Annual Report - PEL
275
-
Upload
khangminh22 -
Category
Documents
-
view
1 -
download
0
Transcript of Annual Report - PEL

Innovating todayfor a better tomorrow..Through Research & Development, Technology and Innovation Leadership
PEL recognizes the importance of consumer-driven productdevelopment, makes signicant investments in Research & Development and Technologies, and remains a technologyforerunner and market leader in providing new productsand services to meet the challenges and technologyintensive needs of its customers.
This annual report can be accessed and downloaded from PEL’s websitehttp://pel.com.pk/index.php/nancial/

iAnnual Report 2018
The institute of Chartered Accountants of Pakistan (ICAP) and the Institute of Cost and Management (ICMAP) jointly hold the Best Corporate Report Award annually.
Companies are encouraged to adopt international best practices to ensure transparency by giving more disclosures and following specic formal requirements. The criteria for evaluating companies are reviewed by the joint Committee of ICAP and ICMAP every year based on latest trends.
Every year all listed companies are requested to send their annual reports for the competition.
The objective of the Awards is to encourage the application of timely, accurate, informative and well-presented annual reports for stakeholders.
PEL participated in the competition for third consecutive year and was able to successfully secure awards in the Engineering and Auto sector for all three years, 2015, 2016 and 2017. PEL’s annual report is a more vital tool for investors at home and abroad to enable them to understand the underlying factors relating to the current position and future prospects of the Company. The value of reporting to investors has been achieved by providing a greater focus on forward looking information, risk management, and integrating them in a more coherent way.
Best Corporate and SustainabilityReport Awards 2017

ii Pak Elektron Limited iiiAnnual Report 2018
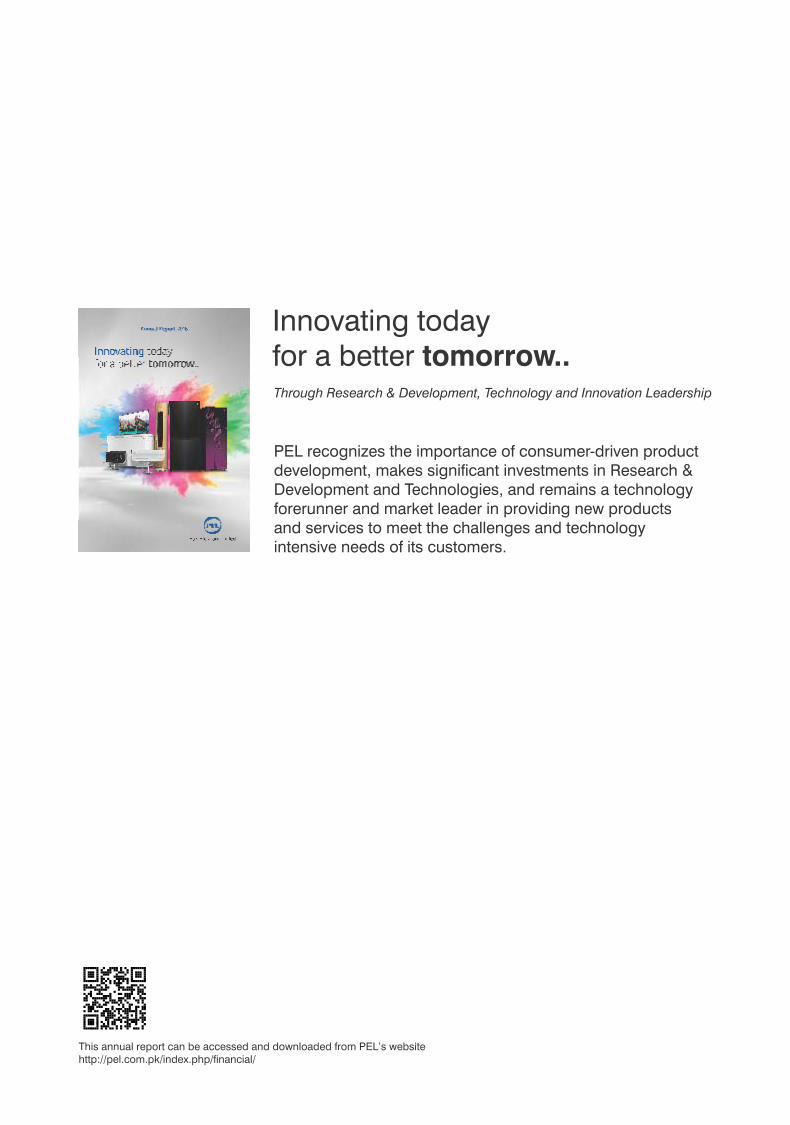
Contents We need constant change, technological innovation capability, and high productivity to survive in the erce competitive environment. -Joe Kaeser
BEST CORPORATE REPORT AWARD
TABLE OF CONTENTS
2018 IN NUMBERS
STRIVING FOR EXCELLENCE IN CORPORATE REPORTING
CALENDER OF EVENTS
i
ii
iv
vi
vii
A ORGANIZATIONAL OVERVIEW AND
EXTERNAL ENVIRONMENT
ABOUT PEL
PRODUCT PROFILE
GEOPRAPHICAL PRESENCE
PEL'S JOURNEY THROUGH TIME
CORPORATE INFORMATION
VISION AND MISSION
ETHICS AND BUSINESS PRACTICES
CODE OF CONDUCT
ORGANIZATIONAL CULTURE
CORE VALUES
GROUP STRUCTURE
HUMAN CAPITAL
ORGANIZATION CHART
POSITION WITHIN THE VALUE CHAIN
EXTERNAL ENVIRONMENT
EFFECT OF SEASONALITY
COMPOSITION OF RAW MATERIAL; LOCAL VS IMPORTED
SIGNIFICANT CHANGES FROM PRIOR YEARS
A 02
A 04
A 18
A 20
A 22
A 24
A 26
A 26
A 26
A 27
A 28
A 30
A 32
A 34
A 36
A 38
A 38
A 38
B STRATEGY AND RESOURCE ALLOCATION
OBJECTIVES AND STRATEGIES
RESOURCE ALLOCATION PLAN
BUSINESS MODEL
LIQUIDITY MANAGEMENT
SIGNIFICANT PLANS AND DECISIONS
B 02
B 04
B 05
B 06
B 06
C RISK AND OPPORTUNITIES
RISKS AND MITIGATION STRATEGIES
OPPORTUNITIES AND MATERIALIZATION STRATEGIES
MATERIALITY APPROACH
SWOT ANALYSIS
CAPITAL STRUCTURE
REPAYMENT DEBTS
C 02
C 06
C 06
C 07
C 08
C 08
D GOVERNANCE
Prole of Board Members
Composition of the Board
Independent Director
Female Director
Meetings of The Board
Board Operations
Changes to the Board
Annual Evaluation of Board's Performance
Ofce of the Chairman and Chief Executive Ofcer
Roles and Responsibilities of the Chairman
and Chief Executive Ofcer
Formal Orientation at Induction
Directors Training Program
Directors' Remuneration
BOARD OF DIRECTORSD 02
D 02
D 04
D 04
D 04
D 04
D 05
D 05
D 05
D 05
D 05
D 06
D 06
D 06
D 07
D 08
D 09
COMMITEES OF THE BOARD
Audit Commitee
Human Resource and Remuneration
Committee
D 10 INFORMATION TECHNOLOGY
GOVERNANCE
IT Governance Policy
Business Continuity and Disaster
Recovery Plan
D 10
D 10
D 12
D 12
D 12
D 12
D 12
D 13
D 13
D 13
POLICY DISCLOSURES
Diversity Policy
Corporate Social Responsibility and
Sustainability Policy
Conict of Interest Policy
Investers' Grievance Policy
Policy For Safety Of Records
Whistle Blowing Policy
Human Resource Management Policy
D 14
D 14
D 15
SHARIAH COMPLIANCE
Shariah Compliance Certicate
Shariah Advisor's Prole And Report
D 16
D 16
D 18
D 20
CODE OF CORPORATE GOVERNANCE
Statement of Compliance
Report of the Audit Committee
Review Report by Auditors
E PERFORMANCE AND POSITION
Macro-economic Overview
Analysis of Financial and Non-Financial
Performance
Product-Wise Operating Performance
Financial Ratios
Graphical Anaylsis
Dupont Anaylsis
Free Cash Flow
Economic Value Added
Summary of Cash Flows
Horizontal Analysis
Vertical Analysis
Quarterly Analysis
Direct Method Cash Flow Statement
Segmental Review of Business Performance
Market Share Information
Market Overview
Pattern of Shareholding
Capital Expenditure
Dividend
Other Matters
Directors' Report In Urdu
CHAIRMAN'S REVIEW
CEO'S REMARKS
DIRECTORS' REPORT
E 02
E 04
E 06
E 06
E 08
E 13
E 16
E 18
E 20
E 21
E 22
E 23
E 24
E 26
E 28
E 29
E 30
E 31
E 32
E 34
E 40
E 40
E 40
E 46
F OUT LOOK
FORWARD LOOKING STATEMENT
COMPANY PERFORMANCE AGAINST
LAST YEAR PROJECTIONS
FINANCIAL PROJECTIONS
STATUS OF PROJECTS
SOURCES OF INFORMATION AND
ASSUMPTIONS
F 02
F 02
F 03
F 03
F 03
G STAKEHOLDERS RELATIONSHIP
AND ENGAGEMENT
STAKEHOLDERS' ENGAGEMENT
STATEMENT OF VALUE ADDITION
INVESTOR RELATIONS
GLOSSARY OF TERMS AND DEFINITIONS
G 02
G 05
G 06
G 08
H SUSTAINABILITY AND CORPORATE
SOCIAL RESPONSIBILITY
H 02
H 07
CSR INITIATIVES
SUSTAINABILITY HIGHLIGHTS
CONSOLIDATED FINANCIAL STATEMENTS
SEPARATE FINANCIAL STATEMENTS
ANNUAL GENERAL MEETING
I
J
K
K 02
K 07
NOTICE OF ANNUAL GENERAL MEETING
FORM OF PROXY
Foreign Directors
Implemented Governance Practices
vs Legal Requirements
Related Parties
Preparation and Fair Presentation
of Financial Statements
D 06
D 06
D 07
D 07
ii Pak Elektron Limited iiiAnnual Report 2018
Contents We need constant change, technological innovation capability, and high productivity to survive in the erce competitive environment. -Joe Kaeser
BEST CORPORATE REPORT AWARD
TABLE OF CONTENTS
2018 IN NUMBERS
STRIVING FOR EXCELLENCE IN CORPORATE REPORTING
CALENDER OF EVENTS
i
ii
iv
vi
vii
A ORGANIZATIONAL OVERVIEW AND
EXTERNAL ENVIRONMENT
ABOUT PEL
PRODUCT PROFILE
GEOPRAPHICAL PRESENCE
PEL'S JOURNEY THROUGH TIME
CORPORATE INFORMATION
VISION AND MISSION
ETHICS AND BUSINESS PRACTICES
CODE OF CONDUCT
ORGANIZATIONAL CULTURE
CORE VALUES
GROUP STRUCTURE
HUMAN CAPITAL
ORGANIZATION CHART
POSITION WITHIN THE VALUE CHAIN
EXTERNAL ENVIRONMENT
EFFECT OF SEASONALITY
COMPOSITION OF RAW MATERIAL; LOCAL VS IMPORTED
SIGNIFICANT CHANGES FROM PRIOR YEARS
A 02
A 04
A 18
A 20
A 22
A 24
A 26
A 26
A 26
A 27
A 28
A 30
A 32
A 34
A 36
A 38
A 38
A 38
B STRATEGY AND RESOURCE ALLOCATION
OBJECTIVES AND STRATEGIES
RESOURCE ALLOCATION PLAN
BUSINESS MODEL
LIQUIDITY MANAGEMENT
SIGNIFICANT PLANS AND DECISIONS
B 02
B 04
B 05
B 06
B 06
C RISK AND OPPORTUNITIES
RISKS AND MITIGATION STRATEGIES
OPPORTUNITIES AND MATERIALIZATION STRATEGIES
MATERIALITY APPROACH
SWOT ANALYSIS
CAPITAL STRUCTURE
REPAYMENT DEBTS
C 02
C 06
C 06
C 07
C 08
C 08
D GOVERNANCE
Prole of Board Members
Composition of the Board
Independent Director
Female Director
Meetings of The Board
Board Operations
Changes to the Board
Annual Evaluation of Board's Performance
Ofce of the Chairman and Chief Executive Ofcer
Roles and Responsibilities of the Chairman
and Chief Executive Ofcer
Formal Orientation at Induction
Directors Training Program
Directors' Remuneration
BOARD OF DIRECTORSD 02
D 02
D 04
D 04
D 04
D 04
D 05
D 05
D 05
D 05
D 05
D 06
D 06
D 06
D 07
D 08
D 09
COMMITEES OF THE BOARD
Audit Commitee
Human Resource and Remuneration
Committee
D 10 INFORMATION TECHNOLOGY
GOVERNANCE
IT Governance Policy
Business Continuity and Disaster
Recovery Plan
D 10
D 10
D 12
D 12
D 12
D 12
D 12
D 13
D 13
D 13
POLICY DISCLOSURES
Diversity Policy
Corporate Social Responsibility and
Sustainability Policy
Conict of Interest Policy
Investers' Grievance Policy
Policy For Safety Of Records
Whistle Blowing Policy
Human Resource Management Policy
D 14
D 14
D 15
SHARIAH COMPLIANCE
Shariah Compliance Certicate
Shariah Advisor's Prole And Report
D 16
D 16
D 18
D 20
CODE OF CORPORATE GOVERNANCE
Statement of Compliance
Report of the Audit Committee
Review Report by Auditors
E PERFORMANCE AND POSITION
Macro-economic Overview
Analysis of Financial and Non-Financial
Performance
Product-Wise Operating Performance
Financial Ratios
Graphical Anaylsis
Dupont Anaylsis
Free Cash Flow
Economic Value Added
Summary of Cash Flows
Horizontal Analysis
Vertical Analysis
Quarterly Analysis
Direct Method Cash Flow Statement
Segmental Review of Business Performance
Market Share Information
Market Overview
Pattern of Shareholding
Capital Expenditure
Dividend
Other Matters
Directors' Report In Urdu
CHAIRMAN'S REVIEW
CEO'S REMARKS
DIRECTORS' REPORT
E 02
E 04
E 06
E 06
E 08
E 13
E 16
E 18
E 20
E 21
E 22
E 23
E 24
E 26
E 28
E 29
E 30
E 31
E 32
E 34
E 40
E 40
E 40
E 46
F OUT LOOK
FORWARD LOOKING STATEMENT
COMPANY PERFORMANCE AGAINST
LAST YEAR PROJECTIONS
FINANCIAL PROJECTIONS
STATUS OF PROJECTS
SOURCES OF INFORMATION AND
ASSUMPTIONS
F 02
F 02
F 03
F 03
F 03
G STAKEHOLDERS RELATIONSHIP
AND ENGAGEMENT
STAKEHOLDERS' ENGAGEMENT
STATEMENT OF VALUE ADDITION
INVESTOR RELATIONS
GLOSSARY OF TERMS AND DEFINITIONS
G 02
G 05
G 06
G 08
H SUSTAINABILITY AND CORPORATE
SOCIAL RESPONSIBILITY
H 02
H 07
CSR INITIATIVES
SUSTAINABILITY HIGHLIGHTS
CONSOLIDATED FINANCIAL STATEMENTS
SEPARATE FINANCIAL STATEMENTS
ANNUAL GENERAL MEETING
I
J
K
K 02
K 07
NOTICE OF ANNUAL GENERAL MEETING
FORM OF PROXY
Foreign Directors
Implemented Governance Practices
vs Legal Requirements
Related Parties
Preparation and Fair Presentation
of Financial Statements
D 06
D 06
D 07
D 07

iv Pak Elektron Limited vAnnual Report 2018
Equity
79.17% Cost of sales
8.15% Distribution cost
3.99% Administrative and general expenses
0.23% Other expenses
7.76% Finance cost
0.69% Taxation
Expenses In 2018[RUPEES IN MILLIONS]
EARNINGS PER SHARE
Key Indicators
Rs. 2.67RETURN ON EQUITY4.53%
MARKET VALUE PER SHARERs. 24.90
MARKET CAPITALIZATIONRs. 12,392 M
BREAK-UP VALUE PER SHARERs. 59.94
CURRENT RATIO 1.77 Times
Segmental Performance[RUPEES IN MILLIONS]
APPLIANCES DIVISION
POWER DIVISION
[RUPEES IN MILLIONS]
Share capital and reserves
Advance against issue of ordinary shares
Surplus on revaluation of property, plant and equipment
0.01% Share of loss of associate
27,276
11,715
REVENUE IN 2018[RUPEES IN MILLIONS]
38,990
2018the year innumbers
2018
38
,99
0
2017
42
,34
7
18
,85
6
24
,12
6
29
,32
3
2013 2014 2015 2016
34
,12
4
30,280
30,280
2013 2014 2015 2016
11,158
15,595
25,511
19,996
27,001
20182017

INTEGRATEDREPORTING
A
B
C
DF
H
G
E
Organizationaloverview and externalenvironment
Risks and opportunities
Strategy andresource allocation
Governance
Corporate socialresponsibility andsustainability
Performanceand position
Outlook
Stakeholder'srelationship andengagement
vi Pak Elektron Limited viiAnnual Report 2018
Striving for Excellence in CorporateReporting
ADOPTION AND STATEMENT OF ADHERENCE WITH THE INTERNATIONAL INTEGRATED REPORTING FRAMEWORK
Since its inception in 1956, PEL has maintained a legacy of adhering to the best corporate governance practices. The management has laid business foundation built on the principles of ethics and corporate professionalism and, as always, it is committed to generating greater value for both the organization and its stakeholders. The Company is not only focused on achieving sustainable corporate value but also committed to achieving excellence in transparent reporting.
In the current increasingly complex economic, technological, social, political and environmental circumstances, integration of its nancial information with nonnancial information is one of the most effective ways for an organization to demonstrate the importance of linking sustainability issues to business strategies. Frequent changes to the corporate environment have led to a need for additional information beyond the basic nancial statements so that stakeholders can have a better understanding of the value-creation process.
The Company has adopted 'International Integrated Reporting (IR) Framework' to give an overview of the Company's business affairs by presenting and explaining all the nancial and non-nancial information, considering the variable interests of a wide range of stakeholders, in a manner that would enhance the user's understanding as to how the Company is working to improve its performance.
The IR Framework requires a strong commitment by the Company's management who is ultimately responsible for the message the Company is delivering to all of its stakeholders. The Board of Directors, elected by shareholders, play a crucial role in maintaining an integrated reporting mechanism and ensuring long-term value creation while simultaneously increasing transparency for the shareholders.
Adoption of International Integrated Reporting Framework depends on the individual circumstances of an entity and is still considered to be a practice in its early stages. We will continue to improve the information produced to make it even easier to understand, while taking into account the opinion of stakeholders reading this report. Initially, the Company has included following content elements for the users of this report:
A. Organizational overview and external environment
B. Strategy and resource allocation
C. Risks and opportunities
D. Governance
E. Performance and position
F. Outlook
G. Stakeholder's relationship and engagement
H. Corporate social responsibility and sustainability
Moving ahead with PEL's tradition of providing information to its stakeholders that goes beyond the traditional requirements of nancial reporting framework and other legal requirements, by doing so we believe the stakeholders gain a better understanding of the Company, its business, strategies, opportunities and risks, business model, governance and performance which itself is a form of value creation for its stakeholders.
UNRESERVED COMPLIANCE WITH INTERNATIONAL FINANCIAL REPORTING STANDARDS ISSUED BY INTERNATIONAL ACCOUNTING STANDARDS BOARD
PEL prepares its nancial statements in accordance with the accounting and reporting standards as applicable in Pakistan. The accounting and reporting standards applicable in Pakistan comprise of:
a) International Financial Reporting Standards ['IFRS'] issued by the International Accounting Standards Board ['IASB'] as notied under the Companies Act, 2017;
b) Islamic Financial Accounting Standards ['IFAS'] issued by Institute of Chartered Accountants of Pakistan as notied under the Companies Act, 2017; and
c) Provisions of and directives issued under the Companies Act, 2017.
The Company has adopted all IFRSs notied under the Companies Act, 2017 and effective for the year 2018. Those IFRSs which have been notied under the Companies Act, 2017 but are not effective for the year 2018 will adopted on their due dates.
However, where provisions of and directives issued under the Companies Act, 2017 differ from the IFRS and IFAS, the provisions of and directives issued under the Companies Act, 2017 have been followed in preparation of nancial statements.

AOrganizational
Overview and ExternalEnvironment
viii Pak Elektron Limited
Calendar Of Events 2018
NovemberObtained STL short circuit certicate from VEIKI-VNL Lab, Hungry,after successful testing of Power Transformer.
SeptemberPrequalication with DHA Karachi for supply of compact Substationafter successful testing from “XIAI High Voltage Laboratory China”.
AugustStart of setting up Washing Machine manufacturing facility atPEL I 14-KM Ferozepur Road, Lahore.
JuneShifting of Switchgear production line to PEL II 34-KMFerozepur Road, Lahore.
MayLaunched LED TVs after successful production trial run.

A 02 Pak Elektron Limited A 03Annual Report 2018
About PELPEL is the pioneer manufacturer of electrical goods in Pakistan. In 1956, the Company was set up by Malik Brothers in technical collaboration with M/s AEG of Germany (“AEG”) to manufacture transformers, switchgear and electric motors. AEG exited from the venture and sold their share of PEL to the Malik Brothers in the late 1960s, which was subsequently acquired by the Saigol Group of Companies in 1978.
Since its inception, the Company has always been contributing towards the advancement and development of the engineering sector in Pakistan by introducing a range of quality electrical equipment, home appliances and by producing hundreds of engineers, skilled workers and technicians through its apprenticeship schemes and training programmes.
Until the acquisition by the Saigol Group, PEL was solely catering the power equipment market. The Company ventured into home appliances market in 1981 after acquisition as a part of the Group’s long term strategy of diversication.
The Company comprises of two divisions; each offering a wide range of products as follows:
Power Division
• Distribution Transformers• Power Transformers• Energy Meters• Switchgears• Grid Stations• EPC
Appliances Division
• Refrigerators• Air Conditioners• Deep Freezers• Microwave Ovens• Water Dispensers• LED TVs• Small Domestic Appliances (Electric Kettle,
Toaster, Sandwich Maker, Steam Iron)
Since its inception, PEL has always been contributing towards the advancement and development of the engineering sector in Pakistan by introducing a range of quality electrical equipment, home appliances and by producing hundreds of engineers, skilled workers and technicians through its apprenticeship schemes and training programmes.

Product ProleAPPLIANCES DIVISIONPEL is among the market leaders in home appliances business with a very good presence and market share since year 1987. The growing demand is due to innovation and product development through dedicated & continuous research & development.
REFRIGERATOR
PEL started refrigerator manufacturing in 1987 with the technical assistance of IAR- SILTAL Italy. Its cooling performance is tested and approved by Danfoss Germany while the manufacturing facility is ISO 9002 Certied from SGS Switzerland.
Growing numbers of middle class, growth in disposable Incomes, upward trajectory of country macro- economic indicators, improved country law & order situation and improved electricity supply are the factors behind growing market demand of refrigerators. Wide product penetration gap is yet to be bridged, especially in rural areas. In the improving electricity load shedding scenario, PEL's “Inverter / Invert on Series Refrigerators” being “Energy Efcient” will create an additional demand.
The Company is well positioned to take benet of growing demand as a result of above factors and has introduced energy efcient “Invert on series” Compatible with UPS and solar solutions. Company also launched “Arctic Fresh" Series with turbo cooling and freshness LEDs for better food preservation. Both of the series being based on a masterpiece of “Japanese Inverter Technology” with electricity saving up to 50% with improved aesthetics are well received in the local market. In already existing series new models with enhanced space and cooling retention are introduced in the
market. PEL Glass Door Series “INTELLO” with super freezer, bluetooth speaker, door alarm and intelligent temperature control system is also launched last year, are receiving an excellent response due to its additional and unique features.
The Company is focusing on continuous improvement through R&D. Special attention is being given through different marketing campaigns to further strengthen the PEL Brand. The turnover of refrigerators has increased signicantly over the past few years.
Going forward, the Company is committed to adding more products in its range. The strategy employed is to use the same distribution channel to sell more products. This dilutes our xed cost. The growth potential to add more products and leverage to the PEL Brand is Vast.
A 04 Pak Elektron Limited A 05Annual Report 2018

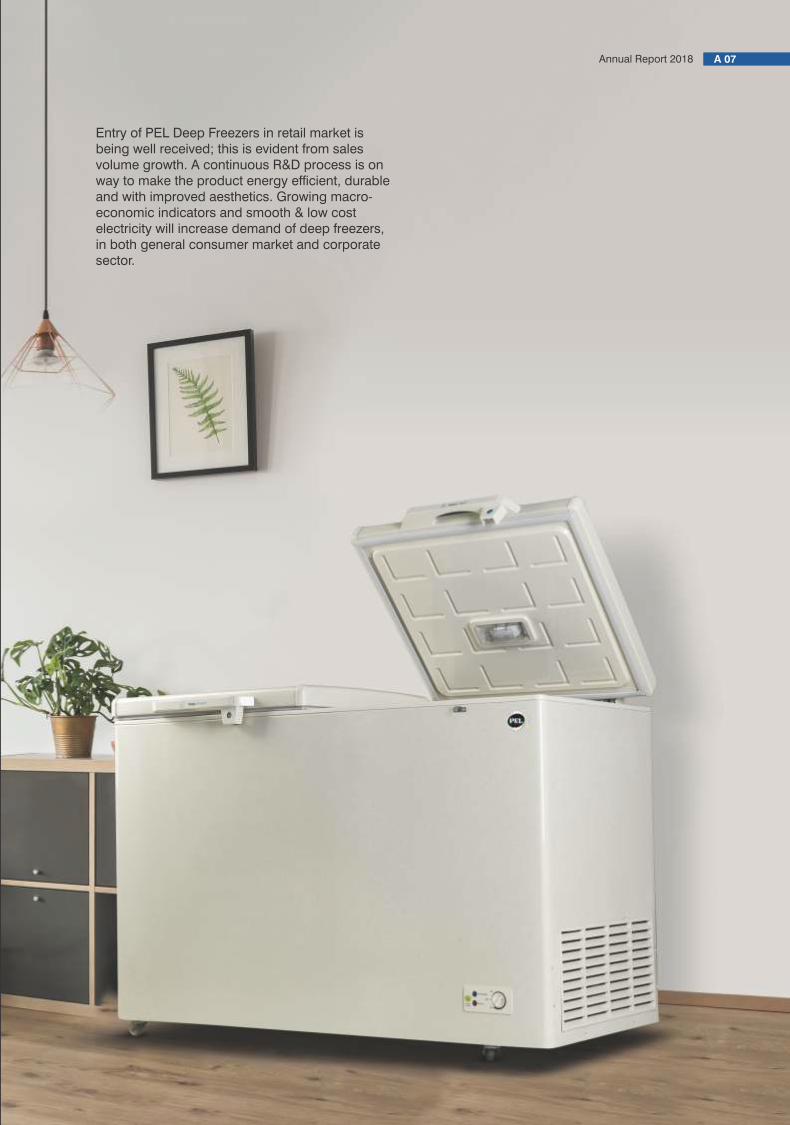
DEEP FREEZER
PEL Deep Freezers were introduced in 1987 in technical collaboration with ARISTON Italy. The Company's manufacturing facility is ECO Friendly because PEL uses Green Gases and is the best choice for MNCs. Customized products (Deep Freezers and ICE Cream Cabinets) with durability and high level of performance is preference of Corporate Customers like Unilever (Walls), Engro Foods (O more), Pakistan Dairies (Igloo), Coke and PEPSI Bottlers. Due to superior product quality and highly responsive after sales service, the Company receiving continuously repeat orders from corporate customers.
Capitalizing on our technical expertise we have signed after sale service agreements with Coca Cola Beverages Limited, PEPSI Bottlers, Unilever, Engro Foods, Pakistan Dairies for repair services of Deep Freezers, Visi Coolers and Chest Coolers . This will deepen our relationship with valued customers and multinational companies.
Entry of PEL Deep Freezers in retail market is being well received; this is evident from sales volume growth. A continuous R&D process is on way to make the product energy efcient, durable and with improved aesthetics. Growing macro-economic indicators and smooth & low cost electricity will increase demand of deep freezers, in both general consumer market and corporate sector.
A 06 Pak Elektron Limited A 07Annual Report 2018

Company introduced new product series like "Invert-Eco", "Invert-o-Sense" , "Invert-o-Sense" , "Invert-o-Life" and "Invert-o-Pro" launched during the year, are well received by Market. These “Heat & Cool" Energy Efcient ACs with "4 Star Rating Inverter Technology" are real market "Eye Catch" due to product quality & aesthetics. An aggressive market campaign also leveled fueled the growth trajectory. Improved electricity supply also played a vital role in country market growth.
AIR CONDITIONER
The Company is among the pioneers of Window AC manufacturing in the country and remained market leader for a long time until it hit due to technological shift on Split AC. Since the Company's return in Split A.C Business, PEL Split A.C has been well received in the market due to its innovations, durability, quality, brand equity and after sales service.
Growing emerging middle class, rapid urbanization and increase in disposable income are market growth drivers. Uninterrupted and lower cost electricity supply has further increase the market demand, due to low electricity consumption by Inverter technology based equipments. Company's country wide efcient after sales services net work is also playing a vital role to win "Consumer Condence”.
A 08 Pak Elektron Limited A 09Annual Report 2018

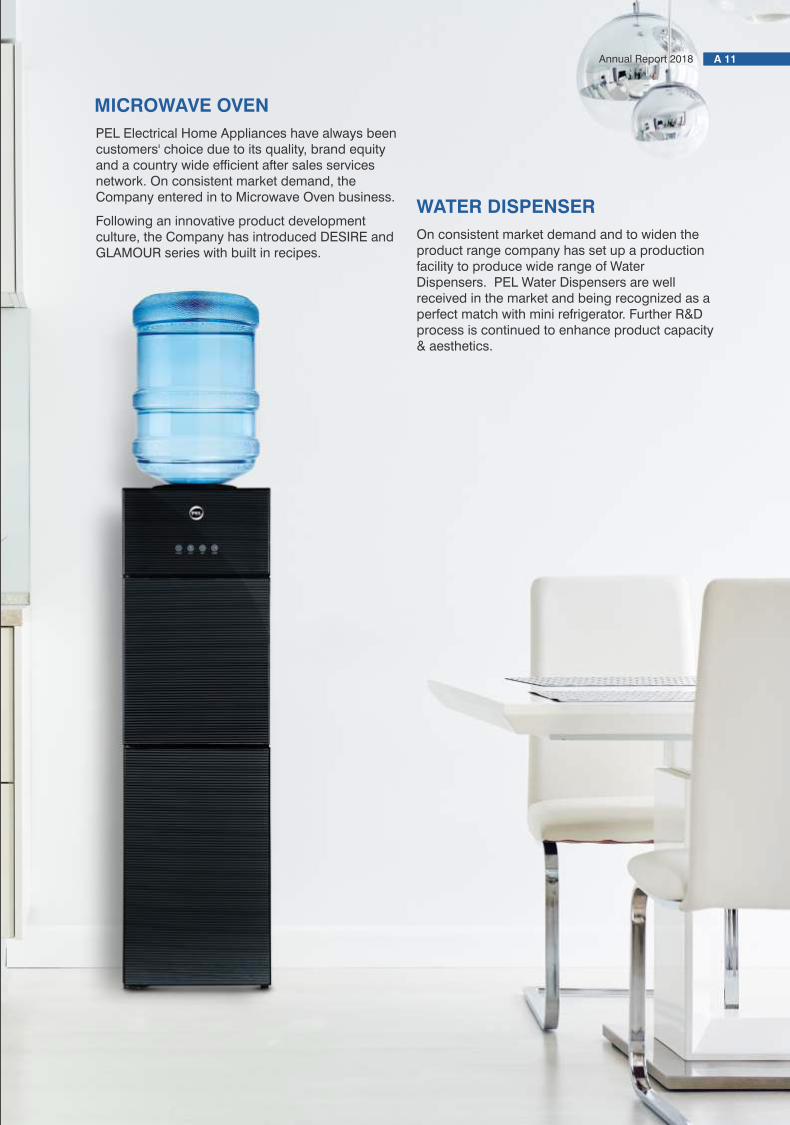
MICROWAVE OVEN
WATER DISPENSER
PEL Electrical Home Appliances have always been customers' choice due to its quality, brand equity and a country wide efcient after sales services network. On consistent market demand, the Company entered in to Microwave Oven business.
Following an innovative product development culture, the Company has introduced DESIRE and GLAMOUR series with built in recipes.
On consistent market demand and to widen the product range company has set up a production facility to produce wide range of Water Dispensers. PEL Water Dispensers are well received in the market and being recognized as a perfect match with mini refrigerator. Further R&D process is continued to enhance product capacity & aesthetics.
A 10 Pak Elektron Limited A 11Annual Report 2018

LED TV
PEL celebrated the launch of their new 4K Coloron LED Smart TV in Pakistan with an event on October 20, 2018.
The Smart TV features 4K UHD, Smart LED technology and Dolby Digital (5.1) surround sound system which, combined with Netix and YouTube, delivers a fully cinematic entertainment experience.
The Coloron LED TV also comes with Android 6.0 Marshmallow, as well as Google Play and Wi-Fi functions, allowing users to download and use all their favourite apps on the TV itself. With its built-in Screen Mirroring technology, users can use the Coloron LED TV to view content being played on their mobile devices.
The new LED TV uses IPS display to enhance display and colour quality, and allows for high quality viewing from any angle. It also has 1 GB ram, 8 GB Internal Space, VGA, USB 2.0, HDMI 2.0 and has LAN capabilities making it an equally good choice for both movie fans and gamers.
Coloron Prime 4K LED TVs are available in 55 and 49inch sizes, the smart Coloron model is available in 40inches, with basic models available in 49, 40, and 32 inch sizes.
A 12 Pak Elektron Limited A 13Annual Report 2018
ENERGY METER
PEL Single Phase and Three Phase Static Meters are manufactured as per specications of Utility Companies licensed from ABB USA and its quality is certied by KEMA Laboratories.
PEL Energy Meter Plant is ISO 9002 certied and its products meet the standards of WAPDA & KESC.
To overcome the circular debt Government has Plan to introduce more efcient metering system to control electricity pilferage. Company has developed Single Phase, Three Phase GSM Energy Meters and DLMS Compliant Single Phase Energy Meter and got it approved from National Transmission and Distribution Company - NTDC and is well positioned to take care of rising demand of Energy Meters with advance functionalities.
POWER TRANSFORMERS
Extensive experience and success in manufacturing distribution transformer led to establishment of Power Transformer Division in 2005. Since its birth this division has produced transformers of rating 31/40 MVA, 20/26 MVA and 10/13 MVA for 132 KV level. To compete internationally, PEL combined its technical expertise with GANZ, a renowned and experienced Hungarian transformer manufacturer with over 150 years of history and now continues to cooperate with their technical partners for new development.
After Siemens' exit from transformer business, PEL is a leading power transformer manufacturer in local market. Demand of power transformers is expected to continue due to the Government's accelerated efforts for T&D Infrastructure Augmentation after meeting energy generation requirements.
POWER DIVISIONPEL is among the pioneers of Electrical Capital Goods and has been serving the power utility companies, industries, individual customers, housing and commercial projects by providing cost effective solutions. PEL is now technology forerunner and market leader in providing new products and services to meet the challenges and technology intensive needs of its customers. Our EPC contracting division delivers customer designed and built HV and EHV grid stations, electrication of housing projects and industrial parks. We aim to maintain this competitive edge and at the same time keep striving to improve it further by continuous R&D, creating new knowledge and adopting global developments in technology and product design.
High standards of Quality and customer care are hallmark of PEL Corporate Philosophy. We have a comprehensive Quality Management System that is Consistent with ISO 9001-2000. PEL is an ISO certied Company.
PEL being leading electrical equipment manufacturer has aligned its policies to support the Government in its effort to overcome the energy issues and is well positioned to obtain its due share in electrical equipment business arising from CPEC developments.
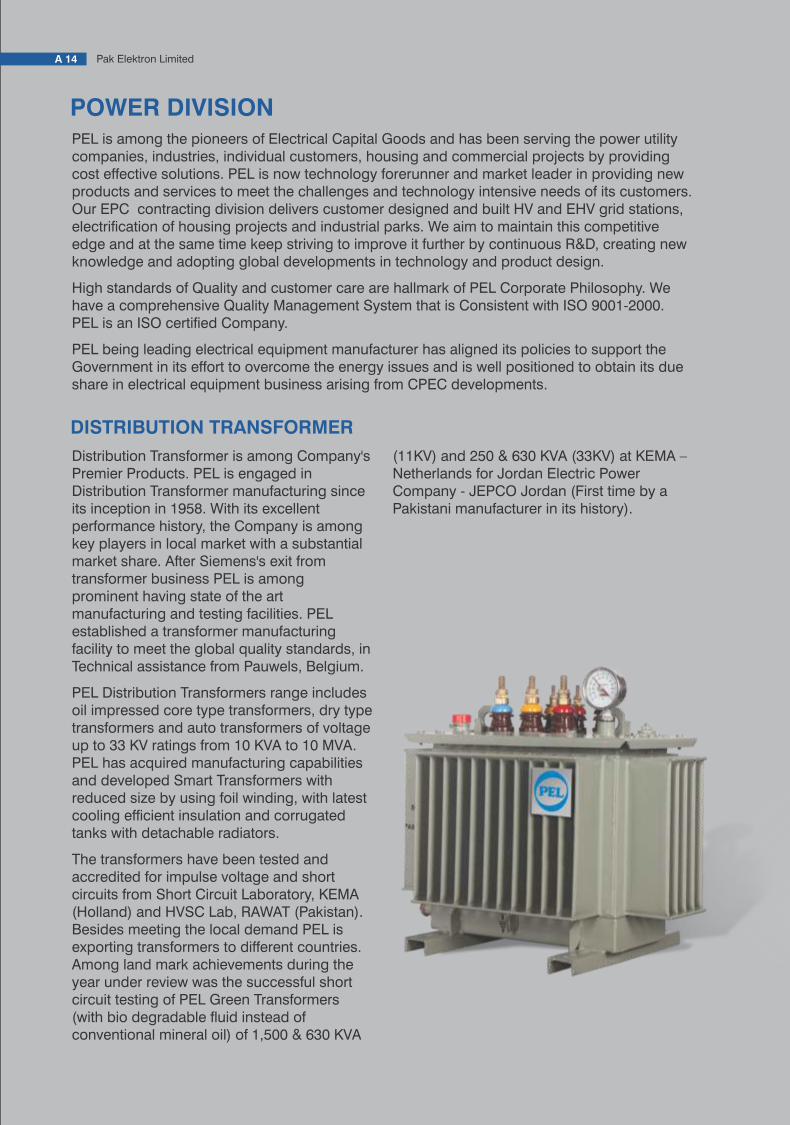
DISTRIBUTION TRANSFORMER
Distribution Transformer is among Company's Premier Products. PEL is engaged in Distribution Transformer manufacturing since its inception in 1958. With its excellent performance history, the Company is among key players in local market with a substantial market share. After Siemens's exit from transformer business PEL is among prominent having state of the art manufacturing and testing facilities. PEL established a transformer manufacturing facility to meet the global quality standards, in Technical assistance from Pauwels, Belgium.
PEL Distribution Transformers range includes oil impressed core type transformers, dry type transformers and auto transformers of voltage up to 33 KV ratings from 10 KVA to 10 MVA. PEL has acquired manufacturing capabilities and developed Smart Transformers with reduced size by using foil winding, with latest cooling efcient insulation and corrugated tanks with detachable radiators.
The transformers have been tested and accredited for impulse voltage and short circuits from Short Circuit Laboratory, KEMA (Holland) and HVSC Lab, RAWAT (Pakistan). Besides meeting the local demand PEL is exporting transformers to different countries. Among land mark achievements during the year under review was the successful short circuit testing of PEL Green Transformers (with bio degradable uid instead of conventional mineral oil) of 1,500 & 630 KVA
A 14 Pak Elektron Limited A 15Annual Report 2018
(11KV) and 250 & 630 KVA (33KV) at KEMA – Netherlands for Jordan Electric Power Company - JEPCO Jordan (First time by a Pakistani manufacturer in its history).

ENERGY METER
PEL Single Phase and Three Phase Static Meters are manufactured as per specications of Utility Companies licensed from ABB USA and its quality is certied by KEMA Laboratories.
PEL Energy Meter Plant is ISO 9002 certied and its products meet the standards of WAPDA & KESC.
To overcome the circular debt Government has Plan to introduce more efcient metering system to control electricity pilferage. Company has developed Single Phase, Three Phase GSM Energy Meters and DLMS Compliant Single Phase Energy Meter and got it approved from National Transmission and Distribution Company - NTDC and is well positioned to take care of rising demand of Energy Meters with advance functionalities.
POWER TRANSFORMERS
Extensive experience and success in manufacturing distribution transformer led to establishment of Power Transformer Division in 2005. Since its birth this division has produced transformers of rating 31/40 MVA, 20/26 MVA and 10/13 MVA for 132 KV level. To compete internationally, PEL combined its technical expertise with GANZ, a renowned and experienced Hungarian transformer manufacturer with over 150 years of history and now continues to cooperate with their technical partners for new development.
After Siemens' exit from transformer business, PEL is a leading power transformer manufacturer in local market. Demand of power transformers is expected to continue due to the Government's accelerated efforts for T&D Infrastructure Augmentation after meeting energy generation requirements.
POWER DIVISIONPEL is among the pioneers of Electrical Capital Goods and has been serving the power utility companies, industries, individual customers, housing and commercial projects by providing cost effective solutions. PEL is now technology forerunner and market leader in providing new products and services to meet the challenges and technology intensive needs of its customers. Our EPC contracting division delivers customer designed and built HV and EHV grid stations, electrication of housing projects and industrial parks. We aim to maintain this competitive edge and at the same time keep striving to improve it further by continuous R&D, creating new knowledge and adopting global developments in technology and product design.
High standards of Quality and customer care are hallmark of PEL Corporate Philosophy. We have a comprehensive Quality Management System that is Consistent with ISO 9001-2000. PEL is an ISO certied Company.
PEL being leading electrical equipment manufacturer has aligned its policies to support the Government in its effort to overcome the energy issues and is well positioned to obtain its due share in electrical equipment business arising from CPEC developments.
DISTRIBUTION TRANSFORMER
Distribution Transformer is among Company's Premier Products. PEL is engaged in Distribution Transformer manufacturing since its inception in 1958. With its excellent performance history, the Company is among key players in local market with a substantial market share. After Siemens's exit from transformer business PEL is among prominent having state of the art manufacturing and testing facilities. PEL established a transformer manufacturing facility to meet the global quality standards, in Technical assistance from Pauwels, Belgium.
PEL Distribution Transformers range includes oil impressed core type transformers, dry type transformers and auto transformers of voltage up to 33 KV ratings from 10 KVA to 10 MVA. PEL has acquired manufacturing capabilities and developed Smart Transformers with reduced size by using foil winding, with latest cooling efcient insulation and corrugated tanks with detachable radiators.
The transformers have been tested and accredited for impulse voltage and short circuits from Short Circuit Laboratory, KEMA (Holland) and HVSC Lab, RAWAT (Pakistan). Besides meeting the local demand PEL is exporting transformers to different countries. Among land mark achievements during the year under review was the successful short circuit testing of PEL Green Transformers (with bio degradable uid instead of conventional mineral oil) of 1,500 & 630 KVA
A 14 Pak Elektron Limited A 15Annual Report 2018
(11KV) and 250 & 630 KVA (33KV) at KEMA – Netherlands for Jordan Electric Power Company - JEPCO Jordan (First time by a Pakistani manufacturer in its history).
EPC CONTRACTING
PEL EPC Division was formally established in 2006 and delivers custom made solutions in following areas.
• 132 & 220 KV Grid Station for Power Utility Companies.
• 132 and 11 KV Substations for commercial & industrial customers for integration of Private Captive .Power Generation Plants into utility network for sale of their surplus power to utility companies.
• Electrication of housing projects and industrial parks.
EPC business foresees a great Potential due to CPEC developments and boom in the local construction industry. The Company is well prepared to grasp opportunities in this sector.
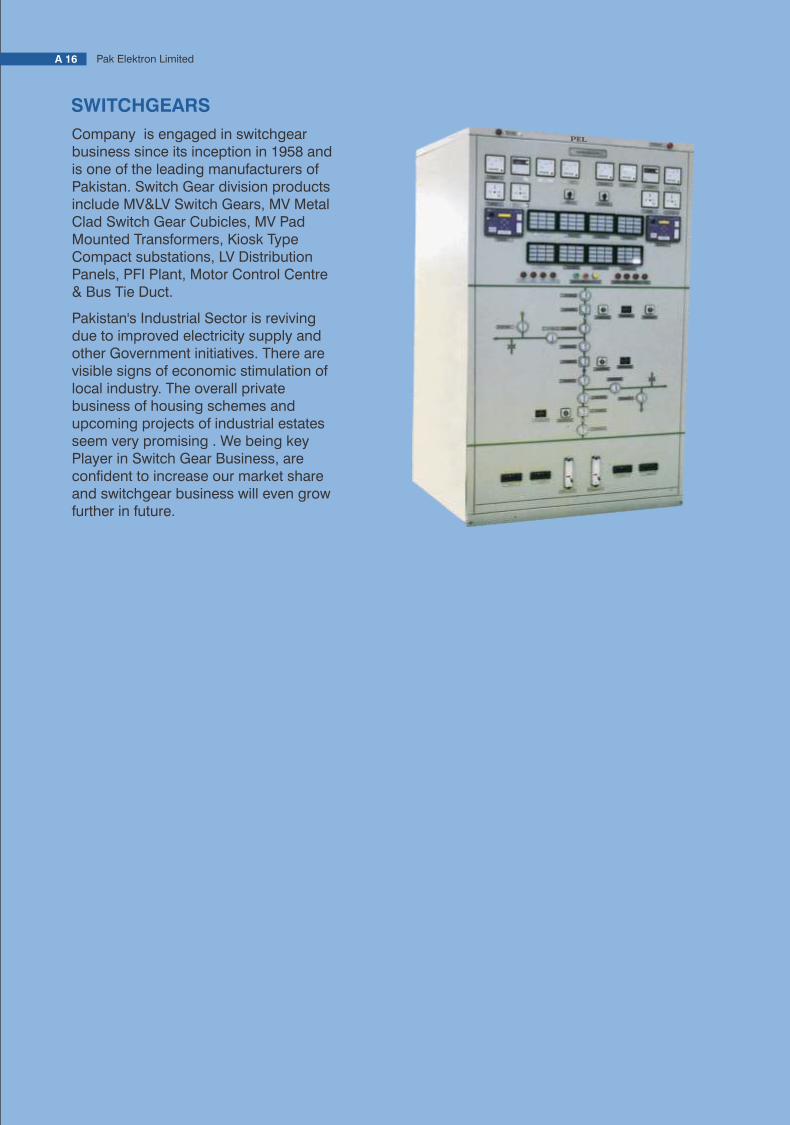
SWITCHGEARS
Company is engaged in switchgear business since its inception in 1958 and is one of the leading manufacturers of Pakistan. Switch Gear division products include MV&LV Switch Gears, MV Metal Clad Switch Gear Cubicles, MV Pad Mounted Transformers, Kiosk Type Compact substations, LV Distribution Panels, PFI Plant, Motor Control Centre & Bus Tie Duct.
Pakistan's Industrial Sector is reviving due to improved electricity supply and other Government initiatives. There are visible signs of economic stimulation of local industry. The overall private business of housing schemes and upcoming projects of industrial estates seem very promising . We being key Player in Switch Gear Business, are condent to increase our market share and switchgear business will even grow further in future.
A 16 Pak Elektron Limited A 17Annual Report 2018

EPC CONTRACTING
PEL EPC Division was formally established in 2006 and delivers custom made solutions in following areas.
• 132 & 220 KV Grid Station for Power Utility Companies.
• 132 and 11 KV Substations for commercial & industrial customers for integration of Private Captive .Power Generation Plants into utility network for sale of their surplus power to utility companies.
• Electrication of housing projects and industrial parks.
EPC business foresees a great Potential due to CPEC developments and boom in the local construction industry. The Company is well prepared to grasp opportunities in this sector.
SWITCHGEARS
Company is engaged in switchgear business since its inception in 1958 and is one of the leading manufacturers of Pakistan. Switch Gear division products include MV&LV Switch Gears, MV Metal Clad Switch Gear Cubicles, MV Pad Mounted Transformers, Kiosk Type Compact substations, LV Distribution Panels, PFI Plant, Motor Control Centre & Bus Tie Duct.
Pakistan's Industrial Sector is reviving due to improved electricity supply and other Government initiatives. There are visible signs of economic stimulation of local industry. The overall private business of housing schemes and upcoming projects of industrial estates seem very promising . We being key Player in Switch Gear Business, are condent to increase our market share and switchgear business will even grow further in future.
A 16 Pak Elektron Limited A 17Annual Report 2018

Sales Ofces
Service Centers
PUNJAB
BALOCHISTAN
SINDH
KPK
QUETTA
KARACHIGAWADAR
LAHORE
ISLAMABAD
PESHAWAR
GILGIT
SKARDU
JAMMU & KASHMIR(DISPUTED TERRITORY)
KPK
BALOCHISTAN
PUNJAB
SINDH
SUMMARY
Our nationwide Dealer and Service Centre Network provides us access
to a wide range of customers and enables us to provide quality after
sales services.
PEL Dealer/Service Centre Network
PopulationDealersSales OfcesService CenterASCs
: 12%: 11%: 2: 2: 91
PopulationDealersSales OfcesService CenterASCs
: 6%: 2%: 1: 0: 6 Population
DealersSales OfcesService CenterASCs
: 61%: 75%: 11: 13: 366
PopulationDealersSales OfcesService CenterASCs
: 21%: 12%: 3: 7: 61
Total Appliances DealersPEL DealerPEL Sales OfcesPEL Service CentersAuthorized Service Centers (ASCs)
: 2,600: 1,500: 17: 22: 524
GEOGRAPHICAL PRESENCE
-Walt Disney
If you candream it,
you can do it.
• Qatar
• Saudi Arabia
• Oman• Afghanistan
• Tanzania • UAE
• Zimbabwe • Kazakhstan
• Kuwait
• Yemen • Botswana• Congo
• Swaziland
• Kenya
International Presence
PEL exports to customers and see potential in following countries and has
continued focus on expanding presence in international market:
• Nigeria
• Rwanda
• Jorden• Namibia
• Bulgaria• Uganda• South Africa• Guinea• Mauritius • Ghana
A 18 Pak Elektron Limited A 19Annual Report 2018
• Tajikistan

19581981
1987
1956
Start of Commercial
Production of
Distribution
Transformers and
Switch Gears in
Technical
Collaboration with
AEG Germany
Manufacturing of
Air Conditioners
with assistance of
Fujitsu Japan
Manufacturing of
Refrigerators & Deep
Freezers in Technical
Collaboration with
IAR-SILTAL &
ARISTON of Italy
Listing with all Stock
Exchanges in
Pakistan Acquired
License to
manufacture VCBs
from Hitachi, Japan
Started Production
of Energy Meters
under the License
from ABB USA
Quality
Management
System Certication
for Energy Meter
ISO 9001 by SGS
19881992
1994
1997
Acquired
Technology from
Carrier,USA to
manufacture
Air Conditioners
2000
2004
Launching of new
Crystal Series
Refrigerator under
Technical
Collaboration of
Danfoss, Germany
Acquired
Technology from
GANZ, Hungry to
Produce Power
Transformers
2006
Formal start of EPC
Business Segment
of the Company
2009
th4 CSR NationalthExcellence Award 6
Annual Environmental
Excellence Award
Export of Power
Transformer
2010
Launching of New
Desire Series
Refrigerator
Prequalication with
Saudi Electrical
Company - SEC
Inauguration of New
Distribution Transformer
Factory by Prime Minister of
Pakistan under Technical
Assistance from Pauwels,
Belgium.
2011
2012
Launch of new Arctic
Series Refrigerator
with New Aesthetics
2013
Successful
Commissioning
of 220 KV GIS
Shalimar Grid Station
worthRs. 1.3 Billion
2014
Launching of New
Glass Door
Refrigerator with
New Aesthetics
2015
Launching of Glass
Door Mirror Series
2016
Launching of Inverter
Refrigerator & Air
Conditioner Series
Successful Short
Circuit Testing of
PEL Green
Transformer
2017
Commencement of
Water Dispenser
Production.
Launching of “ Invert
-o-Cool" Air
Conditioners, "
Arctic Premium Plus
" Deep Freezers and
" Convection Series"
Microwave Ovens.
Launched of 4K Coloron LED
Smart TV Android 6.0
Marshmallow powered by the
massively successful Android
with high resolutionns.
2018
Incorporation
of Pak Elektron
Limited
PEL’s Journey Through Time
A 20 Pak Elektron Limited A 21Annual Report 2018

Mr. M. Naseem Saigol Director/Chairman - Non ExecutiveMr. M. Murad Saigol Director/Chief Executive Ofcer - Executive/Certied (DTP)Mr. M. Zeid Yousuf Saigol Director - Executive/Certied (DTP)Syed Manzar Hassan Director - Executive/Certied (DTP)Sheikh Muhammad Shakeel Director - Non Executive/Certied (DTP)Syed Haroon Rashid Director - Non Executive/Certied (DTP)Mr. Asad Ullah Khawaja Director - NIT Nominee/IndependentMr. Usman Shahid Director - NBP Nominee U/S 182 of the Ordinance/ Non ExecutiveMr. Jamal Baquar Director - NBP Nominee U/S 182 of the Ordinance/ Non ExecutiveMs. Azra Shoaib Director - NBP Nominee U/S 182 of the Ordinance/ Non Executive
Mr. Asad Ullah Khawaja Chairman/MemberMr. Usman Shahid MemberSheikh Muhammad Shakeel MemberSyed Haroon Rashid Member
AUDIT COMMITTEE
Mr. Asad Ullah Khawaja Chairman/MemberMr. Usman Shahid MemberSyed Manzar Hassan MemberSyed Haroon Rashid Member
HR & REMUNERATION COMMITTEE
BANKERS
17- Aziz Avenue, Canal Bank,Gulberg-V, LahoreTel: 042-35718274-6, Fax: 042-35762707E-Mail: [email protected]
REGISTERED OFFICE KARACHI
Kohinoor Building 25-West Wharf Road,KarachiTel: 021-32200951-4Fax: 021-32310303
14-K.M. Ferozepur Road, LahoreTel: 042-35920151-9
WORKSTRANSFORMERFACILITY34-K.M. Ferozepur Road,Keath Village, LahoreTel: 042-35935151-2
ISLAMABAD
Room # 301, 3rd Floor,Green Trust Tower,Blue Area, IslamabadTel: 051-2824543, 2828941Fax: 051-2273858
CHINA
206, No. 1007, ZhongShan Naun Er Road,Shanghai, ChinaTel: 86-21-64567713Fax: 86-21-54109971
Muhammad Omer Farooq
COMPANY SECRETARY
Syed Manzar Hassan, FCA
CHIEF FINANCIAL OFFICER
Rahman Sarfaraz Rahim Iqbal RaqChartered AccountantsA member of Russell Bedford International
AUDITORS
M/s Hassan & Hassan Advocates
LEGAL ADVISOR
Corplink (Pvt.) Limited Wings Arcade,1-K Commercial Model Town, Lahore.Tel: 042-35916714, 35839182,Fax: 042-35869037E-Mail: [email protected]
SHARE REGISTRAR
Mufti Zeeshan Abdul AzizS.M. Suhail & Co.Chartered Accountants
SHARIAH ADVISOR
Corporate Information
BOARD OF DIRECTORS
0000802
COMPANY REG. NO.
2011386-2
NATIONAL TAX NO. (NTN)
Public Interest Company (PIC)
STATUS OF COMPANY
Albaraka Bank (Pakistan) LimitedAskari Bank Limited Bank Alfalah Limited The Bank of Khyber The Bank of PunjabSindh Bank LimitedFaysal Bank LimitedBank Islami (Pakistan) LimitedMCB Bank LimitedNational Bank of PakistanPak Brunei Investment Company LimitedPak Libya Holding Company (Private) LimitedPak Oman Investment Company LimitedSamba Bank LimitedSilk Bank LimitedSoneri Bank LimitedStandard Chartered Bank (Pakistan) LimitedSummit Bank LimitedSaudi Pak Industrial and Agriculture Investment Company LimitedUnited Bank Limited
A 22 Pak Elektron Limited A 23Annual Report 2018
SERVICE CENTERS
1. 203-L, Block-2, PECHS society, Karachi
2. A- 120, Block 5, Sardar Ali Sabri Road, Gulshan-e-Iqbal, Karachi
3. H # B-434, Sector 35/A, Area Gulshan-E-Hali Korangi No. 4, Zaman Town, Karachi
4. B-273, Block A, North Nazimabad, Karachi
5. E-38 Site Area Shershah, Karachi
6. 5/A, Block-6, Unit No.6, Latifabad, Hyderabad
7. A-115, Street no. 2 Sindh Corporative Housing Society, Airport Road, Sukkur
8. 288, Opposite Ladies Park, Shams Abad Colony, Multan
9. Kohinoor Industries Limited, Madina Town, Faisalabad
10. 173, Tehsil Road, Sahiwal
11. 6-A, Small Industrial Area, Lahore Road, Sargodha
12. 81-X, New Sadiq Colony, Bahawalpur
13. Factory Area, Shahbaz Pur Road, Rahim Yar Khan
14. 16, Shah Jamal, Lahore
15. 143/4 Begum Pura GT Road, Lahore
16. 2-C1, Street No. 1, Session Court Road, Civil Lines, Gujranwala
17. Khayam Plaza, Police Lines Road, Gujrat
18. Mubarak Palace, Garden Town, Butter Road, Daska Road, Sialkot
19. 85-C/2 ,Block C , Satellite Town, Rawalpindi
20. 44, Street No.6, Gulshan-e-Iqbal Town, University Road, Peshawar
21. 5 Street no. 7, Phase no. 2 Wah Model town, Wah Cantt.
22. 76, Baghdad Colony, North West Circular Road, Dera Ismail Khan
1. 25-1-C, Punjab Small Industries Estate, Bahawalpur Road, Bahawalpur
2. Chungi No. 5, Burewala
3. 4 KM Bannu Road, Dera Ismail Khan
4. Kohinoor Industries, College Road, Madina Town, Faislabad
5. Abdullah Marriage Hall, Near Pindi Bypass, Gujranwala
6. Plot No. D/2-A, Hyderabad
7. Main Fath Jung Road, Tarnool, Islamabad
8. D-132 Site, Metrovil, Karachi
9. Plot# 220, Sher Shah By Pass Road, Multan
10. Adil International (Private) Limited, Amangrah G.T. Road, Nowshera
11. Al Syed Godown, Airport Road, Quetta
12. Factory Area, Shahbaz Pur Road, Rahim Yar Khan
13. PEL Godown, 02 Km Multan Road, Sahiwal
14. A-3 Small Industres Estate, Sargodha
15. 6A, Main Small Industries State, Lahore Road, Sargodha
16. China Chowk, Pasrur Road, Sialkot
17. A-74, Block A Sindh Small Industrial Estate, Golimar, Sukkur
SALES OFFICES

Vision
To excel in providing engineering goods and services through continuous improvement.
MissionTo provide quality products and services to the complete satisfaction of our customers and maximize returns for all stakeholders through optimal use of resources.
To focus on personal development of our human resource to meet future challenges.
To promote good governance, corporate values and a safe working environment with a strong sense of social responsibility.
A 24 Pak Elektron Limited A 25Annual Report 2018

STATEMENT OF ETHICS AND BUSINESS PRACTICES CODE OF CONDUCT
PEL’s Code of Conduct claries its mission, values and principles, linking them with standards of professional conduct.
• Honesty and integrity: We shall demonstrate highest standards of honesty and integrity while conducting our employment activities.
• Unlawful activities: We shall not engage in any activity that is believed to be in violation of any law.
• Unfair advantage: We shall not abuse our position in any manner to inuence any person, including subordinates, to provide us any favour, whether nancial or otherwise.
• Conict of interest: We shall not allow ourselves to be put in a position, while representing the Company in dealings with third parties, in which an actual or perceived conict of interest exists.
• Other engagements: We shall not engage in any business activity, whether directly or indirectly, with any customer, supplier or agent of the Company or which is inconsistent or conicting with the business activities of the Company.
• Condentiality: We shall not use or disclose the Company’s proprietary or condential information to make personal gains or benets.
A 26 Pak Elektron Limited
• We are serving the nation through manufacturing and sales of electrical goods and home appliances. We are committed to represent the ethical responsibilities of company operations. In recognition of this, our commitment reects the value statements.
• As directors, and employees, we all are passionate to our contents and strive to be model of the principles. It is an organization of people who are united to achieve the common goal. We are accountable for all our actions both individually and as a company. We act with absolute honesty, integrity and fairness in the way we conduct our business and in the way we live and act.
• We realize the importance of the human life and company’s all other resources. We are committed, all the time, to the safe and reliable operations of our power complex, and to the incident-free workplace. We ensure that this commitment shall remain one of our utmost priorities.
• We are persistent about delivering our promises to the customers as our success comes only with the success of our customers. We carried out jobs keeping in view the satisfaction of our internal and external customers. We believe in cost effective quality of work with the aim of excellence in everything.
• We value the safety, security and peace of mind of our employees. We recognize and afrm the unique and intrinsic worth of each individual and treat all with compassion and kindness. We value treating each individual with an attitude of mutual respect, caring attention and fairness. We observe strict compliance in the organization discipline with respect to all the company rules and regulations.
• We embrace progress and growth as the life blood of our organization that gives us the freedom to fulll our vision and mission. This includes company’s growth as well as the career growth of the employees.
• We value and promote teamwork by providing a work environment that helps to recognize the benets of the individual and collective wisdom which is achieved through empowering the employees to create and act based upon the highest level of ethical conduct.
• We strive to enhance the quality of life of our surrounding community and set the precedent for the corporate sector to recognize the responsibilities. We value the promotion of mutual trust between the community and corporate sector.
Organizational culture at PEL is based on strongly held and widely shared set of values and beliefs that are supported by our strategy and structure. Our culture sets the context for everything we do and is driven by our core values.
ORGANIZATIONAL CULTURE
CORE VALUES
• Honesty and integrity in conducting business.
• Continued focus on customer satisfaction
• Being socially responsible by giving back to society.
• Adhering to high standards of morality.
A 27Annual Report 2018

Group Structure
A 28 Pak Elektron Limited
PAK ELEKTRON LIMITED (PEL)(PARENT COMPANY)
PEL contributes in your lives every day, by providing you not just appliances for a better lifestyle, but with Power products like transformers, switch gears and energy meters. We are the pioneers of electrical manufacturing in Pakistan and we are here to make a difference in your lives whether it is through taking care of your home, your lifestyle, making your day to day activities easier or by helping you save energy.
KOHINOOR INDUSTRIES LIMITED(TEXTILE MANUFACTURERS)
Kohinoor Industries Limited one of the largest vertically integrated textile manufacturers, started its successful journey back in 1949. Located at Kohinoor Nagar, College Road, Madina Town, Faisalabad. Kohinoor Industries Limited is PEL’s associated company by virtue of investment in ordinary shares by PEL and common directorship.
THE FOUR SEASONS / THE MEADOWS(A PROJECT OF REAL ESTATE)
The Four Seasons is a real estate project by Saigols which launched its rst project by the name of Four Seasons Housing Scheme in 2007 that spans over 800 Kanals of land area with 1000 housing units of various areas. The objective of the project is to develop schemes designed to meet all the requirements for a thriving commercial and residential community built along futuristic lines that ensures and enriches the quality of life. The Four Seasons is an associated undertaking of the Company by virtue of common partner/directorship. The Four Seasons is PEL’s associated undertaking by virtue of common directorship.
A 29Annual Report 2018
KOHINOOR ENERGY LIMITED (POWER GENERATION)
Kohinoor Energy Limited was incorporated in April 1994 with an objective to take part in the prosperity of the country through power generation. KEL having paid-up capital of Rupees 1,695 million and is a joint venture of Saigols Group of Companies (a well-known multi-industrial group of Pakistan) and Toyota Tsusho Corporation (an eminent consortium of multi-industrial undertakings of Japan.) KEL is situated at 35-KM Link Manga Raiwind Road Lahore. It is one of the pioneer projects of Independent Power Producers in Pakistan. The principle activities of the Company are to own, operate and maintain a furnace oil power station with the net capacity of 124 MW (gross capacity 131.44 MW). WAPDA is the sole customer of KEL. Kohinoor Energy Limited is PEL’s associated company by virtue of common directorship.
SARITOW SPINNING MILLS LIMITED(YARN)
In 1987, the Saritow Spinning Mills located at Multan Road, Phool Nagar, District Kasur was established under the banner of Saigol Group of Companies engaged in manufacturing of yarn. Facilitated with the most modern and efcient Japanese and European Machinery, its knitted yarn is renowned in Far east and Europe for its nest quality. Saritow Spinning Mills Limited is PEL’s associated company by virtue of common directorship.
RED COMMUNICATION ARTS (PRIVATE) LIMITED(ADVERTISEMENT)
In 1996 RED COMMUNICATION was formed to fulll the gap in advertisement sector. To be the best in the business, RED attracted the best talent in the business and translated the core belief into a full-edged working advertising machine. Its approach has helped transform businesses by engaging consumers and developing meaningful relationships with them. RED has expanded into the three major cities of Pakistan, and is among the fastest growing AD agencies today. In 2008, RED also became an afliate of the Publicis Groupe. Recently RED has extended its business in Digital Sector. It has managed to score a prominent position in the industry by extensive growth through advertisement for the leading brands of the country. It has won many advertisement and reporting awards like PAS, PAA etc. Red Communication Arts (Private) Limited is PEL’s associated company by virtue of common directorship.
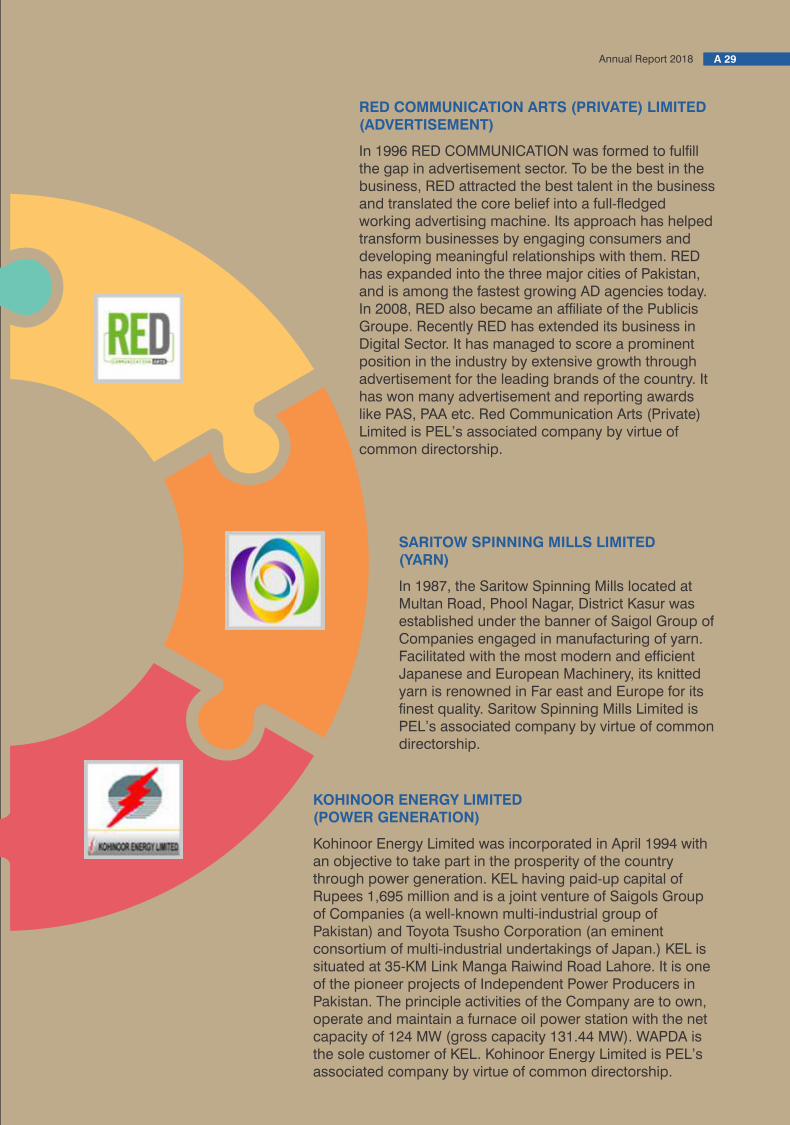

Human Capital
Human Capital is considered as one of most valuable resource at PEL. With signicant contributions towards the growth and success of PEL, Human Capital remains one the most important areas of focus as PEL endeavors to ensure acquisition of top talent and provision of best employee development programs, healthy and safe work environment and market commensurate compensation packages.
SUCCESSION PLANNING
In its quest of the Top Talent, PEL has formulated a comprehensive succession plan which includes performance evaluation and appropriate training requirements for development of potential and prospective future leaders. The succession plan allows PEL to ensure availability of competent personnel in each department.
RETIREMENT BENEFITS
PEL has put in place a retirement benet plan for its employees, in the form of an approved funded contributory provident fund “Pak Elektron Limited Employees Provident Fund Trust”. All employees who have completed a minimum qualifying period of service as dened under the trust are eligible. Equal monthly contributions are made by PEL and employees in accordance with the scheme, to cover the obligation.
Size of the fund as December 31, 2018 stood at Rs. 389.017 million. Investments of the fund at the close of 2018 are valued at 351.027 million.
A 30 Pak Elektron Limited
Size of fund Value of Investments
Financial year
Ru
pees
in m
illo
ns
SIZE OF PROVIDENT FUND &VALUE OF INVESTMENTS
-
50,000
100,000
150,000
200,000
250,000
300,000
350,000
400,000
450,000
2018
2017
MIX OF INVESTMENTS
20172018
Listed equity collective investment schemes
Government SecuritiesDeposit accounts with commercial banks
66.35%
33.65%28.64%
41.69%
29.66% The best preparation for tomorrow is doing your best today.-H Jackson brown Junior
A 31Annual Report 2018

Organization Chart
Administrative Reporting
Functional Reporting
Sr. ManagerCorporate Finance
Finance Manager(AD)/(PD) Financial Controller
Sr. Manager(Imports & Logistics)
Chief ExecutiveOfficer
Chief Financial Officer
Director Operations
Head of InternalAudit
Audit Committee
GM ManufacturingTransformers
Sr. GM MarketingPrivate Business
& WAPDA
GM ManufacturingSwitchgear
Shareholders
Board of Directors
A 32 Pak Elektron Limited
Company Secretary
HR & RemunerationCommittee
Sr. ManagerHuman Resources
Chief IT Officer
Sr. ManagerMarketing
(Appliances Division)
ManagerCompliance
ManagerManufacturingEnergy Meter
A 33Annual Report 2018
Sr. GM Sales(Appliances Division)
GMSupply Chain
GMIR & A
Sr. GM Manufacturing & R&D
GMManufacturing AC
& Deep Freezer
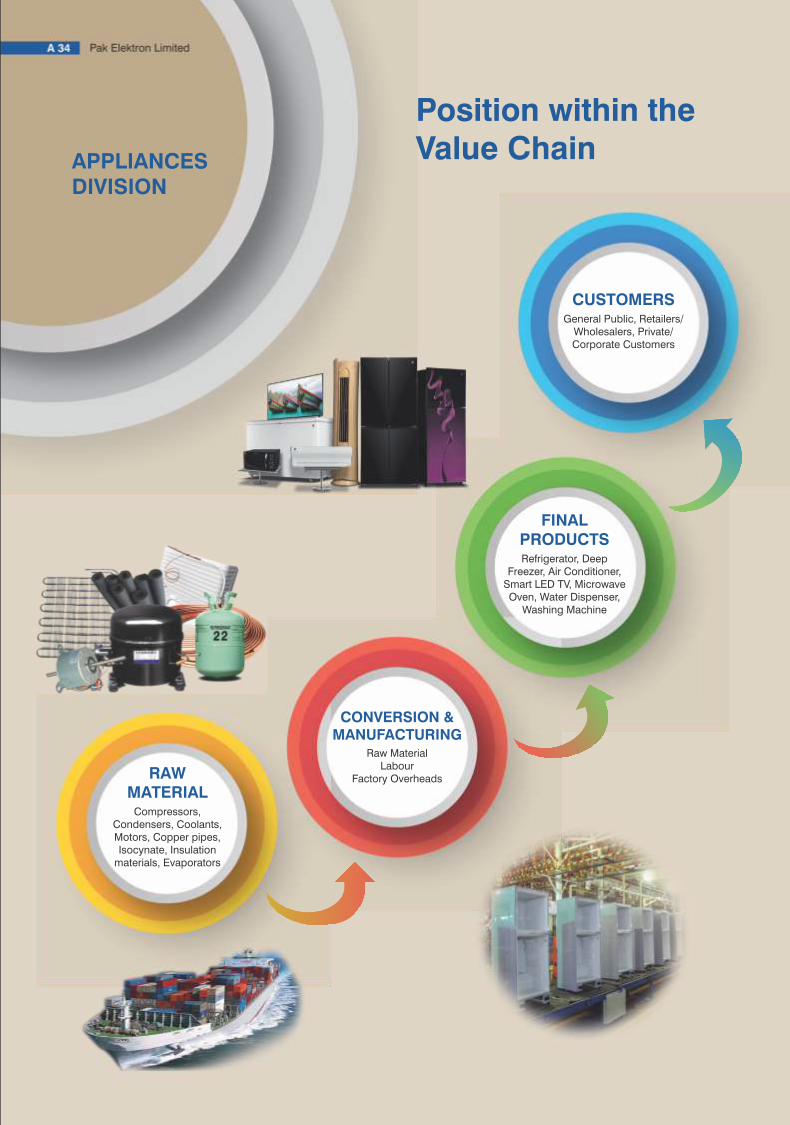
Position within theValue ChainAPPLIANCES
DIVISION
CUSTOMERSGeneral Public, Retailers/
Wholesalers, Private/ Corporate Customers
FINAL PRODUCTSRefrigerator, Deep
Freezer, Air Conditioner, Smart LED TV, Microwave Oven, Water Dispenser,
Washing Machine
CONVERSION & MANUFACTURING
Raw MaterialLabour
Factory Overheads RAW MATERIAL
Compressors, Condensers, Coolants, Motors, Copper pipes, Isocynate, Insulation
materials, Evaporators
A 35Annual Report 2018
POWERDIVISION
CUSTOMERSWAPDA DISCOs, Private/Corporate
Customers
FINAL PRODUCTS
Distribution Transformer, Power Transformers,
Energy Meter, Switchgears, EPC
Contracting
CONVERSION & MANUFACTURING
Raw MaterialLabour
Factory Overheads RAW
MATERIAL Copper coils, Silicon
steel sheets, Transformer oil, Magnet, Cables,
Cold-rolled grain oriented (CRGO)
laminations

Signicant Factors Affecting theExternal Environment
A 36 Pak Elektron Limited
Businesses are inuenced by the external environment that they're in and all the situational factors that determine circumstances from day to day. It is because of this, that businesses need to keep a check and constantly analyze the environment within which they operate and respond to the changes accordingly. Some of the important factors that affect the Company's external environment are as follows:
Factors DescriptionSignicant change
from prior yearPEL's response
These factors determine the extent to which a government may inuence the economy or a certain industry
• General elections 2018
• Political uncertainty
The Company keeps a close eye on the political situation of the country including changes in regulations and business policies in order to be able to take timely decisions to avoid any unfavourable outcome on the Company's business.
PO
LIT
ICA
L
These factors are determinants of an economy's performance that directly impacts a business and have resonating long term effects.
• Increase in interest rates
• Ination
• Rupee depreciation
• Reduced Government spending on infrastructure development
Decline in general economic conditions has been the main cause of decrease in protability of the Company.
EC
ON
OM
IC
These factors scrutinize the social environment of the market and gauge the demographic characteristics, norms, customs and values of the population within which the organization operates
• Customers have become technology intensive
• Decline in per capita disposable income
The Company continuously monitors customer characteristics and any changes there in and marketing and product development plans are devised and modied accordingly.
SO
CIA
L
A 37Annual Report 2018
Factors DescriptionSignicant change
from prior yearPEL's response
These factors pertain to innovations in technology that may affect the operations of the industry and the market favorably or unfavorably. This refers to automation, research and development and the amount of technological awareness that a market possesses.
• Energy efcient appliances have gained popularity
• Customers have become technology intensive
The Company recognizes the importance of consumer-driven product development, makes signicant investments in research and development and technologies, and remains a technology forerunner and market leader in providing new products and services to meet the challenges and technology intensive needs of its customers.
TE
CH
NO
LOG
ICA
L
These factors include laws, rules and regulations that organizations are required to abide by.
• Companies Act, 2017
• Finance Act, 2018
• New IFRSs and amendments thereto.
The Company has a professional in-house legal team, the members of which are experts of their respective elds as well as has retained services of accounting and law rms to ensure that the Company remains compliant with all laws that are applicable.
LE
GA
L
These factors include all those that inuence or are determined by the surrounding environment.
• Climate change
• Increase an average temperature.
Increase in average temperature in the country is expected to cause increase in demand for domestic appliances like Air Conditioners, Refrigerators, Deep Freezers and Water Dispensers. The Company has a proactive marketing team capable of making the most of this opportunity.
EN
VIR
ON
ME
NTA
L
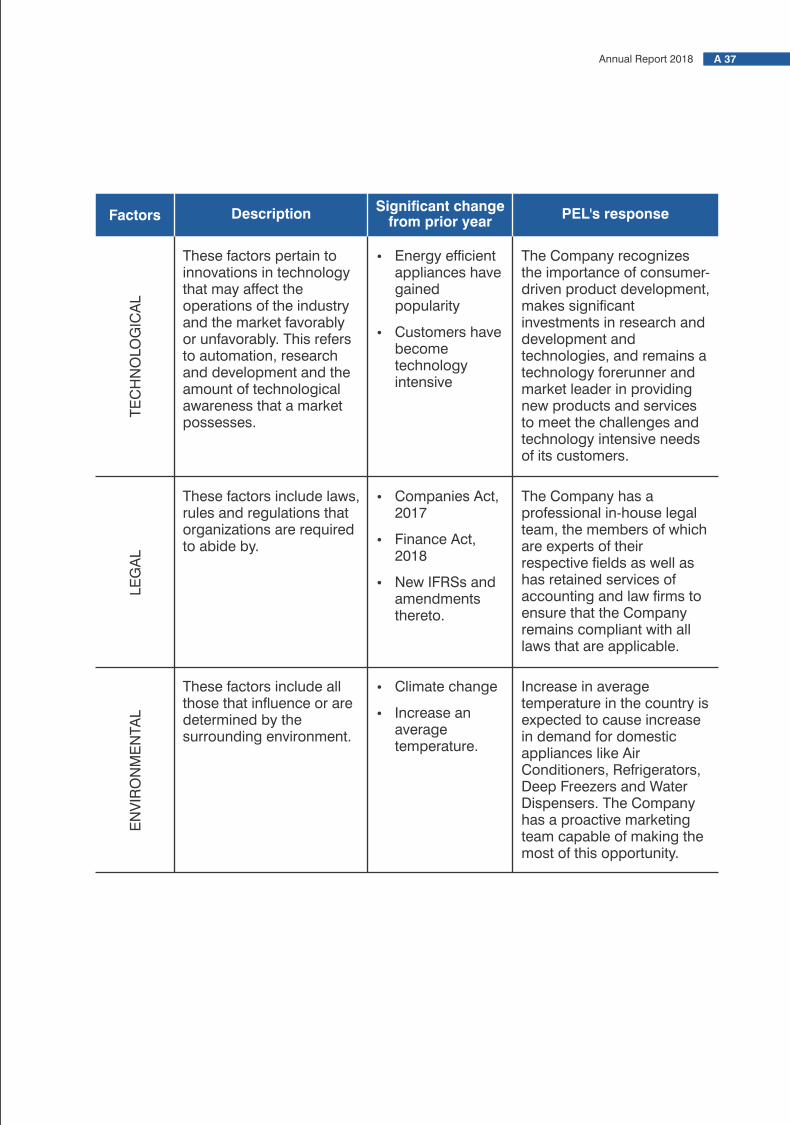

Effect of Seasonality on Business
A 38 Pak Elektron Limited
Appliances Division’s cooling products; refrigerators, air conditioners, water dispensers and deep freezers are season oriented products. The peak production and sales period is from April to August, while other products are produced and sold through out the year. Power Division products are produced and sold through out the year depending on ordering form WAPDA Discos.
The nancial statements of the Company for the year 2018 have been prepared in accordance with the requirements of Companies Act, 2017 ['the Act']. The Act was enacted on May 30, 2017. The Act has brought certain changes with regard to the preparation and presentation of these consolidated nancial statements. These changes, amongst others, included change in respect of presentation and measurement of surplus on revaluation of property, plant and equipment and change in nomenclature of primary statements. Further, the disclosure requirements contained in the fourth schedule of the Act have been revised, resulting in elimination of duplicative disclosure with the IFRS disclosure requirements and incorporation of additional/amended disclosures including, but not limited to, particulars of immovable assets of the Group, management assessment of sufciency of tax provision in the consolidated nancial statements, change in threshold for identication of executives, additional disclosure requirements for related parties, disclosure of signicant events and transactions affecting the nancial position and performance of the Group, disclosure relating to number of employees etc.
In line with the Company's vision of product diversication, the Company has set up its LED TV production line during the year and made a colorful entry in the market with a brand “COLOR ON”. The Company made a massive launch with advertisement campaigns all across the country to stamp the product awareness. Further, various new models of existing products with improved features and aesthetics were launched during the year.
Signicant Changes from Prior Year
Local vs Imported Raw Material andImpact of Exchange Rate Fluctuation
The Company sources a signicant part of its material procurement from international markets. Majority of these are imported directly, however some the imported material is also procured from local importers/vendors.
Imported
Local
65%
35%
65% of the material procured during the year was imported while 35% was sourced locally.
This exposes the Company to changes in exchange rates which have an important bearing on the nancial performance of the Company. Keeping all other factors constant, a 1% depreciation or appreciation in Pak Rupee during the year would have had an estimated impact of approximately Rs. 126 million on the prot before taxation. COMPOSITION OF RAW MATERIAL

B Strategy and Resource Allocation

B 02 Pak Elektron Limited B 03Annual Report 2018
Objectives and Strategies
Our short, medium and long term strategic objectives, strategies in place to achieve those strategic objectives, KPIs monitored and their future relevance are as follows:
Relevant term Objective
Product innovation and development
Strategies KPI's monitored
Short Term Improve existing product features and aesthetics through research and development and efcient market research
• Improved product features and aesthetics for existing products.
• No of new models for existing products launched.
Development of human capital
Short Term Technical and non-technical training programs for employees at all levels both internally and externally
• Training and education programs for employees.
Occupational health and safety for employees
Short Term Ensure a safe and congenial environment for employees through strict and stringent safety policies and regular health and safety trainings to avoid risk of accident
• Health and safety policies in place
• Training activities conducted
• Number of health and safety incidents.
Maintaining supplier relationships
Short Term Monitor cash ow requirements and produce cash ow projections for payables to ensure that timely payments are made as and when due
• Payable days
Maintaining customer relationships
Short Term Improve access to customers through a nationwide sale/service center and dealer network, continuous focus on after sales services and monitor customer feedback
• Sale/service center and dealer network
• After sales services
• Customer feedback
Be a socially responsible corporate entity
Short Term Promote a culture of giving back to the community
• CSR initiatives and activities
Have sufcient liquidity to meet liabilities when due
Short / Medium / Long term
Monitor cash ow requirements and produce cash ow projections for the short and long term. Maintain
• Liquidity ratios
• Timely payments
Relevant term Objective Strategies KPI's monitored
balance sheet liquidity ratios, debtors and creditors concentration both in terms of overall funding mix and avoid undue reliance on large individual customer.
DiversicationMedium Term Continuously seek avenues to diversify within and outside the Appliance and Power Industry
• Product range
Enhance production facilities and processes to improve efciency
Medium Term Keep up-to-date with the latest technology advancements to achieve production efciencies
• Technology upgradation activities.
Increase shareholder's wealth
Long Term Build on short and medium term objectives to increase shareholder's wealth
• Market share price
Maintain industry leadership and market presence
Long Term Planned and integrated marketing campaigns and increasing access to customers through a nationwide sale/service center and dealer network
• Market share
• Sales, service center and dealer network.
There were no signicant changes in objectives and strategies from prior years. The existing objectives and strategies have been re-arranged for the purposes of better reporting.
Further, all of the above KPIs will continue to be relevant in future.
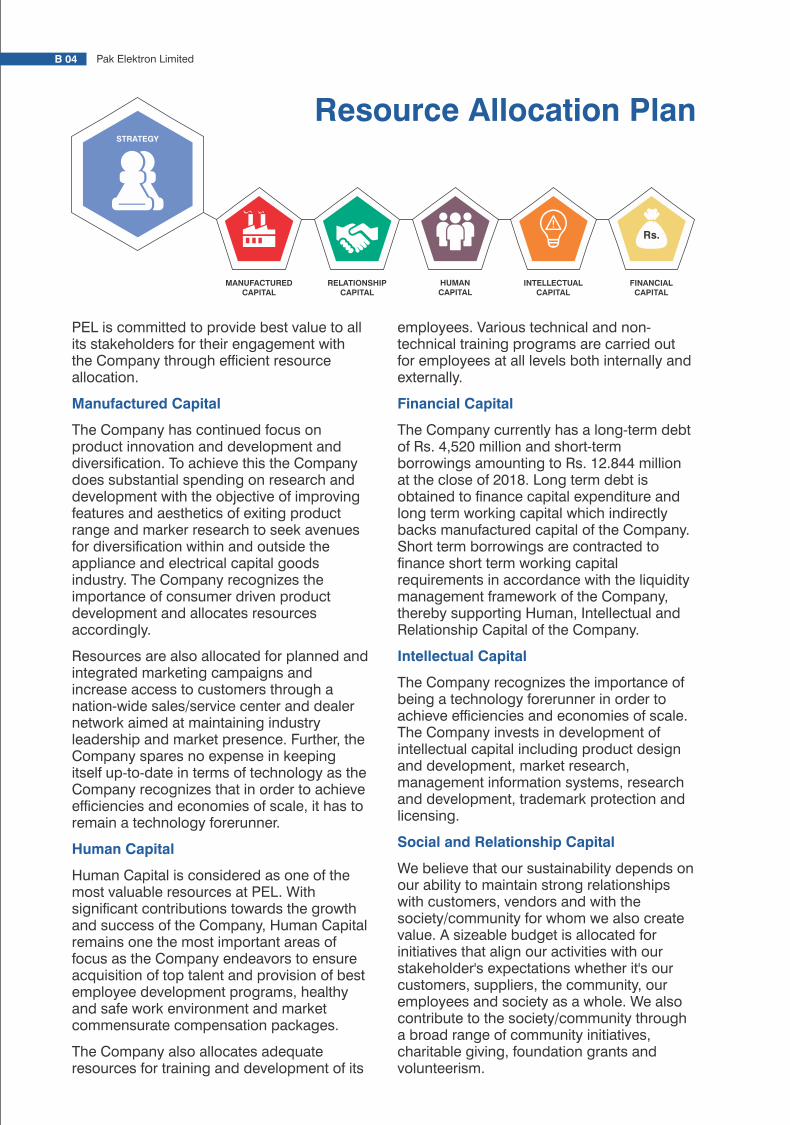
Business Model
Our business model is at the heart of our strategy. It enables us to prosper and positions us well to deliver continued growth.
Human Capital, being our most
important asset, directly affects our performance.
Market goodwill and brand image is another valuable asset that has
been, and continues to be, the primary ingredient to our
accomplishments.
Keeping abreast with latest technology is key input to our continuous efforts to
produce innovative high quality products.
Our nationwide distribution network and international presence enables us to reach a wide range
of customers.
KEY ASSETS
SUSTAINABLITY
Customer satisfaction is the one of main areas of focus in our sustainability model which is
achieved through a comprehensive quality assurance mechanism and excellent after sales
services. Liquidity is the key to smooth running of operations. Adequate reserves and banking
facilities are maintained by continuously monitoring of forecasts and actual cash ows.
Continuous research and development has allowed us to emerge as technology and
innovation leader in the industry.
GROWTH DRIVERS
Our growth is
primarily driven by increase in sales
revenue resulting from strong demand forour
products and our presence nationwide and
internationally.
We have continued focus on improving production
efciencies and economizing costs which, in turn
contributes towards improved protability.
Effective planning is the key to achieving our
management objectives. Continuous
monitoring enables us to identify gaps
and improve our planning
process.
B 04 Pak Elektron Limited B 05Annual Report 2018
PEL is committed to provide best value to all its stakeholders for their engagement with the Company through efcient resource allocation.
Manufactured Capital
The Company has continued focus on product innovation and development and diversication. To achieve this the Company does substantial spending on research and development with the objective of improving features and aesthetics of exiting product range and marker research to seek avenues for diversication within and outside the appliance and electrical capital goods industry. The Company recognizes the importance of consumer driven product development and allocates resources accordingly.
Resources are also allocated for planned and integrated marketing campaigns and increase access to customers through a nation-wide sales/service center and dealer network aimed at maintaining industry leadership and market presence. Further, the Company spares no expense in keeping itself up-to-date in terms of technology as the Company recognizes that in order to achieve efciencies and economies of scale, it has to remain a technology forerunner.
Human Capital
Human Capital is considered as one of the most valuable resources at PEL. With signicant contributions towards the growth and success of the Company, Human Capital remains one the most important areas of focus as the Company endeavors to ensure acquisition of top talent and provision of best employee development programs, healthy and safe work environment and market commensurate compensation packages.
The Company also allocates adequate resources for training and development of its
employees. Various technical and non-technical training programs are carried out for employees at all levels both internally and externally.
Financial Capital
The Company currently has a long-term debt of Rs. 4,520 million and short-term borrowings amounting to Rs. 12.844 million at the close of 2018. Long term debt is obtained to nance capital expenditure and long term working capital which indirectly backs manufactured capital of the Company. Short term borrowings are contracted to nance short term working capital requirements in accordance with the liquidity management framework of the Company, thereby supporting Human, Intellectual and Relationship Capital of the Company.
Intellectual Capital
The Company recognizes the importance of being a technology forerunner in order to achieve efciencies and economies of scale. The Company invests in development of intellectual capital including product design and development, market research, management information systems, research and development, trademark protection and licensing.
Social and Relationship Capital
We believe that our sustainability depends on our ability to maintain strong relationships with customers, vendors and with the society/community for whom we also create value. A sizeable budget is allocated for initiatives that align our activities with our stakeholder's expectations whether it's our customers, suppliers, the community, our employees and society as a whole. We also contribute to the society/community through a broad range of community initiatives, charitable giving, foundation grants and volunteerism.
Resource Allocation PlanSTRATEGY
MANUFACTUREDCAPITAL
Rs.
FINANCIALCAPITAL
INTELLECTUALCAPITAL
HUMANCAPITAL
RELATIONSHIPCAPITAL

-
0.50
1.00
1.50
2.00
2.50
3.00
2013 2014 2015 2016 2017 2018
Tim
es
Years
Current ratio
-
0.50
1.00
1.50
2.00
2013 2014 2015 2016 2017 2018
Tim
es
Years
Quick Ratio
-
200
400
600
800
2013 2014 2015 2016 2017 2018
Ru
pees
in m
illio
n
Years
Liquid assets
Cash and bank balances Short term investments
B 06 Pak Elektron Limited
Liquidity Management
Liquidity Position
The Company's liquid assets comprise short term investments and cash and bank balances which stood at an aggregate of Rs. 493.33 million at the close of 2018.
Liquidity management
PEL continuously aims to maintain a strong liquidity position through an effective liquidity management system to ensure availability of sufficient working capital. The Board of Directors has built an appropriate liquidity management framework for the management of short, medium and long-term funding and liquidity requirements.
The Company's approach to managing liquidity risk is to ensure, as far as possible, that it will always have sufficient liquidity to meet its liabilities when due, under both normal and stressed conditions, without incurring unacceptable losses or risking damage to the Company's reputation. The Company monitors cash flow requirements and produces cash flow projections for the short and long term. Typically, the Company ensures that it has sufficient cash on demand to meet expected operational cash flows, including servicing of financial obligations. This includes maintenance of balance sheet liquidity ratios, debtors and creditors concentration both in terms of overall funding mix and avoidance of undue reliance on large individual customer and matching the maturity profiles of financial assets and liabilities.
Cash flow projections for the future indicate availability of sufficient funds for timely repayment of external debts as well as for retention for sustained profitability.
Company has a robust growth history by expanding its market share and up keep of higher customer satisfaction level and brand equity. All necessary improvements in manufacturing facilities were made for market competitiveness and brand equity. Further, to cater the growth factor, necessary plant capacity expansion managed compactable latest product designs to explore exports market. Company on the consistent market demand enhanced its product range. In year under review Company launched. LED TVs after successful production trial run. Installation of washing machine manufacturing facility started during the year and production is
ndlikely to be started by 2 half of year 2019.
Significant Plans and Decisions

C Risks and Opportunities

C 02 Pak Elektron Limited C 03Annual Report 2018
Risks and Opportunities
PEL's activities expose it to a variety of risks which are subject to difference levels of uncertainty against which PEL has implemented effective mitigating strategies. These risks can emanate from a number of factors including but not limited to uncertainties in nancial markets, project failures, legal liabilities, credit risk, accidents and disasters as well as deliberate aggressive actions from an adversary, or uncertain or unpredictable events.
Risk Governance Structure
PEL's risk management policies are established to identify and analyze the risks faced by PEL, to set appropriate risk limits and controls, and to monitor risks and adherence to limits. Risk management policies and systems are reviewed regularly to reect changes in market conditions and PEL's activities. PEL, through its training and management standards and procedures, aims to develop a disciplined and constructive control environment in which all employees understand their roles and obligations.
The Board of Directors has overall responsibility for the establishment and oversight of PEL's risk management framework. The Board is responsible for developing and monitoring PEL's risk management policies.
The Audit Committee oversees how management monitors compliance with PEL's risk management policies and procedures and reviews the adequacy of the risk management framework in relation to the risks faced by PEL. The Audit Committee is assisted in its oversight role by Internal Audit department. Internal Audit department undertakes both regular and ad hoc reviews of risk management controls and procedures, the results of which are reported to the Audit Committee.
The Human Resource & Remuneration Committee focuses on risks in its area of oversight. This includes succession planning with a view to ensure availability of talented functionaries in each area of critical company operations as well as assessment of compensation programs to ensure that they do not escalate corporate risk.
RISKS AND MITIGATION STRATEGIES
Risk
Technological shift may render PEL's production process obsolete.
Source
Moderate / High
Likelihood /Magnitude
Capital affected Mitigation strategy
External Manufactured / Intellectual Capital
Regular balancing, modernization and replacement carried out at all production facilities in order to ensure state of the art production plants utilizing latest technology resulting in cost efciencies and improved products.
Strong market competition lowering demand for PEL's products
Low / Moderate
External Manufactured / Intellectual Capital
PEL holds a considerable market share and has continued focus on sustaining and maintaining its market share through offering new and improved products and
Risk SourceLikelihood /Magnitude
Capital affected Mitigation strategy
effective marketing strategies
Turnover of personnel at critical positions may affect smooth running of operations
Low / Moderate
Internal Human Capital PEL has formulated a comprehensive succession plan which includes performance evaluation and appropriate training requirements for development of potential and prospective future leaders
Breach of IT Security may affect operations and cause nancial and data loss
Low / High Internal Financial / Intellectual Capital
Adequate IT controls are in place to prevent unauthorized data access to condential information. Regular IT audits and trainings are conducted to monitor IT controls
Accidents and disasters, natural or by deliberate actions, may disrupt operations
Low / High Internal / External
Manufactured / Financial / Intellectual Capital
PEL has put in place a comprehensive Disaster Recovery and Business Continuity Plan which has been implemented at all locations and PEL's staff is fully trained and equipped to recover from any disruption
Further strict and standard operating procedures are in place and implemented together with employee trainings, operational discipline and regular safety audits

C 04 Pak Elektron Limited C 05Annual Report 2018
Risk SourceLikelihood /Magnitude
Capital affected Mitigation strategy
Loss of customer condence in PEL brand adversely affecting sales
Low / High External Manufactured Capital
Continued focus on new and improved products and state of the art after sales services to customers
Breach of law resulting in nes, penal action or suspension of business operations
Low / High Internal Manufactured / Financial Capital
Monitoring of latest updates in regulatory framework is carried out to prevent in breach of law. Expert legal advice is obtained before taking any critical decision
Default by customers causing nancial loss
Low / Moderate
Internal Financial / Relationship Capital
PEL maintains procedures covering the application for credit approvals, granting and renewal of counterparty limits and monitoring of exposures against these limits. As part of these processes the nancial viability of all counterparties is regularly monitored and assessed. Outstanding customer receivables are regularly monitored and any shipments to major customers are generally covered by letters of credit or other form of credit insurance.
Liquidity shortfall resulting in inability to make payments as the fall due
Low / Moderate
Internal Financial Capital The responsibility for liquidity risk management rests with the Board of Directors, who has built an appropriate liquidity risk management framework for the
Risk SourceLikelihood /Magnitude
Capital affected Mitigation strategy
Increase in interest rates resulting high interest costs
Moderate / Moderate
External Financial Capital
management of the PEL's short, medium and long-term funding and liquidity management requirements. Liquidity risk is managed by maintaining adequate reserves, banking facilities and reserve borrowing facilities, by continuously monitoring forecast and actual cash ows and matching the maturity proles of nancial assets and liabilities
PEL manages interest rate risk by analyzing its interest rate exposure on a dynamic basis. Cash ow interest rate risk is managed by simulating various scenarios taking into consideration renancing, renewal of existing positions and alternative nancing. Based on these scenarios, the management calculates impact on prot after taxation and equity of dened interest rate shift, mostly 100 basis points
Rupee depreciation causing increase in costs
High / High External Manufactured / Financial Capital
The Company does continuous monitoring of expected/forecast committed and non-committed foreign currency payments
Risks and Opportunities
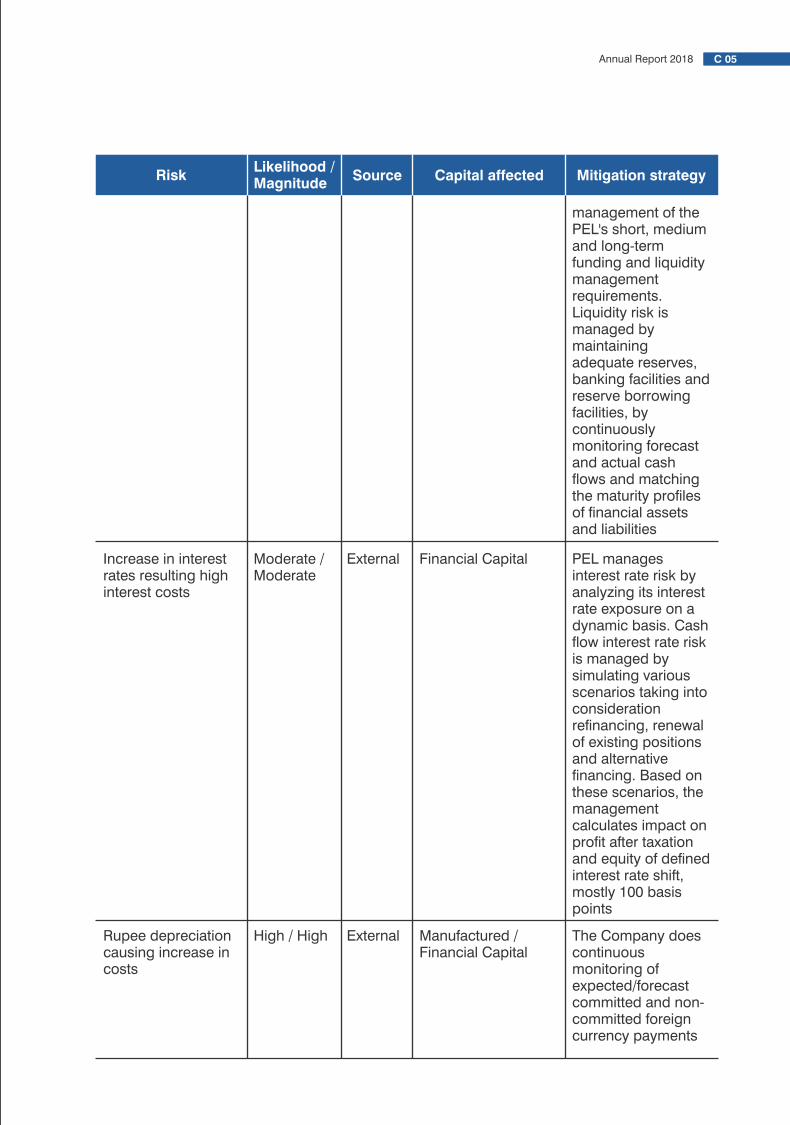

C 06 Pak Elektron Limited C 07Annual Report 2018
Risk SourceLikelihood /Magnitude
Capital affected Mitigation strategy
and receipts. Reports on forecast foreign currency transactions, receipts and payments are prepared on monthly basis, exposure to currency risk is measured and appropriate steps are taken to ensure that such exposure is minimized
Risks and Opportunities
OPPORTUNITIES AND MATERIALIZATION STRATEGIES
Opportunity
There are still numerous unexplored product lines that are offered by current competitors of PEL.
Internal
Source Capital affected Materialization strategy
Manufactured Capital
Continuously seek avenues to diversify within and outside the Appliance and Power Industry
Demand for grid station installations and underground and on ground electrications due to increase in housing sector schemes, upgrading of grid stations, government's focus towards augmentation of transmission and dispatch Infrastructure and CPEC
External Manufactured Capital
The company is aiming to capitalize on its brand equity and commercial relations with WAPDA Distribution Companies in the emerging CPEC Scenario along with investment in initiatives to enhance relationships with customers in the private/corporate sector
SWOT Analysis
Matters are considered to be material, if they, individually or in aggregate, are expected to significantly affect the performance and profitability of the Company.
Powers of the Board of Directors and the management of PEL have been defined with reference to, and in compliance with relevant regulatory framework, the Articles of Association of PEL, guidelines and frameworks issued by professional bodies and best practices.
Determination of materiality levels, other than those provided under the law, is judgemental and varies between organizations. Authorizations for transactions and delegation of powers have also been defined clearly and carried out through formal and implemented policies and procedures. Materiality levels are reviewed on a periodic basis and updated as required.
MATERIALITY APPROACH
STRENGTHS
• Product diversication• Sufcient production capacity to absorb the
increase in volumes• Technical Collaboration with international
reputed organizations• Latest Technologies• Excellent labour skills to execute Power
Division orders• Focused Research and Development
strategy• Strong country wide dealers network• Strong, efcient and broad after sales
network
WEAKNESSES
• The Company has high nancial leverage
THREATS
• Availability of timely working capital• Law and order situation and political
disturbance in the country• Dependence on WAPDA/ DISCOs Financial
health• Devaluation of Pak Rupee• Change in regulatory frame work
OPPORTUNITIES
• Government has plans to up grade existing electricity infra structure resulting into more orders for Power Division.
• Appliances market is showing growth.• Local industry preferential protection in
international tenders.
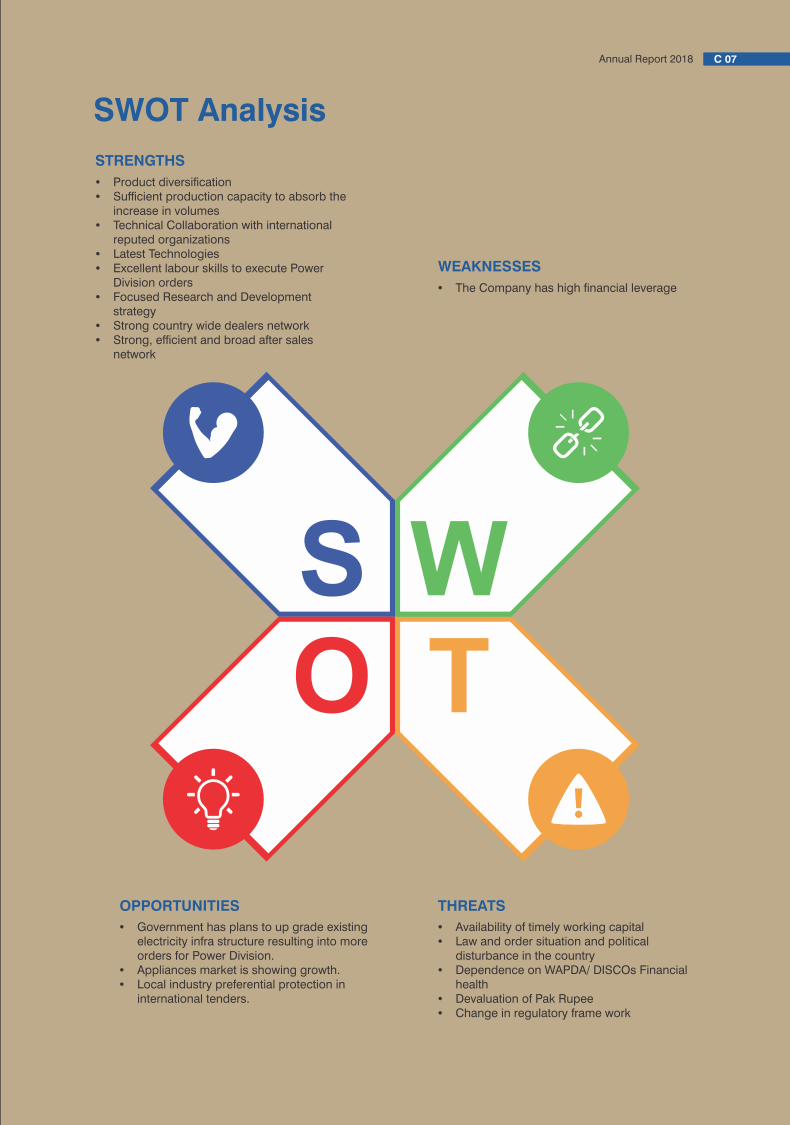

PEL's capital structure comprises of Rs. 4,977 million of ordinary share capital with net worth of Rs. 12,392 million, preferred share capital of Rs. 450 million, reserves of Rs. 24,853 and long term debt (including current maturity) of Rs. 4,520 million at the close of 2018 with a debt-equity ratio of 13:87 as compared to 18:82 in 2017.
-
5,000
10,000
15,000
20,000
25,000
30,000
35,000
40,000
2013 2014 2015 2016 2017 2018
Ru
pees
in m
illio
n
Years
Capital Structure
Orindary share capital Preferred share capital
Reserves Long term debt
C 08 Pak Elektron Limited
Repayment of Debts
Capital Structure
The Group's external long term debt stood at Rs. 4,520 million at the close of 2018 recording a net decrease of Rs. 1,558 million.
Short term borrowings showed an increase of Rs. 5,616 million due to increase in reliance on external borrowings for working capital requirements.
PEL is in the process of finalizing re-profiling exercise based on mutual agreement to be made amongst the existing investors for redemption/settlement of outstanding preference shares.
PEL has remained current in debt servicing throughout the year. All payments on account of principal repayments and interest have been made by due dates.

GovernanceD

Board of Directors
D 02 Pak Elektron Limited D 03Annual Report 2018
MR. M NASEEM SAIGOL Chairman/Non-Executive
Mr. M. Naseem Saigol is the Chairman of the Saigol Group of Companies including PEL. He holds a degree in chemical engineering from USA. Mr. M. Naseem Saigol came up with the vision to serve the nation through power industry in 1994 when Pakistan was facing a severe shortage of power supply. He joined hands with Tomen Corporation Japan (later on acquired by Toyota Tsusho Corporation, Japan) and formed Kohinoor Energy Limited (KEL) as an Independent Power Producer. KEL is proudly contributing to the dire power needs of the country.
Mr. M. Naseem Saigol has been the Chairman of All Pakistan Textile Mills Association (APTMA), Vice President of Lahore Chamber of Commerce and Industry, President of Faisalabad Chamber of Commerce and Industry, and is member of Industrial Employers' Association. He holds the office of Honorary Consulate of Belgium. Mr. M. Naseem Saigol through his business group in terms of services, manufacturing home appliances and electrical equipment, textile products and exports thereof, and power generation, is not only contributing to exchequer and the GDP of the country but also bestows businesses to local vendor industry and provides job opportunities to thousands of Pakistanis. He, being an eminent textile entrepreneur, has also the honor to provide technical and management expertise to the governments of Libya, Somalia and Tanzania for establishing textile industry in their countries.
Mr. M. Naseem Saigol is also on the Boards of Kohinoor Energy Limited, Saritow Spinning Mills Limited, Kohinoor Industries Limited and Kohinoor Power Company Limited.
Mr. M. Murad Saigol is the Chief Executive and Managing Director of the Company. He did his graduation from School of Oriental and African Studies, London UK. He looks after all of the Strategic and Operational affairs of the Company. He joined PEL in 2005 and achieved certain land marks in Company Business. In his current role he is responsible to drive the Company affairs in accordance with Board of Directors Vision and Mission. He is a Corporate Governance Certified Director under Directors Training Program.
Mr. M. Murad Saigol is also on the Boards of Saritow Spinning Mills Limited, Kohinoor Industries Limited and Kohinoor Power Company Limited.
MR. M. MURAD SAIGOL Chief Executive Officer
Mr. M. Zeid Yousaf Saigol is an Executive Director on the Board of PEL. He holds Bachelors in Science (BS) in Chemical Engineering from Carnegie Mellon University USA.
He is associated with Company since 2011 and is leading the Company's Power Division Operations. He is a Corporate Governance Certified Director under Directors Training Program.
Mr. M. Zeid Yousaf Saigol is also on the Boards of Saritow Spinning Mills Limited, Kohinoor Industries Limited and Kohinoor Power Company Limited.
MR. M. ZEID YOUSAF SAIGOL Executive Director
Syed Manzar Hassan is an Executive Director on the Board of PEL and is also the Chief Financial Officer of the Company. He is a Fellow Member of Institute of Chartered Accountants of Pakistan. He has over 20 years' experience in Financial Management, Financial & Management Reporting and handling Corporate Matters with a Specialization in Corporate Finance. He joined PEL in 1998 and is responsible for financial matters including budgeting and financial planning. In his current role, he is responsible for all necessary financing arrangements for smooth cash flow, budgeting and business planning, management and corporate accounting, company taxation and regulatory issues and company IT resource management. He is a member of the Company's Human Resource & Remuneration Committee. He is a Corporate Governance Certified Director under Directors Training Program.
SYED MANZAR HASSAN Executive Director & CFO
In addition to the above directors Mr. Asad Ullah Khawaja is an Independent Non-Executive Director on the Board of PEL nominated by NIT.
The following Directors are on the Board of directors of PEL through nomination under section 182 of the Companies Ordinance, 1984.
1) Mr. Usman Shahid 2) Mr. Jamal Baquar 3) Ms. Azra Shoaib
OTHER DIRECTORS
Mr. S M Shakeel is a Non-Executive Director on the Board of PEL. He is a Fellow Member of the Institute of Chartered Accountants of Pakistan. In 1990 he joined A. F. Ferguson & Co, Lahore, as Audit Trainee. During the training, he gained extensive experience of operations of a number of listed companies representing diverse segments of industry and finance. He passed his C.A. examination in 1994, and in recognition to his outstanding performance the Institute awarded him with the Gold Medal. He is a Corporate Governance Certified Director under Directors Training Program.
In 1994, he joined the Saigols Group as Manager Finance and was soon promoted to the position of General Manager Finance. Mr. Shakeel carries a wide range of experience in the fields of project development, business operations, financial management, and corporate and tax administration. He is a member of the Company’s Audit Committee. He is a Corporate Governance Certified Director under Directors Training Program.
He is also on the Board of Kohinoor Energy Limited.
SHEIKH MUHAMMAD SHAKEELNon-Executive Director
Syed Haroon Rashid has over twenty years of experience in corporate Finance and strategic management having worked in various Financial as well as non-Financial institutions. He started his career with the Experts Advisory Cell, a successor to the Board of Industrial Management, established to assist the Ministry of Production in the management & control, corporate planning and performance evaluation of public sector industrial enterprises in sectors ranging from fertilizer, automobiles, heavy engineering, chemicals, petroleum, cement to steel. Subsequently, he served as Advisor with the Investment Corporation of Pakistan which was the first closed-end mutual fund established in Pakistan in the early 1960's. Later, he joined the Zarai Taraqiati Bank Ltd. as part of a senior management team formed for the restructuring of the Bank where he served as Head, Restructuring (Project Loans) as well as Head, Project Implementation Unit of the Asian Development Bank. He played a major role in restructuring of corporate loan departments of the organization and worked to successfully revitalize them. He is also a training consultant with the National Institute of Banking and Finance, Islamabad (State Bank of Pakistan).
Syed Haroon Rashid has also served as NIT's (National Investment Trust) Director on Boards of various public listed companies. He is also a Certified Director of the IFC (World Bank Group) sponsored by Pakistan Institute of Corporate Governance.
Syed Harron Rashid is also on the Boards of Saritow Spinning Mills Limited, Baluchistan Wheels Limited and Ghandara Nissan Limited.
Non-Executive Director
SYED HAROON RASHID
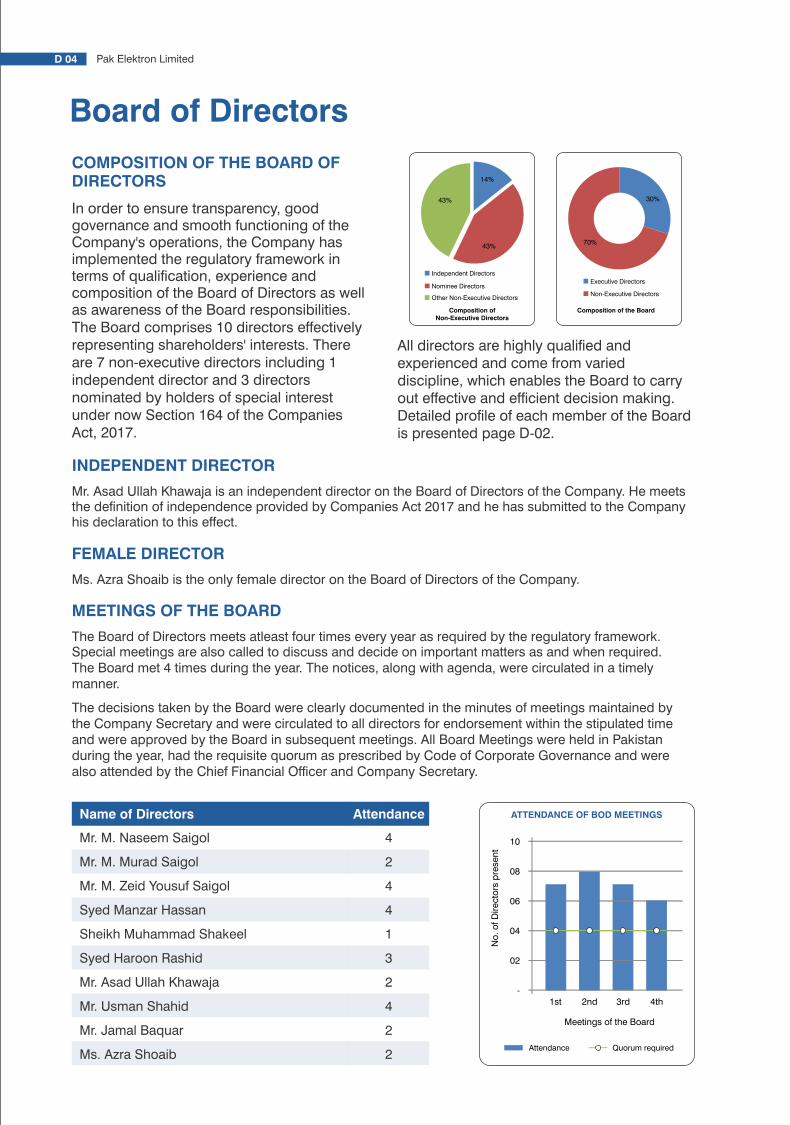
Board of Directors
D 04 Pak Elektron Limited D 05Annual Report 2018
MEETINGS OF THE BOARD
The Board of Directors meets atleast four times every year as required by the regulatory framework. Special meetings are also called to discuss and decide on important matters as and when required.The Board met 4 times during the year. The notices, along with agenda, were circulated in a timely manner.
The decisions taken by the Board were clearly documented in the minutes of meetings maintained by the Company Secretary and were circulated to all directors for endorsement within the stipulated time and were approved by the Board in subsequent meetings. All Board Meetings were held in Pakistan during the year, had the requisite quorum as prescribed by Code of Corporate Governance and were also attended by the Chief Financial Officer and Company Secretary.
Name of Directors Attendance
Mr. M. Naseem Saigol
Mr. M. Murad Saigol
Mr. M. Zeid Yousuf Saigol
Syed Manzar Hassan
Sheikh Muhammad Shakeel
Syed Haroon Rashid
Mr. Asad Ullah Khawaja
Mr. Usman Shahid
Mr. Jamal Baquar
Ms. Azra Shoaib
4
2
4
4
1
3
2
4
2
2
-
02
04
06
08
10
1st 2nd 3rd 4th
Meetings of the Board
No
. o
f D
irecto
rs p
rese
nt
ATTENDANCE OF BOD MEETINGS
Attendance Quorum required
COMPOSITION OF THE BOARD OF DIRECTORS
In order to ensure transparency, good governance and smooth functioning of the Company's operations, the Company has implemented the regulatory framework in terms of qualification, experience and composition of the Board of Directors as well as awareness of the Board responsibilities.The Board comprises 10 directors effectively representing shareholders' interests. There are 7 non-executive directors including 1 independent director and 3 directors nominated by holders of special interest under now Section 164 of the Companies Act, 2017.
14%
43%
43%
Independent Directors
Nominee Directors
Other Non-Executive Directors
Composition ofNon-Executive Directors
30%
70%
Executive Directors
Non-Executive Directors
Composition of the Board
All directors are highly qualified and experienced and come from varied discipline, which enables the Board to carry out effective and efficient decision making. Detailed profile of each member of the Board is presented page D-02.
INDEPENDENT DIRECTOR
Mr. Asad Ullah Khawaja is an independent director on the Board of Directors of the Company. He meets the definition of independence provided by Companies Act 2017 and he has submitted to the Company his declaration to this effect.
FEMALE DIRECTOR
Ms. Azra Shoaib is the only female director on the Board of Directors of the Company.
BOARD OPERATIONS
Each member of the Board is fully aware of his responsibilities as an individual member as well as the responsibilities of all members together as a board.
The Board actively participates in all major decisions of the Company including appointment approval of capital expenditure budgets, investments, issuance of equity and debt capital, related party transactions and appointment of key personnel.
The Board also monitors the Company's operations by approval of financial statements, review of internal and external audit observations, if any and recommendation of dividend.
The Board has devised formal policies for conducting business and ensures their monitoring through an independent Internal Audit Department which continuously monitors adherence to Company Policies.
The responsibility of implementing the strategies as approved by the Board of Directors is that of the management. The management conducts the routine business operations of the Company in an effective and ethical manner in accordance with the strategies and goals approved by the Board and identifies and administers the key risks and opportunities which could impact the Company in the ordinary course of execution of its business. Management is also concerned in keeping the Board members updated regarding any changes in the operating environment or risk profile. It is also the responsibility of management, with the oversight of the Board and its Audit Committee, to prepare financial statements that fairly present the financial position of the Company in accordance with applicable accounting standards and legal requirements.
CHANGES TO THE BOARD
There were no changes to the Board of Directors during the year.
ANNUAL EVALUATION OF BOARD’S PERFORMANCE
PEL has put in place a comprehensive mechanism for undertaking annual evaluation of the performance of the Board of Directors in accordance with the requirement of the Code of Corporate Governance.
The mechanism evaluates the performance of the Board on the following parameters:
• Board composition, organization and scope
• Board functions and responsibilities
• Monitoring of Company's performance
Evaluation forms and checklists are circulated to all members of the Board and each member is required to submit the same duly filled to the Company Secretary.
The results are consolidated and discussed in the nest meeting to formulate a strategy for improvement in Board's performance.
OFFICE OF THE CHAIRMAN AND CHIEF EXECUTIVE OFFICER
The office of Chairman and that of the Chief Executive Officer of the Company are held separately, as part of the Company's governance structure, with clear division of roles and responsibilities.
ROLES AND RESPONSIBILITIES OF THE CHAIRMAN AND CHIEF EXECUTIVE OFFICER
The Chairman acts as the head of the Board and is responsible for assessing and making recommendations regarding effectiveness of the Board and ensuring effective role of the Board in fulfilling all its responsibilities and has the power to set agendas, give directions and sign the minutes of Board meetings.
The Chief Executive Officer is an executive director who also acts as the head of the Company's management in the capacity of managing director and implements the policies delegated by the Board within the limits prescribed.

D 06 Pak Elektron Limited D 07Annual Report 2018
The main responsibilities of the Chief Executive Officer include:
• Safeguarding the Company's assets
• Creation of shareholder value
• Identification of potential
• diversification/investment projects
• Implementation of projects approved by the Board
• Ensuring effective functioning of the internal control system
• Identifying risks and designing mitigation strategies
• Development of human capital and good investors' relations
• Compliance with regulations and best practices.
FORMAL ORIENTATION AT INDUCTION
New members of the Board are taken through a detailed orientation process at the time of induction. The orientation process involves a familiarization program which mainly features the following:
• Vision, mission, core values and strategies and stakeholders.
• Significant policies
• Summary of financial position
• Risks exposure and management
• Critical performance indicators
• Roles and responsibilities of director under the statute
• Expectations from the Board
• Facets of business including strategic plans, forecasts, minutes of past meetings and litigations.
DIRECTORS' TRAINING PROGRAM
The following directors have obtained certification under the Directors' Training Program from SECP approved institutes in accordance with requirements of the Code of Corporate Governance:
Board of Directors
1. M. Murad Sagol
2. M. Zeid Yousuf Saigol
3. Sheikh Muhammad Shakeel
4. Syed Haroon Rashid
5. Syed Manzar Hassan
Certifications of the remaining members of the Board are expected to be completed as per schedule prescribed by Listed Companies (Code of Corporate Governance) Regulations, 2017.
DIRECTORS' REMUNERATION
There are formal and transparent procedures for fixing the remuneration of directors and no director is involved in deciding his own remuneration. Remuneration levels are kept at a reasonable level in order to attract and retain directors, without compromising independence.
FOREIGN DIRECTORS
The Company does not have any foreign directors on its Board.
IMPLEMENTED GOVERNANCE PRACTICES VS LEGAL REQUIREMENTS
PEL is committed to highest standards of business ethics to promote transparency, fairness and accountability throughout its business processes which thereby protects customer and shareholder interests. PEL as an organization encourages proactive and accountable management system to ensure transparency and compliance with laws. To further strengthen implementation of the same, PEL has well composed and structured policies and procedures based on international standards that are ahead of our laws and regulations. For this we have instituted a comprehensive legal and compliance function in the company that goes beyond legal requirements.
Related parties from the Company's perspective comprise subsidiary, associated companies and undertakings, key management personnel and post employment benefit plan. Key management personnel are those persons having authority and responsibility for planning, directing and controlling the activities of the Company, directly or indirectly, and includes the Chief Executive and Directors of the Company. The details of Company's related parties, with whom the Company had transactions during the year or has balances outstanding as at the reporting date are as follows:
Name of related party Nature of relationship Basis of relationship Nature of transaction
Pak Elektron Limited
Employees Provident Fund Trust
Provident Fund Trust Contribution to provident fund
N/A
PEL Marketing (Private) Limited Subsidiary Investment Sale of goodsExpense allocation
N/A
Kohinoor Power Company Limited Associated company Investment Purchase of services N/A
Common Directors Purchase of servicesRed Communication Arts (Private) Limited Associated undertaking N/A
Mr. M. Murad Saigol Key management personnel Chief executive Remuneration 0.0025%
Mr. M. Zeid Yousuf Saigol Key management personnel Director Remuneration 2.9637%
Mr. Syed Manzar Hassan Key management personnel Director Remuneration 0.0004%
Aggregate
%age of
shareholding
in the Company
The Board of Directors has approved a policy for Related Party Transactions, which require that the company shall carry out transactions with its related parties on an arm's length basis in the normal course of business. The term 'arm's length' requires conducting business on the same terms and conditions as the business between two unrelated / unconcerned persons. The policy specifies that all transactions entered into with related parties shall require Board's approval.
There were no transactions with related parties on non-arm’s length basis.
Related Parties
Management is responsible for the preparation and fair presentation of the nancial statements in accordance with the accounting and reporting standards as applicable in Pakistan and the requirements of Companies Act, 2017(XIX of 2017) and for such internal control as management determines is necessary to enable the preparation of nancial statements that are free from material misstatement, whether due to fraud or error.
In preparing the nancial statements, management is responsible for assessing the Company's ability to continue as a going concern, disclosing, as applicable, matters related to going concern and using the going concern basis of accounting unless management either intends to liquidate the Company or to cease operations, or has no realistic alternative but to do so.
The Board of directors is responsible for overseeing the Company's nancial reporting process.
Preparation and Fair Presentationof the Financial Statements

D 08 Pak Elektron Limited D 09Annual Report 2018
Audit Committee
Mr. Asad Ullah Khawaja
Mr. Usman Shahid
Sheikh Muhammad Shakeel
Syed Haroon Rashid
Composition
Chairman
Member
Member
Member
Designation
Salient Features & Terms of References
The Board of Directors of the Company have determined the following term of reference of the Audit Committee:
a) Determination of appropriate measures to safeguard the Company's assets.
b) Review of preliminary announcements of results prior to publication.
c) Review of quarterly, half yearly and annual financial statements of the Company, prior to their approval by the Board of Directors, focusing on:
• Major judgmental areas,
• Significant adjustments resulting from the audit,The going concern assumption,
• Any change in accounting policies and practices,
• Significant related party transactions
• Compliance with applicable accounting standards, and
• Compliance with listing regulations and other statutory and regulatory requirements.
d) Facilitating the external audit and discussion with external auditors of major observations arising from interim and final audits and any matter that the auditors may wish to highlight (in the absence of Management, where necessary).
e) Review of Management Letter issued by external auditors and Management's responsible thereto.
f) Ensuring coordination between the internal and external auditors of Company.
g) Review of the scope and extent of internal audit and ensuring that the internal audit function has adequate resources and is appropriately placed within the Company.
h) consideration of major findings of internal investigations of activities characterized by fraud, corruption and abuse of power and management's response thereto.
i) ascertaining that the internal control systems including financial and operational controls, accounting systems for timely and appropriate recording of purchases and
sales, receipts and payments, assets and liabilities and the reporting structure are adequate and effective.
j) Review of Company's statement on internal control system prior to endorsement by the Board of Directors and internal audit reports.
k) Instituting special projects, value for money studies or other investigations on any matter specified by the Board of Directors, in consultation with the CEO and to consider remittance of any matter to the external auditors or to any other external body.
l) Determination of compliance with relevant statuary requirements.
m) Monitoring compliance with the best practices of corporate governance and identification of significant violations thereof.
n) Review of arrangement for staff and management to report to audit committee financial and other matters and recommend instituting remedial and mitigating measures;
o) Recommend to the Board of Directors the appointment of external auditors, their removal, audit fees, the provision of any service permissible to be financial statements. The board of directors shall give due consideration to the recommendations of the audit committee and where it acts otherwise it shall record the reasons thereof.
p) Consideration of any other issue or matter as maybe assigned by the Board of Directors.
Directors
Mr. Asad Ullah Khawaja
Mr. Usman Shahid
Sheikh Muhammad Shakeel
Syed Haroon Rashid
TotalAttended
2
4
1
3
th25April
th16March
th16August
th30October
Composition
Chairman
Member
Member
Member
Designation
Human Resource andRemuneration Committee
Mr. Asad Ullah Khawaja
Mr. Usman Shahid
Syed Manzar Hassan
Syed Haroon Rashid
Directors TotalAttended
-
1
1
-
th16March
Mr. Asad Ullah Khawaja
Mr. Usman Shahid
Syed Manzar Hassan
Syed Haroon Rashid
Salient Features & Terms of Reference
The Board of Directors of the Company have determined the following term of reference of the Human Resource and Remuneration Committee:
a) Recommend to the board for Consideration and approval a policy framework for determining remuneration of directors (both executive and non-executive directors and members of senior management). The definition of senior management will be determined by the board which shall normally include the first layer of management below the chief executive officer level;
b) Undertaking annually a formal process of evaluation of performance of the board as a whole and its committees either directly or by engaging external independent consultant and if so appointed, a statement to that effect shall be made in the directors’
report disclosing name, qualifications and major terms of appointment;
c) Recommending human resource management policies to the board;
d) Recommending to the board the selection, evaluation, development, compensation (including retirement benefits) of chief operating office, chief financial officer, company secretary and head of internal audit;
e) Consideration and approval on recommendations of chief executive office on such matters for key management positions who report directly to chief executive office or chief operating officer; and
f) Ensure, in consultation with the CEO that succession plans are in place and review such plans at regular intervals for those executives, whose appointment requires Board approval (under Code of Corporate Governance), namely, the Chief
Financial Officer, the Company Secretary and the Head of Internal Audit, including their terms of appointment and remuneration package.
The Committee meets on as required basis or when directed by the Board sets the agenda, time, date and venue of the meeting in consultation with the Chairman of the Committee.
Senior Manager Human Resources acts as Secretary of the Committee and submits of the minutes of the meeting duly signed its Chairman to the Company Secretary. These minutes are then circulated to the Board of Directors.

D 10 Pak Elektron Limited D 11Annual Report 2018
Information Technology has grown to permeate the business world, affecting how companies make and market their products as well as how people communicate and accomplish their jobs. The need for IT governance has also become pivotal towards organization sustenance and growth.
At PEL, IT Governance provides a framework that is aimed at IT strategy about IT infrastructure, risks management, deployment of new techniques and ideas as well as delivery of IT services in an efcient and economical way. PEL remains focused on continuous exploration of best technologies and infrastructure, to enable efcient and timely decision making, in addition to economizing on the cost related to operating and decision making.
Review of Business Continuity and Disaster Recovery Planning by the Board
PEL has implemented an effective Disaster Recovery System, for sustained business operations in the event of a disruption or disaster.
Business Continuity Planning
Recognizing the critical importance of technological dominance, extreme competition and sustained/continued business operations, PEL has undertaken measures to enhance its capacity to survive against disruptions/ calamities.
Business Continuity Planning instills employee satisfaction, inculcates condence of customers as well as investors inbusiness and helps protect PEL’s image, brand and reputation.
Disaster Recovery Planning
As part of BCP, a Disaster Recovery site (DR) has been established to further strengthen the availability of IT/Oracle services in case of a disaster.
The site hosts backup servers for shifting of services during a disaster. A comprehensive set of policies and procedures, including responsibilities and actions to recover computer, communications and network environment in the event of an unexpected interruption, have been implemented to ensure a hassle free movement of data from primary site to DR site.
Safety and security of IT record
Safety and security of IT records is ensured through effective implementation of the Company’s policy for Safety of Records, which has been elaborated on page D-13.
Today’sinnovation istomorrow’stradition.- lidia Bastianich
Information Technology Governance

D 12 Pak Elektron Limited D 13Annual Report 2018
Policy Disclosures
DIVERSITY POLICY
PEL is committed to promoting and maintaining a culture of diversity. Our human capital is our most valuable resource, with the individuals coming from different age, color, disability, ethnicity, family or marital status, gender identity or expression, language, national origin, physical and mental ability, political afliation, race, religion, sexual orientation, socio-economic status, veteran status, and other characteristics that make each individual unique.
All major areas of human resource management are subject to our diversity policy, be it, recruitment and selection, compensation and benets, professional development and training, promotions, transfers, social and recreational programs, layoffs or terminations with strict disciplinary actions in case of non-compliance.
CORPORATE SOCIAL RESPONSIBILITY AND SUSTAINABILITY POLICY
PEL is committed to act responsibly towards the community and environment for our mutual benefit as PEL believes that the success of the Company emanates from the development of the community. Our Social and Environmental practices have been elaborated in the section relating to 'Corporate Social Responsibility', with the following distinct features:
• Community investment & welfare schemes
• Rural development programmes
• Corporate Social Responsibility
• Environmental protection measures
• Occupational health & safety
• Business ethics & anti-corruption measures
• Consumer protection measures
• Energy conservation
• Industrial relations
• Employment of special persons
• National cause donations
• Contribution to National Exchequer
CONFLICT OF INTEREST POLICY
In order to avoid known or perceived conflicts of interests, PEL has employed, in addition to compliance of regulatory requirements, a formal Code of Business Ethics, for formal disclosure of vested interests if any. While all the directors exercise their due rights of participation in Board proceedings, which are generally undertaken through consensus, concerns of the Board members on any agenda point are duly noted in the minutes of the proceedings for further evaluation of actual existence in addition to quantification of any conflict of interest before finalization of any agenda point.
INVESTORS' GRIEVANCE POLICY
The Company believes in allowing full access to all shareholders including potential investors, to call for information or detail on Company operations, in addition to details relating to his/her specific investment, dividend distribution or circulation of regulatory publications by the Company, with endeavours for prompt provision of information or resolution of query/grievance in accordance with the statutory guidelines. Investor grievances are managed centrally by the Corporate Affairs Department, through an effective grievance management mechanism for handling of investor queries and complaints, through the following key measures:
• Increasing the investor's awareness relating to modes for filing of queries handling of investor grievances in a timely manner
• Grievances are handled honestly and in good faith by PEL employees and without prejudice
• Any grievances requiring attention of the management or the Board of Directors, are escalated to the appropriate levels with full facts of the case, for judicious settlement of the grievance
• Investigations are also carried out to inquire whether the cause of the grievance was a weakness in the system or negligence/willful act on part of any employee
• Appropriate remedial action is taken immediately to ensure avoidance in the future
POLICY FOR SAFETY OF RECORDS
The Company has established a policy for preservation of records in line with good governance practice.
These records include books of account, documentation pertaining to secretarial, legal, contractual, taxation and other matters, which have been archived where needed, in a well preserved and secure manner.
The main objectives this policy are:
• To ensure that the Company's records are created, managed, retained and disposed off in an effective and efficient manner;
• To ensure preservation of the Company's records of permanent value to support both protection of privacy and freedom of information;
• To ensure that information is held as long as required to meet legal, administrative, operational and other requirements of the Company.
These objectives are achieved through implementation of access controls, on-site and off-site backups, determination of responsibilities for all Company departments for safeguarding of their respective records and implementing mechanism for reporting of breach of security or damage of record to the management.
WHISTLE BLOWING POLICY
PEL ensures accountability and integrity in conduct, by devising a transparent and effective whistle blowing mechanism for sounding of alerts against deviations from policies, controls, applicable regulations, or violation of the code of professional ethics / conduct. The Whistle Blowing Policy is applicable to all employees, management and the Board and extends to every individual associated with the Company including contractors, suppliers, business partners and shareholders etc., who can participate effectively and in confidentiality, without fear of reprisal or repercussions.
The employees are required to report concerns directly to immediate supervisors, except where, reporting to supervisors is impracticable, in which case, the level may be raised to the senior management.
The purpose of this policy is to encourage all stakeholders to raise questions and concerns, monitor the progress of resultant inquiries, provide feedback and where required, also voice concerns against any unsatisfactory inquiry or proceeding.
The Policy covers unethical conduct, offence, breach of law or failure to comply with legal obligations and possible fraud / corruption. Due emphasis has also been placed on health, safety and environmental risks. Inappropriate or malicious reporting leading to wrongful convictions have been specifically forbidden, with clear definition of consequences for the persons making wrongful accusations.
No material incidence was reported to the Audit Committee during the year regarding improprieties in financial, operating, legal or other matters. All minor events requiring management's attention were duly addressed with dissemination of messages across the Company for avoidance of such incidents in the future.
HUMAN RESOURCE MANAGEMENT POLICY & SUCCESSION PLANNING
PEL attracts the finest talent for induction in all functions of the Company and ensures provision of a conducive environment to stimulate performance, in addition to market commensurate remuneration to retain qualityworkforce, and developing and refining their abilities for prospective leadership roles.
The Company also ensures availability of competent personnel in each department through a comprehensive Succession Plan, carried out in terms of an individual's potential, qualification, period of service and professional attitude amongst other criteria. The succession policy is updated periodically in line with the Company's requirements and career development objectives.
D 14 Pak Elektron Limited D 15Annual Report 2018
Shariah Compliance
S.M. SUHAIL & CO.Chartered Accountants
M/s.Pak Elektron Limited
CERTIFICATE ON SHARIAH COMPLIANCE REVIEW OF PAK ELEKTRON LIMITED
global
leading allianceedgeinnovation quality excellence
It is hereby certied that M/s Pak Elektron Limited (PEL) is a Shariah Compliant Company as on December 31, 2018, including the business activities for the year then ended, as per the relevant information provided to us and to the best of our knowledge and belief.
Our Ref: SMS-A-1442019Date: April 04, 2019
PAK ELEKTRON
ELEKTRON LIMITEDPAK
LIMITED (PEL)
April 04, 2019Ref: SA-2019/027
SHARIAH COMPLIANCE CERTIFICATE OF PAK ELEKTRON LIMITED (PEL)

M. Naseem SaigolChairman
Lahore:April 04, 2019
13. The terms of reference of the aforesaid committees have been formed, documented and advised to the committee for compliance.
14. The frequency of meetings (quarterly/half yearly/ yearly) of the committee were as per following:
a) Audit Committee: Four (4)
b) Human Resource and Remuneration Committee: One (1)
15. The board has set up an effective internal audit function who is considered suitably qualified and experienced for the purpose and are conversant with the policies and procedures of the company.
16. The statutory auditors of the company have confirmed that they have been given a satisfactory rating under the quality control review program of the ICAP and registered with Audit Oversight Board of Pakistan, that they or any of the partners of the firm, their spouses and minor children do not hold shares of the company and that the firm and all its partners are in compliance with International Federation of Accountants (IFAC) guidelines on code of ethics as adopted by the ICAP.
17. The statutory auditors or the persons associated with them have not been appointed to provide other services except in accordance with the Act, these regulations or any other regulatory requirement and the auditors have confirmed that they have observed IFAC guidelines in this regard.
18. We confirm that all other requirements of the Regulations have been complied with.
Corporate Governance
D 16 Pak Elektron Limited
STATEMENT OF COMPLIANCE WITH LISTED COMPANIES (CODE OFCORPORATE GOVERNANCE) REGULATIONS, 2017
The company has complied with the requirements of the Regulations in the following manner:
1. The total number of directors are Ten as per the following:
a) Male: Nine (9) b) Female: One (1)
2. The composition of board is as follows:
3. The directors have confirmed that none of them is serving as a director on more than five listed companies, including this company.
4. The company has prepared a Code of Conduct and has ensured that appropriate steps have been taken to disseminate it throughout the company along with its supporting policies and procedures.
5. The board has developed a vision/mission statement, overall corporate strategy and significant policies of the company. A complete record of particulars of significant policies along with the dates on which they were approved or amended has been maintained.
6. All the powers of the board have been duly exercised and decisions on relevant matters have been taken by board/ shareholders as empowered by the relevant provisions of the Act and these Regulations.
7. The meetings of the board were presided over by the Chairman and, in his
absence, by a director elected by the board for this purpose. The board has complied with the requirements of Act and the Regulations with respect to frequency, recording and circulating minutes of meeting of board.
8. The board of directors have a formal policy and transparent procedures for remuneration of directors in accordance with the Act and these Regulations.
9. The Board has arranged Directors' Training program for the following Directors:
a) Mr. Muhammad Murad Saigol b) Mr. Muhammad Zeid Yousuf Saigol c) Syed Manzar Hassan d) Syed Haroon Rashid e) Sheikh Muhammad Shakeel
10. The board has approved appointment of CFO, Company Secretary and Head of Internal Audit, including their remuneration and terms and conditions of employment and complied with relevant requirements of the Regulations.
11. CFO and CEO duly endorsed the financial statements before approval of the board.
12. The board has formed committees comprising of members given below:
a) Audit Committee:
1. Mr. Asad Ullah Khawaja
2. Mr. Usman Shahid
3. Sheikh Muhammad Shakeel
4. Syed Haroon Rashid
b) Human Resource and Remuneration Committee:
1. Mr. Asad Ullah Khawaja
2. Mr. Usman Shahid
3. Syed Manzar Hassan
4. Syed Haroon Rashid
Category Names
Independent Director Mr. Asad Ullah Khawaja
Executive Directors Mr. M. Murad SaigolMr. M. Zeid Yousuf SaigolSyed Manzar Hassan
Non-Executive Directors Mr. M. Naseem SaigolSheikh Muhammad ShakeelSyed Haroon RashidMr. Usman ShahidSyed Jamal BaquarMs. Azra Shoaib
D 17Annual Report 2018
D 18 Pak Elektron Limited
AUDIT COMMITTEE’S REPORT ON COMPLIANCE WITH LISTED COMPANIES(CODE OF CORPORATE GOVERNANCE) REGULATIONS, 2017
The Committee comprises of members possessing considerable financial insight. The Audit committee has concluded its annual review of the conduct and operations of the Company during 2018, and report that:
• The Company has issued a "Statement of Compliance with the Listed Companies (Code of Corporate Governance) Regulations, 2017, which has also been reviewed by the External Auditors of the Company.
• Understanding and compliance with Company codes and policies has been affirmed by the members of the Board, the Management and employees of the Company individually. Equitable treatment of shareholders has also been ensured.
• Appropriate accounting policies have been consistently applied. All applicable Approved Accounting and Financial Reporting Standards were followed in preparation of financial statements of the Company on a going concern basis, for the financial year ended December 31, 2018, which present fairly the state of affairs, results of operations, profits, cash flows and changes in equity of the Company.
• The Chief Executive and the Chief Financial Officer have endorsed the financial statements of the Company. They acknowledge their responsibility for true and fair presentation of the Company's financial condition and results, compliance with regulations and applicable accounting standards and establishment and maintenance of internal controls and systems of the Company.
• Accounting estimates are based on reasonable and prudent judgment. Proper and adequate accounting records have been maintained by the Company in accordance with the Companies Act, 2017. The financial statements comply with the requirements of the Fourth Schedule to the Companies Act, 2017 and the external reporting is consistent with
management processes and adequate for shareholder needs.
• All Directors have access to the Company Secretary. All direct or indirect trading and holdings of Company's shares by Directors and executives or their spouses were notified in writing to the Company Secretary along with the all the necessary require information, including price, number of shares, form ofshare certificates and nature of transaction, which were notified by the Secretary to the Board within the stipulated time. All such holdings have been disclosed in the pattern of shareholding. The Annual Secretarial Compliance Certificates are being filed regularly within stipulated time.
• Closed periods were duly determined and announced by the Company, precluding the Directors, the Chief Executive and executives of the Company from dealing in Company's shares, prior to each Board meeting involving announcement of interim / final results, distribution to shareholders or any other business decision, which could materially affect the share market price of Company, along with maintenance of confidentiality of all business information.
Internal Audit
• The internal control framework has been effectively implemented through an Internal Audit function established by the Board which is independent of the External Auditors of the Company.
• The Company's system of internal control is sound in design and has been continually evaluated for effectiveness and adequacy.
• The Audit Committee has ensured the achievement of operational, compliance, risk management and financial reporting objectives and safeguarding of the assets of the Company and the shareholders wealth at all levels within the Company.
D 19Annual Report 2018
• The Internal Audit function has carried out its duties under the charter defined by the Committee. The Committee has reviewed material Internal Audit findings, taking appropriate action or bringing the matters to the Board's attention where required.
• The Head of Internal Audit has direct access to the Chairman of the Audit Committee and the Committee has ensured staffing of personnel with sufficient internal audit insight and that the function has all necessary access to Management and the right to seek information and explanations.
• Coordination between the External and Internal Auditors was facilitated to ensure efficiency and contribution to the Company's objectives, including a reliable financial reporting system and compliance with laws and regulations.
External Auditors
• The statutory Auditors of the Company, Rahman Sarfaraz Rahim Iqbal Rafiq, Chartered Accountants, have completed their Audit of the Company's financial statements and the their Review of the Company's Compliance with the Code of Corporate Governance for the financial year ended December 31, 2018 and shall retire on the conclusion of the 63rd Annual General Meeting.
• The Audit Committee has reviewed and discussed Audit observations and Draft Audit Management Letter with the External Auditors. Final Management Letter is required to be submitted within 45 days of the date of the Auditors' Report on financial statements under the listing regulations and shall accordingly be discussed in the next Audit Committee Meeting. Audit observations for interim review were also discussed with the Auditors.
• The Auditors have been allowed direct access to the Committee and the effectiveness, independence and
objectivity of the Auditors has thereby been ensured. The Auditors attended the General Meetings of the Company during the year and have confirmed attendance of the 63rd Annual General Meeting scheduled for April 26, 2019 and have indicated their willingness to continue as Auditors.
• Being eligible for reappointment as Auditors of the Company, the Audit Committee has recommended the appointment of Rahman Sarfaraz Rahim Iqbal Rafiq, Chartered Accountants as External Auditors of the Company for the year ending December 31, 2019.
• The Firm has no financial or other relationship of any kind with the Company except that of External Auditors.
Chairman - Audit Committee
Lahore:April 04, 2019
Asad Ullah Khawaja
Corporate Governance

D 20 Pak Elektron Limited
We have reviewed the enclosed Statement of Compliance with the Listed Companies (Code of Corporate Governance) Regulations, 2017 ['the Regulations'] prepared by the Board of Directors of PAK ELEKTRON LIMITED for the year ended December 31, 2018 in accordance with the requirements of regulation 40 of the Regulation.
The responsibility for compliance with the Regulations is that of the Board of Directors of the Company. Our responsibility is to review whether the Statement of Compliance reflects the status of the Company's compliance with the provisions of the Regulations and report if it does not and to highlight any non-compliance with the requirements of the Regulations. A review is limited primarily to inquiries of the Company's personnel and review of various documents prepared by the Company to comply with the Regulations.
As a part of our audit of the financial statements we are required to obtain an understanding of the accounting and internal control systems sufficient to plan the audit and develop an effective audit approach. We are not required to consider whether the Board of Directors' statement on internal control covers all risks and controls or to form an opinion on the effectiveness of such internal controls, the Company's corporate governance procedures and risks.
The Regulations require the Company to place before the Audit Committee, and upon recommendation of the Audit Committee, place before the Board of Directors for their review and approval, its related party transactions and also ensure compliance with the requirements of section 208 of the Companies Act, 2017. We are only required and have ensured compliance of this requirement to the extent of the approval of the related party transactions by the Board of Directors upon recommendation of the Audit Committee. We have not carried out procedures to assess and determine the Company's process for identification of related parties and that whether the related party transactions were undertaken at arm's length price or not.
Based on our review, nothing has come to our attention which causes us to believe that the Statement of Compliance does not appropriately reflect the Company's compliance, in all material respects, with the requirements contained in the Regulations as applicable to the Company for the year ended December 31, 2018.
RAHMAN SARFARAZ RAHIM IQBAL RAFIQChartered Accountants
Lahore: April 04, 2019
To the members of PAK ELEKTRON LIMITED
Review Report on the Statement of Compliance contained in Listed Companies(Code of Corporate Governance) Regulations, 2017
Corporate Governance
Rahman Sarfaraz Rahim Iqbal RafiqChartered Accountants
72-A, Faisal Town,Lahore - 54770, Pakistan.
T:F:E:W:
+92 42 35160430 - 32+92 42 [email protected]
Member of Russell Bedford International - a global network of independent professional services firms

Performance andPositionE

Chairman’s Review
M. Naseem Saigol
LahoreApril 04, 2019
Chairman
I am pleased to inform that in this challenging economic era your company maintained its share holders trust and market share due to its quality products and business practices.
At the close of 2018, Company achieved a revenue level of Rs.38.990 Billion against Rs. 42.346 Billion of previous year. Despite of overall economic stress, Appliances Division business almost maintained its revenue level at Rs. 27.275 Billion against Rs. 27.754 Billion of preceding year. In such a challenging environment, this all is due to our team resilience, strong customer focus and reception of PEL's brand image in the industry.
Power Division business remained slower, with a revenue of Rs. 11.714 Billion against 14.591 Billion of previous year. Slow ordering from WAPDA and Discos are the underlying reasons causing this decline.
After nalization of IMF program, Revival of energy & housing sectors and CPEC Special Economic Zones SEZs the demand of Power Division products is expected to ourish. In future economic outlook CPEC Projects of around 15,852 MW are in pipe line and privatization of DISCOs is underway, the Company foresees a promising way forward for this segment. Our focus will remain on continuous research and development which will enable us to not only cater for the local demands but also explore new markets outside Pakistan.
Under the prevailing competitive circumstances we remained committed to our strategy of steady growth in quality avenues with signicant emphasis on product development. The cornerstone of our business philosophy revolves around customer satisfaction, capacity building and human resource.
Our organization has passed through a dynamic phase where skills, technologies and scales are developed. With the increased capacity and improved competitiveness our PEL brand is well positioned as standout market leader.
E 02 Pak Elektron Limited E 03Annual Report 2018
The cornerstone of our business philosophy revolves around customer satisfaction, capacity building and human resource. Our organization has passed through a dynamic phase where skills, technologies and scales are developed. With the increased capacity and improved competitiveness our PEL brand is well positioned as standout market leader.

CEO’s Remarks
M. Murad SaigolChief Executive Ofcer
LahoreApril 04, 2019
This year has been highly challenging to meet inuences of tough economic macros prevailed in the country during the period under review. Company business fundamentals are intact and it will again attain its growth momentum as economic conditions revive. The company is on way to launch latest market competitive product models both in home appliances and power division through ongoing R&D. The company aims to achieve sustainable growth by undertaking strategic and forward looking investments that build on our robust earnings based and meet the rising demand of PEL products.
In 2018 revenue achieved is Rs. 38,990 million which is lower by 7.92% as compared to the corresponding period (2017: Rs. 42,347 million). Decline in sales is due to prevailing country economic outlook and reverse with the improvement in key economic indicators.
Appliance Division maintained its business volumes of Rs. 27 Billion despite overall decline in per capita disposable income. The company continued launching of “New Series” of all products to achieve market competitiveness. To cater the consistent product range widening LED TV launched in last quarter of the year which is well received in the market. Production Facility of Washing Machine is under installation and its commercial production is expected to commence in 2nd half of the year 2019. Refrigerator new series “Llife”, Arctic Fresh” and InverterON are well received in the market. “Full DC Inverter series” of Air Conditioners, “Inverter series” in Deep Freezers and curve glass with multiple designs introduced in Water Dispensers. The Company kept on improving
product features, introduce aesthetics and increase product range that led to strengthening the customer's condence.
The sales in Power Division remained lower by 20% due to low ordering from Government sector. We foresee a potential recovery and further growth momentum due to Electricity T&D infrastructure augmentation needs after managing electricity generation shortfall.
Gross prot achieved in 2018 amounts to Rs. 6,997 million as compared to Rs. 9,116 million in 2017, resulting a decline of @ 23 % as compared to previous year mainly due to increase in input cost mainly affected by Pak Rupee depreciation of 25.8% during the year under review. Prot after tax was recorded at Rs. 1,372 million as compared to Rs. 3,308 for the previous year.
Earning per share is Rs. 2.67 as compared to that of Rs. 6.56 of previous year.
To support the future growth in revenue, production and prots, Company has invested in building, plant and machinery, which will not only increase the production capacities, but will also improve efciencies. This will support us to meet the production and warehousing requirements during peak seasons and in timely deliveries against future high order intakes.
The aggressive marketing by the global brands, persistent pricing pressure and strong competition continue to pose challenges for Company protability and performance. However, we remain committed to drive the business forward and explore the new avenues despite these numerous challenges. Resilient Company performance during 2018, besides our planned diversication & productivity initiatives, improved brand equity
and dedication provide condence of sustained protability for the shareholders of the Company.
E 04 Pak Elektron Limited E 05Annual Report 2018

E 06 Pak Elektron Limited E 07Annual Report 2018
MACRO - ECONOMIC OVERVIEW
Global Economic Overview
Globally, Economic growth remained subdued during 2018.The growth rates are estimated at 3.7% for 2019 and 2020 growth estimates have now been revised downward at 3.5% and 3.6% respectively which is 0.2 and 0.1 percentage point below the initial estimates. These developments occurred against a backdrop of weakening nancial market sentiments and a lack luster performance observed by major economies. Concerns about inationary effects like oil price volatility and currency depreciation have forced central banks in emerging market economies to raise policy rates.
Domestic Economic Overview
Economic progress in 2018 has been undermined by challenges revolved around maintaining a stable foreign exchange reserves position, containing the scal decit and the steady increase in the level of ination. This has resulted in an expected slowdown in the rate of GDP growth for FY'19 to 4.0% from the earlier targeted level of 6.2% (FY'18: 5.8%). The low interest rate regime during the previous years, along with high aggregate demand had resulted in huge credit expansion. However, measures taken in the last one year in the form of monetary policy tightening and sharp devaluation are now impacting the rate of growth.
The current account decit, although still at high levels, has reduced from USD 8.4 billion in H1 FY'18 to USD 8.0 billion in H1 FY'19. The trade decit reduced from USD 17.7 billion in H1 FY'18 to USD 16.8 billion in H1 FY'19.
This is in line with a 2% YoY increase in the level of exports to USD 11.2 billion in H1 FY'19 vs. last year and a 2.3% YoY reduction in the level of imports to USD 28.0 billion during H1 FY'19. Home remittances remained strong with growth of 10% (H1 FY'19 vs. H1 FY'18) and stood at USD 10.8 billion during H1 FY'19.
The huge current account decit continued to strain FX reserves that reduced from USD 20.2 billion in Dec'17 to USD 13.8 billion at Dec'18, a decline of 31.8%. While the country's decision of formally entering into another IMF Program remained under review, external support during the last quarter of 2018 eased the burden on the balance of payments position. However, pressure remained on the exchange rate resulting in 25.8% devaluation in the rupee over the year with the closing level in Dec'18 at PKR 138.86 / USD.
Inationary pressures have started to build up as average H1 FY'19 CPI stood at 6.0% year on year versus 3.8% in H1 FY'18. Rising ination, combined with the deteriorating external and scal imbalances, resulted in an increase in the benchmark policy rate by a cumulative 450 basis points in the last one year, taking the policy rate to 10.25% in January 2019.
A more bearish sentiment prevailed in the stock market throughout the year as the PSX-100 Index closed at 37,067 points in Dec'18, a decline of 8.4% over the Dec'17 level. 2018 proved to be a difcult year for the stock market in view of sharp devaluation, while investors awaited more clarity on the macro economic outlook under the new government. Sell-off by global funds also led to the lower
than expected performance of the Pakistani market as foreign investment recorded a net outow of USD 537.1 million in CY'18 (CY'17: USD 487.1 million).
Industry Overview
After peaceful General Elections and a smooth transition process is completed. The new Government with its manifesto is taking off. A nancial Planning with complete understanding of economic issues is intact. In next following months government is moving towards IMF package and after its conclusion stability with reference current economic issues will be seen. Pak Rupees Deprecation increased home appliance cost, beyond the consumer absorption limits resulted in manufacturer's margin cut. On the other hand growing inationary trends curtailed disposable incomes and ultimately lower buying.
Electricity shortage is almost cooped after power generation projects and augmentation of T&D infrastructure is major task to transmit the additionally generated electricity to end consumers. A temporary slowdown is seen on this and due to the reason ordering of electrical equipment by WAPDA distribution companies is slow. After conclusion of IMF package hopefully the things will move on its natural pace.
The Board of Directors’ is pleased to present to you the annual report of the Company along with the audited nancial statements for the year ended December 31, 2018
Directors’ Report
E 07Annual Report 2018
The company aims to achieve sustainable growth by undertaking strategic and forward looking investments that build on our robust earnings based and meet the rising demand of PEL products.
M. Murad SaigolChief Executive Ofcer
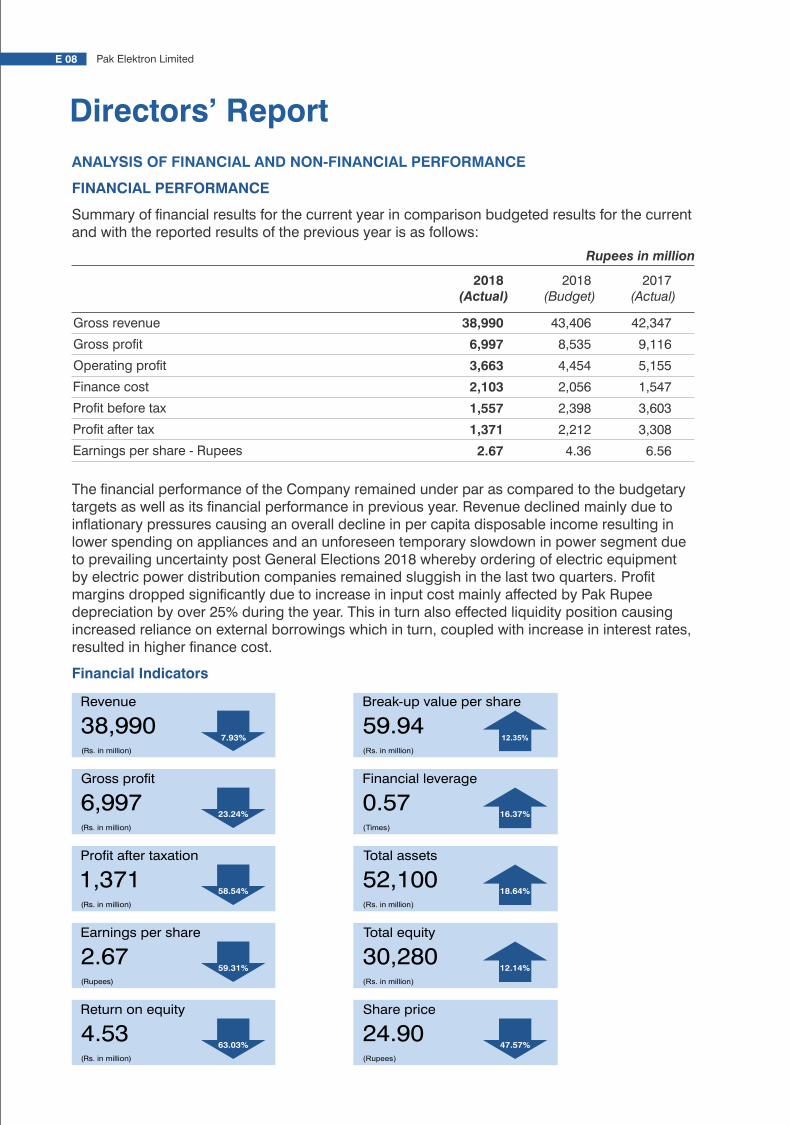
Directors’ Report
NON-FINANCIAL PERFORMANCE
As regards non-nancial targets, the Company continues to remain on track having maintained its market share, added new products, improved existing product features and aesthetics, continued focus on human resource development and maintained healthy relationship with all key stakeholders.
Non-Financial Indicators
MANUFACTUREDCAPITAL
Capital forms
Product innovation and development
Objective KPI's monitored Future relevance
Improved product features and aesthetics for existing products.
New series for refrigerator, air conditioner and water dispenser with new features and improved aesthetics were launched during the year.
Yes.
The Company continues to recognize the importance of consumer-driven product development.
Diversication Product range.
LED TV and washing machines launched during the year and well-received in the market
Yes.
There are still numerous unexplored product lines that are offered by our current competitors
Maintain industry leadership and market presence
Market share and sales/service center and dealer network.
The Company has been able to maintain its market shares despite tough competition and has nation-wide sales, service center and dealer network.
Yes.
Planned and integrated marketing campaigns and increasing access to customers through a nationwide sales/service center and dealer network is vital for the Company to maintain industry leadership and market presence.
Enhance production facilities and processes to improve efciency
Technology upgradation activities.
The Company has kept itself up-to-date with the latest technology advancements to achieve production efciencies
Yes.
The Company believes that in order to achieve efciencies and economies of scale, it has to remain a technology forerunner.
E 08 Pak Elektron Limited E 09Annual Report 2018
ANALYSIS OF FINANCIAL AND NON-FINANCIAL PERFORMANCE
FINANCIAL PERFORMANCE
Summary of nancial results for the current year in comparison budgeted results for the current and with the reported results of the previous year is as follows:
The nancial performance of the Company remained under par as compared to the budgetary targets as well as its nancial performance in previous year. Revenue declined mainly due to inationary pressures causing an overall decline in per capita disposable income resulting in lower spending on appliances and an unforeseen temporary slowdown in power segment due to prevailing uncertainty post General Elections 2018 whereby ordering of electric equipment by electric power distribution companies remained sluggish in the last two quarters. Prot margins dropped signicantly due to increase in input cost mainly affected by Pak Rupee depreciation by over 25% during the year. This in turn also effected liquidity position causing increased reliance on external borrowings which in turn, coupled with increase in interest rates, resulted in higher nance cost.
Financial Indicators
Revenue
38,990(Rs. in million)
Prot after taxation
1,371(Rs. in million)
Earnings per share
2.67(Rupees)
Return on equity
4.53(Rs. in million)
Gross prot
6,997(Rs. in million)
Break-up value per share
59.94(Rs. in million)
12.35%7.93%
23.24%
58.54%
59.31%
63.03%
Financial leverage
0.57(Times)
16.37%
Total assets
52,100(Rs. in million)
18.64%
Total equity
30,280(Rs. in million)
12.14%
Share price
24.90(Rupees)
47.57%
2018(Actual)
38,990
6,997
3,663
2,103
1,557
1,371
2.67
2018(Budget)
43,406
8,535
4,454
2,056
2,398
2,212
4.36
2017(Actual)
42,347
9,116
5,155
1,547
3,603
3,308
6.56
Rupees in million
Gross revenue
Gross prot
Operating prot
Finance cost
Prot before tax
Prot after tax
Earnings per share - Rupees

Directors’ Report
Capital forms
Increasing shareholder's wealth
Objective KPI's monitored Future relevance
Market share price
The Company's market share price decline during the year as it is directly impacted by the Company's performance
Yes.
The Company's shareholders shall continue to be of the prime focus.
Maintaining supplier relationships
Payable days
The Company has substantially maintained 'Payable Days' which is evident of the Company's policy for timely payment to its suppliers
Yes.
The Company values its relationships with suppliers and shall continue to make timely payments
Maintaining customer relationships
Sale/service center and dealer network, after sales services and customer feedback.
The Company has a nationwide sales/center and dealer network to maintain access to customers and provide efcient after sales services, and monitors customer feedback for improvement
Yes.
The Company believes that customer relations is a fundamental function and is vital for the Company's growth
Be a socially responsible corporate entity
CSR initiatives and activities.
The Company undertook several CSR initiatives and activities during the year and continued to give back to the community through a broad range of community initiatives, charity giving, foundation grants and volunteerism.
Yes.
At PEL, we pride ourselves in aligning our business strategy to meet societal needs.
SOCIAL ANDRELATIONSHIP
CAPITAL
E 10 Pak Elektron Limited E 11Annual Report 2018
Rs.
FINANCIALCAPITAL
HUMANCAPITAL
Capital forms
Personnel development
Objective KPI's monitored Future relevance
Training and education programs for employees.
Technical and non-technical training programs were arranged during the year for employees at various levels both internally and externally
Yes.
Human Capital shall continue to remain one of the most important areas of focus for the Company.
Occupational health and safety
Health and safety policies in place, training activities conducted and number of health and safety incidents.
The Company provides a safe and congenial environment to its employees. Strict and stringent safety policies have been put in place to avoid risk of accident. Health and safety trainings are were carried out regularly during the year. No major health and safety incidents occurred during the year.
Yes.
Employee safety shall continue to remain and integral part of the Company's agenda.
Have sufcient liquidity to meet liabilities when due, under both normal and stressed conditions, without incurring unacceptable losses or risking damage to the Company's reputation
Timely payments
The Company has maintained sufcient liquidity and has met its liabilities as and when due.
Yes.
Having sufcient liquidity is critical for the Company's survival.
PRODUCT WISE OPERATING PERFORMANCE
Refrigerator
Being Company's Prime Product, refrigerator contributed 64% of the appliance division's revenue and 45% of in total Company's revenue in the year 2018. Refrigerator registered a YOY sales decrease @ 7% due to slow country market. Product cost hike faced during the year due to massive Pak Rupee depreciation and same could not be passed on completely to customers as their buying power had also shrunk due to increasing ination.
Our energy efcient refrigerator “InvertON series” with lowest start-up with 100 Volts &“Arctic Fresh" series with Turbo Cooling and Freshness LEDs are designed for better food preservation. These series are based on a masterpiece of “Japanese Inverter Technology” with electricity saving up to 40%. These refrigerators with improved aesthetics have been well received in the local market. Further R&D is on the way to introduce new wide body models with increased capacity in all existing series. The multi door and side-by-side refrigerators are also introduced in the market which fetched a very promising response from the customers. Parallel to product development initiatives, continuous marketing campaigns and tireless sales activities lead to maintain the market share.
With the expected economic revival after IMF Package again improvement in disposable income of middle class will be seen and resultantly demand of refrigerator will get back on its growth trajectory and your company is well positioned to
take the opportunity. Wide product penetration gap is yet to be bridged, especially in rural areas. In the improved electricity load shedding scenario, PEL's “Inverter / Invert on Series Refrigerators” being “Energy Efcient” will have an additional demand. A number of initiatives have been premeditated with respect to product innovation which will be complemented with appropriate marketing campaigns.
Deep Freezer
Deep Freezer revenue registered a YoY growth @ 18% as Company aggressively entered into this market and captured additional volumes over & above Institutional Sales. Company Uses “O Zone Friendly Refrigerants" as per UN Montreal Protocol, so is the preferred choice for MNCs in the corporate sector. PEL's innovative customized product satises the demand of Ice cream and beverage companies and has gained strong brand equity. PEL Deep Freezers has become the preferred choice of corporate Institutions like Unilever, Engro Foods, Pepsi and Pakistan Dairies (Igloo) who are the major customers of PEL's deep freezers right now.
During the year new advances series of “Arctic Pro Freeze Extend” and “Slider Series” are introduced with improved technological developments with primary focus on energy efciency. The Company has also changed its slogan “Sub Sy Thanda” to “Extreme Freezing -33“.
our company is capitalizing on stronger relations and technical expertise and our After Sale Department has signed service agreements with Coca Cola Beverages Pakistan Limited
(CCBPL) and PEPSI (Riaz Bottlers) for repair services of Deep Freezers, Visi Coolers and Chest Coolers in different parts of Pakistan.
PEL Deep Freezers with its improved aesthetics is well received in retail market is well received; this is evident from Sales Volume growth by 18% in the current year. Company is also introducing a glass door series in year 2019 on market demand. A Continuous R&D Process is on way to make the product energy efcient, durable and with improved esthetics.
Air conditioner (AC)
During the year Split ACs Business showed a declining trend @ 10%. The Split AC market is still highly potential for growth. The models introduced during the year are “AERO”, “ALLURE”, “ACE”, “APEX” and “FIT”. All the product development is fueled by the concept of energy efcient and 4 star rating inverter technology to meet the customer satisfaction and market competition.
Growing Emerging Middle-Class and Rapid Urbanization are potential market growth drivers. Uninterrupted and lower cost electricity supply will further increase the market demand, due to low electricity consumption by Inverter technology based equipments. Company's country wide efcient after sales services net work is also play a vital role to win "Consumer Condence”.
Microwave Oven
During the period under review Company registered slight decline of 3% in revenue from last year. Company launched new innovative MWO Series “Classic Plus” and “Silver Line”
INTELLECTUALCAPITAL
Capital forms
Product innovation
Objective KPI's monitored Future relevance
Improved product features and aesthetics for existing products.
New series for refrigerator, air conditioner and water dispenser with new features and improved aesthetics were launched during the year.
Yes.
The Company recognizes the importance of meeting the innovation intensive needs of its customers.
METHODS AND ASSUMPTIONS USED IN COMPILING KEY PERFORMANCE INDICATORS
The Company sets budgetary targets for various nancial and non-nancial indicators on an annual basis which are approved by the Board of Directors. Key Performance Indicators are identied based on how effectively these reect the Company's performance and position. Various factors, including but not limited to, general market conditions, the Company's market positioning, competitors are taken into account while compiling these indicators. Actual performance is analyzed against budgetary targets by monitoring key performance indicators on a regular basis.
The Company's nancial performance and position are the most basic nancial indicators. The Company analyses revenue, gross prot, prot after taxation, earnings per share and return on equity to assess its performance. Total equity, total assets and break-up value per share are analyzed to gauge the Company's nancial position. Market share price is also a very important nancial indicator as the Company's market perception is measured directly with reference to its market share price.
Non-nancial indicators are set for business objectives associated with various forms of capital including those pertaining business growth and expansion, product development, human resource development and relationships with key stakeholders etc.
CHANGES IN INDICATORS AND PERFORMANCE MEASURES
There were no changes in indicators and performance measures from the previous years.
Directors’ Report
E 12 Pak Elektron Limited E 13Annual Report 2018

of Power Transformer dropped by 58% as compared to last year, largely due to slow ordering by WAPDA Distribution Companies. After eliminating generation short fall, there must be a focus shift on rehabilitation of T&D Infrastructure and demand of Power Transformers is again expected to increase and PEL being key player will gain its due business share from WAPDA Distribution Companies. With the revival of local industry it is expected additional demand of Power Transformer will arise. Housing Sector Growth backed by rapid urbanization and Population pressure will increase demand of Power Transformers. We are condent that we will gain our due share of distribution transformer supply share in present government Five million houses of “Naya Pakistan Housing Authority Project”
During the Year Company obtained “STL Short Circuit Certication from VEIKI-VNL Lab, Hungary” after successful testing of Power Transformer, becoming the rst local manufacturer to have achieved this milestone.
Our focus will remain on continuous research and development which will enable us to not only cater for the local demands but also explore new markets outside Pakistan.
Switch Gears (SG)
Company is among the Pioneers of Switch Gear Industry in Pakistan and is engaged in switchgear business since its inception in 1958. PEL is one of the leading manufacturers of Pakistan. Switch Gear Business reected decline trend @ 8% during the year under review due to timing of ordering by WAPDA distribution companies. However positive signs are
there in the following year due to demand increase as a result of Distribution system up gradation and expected Industrialization.
During the year company achieved a milestone for qualifying with DHA Karachi for supply of compact substations after successful testing from “Xiai High Voltage Laboratory China”.
We have an optimistic Business outlook, aligned the visible signs of economic stimulation of national industry in textile and energy sectors. The overall private business of housing schemes and upcoming projects of industrial estates seem very promising next following years.
Energy Meters
Energy Meter Business during the review registered 37% YOY decline due slow ordering by WAPDA Distribution companies.
Construction of Five Million Houses by “Naya Pakistan Housing Authority” an opportunity window for Energy Meter Business and Your Company is well positioned to take its due market share, as has already developed Single Phase, Three Phase GSM Energy Meters and DLMS Compliant Single Phase Energy Meter and got it approved from NTDC.
During the year your company pre- qualied with “Karachi Electric KE” for supply of electricity meters.
Development and approval of Three Phase GSM / GPRS based on MPECO Specication Customized Meter and development of Firmware, Programming and Calibration Software for smooth Production ow is already obtained.
EPC Contracting
PEL- EPC Department takes up turnkey contracts involving Engineering, Procurement and Construction (EPC) for building power infrastructure projects comprising electrical networks/electrication and grid stations up to 220 KV level.
EPC Business reected a slow trend @ 17 % mainly due to execution timings and registered revenue of Rupees 3.135 Billion in comparison to 3.784 Billion of last year. Company capitalizing its performance history of Installation of Grid Stations for NTDC, WAPDA Distribution Companies and Private Customers. We received Contract of 132 KV GIS Grid Station at DHA Karachi and external electrication project with Faisalabad Development Authority. EPC Business also achieved a contract of Design, Supply and supervision of Installation & Commissioning of 33 KV grid station at Juba South Sudan. This will further open an avenue of off-shore business and our EPC team of seasoned professionals with an excellent performance history is determined to grasp this opportunity.
EPC Business has a great potential due to CPEC developments in the country and also because of expected local construction Industry boom. Your Company is well prepared to grasp arising future opportunities in this sector.
during the year. These series with improved product features and offer a unique cooking experience. These include solo as well as grill models inspired by users' need for both the options. The PEL microwave ovens are equipped with manual as well as digital interface depending on customers' needs. These products are well-designed and recommended for space-saving, they also offer customized cooking experience.
Water Dispenser
On consistent Market Demand to widen the Product Range Company entered into Water Dispenser trading and after seeing business potential decided to set up a Production Facility and started Commercial Production in year 2017. During the Year 2018 Sales volumes increase @112% indicates its warm market reception. The continuous research and development activities are on the way to improve product quality & esthetics.
LED Television
Keeping in view the rapidly growing market of LED television and as a key unit of home appliances product portfolio, PEL decided to enter into the manufacturing of LED televisions. The Company has set up its production line during the year and made a colorful entry in the market with a brand “COLOR ON”. We made a massive launch with advertisement campaigns all across the country to stamp the product awareness.
The major focus in development of LED TV was to introduce the features that make PEL's TV more attractive & cost competitive in comparison to its
commercial production and now the target is to transmit the generated electricity to end consumers. Augmentation of T&D infrastructure is much needed at the moment. As the current slowdown ends, a robust demand of Distribution Transformers is expected and Your Company is well equipped to take this opportunity. After expected revival of local industry demand of transformers will increase in Private sector as well. We are condent that we will gain our due share of distribution transformer supply share in present government Five million houses of “Naya Pakistan Housing Authority Project”.
Your Company is also gaining ground in the export market in Middle East, Africa, and Central Asia, Swaziland with special focus on Afghanistan.
PEL transformer manufacturing facility continues to be the agship of the Company by maintaining its image of being the best state-of the - art manufacturing set up in the region. With the highest quality human resource, manufacturing and design infrastructure, your Company is committed to not only maintain, but enhance its brand image in local as well as global markets.
Power transformer (PTR)
Company started Power Transformer Business in year 2004, in technical Collaboration with GANZ Hungry. Power Transformer is a high value asset in any electrical network. There are limited Power Transformer suppliers in Pakistan. Company has the plan to set up a state of art Power Transformer Manufacturing Facility at 34 KM Ferozepur Road Lahore.
During the Year, Sales Revenue
competitors in market. For this purpose state of the art technology regarding Video Processing and Latest Sound Standards are adopted to meet with the customer requirements. Along with this now a days due to versatility of ANDROID OS in mobiles, television manufacturers also focused to embed this feature in the LED TVs. We have incorporated the ANDROID OS in LED TVs to convert the television from NORMAL to SMART and offer the user to enjoy the SMART television experience.
Washing Machine
The persistent urge of enhancing our product portfolio and diversication has led us to set of Washing Machine manufacturing facility. There is sizable market of Washing Machine which exists in the country and being essential in home appliances. Company foresees a reasonable market share in near future. The manufacturing facility is in the process of setting up washing machine manufacturing facility and production is expected in 2nd half of year 2019.
Distribution transformer (DTR)
PEL, is amongst the Pioneers in Distribution Transformer Manufacturing in Pakistan, has set up a state of art Distribution Transformer manufacturing and testing facility in year 2009 to attain Global Quality Standards. Distribution Transformer is also one of the Company's Premier Product. In the year under review Product revenues remained lower by 16% due to lowering of pricing and slow ordering from WAPDA Distribution Companies.
Most of Power Generation Projects under CPEC arrangements has started
Directors’ Report
E 14 Pak Elektron Limited E 15Annual Report 2018

E 16 Pak Elektron Limited E 17Annual Report 2018
Unit
Protability Ratios
Gross Prot ratio %
Net Prot to Sales %
EBIT margin Rupees in millions
EBITDA margin Rupees in millions
% change in sales %
% change EBIT margin %
EBITDA Margin to Sales %
Operating Leverage Times
Return on Equity
- without revaluation resevres %
- with revaluation resevres %
Return on Capital Employed %
Liquidity Ratios
Current ratio Times
Quick / Acid Test ratio Times
Cash to Current Liabilities Times
Cash Flow from Operations to Sales Times
Activity/Turnover Ratios
Inventory turnover ratio Times
No. of Days in Inventory Days
Debtor turnover ratio Times
No. of Days in Receivables Days
Creditor turnover ratio Times
No. of Days in Payables Days
Total Assets turnover ratio Times
Fixed Assets turnover ratio Times
Operating Cycle Days
Investment/Market Ratios
Earning per Share - Basic Rupees
Earning per Share - Diluted Rupees
Price Earnings ratio Times
Dividend Yield ratio %
Dividend Payout ratio %
Dividend Cover ratio Times
Cash Dividend per Share Rupees
Stock Dividend per Share %
Market Value per Share
- year end Rupees
- high during the year Rupees
- low during the year Rupees
Break-up Value per Share
- without revaluation resevres Rupees
- with revaluation resevres Rupees
Market capitalization Rupees in millions
Capital Structure Ratios
Financial Leverage ratio Times
Weighted Average Cost of Debt %
Debt to Equity ratio %
Interest Cover ratio Times
2018 2017 2016 2015 2014 2013
24.60 29.41 30.87 29.59 30.75 24.62
4.82 10.67 13.68 11.46 10.92 3.69
3,765 5,173 5,691 5,295 4,438 2,594
4,616 6,055 6,541 6,041 5,195 3,315
(7.93) 24.10 16.37 21.54 27.94 (7.08)
(27.23) (9.10) 7.47 19.32 71.07 17.34
16.23 19.53 24.38 24.05 25.32 20.13
3.44
(0.38)
0.46
0.90
2.54
(2.45)
5.79
14.56
17.61
18.96
20.33
9.28
4.53
12.25
14.39
14.40
14.37
5.44
3.12
7.68
9.28
8.13
7.45
2.38
1.77
2.40
2.84
2.52
2.44
1.52
1.04
1.55
1.73
1.61
1.49
0.99
0.03
0.05
0.07
0.07
0.05
0.04
(0.00)
0.06
0.08
0.08
(0.17)
0.00
2.27
2.74
2.64
2.83
2.79
3.24
161
133
138
129
131
113
3.73
4.42
4.23
3.96
3.83
3.39
98
83
86
92
95
108
26.07 27.39 24.72 23.59 17.63 10.54
14 13 15 15 21 35
0.55
0.71
0.67
0.69
0.63
0.61
1.75
2.39
2.04
1.85
1.63
1.24
245
203
210
206
206
186
2.67
6.56
7.51
6.61
6.13
3.75
2.67
6.56
7.51
6.61
6.13
3.75
9.33
7.24
9.49
9.46
6.68
5.33
-
5.69
4.21
2.00
-
-
-
41.15
39.95
18.91
-
-
-
2.43
2.50
5.29
-
-
-
2.70
3.00
1.25
-
-
-
-
-
-
-
10.00
24.90
47.49
71.28
62.54
40.93
19.99
61.85
123.73
74.64
94.97
40.93
27.97
21.96
43.10
53.57
42.33
18.87
8.14
46.72 44.76 40.97 33.07 26.57 22.74
59.94 53.35 50.36 45.14 38.04 39.94
12,392 23,635 35,475 24,900 16,296 5,360
0.57 0.49 0.45 0.69 0.84 1.00
10.69 9.31 9.13 11.15 14.81 14.52
13:87 18:82 20:80 29:71 36:64 36:64
2.30 4.50 5.16 3.67 2.47 1.51
COMMENTS ON FINANCIAL RATIOSFINANCIAL RATIOS
Directors’ Report
Protability Ratios
Gross prot has decreased by 23% as compared to the previous year 2017 primarily due to increase in input cost mainly affected by Pak Rupee depreciation of 25.8% and decrease in Sales due to prevailing economic conditions in the country. Net prot also decreased by 59% as compared to 2017 mainly due to increased nance cost. As a result return on equity and capital employed also decreased by 60% and 59% against the previous year of 2017.
Liquidity Ratios
Current ratio as at close of 2018 has decreased by 26% as compared to the year 2017 mainly due to increase in short term borrowings. This also caused a slight decrease in cash to current liabilities and cash ow from operations to sales ratio.
Activity/ Turnover Ratios
Inventory days increased in current year by 28 days as compared to previous year 2017. mainly due to bulk buying and receivable days increased by 15 days.
There is a slight improvement in payment days to creditors.
Investment / Market ratios
As a result of decrease in earning in current year EPS has also decreased to 2.67 as compared to 6.56 in the previous year. Economic uncertainty on the political front resulted in an oscillate price trend exhibited by the company's share throughout the year. However, investor condence is resuming in the light of improved fundamentals like price earnings ratio which is 9.33 in 2018 as compare to 7.24 in year 2017.
Capital Structure Ratios
Financial leverage improved in the current year to 0.57 which is reduced 43% as compared to the year 2013 when it was 1 times. As a result of increased nance cost and low earnings recorded in year under review interest cover declined to 2.3 times as compared to 4.5 times in year 2017.
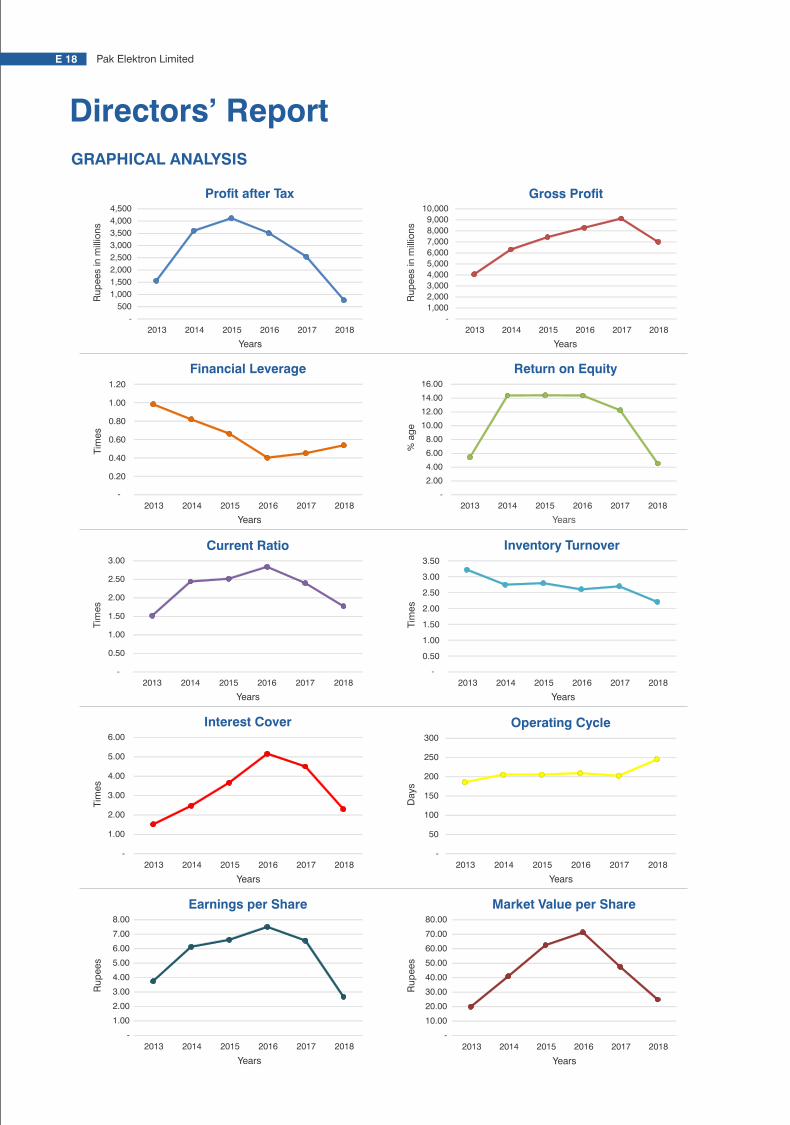
Directors’ Report
E 18 Pak Elektron Limited E 19Annual Report 2018
-
500
1,000
1,500
2,000
2,500
3,000
3,500
4,000
4,500
2013 2014 2015 2016 2017 2018
Ru
pees
in m
illio
ns
Years
Prot after Tax
-
1,000
2,000
3,000
4,000
5,000
6,000
7,000
8,000
9,000
10,000
2013 2014 2015 2016 2017 2018
Ru
pees
in m
illio
ns
Years
Gross Prot
-
2.00
4.00
6.00
8.00
10.00
12.00
14.00
16.00
2013 2014 2015 2016 2017 2018
% a
ge
Years
Return on Equity
2013 2014 2015 2016 2017 2018
-
0.50
1.00
1.50
2.00
2.50
3.00
Tim
es
Years
Current Ratio
-
50
100
150
200
250
300
2013 2014 2015 2016 2017 2018
Days
Years
Operating Cycle
-
1.00
2.00
3.00
4.00
5.00
6.00
2013 2014 2015 2016 2017 2018
Tim
es
Years
Interest Cover
-
1.00
2.00
3.00
4.00
5.00
6.00
7.00
8.00
2013 2014 2015 2016 2017 2018
Ru
pees
Years
Earnings per Share
-
10.00
20.00
30.00
40.00
50.00
60.00
70.00
80.00
2013 2014 2015 2016 2017 2018
Ru
pees
Years
Market Value per Share
2013 2014 2015 2016 2017 2018
-
0.50
1.00
1.50
2.00
2.50
3.00
3.50
Tim
es
Years
Inventory Turnover
-
0.20
0.40
0.60
0.80
1.00
1.20
2013 2014 2015 2016 2017 2018
Tim
es
Years
Financial Leverage
GRAPHICAL ANALYSIS
-
5,000
10,000
15,000
20,000
25,000
30,000
2013 2014 2015 2016 2017 2018
Ru
pees
in m
illio
ns
Years
Statement of Financial Position Analysis (Assets)
Non-current Assets Current Assets
0% 10% 20% 30% 40% 50% 60% 70% 80% 90% 100%
2013
2014
2015
2016
2017
2018
Statement of Financial Position Analysis (Equity and Liabilities)
Equity Long term debt Deferred liabilities/income Current liabilities
0% 10% 20% 30% 40% 50% 60% 70% 80% 90% 100%
2013
2014
2015
2016
2017
2018
Statement of Prot or Loss Analysis (Expenses)
Cost of sales Distribution cost Administrative and general expenses Other expenses Finance cost
-
5,000
10,000
15,000
20,000
25,000
30,000
35,000
40,000
45,000
2013 2014 2015 2016 2017 2018
Ru
pees
in m
illio
n
Years
Statement of Prot or Loss Analysis (Revenue)
Gross revenue Net revenue
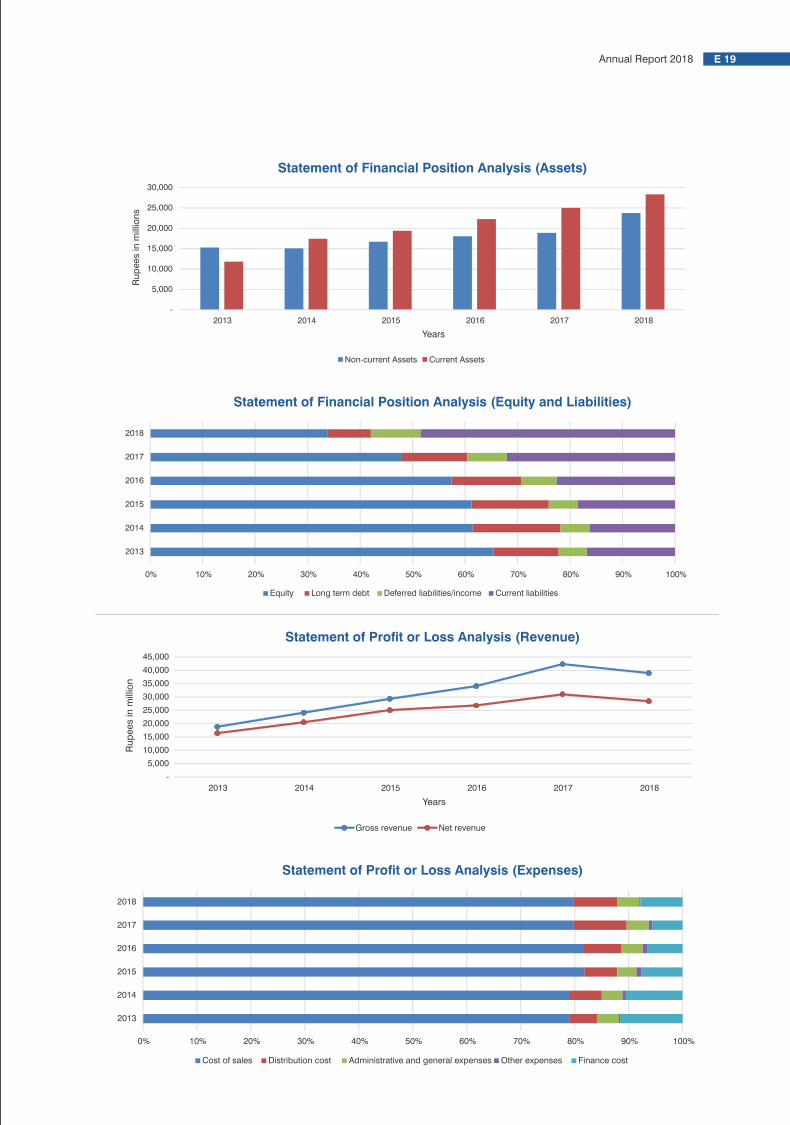

Directors’ Report
E 20 Pak Elektron Limited E 21Annual Report 2018
DUPONT ANALYSIS
Total equityRs. 30,280 M
RevenueRs. 28,445 M
Net profitRs. 1,371 M
Total assetsRs. 52,100 M
Total liabilitiesRs. 21,820 M
Net profit margin4.82 %
Assets turnover0.55 times
Total equityRs. 30,280 M
Total assetsRs. 52,100 M
Return on assets2.63 %
Ownership Ratio58.12%
RETURN ON EQUITY4.53 %
Unit 2018 2017
Tax burden
Interest burden
EBIT margin
Asset turnover
Leverage
Return on Equity
%
%
%
Times
%
%
88.07
41.37
13.23
0.55
172.06
4.53
91.81
69.65
16.69
0.71
162.65
12.25
COMMENTS ON DUPONT ANALYSIS
5.44
14.37 14.40 14.39
12.25
4.53
2013 2014 2015 2016 2017 2018
-
2.00
4.00
6.00
8.00
10.00
12.00
14.00
16.00
Retu
rn o
n E
qu
ity (
% a
ge)
Years
GRAPHICAL PRESENTATION OF DUPONT ANALYSIS
FREE CASH FLOW
Prot before taxation
Adjustments for non-cash and other items
Changes in working capital
Payments for income tax, interest etc.
Net cash generated from/(used in) operating activities
Purchase of property, plant and equipment
Free Cash Flows
2018
1,558 2,609
(2,032)
(2,224)
(89)
(2,369)
(2,458)
2017
3,603
2,197
(1,941)
(2,010)
1,849
(1,843)
6
Rs. In millions
2,545
2,649
(5,761)
(2,918)
(3,485)
(387)
(3,872)
2014
775
2,502
(1,495)
(1,719)
63
(334)
(271)
2013
3,514
2,391
(1,721)
(2,119)
2,065
(1,878)
187
2015
4,119
2,125
(2,247)
(1,864)
2,133
(1,731)
402
2016
(2,458)
6
402 187
(3,872)
(271)
(4,500)
(4,000)
(3,500)
(3,000)
(2,500)
(2,000)
(1,500)
(1,000)
(500)
-
500
1,000
201320142015201620172018
Fre
e C
ash
Flo
ws
Years
COMMENTS ON FREE CASH FLOW
Since the Company is in the process of expanding its product range, significant amount of capital expenditure has been made in the current year which has resulted in negative free cash flows.
Operating margin has slided down over the outgoing year primarily due to increase in raw material cost in the local and international markets. Finance cost as represented by leverage has also increased to cater the working capital financing needs which is also visible in the lowered interest burden. The company continued to benefit from tax efficiency in 2018 as well. To sum up, these factors out weighted the positive factors causing return on equity to fall.

Directors’ Report
E 22 Pak Elektron Limited E 23Annual Report 2018
2018
2017
2016
2015
2014 2013Rs. In millions
Prot before taxation
Adjustments for non-cash and other items
Changes in working capital
Payments for income tax, interest etc.
Net cash generated from/(used in) operating activities
Purchase of property, plant and equipment
Purchase of intangible assets
Proceeds from disposal of property, plant and equipment
Acquisition of short term investments
Proceeds from sale of investments
Long term deposits Long term advances Net cash used in investing activities Long term debt obtained
Repayment of long term debt
Net increase/(deacrese) in short term borrowings
Proceeds from issue of ordinary shares
Advances against issue of ordinary shares
Proceeds from sale and leaseback activities
Dividend paid
Net cash generated from/(used in) nancing activities
Net increase/(decrease) in cash and cash equivalents
Cash and cash equivalents as at beginning of the year
Cash and cash equivalents as at end of the year
1,558
2,609
(2,032)
(2,224)
(89)
(2,369)
(8)
36
-
-
6 (1,040)
(3,375)
226
(1,910)
5,616
-
-
110
(591)
3,451
(13)
484
471
3,603
2,197
(1,941)
(2,010)
1,849
(1,843)
(4)
30
-
-
(106) (300)
(2,223)
3,810
(4,153)
2,246
-
-
15
(1,611)
307
(67)
552
484
4,119
2,125
(2,247)
(1,864)
2,133
(1,731)
-
38
-
65
23 (861)
(2,466)
58
(1,854)
313
2,406
-
4
(619)
308
(25)
578
552
3,514
2,391
(1,721)
(2,119)
2,065
(1,878)
-
126
-
-
(97) (688)
(2,537)
2,063
(2,912)
426
-
1,575
52
(494)
710
238
340
578
2,545
2,649
(5,761)
(2,918)
(3,485)
(387)
-
16
(50)
-
(73)
-
(495)
1,850
(319)
345
2,064
-
100
-
4,041
62
278
340
775
2,502
(1,495)
(1,719)
63
(334)
(42)
34
-
-
(53)
-
(393)
-
(80)
(1,355)
1,828
-
-
-
393
62
216
278
(4,000)
(3,000)
(2,000)
(1,000)
-
1,000
2,000
3,000
4,000
5,000
201320142015201620172018
Ru
pees
in m
illio
n
Years
Cash ows from operating activities Cash ows from investing activities Cash ows from nancing activities
2018 2017 2016 2015 2014 2013
Operating prot 3,663
5,155
5,616
5,193
4,449 2,615
Taxation (186)
(295)
(450)
(634)
(304) (168)
Operating prot after taxation 3,477
4,860
5,166
4,559
4,145 2,448
Total assets 52,100
43,916
40,327
36,149
32,527 27,143
Current liabilities (15,990)
(1,941)
(2,247)
(1,721)
(5,761) (1,495)
Invested Capital 36,110 41,975 38,080 34,428 26,766 25,648
WACC 14.92 11.86 11.61 11.84 14.39 14.09
Cost of capital 5,389
4,977
4,420
4,076
3,852 3,615
Economic Value Added (1,911)
(117)
746
483
294 (1,167)
Rs. In millions
(1,167)
294 483
746
(117)
(1,911)
(2,500)
(2,000)
(1,500)
(1,000)
(500)
-
500
1,000
201320142015201620172018
Years
COMMENTS ON ECONOMIC VALUE ADDED
ECONOMIC VALUE ADDED SUMMARY OF CASH FLOWS
COMMENTS ON CASH FLOWS
Net cash used in operating activities amounted to Rs. 89 million, after payment of interest/mark-up of Rs. 1,414 million and income tax payments of Rs. 810 million.
Net cash used in investing activities amounted to Rs. 3,375 million comprising payments for capital expenditure of Rs. 2,377 million, and long term advances of Rs. 1,040 million and long term deposits of Rs. 21 million partially offset by proceeds from disposal of property, plant and equipment amounting to Rs. 36 million and refund of long term advances of Rs. 27 million.
Net cash generated from financing activities amounted to Rs. 3,451 million comprising of long term finance obtained Rs. 226 million, proceeds from short term borrowings Rs. 5,616 million and proceeds from sales & lease back activities Rs. 110 million offset from redemption of redeemable capital Rs. 275 million, payment of long term finances Rs. 1,543 million, repayment of lease liabilities Rs. 92 million and a dividend payment of Rs. 591 million.
Interest rates increased significantly during the year which caused the weighted average cost of capital of the Company rise by 25.8 % and also, coupled with depreciation of Rupee, negatively affected the financial performance of the Company. The increase in cost of capital and decrease in profits caused economic value added to decline further since the close of 2017.
Eco
no
mic
Valu
e A
dd
ed
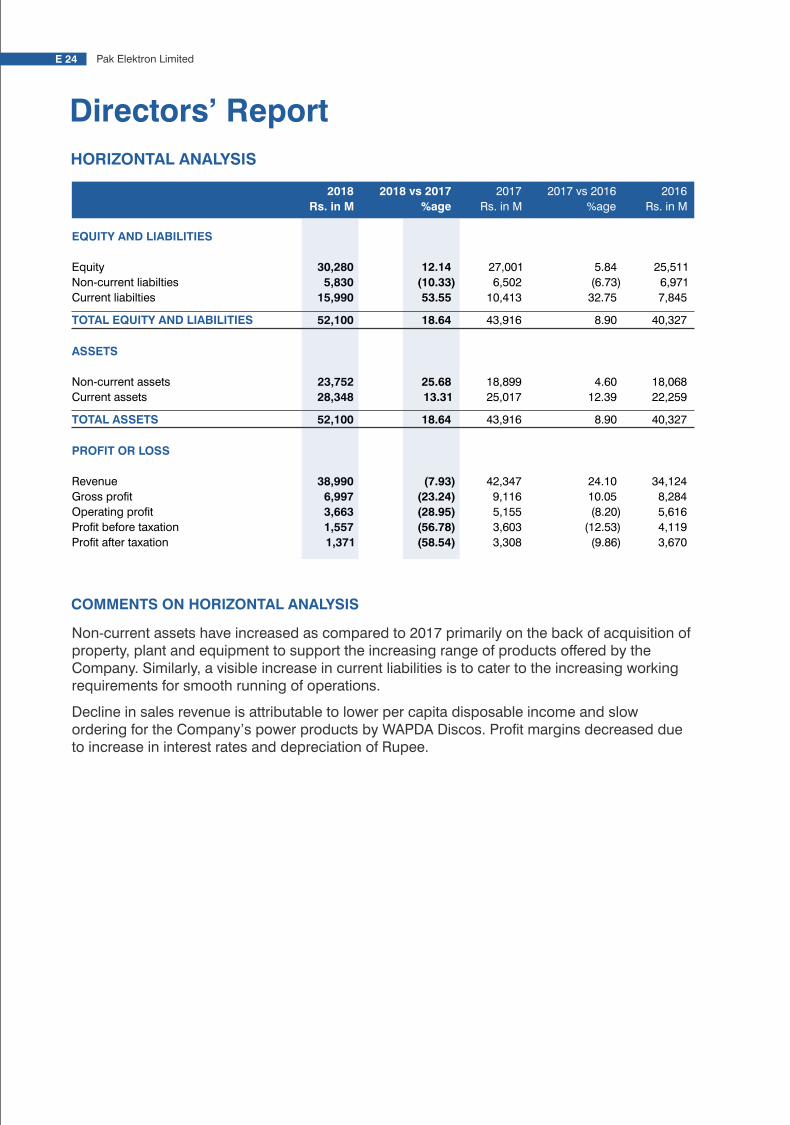
Directors’ Report
E 24 Pak Elektron Limited E 25Annual Report 2018
HORIZONTAL ANALYSIS
COMMENTS ON HORIZONTAL ANALYSIS
EQUITY AND LIABILITIES
Equity
Non-current liabilties
Current liabilties
TOTAL EQUITY AND LIABILITIES
ASSETS
Non-current assets Current assets
TOTAL ASSETS
PROFIT OR LOSS
Revenue
Gross prot
Operating prot
Prot before taxation
Prot after taxation
27.58
(17.33)
1.59
11.56
8.07 14.56
11.56
16.37
11.43
8.14
17.22
27.43
19,996
8,432
7,722
36,149
16,719 19,431
36,149
29,323
7,434
5,193
3,514
2,880
28.22
(13.82)
8.02
11.14
10.96 11.29
11.14
21.54
17.83
16.72
38.07
28.49
15,595
9,783
7,148
32,527
15,068
17,459
32,527
24,126
6,309
4,449
2,545
2,241
39.77
19.27
(8.15) 19.84
(1.49)
47.36
19.84
27.94
55.59
70.11
228.46
269.07
11,158
8,203
7,782 27,143
15,295
11,848
27,143
18,856
4,055
2,615
775
607
43.38
7.91
(20.84) 7.65
7.72
7.55
7.65
(7.08)
11.29
17.61
381.55
429.65
7,782
7,601
9,832 25,215
14,198
11,016
25,215
20,294
3,644
2,224
161
115
30,280
5,830
15,990
52,100
23,752 28,348
52,100
38,990
6,997
3,663
1,557
1,371
12.14
(10.33)
53.55
18.64
25.68
13.31
18.64
(7.93)
(23.24)
(28.95)
(56.78)
(58.54)
27,001
6,502
10,413
43,916
18,899
25,017
43,916
42,347
9,116
5,155
3,603
3,308
5.84
(6.73)
32.75
8.90
4.60 12.39
8.90
24.10
10.05
(8.20)
(12.53)
(9.86)
2016 vs 2015
%age
2015
Rs. in M
2015 vs 2014
%age
2014
Rs. in M
2014 vs 2013
%age
2013
Rs. in M
2013 vs 2012
%age
2012
Rs. in M
2018
Rs. in M
2018 vs 2017
%age
2017
Rs. in M
2017 vs 2016
%age
2016
Rs. in M
25,511
6,971
7,845
40,327
18,068 22,259
40,327
34,124
8,284
5,616
4,119
3,670
Non-current assets have increased as compared to 2017 primarily on the back of acquisition of property, plant and equipment to support the increasing range of products offered by the Company. Similarly, a visible increase in current liabilities is to cater to the increasing working requirements for smooth running of operations.
Decline in sales revenue is attributable to lower per capita disposable income and slow ordering for the Company’s power products by WAPDA Discos. Profit margins decreased due to increase in interest rates and depreciation of Rupee.
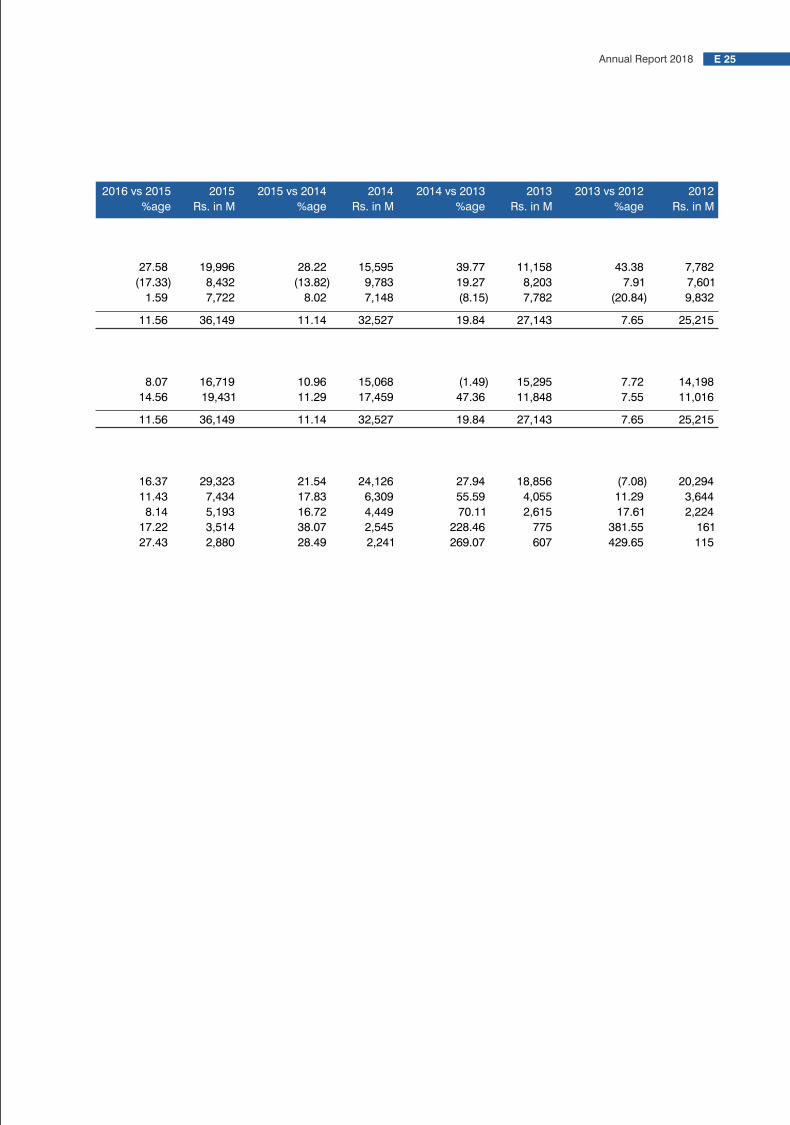
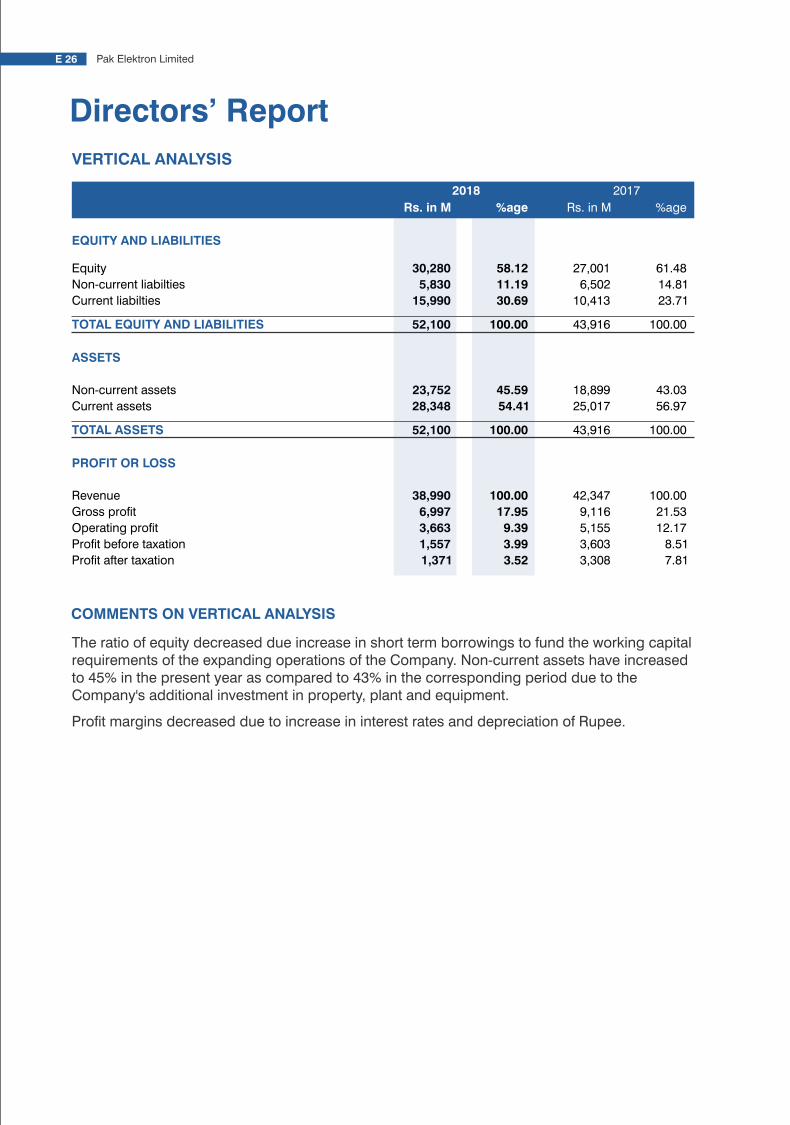
Directors’ Report
E 26 Pak Elektron Limited E 27Annual Report 2018
VERTICAL ANALYSIS
EQUITY AND LIABILITIES
Equity
Non-current liabilties
Current liabilties
TOTAL EQUITY AND LIABILITIES
ASSETS
Non-current assets
Current assets
TOTAL ASSETS
PROFIT OR LOSS
Revenue
Gross prot
Operating prot
Prot before taxation
Prot after taxation
Rs. in M
30,280
5,830
15,990
52,100
23,752
28,348
52,100
38,990
6,997
3,663
1,557
1,371
%age
58.12
11.19
30.69
100.00
45.59
54.41
100.00
100.00
17.95
9.39
3.99
3.52
Rs. in M
27,001
6,502
10,413
43,916
18,899
25,017
43,916
42,347
9,116
5,155
3,603
3,308
%age
61.48
14.81
23.71
100.00
43.03
56.97
100.00
100.00
21.53
12.17
8.51
7.81
2018 2017
2016
Rs. in M
25,511
6,971
7,845
40,327
18,068
22,259
40,327
34,124
8,284
5,616
4,119
3,670
%age
63.26
17.29
19.45
100.00
44.80
55.20
100.00
100.00
24.28
16.46
12.07
10.75
Rs. in M
19,996
8,432
7,722
36,149
16,719
19,431
36,149
29,323
7,434
5,193
3,514
2,880
%age
55.31
23.33
21.36
100.00
46.25
53.75
100.00
100.00
25.35
17.71
11.98
9.82
Rs. in M
15,595
9,783
7,148
32,527
15,068
17,459
32,527
24,126
6,309
4,449
2,545
2,241
%age
47.94
30.08
21.98
100.00
46.32
53.68
100.00
100.00
26.15
18.44
10.55
9.29
11,158
8,203
7,782
27,143
15,295
11,848
27,143
18,856
4,055
2,615
775
607
100.00
100.00
100.00
Rs. in M %age
41.11
30.22
28.67
56.35
43.65
21.51
13.87
4.11
3.22
20132015 2014
COMMENTS ON VERTICAL ANALYSIS
The ratio of equity decreased due increase in short term borrowings to fund the working capital requirements of the expanding operations of the Company. Non-current assets have increased to 45% in the present year as compared to 43% in the corresponding period due to the Company's additional investment in property, plant and equipment.
Profit margins decreased due to increase in interest rates and depreciation of Rupee.
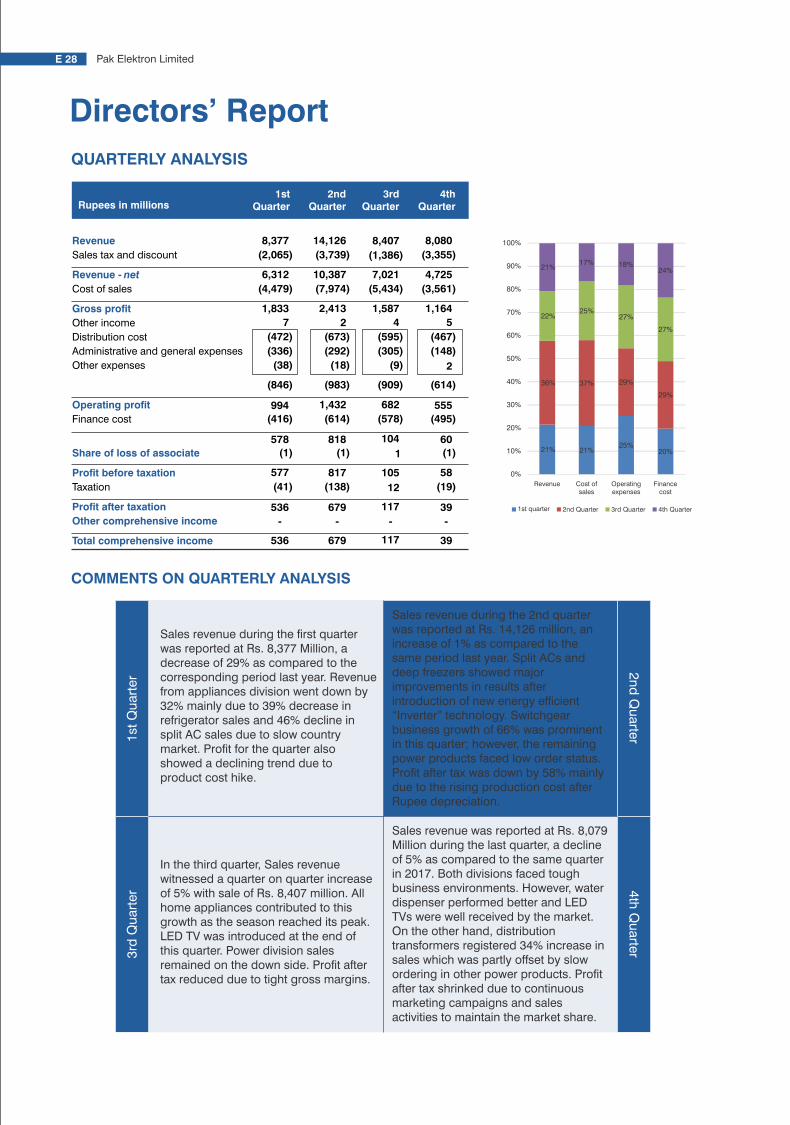
QUARTERLY ANALYSIS
Revenue
Sales tax and discount
Revenue - net
Cost of sales
Gross profit
Other income
Distribution cost
Administrative and general expenses
Other expenses
Operating profit
Finance cost
Share of loss of associate
Profit before taxation
Taxation
Profit after taxation
Other comprehensive income
Total comprehensive income
1stQuarter
2ndQuarter
3rdQuarter
4thQuarterRupees in millions
8,377 14,126 8,407
(2,065) (3,739) (1,386)
6,312
10,387
7,021
(4,479)
(7,974)
(5,434)
1,833
2,413
1,587
7
2
4
(472) (673) (595)
(336) (292) (305)
(38) (18) (9)
(846)
(983)
(909)
994
1,432
682 (416)
(614)
(578)
578
818
104
(1)
(1)
1
577
817
105
(41) (138) 12
536 679 117
- - -
536 679 117
21% 21%25%
20%
36% 37% 29%
29%
22%25%
27%
27%
21%17% 18%
24%
0%
10%
20%
30%
40%
50%
60%
70%
80%
90%
100%
Revenue Cost ofsales
Operatingexpenses
Financecost
1st quarter 2nd Quarter 3rd Quarter 4th Quarter
E 28 Pak Elektron Limited E 29Annual Report 2018
COMMENTS ON QUARTERLY ANALYSIS
Sales revenue during the first quarter was reported at Rs. 8,377 Million, a decrease of 29% as compared to the corresponding period last year. Revenue from appliances division went down by 32% mainly due to 39% decrease in refrigerator sales and 46% decline in split AC sales due to slow country market. Profit for the quarter also showed a declining trend due to product cost hike.
In the third quarter, Sales revenue witnessed a quarter on quarter increase of 5% with sale of Rs. 8,407 million. All home appliances contributed to this growth as the season reached its peak. LED TV was introduced at the end of this quarter. Power division sales remained on the down side. Profit after tax reduced due to tight gross margins.
1st
Qu
art
er
3rd
Qu
art
er
2n
d Q
uarte
r4
th Q
uarte
r
Sales revenue during the 2nd quarter was reported at Rs. 14,126 million, an increase of 1% as compared to the same period last year. Split ACs and deep freezers showed major improvements in results after introduction of new energy efficient “Inverter” technology. Switchgear business growth of 66% was prominent in this quarter; however, the remaining power products faced low order status. Profit after tax was down by 58% mainly due to the rising production cost after Rupee depreciation.
Sales revenue was reported at Rs. 8,079 Million during the last quarter, a decline of 5% as compared to the same quarter in 2017. Both divisions faced tough business environments. However, water dispenser performed better and LED TVs were well received by the market. On the other hand, distribution transformers registered 34% increase in sales which was partly offset by slow ordering in other power products. Profit after tax shrinked due to continuous marketing campaigns and sales activities to maintain the market share.
Directors’ Report
DIRECT METHOD CASH FLOW STATEMENT
COMMENTS ON DIRECT METHOD CASH FLOW STATEMENT
CASH FLOWS FROM OPERATING ACTIVITIES
Receipts from customers - net
Payments to suppliers/service providers/employees etc. - net
Payment to Workers' Prot Participation Fund
Payment to Workers' Welfare Fund
Interest/mark-up on borrowings paid
Income taxes (paid)/refund
Net cash generated from/(used in) operating activties
CASH FLOWS FROM INVESTING ACTIVITIES
Purchase of property, plant and equipment
Purchase of intangible assets
Proceeds from disposal of property, plant and equipment Acquisition of short term investments Proceeds from sale of investments
Long term deposits
Long term advances
Net cash generated used in investing activties
CASH FLOWS FROM FINANCING ACTIVITIES
Long term debt obtained
Repayment of long term debt
Net increase/(deacrese) in short term borrowings
Proceeds from issue of ordinary shares
Advances against issue of ordinary shares
Proceeds from sale and leaseback activities
Dividend paid
Net cash generated used in investing activties
Net increase/(decrease) in cash and cash equivalents
Cash and cash equivalents at the end of the year
Cash and cash equivalents at the end of the year
2018
39,358
(37,062)
(87)
(74)
(1,414)
(810)
(89)
(2,369)
(8)
36 - -
6
(1,040)
(3,375)
226
(1,910)
5,616
-
-
110
(591)
3,451
(13)
484
471
2017
39,823
(35,774)
(105)
(84)
(1,143)
(867)
1,849
(1,843)
(4)
30 - -
(106)
(300)
(2,223)
3,810
(4,153)
2,246
-
-
15
(1,611)
307
(67)
552
484
2016
33,322
(29,145)
(107)
(72)
(1,203)
(661)
2,133
(1,731)
-
38
-
65
23
(861)
(2,466)
58
(1,854)
313
2,406
-
4
(619)
308
(25)
578
552
2015
28,670
(24,369)
(70)
(47)
(1,683)
(437)
2,065
(1,878)
- 126
-
-
(97)
(688)
(2,537)
2,063
(2,912)
426
-
1,575
52
(494)
710
238
340
578
2014
21,864
(22,394)
(27)
(9)
(2,748)
(170)
(3,485)
(387)
-
16
(50)
-
(73)
-
(495)
1,850
(319)
345
2,064
-
100
-
4,041
62
278
340
2013
18,414
(16,610)
(4)
(18)
(1,506)
(214)
63
(334) (42) 34
-
-
(53)
-
(393)
-
(80)
(1,355)
1,828
-
-
-
393
62
216
278
Rs. in millions
Net cash used in operating activities amounted to Rs. 89 million, after payment of interest/mark-up of Rs. 1,414 million and income tax payments of Rs. 810 million.
Net cash used in investing activities amounted to Rs. 3,375 million comprising payments for capital expenditure of Rs. 2,377 million, and long term advances of Rs. 1,040 million and long term deposits of Rs. 21 million partially offset by proceeds from disposal of property, plant and equipment amounting to Rs. 36 million and refund of long term advances of Rs. 27 million.
Net cash generated from financing activities amounted to Rs. 3,451 million comprising of long term finance obtained Rs. 226 million, proceeds from short term borrowings Rs. 5,616 million and proceeds from sales & lease back activities Rs. 110 million offset from redemption of redeemable capital Rs. 275 million, payment of long term finances Rs. 1,543 million, repayment of lease liabilities Rs. 92 million and a dividend payment of Rs. 591 million.
8,080
(3,355)
4,725
(3,561)
1,164
5
(467)
(148)
2
(614)
555 (495)
60
(1)
58
(19)
39
-
39

E 30 Pak Elektron Limited E 31Annual Report 2018
Directors’ Report
SEGMENTAL REVIEW MARKET SHARE INFORMATION
Share Price vs Volume Traded 2018
-
10.00
20.00
30.00
40.00
50.00
60.00
70.00
-
5,000,000
10,000,000
15,000,000
20,000,000
25,000,000
30,000,000
35,000,000
Highest Share PriceLowest Share Price Average Share Price
Jan Feb Mar Apr May Jun Jul Aug Sep Oct Nov Dec
Volume Traded Share Price
An operating segment is a component of an entity:
a) that engages in business activities from which it may earn revenues and incur expenses (including revenues and expenses relating to transactions with other components of the same entity),
b) whose operating results are regularly reviewed by the entity's chief operating decision maker to make decisions about resources to be allocated to the segment and assess its performance, and
c) for which discrete financial information is available.
Information about the Group's reportable segments as at the reporting date is as follows:
Segments Nature of business
Power Division Manufacturing and distribution of Transformers, Switch Gears, Energy Meters, Power Transformers and Engineering, Procurement and Construction Contracting (EPC).
Appliances Division Manufacturing, assembling and distribution of Refrigerators, Air conditioners, Deep Freezers, Microwave ovens, Water Dispensers, LED TVs, Washing Machines and other Small Domestic Appliances.
The Company is listed on Pakistan Stock Exchange ['PSX'] which is a large and liquid stock exchange, offering orderly and reliable market prices for its investors. As at December 31, 201, the market capitalization of PEL's shares stood at Rs. 12,392 million, lower by 48% from previous year. PEL's share traded at an average of Rs. 39.27 per share. Market price experienced fluctuations, principally, caused by market psychology, speculative investors and material events occurring during the year, between Rs. 61.85 and Rs. 21.96 per share. Total trading volume during the year was 1,690 million shares.
Power Division
Power division recorded 19.71% decline in revenue in comparison with previous year resulting in profit before tax of Rs. 280 million for the year, down by 48.62% from 2017. The decline was mainly attributable to slow ordering of power products by WAPDA DISCOs and depreciation of Rupee. A summary of operating results of power division is presented below:
Appliances Division
Appliance Division maintained its business volumes of Rs. 27 billion, as in the previous year, despite overall decline in per capita disposable income. However, profit margins went down by 58.97% from the previous year due to increase in interest rates and depreciation of Rupee. A summary of operating results of appliances division is presented below:
2018 2017 YoY 2018 2017 YoY
Rs. in M Rs. in M %age Rs. in M Rs. in M %age
Revenue 11,715 14,591 (19.71) Revenue 27,275 27,755 (1.73)
Finance cost 689
637
8.16 Finance cost 1,415 910 55.49
Prot before taxation 280
545 (48.62) Prot before taxation 1,322 3,222 (58.97)
12,684 15,773 30,012 31,887
Appliances divisionPower Division
5,000
6,000
7,000
8,000
9,000
10,000
11,000
12,000
13,000
14,000
15,000
2017 2018
RevenuePower Division
5,000
10,000
15,000
20,000
25,000
30,000
2017 2018
RevenueAppliances Division
SHARE PRICE SENSITIVITY
PEL's share price is directly affected by its performance. However, there are numerous other factors which influence share price of the Company. These factors and the way the influence the share price of the Company are as follows:
General Market Sentiment: The general stock market sentiment prevalent in the country not affects share price but also the trading volumes. Market sentiment is generally based on over political, economical and law and order situation of the Country and any uncertainty regarding these adversely affects share prices.
Shares' market perception: Shareholders' perception of the Company's share affects how it is valued on the exchange. A sell behavior induces a fall in share price.
Financial performance: The Company's financial performance is affected by a number of factors which include, but are not limited to:
• Interest rates: The Company relies on debt financing to finance its working capital requirements. Increase in interest rates increases the borrowing costs of the Company.
• Energy crises: The current energy crises has a direct bearing on the operations of the Company. Hikes in electric power tariff increase the cost of operations thereby reducing profitability.
• Rupee valuation: The Company is directors exposed to exchange rate fluctuation. Any depreciation of Pak Rupee adversely impact the financial performance of the Company.
• Any growth or decline in the engineering and Engineering and home appliances industry:home appliance industry has a direct impact on financial performance of the Company
• Government policies, including those related to direct and indirect Government policies:taxes, can have a substantial impact on the Company's financial performance.
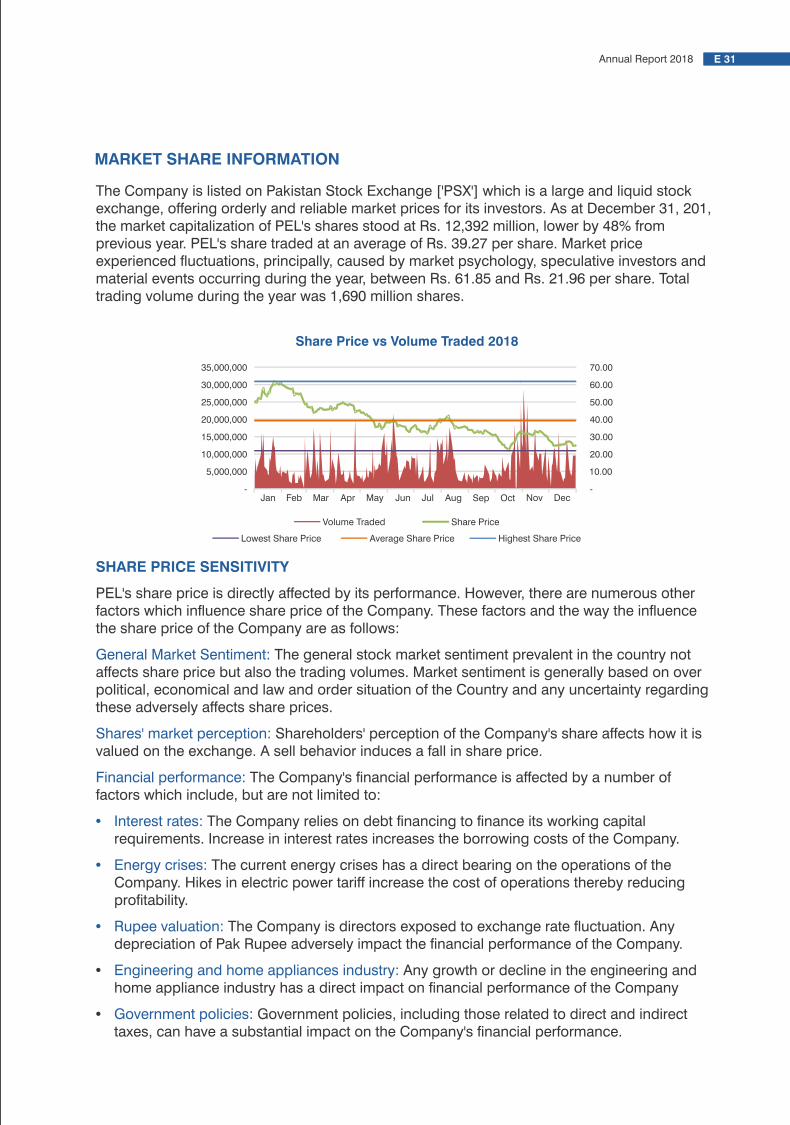

E 32 Pak Elektron Limited
Directors’ Report
MARKET OVERVIEW
The appliances industry in Pakistan has continued to grow steadily for the past few years. As domestic appliances become more energy efcient and affordable, penetration of these appliances is growing day by day. Business growth potential remains steady, with more households willing to embrace our reliable home appliances for better living.
Continued focus of the Government on improvement of power generation and distribution infrastructure, the market outlook for power division looks promising.
Government's initiatives in the energy sector in light of recent energy deals signed, policies for IPPs and above all, CPEC will create a pool of opportunities for power products. EPC activity is also on agrowth track due to the increase in housing sector schemes and upgrading of grid stations.
PEL’s MARKETING ACTIVITES
PEL is providing premium quality products to consumers through its ever evolving dealer network which is spread all over the country.
PEL's market strategy encompasses market research , brand positioning and marketing communications as well as right decisions in terms of incentives and dealers to ensure smooth running of dealers network. The sales of power division mainly originate from tendering and our power division marketing team is well versed and equipped to win major orders.
Pakistan Fashion Week 2018
This year Red Carpet of Pakistan Fashion Week was sponsored by PEL and a display of PEL's products attracted people.
Pel Limitless Summit 2018 Dealer Convention
PEL celebrated the big gest ever Summit at the Grand Ball Room – PEL LIMITLESS, at Pearl Continental Hotel (PC), Lahore on 21st January 2018. over 1500 participants attended the e vent from all over the country. The event was full of fun lled activities including musical performances by various artists, followed by stand-up comedy by renowned comedians.
Jeeto PEL Say
This year a new activity named “JEETO PEL SAY” was arranged for customer retention. This activity has been taken place nation wide and different prizes compromising PEL's products have been distributed among customers.
Women in Business and Leadership Conference 2018
PEL sponsored Women in Business and Leadership Conference - WIBCON 2018 which was the biggest learning festival where diverse, multicultural, cross functional and unorthodox business ideas were presented and shared. Through this event, the most successful and highly accomplished women leaders from Pakistan and across the globe were brought together to share stories of their hardships and failures.
Floor Salesman Trainings 2018
PEL initiated Floor Salesman Training which has been taken place in the major cities of Pakistan to share the complete functionality of all products. Representatives from different departments such as Research and Development, Customer Services, Marketing and Sales provided detail information and gave demonstration as well.
Mall Cinema Activations for ColorOn Smart LED TV
This year PEL launched ColorOn LED Smart TV. Launching ceremony took place in Emporium Mall Lahore and Dolmen Mall Karachi while various cinemas (Cinepax, Universal Cinema, Emporium Mall, Nuplex Cinema Karachi and Centaurs Mall Islamabad) were branded with ColorOn “RUNG JAMA KE DEKH” balloons & other promotional material.
Through the activations we shared complete details to the customers, engaged them via Xbox gaming consoles, VR and Kinect Games, and lucky draws. Small Domestic Appliances and LED's were the bumper prizes for the lucky winners.
E 33Annual Report 2018
PRODUCT QUALITY ASSURANCE
PEL is dedicated towards maintenance of excellent product quality which is evident from evergrowing consumer condence in PEL's products.
Extensive quality assurance measures have been implemented by PEL to provide best 'value for money' products through the following measures:
• Suppliers of raw material and other inputs are selected carefully and only those suppliers are engaged, who can demonstrate the full commitment and ability to comply with PEL's quality requirements/standards.
• Careful and meticulous inspections and testing is carried out at every stage of production.
• Top quality packing material to eliminate the chance of physical damage to the product during transportation and storage.

E 34 Pak Elektron Limited
PATTERN OF SHAREHOLDING
FORM 34
THE COMPANIES ACT 2017(Section 237(2)(f)
PATTERN OF SHAREHOLDING
1. Incorporation Number 0000802
2. Name of the Company PAK ELEKTRON LIMITED
3. Pattern of holding of the shares held by the shareholders as at 31-12-2018
4. Number ofshareholders
Totalshares heldFrom To
Shareholding
1,0142,1982,1634,0331,152
442277181136
676241852824182326
91714
8461110
297724
1443235125
122351142241
1101501
1,0015,001
10,00115,00120,00125,00130,00135,00140,00145,00150,00155,00160,00165,00170,00175,00180,00185,00190,00195,001
100,001105,001110,001115,001120,001125,001130,001140,001145,001150,001155,001160,001165,001170,001180,001185,001190,001195,001205,001215,001220,001230,001240,001245,001260,001265,001270,001275,001
100500
1,0005,000
10,00015,00020,00025,00030,00035,00040,00045,00050,00055,00060,00065,00070,00075,00080,00085,00090,00095,000
100,000105,000110,000115,000120,000125,000130,000135,000145,000150,000155,000160,000165,000170,000175,000185,000190,000195,000200,000210,000220,000225,000235,000245,000250,000265,000270,000275,000280,000
36,557917,681
2,046,20211,348,605
9,046,9395,731,5015,041,4384,262,6023,889,5752,212,4592,389,3241,763,8684,200,2381,487,3291,409,2701,139,9841,571,4181,914,553
701,4221,415,8361,238,462
745,2154,590,5651,130,5831,086,307
222,8751,071,700
865,500894,200265,125569,269
2,090,500617,000472,400326,000507,500870,500185,000379,000966,800
2,393,400418,000649,490
1,120,500232,000244,000996,000522,300536,750
1,093,500279,500
Directors’ Report
E 35Annual Report 2018
4. Number ofshareholders
Totalshares heldFrom To
Shareholding
1271142132171112111117112131211111111111111111211151111111111111
280,001285,001295,001300,001320,001325,001335,001340,001345,001360,001385,001395,001410,001420,001430,001435,001455,001465,001470,001485,001490,001495,001500,001510,001525,001535,001545,001555,001595,001605,001615,001630,001645,001705,001725,001740,001745,001750,001770,001790,001795,001815,001825,001830,001865,001870,001890,001895,001925,001955,001995,001
1,025,0011,085,0011,190,0011,295,0011,360,0011,440,0011,445,0011,450,0011,495,0011,505,0011,690,0011,700,0011,835,001
281,250577,000
2,096,000300,500325,000
1,314,500674,620341,000
1,050,000722,000390,000
2,797,500410,250422,926434,000879,000456,500467,000470,500487,270492,000
3,497,500502,000511,000
1,059,900538,303
1,650,000560,000
1,200,000610,000617,645633,000650,000710,000726,760740,947750,000752,000771,000791,500800,000819,000827,200834,000870,000873,523
1,787,000900,000929,000960,000
5,000,0001,030,0001,088,2001,194,2001,299,5001,361,5001,445,0001,450,0001,450,6501,500,0001,510,0001,690,5001,702,0001,839,000
285,000290,000300,000305,000325,000330,000340,000345,000350,000365,000390,000400,000415,000425,000435,000440,000460,000470,000475,000490,000495,000500,000505,000515,000530,000540,000550,000560,000600,000610,000620,000635,000650,000710,000730,000745,000750,000755,000775,000795,000800,000820,000830,000835,000870,000875,000895,000900,000930,000960,000
1,000,0001,030,0001,090,0001,195,0001,300,0001,365,0001,445,0001,450,0001,455,0001,500,0001,510,0001,695,0001,705,0001,840,000
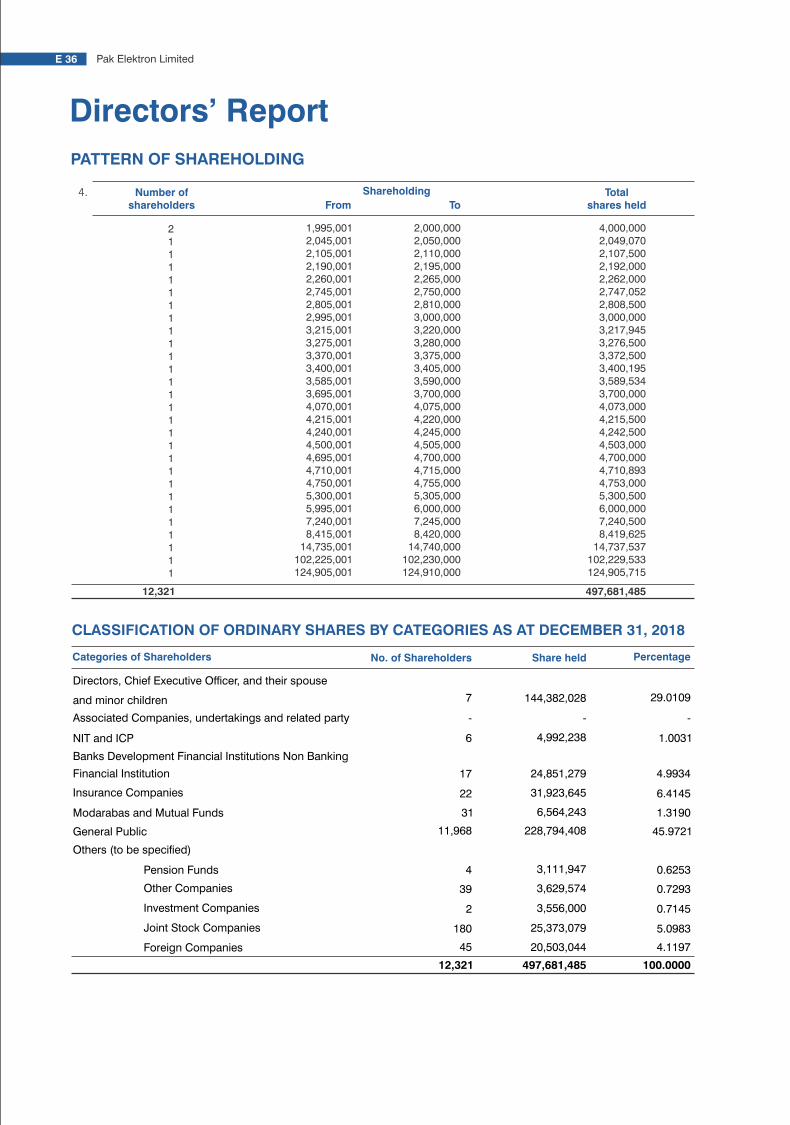
E 36 Pak Elektron Limited
4. Number ofshareholders
Totalshares heldFrom To
Shareholding
12,321 497,681,485
Categories of Shareholders No. of Shareholders Share held Percentage
CLASSIFICATION OF ORDINARY SHARES BY CATEGORIES AS AT DECEMBER 31, 2018
Directors, Chief Executive Ofcer, and their spouse
and minor children
Others (to be specied)
Other Companies
Pension Funds
NIT and ICP
Banks Development Financial Institutions Non Banking
Financial Institution
Insurance Companies
Modarabas and Mutual Funds
General Public
Associated Companies, undertakings and related party
Investment Companies
Foreign Companies
Joint Stock Companies
497,681,485 100.000012,321
2111111111111111111111111111
1,995,0012,045,0012,105,0012,190,0012,260,0012,745,0012,805,0012,995,0013,215,0013,275,0013,370,0013,400,0013,585,0013,695,0014,070,0014,215,0014,240,0014,500,0014,695,0014,710,0014,750,0015,300,0015,995,0017,240,0018,415,001
14,735,001102,225,001124,905,001
2,000,0002,050,0002,110,0002,195,0002,265,0002,750,0002,810,0003,000,0003,220,0003,280,0003,375,0003,405,0003,590,0003,700,0004,075,0004,220,0004,245,0004,505,0004,700,0004,715,0004,755,0005,305,0006,000,0007,245,0008,420,000
14,740,000102,230,000124,910,000
4,000,0002,049,0702,107,5002,192,0002,262,0002,747,0522,808,5003,000,0003,217,9453,276,5003,372,5003,400,1953,589,5343,700,0004,073,0004,215,5004,242,5004,503,0004,700,0004,710,8934,753,0005,300,5006,000,0007,240,5008,419,625
14,737,537102,229,533124,905,715
7
-
6
17
22
31
11,968
4
39
2
180
45
144,382,028
-
4,992,238
24,851,279
31,923,645
6,564,243
228,794,408
3,111,947
3,629,574
3,556,000
25,373,079
20,503,044
29.0109
-
1.0031
4.9934
6.4145
1.3190
45.9721
0.6253
0.7293
0.7145
5.0983
4.1197
PATTERN OF SHAREHOLDING
Directors’ Report
E 37Annual Report 2018
CATEGORIES OF SHAREHOLDING REQUIRED UNDER LISTED COMPANIES (CODE OFCORPORATE GOVERNANCE) REGULATIONS, 2017 AS ON DECEMBER 31, 2018
Sr.No.
Name No. of SharesHeld
Percentage
Associated Companies, Undertakings and Related Parties:
Mutual Funds:
123456789
10111213141516171819202122232425262728
CDC - TRUSTEE ABL INCOME FUND - MT (CDC)CDC - TRUSTEE AKD INDEX TRACKER FUND (CDC)CDC - TRUSTEE AL AMEEN ISLAMIC DEDICATED EQUITY FUND (CDC)CDC - TRUSTEE AL-AMEEN ISLAMIC ASSET ALLOCATION FUND (CDC)CDC - TRUSTEE ALFALAH GHP INCOME FUND - MT (CDC)CDC - TRUSTEE ALFALAH GHP INCOME MULTIPLIER FUND - MT (CDC)CDC - TRUSTEE ALFALAH GHP ISLAMIC DEDICATED EQUITY FUND (CDC)CDC - TRUSTEE ALFALAH GHP SOVERGEIGN FUND - MT (CDC)CDC - TRUSTEE APIF - EQUITY SUB FUND (CDC)CDC - TRUSTEE ATLAS ISLAMIC STOCK FUND (CDC)CDC - TRUSTEE DAWOOD ISLAMIC FUND (CDC)CDC - TRUSTEE FAYSAL MTS FUND - MT (CDC)CDC - TRUSTEE FAYSAL SAVINGS GROWTH FUND - MT (CDC)CDC - TRUSTEE FIRST CAPITAL MUTUAL FUND (CDC)CDC - TRUSTEE FIRST DAWOOD MUTUAL FUND (CDC)CDC - TRUSTEE KSE MEEZAN INDEX FUND (CDC)CDC - TRUSTEE MCB DCF INCOME FUND (CDC)CDC - TRUSTEE MCB PAKISTAN ASSET ALLOCATION FUND (CDC)CDC - TRUSTEE MEZAN ISLAMIC FUND (CDC)CDC - TRUSTEE NAFA INCOME FUND - MT (CDC)CDC - TRUSTEE NAFA INCOME OPPORTUNITY FUND - MT (CDC)CDC - TRUSTEE NAFA ISLAMIC ACTIVE ALLOCATION EQUITY FUND (CDC)CDC - TRUSTEE NAFA ISLAMIC STOCK ALLOCATION FUND (CDC)CDC - TRUSTEE PAKISTAN INCOME FUND - MT (CDC)CDC-TRUSTEE NAFA SAVING PLUS FUND - MT (CDC)MC FSL - TRUSTEE JS - INCOME FUND (CDC)MC FSL - TRUSTEE JS - INCOME FUND - MT (CDC)MCBFSL - TRUSTEE PAK OMAN ISLAMIC ASSET ALLOCATION FUND (CDC)
8,50053,775
900700
1,5008,500
31513,000
122,500250,000
10,500115,500
1,00010,000
4,500538,303834,000895,000
11,350210,000960,000296,000400,000
4,00032,500
1,690,50020,500
100
0.00170.01080.00020.00010.00030.00170.00010.00260.02460.05020.00210.02320.00020.00200.00090.10820.16760.17980.00230.04220.19290.05950.08040.00080.00650.33970.00410.0000
6,493,443 1.3047
1234567
Directors, CEO and their Spouse and Minor Children:
29.0109
MR. M. NASEEM SAIGOL (CDC)MR. MUHAMMAD MURAD SAIGOLMR. MUHAMMAD ZEID YOUSAF SAIGOLSHEIKH MUHAMMAD SHAKEELSYED MANZAR HASSANSYED HAROON RASHIDMRS. SEHYR SAIGOL W/O MR. M. NASEEM SAIGOL (CDC)
124,905,71512,421
14,749,958500
2,041500
4,710,893
25.09750.00252.96370.00010.00040.00010.9466
144,382,028
- -
- -
59,957,671 12.0474
Executives:
Public Sector Companies & Corporations:
Banks, Development Finance Institutions, Non Banking Finance
Institution, Insurance Companies, Modarabas and Pension Funds:

Sr.No.
Name No. of SharesHeld
Percentage
2 102,229,533 20.5412
227,135,248 45.6387
Shareholders holding ve percent or more voting intrest in the listed company
124,905,7151 25.0975MR. M. NASEEM SAIGOL (CDC)
MRS. AMBER HAROON SAIGOL W/O MR. M. AZAM SAIGOL (CDC)
All trades in the shares of the listed company, carried out by its Directors, CEO, CFO, Company
Secretary, Their spouses and minor children:
S. No. NAME SALE PURCHASE RIGHT
5001 -SYED HAROON RASHID -
PATTERN OF SHAREHOLDING
Directors’ Report
E 38 Pak Elektron Limited E 39Annual Report 2018
CAPITAL EXPENDITURE
Customer satisfaction is a primary organizational objective and company is always determined for its energy efficient and esthetically improved products for market competitiveness. Company is consistently spending on development of different models in its existing products to cater market demand. On consistent market demand, company during the year added locally manufactured LED TVs in its product range. Installation Washing Machine production line is started in the year under review and its production is expected by 2nd half of the year 2019.
Demand of energy efficient products with improved esthetics is latest market trend. Company for market competiveness spends a lot on required modifications in manufacturing line. Further, Company is widening its product range on continues market demand. Both of the steps relate to improved profitability & long term business sustainability. In this way company safeguards the stake holders interest i.e. security of Investment & Payout.
DIVIDEND AND APPROPRIATIONS
During the year, PEL distributed cash dividend on ordinary shares at Rs. 1.20 per ordinary share as final dividend for the year 2017. However, in view of the financial results for 2018, the Board of Directors did not proposed any dividend for the year 2018.
CORPORATE SOCIAL RESPONSIBILITY
At PEL we pride ourselves in aligning our business strategy to meet societal needs. We believe in giving something back to the society because we care. For us it’s about more than just aligning our activities with our stakeholder’s expectations whether it’s our clients, suppliers, the community, our employees and society as a whole. Through a broad range of community initiatives, charitable giving, foundation grants and volunteerism, we seek to create more value for our society to continue to bring joy in people’s lives.
Directors’ Report
E 40 Pak Elektron Limited
CORPORATE AND FINANCIAL REPORTING FRAMEWORK
The Directors are pleased to state that:
• The financial statements, prepared by the management of the company, present its state of affairs fairly, the result of its operations, cash flows and changes in equity.
• Proper books of accounts of the company have been maintained.
• Appropriate accounting policies have been consistently applied in the preparation of financial statements and accounting estimates are based on reasonable and prudent judgment.
• International accounting standards, as applicable in Pakistan, have been followed in preparation of financial statements and any departure there from has been adequately disclosed.
• The system of internal control is sound in design and has been effectively implemented and monitored.
• There are no significant doubts upon the Company's ability to continue as a going concern.
• There has been no material departure from the best practices of corporate governance, as detailed in the listing regulations.
• Key operating and financial data for last six (6) years in summarized form is given on page E-16.
• The Company has been declaring regular dividends to its shareholders for the past three years, however, in view of the financial results for 2018, the Board of Directors do not propose any dividend for the year 2018.
• There is nothing outstanding against the Company on account of taxes, duties, levies and charges except for those which are being made in normal course of business.
• The Company maintains Provident Fund accounts for its employees. The values of the investments of the fund as on December 31, 2018 are given on page A-30.
BOARD OF DIRECTORS
The composition of the Board of Directors, and their profile and attendance at meetings is give on page D-04.
REVIEW OF RELATED PARTY TRANSACTIONS
Details of all related party transactions are placed before the Audit Committee and upon recommendations of the Audit Committee, the same are placed before the Board for review and approval in accordance with requirements of the Code of Corporate Governance.
TRADING IN SHARES BY DIRECTORS AND EXECUTIVES
Details of trading conducted by directors, executives, their spouses and minor children in the shares of PEL during the year is given on page E-38.
INTERIM FINANCIAL REPORTING
Periodic nancial statements of the Company during the year 2018 were circulated to directors, duly endorsed by the CEO and the Chief Financial Ofcer. Quarterly nancial statements of the Company, were approved, published and circulated to shareholders within one month of closing date, while half yearly nancial statements were reviewed by external auditors of the Company, approved by the Board, published and circulated to shareholders within the permitted time of two months after the period end.
RISK ASSESSMENT
The Board of Directors have carried out a robust assessment of the principal riks facing the Company, including those that wood threaten the business model, future performance, solvency or liquidity. The detalis of risks faced by the Company and our mitigating strategies are given on page C-02.
SUBSEQUENT EVENTS
There were no major events subsequent to the reporting period that may require material
E 41Annual Report 2018
adjustment to or disclosure in the financial statements.
REVIEW OF BUSINESS CONTINUITY AND DISASTER RECOVERY PLANNING BY THE BOARD
The Board of Directors has Reviewed the Business Continuity and Disaster Recovery Plan of the Company and satised that the Company is well protected against risks of loss arising from any disaster. The details of the Company’s Business Continuity and Disaster Recovery Plan are given on page D-10.
APPOINTMENT OF AUDITORS
Rahman Sarfaraz Rahim Iqbal Rafiq, Chartered Accountants, have completed the annual audit of PEL for the year ended December 31, 2018 and have issued an unqualified report. They will retire at the conclusion of the forthcoming AGM, and being eligible, have offered themselves for reappointment for the year ending December 31, 2019. The Board of Directors on the suggestion of the Audit Committee has recommended their re-appointment as auditors of the PEL for the year ending December 31, 2019 at a fee to be mutually agreed.
FUTURE OUTLOOK
A detail Forward Looking Statement is give on page F-02.
ACKNOWLEDGMENT
The management would like to express its gratitude to all customers, financial institutions, staff memebers, suppliers and shareholders who hae been assoicated with the Company for their continued support and cooperation.
Chief Executive Ofcer
LahoreApril 04, 2019
M. Murad Saigol

E 42 Pak Elektron Limited E 43Annual Report 2018

E 42 Pak Elektron Limited E 43Annual Report 2018

E 44 Pak Elektron Limited E 45Annual Report 2018

E 44 Pak Elektron Limited E 45Annual Report 2018

E 46 Pak Elektron Limited
2017 2018 ò»Üž
ù¦Wæã
o«
IZiLo«
ZiLo«
°¥WæãXgz9
42,347
9,116
5,155
1,547
3,603
3,308
6.56
38,990
6,997
3,663
2,103
1,557
1,371
2.67

OutlookF

Forward Looking Statement
World Bank has foreseen in coming years growth rate of below 4.0% for Pakistan against 5.4% for the year 2018. The decline is projected due to stressed situation of balance of payment, current accounts decit and low Forex reserves level. After IMF package the severity is expected to tone down and the economy can derive the benets from Infrastructure Development, recovery of energy shortfall and improved Law & Order Situation. Legal & Economic reforms are on way under Pakistan Vision 2025. The improved governance level and ease of doing business are being focused to attract local as well foreign Investors. The targeted measures to raise investor's condence will certainly boost economic growth.
Viable energy solutions, Improvement in Human Index Level, Channelizing youth potential and Improvement in governance level are the measures to meet the challenges of growing population which is expected to be double by 2050. Cost competitiveness is right now major challenge to local Industry and this can be met through technical collaborations. Regional low labour cost and growing market of 200 Million population can be an attraction for foreign investors.
China Pak Economic Corridor (CPEC) has come into its execution phase and has emerged with tangible existence on the canvas. Most of the Energy Projects are functional, as a result Electricity Load Shedding is expected to eliminate in near future. A Lot of developments in Roads and Railway under CPEC arrangements is on the way and likely to complete within scheduled time line. These all developments will promote local industry and Foreign Direct Investment (FDI). Six Special Economic Zones -SEZ have been notied out of 46 SEZs proposed under CPEC arrangements and infrastructure development is almost complete. These Industrial Parks will lead an industrial revolution all over the country.
Home Appliances Division Products Penetration is expected to grow as a result of growth in consumable income and rapid
urbanization. This will lead to an overall growth in Country Home Appliances Market and Company with its brand equity , state of art manufacturing facility , Country wide Sales and After Sales Services Net work is quiet condent to clutch its due market share.
After successful commissioning of electricity generation projects, now the focus has to swing towards augmentation of T&D Infrastructure to ensure availability of electricity at consumer end. PEL being key electrical equipment manufacturer is condent of receiving its due market share. Company's EPC Division engaged in Grid Station Installations and underground & on ground electrications is on a growth track due to the increase in housing sector schemes and upgrading of grid stations.
Company is aiming at to capitalize its Brand Equity and Commercial Relations with WAPDA Distribution Companies in the emerging CPEC Scenario. Per Capita Income is likely grow in future years due to potential improvement in Macro Economic Indicators and PEL Brand market penetration at large will sustain its growth perspective in Home Appliances Division. Your Company apart from widening product range is launching aggressive marketing campaigns to promote PEL Brand.
COMPANY PERFORMANCE AGAINST LAST YEAR PROJECTION
For the Year 2018 company budgeted revenue of Rs. 43,406 at 2.5% growth over year 2017. Due to slow ordering by WAPDA distribution companies and shrink of disposable income, company achieved revenue of Rs. 38,990 million at 10.1% below the budgeted number. Product cost increased due Rupee depreciation by 25.8%, which could not be passed on to customers in full due slow economic environment. Lower volume and cost increase resulted in declined gross prot of Rs. 6,997 million against budgeted Rs.8,535 million. Net prots also reduced to Rs. 1,557 million against budgeted Rs. 2,397 million due increase in policy rate along with the factors earlier explained.
FINANCIAL PROJECTIONS
Company foresees a moderate revenue growth in future years keeping in view current economic indicators. Growing country population, rapid urbanization and required T&D infrastructure augmentation are among major growth assumptions.
Revenue
Rs. in millions
STATUS OF PROJECTS
During the year company installed LED TVs manufacturing facility and started its commercial production after successful trial run. Company has started installation of washing machines production line during the year is likely to be completed in next year and commercial production is expected to start commercial production by 2nd half of year 2019. Company also plans to set up Power Transformer Manufacturing Facility at PEL –Unit II 34 KM Ferozepur Road, Lahore. Besides these developments a continuous Plant BMR is made to ensure improved quality production.
SOURCES OF INFORMATION AND ASSUMPTIONS
Revenue planning of existing products is based on market feedback through countrywide sales net work, independent market survey and latest consumer trends .
For new product launching market research, market surveys and sales network feedback is based. If required, consultants are engaged for project feasibilities. Before formal submission of feasibilities underlying assumptions are discussed at length. The feasibility is then presented to board for formal approval. Board after thorough discussion of its nancial viability by paying special attention realistic payback period approves the feasibility report.
2019
39,964
2020
41,364
2021
43,431
F 02 Pak Elektron Limited F 03Annual Report 2018
Everything ispossibleYour dreams,Your ideas!Your Inventions!Your Vision!Never let anyonetell you, You Cant!

This page has been left blank intentionally

GStakeholders
Relationship andEngagement

G 02 Pak Elektron Limited G 03Annual Report 2018
Stakeholders Relationshipand Engagement
The development of sustained stakeholder relationships is paramount to the performance of any company. From short term assessments to longer term strategic relationship building, 'Stakeholders' Engagement' lies at the core of our business practices to promote improved risk management, compliance with regulatory and lender requirements in addition to overall growth of the Company.
The frequency of engagements is based on business and corporate requirements as specified by the Code of Corporate Governance, contractual obligations or on requirements basis.
The following table elaborates on the mode of engagement in addition to the impact of each of the following stakeholders on Company's operations.
STAKEHOLDERS ENGAGEMENT PROCESS
Analysts In order to attract potential investors, the Company regularly engages with analysts on details of projects already disclosed to the regulators, with due regard to regulatory restrictions imposed on inside information / trading, to avoid any negative impact on the Company's reputation or share price.
Providing all the required information to analysts helps in clarifying any misconception/rumour in the market
Employees Our commitment to our most valued resource, our human capital, is at the core of our HR strategy. PEL provides a nurturing and employee friendly environment to its employees.
Our employees represent us in in the industry and community, and are at the heart of our organization, implementing every strategic and operational decision of the management.
Employees Local community and general public
PEL regularly engages with general public at large through its CSR initiates. This engagement helps us to identify required interventions in the eld of education, health and uplift of the society.
The people of our country provide the grounds for us to build our future.
Stakeholders Management of Stakeholders’ Engagement Effect and value to PEL
Institutional Investors /Shareholders
We recognize the trust our investors put in us and acknowledge it by providing a steady return on their investments.
The providers of capital allow PEL the means to achieve its vision
Customers & Suppliers
We recognize the importance of customer relationship management and have made signicant investments in this regard over the years going beyond extending credit facilities and trade discounts. We also acknowledge that engaging reputed and dependable suppliers as business partners for supply of raw material, industrial inputs, machinery and equipment is the key to our continuous and sustainable growth.
Our success and performance depends upon the loyalty of our customers with the PEL brand and effective supply chain management
Banks and other lenders
Banks and other providers of debt nances are one of the key stakeholders who are engaged by us on a regular basis for the purpose of short term and long term nancing.
Dealing with banks and other providers of debt nances is key to our performance in terms of access to cheaper loans, minimal fee, higher level of customer service, and future planning.
Media Different communication mediums are used on need basis to apprise the general public about new developments, activities and products of the Company
By keeping the media informed of the developments and activities of PEL, more awareness of the Company is developed along with awareness of the Company's products offered.
Regulators We pride ourselves in being a responsible corporate citizen and abide by the laws and regulations of Pakistan.
Laws and regulations, and other factors controlled by the Government affect PEL and its activities.
G 04 Pak Elektron Limited
Statement of Value Addition
G 05Annual Report 2018
Stakeholders Relationshipand Engagement
Wealth Generated
Contract Revenue
Sale of Goods
Other income
Total Wealth Generated
Wealth Distributed
Cost of sales
Employees remuneration and benetes
Operating expenses
Depreciation and Amortization
Finance cost
Government levies
Dividends to shareholders
Retained in business
Total Wealth Distributed
Rs. '000 %age
2,899,882
29,255,895
17,977
32,173,754
19,443,171 2,248,596
2,201,117
851,104
2,098,403
3,959,894
597,218
774,251
32,173,754
9.01%
90.93%
0.06%
100.00%
60.43%
6.99%
6.84%
2.65%
6.52%
12.31%
1.86%
2.41%
100.00%
2018
Rs. '000
19,871,468 2,134,990
2,818,627
881,926
1,540,949
4,519,058
1,617,465
1,690,789
35,075,272
2,841,124
32,221,709
12,439
35,075,272
%age
8.10%
91.86%
0.04%
100.00%
56.65%
6.09%
8.04%
2.51%
4.39%
12.88%
4.61%
4.82%
100.00%
2017
60.43%
6.99%
6.84%
2.65%
6.52%
12.31%
1.86%2.41%
Cost of sales
Operating expenses
Finance cost
Dividends to shareholders
Employees remuneration and benetes
Depreciation and Amortization
Government levies
Retained in business
Cost of sales
Operating expenses
Finance cost
Dividends to shareholders
Employees remuneration and benetes
Depreciation and Amortization
Government levies
Retained in business
56.65%
6.09%
8.04%
2.51%
4.39%
12.88%
4.61%4.82%
2018
2017
INVESTORS' SECTION ON PEL WEBSITE
Detailed Company information regarding financial highlights, investor information, share pattern/value and other requisite information specified under the relevant regulations, has been placed on the corporate website of the Company, www.pel.com.pk, which is updated on regular basis.
ISSUES RAISED AT LAST AGM
No issues were raised at the last AGM held on April 25, 2018.
ANALYST BRIEFINGS
The Company did not hold any analyst briefings during the year 2018, however, the Company plans to hold such briefings in future to share business updates that are relevant to the analysts’ coverage areas.
MINORITY SHAREHOLDERS
The minority shareholders of the Company are encouraged to attend general meetings of the Company. A statement by the order of the Board is annexed to the notice of general meetings in this regard.
“Engaging with stakeholders is crucial to PEL's success of any organization. Effective engagement helps us translate stakeholder needs into organizational goals and creates the basis of effective strategy development.”

G 06 Pak Elektron Limited G 07Annual Report 2018
Investor Relations
REGISTERED OFFICE
17-Aziz Avenue, Canal Bank, Gulberg-V, Lahore.Tel: 042-35718274-6Fax: 042-35762707
SHARE REGISTRAR
Corplink (Pvt) LimitedWings Arcade, 1-K Commercial Model Town, Lahore.Tel: 042-35839182, 35887262Fax: 042-35869037
LISTING ON STOCK EXCHANGES
Ordinary shares of Pak Elektron Limited are listed on Pakistan Stock Exchange Limited.
STOCK CODE / SYMBOL
The stock code / symbol for trading in ordinary shares of Pak Elektron Limited at Pakistan Stock Exchange Limited is PAEL.
STATUTORY COMPLIANCE
During the year, the Company has complied with all applicable provisions, filed all returns/forms and furnished all the relevant particulars as required under the repealed Companies Ordinance, 1984 (now Companies Act, 2017) and allied rules, the Securities and Exchange Commission of Pakistan Regulations and the listing requirements.
BOOK CLOSURE DATES
Share Transfer Books of the Company will remain closed from April 20, 2019 to April 26, 2019 (both days inclusive).
DIVIDEND
in view of the financial results for 2018, the Board of Directors did not proposed any dividend for the year 2018.
DIVIDEND REMITTANCE
Ordinary dividend declared and approved at the Annual General Meeting will be paid within the statutory time limit of 30 days.
(i) For shares held in physical form: to shareholders whose names appear in the Register of Members of the Company after entertaining all requests for transfer of shares lodged with the Company on or before the book closure date.
(ii) For shares held in electronic from: to shareholders whose names appear in the statement of beneficial ownership furnished by CDC as at end of business on book closure date.
WITHHOLDING OF TAX &ZAKAT ON ORDINARYDIVIDEND
As per the provisions of the Income Tax Ordinance, 2001, income tax is deductible at source by the Company at the rate of 15% (filer) and 20% (non-filer) wherever applicable.
Zakat is also deductible at source form the ordinary dividend at the rate of 2.5% of the face value of the share, other than corporate holders or individuals who have provided an undertaking for non-deduction.
DIVIDEND WARRANTS
Cash dividends are paid through dividend warrants addressed to the ordinary shareholders whose names appear in the Register of Shareholders at the date of book closure.
GENERAL MEETINGS & VOTING RIGHTS
Pursuant to section 132 of the Companies Act, 2017) PEL holds a General Meeting of shareholders at least once a year. Every shareholder has a right to attend the General Meeting. The notice of such meeting is sent to all the shareholders at least 21 days before the meeting and also advertised in at least one English and one Urdu newspaper having circulation in Karachi, Lahore and Islamabad.
Shareholders having holding of at least 10% of voting rights may also apply to the Board of Directors to call for meeting of shareholders, and if the Board does not take action on such application within 21 days, the shareholders may themselves call the meeting.
All ordinary shares issued by the Company carry equal voting rights, Generally, matters at the general meetings are decided by a show of hands in the first instance. Voting by show of hands operates on the principle of “One Member-One Vote”. If majority of shareholders raise their hands in favor of a particular resolution, it is taken as passed, unless a poll is demanded.
Since the fundamental voting principle in the Company is “One Share-One Vote”, voting takes place by a poll, if demanded. On a poll being taken, the decision arrived by poll is final, overruling any decision taken on a show of hands.
WEB PRESENCE
Updated information regarding the Company can be accessed at its website, www.pel.com.pk The website contains the latest financial results of the Company together with the Company’s profile.
PROXIES
Pursuant to section 137 of the Companies Act, 2017) and according to the Memorandum and Articles of Association of the Company, every shareholder of the Company who is entitled to attend and vote at a general meeting of the Company can appoint another member as his/her proxy to attend and vote instead of him/her. Every notice calling a general meeting of the Company contains a statement that a shareholder entitled to appoint a proxy. The instrument appointing a proxy (duly signed by the shareholder appointing that proxy) should be deposited at the office of the Company not less than forty-eight hours before the meeting.
SERVICE STANDARDS
Listed below are various investor services and the maximum time limits set for their execution:
Transfer and transmission of shares
Issue of duplicate share certificates
Issue of duplicate dividend warrants
Issue of revalidated dividend warrants
Change of address
30 days after receipt
30 days after receipt
5 days after receipt
5 days after receipt
2 days after receipt
For requests receivedthrough post
30 days after receipt
30 days after receipt
5 days after receipt
5 days after receipt
1 day after receipt
For requests receivedover the counter
Well qualified personnel of the Shares Registrar have been entrusted with the responsibility of ensuring that services are rendered within the set time limits.
Fundamental knowledge and understanding of financial market is crucial for the general public and lack of financial literacy or capability makes them vulnerable to frauds. SECP recognizes the importance of investor education and therefore initiated this investor education program, called 'JamaPunji', an investor training program, to promote financial literacy in Pakistan.
www.jamapunji.pk
To date none of the investors or shareholders has filed any significant complaint against any service provided by the Company to its shareholders.
INVESTOR’S GRIEVANCES
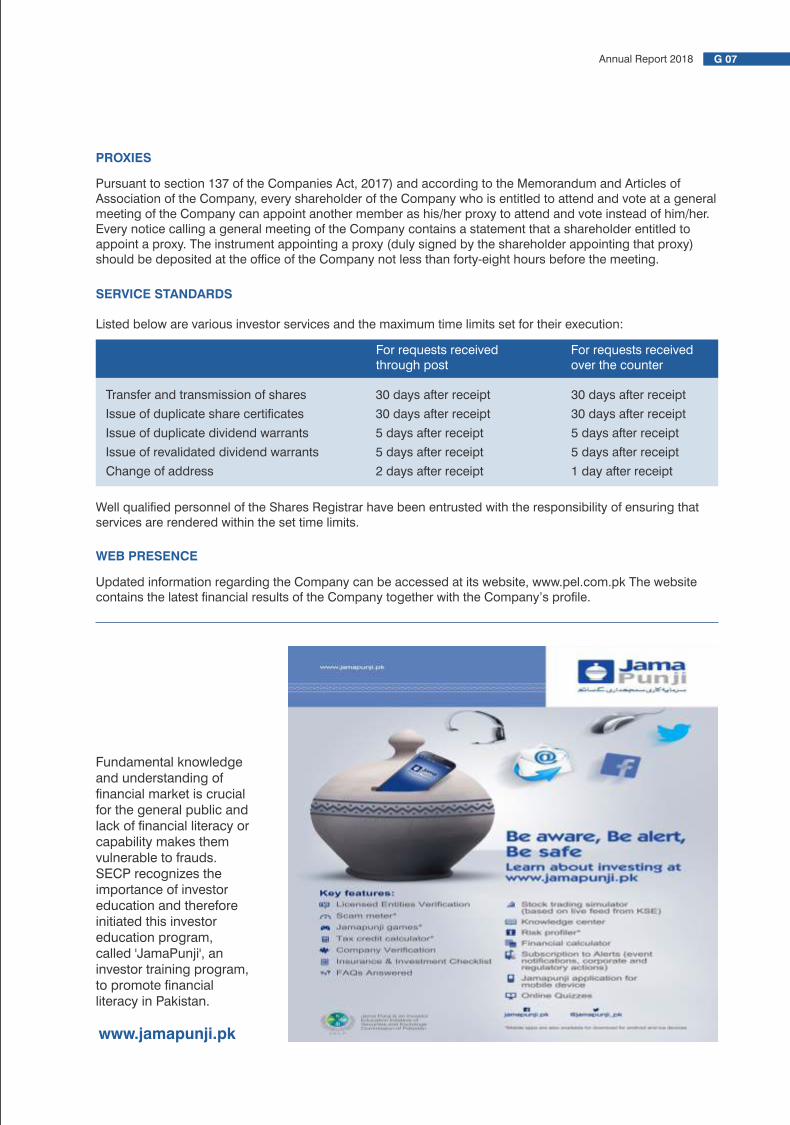

Investment Market Ratios
Approved Accounting Standards
Capital Structure Ratios
Gearing
Liquidity Ratios
Management Letter
Market Capitalization
Materiality
Protability Ratios
Approved accounting standards comprise of such IFRSS issued by the International Accounting Standards Board as notied under the provisions of the Companies Ordinance, 1984, provisions of and directives issued under the Companies Ordinance, 1984.
Capital Structure ratios provide an indication of the long term solvency of the Company and its cost of debt, in relation to equity and prots.
The level of a company’s debt related to its equity capital. It is a measure of a company’s nancial leverage and shows the extent to which its operations are funded by lenders versus shareholders.
Going Concern Assumption An accounting assumption that an entity will remain in business for the foreseeable future.
Investment ratios measure the capability of the Company to earn an adequate return for its shareholders. Market Ratios evaluate the current market price of a share versus an indicator of the company’s ability to generate prots.
Liquidity ratios determine the Company’s ability to meet its short-term nancial obligations.
Letter written by auditors to directors of the company, communicating material issues, concerns and suggestions noted during the audit.
The value of a company that is traded on the stock market, calculated by multiplying the total number of shares by the present share price.
Financial statement items are material if they could inuence the economic decisions of users.
Protability Ratios give and assessment of the Company’s ability to generate prots in relation to its sales, assets and equity.
DEFINITIONS
Term Definition
Glossary of Terms and Definitions
GLOSSARY OF TERMS
Term Description
Code of Corporate Governance
Chief Executive Ofcer
Chief Financial Ofcer
China Pakistan Economic Corridor
Consumer Price Index
Corporate Social Responsibility
Distribution Companies
Distribution Transformer
Engineering, Procurement and Construction
Earnings per share
High Voltage
International Financial Reporting Standards
International Standards Organization
Kilovolt
Multi National Companies
Mega Volt Amp
Pakistan Stock Exchange
Power Transformer
Water and Power Development Authority
Workers' Prot Participation Fund
Workers' Welfare Fund
CCG
CEO
CFO
CPEC
CPI
CSR
DISCOs
DTR
EPC
EPS
HV
IFRS
ISO
KV
MNCs
MVA
PSX
PTR
WAPDA
WPPF
WWF
DEFINITIONS
Activity/Turnover Ratios Activity / Turnover ratios are used to evaluate the operational efciency of the Company to convert inventory and receivables into cash against time taken to pay creditors, measured in terms of revenue and cost of sales.
Term Definition
G 08 Pak Elektron Limited G 09Annual Report 2018

This page has been left blank intentionally

HCorporate Social
Responsibilityand Sustainability

H 02 Pak Elektron Limited H 03Annual Report 2018
Corporate Social Responsibilityand Sustainability
At PEL we pride ourselves in aligning our business strategy to meet societal needs. We believe in giving something back to the society because we care. For us it’s about more than just aligning our activities with our stakeholde-r’s expectations whether it’s our clients, suppliers, the community, our employees and society as a whole. We work hard to minimize environmental impact to maximize social development.
Our appliances and power division has opened doors to improving lives through innovation, sustainability and adaptability. Through a broad range of community initiatives, charitable giving, foundation grants and volunteerism, we seek to create more value for our society to continue to bring joy in people’s lives.
FATIMA MEMORIAL HOSPITAL
A donation was made to Fatima Memorial Hospital for their neonatal intensive care unit. The donation will be spent towards the purchase of a high frequency ventilator that will provide care for all sick or premature infants born in the hospital.
EID CHARITY DRIVE
CSR INITIATIVES
According to the World Health Organization (WHO), Pakistan ranks at 122 out of 190 countries in terms of health care standards. There have been many inter-ventions made in health care but due to the poor standards of education, there is a lack of doctors and health experts all over which does not create a conducive atmosphere for hospitals to thrive in.
Amongst all those who suffer children are the ones who are affected the most. Children face multiple obstacles, including birth injuries and infectious diseases. Millions of children suffer from short- and long-term adverse consequences of illnesses, malnutrition and injuries that impact their well-being and options in life, including fewer educational opportunities and diminished future economic prospects.
This year we conducted a charity drive requesting employees to come forward and donate for this cause. We collected substantial amount of money and during the last week of Ramadan went to various children wards in government hospitals to distribute Eidi/monetary and give away goodie bags.

H 04 Pak Elektron Limited H 05Annual Report 2018
Corporate Social Responsibilityand Sustainability
FAISALABAD DEAF CRICKET ASSOCIATION
Deaf and hard of hearing people face many injustices around the world. Deaf sports are an important part of the social lives for the deaf and hard of hearing people. The rules of the game are virtually the same as in ordinary sports, but with certain modications. This year PEL sponsored a cricket match for the Faisalabad Deaf Cricket Association. The initiative breaks down barriers the deaf community faces when accessing sports, art and leisure opportunities.
In order to keep up with the expectations of the society, “PEL Cares”. We have a vast history of contributing for the social causes which help us become a good corporate citizen.
NUST NEED BLIND PROGRAM
“Giving is not just about making a donation, but it is about .”making a difference
In an effort to build an intelligent future of beloved Pakistan, PEL always seeks opportunities to take a step-forward in contribute for social good. This year, PEL gave for the higher education of 10 undergraduate engineering students at NUST. The total cost for this donation was PKR 2 Million. PEL believes that paying for this kind of CSR brings good for the society as a whole. The students who will avail this scholarship will at rst benet from our part and later on they will start playing their role.
NATIONAL CAUSE DONATIONS
PEL makes generous donations for national cause on a regular basis.

H 06 Pak Elektron Limited H 07Annual Report 2018
The graduates of a prestigious institution like NUST will surely throw in a great deal towards the engineering sector of country. This is also excellent because the one, who is taken care of, is most likely to take care of others when he gets to this kind of position.
“No one has ever become poor by Giving.”
SOS CHILDREN'S VILLAGE MUZAFFARABAD
The orphan children of our society are enormously neglected. PEL recognizes the problem and always contributes keenly so that these children who are the future of Pakistan can be calmed. This year, PEL donated 15 Refrigerators amounting to PKR 675,000 to SOS Children's Village Muzaffarabad. PEL aims to build a society where less-privileged people don't nd themselves deprived of such necessities of life.
“Nothing that you have not
given away will ever be really
yours.”
GOVT. TRAINING COLLEGE FOR THE TEACHERS FOR DEAF
Special Children are beautiful assets of Pakistan and PEL understands their signicance and necessities. These children merely need love and affection from society. Bringing a smile on these beautiful faces is the best thing one can do. PEL also loves them and to express it, PEL donated TWO Water Dispensers to the Govt. Training College for the Teachers of Deaf. This effort was made to encourage those teachers who are playing vital role to make these children a better citizen.
SOS Children's Village Muzaffarabad
SUSTAINABILITY HIGHLIGHTS
Corporate Social Responsibilityand Sustainability
The highlights of the Company’s performance, policies, initiatives and plans in place relating to various aspects of sustainability are as follows:
ECONOMIC
The Company is cognizant of both private and social economic impact on its stakeholders and includes:
a.) Economic Performance
PEL is committed to providing persistent growth and steady value for all its stakeholders. This growth and value can be quantied and evaluated accurately through the audited nancial statements of the Company and the statement of value addition and its distribution (which is reported on page G-05).
b.) Market Presence
PEL not only provides employment but also various business opportunities in the market. The Company encourages hiring staff members at all levels from local community. The Company also ensures that business opportunities are rst made available to local transporters, contractors and vendors.
c.) Indirect Economic Impact
Growth and development of the Company contributes towards the growth of our beloved country Pakistan. Wherever possible, the Company contributes towards development of infrastructure and other facilities of the country in general and of our premises vicinity in particular.
ENVIRONMENTAL
The highlights of the Company’s performance, policies, initiatives and plans in place relating to certain aspects of this dimension of sustainability are as follows:
a.) Clean Drinking Water
PEL launched “Pel Se Zindagi”, an on ground activation that resulted in the installation of refrigerator like water dispensers that provided cool and clean
drinking water to the underprivileged community of Lahore. These water dispensers were placed in parks where people rest under the cool shade of the tree, at railway stations, near government hospitals and in marketplaces where most people travel back and forth by foot.
A noble and encouraging initiative, “Pel Se Zindagi” not only involved in spreading awareness about the importance of clean water but also instilled a desire among people to perform their own acts of kindness. People were inspired to take a step forward towards making a difference. They were encouraged to post their stories or accounts of their good deeds in order build a united community based on charity.
a.) Energy Conservation
PEL recognizes the importance of efficient use of limited energy resources and responsible use of energy resources remains a priority at PEL.
PEL has also developed an Energy Information System to help identity energy losses at PEL's production units and those associated with PEL's products. The system helps addressing abnormalities in the system and enables PEL to dened benchmarks for energy consumption per product thereby improving energy consumption at PEL's production units.
b.) Mitigating the Adverse Impact of Industrial Efuents
There are no industrial efuents at PEL's plants that might adversely impact the environment.
SOCIAL
The Company has signicant impact on the social systems in which its operates. The highlights of the Company’s performance, policies, initiatives and plans in place relating to certain aspects of this dimension of sustainability are as follows:
H 08 Pak Elektron Limited H 09Annual Report 2018
Corporate Social Responsibilityand Sustainabilitya.) Industrial Relations
PEL recognizes importance of good and positive relations with its employees and has put in place an effective system to ensure that a mutual beneficial relationship is maintained. Salient features of this system include providing conducing working environment, appropriate pay packages, rewards for performance with discrimination and special incentives for maintenance of industrial peace.
b.) Community Investment & Welfare
Keeping in perspective the need for motivational packages, PEL has introduced an innovative form of compensation to its employees. On an annual basis, Lucky Draw is held for all the employees of PEL who have been with the company for a minimum duration of five years.
Ten lucky individuals are selected to perform the noble cause of Hajj and their entire expenses in this regard are borne by PEL.
c.) Product Quality Assurance
PEL continues to be a quality conscious manufacturer with quality checks at incoming, in-process and final stages.
The Company has implemented an extensive and effective quality assurance system for its products, as detailed on page E-32.
d.) Employment of Special Persons
PEL considers it a social and moral responsibility to accommodate special persons and ensure that there are ample opportunities for their hiring and retention.
Special efforts are made for training and development of special persons to enable them to compete with others and to provide equal incentives for career growth and development without discrimination.
e.) Consumer Protection Measures
The requirement for protection of consumer rights and interests is greatly valued at PEL. For this, an effective system has been put in place to ensure the consumer interests are safeguarded.
Our extensive dealer network ensures that our products are available throughout the country. Well trained officers employed at established and strategically located regional offices handle customers complaints and simultaneously provide guidance to consumers. Customers are provided business related information regularly so that they remain abreast with latest products. Regular customer satisfaction surveys are conducted to gain customer feedback.
f.) Occupational Health and Safety
Employee safety is an integral part of PEL’s agenda. PEL heavily relies on Quality and Safety policy, strict and stringent safety policies have been put in place for workers to avoid the risk of an accident and ensure maximum safety of employees. PEL over the year has implemented initiatives to promote awareness, training and communication targeting all employees. 46 technical and non technical trainings were conducted companywide for workers.
Three water ltration plants are installed in the company in compliance with World Health Organization (WHO) & National Environmental Quality Standards to provide clean drinking water to its employees.
g.) Rural Development Programs
PEL has undertaken establishing a girls' school near Luliani in coordination with a charitable trust by the name of Care Foundation. This will be followed by establishing more schools in other rural areas of the country.
At PEL, we inspire to take a step
forward towards making a
difference.

h.) Business Ethics and Anti-corruption Measures
PEL’s Legal & Compliance Department organized a Code of Conduct brieng session.An awareness drive was set up. The session was specially conducted for the Department Heads and the General Managers; primary goal was to increase the participants’ understanding of the company’s Code of Conduct and to gain their valuable feedback. Emphasis was on the importance of the Code and its implementation as an imperative measure for the legal and compliance procedures to be commensurate with the company’s growth. It is the policy of PEL to comply with all applicable laws, regulations and corporate ethical standards in the conduct of its business.
i.) Equal Opportunity and Non-Discrimination
PEL takes pride in being an equal opportunity employer. The Company aims to create a working environment in which every individual is able to effectively and efciently use their skills and abilities, free from discrimination or harassment, and in which all decisions, rewards and/or promotions are objectively based on merit. We do not tolerate any form of discrimination, harassment or bullying at the workplace.
j.) Child Labor
The Company strictly adheres to a prohibition policy on any form of child labor. No child has ever been employed by the Company and the same policy shall continue in future.
k.) Forced or Compulsory Labor
PEL does not engage in forced or compulsory work practices and maintains a free working environment.
l.) Grievance Mechanism
The Company is committed to provide every opportunity to every employee for re-dress of any valid grievances arising from work related matters. The management does not discriminate against any employee who elects to use the grievance procedure. The purpose of this policy is to encourage healthy relationship between employees in order to ensure smooth running of the business.
Corporate Social Responsibilityand Sustainability
H 10 Pak Elektron Limited

I ConsolidatedFinancial Statements
Independent Auditor’s ReportTo the members of PAK ELEKTRON LIMITEDReport on the Audit of the Consolidated Financial Statements
Opinion
We have audited the annexed consolidated nancial statements of PAK ELEKTRON LIMITED and its subsidiary ['the Group'], which comprise the consolidated statement of nancial position as at December 31, 2018, the consolidated statement of prot or loss, the consolidated statement of comprehensive income, the consolidated statement of changes in equity, the consolidated statement of cash ows for the year then ended, and notes to the consolidated nancial statements, including a summary of signicant accounting policies and other explanatory information.
In our opinion, consolidated nancial statements give a true and fair view of the consolidated nancial position of the Group as at December 31, 2018, and of its consolidated nancial performance and its consolidated cash ows for the year then ended in with the accounting and reporting standards as applicable in Pakistan.
Basis for Opinion
We conducted our audit in accordance with International Standards on Auditing ['ISAs'] as applicable in Pakistan. Our responsibilities under those standards are further described in the Auditor's Responsibilities for the Audit of the Consolidated Financial Statements section of our report. We are independent of the Group in accordance with the International Ethics Standards Board for Accountants' Code of Ethics for Professional Accountants as adopted by the Institute of Chartered Accountants of Pakistan ['the Code'] and we have fullled our other ethical responsibilities in accordance with the Code. We believe that the audit evidence we have obtained is sufcient and appropriate to provide a basis for our opinion.
Key Audit Matters
Key audit matters are those matters that, in our professional judgment, were of most signicance in our audit of the consolidated nancial statements of the current period. These matters were addressed in the context of our audit of the consolidated nancial statements as a whole, and in forming our opinion thereon, and we do not provide a separate opinion on these matters.
1. Preparation of consolidated nancial statements under Companies Act, 2017
As disclosed in note 3 to the annexed consolidated nancial statements, the Companies Act, 2017 ['the Act'] became applicable for the rst time for the preparation of the Group's annual nancial statements for the year ended December 31, 2018.
The Act forms an integral part of the statutory nancial reporting framework as applicable to the Group and amongst
Key audit matter How our audit addressed the key audit matter
We assessed the procedures applied by the management for identication of the changes required in the nancial statements due to the application of the Act. We considered the adequacy and appropriateness of the additional disclosures and changes to the previous disclosures based on the new requirements.
We also evaluated the sources of information used by the management for the preparation of these disclosures and the internal consistency of such disclosures with other elements of the consolidated nancial statements.
Rahman Sarfaraz Rahim Iqbal RafiqChartered Accountants
72-A, Faisal Town,Lahore - 54770, Pakistan.
T:F:E:W:
+92 42 35160430 - 32+92 42 [email protected]
Member of Russell Bedford International - a global network of independent professional services firms
In respect of the change in accounting policy for the accounting and presentation of surplus on revaluation of property, plant and equipment, as referred to in note 5 to the consolidated nancial statements, we assessed the accounting implications in accordance with the accounting and reporting standards as applicable in Pakistan and evaluated its application in the context of the Group.
others, prescribes the nature and content of disclosures in relation to various elements of the consolidated nancial statements.
In the case of the Group, a summary of key additional disclosures and changes to the existing disclosures have been stated in note 3 to the annexed consolidated nancial statements.
Further, the Group has also changed its a c c o u n t i n g p o l i c y r e l a t i n g t o presentation and measurement of surplus on revaluation of property, plant and equipment as a consequence of the application of the Act with retrospective effect. The impact of the said change in accounting policy has been disclosed in n o t e 5 t o t h e a c c o m p a n y i n g consolidated nancial statements.
The above changes and enhancements in the consolidated nancial statements are considered important and a key audit matter because of the volume and signicance of the changes in the consolidated nancial statements resulting from transition to the new reporting requirements under the Act.
Key audit matter How our audit addressed the key audit matter
2. Inventory valuation
Stock in trade amounts to Rs 10,786 million as at the reporting date. The valuation of stock in trade at cost has different components, which includes judgment in relation to the allocation of labour and overheads which are incurred in bringing the stock to its present locat ion and condi t ion. Judgment has also been applied by management in determining the Net Realizable Value ['NRV'] of stock in trade.
The estimates and judgments applied by management are inuenced by the amount of direct costs incurred historically, expectations of repeat orders to utilize the stock in trade, sales contract in hand and historically realized sales prices.
The signicance of the balance coupled with the judgment involved has resulted
To address the valuation of stock in trade, we assessed historical costs recorded in the inventory valuation; testing on a sample basis with purchase invoices. We tested the reasonability of assumptions applied by the management in allocating direct labour and direct overhead costs to inventories.
We also assessed management's determination of the net realizable value of inventories by performing tests on the sales prices secured by the Group for similar or comparable items of inventories.
I 02 Pak Elektron Limited I 03Annual Report 2018

Key audit matter How our audit addressed the key audit matter
in the valuation of inventories being identied as a key audit matter
The disclosures in relation to inventories are included in note 27.
Key audit matter How our audit addressed the key audit matter
4. Contract accounting and revenue recognition
The Group's business involves entering into long term contracts with customers to provide a construction services with a signicant proportion of the Group's revenues and prots derived such contracts.
Due to the contracting nature of the business, revenue recognition involves a signicant degree of judgment, as referred to in note 2.4.8 to the consolidated nancial statements, with estimates being made to:
• assess the total contract cost;
• assess the stage of completion of the contract;
• forecast the prot margin after taking consideration of estimated future costs to complete the projects in progress; and
We read the relevant clauses with in all key contracts and discussed each with management to obtain a full understanding of the specic terms and risks, which informed our consideration of whether revenue for these contracts was appropriately recognized.
We evaluated and tested the operating effectiveness of internal controls over the accuracy and timing of revenue recognized, including controls relating to estimating total costs, stage of completion of contracts, prot margin and evaluating contract protability.
• For the more signicant and judgemental contracts, in performing the following additional testing, we:
• obtained an understanding of the performance and status of the contracts in progress;
• discussed and understood management's estimates for total contract costs and forecast costs to complete, including taking into account the historical accuracy of such estimates; and
3. Tax contingencies
As disclosed in note 20 to the annexed consolidated nancial statements, various tax matters are pending adjudication at various levels with the taxation authorities and other legal forums. Such contingencies require the management to make judgments and estimates in relation to the interpretation of tax laws and regulations and the recognition and measurement of any provisions that may be required against such contingencies. Due to inherent uncertainties and the time period such matters may take to resolve, the m a n a g e m e n t ' s j u d g m e n t s a n d e s t i m a t e s i n r e l a t i o n t o s u c h contingencies may be complex and can signicantly impact the consolidated nancial statements. For such reasons we have considered tax contingencies as a key audit matter.
Our key audit procedures in this area included, amongst others, a review of the correspondence of the Group with the relevant tax authorities and tax advisors including judgments or orders passed by the competent authorities.
We also obtained and reviewed conrmations from the Group's external tax advisor for their views on the status of each case and an overall opinion on the open tax position of the Group.
We involved internal tax experts to assess and review the management's conclusions on contingent tax matters and evaluated whether adequate disclosures have been made in note 20 to the annexed consolidated nancial statements.
• appropriately provide for loss making contracts.
There is a range of acceptable outcomes resulting from these judgments that could lead to different prot and revenue reported in the consolidated nancial statements.
• compared management's position on the recognition of any cost and revenue, to the actual costs incurred and current progress of the contract.
5. Revenue recognition
As referred to in note 6.16, revenue is recognized when the risks and rewards of the underlying products have been transferred to the customer. The Group f o c u s e s o n r e v e n u e a s a k e y performance measure which could create an incentive for fraudulently overstated revenue by recognizing revenue before the risks and rewards have been transferred.
Our audit procedures included considering the appropriateness of the Group's revenue recognition accounting policies.
In response to the risk of fraud, we tested the effectiveness of the Group's controls over the timing of revenue recognition.
We assessed sales transactions taking place at either side of the year end as well as credit notes, if any, issued after the year end date to assess whether that revenue was recognised in the correct period.
We performed testing over journals posted to revenue, near the end of the reporting period to identify unusual or irregular items.
We also considered the adequacy of the Group's disclosures in respect of revenue
Information other than the Consolidated Financial Statements and Auditor's Report Thereon
Management is responsible for the other information. The other information comprises the information included in the annual report, but does not include the consolidated nancial statements and our auditor's report thereon.
Our opinion on the consolidated nancial statements does not cover the other information and we do not express any form of assurance conclusion thereon.
In connection with our audit of the consolidated nancial statements, our responsibility is to read the other information and, in doing so, consider whether the other information is materially inconsistent with the consolidated nancial statements or our knowledge obtained in the audit or otherwise appears to be materially misstated.
If, based on the work we have performed, we conclude that there is a material misstatement of this other information, we are required to report that fact. We have nothing to report in this regard.
Responsibilities of Management and Board of Directors for the Consolidated Financial Statements
Management is responsible for the preparation and fair presentation of the consolidated nancial statements in accordance with the accounting and reporting standards as applicable in Pakistan and the requirements of Companies Act, 2017(XIX of 2017) and for such internal control as management determines is necessary to enable the preparation of consolidated nancial statements that are free from material misstatement, whether due to fraud or error.
In preparing the consolidated nancial statements, management is responsible for assessing the Group's ability to continue as a going concern, disclosing, as applicable, matters related to going concern and using the going concern basis of accounting unless management either intends to liquidate the Group or to cease operations, or has no realistic alternative but to do so.
I 04 Pak Elektron Limited I 05Annual Report 2018

Key audit matter How our audit addressed the key audit matter
in the valuation of inventories being identied as a key audit matter
The disclosures in relation to inventories are included in note 27.
Key audit matter How our audit addressed the key audit matter
4. Contract accounting and revenue recognition
The Group's business involves entering into long term contracts with customers to provide a construction services with a signicant proportion of the Group's revenues and prots derived such contracts.
Due to the contracting nature of the business, revenue recognition involves a signicant degree of judgment, as referred to in note 2.4.8 to the consolidated nancial statements, with estimates being made to:
• assess the total contract cost;
• assess the stage of completion of the contract;
• forecast the prot margin after taking consideration of estimated future costs to complete the projects in progress; and
We read the relevant clauses with in all key contracts and discussed each with management to obtain a full understanding of the specic terms and risks, which informed our consideration of whether revenue for these contracts was appropriately recognized.
We evaluated and tested the operating effectiveness of internal controls over the accuracy and timing of revenue recognized, including controls relating to estimating total costs, stage of completion of contracts, prot margin and evaluating contract protability.
• For the more signicant and judgemental contracts, in performing the following additional testing, we:
• obtained an understanding of the performance and status of the contracts in progress;
• discussed and understood management's estimates for total contract costs and forecast costs to complete, including taking into account the historical accuracy of such estimates; and
3. Tax contingencies
As disclosed in note 20 to the annexed consolidated nancial statements, various tax matters are pending adjudication at various levels with the taxation authorities and other legal forums. Such contingencies require the management to make judgments and estimates in relation to the interpretation of tax laws and regulations and the recognition and measurement of any provisions that may be required against such contingencies. Due to inherent uncertainties and the time period such matters may take to resolve, the m a n a g e m e n t ' s j u d g m e n t s a n d e s t i m a t e s i n r e l a t i o n t o s u c h contingencies may be complex and can signicantly impact the consolidated nancial statements. For such reasons we have considered tax contingencies as a key audit matter.
Our key audit procedures in this area included, amongst others, a review of the correspondence of the Group with the relevant tax authorities and tax advisors including judgments or orders passed by the competent authorities.
We also obtained and reviewed conrmations from the Group's external tax advisor for their views on the status of each case and an overall opinion on the open tax position of the Group.
We involved internal tax experts to assess and review the management's conclusions on contingent tax matters and evaluated whether adequate disclosures have been made in note 20 to the annexed consolidated nancial statements.
• appropriately provide for loss making contracts.
There is a range of acceptable outcomes resulting from these judgments that could lead to different prot and revenue reported in the consolidated nancial statements.
• compared management's position on the recognition of any cost and revenue, to the actual costs incurred and current progress of the contract.
5. Revenue recognition
As referred to in note 6.16, revenue is recognized when the risks and rewards of the underlying products have been transferred to the customer. The Group f o c u s e s o n r e v e n u e a s a k e y performance measure which could create an incentive for fraudulently overstated revenue by recognizing revenue before the risks and rewards have been transferred.
Our audit procedures included considering the appropriateness of the Group's revenue recognition accounting policies.
In response to the risk of fraud, we tested the effectiveness of the Group's controls over the timing of revenue recognition.
We assessed sales transactions taking place at either side of the year end as well as credit notes, if any, issued after the year end date to assess whether that revenue was recognised in the correct period.
We performed testing over journals posted to revenue, near the end of the reporting period to identify unusual or irregular items.
We also considered the adequacy of the Group's disclosures in respect of revenue
Information other than the Consolidated Financial Statements and Auditor's Report Thereon
Management is responsible for the other information. The other information comprises the information included in the annual report, but does not include the consolidated nancial statements and our auditor's report thereon.
Our opinion on the consolidated nancial statements does not cover the other information and we do not express any form of assurance conclusion thereon.
In connection with our audit of the consolidated nancial statements, our responsibility is to read the other information and, in doing so, consider whether the other information is materially inconsistent with the consolidated nancial statements or our knowledge obtained in the audit or otherwise appears to be materially misstated.
If, based on the work we have performed, we conclude that there is a material misstatement of this other information, we are required to report that fact. We have nothing to report in this regard.
Responsibilities of Management and Board of Directors for the Consolidated Financial Statements
Management is responsible for the preparation and fair presentation of the consolidated nancial statements in accordance with the accounting and reporting standards as applicable in Pakistan and the requirements of Companies Act, 2017(XIX of 2017) and for such internal control as management determines is necessary to enable the preparation of consolidated nancial statements that are free from material misstatement, whether due to fraud or error.
In preparing the consolidated nancial statements, management is responsible for assessing the Group's ability to continue as a going concern, disclosing, as applicable, matters related to going concern and using the going concern basis of accounting unless management either intends to liquidate the Group or to cease operations, or has no realistic alternative but to do so.
I 04 Pak Elektron Limited I 05Annual Report 2018
The engagement partner on the audit resulting in this independent auditor's report is ZUBAIR IRFAN MALIK.
RAHMAN SARFARAZ RAHIM IQBAL RAFIQ
Chartered Accountants
Lahore: April 04, 2019
The Board of directors is responsible for overseeing the Group's nancial reporting process.
Auditor's Responsibilities for the Audit of the Consolidated Financial Statements
Our objectives are to obtain reasonable assurance about whether the consolidated nancial statements as a whole are free from material misstatement, whether due to fraud or error, and to issue an auditor's report that includes our opinion. Reasonable assurance is a high level of assurance, but is not a guarantee that an audit conducted in accordance with ISAs as applicable in Pakistan will always detect a material misstatement when it exists. Misstatements can arise from fraud or error and are considered material if, individually or in the aggregate, they could reasonably be expected to inuence the economic decisions of user taken on the basis of these consolidated nancial statements.
As part of an audit in accordance with ISAs as applicable in Pakistan, we exercise professional judgment and maintain professional skepticism throughout the audit. We also:
• Identify and assess the risks of material misstatement of the consolidated nancial statements, whether due to fraud or error, design and perform audit procedures responsive to those risks, and obtain audit evidence that is sufcient and appropriate to provide a basis for our opinion. The risk of not detecting a material misstatement resulting from fraud is higher than for one resulting from error, as fraud may involve collusion, forgery, intentional omissions, misrepresentations, or the override of internal control.
• Obtain an understanding of internal control relevant to the audit in order to design audit procedures that are appropriate in the circumstances, but not for the purpose of expressing an opinion on the effectiveness of the Group's internal control.
• Evaluate the appropriateness of accounting policies used and the reasonableness of accounting estimates and related disclosures made by management.
• Conclude on the appropriateness of management's use of the going concern basis of accounting and, based on the audit evidence obtained, whether a material uncertainty exists related to events or conditions that may cast signicant doubt on the Group's ability to continue as a going concern. If we conclude that a material uncertainty exists, we are required to draw attention in our auditor's report to the related disclosures in the consolidated nancial statements or, if such disclosures are inadequate, to modify our opinion. Our conclusions are based on the audit evidence obtained up to the date of our auditor's report. However, future events or conditions may cause the Group to cease to continue as a going concern.
• Evaluate the overall presentation, structure and content of the consolidated nancial statements, including the disclosures, and whether the consolidated nancial statements represent the underlying transactions and events in a manner that achieves fair presentation.
• Obtain sufcient appropriate audit evidence regarding the nancial information of the entities or business activities within the Group to express an opinion on the consolidated nancial statements. We are responsible for the direction, supervision and performance of the group audit. We remain solely responsible for our audit opinion.
We communicate with the board of directors regarding, among other matters, the planned scope and timing of the audit and signicant audit ndings, including any signicant deciencies in internal control that we identify during our audit.
We also provide the board of directors with a statement that we have complied with relevant ethical requirements regarding independence, and to communicate with them all relationships and other matters that may reasonably be thought to bear on our independence, and where applicable, related safeguards.
From the matters communicated with the board of directors, we determine those matters that were of most signicance in the audit of the consolidated nancial statements of the current period and are therefore the key audit matters. We describe these matters in our auditor's report unless law or regulation precludes public disclosure about the matter or when, in extremely rare circumstances, we determine that a matter should not be communicated in our report because the adverse consequences of doing so would reasonably be expected to outweigh the public interest benets of such communication.
I 06 Pak Elektron Limited I 07Annual Report 2018
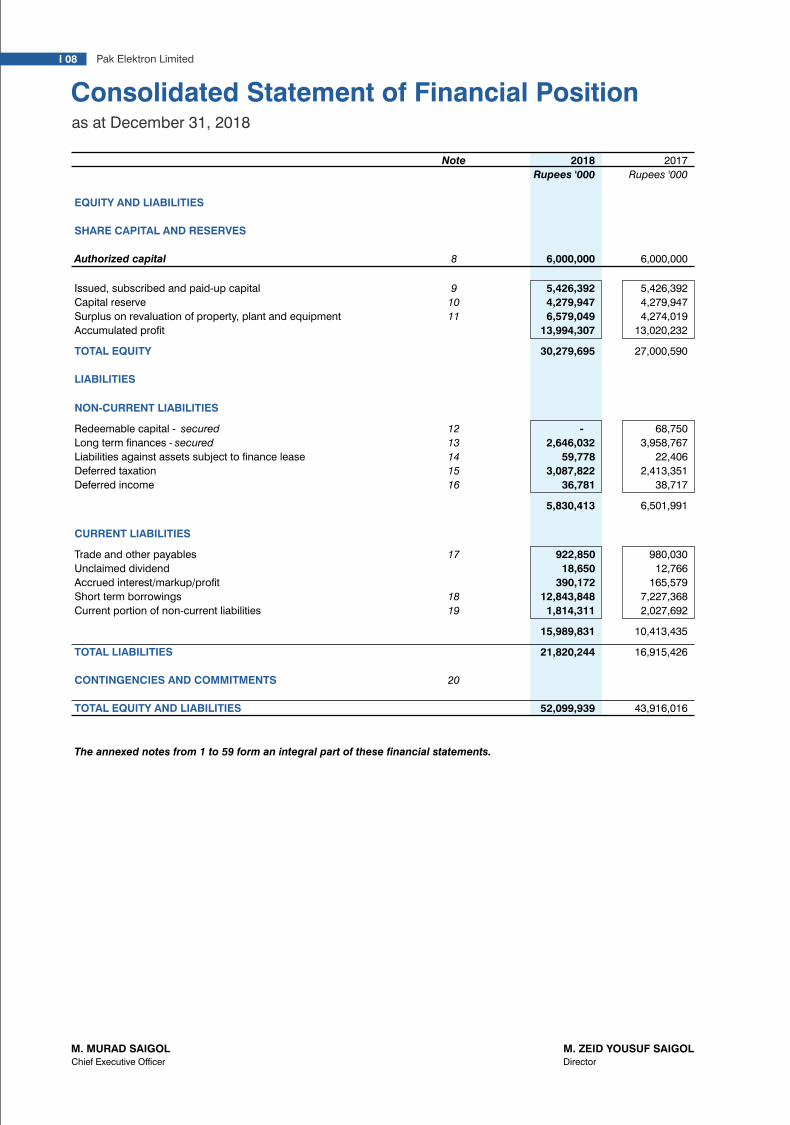
SYED MANZAR HASSANChief Financial Officer
as at December 31, 2018
M. MURAD SAIGOLChief Executive Officer
M. ZEID YOUSUF SAIGOLDirector
Consolidated Statement of Financial Position
EQUITY AND LIABILITIES
SHARE CAPITAL AND RESERVES
Authorized capital
Issued, subscribed and paid-up capital
Capital reserve
Surplus on revaluation of property, plant and equipment
Accumulated prot
TOTAL EQUITY
LIABILITIES
NON-CURRENT LIABILITIES
Redeemable capital - secured
Long term nances - secured Liabilities against assets subject to nance lease Deferred taxation
Deferred income
CURRENT LIABILITIES
Trade and other payables
Unclaimed dividend
Accrued interest/markup/prot
Short term borrowings
Current portion of non-current liabilities
TOTAL LIABILITIES
CONTINGENCIES AND COMMITMENTS
TOTAL EQUITY AND LIABILITIES
The annexed notes from 1 to 59 form an integral part of these nancial statements.
Note 2018 2017
Rupees '000 Rupees '000
8 6,000,000
6,000,000
9 5,426,392
5,426,392
10 4,279,947
4,279,947
11 6,579,049
4,274,019
13,994,307 13,020,232
30,279,695
27,000,590
12 - 68,750
13 2,646,032 3,958,767
14 59,778 22,406
15 3,087,822
2,413,351
16 36,781
38,717
5,830,413
6,501,991
17 922,850
980,030
18,650
12,766
390,172
165,579
18 12,843,848
7,227,368
19 1,814,311 2,027,692
15,989,831 10,413,435
21,820,244 16,915,426
20
52,099,939 43,916,016
ASSETS
NON-CURRENT ASSETS
Property, plant and equipment
Intangible assets
Long term investments
Long term deposits
Long term advances
CURRENT ASSETS
Stores, spares and loose tools
Stock in trade
Trade debts
Due against construction work in progress - unsecured, considered good
Short term advances
Short term deposits and prepayments
Other receivables - unsecured, considered good
Short term investments
Advance income tax/Income tax refundable
Cash and bank balances
Note 2018 2017
Rupees '000 Rupees '000
21 21,957,015
17,405,713
22 313,352
315,525
23 6,985 8,848
24 365,957
371,936
25 1,109,094
796,843
23,752,403 18,898,865
26 859,145 746,408
27 10,786,157 8,149,848
28 10,181,739 10,727,632
29 1,535,735
1,393,185
30 1,039,505
845,826
31 1,105,179
1,109,232
360,962
311,090
32 22,071
21,824
33 1,985,785 1,227,912
34 471,258 484,194
28,347,536 25,017,151
TOTAL ASSETS
The annexed notes from 1 to 59 form an integral part of these nancial statements.
52,099,939 43,916,016
I 08 Pak Elektron Limited I 09Annual Report 2018
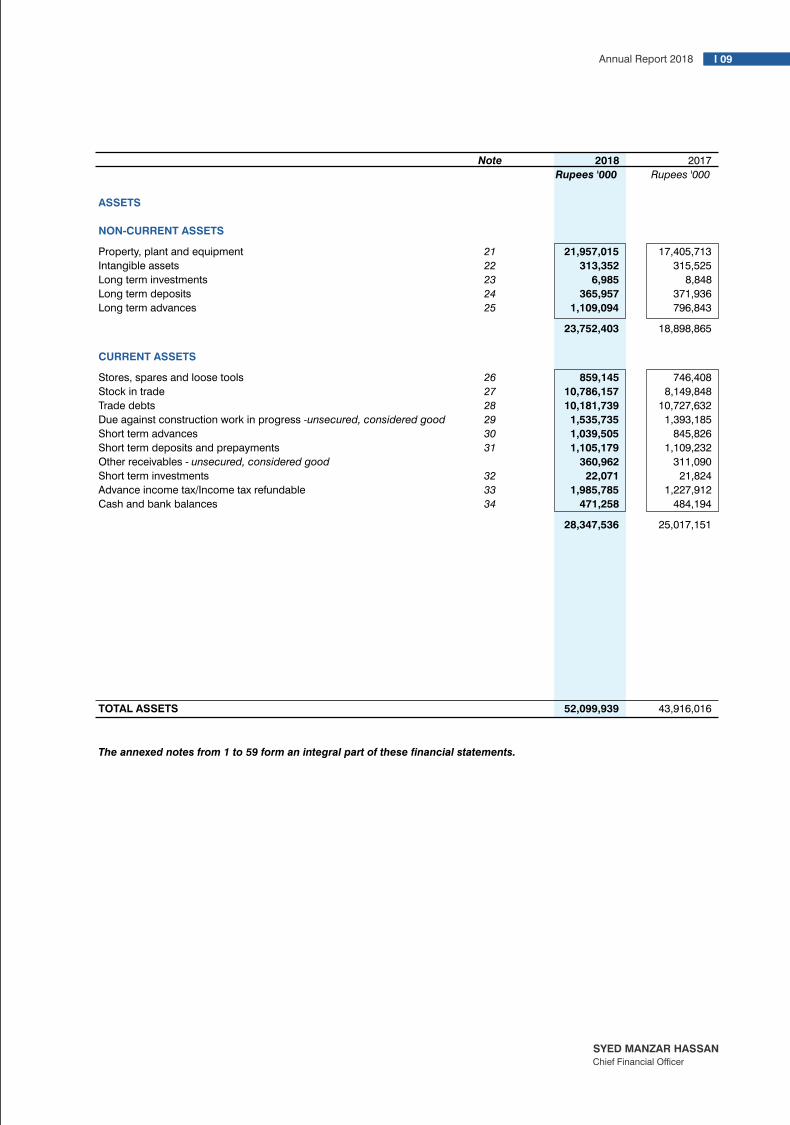

SYED MANZAR HASSANChief Financial Officer
M. MURAD SAIGOLChief Executive Officer
M. ZEID YOUSUF SAIGOLDirector
SYED MANZAR HASSANChief Financial Officer
M. MURAD SAIGOLChief Executive Officer
M. ZEID YOUSUF SAIGOLDirector
Consolidated Statement of Prot or LossFor the year ended December 31, 2018 For the year ended December 31, 2018
Revenue
Sales tax, excise duty and discounts
Net revenue
Cost of sales
Gross prot
Other income
Distribution cost
Administrative and general expenses
Other expenses
Operating prot
Finance cost
Share of loss of associate
Prot before taxation
Taxation
Prot after taxation
Earnings per share - basic and diluted
The annexed notes from 1 to 59 form an integral part of these nancial statements.
35 38,990,247 42,346,753
35 (10,544,936) (11,346,711)
28,445,311 31,000,042
36 (21,448,040)
(21,883,842)
6,997,271
9,116,200
37 17,977 17,793
38 (2,207,445)
(2,683,532)
39 (1,081,326)
(1,118,844)
40 (63,376)
(176,194)
(3,352,147) (3,978,570)
3,663,101
5,155,423
41 (2,103,343)
(1,546,604)
1,559,758 3,608,819
23.1 (2,456)
(5,354)
1,557,302
3,603,465
42 (185,833)
(295,211)
1,371,469 3,308,254
43 2.67 6.56
Rupees '000 Rupees '000 Note 2018 2017
Consolidated Statement of Comprehensive Income
Items that may be reclassied subsequently to prot or loss
Items that will not be reclassied to prot or loss
Surplus on revaluation of property, plant and
equipment recognised during the year
Deferred tax adjustment on surplus on revaluation of
property, plant and equipment recognised during the year
Deferred tax adjustment on surplus on revaluation of
property, plant and equipment attributable to changes in tax rates
Deferred tax adjustment on surplus on revaluation of
property, plant and equipment attributable to change
in proportion of income taxable under nal tax regime
Other comprehensive income/(loss)
Prot for the year
Total comprehensive income
The annexed notes from 1 to 59 form an integral part of these nancial statements.
Note 2018 2017
-
-
11 3,045,215
-
11 (672,091) -
11 52,268 -
11 79,462 (201,431)
2,504,854
(201,431)
2,504,854 (201,431)
1,371,469 3,308,254
3,876,323 3,106,823
Rupees '000 Rupees '000
I 10 Pak Elektron Limited I 11Annual Report 2018

SYED MANZAR HASSANChief Financial Officer
M. MURAD SAIGOLChief Executive Officer
M. ZEID YOUSUF SAIGOLDirector
SYED MANZAR HASSANChief Financial Officer
M. MURAD SAIGOLChief Executive Officer
M. ZEID YOUSUF SAIGOLDirector
Consolidated Statement of Prot or LossFor the year ended December 31, 2018 For the year ended December 31, 2018
Revenue
Sales tax, excise duty and discounts
Net revenue
Cost of sales
Gross prot
Other income
Distribution cost
Administrative and general expenses
Other expenses
Operating prot
Finance cost
Share of loss of associate
Prot before taxation
Taxation
Prot after taxation
Earnings per share - basic and diluted
The annexed notes from 1 to 59 form an integral part of these nancial statements.
35 38,990,247 42,346,753
35 (10,544,936) (11,346,711)
28,445,311 31,000,042
36 (21,448,040)
(21,883,842)
6,997,271
9,116,200
37 17,977 17,793
38 (2,207,445)
(2,683,532)
39 (1,081,326)
(1,118,844)
40 (63,376)
(176,194)
(3,352,147) (3,978,570)
3,663,101
5,155,423
41 (2,103,343)
(1,546,604)
1,559,758 3,608,819
23.1 (2,456)
(5,354)
1,557,302
3,603,465
42 (185,833)
(295,211)
1,371,469 3,308,254
43 2.67 6.56
Rupees '000 Rupees '000 Note 2018 2017
Consolidated Statement of Comprehensive Income
Items that may be reclassied subsequently to prot or loss
Items that will not be reclassied to prot or loss
Surplus on revaluation of property, plant and
equipment recognised during the year
Deferred tax adjustment on surplus on revaluation of
property, plant and equipment recognised during the year
Deferred tax adjustment on surplus on revaluation of
property, plant and equipment attributable to changes in tax rates
Deferred tax adjustment on surplus on revaluation of
property, plant and equipment attributable to change
in proportion of income taxable under nal tax regime
Other comprehensive income/(loss)
Prot for the year
Total comprehensive income
The annexed notes from 1 to 59 form an integral part of these nancial statements.
Note 2018 2017
-
-
11 3,045,215
-
11 (672,091) -
11 52,268 -
11 79,462 (201,431)
2,504,854
(201,431)
2,504,854 (201,431)
1,371,469 3,308,254
3,876,323 3,106,823
Rupees '000 Rupees '000
I 10 Pak Elektron Limited I 11Annual Report 2018

Consolidated Statement of Cash Flows
CASH FLOW FROM OPERATING ACTIVITIES
Cash generated from operations
Payments for:
Interest/markup on borrowings - Interest based arrangements
Interest/markup/prot on borrowings - Shariah compliant
Income tax
Net cash (used in)/generated from operating activities
CASH FLOW FROM INVESTING ACTIVITIES
Purchase of property, plant and equipment
Purchase of intangible assets
Proceeds from disposal of property, plant and equipment
Long term deposits made
Long term deposits refunded
Long term advances made
Net cash used in investing activities
CASH FLOW FROM FINANCING ACTIVITIES
Redemption of redeemable capital
Long term nances obtained
Repayment of long term nances
Proceeds from sale and lease back activities
Repayment of liabilities against assets subject to nance lease
Net increase in short term borrowings
Dividend paid
Net cash generated from nancing activities
NET DECREASE IN CASH AND CASH EQUIVALENTS
CASH AND CASH EQUIVALENTS AT THE BEGINNING OF THE YEAR
CASH AND CASH EQUIVALENTS AT THE END OF THE YEAR
The annexed notes from 1 to 59 form an integral part of these nancial statements.
Note 2018 2017
Rupees '000 Rupees '000
44 2,134,519 3,859,383
(1,217,343)
(1,099,531)
(196,675)
(43,601)
(809,596)
(867,489)
(89,095)
1,848,762
(2,369,292)
(1,843,969)
(8,030)
(3,919)
36,288 30,010
(21,394) (117,510)
27,373
11,927
(1,040,000)
(300,000)
(3,375,055)
(2,223,461)
(275,000)
(2,564,553)
226,013
3,809,701
(1,542,813)
(1,516,669)
109,944 15,100
(92,076)
(71,186)
5,616,480 2,245,706
(591,334)
(1,611,416)
3,451,214 306,683
(12,936) (68,016)
484,194 552,210
45 471,258 484,194
For the year ended December 31, 2018 For the year ended December 31, 2018
Consolidated Statement of Changes In Equity
Share capitalRevenue
reserves
Surplus on
Issued revaluation of
subscribed and Capital property, plant Accumulated
Note paid-up capital reserve and equipment prot
Rupees '000 Rupees '000 Rupees '000 Rupees '000
Balance as at January 01, 2017 5,426,392
4,279,947
4,668,386
11,134,131
Comprehensive income
Prot after taxation -
-
-
3,308,254
Other comprehensive loss -
-
(201,431)
-
Total comprehensive income -
-
(201,431)
3,308,254
Incremental depreciation 11 -
-
(192,936)
195,312
Transaction with owners
Final dividend on ordinary shares
@ Rs. 1.75 per share - - - (870,943)
Interim dividend on ordinary shares
@ Rs. 1.25 per share -
-
-
(746,522)
-
-
-
(1,617,465)
Balance as at December 31, 2017 5,426,392
4,279,947
4,274,019
13,020,232
Balance as at January 01, 2018 5,426,392
4,279,947
4,274,019
13,020,232
Comprehensive income
Prot after taxation -
-
-
1,371,469
Other comprehensive income - - 2,504,854 -
Total comprehensive income -
-
2,504,854
1,371,469
Incremental depreciation 11 -
-
(199,824)
199,824
Transaction with owners
Final dividend on ordinary shares
@ Rs. 1.20 per share - - - (597,218)
Balance as at December 31, 2018 5,426,392 4,279,947 6,579,049 13,994,307
The annexed notes from 1 to 59 form an integral part of these nancial statements.
Capital reserves
Total
equity
Rupees '000
25,508,856
3,308,254
(201,431)
3,106,823
2,376
(870,943)
(746,522)
(1,617,465)
27,000,590
27,000,590
1,371,469
2,504,854
3,876,323
-
(597,218)
30,279,695
I 12 Pak Elektron Limited I 13Annual Report 2018
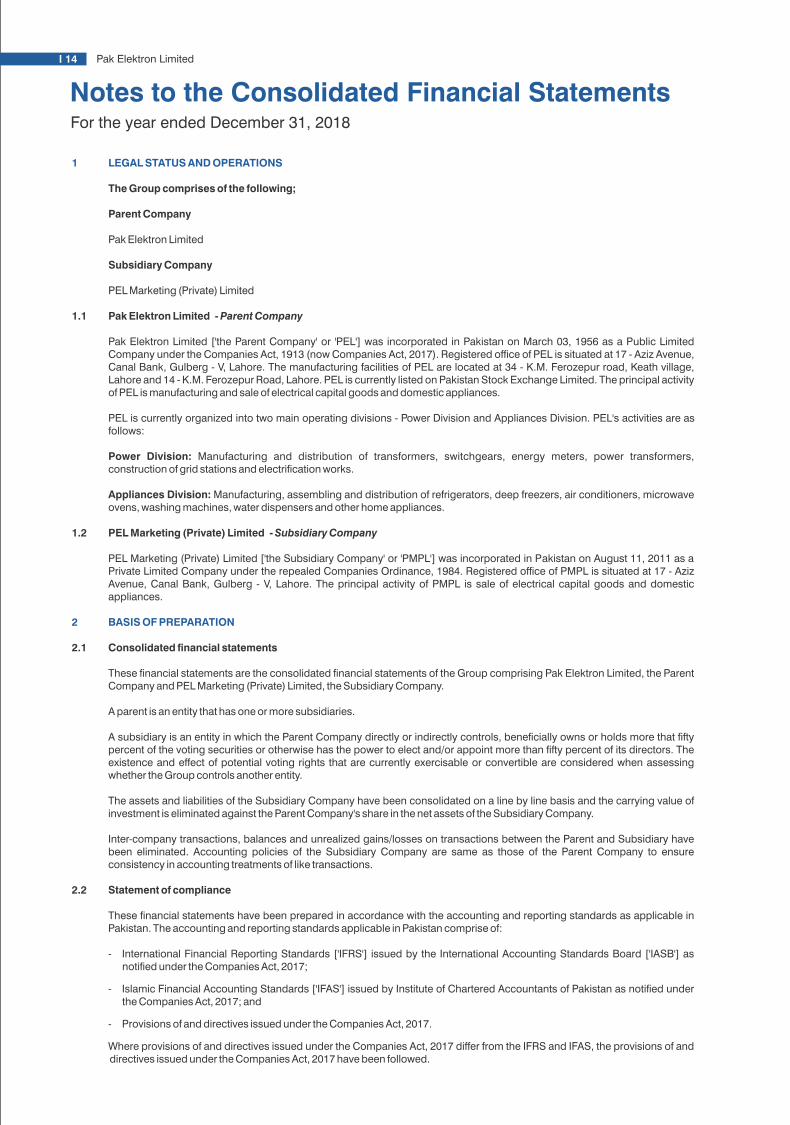
Notes to the Consolidated Financial Statements
1 LEGAL STATUS AND OPERATIONS
The Group comprises of the following;
Parent Company
Pak Elektron Limited
Subsidiary Company
PEL Marketing (Private) Limited
1.1 Pak Elektron Limited - Parent Company
Pak Elektron Limited ['the Parent Company' or 'PEL'] was incorporated in Pakistan on March 03, 1956 as a Public Limited Company under the Companies Act, 1913 (now Companies Act, 2017). Registered ofce of PEL is situated at 17 - Aziz Avenue, Canal Bank, Gulberg - V, Lahore. The manufacturing facilities of PEL are located at 34 - K.M. Ferozepur road, Keath village, Lahore and 14 - K.M. Ferozepur Road, Lahore. PEL is currently listed on Pakistan Stock Exchange Limited. The principal activity of PEL is manufacturing and sale of electrical capital goods and domestic appliances.
PEL is currently organized into two main operating divisions - Power Division and Appliances Division. PEL's activities are as follows:
Power Division: Manufacturing and distribution of transformers, switchgears, energy meters, power transformers, construction of grid stations and electrication works.
Appliances Division: Manufacturing, assembling and distribution of refrigerators, deep freezers, air conditioners, microwave ovens, washing machines, water dispensers and other home appliances.
1.2 PEL Marketing (Private) Limited - Subsidiary Company
PEL Marketing (Private) Limited ['the Subsidiary Company' or 'PMPL'] was incorporated in Pakistan on August 11, 2011 as a Private Limited Company under the repealed Companies Ordinance, 1984. Registered ofce of PMPL is situated at 17 - Aziz Avenue, Canal Bank, Gulberg - V, Lahore. The principal activity of PMPL is sale of electrical capital goods and domestic appliances.
2 BASIS OF PREPARATION
2.1 Consolidated nancial statements
These nancial statements are the consolidated nancial statements of the Group comprising Pak Elektron Limited, the Parent Company and PEL Marketing (Private) Limited, the Subsidiary Company.
A parent is an entity that has one or more subsidiaries.
A subsidiary is an entity in which the Parent Company directly or indirectly controls, benecially owns or holds more that fty percent of the voting securities or otherwise has the power to elect and/or appoint more than fty percent of its directors. The existence and effect of potential voting rights that are currently exercisable or convertible are considered when assessing whether the Group controls another entity.
The assets and liabilities of the Subsidiary Company have been consolidated on a line by line basis and the carrying value of investment is eliminated against the Parent Company's share in the net assets of the Subsidiary Company.
Inter-company transactions, balances and unrealized gains/losses on transactions between the Parent and Subsidiary have been eliminated. Accounting policies of the Subsidiary Company are same as those of the Parent Company to ensure consistency in accounting treatments of like transactions.
2.2 Statement of compliance
These nancial statements have been prepared in accordance with the accounting and reporting standards as applicable in Pakistan. The accounting and reporting standards applicable in Pakistan comprise of:
- International Financial Reporting Standards ['IFRS'] issued by the International Accounting Standards Board ['IASB'] as notied under the Companies Act, 2017;
- Islamic Financial Accounting Standards ['IFAS'] issued by Institute of Chartered Accountants of Pakistan as notied under the Companies Act, 2017; and
- Provisions of and directives issued under the Companies Act, 2017.
Where provisions of and directives issued under the Companies Act, 2017 differ from the IFRS and IFAS, the provisions of and directives issued under the Companies Act, 2017 have been followed.
2.3 Basis of measurement
These consolidated nancial statements have been prepared under the historical cost convention except for certain items of property, plant and equipment at revalued amounts, certain assets at recoverable amounts, monetary assets and liabilities denominated in foreign currency measured at spot exchange rates and certain nancial instruments measured at fair value/amortized cost. In these nancial statements, except for the amounts reected in the statement of cash ows, all transactions have been accounted for on accrual basis.
2.4 Judgments, estimates and assumptions
The preparation of nancial statements requires management to make judgements, estimates and assumptions that affect the application of accounting policies and the reported amounts of assets, liabilities, income and expenses. The estimates and associated assumptions and judgements are based on historical experience and various other factors that are believed to be reasonable under the circumstances, the result of which forms the basis of making judgements about carrying values of assets and liabilities that are not readily apparent from other sources. Subsequently, actual results may differ from these estimates. Estimates and underlying assumptions are reviewed on an ongoing basis. Revisions to accounting estimates are recognized in the period in which the estimate is revised and in any future periods affected. Judgments made by management in the application of approved accounting and reporting standards as applicable in Pakistan that have signicant effect on the nancial statements and estimates with a risk of material adjustment in subsequent years are as follows:
2.4.1 Depreciation method, rates and useful lives of property, plant and equipment (see note 6.1.1)
The Group reassesses useful lives, depreciation method and rates for each item of property, plant and equipment annually by considering expected pattern of economic benets that the Group expects to derive from that item.
2.4.2 Amortization method, rates and useful lives of intangible assets (see note 6.2)
The Group reassesses useful lives, amortization method and rates for each intangible asset annually by considering expected pattern of economic benets that the Group expects to derive from that asset.
2.4.3 Recoverable amount and impairment (see note 6.25)
The management of the Group reviews carrying amounts of its assets for possible impairment and makes formal estimates of recoverable amount if there is any such indication.
Goodwill
Determining whether goodwill is impaired requires an estimation of the value in use of the cash-generating units to which goodwill has been allocated. The calculation of value in use requires the entity to estimate the future cash ows expected to arise from the cash-generating unit and a suitable discount rate in order to calculate present value.
Trade and other receivables
The Group assesses the recoverability of its trade debts and other receivables if there is objective evidence that the Group will not be able to collect all the amount due according to the original terms. Signicant nancial difculties of the debtors, probability that the debtor will enter bankruptcy and default or delinquency in payments are considered indicators that the trade debt is impaired.
Investments
The Group reviews the carrying amounts of its investments in equity securities for possible indications of impairment. Indicators considered include nancial position/credit rating of the investee entity and changes in values of investment by reference to active market, if any.
2.4.4 Revaluation of property, plant and equipment (see note 6.1.1)
Revaluation of property, plant and equipment is carried out by independent professional valuers. Revalued amounts of non-depreciable items are determined by reference to local market values and that of depreciable items are determined by reference to present depreciated replacement values.
2.4.5 Taxation (see note 6.2)
The Group takes into account the current income tax law and decisions taken by appellate and other relevant legal forums while estimating its provision for current tax. Provision for deferred tax is estimated after taking into account historical and expected future turnover and prot trends and their taxability under the current tax law.
2.4.6 Provisions (see note 6.14)
Provisions are based on best estimate of the expenditure required to settle the present obligation at the reporting date, that is, the amount that the Group would rationally pay to settle the obligation at the reporting date or to transfer it to a third party.
2.4.7 Net realizable values (see note 6.4)
The Group reviews the net realizable values of stock in trade to assess any diminution in the respective carrying amounts. Net realizable value is determined with reference to estimated selling prices less estimated costs necessary to make the sale.
For the year ended December 31, 2018
I 14 Pak Elektron Limited I 15Annual Report 2018

2.4.8 Estimated future costs to complete projects in progress (see note 6.18)
As part of the application of percentage of completion method on contract accounting, the project costs are estimated. These estimates are based on the prices of materials and services applicable at that time, forecasted increases and expected completion date at the time of such estimation. Such estimates are reviewed at regular intervals. Any subsequent changes in the prices of materials and services compared to forecasted prices and changes in the time of completion affect the results of the subsequent periods.
2.5 Functional currency
These consolidated nancial statements have been prepared in Pak Rupees which is the Group's functional currency.
2.6 Date of authorization for issue
These nancial statements were authorized for issue on April 04, 2019 by the Board of Directors of the Parent Company.
3 NEW AND REVISED STANDARDS, INTERPRETATIONS AND AMENDMENTS EFFECTIVE DURING THE YEAR
The following new and revised standards, interpretations and amendments are effective in the current period but, unless specied otherwise, are either not relevant to the Group or their application does not have any material impact on the nancial statements of the Group other than presentation and disclosures.
Clarications to IFRS 15 - Revenue from Contracts with Customers
IFRS 15 - Revenue from Contracts with Customers have been amended to clarify three aspects of the standard (identifying performance obligations, principal versus agent considerations, and licensing) and to provide some transition relief for modied contracts and completed contracts.
IFRIC 22 - Foreign Currency Transactions and Advances Consideration
The interpretation addresses the determination of taxable prot (tax loss), tax bases, unused tax losses, unused tax credits and tax rates, when there is uncertainty over income tax treatments under IAS 12. It specically considers:
- Whether tax treatments should be considered collectively
- Assumptions for taxation authorities' examinations
- The determination of taxable prot (tax loss), tax bases, unused tax losses, unused tax credits and tax rates
- The effect of changes in facts and circumstances
Classication and Measurement of Share-based Payment Transactions (Amendments to IFRS 2 - Share-based Payment)
IFRS 2 - Share-based Payment have been amended to clarify the standard in relation to the accounting for cash-settled share-based payment transactions that include a performance condition, the classication of share-based payment transactions with net settlement features, and the accounting for modications of share-based payment transactions from cash-settled to equity-settled.
Applying IFRS 9 - Financial Instruments with IFRS 4 - Insurance Contracts (Amendments to IFRS 4 - Insurance Contracts)
IFRS 4 Insurance Contracts have been amended to provide two options for entities that issue insurance contracts within the scope of IFRS 4:
- an option that permits entities to reclassify, from prot or loss to other comprehensive income, some of the income or expenses arising from designated nancial assets; this is the so-called overlay approach;
- an optional temporary exemption from applying IFRS 9 for entities whose predominant activity is issuing contracts within the scope of IFRS 4; this is the so-called deferral approach
The application of both approaches is optional and an entity is permitted to stop applying them before the new insurance contracts standard is applied.
Transfers of Investment Property (Amendments to IAS 40 - Investment Property)
IAS 40 - Investment Property have following amendments:
- Paragraph 57 have been amended to state that an entity shall transfer a property to, or from, investment property when, and only when, there is evidence of a change in use. A change of use occurs if property meets, or ceases to meet, the denition of investment property. A change in management’s intentions for the use of a property by itself does not constitute evidence of a change in use.
- The list of examples of evidence in paragraph 57(a) – (d) is now presented as a non-exhaustive list of examples instead of the previous exhaustive list.
Annual Improvements to IFRS Standards 2014–2016 Cycle (IFRS 1 - First-time Adoption of International Financial Reporting Standards and IAS 28 - Investments in Associates and Joint Ventures)
Annual improvements makes amendments to the following standards:
- IFRS 1 - Deletes the short-term exemptions in paragraphs E3–E7 of IFRS 1, because they have now served their intended purpose.
- IAS 28 - Claries that the election to measure at fair value through prot or loss an investment in an associate or a joint venture that is held by an entity that is a venture capital organisation, or other qualifying entity, is available for each investment in an associate or joint venture on an investment-by-investment basis, upon initial recognition.
Companies Act, 201
The Companies Act 2017 ['the Act'] was enacted on May 30, 2017. The Act has brought certain changes with regard to the preparation and presentation of these consolidated nancial statements. These changes, amongst others, included change in respect of presentation and measurement of surplus on revaluation of property, plant and equipment as fully explained in note of these consolidated nancial statements, change in nomenclature of primary statements. Further, the disclosure requirements contained in the fourth schedule of the Act have been revised, resulting in elimination of duplicative disclosure with the IFRS disclosure requirements and incorporation of additional/amended disclosures including, but not limited to, particulars of immovable assets of the Group (see note 21.2 and 21.3), management assessment of sufciency of tax provision in the consolidated nancial statements (see note 42.1), change in threshold for identication of executives (see note 52), additional disclosure requirements for related parties (see note 46), disclosure of signicant events and transactions affecting the nancial position and performance of the Group (see note 7), disclosure relating to number of employess (see note 56) etc.
4 NEW AND REVISED STANDARDS, INTERPRETATIONS AND AMENDMENTS NOT YET EFFECTIVE
July 01, 2018
July 01, 2018
January 01, 2019
January 01, 2021
Deferred Indefinitely
January 01, 2019
January 01, 2019
January 01, 2019
January 01, 2019
January 01, 2019
January 01, 2020
January 01, 2020
January 01, 2020
beginning on
or after)
(annual periods
Effective date
IFRS 9 - Financial Instruments (2014)
IFRS 15 - Revenue from Contracts with Customers
IFRS 16 - Leases (2016)
IFRS 17 - Insurance contracts (2017)
Sale or contribution of assets between an Investor and its Associate or Joint Venture
(Amendments to IFRS 10 - Consolidated Financial Statements and IAS 28 - Investmentsin
Associates and Joint Ventures).
IFRIC 23 - Uncertainty over Income Tax Treatments
Prepayment Features with Negative Compensation (Amendments to IFRS 9 - Financial
Instruments)
Long-term Interests in Associates and Joint Ventures (Amendments to IAS 28 - Investments
in Associates and Joint Ventures)
Annual Improvements to IFRS Standards 2015 – 2017 Cycle
Plan Amendment, Curtailment or Settlement (Amendments to IAS 19 - Employee Benefits)
Amendments to References to the Conceptual Framework in IFRS Standards
Definition of a Business (Amendments to IFRS 3 - Business Combinations)
Definition of Material (Amendments to IAS 1 - First-time Adoption of InternationalFinancial
Reporting Standards and IAS 8 - AccountingPolicies, Changes in Accounting Estimates and
Errors)
Other than afore mentioned standards, interpretations and amendments, IABS has also issued the following standards which have not been notied by the Securities and Exchange Commission of Pakistan ['SECP']:
IFRS 1 - First Time Adoption of International Financial Reporting Standards IFRS 14 - Regulatory Defferal Accounts IFRS 17 – Insurance contracts (2017)
I 16 Pak Elektron Limited I 17Annual Report 2018

The Group intends to adopt these new and revised standards, interpretations and amendments on their effective dates, subject to, where required, notication by Securities and Exchange Commission of Pakistan under section 225 of the Companies Act, 2017 regarding their adoption. The management anticipates that the adoption of the above standards, amendments and interpretations in future periods, will have no material impact on the Group's nancial statements other than in presentation/disclosures.
IFRS 9 - Financial Instruments
Finalised version of IFRS 9 - Financial Instruments: Recognition and Measurement which contains accounting requirement for nancial instruments, replacing IAS 39 - Financial Instruments: Recognition and Measurement. The standard contains requirements in the following areas:
- Classication and measurement: Financial assets are classied by reference to the business model within which they are held and their contractual cash ow characteristics. The 2014 version of IFRS 9 introduces a 'fair value through other comprehensive income' category for certain debt instruments. Financial liabilities are classied in a similar manner to under IAS 39, however there are differences in the requirements applying to the measurement of an entity's own credit risk.
- Impairment: The 2014 version of IFRS 9 introduces an 'expected credit loss' model for the measurement of the impairment of nancial assets, so it is no longer necessary for a credit event to have occurred before a credit loss is recognised.
- Hedge accounting: Introduces a new hedge accounting model that is designed to be more closely aligned with how entities undertake risk management activities when hedging nancial and non-nancial risk exposures.
- Derecognition: The requirements for the derecognition of nancial assets and liabilities are carried forward from IAS 39.
IFRS 15 - Revenue from Contracts with Customers
IFRS 15 provides a single, principles based ve-step model to be applied to all contracts with customer.
- Identify the contract with customer.
- Identify the performance obligations in the contract.
- Determine the transaction price.
- Allocate the transaction price to the performace obligations in the contracts.
- Recognized revenuew when (or as) the entity satises a performance obligation.
5 CHANGE IN ACCOUNTING POLICY
During the year, the Companies Act, 2017 has been enacted and has resulted in change in accounting policy for surplus on revaluation of property, plant and equipment.
- The surplus on revaluation of property, plant and equipment, which was previously disclosed in the consolidated statement of nancial position of the Group after share capital and reserves, has now been included as part of equity with corresponding inclusion in consolidated statement of changes in equity;
- If an asset's carrying amount is increased as a result of revaluation, the increase will be recognised in statement of comprehensive income. However, the increase shall be recognised in statement of prot or loss to the extent that it reverses a revaluation decrease of the same asset previously recognised in statement of prot or loss;
- If an asset's carrying amount is decreased as a result of a revaluation, the decrease shall be recognised in statement of prot or loss. However, the decrease shall be recognised in statement of comprehensive income to the extent of any credit balance existing in the revaluation surplus in respect of that asset. Previously, section 235 of repealed Companies Ordinance, 1984 allowed that the surplus on revaluation of property, plant and equipment may be applied by the Group in setting off or in diminution of any decit arising from the revaluation of any other property, plant and equipment of the Company.
The change in accounting policy does not have any impact on the amounts reported in these nancial statements. Hence a third consolidated statement of nancial position as at the beginning of the previous year has not been presented.
6 SIGNIFICANT ACCOUNTING POLICIES
The accounting policies set out below have been applied consistently to all periods presented in these consolidated nancial statements except of the change referred to in note 5.
6.1 Property, plant and equipment
6.1.1 Operating xed assets
Operating xed assets are measured at cost less accumulated depreciation and accumulated impairment losses with the exception of freehold land, leasehold land, buildings and plant and machinery. Freehold land, buildings and plant and machinery are measured at revalued amounts less accumulated depreciation and accumulated impairment losses, if any. Leasehold land is measured at historical cost. Cost comprises purchase price, including import duties and non-refundable purchase taxes, after deducting trade discounts and rebates, and includes other costs directly attributable to the acquisition or construction, erection and installation.
Assets' residual values, if signicant and their useful lives are reviewed and adjusted, if appropriate, at each balance sheet date.
When signicant parts of an item of operating xed assets have different useful lives, they are recognized as separate items.
Major renewals and improvements to operating xed assets are recognized in the carrying amount of the item if it is probable that the embodied future economic benets will ow to the Group and the cost of renewal or improvement can be measured reliably. The cost of the day-to-day servicing of operating xed assets are recognized in prot or loss as incurred.
The Group recognizes depreciation in prot or loss by applying reducing balance method, with the exception of computer hardware and allied items, which are depreciated using straight line method, over the useful life of each operating xed asset using rates specied in note 21 to the consolidated nancial statements. Depreciation on additions to operating xed assets is charged from the month in which the item becomes available for use. Depreciation is discontinued from the month in which it is disposed or classied as held for disposal.
An operating xed asset is de-recognized when permanently retired from use. Any gain or loss on disposal of operating xed assets is recognized in prot or loss.
Increases in the carrying amounts arising on revaluation of property, plant and equipment are recognised, net of tax, in other comprehensive income and accumulated in surplus on revaluation of property, plant and equipment in share capital and reserves. To the extent that the increase reverses a decrease previously recognised in prot or loss, the increase is rst recognised in prot or loss. Decreases that reverse previous increases of the same asset are rst recognised in other comprehensive income to the extent of the remaining surplus attributable to the asset; all other decreases are charged to prot or loss. Each year, the difference between depreciation based on the revalued carrying amount of the asset charged to prot or loss and depreciation based on the asset’s original cost, net of tax, is reclassied from the surplus on revaluation of property, plant and equipment to accumulated prot.
6.1.2 Capital work in progress
Capital work in progress is stated at cost less identied impairment loss, if any, and includes the cost of material, labour and appropriate overheads directly relating to the construction, erection or installation of an item of operating xed assets. These costs are transferred to operating xed assets as and when related items become available for intended use.
6.2 Intangible assets
6.2.1 Goodwill
Goodwill represents the excess of the cost of business combination over the acquirer's interest in the net fair value of the identiable assets, liabilities and contingent liabilities of the acquiree. This is stated at cost less any accumulated impairment losses, if any.
6.2.2 Technology transfer
The intangible assets in respect of technology transfer are amortized over the useful life of plant and machinery involved in use of such technology. Amortization of intangible commences when it becomes available for use.
6.2.3 Computer software and ERP
Computer software licenses are capitalized on the basis of the costs incurred to acquire and bring to use the specic software. Costs that are directly associated with the production of identiable and unique software products controlled by the Group, and that will probably generate economic benets exceeding costs beyond one year, are recognized as intangible assets. These costs are amortized over their estimated useful lives. Amortization of intangible commences when it becomes available for use.
6.3 Stores, spares and loose tools
These are generally held for internal use and are valued at cost. Cost is determined on the basis of moving average except for items in transit, which are valued at invoice price plus related cost incurred up to the reporting date. For items which are considered obsolete, the carrying amount is written down to nil. Spare parts held for capitalization are classied as property, plant and equipment through capital work in progress.
6.4 Stock in trade
These are valued at lower of cost and net realizable value, with the exception of stock of waste which is valued at net realizable value. Cost is determined using the following basis:
Raw materials Moving average cost Work in process Average manufacturing cost Finished goods Average manufacturing cost Stock in transit Invoice price plus related cost incurred up to the reporting date
Average manufacturing cost in relation to work in process and nished goods consists of direct material, labour and an appropriate proportion of manufacturing overheads.
Net realizable value signies the estimated selling price in the ordinary course of business less estimated costs of completion and estimated costs necessary to make the sale.
I 18 Pak Elektron Limited I 19Annual Report 2018

6.5 Employee benets
6.5.1 Short-term employee benets
The Group recognizes the undiscounted amount of short term employee benets to be paid in exchange for services rendered by employees as a liability after deducting amount already paid and as an expense in prot or loss unless it is included in the cost of inventories or property, plant and equipment as permitted or required by the approved accounting and reporting standards as applicable in Pakistan. If the amount paid exceeds the undiscounted amount of benets, the excess is recognized as an asset to the extent that the prepayment would lead to a reduction in future payments or cash refund.
The Group provides for compensated absences of its employees on un-availed balance of leaves in the period in which the leaves are earned.
6.5.2 Post-employment benets
The Group operates an approved funded contributory provident fund for all its permanent employees who have completed the minimum qualifying period of service as dened under the respective scheme. Equal monthly contributions are made both by the Group and the employees at the rate of ten percent of basic salary and cost of living allowance, where applicable, to cover the obligation. Contributions are charged to prot or loss.
6.6 Financial instruments
6.6.1 Recognition
A nancial instrument is recognized when the Group becomes a party to the contractual provisions of the instrument.
6.6.2 Classication
The Group classies its nancial instruments into following classes depending on the purpose for which the nancial assets and liabilities are acquired or incurred. The Group determines the classication of its nancial assets and liabilities at initial recognition.
(a) Loans and receivables
Non-derivative nancial assets with xed or determinable payments that are not quoted in an active market are classied as loans and receivables. Assets in this category are presented as current assets except for maturities greater than twelve months from the reporting date, where these are presented as non-current assets.
(b) Financial assets at fair value through prot or loss
Financial assets at fair value through prot or loss are nancial assets that are either designated as such on initial recognition or are classied as held for trading. Financial assets are designated as nancial assets at fair value through prot or loss if the Group manages such assets and evaluates their performance based on their fair value in accordance with the Group’s risk management and investment strategy. Financial assets are classied as held for trading when these are acquired principally for the purpose of selling and repurchasing in the near term, or when these are part of a portfolio of identied nancial instruments that are managed together and for which there is a recent actual pattern of prot taking, or where these are derivatives, excluding derivatives that are nancial guarantee contracts or that are designated and effective hedging instruments. Financial assets in this category are presented as current assets.
(c) Held-to-maturity investments
Held-to-maturity investments are non-derivative nancial assets with xed or determinable payments and xed maturity that an entity has the positive intention and ability to hold to maturity. Assets in this category are presented as non-current assets except for maturities less than twelve months from the reporting date, where these are presented as current assets.
(d) Financial liabilities at amortized cost
Non-derivative nancial liabilities that are not nancial liabilities at fair value through prot or loss are classied as nancial liabilities at amortized cost. Financial liabilities in this category are presented as current liabilities except for maturities greater than twelve months from the reporting date where these are presented as non-current liabilities.
6.6.3 Measurement
The particular measurement methods adopted are disclosed in the individual policy statements associated with each instrument.
6.6.4 De-recognition
Financial assets are de-recognized if the Group's contractual rights to the cash ows from the nancial assets expire or if the Group transfers the nancial asset to another party without retaining control or substantially all risks and rewards of the asset. Financial liabilities are de-recognized if the Group's obligations specied in the contract expire or are discharged or cancelled. Any gain or loss on de-recognition of nancial assets and nancial liabilities is recognized in prot or loss.
6.6.5 Off-setting
A nancial asset and a nancial liability is offset and the net amount reported in the balance sheet if the Group has legally enforceable right to set-off the recognized amounts and intends either to settle on a net basis or to realize the asset and settle the liability simultaneously.
6.7 Ordinary share capital
Ordinary share capital is recognized as equity. Transaction costs directly attributable to the issue of ordinary shares are recognized as deduction from equity.
6.8 Preference share capital
Preference share capital is recognized as equity in accordance with the interpretation of the provision of the repealed Companies Ordinance, 1984, including those pertaining to implied classications of preference shares.
6.9 Loans and borrowings
Loans and borrowings are classied as 'nancial liabilities at amortized cost'. On initial recognition, these are measured at cost, being fair value at the date the liability is incurred, less attributable transaction costs. Subsequent to initial recognition, these are measured at amortized cost with any difference between cost and value at maturity recognized in the prot or loss over the period of the borrowings on an effective interest basis.
6.10 Investments in equity securities
Investments in associates
Investments in associates are accounted for using the equity method of accounting. Under the equity method, investments in associates are carried in the consolidated statement of nancial position at cost as adjusted for post acquisition changes in the Group's share of net assets of the associate, less any impairment in the value of investment. Losses of an associate in excess of the Group's interest in that associate (which includes any long term interest that, in substance, form part of the Group's net investment in the associate) are recognized only to the extent that the Group has incurred legal or constructive obligation or made payment on behalf of the associate.
Investments in other quoted equity securities
These on initial recognition, are designated as 'investments at fair value through prot or loss' and are recognized at cost. Subsequent to initial recognition, these are measured at fair value. Gains and losses arising from changes in fair value are recognized in prot or loss.
6.11 Finance leases
Leases in terms of which the Group assumes substantially all risks and rewards of ownership are classied as nance leases. Assets subject to nance lease are classied as 'operating xed assets'. On initial recognition, these are measured at cost, being an amount equal to the lower of its fair value and the present value of minimum lease payments. Subsequent to initial recognition, these are measured at cost less accumulated depreciation and accumulated impairment losses. Depreciation, subsequent expenditure, de-recognition, and gains and losses on de-recognition are accounted for in accordance with the respective policies for operating xed assets. Liabilities against assets subject to nance lease and deposits against nance lease are classied as 'nancial liabilities at amortized cost' and 'loans and receivables' respectively, however, since they fall outside the scope of measurement requirements of IAS 39 'Financial Instruments - Recognition and Measurement', these are measured in accordance with the requirements of IAS 17 'Leases'. On initial recognition, these are measured at cost, being their fair value at the date of commencement of lease, less attributable transaction costs. Subsequent to initial recognition, minimum lease payments made under nance leases are apportioned between the nance charge and the reduction of outstanding liability. The nance charge is allocated to each period during the lease term so as to produce a constant periodic rate of interest on the remaining balance of the liability. Deposits against nance leases, subsequent to initial recognition are carried at cost.
6.12 Ijarah transactions
Ujrah payments under an Ijarah are recognized as an expense in the prot or loss on a straight-line basis over the Ijarah terms unless another systematic basis are representative of the time pattern of the user's benet, even if the payments are not on that basis.
6.13 Trade and other payables
6.13.1 Financial liabilities
These are classied as 'nancial liabilities at amortized cost'. On initial recognition, these are measured at cost, being their fair value at the date the liability is incurred, less attributable transaction costs. Subsequent to initial recognition, these are measured at amortized cost using the effective interest method, with interest recognized in prot or loss.
6.13.2 Non-nancial liabilities
These, both on initial recognition and subsequently, are measured at cost.
6.14 Provisions and contingencies
Provisions are recognized when the Group has a legal and constructive obligation as a result of past events and it is probable that outow of resources embodying economic benets will be required to settle the obligation and a reliable estimate can be made of the amount of obligation. Provision is recognized at an amount that is the best estimate of the expenditure required to settle the present obligation at the reporting date. Where outow of resources embodying economic benets is not probable, or where a reliable estimate of the amount of obligation cannot be made, a contingent liability is disclosed, unless the possibility of outow is remote.
I 20 Pak Elektron Limited I 21Annual Report 2018
6.15 Trade and other receivables
6.15.1 Financial assets
These are classied as 'loans and receivables'. On initial recognition, these are measured at cost, being their fair value at the date of transaction, plus attributable transaction costs. Subsequent to initial recognition, these are measured at amortized cost using the effective interest method, with interest recognized in prot or loss.
6.15.2 Non-nancial assets
These, both on initial recognition and subsequently, are measured at cost.
6.16 Revenue
Revenue is measured at the fair value of the consideration received or receivable, net of returns allowances, trade discounts and rebates, and represents amounts received or receivable for goods and services provided and other income earned in the normal course of business. Revenue is recognized when it is probable that the economic benets associated with the transaction will ow to the Group, and the amount of revenue and the associated costs incurred or to be incurred can be measured reliably.
- Revenue from different sources is recognized as follows:
- Revenue from sale of goods is recognized when risks and rewards incidental to the ownership of goods are transferred to the buyer.
- Interest income is recognized using effective interest method.
- Dividend income is recognized when right to received payment is established.
- Contract revenue relating to long term construction contracts are recognized as revenue by reference to stage of completion of contract activity at the balance sheet date. Stage of completion of a contract is determined by applying 'cost-to-date method'. Under cost-to-date method stage of completion of a contract is determined by reference to the proportion that contract cost incurred to date bears to the total estimated contract cost.
6.17 Comprehensive income
Comprehensive income is the change in equity resulting from transactions and other events, other than changes resulting from transactions with shareholders in their capacity as shareholders. Total comprehensive income comprises all components of prot or loss and other comprehensive income ['OCI']. OCI comprises items of income and expense, including reclassication adjustments, that are not recognized in prot or loss as required or permitted by approved accounting and reporting standards as applicable in Pakistan, and is presented in 'consolidated statement of comprehensive income'.
6.18 Contract costs
Contract costs relating to long term construction contracts are recognized as expenses by reference to stage of completion of contract activity at the reporting date. Stage of completion of a contract is determined by applying 'cost-to-date method'. Under cost-to-date method, stage of completion of a contract is determined by reference to the proportion that contract cost incurred to date bears to the total estimated contract cost. Expected losses on contracts are recognized as an expense immediately.
6.19 Borrowing costs
Borrowing costs directly attributable to the acquisition, construction or production of qualifying assets, which are assets that necessarily take a substantial period of time to get ready for their intended use or sale, are added to the cost of those assets, until such time as the assets are substantially ready for their intended use or sale. Investment income earned on the temporary investment of specic borrowings pending their expenditure on qualifying asset is deducted from the borrowing costs eligible for capitalization. All other borrowing costs are recognized in prot or loss as incurred.
6.20 Income tax
Income tax expense comprises current tax and deferred tax. Income tax expense is recognized in prot or loss except to the extent that it relates to items recognized directly in other comprehensive income, in which case it is recognized in other comprehensive income.
6.20.1 Current taxation
Current tax is the amount of tax payable on taxable income for the year and any adjustment to the tax payable in respect of previous years. Provision for current tax is based on current rates of taxation in Pakistan after taking into account tax credits, rebates and exemptions available, if any. The amount of unpaid income tax in respect of the current or prior periods is recognized as a liability. Any excess paid over what is due in respect of the current or prior periods is recognized as an asset.
6.20.2 Deferred taxation
Deferred tax is accounted for using the' balance sheet approach' providing for temporary differences between the carrying amounts of assets and liabilities for nancial reporting purposes and the amounts used for tax purposes. In this regard, the effects on deferred taxation of the portion of income that is subject to nal tax regime is also considered in accordance with the treatment prescribed by The Institute of Chartered Accountants of Pakistan. Deferred tax is measured at rates that are expected to be applied to the temporary differences when they reverse, based on laws that have been enacted or substantively enacted by the reporting date. A deferred tax liability is recognized for all taxable temporary differences. A deferred tax asset is recognized for deductible temporary differences to the extent that future taxable prots will be available against which temporary differences can be utilized. Deferred tax assets are reviewed at each reporting date and are reduced to the extent that it is no longer probable that the related tax benet will be realized.
6.21 Government grants
Government grants that compensate the Group for expenses or losses already incurred are recognized in prot or loss in the period in which these are received and are deducted in reporting the relevant expenses or losses. Grants relating to property, plant and equipment are recognized as deferred income and an amount equivalent to depreciation charged on such assets is transferred to prot or loss.
6.22 Earnings per share ['EPS']
Basic EPS is calculated by dividing the prot or loss attributable to ordinary shareholders of the Parent Company by the weighted average number of ordinary shares outstanding during the year.
Diluted EPS is calculated by adjusting basic EPS by the weighted average number of ordinary shares that would be issued on conversion of all dilutive potential ordinary shares into ordinary shares and post-tax effect of changes in prot or loss attributable to ordinary shareholders of the Parent Company that would result from conversion of all dilutive potential ordinary shares into ordinary shares.
6.23 Cash and cash equivalents
Cash and cash equivalents for the purpose of consolidated statement of cashows comprise cash in hand and cash at banks. These are carried at cost.
6.24 Foreign currency transactions and balances
Transactions in foreign currency are translated to the functional currency of the Group using exchange rate prevailing at the date of transaction. Monetary assets and liabilities denominated in foreign currency are translated to the functional currency at exchange rate prevailing at the reporting date. Non-monetary assets and liabilities denominated in foreign currency that are measured at fair value are translated to the functional currency at exchange rate prevailing at the date the fair value is determined. Non-monetary assets and liabilities denominated in foreign currency that are measured at historical cost are translated to functional currency at exchange rate prevailing at the date of initial recognition. Any gain or loss arising on translation of foreign currency transactions and balances is recognized in prot or loss.
6.25 Impairment
6.25.1 Financial assets
A nancial asset is assessed at each reporting date to determine whether there is any objective evidence that it is impaired. Individually signicant nancial assets are tested for impairment on an individual basis. The remaining nancial assets are assessed collectively in groups that share similar credit risk characteristics. A nancial asset is considered to be impaired if objective evidence indicates that one or more events have had a negative effect on the estimated future cash ows of the asset.
An impairment loss in respect of a nancial asset measured at amortized cost is calculated as the difference between its carrying amount, and the present value of the estimated future cash ows discounted at the original effective interest rate. Impairment loss in respect of a nancial asset measured at fair value is determined by reference to that fair value. All impairment losses are recognized in prot or loss. An impairment loss is reversed if the reversal can be related objectively to an event occurring after the impairment loss was recognized. An impairment loss is reversed only to the extent that the nancial asset’s carrying amount after the reversal does not exceed the carrying amount that would have been determined, net of amortization, if no impairment loss had been recognized.
6.25.2 Non-nancial assets
The carrying amount of the Group’s non-nancial assets, other than inventories and deferred tax assets are reviewed at each reporting date to determine whether there is any indication of impairment. If any such indication exists, then the asset’s recoverable amount is estimated. The recoverable amount of an asset or cash generating unit is the greater of its value in use and its fair value less costs to sell. In assessing value in use, the estimated future cash ows are discounted to their present values using a pre-tax discount rate that reects current market assessments of the time value of money and the risks specic to the asset or cash generating unit.
I 22 Pak Elektron Limited I 23Annual Report 2018
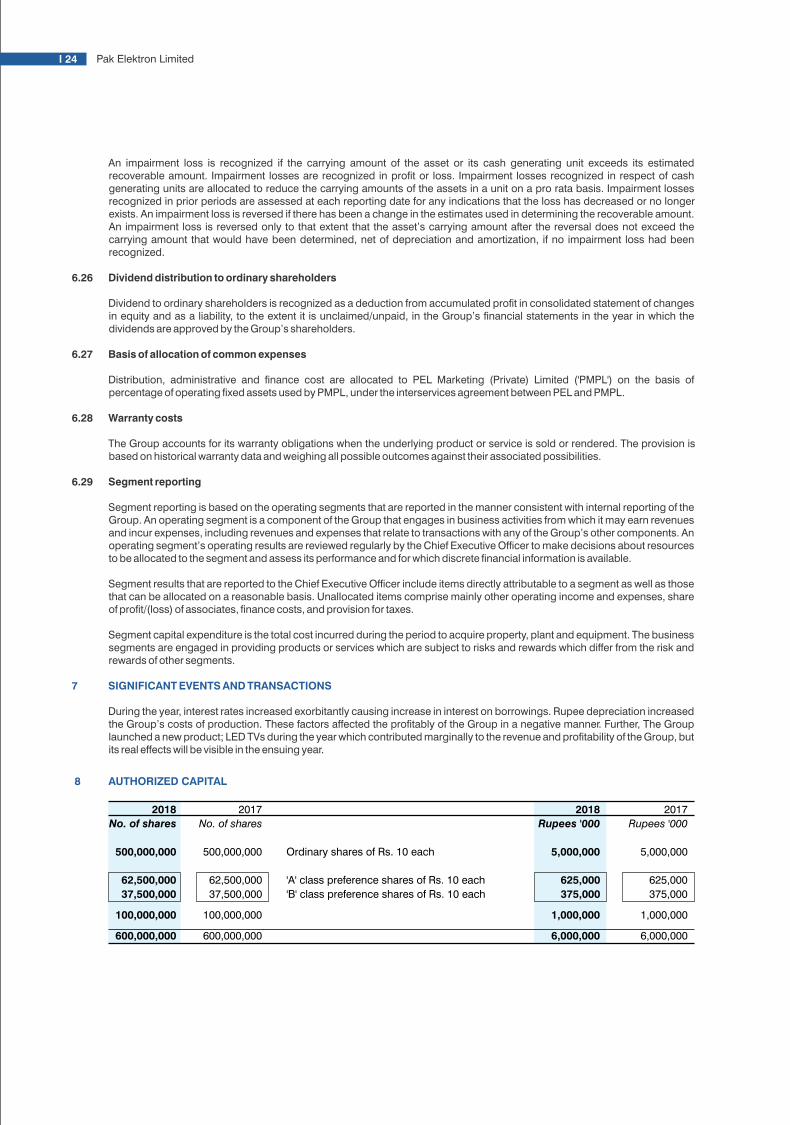
2018 2017
No. of shares No. of shares
500,000,000500,000,000
600,000,000
100,000,000
600,000,000
100,000,000
62,500,000 62,500,000
37,500,000 37,500,000
An impairment loss is recognized if the carrying amount of the asset or its cash generating unit exceeds its estimated recoverable amount. Impairment losses are recognized in prot or loss. Impairment losses recognized in respect of cash generating units are allocated to reduce the carrying amounts of the assets in a unit on a pro rata basis. Impairment losses recognized in prior periods are assessed at each reporting date for any indications that the loss has decreased or no longer exists. An impairment loss is reversed if there has been a change in the estimates used in determining the recoverable amount. An impairment loss is reversed only to that extent that the asset’s carrying amount after the reversal does not exceed the carrying amount that would have been determined, net of depreciation and amortization, if no impairment loss had been recognized.
6.26 Dividend distribution to ordinary shareholders
Dividend to ordinary shareholders is recognized as a deduction from accumulated prot in consolidated statement of changes in equity and as a liability, to the extent it is unclaimed/unpaid, in the Group’s nancial statements in the year in which the dividends are approved by the Group’s shareholders.
6.27 Basis of allocation of common expenses
Distribution, administrative and nance cost are allocated to PEL Marketing (Private) Limited ('PMPL') on the basis of percentage of operating xed assets used by PMPL, under the interservices agreement between PEL and PMPL.
6.28 Warranty costs
The Group accounts for its warranty obligations when the underlying product or service is sold or rendered. The provision is based on historical warranty data and weighing all possible outcomes against their associated possibilities.
6.29 Segment reporting
Segment reporting is based on the operating segments that are reported in the manner consistent with internal reporting of the Group. An operating segment is a component of the Group that engages in business activities from which it may earn revenues and incur expenses, including revenues and expenses that relate to transactions with any of the Group’s other components. An operating segment’s operating results are reviewed regularly by the Chief Executive Ofcer to make decisions about resources to be allocated to the segment and assess its performance and for which discrete nancial information is available.
Segment results that are reported to the Chief Executive Ofcer include items directly attributable to a segment as well as those that can be allocated on a reasonable basis. Unallocated items comprise mainly other operating income and expenses, share of prot/(loss) of associates, nance costs, and provision for taxes.
Segment capital expenditure is the total cost incurred during the period to acquire property, plant and equipment. The business segments are engaged in providing products or services which are subject to risks and rewards which differ from the risk and rewards of other segments.
7 SIGNIFICANT EVENTS AND TRANSACTIONS
During the year, interest rates increased exorbitantly causing increase in interest on borrowings. Rupee depreciation increased the Group’s costs of production. These factors affected the protably of the Group in a negative manner. Further, The Group launched a new product; LED TVs during the year which contributed marginally to the revenue and protability of the Group, but its real effects will be visible in the ensuing year.
8 AUTHORIZED CAPITAL
Ordinary shares of Rs. 10 each
'A' class preference shares of Rs. 10 each
'B' class preference shares of Rs. 10 each
2018 2017
Rupees '000 Rupees '000
5,000,000
5,000,000
625,000
625,000
375,000
375,000
1,000,000
1,000,000
6,000,000
6,000,000
9 ISSUED, SUBSCRIBED AND PAID-UP CAPITAL
Ordinary shares of Rs. 10 each
Issued for cash
Issued for other than cash:
- against machinery
- against acquisition of PEL Appliances Limited
- against conversion of preference shares
- as fully paid bonus shares
'A' class preference shares of Rs. 10 each
Issued for cash
542,639,077542,639,077
44,957,592
137,500
118,343,841 118,343,841
497,681,485
44,957,592
No. of shares
372,751,051
497,681,485
408,273 408,273
6,040,820
No. of shares
372,751,051
6,040,820
137,500
2018 2017 2018 2017
Rupees '000 Rupees '000
3,727,511
3,727,511
1,375 1,375
4,083
4,083
60,408
60,408
1,183,439 1,183,439
4,976,816 4,976,816
449,576 449,576
5,426,392 5,426,392
9.1 'A' class preference shares
9.1.1 Current status of original issue
PEL, in the December 2004, issued 'A' class preference shares to various institutional investors amounting to Rs. 605 million against authorized share capital of this class amounting to Rs. 625 million. In Januray 2010, PEL sent out notices to all preference shareholders seeking conversion of outstanding preference shares into ordinary shares of PEL in accordance with the option available to the investors under the original terms of the issue. As at the reporting date outstanding balance of preference shares amounts to Rs. 449.58 million representing investors who did not opt to convert their holdings into the ordinary shares of PEL. Subsequently, PEL offered re-proling of preference shares to these remaining investors. See note 9.1.2.
The Securities and Exchange Commission of Pakistan ['SECP'] issued order to Pakistan Stock Exchange Limited ['the Exchange'] dated February 6, 2009 for delisting of these preference shares. However, the Company took up the matter with the honorable Lahore High Court which, through order dated October 10, 2017, accepted the appeal of PEL and set aside the SECP order and the appellate order.
9.1.2 Re-proling of preference shares
PEL offered re-proling of preference shares to investors, who did not convert their preference shares into ordinary shares in response to the conversion notices issued by PEL.The investors to the instrument had, in principle, agreed to the re-proling term sheet and commercial terms and conditions therein. Further, SECP had allowed PEL to proceed with the re-proling subject to fulllment of legal requirements. The legal documentation was prepared and circulated amongst the concerned investors which was endorsed by the said investors except for National Bank of Pakistan, as a result of which the original time frame for reproling has lapsed. PEL is in the process of nalising another reproling exercise based on mutual agreement to be made amongst the existing investors.
9.1.3 Accumulated preference dividend
As at reporting date an amount of approximately Rs. 384.39 million (2017: Rs. 341.68 million) has been accumulated on account of preference dividend which is payable if and when declared by the Board, to be appropriated out of the distributable prots for that year. In case the preference dividend continues to be accumulated it would be settled at the time of exercising the redemption or conversion option in accordance with the under process reproling exercise.
As per the opinion of the Group's legal counsel, the provision of cumulative dividend at 9.5% p.a. will prevail on account of preference dividend, as the approval process of the revised terms of reproling from different quarters is not yet complete.
10 CAPITAL RESERVE
This represents premium on issue of right ordinary shares recognized under Section 83(1) of the repealed Companies Ordinance, 1984.
I 24 Pak Elektron Limited I 25Annual Report 2018

2018 2017
No. of shares No. of shares
500,000,000500,000,000
600,000,000
100,000,000
600,000,000
100,000,000
62,500,000 62,500,000
37,500,000 37,500,000
An impairment loss is recognized if the carrying amount of the asset or its cash generating unit exceeds its estimated recoverable amount. Impairment losses are recognized in prot or loss. Impairment losses recognized in respect of cash generating units are allocated to reduce the carrying amounts of the assets in a unit on a pro rata basis. Impairment losses recognized in prior periods are assessed at each reporting date for any indications that the loss has decreased or no longer exists. An impairment loss is reversed if there has been a change in the estimates used in determining the recoverable amount. An impairment loss is reversed only to that extent that the asset’s carrying amount after the reversal does not exceed the carrying amount that would have been determined, net of depreciation and amortization, if no impairment loss had been recognized.
6.26 Dividend distribution to ordinary shareholders
Dividend to ordinary shareholders is recognized as a deduction from accumulated prot in consolidated statement of changes in equity and as a liability, to the extent it is unclaimed/unpaid, in the Group’s nancial statements in the year in which the dividends are approved by the Group’s shareholders.
6.27 Basis of allocation of common expenses
Distribution, administrative and nance cost are allocated to PEL Marketing (Private) Limited ('PMPL') on the basis of percentage of operating xed assets used by PMPL, under the interservices agreement between PEL and PMPL.
6.28 Warranty costs
The Group accounts for its warranty obligations when the underlying product or service is sold or rendered. The provision is based on historical warranty data and weighing all possible outcomes against their associated possibilities.
6.29 Segment reporting
Segment reporting is based on the operating segments that are reported in the manner consistent with internal reporting of the Group. An operating segment is a component of the Group that engages in business activities from which it may earn revenues and incur expenses, including revenues and expenses that relate to transactions with any of the Group’s other components. An operating segment’s operating results are reviewed regularly by the Chief Executive Ofcer to make decisions about resources to be allocated to the segment and assess its performance and for which discrete nancial information is available.
Segment results that are reported to the Chief Executive Ofcer include items directly attributable to a segment as well as those that can be allocated on a reasonable basis. Unallocated items comprise mainly other operating income and expenses, share of prot/(loss) of associates, nance costs, and provision for taxes.
Segment capital expenditure is the total cost incurred during the period to acquire property, plant and equipment. The business segments are engaged in providing products or services which are subject to risks and rewards which differ from the risk and rewards of other segments.
7 SIGNIFICANT EVENTS AND TRANSACTIONS
During the year, interest rates increased exorbitantly causing increase in interest on borrowings. Rupee depreciation increased the Group’s costs of production. These factors affected the protably of the Group in a negative manner. Further, The Group launched a new product; LED TVs during the year which contributed marginally to the revenue and protability of the Group, but its real effects will be visible in the ensuing year.
8 AUTHORIZED CAPITAL
Ordinary shares of Rs. 10 each
'A' class preference shares of Rs. 10 each
'B' class preference shares of Rs. 10 each
2018 2017
Rupees '000 Rupees '000
5,000,000
5,000,000
625,000
625,000
375,000
375,000
1,000,000
1,000,000
6,000,000
6,000,000
9 ISSUED, SUBSCRIBED AND PAID-UP CAPITAL
Ordinary shares of Rs. 10 each
Issued for cash
Issued for other than cash:
- against machinery
- against acquisition of PEL Appliances Limited
- against conversion of preference shares
- as fully paid bonus shares
'A' class preference shares of Rs. 10 each
Issued for cash
542,639,077542,639,077
44,957,592
137,500
118,343,841 118,343,841
497,681,485
44,957,592
No. of shares
372,751,051
497,681,485
408,273 408,273
6,040,820
No. of shares
372,751,051
6,040,820
137,500
2018 2017 2018 2017
Rupees '000 Rupees '000
3,727,511
3,727,511
1,375 1,375
4,083
4,083
60,408
60,408
1,183,439 1,183,439
4,976,816 4,976,816
449,576 449,576
5,426,392 5,426,392
9.1 'A' class preference shares
9.1.1 Current status of original issue
PEL, in the December 2004, issued 'A' class preference shares to various institutional investors amounting to Rs. 605 million against authorized share capital of this class amounting to Rs. 625 million. In Januray 2010, PEL sent out notices to all preference shareholders seeking conversion of outstanding preference shares into ordinary shares of PEL in accordance with the option available to the investors under the original terms of the issue. As at the reporting date outstanding balance of preference shares amounts to Rs. 449.58 million representing investors who did not opt to convert their holdings into the ordinary shares of PEL. Subsequently, PEL offered re-proling of preference shares to these remaining investors. See note 9.1.2.
The Securities and Exchange Commission of Pakistan ['SECP'] issued order to Pakistan Stock Exchange Limited ['the Exchange'] dated February 6, 2009 for delisting of these preference shares. However, the Company took up the matter with the honorable Lahore High Court which, through order dated October 10, 2017, accepted the appeal of PEL and set aside the SECP order and the appellate order.
9.1.2 Re-proling of preference shares
PEL offered re-proling of preference shares to investors, who did not convert their preference shares into ordinary shares in response to the conversion notices issued by PEL.The investors to the instrument had, in principle, agreed to the re-proling term sheet and commercial terms and conditions therein. Further, SECP had allowed PEL to proceed with the re-proling subject to fulllment of legal requirements. The legal documentation was prepared and circulated amongst the concerned investors which was endorsed by the said investors except for National Bank of Pakistan, as a result of which the original time frame for reproling has lapsed. PEL is in the process of nalising another reproling exercise based on mutual agreement to be made amongst the existing investors.
9.1.3 Accumulated preference dividend
As at reporting date an amount of approximately Rs. 384.39 million (2017: Rs. 341.68 million) has been accumulated on account of preference dividend which is payable if and when declared by the Board, to be appropriated out of the distributable prots for that year. In case the preference dividend continues to be accumulated it would be settled at the time of exercising the redemption or conversion option in accordance with the under process reproling exercise.
As per the opinion of the Group's legal counsel, the provision of cumulative dividend at 9.5% p.a. will prevail on account of preference dividend, as the approval process of the revised terms of reproling from different quarters is not yet complete.
10 CAPITAL RESERVE
This represents premium on issue of right ordinary shares recognized under Section 83(1) of the repealed Companies Ordinance, 1984.
I 24 Pak Elektron Limited I 25Annual Report 2018
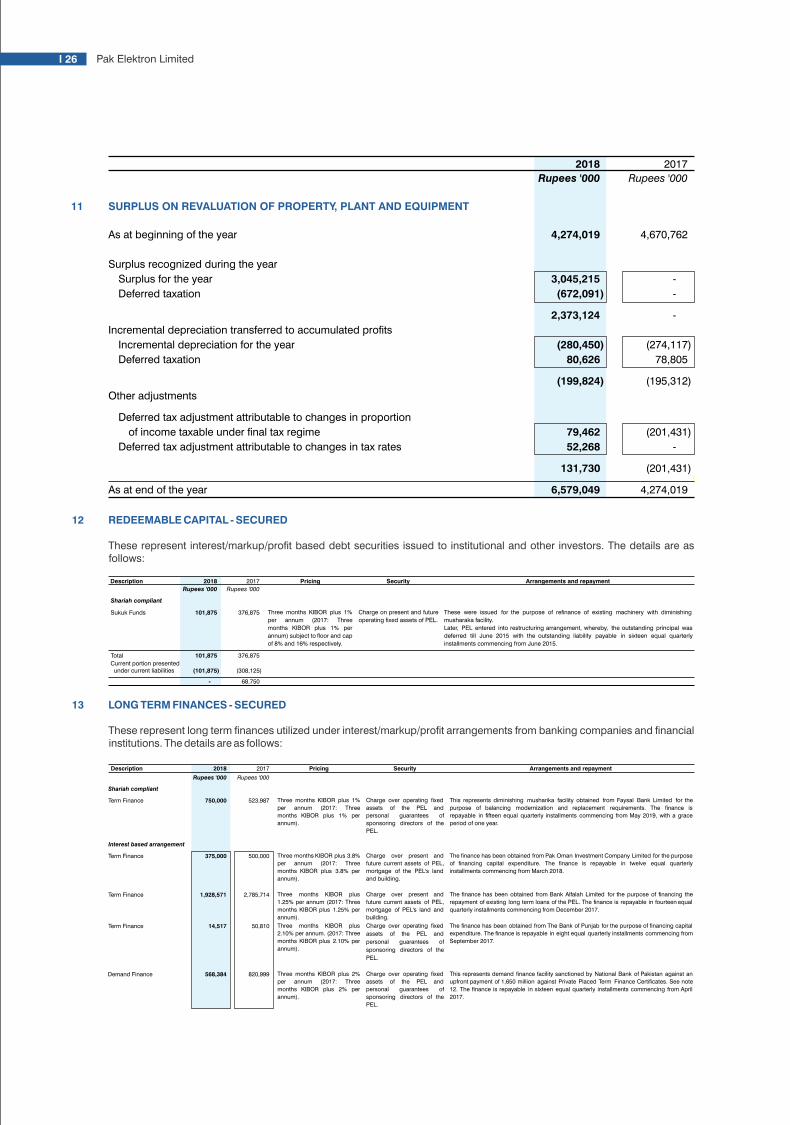
Not later than one year
Later than one year but not later than ve years
Total future minimum lease payments
Finance charge allocated to future periods
Present value of future minimum lease payments
Not later than one year
Later than one year but not later than ve years
15 DEFERRED TAXATION
Deferred tax liability on taxable temporary differences
Deferred tax asset on deductible temporary differences
Note 2018 2017
Rupees '000 Rupees '000
50,351 49,686
64,573
23,703
114,924
73,389
(12,556) (5,327)
102,368
68,062
19 (42,590) (45,656)
59,778 22,406
15.1 3,708,750 3,379,016
15.1 (620,928) (965,665)
3,087,822 2,413,351
14 LIABILITIES AGAINST ASSETS SUBJECT TO FINANCE LEASE
Present value of minimum lease payments
Current portion presented under current liabilities
Note 2018 2017
Rupees '000 Rupees '000
14.1 & 14.2 102,368
68,062
14.1 & 14.2 (42,590) (45,656)
59,778 22,406
11 SURPLUS ON REVALUATION OF PROPERTY, PLANT AND EQUIPMENT
As at beginning of the year
Surplus recognized during the year
Surplus for the year
Deferred taxation
Incremental depreciation transferred to accumulated prots
Incremental depreciation for the year
Deferred taxation
Other adjustments
Deferred tax adjustment attributable to changes in proportion
of income taxable under nal tax regime
Deferred tax adjustment attributable to changes in tax rates
As at end of the year
2018 2017
Rupees '000 Rupees '000
4,274,019 4,670,762
3,045,215 -
(672,091) -
2,373,124 -
(280,450)
(274,117)
80,626
78,805
(199,824)
(195,312)
79,462
(201,431)
52,268
-
131,730
(201,431)
6,579,049
4,274,019
12 REDEEMABLE CAPITAL - SECURED
These represent interest/markup/prot based debt securities issued to institutional and other investors. The details are as follows:
Description 2018 2017 Pricing Security Arrangements and repayment
Rupees '000 Rupees '000
Shariah compliant
Sukuk Funds 101,875 376,875
Total 101,875 376,875
Current portion presented under current liabilities (101,875) (308,125)
- 68,750
Three months KIBOR plus 1%
per annum (2017: Three
months KIBOR plus 1% per
annum) subject to oor and cap
of 8% and 16% respectively.
Charge on present and future
operating xed assets of PEL.
These were issued for the purpose of renance of existing machinery with diminishing
musharaka facility.
Later, PEL entered into restructuring arrangement, whereby, the outstanding principal was
deferred till June 2015 with the outstanding liability payable in sixteen equal quarterly
installments commencing from June 2015.
13 LONG TERM FINANCES - SECURED
These represent long term nances utilized under interest/markup/prot arrangements from banking companies and nancial institutions. The details are as follows:
Shariah compliant
Term Finance 750,000 523,987
Interest based arrangement
Term Finance 375,000 500,000
Term Finance 1,928,571 2,785,714
Term Finance 14,517 50,810
Demand Finance 568,384 820,999
Charge over present and
future current assets of PEL,
mortgage of PEL's land and
building.
The nance has been obtained from Bank Alfalah Limited for the purpose of nancing the
repayment of existing long term loans of the PEL. The nance is repayable in fourteen equal
quarterly installments commencing from December 2017.
Three months KIBOR plus
1.25% per annum (2017: Three
months KIBOR plus 1.25% per
annum).
Three months KIBOR plus 2%
per annum (2017: Three
months KIBOR plus 2% per
annum).
Charge over operating xed
assets of the PEL and
personal guarantees of
sponsoring directors of the
PEL.
This represents demand nance facility sanctioned by National Bank of Pakistan against an
upfront payment of 1,650 million against Private Placed Term Finance Certicates. See note
12. The nance is repayable in sixteen equal quarterly installments commencing from April
2017.
Three months KIBOR plus
2.10% per annum. (2017: Three
months KIBOR plus 2.10% per
annum).
Charge over operating xed
assets of the PEL and
personal guarantees of
sponsoring directors of the
PEL.
The nance has been obtained from The Bank of Punjab for the purpose of nancing capital
expenditure. The nance is repayable in eight equal quarterly installments commencing from
September 2017.
Three months KIBOR plus 3.8%
per annum (2017: Three
months KIBOR plus 3.8% per
annum).
Charge over present and
future current assets of PEL,
mortgage of the PEL's land
and building.
The nance has been obtained from Pak Oman Investment Company Limited for the purpose
of nancing capital expenditure. The nance is repayable in twelve equal quarterly
installments commencing from March 2018.
Three months KIBOR plus 1%
per annum (2017: Three
months KIBOR plus 1% per
annum).
Charge over operating xed
assets of the PEL and
personal guarantees of
sponsoring directors of the
PEL.
This represents diminishing musharika facility obtained from Faysal Bank Limited for the
purpose of balancing modernization and replacement requirements. The nance is
repayable in fteen equal quarterly installments commencing from May 2019, with a grace
period of one year.
Description 2018 2017 Pricing Security Arrangements and repayment
Rupees '000 Rupees '000
Demand Finance 679,406 951,168
3,565,878 5,108,691
Total 4,315,878 5,632,678
Current portion presented under current liabilities (1,669,846) (1,673,911)
2,646,032 3,958,767
Three months KIBOR plus
2.25% per annum (2017: Three
months KIBOR plus 2.25% per
annum).
Charge over present and
future current assets of the
PEL and personal guarantees
of sponsoring directors of
PEL.
The nance has been obtained from National Bank of Pakistan for settlement of long term
nances obtained from NIB Bank Limited. The nance is repayable in twenty three equal
quarterly installments commencing from September 2015.
Description 2018 2017 Pricing Security Arrangements and repayment
Rupees '000 Rupees '000
14.1 These represent vehicles and machinery acquired under nance lease arrangements. The leases are priced at rates ranging from six months KIBOR plus 1.5% to 4.5% per annum (2017: six months to one year KIBOR plus 1.5% to 4.5% per annum). Lease rentals are payable monthly over a tenor ranging from 3 to 4 years. Under the terms of agreement, taxes, repairs, replacements and insurance costs in respect of assets subject to nance lease are borne by the Group. The Group also has the option to acquire these assets at the end of their respective lease terms by adjusting the deposit amount against the residual value of the asset and intends to exercise the option.
14.2 The amount of future payments under the nance lease arrangements and the period in which these payments will become due are as follows:
I 26 Pak Elektron Limited I 27 Annual Report 2018

Not later than one year
Later than one year but not later than ve years
Total future minimum lease payments
Finance charge allocated to future periods
Present value of future minimum lease payments
Not later than one year
Later than one year but not later than ve years
15 DEFERRED TAXATION
Deferred tax liability on taxable temporary differences
Deferred tax asset on deductible temporary differences
Note 2018 2017
Rupees '000 Rupees '000
50,351 49,686
64,573
23,703
114,924
73,389
(12,556) (5,327)
102,368
68,062
19 (42,590) (45,656)
59,778 22,406
15.1 3,708,750 3,379,016
15.1 (620,928) (965,665)
3,087,822 2,413,351
14 LIABILITIES AGAINST ASSETS SUBJECT TO FINANCE LEASE
Present value of minimum lease payments
Current portion presented under current liabilities
Note 2018 2017
Rupees '000 Rupees '000
14.1 & 14.2 102,368
68,062
14.1 & 14.2 (42,590) (45,656)
59,778 22,406
11 SURPLUS ON REVALUATION OF PROPERTY, PLANT AND EQUIPMENT
As at beginning of the year
Surplus recognized during the year
Surplus for the year
Deferred taxation
Incremental depreciation transferred to accumulated prots
Incremental depreciation for the year
Deferred taxation
Other adjustments
Deferred tax adjustment attributable to changes in proportion
of income taxable under nal tax regime
Deferred tax adjustment attributable to changes in tax rates
As at end of the year
2018 2017
Rupees '000 Rupees '000
4,274,019 4,670,762
3,045,215 -
(672,091) -
2,373,124 -
(280,450)
(274,117)
80,626
78,805
(199,824)
(195,312)
79,462
(201,431)
52,268
-
131,730
(201,431)
6,579,049
4,274,019
12 REDEEMABLE CAPITAL - SECURED
These represent interest/markup/prot based debt securities issued to institutional and other investors. The details are as follows:
Description 2018 2017 Pricing Security Arrangements and repayment
Rupees '000 Rupees '000
Shariah compliant
Sukuk Funds 101,875 376,875
Total 101,875 376,875
Current portion presented under current liabilities (101,875) (308,125)
- 68,750
Three months KIBOR plus 1%
per annum (2017: Three
months KIBOR plus 1% per
annum) subject to oor and cap
of 8% and 16% respectively.
Charge on present and future
operating xed assets of PEL.
These were issued for the purpose of renance of existing machinery with diminishing
musharaka facility.
Later, PEL entered into restructuring arrangement, whereby, the outstanding principal was
deferred till June 2015 with the outstanding liability payable in sixteen equal quarterly
installments commencing from June 2015.
13 LONG TERM FINANCES - SECURED
These represent long term nances utilized under interest/markup/prot arrangements from banking companies and nancial institutions. The details are as follows:
Shariah compliant
Term Finance 750,000 523,987
Interest based arrangement
Term Finance 375,000 500,000
Term Finance 1,928,571 2,785,714
Term Finance 14,517 50,810
Demand Finance 568,384 820,999
Charge over present and
future current assets of PEL,
mortgage of PEL's land and
building.
The nance has been obtained from Bank Alfalah Limited for the purpose of nancing the
repayment of existing long term loans of the PEL. The nance is repayable in fourteen equal
quarterly installments commencing from December 2017.
Three months KIBOR plus
1.25% per annum (2017: Three
months KIBOR plus 1.25% per
annum).
Three months KIBOR plus 2%
per annum (2017: Three
months KIBOR plus 2% per
annum).
Charge over operating xed
assets of the PEL and
personal guarantees of
sponsoring directors of the
PEL.
This represents demand nance facility sanctioned by National Bank of Pakistan against an
upfront payment of 1,650 million against Private Placed Term Finance Certicates. See note
12. The nance is repayable in sixteen equal quarterly installments commencing from April
2017.
Three months KIBOR plus
2.10% per annum. (2017: Three
months KIBOR plus 2.10% per
annum).
Charge over operating xed
assets of the PEL and
personal guarantees of
sponsoring directors of the
PEL.
The nance has been obtained from The Bank of Punjab for the purpose of nancing capital
expenditure. The nance is repayable in eight equal quarterly installments commencing from
September 2017.
Three months KIBOR plus 3.8%
per annum (2017: Three
months KIBOR plus 3.8% per
annum).
Charge over present and
future current assets of PEL,
mortgage of the PEL's land
and building.
The nance has been obtained from Pak Oman Investment Company Limited for the purpose
of nancing capital expenditure. The nance is repayable in twelve equal quarterly
installments commencing from March 2018.
Three months KIBOR plus 1%
per annum (2017: Three
months KIBOR plus 1% per
annum).
Charge over operating xed
assets of the PEL and
personal guarantees of
sponsoring directors of the
PEL.
This represents diminishing musharika facility obtained from Faysal Bank Limited for the
purpose of balancing modernization and replacement requirements. The nance is
repayable in fteen equal quarterly installments commencing from May 2019, with a grace
period of one year.
Description 2018 2017 Pricing Security Arrangements and repayment
Rupees '000 Rupees '000
Demand Finance 679,406 951,168
3,565,878 5,108,691
Total 4,315,878 5,632,678
Current portion presented under current liabilities (1,669,846) (1,673,911)
2,646,032 3,958,767
Three months KIBOR plus
2.25% per annum (2017: Three
months KIBOR plus 2.25% per
annum).
Charge over present and
future current assets of the
PEL and personal guarantees
of sponsoring directors of
PEL.
The nance has been obtained from National Bank of Pakistan for settlement of long term
nances obtained from NIB Bank Limited. The nance is repayable in twenty three equal
quarterly installments commencing from September 2015.
Description 2018 2017 Pricing Security Arrangements and repayment
Rupees '000 Rupees '000
14.1 These represent vehicles and machinery acquired under nance lease arrangements. The leases are priced at rates ranging from six months KIBOR plus 1.5% to 4.5% per annum (2017: six months to one year KIBOR plus 1.5% to 4.5% per annum). Lease rentals are payable monthly over a tenor ranging from 3 to 4 years. Under the terms of agreement, taxes, repairs, replacements and insurance costs in respect of assets subject to nance lease are borne by the Group. The Group also has the option to acquire these assets at the end of their respective lease terms by adjusting the deposit amount against the residual value of the asset and intends to exercise the option.
14.2 The amount of future payments under the nance lease arrangements and the period in which these payments will become due are as follows:
I 26 Pak Elektron Limited I 27 Annual Report 2018

16 DEFERRED INCOME
As at beginning of the year
Recognized in prot or loss
As at end of the year
2018 2017
Rupees '000 Rupees '000
38,717 40,755
(1,936) (2,038)
36,781 38,717
15.1 Recognized deferred tax assets and liabilities
Deferred tax assets and liabilities are attributable to the following:
Deferred tax liabilities
Operating xed assets - owned
Operating xed assets - leased
Deferred tax assets
Provisions
Unused tax losses and credits
Long term investments
Deferred tax liabilities
Operating xed assets - owned
Operating xed assets - leased
Deferred tax assets
Provisions
Unused tax losses and credits
Long term investments
As at Recognized in Recognized on As at
January 01 prot or loss balance sheet December 31
Rupees '000 Rupees '000 Rupees '000 Rupees '000
3,351,793 (213,815) 540,361 3,678,339
27,223
3,188
-
30,411
3,379,016 (210,627) 540,361 3,708,750
(215,828) 26,024 - (189,804)
(742,959)
318,992
- (423,967)
(6,878) (279) -
(7,157)
(965,665) 344,737 - (620,928)
2,413,351
134,110
540,361
3,087,822
As at
January 01
Rupees '000
2,942,669 40,117
2,982,786
(148,260)
(508,333)
-
(656,593)
2,326,193
Recognized in
prot or loss
Rupees '000
207,693 (12,894)
194,799
(67,568)
(234,626)
(6,878)
(309,072)
(114,273)
Recognized on
balance sheet
Rupees '000
201,431
-
201,431
-
-
-
-
201,431
As at
December 31
Rupees '000
3,351,793
27,223
3,379,016
(215,828)
(742,959)
(6,878)
(965,665)
2,413,351
2017
2018
15.2 Deferred tax arising from the timing differences pertaining to income taxable under normal provisions and as a separate block of the Income Tax Ordinance, 2001 ('the Ordinance') has been calculated at 29% and 15 % (2017: 30% and 15%) respectively of the timing differences based on tax rates notied by the Government of Pakistan for future tax years for such income.
16.1 The UNIDO vide its contract number 2000/257 dated December 15, 2000, out of the multilateral fund for the implementation of the Montreal Protocol, has given grant-in-aid to PEL for the purpose of phasing out ODS at the Refrigerator and Chest Freezer Plant of PEL. The total grant-in-aid of USD 1,367,633 (Rs. 91,073,838) comprises the capital cost of the project included in xed assets amounting to USD 1,185,929 (Rs. 79,338,650) and grant recoverable in cash of USD 181,704 (Rs. 11,735,188) being the incremental operating cost for six months.
The grant received in cash amounting to Rs.11,735,188 was recognized as income in the year of receipt i.e. year ended June 30, 2001. The value of machinery received in grant was capitalized in year 2001 which started its operation in January 2003. The grant amounting to Rs. 1.936 million (2017: Rs. 2.038 million) has been included in other income in proportion to depreciation charged on related plant and machinery keeping in view the matching principle.
17
unsecured
ecured
nsecured
unsecured
17.1
17.2 Workers' Prot Participation Fund
As at beginning of the year
Interest on fund utilized by the Group
Charged to prot or loss for the year
Paid during the year
As at end of the year
17.2.1
17.3
18
Workers' Welfare Fund
As at beginning of the year
Charged to prot or loss for the year
Paid/adjusted during the year
As at end of the year
SHORT TERM BORROWINGS
Secured
Short term nances utilized under interest/markup/prot arrangements from
- Banking companies - Interest based arrangement
- Banking companies - Shariah compliant
- Non Banking Finance Companies ('NBFCs')
Unsecured
Short term nances utilized under interest/markup arrangements from
Non Banking Finance Companies ('NBFCs') - Interest based arrangement
Book overdraft
TRADE AND OTHER PAYABLES
Trade creditors -
Foreign bills payable - s
Accrued liabilities
Advances from customers - u
Employees' provident fund
Compensated absences
Advance against contracts
Workers' Prot Participation Fund
Workers' Welfare Fund
Other payables -
Foreign bills payable are secured against bills of exchange accepted by the Group in favour of suppliers.
Interest on funds utilized by the Group has been recognized at 9 % (2017: 8.5%) per annum.
Note 2018 2017
Rupees '000 Rupees '000
414,995 399,217
17.1 108,823 99,102
182,301 138,364
82,117
119,864
11,247
13,423
34,162
33,114
47 11,852
9,615
17.2 26,765
82,450
17.3 31,883
73,897
18,705
10,984
922,850
980,030
Note 2018 2017
Rupees '000 Rupees '000
82,450
99,939
41 4,940
5,655
40 26,772
81,504
(87,397)
(104,648)
26,765 82,450
Note 2018 2017
Rupees '000 Rupees '000
73,897
84,078
40 31,883
73,897
(73,897)
(84,078)
31,883 73,897
18.1 10,202,314 4,673,422
18.1 1,854,937 1,000,000
18.2 200,000 350,000
12,257,251 6,023,422
18.3 - 1,135,174
18.5 586,597 68,772
12,843,848 7,227,368
I 28 Pak Elektron Limited I 29Annual Report 2018
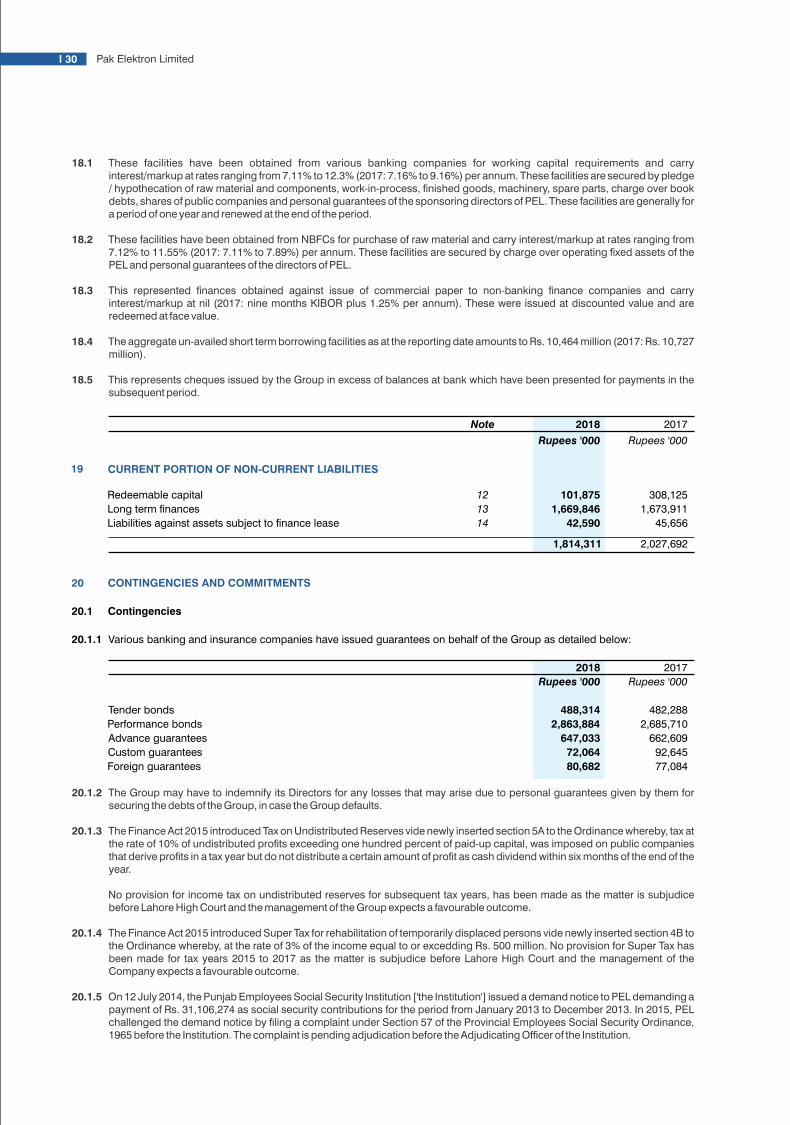
19 CURRENT PORTION OF NON-CURRENT LIABILITIES
Redeemable capital
Long term nances
Liabilities against assets subject to nance lease
20 CONTINGENCIES AND COMMITMENTS
20.1 Contingencies
20.1.1
Tender bonds
Performance bonds
Advance guarantees
Custom guarantees
Foreign guarantees
Various banking and insurance companies have issued guarantees on behalf of the Group as detailed below:
Note 2018 2017
Rupees '000 Rupees '000
12 101,875
308,125
13 1,669,846
1,673,911
14 42,590
45,656
1,814,311
2,027,692
2018 2017
Rupees '000 Rupees '000
488,314
482,288
2,863,884 2,685,710
647,033 662,609
72,064 92,645
80,682 77,084
18.1 These facilities have been obtained from various banking companies for working capital requirements and carry interest/markup at rates ranging from 7.11% to 12.3% (2017: 7.16% to 9.16%) per annum. These facilities are secured by pledge / hypothecation of raw material and components, work-in-process, nished goods, machinery, spare parts, charge over book debts, shares of public companies and personal guarantees of the sponsoring directors of PEL. These facilities are generally for a period of one year and renewed at the end of the period.
18.2 These facilities have been obtained from NBFCs for purchase of raw material and carry interest/markup at rates ranging from 7.12% to 11.55% (2017: 7.11% to 7.89%) per annum. These facilities are secured by charge over operating xed assets of the PEL and personal guarantees of the directors of PEL.
18.3 This represented nances obtained against issue of commercial paper to non-banking nance companies and carry interest/markup at nil (2017: nine months KIBOR plus 1.25% per annum). These were issued at discounted value and are redeemed at face value.
18.4 The aggregate un-availed short term borrowing facilities as at the reporting date amounts to Rs. 10,464 million (2017: Rs. 10,727 million).
18.5 This represents cheques issued by the Group in excess of balances at bank which have been presented for payments in the subsequent period.
20.1.2 The Group may have to indemnify its Directors for any losses that may arise due to personal guarantees given by them for securing the debts of the Group, in case the Group defaults.
20.1.3 The Finance Act 2015 introduced Tax on Undistributed Reserves vide newly inserted section 5A to the Ordinance whereby, tax at the rate of 10% of undistributed prots exceeding one hundred percent of paid-up capital, was imposed on public companies that derive prots in a tax year but do not distribute a certain amount of prot as cash dividend within six months of the end of the year.
No provision for income tax on undistributed reserves for subsequent tax years, has been made as the matter is subjudice before Lahore High Court and the management of the Group expects a favourable outcome.
20.1.4 The Finance Act 2015 introduced Super Tax for rehabilitation of temporarily displaced persons vide newly inserted section 4B to the Ordinance whereby, at the rate of 3% of the income equal to or excedding Rs. 500 million. No provision for Super Tax has been made for tax years 2015 to 2017 as the matter is subjudice before Lahore High Court and the management of the Company expects a favourable outcome.
20.1.5 On 12 July 2014, the Punjab Employees Social Security Institution ['the Institution'] issued a demand notice to PEL demanding a payment of Rs. 31,106,274 as social security contributions for the period from January 2013 to December 2013. In 2015, PEL challenged the demand notice by ling a complaint under Section 57 of the Provincial Employees Social Security Ordinance, 1965 before the Institution. The complaint is pending adjudication before the Adjudicating Ofcer of the Institution.
20.1.6 In tax year 2014 Worker’s Welfare Fund was levied at Rs. 1.55 million contrary to the judgements of the Lahore High Court [‘LHC’] and the apex court and it is expected that this liability will be deleted by the Appellate Authority.
20.1.7 The Group’s case was selected for audit by the Additional Commissioner Inland Revenue ['ACIR'] for tax years 2009, 2016 and 2017. The Group has led appeals for these tax years before the Commissioner Inland Revenue (Appeals) [‘CIR(A)’], and the appellate orders are yet awaited. The issues raised in these appeals are mostly concerning disallowance of various expenses. The management expect to get adequate relief from the Appellate Authority and no additional tax liability is expected to arise.
20.1.8 As per order under section 137(2) of the Income Tax Ordinance, 2001 [‘the Ordinance’] dated October 20, 2017 a refund of Rs. 441.28 million has been determined for the tax year 2016. The department has led an appeal before the Appellate Tribunal Inland Revenue ['ATIR'] on the relief allowed by the Commissioner Inland Revenue (Appeals) [‘CIR(A)’] on the account of adjustment of minimum tax under section 113(2)(c) and tax credit allowed under section 65E of the Ordinance. The appeal led is not xed for hearing. The ATIR in different case has allowed relief respecting the claim of tax under section 113 (2)(c) of the Ordinance. The management expect to get adequate relief from the Appellate Authority and no additional tax liability is expected to arise.
20.2
20.2.1 Commitments under irrevocable letters of credit for import of
Commitments
stores, spare parts and raw material
- payments not later than one year
- payments later than one year
2018 2017
Rupees '000 Rupees '000
2,012,639
1,926,602
2018 2017
Rupees '000 Rupees '000
13,295 44,389
16,139 11,333
29,434 55,722
20.2.2 Commitments under ijarah contracts
The aggregate amount of ujrah payments for ijarah nancing and the period in which these payments will become due are as follows:
I 30 Pak Elektron Limited I 31Annual Report 2018
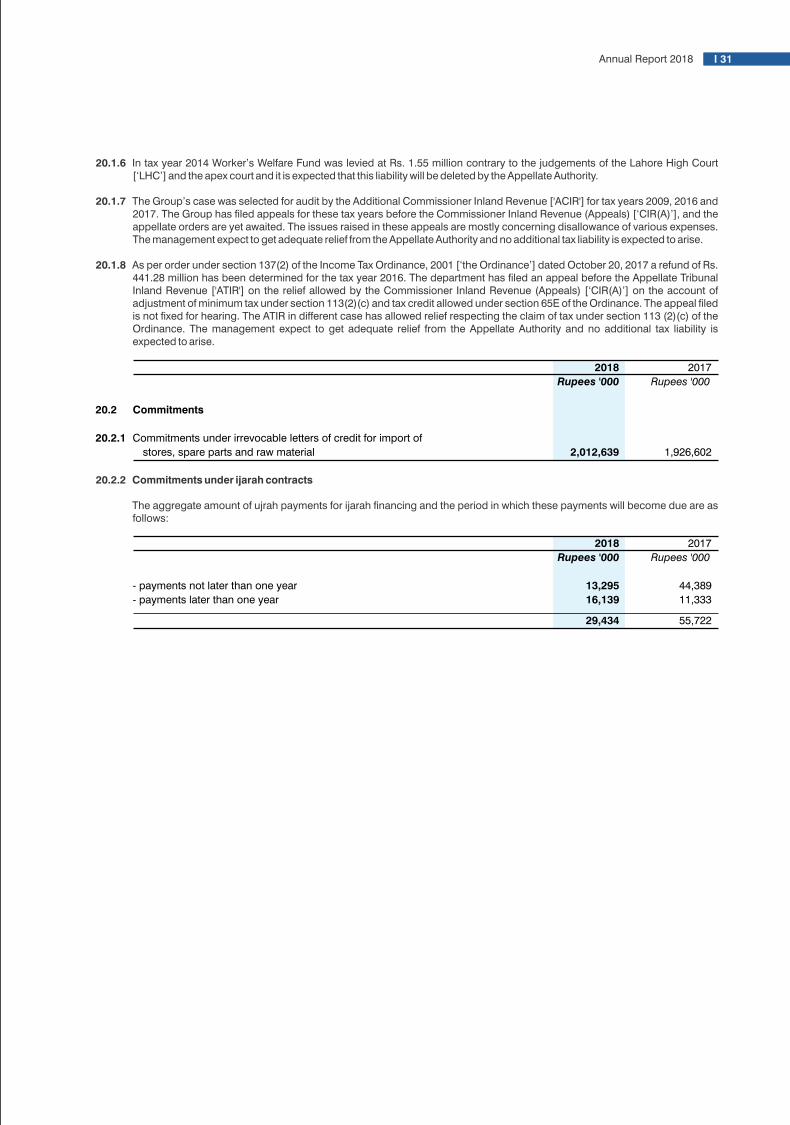

21
PR
OP
ER
TY,
PL
AN
T A
ND
EQ
UIP
ME
NT
Net
boo
k
As
atA
s at
As
atA
s at
valu
e as
at
Janu
ary
01A
dditi
ons
Rev
alua
tion
Dis
posa
lsTr
ansf
ers
Dec
embe
r 31
Rat
eJa
nuar
y 01
For
the
year
Rev
alua
tion
Adj
ustm
ent
Dec
embe
r 31
Dec
embe
r 31
Rup
ees
'000
Rup
ees
'000
Rup
ees
'000
Rup
ees
'000
Rup
ees
'000
Rup
ees
'000
%R
upee
s '0
00R
upee
s '0
00R
upee
s '0
00R
upee
s '0
00R
upee
s '0
00R
upee
s '0
00
Ass
ets
owne
d by
the
Gro
up
Leas
ehol
d la
nd13
,256
--
--
13,2
56
-
-
-
-
-
-
13,2
56
Free
hold
land
539,
232
-48
2,76
8-
-1,
022,
000
-
-
-
-
-
-
1,02
2,00
0
Bui
ldin
g on
leas
ehol
d la
nd1,
763,
372
-45
3,65
0-
-2,
217,
022
575
1,90
4
50,5
74
206,
448
-
1,00
8,92
6
1,20
8,09
6
Bui
ldin
g on
free
hold
land
2,75
6,95
1-
709,
259
--
3,46
6,21
0
588
4,53
9
93,6
20
251,
643
-
1,22
9,80
2
2,23
6,40
8
Pla
nt a
nd m
achi
nery
18,5
43,2
2039
1,79
02,
936,
118
(114
,785
)52
,068
21,8
08,4
11
56,
308,
542
614,
754
1,07
8,48
9
8,83
6
8,01
0,62
1
13,7
97,7
90
Of
ce e
quip
men
t and
xt
ures
214,
254
35,2
08-
(52,
506)
-19
6,95
6
1011
8,94
3
10,7
67
-
(44,
530)
85,1
80
111,
776
Com
pute
r har
dwar
e an
d al
lied
item
s14
1,23
211
,918
-(2
6,73
6)-
126,
414
3010
9,97
2
17,7
97
-
(25,
019)
102,
750
23,6
64
Vehi
cles
309,
313
18,5
83-
(45,
906)
19,1
3330
1,12
3
2013
0,39
8
34,6
22
-
(11,
387)
153,
633
147,
490
24,2
80,8
3045
7,49
94,
581,
795
(239
,933
)71
,201
29,1
51,3
92
8,30
4,29
8
822,
134
1,53
6,58
0
(72,
100)
10,5
90,9
12
18,5
60,4
80
Ass
ets
subj
ect t
o n
ance
leas
e
Pla
nt a
nd m
achi
nery
103,
488
109,
944
--
(52,
068)
161,
364
510
,753
4,63
7
-
(8,9
56)
6,43
4
154,
930
Vehi
cles
102,
834
16,4
38-
-(1
9,13
3)10
0,13
9
2032
,815
14,1
30
-
(10,
191)
36,7
54
63,3
85
206,
322
126,
382
--
(71,
201)
261,
503
43,5
68
18,7
67
-
(19,
147)
43,1
88
218,
315
24,4
87,1
5258
3,88
14,
581,
795
(239
,933
)-
29,4
12,8
95
8,34
7,86
6
840,
901
1,53
6,58
0
(91,
247)
10,6
34,1
00
18,7
78,7
95
Cap
ital w
ork
in p
rogr
ess
Bui
ldin
g on
free
hold
land
1,
010,
883
1,42
3,08
7-
--
2,43
3,97
0
-
-
-
-
-
2,43
3,97
0
Pla
nt a
nd m
achi
nery
255,
544
488,
706
--
-74
4,25
0
-
-
-
-
-
744,
250
1,26
6,42
71,
911,
793
--
-3,
178,
220
-
-
-
-
-
3,17
8,22
0
25,7
53,5
792,
495,
674
4,58
1,79
5(2
39,9
33)
32,5
91,1
158,
347,
866
840,
901
1,53
6,58
0(9
1,24
7)10
,634
,100
21,9
57,0
15
2018
CO
ST
/ RE
VALU
ED
AM
OU
NT
DE
PR
EC
IATI
ON
Net
boo
k
As
atA
s at
As
atA
s at
valu
e as
at
Janu
ary
01A
dd
ition
sR
eval
uatio
nD
isp
osal
sTr
ansf
ers
Dec
emb
er 3
1R
ate
Janu
ary
01Fo
r th
e ye
arR
eval
uatio
nA
dju
stm
ent
Dec
emb
er 3
1D
ecem
ber
31
Rup
ees
'000
Rup
ees
'000
Rup
ees
'000
Rup
ees
'000
Rup
ees
'000
Rup
ees
'000
%R
upee
s '0
00R
upee
s '0
00R
upee
s '0
00R
upee
s '0
00R
upee
s '0
00R
upee
s '0
00
Ass
ets
owne
d by
the
Gro
up
Leas
ehol
d la
nd13
,256
--
--
13,2
56
-
-
-
-
-
-
13,2
56
Free
hold
land
539,
232
--
--
539,
232
-
-
-
-
-
-
539,
232
Bui
ldin
g o
n le
aseh
old
land
1,76
3,37
2-
--
-1,
763,
372
569
8,66
9
53,2
35
-
-
751,
904
1,01
1,46
8
Bui
ldin
g o
n fr
eeho
ld la
nd2,
754,
337
2,61
4-
--
2,75
6,95
1
578
6,06
2
98,4
77
-
-
884,
539
1,87
2,41
2
Pla
nt a
nd m
achi
nery
17,9
18,9
8052
1,54
0-
-10
2,70
018
,543
,220
55,
655,
258
636,
896
-
16,3
88
6,30
8,54
2
12,2
34,6
78
Of
ce e
qui
pm
ent a
nd
xtur
es19
4,67
423
,644
-(4
,064
)-
214,
254
1011
2,49
1
9,13
7
-
(2,6
85)
118,
943
95,3
11
Com
put
er h
ard
war
e an
d a
llied
item
s12
8,66
428
,324
-(1
5,75
6)-
141,
232
3010
7,68
8
17,6
33
-
(15,
349)
109,
972
31,2
60
Vehi
cles
183,
497
132,
022
-(6
2,27
6)56
,070
309,
313
2097
,002
31,2
19
-
2,17
7
130,
398
178,
915
23,4
96,0
1270
8,14
4-
(82,
096)
158,
770
24,2
80,8
30
7,45
7,17
0
846,
597
-
531
8,30
4,29
8
15,9
76,5
32
Ass
ets
subj
ect t
o n
ance
leas
e
Pla
nt a
nd m
achi
nery
203,
488
--
-(1
00,0
00)
103,
488
517
,860
9,28
1
-
(16,
388)
10,7
53
92,7
35
Vehi
cles
131,
102
27,8
02-
-(5
6,07
0)10
2,83
4
2046
,496
13,9
98
-
(27,
679)
32,8
15
70,0
19
334,
590
27,8
02-
-(1
56,0
70)
206,
322
64,3
56
23,2
79
-
(44,
067)
43,5
68
162,
754
23,8
30,6
0273
5,94
6-
(82,
096)
2,70
024
,487
,152
7,52
1,52
6
869,
876
-
(43,
536)
8,34
7,86
6
16,1
39,2
86
Cap
ital w
ork
in p
rogr
ess
Bui
ldin
g o
n fr
eeho
ld la
nd
73,5
4793
7,33
6-
--
1,01
0,88
3-
--
--
1,01
0,88
3
Pla
nt a
nd m
achi
nery
59,7
5519
8,48
9-
-(2
,700
)25
5,54
4-
--
--
255,
544
133,
302
1,13
5,82
5-
-(2
,700
)1,
266,
427
--
--
-1,
266,
427
23,9
63,9
041,
871,
771
-(8
2,09
6)-
25,7
53,5
797,
521,
526
869,
876
-(4
3,53
6)8,
347,
866
17,4
05,7
13
2017
CO
ST
/ RE
VA
LUE
D A
MO
UN
TD
EP
RE
CIA
TIO
N
21.1
P
rop
ert
y, p
lan
t an
d e
qu
ipm
en
t in
clu
des
fully
dep
recia
ted
ass
ets
of R
s. 6
4.5
4 m
illio
n (2
01
7: R
s. 7
1.1
5 m
illio
n) w
hic
h a
re s
till
in u
se o
f PE
L.
21.2
F
reeh
old
lan
d o
f PE
L is
locate
d a
t Mo
uza
Ko
t Isl
am
pu
ra, 3
4 -
K.M
, Fero
zep
ur R
oad
, Lah
ore
with
a to
tal a
rea o
f 51
1 K
an
als
(2
01
7: 5
11
Kan
als
).
21.3
Lease
ho
ld la
nd
of P
EL is
locate
d a
t 14
- K
.M, F
ero
zep
ur R
oad
, Lah
ore
an
d P
lot #
30
2-3
03
, Gad
oo
n In
du
stra
il A
rea, G
ad
oo
n A
maza
i with
a to
tal a
rea o
f 32
2 K
an
als
15
Marl
a (2
01
7: 3
22
Kan
als
15
M
arl
a).
I 32 Pak Elektron Limited I 33Annual Report 2018

21.4 Disposal of operating xed assets
Accumulated Net Disposal Gain/(loss) Mode of
Particulars Cost depreciation book value proceeds on disposal disposal
Rupees '000 Rupees '000 Rupees '000 Rupees '000 Rupees '000
Ofce equipment and xtures
Assets having net book value less than Rs. 500,000 each
Table and chairs 5,246 3,995
1,251
256
(995)
Air conditioners 6,719
5,268
1,451
328
(1,123)
Mobile sets 566
299
267
-
(267)
Miscellaneous ofce items 39,975 34,968 5,007 1,949
(3,058)
52,506
44,530
7,976
2,533
(5,443)
Computer hardware and allied items
Assets having net book value less than Rs. 500,000 each
Computer and printers 10,961
10,961
-
512
512
Laptops 4,441
2,792
1,649
2,901
1,252
Mobile sets 427
359
68
39
(29)
Allied items 10,907 10,907 - 382 382
26,736
25,019
1,717
3,834
2,117
Vehicles
Audi A3 4,060
460
3,600
4,750
1,150
BMW X1 5,217
591
4,626
5,737
1,111
Honda City 1,494
971
523
747
224
Honda Civic 2,439
1,505
934
642
(292)
Honda Civic 2,489
1,460
1,029
539
(490)
Honda Civic 2,469
1,448
1,021
560
(461)
Honda Civic 2,448
1,277
1,171
470
(701)
Honda Civic 2,164
793
1,371
1,456
85
Honda Civic 2,521
892
1,629
328
(1,301)
Porsche 1,202 439 763 3,000 2,237
Suzuki Mehran 578 10 568 222 (346)
Toyota Corolla 1,731 1,015 716 600 (116)
Toyota Corolla 1,771 924 847 831 (16)
Assets having net book value less than Rs. 500,000 each
Honda City 1,438 1,028 410 568 158
Suzuki Cultus 1,020 740 280 203 (77)
Suzuki Cultus 990 692 298 498 200
Suzuki Cultus 1,049 615 434 544 110
Suzuki Cultus 1,039 586 453 572 119
Suzuki Cultus 106 12 94 401 307
Suzuki Cultus 106 12 94 307 213
Suzuki Mehran 612 431 181 700 519
Suzuki Mehran 612 431 181 305 124
Suzuki Mehran 612 431 181 213 32
Suzuki Mehran 612 431 181 - (181)
Suzuki Mehran 640 420 220 345 125
Suzuki Mehran 657 427 230 167 (63)
Suzuki Mehran 657 427 230 167 (63)
Suzuki Mehran 657 427 230 320 90
Suzuki Mehran 688 404 284 472 188
Suzuki Mehran 69 14 55 474 419
Suzuki Mehran 69 16 53 170 117
Suzuki Swift DX 1,131 797 334 383 49
Toyota Corolla 168 - 168 1,450 1,282
Toyota XLI 1,554 1,095 459 306 (153)
Motor Bike 63 55 8 64 56
Motor Bike 41 30 11 41 30
Motor Bike 57 39 18 69 51
Motor Bike 85 53 32 - (32)
Motor Bike 62 29 33 62 29
Motor Bike 62 32 30 62 32
Motor Bike 62 28 34 64 30
Motor Bike 64 29 35 64 29
Motor Bike 42 18 24 42 18
Motor Bike 64 23 41 64 23
Motor Bike 64 21 43 25 (18)
Motor Bike 171 - 171 917 746
Negotiation
Negotiation
As Per Company Policy
Negotiation
Negotiation
Negotiation
As Per Company Policy
Negotiation
As Per Company Policy
As Per Company Policy
As Per Company Policy
As Per Company Policy
As Per Company Policy
As Per Company Policy
As Per Company Policy
As Per Company Policy
As Per Company Policy
Negotiation
As Per Company Policy
As Per Company Policy
As Per Company Policy
As Per Company Policy
As Per Company Policy
As Per Company Policy
As Per Company Policy
As Per Company Policy
As Per Company Policy
As Per Company Policy
As Per Company Policy
As Per Company Policy
As Per Company Policy
As Per Company Policy
As Per Company Policy
As Per Company Policy
As Per Company Policy
As Per Company Policy
As Per Company Policy
As Per Company Policy
As Per Company Policy
As Per Company Policy
As Per Company Policy
As Per Company Policy
As Per Company Policy
As Per Company Policy
As Per Company Policy
As Per Company Policy
As Per Company Policy
As Per Company Policy
As Per Company Policy
As Per Company Policy
As Per Company Policy
As Per Company Policy
As Per Company Policy
As Per Company Policy
Particulars of buyer
Various individuals
Various individuals
Various individuals
Various individuals
Various individuals
Various individuals
Various individuals
Various individuals
Mehdi Hassan (employee)
78, Block C, DHA Phase-1, Lahore.
Mehdi Hassan (employee)
78, Block C, DHA Phase-1, Lahore.
Atif Imtiaz (employee)
23-A, New Staff Colony U.E.T, Lahore.
Waseem Ishaq (employee)
199-A, Block C, PCSIR, College Road, Lahore.
Iftikhar Ahmed (employee)
100, Block E, Askari 10, AOHC, Lahore.
Tariq Irani (employee)
5, Block G4, Wapda Town, Lahore.
Javed A Khan (employee)
777, Ammar Shaheed Road Chahklala Scheme 3, Rawalpindi.
Atif Ali (employee)
180, Block C, Gulshan-e-Ravi, Lahore.
Sadiq Munir (employee)
173-A, New Muslim Town, Lahore.
Performance Automotive
24-D, Al Faisal Town, Lahore.
Shees Butt (employee)
442, Millat Road, Taj Colony, Faisalabad.
Javed Iqbal (employee)
10-A, Block E, Muhaz Town, Multan Road, Lahore.
Rizwan Cheema (employee)
149-B, PCSIR Colony, Canal Road, Lahore.
Imran Iqbal (employee)
Shaq Ahmed (employee)
M Mukhtar Khan (employee)
Irshad Khan (employee)
Salman (employee)
Shahid Ahmed (employee)
Muhammad Asif (employee)
Muhammad Shaq (employee)
Masood ul Hassan (employee)
Tahir Ikram (employee)
Muhammad Asghar (employee)
Sami Ullah Qazi (employee)
Amer Fayyaz (employee)
Sharaf ud Din (employee)
Nasir Javed (employee)
Muhammad Zeeshan (employee)
Uzair (employee)
Shafqat (employee)
Abdul Qavi Butt (employee)
Azeem (employee)
Manzar Hassan (employee)
Waqas (employee)
Abid (employee)
Badar (employee)
Faisal (employee)
Abid Tabassum (employee)
Nauman (employee)
Syed Anwar Ali (employee)
Muhammad Ali Shahbaz (employee)
Nadeem Shahzad (employee)
Abid Tabassum (employee)
Gulman Shah (employee)
Jehanzeb Ahmed (employee)
45,906 21,578 24,328 29,921 5,593
125,148 91,127 34,021 36,288 2,267
2018
Accumulated Net Disposal Gain/(loss) Mode of
Particulars Cost depreciation book value proceeds on disposal disposal Particulars of buyer
Rupees '000 Rupees '000 Rupees '000 Rupees '000 Rupees '000
Ofce equipment and xtures
Table and chairs 1,021 775 246 249 3 Negotiation Various individuals
Air conditioners 1,746 1,233 513 43 (470) Negotiation Various individuals
Mobile sets 364 77 287 94 (193) Negotiation Various individuals
Mobile sets 63 4 59 76 17 Insurance Claim Adamjee insurance
Miscellaneous ofce items 870 596 274 50 (224) Negotiation Various individuals
4,064 2,685 1,379 512 (867)
Computer hardware and allied items
Computer and printers 13,048 13,048 - 342 342 Negotiation Various individuals
Laptops 161 118 43 36 (7) Negotiation Various individuals
Mobile sets 1,854 1,491 363 429 66 Negotiation Various individuals
Allied items 693 692 1 110 109 Negotiation Various individuals
15,756 15,349
407
917
510
Vehicles
Honda City 167 -
167
1,375
1,208
As Per Company Policy Kashif Khan (employee)
Honda City 1,438 979
459
940
481
As Per Company Policy Adnan Shahid (employee)
Honda City 1,603 847
756
201
(555)
As Per Company Policy Arfan Hashmi (employee)
Honda Civic 2,167 1,436
731
719
(12)
As Per Company Policy Nasir Paul (employee)
Toyota Corolla 1,775 -
1,775
1,775
-
As Per Company Policy Javed Iqbal (employee)
Honda Civic 2,383 1,567
816
616
(200)
As Per Company Policy Mehdi Hassan (employee)
Suzuki Cultus 106 -
106
925
819
As Per Company Policy Kamran (employee)
Suzuki Cultus 1,029 528
501
315
(186)
As Per Company Policy Muhammad Hanif (employee)
Suzuki Cultus 106 2
104
825
721
As Per Company Policy Adil Ashfaque (employee)
Suzuki Cultus 85 14
71
439
368
As Per Company Policy Arfan Hashmi (employee)
Suzuki Cultus 1,044 561
483
624
141
As Per Company Policy Khalid Sheikh (employee)
Suzuki Cultus 1,049 516 533 322 (211) As Per Company Policy Umer Shahzad (employee)
Suzuki Cultus 985 621 364 508 144 As Per Company Policy Muhammad Farooq (employee)
Suzuki Cultus 106 5
101
575
474
As Per Company Policy Muhammad Ali (employee)
Suzuki Cultus 1,029 524 505 570 65 As Per Company Policy Tanweer Malik (employee)
Suzuki Mehran 640 416
224
230
6
As Per Company Policy Irfan Ahmad (employee)
Suzuki Mehran 673 345
328
241
(87)
As Per Company Policy Mian Nazir (employee)
Suzuki Mehran 683 348
335
506
171
As Per Company Policy Husnain Arif (employee)
Suzuki Mehran 693 361
332
504
172
As Per Company Policy Khawaja Mudassar (employee)
Suzuki Mehran 657 405
252
167
(85)
As Per Company Policy Attique (employee)
Suzuki Mehran 657 354
303
194
(109)
As Per Company Policy Mahmood (employee)
Suzuki Mehran 657 405
252
358
106
As Per Company Policy Amir Shahzad (employee)
Suzuki Mehran 612 386
226
319
93
As Per Company Policy Afzal (employee)
Suzuki Mehran 612 374
238
340
102
As Per Company Policy Abdul Raheem (employee)
Suzuki Mehran 69 2
67
504
437
As Per Company Policy Yamin Afridi (employee)
Suzuki Swift 1,486 732
754
909
155
As Per Company Policy Muhammad Shahid (employee)
Suzuki Swift 1,282 658
624
562
(62)
As Per Company Policy Muhammad Nauman (employee)
Suzuki Swift 1,282 669
613
532
(81)
As Per Company Policy Shahb Ali (employee)
Suzuki Swift 1,221 634
587
494
(93)
As Per Company Policy Muhammad Shahzad (employee)
Suzuki Swift 1,297 192
1,105
1,107
2
As Per Company Policy Muhammad Farooq (employee)
Suzuki Swift 133 -
133
300
167
As Per Company Policy Nazir (employee)
Suzuki WagonR 92 3
89
443
354
As Per Company Policy Nadeem un Din (employee)
Toyota Corolla 1,824 730 1,094 208 (886) As Per Company Policy Tauqir Akhtar (employee)
Toyota Corolla 1,591 1,084 507 313 (194) As Per Company Policy Tariq Siraj (employee)
Toyota Corolla 1,625 1,047 578 365 (213) As Per Company Policy Muhammad Raq Ahmad (employee)
Toyota Corolla 1,694 926 768 471 (297) As Per Company Policy Jalil ur Rehman (employee)
Toyota Corolla 1,555 874 681 231 (450) As Per Company Policy Ashar Abbas (employee)
Toyota Corolla 1,690 1,098 592 1,070 478 As Per Company Policy Umar Saleemi (employee)
Toyota Corolla 1,690 1,120 570 453 (117) As Per Company Policy Tassawar Hanif (employee)
Toyota Corolla 1,690 1,153 537 441 (96) As Per Company Policy Syed Muhammad Amer (employee)
Toyota Corolla 1,555 1,040 515 761 246 As Per Company Policy Masood Ahmed (employee)
Honda City 1,538 101 1,437 1,799 362 Sale & Lease Back First Habib Modaraba
Suzuki Cultus 961 - 961 1,124 163 Sale & Lease Back First Habib Modaraba
Suzuki Mehran 605 - 605 708 103 Sale & Lease Back First Habib Modaraba
Suzuki Mehran 605 - 605 708 103 Sale & Lease Back First Habib Modaraba
Suzuki WagonR 901 45 856 1,054 198 Sale & Lease Back First Habib Modaraba
Various Motor Cycles 421 155 266 436 170 As Per Company Policy Various individuals
47,763 23,257 24,506 28,581 4,075
67,583 41,291 26,292 30,010 3,718
2017
I 34 Pak Elektron Limited I 35Annual Report 2018

Rupees
Rupees '000
Freehold land 919,800
Buildings on freehold land 2,927,828
Plant and machinery 11,998,078
15,845,706
Freehold land
Buildings
Plant and machinery
Freehold land
Buildings
Plant and machinery
Accumulated Net
Cost depreciation book value
Rupees '000 Rupees '000 Rupees '000
189,184 - 189,184
3,302,326
1,321,029 1,981,297
10,898,107
3,426,343
7,471,764
Accumulated
Cost depreciation Net book value
Rupees '000 Rupees '000 Rupees '000
189,184 - 189,184
3,302,326 1,216,750 2,085,576
10,569,034 3,043,288 7,525,746
2018
2017
21.5 The depreciation charge for the year has been allocated as follows:
Cost of sales
Administrative and general expenses
Note 2018 2017
Rupees '000 Rupees '000
36 772,241 805,694
39 68,660 64,182
840,901
869,876
22 INTANGIBLE ASSETS
Note
Net book
As at As at As at For the As at value as at
January 01 Additions December 31 January 01 period December 31 December 31
Rupees '000' Rupees '000' Rupees '000' Rupees '000' Rupees '000' Rupees '000' Rupees '000'
Technology transfer agreement 22.1 117,054
-
117,054
38,984
3,904
42,888 74,166
Goodwill 22.2 312,341
-
312,341
91,859
-
91,859 220,482
Software 22.3 8,976
8,030
17,006
4,853
2,058
6,911 10,095
Enterprise Resource Planning system 22.4 31,675
-
31,675
18,825
4,241
23,066 8,609
470,046 8,030 478,076 154,521 10,203 164,724 313,352
Accumulated AmortizationCost
2018
Net book
As at As at As at For the As at value as at
January 01 Additions December 31 January 01 period December 31 December 31
Rupees '000' Rupees '000' Rupees '000' Rupees '000' Rupees '000' Rupees '000' Rupees '000'
Technology transfer agreement 22.1 117,054
-
117,054
34,875
4,109
38,984 78,070
Goodwill 22.2 312,341
-
312,341
91,859
-
91,859 220,482
Software 22.3 5,057
3,919
8,976
4,701
152
4,853 4,123
Enterprise Resource Planning system 22.4 31,675
-
31,675
11,036
7,789
18,825 12,850
466,127 3,919 470,046 142,471 12,050 154,521 315,525
2017
Cost Accumulated Amortization
22.1 The Group has obtained technology of single phase meters, three phase digital meters and also of power transformers from different foreign companies. These are amortized on the same rate as of the depreciation of the relevant plant.
22.2 Goodwill represents the difference between the cost of the acquisition (fair value of consideration paid) and the fair value of the net identiable assets acquired at the time of acquisition of PEL Appliances Limited and PEL Daewoo Electronics Limited by the Group. In view of cancelation of LG license, goodwill related to PEL Daewoo Electronics Limited was fully impaired by providing impairment loss of Rs. 140.569 million in December 31, 2011. The carrying value represents goodwill related to PEL Appliances Limited for which there is no indication of impairment.
22.3 The Group has acquired different software for its business purpose. These are being amortized at 33% per annum on reducing balance method.
22.4 These are being amortized at 33% per annum on reducing balance method.
23 LONG TERM INVESTMENTS
This represent investments in ordinary shares of Kohinoor Power Company Limited, an associate. The investment has been accounted for using equity method. The particulars of investment are as follows:
21.6 Revaluation of property, plant and equipment
Most recent valuation of freehold land, buildings on freehold and lease hold land and plant and machinery was carried out by an independent valuer, Asif Associates (Private) Limited, on December 31, 2018 and was incorporated in the nancial statements for the year ended December 31, 2018. For basis of valuation and other fair value measurement disclosures refer to note 50.
Had there been no revaluation, the cost, accumulated depreciation and net book value of revalued items would have been as follows:
21.6.1 As per most recent valuation, forced sale values of freehold land, buildings on freehold land and plant and machinery are as follows:
2018 2017
2,910,600 (2017: 2,910,600) ordinary shares of Rs. 10 each
Percentage of ownership interest 23.10% 23.10%
2018 2017
Rupees '000 Rupees '000
54,701 54,701
(8,857)
(6,401)
45,844
48,300
Cost of investment
Share of post acquisition loss - net of dividend received
Accumulated impairment (38,859)
(39,452)
6,985 8,848
24
Note 2018 2017
Rupees '000 Rupees '000
159,384
170,860
3,411
3,192
4,473
4,028
10,630
23,177
2,456
5,354
2.40 3.04
24.1 7,858 31,131
24.2 42,351 42,351
Assets
Liabilities
Revenue
Loss for the year
Share of loss
Market value per share (Rupees)
LONG TERM DEPOSITS
Financial institutions
Utility companies and regulatory authorities
Customers 24.3 315,748 298,454
365,957 371,936
23.1 Extracts of nancial statements of associated company
The assets and liabilities of Kohinoor Power Company Limited as at the reporting date and related revenue and prot for the year then ended based on the un-audited nancial statements for the year ended December 31, 2018 are as follows:
I 36 Pak Elektron Limited I 37Annual Report 2018
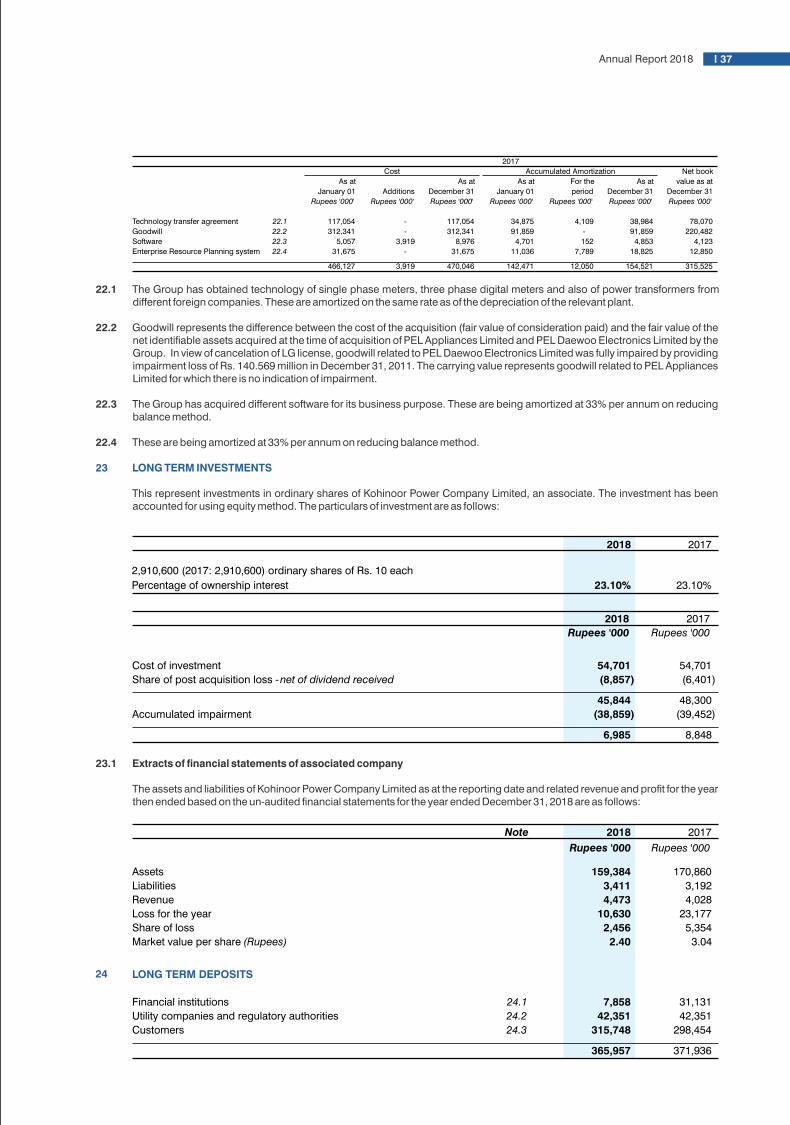

28.2 Movement in impairment allowance
As at beginning of the year
Recognized during the year
As at end of the year
29 DUE AGAINST CONSTRUCTION WORK IN PROGRESS - UNSECURED, CONSIDERED GOOD
30 SHORT TERM ADVANCES
Advances to suppliers and contractors - unsecured
- considered good
- considered doubtful
Impairment allowance for doubtful advances
Advances to employees - unsecured
- considered good
- considered doubtful
Impairment allowance for doubtful advances
This represents unbilled revenue from construction work in progress.
2018 2017
Rupees '000 Rupees '000
576,971 444,589
10,330 132,382
587,301 576,971
589,824 617,091
32,730 32,730
(32,730) (32,730)
589,824 617,091
30.1 449,681 228,735
1,449 1,449
(1,449) (1,449)
449,681 228,735
1,039,505 845,826
Face value of deposits
Additions during the year
Transferred to current assets
Less: unamortized notional interest
As at end of the year
25.2
26
26.1
27
Unamortized notional interest
As at beginning of the year
Recognized during the year
Amortization for the year
As at end of the year
STORES, SPARES AND LOOSE TOOLS
Stores
Spares
Loose tools
Provision for slow moving and obsolete items
STOCK IN TRADE
Raw material
- in stores
- in transit
Provision for slow moving and obsolete items
Work in process
Finished goods
Provision for slow moving and obsolete items
There are no spare parts held exclusively for capitalization as at the reporting date.
Note 2018 2017
Rupees '000 Rupees '000
923,211 1,081,926
1,040,000 300,000
(623,715) (458,715)
25.2 (230,402) (126,368)
1,109,094 796,843
126,368 149,790
38.2 184,408
`
Note 2018 2017
Rupees '000 Rupees '000
56,740
(80,374)
(80,162)
230,402
126,368
290,865
136,561
452,987
505,812
134,117
122,859
877,969 765,232
(18,824) (18,824)
859,145
746,408
5,130,566
4,639,215
2,110,833
582,589
27.1 (37,037) (34,515)
7,204,362
5,187,289
758,928 848,453
2,829,889 2,121,128
(7,022) (7,022)
2,822,867 2,114,106
10,786,157 8,149,848
25.1 These advances have been made to various customers against renovation of show rooms for long term. These are classied as 'loans and receivables' under IAS 39 'Financial Instruments - Recognition and Measurement' which are required to be carried at amortized cost which has been determined using a discount rate of 10.72%.
`
Note 2018 2017
Rupees '000 Rupees '000
24.1 These represent security deposits against Ijarah nancing.
24.2 These have been deposited with various utility companies and regulatory authorities. These are classied as 'loans and receivables' under IAS 39 'Financial Instruments - Recognition and Measurement' which are required to be carried at amortized cost. However, these, being held for an indenite period with no xed maturity date, are carried at cost as their amortized cost is impracticable to determine.
24.3 These have been deposited with various customers against EPC and other contracts and are refundable on completion of projects in accordance with term of contracts. Due to uncertainties regarding dates of refund of these deposits, these have been carried at cost.
25 LONG TERM ADVANCES
27.1
27.2
27.3
28
TRADE DEBTS - UNSECURED
Considered good
- against sale of goods
- against execution of contracts
Considered doubtful
Impairment allowance for doubtful debts
Movement in provision for slow moving and obsolete items
As at beginning of the year
Recognized during the year
As at end of the year
Entire stock in trade is carried at cost being lower than net realizable value.
Stock in trade valued at Rs. 1,754 million (2017: Rs. 1,308 million) is pledged as security with providers of debt nances.
7,127,034 8,841,149
3,054,705 1,886,483
10,181,739 10,727,632
28.2 587,301
576,971
10,769,040 11,304,603
39 (587,301)
(576,971)
10,181,739
10,727,632
Note
Note
2018 2017
Rupees '000 Rupees '000
34,515 25,647
2,522 8,868
37,037 34,515
Note 2018 2017
Rupees '000 Rupees '000
28.1 These include retention money for contracts in progress amounting to Rs. 617.648 million (2017: Rs. 855.5 million) held by the customers in accordance with contract terms.
2018 2017
Rupees '000 Rupees '000
I 38 Pak Elektron Limited I 39Annual Report 2018

30.1
31
These include advances for
- purchases
- expenses
- traveling
SHORT TERM DEPOSITS AND PREPAYMENTS
Security deposits
- considered good
- considered doubtful
Impairment allowance for doubtful deposits
Margin deposits
Prepayments
Letters of credit
33
34
35
Standard Chartered Bank (Pakistan) Limited
915,070 (2017: 915,070) ordinary shares of Rs. 10 each
Market value: Rs. 24.12 (2017: Rs. 23.85) per share
As at beginning of the year
Changes in fair value
As at end of the year
ADVANCE INCOME TAX/INCOME TAX REFUNDABLE
Advance income tax/income tax refundable
Provision for taxation
CASH AND BANK BALANCES
Cash in hand
Cash at banks
NET REVENUE
Contract revenue
Sale of goods
- local
- exports
Sales tax and excise duty
Trade discounts
230,008 147,989
105,524 46,886
114,149 33,860
449,681 228,735
308,133
383,133
5,379
5,379
(5,379) (5,379)
308,133
2018 2017
Rupees '000 Rupees '000
383,133
421,671
488,316
52,865
46,211
322,510
191,572
1,105,179 1,109,232
Note 2018 2017
Rupees '000 Rupees '000
21,824
23,106
37 & 40 247 (1,282)
22,071
21,824
2,129,147
1,637,396
42 (143,362)
(409,484)
1,985,785
1,227,912
16,818
16,217
454,440
467,977
471,258
484,194
47 2,899,882 2,841,124
35,201,408 38,212,710
888,957 1,292,919
38,990,247 42,346,753
(3,710,466) (4,062,791)
(6,834,470) (7,283,920)
(10,544,936) (11,346,711)
28,445,311 31,000,042
32 SHORT TERM INVESTMENTS
These represent investments in listed equity securities classied as 'nancial assets at fair value through prot or loss'. The details are as follows:
36
2,121,128 1,895,253
36.1 19,723,220 19,699,023
(2,829,889) (2,121,128)
19,014,459 19,473,148
47 2,433,581 2,410,694
21,448,040
21,883,842
36.1
848,453 1,033,340
16,936,321
16,792,254
799,473
712,515
422,952
482,115
27,930
25,623
339,186
361,245
68,323 61,254
30,060
30,028
35,855
29,225
21.5 772,241
805,694
22 10,203
12,050
26 & 27 2,522
8,868
23,742 27,540
151,605 153,582
13,282 12,143
1,897,901 2,009,367
20,482,148
20,547,476
COST OF SALES
Finished goods at the beginning of the year
Cost of goods manufactured
Finished goods at the end of the year
Cost of goods sold
Contract cost
Cost of goods manufactured
Work-in-process at beginning of the year
Raw material and components consumed
Direct wages
Factory overheads:
- salaries, wages and benets
- traveling and conveyance
- electricity, gas and water
- repairs and maintenance
- vehicles running and maintenance
- insurance
- depreciation
- amortization of intangible assets
- provision for obsolete and slow moving stock
- carriage and freight
- erection and testing
- other factory overheads
Work-in-process at end of the year (758,928)
(848,453)
19,723,220 19,699,023
36.2
37
23 593 -
32 247
-
2,267 3,718
- 2,832
3,107 6,550
16 1,936 2,038
OTHER INCOME
Gain on nancial instruments
Reversal of impairment loss on long term investments
Changes in fair value of short term investments
Gain on disposal of property, plant and equipment
Gain on sale and lease back activities
Other income
Amortization of grant-in-aid
Others 12,934 9,205
14,870 11,243
17,977 17,793
These include charge in respect of employees retirement benets amounting to Rs. 39.401 million (2017: Rs. 32.37 million).
Note 2018 2017
Rupees '000 Rupees '000
Note 2018 2017
Rupees '000 Rupees '000
I 40 Pak Elektron Limited I 41Annual Report 2018

2017 2016 2015
Rupees Rupees Rupees
409,484 323,783 321,851Provision for current taxation as per nancial statements
Tax assessment under section 120 of the Ordinance 317,845 131,799 -
38
38.1 468,433 454,356
89,541 106,218
111,552 128,721
23,116 24,761
8,555 9,262
59,421 65,505
11,680 10,331
25,815
23,170
38,007
39,952
462,122
695,407
17,940
17,124
451,391
552,921
1,981
10,860
317,342
358,229
DISTRIBUTION COST
Salaries and benets
Traveling and conveyance
Rent, rates and taxes
Electricity, gas, fuel and water
Repairs and maintenance
Vehicles running and maintenance
Printing and stationery
Postage, telegrams and telephones
Entertainment and staff welfare
Advertisement and sales promotion
Insurance
Freight and forwarding
Contract and tendering
Warranty period services
Others 38.2 120,549
186,715
2,207,445
2,683,532
39
39.1 557,738
486,004
52,271 47,161
101,253
88,119
46,788
62,149
75,395
84,548
36,223
30,610
39.2 5,877
5,591
20,907
18,532
20,305
17,874
5,016
4,559
9,791
8,733
17,447
15,606
12,693
12,205
15,105
12,449
10,330 132,382
21.5 68,660 64,182
ADMINISTRATIVE AND GENERAL EXPENSES
Salaries and benets
Traveling and conveyance
Rent, rates and taxes
Ujrah payments
Legal and professional
Electricity, gas and water
Auditor's remuneration
Repairs and maintenance
Vehicles running and maintenance
Printing, stationery and periodicals
Postage, telegrams and telephones
Entertainment and staff welfare
Advertisement
Insurance
Provision for doubtful debts, advances and security deposits
Depreciation
Others 25,527
28,140
1,081,326
1,118,844
39.1
39.2
4,300 4,299
800 600
500 430
Auditor's remuneration
Annual statutory audit
Limited scope review
Review report under Code of Corporate Governance
Out of pocket expenses 277 262
5,877 5,591
These include charge in respect of employees retirement benets amounting to Rs. 21.544 million (2017: Rs. 17.386 million).
Note 2018 2017
Rupees '000 Rupees '000
38.1 These include charge in respect of employees retirement benets amounting to Rs. 17.108 million (2017: Rs. 14.728 million).
38.2 These include notional interest expense/(income) amounting to Rs. 104.034 million (2017: Rs. 23.422 million) on long term advances. (See note 25.2)
Note 2018 2017
Rupees '000 Rupees '000
2018 2017
Rupees '000 Rupees '000
40
41
42
OTHER EXPENSES
Loss on nancial instruments
Loss due to changes in fair value of short term investments
Impairment of long term investments
Loss on sale and lease back activities
Others
Workers' Prot Participation Fund
Workers' Welfare Fund
Others
FINANCE COST
Interest/markup/prot on borrowings:
redeemable capital
long term nances
liabilities against assets subject to nance lease
short term borrowings
Interest on Workers' Prot Participation Fund
Bank charges and commission
TAXATION
Provision for taxation
for current year
for prior year
Deferred taxation
adjustment attributable to origination and reversal of temporary differences
adjustment attributable to changes in tax rates
Note 2018 2017
Rupees '000 Rupees '000
32 - 1,282
23 - 12,139
4,721 -
4,721
13,421
17.2 26,772
81,504
17.3 31,883
73,897
-
7,372
58,655
162,773
63,376
176,194
19,655
288,312
443,864 296,851
6,362
10,922
1,168,730
553,204
1,638,611
1,149,289
17.2 4,940 5,655
459,792 391,660
2,103,343 1,546,604
33 & 42.1
143,362 409,484
(91,639)
-
51,723
409,484
162,516 (114,273)
15.1 (28,406) -
134,110 (114,273)
185,833 295,211
42.1 Provision for current tax has been made in accordance with section 18 and 154 (2017: section 18 and 154) of the Income Tax Ordinance, 2001 ['the Ordinance']. A comparison of last three years of provision for current taxation with tax assessed is presented below:
I 42 Pak Elektron Limited I 43Annual Report 2018

Name of related party
Pak Elektron Limited
Employees Provident Fund Trust
Nature of relationship
Provident Fund Trust
Basis of relationship
Contribution to providend fund N/A
Kohinoor Power Company Limited
Mr. M. Murad Saigol
Red Communication Arts (Private) Limited
Mr. M. Zeid Yousuf Saigol
Mr. Syed Manzar Hassan
Associated company
Key management personnel
Key management personnel
Key management personnel
Investment
Chief executive
Director
Director
N/A
Associated undertaking Common Directorship N/A
0.0025%
2.9637%
0.0004%
Aggregate
%age of
shareholding
in the
Company
42.2
Unit 2018 2017
Rupees 1,557,302 3,603,465
Rupees 185,833 295,211
% 11.93 8.19
% (3.74) 2.40
% 25.39 18.14
% (8.61) 3.17
% 4.03 (1.90)
% 29.00 30.00
42.3
Unit 2018 2017
43
Rupees '000' 1,371,469
3,308,254
Rupees '000' (42,710)
(42,710)
Rupees '000' 1,328,759 3,265,544
No. of shares 497,681,485 497,681,485
Shares
EARNINGS PER SHARE - BASIC AND DILUTED
Earnings
Prot after taxation
Preference dividend for the year
Prot attributable to ordinary shareholders
Weighted average number of ordinary shares outstanding during the year
Earnings per share
Basic and diluted Rupees 2.67 6.56
Reconciliation between average effective tax rate and applicable tax rate
Prot before taxation
Provision for taxation
Average effective tax rate
Tax effects of:
Income taxable under nal tax regime
Admissible deductions, losses and tax credits
Deferred taxation
Others
Applicable tax rate
Assessments upto tax year 2017 have been nalized under the relevant provisions of the Ordinance.
43.1 As per the opinion of the Group's legal counsel, the provision for dividend at 9.5% per annum, under the original terms of issue of preference shares, will prevail on account of preference dividend.
43.2 There is no diluting effect on the basic earnings per share of the Group as the conversion rights pertaining to outstanding preference shares, under the original terms of issue, are no longer exercisable.
43.3 The effect of issue of ordinary and preference shares on conversion of redeemable capital, as referred to in note 12, has not been considered for the purpose of calculation of earnings per share as the said issue is subject to various legal and regulatory approvals which are pending as at the reporting date.
Note 2018 2017
Rupees '000 Rupees '000
44
1,557,302 3,603,465
1,638,611 1,149,289
104,034 (23,422)
(2,267) (3,718)
(1,936)
(2,038)
10,203
12,050
2,456
5,354
-
(2,832)
(593)
-
- 12,139
(247) 1,282
10,330
132,382
2,522 8,868
4,721 -
Depreciation 840,901
869,876
2,608,735
2,159,230
4,166,037
5,762,695
(112,737) 66,507
(2,638,831)
(312,916)
Trade debts 1,159,278
(1,891,212)
(142,550)
(265,189)
(193,679)
109,055
4,053 149,642
(49,872) 169,154
(57,180) 71,647
(2,031,518)
(1,903,312)
2,134,519
3,859,383
45
CASH GENERATED FROM OPERATIONS
Prot before taxation
Adjustments for non-cash and other items
Interest/markup/prot on borrowings
Notional interest
Gain on disposal of property, plant and equipment
Amortization of grant-in-aid
Amortization of intangible assets
Share of loss of associate
Gain on sale and lease back activities
Reversal of impairment loss on long term investments
Impairment of long term investments
Changes in fair value of nancial assets at fair value through prot or loss
Impairment allowance for doubtful debts, advances and security deposits
Provision for obsolete and slow moving stock
Loss on sale and lease back activities
Changes in working capital
Stores, spares and loose tools
Stock in trade
Due against construction work in progress
Short term advances
Trade deposits and short term prepayments
Other receivables
Trade and other payables
Cash generated from operations
CASH AND CASH EQUIVALENTS
Cash and bank balances 34 471,258 484,194
471,258 484,194
46 TRANSACTIONS AND BALANCES WITH RELATED PARTIES
Related parties from the Group's perspective comprise associated companies and undertakings, key management personnel and post employment benet plan. Key management personnel are those persons having authority and responsibility for planning, directing and controlling the activities of the Group, directly or indirectly, and includes the Chief Executive and Directors of the Parent Company. The details of Group's related parties, with whom the Group had transactions during the year or has balances outstanding as at the reporting date are as follows:
I 44 Pak Elektron Limited I 45Annual Report 2018
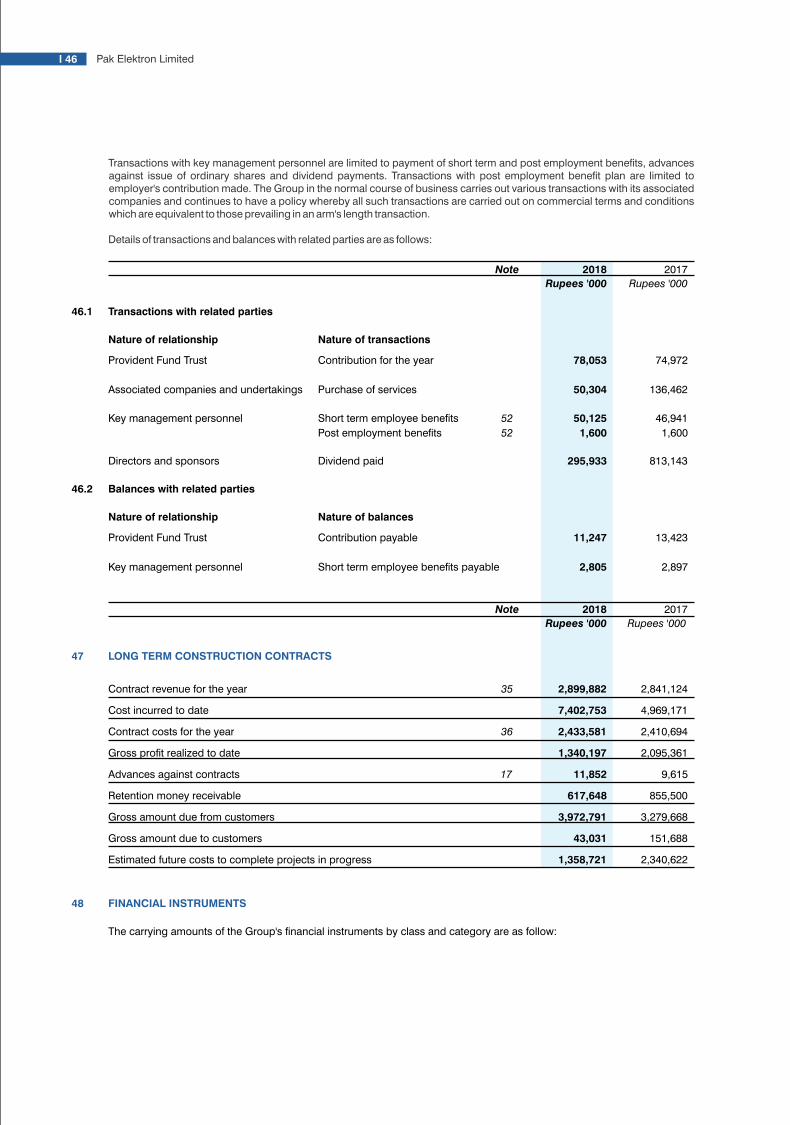
Note 2018 2017
Rupees '000 Rupees '000
46.1
78,053
74,972
50,304
136,462
52 50,125
46,941
52 1,600
1,600
295,933
813,143
46.2
11,247
13,423
Transactions with related parties
Nature of relationship Nature of transactions
Provident Fund Trust Contribution for the year
Associated companies and undertakings Purchase of services
Key management personnel Short term employee benets
Post employment benets
Directors and sponsors Dividend paid
Balances with related parties
Nature of relationship Nature of balances
Provident Fund Trust Contribution payable
Key management personnel Short term employee benets payable 2,805
2,897
Note 2018 2017
Rupees '000 Rupees '000
47
35 2,899,882
2,841,124
7,402,753 4,969,171
36 2,433,581 2,410,694
1,340,197 2,095,361
17 11,852
9,615
617,648
855,500
3,972,791
3,279,668
43,031 151,688
1,358,721 2,340,622
48
LONG TERM CONSTRUCTION CONTRACTS
Contract revenue for the year
Cost incurred to date
Contract costs for the year
Gross prot realized to date
Advances against contracts
Retention money receivable
Gross amount due from customers
Gross amount due to customers
Estimated future costs to complete projects in progress
FINANCIAL INSTRUMENTS
The carrying amounts of the Group's nancial instruments by class and category are as follow:
Transactions with key management personnel are limited to payment of short term and post employment benets, advances against issue of ordinary shares and dividend payments. Transactions with post employment benet plan are limited to employer's contribution made. The Group in the normal course of business carries out various transactions with its associated companies and continues to have a policy whereby all such transactions are carried out on commercial terms and conditions which are equivalent to those prevailing in an arm's length transaction.
Details of transactions and balances with related parties are as follows:
2018 2017
Rupees '000 Rupees '000
48.1
16,818 16,217
358,099
340,805
1,109,094
796,843
10,181,739
10,727,632
1,535,735 1,393,185
729,804
871,449
360,962
311,090
454,440
467,977
14,729,873 14,908,981
22,071 21,824
14,768,762 14,947,022
48.3
101,875
376,875
4,315,878
5,632,678
102,368
68,062
414,995
399,217
108,823
99,102
182,301
138,364
11,247
13,423
34,162 33,114
18,650 12,766
18,705 11,938
390,172 165,579
Financial assets
Cash in hand
Loans and receivables
Long term deposits
Long term advances
Trade debts
Due against construction work in progress
Short term deposits
Other receivables
Bank balances
Financial assets at fair value through prot or loss
Short term investments
Financial liabilities
Financial liabilities at amortized cost
Redeemable capital
Long term nances
Liabilities against assets subject to nance lease
Trade creditors - unsecured
Foreign bills payable - secured
Accrued liabilities
Employees' provident fund
Compensated absences
Unclaimed dividend
Other payables - unsecured
Accrued interest/markup/prot
Short term borrowings 12,843,848 7,227,368
18,543,024 14,178,486
49 FINANCIAL RISK EXPOSURE AND MANAGEMENT
The Group’s activities expose it to a variety of nancial risks: credit risk, liquidity risk and market risk (including currency risk, interest rate risk and price risk). These risks affect revenues, expenses and assets and liabilities of the Group.
The Group’s risk management policies are established to identify and analyze the risks faced by the Group, to set appropriate risk limits and controls, and to monitor risks and adherence to limits. Risk management policies and systems are reviewed regularly to reect changes in market conditions and the Group's activities. The Group, through its training and management standards and procedures, aims to develop a disciplined and constructive control environment in which all employees understand their roles and obligations.
The Board of Directors has overall responsibility for the establishment and oversight of the Group’s risk management framework. The Board is responsible for developing and monitoring the Group’s risk management policies. The Audit Committee oversees how management monitors compliance with the Group’s risk management policies and procedures and reviews the adequacy of the risk management framework in relation to the risks faced by the Group. The Audit Committee is assisted in its oversight role by Internal Audit department. Internal Audit department undertakes both regular and ad hoc reviews of risk management controls and procedures, the results of which are reported to the Audit Committee.
The Group’s exposure to nancial risks, the way these risks affect the nancial position and performance, and forecast transactions of the Group and the manner in which such risks are managed is as follows:
49.1 Credit risk
Credit risk is the risk of nancial loss to the Group, if the counterparty to a nancial instrument fails to meet its obligations.
I 46 Pak Elektron Limited I 47Annual Report 2018
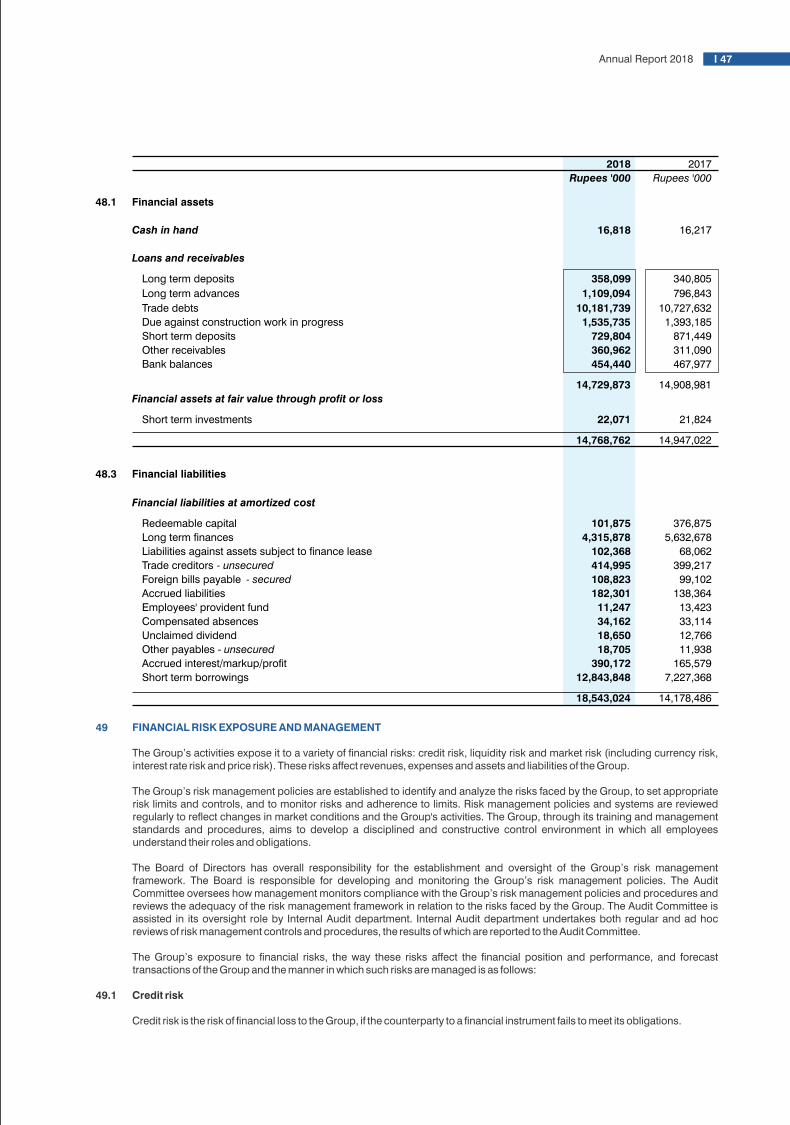
Note 2018 2017
Rupees '000 Rupees '000
46.1
78,053
74,972
50,304
136,462
52 50,125
46,941
52 1,600
1,600
295,933
813,143
46.2
11,247
13,423
Transactions with related parties
Nature of relationship Nature of transactions
Provident Fund Trust Contribution for the year
Associated companies and undertakings Purchase of services
Key management personnel Short term employee benets
Post employment benets
Directors and sponsors Dividend paid
Balances with related parties
Nature of relationship Nature of balances
Provident Fund Trust Contribution payable
Key management personnel Short term employee benets payable 2,805
2,897
Note 2018 2017
Rupees '000 Rupees '000
47
35 2,899,882
2,841,124
7,402,753 4,969,171
36 2,433,581 2,410,694
1,340,197 2,095,361
17 11,852
9,615
617,648
855,500
3,972,791
3,279,668
43,031 151,688
1,358,721 2,340,622
48
LONG TERM CONSTRUCTION CONTRACTS
Contract revenue for the year
Cost incurred to date
Contract costs for the year
Gross prot realized to date
Advances against contracts
Retention money receivable
Gross amount due from customers
Gross amount due to customers
Estimated future costs to complete projects in progress
FINANCIAL INSTRUMENTS
The carrying amounts of the Group's nancial instruments by class and category are as follow:
Transactions with key management personnel are limited to payment of short term and post employment benets, advances against issue of ordinary shares and dividend payments. Transactions with post employment benet plan are limited to employer's contribution made. The Group in the normal course of business carries out various transactions with its associated companies and continues to have a policy whereby all such transactions are carried out on commercial terms and conditions which are equivalent to those prevailing in an arm's length transaction.
Details of transactions and balances with related parties are as follows:
2018 2017
Rupees '000 Rupees '000
48.1
16,818 16,217
358,099
340,805
1,109,094
796,843
10,181,739
10,727,632
1,535,735 1,393,185
729,804
871,449
360,962
311,090
454,440
467,977
14,729,873 14,908,981
22,071 21,824
14,768,762 14,947,022
48.3
101,875
376,875
4,315,878
5,632,678
102,368
68,062
414,995
399,217
108,823
99,102
182,301
138,364
11,247
13,423
34,162 33,114
18,650 12,766
18,705 11,938
390,172 165,579
Financial assets
Cash in hand
Loans and receivables
Long term deposits
Long term advances
Trade debts
Due against construction work in progress
Short term deposits
Other receivables
Bank balances
Financial assets at fair value through prot or loss
Short term investments
Financial liabilities
Financial liabilities at amortized cost
Redeemable capital
Long term nances
Liabilities against assets subject to nance lease
Trade creditors - unsecured
Foreign bills payable - secured
Accrued liabilities
Employees' provident fund
Compensated absences
Unclaimed dividend
Other payables - unsecured
Accrued interest/markup/prot
Short term borrowings 12,843,848 7,227,368
18,543,024 14,178,486
49 FINANCIAL RISK EXPOSURE AND MANAGEMENT
The Group’s activities expose it to a variety of nancial risks: credit risk, liquidity risk and market risk (including currency risk, interest rate risk and price risk). These risks affect revenues, expenses and assets and liabilities of the Group.
The Group’s risk management policies are established to identify and analyze the risks faced by the Group, to set appropriate risk limits and controls, and to monitor risks and adherence to limits. Risk management policies and systems are reviewed regularly to reect changes in market conditions and the Group's activities. The Group, through its training and management standards and procedures, aims to develop a disciplined and constructive control environment in which all employees understand their roles and obligations.
The Board of Directors has overall responsibility for the establishment and oversight of the Group’s risk management framework. The Board is responsible for developing and monitoring the Group’s risk management policies. The Audit Committee oversees how management monitors compliance with the Group’s risk management policies and procedures and reviews the adequacy of the risk management framework in relation to the risks faced by the Group. The Audit Committee is assisted in its oversight role by Internal Audit department. Internal Audit department undertakes both regular and ad hoc reviews of risk management controls and procedures, the results of which are reported to the Audit Committee.
The Group’s exposure to nancial risks, the way these risks affect the nancial position and performance, and forecast transactions of the Group and the manner in which such risks are managed is as follows:
49.1 Credit risk
Credit risk is the risk of nancial loss to the Group, if the counterparty to a nancial instrument fails to meet its obligations.
I 46 Pak Elektron Limited I 47Annual Report 2018

49.1.1 Maximum exposure to credit risk
The gross carrying amount of nancial assets, other than cash in hand, represents maximum exposure to credit risk. The maximum exposure to credit risk as at the reporting date is as follows:
Note 2018 2017
Rupees '000 Rupees '000
Loans and receivables
Long term deposits 24 358,099 340,805 Long term advances 25 1,339,496 923,211
Trade debts 28 10,769,040 11,304,603
Due against construction work in progress 29 1,535,735 1,393,185
Short term deposits 31 735,183 876,828
Bank balances 34 454,440 467,977
15,191,993 15,306,609
Financial assets at fair value through prot or loss
Short term investments 32 22,071 21,824
15,214,064 15,328,433
Customers 13,960,019 13,919,453
Banking companies and nancial institutions 1,211,694 1,366,629
Others 42,351 42,351
15,214,064 15,328,433
2018 2017
Rupees '000 Rupees '000
49.1.2 Concentration of credit risk
There is no concentration of credit risk geographically. Maximum exposure to credit risk by type of counter-party is as follows:
49.1.3 Credit quality and impairment
The manner in which the Group assesses the credit quality of its nancial assets depends on the type of counter-party. The Group conducts different types of transactions with the following counter-parties.
(a) Customers
Customers are counter-parties to trade debts, long term security deposits for contracts in progress, long term advances to dealers, due against contract work in progress and retention money for contracts in progress.
These ,with the exception of trade debts and long term advances to dealers, do not carry any signicant credit risk. Long term advances to dealers are neither past due nor impaired. The ageing analysis of trade debts as at reporting date is as follows:
Not yet due and past due by 1 year
1 to 2 years
2 to 3 years
More than 3 years
Gross Accumulated Gross Accumulated
carrying amount Impairment carrying amount Impairment
Rupees '000 Rupees '000 Rupees '000 Rupees '000
9,286,535 - 9,861,016 - 858,057 - 827,998 -
317,664 280,517 317,328 278,710
306,784 306,784 298,261 298,261
10,769,040 587,301 11,304,603 576,971
20172018
There is no single signicant customer in the trade debts of the Group. The maximum exposure to credit risk for trade debts as at the reporting date by type of customer is:
2018 2017
Rupees '000 Rupees '000
General customers 9,313,265 10,120,445
Corporate customers 1,455,775 1,184,158
10,769,040 11,304,603
In determining the recoverability of a trade debt, the Group considers any change in the credit quality of the trade debt from the date credit was initially granted up to the reporting date. The concentration of credit risk is limited due to the customer base being large and unrelated. Accordingly, the management believes that there is no further provision required in excess of the allowance for doubtful debts.
(b) Banking companies and nancial institutions
Banking companies and nancial institutions are counter-parties to security/margin deposits, bank balances and investments in preference shares. The Group limits its exposure to credit risk by only investing in highly liquid securities and only with counterparties that have reasonably high credit ratings. Given these high credit ratings, management does not expect any counterparty to fail to meet its obligations.
(c) Others
These include employees of the Group who are counter parties to advances and utility companies and regulatory authorities who are counter parties to long term security deposits. These do not carry any signicant credit risk.
49.1.4 Collateral held
The Group does not hold any collateral to secure its nancial assets.
49.1.5 Credit risk management
As mentioned in note 49.1.3 to the nancial statements, the Group's nancial assets do not carry signicant credit risk, with the exception of trade debts, which are exposed to losses arising from any non-performance by customers. To manage credit risk the Group maintains procedures covering the application for credit approvals, granting and renewal of counterparty limits and monitoring of exposures against these limits. As part of these processes the nancial viability of all counterparties is regularly monitored and assessed. The majority of sales to the Group’s customers are made on specic terms. Customer credit risk is managed by each business unit subject to the Group’s established policy, procedures and controls relating to customer credit risk management. Credit limits are established for all customers based on internal rating criteria. Credit quality of the customer is assessed based on an extensive credit rating. Outstanding customer receivables are regularly monitored and any shipments to major customers are generally covered by letters of credit or other form of credit insurance.
49.2 Liquidity risk
Liquidity risk is the risk that the Group will not be able to meet its nancial obligations as they fall due.
49.2.1 Exposure to liquidity risk
The followings is the analysis of contractual maturities of nancial liabilities, including estimated interest payments.
Carrying Contractual One year One to More than
amount cash ows or less ve years ve years
Rupees '000' Rupees '000' Rupees '000' Rupees '000' Rupees '000'
101,875 103,885 103,885 - - 4,315,878 4,962,564 2,059,357 2,903,207 -
- 102,368 114,924 50,351 64,573 -
12,843,848 13,126,746 13,126,746 - - 390,172 390,172 390,172 - -
Redeemable capital
Long term nances
Liabilities against assets
subject to nance lease
Short term borrowings
Accrued interest/markup/prot
Trade and other payables 414,995 414,995 414,995 - -
18,169,136 19,113,286 16,145,506 2,967,780 -
2018
I 48 Pak Elektron Limited I 49Annual Report 2018

(b) Exchange rates applied as at the reporting date
The following spot exchange rates were applied as at the reporting date.
Assets Liabilities Assets Liabilities
Rupees '000 Rupees '000 Rupees '000 Rupees '000
GBP - 176.5100 - -
EUR - 159.1000 - 131.7900
USD - 139.1000 - 110.5000
CHF - 141.2700 - 112.9000
CNY -
20.2100
-
17.3300
20172018
Carrying Contractual One year One to More than
amount cash ows or less ve years ve years
Rupees '000' Rupees '000' Rupees '000' Rupees '000' Rupees '000'
376,875 398,082 70,106 327,976 -
5,632,678 6,433,662 4,391,407 2,042,255 -
68,062 73,389 49,686 23,703 -
7,227,368 7,303,482 7,303,482 - -
165,579 165,579 165,579 - -
Redeemable capital
Long term nances
Liabilities against assets
subject to nance lease
Short term borrowings
Accrued interest/markup/prot
Trade and other payables 399,217 399,217 399,217 - -
13,869,779 14,773,411 12,379,477 2,393,934 -
2017
49.2.2 Liquidity risk management
The responsibility for liquidity risk management rests with the Board of Directors, who has built an appropriate liquidity risk management framework for the management of the Group’s short, medium and long-term funding and liquidity management requirements. The Group manages liquidity risk by maintaining adequate reserves, banking facilities and reserve borrowing facilities, by continuously monitoring forecast and actual cash ows and matching the maturity proles of nancial assets and liabilities. As referred to in note 18.4 the Group has additional undrawn facilities of Rs. 10,727 million (2017: Rs. 10,727 million) at its disposal to further reduce liquidity risk.
49.3 Market risk
49.3.1 Currency risk
Currency risk is the risk that fair values or future cash ows of a nancial instrument will uctuate because of changes in foreign exchange rates. Currency risk arises from transactions and resulting balances that are denominated in a currency other than functional currency.
(a) Exposure to currency risk
The Group's exposure to currency risk as at the reporting date is as follows:
2018 2017
Rupees '000 Rupees '000
- -
(92,204) (80,601) (16,619) -
- (18,501)
(108,823) (99,102)
(108,823) (99,102)
(17,235) (12,895)
(28,496) (70)
(156,714) (305,925)
(1,059) -
(1,809,135) (1,607,712)
- -
(2,012,639) (1,926,602)
Financial assets
Financial liabilities
Foreign bills payable
USD
CNY
EUR
Net balance sheet exposure
Foreign currency commitments
CHF
CNY
EUR
GBP
JPY
USD
Net exposure (2,121,462) (2,025,704)
(c) Sensitivity analysis
A ve percent appreciation in Pak Rupee against foreign currencies would have increased prot and equity for the year by Rs. 5.441 million (2017: Rs. 4.955 million). A ve percent depreciation in Pak Rupee would have had an equal but opposite effect on prot for the year. The analysis assumes that all other variables, in particular interest rates, remain constant and ignores the impact, if any, on provision for taxation for the year.
(d) Currency risk management
The Group manages its exposure to currency risk through continuous monitoring of expected/forecast committed and non-committed foreign currency payments and receipts. Reports on forecast foreign currency transactions, receipts and payments are prepared on monthly basis, exposure to currency risk is measured and appropriate steps are taken to ensure that such exposure is minimized while optimizing return. This includes matching of foreign currency liabilities/payments to assets/receipts and using source inputs in foreign currency.
49.3.2 Interest rate risk
Interest rate risk is the risk that fair values or future cash ows of a nancial instrument will uctuate because of changes in interest rates.
(a) Interest/markup bearing nancial instruments
The effective interest/markup rates for interest/markup bearing nancial instruments are mentioned in relevant notes to the nancial statements. The Group's interest/markup bearing nancial instruments as at the reporting date are as follows:
2018 2017
Rupees '000 Rupees '000
Fixed rate instruments - -
Variable rate instruments
Financial liabilities 16,777,372 13,236,211
(b) Fair value sensitivity analysis for xed rate instruments
The Group does not have any xed rate nancial instruments.
(c) Cash ow sensitivity analysis for variable rate instruments
An increase of 100 basis points in interest rates as at the reporting date would have decreased prot for the year by Rs. 167.774 million (2017: Rs. 132.362 million). A decrease of 100 basis points would have had an equal but opposite effect on prot for the year. The analysis assumes that all other variables, in particular foreign exchange rates, remain constant and ignores the impact, if any, on provision for taxation for the year.
(d) Interest rate risk management
The Group manages interest rate risk by analyzing its interest rate exposure on a dynamic basis. Cash ow interest rate risk is managed by simulating various scenarios taking into consideration renancing, renewal of existing positions and alternative nancing. Based on these scenarios, the Group calculates impact on prot after taxation and equity of dened interest rate shift, mostly 100 basis points.
I 50 Pak Elektron Limited I 51Annual Report 2018

49.3.3 Price risk
Price risk represents the risk that the fair value or future cash ows of nancial instrument will uctuate because of changes in market prices, other than those arising from interest rate risk or currency risk, whether those changes are caused by factors specic to the individual nancial instrument or its issuer, or factors affecting all similar nancial instruments. The Group is exposed to price risk in respect of its investments in equity securities. However, the risk is minimal as these investments are held for strategic purposes rather than trading purposes. The Group does not actively trade in these investments.
50 FAIR VALUE MEASUREMENTS
The Group measures some of its assets at fair value at the end of each reporting period. Fair value measurements are classied using a fair value hierarchy that reects the signicance of the inputs used in making the measurements and has the following levels.
Level 1 Quoted prices (unadjusted) in active markets for identical assets or liabilities.
Level 2 Inputs other than quoted prices included within Level 1 that are observable for the asset or liability, either directly (that is, as prices) or indirectly (that is, derived from prices).
Level 3 Inputs for the asset or liability that are not based on observable market data (that is, unobservable inputs).
The fair value hierarchy of nancial instruments measured at fair value and the information about how the fair values of these nancial instruments are determined are as follows:
50.1 Financial instruments measured at fair value
50.1.1
Financial instruments Hierarchy 2018 2017
Rupees '000 Rupees '000
Financial assets at fair value
through prot or loss
Investments in quoted
equity securities Level 1 22,071 21,824
Level 1 Level 2 Level 3 2018 2017
Rupees '000 Rupees '000
- 1,022,000 - 1,022,000 539,232
- 3,444,504 - 3,444,504 2,883,880
Freehold land
Buildings
Plant and machinery - 13,797,790 - 13,797,790 12,234,678
Quoted bid prices in an active market
Valuation techniques and key inputs
Recurring fair value measurements
50.1.2 Non-recurring fair value measurements
There are no non-recurring fair value measurements as at the reporting date.
50.2 Financial instruments not measured at fair value
The management considers the carrying amount of all nancial instruments not measured at fair value at the end of each reporting period to approximate their fair values as at the reporting date.
50.3 Assets and liabilities other than nancial instruments.
50.3.1 Recurring fair value measurements
For recurring fair value measurements, the fair value hierarchy and information about how the fair values are determined is as follows:
For fair value measurements categorised into Level 2 and Level 3 the following information is relevant:
Freehold land
Buildings
Plant and machinery
Reconciliation of fair value measurements categorized in Level 3 is presented in note 21.6.
There were no transfers between fair value hierarchies during the year.
A 5% increase in estimated
construction and other
ancillary expenditure would
result in a signicant increase
in fair value of buildings by
Rs. 172.225 million (2017: Rs.
144.194 million).
Cost approach that reects
the cost to the market
participants to construct
assets of comparable utility
and age, adjusted for
obsolescence and
depreciation. There was no
change in valuation technique
Estimated construction costs
and other ancillary
expenditure.
Valuation technique Signicant inputs Sensitivity
Cost approach that reects
the cost to the market
participants to acquire assets
of comparable utility and age,
adjusted for obsolescence
and depreciation. There was
no change in valuation
technique during the year.
Estimated purchase price,
including import duties and
non-refundable purchase
taxes and other costs directly
attributable to the acquisition
or construction, erection and
installation.
A 5% increase in estimated
purchase price, including
import duties and non-
refundable purchase taxes
and other directly attributable
costs would result in a
signicant increase in fair
value of plant and machinery
by Rs. 689.890 million(2017:
Rs. 611.734 million).
Valuation technique Signicant inputs Sensitivity
Market comparable
approach that reects recent
transaction prices for similar
properties
Estimated purchase price,
including non-refundable
purchase taxes and other
costs directly attributable to
the acquisition.
A 5% increase in estimated
purchase price, including non-
refundable purchase taxes
and other costs directly
attributable to the acquisition
would result in a signicant
increase in fair value of
buildings by Rs. 51.1 million
(2017: Rs. 26.962 million).
during the year.
50.3.2 Non-recurring fair value measurements
There are no non-recurring fair value measurements as at the reporting date.
51 CAPITAL MANAGEMENT
The Group's objective when measuring capital is to safeguard the Group's ability to continue as going concern while providing returns for shareholders and benets for other stakeholders and to maintain an optimal capital structure through debt and equity balance. The Group manages its capital structure and makes adjustments to it in light of changes in economic conditions. In order to maintain or adjust the capital structure, the Group may adjust the amount of dividends paid to shareholders or issue of new shares. Consistent with others in industry, the Group monitors capital on the basis of gearing ratio which is debt divided by total capital employed. Debt comprises long term nances, redeemable capital and liabilities against assets subject to nances lease, including current maturity. Total capital employed includes total equity plus debt. During the period, the Group's strategy was to maintain the gearing ratio below 30% and 'A' credit rating. The gearing ratios as at the reporting date are as follows:
Unit 2018 2017
Total debt Rupees '000' 4,520,121 6,077,615 Total equity Rupees '000' 30,279,695 27,000,590
Total capital employed Rupees '000' 34,799,816 33,078,205
Gearing ratio % age 12.99 18.37
The Group is not subject to externally imposed capital requirements, except those related to maintenance of debt covenants, commonly imposed by the providers of debt nance.
I 52 Pak Elektron Limited I 53Annual Report 2018
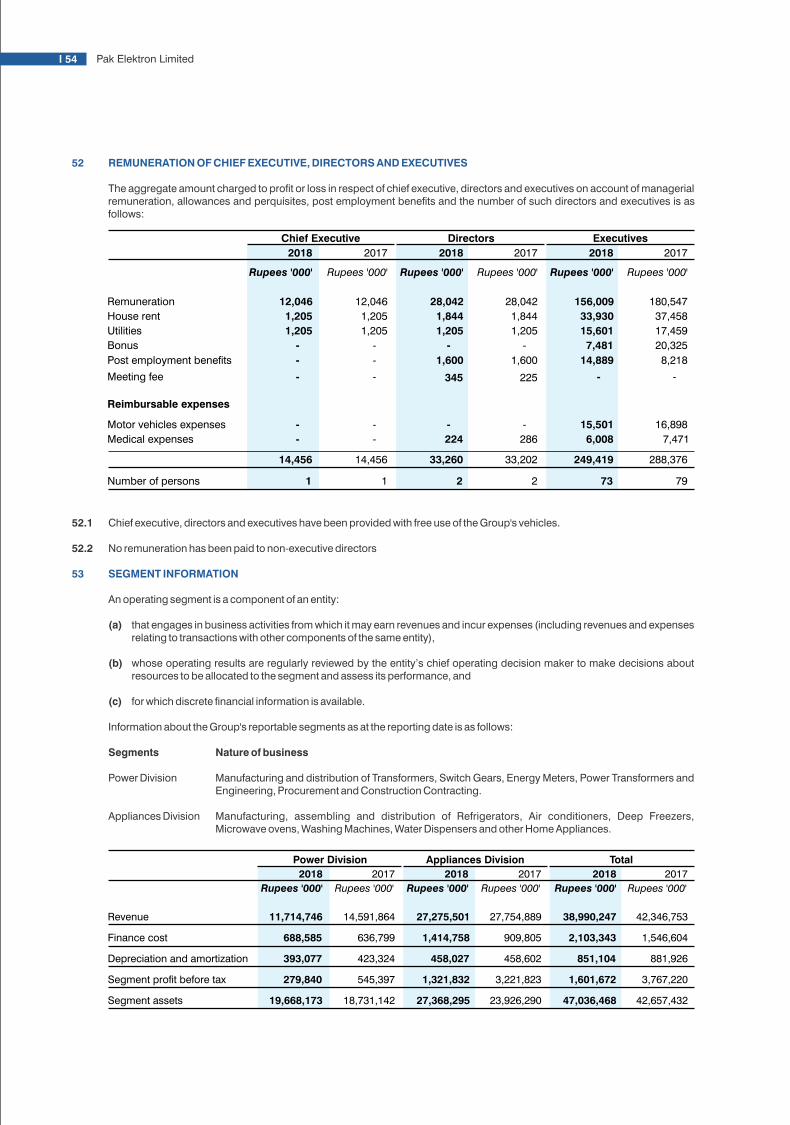
52 REMUNERATION OF CHIEF EXECUTIVE, DIRECTORS AND EXECUTIVES
The aggregate amount charged to prot or loss in respect of chief executive, directors and executives on account of managerial remuneration, allowances and perquisites, post employment benets and the number of such directors and executives is as follows:
2018 2017 2018 2017 2018 2017
Rupees '000' Rupees '000' Rupees '000' Rupees '000' Rupees '000' Rupees '000'
12,046 12,046 28,042 28,042 156,009 180,547
1,205 1,205 1,844 1,844 33,930 37,458
1,205 1,205 1,205 1,205 15,601 17,459
- - - - 7,481 20,325
- - 1,600 1,600 14,889 8,218
- - 345 225 - -
- - - - 15,501 16,898
- - 224 286 6,008 7,471
14,456 14,456 33,260 33,202 249,419 288,376
1
Remuneration
House rent
Utilities
Bonus
Post employment benets
Meeting fee
Reimbursable expenses
Motor vehicles expenses
Medical expenses
Number of persons 1 2 2 73 79
ExecutivesDirectorsChief Executive
52.1 Chief executive, directors and executives have been provided with free use of the Group's vehicles.
52.2 No remuneration has been paid to non-executive directors
53 SEGMENT INFORMATION
An operating segment is a component of an entity:
(a) that engages in business activities from which it may earn revenues and incur expenses (including revenues and expenses relating to transactions with other components of the same entity),
(b) whose operating results are regularly reviewed by the entity’s chief operating decision maker to make decisions about resources to be allocated to the segment and assess its performance, and
(c) for which discrete nancial information is available.
Information about the Group's reportable segments as at the reporting date is as follows:
Segments Nature of business
Power Division Manufacturing and distribution of Transformers, Switch Gears, Energy Meters, Power Transformers and Engineering, Procurement and Construction Contracting.
Appliances Division Manufacturing, assembling and distribution of Refrigerators, Air conditioners, Deep Freezers, Microwave ovens, Washing Machines, Water Dispensers and other Home Appliances.
Revenue
Finance cost
Depreciation and amortization
Segment prot before tax
Segment assets
2018 2017 2018 2017 2018 2017
Rupees '000' Rupees '000' Rupees '000' Rupees '000' Rupees '000' Rupees '000'
11,714,746
14,591,864
27,275,501
27,754,889
38,990,247
42,346,753
688,585
636,799
1,414,758
909,805
2,103,343
1,546,604
393,077
423,324
458,027
458,602
851,104
881,926
279,840
545,397
1,321,832
3,221,823
1,601,672
3,767,220
19,668,173 18,731,142 27,368,295 23,926,290 47,036,468 42,657,432
TotalPower Division Appliances Division
2018 2017
Rupees '000' 389,017 401,413
Rupees '000' 351,027 356,969
% age 90.23 88.93
Rupees '000' % age Rupees '000' % age
- - 148,830 41.69
118,131 33.65 105,890 29.66
232,896 66.35 102,249 28.64
351,027 100.00 356,969 100.00
55
Actual Actual
Annual production Annual production
production during the production during the
Unit capacity year capacity year
MVA 7,000
2,397
7,000
3,239
Nos. 12,000
4,805
12,000
3,318
Nos. 1,700,000
826,007
1,700,000
1,045,231
Tonnes 200,000
103,220
200,000
139,396
Cfts. 6,950,000
5,075,992
6,950,000
5,608,735
Litres 2,500,000
1,945,097
2,500,000
2,072,617
Sets 200,000
24,190
-
-
Kgs 50,000
7,005
-
-
55.1
Size of the fund - total assets
Fair value of investments
Percentage of investments made
The break-up of investments is as follows:
Listed equity collective investment schemes
Government securities
Deposit accounts with commercial banks
PLANT CAPACITY AND ACTUAL PRODUCTION
Transformers/Power Transformers
Switch gears
Energy meters
Air conditioners
Refrigerators/deep freezers
Microwave ovens
LED TVs
Washing machines
Under utilization of capacity is mainly attributable to consumer demand.
2018
2018 2017
2017
2018 2017
Rupees '000' Rupees '000'
53.1
1,601,672
3,767,220
(47,855) (163,755)
1,553,817 3,603,465
53.2
47,036,468
42,657,432
2,014,841 1,258,584
49,051,309 43,916,016
53.3
Reconciliation of segment prot
Total prot for reportable segments
Un-allocated other expenses
Prot before taxation
Reconciliation of segment assets
Total assets for reportable segments
Other corporate assets
Total assets
Information about major customers
Revenue derived from Multan Electric Power Company 2,650,670 -
54 EMPLOYEES PROVIDENT FUND TRUST
The following information is based on the un-audited nancial statements of the Pak Elektron Limited Employees Provident Fund Trust for the year ended December 31, 2018.
I 54 Pak Elektron Limited I 55Annual Report 2018

Total number of employees
Average number of employees
57 RECLASSIFICATIONS
Particulars 2018 2017
Unclaimed dividend 18,650
12,766
From To
Trade and other payables Statement of Financial Position
The following have been reclassied for compliance with Fourth Schedule to the Companies Act, 2017.
2018 2017 2018 2017
5,116
5,138
701
917
5,367 4,283 798 1,529
Area ofcesManufacturing facilities
56 NUMBER OF EMPLOYEES
58 RECOVERABLE AMOUNTS AND IMPAIRMENT
As at the reporting date, recoverable amounts of all assets/cash generating units are equal to or exceed their carrying amounts, unless stated otherwise in these nancial statements.
59 GENERAL
59.1 Figures have been rounded off to the nearest thousands.
59.2 Comparative gures have been rearranged and reclassied, where necessary, for the purpose of comparison. However, there were no signicant reclassications during the year other than those referred to in note 57.
SYED MANZAR HASSANChief Financial Officer
M. MURAD SAIGOLChief Executive Officer
M. ZEID YOUSUF SAIGOLDirector
I 56 Pak Elektron Limited

J SeparateFinancial Statements

1. Preparation of nancial statements under Companies Act, 2017
As disclosed in note 3 to the annexed nancial statements, the Companies Act, 2017 ['the Act'] became applicable for the rst time for the preparation of the Company's annual nancial statements for the year ended December 31, 2018.
The Act forms an integral part of the statutory nancial reporting framework
Key audit matter How our audit addressed the key audit matter
We assessed the procedures applied by the management for identication of the changes required in the nancial statements due to the application of the Act. We considered the adequacy and appropriateness of the additional disclosures and changes to the previous disclosures based on the new requirements.
We also evaluated the sources of information used by the management for the preparation of these disclosures and
Independent Auditor’s ReportTo the members of PAK ELEKTRON LIMITEDReport on the Audit of the Financial Statements
Opinion
We have audited the annexed nancial statements of PAK ELEKTRON LIMITED ['the Company'], which comprise the statement of nancial position as at December 31, 2018, the statement of prot or loss, the statement of comprehensive income, the statement of changes in equity, the statement of cash ows for the year then ended, and notes to the nancial statements, including a summary of signicant accounting policies and other explanatory information, and we state that we have obtained all the information and explanations which, to the best of our knowledge and belief, were necessary for the purposes of the audit.
In our opinion and to the best of our information and according to the explanations given to us, the statement of nancial position, the statement of prot or loss, the statement of comprehensive income, the statement of changes in equity and the statement of cash ows together with the notes forming part thereof conform with the accounting and reporting standards as applicable in Pakistan and give the information required by the Companies Act, 2017 (XIX of 2017), in the manner so required and respectively give a true and fair view of the state of the Company's affairs as at December 31, 2018 and of the prot, other comprehensive income, the changes in equity and its cash ows for the year then ended.
Basis for Opinion
We conducted our audit in accordance with International Standards on Auditing ['ISAs'] as applicable in Pakistan. Our responsibilities under those standards are further described in the Auditor's Responsibilities for the Audit of the Financial Statements section of our report. We are independent of the Company in accordance with the International Ethics Standards Board for Accountants' Code of Ethics for Professional Accountants as adopted by the Institute of Chartered Accountants of Pakistan ['the Code'] and we have fullled our other ethical responsibilities in accordance with the Code. We believe that the audit evidence we have obtained is sufcient and appropriate to provide a basis for our opinion.
Key Audit Matters
Key audit matters are those matters that, in our professional judgment, were of most signicance in our audit of the nancial statements of the current period. These matters were addressed in the context of our audit of the nancial statements as a whole, and in forming our opinion thereon, and we do not provide a separate opinion on these matters.
Rahman Sarfaraz Rahim Iqbal RafiqChartered Accountants
72-A, Faisal Town,Lahore - 54770, Pakistan.
T:F:E:W:
+92 42 35160430 - 32+92 42 [email protected]
J 02 Pak Elektron Limited J 03Annual Report 2018
Member of Russell Bedford International - a global network of independent professional services firms
as applicable to the Company and amongst others, prescribes the nature and content of disclosures in relation to various elements of the nancial statements.
In the case of the Company, a summary of key additional disclosures and changes to the existing disclosures have been stated in note 3 to the annexed nancial statements.
Further, the Company has also changed its accounting policy relating to presentation and measurement of surplus on revaluation of property, plant and equipment as a consequence of the application of the Act with retrospective effect. The impact of the said change in accounting policy has been disclosed in note 5 to the accompanying nancial statements.
The above changes and enhancements in the nanc ia l s ta tements a re considered important and a key audit matter because of the volume and signicance of the changes in the nancial statements resulting from t rans i t ion to the new repor t ing requirements under the Act.
the internal consistency of such disclosures with other elements of the nancial statements.
In respect of the change in accounting policy for the accounting and presentation of surplus on revaluation of property, plant and equipment, as referred to in note 5 to the nancial statements, we assessed the accounting implications in accordance with the accounting and reporting standards as applicable in Pakistan and evaluated its application in the context of the Company.
Key audit matter How our audit addressed the key audit matter
2. Inventory valuation
Stock in trade amounts to Rs 8,374 million as at the reporting date. The valuation of stock in trade at cost has different components, which includes judgment in relation to the allocation of labour and overheads which are incurred in bringing the stock to its present locat ion and condi t ion. Judgment has also been applied by management in determining the Net Realizable Value ['NRV'] of stock in trade.
The estimates and judgments applied by management are inuenced by the amount of direct costs incurred historically, expectations of repeat orders to utilize the stock in trade, sales contract in hand and historically realized sales prices.
To address the valuation of stock in trade, we assessed historical costs recorded in the inventory valuation; testing on a sample basis with purchase invoices. We tested the reasonability of assumptions applied by the management in allocating direct labour and direct overhead costs to inventories.
We also assessed management's determination of the net realizable value of inventories by performing tests on the sales prices secured by the Company for similar or comparable items of inventories.

Key audit matter How our audit addressed the key audit matter
4. Contract accounting and revenue recognition
The Company's business involves entering into long term contracts with customers to provide a construction services with a signicant proportion of the Company's revenues and prots derived such contracts.
Due to the contracting nature of the business, revenue recognition involves a signicant degree of judgment, as referred to in note 2.4.8 to the consolidated nancial statements, with estimates being made to:
• assess the total contract cost;
• assess the stage of completion of the contract;
• forecast the prot margin after taking consideration of estimated future costs to complete the projects in progress; and
We read the relevant clauses with in all key contracts and discussed each with management to obtain a full understanding of the specic terms and risks, which informed our consideration of whether revenue for these contracts was appropriately recognized.
We evaluated and tested the operating effectiveness of internal controls over the accuracy and timing of revenue recognized, including controls relating to estimating total costs, stage of completion of contracts, prot margin and evaluating contract protability.
For the more signicant and judgemental contracts, in performing the following additional testing, we:
• obtained an understanding of the performance and status of the contracts in progress;
• discussed and understood management's estimates for total contract costs and forecast costs to complete, including taking into account the historical accuracy of such estimates; and
Key audit matter How our audit addressed the key audit matter
3. Tax contingencies
As disclosed in note 20 to the annexed nancial statements, various tax matters are pending adjudication at various levels with the taxation authorities and other legal forums. Such contingencies require the management to make judgments and estimates in relation to the interpretation of tax laws and regulations and the recognition and measurement of any provisions that may be requ i red aga ins t such cont ingenc ies . Due to inherent uncertainties and the time period such matters may take to resolve, the m a n a g e m e n t ' s j u d g m e n t s a n d e s t i m a t e s i n r e l a t i o n t o s u c h contingencies may be complex and can signicantly impact the nancial statements. For such reasons we have considered tax contingencies as a key audit matter.
Our key audit procedures in this area included, amongst others, a review of the correspondence of the Company with the relevant tax authorities and tax advisors including judgments or orders passed by the competent authorities.
We also obtained and reviewed conrmations from the Company's external tax advisor for their views on the status of each case and an overall opinion on the open tax position of the Company.
We involved internal tax experts to assess and review the management's conclusions on contingent tax matters and evaluated whether adequate disclosures have been made in note 20 to the annexed nancial statements.
• appropriately provide for loss making contracts.
There is a range of acceptable outcomes resulting from these judgments that could lead to different prot and revenue reported in the nancial statements.
• compared management's position on the recognition of any cost and revenue, to the actual costs incurred and current progress of the contract.
The signicance of the balance coupled with the judgment involved has resulted in the valuation of inventories being identied as a key audit matter
The disclosures in relation to inventories are included in note 26.
5. Revenue recognition
As referred to in note 6.17, revenue is recognized when the risks and rewards of the underlying products have been transferred to the customer. The Company focuses on revenue as a key performance measure which could create an incentive for fraudulently overstated revenue by recognizing revenue before the risks and rewards have been transferred
Our audit procedures included considering the appropriateness of the Company's revenue recognition accounting policies.
In response to the risk of fraud, we tested the effectiveness of the Company's controls over the timing of revenue recognition.
We assessed sales transactions taking place at either side of the year end as well as credit notes, if any, issued after the year end date to assess whether that revenue was recognised in the correct period.
We performed testing over journals posted to revenue, near the end of the reporting period to identify unusual or irregular items.
We also considered the adequacy of the Company's disclosures in respect of revenue.
Information other than the Financial Statements and Auditor's Report Thereon
Management is responsible for the other information. The other information comprises the information included in the annual report, but does not include the nancial statements and our auditor's report thereon.
Our opinion on the nancial statements does not cover the other information and we do not express any form of assurance conclusion thereon.
In connection with our audit of the nancial statements, our responsibility is to read the other information and, in doing so, consider whether the other information is materially inconsistent with the nancial statements or our knowledge obtained in the audit or otherwise appears to be materially misstated.
If, based on the work we have performed, we conclude that there is a material misstatement of this other information, we are required to report that fact. We have nothing to report in this regard.
Responsibilities of Management and Board of Directors for the Financial Statements
Management is responsible for the preparation and fair presentation of the nancial statements in accordance with the accounting and reporting standards as applicable in Pakistan and the requirements of Companies Act, 2017(XIX of 2017) and for such internal control as management determines is necessary to enable the preparation of nancial statements that are free from material misstatement, whether due to fraud or error.
In preparing the nancial statements, management is responsible for assessing the Company's ability to continue as a going concern, disclosing, as applicable, matters related to going concern and using the going concern basis of accounting unless management either intends to liquidate the Company or to cease operations, or has no realistic alternative but to do so.
The Board of directors is responsible for overseeing the Company's nancial reporting process.
J 04 Pak Elektron Limited J 05Annual Report 2018

Key audit matter How our audit addressed the key audit matter
4. Contract accounting and revenue recognition
The Company's business involves entering into long term contracts with customers to provide a construction services with a signicant proportion of the Company's revenues and prots derived such contracts.
Due to the contracting nature of the business, revenue recognition involves a signicant degree of judgment, as referred to in note 2.4.8 to the consolidated nancial statements, with estimates being made to:
• assess the total contract cost;
• assess the stage of completion of the contract;
• forecast the prot margin after taking consideration of estimated future costs to complete the projects in progress; and
We read the relevant clauses with in all key contracts and discussed each with management to obtain a full understanding of the specic terms and risks, which informed our consideration of whether revenue for these contracts was appropriately recognized.
We evaluated and tested the operating effectiveness of internal controls over the accuracy and timing of revenue recognized, including controls relating to estimating total costs, stage of completion of contracts, prot margin and evaluating contract protability.
For the more signicant and judgemental contracts, in performing the following additional testing, we:
• obtained an understanding of the performance and status of the contracts in progress;
• discussed and understood management's estimates for total contract costs and forecast costs to complete, including taking into account the historical accuracy of such estimates; and
Key audit matter How our audit addressed the key audit matter
3. Tax contingencies
As disclosed in note 20 to the annexed nancial statements, various tax matters are pending adjudication at various levels with the taxation authorities and other legal forums. Such contingencies require the management to make judgments and estimates in relation to the interpretation of tax laws and regulations and the recognition and measurement of any provisions that may be requ i red aga ins t such cont ingenc ies . Due to inherent uncertainties and the time period such matters may take to resolve, the m a n a g e m e n t ' s j u d g m e n t s a n d e s t i m a t e s i n r e l a t i o n t o s u c h contingencies may be complex and can signicantly impact the nancial statements. For such reasons we have considered tax contingencies as a key audit matter.
Our key audit procedures in this area included, amongst others, a review of the correspondence of the Company with the relevant tax authorities and tax advisors including judgments or orders passed by the competent authorities.
We also obtained and reviewed conrmations from the Company's external tax advisor for their views on the status of each case and an overall opinion on the open tax position of the Company.
We involved internal tax experts to assess and review the management's conclusions on contingent tax matters and evaluated whether adequate disclosures have been made in note 20 to the annexed nancial statements.
• appropriately provide for loss making contracts.
There is a range of acceptable outcomes resulting from these judgments that could lead to different prot and revenue reported in the nancial statements.
• compared management's position on the recognition of any cost and revenue, to the actual costs incurred and current progress of the contract.
The signicance of the balance coupled with the judgment involved has resulted in the valuation of inventories being identied as a key audit matter
The disclosures in relation to inventories are included in note 26.
5. Revenue recognition
As referred to in note 6.17, revenue is recognized when the risks and rewards of the underlying products have been transferred to the customer. The Company focuses on revenue as a key performance measure which could create an incentive for fraudulently overstated revenue by recognizing revenue before the risks and rewards have been transferred
Our audit procedures included considering the appropriateness of the Company's revenue recognition accounting policies.
In response to the risk of fraud, we tested the effectiveness of the Company's controls over the timing of revenue recognition.
We assessed sales transactions taking place at either side of the year end as well as credit notes, if any, issued after the year end date to assess whether that revenue was recognised in the correct period.
We performed testing over journals posted to revenue, near the end of the reporting period to identify unusual or irregular items.
We also considered the adequacy of the Company's disclosures in respect of revenue.
Information other than the Financial Statements and Auditor's Report Thereon
Management is responsible for the other information. The other information comprises the information included in the annual report, but does not include the nancial statements and our auditor's report thereon.
Our opinion on the nancial statements does not cover the other information and we do not express any form of assurance conclusion thereon.
In connection with our audit of the nancial statements, our responsibility is to read the other information and, in doing so, consider whether the other information is materially inconsistent with the nancial statements or our knowledge obtained in the audit or otherwise appears to be materially misstated.
If, based on the work we have performed, we conclude that there is a material misstatement of this other information, we are required to report that fact. We have nothing to report in this regard.
Responsibilities of Management and Board of Directors for the Financial Statements
Management is responsible for the preparation and fair presentation of the nancial statements in accordance with the accounting and reporting standards as applicable in Pakistan and the requirements of Companies Act, 2017(XIX of 2017) and for such internal control as management determines is necessary to enable the preparation of nancial statements that are free from material misstatement, whether due to fraud or error.
In preparing the nancial statements, management is responsible for assessing the Company's ability to continue as a going concern, disclosing, as applicable, matters related to going concern and using the going concern basis of accounting unless management either intends to liquidate the Company or to cease operations, or has no realistic alternative but to do so.
The Board of directors is responsible for overseeing the Company's nancial reporting process.
J 04 Pak Elektron Limited J 05Annual Report 2018

c) investments made, expenditure incurred and guarantees extended during the year were for the purpose of the Company's business; and
d) zakat deductible at source under the Zakat and Ushr Ordinance, 1980 (XVIII of 1980), was deducted by the Company and deposited in the Central Zakat Fund established under section 7 of that ordinance.
The engagement partner on the audit resulting in this independent auditor's report is ZUBAIR IRFAN MALIK.
RAHMAN SARFARAZ RAHIM IQBAL RAFIQ
Chartered Accountants
Lahore: April 04, 2019
Auditor's Responsibilities for the Audit of the Financial Statements
Our objectives are to obtain reasonable assurance about whether the nancial statements as a whole are free from material misstatement, whether due to fraud or error, and to issue an auditor's report that includes our opinion. Reasonable assurance is a high level of assurance, but is not a guarantee that an audit conducted in accordance with ISAs as applicable in Pakistan will always detect a material misstatement when it exists. Misstatements can arise from fraud or error and are considered material if, individually or in the aggregate, they could reasonably be expected to inuence the economic decisions of user taken on the basis of these nancial statements.
As part of an audit in accordance with ISAs as applicable in Pakistan, we exercise professional judgment and maintain professional skepticism throughout the audit. We also:
• Identify and assess the risks of material misstatement of the nancial statements, whether due to fraud or error, design and perform audit procedures responsive to those risks, and obtain audit evidence that is sufcient and appropriate to provide a basis for our opinion. The risk of not detecting a material misstatement resulting from fraud is higher than for one resulting from error, as fraud may involve collusion, forgery, intentional omissions, misrepresentations, or the override of internal control.
• Obtain an understanding of internal control relevant to the audit in order to design audit procedures that are appropriate in the circumstances, but not for the purpose of expressing an opinion on the effectiveness of the Company's internal control.
• Evaluate the appropriateness of accounting policies used and the reasonableness of accounting estimates and related disclosures made by management.
• Conclude on the appropriateness of management's use of the going concern basis of accounting and, based on the audit evidence obtained, whether a material uncertainty exists related to events or conditions that may cast signicant doubt on the Company's ability to continue as a going concern. If we conclude that a material uncertainty exists, we are required to draw attention in our auditor's report to the related disclosures in the nancial statements or, if such disclosures are inadequate, to modify our opinion. Our conclusions are based on the audit evidence obtained up to the date of our auditor's report. However, future events or conditions may cause the Company to cease to continue as a going concern.
• Evaluate the overall presentation, structure and content of the nancial statements, including the disclosures, and whether the nancial statements represent the underlying transactions and events in a manner that achieves fair presentation.
We communicate with the board of directors regarding, among other matters, the planned scope and timing of the audit and signicant audit ndings, including any signicant deciencies in internal control that we identify during our audit
.We also provide the board of directors with a statement that we have complied with relevant ethical requirements regarding independence, and to communicate with them all relationships and other matters that may reasonably be thought to bear on our independence, and where applicable, related safeguards.
From the matters communicated with the board of directors, we determine those matters that were of most signicance in the audit of the nancial statements of the current period and are therefore the key audit matters. We describe these matters in our auditor's report unless law or regulation precludes public disclosure about the matter or when, in extremely rare circumstances, we determine that a matter should not be communicated in our report because the adverse consequences of doing so would reasonably be expected to outweigh the public interest benets of such communication.
Report on Other Legal and Regulatory Requirements
Based on our audit, we further report that in our opinion:
a) proper books of account have been kept by the Company as required by the Companies Act, 2017 (XIX of 2017);
b) the statement of nancial position, the statement of prot or loss, the statement of comprehensive income, the statement of changes in equity and the statement of cash ows together with the notes thereon have been drawn up in conformity with the Companies Act, 2017 (XIX of 2017) and are in agreement with the books of account and returns;
J 06 Pak Elektron Limited J 07Annual Report 2018

SYED MANZAR HASSANChief Financial Officer
as at December 31, 2018
M. MURAD SAIGOLChief Executive Officer
M. ZEID YOUSUF SAIGOLDirector
Statement of Financial Position
EQUITY AND LIABILITIES
SHARE CAPITAL AND RESERVES
Authorized capital
Issued, subscribed and paid-up capital
Capital reserve
Surplus on revaluation of property, plant and equipment
Accumulated prot
TOTAL EQUITY
LIABILITIES
NON-CURRENT LIABILITIES
Redeemable capital - secured
Long term nances - secured
Liabilities against assets subject to nance lease
Deferred taxation
Deferred income
CURRENT LIABILTIES
Trade and other payables
Unclaimed dividend
Accrued interest/markup/prot
Short term borrowings
Current portion of non-current liabilities
TOTAL LIABILITIES
CONTINGENCIES AND COMMITMENTS
TOTAL EQUITY AND LIABILITIES
The annexed notes from 1 to 58 form an integral part of these nancial statements.
Note 2018 2017
Rupees '000 Rupees '000
8 6,000,000 6,000,000
9 5,426,392 5,426,392 10 4,279,947 4,279,947 11 6,579,049 4,274,019
6,884,031 6,753,080
23,169,419 20,733,438
12 - 68,750
13 2,646,032 3,958,767
14 59,778 22,406
15 2,423,945 1,918,383
16 36,781 38,717
5,166,536 6,007,023
17 823,850 875,182
18,650 12,766
390,172 165,579
18 12,843,848 7,227,368
19 1,814,311 2,027,692
15,890,831 10,308,587
21,057,367 16,315,610
20
44,226,786 37,049,048
ASSETS
NON-CURRENT ASSETS
Property, plant and equipment
Intangible assets
Long term investments
Long term deposits
CURRENT ASSETS
Stores, spares and loose tools
Stock in trade
Trade debts - unsecured
Due against construction work in progress - unsecured, considered good
Short term advances - unsecured
Short term deposits and prepayments
Other receivables - unsecured, considered good
Short term investments
Advance income tax/Income tax refundable
Cash and bank balances
TOTAL ASSETS
The annexed notes from 1 to 58 form an integral part of these nancial statements.
Note 2018 2017
Rupees '000 Rupees '000
21 21,957,015 17,405,713 22 313,352 315,525 23 7,085 8,948 24 365,957 371,936
22,643,409 18,102,122
25 859,145 746,408
26 8,374,111 6,388,779
27 4,870,122 5,484,699
28 1,535,735 1,393,185
29 965,614 826,216
30 1,105,179 1,109,232
360,962 311,090
31 22,071 21,824
32 3,132,528 2,263,669
33 357,910 401,824
21,583,377 18,946,926
44,226,786 37,049,048
J 08 Pak Elektron Limited J 09Annual Report 2018
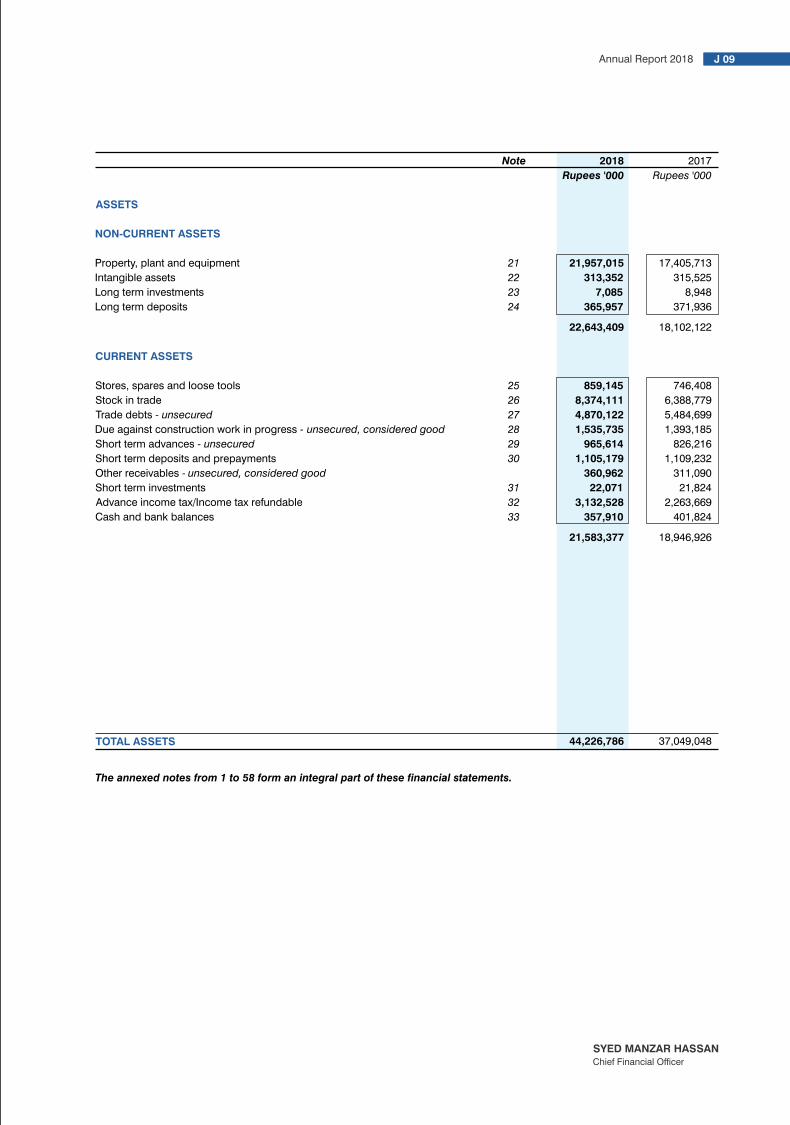

SYED MANZAR HASSANChief Financial Officer
M. MURAD SAIGOLChief Executive Officer
M. ZEID YOUSUF SAIGOLDirector
SYED MANZAR HASSANChief Financial Officer
M. MURAD SAIGOLChief Executive Officer
M. ZEID YOUSUF SAIGOLDirector
For the year ended December 31, 2018 For the year ended December 31, 2018
Statement of Comprehensive IncomeStatement of Prot or Loss
Revenue
Sales tax, excise duty and discounts
Net revenue
Cost of sales
Gross prot
Other income
Distribution cost
Administrative and general expenses
Other expenses
Operating prot
Finance cost
Prot before taxation
Taxation
Prot after taxation
Earnings per share - basic and diluted
The annexed notes from 1 to 58 form an integral part of these nancial statements.
Note 2018 2017
Rupees '000 Rupees '000
34 27,182,898 30,229,103
34 (3,710,466) (4,062,791)
23,472,432 26,166,312
35 (20,719,396) (22,192,115)
2,753,036 3,974,197
36 17,384 17,793
37 (732,340) (805,922)
38 (524,558) (614,442)
39 (43,529) (138,623)
(1,300,427) (1,558,987)
1,469,993 2,433,003
40 (976,447) (921,048)
493,546 1,511,955
41 34,799 (118,792)
528,345 1,393,163
42 0.98 2.71
Items that may be reclassied subsequently to prot or loss
Items that will not be reclassied to prot or loss
Surplus on revaluation of property, plant and
equipment recognised during the year
Deferred tax adjustment on surplus on revaluation of
property, plant and equipment recognised during the year
Deferred tax adjustment on surplus on revaluation of
property, plant and equipment attributable to changes in tax rates
Deferred tax adjustment on surplus on revaluation of
property, plant and equipment attributable to change
in proportion of income taxable under nal tax regime
Other comprehensive income/(loss)
Prot for the year
Total comprehensive income
The annexed notes from 1 to 58 form an integral part of these nancial statements.
Note 2018 2017
- -
11 3,045,215 -
11 (672,091) -
11 52,268 -
11 79,462 (201,431)
2,504,854 (201,431)
2,504,854 (201,431)
528,345 1,393,163
3,033,199 1,191,732
Rupees '000 Rupees '000
J 10 Pak Elektron Limited J 11Annual Report 2018

SYED MANZAR HASSANChief Financial Officer
M. MURAD SAIGOLChief Executive Officer
M. ZEID YOUSUF SAIGOLDirector
SYED MANZAR HASSANChief Financial Officer
M. MURAD SAIGOLChief Executive Officer
M. ZEID YOUSUF SAIGOLDirector
For the year ended December 31, 2018 For the year ended December 31, 2018
Statement of Comprehensive IncomeStatement of Prot or Loss
Revenue
Sales tax, excise duty and discounts
Net revenue
Cost of sales
Gross prot
Other income
Distribution cost
Administrative and general expenses
Other expenses
Operating prot
Finance cost
Prot before taxation
Taxation
Prot after taxation
Earnings per share - basic and diluted
The annexed notes from 1 to 58 form an integral part of these nancial statements.
Note 2018 2017
Rupees '000 Rupees '000
34 27,182,898 30,229,103
34 (3,710,466) (4,062,791)
23,472,432 26,166,312
35 (20,719,396) (22,192,115)
2,753,036 3,974,197
36 17,384 17,793
37 (732,340) (805,922)
38 (524,558) (614,442)
39 (43,529) (138,623)
(1,300,427) (1,558,987)
1,469,993 2,433,003
40 (976,447) (921,048)
493,546 1,511,955
41 34,799 (118,792)
528,345 1,393,163
42 0.98 2.71
Items that may be reclassied subsequently to prot or loss
Items that will not be reclassied to prot or loss
Surplus on revaluation of property, plant and
equipment recognised during the year
Deferred tax adjustment on surplus on revaluation of
property, plant and equipment recognised during the year
Deferred tax adjustment on surplus on revaluation of
property, plant and equipment attributable to changes in tax rates
Deferred tax adjustment on surplus on revaluation of
property, plant and equipment attributable to change
in proportion of income taxable under nal tax regime
Other comprehensive income/(loss)
Prot for the year
Total comprehensive income
The annexed notes from 1 to 58 form an integral part of these nancial statements.
Note 2018 2017
- -
11 3,045,215 -
11 (672,091) -
11 52,268 -
11 79,462 (201,431)
2,504,854 (201,431)
2,504,854 (201,431)
528,345 1,393,163
3,033,199 1,191,732
Rupees '000 Rupees '000
J 10 Pak Elektron Limited J 11Annual Report 2018

Statement of Cash FlowsFor the year ended December 31, 2018 For the year ended December 31, 2018
Statement of Changes In Equity
Note
CASH FLOW FROM OPERATING ACTIVITIES
Cash generated from operations 43
Payments for:
Interest/markup on borrowings - Interest based arrangements
Interest/markup/prot on borrowings - Shariah compliant
Income tax
Net cash (used in)/generated from operating activities
CASH FLOW FROM INVESTING ACTIVITIES
Purchase of property, plant and equipment
Purchase of intangible assets
Proceeds from disposal of property, plant and equipment
Long term deposits refunded
Long term deposits made
Net cash used in investing activities
CASH FLOW FROM FINANCING ACTIVITIES
Redemption of redeemable capital
Long term nances obtained
Repayment of long term nances
Proceeds from sale and lease back activities
Repayment of liabilities against assets subject to nance lease
Net increase in short term borrowings
Dividend paid
Net cash generated from nancing activities
NET DECREASE IN CASH AND CASH EQUIVALENTS
CASH AND CASH EQUIVALENTS AT THE BEGINNING OF THE YEAR
CASH AND CASH EQUIVALENTS AT THE END OF THE YEAR 44
The annexed notes from 1 to 58 form an integral part of these nancial statements.
2018 2017
Rupees '000 Rupees '000
163,131 3,016,858
(257,670) (566,533) (196,675) (43,601) (868,859) (843,872)
(1,160,073) 1,562,852
(2,369,292) (1,843,969)
(8,030) (3,919)
36,288 30,010
27,373 11,927
(21,394) (117,510)
(2,335,055) (1,923,461)
(275,000) (2,564,553)
226,013 3,809,701
(1,542,813) (1,516,669)
109,944 15,100
(92,076) (71,186)
5,616,480 2,245,706
(591,334) (1,611,416)
3,451,214 306,683
(43,914) (53,926)
401,824 455,750
357,910 401,824
Note
Balance as at January 01, 2017
Comprehensive income
Prot after taxation
Other comprehensive loss
Total comprehensive income
Incremental depreciation 11
Transaction with owners
Final dividend on ordinary shares
@ Rs. 1.75 per share
Interim dividend on ordinary shares
@ Rs. 1.25 per share
Balance as at December 31, 2017
Balance as at January 01, 2018
Comprehensive income
Prot after taxation
Other comprehensive income
Total comprehensive income
Incremental depreciation 11
Transaction with owners
Final dividend on ordinary shares
@ Rs. 1.20 per share
Balance as at December 31, 2018
The annexed notes from 1 to 58 form an integral part of these nancial statements.
Share capitalRevenue
reserves
Surplus on
Issued revaluation of
subscribed and Capital property, plant Accumulated Total
paid-up capital reserve and equipment prot equity
Rupees '000 Rupees '000 Rupees '000 Rupees '000 Rupees '000
5,426,392
4,279,947
4,668,386
6,784,446
21,159,171
-
-
-
1,393,163
1,393,163
- - (201,431) - (201,431)
-
-
(201,431)
1,393,163
1,191,732
-
-
(192,936)
192,936
-
-
-
-
(870,943)
(870,943)
-
-
-
(746,522)
(746,522)
-
-
-
(1,617,465)
(1,617,465)
5,426,392 4,279,947 4,274,019 6,753,080 20,733,438
5,426,392
4,279,947
4,274,019
6,753,080
20,733,438
-
-
-
528,345
528,345
-
-
2,504,854
-
2,504,854
-
-
2,504,854
528,345
3,033,199
-
-
(199,824)
199,824
-
-
-
-
(597,218)
(597,218)
5,426,392 4,279,947 6,579,049 6,884,031 23,169,419
Capital reserves
SYED MANZAR HASSANChief Financial Officer
M. MURAD SAIGOLChief Executive Officer
M. ZEID YOUSUF SAIGOLDirector
SYED MANZAR HASSANChief Financial Officer
M. MURAD SAIGOLChief Executive Officer
M. ZEID YOUSUF SAIGOLDirector
J 12 Pak Elektron Limited J 13Annual Report 2018

Notes to the Financial Statements
1 LEGAL STATUS AND OPERATIONS
Pak Elektron Limited ['the Company'] was incorporated in Pakistan on March 03, 1956 as a Public Limited Company under the Companies Act, 1913 (now Companies Act, 2017). Registered ofce of the Company is situated at 17 - Aziz Avenue, Canal Bank, Gulberg - V, Lahore. The manufacturing facilities of the Company are located at 34 - K.M. Ferozepur Road, Keath Village, Lahore and 14 - K.M, Ferozepur Road, Lahore. The Company is currently listed on Pakistan Stock Exchange Limited. The principal activity of the Company is manufacturing and sale of electrical capital goods and domestic appliances.
The Company is currently organized into two main operating divisions - Power Division and Appliances Division. The Company's activities are as follows:
Power Division: Manufacturing and distribution of transformers, switchgears, energy meters, power transformers, construction of grid stations and electrication works.
Appliances Division: Manufacturing, assembling and distribution of refrigerators, deep freezers, air conditioners, microwave ovens, washing machines, water dispensers and other home appliances.
2 BASIS OF PREPARATION
2.1 Separate nancial statements
These nancial statements are the separate nancial statements of the Company in which investments in subsidiary and associated entities are accounted for on the basis of cost rather than on the basis of reported results. Consolidated nancial statements are prepared and presented separately.
2.2 Statement of compliance
These nancial statements have been prepared in accordance with the accounting and reporting standards as applicable in Pakistan. The accounting and reporting standards applicable in Pakistan comprise of:
- International Financial Reporting Standards ['IFRS'] issued by the International Accounting Standards Board ['IASB'] as notied under the Companies Act, 2017;
- Islamic Financial Accounting Standards ['IFAS'] issued by Institute of Chartered Accountants of Pakistan as notied under the Companies Act, 2017; and
- Provisions of and directives issued under the Companies Act, 2017.
Where provisions of and directives issued under the Companies Act, 2017 differ from the IFRS and IFAS, the provisions of and directives issued under the Companies Act, 2017 have been followed.
2.3 Basis of measurement
These nancial statements have been prepared under the historical cost convention except for certain items of property, plant and equipment at revalued amounts, certain assets at recoverable amounts, monetary assets and liabilities denominated in foreign currency measured at spot exchange rates and certain nancial instruments measured at fair value/amortized cost. In these nancial statements, except for the amounts reected in the statement of cash ows, all transactions have been accounted for on accrual basis.
2.4 Judgments, estimates and assumptions
The preparation of nancial statements requires management to make judgments, estimates and assumptions that affect the application of accounting policies and the reported amounts of assets, liabilities, income and expenses. The estimates and associated assumptions and judgments are based on historical experience and various other factors that are believed to be reasonable under the circumstances, the result of which forms the basis of making judgments about carrying values of assets and liabilities that are not readily apparent from other sources. Subsequently, actual results may differ from these estimates. Estimates and underlying assumptions are reviewed on an ongoing basis. Revisions to accounting estimates are recognized in the period in which the estimate is revised and in any future periods affected. Judgments made by management in the application of approved accounting and reporting standards as applicable in Pakistan that have signicant effect on the nancial statements and estimates with a risk of material adjustment in subsequent years are as follows:
2.4.1 Depreciation method, rates and useful lives of property, plant and equipment (see note 6.1.1)
The Company reassesses useful lives, depreciation method and rates for each item of property, plant and equipment annually by considering expected pattern of economic benets that the Company expects to derive from that item.
2.4.2 Amortization method, rates and useful lives of intangible assets (see note 6.2)
The Company reassesses useful lives, amortization method and rates for each intangible asset annually by considering expected pattern of economic benets that the Company expects to derive from that asset.
2.4.3 Recoverable amount and impairment (see note 6.26)
The management of the Company reviews carrying amounts of its assets for possible impairment and makes formal estimates of recoverable amount if there is any such indication.
Goodwill
Determining whether goodwill is impaired requires an estimation of the value in use of the cash-generating units to which goodwill has been allocated. The calculation of value in use requires the entity to estimate the future cash ows expected to arise from the cash-generating unit and a suitable discount rate in order to calculate present value.
Trade and other receivables
The Company assesses the recoverability of its trade debts and other receivables if there is objective evidence that the Company will not be able to collect all the amount due according to the original terms. Signicant nancial difculties of the debtors, probability that the debtor will enter bankruptcy and default or delinquency in payments are considered indicators that the trade debt is impaired.
Investments
The Company reviews the carrying amounts of its investments in equity securities for possible indications of impairment. Indicators considered include nancial position and credit rating of the investee entity and changes in values of investment by reference to active market, if any.
2.4.4 Revaluation of property, plant and equipment (see note 6.1.1)
Revaluation of property, plant and equipment is carried out by independent professional valuers. Revalued amounts of non-depreciable items are determined by reference to local market values and that of depreciable items are determined by reference to present depreciated replacement values
2.4.5 Taxation (see note 6.21)
The Company takes into account the current income tax law and decisions taken by appellate and other relevant legal forums while estimating its provision for current tax. Provision for deferred tax is estimated after taking into account historical and expected future turnover and prot trends and their taxability under the current tax law.
2.4.6 Provisions (see note 6.15)
Provisions are based on best estimate of the expenditure required to settle the present obligation at the reporting date, that is, the amount that the Company would rationally pay to settle the obligation at the reporting date or to transfer it to a third party.
2.4.7 Net realizable values (see note 6.4)
The Company reviews the net realizable values of stock in trade to assess any diminution in the respective carrying amounts. Net realizable value is determined with reference to estimated selling prices less estimated costs necessary to make the sale.
2.4.8 Estimated future costs to complete projects in progress (see note 6.19)
As part of the application of percentage of completion method on contract accounting, the project costs are estimated. These estimates are based on the prices of materials and services applicable at that time, forecasted increases and expected completion date at the time of such estimation. Such estimates are reviewed at regular intervals. Any subsequent changes in the prices of materials and services compared to forecasted prices and changes in the time of completion affect the results of the subsequent periods.
2.5`Functional currency
These nancial statements have been prepared in Pak Rupees which is the Company's functional currency.
2.6 Date of authorization for issue
These nancial statements were authorized for issue on April 04, 2019 by the Board of Directors of the Company.
3 NEW AND REVISED STANDARDS, INTERPRETATIONS AND AMENDMENTS EFFECTIVE DURING THE YEAR
The following new and revised standards, interpretations and amendments are effective in the current year but, unless specied otherwise, are either not relevant to the Company or their application does not have any material impact on the nancial statements of the Company other than presentation and disclosures.
Clarications to IFRS 15 - Revenue from Contracts with Customers
IFRS 15 - Revenue from Contracts with Customers have been amended to clarify three aspects of the standard (identifying performance obligations, principal versus agent considerations, and licensing) and to provide some transition relief for modied contracts and completed contracts.
For the year ended December 31, 2018
J 14 Pak Elektron Limited J 15Annual Report 2018
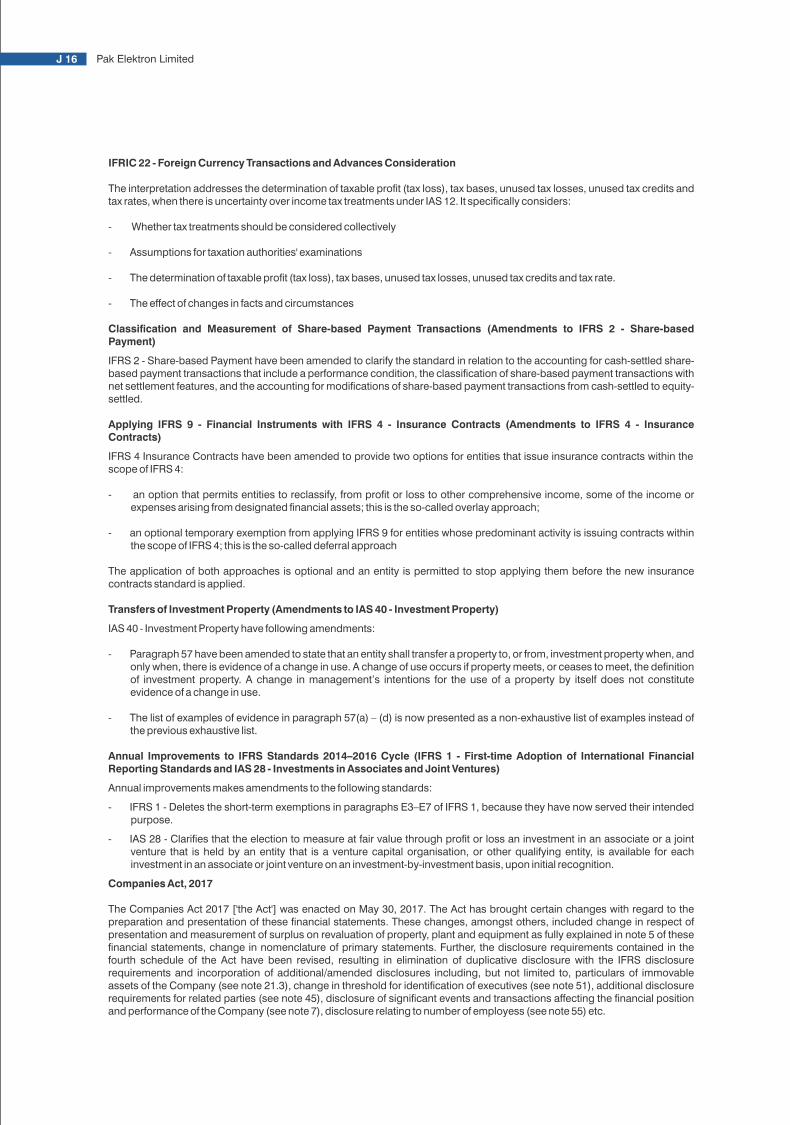
IFRIC 22 - Foreign Currency Transactions and Advances Consideration
The interpretation addresses the determination of taxable prot (tax loss), tax bases, unused tax losses, unused tax credits and tax rates, when there is uncertainty over income tax treatments under IAS 12. It specically considers:
- Whether tax treatments should be considered collectively
- Assumptions for taxation authorities' examinations
- The determination of taxable prot (tax loss), tax bases, unused tax losses, unused tax credits and tax rate.
- The effect of changes in facts and circumstances
Classication and Measurement of Share-based Payment Transactions (Amendments to IFRS 2 - Share-based Payment)
IFRS 2 - Share-based Payment have been amended to clarify the standard in relation to the accounting for cash-settled share-based payment transactions that include a performance condition, the classication of share-based payment transactions with net settlement features, and the accounting for modications of share-based payment transactions from cash-settled to equity-settled.
Applying IFRS 9 - Financial Instruments with IFRS 4 - Insurance Contracts (Amendments to IFRS 4 - Insurance Contracts)
IFRS 4 Insurance Contracts have been amended to provide two options for entities that issue insurance contracts within the scope of IFRS 4:
- an option that permits entities to reclassify, from prot or loss to other comprehensive income, some of the income or expenses arising from designated nancial assets; this is the so-called overlay approach;
- an optional temporary exemption from applying IFRS 9 for entities whose predominant activity is issuing contracts within the scope of IFRS 4; this is the so-called deferral approach
The application of both approaches is optional and an entity is permitted to stop applying them before the new insurance contracts standard is applied.
Transfers of Investment Property (Amendments to IAS 40 - Investment Property)
IAS 40 - Investment Property have following amendments:
- Paragraph 57 have been amended to state that an entity shall transfer a property to, or from, investment property when, and only when, there is evidence of a change in use. A change of use occurs if property meets, or ceases to meet, the denition of investment property. A change in management’s intentions for the use of a property by itself does not constitute evidence of a change in use.
- The list of examples of evidence in paragraph 57(a) – (d) is now presented as a non-exhaustive list of examples instead of the previous exhaustive list.
Annual Improvements to IFRS Standards 2014–2016 Cycle (IFRS 1 - First-time Adoption of International Financial Reporting Standards and IAS 28 - Investments in Associates and Joint Ventures)
Annual improvements makes amendments to the following standards:
- IFRS 1 - Deletes the short-term exemptions in paragraphs E3–E7 of IFRS 1, because they have now served their intended purpose.
- IAS 28 - Claries that the election to measure at fair value through prot or loss an investment in an associate or a joint venture that is held by an entity that is a venture capital organisation, or other qualifying entity, is available for each investment in an associate or joint venture on an investment-by-investment basis, upon initial recognition.
Companies Act, 2017
The Companies Act 2017 ['the Act'] was enacted on May 30, 2017. The Act has brought certain changes with regard to the preparation and presentation of these nancial statements. These changes, amongst others, included change in respect of presentation and measurement of surplus on revaluation of property, plant and equipment as fully explained in note 5 of these nancial statements, change in nomenclature of primary statements. Further, the disclosure requirements contained in the fourth schedule of the Act have been revised, resulting in elimination of duplicative disclosure with the IFRS disclosure requirements and incorporation of additional/amended disclosures including, but not limited to, particulars of immovable assets of the Company (see note 21.3), change in threshold for identication of executives (see note 51), additional disclosure requirements for related parties (see note 45), disclosure of signicant events and transactions affecting the nancial position and performance of the Company (see note 7), disclosure relating to number of employess (see note 55) etc.
4 NEW AND REVISED STANDARDS, INTERPRETATIONS AND AMENDMENTS NOT YET EFFECTIVE
IFRS 9 - Financial Instruments (2014)
IFRS 15 - Revenue from Contracts with Customers
IFRS 16 - Leases (2016)
IFRS 17 - Insurance contracts (2017)
July 01, 2018
July 01, 2018
January 01, 2019
January 01, 2021
Deferred Indenitely
January 01, 2019
January 01, 2019
January 01, 2019
January 01, 2019
January 01, 2019
January 01, 2020
January 01, 2020
January 01, 2020
Effective date
(annual periods beginning
on or after)
Denition of a Business (Amendments to IFRS 3 - Business Combinations)
Denition of Material (Amendments to IAS 1 - First-time Adoption of International
Financial Reporting Standards and IAS 8 - Accounting Policies, Changes in
Accounting Estimates and Errors)
Sale or contribution of assets between an Investor and its Associate or Joint
Venture (Amendments to IFRS 10 - Consolidated Financial Statements and IAS
28 - Investments in Associates and Joint Ventures).
IFRIC 23 - Uncertainty over Income Tax Treatments
Prepayment Features with Negative Compensation (Amendments to IFRS 9 -
Financial Instruments)
Long-term Interests in Associates and Joint Ventures (Amendments to IAS 28 -
Investments in Associates and Joint Ventures)
Annual Improvements to IFRS Standards 2015 – 2017 Cycle
Plan Amendment, Curtailment or Settlement (Amendments to IAS 19 - Employee
Amendments to References to the Conceptual Framework in IFRS Standards
Other than afore mentioned standards, interpretations and amendments, IABS has also issued the following standards which have not been notied by the Securities and Exchange Commission of Pakistan ['SECP']:
IFRS 1 - First Time Adoption of International Financial Reporting Standards IFRS 14 - Regulatory Defferal Accounts IFRS 17 – Insurance contracts (2017)
The Company intends to adopt these new and revised standards, interpretations and amendments on their effective dates, subject to, where required, notication by Securities and Exchange Commission of Pakistan under section 225 of the Companies Act, 2017 regarding their adoption. The management anticipates that the adoption of the above standards, amendments and interpretations in future periods, will have no material impact on the Company's nancial statements other than in presentation/disclosures.
IFRS 9 - Financial Instruments
Finalised version of IFRS 9 - Financial Instruments: Recognition and Measurement which contains accounting requirement for nancial instruments, replacing IAS 39 - Financial Instruments: Recognition and Measurement. The standard contains requirements in the following areas:
- Classication and measurement: Financial assets are classied by reference to the business model within which they are held and their contractual cash ow characteristics. The 2014 version of IFRS 9 introduces a 'fair value through other comprehensive income' category for certain debt instruments. Financial liabilities are classied in a similar manner to under IAS 39, however there are differences in the requirements applying to the measurement of an entity's own credit risk.
- Impairment: The 2014 version of IFRS 9 introduces an 'expected credit loss' model for the measurement of the impairment of nancial assets, so it is no longer necessary for a credit event to have occurred before a credit loss is recognised.
- Hedge accounting: Introduces a new hedge accounting model that is designed to be more closely aligned with how entities undertake risk management activities when hedging nancial and non-nancial risk exposures.
- Derecognition: The requirements for the derecognition of nancial assets and liabilities are carried forward from IAS 39.
J 16 Pak Elektron Limited J 17Annual Report 2018

6.1.2 Capital work in progress
Capital work in progress is stated at cost less identied impairment loss, if any, and includes the cost of material, labour and appropriate overheads directly relating to the construction, erection or installation of an item of operating xed assets. These costs are transferred to operating xed assets as and when related items become available for intended use.
6.2 Intangible assets
6.2.1 Goodwill
Goodwill represents the excess of the cost of business combination over the acquirer's interest in the net fair value of the identiable assets, liabilities and contingent liabilities of the acquiree. This is stated at cost less any accumulated impairment losses, if any.
6.2.2 Technology transfer
The intangible assets in respect of technology transfer are amortized over the useful life of plant and machinery involved in use of such technology. Amortization of intangible commences when it becomes available for use.
6.2.3 Computer software and ERP
Computer software licenses are capitalized on the basis of the costs incurred to acquire and bring to use the specic software. Costs that are directly associated with the production of identiable and unique software products controlled by the Company, and that will probably generate economic benets exceeding costs beyond one year, are recognized as intangible assets. These costs are amortized over their estimated useful lives. Amortization of intangible commences when it becomes available for use.
6.3 Stores, spares and loose tools
These are generally held for internal use and are valued at cost. Cost is determined on the basis of moving average except for items in transit, which are valued at invoice price plus related cost incurred up to the reporting date. For items which are considered obsolete, the carrying amount is written down to nil. Spare parts held for capitalization are classied as property, plant and equipment through capital work in progress.
6.4 Stock in trade
These are valued at lower of cost and net realizable value, with the exception of stock of waste which is valued at net realizable value. Cost is determined using the following basis:
Raw materials Moving average cost Work in process Average manufacturing cost Finished goods Average manufacturing cost Stock in transit Invoice price plus related cost incurred up to the reporting date
Average manufacturing cost in relation to work in process and nished goods consists of direct material, labour and an appropriate proportion of manufacturing overheads.
Net realizable value signies the estimated selling price in the ordinary course of business less estimated costs of completion and estimated costs necessary to make the sale.
6.5 Employee benets
6.5.1 Short-term employee benets
The Company recognizes the undiscounted amount of short term employee benets to be paid in exchange for services rendered by employees as a liability after deducting amount already paid and as an expense in prot or loss unless it is included in the cost of inventories or property, plant and equipment as permitted or required by the approved accounting and reporting standards as applicable in Pakistan. If the amount paid exceeds the undiscounted amount of benets, the excess is recognized as an asset to the extent that the prepayment would lead to a reduction in future payments or cash refund.
The Company provides for compensated absences of its employees on un-availed balance of leaves in the period in which the leaves are earned.
6.5.2 Post-employment benets
The Company operates an approved funded contributory provident fund for all its permanent employees who have completed the minimum qualifying period of service as dened under the respective scheme. Equal monthly contributions are made both by the Company and the employees at the rate of ten percent of basic salary and cost of living allowance, where applicable, to cover the obligation. Contributions are charged to prot or loss.
IFRS 15 - Revenue from Contracts with Customers
IFRS 15 provides a single, principles based ve-step model to be applied to all contracts with customer.
- Identify the contract with customer.
- Identify the performance obligations in the contract.
- Determine the transaction price.
- Allocate the transaction price to the performace obligations in the contracts.
- Recognized revenuew when (or as) the entity satises a performance obligation.
5 CHANGE IN ACCOUNTING POLICY
During the year, the Companies Act, 2017 has been enacted and has resulted in change in accounting policy for surplus on revaluation of property, plant and equipment.
- The surplus on revaluation of property, plant and equipment, which was previously disclosed in the statement of nancial position of the Company after share capital and reserves, has now been included as part of equity with corresponding inclusion in statement of changes in equity;
- If an asset's carrying amount is increased as a result of revaluation, the increase will be recognised in statement of comprehensive income. However, the increase shall be recognised in statement of prot or loss to the extent that it reverses a revaluation decrease of the same asset previously recognised in statement of prot or loss;
- If an asset's carrying amount is decreased as a result of a revaluation, the decrease shall be recognised in statement of prot or loss. However, the decrease shall be recognised in statement of comprehensive income to the extent of any credit balance existing in the revaluation surplus in respect of that asset. Previously, section 235 of repealed Companies Ordinance, 1984 allowed that the surplus on revaluation of property, plant and equipment may be applied by the Company in setting off or in diminution of any decit arising from the revaluation of any other property, plant and equipment of the Company.
The change in accounting policy does not have any impact on the amounts reported in these nancial statements. Hence a third statement of nancial position as at the beginning of the previous year has not been presented.
6 SIGNIFICANT ACCOUNTING POLICIES
6.1 Property, plant and equipment
6.1.1 Operating xed assets
Operating xed assets are measured at cost less accumulated depreciation and accumulated impairment losses with the exception of freehold land, leasehold land, buildings and plant and machinery. Freehold land, buildings and plant and machinery are measured at revalued amounts less accumulated depreciation and accumulated impairment losses, if any. Leasehold land is measured at historical cost. Cost comprises purchase price, including import duties and non-refundable purchase taxes, after deducting trade discounts and rebates, and includes other costs directly attributable to the acquisition or construction, erection and installation.
Assets' residual values, if signicant and their useful lives are reviewed and adjusted, if appropriate, at each statement of nancial position date.
When signicant parts of an item of operating xed assets have different useful lives, they are recognized as separate items.
Major renewals and improvements to operating xed assets are recognized in the carrying amount of the item if it is probable that the embodied future economic benets will ow to the Company and the cost of renewal or improvement can be measured reliably. The cost of the day-to-day servicing of operating xed assets are recognized in prot or loss as incurred.
The Company recognizes depreciation in prot or loss by applying reducing balance method, with the exception of computer hardware and allied items, which are depreciated using straight line method, over the useful life of each operating xed asset using rates specied in note 21 to the nancial statements. Depreciation on additions to operating xed assets is charged from the month in which the item becomes available for use. Depreciation is discontinued from the month in which it is disposed or classied as held for disposal.
An operating xed asset is de-recognized when permanently retired from use. Any gain or loss on disposal of operating xed assets is recognized in prot or loss.
Increases in the carrying amounts arising on revaluation of property, plant and equipment are recognised, net of tax, in other comprehensive income and accumulated in surplus on revaluation of property, plant and equipment in share capital and reserves. To the extent that the increase reverses a decrease previously recognised in prot or loss, the increase is rst recognised in prot or loss. Decreases that reverse previous increases of the same asset are rst recognised in other comprehensive income to the extent of the remaining surplus attributable to the asset; all other decreases are charged to prot or loss. Each year, the difference between depreciation based on the revalued carrying amount of the asset charged to prot or loss and depreciation based on the asset’s original cost, net of tax, is reclassied from the surplus on revaluation of property, plant and equipment to accumulated prot.
J 18 Pak Elektron Limited J 19Annual Report 2018

6.10 Investments in equity securities
6.10.1 Investments in subsidiaries, associates and other un-quoted equity securities
Investments in subsidiaries, associates and other un-quoted equity securities are initially recognized at cost. Subsequent to initial recognition these are measured at cost less accumulated impairment losses, if any.
6.10.2 Investments in other quoted equity securities
These on initial recognition, are designated as 'investments at fair value through prot or loss' and are recognized at cost. Subsequent to initial recognition, these are measured at fair value. Gains and losses arising from changes in fair value are recognized in prot or loss.
6.11 Investments in debt securities
Investments in debt securities with xed or determinable payments and xed maturity that the Company has positive intention and ability to hold are classied as 'held-to-maturity investments'. These are recognized initially at fair value plus transaction costs. Subsequent to initial recognition, these are measured at amortized cost with any difference between cost and value at maturity recognized in the prot or loss over the period of investment on an effective interest basis.
6.12 Finance leases
Leases in terms of which the Company assumes substantially all risks and rewards of ownership are classied as nance leases. Assets subject to nance lease are classied as 'operating xed assets'. On initial recognition, these are measured at cost, being an amount equal to the lower of its fair value and the present value of minimum lease payments. Subsequent to initial recognition, these are measured at cost less accumulated depreciation and accumulated impairment losses. Depreciation, subsequent expenditure, de-recognition, and gains and losses on de-recognition are accounted for in accordance with the respective policies for operating xed assets. Liabilities against assets subject to nance lease and deposits against nance lease are classied as 'nancial liabilities at amortized cost' and 'loans and receivables' respectively, however, since they fall outside the scope of measurement requirements of IAS 39 'Financial Instruments - Recognition and Measurement', these are measured in accordance with the requirements of IAS 17 'Leases'. On initial recognition, these are measured at cost, being their fair value at the date of commencement of lease, less attributable transaction costs. Subsequent to initial recognition, minimum lease payments made under nance leases are apportioned between the nance charge and the reduction of outstanding liability. The nance charge is allocated to each period during the lease term so as to produce a constant periodic rate of interest on the remaining balance of the liability. Deposits against nance leases, subsequent to initial recognition are carried at cost.
6.13 Ijarah transactions
Ujrah payments under an Ijarah are recognized as an expense in the prot or loss on a straight-line basis over the Ijarah terms unless another systematic basis are representative of the time pattern of the user's benet, even if the payments are not on that basis.
6.14 Trade and other payables
6.14.1 Financial liabilities
These are classied as 'nancial liabilities at amortized cost'. On initial recognition, these are measured at cost, being their fair value at the date the liability is incurred, less attributable transaction costs. Subsequent to initial recognition, these are measured at amortized cost using the effective interest method, with interest recognized in prot or loss.
6.14.2 Non-nancial liabilities
These, both on initial recognition and subsequently, are measured at cost.
6.15 Provisions and contingencies
Provisions are recognized when the Company has a legal and constructive obligation as a result of past events and it is probable that outow of resources embodying economic benets will be required to settle the obligation and a reliable estimate can be made of the amount of obligation. Provision is recognized at an amount that is the best estimate of the expenditure required to settle the present obligation at the reporting date. Where outow of resources embodying economic benets is not probable, or where a reliable estimate of the amount of obligation cannot be made, a contingent liability is disclosed, unless the possibility of outow is remote.
6.16 Trade and other receivables
6.16.1 Financial assets
These are classied as 'loans and receivables'. On initial recognition, these are measured at cost, being their fair value at the date of transaction, plus attributable transaction costs. Subsequent to initial recognition, these are measured at amortized cost using the effective interest method, with interest recognized in prot or loss.
6.16.2 Non-nancial assets
These, both on initial recognition and subsequently, are measured at cost.
6.6 Financial instruments
6.6.1 Recognition
A nancial instrument is recognized when the Company becomes a party to the contractual provisions of the instrument.
6.6.2 Classication
The Company classies its nancial instruments into following classes depending on the purpose for which the nancial assets and liabilities are acquired or incurred. The Company determines the classication of its nancial assets and liabilities at initial recognition.
(a) Loans and receivables
Non-derivative nancial assets with xed or determinable payments that are not quoted in an active market are classied as loans and receivables. Assets in this category are presented as current assets except for maturities greater than twelve months from the reporting date, where these are presented as non-current assets.
(b) Financial assets at fair value through prot or loss
Financial assets at fair value through prot or loss are nancial assets that are either designated as such on initial recognition or are classied as held for trading. Financial assets are designated as nancial assets at fair value through prot or loss if the Company manages such assets and evaluates their performance based on their fair value in accordance with the Company’s risk management and investment strategy. Financial assets are classied as held for trading when these are acquired principally for the purpose of selling and repurchasing in the near term, or when these are part of a portfolio of identied nancial instruments that are managed together and for which there is a recent actual pattern of prot taking, or where these are derivatives, excluding derivatives that are nancial guarantee contracts or that are designated and effective hedging instruments. Financial assets in this category are presented as current assets.
(c) Held-to-maturity investments
Held-to-maturity investments are non-derivative nancial assets with xed or determinable payments and xed maturity that an entity has the positive intention and ability to hold to maturity. Assets in this category are presented as non-current assets except for maturities less than twelve months from the reporting date, where these are presented as current assets.
(d) Financial liabilities at amortized cost
Non-derivative nancial liabilities that are not nancial liabilities at fair value through prot or loss are classied as nancial liabilities at amortized cost. Financial liabilities in this category are presented as current liabilities except for maturities greater than twelve months from the reporting date where these are presented as non-current liabilities.
6.6.3 Measurement
The particular measurement methods adopted are disclosed in the individual policy statements associated with each instrument.
6.6.4 De-recognition
Financial assets are de-recognized if the Company's contractual rights to the cash ows from the nancial assets expire or if the Company transfers the nancial asset to another party without retaining control or substantially all risks and rewards of the asset. Financial liabilities are de-recognized if the Company's obligations specied in the contract expire or are discharged or cancelled. Any gain or loss on de-recognition of nancial assets and nancial liabilities is recognized in prot or loss.
6.6.5 Off-setting
A nancial asset and a nancial liability is offset and the net amount reported in the balance sheet if the Company has legally enforceable right to set-off the recognized amounts and intends either to settle on a net basis or to realize the asset and settle the liability simultaneously.
6.7 Ordinary share capital
Ordinary share capital is recognized as equity. Transaction costs directly attributable to the issue of ordinary shares are recognized as deduction from equity.
6.8 Preference share capital
Preference share capital is recognized as equity in accordance with the interpretation of the provision of the repealed Companies Ordinance, 1984, including those pertaining to implied classications of preference shares.
6.9 Loans and borrowings
Loans and borrowings are classied as 'nancial liabilities at amortized cost'. On initial recognition, these are measured at cost, being fair value at the date the liability is incurred, less attributable transaction costs. Subsequent to initial recognition, these are measured at amortized cost with any difference between cost and value at maturity recognized in the prot or loss over the period of the borrowings on an effective interest basis.
J 20 Pak Elektron Limited J 21Annual Report 2018
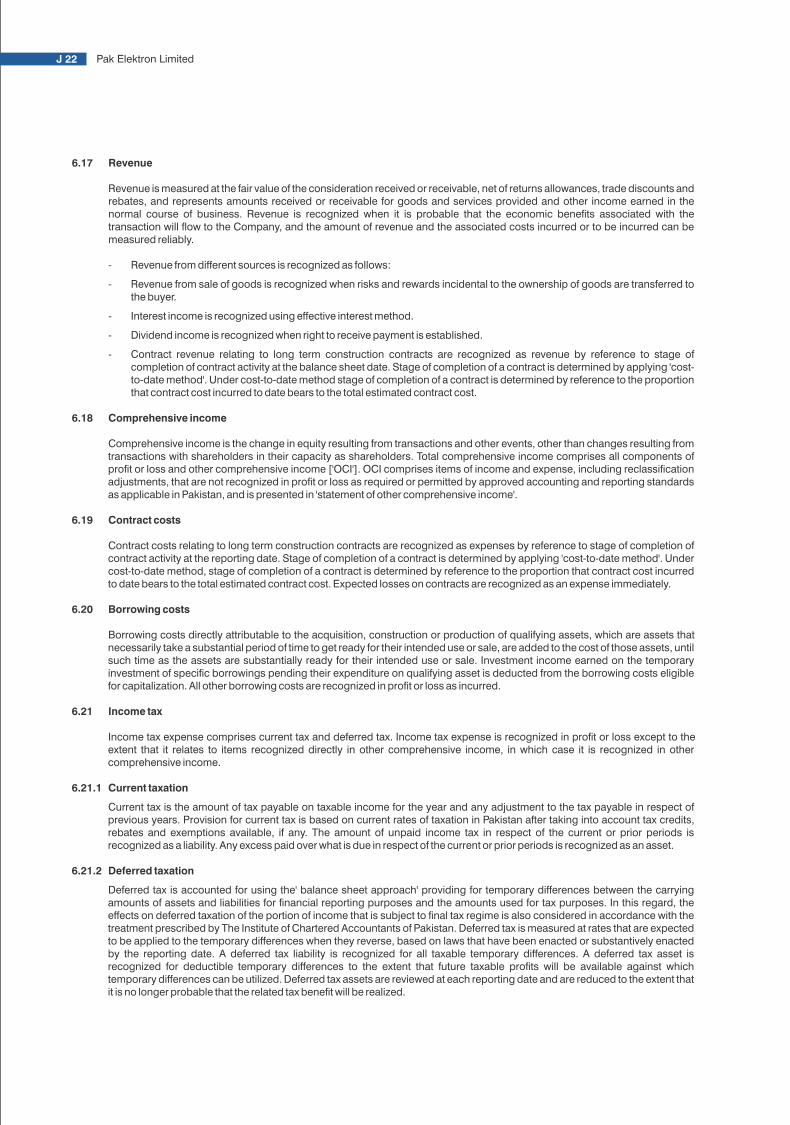
6.22 Government grants
Government grants that compensate the Company for expenses or losses already incurred are recognized in prot or loss in the period in which these are received and are deducted in reporting the relevant expenses or losses. Grants relating to property, plant and equipment are recognized as deferred income and an amount equivalent to depreciation charged on such assets is transferred to prot or loss.
6.23 Earnings per share ['EPS']
Basic EPS is calculated by dividing the prot or loss attributable to ordinary shareholders of the Company by the weighted average number of ordinary shares outstanding during the year.
Diluted EPS is calculated by adjusting basic EPS by the weighted average number of ordinary shares that would be issued on conversion of all dilutive potential ordinary shares into ordinary shares and post-tax effect of changes in prot or loss attributable to ordinary shareholders of the Company that would result from conversion of all dilutive potential ordinary shares into ordinary shares.
6.24 Cash and cash equivalents
Cash and cash equivalents for the purpose of statement of cash ows comprise cash in hand and cash at banks. These are carried at cost.
6.25 Foreign currency transactions and balances
Transactions in foreign currency are translated to the functional currency of the Company using exchange rate prevailing at the date of transaction. Monetary assets and liabilities denominated in foreign currency are translated to the functional currency at exchange rate prevailing at the reporting date. Non-monetary assets and liabilities denominated in foreign currency that are measured at fair value are translated to the functional currency at exchange rate prevailing at the date the fair value is determined. Non-monetary assets and liabilities denominated in foreign currency that are measured at historical cost are translated to functional currency at exchange rate prevailing at the date of initial recognition. Any gain or loss arising on translation of foreign currency transactions and balances is recognized in prot or loss.
6.26 Impairment
6.26.1 Financial assets
A nancial asset is assessed at each reporting date to determine whether there is any objective evidence that it is impaired. Individually signicant nancial assets are tested for impairment on an individual basis. The remaining nancial assets are assessed collectively in groups that share similar credit risk characteristics. A nancial asset is considered to be impaired if objective evidence indicates that one or more events have had a negative effect on the estimated future cash ows of the asset.
An impairment loss in respect of a nancial asset measured at amortized cost is calculated as the difference between its carrying amount, and the present value of the estimated future cash ows discounted at the original effective interest rate. Impairment loss in respect of a nancial asset measured at fair value is determined by reference to that fair value. All impairment losses are recognized in prot or loss. An impairment loss is reversed if the reversal can be related objectively to an event occurring after the impairment loss was recognized. An impairment loss is reversed only to the extent that the nancial asset’s carrying amount after the reversal does not exceed the carrying amount that would have been determined, net of amortization, if no impairment loss had been recognized.
6.26.2 Non-nancial assets
The carrying amount of the Company’s non-nancial assets, other than inventories and deferred tax assets are reviewed at each reporting date to determine whether there is any indication of impairment. If any such indication exists, then the asset’s recoverable amount is estimated. The recoverable amount of an asset or cash generating unit is the greater of its value in use and its fair value less costs to sell. In assessing value in use, the estimated future cash ows are discounted to their present values using a pre-tax discount rate that reects current market assessments of the time value of money and the risks specic to the asset or cash generating unit.
An impairment loss is recognized if the carrying amount of the asset or its cash generating unit exceeds its estimated recoverable amount. Impairment losses are recognized in prot or loss. Impairment losses recognized in respect of cash generating units are allocated to reduce the carrying amounts of the assets in a unit on a pro rata basis. Impairment losses recognized in prior periods are assessed at each reporting date for any indications that the loss has decreased or no longer exists. An impairment loss is reversed if there has been a change in the estimates used in determining the recoverable amount. An impairment loss is reversed only to that extent that the asset’s carrying amount after the reversal does not exceed the carrying amount that would have been determined, net of depreciation and amortization, if no impairment loss had been recognized.
6.27 Dividend distribution to ordinary shareholders
Dividend to ordinary shareholders is recognized as a deduction from accumulated prot in statement of changes in equity and as a liability, to the extent it is unclaimed/unpaid, in the Company’s nancial statements in the year in which the dividends are approved by the Company’s shareholders.
6.17 Revenue
Revenue is measured at the fair value of the consideration received or receivable, net of returns allowances, trade discounts and rebates, and represents amounts received or receivable for goods and services provided and other income earned in the normal course of business. Revenue is recognized when it is probable that the economic benets associated with the transaction will ow to the Company, and the amount of revenue and the associated costs incurred or to be incurred can be measured reliably.
- Revenue from different sources is recognized as follows:
- Revenue from sale of goods is recognized when risks and rewards incidental to the ownership of goods are transferred to the buyer.
- Interest income is recognized using effective interest method.
- Dividend income is recognized when right to receive payment is established.
- Contract revenue relating to long term construction contracts are recognized as revenue by reference to stage of completion of contract activity at the balance sheet date. Stage of completion of a contract is determined by applying 'cost-to-date method'. Under cost-to-date method stage of completion of a contract is determined by reference to the proportion that contract cost incurred to date bears to the total estimated contract cost.
6.18 Comprehensive income
Comprehensive income is the change in equity resulting from transactions and other events, other than changes resulting from transactions with shareholders in their capacity as shareholders. Total comprehensive income comprises all components of prot or loss and other comprehensive income ['OCI']. OCI comprises items of income and expense, including reclassication adjustments, that are not recognized in prot or loss as required or permitted by approved accounting and reporting standards as applicable in Pakistan, and is presented in 'statement of other comprehensive income'.
6.19 Contract costs
Contract costs relating to long term construction contracts are recognized as expenses by reference to stage of completion of contract activity at the reporting date. Stage of completion of a contract is determined by applying 'cost-to-date method'. Under cost-to-date method, stage of completion of a contract is determined by reference to the proportion that contract cost incurred to date bears to the total estimated contract cost. Expected losses on contracts are recognized as an expense immediately.
6.20 Borrowing costs
Borrowing costs directly attributable to the acquisition, construction or production of qualifying assets, which are assets that necessarily take a substantial period of time to get ready for their intended use or sale, are added to the cost of those assets, until such time as the assets are substantially ready for their intended use or sale. Investment income earned on the temporary investment of specic borrowings pending their expenditure on qualifying asset is deducted from the borrowing costs eligible for capitalization. All other borrowing costs are recognized in prot or loss as incurred.
6.21 Income tax
Income tax expense comprises current tax and deferred tax. Income tax expense is recognized in prot or loss except to the extent that it relates to items recognized directly in other comprehensive income, in which case it is recognized in other comprehensive income.
6.21.1 Current taxation
Current tax is the amount of tax payable on taxable income for the year and any adjustment to the tax payable in respect of previous years. Provision for current tax is based on current rates of taxation in Pakistan after taking into account tax credits, rebates and exemptions available, if any. The amount of unpaid income tax in respect of the current or prior periods is recognized as a liability. Any excess paid over what is due in respect of the current or prior periods is recognized as an asset.
6.21.2 Deferred taxation
Deferred tax is accounted for using the' balance sheet approach' providing for temporary differences between the carrying amounts of assets and liabilities for nancial reporting purposes and the amounts used for tax purposes. In this regard, the effects on deferred taxation of the portion of income that is subject to nal tax regime is also considered in accordance with the treatment prescribed by The Institute of Chartered Accountants of Pakistan. Deferred tax is measured at rates that are expected to be applied to the temporary differences when they reverse, based on laws that have been enacted or substantively enacted by the reporting date. A deferred tax liability is recognized for all taxable temporary differences. A deferred tax asset is recognized for deductible temporary differences to the extent that future taxable prots will be available against which temporary differences can be utilized. Deferred tax assets are reviewed at each reporting date and are reduced to the extent that it is no longer probable that the related tax benet will be realized.
J 22 Pak Elektron Limited J 23Annual Report 2018
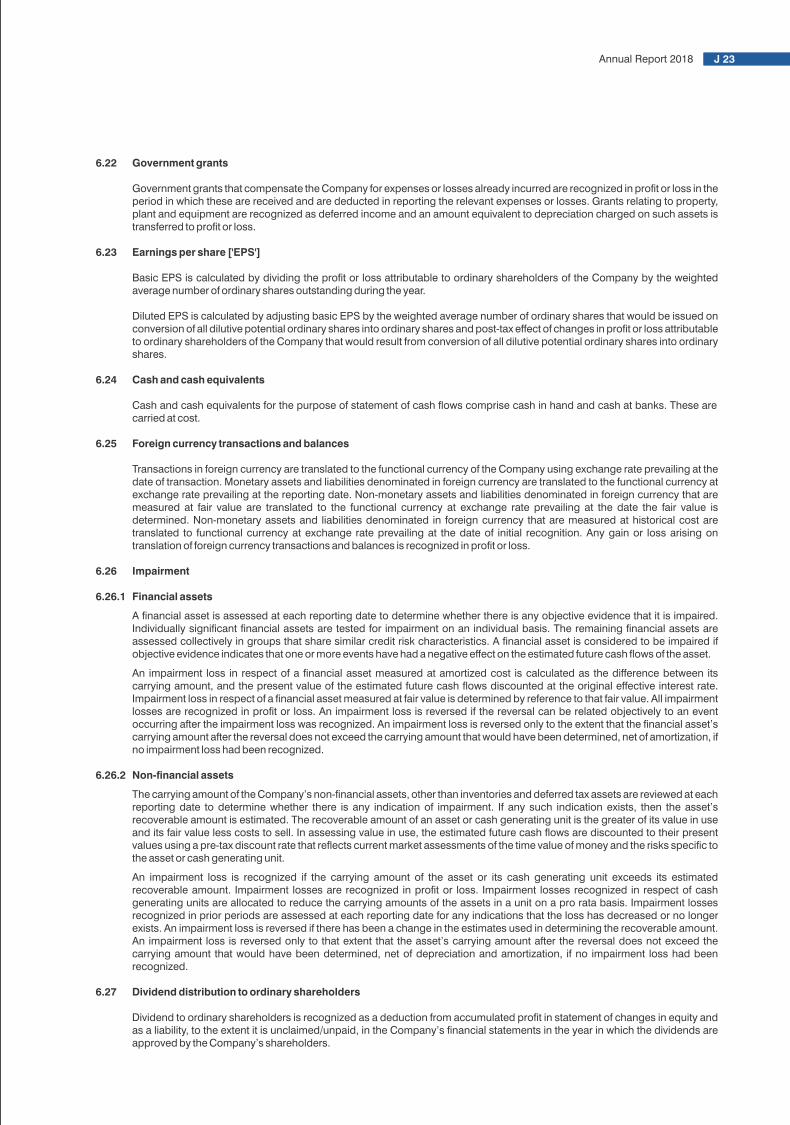
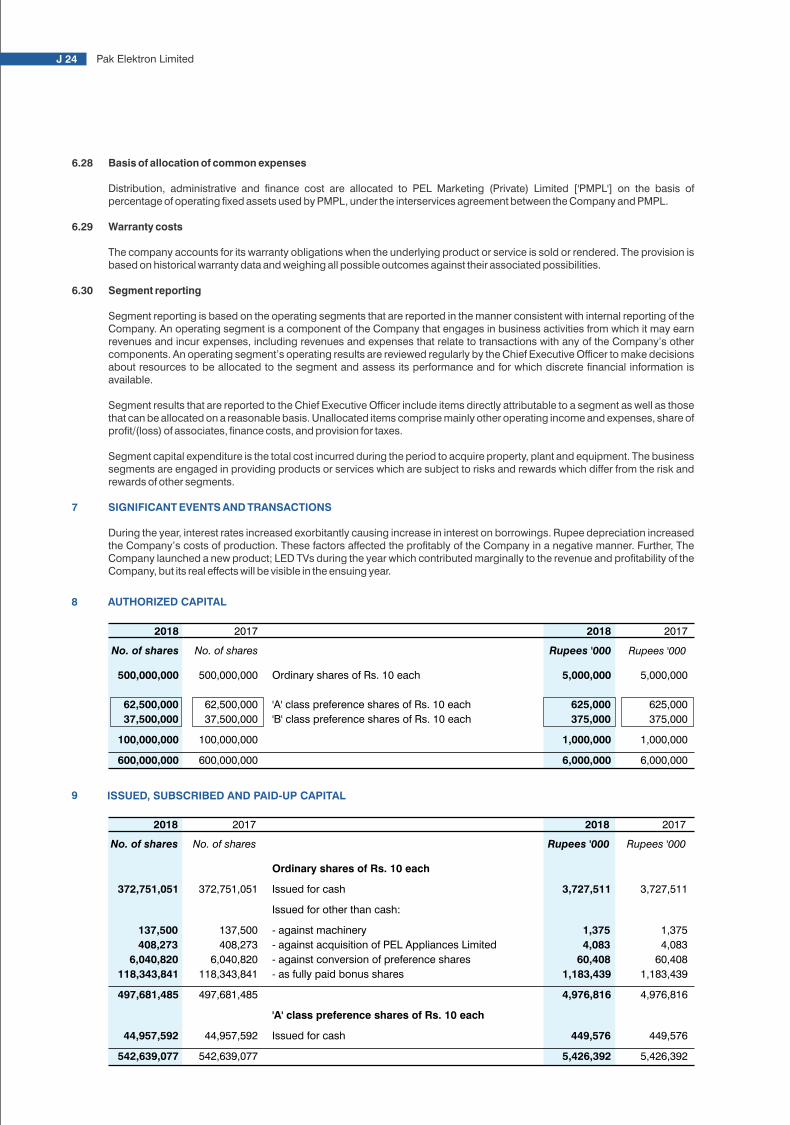
6.28 Basis of allocation of common expenses
Distribution, administrative and nance cost are allocated to PEL Marketing (Private) Limited ['PMPL'] on the basis of percentage of operating xed assets used by PMPL, under the interservices agreement between the Company and PMPL.
6.29 Warranty costs
The company accounts for its warranty obligations when the underlying product or service is sold or rendered. The provision is based on historical warranty data and weighing all possible outcomes against their associated possibilities.
6.30 Segment reporting
Segment reporting is based on the operating segments that are reported in the manner consistent with internal reporting of the Company. An operating segment is a component of the Company that engages in business activities from which it may earn revenues and incur expenses, including revenues and expenses that relate to transactions with any of the Company’s other components. An operating segment’s operating results are reviewed regularly by the Chief Executive Ofcer to make decisions about resources to be allocated to the segment and assess its performance and for which discrete nancial information is available.
Segment results that are reported to the Chief Executive Ofcer include items directly attributable to a segment as well as those that can be allocated on a reasonable basis. Unallocated items comprise mainly other operating income and expenses, share of prot/(loss) of associates, nance costs, and provision for taxes.
Segment capital expenditure is the total cost incurred during the period to acquire property, plant and equipment. The business segments are engaged in providing products or services which are subject to risks and rewards which differ from the risk and rewards of other segments.
7 SIGNIFICANT EVENTS AND TRANSACTIONS
During the year, interest rates increased exorbitantly causing increase in interest on borrowings. Rupee depreciation increased the Company’s costs of production. These factors affected the protably of the Company in a negative manner. Further, The Company launched a new product; LED TVs during the year which contributed marginally to the revenue and protability of the Company, but its real effects will be visible in the ensuing year.
8 AUTHORIZED CAPITAL
Ordinary shares of Rs. 10 each
'A' class preference shares of Rs. 10 each
'B' class preference shares of Rs. 10 each
9 ISSUED, SUBSCRIBED AND PAID-UP CAPITAL
Ordinary shares of Rs. 10 each
Issued for cash
Issued for other than cash:
- against machinery
- against acquisition of PEL Appliances Limited
- against conversion of preference shares
- as fully paid bonus shares
'A' class preference shares of Rs. 10 each
Issued for cash
600,000,000 600,000,000
62,500,000 62,500,000 37,500,000 37,500,000
100,000,000 100,000,000
2018 2017
No. of shares No. of shares
500,000,000 500,000,000
137,500 137,500
408,273 408,273
6,040,820
2017
No. of shares No. of shares
2018
372,751,051 372,751,051
542,639,077 542,639,077
118,343,841 6,040,820
44,957,592 44,957,592
118,343,841
497,681,485 497,681,485
2018 2017
Rupees '000 Rupees '000
5,000,000 5,000,000
625,000 625,000
375,000 375,000
1,000,000 1,000,000
6,000,000 6,000,000
2018 2017
Rupees '000 Rupees '000
3,727,511 3,727,511
1,375 1,375
4,083 4,083
60,408 60,408
1,183,439 1,183,439
4,976,816 4,976,816
449,576 449,576
5,426,392 5,426,392
9.1 'A' class preference shares
9.1.1 Current status of original issue
The Company, in the December 2004, issued 'A' class preference shares to various institutional investors amounting to Rs. 605 million against authorized share capital of this class amounting to Rs. 625 million. In Januray 2010, the Company sent out notices to all preference shareholders seeking conversion of outstanding preference shares into ordinary shares of the Company in accordance with the option available to the investors under the original terms of the issue. As at the reporting date, the outstanding balance of preference shares amounts to Rs. 449.58 million representing investors who did not opt to convert their holdings into the ordinary shares of the Company. Subsequently, the Company offered re-proling of preference shares to these remaining investors. See note 9.1.2.
The Securities and Exchange Commission of Pakistan ['SECP'] issued order to Pakistan Stock Exchange Limited ['the Exchange'] dated February 6, 2009 for delisting of these preference shares. However, the Company took up the matter with the honorable Lahore High Court which, through order dated October 10, 2017, accepted the appeal of Company and set aside the SECP order and the appellate order.
9.1.2 Re-proling of preference shares
The Company offered re-proling of preference shares to investors, who did not convert their preference shares into ordinary shares in response to the conversion notices issued by the Company. The investors to the instrument had, in principle, agreed to the re-proling term sheet and commercial terms and conditions therein. Further, SECP had allowed the Company to proceed with the re-proling subject to fulllment of legal requirements. The legal documentation was prepared and circulated amongst the concerned investors which was endorsed by the said investors except for National Bank of Pakistan, as a result of which the original time frame for reproling has lapsed. The Company is in the process of nalising another reproling exercise based on mutual agreement to be made amongst the existing investors.
9.1.3 Accumulated preference dividend
As at reporting date, an amount of approximately Rs. 384.39 million (2017: Rs. 341.68 million) has been accumulated on account of preference dividend which is payable if and when declared by the Board, to be appropriated out of the distributable prots for that year. In case the preference dividend continues to be accumulated it would be settled at the time of exercising the redemption or conversion option in accordance with the under process reproling exercise.
As per the opinion of Company's legal counsel, the provision of cumulative dividend at 9.5% p.a. will prevail on account of preference dividend, as the approval process of the revised terms of reproling from different quarters is not yet complete.
10 CAPITAL RESERVE
This represents premium on issue of right ordinary shares recognized under Section 83(1) of the repealed Companies Ordinance, 1984.
2018 2017
Rupees '000 Rupees '000
11
4,274,019
4,668,386
3,045,215 -
(672,091)
-
2,373,124 -
-
(280,450) (271,741)
80,626 78,805
(199,824)
(192,936)
79,462 (201,431)
52,268
131,730 (201,431)
SURPLUS ON REVALUATION OF PROPERTY, PLANT AND EQUIPMENT
As at beginning of the year
Surplus recognized during the year
Surplus for the year
Deferred taxation
Incremental depreciation transferred to accumulated prots
Incremental depreciation for the year
Deferred taxation
Other adjustments
Deferred tax adjustment attributable to changes in proportion
of income taxable under nal tax regime
Deferred tax adjustment attributable to changes in tax rates
As at end of the year 6,579,049 4,274,019
J 24 Pak Elektron Limited J 25Annual Report 2018

Note 2018 2017
Rupees '000 Rupees '000
14 LIABILITIES AGAINST ASSETS SUBJECT TO FINANCE LEASE
Present value of minimum lease payments 14.1 & 14.2 102,368
68,062
Current portion presented under current liabilities 14.1 & 14.2 (42,590) (45,656)
59,778 22,406
Note
19
Not later than one year
Later than one year but not later than ve years
Total future minimum lease payments
Finance charge allocated to future periods
Present value of future minimum lease payments
Not later than one year
Later than one year but not later than ve years
15 DEFERRED TAXATION
Deferred tax liability on taxable temporary differences 15.1
Deferred tax asset on deductible temporary differences 15.1
15.1 Recognized deferred tax assets and liabilities
Deferred tax assets and liabilities are attributable to the following:
Deferred tax liabilities
Operating xed assets - owned
Operating xed assets - leased
Deferred tax assets
Provisions
Unused tax losses and credits
Long term investments
2018 2017
Rupees '000 Rupees '000
50,351 49,686
64,573 23,703
114,924 73,389
(12,556) (5,327)
102,368 68,062
(42,590) (45,656)
59,778 22,406
3,708,750 3,379,016
(1,284,805) (1,460,633)
2,423,945 1,918,383
As at Recognized in Recognized on As at
January 01 prot or loss balance sheet December 31
Rupees '000 Rupees '000 Rupees '000 Rupees '000
3,351,793
(213,815)
540,361
3,678,339
27,223
3,188
-
30,411
3,379,016
(210,627)
540,361
3,708,750
(217,668) 27,864 - (189,804)
(1,236,102) 148,243
-
(1,087,859)
(6,863)
(279)
-
(7,142)
(1,460,633) 175,828
-
(1,284,805)
1,918,383 (34,799) 540,361 2,423,945
2018
14.1 These represent vehicles and machinery acquired under nance lease arrangements. The leases are priced at rates ranging from six months KIBOR plus 1.5% to 4.5% per annum (2017: six months to one year KIBOR plus 1.5% to 4.5% per annum). Lease rentals are payable monthly over a tenor ranging from 3 to 4 years. Under the terms of agreement, taxes, repairs, replacements and insurance costs in respect of assets subject to nance lease are borne by the Company. The Company also has the option to acquire these assets at the end of their respective lease terms by adjusting the deposit amount against the residual value of the asset and intends to exercise the option.
14.2 The amount of future payments under the nance lease arrangements and the period in which these payments will become due are as follows:
Description 2018 2017 Pricing Security Arrangements and repayment
Rupees '000 Rupees '000
Shariah compliant
Sukuk Funds 101,875
376,875
Total 101,875 376,875 Current portion presented under current liabilities (101,875)
(308,125)
- 68,750
Three months KIBOR plus 1%
per annum (2017: Three
months KIBOR plus 1% per
annum) subject to oor and
cap of 8% and 16%respectively.
Charge on present and
future operating xed
assets of the Company.
These were issued for the purpose of renance of existing machinery with
diminishing musharaka facility.
Later, the Company entered into restructuring arrangement, whereby, the
outstanding principal was deferred till June 2015 with the outstanding liability
payable in sixteen equal quarterly installments commencing from June 2015.
12 REDEEMABLE CAPITAL - SECURED
These represent interest/markup/prot based debt securities issued to institutional and other investors. The details are as follows:
13 LONG TERM FINANCES - SECURED
These represent long term nances utilized under interest/markup/prot arrangements from banking companies and nancial institutions. The details are as follows:
Description 2018 2017 Pricing Security Arrangements and repayment
Rupees '000 Rupees '000
Shariah compliant
Interest based arrangements
3,565,878 5,108,691
Total 4,315,878 5,632,678
Current portion presented under current liabilities (1,669,846) (1,673,911)
2,646,032 3,958,767
Demand Finance 679,406
951,168
The nance has obtained from National Bank of Pakistan for settlementof long term
nances obtained from NIB Bank Limited. The nance is repayable in twenty three
equal quarterly installments commencing from September 2015.
Charge over present
and future current assets
of the Company and
personal guarantees of
sponsoring directors of
the Company.
Three months KIBOR plus
2.25% per annum (2017:
Three months KIBOR plus
2.25% per annum).
Term Finance 750,000 523,987 Three months KIBOR plus 1%
per annum (2017: Three
months KIBOR plus 1% per
annum).
Charge over operating
xed assets of the
Company and personal
guarantees of
sponsoring directors of
the Company.
This represents diminishingmusharika facility obtained from Faysal Bank Limited for
the purpose of balancing modernization and replacement requirements. The
nance is repayable in fteen equal quarterly installmentscommencing from May
2019, with a grace period of one year.
Demand Finance 568,384
820,999
Three months KIBOR plus 2%
per annum (2017: Three
months KIBOR plus 2% per
annum).
Charge over operating
xed assets of the
Company and personal
guarantees of
sponsoring directors of
the Company.
This represents demand nance facility sanctioned by National Bank of Pakistan
against an upfront payment of 1,650 millionagainst Private Placed Term Finance
Certicates. The nance is repayable in sixteen equal quarterly installments
commencing from April 2017.
Term Finance 375,000
500,000
Three months KIBOR plus
3.8% per annum (2017: Three
months KIBOR plus 3.8% per
annum).
Charge over present
and future current assets
of the Company,
mortgage of the
Company's land and
building.
The nance has been obtained from Pak Oman Investment Company Limited for
the purpose of nancing capital expenditure. The nance is repayable in twelve
equal quarterly installments commencing from March 2018.
Term Finance 1,928,571 2,785,714 Three months KIBOR plus
1.25% per annum (2017:
Three months KIBOR plus
1.25% per annum).
Charge over present
and future current and
xed assets of the
Company, mortgage of
the Company's land and
building.
The nance has been obtained from Bank Alfalah Limited for the purpose of
nancing the repayment of existing long term loans of the company. The nance is
repayable in fourteen equal quarterly installments commencing from December
2017.
Term Finance 14,517
50,810
Charge over operating
xed assets of the
Company and personal
guarantees of
sponsoring directors of
the Company.
The nance has been obtained from The Bank of Punjab for the purpose of
nancing capital expenditure. The nance is repayable in eight equal quarterly
installments commencing from September 2017.
Three months KIBOR plus
2.10% per annum. (2017:
Three months KIBOR plus
2.10% per annum).
J 26 Pak Elektron Limited J 27Annual Report 2018

Deferred tax liabilities
Operating xed assets - owned
Operating xed assets - leased
Deferred tax assets
Provisions
Unused tax losses and credits
Long term investments
As at Recognized in Recognized on As at
January 01 prot or loss balance sheet December 31
Rupees '000 Rupees '000 Rupees '000 Rupees '000
2,942,669 207,693 201,431 3,351,793
40,117
(12,894)
-
27,223
2,982,786 194,799 201,431 3,379,016
(148,524)
(69,144)
-
(217,668)
(1,236,102)
-
-
(1,236,102)
-
(6,863)
-
(6,863)
(1,384,626) (76,007) - (1,460,633)
1,598,160 118,792 201,431 1,918,383
2017
15.2 Deferred tax arising from the timing differences pertaining to income taxable under normal provisions and as a separate block of the Income Tax Ordinance, 2001 ('the Ordinance') has been calculated at 29% and 15 % (2017: 30% and 15%) respectively of the timing differences based on tax rates notied by the Government of Pakistan for future tax years for such income.
2018 2017
Rupees '000 Rupees '000
16 DEFERRED INCOME
As at beginning of the year 38,717
40,755 Recognized in prot or loss (1,936) (2,038)
As at end of the year 36,781 38,717
17 TRADE AND OTHER PAYABLES
Trade creditors - unsecured
Foreign bills payable - secured
Accrued liabilities
Advances from customers - unsecured
Employees' provident fund
Compensated absences
Advance against contracts
Workers' Prot Participation Fund
Workers' Welfare Fund
Other payables - unsecured
17.1 Foreign bills payable are secured against bills of exchange accepted by the Company in favour of suppliers.
Note 2018 2017
Rupees '000 Rupees '000
414,995 399,217 17.1 108,823 99,102
121,826 107,146 65,302 88,205 11,247 13,423 34,162 33,114
46 11,852 9,615 17.2 26,765 82,450 17.3 10,173 30,972
18,705 11,938
823,850 875,182
16.1 The UNIDO vide its contract number 2000/257 dated December 15, 2000, out of the multilateral fund for the implementation of the Montreal Protocol, has given grant-in-aid to the Company for the purpose of phasing out ODS at the Refrigerator and Chest Freezer Plant of the Company. The total grant-in-aid of USD 1,367,633 (Rs. 91,073,838) comprises the capital cost of the project included in xed assets amounting to USD 1,185,929 (Rs. 79,338,650) and grant recoverable in cash of USD 181,704 (Rs. 11,735,188) being the incremental operating cost for six months.
The grant received in cash amounting to Rs.11,735,188 was recognized as income in the year of receipt i.e. year ended June 30, 2001. The value of machinery received in grant was capitalized in year 2001 which started its operation in January 2003. The grant amounting to Rs. 1.936 million (2017: Rs. 2.038 million) has been included in other income in proportion to depreciation charged on related plant and machinery keeping in view the matching principle.
Note 2018 2017
Rupees '000 Rupees '000
82,450 99,939
4,940 5,655
26,772 81,504
(87,397) (104,648)
26,765 82,450
2018 2017
Rupees '000 Rupees '000
30,972
37,977
10,173
30,972
(30,972)
(37,977)
10,173 30,972
10,202,314 4,673,422
1,854,937
1,000,000
200,000
350,000
12,257,251 6,023,422
-
1,135,174
586,597
68,772
12,843,848
7,227,368
18 SHORT TERM BORROWINGS
Secured
Short term nances utilized under interest/markup/prot arrangements from
- Banking companies - Interest based arrangements 18.1
- Banking companies - Shariah compliant 18.1
- Non Banking Finance Companies ['NBFC's'] 18.2
Unsecured
Short term nances utilized under interest/markup arrangements from
Non Banking Finance Companies ['NBFC's'] - Interest based arrangements 18.3
Book overdraft 18.5
17.3 Workers' Welfare Fund
As at beginning of the year
Charged to prot or loss for the year 39
Paid/adjusted during the year
As at end of the year
Note
17.2 Workers' Prot Participation Fund
As at beginning of the year
Interest on funds utilized by the Company 40
Charged to prot or loss for the year 39
Paid during the year
As at end of the year
17.2.1 Interest on funds utilized by the Company has been recognized at 9% (2017: 8.5%) per annum.
18.1 These facilities have been obtained from various banking companies for working capital requirements and carry interest/markup/prot at rates ranging from 7.11% to 12.3% (2017: 7.16% to 9.16%) per annum. These facilities are secured by pledge / hypothecation of raw material and components, work-in-process, nished goods, machinery, spare parts, charge over book debts, shares of public companies and personal guarantees of the sponsoring directors of the Company. These facilities are generally for a period of one year and renewed at the end of the period.
18.2 These facilities have been obtained from NBFCs for purchase of raw material and carry interest/markup at rates ranging from 7.12% to 11.55% (2017: 7.11% to 7.89%) per annum. These facilities are secured by charge over operating xed assets of the Company and personal guarantees of the directors of the Company.
18.3 This represented nances obtained against issue of commercial paper to non-banking nance companies and carry interest/markup at nil (2017: nine months KIBOR plus 1.25% per annum). These were issued at discounted value and are redeemed at face value.
18.4 The aggregate un-availed short term borrowing facilities as at the reporting date amounts to Rs. 10,464 million (2017: Rs. 10,727 million).
18.5 This represents cheques issued by the Company in excess of balances at bank which have been presented for payments in the subsequent period.
J 28 Pak Elektron Limited J 29Annual Report 2018
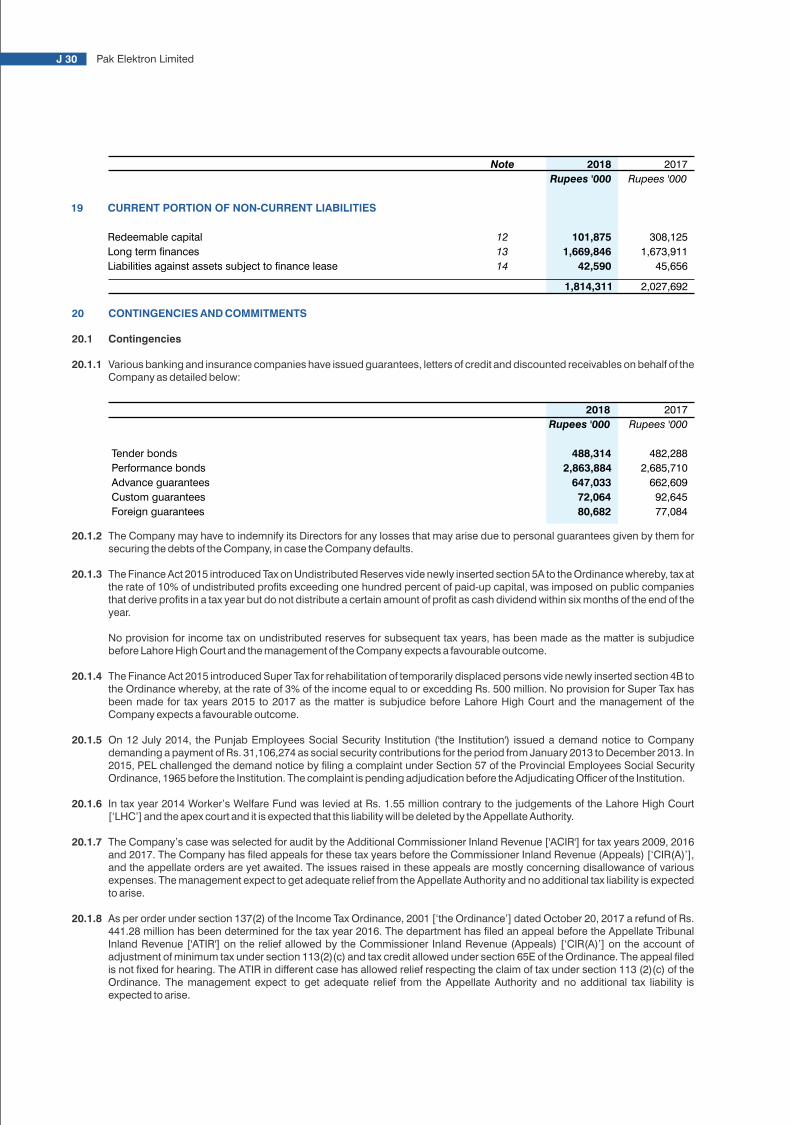
19 CURRENT PORTION OF NON-CURRENT LIABILITIES
Redeemable capital
Long term nances
Liabilities against assets subject to nance lease
Tender bonds
Performance bonds
Advance guarantees
Custom guarantees
Foreign guarantees
2018 2017
Rupees '000 Rupees '000
488,314 482,288 2,863,884 2,685,710
647,033 662,609 72,064 92,645 80,682 77,084
Note 2018 2017
Rupees '000 Rupees '000
12 101,875
308,125
13 1,669,846
1,673,911
14 42,590 45,656
1,814,311 2,027,692
20.2 Commitments
20.2.1 Commitments under irrevocable letters of credit for import of
stores, spare parts and raw material 2,012,639
1,926,602
2018 2017
Rupees '000 Rupees '000
2018 2017
Rupees '000 Rupees '000
- payments not later than one year 13,295
44,389
- payments later than one year 16,139
11,333
29,434 55,722
20 CONTINGENCIES AND COMMITMENTS
20.1 Contingencies
20.1.1 Various banking and insurance companies have issued guarantees, letters of credit and discounted receivables on behalf of the Company as detailed below:
20.1.2 The Company may have to indemnify its Directors for any losses that may arise due to personal guarantees given by them for securing the debts of the Company, in case the Company defaults.
20.1.3 The Finance Act 2015 introduced Tax on Undistributed Reserves vide newly inserted section 5A to the Ordinance whereby, tax at the rate of 10% of undistributed prots exceeding one hundred percent of paid-up capital, was imposed on public companies that derive prots in a tax year but do not distribute a certain amount of prot as cash dividend within six months of the end of the year.
No provision for income tax on undistributed reserves for subsequent tax years, has been made as the matter is subjudice before Lahore High Court and the management of the Company expects a favourable outcome.
20.1.4 The Finance Act 2015 introduced Super Tax for rehabilitation of temporarily displaced persons vide newly inserted section 4B to the Ordinance whereby, at the rate of 3% of the income equal to or excedding Rs. 500 million. No provision for Super Tax has been made for tax years 2015 to 2017 as the matter is subjudice before Lahore High Court and the management of the Company expects a favourable outcome.
20.1.5 On 12 July 2014, the Punjab Employees Social Security Institution ('the Institution') issued a demand notice to Company demanding a payment of Rs. 31,106,274 as social security contributions for the period from January 2013 to December 2013. In 2015, PEL challenged the demand notice by ling a complaint under Section 57 of the Provincial Employees Social Security Ordinance, 1965 before the Institution. The complaint is pending adjudication before the Adjudicating Ofcer of the Institution.
20.1.6 In tax year 2014 Worker’s Welfare Fund was levied at Rs. 1.55 million contrary to the judgements of the Lahore High Court [‘LHC’] and the apex court and it is expected that this liability will be deleted by the Appellate Authority.
20.1.7 The Company’s case was selected for audit by the Additional Commissioner Inland Revenue ['ACIR'] for tax years 2009, 2016 and 2017. The Company has led appeals for these tax years before the Commissioner Inland Revenue (Appeals) [‘CIR(A)’], and the appellate orders are yet awaited. The issues raised in these appeals are mostly concerning disallowance of various expenses. The management expect to get adequate relief from the Appellate Authority and no additional tax liability is expected to arise.
20.1.8 As per order under section 137(2) of the Income Tax Ordinance, 2001 [‘the Ordinance’] dated October 20, 2017 a refund of Rs. 441.28 million has been determined for the tax year 2016. The department has led an appeal before the Appellate Tribunal Inland Revenue ['ATIR'] on the relief allowed by the Commissioner Inland Revenue (Appeals) [‘CIR(A)’] on the account of adjustment of minimum tax under section 113(2)(c) and tax credit allowed under section 65E of the Ordinance. The appeal led is not xed for hearing. The ATIR in different case has allowed relief respecting the claim of tax under section 113 (2)(c) of the Ordinance. The management expect to get adequate relief from the Appellate Authority and no additional tax liability is expected to arise.
20.2.2 Commitments under ijarah contracts
The aggregate amount of ujrah payments for ijarah nancing and the period in which these payments will become due are as follows:
J 30 Pak Elektron Limited J 31Annual Report 2018

21
PR
OP
ER
TY,
PL
AN
T A
ND
EQ
UIP
ME
NT
Net
boo
k
As
atA
s at
As
atA
s at
valu
e as
at
Janu
ary
01A
dditi
ons
Rev
alua
tion
Dis
posa
lsTr
ansf
ers
Dec
embe
r 31
Rat
eJa
nuar
y 01
For
the
year
Rev
alua
tion
Adj
ustm
ent
Dec
embe
r 31
Dec
embe
r 31
Rup
ees
'000
Rup
ees
'000
Rup
ees
'000
Rup
ees
'000
Rup
ees
'000
Rup
ees
'000
%R
upee
s '0
00R
upee
s '0
00R
upee
s '0
00R
upee
s '0
00R
upee
s '0
00R
upee
s '0
00
Asse
ts o
wne
d by
the
Com
pany
Leas
ehol
d la
nd13
,256
-
-
-
-
13
,256
-
-
-
-
-
-13
,256
Free
hold
land
539,
232
-
482,
768
-
-
1,02
2,00
0
-
-
-
-
-
-1,
022,
000
Bui
ldin
g on
leas
ehol
d la
nd1,
763,
372
-
45
3,65
0
-
-
2,
217,
022
575
1,90
4
50
,574
20
6,44
8
-
1,00
8,92
61,
208,
096
Bui
ldin
g on
free
hold
land
2,75
6,95
1
-
709,
259
-
-
3,46
6,21
0
588
4,53
9
93
,620
25
1,64
3
-
1,22
9,80
22,
236,
408
Plan
t and
mac
hine
ry18
,543
,220
391,
790
2,93
6,11
8
(114
,785
)
52,0
68
21,8
08,4
11
56,
308,
542
614,
754
1,07
8,48
9
8,83
68,
010,
621
13,7
97,7
90
-O
fce
equ
ipm
ent a
nd
xtur
es21
4,25
4
35,2
08
-
(52,
506)
-
19
6,95
6
10
118,
943
10,7
67
-
(4
4,53
0)85
,180
111,
776
Com
pute
r har
dwar
e an
d al
lied
item
s14
1,23
2
11,9
18
-
(26,
736)
-
12
6,41
4
30
109,
972
17,7
97
-
(2
5,01
9)10
2,75
023
,664
Vehi
cles
309,
313
18
,583
-
(4
5,90
6)
19
,133
30
1,12
3
20
130,
398
34,6
22
-
(1
1,38
7)15
3,63
314
7,49
0
24,2
80,8
30
457,
499
4,58
1,79
5
(239
,933
)
71,2
01
29,1
51,3
92
8,30
4,29
8
822,
134
1,53
6,58
0
(72,
100)
10,5
90,9
1218
,560
,480
Asse
ts s
ubje
ct to
na
nce
leas
e
Plan
t and
mac
hine
ry10
3,48
8
109,
944
-
-
(52,
068)
161,
364
510
,753
4,
637
-
(8
,956
)6,
434
154,
930
Vehi
cles
102,
834
16
,438
-
-
(19,
133)
100,
139
2032
,815
14
,130
-
(10,
191)
36,7
5463
,385
206,
322
12
6,38
2
-
-
(7
1,20
1)
26
1,50
3
43
,568
18
,767
-
(19,
147)
43,1
8821
8,31
5
24,4
87,1
52
583,
881
4,58
1,79
5
(239
,933
)
-
29
,412
,895
8,34
7,86
6
840,
901
1,53
6,58
0
(91,
247)
10,6
34,1
0018
,778
,795
Cap
ital w
ork
in p
rogr
ess
Bui
ldin
g on
free
hold
land
1,
010,
883
1,42
3,08
7
-
-
-
2,
433,
970
-
-
-
-
-2,
433,
970
Plan
t and
mac
hine
ry25
5,54
4
488,
706
-
-
-
74
4,25
0
-
-
-
--
744,
250
1,26
6,42
7
1,
911,
793
-
-
-
3,
178,
220
-
-
-
-
-3,
178,
220
25,7
53,5
792,
495,
674
4,58
1,79
5(2
39,9
33)
-32
,591
,115
8,34
7,86
684
0,90
11,
536,
580
(91,
247)
10,6
34,1
0021
,957
,015
2018
CO
ST
/ REV
ALU
ED A
MO
UN
TD
EPR
ECIA
TIO
N
Net
boo
k
As a
tAs
at
As a
tAs
at
valu
e as
at
Janu
ary
01Ad
ditio
nsR
eval
uatio
nD
ispo
sals
Tran
sfer
sD
ecem
ber 3
1R
ate
Janu
ary
01Fo
r the
yea
rR
eval
uatio
nAd
just
men
tD
ecem
ber 3
1D
ecem
ber 3
1
Rup
ees
'000
Rup
ees
'000
Rup
ees
'000
Rup
ees
'000
Rup
ees
'000
Rup
ees
'000
%R
upee
s '0
00R
upee
s '0
00R
upee
s '0
00R
upee
s '0
00R
upee
s '0
00R
upee
s '0
00
Asse
ts o
wne
d by
the
Com
pany
Leas
ehol
d la
nd13
,256
-
-
-
-
13
,256
-
-
-
-
-
-13
,256
Free
hold
land
539,
232
-
-
-
-
539,
232
-
-
-
-
-
-53
9,23
2
Bui
ldin
g on
leas
ehol
d la
nd1,
763,
372
-
-
-
-
1,76
3,37
2
569
8,66
9
53
,235
-
-75
1,90
41,
011,
468
Bui
ldin
g on
free
hold
land
2,75
4,33
7
2,
614
-
-
-
2,75
6,95
1
578
6,06
2
98
,477
-
-88
4,53
91,
872,
412
Plan
t and
mac
hine
ry17
,918
,980
521,
540
-
-
102,
700
18,5
43,2
20
55,
655,
258
636,
896
-
16
,388
6,30
8,54
212
,234
,678
-O
fce
equ
ipm
ent a
nd
xtur
es19
4,67
4
23,6
44
-
(4
,064
)
-
21
4,25
4
10
112,
491
9,13
7
-
(2,6
85)
118,
943
95,3
11
Com
pute
r har
dwar
e an
d al
lied
item
s12
8,66
4
28,3
24
-
(1
5,75
6)
-
14
1,23
2
30
107,
688
17,6
33
-
(1
5,34
9)10
9,97
231
,260
Vehi
cles
183,
497
132,
022
-
(6
2,27
6)
56,0
70
309,
313
2097
,002
31
,219
-
2,17
713
0,39
817
8,91
5
23,4
96,0
12
708,
144
-
(8
2,09
6)
158,
770
24,2
80,8
30
7,45
7,17
0
846,
597
-
53
18,
304,
298
15,9
76,5
32
Asse
ts s
ubje
ct to
na
nce
leas
e
Plan
t and
mac
hine
ry20
3,48
8
-
-
-
(1
00,0
00)
103,
488
517
,860
9,
281
-
(1
6,38
8)10
,753
92,7
35
Vehi
cles
131,
102
27,8
02
-
-
(56,
070)
102,
834
2046
,496
13
,998
-
(27,
679)
32,8
1570
,019
334,
590
27,8
02
-
-
(156
,070
)
206,
322
64,3
56
23,2
79
-
(4
4,06
7)43
,568
162,
754
23,8
30,6
02
735,
946
-
(8
2,09
6)
2,70
0
24
,487
,152
7,52
1,52
6
869,
876
-
(4
3,53
6)8,
347,
866
16,1
39,2
86
Cap
ital w
ork
in p
rogr
ess
Bui
ldin
g on
free
hold
land
73
,547
93
7,33
6
-
-
-
1,01
0,88
3
-
-
-
-
-1,
010,
883
Plan
t and
mac
hine
ry59
,755
19
8,48
9
-
-
(2
,700
)
255,
544
-
-
-
-
-25
5,54
4
133,
302
1
,135
,825
-
-
(2,7
00)
1,26
6,42
7
-
-
-
-
-1,
266,
427
23,9
63,9
04
1,87
1,77
1
-
(8
2,09
6)
-
25
,753
,579
7,52
1,52
6
869,
876
-
(4
3,53
6)8,
347,
866
17,4
05,7
13
2017
CO
ST /
REV
ALU
ED A
MO
UN
TD
EPR
ECIA
TIO
N
21.1
Pro
pert
y, p
lan
t an
d e
qu
ipm
en
t in
clu
des
fully
dep
recia
ted
ass
ets
of R
s. 6
4.5
4 m
illio
n (2
01
7: R
s. 7
1.1
5 m
illio
n) w
hic
h a
re s
till
in u
se o
f th
e C
om
pan
y.
21.2
Fre
eh
old
lan
d o
f th
e C
om
pan
y is
locate
d a
t Mo
uza
Ko
t Isl
am
pu
ra, 3
4 -
K.M
, Fero
zep
ur R
oad
, Lah
ore
with
a to
tal a
rea o
f 51
1 K
an
als
(2
01
7: 5
11
Kan
als
).
21.3
Lease
ho
ld la
nd
of t
he C
om
pan
y is
locate
d a
t 14
- K
.M, F
ero
zep
ur R
oad
, Lah
ore
an
d P
lot #
30
2-3
03
, Gad
oo
n In
du
stra
il A
rea, G
ad
oo
n A
maza
i with
a to
tal a
rea o
f 32
2 K
an
als
15
Marl
a (2
01
7: 3
22
K
an
als
15
Marl
a).
J 32 Pak Elektron Limited J 33Annual Report 2018

21
PR
OP
ER
TY,
PL
AN
T A
ND
EQ
UIP
ME
NT
Net
boo
k
As
atA
s at
As
atA
s at
valu
e as
at
Janu
ary
01A
dditi
ons
Rev
alua
tion
Dis
posa
lsTr
ansf
ers
Dec
embe
r 31
Rat
eJa
nuar
y 01
For
the
year
Rev
alua
tion
Adj
ustm
ent
Dec
embe
r 31
Dec
embe
r 31
Rup
ees
'000
Rup
ees
'000
Rup
ees
'000
Rup
ees
'000
Rup
ees
'000
Rup
ees
'000
%R
upee
s '0
00R
upee
s '0
00R
upee
s '0
00R
upee
s '0
00R
upee
s '0
00R
upee
s '0
00
Asse
ts o
wne
d by
the
Com
pany
Leas
ehol
d la
nd13
,256
-
-
-
-
13
,256
-
-
-
-
-
-13
,256
Free
hold
land
539,
232
-
482,
768
-
-
1,02
2,00
0
-
-
-
-
-
-1,
022,
000
Bui
ldin
g on
leas
ehol
d la
nd1,
763,
372
-
45
3,65
0
-
-
2,
217,
022
575
1,90
4
50
,574
20
6,44
8
-
1,00
8,92
61,
208,
096
Bui
ldin
g on
free
hold
land
2,75
6,95
1
-
709,
259
-
-
3,46
6,21
0
588
4,53
9
93
,620
25
1,64
3
-
1,22
9,80
22,
236,
408
Plan
t and
mac
hine
ry18
,543
,220
391,
790
2,93
6,11
8
(114
,785
)
52,0
68
21,8
08,4
11
56,
308,
542
614,
754
1,07
8,48
9
8,83
68,
010,
621
13,7
97,7
90
-O
fce
equ
ipm
ent a
nd
xtur
es21
4,25
4
35,2
08
-
(52,
506)
-
19
6,95
6
10
118,
943
10,7
67
-
(4
4,53
0)85
,180
111,
776
Com
pute
r har
dwar
e an
d al
lied
item
s14
1,23
2
11,9
18
-
(26,
736)
-
12
6,41
4
30
109,
972
17,7
97
-
(2
5,01
9)10
2,75
023
,664
Vehi
cles
309,
313
18
,583
-
(4
5,90
6)
19
,133
30
1,12
3
20
130,
398
34,6
22
-
(1
1,38
7)15
3,63
314
7,49
0
24,2
80,8
30
457,
499
4,58
1,79
5
(239
,933
)
71,2
01
29,1
51,3
92
8,30
4,29
8
822,
134
1,53
6,58
0
(72,
100)
10,5
90,9
1218
,560
,480
Asse
ts s
ubje
ct to
na
nce
leas
e
Plan
t and
mac
hine
ry10
3,48
8
109,
944
-
-
(52,
068)
161,
364
510
,753
4,
637
-
(8
,956
)6,
434
154,
930
Vehi
cles
102,
834
16
,438
-
-
(19,
133)
100,
139
2032
,815
14
,130
-
(10,
191)
36,7
5463
,385
206,
322
12
6,38
2
-
-
(7
1,20
1)
26
1,50
3
43
,568
18
,767
-
(19,
147)
43,1
8821
8,31
5
24,4
87,1
52
583,
881
4,58
1,79
5
(239
,933
)
-
29
,412
,895
8,34
7,86
6
840,
901
1,53
6,58
0
(91,
247)
10,6
34,1
0018
,778
,795
Cap
ital w
ork
in p
rogr
ess
Bui
ldin
g on
free
hold
land
1,
010,
883
1,42
3,08
7
-
-
-
2,
433,
970
-
-
-
-
-2,
433,
970
Plan
t and
mac
hine
ry25
5,54
4
488,
706
-
-
-
74
4,25
0
-
-
-
--
744,
250
1,26
6,42
7
1,
911,
793
-
-
-
3,
178,
220
-
-
-
-
-3,
178,
220
25,7
53,5
792,
495,
674
4,58
1,79
5(2
39,9
33)
-32
,591
,115
8,34
7,86
684
0,90
11,
536,
580
(91,
247)
10,6
34,1
0021
,957
,015
2018
CO
ST
/ REV
ALU
ED A
MO
UN
TD
EPR
ECIA
TIO
N
Net
boo
k
As a
tAs
at
As a
tAs
at
valu
e as
at
Janu
ary
01Ad
ditio
nsR
eval
uatio
nD
ispo
sals
Tran
sfer
sD
ecem
ber 3
1R
ate
Janu
ary
01Fo
r the
yea
rR
eval
uatio
nAd
just
men
tD
ecem
ber 3
1D
ecem
ber 3
1
Rup
ees
'000
Rup
ees
'000
Rup
ees
'000
Rup
ees
'000
Rup
ees
'000
Rup
ees
'000
%R
upee
s '0
00R
upee
s '0
00R
upee
s '0
00R
upee
s '0
00R
upee
s '0
00R
upee
s '0
00
Asse
ts o
wne
d by
the
Com
pany
Leas
ehol
d la
nd13
,256
-
-
-
-
13
,256
-
-
-
-
-
-13
,256
Free
hold
land
539,
232
-
-
-
-
539,
232
-
-
-
-
-
-53
9,23
2
Bui
ldin
g on
leas
ehol
d la
nd1,
763,
372
-
-
-
-
1,76
3,37
2
569
8,66
9
53
,235
-
-75
1,90
41,
011,
468
Bui
ldin
g on
free
hold
land
2,75
4,33
7
2,
614
-
-
-
2,75
6,95
1
578
6,06
2
98
,477
-
-88
4,53
91,
872,
412
Plan
t and
mac
hine
ry17
,918
,980
521,
540
-
-
102,
700
18,5
43,2
20
55,
655,
258
636,
896
-
16
,388
6,30
8,54
212
,234
,678
-O
fce
equ
ipm
ent a
nd
xtur
es19
4,67
4
23,6
44
-
(4
,064
)
-
21
4,25
4
10
112,
491
9,13
7
-
(2,6
85)
118,
943
95,3
11
Com
pute
r har
dwar
e an
d al
lied
item
s12
8,66
4
28,3
24
-
(1
5,75
6)
-
14
1,23
2
30
107,
688
17,6
33
-
(1
5,34
9)10
9,97
231
,260
Vehi
cles
183,
497
132,
022
-
(6
2,27
6)
56,0
70
309,
313
2097
,002
31
,219
-
2,17
713
0,39
817
8,91
5
23,4
96,0
12
708,
144
-
(8
2,09
6)
158,
770
24,2
80,8
30
7,45
7,17
0
846,
597
-
53
18,
304,
298
15,9
76,5
32
Asse
ts s
ubje
ct to
na
nce
leas
e
Plan
t and
mac
hine
ry20
3,48
8
-
-
-
(1
00,0
00)
103,
488
517
,860
9,
281
-
(1
6,38
8)10
,753
92,7
35
Vehi
cles
131,
102
27,8
02
-
-
(56,
070)
102,
834
2046
,496
13
,998
-
(27,
679)
32,8
1570
,019
334,
590
27,8
02
-
-
(156
,070
)
206,
322
64,3
56
23,2
79
-
(4
4,06
7)43
,568
162,
754
23,8
30,6
02
735,
946
-
(8
2,09
6)
2,70
0
24
,487
,152
7,52
1,52
6
869,
876
-
(4
3,53
6)8,
347,
866
16,1
39,2
86
Cap
ital w
ork
in p
rogr
ess
Bui
ldin
g on
free
hold
land
73
,547
93
7,33
6
-
-
-
1,01
0,88
3
-
-
-
-
-1,
010,
883
Plan
t and
mac
hine
ry59
,755
19
8,48
9
-
-
(2
,700
)
255,
544
-
-
-
-
-25
5,54
4
133,
302
1
,135
,825
-
-
(2,7
00)
1,26
6,42
7
-
-
-
-
-1,
266,
427
23,9
63,9
04
1,87
1,77
1
-
(8
2,09
6)
-
25
,753
,579
7,52
1,52
6
869,
876
-
(4
3,53
6)8,
347,
866
17,4
05,7
13
2017
CO
ST /
REV
ALU
ED A
MO
UN
TD
EPR
ECIA
TIO
N
21.1
Pro
pert
y, p
lan
t an
d e
qu
ipm
en
t in
clu
des
fully
dep
recia
ted
ass
ets
of R
s. 6
4.5
4 m
illio
n (2
01
7: R
s. 7
1.1
5 m
illio
n) w
hic
h a
re s
till
in u
se o
f th
e C
om
pan
y.
21.2
Fre
eh
old
lan
d o
f th
e C
om
pan
y is
locate
d a
t Mo
uza
Ko
t Isl
am
pu
ra, 3
4 -
K.M
, Fero
zep
ur R
oad
, Lah
ore
with
a to
tal a
rea o
f 51
1 K
an
als
(2
01
7: 5
11
Kan
als
).
21.3
Lease
ho
ld la
nd
of t
he C
om
pan
y is
locate
d a
t 14
- K
.M, F
ero
zep
ur R
oad
, Lah
ore
an
d P
lot #
30
2-3
03
, Gad
oo
n In
du
stra
il A
rea, G
ad
oo
n A
maza
i with
a to
tal a
rea o
f 32
2 K
an
als
15
Marl
a (2
01
7: 3
22
K
an
als
15
Marl
a).
J 32 Pak Elektron Limited J 33Annual Report 2018

Accumulated Net Disposal Gain/(loss) Mode of
Particulars Cost depreciation book value proceeds on disposal disposal Particulars of buyer
Rupees '000 Rupees '000 Rupees '000 Rupees '000 Rupees '000
Ofce equipment and xtures
Assets having net book value less than Rs. 500,000 each
Table and chairs 5,246 3,995 1,251 256 (995) Negotiation Various individuals
Air conditioners 6,719 5,268 1,451 328 (1,123) Negotiation Various individuals
Mobile sets 566 299 267 - (267) As Per Company Policy Various individuals
Miscellaneous ofce items 39,975 34,968 5,007 1,949 (3,058) Negotiation Various individuals
52,506 44,530 7,976 2,533 (5,443)
Computer hardware and allied items
Assets having net book value less than Rs. 500,000 each
Computer and printers 10,961 10,961
-
512
512
Negotiation Various individuals
Laptops 4,441 2,792
1,649
2,901
1,252
Negotiation Various individuals
Mobile sets 427
359
68
39
(29)
As Per Company Policy Various individuals
Allied items 10,907 10,907
-
382
382
Negotiation Various individuals
26,736 25,019
1,717
3,834
2,117
Vehicles
Audi A3 4,060 460
3,600
4,750
1,150
As Per Company Policy Mehdi Hassan (employee)
78, Block C, DHA Phase-1, Lahore.
BMW X1 5,217 591
4,626
5,737
1,111
As Per Company Policy Mehdi Hassan (employee)
78, Block C, DHA Phase-1, Lahore.
Honda City 1,494 971
523
747
224
As Per Company Policy Atif Imtiaz (employee)
23-A, New Staff Colony U.E.T, Lahore.
Honda Civic 2,439 1,505
934
642
(292)
As Per Company Policy Waseem Ishaq (employee)
199-A, Block C, PCSIR, College Road, Lahore.
Honda Civic 2,489 1,460
1,029
539
(490)
As Per Company Policy Iftikhar Ahmed (employee)
100, Block E, Askari 10, AOHC, Lahore.Honda Civic 2,469 1,448
1,021
560
(461)
As Per Company Policy Tariq Irani (employee)
5, Block G4, Wapda Town, Lahore.
Honda Civic 2,448 1,277
1,171
470
(701)
As Per Company Policy Javed A Khan (employee)
777, Ammar Shaheed Road Chahklala Scheme 3, Rawalpindi.
Honda Civic 2,164 793
1,371
1,456
85
As Per Company Policy Atif Ali (employee)
180, Block C, Gulshan-e-Ravi, Lahore.
Honda Civic 2,521 892
1,629
328
(1,301)
As Per Company Policy Sadiq Munir (employee)
173-A, New Muslim Town, Lahore.
Porsche 1,202 439
763
3,000
2,237
Negotiation Performance Automotive
24-D, Al Faisal Town, Lahore.
Suzuki Mehran 578 10 568 222 (346) As Per Company Policy Shees Butt (employee)
442, Millat Road, Taj Colony, Faisalabad.
Toyota Corolla 1,731 1,015
716
600
(116)
As Per Company Policy Javed Iqbal (employee)
10-A, Block E, Muhaz Town, Multan Road, Lahore.
Toyota Corolla 1,771 924
847
831
(16)
As Per Company Policy Rizwan Cheema (employee)
149-B, PCSIR Colony, Canal Road, Lahore.Assets having net book value less than Rs. 500,000 each
Honda City 1,438 1,028
410
568
158
As Per Company Policy Imran Iqbal (employee)
Suzuki Cultus 1,020 740
280
203
(77)
As Per Company Policy Shaq Ahmed (employee)
Suzuki Cultus 990
692
298
498
200
As Per Company Policy M Mukhtar Khan (employee)
Suzuki Cultus 1,049 615
434
544
110
As Per Company Policy Irshad Khan (employee)
Suzuki Cultus 1,039 586
453
572
119
As Per Company Policy Salman (employee)
Suzuki Cultus 106
12
94
401
307
As Per Company Policy Shahid Ahmed (employee)
Suzuki Cultus 106
12
94
307
213
As Per Company Policy Muhammad Asif (employee)
Suzuki Mehran 612
431
181
700
519
As Per Company Policy Muhammad Shaq (employee)
Suzuki Mehran 612
431
181
305
124
As Per Company Policy Masood ul Hassan (employee)
Suzuki Mehran 612
431
181
213
32
As Per Company Policy Tahir Ikram (employee)
Suzuki Mehran 612
431
181
-
(181)
As Per Company Policy Muhammad Asghar (employee)
Suzuki Mehran 640
420
220
345
125
As Per Company Policy Sami Ullah Qazi (employee)
Suzuki Mehran 657
427
230
167
(63)
As Per Company Policy Amer Fayyaz (employee)
Suzuki Mehran 657
427
230
167
(63)
As Per Company Policy Sharaf ud Din (employee)
Suzuki Mehran 657
427
230
320
90
As Per Company Policy Nasir Javed (employee)
Suzuki Mehran 688
404
284
472
188
As Per Company Policy Muhammad Zeeshan (employee)
Suzuki Mehran 69
14
55
474
419
As Per Company Policy Uzair (employee)
Suzuki Mehran 69
16
53
170
117
As Per Company Policy Shafqat (employee)
Suzuki Swift DX 1,131 797
334
383
49
As Per Company Policy Abdul Qavi Butt (employee)
Toyota Corolla 168
-
168
1,450
1,282
As Per Company Policy Azeem (employee)
Toyota XLI 1,554 1,095 459 306 (153) As Per Company Policy Manzar Hassan (employee)
Motor Bike 63 55 8 64 56 As Per Company Policy Waqas (employee)
Motor Bike 41 30 11 41 30 As Per Company Policy Abid (employee)
Motor Bike 57 39 18 69 51 As Per Company Policy Badar (employee)
Motor Bike 85 53 32 - (32) As Per Company Policy Faisal (employee)
Motor Bike 62 29 33 62 29 As Per Company Policy Abid Tabassum (employee)
Motor Bike 62 32 30 62 32 As Per Company Policy Nauman (employee)
Motor Bike 62 28 34 64 30 As Per Company Policy Syed Anwar Ali (employee)
Motor Bike 64 29 35 64 29 As Per Company Policy Muhammad Ali Shahbaz (employee)
Motor Bike 42 18 24 42 18 As Per Company Policy Nadeem Shahzad (employee)
Motor Bike 64 23 41 64 23 As Per Company Policy Abid Tabassum (employee)
Motor Bike 64 21 43 25 (18) As Per Company Policy Gulman Shah (employee)
Motor Bike 171 - 171 917 746 As Per Company Policy Jehanzeb Ahmed (employee)
45,906 21,578 24,328 29,921 5,593
125,148 91,127 34,021 36,288 2,267
2018
21.4 Disposal of operating xed assets
Accumulated Net Disposal Gain/(loss) Mode of
Particulars Cost depreciation book value proceeds on disposal disposal Particulars of buyer
Rupees '000 Rupees '000 Rupees '000 Rupees '000 Rupees '000
Ofce equipment and xtures
Table and chairs 1,021 775 246 249 3 Negotiation Various individuals
Air conditioners 1,746 1,233 513 43 (470) Negotiation Various individuals
Mobile sets 364 77 287 94 (193) Negotiation Various individuals
Mobile sets 63
4
59
76
17
Insurance Claim Adamjee insurance
Miscellaneous ofce items 870 596 274 50 (224) Negotiation Various individuals
4,064
2,685
1,379
512
(867)
Computer hardware and allied items
Computer and printers 13,048
13,048
-
342
342
Negotiation Various individuals
Laptops 161
118
43
36
(7)
Negotiation Various individuals
Mobile sets 1,854
1,491
363
429
66
Negotiation Various individuals
Allied items 693
692
1
110
109
Negotiation Various individuals
15,756
15,349
407
917
510
Vehicles
Honda City 167
-
167
1,375
1,208
As Per Company Policy Kashif Khan (employee)
Honda City 1,438
979
459
940
481
As Per Company Policy Adnan Shahid (employee)
Honda City 1,603
847
756
201
(555)
As Per Company Policy Arfan Hashmi (employee)
Honda Civic 2,167
1,436
731
719
(12)
As Per Company Policy Nasir Paul (employee)
Toyota Corolla 1,775
-
1,775
1,775
-
As Per Company Policy Javed Iqbal (employee)
Honda Civic 2,383
1,567
816
616
(200)
As Per Company Policy Mehdi Hassan (employee)
Suzuki Cultus 106
-
106
925
819
As Per Company Policy Kamran (employee)
Suzuki Cultus 1,029
528
501
315
(186)
As Per Company Policy Muhammad Hanif (employee)
Suzuki Cultus 106
2
104
825
721
As Per Company Policy Adil Ashfaque (employee)
Suzuki Cultus 85
14
71
439
368
As Per Company Policy Arfan Hashmi (employee)
Suzuki Cultus 1,044
561
483
624
141
As Per Company Policy Khalid Sheikh (employee)
Suzuki Cultus 1,049
516
533
322
(211)
As Per Company Policy Umer Shahzad (employee)
Suzuki Cultus 985 621 364 508 144 As Per Company Policy Muhammad Farooq (employee)
Suzuki Cultus 106 5 101 575 474 As Per Company Policy Muhammad Ali (employee)
Suzuki Cultus 1,029 524 505 570 65 As Per Company Policy Tanweer Malik (employee)
Suzuki Mehran 640
416
224
230
6
As Per Company Policy Irfan Ahmad (employee)
Suzuki Mehran 673
345
328
241
(87)
As Per Company Policy Mian Nazir (employee)
Suzuki Mehran 683
348
335
506
171
As Per Company Policy Husnain Arif (employee)
Suzuki Mehran 693
361
332
504
172
As Per Company Policy Khawaja Mudassar (employee)
Suzuki Mehran 657
405
252
167
(85)
As Per Company Policy Attique (employee)
Suzuki Mehran 657
354
303
194
(109)
As Per Company Policy Mahmood (employee)
Suzuki Mehran 657
405
252
358
106
As Per Company Policy Amir Shahzad (employee)
Suzuki Mehran 612
386
226
319
93
As Per Company Policy Afzal (employee)
Suzuki Mehran 612
374
238
340
102
As Per Company Policy Abdul Raheem (employee)
Suzuki Mehran 69
2
67
504
437
As Per Company Policy Yamin Afridi (employee)
Suzuki Swift 1,486
732
754
909
155
As Per Company Policy Muhammad Shahid (employee)
Suzuki Swift 1,282
658
624
562
(62)
As Per Company Policy Muhammad Nauman (employee)
Suzuki Swift 1,282
669
613
532
(81)
As Per Company Policy Shahb Ali (employee)
Suzuki Swift 1,221
634
587
494
(93)
As Per Company Policy Muhammad Shahzad (employee)
Suzuki Swift 1,297
192
1,105
1,107
2
As Per Company Policy Muhammad Farooq (employee)
Suzuki Swift 133
-
133
300
167
As Per Company Policy Nazir (employee)
Suzuki WagonR 92
3
89
443
354
As Per Company Policy Nadeem un Din (employee)
Toyota Corolla 1,824
730
1,094
208
(886)
As Per Company Policy Tauqir Akhtar (employee)
Toyota Corolla 1,591
1,084
507
313
(194)
As Per Company Policy Tariq Siraj (employee)
Toyota Corolla 1,625
1,047
578
365
(213)
As Per Company Policy Muhammad Raq Ahmad (employee)
Toyota Corolla 1,694
926
768
471
(297)
As Per Company Policy Jalil ur Rehman (employee)
Toyota Corolla 1,555
874
681
231
(450)
As Per Company Policy Ashar Abbas (employee)
Toyota Corolla 1,690
1,098
592
1,070
478
As Per Company Policy Umar Saleemi (employee)
Toyota Corolla 1,690
1,120
570
453
(117)
As Per Company Policy Tassawar Hanif (employee)
Toyota Corolla 1,690
1,153
537
441
(96)
As Per Company Policy Syed Muhammad Amer (employee)
Toyota Corolla 1,555
1,040
515
761
246
As Per Company Policy Masood Ahmed (employee)
Honda City 1,538 101 1,437 1,799 362 Sale & Lease Back First Habib Modaraba
Suzuki Cultus 961 - 961 1,124 163 Sale & Lease Back First Habib Modaraba
Suzuki Mehran 605 - 605 708 103 Sale & Lease Back First Habib Modaraba
Suzuki Mehran 605 - 605 708 103 Sale & Lease Back First Habib Modaraba
Suzuki WagonR 901 45 856 1,054 198 Sale & Lease Back First Habib Modaraba
Various Motor Cycles 421 155 266 436 170 As Per Company Policy Various individuals
47,763 23,257 24,506 28,581 4,075
67,583 41,291 26,292 30,010 3,718
2017
J 34 Pak Elektron Limited J 35Annual Report 2018

Accumulated Net Disposal Gain/(loss) Mode of
Particulars Cost depreciation book value proceeds on disposal disposal Particulars of buyer
Rupees '000 Rupees '000 Rupees '000 Rupees '000 Rupees '000
Ofce equipment and xtures
Assets having net book value less than Rs. 500,000 each
Table and chairs 5,246 3,995 1,251 256 (995) Negotiation Various individuals
Air conditioners 6,719 5,268 1,451 328 (1,123) Negotiation Various individuals
Mobile sets 566 299 267 - (267) As Per Company Policy Various individuals
Miscellaneous ofce items 39,975 34,968 5,007 1,949 (3,058) Negotiation Various individuals
52,506 44,530 7,976 2,533 (5,443)
Computer hardware and allied items
Assets having net book value less than Rs. 500,000 each
Computer and printers 10,961 10,961
-
512
512
Negotiation Various individuals
Laptops 4,441 2,792
1,649
2,901
1,252
Negotiation Various individuals
Mobile sets 427
359
68
39
(29)
As Per Company Policy Various individuals
Allied items 10,907 10,907
-
382
382
Negotiation Various individuals
26,736 25,019
1,717
3,834
2,117
Vehicles
Audi A3 4,060 460
3,600
4,750
1,150
As Per Company Policy Mehdi Hassan (employee)
78, Block C, DHA Phase-1, Lahore.
BMW X1 5,217 591
4,626
5,737
1,111
As Per Company Policy Mehdi Hassan (employee)
78, Block C, DHA Phase-1, Lahore.
Honda City 1,494 971
523
747
224
As Per Company Policy Atif Imtiaz (employee)
23-A, New Staff Colony U.E.T, Lahore.
Honda Civic 2,439 1,505
934
642
(292)
As Per Company Policy Waseem Ishaq (employee)
199-A, Block C, PCSIR, College Road, Lahore.
Honda Civic 2,489 1,460
1,029
539
(490)
As Per Company Policy Iftikhar Ahmed (employee)
100, Block E, Askari 10, AOHC, Lahore.Honda Civic 2,469 1,448
1,021
560
(461)
As Per Company Policy Tariq Irani (employee)
5, Block G4, Wapda Town, Lahore.
Honda Civic 2,448 1,277
1,171
470
(701)
As Per Company Policy Javed A Khan (employee)
777, Ammar Shaheed Road Chahklala Scheme 3, Rawalpindi.
Honda Civic 2,164 793
1,371
1,456
85
As Per Company Policy Atif Ali (employee)
180, Block C, Gulshan-e-Ravi, Lahore.
Honda Civic 2,521 892
1,629
328
(1,301)
As Per Company Policy Sadiq Munir (employee)
173-A, New Muslim Town, Lahore.
Porsche 1,202 439
763
3,000
2,237
Negotiation Performance Automotive
24-D, Al Faisal Town, Lahore.
Suzuki Mehran 578 10 568 222 (346) As Per Company Policy Shees Butt (employee)
442, Millat Road, Taj Colony, Faisalabad.
Toyota Corolla 1,731 1,015
716
600
(116)
As Per Company Policy Javed Iqbal (employee)
10-A, Block E, Muhaz Town, Multan Road, Lahore.
Toyota Corolla 1,771 924
847
831
(16)
As Per Company Policy Rizwan Cheema (employee)
149-B, PCSIR Colony, Canal Road, Lahore.Assets having net book value less than Rs. 500,000 each
Honda City 1,438 1,028
410
568
158
As Per Company Policy Imran Iqbal (employee)
Suzuki Cultus 1,020 740
280
203
(77)
As Per Company Policy Shaq Ahmed (employee)
Suzuki Cultus 990
692
298
498
200
As Per Company Policy M Mukhtar Khan (employee)
Suzuki Cultus 1,049 615
434
544
110
As Per Company Policy Irshad Khan (employee)
Suzuki Cultus 1,039 586
453
572
119
As Per Company Policy Salman (employee)
Suzuki Cultus 106
12
94
401
307
As Per Company Policy Shahid Ahmed (employee)
Suzuki Cultus 106
12
94
307
213
As Per Company Policy Muhammad Asif (employee)
Suzuki Mehran 612
431
181
700
519
As Per Company Policy Muhammad Shaq (employee)
Suzuki Mehran 612
431
181
305
124
As Per Company Policy Masood ul Hassan (employee)
Suzuki Mehran 612
431
181
213
32
As Per Company Policy Tahir Ikram (employee)
Suzuki Mehran 612
431
181
-
(181)
As Per Company Policy Muhammad Asghar (employee)
Suzuki Mehran 640
420
220
345
125
As Per Company Policy Sami Ullah Qazi (employee)
Suzuki Mehran 657
427
230
167
(63)
As Per Company Policy Amer Fayyaz (employee)
Suzuki Mehran 657
427
230
167
(63)
As Per Company Policy Sharaf ud Din (employee)
Suzuki Mehran 657
427
230
320
90
As Per Company Policy Nasir Javed (employee)
Suzuki Mehran 688
404
284
472
188
As Per Company Policy Muhammad Zeeshan (employee)
Suzuki Mehran 69
14
55
474
419
As Per Company Policy Uzair (employee)
Suzuki Mehran 69
16
53
170
117
As Per Company Policy Shafqat (employee)
Suzuki Swift DX 1,131 797
334
383
49
As Per Company Policy Abdul Qavi Butt (employee)
Toyota Corolla 168
-
168
1,450
1,282
As Per Company Policy Azeem (employee)
Toyota XLI 1,554 1,095 459 306 (153) As Per Company Policy Manzar Hassan (employee)
Motor Bike 63 55 8 64 56 As Per Company Policy Waqas (employee)
Motor Bike 41 30 11 41 30 As Per Company Policy Abid (employee)
Motor Bike 57 39 18 69 51 As Per Company Policy Badar (employee)
Motor Bike 85 53 32 - (32) As Per Company Policy Faisal (employee)
Motor Bike 62 29 33 62 29 As Per Company Policy Abid Tabassum (employee)
Motor Bike 62 32 30 62 32 As Per Company Policy Nauman (employee)
Motor Bike 62 28 34 64 30 As Per Company Policy Syed Anwar Ali (employee)
Motor Bike 64 29 35 64 29 As Per Company Policy Muhammad Ali Shahbaz (employee)
Motor Bike 42 18 24 42 18 As Per Company Policy Nadeem Shahzad (employee)
Motor Bike 64 23 41 64 23 As Per Company Policy Abid Tabassum (employee)
Motor Bike 64 21 43 25 (18) As Per Company Policy Gulman Shah (employee)
Motor Bike 171 - 171 917 746 As Per Company Policy Jehanzeb Ahmed (employee)
45,906 21,578 24,328 29,921 5,593
125,148 91,127 34,021 36,288 2,267
2018
21.4 Disposal of operating xed assets
Accumulated Net Disposal Gain/(loss) Mode of
Particulars Cost depreciation book value proceeds on disposal disposal Particulars of buyer
Rupees '000 Rupees '000 Rupees '000 Rupees '000 Rupees '000
Ofce equipment and xtures
Table and chairs 1,021 775 246 249 3 Negotiation Various individuals
Air conditioners 1,746 1,233 513 43 (470) Negotiation Various individuals
Mobile sets 364 77 287 94 (193) Negotiation Various individuals
Mobile sets 63
4
59
76
17
Insurance Claim Adamjee insurance
Miscellaneous ofce items 870 596 274 50 (224) Negotiation Various individuals
4,064
2,685
1,379
512
(867)
Computer hardware and allied items
Computer and printers 13,048
13,048
-
342
342
Negotiation Various individuals
Laptops 161
118
43
36
(7)
Negotiation Various individuals
Mobile sets 1,854
1,491
363
429
66
Negotiation Various individuals
Allied items 693
692
1
110
109
Negotiation Various individuals
15,756
15,349
407
917
510
Vehicles
Honda City 167
-
167
1,375
1,208
As Per Company Policy Kashif Khan (employee)
Honda City 1,438
979
459
940
481
As Per Company Policy Adnan Shahid (employee)
Honda City 1,603
847
756
201
(555)
As Per Company Policy Arfan Hashmi (employee)
Honda Civic 2,167
1,436
731
719
(12)
As Per Company Policy Nasir Paul (employee)
Toyota Corolla 1,775
-
1,775
1,775
-
As Per Company Policy Javed Iqbal (employee)
Honda Civic 2,383
1,567
816
616
(200)
As Per Company Policy Mehdi Hassan (employee)
Suzuki Cultus 106
-
106
925
819
As Per Company Policy Kamran (employee)
Suzuki Cultus 1,029
528
501
315
(186)
As Per Company Policy Muhammad Hanif (employee)
Suzuki Cultus 106
2
104
825
721
As Per Company Policy Adil Ashfaque (employee)
Suzuki Cultus 85
14
71
439
368
As Per Company Policy Arfan Hashmi (employee)
Suzuki Cultus 1,044
561
483
624
141
As Per Company Policy Khalid Sheikh (employee)
Suzuki Cultus 1,049
516
533
322
(211)
As Per Company Policy Umer Shahzad (employee)
Suzuki Cultus 985 621 364 508 144 As Per Company Policy Muhammad Farooq (employee)
Suzuki Cultus 106 5 101 575 474 As Per Company Policy Muhammad Ali (employee)
Suzuki Cultus 1,029 524 505 570 65 As Per Company Policy Tanweer Malik (employee)
Suzuki Mehran 640
416
224
230
6
As Per Company Policy Irfan Ahmad (employee)
Suzuki Mehran 673
345
328
241
(87)
As Per Company Policy Mian Nazir (employee)
Suzuki Mehran 683
348
335
506
171
As Per Company Policy Husnain Arif (employee)
Suzuki Mehran 693
361
332
504
172
As Per Company Policy Khawaja Mudassar (employee)
Suzuki Mehran 657
405
252
167
(85)
As Per Company Policy Attique (employee)
Suzuki Mehran 657
354
303
194
(109)
As Per Company Policy Mahmood (employee)
Suzuki Mehran 657
405
252
358
106
As Per Company Policy Amir Shahzad (employee)
Suzuki Mehran 612
386
226
319
93
As Per Company Policy Afzal (employee)
Suzuki Mehran 612
374
238
340
102
As Per Company Policy Abdul Raheem (employee)
Suzuki Mehran 69
2
67
504
437
As Per Company Policy Yamin Afridi (employee)
Suzuki Swift 1,486
732
754
909
155
As Per Company Policy Muhammad Shahid (employee)
Suzuki Swift 1,282
658
624
562
(62)
As Per Company Policy Muhammad Nauman (employee)
Suzuki Swift 1,282
669
613
532
(81)
As Per Company Policy Shahb Ali (employee)
Suzuki Swift 1,221
634
587
494
(93)
As Per Company Policy Muhammad Shahzad (employee)
Suzuki Swift 1,297
192
1,105
1,107
2
As Per Company Policy Muhammad Farooq (employee)
Suzuki Swift 133
-
133
300
167
As Per Company Policy Nazir (employee)
Suzuki WagonR 92
3
89
443
354
As Per Company Policy Nadeem un Din (employee)
Toyota Corolla 1,824
730
1,094
208
(886)
As Per Company Policy Tauqir Akhtar (employee)
Toyota Corolla 1,591
1,084
507
313
(194)
As Per Company Policy Tariq Siraj (employee)
Toyota Corolla 1,625
1,047
578
365
(213)
As Per Company Policy Muhammad Raq Ahmad (employee)
Toyota Corolla 1,694
926
768
471
(297)
As Per Company Policy Jalil ur Rehman (employee)
Toyota Corolla 1,555
874
681
231
(450)
As Per Company Policy Ashar Abbas (employee)
Toyota Corolla 1,690
1,098
592
1,070
478
As Per Company Policy Umar Saleemi (employee)
Toyota Corolla 1,690
1,120
570
453
(117)
As Per Company Policy Tassawar Hanif (employee)
Toyota Corolla 1,690
1,153
537
441
(96)
As Per Company Policy Syed Muhammad Amer (employee)
Toyota Corolla 1,555
1,040
515
761
246
As Per Company Policy Masood Ahmed (employee)
Honda City 1,538 101 1,437 1,799 362 Sale & Lease Back First Habib Modaraba
Suzuki Cultus 961 - 961 1,124 163 Sale & Lease Back First Habib Modaraba
Suzuki Mehran 605 - 605 708 103 Sale & Lease Back First Habib Modaraba
Suzuki Mehran 605 - 605 708 103 Sale & Lease Back First Habib Modaraba
Suzuki WagonR 901 45 856 1,054 198 Sale & Lease Back First Habib Modaraba
Various Motor Cycles 421 155 266 436 170 As Per Company Policy Various individuals
47,763 23,257 24,506 28,581 4,075
67,583 41,291 26,292 30,010 3,718
2017
J 34 Pak Elektron Limited J 35Annual Report 2018

Note 2018 2017
Rupees '000 Rupees '000
21.5
35 772,241
805,694
The depreciation charge for the year has been allocated as follows:
Cost of sales
Administrative and general expenses 38 68,660 64,182
840,901 869,876
Accumulated Net
Cost depreciation book value
Rupees '000 Rupees '000 Rupees '000
189,184 - 189,184
3,302,326 1,321,029 1,981,297
10,898,107 3,426,343 7,471,764
Accumulated
Cost depreciation Net book value
Rupees '000 Rupees '000 Rupees '000
189,184 - 189,184
3,302,326 1,216,750 2,085,576
Freehold land
Buildings
Plant and machinery
Freehold land
Buildings
Plant and machinery 10,569,034 3,043,288 7,525,746
Rupees
Rupees '000
919,800
2,927,828
Freehold land
Buildings on freehold land
Plant and machinery 11,998,078
15,845,706
2018
2017
21.6 Revaluation of property, plant and equipment
Most recent valuation of freehold land, buildings on freehold and lease hold land and plant and machinery was carried out by an independent valuer, Maricon Consultants (Private) Limited, on December 31, 2018 and was incorporated in the nancial statements for the year ended December 31, 2018. For basis of valuation and other fair value measurement disclosures refer to note 49.
Had there been no revaluation, the cost, accumulated depreciation and net book value of revalued items would have been as follows:
21.6.1 As per most recent valuation, forced sale values of freehold land, buildings on freehold land and plant and machinery are as follows:
22 INTANGIBLE ASSETS
Note
Net book
As at As at As at For the As at value as at
January 01 Additions December 31 January 01 period December 31 December 31
Rupees '000' Rupees '000' Rupees '000' Rupees '000' Rupees '000' Rupees '000' Rupees '000'
Technology transfer agreement 22.1 117,054
-
117,054
38,984
3,904
42,888
74,166
Goodwill 22.2 312,341
-
312,341
91,859
-
91,859
220,482
Software 22.3 8,976
8,030
17,006
4,853
2,058
6,911
10,095
Enterprise Resource Planning system 22.4 31,675
-
31,675
18,825
4,241
23,066
8,609
470,046 8,030 478,076 154,521 10,203 164,724 313,352
2018
Cost Accumulated Amortization
Net book
As at As at As at For the As at value as at
January 01 Additions December 31 January 01 period December 31 December 31
Rupees '000' Rupees '000' Rupees '000' Rupees '000' Rupees '000' Rupees '000' Rupees '000'
Technology transfer agreement 22.1 117,054
-
117,054
34,875
4,109
38,984
78,070
Goodwill 22.2 312,341
-
312,341
91,859
-
91,859
220,482
Software 22.3 5,057 3,919 8,976 4,701 152 4,853 4,123
Enterprise Resource Planning system 22.4 31,675 - 31,675 11,036 7,789 18,825 12,850
466,127 3,919 470,046 142,471 12,050 154,521 315,525
2017
Cost Accumulated Amortization
22.1 The Company has obtained technology of single phase meters, three phase digital meters and also of power transformers from different foreign companies. These are amortized on the same rate as of the depreciation of the relevant plant.
22.2 Goodwill represents the difference between the cost of the acquisition (fair value of consideration paid) and the fair value of the net identiable assets acquired at the time of acquisition of PEL Appliances Limited and PEL Daewoo Electronics Limited by the Company. In view of cancelation of LG license, goodwill related to PEL Daewoo Electronics Limited was fully impaired by providing impairment loss of Rs. 140.569 million in December 31, 2011. The carrying value represents goodwill related to PEL Appliances Limited for which there is no indication of impairment.
22.3 The Company has acquired different software for its business purpose. These are being amortized at 33% per annum on reducing balance method.
22.4 These are being amortized at 33% per annum on reducing balance method.
23 LONG TERM INVESTMENTS
These represent investments in ordinary shares of related parties and are carried at cost less accumulated impairment. The details are as follows:
23.1
24
Note 2018 2017
Rupees '000 Rupees '000
100
100
23.1 6,985 8,848
7,085 8,948
54,701 54,701 (47,716) (45,853)
6,985 8,848
24.1 7,858 31,131
24.2 42,351 42,351
PEL Marketing (Private) Limited - Unquoted
10,000 (2017: 10,000) ordinary shares of Rs. 10 each
Relationship: wholly-owned subsidiary
Ownership Interest: 100%
Kohinoor Power Company Limited - Quoted
2,910,600 (2017: 2,910,600) ordinary shares of Rs. 10 each
Relationship: associate
Ownership Interest: 23.1%
Market value: Rs. 2.40 (2017: Rs. 3.04) per share
Details of investment are as follows:
Cost of investment
Accumulated impairment
LONG TERM DEPOSITS
Financial institutions
Utility companies and regulatory authorities
Customers 24.3 315,748 298,454
365,957 371,936
24.1 These represent security deposits against Ijarah nancing.
24.2 These have been deposited with various utility companies and regulatory authorities. These are classied as 'loan and receivables' under IAS 39 'Financial Instruments - Recognition and Measurement' which are required to be carried at amortized cost. However, these, being held for an indenite period with no xed maturity date, are carried at cost as their amortized cost is impracticable to determine.
J 36 Pak Elektron Limited J 37Annual Report 2018

Note 2018 2017
Rupees '000 Rupees '000
21.5
35 772,241
805,694
The depreciation charge for the year has been allocated as follows:
Cost of sales
Administrative and general expenses 38 68,660 64,182
840,901 869,876
Accumulated Net
Cost depreciation book value
Rupees '000 Rupees '000 Rupees '000
189,184 - 189,184
3,302,326 1,321,029 1,981,297
10,898,107 3,426,343 7,471,764
Accumulated
Cost depreciation Net book value
Rupees '000 Rupees '000 Rupees '000
189,184 - 189,184
3,302,326 1,216,750 2,085,576
Freehold land
Buildings
Plant and machinery
Freehold land
Buildings
Plant and machinery 10,569,034 3,043,288 7,525,746
Rupees
Rupees '000
919,800
2,927,828
Freehold land
Buildings on freehold land
Plant and machinery 11,998,078
15,845,706
2018
2017
21.6 Revaluation of property, plant and equipment
Most recent valuation of freehold land, buildings on freehold and lease hold land and plant and machinery was carried out by an independent valuer, Maricon Consultants (Private) Limited, on December 31, 2018 and was incorporated in the nancial statements for the year ended December 31, 2018. For basis of valuation and other fair value measurement disclosures refer to note 49.
Had there been no revaluation, the cost, accumulated depreciation and net book value of revalued items would have been as follows:
21.6.1 As per most recent valuation, forced sale values of freehold land, buildings on freehold land and plant and machinery are as follows:
22 INTANGIBLE ASSETS
Note
Net book
As at As at As at For the As at value as at
January 01 Additions December 31 January 01 period December 31 December 31
Rupees '000' Rupees '000' Rupees '000' Rupees '000' Rupees '000' Rupees '000' Rupees '000'
Technology transfer agreement 22.1 117,054
-
117,054
38,984
3,904
42,888
74,166
Goodwill 22.2 312,341
-
312,341
91,859
-
91,859
220,482
Software 22.3 8,976
8,030
17,006
4,853
2,058
6,911
10,095
Enterprise Resource Planning system 22.4 31,675
-
31,675
18,825
4,241
23,066
8,609
470,046 8,030 478,076 154,521 10,203 164,724 313,352
2018
Cost Accumulated Amortization
Net book
As at As at As at For the As at value as at
January 01 Additions December 31 January 01 period December 31 December 31
Rupees '000' Rupees '000' Rupees '000' Rupees '000' Rupees '000' Rupees '000' Rupees '000'
Technology transfer agreement 22.1 117,054
-
117,054
34,875
4,109
38,984
78,070
Goodwill 22.2 312,341
-
312,341
91,859
-
91,859
220,482
Software 22.3 5,057 3,919 8,976 4,701 152 4,853 4,123
Enterprise Resource Planning system 22.4 31,675 - 31,675 11,036 7,789 18,825 12,850
466,127 3,919 470,046 142,471 12,050 154,521 315,525
2017
Cost Accumulated Amortization
22.1 The Company has obtained technology of single phase meters, three phase digital meters and also of power transformers from different foreign companies. These are amortized on the same rate as of the depreciation of the relevant plant.
22.2 Goodwill represents the difference between the cost of the acquisition (fair value of consideration paid) and the fair value of the net identiable assets acquired at the time of acquisition of PEL Appliances Limited and PEL Daewoo Electronics Limited by the Company. In view of cancelation of LG license, goodwill related to PEL Daewoo Electronics Limited was fully impaired by providing impairment loss of Rs. 140.569 million in December 31, 2011. The carrying value represents goodwill related to PEL Appliances Limited for which there is no indication of impairment.
22.3 The Company has acquired different software for its business purpose. These are being amortized at 33% per annum on reducing balance method.
22.4 These are being amortized at 33% per annum on reducing balance method.
23 LONG TERM INVESTMENTS
These represent investments in ordinary shares of related parties and are carried at cost less accumulated impairment. The details are as follows:
23.1
24
Note 2018 2017
Rupees '000 Rupees '000
100
100
23.1 6,985 8,848
7,085 8,948
54,701 54,701 (47,716) (45,853)
6,985 8,848
24.1 7,858 31,131
24.2 42,351 42,351
PEL Marketing (Private) Limited - Unquoted
10,000 (2017: 10,000) ordinary shares of Rs. 10 each
Relationship: wholly-owned subsidiary
Ownership Interest: 100%
Kohinoor Power Company Limited - Quoted
2,910,600 (2017: 2,910,600) ordinary shares of Rs. 10 each
Relationship: associate
Ownership Interest: 23.1%
Market value: Rs. 2.40 (2017: Rs. 3.04) per share
Details of investment are as follows:
Cost of investment
Accumulated impairment
LONG TERM DEPOSITS
Financial institutions
Utility companies and regulatory authorities
Customers 24.3 315,748 298,454
365,957 371,936
24.1 These represent security deposits against Ijarah nancing.
24.2 These have been deposited with various utility companies and regulatory authorities. These are classied as 'loan and receivables' under IAS 39 'Financial Instruments - Recognition and Measurement' which are required to be carried at amortized cost. However, these, being held for an indenite period with no xed maturity date, are carried at cost as their amortized cost is impracticable to determine.
J 36 Pak Elektron Limited J 37Annual Report 2018

25 STORES, SPARES AND LOOSE TOOLS
Stores
Spares
Loose tools
Provision for slow moving and obsolete items
25.1 There are no spare parts held exclusively for capitalization as at the reporting date.
Note 2018 2017
Rupees '000 Rupees '000
290,865 136,561
452,987
505,812
134,117
122,859
877,969 765,232
(18,824)
(18,824)
859,145 746,408
24.3 These have been deposited with various customers against EPC and other contracts and are refundable on completion of projects in accordance with term of contracts. Due to uncertainties regarding dates of refund of these deposits, these have been carried at cost.
26
26.1
26.2
26.3
STOCK IN TRADE
Raw material
- in stores
- in transit
Provision for slow moving and obsolete items
Work in process
Finished goods
Provision for slow moving and obsolete items
Movement in provision for slow moving and obsolete items - raw material
As at beginning of the year
Recognized during the year
As at end of the year
Stock in trade valued at Rs. 1,754 million (2017: Rs. 1,308 million) is pledged as security with providers of debt nances.
Entire stock in trade is carried at cost being lower than net realizable value.
Note 2018 2017
Rupees '000 Rupees '000
5,130,566
4,639,215
2,110,833
582,589
26.1 (37,037) (34,515)
7,204,362
5,187,289
758,928 848,453
417,843
360,059
(7,022) (7,022)
410,821 353,037
8,374,111 6,388,779
34,515 25,647 2,522 8,868
37,037 34,515
27 TRADE DEBTS - UNSECURED
Considered good
- against sale of goods
- against execution of contracts
Considered doubtful
Impairment allowance for doubtful debts
1,815,417 3,598,216
27.1 3,054,705 1,886,483
4,870,122 5,484,699
27.2 587,301 576,971
5,457,423 6,061,670
38 (587,301) (576,971)
4,870,122 5,484,699
27.2
28 DUE AGAINST CONSTRUCTION WORK IN PROGRESS - UNSECURED, CONSIDERED GOOD
This represents unbilled revenue from construction work in progress.
Movement in impairment allowance
As at beginning of the year
Recognized during the year
As at end of the year
2018 2017
Rupees '000 Rupees '000
576,971
444,589
10,330
132,382
587,301 576,971
Note 2018 2017
Rupees '000 Rupees '000
27.1 These include retention money for contracts in progress amounting to Rs. 617.648 million (2017: Rs. 855.5 million) held by the customers in accordance with contract terms.
29
29.1
30
SHORT TERM ADVANCES - UNSECURED
Advances to suppliers and contractors - unsecured
- considered good
- considered doubtful
Impairment allowance for doubtful advances
Advances to employees - unsecured
- considered good
- considered doubtful
Impairment allowance for doubtful advances
These include advances for
- purchases
- expenses
- traveling
SHORT TERM DEPOSITS AND PREPAYMENTS
Security deposits
- considered good
- considered doubtful
Impairment allowance for doubtful deposits
Margin deposits
Prepayments
Letters of credit
Note 2018 2017
Rupees '000 Rupees '000
589,824
617,091
32,730
32,730
(32,730) (32,730)
589,824
617,091
29.1 375,790
209,125
1,449
1,449
(1,449) (1,449)
375,790 209,125
965,614 826,216
189,350 136,903 105,524 46,886 80,916 25,336
375,790 209,125
308,133 383,133
5,379 5,379
(5,379) (5,379)
308,133 383,133
421,671 488,316
52,865 46,211
322,510 191,572
1,105,179 1,109,232
J 38 Pak Elektron Limited J 39Annual Report 2018

35.1
21.5
22
26 & 27
848,453
15,556,700
799,473
422,952
27,930
339,186
68,323
30,060
35,855
772,241
10,203
2,522
23,742
151,605
13,282
1,897,901
19,102,527
(758,928)
18,343,599
1,033,340
15,491,808
712,515
482,115
25,623
361,245
61,254
30,028
29,225
805,694
12,050
8,868
27,540
153,582
12,143
2,009,367
19,247,030
(848,453)
18,398,577
35.2
Cost of goods manufactured
Work-in-process at beginning of the year
Raw material and components consumed
Direct wages
Factory overheads:
- salaries, wages and benets
- traveling and conveyance
- electricity, gas and water
- repairs and maintenance
- vehicles running and maintenance
- insurance
- depreciation
- amortization of intangible assets
- provision for obsolete and slow moving stock
- carriage and freight
- erection and testing
- other factory overheads
Work-in-process at end of the year
These include charge in respect of employees retirement benets amounting to Rs. 39.401 million (2017: Rs. 32.37 million).
32
Standard Chartered Bank (Pakistan) Limited
915,070 (2017: 915,070) ordinary shares of Rs. 10 each
Market value: Rs. 24.12 (2017: Rs. 23.85) per share
As at beginning of the year
Changes in fair value
As at end of the year
ADVANCE INCOME TAX/INCOME TAX REFUNDABLE
Advance income tax/income tax refundable
Provision for taxation
Note 2018 2017
Rupees '000 Rupees '000
21,824
23,106
36 & 39 247
(1,282)
22,071
21,824
3,132,528
2,263,669
41 -
-
3,132,528 2,263,669
31 SHORT TERM INVESTMENTS
These represent investments in listed equity securities classied as 'nancial assets at fair value through prot or loss'. The details are as follows:
33
34
46
35
35.1
CASH AND BANK BALANCES
Cash in hand
Cash at banks
NET REVENUE
Contract revenue
Sale of goods
- local
- exports
Sales tax and excise duty
COST OF SALES
Finished goods at the beginning of the year
Cost of goods manufactured
Finished goods at the end of the year
Cost of goods sold
Contract cost 46
8,102
349,808
357,910
2,899,882
23,394,059 888,957
27,182,898 (3,710,466)
23,472,432
360,059
18,343,599
(417,843)
18,285,815
2,433,581
20,719,396
12,012 389,812
401,824
2,841,124
26,095,060
1,292,919
30,229,103
(4,062,791)
26,166,312
1,742,903
18,398,577
(360,059)
19,781,421
2,410,694
22,192,115
Note 2018 2017
Rupees '000 Rupees '000
36
37
OTHER INCOME
Gain on nancial instruments
Changes in fair value of short term investments
Gain on disposal of property, plant and equipment
Gain on sale and lease back activities
Other income
Amortization of grant-in-aid
Others
DISTRIBUTION COST
Salaries and benets
Traveling and conveyance
Rent, rates and taxes
Electricity, gas, fuel and water
Repairs and maintenance
Vehicles running and maintenance
Printing and stationery
Postage, telegrams and telephones
Entertainment and staff welfare
Advertisement and sales promotion
Insurance
Freight and forwarding
Contract and tendering
Warranty period services
Others
Note 2018 2017
Rupees '000 Rupees '000
31 247
-
2,267
3,718
-
2,832
2,514
6,550
16 1,936
2,038
12,934 9,205
14,870 11,243
17,384 17,793
37.1 151,963 137,132 59,254 61,035 9,812 9,710 3,162 3,236 1,302 1,510
18,228 18,792 3,368 3,256 4,469 4,158
11,763 10,731 191,524 258,034
7,524 7,003
121,588 132,209
1,355 6,610
111,565 106,228
35,463 46,278
732,340 805,922
J 40 Pak Elektron Limited J 41Annual Report 2018

35.1
21.5
22
26 & 27
848,453
15,556,700
799,473
422,952
27,930
339,186
68,323
30,060
35,855
772,241
10,203
2,522
23,742
151,605
13,282
1,897,901
19,102,527
(758,928)
18,343,599
1,033,340
15,491,808
712,515
482,115
25,623
361,245
61,254
30,028
29,225
805,694
12,050
8,868
27,540
153,582
12,143
2,009,367
19,247,030
(848,453)
18,398,577
35.2
Cost of goods manufactured
Work-in-process at beginning of the year
Raw material and components consumed
Direct wages
Factory overheads:
- salaries, wages and benets
- traveling and conveyance
- electricity, gas and water
- repairs and maintenance
- vehicles running and maintenance
- insurance
- depreciation
- amortization of intangible assets
- provision for obsolete and slow moving stock
- carriage and freight
- erection and testing
- other factory overheads
Work-in-process at end of the year
These include charge in respect of employees retirement benets amounting to Rs. 39.401 million (2017: Rs. 32.37 million).
32
Standard Chartered Bank (Pakistan) Limited
915,070 (2017: 915,070) ordinary shares of Rs. 10 each
Market value: Rs. 24.12 (2017: Rs. 23.85) per share
As at beginning of the year
Changes in fair value
As at end of the year
ADVANCE INCOME TAX/INCOME TAX REFUNDABLE
Advance income tax/income tax refundable
Provision for taxation
Note 2018 2017
Rupees '000 Rupees '000
21,824
23,106
36 & 39 247
(1,282)
22,071
21,824
3,132,528
2,263,669
41 -
-
3,132,528 2,263,669
31 SHORT TERM INVESTMENTS
These represent investments in listed equity securities classied as 'nancial assets at fair value through prot or loss'. The details are as follows:
33
34
46
35
35.1
CASH AND BANK BALANCES
Cash in hand
Cash at banks
NET REVENUE
Contract revenue
Sale of goods
- local
- exports
Sales tax and excise duty
COST OF SALES
Finished goods at the beginning of the year
Cost of goods manufactured
Finished goods at the end of the year
Cost of goods sold
Contract cost 46
8,102
349,808
357,910
2,899,882
23,394,059 888,957
27,182,898 (3,710,466)
23,472,432
360,059
18,343,599
(417,843)
18,285,815
2,433,581
20,719,396
12,012 389,812
401,824
2,841,124
26,095,060
1,292,919
30,229,103
(4,062,791)
26,166,312
1,742,903
18,398,577
(360,059)
19,781,421
2,410,694
22,192,115
Note 2018 2017
Rupees '000 Rupees '000
36
37
OTHER INCOME
Gain on nancial instruments
Changes in fair value of short term investments
Gain on disposal of property, plant and equipment
Gain on sale and lease back activities
Other income
Amortization of grant-in-aid
Others
DISTRIBUTION COST
Salaries and benets
Traveling and conveyance
Rent, rates and taxes
Electricity, gas, fuel and water
Repairs and maintenance
Vehicles running and maintenance
Printing and stationery
Postage, telegrams and telephones
Entertainment and staff welfare
Advertisement and sales promotion
Insurance
Freight and forwarding
Contract and tendering
Warranty period services
Others
Note 2018 2017
Rupees '000 Rupees '000
31 247
-
2,267
3,718
-
2,832
2,514
6,550
16 1,936
2,038
12,934 9,205
14,870 11,243
17,384 17,793
37.1 151,963 137,132 59,254 61,035 9,812 9,710 3,162 3,236 1,302 1,510
18,228 18,792 3,368 3,256 4,469 4,158
11,763 10,731 191,524 258,034
7,524 7,003
121,588 132,209
1,355 6,610
111,565 106,228
35,463 46,278
732,340 805,922
J 40 Pak Elektron Limited J 41Annual Report 2018

42 EARNINGS PER SHARE - BASIC AND DILUTED
Earnings
Prot after taxation
Preference dividend for the year
Prot attributable to ordinary shareholders
Shares
Weighted average number of ordinary shares outstanding during the year
Earnings per share
Basic and diluted
Unit 2018 2017
Rupees '000 528,345
1,393,163 Rupees '000 (42,710) (42,710)
Rupees '000 485,635 1,350,453
No. of shares 497,681,485 497,681,485
Rupees 0.98 2.71
38 ADMINISTRATIVE AND GENERAL EXPENSES
Salaries and benets
Traveling and conveyance
Rent, rates and taxes
Ujrah payments
Legal and professional
Electricity, gas and water
Auditor's remuneration
Repairs and maintenance
Vehicles running and maintenance
Printing, stationery and periodicals
Postage, telegrams and telephones
Entertainment and staff welfare
Advertisement
Insurance
Provision for doubtful debts, advances and security deposits
Depreciation
Others
38.1 These include charge in respect of employees retirement benets amounting to Rs. 13.848 million (2017: Rs. 14.032 million).
Note 2018 2017
Rupees '000 Rupees '000
38.1 203,176 176,258
14,318 12,318
30,020 27,243
21,620 31,591
56,932 60,952
27,215 23,587
38.2 4,827 4,557
10,562 9,275
14,782
13,218
3,150
2,803
7,553
6,615
10,012
8,692
8,168
12,152
8,882
6,786
10,330
132,382
21.5 68,660
64,182
24,351
21,831
524,558 614,442
37.1 These include charge in respect of employees retirement benets amounting to Rs. 6.145 million (2017: Rs. 5.659 million).
38.2
39
Auditor's remuneration
Annual statutory audit
Limited scope review
Review report under Code of Corporate Governance
Out of pocket expenses
OTHER EXPENSES
Loss on nancial instruments
Loss due to changes in fair value of short term investments
Loss on sale and lease back activities
Impairment of long term investments
Others
Workers' Prot Participation Fund
Workers' Welfare Fund
Others
Note 2018 2017
Rupees '000 Rupees '000
3,300
3,300
800
600
500
430
227 227
4,827 4,557
31 - 1,282 4,721 - 1,863 17,493
6,584 18,775
17.2 26,772 81,504 17.3 10,173 30,972
- 7,372
36,945 119,848
43,529 138,623
Note 2018 2017
Rupees '000 Rupees '000
40
41
32 & 41.1 -
-
-
-
-
-
(22,893) 118,792
FINANCE COST
Interest/markup/prot on borrowings:
redeemable capital
long term nances
liabilities against assets subject to nance lease
short term borrowings
Interest on Workers' Prot Participation Fund
Bank charges and commission
TAXATION
Provision for taxation
for current year
for prior years
Deferred taxation
adjustment attributable to origination and reversal of temporary differences
adjustment attributable to changes in tax rates 15.1 (11,906)
-
(34,799)
118,792
(34,799)
118,792
19,655 288,312
443,864 296,851
6,362 10,922
209,057 20,206
678,938 616,291
17.2 4,940 5,655
292,569 299,102
976,447 921,048
41.1 The Company is taxable under section 59AA of the Income Tax Ordinance, 2001 along with its subsidiary as a single unit. The provision for the year has been allocated to the Company on proportionate basis. No provision for taxation is charged due to available tax credits. There is no relationship between aggregate tax expense and accounting prot. Accordingly no numerical reconciliation has been presented.
41.2 Assessments upto tax year 2017 have been nalized under the relevant provisions of the Ordinance.
42.1 As per the opinion of the Company's legal counsel, the provision for dividend at 9.5% per annum, under the original terms of issue of preference shares, will prevail on account of preference dividend.
42.2 There is no diluting effect on the basic earnings per share of the Company as the conversion rights pertaining to outstanding preference shares, under the original terms of issue, are no longer exercisable.
42.3 The effect of issue of ordinary and preference shares on conversion of redeemable capital, as referred to in note 12, has not been considered for the purpose of calculation of earnings per share as the said issue is subject to various legal and regulatory approvals which are pending as at the reporting date.
J 42 Pak Elektron Limited J 43Annual Report 2018

43
44
CASH GENERATED FROM OPERATIONS
Prot before taxation
Adjustments for non-cash and other items
Interest/markup on borrowings
Gain on disposal of property, plant and equipment
Amortization of grant-in-aid
Amortization of intangible assets
Gain on sale and lease back activities
Impairment of long term investments
Changes in fair value of nancial assets at fair value through prot or loss
Impairment allowance for doubtful debts, advances and security deposits
Provision for obsolete and slow moving stock
Loss on sale and lease back activities
Depreciation
Changes in working capital
Stores, spares and loose tools
Stock in trade
Trade debts
Due against construction work in progress
Advances
Trade deposits and short term prepayments
Other receivables
Trade and other payables
Cash generated from operations
CASH AND CASH EQUIVALENTS
Cash and bank balances
Note 2018 2017
Rupees '000 Rupees '000
493,546 1,511,955
678,938 616,291
(2,267) (3,718)
(1,936) (2,038)
10,203 12,050
- (2,832)
1,863 17,493
(247) 1,282
10,330 132,382
2,522 8,868
4,721 -
840,901 869,876
1,545,028 1,649,654
2,038,574 3,161,609
(112,737) 66,507
(1,987,854) 1,295,803
604,247
(1,774,707)
(142,550)
(265,189)
(139,398)
128,665
4,053
149,642
(49,872)
169,154
(51,332)
85,374
(1,875,443) (144,751)
163,131 3,016,858
33 357,910
401,824
357,910 401,824
45 TRANSACTIONS AND BALANCES WITH RELATED PARTIES
Related parties from the Company's perspective comprise subsidiary, associated companies, key management personnel and post employment benet plan. Key management personnel are those persons having authority and responsibility for planning, directing and controlling the activities of the Company, directly or indirectly, and includes the Chief Executive and Directors of the Company. The details of Company's related parties, with whom the Company had transactions during the year or has balances outstanding as at the reporting date are as follows:
Name of related party Nature of relationship Basis of relationship
Pak Elektron Limited
Employees Provident Fund Trust Provident Fund Trust Contribution to providend fund N/A
PEL Marketing (Private) Limited Subsidiary Investment N/A
Kohinoor Power Company Limited Associated company Investment N/A
N/A
Mr. M. Murad Saigol
Red Communication Arts (Private) Limited
Key management personnel
Associated undertaking
Chief executive
Common directorship
0.0025%
Mr. M. Zeid Yousuf Saigol Key management personnel Director 2.9637%
Mr. Syed Manzar Hassan Key management personnel Director 0.0004%
Aggregate
%age of
shareholding
in the
Note 2018 2017
Rupees '000 Rupees '000
45.1
59,394 62,720
14,159,484 14,008,319
1,379,621 1,300,446
50,304 136,462
51 50,125 46,941
51 1,600 1,600
295,933 813,143
45.2
11,247 13,423
Transactions with related parties
Nature of relationship Nature of transactions
Provident Fund Trust Contribution for the year
Subsidiary Sale of goods
Allocation of common expenses
Associated companies and undertakings Purchase of services
Key management personnel Short term employee benets
Post employment benets
Directors and sponsors Dividend paid
Balances with related parties
Nature of relationship Nature of balances
Provident Fund Trust Contribution payable
Key management personnel Short term employee benets payable 2,805 2,897
46
34 2,899,882
2,841,124
7,402,753 4,969,171
35 2,433,581
2,410,694
1,340,197 2,095,361
17 11,852
9,615
27.1 617,648
855,500
3,972,791
3,279,668
43,031
151,688
LONG TERM CONSTRUCTION CONTRACTS
Contract revenue for the year
Cost incurred to date
Contract costs for the year
Gross prot realized to date
Advances against contracts
Retention money receivable
Gross amount due from customers
Gross amount due to customers
Estimated future costs to complete projects in progress 1,358,721 2,340,622
Transactions with key management personnel are limited to payment of short term and post employment benets, advances against issue of ordinary shares and dividend payments. Transactions with post employment benets plan are limited to employers' contribution made. The Company in the normal course of business carries out various transactions with its subsidiary and associated companies and continues to have a policy whereby all such transactions are carried out on commercial terms and conditions which are equivalent to those prevailing in an arm's length transaction.
Details of transactions and balances with related parties are as follows:
J 44 Pak Elektron Limited J 45Annual Report 2018
Company
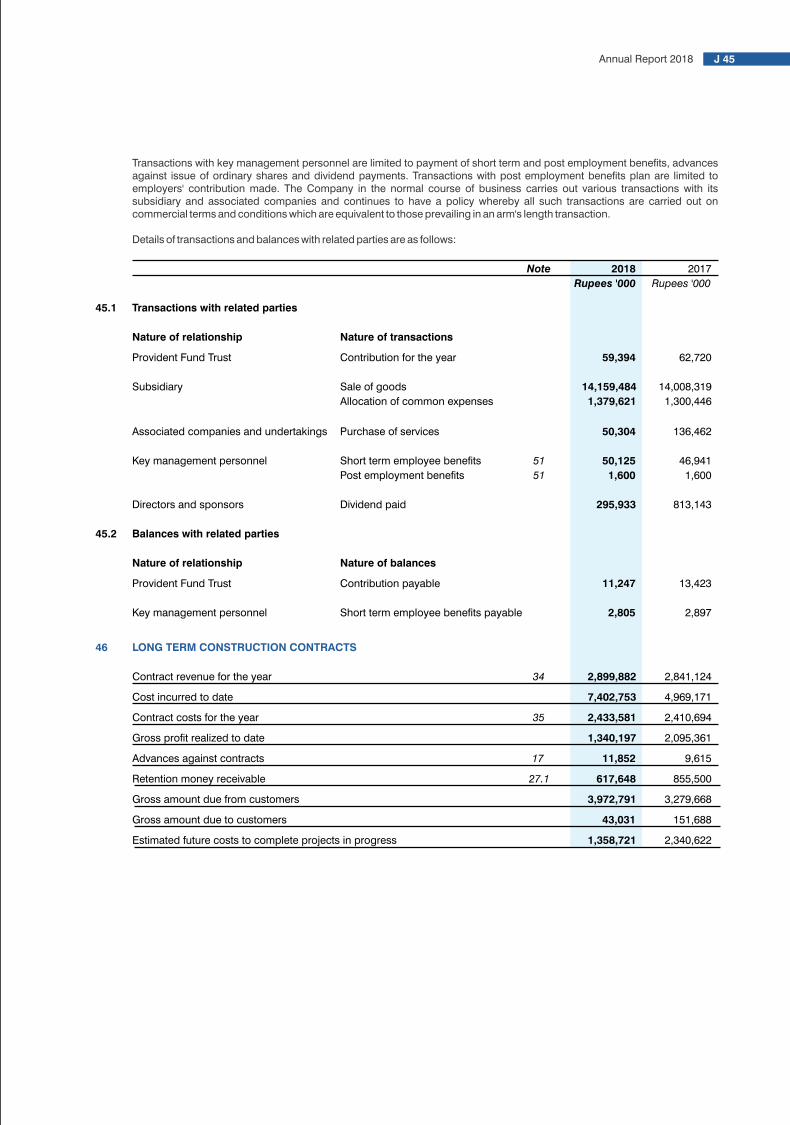
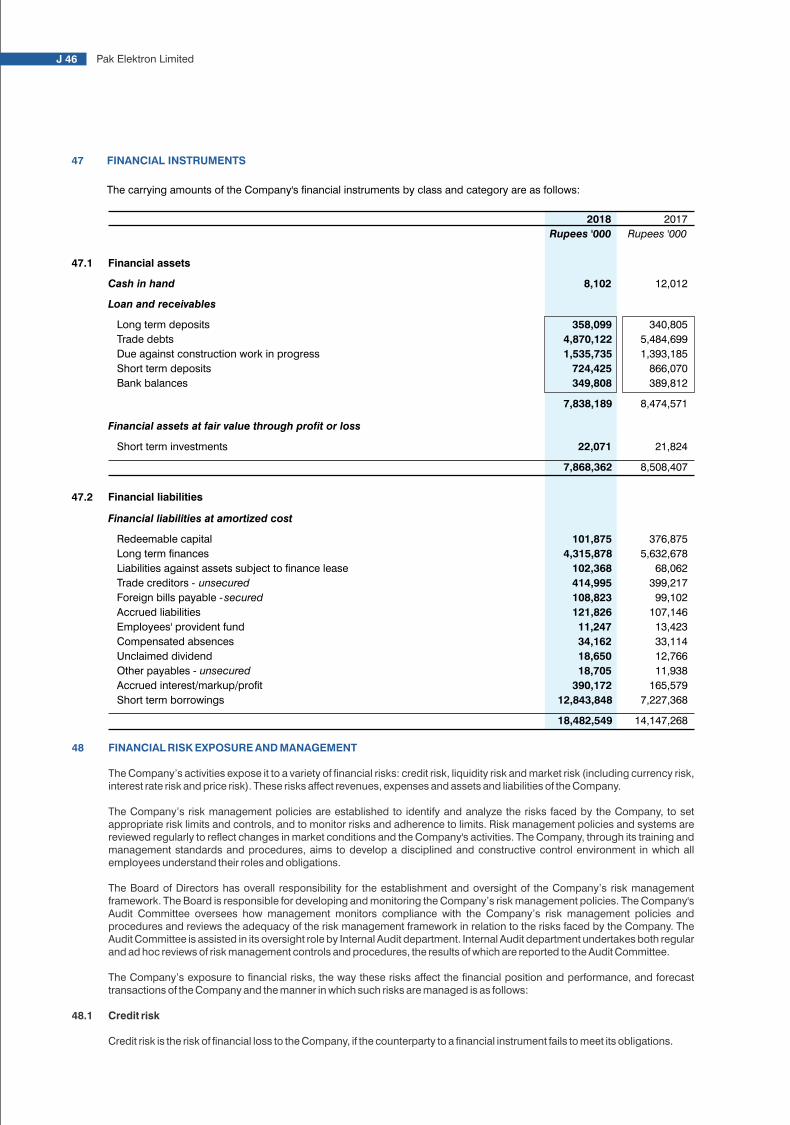
47 FINANCIAL INSTRUMENTS
The carrying amounts of the Company's nancial instruments by class and category are as follows:
47.1
47.2
Financial assets
Cash in hand
Loan and receivables
Long term deposits
Trade debts
Due against construction work in progress
Short term deposits
Bank balances
Financial assets at fair value through prot or loss
Short term investments
Financial liabilities
Financial liabilities at amortized cost
Redeemable capital
Long term nances
Liabilities against assets subject to nance lease
Trade creditors - unsecured
Foreign bills payable - secured
Accrued liabilities
Employees' provident fund
Compensated absences
Unclaimed dividend
Other payables - unsecured
Accrued interest/markup/prot
Short term borrowings
2018 2017
Rupees '000 Rupees '000
8,102 12,012
358,099 340,805 4,870,122 5,484,699 1,535,735 1,393,185
724,425 866,070
349,808 389,812
7,838,189 8,474,571
22,071 21,824
7,868,362 8,508,407
101,875 376,875
4,315,878 5,632,678
102,368 68,062
414,995 399,217
108,823 99,102
121,826 107,146
11,247 13,423
34,162 33,114
18,650 12,766
18,705 11,938
390,172 165,579
12,843,848 7,227,368
18,482,549 14,147,268
48 FINANCIAL RISK EXPOSURE AND MANAGEMENT
The Company’s activities expose it to a variety of nancial risks: credit risk, liquidity risk and market risk (including currency risk, interest rate risk and price risk). These risks affect revenues, expenses and assets and liabilities of the Company.
The Company’s risk management policies are established to identify and analyze the risks faced by the Company, to set appropriate risk limits and controls, and to monitor risks and adherence to limits. Risk management policies and systems are reviewed regularly to reect changes in market conditions and the Company's activities. The Company, through its training and management standards and procedures, aims to develop a disciplined and constructive control environment in which all employees understand their roles and obligations.
The Board of Directors has overall responsibility for the establishment and oversight of the Company’s risk management framework. The Board is responsible for developing and monitoring the Company’s risk management policies. The Company's Audit Committee oversees how management monitors compliance with the Company’s risk management policies and procedures and reviews the adequacy of the risk management framework in relation to the risks faced by the Company. The Audit Committee is assisted in its oversight role by Internal Audit department. Internal Audit department undertakes both regular and ad hoc reviews of risk management controls and procedures, the results of which are reported to the Audit Committee.
The Company’s exposure to nancial risks, the way these risks affect the nancial position and performance, and forecast transactions of the Company and the manner in which such risks are managed is as follows:
48.1 Credit risk
Credit risk is the risk of nancial loss to the Company, if the counterparty to a nancial instrument fails to meet its obligations.
48.1.1 Maximum exposure to credit risk
The gross carrying amount of nancial assets, other than cash in hand, represents maximum exposure to credit risk. The maximum exposure to credit risk as at the reporting date is as follows:
Loan and receivables
Long term deposits
Trade debts
Due against construction work in progress
Short term deposits
Cash at banks
Financial assets at fair value through prot or loss
Short term investments
Customers
Banking companies and nancial institutions
Others
Not yet due and past due by 1 year
1 to 2 years
2 to 3 years
More than 3 years
Note 2018 2017
Rupees '000 Rupees '000
24 358,099 340,805
27 5,457,423 6,061,670
28 1,535,735
1,393,185
30 735,183 876,828
33 349,808 389,812
8,436,248 9,062,300
31 22,071 21,824
8,458,319 9,084,124
2018 2017
Rupees '000 Rupees '000
7,308,906 7,753,309
1,107,062 1,288,464
42,351 42,351
8,458,319 9,084,124
48.1.2 Concentration of credit risk
There is no concentration of credit risk geographically. Maximum exposure to credit risk by type of counterparty is as follows:
48.1.3 Credit quality and impairment
The manner in which the company assesses the credit quality of its nancial assets depends on the type of counter-party. The Company conducts different types of transactions with the following counter-parties.
(a) Customers
Customers are counter parties to trade debts, long term security deposits for contracts in progress, due against contract work in progress and retention money for contracts in progress.
These, with the exception of trade debts, do not carry any signicant credit risk. The ageing analysis of trade debts as at the reporting date is as follows:
Gross Accumulated
carrying amount Impairment
Rupees '000 Rupees '000
5,014,835 -
431,246 -
317,328 278,710
298,261 298,261
6,061,670
576,971
2018 2017
Gross Accumulated
carrying amount Impairment
Rupees '000 Rupees '000
4,401,729 -
431,246 -
317,664 280,517
306,784 306,784
5,457,423
587,301
The Company's three (2017: two) signicant customers accounts for Rs. 930.603 million (2017: Rs. 647.89 million ) of trade debts as at the reporting date, apart from this, exposure to any single customer does not exceed 5% (2017: 5%) of trade debts. These signicant customers have long standing business relationships with the Company and have a good payment record and accordingly non-performance by these customers is not expected.
J 46 Pak Elektron Limited J 47Annual Report 2018
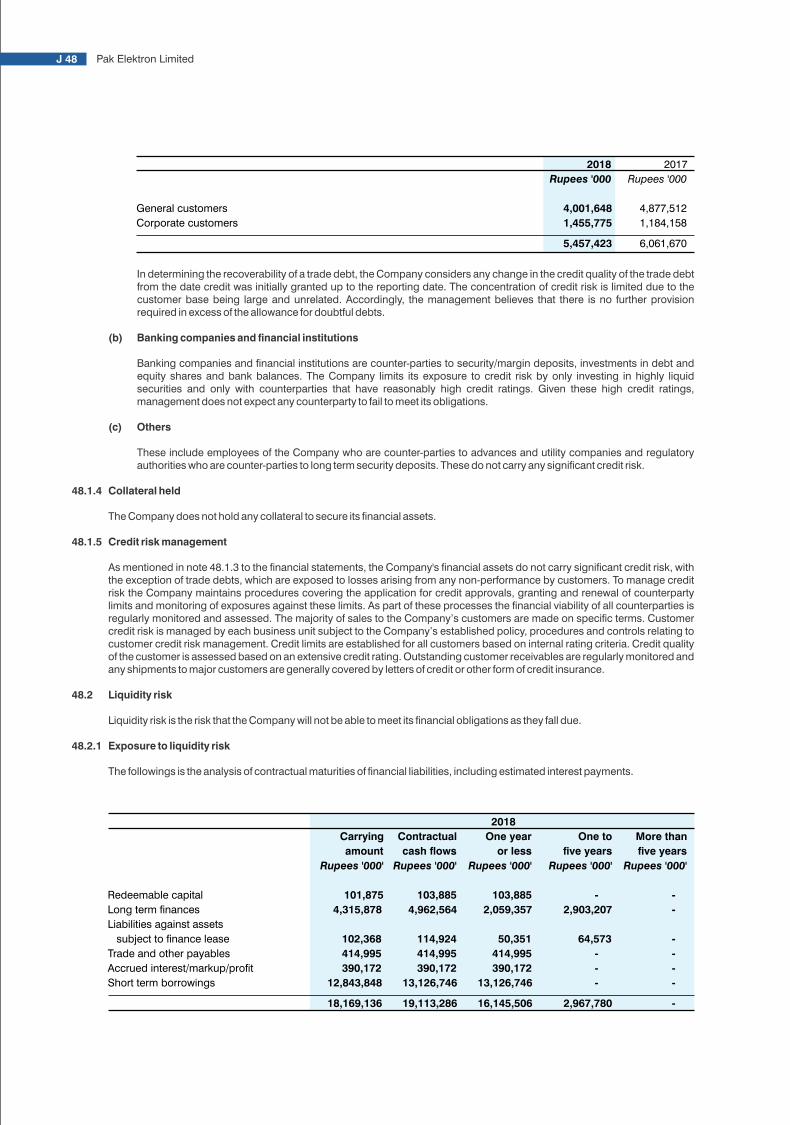
2018 2017
Rupees '000 Rupees '000
General customers 4,001,648 4,877,512
Corporate customers 1,455,775 1,184,158
5,457,423 6,061,670
In determining the recoverability of a trade debt, the Company considers any change in the credit quality of the trade debt from the date credit was initially granted up to the reporting date. The concentration of credit risk is limited due to the customer base being large and unrelated. Accordingly, the management believes that there is no further provision required in excess of the allowance for doubtful debts.
(b) Banking companies and nancial institutions
Banking companies and nancial institutions are counter-parties to security/margin deposits, investments in debt and equity shares and bank balances. The Company limits its exposure to credit risk by only investing in highly liquid securities and only with counterparties that have reasonably high credit ratings. Given these high credit ratings, management does not expect any counterparty to fail to meet its obligations.
(c) Others
These include employees of the Company who are counter-parties to advances and utility companies and regulatory authorities who are counter-parties to long term security deposits. These do not carry any signicant credit risk.
48.1.4 Collateral held
The Company does not hold any collateral to secure its nancial assets.
48.1.5 Credit risk management
As mentioned in note 48.1.3 to the nancial statements, the Company's nancial assets do not carry signicant credit risk, with the exception of trade debts, which are exposed to losses arising from any non-performance by customers. To manage credit risk the Company maintains procedures covering the application for credit approvals, granting and renewal of counterparty limits and monitoring of exposures against these limits. As part of these processes the nancial viability of all counterparties is regularly monitored and assessed. The majority of sales to the Company’s customers are made on specic terms. Customer credit risk is managed by each business unit subject to the Company’s established policy, procedures and controls relating to customer credit risk management. Credit limits are established for all customers based on internal rating criteria. Credit quality of the customer is assessed based on an extensive credit rating. Outstanding customer receivables are regularly monitored and any shipments to major customers are generally covered by letters of credit or other form of credit insurance.
48.2 Liquidity risk
Liquidity risk is the risk that the Company will not be able to meet its nancial obligations as they fall due.
48.2.1 Exposure to liquidity risk
The followings is the analysis of contractual maturities of nancial liabilities, including estimated interest payments.
Redeemable capital
Long term nances
Liabilities against assets
subject to nance lease
Trade and other payables
Accrued interest/markup/prot
Short term borrowings
Carrying Contractual One year One to More than
amount cash ows or less ve years ve years
Rupees '000' Rupees '000' Rupees '000' Rupees '000' Rupees '000'
101,875 103,885
103,885
-
- 4,315,878
4,962,564
2,059,357
2,903,207
-
102,368
114,924
50,351
64,573
- 414,995
414,995
414,995
-
-
390,172
390,172
390,172
-
-
12,843,848 13,126,746 13,126,746 - -
18,169,136 19,113,286 16,145,506 2,967,780 -
2018
2018 2017
Rupees '000 Rupees '000
- -
(92,204)
(80,601)
(16,619)
-
-
(18,501)
(108,823)
(99,102)
(108,823) (99,102)
(17,235) (12,895)
(28,496)
(70)
(156,714)
(305,925)
(1,059)
-
(1,809,135)
(1,607,712)
(2,012,639)
(1,926,602)
Financial assets
Financial liabilities
Foreign bills payable
USD
CNY
EUR
Net balance sheet exposure
Foreign currency commitments
CHF
CNY
EUR
GBP
USD
Net exposure (2,121,462) (2,025,704)
Carrying Contractual One year One to More than
amount cash ows or less ve years ve years
Rupees '000' Rupees '000' Rupees '000' Rupees '000' Rupees '000'
376,875 398,082
70,106 327,976 -
5,632,678 6,433,662 4,391,407 2,042,255 -
68,062 73,389 49,686 23,703 - 399,217 399,217 399,217 - - 165,579 165,579 165,579 - -
Redeemable capital
Long term nances
Liabilities against assets
subject to nance lease
Trade and other payables
Accrued interest/markup/prot
Short term borrowings 7,227,368 7,303,482 7,303,482 - -
13,869,779 14,773,411 12,379,477 2,393,934 -
2017
48.2.2 Liquidity risk management
The responsibility for liquidity risk management rests with the Board of Directors, who has built an appropriate liquidity risk management framework for the management of the Company’s short, medium and long-term funding and liquidity management requirements. The Company manages liquidity risk by maintaining adequate reserves, banking facilities and reserve borrowing facilities, by continuously monitoring forecast and actual cash ows and matching the maturity proles of nancial assets and liabilities. As referred to in note 18.4 the Company has additional undrawn facilities of Rs. 12,014 million (2017: Rs. 10,727 million) at its disposal to further reduce liquidity risk.
48.3 Market risk
48.3.1 Currency risk
Currency risk is the risk that fair values or future cash ows of a nancial instrument will uctuate because of changes in foreign exchange rates. Currency risk arises from transactions and resulting balances that are denominated in a currency other than functional currency.
(a) Exposure to currency risk
The Company's exposure to currency risk as at the reporting date is as follows:
J 48 Pak Elektron Limited J 49Annual Report 2018

2018 2017
Rupees '000 Rupees '000
General customers 4,001,648 4,877,512
Corporate customers 1,455,775 1,184,158
5,457,423 6,061,670
In determining the recoverability of a trade debt, the Company considers any change in the credit quality of the trade debt from the date credit was initially granted up to the reporting date. The concentration of credit risk is limited due to the customer base being large and unrelated. Accordingly, the management believes that there is no further provision required in excess of the allowance for doubtful debts.
(b) Banking companies and nancial institutions
Banking companies and nancial institutions are counter-parties to security/margin deposits, investments in debt and equity shares and bank balances. The Company limits its exposure to credit risk by only investing in highly liquid securities and only with counterparties that have reasonably high credit ratings. Given these high credit ratings, management does not expect any counterparty to fail to meet its obligations.
(c) Others
These include employees of the Company who are counter-parties to advances and utility companies and regulatory authorities who are counter-parties to long term security deposits. These do not carry any signicant credit risk.
48.1.4 Collateral held
The Company does not hold any collateral to secure its nancial assets.
48.1.5 Credit risk management
As mentioned in note 48.1.3 to the nancial statements, the Company's nancial assets do not carry signicant credit risk, with the exception of trade debts, which are exposed to losses arising from any non-performance by customers. To manage credit risk the Company maintains procedures covering the application for credit approvals, granting and renewal of counterparty limits and monitoring of exposures against these limits. As part of these processes the nancial viability of all counterparties is regularly monitored and assessed. The majority of sales to the Company’s customers are made on specic terms. Customer credit risk is managed by each business unit subject to the Company’s established policy, procedures and controls relating to customer credit risk management. Credit limits are established for all customers based on internal rating criteria. Credit quality of the customer is assessed based on an extensive credit rating. Outstanding customer receivables are regularly monitored and any shipments to major customers are generally covered by letters of credit or other form of credit insurance.
48.2 Liquidity risk
Liquidity risk is the risk that the Company will not be able to meet its nancial obligations as they fall due.
48.2.1 Exposure to liquidity risk
The followings is the analysis of contractual maturities of nancial liabilities, including estimated interest payments.
Redeemable capital
Long term nances
Liabilities against assets
subject to nance lease
Trade and other payables
Accrued interest/markup/prot
Short term borrowings
Carrying Contractual One year One to More than
amount cash ows or less ve years ve years
Rupees '000' Rupees '000' Rupees '000' Rupees '000' Rupees '000'
101,875 103,885
103,885
-
- 4,315,878
4,962,564
2,059,357
2,903,207
-
102,368
114,924
50,351
64,573
- 414,995
414,995
414,995
-
-
390,172
390,172
390,172
-
-
12,843,848 13,126,746 13,126,746 - -
18,169,136 19,113,286 16,145,506 2,967,780 -
2018
2018 2017
Rupees '000 Rupees '000
- -
(92,204)
(80,601)
(16,619)
-
-
(18,501)
(108,823)
(99,102)
(108,823) (99,102)
(17,235) (12,895)
(28,496)
(70)
(156,714)
(305,925)
(1,059)
-
(1,809,135)
(1,607,712)
(2,012,639)
(1,926,602)
Financial assets
Financial liabilities
Foreign bills payable
USD
CNY
EUR
Net balance sheet exposure
Foreign currency commitments
CHF
CNY
EUR
GBP
USD
Net exposure (2,121,462) (2,025,704)
Carrying Contractual One year One to More than
amount cash ows or less ve years ve years
Rupees '000' Rupees '000' Rupees '000' Rupees '000' Rupees '000'
376,875 398,082
70,106 327,976 -
5,632,678 6,433,662 4,391,407 2,042,255 -
68,062 73,389 49,686 23,703 - 399,217 399,217 399,217 - - 165,579 165,579 165,579 - -
Redeemable capital
Long term nances
Liabilities against assets
subject to nance lease
Trade and other payables
Accrued interest/markup/prot
Short term borrowings 7,227,368 7,303,482 7,303,482 - -
13,869,779 14,773,411 12,379,477 2,393,934 -
2017
48.2.2 Liquidity risk management
The responsibility for liquidity risk management rests with the Board of Directors, who has built an appropriate liquidity risk management framework for the management of the Company’s short, medium and long-term funding and liquidity management requirements. The Company manages liquidity risk by maintaining adequate reserves, banking facilities and reserve borrowing facilities, by continuously monitoring forecast and actual cash ows and matching the maturity proles of nancial assets and liabilities. As referred to in note 18.4 the Company has additional undrawn facilities of Rs. 12,014 million (2017: Rs. 10,727 million) at its disposal to further reduce liquidity risk.
48.3 Market risk
48.3.1 Currency risk
Currency risk is the risk that fair values or future cash ows of a nancial instrument will uctuate because of changes in foreign exchange rates. Currency risk arises from transactions and resulting balances that are denominated in a currency other than functional currency.
(a) Exposure to currency risk
The Company's exposure to currency risk as at the reporting date is as follows:
J 48 Pak Elektron Limited J 49Annual Report 2018

(b) Exchange rates applied as at the reporting date
Assets Liabilities
Rupees '000 Rupees '000
GBP -
176.5100
EUR -
159.1000
USD -
139.1000
CHF -
141.2700
CNY -
20.2100
The following spot exchange rates were applied as at the reporting date.
2018
Assets Liabilities
Rupees '000 Rupees '000
-
-
-
131.7900
-
110.5000
-
112.9000
-
17.3300
2017
(c) Sensitivity analysis
A ve percent appreciation in Pak Rupee against foreign currencies would have increased prot and equity for the year by Rs. 5.44 million (2017: Rs. 4.96 million). A ve percent depreciation in Pak Rupee would have had an equal but opposite effect on prot for the year. The analysis assumes that all other variables, in particular interest rates, remain constant and ignores the impact, if any, on provision for taxation for the year.
(d) Currency risk management
The Company manages its exposure to currency risk through continuous monitoring of expected/forecast committed and non-committed foreign currency payments and receipts. Reports on forecast foreign currency transactions, receipts and payments are prepared on monthly basis, exposure to currency risk is measured and appropriate steps are taken to ensure that such exposure is minimized while optimizing return. This includes matching of foreign currency liabilities/payments to assets/receipts and using source inputs in foreign currency.
48.3.2 Interest rate risk
Interest rate risk is the risk that fair values or future cash ows of a nancial instrument will uctuate because of changes in interest rates.
(a) Interest/markup/prot bearing nancial instruments
The effective interest/markup rates for interest/markup/prot bearing nancial instruments are mentioned in relevant notes to the nancial statements. The Company's interest/markup/prot bearing nancial instruments as at the reporting date are as follows:
2018 2017
Rupees '000 Rupees '000
Fixed rate instruments - -
Variable rate instruments
Financial liabilities 16,777,372 13,236,211
(b) Fair value sensitivity analysis for xed rate instruments
The Company does not have any xed rate nancial instruments.
(c) Cash ow sensitivity analysis for variable rate instruments
An increase of 100 basis points in interest rates as at the reporting date would have decreased prot for the year by Rs. 167.774 million (2017: Rs. 132.362 million). A decrease of 100 basis points would have had an equal but opposite effect on prot for the year. The analysis assumes that all other variables, in particular foreign exchange rates, remain constant and ignores the impact, if any, on provision for taxation for the year.
(d) Interest rate risk management
The Company manages interest rate risk by analyzing its interest rate exposure on a dynamic basis. Cash ow interest rate risk is managed by simulating various scenarios taking into consideration renancing, renewal of existing positions and alternative nancing. Based on these scenarios, the Company calculates impact on prot after taxation and equity of dened interest rate shift, mostly 100 basis points.
48.3.3 Price risk
Price risk represents the risk that the fair value or future cash ows of nancial instrument will uctuate because of changes in market prices, other than those arising from interest rate risk or currency risk, whether those changes are caused by factors specic to the individual nancial instrument or its issuer, or factors affecting all similar nancial instruments. The Company is exposed to price risk in respect of its investments in equity securities. However, the risk is minimal as these investments are held for strategic purposes rather than trading purposes. The Company does not actively trade in these investments.
49 FAIR VALUE MEASUREMENTS
The Company measures some of its assets at fair value at the end of each reporting period. Fair value measurements are classied using a fair value hierarchy that reects the signicance of the inputs used in making the measurements and has the following levels.
Level 1 Quoted prices (unadjusted) in active markets for identical assets or liabilities.
Level 2 Inputs other than quoted prices included within Level 1 that are observable for the asset or liability, either directly (that is, as prices) or indirectly (that is, derived from prices).
Level 3 Inputs for the asset or liability that are not based on observable market data (that is, unobservable inputs).
The fair value hierarchy of nancial instruments measured at fair value and the information about how the fair values of these nancial instruments are determined are as follows:
49.1
49.1.1
Hierarchy 2018 2017
Rupees '000 Rupees '000
Level 1 22,071 21,824
Valuation techniques and key inputs
Quoted bid prices in an active market
Financial instruments
Financial assets at fair value
through prot or loss
Investments in quoted
equity securities
Recurring fair value measurements
Financial instruments measured at fair value
Level 1 Level 2 Level 3 2018 2017
Rupees '000 Rupees '000
Freehold land - 1,022,000 - 1,022,000 539,232
Buildings - 3,444,504 - 3,444,504 2,883,880
Plant and machinery - 13,797,790 - 13,797,790 12,234,678
49.1.2 Non-recurring fair value measurements
There are no non-recurring fair value measurements as at the reporting date.
49.2 Financial instruments not measured at fair value
The management considers the carrying amount of all nancial instruments not measured at fair value at the end of each reporting period to approximate their fair values as at the reporting date.
49.3 Assets and liabilities other than nancial instruments
49.3.1 Recurring fair value measurements
For recurring fair value measurements, the fair value hierarchy and information about how the fair values are determined is as follows:
J 50 Pak Elektron Limited J 51Annual Report 2018

Revenue
Finance cost
Depreciation and amortization
Segment prot before tax
Segment assets
2018 2017 2018 2017 2018 2017
Rupees '000' Rupees '000' Rupees '000' Rupees '000' Rupees '000' Rupees '000'
11,714,746
14,591,864
15,468,152
15,637,239
27,182,898
30,229,103
688,585
636,799
287,862
284,249
976,447
921,048
393,077
423,324
458,027
458,602
851,104
881,926
279,840
545,397 239,851 1,087,388 519,691 1,632,785
19,668,173
18,731,142
21,396,929
16,023,465
41,065,102
34,754,607
Power Division Appliances Division Total
For fair value measurements categorised into Level 2 and Level 3 the following information is relevant:
Freehold land
Buildings
Plant and machinery
Cost approach that reects
the cost to the market
participants to construct
assets of comparable utility
and age, adjusted for
obsolescence and
depreciation. There was no
change in valuation
technique during the year.
A 5% increase in estimated
purchase price, including
import duties and non-
refundable purchase taxes and
other directly attributable costs
would result in a signicant
increase in fair value of plant
and machinery by Rs. 689.890
million (2017: Rs. 611.734
Estimated purchase price,
including import duties and
non-refundable purchase
taxes and other costs directly
attributable to the acquisition
or construction, erection and
installation.
Cost approach that reects
the cost to the market
participants to acquire assets
of comparable utility and
age, adjusted for
obsolescence and
depreciation. There was no
change in valuation
technique during the year.
Valuation technique
A 5% increase in estimated
purchase price, including non-
refundable purchase taxes and
other costs directly attributable
to the acquisition would result in
a signicant increase in fair
value of buildings by Rs. 51.1
million (2017: Rs. 26.962
million).
SensitivitySignicant inputs
A 5% increase in estimated
constructionand other ancillary
expenditure would result in a
signicant increase in fair value
of buildings by Rs. 172.225
million (2017: Rs. 144.194
million).
Estimated construction costs
and other ancillary
expenditure.
Estimated purchase price,
including non-refundable
purchase taxes and other
costs directly attributable to
the acquisition.
Market comparable
approach that reects recent
transaction prices for similar
properties
50 CAPITAL MANAGEMENT
The Company's objective when measuring capital is to safeguard the Company's ability to continue as going concern while providing returns for shareholders and benets for other stakeholders and to maintain an optimal capital structure through debt and equity balance. The Company manages its capital structure and makes adjustments to it in light of changes in economic conditions. In order to maintain or adjust the capital structure, the Company may adjust the amount of dividends paid to shareholders or issue of new shares. Consistent with others in industry, the Company monitors capital on the basis of gearing ratio which is debt divided by total capital employed. Debt comprises long term nances, redeemable capital and liabilities against assets subject to nances lease, including current maturity. Total capital employed includes total equity plus debt. During the period, the Company's strategy was to maintain the gearing ratio below 30% and 'A' credit rating. The gearing ratios as at the reporting date are as follows:
Unit 2018 2017
Rupees '000' 4,520,121
6,077,615 Rupees '000' 23,169,419 20,733,438
Rupees '000' 27,689,540 26,811,053
Total debt
Total equity
Total capital employed
Gearing ratio % age 16.32 22.67
2018 2017 2018 2017 2018 2017
Rupees '000' Rupees '000' Rupees '000' Rupees '000' Rupees '000' Rupees '000'
Remuneration 12,046 12,046 28,042 156,009 House rent 1,205 1,205 1,844 33,930 Utilities 1,205 1,205 1,205 15,601 Bonus - - - 7,481 Post employment benets - - 1,600 14,889 Meeting fee - - 345 -
Reimbursable expenses
Motor vehicles expenses - - - 15,501 Medical expenses - - 224 6,008
14,456 14,456 33,260 249,419
Number of persons 1 1 2 73
Chief Executive Directors Executives
The Company is not subject to externally imposed capital requirements, except those related to maintenance of debt covenants, commonly imposed by the providers of debt nance.
51 REMUNERATION OF CHIEF EXECUTIVE, DIRECTORS AND EXECUTIVES
The aggregate amount charged to prot or loss in respect of chief executive, directors and executives on account of managerial remuneration, allowances and perquisites, post employment benets and the number of such directors and executives is as follows:
51.1 Chief executive, directors and executives have been provided with free use of the Company's vehicles.
51.2 No remuneration has been paid to non-executive directors
52 SEGMENT INFORMATION
An operating segment is a component of an entity:
(a) that engages in business activities from which it may earn revenues and incur expenses (including revenues and expenses relating to transactions with other components of the same entity),
(b) whose operating results are regularly reviewed by the entity’s chief operating decision maker to make decisions about resources to be allocated to the segment and assess its performance, and
(c) for which discrete nancial information is available.
Information about the Company's reportable segments as at the reporting date is as follows:
Segments Nature of business
Power Division Manufacturing and distribution of Transformers, Switch Gears, Energy Meters, Power Transformers and Engineering, Procurement and Construction Contracting.
Appliances Division Manufacturing, assembling and distribution of Refrigerators, Air conditioners, Deep Freezes, Microwave ovens, Washing Machines, Water Dispensers and other Home Appliances
J 52 Pak Elektron Limited J 53Annual Report 2018
28,042
1,844
1,205
-
1,600
225
-
286
33,202
2
180,547
37,458
17,459
20,325
8,218
-
16,898
7,471
288,376
79

55 NUMBER OF EMPLOYEES
2018 2017 2018 2017
Total number of employees 4,792
4,889
46
107
Average number of employees 4,994
4,029
113
767
56 RECLASSIFICATIONS
Particulars 2018 2017
Unclaimed dividend 18,650
12,766
Manufacturing facilities Area ofces
The following have been reclassied for compliance with Fourth Schedule to the Companies Act, 2017.
From
Trade and other payables
To
Statement of Financial Position
2018 2017
Rupees '000' 389,017 401,413 Rupees '000' 351,027 356,969
% age 90.23 88.93
Rupees '000' % age Rupees '000' % age
- - 148,830 41.69
118,131 33.65 105,890 29.66
Size of the fund - total assets
Fair value of investments
Percentage of investments made
The break-up of investments is as follows:
Listed equity collective investment schemes
Government securities
Deposit accounts with commercial banks 232,896 66.35 102,249 28.64
351,027 100.00 356,969 100.00
54
Actual Actual
Annual production Annual production
production during the production during the
Unit capacity year capacity year
MVA 7,000 2,397 7,000 3,239
Nos. 12,000 4,805 12,000 3,318
Nos. 1,700,000 826,007 1,700,000 1,045,231
Tonnes 200,000 103,220 200,000 139,396
Cfts. 6,950,000
5,075,992
6,950,000
5,608,735
Litres 2,500,000
1,945,097
2,500,000
2,072,617
Sets 200,000
24,190
-
-
Kgs 50,000
7,005
-
-
54.1
PLANT CAPACITY AND ACTUAL PRODUCTION
Transformers/Power Transformers
Switch gears
Energy meters
Air conditioners
Refrigerators/deep freezers
Microwave ovens
LED TVs
Washing machines
Under utilization of capacity is mainly attributable to consumer demand.
2018 2017
2018 2017
52.1
52.2
52.3
14,159,484 14,008,319
Reconciliation of segment prot
Total prot for reportable segments
Un-allocated other expenses
Prot before taxation
Reconciliation of segment assets
Total assets for reportable segments
Other corporate assets
Total assets
Information about major customers
Revenue derived from PEL Marketing (Private) Limited
Revenue derived from Multan Electric Power Company 2,650,670 -
2018 2017
Rupees '000' Rupees '000'
519,691
1,632,785 (26,145) (120,830)
493,546 1,511,955
41,065,102
34,754,607
3,161,684 2,294,441
44,226,786 37,049,048
53 EMPLOYEES PROVIDENT FUND TRUST
The following information is based on the un-audited nancial statements of the Pak Elektron Limited Employees Provident Fund Trust for the year ended December 31, 2018.
57 RECOVERABLE AMOUNTS AND IMPAIRMENT
As at the reporting date, recoverable amounts of all assets/cash generating units are equal to or exceed their carrying amounts, unless stated otherwise in these nancial statements.
58 GENERAL
58.1 Figures have been rounded off to the nearest thousands.
58.2 Comparative gures have been rearranged and reclassied, where necessary, for the purpose of comparison. However, there were no signicant reclassications during the year other than those referred to in note 56.
SYED MANZAR HASSANChief Financial Officer
M. MURAD SAIGOLChief Executive Officer
M. ZEID YOUSUF SAIGOLDirector
J 54 Pak Elektron Limited J 55Annual Report 2018

This page has been left blank intentionally

K Annual GeneralMeeting

Notice of Annual General Meeting
By Order of the Board
M. Omer FarooqCompany Secretary
Lahore:April 04, 2019
Notes:
1. Share Transfer Books of the Company will remain closed from April 20, 2019 to April 26, 2019 (both days inclusive). Physical transfers/CDS Transactions IDs received in order at Company registrar office M/s Corplink (Pvt.) Limited Wings Arcade, 1-K, Commercial Model Town, Lahore on or before April 19, 2019 will be treated in time.
2. A member entitled to attend and vote at this Meeting may appoint another Member as proxy. Proxies in order to be effective, must be received at17-Aziz Avenue, Canal Bank, Gulberg-V, Lahore the Registered Office of the Company not later than forty-eight hours before the time of the meeting and must be duly stamped, signed and witnessed.
3. Members whose shares are deposited with Central Depository System are requested to bring their original National Identity Cards or original Passports along with their Account Numbers in Central Depository System for attending the meeting.
4. Members are requested to notify the Company change in their addresses, if any.
5. Annual Audited Financial Statements of the Company for the Financial Year ended December 31, 2018 have been placed on the Company's website i.e. www.pel.com.pk.
6. SUBMISSION OF COPY OF CNIC/NTN DETAILS (MANDATORY)
Pursuant to the directives of the Securities and Exchange Commission of Pakistan CNIC number of individuals is mandatorily required to be mentioned on dividend warrants and pursuant to the provisions of Finance Act 2017, the rate of deduction of income tax under section 150 of the Income Tax Ordinance 2001 from dividend payment have been revised as : for filers of Income Tax return 15% and Non filers of Income Tax return 20%. In case of Joint account, each holder is to be treated individually as either a filer or non-filer and tax will be deducted on the basis of shareholding of each joint holder as may be notified by the shareholder, in writing as follows, to our Share Registrars, or if no notification, each joint holder shall be assumed to have an equal number of shares.
Company Name
Folio/CDSAccount No.
Total Shares Principal Shareholder Joint Shareholder
Name &CNIC No.
ShareholdingProportionNo. of Shares
Name &CNIC No.
ShareholdingproportionNo. of Shares
Notice is hereby given that the 63rd Annual General Meeting of Shareholders of Pak Elektron Limited will be held on Friday, April 26 , 2019 at 11:30 A.M. at Factory Premises, 14-KM. Ferozepur Road, Lahore to transact the following business:-
1. To confirm the minutes of Last Annual General Meeting held on April 25, 2018.
2. To receive and adopt the Annual Audited Accounts of the Company for the year ended December 31, 2018 together with Directors' and Auditors' Reports thereon.
3. To appoint Auditors to hold office till the conclusion of the next Annual General Meeting and to fix their remuneration.
4. Any other business with the permission of the Chair.
The CNIC number/NTN details is now mandatory and is required for checking the tax status as per the Active Taxpayers List (ATL) issued by Federal Board of Revenue (FBR) from time to time.
Individuals including all joint holders holding physical share certificates are therefore requested to submit a copy of their valid CNIC to the company or its Registrar if not already provided, For shareholders other than individuals, the checking will be done by matching the NTN number, therefore the Corporate shareholders having CDC accounts are requested in their own interest to provide a copy of NTN certificate to check their names in the ATL before the book closure date to their respective participants/CDC, whereas corporate shareholders holding physical share certificates should send a copy of their NTN certificate to the Company or its Share Registrar. The Shareholders while sending CNIC or NTN certificates, as the case may be must quote their respective folio numbers.
In case of non-receipt of the copy of a valid CNIC or NTN, the Company would be unable to comply with SRO 831(1)/2012 dated July 05, 2012 of SECP and therefore will be constrained under Section 243(3) of the Companies Act, 2017 to withhold dispatch of dividend warrants of such shareholder. Further, all shareholders are advised to immediately check their status on ATL and may, if required take necessary action for inclusion of their name in the ATL. The company as per the new law, shall apply 20% rate of withholding tax if the shareholders name, with relevant details, does not appear on the ATL, available on the FBR website on the first day of book closure and deposit the same in the Government Treasury as this has to be done within the prescribed time.
7. Payment of Cash Dividend Electronically
As per provision of Section 242 of Companies Act, 2017 any dividend payable in cash shall only be paid through electronic mode directly in to the bank account designated by the entitled shareholders. The shareholders are requested to provide their folio number, name and details of bank account consisting of bank name, branch name, branch code, Account number, Title of Account and IBAN in which they desire their dividend to be credited, failing which the Company will be unable to pay the dividend through any other mode. Standard request form has also been placed on website of the Company. The members are requested to send the information on the same to our shares registrar (M/s Corplink Private Limited, Wings Arcade, 1-K, Commercial, Model Town, Lahore.) at the earliest possible.
In case shares are held in CDC then the form must be submitted directly to shareholder's broker/participant/CDC Investor account services.
8. Transmission of Annual Financial Statements through E-mail
The Securities and Exchange Commission of Pakistan vide SRO 787(I)/2014 dated September 08, 2014 has allowed companies to circulate annual balance sheet, profit & loss account, auditors' and directors' reports along with notice of annual general meeting to its members through e-mail. Members who wish to avail this facility can give their written consent. Standard request form has also been placed on website of the Company. The members are requested to send the information on the same to our shares registrar (M/s Corplink Private Limited, Wings Arcade, 1-K, Commercial, Model Town, Lahore.)
9. Transmission of Annual Financial Statements through CD/DVD/USB
SECP through its SRO 470(I)/2016 dated May 31, 2016 have allowed companies to circulate the annual balance sheet, profit and loss account, auditors' report and directors' report etc to its members through CD/DVD/USB at their registered addresses. However a shareholder may request to the Company Secretary at Pak Elektron Limited, Factory Premises, 14-K.M. Ferozepur Road, Lahore to provide printed copy of Annual Financial Statements and the same will be provided at his/her registered address, free of cost, within one week of the demand.
K 02 Pak Elektron Limited K 03Annual Report 2018

Notice of Annual General Meeting
10. ZAKAT DECLARATIONS (CZ-50)
The Zakat will be deducted from the dividends at source at the rate of 2.5% of the paid-up value of the shares (Rs. 10/- each) under Zakat and Ushr Laws and will be deposited within the prescribed period with the relevant authority, Please submit your Zakat Declarations under Zakat and Ushr Ordinance, 1980 & Rule 4 of Zakat (Deduction & Refund) Rules, 1981 CZ-50 Form, in case you want to claim exemption, with your brokers or the Central Depository Company Ltd. (in case the shares are held in Investor Account Services on the CDC) or to our Registrars, M/s Corplink Private Limited, Wings Arcade, 1-K, Commercial, Model Town, Lahore (in case the shares are held in paper certificate form). The shareholders while sending the Zakat Declarations, as the case may be must quote company name and respective folio numbers.
11. ATTENDANCE OF MINORITY SHAREHOLDERS
All minority shareholders of the Company are encouraged to attend the Annual General Meeting.
12. PRESENCE OF CHAIRMAN OF AUDIT COMMITTEE
The chairman of the Audit Committee will be present at the annual general meeting to respond to questions on audit committee’s activities and matter within the scope of audit committee’s responsibilities.
K 04 Pak Elektron Limited K 05Annual Report 2018
K 06 Pak Elektron Limited K 07Annual Report 2018
Form of ProxyRD63 ANNUAL GENERAL MEETING
LEDGER FOLIO SHARES HELD
I / We
of
appoint
(or of
failing him)
(being a member of the Company) as my / or proxy to attend and vote for me / us and on my / our behalf at
rdthe 63 Annual General Meeting of the Company to be held on April 26, 2019 at factory premises, 14-Km,
Ferozepur Road, Lahore at 11:30 A.M. and at every adjournment thereof, if any.
A witness my / our hand (s) this day of 2019.
Signed by the said REVENUE
STAMP
Witnesses:
1) Name
Address
CNIC No.
2)
Notes:
1.
2.
A member entitled to attend and vote at this Meeting may appoint proxy in accordance with the provisions of Article 54 of the Articles of Association of the Company. Proxies in order to be effective, must be received at 17-Aziz Avenue, Canal Bank Gublerg-V, Lahore, the Registered Office of the Company not later than forty eight hours before the time of holding the meeting and must be duly stamped, signed and witnessed.
For CDC Account Holders/ Corporate Entities in addition to the above the following requirement have to be met.
(i) Attested copies of CNIC or the passport of the Beneficial Owners and the Proxy shall be provided with the proxy form
(ii) In came of a Corporate entity, the Board of Directors' Resolution / Power of Attorney with specimen signatures shall be submitted (unless it has been provided earlier alongwith proxy form to the Company).
(iii) The Proxy shall produce his original CNIC or original passport at the time of the meeting.
Name
Address
CNIC No.
The Company Secretary
17 - Aziz Avenue, Canal Bank,Gulberg-V, Lahore.
PAK ELEKTRON LIMITED
AFFIXCORRECTPOSTAGE
2019
K 08 Pak Elektron Limited K 09Annual Report 2018
The Company Secretary
17 - Aziz Avenue, Canal Bank,Gulberg-V, Lahore.
PAK ELEKTRON LIMITED
AFFIXCORRECTPOSTAGE
2019
K 08 Pak Elektron Limited K 09Annual Report 2018

The Company Secretary
17 - Aziz Avenue, Canal Bank,Gulberg-V, Lahore.
PAK ELEKTRON LIMITED
AFFIXCORRECTPOSTAGE
K 10 Pak Elektron Limited