ANNUAL REPORT OF HOSPITAL SERVICES For the Fiscal ...
214
ANNUAL REPORT OF HOSPITAL SERVICES For the Fiscal Year Ending March 31, 2014 May 2015
-
Upload
khangminh22 -
Category
Documents
-
view
0 -
download
0
Transcript of ANNUAL REPORT OF HOSPITAL SERVICES For the Fiscal ...

ANNUAL REPORT OF
HOSPITAL SERVICES
For the Fiscal Year Ending March 31, 2014
May 2015


2013/2014 Annual Report of Hospital Services
TABLE OF CONTENTS 1. Introduction Changes in the Annual Report (for this year) 2. Executive Summary 3. Section I – Total Expenses and Revenues Table I-1(a) Total Expenses by Facility Type Table I-1(b) Total Expenses by Facility Table I-2 Total Expenses by Expense Account Type by RHA Table I-3(a) Total Expenses by Functional Area by RHA Table I-3(b) Administrative Support Total Expenses by Functional Centre by Zone Table I-4 Trends in Total Expenses by Expense Account Type Table I-5(a) Total Revenues by Revenue Account Type by RHA Table I-5(b) Revenue Received in Current Year Related to Prior Year Activity Table I-6 Trends in Total Expenses by Functional Area Table I-7 Trends in Total Revenues by Revenue Account Type 4. Section II – Compensation Expenses and Statistics Table II-1 Worked and Benefit Hours Trends (Including Medical Hours) Table II-2 Total Worked and Benefit Hours by RHA by Facility (Excluding Medical) Table II-3 Total Worked and Benefit Hours by Functional Area by RHA (Excluding Medical) Table II-4 Salaries Expense Per Paid Hour by Functional Area by RHA (Excluding Medical) Table II-5 Total UPP and MOS Worked Hours by Functional Area by RHA (Excluding Medical) Table II-6 Breakdown by Benefit Contributions by RHA Table II-7(a) Number of Full-time and Part-time Employees as of March Figure II-7(a) Percentage of Full-time and Part-time Employees Table II-7(b) Number of Permanent and Temporary Employees as of March Figure II-7(b) Percentage of Permanent and Temporary Employees Table II-7(c) Age Distribution by RHA as of March Figure II-7(c) Percentage of Age Grouping 5. Section III – Clinical Statistics Table III-1a Acute Care (Level of Care) Inpatient Separations, Days Stay, and Weighted Cases by Regional
Health Authority Figure III-1a (i) Acute Care (Level of Care) Inpatient Separations by RHA Figure III-1a (ii) Acute Care (Level of Care) Inpatient Days Stay by RHA Figure III-1a (iii) Acute Care (Level of Care) Inpatient Average Length of Stay (ALOS) by RHA Figure III-1a (iv) Acute Care (Level of Care) Inpatient Weighted Cases by RHA Figure III-1a (v) Acute Care (Level of Care) Inpatient Average RIW by RHA Table III-1b Chronic/Extended (Level of Care) Inpatient Separations, Days Stay by Regional Health Authority Table III–1c Rehabilitation (Level of Care) Inpatient Separations, Days Stay by Regional Health Authority Table III–1d VAC (Level of Care) Inpatient Separations, Days Stay by Regional Health Authority Table III–1e Psychiatric Facilities Inpatient Separations, Days Stay by Regional Health Authority Table III – 1f Total Newborns by Regional Health Authority Figure III – 1f (i) Total Newborns by RHA Table III – 1g Total Newborns by Regional Health Authority by Gender Figure III – 1g (i) Provincial Percentage of Newborns by Gender Table III – 1h Total Deaths (All Inpatient levels of care) by Regional Health Authority Figure III – 1h (i) Total Deaths (All Inpatient levels of care) by RHA Table III – 1i Total Deaths (All Inpatient levels of care) by Regional Health Authority by Gender Figure III – 1i (i) Provincial Percentage of Deaths (All inpatient levels of care) by Gender Table III – 1j Total Deliveries by Regional Health Authority Figure III – 1j (i) Total Vaginal Deliveries by RHA Figure III – 1j (ii) Total Caesarean Sections by RHA
May 2015 Table of Contents - Page 1

2013/2014 Annual Report of Hospital Services
Figure III – 1j (iii) Total Deliveries (Vaginal and Caesarean Sections) by RHA Figure III – 1j (iv) Percentage of Caesarean Sections by RHA Table III-2 Total Day Surgery Cases, Weighted Cases and Average DPG Weight by Regional Health Authority Figure III-2 (i) Total Day Surgery Cases by RHA Figure III-2 (ii) Total Day Surgery Weighted by RHA Figure III-2 (iii) Average CACS Weight per Day Surgery Case by RHA Table III-3a Total Surgical Episodes Performed in the Main OR and Caesarean Sections in the Delivery Room Table III-3b All Inpatient Separations (cases) - Top 25 Principle Interventions (Main OR) and principle
Caesarean Sections (Delivery Room) in the province Table III-4a Acute Care Separations (Cases) – Top 25 Case Mix Groups (CMG+) in the Province Table III– 4b Acute Care Separations (Cases) – Top 10 Case Mix Groups (CMG+) by Regional Health
Authority Table III– 4c Acute Care Separations (Cases) – Top 10 Case Mix Groups (CMG+) by Regional Health
Authority Table III– 4d Acute Care Separations (Cases) – Top 10 Case Mix Groups (CMG+) by Regional Health
Authority Table III– 4e Acute Care Separations (Cases) – Top 10 Case Mix Groups (CMG+) by Regional Health
Authority Table III-5a Day Surgery Separations (Cases) – Top 25 Comprehensive Ambulatory Classification System
(CACS) groups in the Province Table III-5b Days Surgery Separations (Cases) – Top 10 Comprehensive Ambulatory Classification System
(CACS) groups by Regional Health Authority Table III-5c Days Surgery Separations (Cases) – Top 10 Comprehensive Ambulatory Classification System
(CACS) groups by Regional Health Authority Table III-5d Days Surgery Separations (Cases) – Top 10 Comprehensive Ambulatory Classification System
(CACS) groups by Regional Health Authority Table III-5e Days Surgery Separations (Cases) – Top 10 Comprehensive Ambulatory Classification System
(CACS) groups by Regional Health Authority Table III-6 Acute Care Separations with Alternate Level of Care (ALC) Days by Regional Health Authority 6. Section IV – Expenses and Statistics by Functional Centre Table IV-1(a) Nursing Inpatient Total Expenses, Worked Hours, Benefit Hours and Patient Days by Functional
Centre Table IV-1(b) Nursing Inpatient Workload Units by Functional Centre Table IV-1(c) Nursing Inpatient Indicators by Functional Centre Table IV-1(d) Nursing Inpatient Percent of Total Workload by RHA Table IV-2(a) Operating Room/Recovery Room/Day Surgery Total Expenses, Worked Hours and Statistics Table IV-2(b) Operating Room/Recovery Room/Day Surgery Workload Units Table IV-2(c) Operating Room/Recovery Room/Day Surgery Indicators Table IV-3 Ambulatory Care Service Activity by RHA Figure IV-3(i) Total Emergency Room Visits by RHA Figure IV-3(ii) Total Day/ Night Care and Clinic Visits by RHA Table IV-4(a) Emergency Room, Day Night Care & Clinics Total Expenses, Worked Hours and Statistics Table IV-4(b) Emergency Room Visits by Triage Level Table IV-4(c) Emergency Room Visits by Triage Level and Time of Day Table IV-4(d) Emergency Room and Day Night Care & Clinics Indicators Table IV-5(a) Clinical Laboratory Expenses, UPP Worked Hours, UPP Benefit Hours and Workload Units by
Functional Centre Table IV-5(b) Clinical Laboratory – Distribution of Workload by Functional Centre and Source of Request Table IV-5(c) Clinical Laboratory Indicators Table IV-5(d) Clinical Laboratory Percent of Total Workload by RHA Table IV-6(a) Diagnostic Imaging Expenses, UPP Worked Hours, UPP Benefit Hours and Workload Units and
Exams/Procedures by Functional Centre Table IV-6(b) Diagnostic Imaging Distribution of Workload and Exams by Source of Request Table IV-6(c) Diagnostic Imaging Indicators Table IV-7(a) Electrodiagnostic, Non-Invasive Cardiology and Vascular Lab Expenses, UPP Worked Hours, UPP
Benefit Hours, Workload Units and Exams/Procedures by Functional Centre
May 2015 Table of Contents - Page 2
2013/2014 Annual Report of Hospital Services
Table IV-7(b) Electrodiagnostic, Non-Invasive Cardiology and Vascular Lab Workload Units by Functional Centre and Source of Request
Table IV-7(c) Electrodiagnostic, Non-Invasive Cardiology and Vascular Lab Indicators Table IV-8(a) Other Diagnostic and Therapeutic Total Expenses, Worked Hours and Statistics by Functional Centre Table IV-8(b) Other Diagnostic and Therapeutic Total Workload by Functional Centre and Source of Request Table IV-8(c) Other Diagnostic and Therapeutic Indicators Table IV-8(d) Other Diagnostic and Therapeutic Percent Workload by Service Recipient Table IV-8(e) Other Diagnostic and Therapeutic Productivity Table IV-9(a) Extra-Mural Total Expenses, Worked Hours and Statistics by Functional Centre Table IV-9(b) Extra-Mural Workload Units by Functional Centre Table IV-9(c) Extra-Mural Workload Indicators by Functional Centre Table IV-9(d) Extra-Mural Total Expense (Shareable and Non Shareable) by Expense Account Type Table IV-9(e) Extra-Mural Admissions, Discharges and Select Indicators Table IV-10(a) Patient Laundry Services Table IV-10(b) Patient Food Services 7. Section V – Surgical Wait Times Trends Table V-1(a) Surgical Wait Time (Median) in Days for surgeries waiting, by Zone Table V-1(b) Surgical Wait Time (Median) in Days for surgeries completed, by Zone Table V-1(c) Surgical Wait Time (Median) in Days for Cancer Surgeries waiting, by Zone Table V-1(d) Surgical Wait Time (Median) in Days for Cancer Surgeries completed, by Zone Table V-2(a) Number of Surgeries Waiting for the Province Table V-2(b) Number of Surgeries Completed for the Province Table V-2(c) Number of Surgeries Waiting by Zone Table V-2(d) Number of Surgeries Completed by Zone Table V-2(e) Surgical Volumes for Cases Waiting Longer Than 12 months by Zone Table V-2(f) Surgical Volumes for Cases Completed Having Waited Longer than 12 months by Zone Table V-3 Clinical Acuity Model Target Timeframe by Zone Table V-3(a) Category I – Percent of Surgeries Completed within 3 weeks Table V-3(b) Category II – Percent of Surgeries Completed within 6 weeks Table V-3(c) Category III – Percent of Surgeries Completed within 3 months Table V-3(d) Category IV – Percent of Surgeries Completed within 12 months Table V-3(e) All Surgeries – Percent of Surgeries Completed within 12 months Table V-4 Pan Canadian Benchmark Procedure Targets by Zone Table V-4(a) Hip Replacement Surgery – Percent Completed within 26 weeks Table V-4(b) Knee Replacement Surgery – Percent Completed within 26 weeks Table V-4(c) High-Risk Cataract Surgery – Percent Completed within 16 weeks Table V-4(d) Coronary Artery Bypass Graft Surgery – Level I (percent completed within 2 weeks), Level II (percent
completed within 2-6 weeks), and Level III (percent completed within 6-26 weeks) Table V-4(e) Hip Fracture Fixation – Percent Completed within 48 hours 8. Section VI – Other Hospital Services Financial Data Table VI-1 Detail of Expenditures for Hospital Services per Public Accounts Table VI-2 Capital Equipment Expenditures Paid by Hospital Services 9. Glossary of Terms
May 2015 Table of Contents - Page 3


Introduction


2013/2014 Annual Report of Hospital Services
INTRODUCTION The Annual Report of Hospital Services provides a summary of the financial and statistical activity of the Regional Health Authorities The Annual Report of Hospital Services provides summaries, at varying levels of functional detail, of the expenses, revenues, service activity, and patient volumes of the Regional Health Authorities (RHAs). The Annual Report also provides trends of these measures over the last three to five years. The source of the data is the Hospital Financial Utilization Management System (HFUMS) database at the Department of Health (DH) and consists of data from Management Information System (MIS), Human Resource Database (HRDB), Discharge Abstract Data (DAD) and Surgical Wait Time database. The data reported by the RHAs is consistent with provincial and national reporting standards. The Quality of the RHA Financial and Statistical Data Continues to Improve The Canadian Institute for Health Information (CIHI) has recognized New Brunswick as a leader in providing accurate coverage, timely, comparable, useable and relevant health information. Ongoing data quality processes evaluate and enhance the quality of the identified quality dimensions. Work is still in progress however and some gaps and inconsistencies may exist in the data. Notes are included below the tables to indicate where such data quality issues are known to exist. Additional content is added as data holdings are enhanced and quality improves. It must be noted that some therapeutic services have transitioned to a new workload measurement collection system. During this transition there may be some data quality issues. The Annual Report is not a performance measurement report The Annual Report and the data it presents should not be used to evaluate the relative performance or efficiency of the RHAs. The objective is to present a cross section of the RHAs expenditures, revenues and activity, without reference to benchmarks, or performance targets. This does not preclude the calculation of performance indicators or presentation of such indicators in future Annual Reports. This Annual Report has been reviewed by stakeholders from the RHAs and the DH The data presented in this Annual Report has been reviewed thoroughly by financial and clinical department managers at each of the Regional Health Authorities (RHAs) and by financial and clinical consultants at the Department of Health (DH). The overall report has been reviewed by the provincial MIS Coordinator Committee, which includes multi-disciplinary representation from the RHAs and the DH. While recognizing that a few data quality and data comparability issues may exist in the data, the reviewers generally agreed that the report is a fair representation of overall RHA financial and statistical operations.
May 2015 Introduction - Page 1

2013/2014 Annual Report of Hospital Services
CHANGES IN THE ANNUAL REPORT No changes. Five years of comparative data are provided in the trend tables Again this year, given the relatively higher level of confidence in the data, five-year trends are provided. The reader should be cautious in interpreting the trends because of the reporting changes that have taken place over that timeframe. It is often the case that year-to-year changes in the data are due to modifications in the reporting as opposed to actual changes in resource consumption or service delivery. Notes explain specific, known areas where the trend analysis may be compromised. Effective 2009, FacilicorpNB reporting is included in Section I and II. Comparison to current or previous years is not recommended as the reporting processes are still being improved.
May 2015 Introduction - Page 2

Executive Summary

2013/2014 Annual Report of Hospital Services
EXECUTIVE SUMMARY Section I: Summary of Total Expenses and Revenues Section I provides breakdowns of total expenses and revenues at various levels of detail for two Regional Health Authorities (RHAs) and eight zones. Note: FacilicorpNB and corporate expenses for RRS A and RHA B are reported separately from those of the zones. Total expenses showed a small rise (an increase of 0.9% from last year including corporate expenses for RRS A and RHA B and FacilicorpNB). The vast majority of expenses were incurred by acute care hospitals (84.3%) Table I-1(a) shows the breakdown by facility type. Compensation expenses account for 74.4% of total expenses [Table I-4].
o Salaries have decreased by 1.0%. o Benefit Contributions grew by 16.3% due to a change in the Public Sector Accounting Board
guidelines requiring that Sick Leave Benefits Payable be captured. Medical Surgical, Sundry and Other Supply expenses accounts for 15.6% of total expenses. Drugs represent 3.6% of the total (no change from last year) Note: Refer to Table I-4 for trends in total expenses by expense account type. Total revenues are up by 1.3%. (Refer to table I-5(a) (b) and I-7 for trends in revenues). DH revenues increased by 2.0% from last year, while Medicare Revenues decreased 0.4% in the same period.
May 2015 Excecutive Summary - Page 1

2013/2014 Annual Report of Hospital Services
The table below provides a high level summary of RHA expenses, revenues and specific expense types (including corporate and FacilicorpNB). Details related to the table can be found in Section I of the annual report.
Financial Summary
2009/10 2010/11 2011/12 2012/13 2013/14 % Change (2012/13, 2013/14)
Expenses
Overall Expenses
1,838,120,998 1,917,040,523 1,935,962,373 1,968,475,103 1,984,979,596 0.8%
Specific Expenses – Excludes Referred Out and Buildings and Grounds
Salaries 1,184,294,819 1,255,480,827 1,281,784,804 1,296,003,693 1,282,588,897 -1.0%
Benefit Contributions
135,729,522 141,999,787 148,460,804 162,596,501 194,159,168 19.5%
Medical & Surgical Supplies, Other Supplies, Sundry
289,381,271 291,960,313 283,777,230 287,653,389 285,370,793 -0.7%
Equipment Expenses
83,402,854 81,255,946 77,046,813 85,105,496 85,233,108 0.3%
Drugs 68,327,878 73,260,107 72,867,731 71,138,717 70,848,457 -0.4%
Revenues
Overall Revenues
1,844,342,114 1,909,637,238 1,943,710,374 1,944,259,602 1,968,879,697 1.3%
Table I-6 provides a break-down of total expenses by functional area by RHA for the most recent 5 years.
May 2015 Excecutive Summary - Page 2
2013/2014 Annual Report of Hospital Services
Section II: Summary of Compensation Expenses and Statistics Section II provides a summary of compensation data by RHA and Zone. These reports provide detail of worked hours and benefit hours, as well as calculated Full Time Equivalents (FTEs). A breakdown of compensation expenses (salaries and benefit contributions) is also provided. Effective 2009, FacilicorpNB reporting is included in Section II. Comparison to current or previous years is not recommended as the reporting processes are still being improved. Table II-1 shows a decrease of 2.0% in total paid hours in 2013/14. Table II-2 shows the same data by facility. Note that facility level FTE’s can be confounded by the fact that staff from the regional hospital may provide services to the smaller hospitals and are not always charged to those hospitals. The calculated FTEs were equivalent to 17,687. The largest volume of FTE’s was in nursing inpatient (28.7%) followed by 26.0% for Admin and Support. Refer to Table II-3 for FTE’s by functional area. The average salary cost per hour in Nursing Inpatient ranges from a low of $29.64 (RRS A Zone 5) to a high of $33.92 (RHA B Zone 1) (Table II-4). Figure II-7(a) shows that 66.3% of the employees work full-time and of the total number of employees, 88.0% have a permanent status. Figure II-7(c) shows that 56.8% of employees are between the ages of 35 to 55 years. The greatest percentage of employees (32.0%) is between the ages of 45 to 55 years and 24.8% are in the age range of 35 to 45 years. Note: Multi-year trending of compensation hours and expenses can be confounded by significant, retroactive payouts associated with collective bargaining settlements. Since RHAs do not accrue the payments prospectively, a large payout in a given year would artificially inflate the total costs in that year and affect the natural trend across years. In fiscal year 2012/13, contract agreements were signed for Nurses in February 2013.
May 2015 Excecutive Summary - Page 3
2013/2014 Annual Report of Hospital Services
Section III: Summary of Clinical Statistics – DAD (Discharge Abstract Database) Section III provides a summary of the patient activity for inpatient (level of care) and day surgery services in New Brunswick. A number of tables in this section provide comparisons between 2009/10 and 2013/14. The inpatient and day surgery information is derived from the Canadian Institute for Health Information (CIHI) Discharge Abstract Database (DAD), to which health facilities submit patient activity data on a regular basis Table III-1(a) to (e) shows that the number of separations decreased for all levels of care except for chronic/extended care and VAC. Acute care experienced a 1.2% decrease from 2012/13 to 2013/14. Rehabilitation experienced a 3.1% decrease and the psychiatric facilities experienced an 18.5% decrease in separations. Total days stay increased for all levels of care except for rehabilitation although it was a very slight increase (0.7%) for acute care. The average length of stay varies by level of care. For 2013/14 the average for acute care was 8.8 days, 87.8 for chronic/extended care and 41.6 days for rehabilitation. Total surgical episodes performed in the main OR and caesarean sections in the delivery room for 2013/14 (Table III-3(a)) included 21,402 inpatients and 43,318 day surgeries. A breakdown of the top 25 case mix groups for the province is provided in Table III-4(a). Cases have been grouped into CMGs using the 2013 CMG+ Grouper for all years and the top two CMG’s have remained consistent over the past five years and includes;
Normal Newborn, Singleton Vaginal Delivery Chronic Obstructive Pulmonary Disease
May 2015 Excecutive Summary - Page 4

2013/2014 Annual Report of Hospital Services
Section IV: Summary of Expenses and Statistics by Functional Centre Section IV includes information related to workload and a number of indicators calculated for key functional centres. These indicators include the number of unit producing personnel worked hours per patient day, per case or per visit as well as workload units per worked hour. Note that workload units are measured in minutes. A number of other factors (besides labour productivity) drive the indicator values including the quality of the workload measurement system used to produce the workload data. Expenses found within Section IV should not be compared to those of other sections because of the narrowing focus of Section IV (i.e. exclusions of some functional centres). Service recipient activities are unit-producing personnel activities that involve the delivery of services to or on behalf of a specific service recipient. These activities directly contribute to the fulfillment of the primary service mandate of the functional centre. Examples include assessment; therapeutic interventions or consultation/collaboration. Non-service recipient activities are unit-producing personnel activities that are integral to the functional centre's operations, but do not involve the delivery of services to service recipients and/or their significant others. Examples may include attendance at mandatory education/in-service programs; research; participation in meetings or activities to maintain the functioning of the department. Effective fiscal year 2007/08, Expenses reported in Section IV exclude Admin Allocation, Medical Compensation and Interdepartmental Expenses. Comparison to previous annual reports is not recommended because of this change. This allocation was removed to facilitate calculation of indicators using direct expenses only. The tables below report percentage change for specific functional areas using data extracted from the Section IV of previous Annual Reports of Hospital Services to key statistics found within Section IV of the this year’s report.
Nursing Inpatient Financial and Statistical Information 2011/12 2012/13 2013/14 % Change (2012/13, 2013/14)
Nursing Inpatient (excluding Zone 5
Pyschiatry)
Expenses (excluding admin allocation) 363,771,796 369,713,716 365,765,670 -1.1%
Patient Days 962,476 975,019 971,308 -0.4%
Average Cost Per Day 378 379 377 -0.5%
Total costs include not just nurses’ compensation but all costs incurred by the nursing functional centres including clerical and management staff, drugs, medical and surgical supplies, and so on. Medical and Interdepartmental expenses are excluded. The inpatient cost per day (Table IV-1(c)) in more resource intensive functional centres like the Intensive Care Unit ($1,194) is obviously much higher than in a regular medical ($317) or surgical unit ($387). Extended Care units, on the other hand, are less resource intensive and have a lower cost per day ($214) than the average acute care unit.
May 2015 Excecutive Summary - Page 5

2013/2014 Annual Report of Hospital Services
Emergency Department and Ambulatory Financial and Statistical Information
2011/12 2012/13 2013/14 % Change (2012/13, 2013/14)
Emergency Department
ER Expenses (excluding admin allocation) 63,397,731 67,133,195 68,250,795 1.7%
ER Visits 618,797 627,117 605,774 -3.4%
Patient Days in ER 14,137 17,155 15,797 -7.9%
Average Cost Per ER Visit 102 107 113 5.6%
Day/Night (D/N) Care & Clinics
D/N & Clinics Expenses (excluding admin allocation)
129,189,640 132,758,693 135,205,207 1.8%
D/N & Clinics Visits 879,817 830,609 840,344 1.2%
Average Cost per Clinic Visit 147 160 161 0.6%
Patient Days in the ER is a statistic that is included because it indicates the degree to which the Zone’s ER provided care to admitted patients who could not be transferred immediately to an inpatient bed. A small increase in ER visits (1.7%) was noted.
0
100,000
200,000
300,000
400,000
500,000
600,000
700,000
800,000
900,000
1,000,000
2011/12 2012/13 2013/14
Trends Emergency, Day/Night Care and Clinic Visits
ER Visits D/N & Clinics Visits
May 2015 Excecutive Summary - Page 6

2013/2014 Annual Report of Hospital Services
Diagnostic Financial and Statistical Information 2011/12 2012/13 2013/14 % Change (2012/13, 2013/14)
Clinical Laboratory (Lab)
Lab Expenses (excluding admin allocation)
81, 338,008 82,864,749 83,593,331 0.9%
Lab Workload 86, 829,902 87,788,869 88,230,936 0.5%
Average Costs Per Workload Unit 0.94 0.94 0.95 0.4%
Diagnostic Imaging (DI)
DI Expenses (excluding admin allocation)
67, 108,810 74,838,549 74,327,014 -0.7%
DI Exams/Procedures 1, 135,338 1,110,792 1,090,136 -1.9%
DI Average Cost Per Exam/Procedure 59.11 67.38 63.18 1.2%
Workload units (minutes) give an indication of the labour resources consumed in providing the various laboratory services. Details related to Clinical Laboratory expenses, worked and benefit hours, workload and procedures is provided in Tables IV-5(a) to IV-5(d) and Diagnostic Imaging details can be found in Tables IV-6(a) to IV-6(c) of the report. Note that workload units in this report should not be compared to other jurisdictions because NB results are based on pre-2009 CIHI standards. The Lab average cost per workload unit ($0.95) showed no significant change from last year. In the detail of Table IV-5(c), the cost per workload unit ranged from $0.79 in Anatomical Pathology to $1.48 for Transfusion Medicine Table IV-6(c) shows the average cost per exam for Diagnostic Imaging ranged from $35.01 for Radiography to $1,033.33 for PET Scan service. PET Scan exams/procedures and workload reflect both the PET Scan and the CT Scan that are performed as part of the service.
Other Diagnostic and Therapeutic Financial and Statistical Information
2011/12 2012/13 2013/14 % Change (2012/13, 2013/14)
Therapeutic Services
Expenses (excluding admin allocation) 60,488,795 61,560,554 62,584,740 1.7%
Attendance Days 828,523 818,568 815,590 -0.4%
Average Costs per Attendance Day 73.01 75.21 76.74 2.0%
Respiratory Services
Expenses (excluding admin allocation) 16,443,897 16,851,343 16,871,799 0.1%
Procedures 1,052,224 900,156 767,217 -14.8%
Average Costs per Procedure 15.63 18.72 21.99 17.5%
Radiation Therapy
Expenses (excluding admin allocation) 10,296,252 10,779,552 11,154,532 3.5%
Attendance Days 45,919 42,791 40,343 -5.7%
Average Costs per Attendance Day 224.23 251.91 276.49 9.8%
The functional area for other diagnostic and therapeutic services includes the therapeutic disciplines, respiratory services and radiation therapy. The average cost per attendance day for Therapeutic Services overall increased 2.0%. Table IV-8(c) includes the average cost per discipline. The average cost per procedure decreased by 14.8% for Respiratory Services. Comparison to previous years is not recommended because of improved data collection of respiratory procedures in 2012-2013. The 9.8% increase in Radiation Therapy can be partially attributed to a decrease in the number of attendance days reported.
May 2015 Excecutive Summary - Page 7

2013/2014 Annual Report of Hospital Services
Extra-Mural (EMP) Financial and Statistical
Information 2011/12 2012/13 2013/14
% Change (2012/13, 2013/14))
Extra-Mural Program (EMP)
Visits 476,433 464,398 449,400 -3.2%
Discharges 19,573 22,365 19,731 -11.8%
Admissions 20,283 20,685 20,094 -2.9%
Average Cost Per Visit 126 130 126 -3.1%
Average Cost Per Discharge 3,921 3,432 3,665 -6.8%
The above table shows that there has been a 3.2% decrease in visits, 11.8% decrease in discharges and a 2.9 % decrease in admissions (i.e. flow through). A breakdown of the visits by service provider discipline and a breakdown of the discharges by RHA are provided in Table IV-9(a).
May 2015 Excecutive Summary - Page 8

2013/2014 Annual Report of Hospital Services
Section V: Surgical Wait Time: Section V provides detailed information in relation to surgical wait times and surgical volumes, as well as achievements in the provincial clinical acuity model target time frames and the Pan Canadian surgical benchmarks. These are illustrated for the province and each of the eight Zones.
The wait time data from the provincial surgical access registry is utilized by surgeons and surgical programs to improve wait time for patients. Uses include - scheduling patients for surgery, allocating operating room time to surgeons, and answering patient’s questions on their wait time. The provincial wait time data is monitored by the Regional Health Authorities and Department of Health. Annual wait time targets were established by the provincial committees for the New Brunswick clinical acuity model and the Pan Canadian benchmarks. The surgical teams at each facility are actively working to reduce individual patient wait time and to achieve the targets established for December 2012. Wait time data has been shared across the province since January 2008.
Surgical Volumes
Number of Surgeries 2011/2012 2012/2013 2013/2014 % Change from
2011/2012 to 2013/2014
Surgeries Waiting 15,277 15,495 15,645 2.4% Surgeries Completed 56,293 55,351 55,240 -1.9%
Surgeries Waiting > 12 Months Mar 31,
2012 Mar 31,
2013 Mar 31,
2014 % Change from
2012 to 2014 Surgeries waiting longer than 12 months 641 586 844 31.7%
Wait Time Trending All Surgeries Waiting
Mar 31, 2012
Mar 31, 2013
Mar 31, 2014
% Change from 2012 to 2014
Median wait in days 52 58 58 11.5% 90th Percentile wait in days 267 263 294 10.1%
Cancer Surgeries Waiting Mar 31,
2012 Mar 31,
2013 Mar 31,
2014 % Change from
2012 to 2014 Median wait in days 12 18 13 8.3% 90th Percentile wait in days 65 69 59 -9.2%
NB Clinical Acuity Model Wait Time Targets Surgeries Completed 2011/2012 2012/2013 2013/2014
2014Target
Category I (within 3 weeks) 55 % 62 % 68 % 90 % Category II (within 6 weeks) 61 % 63 % 68 % 90 %Category III (within 3 months) 69 % 73 % 75 % 90 % Category IV (within 12 months) 98 % 98 % 97 % 100 %All Surgeries Completed within 12 months 98.3 % 98.7 % 98.4 % 100 % All Cancer Surgeries within 6 weeks 88 % 89 % 84 % 100 %All Cancer Surgeries within 3 months 88 % 92 % 92 % 100 %
May 2015 Excecutive Summary - Page 9

2013/2014 Annual Report of Hospital Services
Pan-Canadian Benchmark Targets Pan-Canadian Benchmark Procedures Completed
2011/2012 2012/2013 2013/2014 2014
Target Total Hip Replacement Surgery (26 weeks) 70% 73% 70% 85% Knee Replacement Surgery (26 weeks) 57% 59% 60% 75% Cataract Surgery (16 weeks) 85% 85% 88% 90% Coronary Artery Bypass Graft Surgery - Level I (2 weeks) 100% 75% 100% 90%
Coronary Artery Bypass Graft Surgery - Level II (2-6 weeks)
84% 85% 85% 85%
Coronary Artery Bypass Graft Surgery - Level III (6-26 weeks)
100% 100% 100% 100%
*Hip Fracture Fixation (48 hours) 85% 83% 86% 95%
Timeframes during which the patient was not available for surgery are excluded from the wait time calculations. Emergency surgeries are excluded. *Data for hip fracture fixation are obtained from the CIHI Discharge Abstract Database (DAD). Wait times are calculated from the admission date and time to the date and time the procedure commenced. Inpatient transfers from other facilities are included.
May 2015 Excecutive Summary - Page 10
2013/2014 Annual Report of Hospital Services
Section VI: Other Hospital Services Financial Data Section VI contains capital equipment expenditures paid by Hospital Services compiled by Hospital Services, most of which is derived from sources other than the RHA submissions to MIS.
May 2015 Excecutive Summary - Page 11


Section I
Total Expenses and Revenues


2013/2014 Annual Report of Hospital Services
Section I: Summary of Total Expenses and Revenues This section is useful to those who wish to understand the expenses and revenues related to programs and services. Detailed breakdowns are available for the current year and the four preceding years by expense/revenue type, by RHA, by Zone, and facility type, and by functional area (high level aggregates of RHA departments and services). Section I provides breakdowns of total expenses and revenues at various levels of detail two Regional Health Authorities (RHA) and eight zones. Note: FacilicorpNB and corporate expenses for RHA A and RHA B are reported separate from those of the zones. For this reason, a summary of these expenses appear in Section I of the annual report. Notes are included below many of the tables to explain certain inclusions, exclusions or variations in the data. A Glossary of Terms is provided at the end of the Annual Report. The following are the general descriptions of financial data provided in Section I: Table I-1: Total Expenses by Facility Type (Hospitals, Extra-Mural, Health Centres, Community Health Centres, Public Health and Mental Health) I-1(a) shows total expenses by each of the facility types operated by RHAs. The vast majority of expenses were incurred by acute care hospitals. I-1(b) shows the breakdown for the facilities in each RHA. Note that many expenses related to providing services at the smaller facilities in a given RHA are reported in the main regional facility (e.g., administration expenses, costs of specialized diagnostic services, etc.). As such, small facility costs tend to be under-reported while regional facility cost would be inflated (as they would include a portion of the small facility related costs). Table I-2: Total Expenses by Expense Account Type This table shows total expenses by expense account type. Not surprisingly, compensation expenses accounts for approximately 74% of total expenses. Supplies and drugs together make up the next largest category at around 15%. Table I-3: Total Expenses by Functional Area (Departmental Groupings) Functional Areas are groupings of RHA functional centres (which are analogous to departments). See glossary for definitions of functional centres and areas. Table I-3(a) shows a current year percentage breakdown of expenses by functional area. Table I-3(b) provides additional detail related to Administrative Support expenses ($150,933,096) for RHAs, Corporate and FacilicorpNB. Table I-4: Five-year Trends of Total Expenses by Expense Account Type (2009/10 to 2013/14) I-4 shows trends of total expenses (excluding interdepartmental) by RHA for the five years. Total expenses have continued to rise (a slight increase of 0.9% from last year). I-4 shows that salaries decreased by 1.0% and benefit contributions increased 19.5% from last year. Note that retroactive contract settlement expenses are reported in the year they are paid out which skews the year to year comparisons of compensation expenses. In fiscal year 2012/13, contract agreements were signed for Nurses in February 2013. Table I-5: Total Revenues by Revenue Account Type I-5(a) shows the total revenues by account type. DH revenues accounts for 78.5% of total revenues followed by Medicare at 12.8%.
May 2015 Section I - Page 1

2013/2014 Annual Report of Hospital Services
Table I-5(b) provides revenues received in 2013/14 but that relate to prior years. These prior year revenues are in the RHA financial statements for 2013/14 but should be excluded when analyzing financial activity for that year. Table I-6: Five-year Trends of Total Expenses by Functional Area (2009/10 to 2013/14) This table shows a five year trend of expenses (excluding interdepartmental) by functional area. More detail of expenses by functional centre (department) is provided in Section IV. Table I-7: Five-year Trends of Total Revenues by Revenue Account Fund Type (2009/10 to 2013/14) I-7shows the trends in total revenues by account type. DH revenues increased by 2.0% from last year while Medicare Revenues decreased by 0.4% in the same period.
May 2015 Section I - Page 2


Section I - Total Expenses and Revenues2013/2014 Annual Report of Hospital Services
Note 1: The facility type "Other Subservices" represents those facilities converted to CHCs that continue to provide subservices aligned with the regional facilities and Hospital Services (e.g. Lab, Diagnostic Imaging). Note 2: FacilicorpNB and corporate expenses for RRS A and RHA B are included in Section I reports.
Table I-1(a): Total Expenses by Facility Type - 2013/2014
Region Acute Care Facilities
Extra-Mural Program
Health Centres
Psychiatric Facilities
Public Health Rehabilitation Facilities
Community Mental Health
Community Health Centres
Other Subservices
Corporate Facilicorp Total
RRS A Zone 1 232,265,434 9,977,778 706,438 0 4,905,779 0 4,033,070 0 0 1,585,065 12,072,257 265,545,821 RRS A Zone 4 120,170,162 7,763,082 277,141 0 2,074,751 0 4,392,933 0 0 1,444,149 6,901,627 143,023,844 RRS A Zone 5 84,190,360 3,328,606 251,415 24,153,101 1,267,515 0 3,781,889 2,279,740 5,451,719 1,336,162 7,667,430 133,707,937 RRS A Zone 6 171,186,027 8,929,527 618,714 0 3,217,998 0 6,208,224 5,421,601 0 1,313,659 8,926,160 205,821,910
RHA B Zone 1 272,185,919 9,634,708 1,272,398 0 0 0 4,662,601 1,437,594 54,361 1,682,670 13,575,190 304,505,440 RHA B Zone 2 415,331,170 15,414,272 2,210,004 7,516,581 4,528,114 0 8,914,261 4,070,887 0 2,507,486 24,314,351 484,807,127 RHA B Zone 3 276,580,573 14,540,990 3,490,978 0 4,687,387 11,161,292 7,639,511 8,315,199 638,722 1,606,338 14,785,756 343,446,745 RHA B Zone 7 89,051,892 4,583,862 1,022,833 0 1,746,401 0 2,424,315 0 0 544,440 4,747,029 104,120,772
RRS A 607,811,983 29,998,994 1,853,708 24,153,101 11,466,042 0 18,416,116 7,701,341 5,451,719 5,679,035 35,567,473 748,099,512
RHA B 1,053,149,555 44,173,832 7,996,212 7,516,581 10,961,903 11,161,292 23,640,688 13,823,681 693,083 6,340,933 57,422,325 1,236,880,084
Total 1,660,961,538 74,172,825 9,849,920 31,669,683 22,427,945 11,161,292 42,056,804 21,525,022 6,144,801 12,019,968 92,989,798 1,984,979,596
May 2015 Section I - page 3

2013/2014 Annual Report of Hospital Services Section I - Total Expenses and Revenues
Table I-1(b): Total Expenses by Facility - 2013/2014 - Page 1 of 4
Note 1: The facility type "Other Subservices" represents those facilities converted to CHCs that continue to provide subservices aligned with the regional facilities and Hospital Services (e.g. Lab, Diagnostic Imaging). Note 2: FacilicorpNB and corporate expenses for RRS A and RHA B are included in Section I reports. Note 3: Number of sites listed is based on RHA reporting structure to DH and not intended to be reflective of the total number of unique physical health care institutions.
Extra-Mural ProgramFacility RHA Facilicorp Expenses
PEM unité de Blanche Bourgeois 5,064,722 49 5,064,772 PEM unité de Kent 2,076,801 0 2,076,801 PEM unité de Shédiac 2,836,255 0 2,836,255
PEM unité d'Edmundston 4,281,777 247 4,282,024 PEM unité de Grand Sault 2,550,137 9 2,550,146 PEM unité de Kedgwick 931,168 0 931,168
PEM unité de Restigouche 3,328,606 0 3,328,606
PEM unité de Bathurst 3,251,266 0 3,251,266 PEM unité de la Péninsule acadienne - Caraquet 2,003,008 250 2,003,258 PEM unité de la Péninsule acadienne - Lamèque 1,406,727 0 1,406,727 PEM unité de la Péninsule acadienne -Tracadie 2,268,527 89 2,268,616
EMP Driscoll Unit 8,453,715 0 8,453,715 EMP Tantramar Unit 1,180,994 0 1,180,994
EMP Eastern Charlotte Unit 1,826,823 0 1,826,823 EMP Kennebecasis Valley Unit 2,661,503 57 2,661,561 EMP Saint John Unit 6,608,640 333 6,608,973 EMP St. Stephen Unit 2,094,517 0 2,094,517 EMP Sussex Unit 2,222,787 0 2,222,787
EMP Boiestown Office 259,813 0 259,813 EMP Fredericton Unit 7,027,604 2,006 7,029,610 EMP Oromocto Unit 2,346,424 0 2,346,424 EMP Perth Unit 2,077,458 0 2,077,458 EMP Woodstock Unit 2,829,691 0 2,829,691
EMP Blackville Office 336,140 0 336,140 EMP Miramichi Unit 3,973,515 0 3,973,515 EMP Neguac 274,206 0 274,206
RRS A Zone 1 Sub-Total 9,977,828 9,977,778 49
RRS A Zone 4 Sub-Total 7,763,338 7,763,082 256
RRS A Zone 5 Sub-Total 3,328,606 3,328,606 0
RRS A Zone 6 Sub-Total 8,929,867 8,929,527 339 RRS A Sub-Total 29,999,638 29,998,994 644
RHA B Zone 1 Sub-Total 9,634,708 9,634,708 0
RHA B Zone 2 Sub-Total 15,414,662 15,414,272 390
RHA B Zone 3 Sub-Total 14,542,997 14,540,990 2,006
RHA B Zone 7 Sub-Total 4,583,862 4,583,862 0 RHA B Sub-Total 44,176,229 44,173,832 2,397
Total Extra-Mural 74,175,867 74,172,825 3,041
Acute Care Facilities
Facility RHA Facilicorp TotalCentre hospitalier universitaire Dr-Georges-L.-Dumont221,439,944 11,374,754 232,814,698 Hôpital Stella-Maris- de-Kent 10,825,489 655,951 11,481,440
Hotel-Dieu Saint-Joseph de Saint-Quentin 8,513,703 379,147 8,892,850 Hôpital général de Grand-Sault 13,966,937 752,149 14,719,086 Hôpital régional d'Edmundston 97,689,522 5,755,009 103,444,531
Hôpital Régional de Campbellton 84,190,360 5,647,720 89,838,080
Hôpital de Lamèque 2,755,510 204,600 2,960,109 Hôpital de Tracadie -Sheila 30,381,090 1,682,351 32,063,441 Hôpital de l'Enfant-Jésus RHSJ 16,880,307 844,388 17,724,695 Hôpital régional Chaleur 121,169,120 5,948,669 127,117,789
Sackville Memorial Hospital 10,695,804 552,706 11,248,510 The Moncton Hospital 261,490,116 12,899,084 274,389,199
Charlotte County Hospital 15,910,644 1,070,623 16,981,267 Grand Manan Hospital 2,701,549 121,982 2,823,531 Saint John Regional Hospital 343,906,830 18,937,654 362,844,484 St. Joseph's Hospital 37,388,367 2,391,988 39,780,355 Sussex Health Centre 15,423,780 963,460 16,387,240
Dr. Everett Chalmers Regional Hospital 203,740,687 10,146,320 213,887,007 Hotel-Dieu of St. Joseph 12,396,200 597,952 12,994,152 Oromocto Public Hospital 18,562,255 1,009,127 19,571,381 Upper River Valley Hospital 41,881,430 1,914,087 43,795,517
Miramichi Regional Hospital 89,051,892 4,693,148 93,745,041
RRS A Zone 1 Sub-Total 244,296,139 12,030,705 232,265,434
RRS A Zone 4 Sub-Total 127,056,467 6,886,305 120,170,162
RRS A Zone 5 Sub-Total 89,838,080 5,647,720 84,190,360
RRS A Zone 6 Sub-Total 179,866,035 8,680,007 171,186,027 RRS A Sub-Total 641,056,721 33,244,738 607,811,983
RHA B Zone 1 Sub-Total 285,637,709 13,451,790 272,185,919
RHA B Zone 2 Sub-Total 438,816,878 23,485,707 415,331,170
RHA B Zone 3 Sub-Total 290,248,058 13,667,485 276,580,573
RHA B Zone 7 Sub-Total 93,745,041 4,693,148 89,051,892 RHA B Sub-Total 1,108,447,685 55,298,131 1,053,149,555 Total Hospitals
1,749,504,406 88,542,868 1,660,961,538
May 2015 Section I - page 4

2013/2014 Annual Report of Hospital Services Section I - Total Expenses and Revenues
Note 1: The facility type "Other Subservices" represents those facilities converted to CHCs that continue to provide subservices aligned with the regional facilities and Hospital Services (e.g. Lab, Diagnostic Imaging). Note 2: FacilicorpNB and corporate expenses for RRS A and RHA B are included in Section I reports. Note 3: Number of sites listed is based on RHA reporting structure to DH and not intended to be reflective of the total number of unique physical health care institutions.
Health CentresFacility RHA Facilicorp Total
Centre médical régional de Shédiac 706,438 41,502 747,940
Centre de santé de Ste-Anne 277,141 14,989 292,131
Centre de santé de Jacquet River 251,415 15,726 267,141
Centre de santé Chaleur 296,879 15,103 311,983 Centre de santé de Miscou 123,330 6,125 129,455 Centre de santé de Paquetville 198,505 9,379 207,885
Petitcodiac Health Centre 511,650 26,476 538,125 Port Elgin and Region Health Centre 277,412 16,406 293,818 Rexton Health Centre 483,336 25,955 509,292
Campobello Health Centre 430,137 23,495 453,633 Deer Island Health Centre 249,934 14,123 264,057 Fundy Health Centre - Blacks Harbour 1,529,932 93,812 1,623,744
Boiestown Health Centre 188,317 9,969 198,287 Chipman Health Centre 398,885 22,058 420,943 Fredericton Junction Health Centre 294,894 16,827 311,720 Harvey Health Centre 839,586 46,689 886,275 McAdam Health Centre 879,831 49,393 929,224 Nackawic Health Centre 424,913 11,251 436,164 Stanley Health Services Centre 464,553 23,617 488,170
Baie Ste. Anne Health Clinic 232,603 11,357 243,960 Blackville Health Clinic 239,749 12,497 252,246 Néguac Health Clinic 305,333 16,454 321,787 Rogersville Health Clinic 245,148 13,573 258,720
RRS A Zone 1 Sub-Total 747,940 706,438 41,502
RRS A Zone 4 Sub-Total 292,131 277,141 14,989
RRS A Zone 5 Sub-Total 267,141 251,415 15,726
RRS A Zone 6 Sub-Total 649,322 618,714 30,608
RRS A Sub-Total 1,956,533 1,853,708 102,825
RHA B Zone 1 Sub-Total 1,341,235 1,272,398 68,837
RHA B Zone 2 Sub-Total 2,341,434 2,210,004 131,430
RHA B Zone 3 Sub-Total 3,670,783 3,490,978 179,805
RHA B Zone 7 Sub-Total 1,076,713 1,022,833 53,880
RHA B Sub-Total 8,430,164 7,996,212 433,952 Total Health Centres 10,386,697 9,849,920 536,777
Public HealthFacility RHA Facilicorp Total
Bureau de la Santé publique de Moncton Beauséjour 4,905,779 0 4,905,779
Santé publique d'Edmundston 2,074,751 77 2,074,827
Santé publique de Campbellton 1,267,515 0 1,267,515
Santé publique de Bathurst 1,555,366 0 1,555,366 Santé publique de Caraquet 1,662,632 0 1,662,632
Saint John Public Health 4,528,114 0 4,528,114
Fredericton Public Health 3,575,039 0 3,575,039 Woodstock Public Health 1,112,348 0 1,112,348
Miramichi Public Health 1,746,401 0 1,746,401
RRS A Zone 1 Sub-Total 4,905,779 4,905,779 0
RRS A Zone 4 Sub-Total 2,074,827 2,074,751 77
RRS A Zone 5 Sub-Total 1,267,515 1,267,515 0
RRS A Zone 6 Sub-Total 3,217,998 3,217,998 0
RRS A Sub-Total 11,466,118 11,466,042 77
RHA B Zone 2 Sub-Total 4,528,114 4,528,114 0
RHA B Zone 3 Sub-Total 4,687,387 4,687,387 0
RHA B Zone 7 Sub-Total 1,746,401 1,746,401 0
RHA B Sub-Total 10,961,903 10,961,903 0 Total Community Public Health 22,428,022 22,427,945 77
Table I-1(b): Total Expenses by Facility - 2013/2014 - Page 2 of 4
Rehabilitation FacilitiesFacility RHA Facilicorp Total
Stan Cassidy Centre For Rehabilitation 11,161,292 589,945 11,751,237 RHA B Zone 3 Sub-Total 11,751,237 11,161,292 589,945 RHA B Sub-Total 11,751,237 11,161,292 589,945
Total Rehabilitation Facilities 11,751,237 11,161,292 589,945
Psychiatric FacilitiesFacility RHA Facilicorp Total
Centre Hospitalier Restigouche 24,153,101 1,864,239 26,017,340
Centracare 7,516,581 528,492 8,045,073
RRS A Zone 5 Sub-Total 26,017,340 24,153,101 1,864,239 RRS A Sub-Total 26,017,340 24,153,101 1,864,239
RHA B Zone 2 Sub-Total 8,045,073 7,516,581 528,492 RHA B Sub-Total 8,045,073 7,516,581 528,492
Total Psychiatric Facilities 34,062,414 31,669,683 2,392,731
May 2015 Section I - page 5
2013/2014 Annual Report of Hospital Services Section I - Total Expenses and Revenues
Note 1: The facility type "Other Subservices" represents those facilities converted to CHCs that continue to provide subservices aligned with the regional facilities and Hospital Services (e.g. Lab, Diagnostic Imaging). Note 2: FacilicorpNB and corporate expenses for RRS A and RHA B are included in Section I reports. Note 3: Number of sites listed is based on RHA reporting structure to DH and not intended to be reflective of the total number of unique physical health care institutions.
Community Mental HealthFacility RHA Facilicorp Total
Centre de santé mentale communautaire de Moncton Beauséjour 2,522,050 0 2,522,050 Centre de santé mentale communautaire de Richibucto 1,511,020 0 1,511,020
Centre de santé mentale communautaire d'Edmundston 2,528,850 0 2,528,850 Centre de santé mentale communautaire de Grand-Sault 1,864,083 0 1,864,083
Centre de santé mentale communautaire de Campbellton 3,781,889 0 3,781,889
Centre de santé mentale communautaire de Bathurst 2,653,418 0 2,653,418 Centre de santé mentale communautaire de Caraquet 3,554,806 0 3,554,806
RHA 1SE Community Mental Health Centre 4,662,601 0 4,662,601
Saint John Community Mental Health Centre 5,349,211 0 5,349,211 St. Stephen Community Mental Health Centre 2,008,806 0 2,008,806 Sussex Community Mental Health Centre 1,556,244 0 1,556,244
Fredericton Community Mental Health Centre 5,209,810 0 5,209,810 Woodstock Community Mental Health Centre 2,429,701 0 2,429,701
Miramichi Community Mental Health Centre 2,424,315 0 2,424,315
RRS A Zone 1 Sub-Total 4,033,070 4,033,070 0
RRS A Zone 4 Sub-Total 4,392,933 4,392,933 0
RRS A Zone 5 Sub-Total 3,781,889 3,781,889 0
RRS A Zone 6 Sub-Total 6,208,224 6,208,224 0
RRS A Sub-Total 18,416,116 18,416,116 0
RHA B Zone 1 Sub-Total 4,662,601 4,662,601 0
RHA B Zone 2 Sub-Total 8,914,261 8,914,261 0
RHA B Zone 3 Sub-Total 7,639,511 7,639,511 0
RHA B Zone 7 Sub-Total 2,424,315 2,424,315 0
RHA B Sub-Total 23,640,688 23,640,688 0
Total Community Mental Health 42,056,804 42,056,804 0
Community Health CentersFacility RHA Facilicorp Total
Centre de santé communautaire St-Joseph 2,279,740 93,068 2,372,808
Centre de santé communautaire de Lamèque 5,022,117 194,022 5,216,139 Centre de santé communautaire de St-Isidore 399,485 21,183 420,667
Albert County Health and Wellness Centre 1,437,594 54,563 1,492,156
MediSanté 571,945 20,497 592,441 St-Joseph's Community Health Centre 3,498,943 147,835 3,646,778
Central Miramichi Community Health Centre 1,008,576 58,742 1,067,318 Centre de santé Noreen-Richard Health Centre 574,330 18,655 592,984 Gibson Health Clinic 1,944,916 46,599 1,991,514 Oromocto Health Clinic 85,384 5,227 90,611 Queens North Community Health Centre 2,743,461 110,990 2,854,451 Tobique Valley Community Health Centre 1,958,534 105,070 2,063,604
RRS A Zone 5 Sub-Total 2,372,808 93,068 2,279,740
RRS A Zone 6 Sub-Total 5,636,807 215,205 5,421,601
RRS A Sub-Total 8,009,615 308,274 7,701,341
RHA B Zone 1 Sub-Total 1,492,156 54,563 1,437,594
RHA B Zone 2 Sub-Total 4,239,219 168,332 4,070,887
RHA B Zone 3 Sub-Total 8,660,483 345,284 8,315,199
RHA B Sub-Total 14,391,858 568,178 13,823,681
Total Community Health Centers 22,401,473 876,451 21,525,022
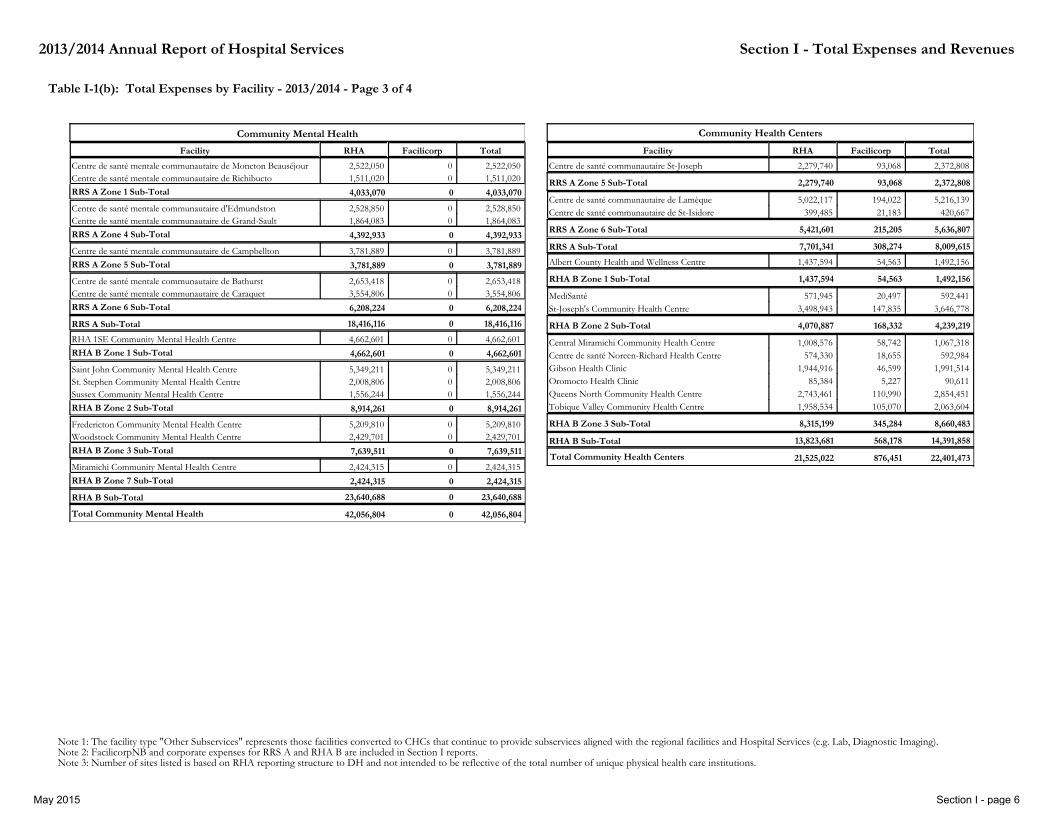
Table I-1(b): Total Expenses by Facility - 2013/2014 - Page 3 of 4
May 2015 Section I - page 6

2013/2014 Annual Report of Hospital Services Section I - Total Expenses and Revenues
Note 1: The facility type "Other Subservices" represents those facilities converted to CHCs that continue to provide subservices aligned with the regional facilities and Hospital Services (e.g. Lab, Diagnostic Imaging). Note 2: FacilicorpNB and corporate expenses for RRS A and RHA B are included in Section I reports. Note 3: Number of sites listed is based on RHA reporting structure to DH and not intended to be reflective of the total number of unique physical health care institutions.
Table I-1(b): Total Expenses by Facility - 2013/2014 - Page 4 of 4
CorporateFacility Total
Centre hospitalier universitaire Dr-Georges-L.-Dumont 1,495,082 Hôpital Stella-Maris- de-Kent 89,983 Hotel-Dieu Saint-Joseph de Saint-Quentin 114,319 Hôpital général de Grand-Sault 115,345 Hôpital régional d'Edmundston 1,214,485 Centre Hospitalier Restigouche 183,764 Dalhousie 94,268 Hôpital Régional de Campbellton 1,058,130 Centre de santé communautaire de Lamèque 795 Hôpital de Lamèque 580 Hôpital de Tracadie -Sheila 5,361 Hôpital de l'Enfant-Jésus RHSJ 148,589 Hôpital régional Chaleur 1,158,334
Albert County 172 Sackville Memorial Hospital 8,511 The Moncton Hospital 1,673,987 Centracare 6,354 Charlotte County Hospital 104,484 Fundy Health Centre - Blacks Harbour 77,757 Grand Manan Hospital 349 Saint John Regional Hospital 2,016,392 St-Joseph's Community Health Centre 136,969 St. Joseph's Hospital 136,400 Sussex Health Centre 28,780 Dr. Everett Chalmers Regional Hospital 1,494,353 Harvey Health Centre 149 Hotel-Dieu of St. Joseph 30,421 Minto 940 Oromocto Public Hospital 11,480 Stan Cassidy Centre For Rehabilitation 1,325 Tobique Valley 729 Tobique Valley Community Health Centre 535 Upper Miramichi Health Services Centre - Doaktown 180 Upper River Valley Hospital 66,226 Miramichi Regional Hospital 544,440
RRS A Sub-Total 5,679,035
RHA B Sub-Total 6,340,933
12,019,968 Total Corporate
Other SubservicesFacility RHA Facilicorp Total
Dalhousie 5,451,719 46,677 5,498,395
Albert County 54,361 0 54,361
Minto 333,781 0 333,781 Tobique Valley 240,718 0 240,718 Upper Miramichi Health Services Centre - Doaktown 64,223 1,231 65,453
RRS A Zone 5 Sub-Total 5,498,395 5,451,719 46,677 RRS A Sub-Total 5,498,395 5,451,719 46,677
RHA B Zone 1 Sub-Total 54,361 54,361 0
RHA B Zone 3 Sub-Total 639,952 638,722 1,231 RHA B Sub-Total 694,313 693,083 1,231
Total Others 6,192,709 6,144,801 47,908
May 2015 Section I - page 7

Section I - Total Expenses and Revenues2013/2014 Annual Report of Hospital Services
Table I-2: Total Expenses by Expense Account Type by Regional Health Authority - 2013/2014
RHA Zone
Expenses % of Total
SALARIES (including medical)
Expenses % of Total
BENEFIT CONTRIBUTIONS
Expenses % of Total
MEDICAL & SURGICAL SUPPLIES
Expenses % of Total
DRUGS
Expenses % of Total
OTHER SUPPLIES
RRS A Zone 1 159,230,789 63.2% 22,956,626 9.1% 17,480,239 6.9% 12,604,677 5.0% 16,238,546 6.4% RRS A Zone 4 90,301,241 67.0% 14,690,590 10.9% 5,940,992 4.4% 4,886,773 3.6% 7,905,236 5.9% RRS A Zone 5 86,585,645 69.4% 14,659,790 11.8% 3,805,334 3.1% 2,457,370 2.0% 8,593,891 6.9% RRS A Zone 6 126,768,038 64.8% 20,295,183 10.4% 8,930,758 4.6% 7,558,273 3.9% 14,584,357 7.5% RRS A Organisation 2,765,449 48.7% 414,079 7.3% 0 0.0% 0 0.0% 47,315 0.8%
RHA B Zone 1 184,611,782 63.8% 27,802,593 9.6% 22,596,247 7.8% 12,933,755 4.5% 14,234,903 4.9% RHA B Zone 2 300,891,567 65.7% 41,939,819 9.2% 39,453,586 8.6% 15,985,625 3.5% 24,176,287 5.3% RHA B Zone 3 216,395,301 66.2% 30,628,257 9.4% 15,824,493 4.8% 11,118,393 3.4% 21,551,708 6.6% RHA B Zone 7 67,288,530 68.1% 9,040,805 9.1% 4,615,246 4.7% 3,303,591 3.3% 4,937,413 5.0% RHA B Organization 3,669,358 57.9% 532,710 8.4% 0 0.0% 0 0.0% 96,875 1.5%
RRS A 65.4% 10.2% 5.1% 3.9% 6.6% 465,651,163 73,016,268 36,157,323 27,507,093 47,369,345
RHA B 65.5% 9.3% 7.0% 3.7% 5.5% 772,856,538 109,944,185 82,489,572 43,341,364 64,997,185
Facilicorp 47.4% 12.0% 0.0% 0.0% 5.0% 44,081,196 11,198,716 0 0 4,626,707
64.6% 9.8% 6.0% 3.6% 5.9% Total 1,282,588,897 194,159,168 118,646,894 70,848,457 116,993,237
RHA Zone
Expenses % of Total
EQUIPMENT EXPENSE
Expenses % of Total
REFERRED-OUT SERVICES
Expenses % of Total
SUNDRY
Expenses % of Total
BUILDINGS & GROUNDS EXPENSES
Expenses % of Total
Total
RRS A Zone 1 8,715,935 3.5% 3,962,883 1.6% 5,310,757 2.1% 5,388,047 2.1% 251,888,499 100.0% RRS A Zone 4 3,800,527 2.8% 1,165,505 0.9% 2,785,845 2.1% 3,201,359 2.4% 134,678,069 100.0% RRS A Zone 5 3,096,738 2.5% 418,374 0.3% 1,774,692 1.4% 3,312,510 2.7% 124,704,344 100.0% RRS A Zone 6 5,165,675 2.6% 3,583,616 1.8% 4,441,260 2.3% 4,254,931 2.2% 195,582,092 100.0% RRS A Organisation 23,542 0.4% 154,477 2.7% 2,272,777 40.0% 1,396 0.0% 5,679,035 100.0%
RHA B Zone 1 7,623,861 2.6% 7,472,245 2.6% 6,014,843 2.1% 5,957,351 2.1% 289,247,581 100.0% RHA B Zone 2 17,019,143 3.7% 1,394,774 0.3% 8,494,844 1.9% 8,629,645 1.9% 457,985,290 100.0% RHA B Zone 3 11,747,867 3.6% 4,978,231 1.5% 6,897,844 2.1% 7,912,557 2.4% 327,054,652 100.0% RHA B Zone 7 3,863,782 3.9% 850,989 0.9% 1,648,755 1.7% 3,280,193 3.3% 98,829,303 100.0% RHA B Organization 13,592 0.2% 74,132 1.2% 1,954,266 30.8% 0 0.0% 6,340,933 100.0%
RRS A 2.9% 1.3% 2.3% 2.3% 100.0% 20,802,417 9,284,855 16,585,330 16,158,243 712,532,039
RHA B 3.4% 1.3% 2.1% 2.2% 100.0% 40,268,245 14,770,371 25,010,553 25,779,747 1,179,457,759
Facilicorp 26.0% 0.5% 8.7% 0.4% 100.0% 24,162,446 436,279 8,134,778 349,676 92,989,798
4.3% 1.2% 2.5% 2.1% 100.0% Total 85,233,108 24,491,506 49,730,662 42,287,666 1,984,979,596
Note 1: Expenses excludes interdepartmental expenses. Note 2: FacilicorpNB and corporate expenses for RRS A and RHA B are included in Section I reports.
May 2015 Section I - page 8

Section I - Total Expenses and Revenues2013/2014 Annual Report of Hospital Services
Note 1: "Other Diagnostics and Therapeutics" include Radiation Oncology, ECG, Physiotherapy, Occupational Therapy, etc. Note 2: Education expenses include Formal Medical Education where it is provided. Note 3: Amortization is distributed across the functional centres except for other undistributed amounts which appear under "Other". Note 4: Expenses excludes interdepartmental expenses. Note 5: FacilicorpNB and corporate expenses for RRS A and RHA B are included in Section I reports. Note 6: Zone 2 Non-Inpatient Emergency Services includes Trauma Centre expenses ($803,646).
Table I-3(a): Total Expenses by Functional Area by Regional Health Authority - 2013/2014 - Page 1 of 2
Cc Group English DescFunctional Area
Expenses % of TotalRRS A Zone 1
Expenses % of TotalRRS A Zone 4
Expenses % of TotalRRS A Zone 5
Expenses % of TotalRRS A Zone 6
Expenses % of TotalRRS A Organization
ExpensesTotal
Régie régionale de la santé A
Administration & Support Administrative Support 7,769,463 2.9% 6,265,863 4.4% 9,369,975 7.1% 8,005,188 3.9% 5,650,439 99.5% 37,060,927 Clinical Support 5,635,393 2.1% 3,625,586 2.6% 2,389,707 1.8% 5,150,169 2.5% 0 0.0% 16,800,855 Hotel 8,650,213 3.3% 5,588,118 3.9% 6,504,435 4.9% 8,630,689 4.2% 0 0.0% 29,373,455 Plant 8,817,422 3.3% 5,614,159 4.0% 7,674,154 5.8% 11,631,346 5.7% 0 0.0% 33,737,082
Nursing Inpatient Nursing Admin & Medical Resources 5,968,137 2.3% 2,438,838 1.7% 2,575,849 1.9% 2,750,309 1.3% 0 0.0% 13,733,133 Acute Inpatient 26,500,277 10.0% 15,196,209 10.7% 10,057,495 7.6% 25,803,709 12.6% 0 0.0% 77,557,690 Maternal and Newborn 3,965,054 1.5% 4,000,483 2.8% 2,652,554 2.0% 4,864,999 2.4% 0 0.0% 15,483,090 Critical Care 5,711,422 2.2% 3,138,743 2.2% 2,775,611 2.1% 3,617,585 1.8% 0 0.0% 15,243,361 Operating Room/PARR/Day Surgery 12,947,911 4.9% 8,261,473 5.8% 5,156,556 3.9% 10,639,161 5.2% 0 0.0% 37,005,101 Mental Health 5,366,348 2.0% 3,177,913 2.2% 17,132,184 12.9% 4,400,599 2.2% 0 0.0% 30,077,044
Restorative Care Inpatient Rehabilitation 2,432,011 0.9% 0 0.0% 0 0.0% 0 0.0% 0 0.0% 2,432,011 Extended (Chronic) Care 4,532,326 1.7% 3,075,643 2.2% 4,440,497 3.4% 3,328,428 1.6% 0 0.0% 15,376,894
Non-Inpatient Services Emergency Services 14,466,825 5.5% 13,408,336 9.5% 7,379,074 5.6% 13,865,944 6.8% 0 0.0% 49,120,179 Ambulatory Care 30,654,321 11.6% 10,330,471 7.3% 5,556,873 4.2% 17,726,629 8.7% 0 0.0% 64,268,294 Extra-Mural Program 9,346,321 3.5% 7,443,175 5.3% 3,145,417 2.4% 8,812,364 4.3% 0 0.0% 28,747,277 Addiction 0 0.0% 1,622,740 1.1% 2,110,654 1.6% 1,967,740 1.0% 0 0.0% 5,701,134 Community Services 3,936,476 1.5% 937,251 0.7% 2,809,651 2.1% 4,440,183 2.2% 0 0.0% 12,123,560 Home Dialysis 158,921 0.1% 160,699 0.1% 0 0.0% 782,964 0.4% 0 0.0% 1,102,585
Diagnostic & Therapeutic Laboratory 17,797,612 6.7% 6,671,967 4.7% 5,400,253 4.1% 11,810,904 5.8% 21,304 0.4% 41,702,040 Diagnostic Imaging/Breast Screening 21,174,241 8.0% 8,602,402 6.1% 5,712,335 4.3% 13,753,340 6.7% 0 0.0% 49,242,318 Other Diagnostic and Therapeutic 26,836,084 10.2% 8,884,110 6.3% 10,032,811 7.6% 14,166,326 6.9% 7,291 0.1% 59,926,623
Public & Mental Health Public Health 4,905,779 1.9% 2,074,751 1.5% 1,267,515 1.0% 3,217,998 1.6% 0 0.0% 11,466,042 Community Mental Health 5,151,179 2.0% 4,392,933 3.1% 3,781,889 2.9% 6,500,521 3.2% 0 0.0% 19,826,522
Other Research and Education 6,737,308 2.6% 829,553 0.6% 613,443 0.5% 1,175,643 0.6% 0 0.0% 9,355,948 Undistributed Amortization 4,489,090 1.7% 2,892,033 2.0% 0 0.0% 2,436,024 1.2% 0 0.0% 9,817,146 Other Undistributed Expenses 7,938,364 3.0% 6,044,619 4.3% 6,165,413 4.7% 6,103,331 3.0% 0 0.0% 26,251,727
Facilicorp Administrative Support 9,054,256 3.4% 4,947,468 3.5% 5,897,815 4.5% 6,537,804 3.2% 0 0.0% 26,437,343 Revenue 0 0.0% 897 0.0% 35,750 0.0% 0 0.0% 0 0.0% 36,647 Clinical Support 1,795,276 0.7% 727,129 0.5% 570,877 0.4% 1,118,892 0.5% 0 0.0% 4,212,174 Hotel 1,222,725 0.5% 1,226,133 0.9% 1,162,987 0.9% 1,269,464 0.6% 0 0.0% 4,881,308
30,872,491 21,093,726 25,938,271 33,417,392 11.7% 14.9% 19.6% 16.3% Sub Total 5,650,439 99.5% 116,972,320
60,459,149 36,213,659 40,350,249 52,076,361 22.9% 25.6% 30.5% 25.5% Sub Total 0 0.0% 189,099,419
6,964,338 3,075,643 4,440,497 3,328,428 2.6% 2.2% 3.4% 1.6% Sub Total 0 0.0% 17,808,905
58,562,864 33,902,673 21,001,668 47,595,824 22.2% 23.9% 15.9% 23.3% Sub Total 0 0.0% 161,063,030
65,807,936 24,158,480 21,145,399 39,730,570 24.9% 17.1% 16.0% 19.4% Sub Total 28,595 0.5% 150,870,981
10,056,958 6,467,684 5,049,404 9,718,518 3.8% 4.6% 3.8% 4.8% Sub Total 0 0.0% 31,292,563
19,164,762 9,766,205 6,778,856 9,714,998 7.3% 6.9% 5.1% 4.8% Sub Total 0 0.0% 45,424,821
12,072,257 6,901,627 7,667,430 8,926,160 4.6% 4.9% 5.8% 4.4% Sub Total 0 0.0% 35,567,473
Total 263,960,756 141,579,696 132,371,774 204,508,251 100.0% 100.0% 100.0% 100.0% 5,679,035 100.0% 748,099,512
May 2015 Section I - page 9

Section I - Total Expenses and Revenues2013/2014 Annual Report of Hospital Services
Note 1: "Other Diagnostics and Therapeutics" include Radiation Oncology, ECG, Physiotherapy, Occupational Therapy, etc. Note 2: Education expenses include Formal Medical Education where it is provided. Note 3: Amortization is distributed across the functional centres except for other undistributed amounts which appear under "Other". Note 4: Expenses excludes interdepartmental expenses. Note 5: FacilicorpNB and corporate expenses for RRS A and RHA B are included in Section I reports. Note 6: Zone 2 Non-Inpatient Emergency Services includes Trauma Centre expenses ($803,646).
Table I-3(a): Total Expenses by Functional Area by Regional Health Authority - 2013/2014 - Page 2 of 2
Cc Group English DescFunctional Area
Expenses % of TotalRHA B Zone 1
Expenses % of TotalRHA B Zone 2
Expenses % of TotalRHA B Zone 3
Expenses % of TotalRHA B Zone 7
Expenses % of TotalRHA B Organization
ExpensesTotal
Regional Health Authority B
Expenses
Total
Administration & Support Administrative Support 9,043,823 3.0% 14,972,280 3.1% 12,684,345 3.7% 3,721,500 3.6% 5,275,398 83.2% 45,697,345 82,758,273 Clinical Support 5,139,098 1.7% 9,205,945 1.9% 6,287,142 1.8% 2,384,931 2.3% 192,445 3.0% 23,209,561 40,010,416 Hotel 8,987,271 3.0% 21,541,233 4.5% 14,880,661 4.4% 4,232,928 4.1% 0 0.0% 49,642,094 79,015,549 Plant 11,489,302 3.8% 20,371,120 4.2% 16,255,472 4.8% 3,953,076 3.8% 0 0.0% 52,068,971 85,806,053
Nursing Inpatient Nursing Admin & Medical Resources 7,468,257 2.5% 13,937,020 2.9% 8,755,847 2.6% 2,314,273 2.2% 0 0.0% 32,475,397 46,208,530 Acute Inpatient 47,437,481 15.7% 61,296,848 12.7% 42,769,913 12.5% 11,400,945 11.0% 0 0.0% 162,905,187 240,462,876 Maternal and Newborn 5,862,914 1.9% 7,515,287 1.6% 8,651,562 2.5% 3,683,187 3.6% 0 0.0% 25,712,949 41,196,039 Critical Care 13,700,279 4.5% 17,034,202 3.5% 13,363,550 3.9% 4,032,921 3.9% 0 0.0% 48,130,951 63,374,313 Operating Room/PARR/Day Surgery 19,613,757 6.5% 33,677,796 7.0% 21,699,558 6.3% 8,678,462 8.4% 0 0.0% 83,669,573 120,674,674 Mental Health 6,254,021 2.1% 11,949,019 2.5% 5,670,174 1.7% 2,472,131 2.4% 0 0.0% 26,345,345 56,422,389
Restorative Care Inpatient Rehabilitation 2,015,224 0.7% 1,909,841 0.4% 5,244,331 1.5% 1,961,224 1.9% 0 0.0% 11,130,619 13,562,630 Extended (Chronic) Care 4,015,264 1.3% 14,003,106 2.9% 4,504,042 1.3% 0 0.0% 0 0.0% 22,522,412 37,899,305
Non-Inpatient Services Emergency Services 15,268,277 5.0% 27,099,027 5.6% 23,621,082 6.9% 6,691,903 6.5% 0 0.0% 72,680,289 121,800,468 Ambulatory Care 32,160,717 10.6% 38,052,011 7.9% 21,483,999 6.3% 6,257,888 6.0% 0 0.0% 97,954,615 162,222,909 Extra-Mural Program 9,634,708 3.2% 15,414,272 3.2% 14,040,103 4.1% 4,481,539 4.3% 0 0.0% 43,570,622 72,317,900 Addiction 3,315,641 1.1% 5,172,862 1.1% 2,551,969 0.7% 2,154,418 2.1% 0 0.0% 13,194,890 18,896,024 Community Services 3,222,105 1.1% 4,565,058 0.9% 9,710,097 2.8% 1,285,876 1.2% 0 0.0% 18,783,136 30,906,696 Home Dialysis 0 0.0% 2,727,131 0.6% 0 0.0% 0 0.0% 0 0.0% 2,727,131 3,829,716
Diagnostic & Therapeutic Laboratory 17,715,157 5.9% 24,600,976 5.1% 20,227,563 5.9% 5,079,965 4.9% 120,162 1.9% 67,743,823 109,445,863 Diagnostic Imaging/Breast Screening 24,862,993 8.2% 31,501,356 6.5% 17,346,260 5.1% 6,415,330 6.2% 121,734 1.9% 80,247,673 129,489,991 Other Diagnostic and Therapeutic 19,658,180 6.5% 42,205,663 8.8% 25,569,465 7.5% 6,452,417 6.2% 403,515 6.4% 94,289,240 154,215,862
Public & Mental Health Public Health 0 0.0% 4,528,114 0.9% 4,687,387 1.4% 1,746,401 1.7% 0 0.0% 10,961,903 22,427,945 Community Mental Health 4,662,601 1.5% 8,914,261 1.8% 7,639,511 2.2% 2,424,315 2.3% 0 0.0% 23,640,688 43,467,209
Other Research and Education 4,246,012 1.4% 6,831,376 1.4% 3,342,805 1.0% 592,379 0.6% 227,680 3.6% 15,240,252 24,596,200 Undistributed Amortization 4,521,765 1.5% 4,482,542 0.9% 6,488,188 1.9% 2,600,268 2.5% 0 0.0% 18,092,762 27,909,908 Other Undistributed Expenses 8,952,737 3.0% 14,476,946 3.0% 9,579,624 2.8% 3,811,025 3.7% 0 0.0% 36,820,332 63,072,059
Facilicorp Administrative Support 10,052,626 3.3% 16,413,593 3.4% 11,729,037 3.4% 3,542,224 3.4% 0 0.0% 41,737,479 68,174,823 Revenue 0 0.0% 0 0.0% 0 0.0% 0 0.0% 0 0.0% 0 36,647 Clinical Support 1,349,533 0.4% 1,806,012 0.4% 798,450 0.2% 422,505 0.4% 0 0.0% 4,376,500 8,588,674 Hotel 2,173,031 0.7% 6,094,746 1.3% 2,258,269 0.7% 782,300 0.8% 0 0.0% 11,308,346 16,189,654
34,659,494 66,090,577 50,107,621 14,292,436 11.4% 13.7% 14.7% 13.8% Sub Total 5,467,843 86.2% 170,617,971 287,590,290
100,336,708 145,410,172 100,910,604 32,581,919 33.1% 30.1% 29.5% 31.5% Sub Total 0 0.0% 379,239,402 568,338,821
6,030,487 15,912,947 9,748,373 1,961,224 2.0% 3.3% 2.9% 1.9% Sub Total 0 0.0% 33,653,030 51,461,936
63,601,448 93,030,360 71,407,251 20,871,624 21.0% 19.3% 20.9% 20.2% Sub Total 0 0.0% 248,910,683 409,973,713
62,236,329 98,307,995 63,143,288 17,947,713 20.6% 20.4% 18.5% 17.3% Sub Total 645,411 10.2% 242,280,736 393,151,717
4,662,601 13,442,375 12,326,898 4,170,717 1.5% 2.8% 3.6% 4.0% Sub Total 0 0.0% 34,602,591 65,895,154
17,720,513 25,790,864 19,410,617 7,003,672 5.9% 5.3% 5.7% 6.8% Sub Total 227,680 3.6% 70,153,346 115,578,167
13,575,190 24,314,351 14,785,756 4,747,029 4.5% 5.0% 4.3% 4.6% Sub Total 0 0.0% 57,422,325 92,989,798
Total 302,822,770 482,299,641 341,840,407 103,576,332 100.0% 100.0% 100.0% 100.0% 6,340,933 100.0% 1,236,880,084 1,984,979,596
May 2015 Section I - page 10

Section I - Total Expenses and Revenues2013/2014 Annual Report of Hospital Services
Note 1: General Administration functional centres may include expenses related to specific clinical functions such as infection control as well risk management, utilization management, public relations, privacy officer, planning & development, quality assurance and internal audit.
Table I-3(b): Administration & Support Expenses by Functional Centre by Regional Health Authority - 2013/2014
Functional CentreRRS A Zone 1
RRS A Zone 4
RRS A Zone 5
RRS A Zone 6
RRS A Organization
TotalRégie régionale de la santé A
RHA B Zone 1
RHA B Zone 2
RHA B Zone 3
RHA B Zone 7
RHA B Organization
TotalRegional Health Authority B
FacilicorpFacilicorp Total
711100000 - General Administration 0 0 0 0 0 0 0 0 0 0 0 0 2,541,905 2,541,905 711101000 - Executive office 1,359,867 1,803,089 5,056,559 2,325,056 2,967,363 13,511,934 846,960 5,269,154 1,657,868 809,273 4,304,371 12,887,626 0 26,399,560 711102500 - Utilization Management 149,895 174,400 110,034 0 189,261 623,590 212,783 89,707 523,882 0 0 826,372 0 1,449,962 711103000 - Board of Trustees 0 0 0 0 237,069 237,069 0 0 239,627 0 0 239,627 0 476,697 711104000 - Public Relations 116,159 0 0 0 698,677 814,836 691,020 69,449 402,825 0 311,105 1,474,400 0 2,289,236 711105000 - Planning & Development 398,950 185,847 0 0 534,255 1,119,051 945,759 0 80,100 0 248,055 1,273,914 0 2,392,965 711105300 - Privacy Officer 66,647 0 0 0 0 66,647 0 0 123,815 0 0 123,815 0 190,461 711105500 - Risk Management 393,315 308,736 142,807 291,844 0 1,136,703 412,216 116,071 245,328 116,851 92,835 983,301 0 2,120,004 711105600 - Infection Control 160,326 200,028 204,041 282,346 0 846,741 278,934 1,167,695 361,292 120,971 0 1,928,893 0 2,775,634 711106000 - Quality Assurance 71,681 164,321 221,373 0 625,799 1,083,174 122,130 132,605 314,331 0 155,518 724,584 0 1,807,758 711150000 - Finance 1,393,250 966,947 929,171 1,285,781 202,289 4,777,438 1,258,153 1,901,256 1,697,821 604,760 0 5,461,990 669,687 10,909,115 711200000 - Personnel Services (Human Resources) 1,245,147 895,230 945,023 1,359,446 167,229 4,612,075 1,210,856 1,562,617 2,606,707 877,405 163,514 6,421,099 588,778 11,621,953 711250000 - Systems Support 3,193 20,117 69,496 14,956 0 107,763 41,607 288,374 0 0 0 329,981 50,302,058 50,739,803 711300000 - Communications 805,507 132,890 504,233 581,910 28,497 2,053,036 879,980 1,246,610 1,505,788 280,000 0 3,912,378 0 5,965,415 711350500 - Materials Management Administration 0 0 0 0 0 0 4,648 0 0 0 0 4,648 0 4,648 711351000 - Purchasing 48,547 0 155,952 0 0 204,499 0 23,324 0 0 0 23,324 5,145,179 5,373,002 711353000 - Stores (May Include Receiving and Shipping)
78,877 136,863 22,398 84,232 0 322,369 -27,389 0 0 -8,363 0 -35,752 7,019,006 7,305,624
711354000 - Reprocessing 1,367,505 1,239,486 969,305 1,682,408 0 5,258,704 2,040,720 2,504,838 2,144,239 806,337 0 7,496,133 0 12,754,838 711355000 - Printing 110,596 37,908 36,733 97,210 0 282,447 51,751 539,156 -213,316 114,265 0 491,855 516,810 1,291,113 711356000 - Distribution: Internal 0 0 0 0 0 0 73,695 0 907,375 0 0 981,070 0 981,070 711357000 - Distribution: External 0 0 2,848 0 0 2,848 0 61,422 86,664 0 0 148,086 638,556 789,491 711359000 - Materials Management Support 0 0 0 0 0 0 0 0 0 0 0 0 752,844 752,844
Administration & Support
Total 7,769,463 6,265,863 9,369,975 8,005,188 5,650,439 9,043,823 14,972,280 12,684,345 3,721,500 5,275,398 68,174,823 37,060,927 45,697,345 150,933,096
May 2015 Section I - page 11

Section I - Total Expenses and Revenues2013/2014 Annual Report of Hospital Services
Note 1: "Salaries" include worked and benefit salaries as well as purchased service salaries. Note 2: In 2011/12, contract agreements were signed for Nurses on February 26, 2013.
RHA zoneFiscal-4 Fiscal-3 Fiscal-2 Prev Fiscal Curr Fiscal % Change
SALARIES (Including Medical)
Fiscal-4 Fiscal-3 Fiscal-2 Prev Fiscal Curr Fiscal % Change
BENEFIT CONTRIBUTIONS
RRS A Zone 1 146,180,113 153,753,023 159,628,481 160,550,251 159,230,789 -0.8% 15,464,129 15,674,361 17,062,665 18,983,041 22,956,626 20.9% RRS A Zone 4 84,438,608 89,230,001 90,374,082 91,900,930 90,301,241 -1.7% 10,002,680 10,154,967 11,081,972 12,022,979 14,690,590 22.2% RRS A Zone 5 82,824,064 85,272,024 87,076,314 86,556,156 86,585,645 0.0% 10,719,457 10,887,000 11,233,340 11,729,848 14,659,790 25.0% RRS A Zone 6 121,064,075 127,342,052 129,941,870 130,868,395 126,768,038 -3.1% 13,914,500 14,779,142 15,594,993 17,437,666 20,295,183 16.4% RRS A Org 4,341,039 3,232,690 2,753,409 4,642,442 2,765,449 -40.4% 565,270 356,182 329,369 640,198 414,079 -35.3%
RHA B Zone 1 173,437,474 182,657,961 185,981,034 186,827,641 184,611,782 -1.2% 19,371,442 19,784,949 20,843,821 22,520,918 27,802,593 23.5% RHA B Zone 2 272,955,838 287,377,858 292,444,642 296,507,748 300,891,567 1.5% 31,923,193 33,011,693 33,915,587 37,399,946 41,939,819 12.1% RHA B Zone 3 208,015,220 219,780,456 223,524,382 220,789,814 216,395,301 -2.0% 23,046,121 23,928,247 24,350,824 26,158,896 30,628,257 17.1% RHA B Zone 7 64,856,510 65,967,648 67,683,189 67,388,880 67,288,530 -0.1% 6,742,881 7,244,467 7,357,889 7,682,362 9,040,805 17.7% RHA B Org 3,473,183 4,160,507 4,436,390 4,893,349 3,669,358 -25.0% 474,344 468,820 571,984 576,390 532,710 -7.6%
RRS A 20.1% -1.9% 438,847,898 50,666,036 469,774,157 55,302,339 458,829,789 51,851,653 474,518,174 60,813,731 465,651,163 73,016,268
RHA B 16.5% -0.5% 722,738,225 81,557,982 774,069,636 87,040,105 759,944,430 84,438,176 776,407,431 94,338,512 772,856,538 109,944,185 Facilicorp 52.9% -0.1% 22,708,696 3,505,505 37,941,011 6,118,360 36,706,607 5,709,958 44,134,437 7,325,684 44,081,196 11,198,716
Total 19.5% -1.0% 1,184,294,819 135,729,522 1,281,784,804 148,460,804 1,255,480,827 141,999,787 1,295,060,042 162,477,928 1,282,588,897 194,159,168
2013/142013/142012/132009/10 2010/11 2011/12 2009/10 2010/11 2011/12 2012/13
RHA zoneFiscal-4 Fiscal-3 Fiscal-2 Prev Fiscal Curr Fiscal % Change
MEDICAL & SURGICAL SUPPLIES
Fiscal-4 Fiscal-3 Fiscal-2 Prev Fiscal Curr Fiscal % Change
DRUGS
RRS A Zone 1 16,371,711 18,437,190 16,753,946 18,738,573 17,480,239 -6.7% 11,046,935 12,064,019 10,912,838 13,022,228 12,604,677 -3.2% RRS A Zone 4 5,353,517 5,772,593 5,958,381 6,164,707 5,940,992 -3.6% 4,812,415 4,911,158 5,296,113 4,998,488 4,886,773 -2.2% RRS A Zone 5 3,572,237 3,820,100 3,580,762 3,669,262 3,805,334 3.7% 2,428,902 2,623,900 2,664,324 2,583,033 2,457,370 -4.9% RRS A Zone 6 8,971,783 8,699,074 8,472,484 8,959,416 8,930,758 -0.3% 6,566,270 6,716,601 6,836,113 7,569,558 7,558,273 -0.1% RRS A Org 0 0 0 0 0 0.0% 0 0 0 0 0 0.0%
RHA B Zone 1 21,509,743 22,336,646 22,788,061 21,812,753 22,596,247 3.6% 11,537,879 11,741,211 12,009,759 11,693,161 12,933,755 10.6% RHA B Zone 2 35,847,815 37,325,645 37,694,483 38,485,374 39,453,586 2.5% 15,450,024 17,683,159 17,231,845 16,719,518 15,985,625 -4.4% RHA B Zone 3 15,312,308 15,932,534 15,314,602 15,651,163 15,824,493 1.1% 13,476,255 14,346,746 14,575,368 11,380,483 11,118,393 -2.3% RHA B Zone 7 4,574,706 4,461,532 4,521,010 4,839,114 4,615,246 -4.6% 3,009,198 3,173,312 3,341,371 3,172,248 3,303,591 4.1% RHA B Org 0 0 0 0 0 0.0% 0 0 0 0 0 0.0%
RRS A -3.7% 34,269,249 36,728,956 34,765,573 37,531,958 36,157,323 -2.4% 24,854,522 26,315,678 25,709,387 28,173,306 27,507,093
RHA B 2.1% 77,244,573 80,056,357 80,318,156 80,788,404 82,489,572 0.9% 43,473,356 46,944,429 47,158,344 42,965,411 43,341,364 Facilicorp 0.0% 0 0 0 0 0 0.0% 0 0 0 0 0 Total 0.3% 111,513,822 116,785,313 115,083,729 118,320,362 118,646,894 -0.4% 68,327,878 73,260,107 72,867,731 71,138,717 70,848,457
2010/11 2013/142012/132011/122009/102013/142012/132011/122010/112009/10
Table I-4: Trends in Total Expenses by Expense Account Type - 2009/2010 to 2013/2014 - Page 1 of 3
May 2015 Section I - page 12

Section I - Total Expenses and Revenues2013/2014 Annual Report of Hospital Services
Note 1: "Salaries" include worked and benefit salaries as well as purchased service salaries. Note 2: In 2011/12, contract agreements were signed for Nurses on February 26, 2013.
RHA zoneFiscal-4 Fiscal-3 Fiscal-2 Prev Fiscal Curr Fiscal % Change
OTHER SUPPLIES
Fiscal-4 Fiscal-3 Fiscal-2 Prev Fiscal Curr Fiscal % Change
EQUIPMENT EXPENSE
RRS A Zone 1 16,883,916 16,000,835 16,164,804 17,060,279 16,238,546 -4.8% 8,462,641 7,900,797 7,910,078 9,653,332 8,715,935 -9.7% RRS A Zone 4 7,541,790 8,503,748 7,989,363 7,867,172 7,905,236 0.5% 3,824,412 3,747,066 3,062,282 3,601,818 3,800,527 5.5% RRS A Zone 5 8,725,772 9,793,367 9,796,079 8,652,449 8,593,891 -0.7% 2,678,203 2,949,364 2,893,827 2,913,952 3,096,738 6.3% RRS A Zone 6 14,302,679 15,315,329 15,415,154 14,852,220 14,584,357 -1.8% 5,751,092 5,353,957 4,924,775 4,744,920 5,165,675 8.9% RRS A Org 51,982 60,970 57,060 102,016 47,315 -53.6% 26,046 17,300 23,861 32,724 23,542 -28.1%
RHA B Zone 1 15,030,503 16,336,805 15,219,138 14,660,988 14,234,903 -2.9% 9,697,924 7,870,263 7,815,243 8,376,602 7,623,861 -9.0% RHA B Zone 2 24,269,282 24,735,976 24,568,920 24,351,452 24,176,287 -0.7% 19,217,628 18,798,561 16,544,073 16,865,459 17,019,143 0.9% RHA B Zone 3 19,837,684 20,470,055 20,375,021 20,126,291 21,551,708 7.1% 14,047,316 14,526,087 12,438,702 12,349,522 11,747,867 -4.9% RHA B Zone 7 5,436,978 5,689,456 5,556,143 5,313,489 4,937,413 -7.1% 3,511,580 3,289,421 3,366,481 3,663,984 3,863,782 5.5% RHA B Org 118,820 97,141 66,918 68,338 96,875 41.8% 21,296 29,255 16,565 16,517 13,592 -17.7%
RRS A -2.4% 47,506,139 49,422,460 49,674,249 48,534,137 47,369,345 20,802,417 20,946,746 18,814,824 19,968,485 20,742,393 -0.7%
RHA B 0.7% 64,693,267 65,786,140 67,329,433 64,520,559 64,997,185 40,268,245 41,272,084 40,181,063 44,513,586 46,495,745 -2.4% Facilicorp 19.3% 684,022 2,474,157 2,675,386 3,879,783 4,626,707 24,162,446 22,780,101 18,050,926 16,773,875 16,164,716 6.1%
Total 0.1% 112,883,428 117,682,757 119,679,068 116,934,478 116,993,237 85,233,108 84,998,931 77,046,813 81,255,946 83,402,854 0.3%
2013/142013/142012/132009/10 2010/11 2011/12 2009/10 2010/11 2011/12 2012/13
Table I-4: Trends in Total Expenses by Expense Account Type - 2009/2010 to 2013/2014 - Page 2 of 3
RHA zoneFiscal-4 Fiscal-3 Fiscal-2 Prev Fiscal Curr Fiscal % Change
REFERRED-OUT SERVICES
Fiscal-4 Fiscal-3 Fiscal-2 Prev Fiscal Curr Fiscal % Change
SUNDRY
RRS A Zone 1 5,436,793 6,119,915 4,937,045 4,900,781 3,962,883 -19.1% 5,771,249 5,737,501 6,145,227 5,587,328 5,310,757 -4.9% RRS A Zone 4 1,168,513 1,226,712 1,146,452 1,037,717 1,165,505 12.3% 3,153,987 3,159,780 3,058,255 3,201,392 2,785,845 -13.0% RRS A Zone 5 316,838 191,338 388,877 564,276 418,374 -25.9% 2,189,396 2,281,027 2,054,900 1,777,055 1,774,692 -0.1% RRS A Zone 6 3,119,736 3,520,548 3,373,470 3,492,520 3,583,616 2.6% 5,949,739 5,736,917 5,370,931 5,376,435 4,441,260 -17.4% RRS A Org 292,675 38,208 18,823 58,931 154,477 162.1% 1,679,585 1,481,818 1,436,970 2,143,613 2,272,777 6.0%
RHA B Zone 1 8,438,684 7,951,823 9,023,703 8,297,801 7,472,245 -9.9% 6,326,099 6,478,516 6,265,128 6,935,218 6,014,843 -13.3% RHA B Zone 2 7,630,165 7,501,090 7,336,012 1,409,965 1,394,774 -1.1% 22,152,919 12,445,680 9,450,246 9,796,558 8,494,844 -13.3% RHA B Zone 3 5,278,500 4,964,247 5,499,999 5,241,354 4,978,231 -5.0% 7,241,595 8,079,916 7,547,545 6,980,502 6,897,844 -1.2% RHA B Zone 7 1,868,772 1,022,253 1,000,514 819,356 850,989 3.9% 2,558,945 2,166,277 1,978,665 1,838,639 1,648,755 -10.3% RHA B Org 39,107 32,591 12,988 21,040 74,132 252.3% 1,891,772 1,517,391 1,501,839 1,508,046 1,954,266 29.6%
RRS A -7.7% -8.3% 10,334,556 11,096,721 10,054,226 9,284,855 18,743,956 18,397,043 18,085,822 16,585,330 9,864,667 18,066,284
RHA B -6.5% -7.6% 23,255,227 21,472,003 15,789,515 14,770,371 40,171,330 30,687,779 27,058,963 25,010,553 22,873,216 26,743,423 Facilicorp 65.3% 18.7% 5,050,025 1,699,535 263,907 436,279 6,068,735 6,411,110 6,855,937 8,134,778 267,824 6,201,037 Total -6.2% -4.4% 38,639,807 34,268,260 33,005,707 26,107,647 24,491,506 64,984,022 55,495,932 51,010,744 52,000,723 49,730,662
2010/11 2013/142012/132011/122009/102013/142012/132011/122010/112009/10
May 2015 Section I - page 13

Section I - Total Expenses and Revenues2013/2014 Annual Report of Hospital Services
Note 1: "Salaries" include worked and benefit salaries as well as purchased service salaries. Note 2: In 2011/12, contract agreements were signed for Nurses on February 26, 2013.
RHA zoneFiscal-4 Fiscal-3 Fiscal-2 Prev Fiscal Curr Fiscal % Change
BUILDINGS & GROUNDS
RRS A Zone 1 5,545,892 5,869,571 4,801,533 5,588,507 5,388,047 -3.6% RRS A Zone 4 2,894,810 2,934,304 3,014,894 3,122,682 3,201,359 2.5% RRS A Zone 5 2,930,950 2,893,807 3,040,413 3,118,483 3,312,510 6.2% RRS A Zone 6 3,704,379 4,118,108 4,317,897 4,004,501 4,254,931 6.3% RRS A Org 456 1,143 1,291 1,757 1,396 -20.6%
RHA B Zone 1 6,550,880 4,772,574 4,558,593 4,695,390 5,957,351 26.9% RHA B Zone 2 6,575,540 7,270,300 8,507,546 8,347,304 8,629,645 3.4% RHA B Zone 3 7,138,284 7,153,009 7,579,886 7,833,510 7,912,557 1.0% RHA B Zone 7 2,907,584 2,885,481 2,881,757 2,836,532 3,280,193 15.6% RHA B Org 0 0 0 0 0 0.0%
RRS A 15,076,486 15,816,933 15,176,027 15,835,930 16,158,243 2.0%
RHA B 23,172,288 22,081,365 23,527,782 23,712,736 25,779,747 8.7% Facilicorp 96,071 916,985 315,475 294,278 349,676 18.8%
Total 38,344,845 38,815,283 39,019,285 39,842,944 42,287,666 6.1%
2013/142012/132009/10 2010/11 2011/12
Table I-4: Trends in Total Expenses by Expense Account Type - 2009/2010 to 2013/2014 - Page 3 of 3
RHA zoneFiscal-4 Fiscal-3 Fiscal-2 Prev Fiscal Curr Fiscal
Total % Change
RRS A Zone 1 231,163,378 241,557,211 244,316,618 254,084,319 251,888,499 -0.9% RRS A Zone 4 123,190,733 129,640,330 130,981,793 133,917,884 134,678,069 0.6% RRS A Zone 5 116,385,819 120,711,928 122,728,836 121,564,514 124,704,344 2.6% RRS A Zone 6 183,344,253 191,581,728 194,247,688 197,305,632 195,582,092 -0.9% RRS A Org 6,957,052 5,188,311 4,620,783 7,621,682 5,679,035 -25.5%
RHA B Zone 1 271,900,629 279,930,749 284,504,481 285,820,473 289,247,581 1.2% RHA B Zone 2 436,022,404 446,149,962 447,693,353 449,883,323 457,985,290 1.8% RHA B Zone 3 313,393,284 329,181,297 331,206,329 326,511,536 327,054,652 0.2% RHA B Zone 7 95,467,155 95,899,846 97,687,019 97,554,603 98,829,303 1.3% RHA B Org 6,018,522 6,305,705 6,606,683 7,083,680 6,340,933 -10.5%
RRS A -0.3% 661,041,235 688,679,509 696,895,718 714,494,030 712,532,039
RHA B 1.1% 1,122,801,993 1,157,467,559 1,167,697,866 1,166,853,615 1,179,457,759 Facilicorp 8.7% 54,277,770 70,893,456 71,368,790 85,534,127 92,989,798 Total 0.9% 1,838,120,998 1,917,040,523 1,935,962,373 1,966,881,771 1,984,979,596
2013/142012/132011/122010/112009/10
May 2015 Section I - page 14
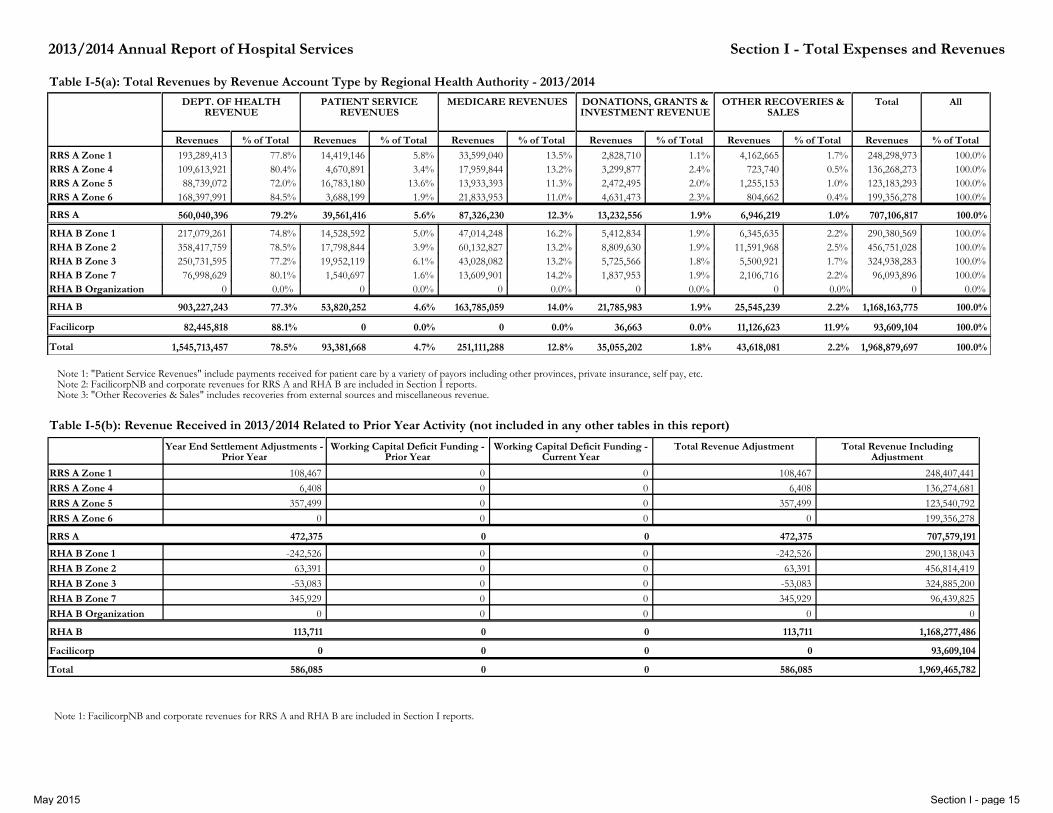
Section I - Total Expenses and Revenues2013/2014 Annual Report of Hospital Services
Revenues % of Total
DEPT. OF HEALTH REVENUE
Revenues % of Total
PATIENT SERVICE REVENUES
Revenues % of Total
MEDICARE REVENUES
Revenues % of Total
DONATIONS, GRANTS & INVESTMENT REVENUE
Revenues % of Total
OTHER RECOVERIES & SALES
Revenues
Total
% of Total
All
RRS A Zone 1 193,289,413 77.8% 14,419,146 5.8% 33,599,040 13.5% 2,828,710 1.1% 4,162,665 1.7% 248,298,973 100.0% RRS A Zone 4 109,613,921 80.4% 4,670,891 3.4% 17,959,844 13.2% 3,299,877 2.4% 723,740 0.5% 136,268,273 100.0% RRS A Zone 5 88,739,072 72.0% 16,783,180 13.6% 13,933,393 11.3% 2,472,495 2.0% 1,255,153 1.0% 123,183,293 100.0% RRS A Zone 6 168,397,991 84.5% 3,688,199 1.9% 21,833,953 11.0% 4,631,473 2.3% 804,662 0.4% 199,356,278 100.0%
RHA B Zone 1 217,079,261 74.8% 14,528,592 5.0% 47,014,248 16.2% 5,412,834 1.9% 6,345,635 2.2% 290,380,569 100.0% RHA B Zone 2 358,417,759 78.5% 17,798,844 3.9% 60,132,827 13.2% 8,809,630 1.9% 11,591,968 2.5% 456,751,028 100.0% RHA B Zone 3 250,731,595 77.2% 19,952,119 6.1% 43,028,082 13.2% 5,725,566 1.8% 5,500,921 1.7% 324,938,283 100.0% RHA B Zone 7 76,998,629 80.1% 1,540,697 1.6% 13,609,901 14.2% 1,837,953 1.9% 2,106,716 2.2% 96,093,896 100.0% RHA B Organization 0 0.0% 0 0.0% 0 0.0% 0 0.0% 0 0.0% 0 0.0%
RRS A 5.6% 12.3% 1.9% 1.0% 79.2% 100.0% 560,040,396 39,561,416 87,326,230 13,232,556 6,946,219 707,106,817
RHA B 4.6% 14.0% 1.9% 2.2% 77.3% 100.0% 903,227,243 53,820,252 163,785,059 21,785,983 25,545,239 1,168,163,775
Facilicorp 0.0% 0.0% 0.0% 11.9% 88.1% 100.0% 82,445,818 0 0 36,663 11,126,623 93,609,104
Total 4.7% 12.8% 1.8% 2.2% 100.0% 78.5% 1,545,713,457 93,381,668 251,111,288 35,055,202 43,618,081 1,968,879,697
Note 1: "Patient Service Revenues" include payments received for patient care by a variety of payors including other provinces, private insurance, self pay, etc. Note 2: FacilicorpNB and corporate revenues for RRS A and RHA B are included in Section I reports. Note 3: "Other Recoveries & Sales" includes recoveries from external sources and miscellaneous revenue.
Table I-5(a): Total Revenues by Revenue Account Type by Regional Health Authority - 2013/2014
RHA Zone Year End Settlement Adjustments - Prior Year
Working Capital Deficit Funding - Prior Year
Working Capital Deficit Funding - Current Year
Total Revenue Adjustment Total Revenue Including Adjustment
RRS A Zone 1 108,467 0 0 108,467 248,407,441 RRS A Zone 4 6,408 0 0 6,408 136,274,681 RRS A Zone 5 357,499 0 0 357,499 123,540,792 RRS A Zone 6 0 0 0 0 199,356,278
RHA B Zone 1 -242,526 0 0 -242,526 290,138,043 RHA B Zone 2 63,391 0 0 63,391 456,814,419 RHA B Zone 3 -53,083 0 0 -53,083 324,885,200 RHA B Zone 7 345,929 0 0 345,929 96,439,825 RHA B Organization 0 0 0 0 0
472,375 0 0 472,375 707,579,191 RRS A
113,711 0 0 113,711 1,168,277,486 RHA B
0 0 0 0 93,609,104 Facilicorp
586,085 0 0 586,085 1,969,465,782 Total
Table I-5(b): Revenue Received in 2013/2014 Related to Prior Year Activity (not included in any other tables in this report)
Note 1: FacilicorpNB and corporate revenues for RRS A and RHA B are included in Section I reports.
May 2015 Section I - page 15
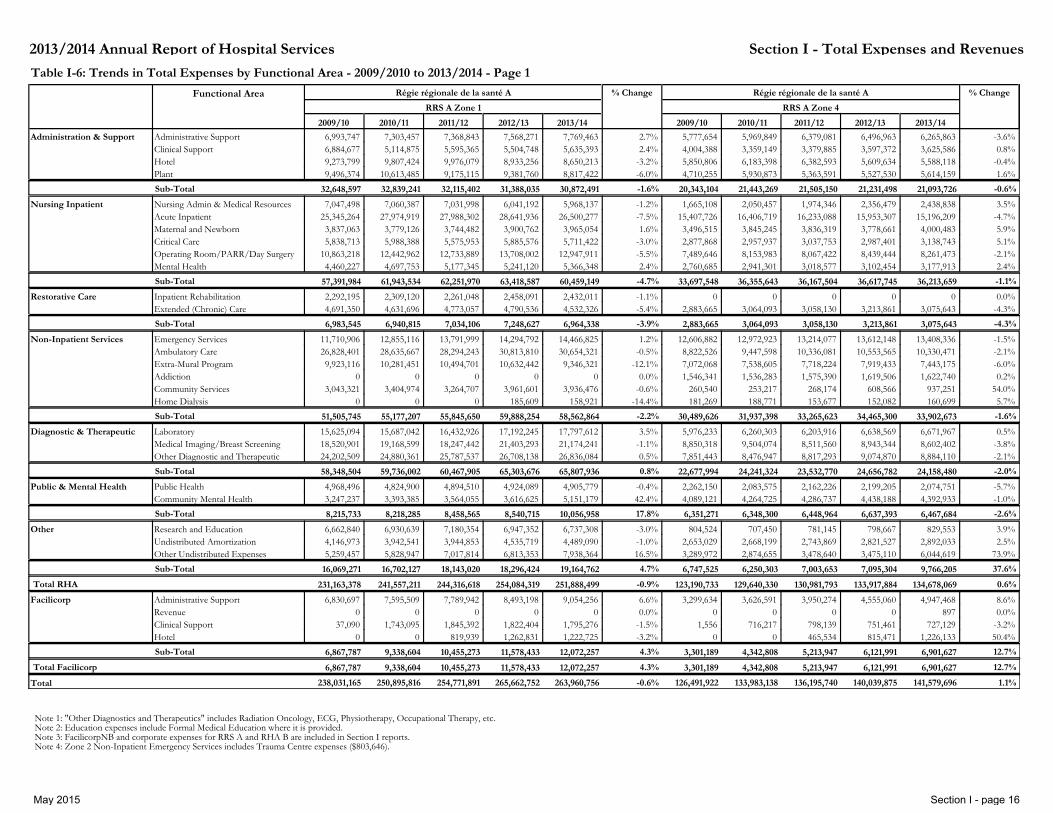
Section I - Total Expenses and Revenues2013/2014 Annual Report of Hospital Services
Cc Group English De Functional Area
Fiscal-4 ExpenseFiscal-3 ExpenseFiscal-2 ExpensePrev Fiscal ExpenseCurrent Fiscal ExpenseRRS A Zone 1
Régie régionale de la santé A % Change
Fiscal-4 ExpenseFiscal-3 ExpenseFiscal-2 ExpensePrev Fiscal ExpenseCurrent Fiscal ExpenseRRS A Zone 4
Régie régionale de la santé A % Change
Administration & Support Administrative Support 6,993,747 7,303,457 7,368,843 7,568,271 7,769,463 2.7% 5,777,654 5,969,849 6,379,081 6,496,963 6,265,863 -3.6% Clinical Support 6,884,677 5,114,875 5,595,365 5,504,748 5,635,393 2.4% 4,004,388 3,359,149 3,379,885 3,597,372 3,625,586 0.8% Hotel 9,273,799 9,807,424 9,976,079 8,933,256 8,650,213 -3.2% 5,850,806 6,183,398 6,382,593 5,609,634 5,588,118 -0.4% Plant 9,496,374 10,613,485 9,175,115 9,381,760 8,817,422 -6.0% 4,710,255 5,930,873 5,363,591 5,527,530 5,614,159 1.6%
Nursing Inpatient Nursing Admin & Medical Resources 7,047,498 7,060,387 7,031,998 6,041,192 5,968,137 -1.2% 1,665,108 2,050,457 1,974,346 2,356,479 2,438,838 3.5% Acute Inpatient 25,345,264 27,974,919 27,988,302 28,641,936 26,500,277 -7.5% 15,407,726 16,406,719 16,233,088 15,953,307 15,196,209 -4.7% Maternal and Newborn 3,837,063 3,779,126 3,744,482 3,900,762 3,965,054 1.6% 3,496,515 3,845,245 3,836,319 3,778,661 4,000,483 5.9% Critical Care 5,838,713 5,988,388 5,575,953 5,885,576 5,711,422 -3.0% 2,877,868 2,957,937 3,037,753 2,987,401 3,138,743 5.1% Operating Room/PARR/Day Surgery 10,863,218 12,442,962 12,733,889 13,708,002 12,947,911 -5.5% 7,489,646 8,153,983 8,067,422 8,439,444 8,261,473 -2.1% Mental Health 4,460,227 4,697,753 5,177,345 5,241,120 5,366,348 2.4% 2,760,685 2,941,301 3,018,577 3,102,454 3,177,913 2.4%
Restorative Care Inpatient Rehabilitation 2,292,195 2,309,120 2,261,048 2,458,091 2,432,011 -1.1% 0 0 0 0 0 0.0% Extended (Chronic) Care 4,691,350 4,631,696 4,773,057 4,790,536 4,532,326 -5.4% 2,883,665 3,064,093 3,058,130 3,213,861 3,075,643 -4.3%
Non-Inpatient Services Emergency Services 11,710,906 12,855,116 13,791,999 14,294,792 14,466,825 1.2% 12,606,882 12,972,923 13,214,077 13,612,148 13,408,336 -1.5% Ambulatory Care 26,828,401 28,635,667 28,294,243 30,813,810 30,654,321 -0.5% 8,822,526 9,447,598 10,336,081 10,553,565 10,330,471 -2.1% Extra-Mural Program 9,923,116 10,281,451 10,494,701 10,632,442 9,346,321 -12.1% 7,072,068 7,538,605 7,718,224 7,919,433 7,443,175 -6.0% Addiction 0 0 0 0 0 0.0% 1,546,341 1,536,283 1,575,390 1,619,506 1,622,740 0.2% Community Services 3,043,321 3,404,974 3,264,707 3,961,601 3,936,476 -0.6% 260,540 253,217 268,174 608,566 937,251 54.0% Home Dialysis 0 0 0 185,609 158,921 -14.4% 181,269 188,771 153,677 152,082 160,699 5.7%
Diagnostic & Therapeutic Laboratory 15,625,094 15,687,042 16,432,926 17,192,245 17,797,612 3.5% 5,976,233 6,260,303 6,203,916 6,638,569 6,671,967 0.5% Medical Imaging/Breast Screening 18,520,901 19,168,599 18,247,442 21,403,293 21,174,241 -1.1% 8,850,318 9,504,074 8,511,560 8,943,344 8,602,402 -3.8% Other Diagnostic and Therapeutic 24,202,509 24,880,361 25,787,537 26,708,138 26,836,084 0.5% 7,851,443 8,476,947 8,817,293 9,074,870 8,884,110 -2.1%
Public & Mental Health Public Health 4,968,496 4,824,900 4,894,510 4,924,089 4,905,779 -0.4% 2,262,150 2,083,575 2,162,226 2,199,205 2,074,751 -5.7% Community Mental Health 3,247,237 3,393,385 3,564,055 3,616,625 5,151,179 42.4% 4,089,121 4,264,725 4,286,737 4,438,188 4,392,933 -1.0%
Other Research and Education 6,662,840 6,930,639 7,180,354 6,947,352 6,737,308 -3.0% 804,524 707,450 781,145 798,667 829,553 3.9% Undistributed Amortization 4,146,973 3,942,541 3,944,853 4,535,719 4,489,090 -1.0% 2,653,029 2,668,199 2,743,869 2,821,527 2,892,033 2.5% Other Undistributed Expenses 5,259,457 5,828,947 7,017,814 6,813,353 7,938,364 16.5% 3,289,972 2,874,655 3,478,640 3,475,110 6,044,619 73.9%
Facilicorp Administrative Support 6,830,697 7,595,509 7,789,942 8,493,198 9,054,256 6.6% 3,299,634 3,626,591 3,950,274 4,555,060 4,947,468 8.6% Revenue 0 0 0 0 0 0.0% 0 0 0 0 897 0.0% Clinical Support 37,090 1,743,095 1,845,392 1,822,404 1,795,276 -1.5% 1,556 716,217 798,139 751,461 727,129 -3.2% Hotel 0 0 819,939 1,262,831 1,222,725 -3.2% 0 0 465,534 815,471 1,226,133 50.4%
-1.6% Sub-Total -0.6% 32,648,597 20,343,104 32,839,241 21,443,269 32,115,402 21,505,150 31,388,035 21,231,498 30,872,491 21,093,726
-4.7% Sub-Total -1.1% 57,391,984 33,697,548 61,943,534 36,355,643 62,251,970 36,167,504 63,418,587 36,617,745 60,459,149 36,213,659
-3.9% Sub-Total -4.3% 6,983,545 2,883,665 6,940,815 3,064,093 7,034,106 3,058,130 7,248,627 3,213,861 6,964,338 3,075,643
-2.2% Sub-Total -1.6% 51,505,745 30,489,626 55,177,207 31,937,398 55,845,650 33,265,623 59,888,254 34,465,300 58,562,864 33,902,673
0.8% Sub-Total -2.0% 58,348,504 22,677,994 59,736,002 24,241,324 60,467,905 23,532,770 65,303,676 24,656,782 65,807,936 24,158,480
17.8% Sub-Total -2.6% 8,215,733 6,351,271 8,218,285 6,348,300 8,458,565 6,448,964 8,540,715 6,637,393 10,056,958 6,467,684
4.7% Sub-Total 37.6% 16,069,271 6,747,525 16,702,127 6,250,303 18,143,020 7,003,653 18,296,424 7,095,304 19,164,762 9,766,205 231,163,378 123,190,733 241,557,211 129,640,330 244,316,618 130,981,793 254,084,319 133,917,884 251,888,499 134,678,069 Total RHA -0.9% 0.6%
4.3% Sub-Total 12.7% 6,867,787 3,301,189 9,338,604 4,342,808 10,455,273 5,213,947 11,578,433 6,121,991 12,072,257 6,901,627 6,867,787 3,301,189 9,338,604 4,342,808 10,455,273 5,213,947 11,578,433 6,121,991 12,072,257 6,901,627 Total Facilicorp 4.3% 12.7%
Total -0.6% 1.1% 238,031,165 126,491,922 250,895,816 133,983,138 254,771,891 136,195,740 265,662,752 140,039,875 263,960,756 141,579,696
2010/11 2011/12 2012/13 2013/14 2009/10 2012/13 2013/142010/11 2011/122009/10
Note 1: "Other Diagnostics and Therapeutics" includes Radiation Oncology, ECG, Physiotherapy, Occupational Therapy, etc. Note 2: Education expenses include Formal Medical Education where it is provided. Note 3: FacilicorpNB and corporate expenses for RRS A and RHA B are included in Section I reports. Note 4: Zone 2 Non-Inpatient Emergency Services includes Trauma Centre expenses ($803,646).
Table I-6: Trends in Total Expenses by Functional Area - 2009/2010 to 2013/2014 - Page 1
May 2015 Section I - page 16

Section I - Total Expenses and Revenues2013/2014 Annual Report of Hospital Services
Cc Group English De Functional Area
Fiscal-4 ExpenseFiscal-3 ExpenseFiscal-2 ExpensePrev Fiscal ExpenseCurrent Fiscal ExpenseRRS A Zone 5
Régie régionale de la santé A % Change
Fiscal-4 ExpenseFiscal-3 ExpenseFiscal-2 ExpensePrev Fiscal ExpenseCurrent Fiscal ExpenseRRS A Zone 6
Régie régionale de la santé A % Change
Administration & Support Administrative Support 6,944,482 9,625,839 10,097,927 9,627,879 9,369,975 -2.7% 8,410,321 10,609,448 11,519,910 8,112,551 8,005,188 -1.3% Clinical Support 2,718,991 2,341,381 2,388,391 2,401,833 2,389,707 -0.5% 5,800,295 5,012,364 5,137,613 5,223,480 5,150,169 -1.4% Hotel 7,665,120 8,127,592 8,290,231 6,781,611 6,504,435 -4.1% 9,204,588 9,772,414 9,813,153 8,730,379 8,630,689 -1.1% Plant 7,005,285 7,422,427 7,433,680 7,178,377 7,674,154 6.9% 10,027,064 11,616,257 11,448,039 11,848,670 11,631,346 -1.8%
Nursing Inpatient Nursing Admin & Medical Resources 3,037,450 3,002,534 2,982,679 2,785,480 2,575,849 -7.5% 2,018,703 2,340,266 2,765,846 3,032,573 2,750,309 -9.3% Acute Inpatient 9,320,182 10,130,972 10,033,824 10,361,489 10,057,495 -2.9% 25,054,209 26,816,024 26,137,626 26,717,032 25,803,709 -3.4% Maternal and Newborn 2,006,288 2,416,629 2,465,160 2,663,232 2,652,554 -0.4% 4,600,450 5,125,731 5,073,595 4,946,452 4,864,999 -1.6% Critical Care 1,906,498 3,220,251 2,554,909 2,569,009 2,775,611 8.0% 2,889,499 3,100,920 2,937,279 3,312,186 3,617,585 9.2% Operating Room/PARR/Day Surgery 5,445,407 4,376,491 4,457,074 4,712,104 5,156,556 9.4% 11,141,864 11,148,558 10,825,020 10,920,076 10,639,161 -2.6% Mental Health 18,291,666 18,223,220 18,705,753 17,608,888 17,132,184 -2.7% 3,870,539 4,238,374 4,223,066 4,318,955 4,400,599 1.9%
Restorative Care Inpatient Rehabilitation 0 0 0 0 0 0.0% 0 0 0 0 0 0.0% Extended (Chronic) Care 4,051,064 4,693,376 4,600,455 4,341,106 4,440,497 2.3% 4,111,991 3,762,353 3,429,805 3,467,982 3,328,428 -4.0%
Non-Inpatient Services Emergency Services 6,692,405 7,194,123 6,937,773 7,084,129 7,379,074 4.2% 12,627,608 11,735,896 11,730,657 13,949,871 13,865,944 -0.6% Ambulatory Care 4,464,814 5,438,277 5,905,192 5,590,490 5,556,873 -0.6% 12,652,209 13,386,562 17,077,997 17,508,866 17,726,629 1.2% Extra-Mural Program 3,132,257 3,039,518 3,130,775 3,196,119 3,145,417 -1.6% 9,101,219 9,329,210 9,775,842 9,664,035 8,812,364 -8.8% Addiction 1,928,635 1,985,215 2,037,733 1,953,266 2,110,654 8.1% 1,720,912 1,818,723 1,917,213 2,098,148 1,967,740 -6.2% Community Services 2,303,310 2,364,480 2,485,347 2,841,610 2,809,651 -1.1% 5,737,172 7,335,350 4,255,119 4,431,638 4,440,183 0.2% Home Dialysis 0 0 0 0 0 0.0% 526,731 503,766 491,357 660,178 782,964 18.6%
Diagnostic & Therapeutic Laboratory 4,909,930 5,157,657 5,093,013 5,434,649 5,400,253 -0.6% 10,376,570 10,795,272 11,402,987 11,560,814 11,810,904 2.2% Medical Imaging/Breast Screening 5,514,804 5,611,278 6,165,623 6,396,686 5,712,335 -10.7% 14,191,060 13,919,546 13,568,415 13,948,883 13,753,340 -1.4% Other Diagnostic and Therapeutic 8,140,330 8,441,851 8,745,097 9,337,009 10,032,811 7.5% 12,404,817 12,650,446 13,529,991 14,021,544 14,166,326 1.0%
Public & Mental Health Public Health 1,651,236 1,423,750 1,383,089 1,321,078 1,267,515 -4.1% 3,781,075 3,348,760 3,336,555 3,253,225 3,217,998 -1.1% Community Mental Health 3,246,305 3,430,305 3,599,725 3,667,884 3,781,889 3.1% 5,482,761 5,610,172 6,146,782 6,740,170 6,500,521 -3.6%
Other Research and Education 865,231 850,869 725,468 668,232 613,443 -8.2% 1,174,777 1,394,173 1,211,370 1,330,764 1,175,643 -11.7% Undistributed Amortization 2,836,142 0 0 0 0 0.0% 2,253,632 2,335,902 2,735,786 2,383,220 2,436,024 2.2% Other Undistributed Expenses 2,307,987 2,193,892 2,509,918 3,042,357 6,165,413 102.7% 4,184,191 3,875,239 3,756,664 5,123,941 6,103,331 19.1%
Facilicorp Administrative Support 3,459,559 3,570,659 3,543,152 4,566,244 5,897,815 29.2% 5,137,893 5,528,455 5,443,697 6,094,922 6,537,804 7.3% Revenue 0 0 0 0 35,750 0.0% 0 0 0 0 0 0.0% Clinical Support 1,591 506,732 612,084 542,810 570,877 5.2% 2,126 996,017 1,152,993 1,175,497 1,118,892 -4.8% Hotel 0 0 466,471 893,549 1,162,987 30.2% 0 0 675,993 1,290,703 1,269,464 -1.6%
Sub-Total -0.2% -1.5% 24,333,877 33,442,267 27,517,239 37,010,484 28,210,230 37,918,716 25,989,700 33,915,080 25,938,271 33,417,392
Sub-Total -0.9% -2.2% 40,007,491 49,575,263 41,370,097 52,769,872 41,199,399 51,962,432 40,700,201 53,247,273 40,350,249 52,076,361
Sub-Total 2.3% -4.0% 4,051,064 4,111,991 4,693,376 3,762,353 4,600,455 3,429,805 4,341,106 3,467,982 4,440,497 3,328,428
Sub-Total 1.6% -1.5% 18,521,421 42,365,850 20,021,612 44,109,508 20,496,820 45,248,185 20,665,612 48,312,736 21,001,668 47,595,824
Sub-Total -0.1% 0.5% 18,565,064 36,972,447 19,210,787 37,365,265 20,003,733 38,501,392 21,168,344 39,531,241 21,145,399 39,730,570
Sub-Total 1.2% -2.8% 4,897,541 9,263,836 4,854,055 8,958,932 4,982,814 9,483,337 4,988,962 9,993,395 5,049,404 9,718,518
Sub-Total 82.7% 9.9% 6,009,360 7,612,600 3,044,761 7,605,314 3,235,386 7,703,821 3,710,589 8,837,925 6,778,856 9,714,998 116,385,819 183,344,253 120,711,928 191,581,728 122,728,836 194,247,688 121,564,514 197,305,632 124,704,344 195,582,092 Total RHA -0.9% 2.6%
Sub-Total 27.7% 4.3% 3,461,149 5,140,018 4,077,391 6,524,472 4,621,707 7,272,683 6,002,603 8,561,121 7,667,430 8,926,160 3,461,149 5,140,018 4,077,391 6,524,472 4,621,707 7,272,683 6,002,603 8,561,121 7,667,430 8,926,160 Total Facilicorp 4.3% 27.7%
Total -0.7% 3.8% 119,846,968 188,484,272 124,789,319 198,106,201 127,350,543 201,520,370 127,567,117 205,866,753 132,371,774 204,508,251
2010/11 2011/12 2012/13 2013/14 2009/10 2012/13 2013/142010/11 2011/122009/10
Note 1: "Other Diagnostics and Therapeutics" includes Radiation Oncology, ECG, Physiotherapy, Occupational Therapy, etc. Note 2: Education expenses include Formal Medical Education where it is provided. Note 3: FacilicorpNB and corporate expenses for RRS A and RHA B are included in Section I reports. Note 4: Zone 2 Non-Inpatient Emergency Services includes Trauma Centre expenses ($803,646).
Table I-6: Trends in Total Expenses by Functional Area - 2009/2010 to 2013/2014 - Page 1b
May 2015 Section I - page 17
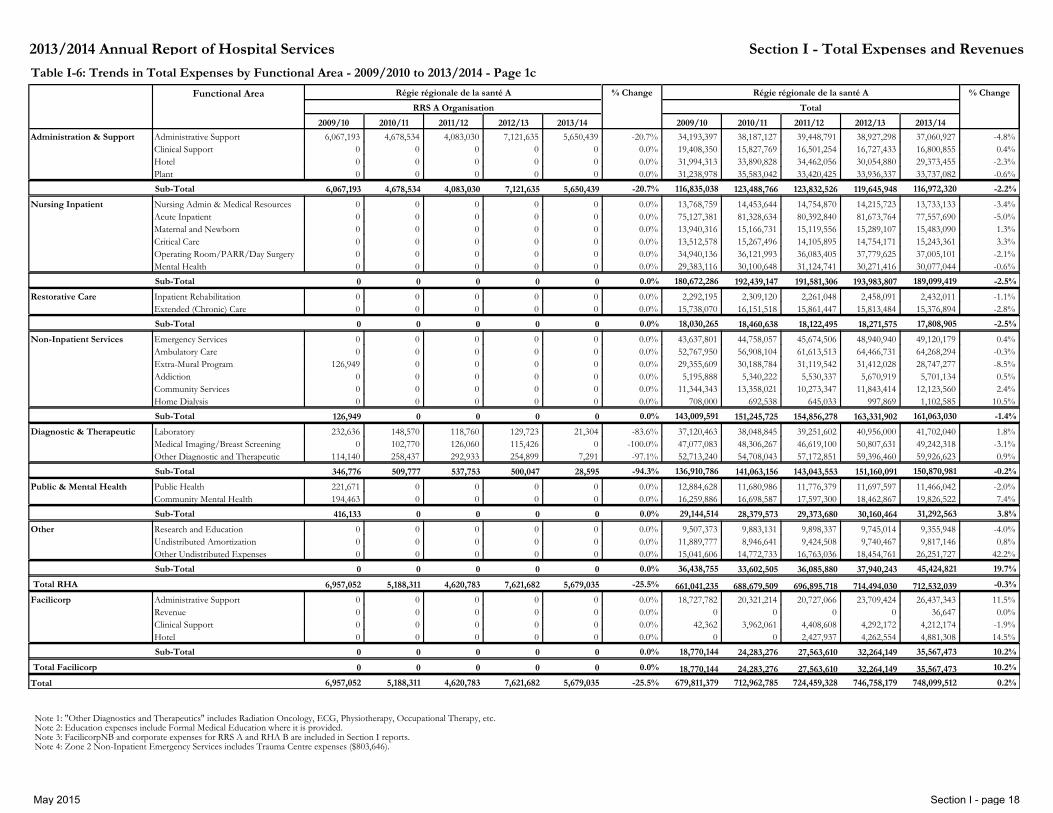
Section I - Total Expenses and Revenues2013/2014 Annual Report of Hospital Services
Cc Group English De Functional Area
Fiscal-4 ExpenseFiscal-3 ExpenseFiscal-2 ExpensePrev Fiscal ExpenseCurrent Fiscal ExpenseRRS A Organisation
Régie régionale de la santé A % Change
Fiscal-4 ExpenseFiscal-3 ExpenseFiscal-2 ExpensePrev Fiscal ExpenseCurrent Fiscal ExpenseTotal
Régie régionale de la santé A % Change
Administration & Support Administrative Support 6,067,193 4,678,534 4,083,030 7,121,635 5,650,439 -20.7% 34,193,397 38,187,127 39,448,791 38,927,298 37,060,927 -4.8% Clinical Support 0 0 0 0 0 0.0% 19,408,350 15,827,769 16,501,254 16,727,433 16,800,855 0.4% Hotel 0 0 0 0 0 0.0% 31,994,313 33,890,828 34,462,056 30,054,880 29,373,455 -2.3% Plant 0 0 0 0 0 0.0% 31,238,978 35,583,042 33,420,425 33,936,337 33,737,082 -0.6%
Nursing Inpatient Nursing Admin & Medical Resources 0 0 0 0 0 0.0% 13,768,759 14,453,644 14,754,870 14,215,723 13,733,133 -3.4% Acute Inpatient 0 0 0 0 0 0.0% 75,127,381 81,328,634 80,392,840 81,673,764 77,557,690 -5.0% Maternal and Newborn 0 0 0 0 0 0.0% 13,940,316 15,166,731 15,119,556 15,289,107 15,483,090 1.3% Critical Care 0 0 0 0 0 0.0% 13,512,578 15,267,496 14,105,895 14,754,171 15,243,361 3.3% Operating Room/PARR/Day Surgery 0 0 0 0 0 0.0% 34,940,136 36,121,993 36,083,405 37,779,625 37,005,101 -2.1% Mental Health 0 0 0 0 0 0.0% 29,383,116 30,100,648 31,124,741 30,271,416 30,077,044 -0.6%
Restorative Care Inpatient Rehabilitation 0 0 0 0 0 0.0% 2,292,195 2,309,120 2,261,048 2,458,091 2,432,011 -1.1% Extended (Chronic) Care 0 0 0 0 0 0.0% 15,738,070 16,151,518 15,861,447 15,813,484 15,376,894 -2.8%
Non-Inpatient Services Emergency Services 0 0 0 0 0 0.0% 43,637,801 44,758,057 45,674,506 48,940,940 49,120,179 0.4% Ambulatory Care 0 0 0 0 0 0.0% 52,767,950 56,908,104 61,613,513 64,466,731 64,268,294 -0.3% Extra-Mural Program 126,949 0 0 0 0 0.0% 29,355,609 30,188,784 31,119,542 31,412,028 28,747,277 -8.5% Addiction 0 0 0 0 0 0.0% 5,195,888 5,340,222 5,530,337 5,670,919 5,701,134 0.5% Community Services 0 0 0 0 0 0.0% 11,344,343 13,358,021 10,273,347 11,843,414 12,123,560 2.4% Home Dialysis 0 0 0 0 0 0.0% 708,000 692,538 645,033 997,869 1,102,585 10.5%
Diagnostic & Therapeutic Laboratory 232,636 148,570 118,760 129,723 21,304 -83.6% 37,120,463 38,048,845 39,251,602 40,956,000 41,702,040 1.8% Medical Imaging/Breast Screening 0 102,770 126,060 115,426 0 -100.0% 47,077,083 48,306,267 46,619,100 50,807,631 49,242,318 -3.1% Other Diagnostic and Therapeutic 114,140 258,437 292,933 254,899 7,291 -97.1% 52,713,240 54,708,043 57,172,851 59,396,460 59,926,623 0.9%
Public & Mental Health Public Health 221,671 0 0 0 0 0.0% 12,884,628 11,680,986 11,776,379 11,697,597 11,466,042 -2.0% Community Mental Health 194,463 0 0 0 0 0.0% 16,259,886 16,698,587 17,597,300 18,462,867 19,826,522 7.4%
Other Research and Education 0 0 0 0 0 0.0% 9,507,373 9,883,131 9,898,337 9,745,014 9,355,948 -4.0% Undistributed Amortization 0 0 0 0 0 0.0% 11,889,777 8,946,641 9,424,508 9,740,467 9,817,146 0.8% Other Undistributed Expenses 0 0 0 0 0 0.0% 15,041,606 14,772,733 16,763,036 18,454,761 26,251,727 42.2%
Facilicorp Administrative Support 0 0 0 0 0 0.0% 18,727,782 20,321,214 20,727,066 23,709,424 26,437,343 11.5% Revenue 0 0 0 0 0 0.0% 0 0 0 0 36,647 0.0% Clinical Support 0 0 0 0 0 0.0% 42,362 3,962,061 4,408,608 4,292,172 4,212,174 -1.9% Hotel 0 0 0 0 0 0.0% 0 0 2,427,937 4,262,554 4,881,308 14.5%
Sub-Total -2.2% -20.7% 6,067,193 4,678,534 4,083,030 7,121,635 5,650,439 116,835,038 123,488,766 123,832,526 116,972,320 119,645,948
Sub-Total -2.5% 0.0% 0 0 0 0 0 180,672,286 192,439,147 191,581,306 189,099,419 193,983,807
Sub-Total -2.5% 0.0% 0 0 0 0 0 18,030,265 18,460,638 18,122,495 17,808,905 18,271,575
Sub-Total -1.4% 0.0% 126,949 0 0 0 0 143,009,591 151,245,725 154,856,278 161,063,030 163,331,902
Sub-Total -0.2% -94.3% 346,776 509,777 537,753 500,047 28,595 136,910,786 141,063,156 143,043,553 150,870,981 151,160,091
Sub-Total 3.8% 0.0% 416,133 0 0 0 0 29,144,514 28,379,573 29,373,680 31,292,563 30,160,464
Sub-Total 19.7% 0.0% 0 0 0 0 0 36,438,755 33,602,505 36,085,880 45,424,821 37,940,243 6,957,052 5,188,311 4,620,783 7,621,682 5,679,035 Total RHA -25.5% -0.3% 661,041,235 688,679,509 696,895,718 712,532,039 714,494,030
Sub-Total 10.2% 0.0% 0 0 0 0 0 18,770,144 24,283,276 27,563,610 35,567,473 32,264,149 0 0 0 0 0 Total Facilicorp 0.0% 10.2% 18,770,144 24,283,276 27,563,610 35,567,473 32,264,149
Total 0.2% -25.5% 6,957,052 5,188,311 4,620,783 7,621,682 5,679,035 679,811,379 712,962,785 724,459,328 748,099,512 746,758,179
2010/11 2011/12 2012/13 2013/14 2009/10 2012/13 2013/142010/11 2011/122009/10
Note 1: "Other Diagnostics and Therapeutics" includes Radiation Oncology, ECG, Physiotherapy, Occupational Therapy, etc. Note 2: Education expenses include Formal Medical Education where it is provided. Note 3: FacilicorpNB and corporate expenses for RRS A and RHA B are included in Section I reports. Note 4: Zone 2 Non-Inpatient Emergency Services includes Trauma Centre expenses ($803,646).
Table I-6: Trends in Total Expenses by Functional Area - 2009/2010 to 2013/2014 - Page 1c
May 2015 Section I - page 18

Section I - Total Expenses and Revenues2013/2014 Annual Report of Hospital Services
Cc Group English De Functional Area
Fiscal-4 ExpenseFiscal-3 ExpenseFiscal-2 ExpensePrev Fiscal ExpenseCurrent Fiscal ExpenseRHA B Zone 1
Regional Health Authority B % Change
Fiscal-4 ExpenseFiscal-3 ExpenseFiscal-2 ExpensePrev Fiscal ExpenseCurrent Fiscal ExpenseRHA B Zone 2
Regional Health Authority B % Change
Administration & Support Administrative Support 11,154,943 11,158,544 10,646,671 10,164,355 9,043,823 -11.0% 15,347,378 15,699,873 14,231,744 14,296,947 14,972,280 4.7% Clinical Support 5,941,382 5,053,215 5,247,988 5,241,173 5,139,098 -1.9% 9,701,224 8,904,195 8,819,002 9,075,393 9,205,945 1.4% Hotel 9,779,963 10,284,077 10,444,348 9,122,481 8,987,271 -1.5% 26,320,792 27,407,408 27,579,600 21,898,942 21,541,233 -1.6% Plant 11,570,766 11,826,366 11,829,897 11,168,196 11,489,302 2.9% 19,987,232 21,299,342 20,478,978 19,492,641 20,371,120 4.5%
Nursing Inpatient Nursing Admin & Medical Resources 6,884,097 7,165,988 6,710,659 6,639,251 7,468,257 12.5% 14,872,746 16,341,262 12,753,648 13,091,028 13,937,020 6.5% Acute Inpatient 43,733,896 46,759,903 46,575,342 47,262,292 47,437,481 0.4% 55,719,213 59,263,192 58,491,083 60,339,122 61,296,848 1.6% Maternal and Newborn 5,262,587 5,850,334 5,797,138 5,622,689 5,862,914 4.3% 6,622,842 7,195,149 7,646,039 7,504,617 7,515,287 0.1% Critical Care 13,288,580 13,934,847 13,733,540 13,950,142 13,700,279 -1.8% 16,321,577 16,946,641 16,733,977 17,670,680 17,034,202 -3.6% Operating Room/PARR/Day Surgery 19,835,767 19,896,227 20,563,821 20,179,633 19,613,757 -2.8% 27,864,916 28,789,186 30,106,013 30,271,997 33,677,796 11.3% Mental Health 5,550,961 5,674,595 5,903,648 6,074,437 6,254,021 3.0% 11,102,999 10,823,242 11,708,039 11,752,097 11,949,019 1.7%
Restorative Care Inpatient Rehabilitation 1,877,083 1,787,438 1,944,776 2,015,826 2,015,224 -0.0% 0 1,639,649 1,623,296 1,748,162 1,909,841 9.2% Extended (Chronic) Care 3,383,943 3,753,160 3,778,394 4,111,788 4,015,264 -2.3% 13,104,305 13,200,013 13,614,468 13,395,437 14,003,106 4.5%
Non-Inpatient Services Emergency Services 13,759,334 14,255,845 15,281,723 15,305,943 15,268,277 -0.2% 22,730,817 24,313,336 26,462,016 26,877,532 27,099,027 0.8% Ambulatory Care 27,394,952 30,985,131 31,977,978 30,974,634 32,160,717 3.8% 27,737,213 31,775,011 38,282,004 38,114,188 38,052,011 -0.2% Extra-Mural Program 9,056,666 9,259,337 9,691,555 9,649,315 9,634,708 -0.2% 15,653,246 15,907,063 16,149,937 16,170,561 15,414,272 -4.7% Addiction 2,850,184 3,005,575 2,953,071 3,254,339 3,315,641 1.9% 4,775,255 4,781,144 4,991,481 4,986,213 5,172,862 3.7% Community Services 1,578,512 1,605,412 1,546,338 3,327,335 3,222,105 -3.2% 3,286,559 3,460,034 3,594,899 5,017,783 4,565,058 -9.0% Home Dialysis 0 0 0 0 0 0.0% 2,822,713 2,610,279 2,769,447 2,709,702 2,727,131 0.6%
Diagnostic & Therapeutic Laboratory 15,480,627 16,693,085 17,545,351 18,138,513 17,715,157 -2.3% 22,017,919 23,569,632 24,097,078 24,546,790 24,600,976 0.2% Medical Imaging/Breast Screening 25,784,841 24,875,538 25,669,373 24,259,400 24,862,993 2.5% 38,307,512 39,937,269 32,027,608 31,341,121 31,501,356 0.5% Other Diagnostic and Therapeutic 17,743,446 18,202,980 18,097,016 18,943,940 19,658,180 3.8% 35,552,649 38,435,925 39,622,136 40,877,370 42,205,663 3.2%
Public & Mental Health Public Health 1,061,412 0 0 0 0 0.0% 5,559,788 4,528,062 4,542,652 4,599,829 4,528,114 -1.6% Community Mental Health 4,044,530 4,401,034 4,693,277 4,899,677 4,662,601 -4.8% 8,441,836 8,446,635 8,664,493 8,609,286 8,914,261 3.5%
Other Research and Education 3,380,762 3,797,612 3,966,561 4,061,317 4,246,012 4.5% 5,856,025 6,053,942 6,560,984 6,779,976 6,831,376 0.8% Undistributed Amortization 6,121,657 4,213,887 4,300,510 4,397,414 4,521,765 2.8% 0 0 3,938,858 4,824,882 4,482,542 -7.1% Other Undistributed Expenses 5,379,738 5,490,620 5,605,508 7,056,385 8,952,737 26.9% 26,315,650 14,822,480 12,203,873 13,891,027 14,476,946 4.2%
Facilicorp Administrative Support 8,930,230 8,858,351 9,476,263 9,998,585 10,052,626 0.5% 15,697,266 15,230,254 14,203,597 15,897,282 16,413,593 3.2% Revenue 0 0 0 0 0 0.0% 0 0 0 0 0 0.0% Clinical Support 3,267 1,126,333 1,068,476 1,057,586 1,349,533 27.6% 5,275 1,442,569 1,798,993 1,765,826 1,806,012 2.3% Hotel 0 0 961,689 1,392,011 2,173,031 56.1% 0 6,867,594 1,547,292 5,415,376 6,094,746 12.5%
Sub-Total -2.9% 2.0% 38,447,055 71,356,625 38,322,202 73,310,818 38,168,904 71,109,324 35,696,204 64,763,923 34,659,494 66,090,577
Sub-Total 0.6% 3.4% 94,555,889 132,504,293 99,281,893 139,358,672 99,284,148 137,438,799 99,728,444 140,629,542 100,336,708 145,410,172
Sub-Total -1.6% 5.1% 5,261,026 13,104,305 5,540,598 14,839,661 5,723,170 15,237,764 6,127,614 15,143,599 6,030,487 15,912,947
Sub-Total 1.7% -0.9% 54,639,647 77,005,803 59,111,301 82,846,866 61,450,664 92,249,784 62,511,565 93,875,979 63,601,448 93,030,360
Sub-Total 1.5% 1.6% 59,008,914 95,878,080 59,771,603 101,942,826 61,311,740 95,746,822 61,341,853 96,765,281 62,236,329 98,307,995
Sub-Total -4.8% 1.8% 5,105,942 14,001,624 4,401,034 12,974,696 4,693,277 13,207,144 4,899,677 13,209,115 4,662,601 13,442,375
Sub-Total 14.2% 1.2% 14,882,157 32,171,675 13,502,118 20,876,422 13,872,578 22,703,715 15,515,117 25,495,885 17,720,513 25,790,864 271,900,629 436,022,404 279,930,749 446,149,962 284,504,481 447,693,353 285,820,473 449,883,323 289,247,581 457,985,290 Total RHA 1.2% 1.8%
Sub-Total 9.1% 5.4% 8,933,497 15,702,541 9,984,684 23,540,417 11,506,428 17,549,882 12,448,182 23,078,484 13,575,190 24,314,351 8,933,497 15,702,541 9,984,684 23,540,417 11,506,428 17,549,882 12,448,182 23,078,484 13,575,190 24,314,351 Total Facilicorp 9.1% 5.4%
Total 1.5% 2.0% 280,834,126 451,724,945 289,915,433 469,690,379 296,010,909 465,243,235 298,268,655 472,961,807 302,822,770 482,299,641
2010/11 2011/12 2012/13 2013/14 2009/10 2012/13 2013/142010/11 2011/122009/10
Note 1: "Other Diagnostics and Therapeutics" includes Radiation Oncology, ECG, Physiotherapy, Occupational Therapy, etc. Note 2: Education expenses include Formal Medical Education where it is provided. Note 3: FacilicorpNB and corporate expenses for RRS A and RHA B are included in Section I reports. Note 4: Zone 2 Non-Inpatient Emergency Services includes Trauma Centre expenses ($803,646).
Table I-6: Trends in Total Expenses by Functional Area - 2009/2010 to 2013/2014 - Page 1d
May 2015 Section I - page 19

Section I - Total Expenses and Revenues2013/2014 Annual Report of Hospital Services
Cc Group English De Functional Area
Fiscal-4 ExpenseFiscal-3 ExpenseFiscal-2 ExpensePrev Fiscal ExpenseCurrent Fiscal ExpenseRHA B Zone 3
Regional Health Authority B % Change
Fiscal-4 ExpenseFiscal-3 ExpenseFiscal-2 ExpensePrev Fiscal ExpenseCurrent Fiscal ExpenseRHA B Zone 7
Regional Health Authority B % Change
Administration & Support Administrative Support 16,461,141 16,985,685 17,344,404 15,863,156 12,684,345 -20.0% 3,226,062 3,667,096 3,789,170 3,787,005 3,721,500 -1.7% Clinical Support 6,582,845 5,593,100 5,327,703 6,031,486 6,287,142 4.2% 2,618,063 2,358,524 2,295,356 2,357,871 2,384,931 1.1% Hotel 16,771,124 16,826,763 16,895,555 14,550,288 14,880,661 2.3% 4,558,988 4,639,071 4,791,002 4,315,545 4,232,928 -1.9% Plant 13,124,929 13,195,028 13,013,397 14,175,365 16,255,472 14.7% 3,877,990 4,072,239 3,892,761 3,593,346 3,953,076 10.0%
Nursing Inpatient Nursing Admin & Medical Resources 4,505,931 6,111,684 6,255,758 5,892,629 8,755,847 48.6% 3,154,539 3,105,033 2,548,653 2,492,328 2,314,273 -7.1% Acute Inpatient 41,307,092 44,531,541 43,877,955 44,010,780 42,769,913 -2.8% 10,912,706 11,173,934 11,577,346 11,363,488 11,400,945 0.3% Maternal and Newborn 7,895,579 8,319,341 8,493,973 8,606,740 8,651,562 0.5% 3,429,969 3,360,237 3,508,183 3,497,441 3,683,187 5.3% Critical Care 11,044,819 13,323,130 13,255,564 13,219,236 13,363,550 1.1% 3,785,845 4,001,741 4,235,362 3,999,153 4,032,921 0.8% Operating Room/PARR/Day Surgery 22,068,970 22,946,617 22,976,067 22,960,672 21,699,558 -5.5% 8,251,237 8,097,150 8,421,084 9,080,340 8,678,462 -4.4% Mental Health 5,324,841 5,240,877 5,397,263 5,438,989 5,670,174 4.3% 2,679,324 2,792,025 2,766,658 2,586,723 2,472,131 -4.4%
Restorative Care Inpatient Rehabilitation 4,561,866 5,152,596 5,097,396 5,260,364 5,244,331 -0.3% 0 0 0 0 1,961,224 0.0% Extended (Chronic) Care 4,860,372 5,081,519 5,052,427 4,785,332 4,504,042 -5.9% 2,071,623 2,295,434 2,147,293 2,030,577 0 -100.0%
Non-Inpatient Services Emergency Services 20,692,703 21,406,890 22,562,748 22,902,265 23,621,082 3.1% 6,207,823 6,320,359 6,618,750 6,577,223 6,691,903 1.7% Ambulatory Care 20,293,068 22,624,874 23,581,514 21,145,954 21,483,999 1.6% 6,241,300 6,713,771 7,376,456 6,087,232 6,257,888 2.8% Extra-Mural Program 13,656,576 14,597,819 15,041,406 14,841,107 14,040,103 -5.4% 4,740,227 4,444,537 4,743,707 4,682,644 4,481,539 -4.3% Addiction 1,665,181 2,586,386 2,464,258 2,494,823 2,551,969 2.3% 2,102,932 2,043,388 2,088,949 2,136,060 2,154,418 0.9% Community Services 6,967,920 7,637,665 7,860,657 10,126,685 9,710,097 -4.1% 208,259 214,763 201,436 1,383,285 1,285,876 -7.0% Home Dialysis 0 0 0 0 0 0.0% 0 0 0 0 0 0.0%
Diagnostic & Therapeutic Laboratory 17,716,222 18,596,877 19,174,890 19,543,844 20,227,563 3.5% 5,071,543 4,688,438 4,951,849 5,042,082 5,079,965 0.8% Medical Imaging/Breast Screening 20,731,282 21,479,088 20,574,981 20,945,274 17,346,260 -17.2% 6,129,179 5,816,963 5,984,926 6,149,390 6,415,330 4.3% Other Diagnostic and Therapeutic 25,232,219 24,886,814 24,721,068 25,300,188 25,569,465 1.1% 5,859,476 6,135,415 6,127,184 6,277,938 6,452,417 2.8%
Public & Mental Health Public Health 5,735,470 4,737,755 4,578,126 4,578,936 4,687,387 2.4% 2,385,339 1,815,193 1,752,544 1,730,078 1,746,401 0.9% Community Mental Health 6,096,481 6,237,688 6,620,881 7,099,376 7,639,511 7.6% 2,238,166 2,201,636 2,214,916 2,304,041 2,424,315 5.2%
Other Research and Education 3,505,319 3,359,998 2,990,724 2,904,097 3,342,805 15.1% 631,808 584,162 520,527 561,072 592,379 5.6% Undistributed Amortization 6,240,532 6,091,710 6,345,760 6,506,255 6,488,188 -0.3% 2,611,113 2,620,830 2,600,881 2,600,309 2,600,268 -0.0% Other Undistributed Expenses 10,350,801 11,629,852 11,701,854 7,327,694 9,579,624 30.7% 2,473,642 2,737,907 2,532,025 2,919,432 3,811,025 30.5%
Facilicorp Administrative Support 8,050,862 8,805,461 9,107,888 10,410,607 11,729,037 12.7% 2,815,836 2,935,768 2,991,558 3,184,980 3,542,224 11.2% Revenue 0 0 0 0 0 0.0% 0 0 0 0 0 0.0% Clinical Support 3,750 1,029,778 852,565 800,437 798,450 -0.2% 1,140 314,072 357,585 407,918 422,505 3.6% Hotel 0 0 1,102,386 2,033,955 2,258,269 11.0% 0 0 336,887 905,415 782,300 -13.6%
Sub-Total -1.0% 1.7% 52,940,039 14,281,103 52,600,576 14,736,931 52,581,059 14,768,289 50,620,295 14,053,767 50,107,621 14,292,436
Sub-Total 0.8% -1.3% 92,147,232 32,213,621 100,473,189 32,530,120 100,256,581 33,057,286 100,129,046 33,019,472 100,910,604 32,581,919
Sub-Total -3.0% -3.4% 9,422,239 2,071,623 10,234,115 2,295,434 10,149,823 2,147,293 10,045,696 2,030,577 9,748,373 1,961,224
Sub-Total -0.1% 0.0% 63,275,447 19,500,541 68,853,635 19,736,817 71,510,582 21,029,299 71,510,834 20,866,445 71,407,251 20,871,624
Sub-Total -4.0% 2.7% 63,679,723 17,060,199 64,962,779 16,640,816 64,470,939 17,063,960 65,789,306 17,469,410 63,143,288 17,947,713
Sub-Total 5.6% 3.4% 11,831,951 4,623,505 10,975,443 4,016,830 11,199,007 3,967,460 11,678,312 4,034,119 12,326,898 4,170,717
Sub-Total 16.0% 15.2% 20,096,653 5,716,563 21,081,560 5,942,899 21,038,339 5,653,433 16,738,046 6,080,813 19,410,617 7,003,672 313,393,284 95,467,155 329,181,297 95,899,846 331,206,329 97,687,019 326,511,536 97,554,603 327,054,652 98,829,303 Total RHA 0.2% 1.3%
Sub-Total 11.6% 5.5% 8,054,612 2,816,976 9,835,239 3,249,840 11,062,839 3,686,030 13,244,998 4,498,314 14,785,756 4,747,029 8,054,612 2,816,976 9,835,239 3,249,840 11,062,839 3,686,030 13,244,998 4,498,314 14,785,756 4,747,029 Total Facilicorp 11.6% 5.5%
Total 0.6% 1.5% 321,447,896 98,284,131 339,016,536 99,149,686 342,269,168 101,373,049 339,756,534 102,052,916 341,840,407 103,576,332
2010/11 2011/12 2012/13 2013/14 2009/10 2012/13 2013/142010/11 2011/122009/10
Note 1: "Other Diagnostics and Therapeutics" includes Radiation Oncology, ECG, Physiotherapy, Occupational Therapy, etc. Note 2: Education expenses include Formal Medical Education where it is provided. Note 3: FacilicorpNB and corporate expenses for RRS A and RHA B are included in Section I reports. Note 4: Zone 2 Non-Inpatient Emergency Services includes Trauma Centre expenses ($803,646).
Table I-6: Trends in Total Expenses by Functional Area - 2009/2010 to 2013/2014 - Page 1e
May 2015 Section I - page 20

Section I - Total Expenses and Revenues2013/2014 Annual Report of Hospital Services
Cc Group English De Functional Area
Fiscal-4 ExpenseFiscal-3 ExpenseFiscal-2 ExpensePrev Fiscal ExpenseCurrent Fiscal ExpenseRHA B Organization
Regional Health Authority B % Change
Fiscal-4 ExpenseFiscal-3 ExpenseFiscal-2 ExpensePrev Fiscal ExpenseCurrent Fiscal ExpenseTotal
Regional Health Authority B % Change
Administration & Support Administrative Support 5,491,273 5,661,777 5,729,232 6,172,121 5,275,398 -14.5% 51,680,796 53,172,975 51,741,221 50,283,583 45,697,345 -9.1% Clinical Support 79,900 83,703 86,097 186,946 192,445 2.9% 24,923,414 21,992,737 21,776,147 22,892,869 23,209,561 1.4% Hotel 0 0 0 0 0 0.0% 57,430,867 59,157,320 59,710,505 49,887,256 49,642,094 -0.5% Plant 0 0 0 0 0 0.0% 48,560,918 50,392,975 49,215,033 48,429,548 52,068,971 7.5%
Nursing Inpatient Nursing Admin & Medical Resources 0 0 0 0 0 0.0% 29,417,314 32,723,966 28,268,718 28,115,235 32,475,397 15.5% Acute Inpatient 0 0 0 0 0 0.0% 151,672,907 161,728,570 160,521,725 162,975,682 162,905,187 -0.0% Maternal and Newborn 0 0 0 0 0 0.0% 23,210,976 24,725,060 25,445,334 25,231,487 25,712,949 1.9% Critical Care 0 0 0 0 0 0.0% 44,440,821 48,206,358 47,958,443 48,839,211 48,130,951 -1.5% Operating Room/PARR/Day Surgery 0 0 0 0 0 0.0% 78,020,891 79,729,180 82,066,985 82,492,643 83,669,573 1.4% Mental Health 0 0 0 0 0 0.0% 24,658,126 24,530,739 25,775,608 25,852,247 26,345,345 1.9%
Restorative Care Inpatient Rehabilitation 0 0 0 0 0 0.0% 6,438,950 8,579,683 8,665,468 9,024,352 11,130,619 23.3% Extended (Chronic) Care 0 0 0 0 0 0.0% 23,420,244 24,330,125 24,592,582 24,323,134 22,522,412 -7.4%
Non-Inpatient Services Emergency Services 0 0 0 0 0 0.0% 63,390,677 66,296,429 70,925,236 71,662,964 72,680,289 1.4% Ambulatory Care 0 0 0 0 0 0.0% 81,666,533 92,098,787 101,217,951 96,322,008 97,954,615 1.7% Extra-Mural Program 0 0 0 0 0 0.0% 43,106,714 44,208,756 45,626,605 45,343,627 43,570,622 -3.9% Addiction 0 0 0 0 0 0.0% 11,393,552 12,416,493 12,497,759 12,871,434 13,194,890 2.5% Community Services 0 0 0 0 0 0.0% 12,041,250 12,917,874 13,203,330 19,855,087 18,783,136 -5.4% Home Dialysis 0 0 0 0 0 0.0% 2,822,713 2,610,279 2,769,447 2,709,702 2,727,131 0.6%
Diagnostic & Therapeutic Laboratory 91,758 89,476 111,848 107,078 120,162 12.2% 60,378,069 63,637,509 65,881,016 67,378,307 67,743,823 0.5% Medical Imaging/Breast Screening 128,954 120,462 115,583 118,846 121,734 2.4% 91,081,769 92,229,320 84,372,471 82,814,031 80,247,673 -3.1% Other Diagnostic and Therapeutic 137,746 138,732 327,020 385,650 403,515 4.6% 84,525,536 87,799,865 88,894,425 91,785,086 94,289,240 2.7%
Public & Mental Health Public Health 0 0 0 0 0 0.0% 14,742,009 11,081,010 10,873,322 10,908,843 10,961,903 0.5% Community Mental Health 0 0 0 0 0 0.0% 20,821,012 21,286,994 22,193,567 22,912,380 23,640,688 3.2%
Other Research and Education 88,891 211,555 236,904 113,040 227,680 101.4% 13,462,806 14,007,269 14,275,700 14,419,502 15,240,252 5.7% Undistributed Amortization 0 0 0 0 0 0.0% 14,973,302 12,926,426 17,186,009 18,328,861 18,092,762 -1.3% Other Undistributed Expenses 0 0 0 0 0 0.0% 44,519,831 34,680,858 32,043,260 31,194,538 36,820,332 18.0%
Facilicorp Administrative Support 0 0 0 0 0 0.0% 35,494,193 35,829,834 35,779,306 39,491,455 41,737,479 5.7% Revenue 0 0 0 0 0 0.0% 0 0 0 0 0 0.0% Clinical Support 0 0 0 0 0 0.0% 13,433 3,912,752 4,077,620 4,031,767 4,376,500 8.6% Hotel 0 0 0 0 0 0.0% 0 6,867,594 3,948,254 9,746,756 11,308,346 16.0%
Sub-Total -0.5% -14.0% 5,571,173 5,745,480 5,815,330 6,359,067 5,467,843 182,595,994 184,716,008 182,442,906 170,617,971 171,493,256
Sub-Total 1.5% 0.0% 0 0 0 0 0 351,421,034 371,643,873 370,036,813 379,239,402 373,506,504
Sub-Total 0.9% 0.0% 0 0 0 0 0 29,859,193 32,909,808 33,258,050 33,653,030 33,347,486
Sub-Total 0.1% 0.0% 0 0 0 0 0 214,421,438 230,548,619 246,240,329 248,910,683 248,764,822
Sub-Total 0.1% 5.5% 358,458 348,669 554,450 611,573 645,411 235,985,374 243,666,694 239,147,911 242,280,736 241,977,423
Sub-Total 2.3% 0.0% 0 0 0 0 0 35,563,021 32,368,003 33,066,889 34,602,591 33,821,223
Sub-Total 9.7% 101.4% 88,891 211,555 236,904 113,040 227,680 72,955,939 61,614,553 63,504,968 70,153,346 63,942,901 6,018,522 6,305,705 6,606,683 7,083,680 6,340,933 Total RHA 1.1% -10.5% 1,122,801,993 1,157,467,559 1,167,697,866 1,179,457,759 1,166,853,615
Sub-Total 7.8% 0.0% 0 0 0 0 0 35,507,626 46,610,180 43,805,180 57,422,325 53,269,978 0 0 0 0 0 Total Facilicorp 7.8% 0.0% 35,507,626 46,610,180 43,805,180 57,422,325 53,269,978
Total 1.4% -10.5% 6,018,522 6,305,705 6,606,683 7,083,680 6,340,933 1,158,309,619 1,204,077,738 1,211,503,045 1,236,880,084 1,220,123,593
2010/11 2011/12 2012/13 2013/14 2009/10 2012/13 2013/142010/11 2011/122009/10
Note 1: "Other Diagnostics and Therapeutics" includes Radiation Oncology, ECG, Physiotherapy, Occupational Therapy, etc. Note 2: Education expenses include Formal Medical Education where it is provided. Note 3: FacilicorpNB and corporate expenses for RRS A and RHA B are included in Section I reports. Note 4: Zone 2 Non-Inpatient Emergency Services includes Trauma Centre expenses ($803,646).
Table I-6: Trends in Total Expenses by Functional Area - 2009/2010 to 2013/2014 - Page 1f
May 2015 Section I - page 21

Section I - Total Expenses and Revenues2013/2014 Annual Report of Hospital Services
Cc Group English De Functional AreaFiscal-4 Expense Fiscal-3 Expense Fiscal-2 Expense Prev Fiscal ExpenseCurrent Fiscal Expense
Total % Change
Administration & Support Administrative Support 85,874,193 91,360,102 91,190,012 89,210,881 82,758,273 -7.2% Clinical Support 44,331,764 37,820,507 38,277,401 39,620,302 40,010,416 1.0% Hotel 89,425,180 93,048,148 94,172,562 79,942,135 79,015,549 -1.2% Plant 79,799,895 85,976,017 82,635,458 82,365,886 85,806,053 4.2%
Nursing Inpatient Nursing Admin & Medical Resources 43,186,073 47,177,610 43,023,588 42,330,958 46,208,530 9.2% Acute Inpatient 226,800,287 243,057,204 240,914,565 244,649,446 240,462,876 -1.7% Maternal and Newborn 37,151,293 39,891,791 40,564,890 40,520,594 41,196,039 1.7% Critical Care 57,953,399 63,473,854 62,064,338 63,593,382 63,374,313 -0.3% Operating Room/PARR/Day Surgery 112,961,026 115,851,173 118,150,390 120,272,267 120,674,674 0.3% Mental Health 54,041,242 54,631,387 56,900,349 56,123,663 56,422,389 0.5%
Restorative Care Inpatient Rehabilitation 8,731,144 10,888,803 10,926,516 11,482,443 13,562,630 18.1% Extended (Chronic) Care 39,158,313 40,481,643 40,454,029 40,136,618 37,899,305 -5.6%
Non-Inpatient Services Emergency Services 107,028,478 111,054,486 116,599,743 120,603,904 121,800,468 1.0% Ambulatory Care 134,434,483 149,006,891 162,831,464 160,788,738 162,222,909 0.9% Extra-Mural Program 72,462,323 74,397,541 76,746,147 76,755,655 72,317,900 -5.8% Addiction 16,589,440 17,756,715 18,028,095 18,542,354 18,896,024 1.9% Community Services 23,385,593 26,275,895 23,476,677 31,698,501 30,906,696 -2.5% Home Dialysis 3,530,712 3,302,816 3,414,481 3,707,571 3,829,716 3.3%
Diagnostic & Therapeutic Laboratory 97,498,532 101,686,353 105,132,618 108,334,306 109,445,863 1.0% Medical Imaging/Breast Screening 138,158,852 140,535,587 130,991,571 133,621,662 129,489,991 -3.1% Other Diagnostic and Therapeutic 137,238,776 142,507,909 146,067,275 151,181,545 154,215,862 2.0%
Public & Mental Health Public Health 27,626,637 22,761,996 22,649,701 22,606,440 22,427,945 -0.8% Community Mental Health 37,080,898 37,985,580 39,790,867 41,375,247 43,467,209 5.1%
Other Research and Education 22,970,179 23,890,400 24,174,036 24,164,516 24,596,200 1.8% Undistributed Amortization 26,863,079 21,873,068 26,610,517 28,069,328 27,909,908 -0.6% Other Undistributed Expenses 59,561,437 49,453,591 48,806,295 49,649,299 63,072,059 27.0%
Facilicorp Administrative Support 54,221,975 56,151,049 56,506,371 63,200,878 68,174,823 7.9% Revenue 0 0 0 0 36,647 0.0% Clinical Support 55,795 7,874,813 8,486,228 8,323,938 8,588,674 3.2% Hotel 0 6,867,594 6,376,191 14,009,310 16,189,654 15.6%
-1.2% Sub-Total 299,431,032 308,204,774 306,275,432 287,590,290 291,139,204
0.1% Sub-Total 532,093,320 564,083,020 561,618,119 568,338,821 567,490,311
-0.3% Sub-Total 47,889,458 51,370,446 51,380,545 51,461,936 51,619,061
-0.5% Sub-Total 357,431,029 381,794,345 401,096,607 409,973,713 412,096,724
0.0% Sub-Total 372,896,160 384,729,849 382,191,464 393,151,717 393,137,514
3.0% Sub-Total 64,707,536 60,747,576 62,440,568 65,895,154 63,981,687
13.4% Sub-Total 109,394,694 95,217,058 99,590,848 115,578,167 101,883,143 Total RHA 0.6% 1,783,843,228 1,846,147,068 1,864,593,583 1,891,989,797 1,881,347,645
8.7% Sub-Total 54,277,770 70,893,456 71,368,790 92,989,798 85,534,127 Total Facilicorp 8.7% 54,277,770 70,893,456 71,368,790 92,989,798 85,534,127
Total 0.9% 1,838,120,998 1,917,040,523 1,935,962,373 1,984,979,596 1,966,881,771
2009/10 2010/11 2011/12 2012/13 2013/14
Note 1: "Other Diagnostics and Therapeutics" includes Radiation Oncology, ECG, Physiotherapy, Occupational Therapy, etc. Note 2: Education expenses include Formal Medical Education where it is provided. Note 3: FacilicorpNB and corporate expenses for RRS A and RHA B are included in Section I reports. Note 4: Zone 2 Non-Inpatient Emergency Services includes Trauma Centre expenses ($803,646).
Table I-6: Trends in Total Expenses by Functional Area - 2009/2010 to 2013/2014 - Page 1g
May 2015 Section I - page 22

Section I - Total Expenses and Revenues2013/2014 Annual Report of Hospital Services
Note 1: Excludes revenues related to prior year activity. Refer to table I-2(b). Note 2: FacilicorpNB and corporate revenues for RRS A and RHA B are included in Section I reports.
Fiscal-4 Fiscal-3 Fiscal-2 Prev Fiscal Curr Fiscal % Change
DH REVENUE
Fiscal-4 Fiscal-3 Fiscal-2 Prev Fiscal Curr Fiscal % Change
PATIENT SERVICE REVENUES
RRS A Zone 1 177,185,763 182,248,833 186,016,636 191,112,799 193,289,413 1.1% 14,791,669 15,349,919 15,186,769 14,463,955 14,419,146 -0.3% RRS A Zone 4 98,207,345 101,246,636 101,179,280 103,137,733 109,613,921 6.3% 4,915,145 4,919,913 4,945,015 4,490,317 4,670,891 4.0% RRS A Zone 5 86,916,553 87,704,491 89,623,140 87,931,987 88,739,072 0.9% 14,727,528 16,092,752 17,183,830 15,474,388 16,783,180 8.5% RRS A Zone 6 158,738,518 163,887,201 165,697,158 165,835,952 168,397,991 1.5% 3,827,555 3,896,547 3,519,288 3,935,108 3,688,199 -6.3%
RHA B Zone 1 200,518,031 208,823,848 211,762,316 213,773,163 217,079,261 1.5% 14,296,437 13,527,689 14,676,754 14,840,345 14,528,592 -2.1% RHA B Zone 2 353,293,110 357,921,060 358,615,756 353,280,184 358,417,759 1.5% 16,957,153 16,565,982 17,679,464 18,081,974 17,798,844 -1.6% RHA B Zone 3 234,817,461 243,418,560 249,681,314 246,723,219 250,731,595 1.6% 16,656,794 16,587,763 15,678,010 20,183,882 19,952,119 -1.1% RHA B Zone 7 75,658,164 77,488,132 77,836,499 76,538,660 76,998,629 0.6% 1,314,864 1,683,458 2,083,464 1,678,123 1,540,697 -8.2% RHA B Org 0 0 0 0 0 0.0% 0 0 0 0 0 0.0%
RRS A 2.2% 3.1% 521,048,178 38,261,898 542,516,214 40,834,902 535,087,161 40,259,130 548,018,471 38,363,769 560,040,396 39,561,416
RHA B 1.5% -1.8% 864,286,766 49,225,249 897,895,885 50,117,692 887,651,600 48,364,893 890,315,227 54,784,324 903,227,243 53,820,252
Facilicorp 6.7% 0.0% 52,441,192 71,123 60,394,318 0 59,073,578 7,124,545 77,285,934 0 82,445,818 0
Total 2.0% 0.3% 1,437,776,135 87,558,270 1,500,806,418 90,952,593 1,481,812,338 95,748,569 1,515,619,631 93,148,0931,545,713,457 93,381,668
2013/142012/132009/10 2010/11 2011/12 2009/10 2010/11 2011/12 2012/13
Fiscal-4 Fiscal-3 Fiscal-2 Prev Fiscal Curr Fiscal % Change
MEDICARE REVENUES
Fiscal-4 Fiscal-3 Fiscal-2 Prev Fiscal Curr Fiscal % Change
DONATIONS, GRANTS & INVESTMENT REVENUE
RRS A Zone 1 27,872,837 30,226,809 31,946,851 32,857,634 33,599,040 2.3% 6,804,645 6,180,539 5,637,184 3,481,781 2,828,710 -18.8% RRS A Zone 4 16,357,482 17,304,344 17,506,737 18,118,935 17,959,844 -0.9% 4,231,645 4,121,163 4,070,134 5,578,888 3,299,877 -40.9% RRS A Zone 5 13,861,843 13,346,997 14,064,974 14,071,843 13,933,393 -1.0% 3,877,811 4,103,316 4,216,581 1,532,024 2,472,495 61.4% RRS A Zone 6 20,290,599 20,542,526 21,011,264 22,922,064 21,833,953 -4.7% 5,526,478 4,921,506 4,982,025 6,697,418 4,631,473 -30.8%
RHA B Zone 1 40,230,810 43,095,301 45,577,866 45,074,557 47,014,248 4.3% 10,614,597 7,549,526 7,697,514 8,383,326 5,412,834 -35.4% RHA B Zone 2 49,586,833 55,815,171 57,987,088 58,266,546 60,132,827 3.2% 13,530,578 12,363,338 10,550,246 8,822,893 8,809,630 -0.2% RHA B Zone 3 38,907,572 41,966,442 45,210,073 46,711,044 43,028,082 -7.9% 13,522,578 14,439,844 12,877,781 3,568,003 5,725,566 60.5% RHA B Zone 7 14,042,640 13,812,493 14,694,185 14,204,055 13,609,901 -4.2% 4,326,383 4,159,192 4,096,635 2,965,699 1,837,953 -38.0% RHA B Org 0 0 0 0 0 0.0% 0 0 0 0 0 0.0%
RRS A -0.7% -23.5% 78,382,761 81,420,676 84,529,826 87,970,476 87,326,230 20,440,580 19,326,524 18,905,924 13,232,556 17,290,110
RHA B -0.3% -8.2% 142,767,855 154,689,407 163,469,211 164,256,203 163,785,059 41,994,136 38,511,901 35,222,176 21,785,983 23,739,921
Facilicorp 0.0% -90.3% 0 0 0 0 0 599 30,428 117,844 36,663 376,123
Total -0.4% -15.3% 221,150,616 236,110,082 247,999,037 252,226,679 251,111,288 62,435,315 57,868,854 54,245,943 35,055,202 41,406,154
2010/11 2013/142012/132011/122009/102013/142012/132011/122010/112009/10
Table I-7: Trends in Total Revenues and Recoveries by Revenue Account Type - 2009/2010 to 2013/2014 - Page 1 of 2
2013/14
May 2015 Section I - page 23

Section I - Total Expenses and Revenues2013/2014 Annual Report of Hospital Services
Note 1: Excludes revenues related to prior year activity. Refer to table I-2(b). Note 2: FacilicorpNB and corporate revenues for RRS A and RHA B are included in Section I reports.
Fiscal-4 Fiscal-3 Fiscal-2 Prev Fiscal Curr Fiscal % Change
OTHER RECOVERIES & SALES
RRS A Zone 1 4,679,831 4,542,097 4,244,659 4,217,154 4,162,665 -1.3% RRS A Zone 4 841,924 838,246 793,750 783,761 723,740 -7.7% RRS A Zone 5 745,381 663,306 1,339,193 882,281 1,255,153 42.3% RRS A Zone 6 1,526,937 1,059,307 1,256,800 1,166,290 804,662 -31.0%
RHA B Zone 1 4,480,202 4,357,356 4,781,727 5,454,192 6,345,635 16.3% RHA B Zone 2 10,875,687 11,923,073 11,617,141 10,863,864 11,591,968 6.7% RHA B Zone 3 8,726,618 8,993,673 9,465,987 4,949,614 5,500,921 11.1% RHA B Zone 7 1,100,063 1,151,866 1,171,248 1,384,789 2,106,716 52.1% RHA B Org 6,555 0 0 2,444 0 -100.0%
RRS A -1.5% 7,794,073 7,634,401 7,102,956 7,049,486 6,946,219
RHA B 12.8% 25,189,125 27,036,103 26,425,969 22,654,903 25,545,239
Facilicorp 5.4% 2,438,580 15,035,878 4,568,470 10,561,324 11,126,623
Total 8.3% 35,421,779 49,706,382 38,097,395 40,265,713 43,618,081
2012/132009/10 2010/11 2011/12
Table I-7: Trends in Total Revenues and Recoveries by Revenue Account Type - 2009/2010 to 2013/2014 - Page 2 of 2
Fiscal-4 Fiscal-3 Fiscal-2 Prev Fiscal Curr Fiscal
Total % Change
RRS A Zone 1 231,334,745 238,548,197 243,032,098 246,133,322 248,298,973 0.9% RRS A Zone 4 124,553,542 128,430,301 128,494,917 132,109,634 136,268,273 3.1% RRS A Zone 5 120,129,116 121,910,861 126,427,718 119,892,523 123,183,293 2.7% RRS A Zone 6 189,910,088 194,307,087 196,466,534 200,556,833 199,356,278 -0.6%
RHA B Zone 1 270,140,077 277,353,721 284,496,177 287,525,583 290,380,569 1.0% RHA B Zone 2 444,243,361 454,588,625 456,449,695 449,315,462 456,751,028 1.7% RHA B Zone 3 312,631,023 325,406,282 332,913,165 322,135,763 324,938,283 0.9% RHA B Zone 7 96,442,114 98,295,141 99,882,031 96,771,326 96,093,896 -0.7% RHA B Org 6,555 0 0 2,444 0 -100.0%
RRS A 1.2% 665,927,490 683,196,447 694,421,267 698,692,311 707,106,817
RHA B 1.1% 1,123,463,130 1,155,643,770 1,173,741,067 1,155,750,578 1,168,163,775
Facilicorp 6.1% 54,951,495 70,797,022 75,548,040 88,223,381 93,609,104
Total 1.3% 1,844,342,114 1,909,637,238 1,943,710,374 1,942,666,270 1,968,879,697
2013/142012/132011/122010/112009/10
2013/14
May 2015 Section I - page 24


Section II
Compensation Expenses and Statistics


2013/2014 Annual Report of Hospital Services
Section II: Summary of Compensation Expenses and Statistics This section is useful for those who wish to understand the utilization and cost of human resources in the RHAs. Section II provides a summary of compensation data by RHA. These reports provide detail of worked hours and benefit hours, as well as calculated Full Time Equivalents (FTEs). A breakdown of compensation expenses (salaries and benefit contributions) is also provided. The source of the data presented in this section is the MIS and human resource data submitted by the RHAs. Due to differences in accrual rules and timing, the compensation data in this Report will not necessarily match the data reported in the Human Resource Database (HRDB), which is based on actual payroll data. Effective 2009, FacilicorpNB reporting is included in Section II. Comparison to current or previous years is not recommended as the reporting processes are still being improved. Note that although this section provides multi-year trending of compensation hours and expenses, the trends can be confounded by significant, retroactive payouts associated with collective bargaining settlements. Since RHAs do not accrue the payments prospectively, a large payout in a given year would artificially inflate the total costs in that year and affect the natural trend across years. In fiscal year 2012/13, contract agreements were signed for Nurses in February 2013. The following are the general categories of Human Resources data presented in this section: Table II-1 & 2: Worked and Benefit Hours and calculated FTEs by RHA and by Facility Table II-1 shows a decrease in total paid hours in 2013/14. Table II-2 shows the same data by facility. Note that facility level can be confounded by the fact that staff from the regional hospital that provide services to the smaller hospitals are not always charged to those hospitals. The calculated FTEs were equivalent to 17,687. Table II-3: Worked and Benefit Hours and calculated FTEs by Functional Area This table shows that the largest functional groups in terms of FTEs are Nursing Inpatient at 28.7% of total FTEs and Administration and Support at 26.0% of total FTEs. Table II-4: Salaries Expense per Paid Hour by Functional Area by RHA This table compares labour rates across RHAs. Note, given that most wages are set using a province-wide central bargaining process, most differences in unionized labour rates are due to difference in skill mix (e.g., RN vs. LPN), seniority, and overtime. As expected, the inter-RHA variations within each functional area are not substantial. For example, the average salary cost per hour in Nursing Inpatient ranges from a low of $29.64 in RRS A Zone 5 to a high of $33.92 in RHA B Zone 1. Table II-5: Total UPP and MOS Worked Hours by Functional Area by RHA RHAs are using consistent definitions in the reporting of compensation data by Broad Occupation Group (MOS, UPP, and Medical – See Glossary for definitions). Table II-5 provides a breakdown of hours by MOS and UPP by functional area (medical hours are excluded). Overall, 17.4% of total hours are MOS. Individual Zone results range from a low of 14.3% in RRS A Zone 5 to a high of 22.5% in RHA B Zone 7. Table II-6: Benefit Contribution Expenses by RHA This table provides the break-downs of total benefit contributions by type by RHA. The largest benefit contribution category is the Provincial Pension Plan, followed by the Canada Pension Plan, then the Retirement Benefits & Other Pensions.
May 2015 Section II - Page 1

2013/2014 Annual Report of Hospital Services
Table II-7: Number of Full-time, Part-time, Permanent and Temporary Employees and Age Distribution by RHA Tables II-7 (a) (b) (c) are extracted from the Human Resources Database (HRDB) and provide information on the number of employees by employment status and age distribution across the RHAs. Figure II-7(a) shows that 66.3% of the employees work full-time and of the total number of employees, 88.0% have a permanent status. Figure II-7(c) shows that 56.8% of employees are between the ages of 35 to 55 years. The greatest percentage of employees (32.0%) is between the ages of 45 to 55 years and 24.8% are in the age range of 35 to 45 years. Notes are included below many of the tables to explain certain inclusions, exclusions or variations in the data. A Glossary of Terms is provided at the end of the Annual Report.
May 2015 Section II - Page 2

Section II - Compensation Expenses and Statistics2013/2014 Annual Report of Hospital Services
RHA
Fiscal-4 AmountFiscal-3 AmountFiscal-2 AmountPrev Fiscal AmountCurr Fiscal Amount
Total % Change
RRS A Zone 1 4,321,056 4,330,097 4,420,380 4,310,013 4,174,159 -3.2% RRS A Zone 4 2,491,142 2,543,119 2,648,631 2,624,541 2,502,868 -4.6% RRS A Zone 5 2,888,144 2,836,732 2,758,534 2,662,292 2,577,626 -3.2% RRS A Zone 6 3,823,369 3,855,802 3,849,183 3,771,031 3,600,695 -4.5% RRS A Org 82,052 53,517 48,739 92,375 58,819 -36.3%
RHA B Zone 1 4,958,346 5,047,632 5,020,250 4,903,620 4,760,001 -2.9% RHA B Zone 2 8,220,840 8,328,398 8,375,351 8,390,248 8,336,674 -0.6% RHA B Zone 3 6,148,219 6,237,599 6,206,274 5,994,028 5,846,407 -2.5% RHA B Zone 7 1,821,856 1,752,477 1,733,214 1,779,921 1,744,224 -2.0% RHA B Org 44,984 56,071 59,942 73,632 71,764 -2.5%
RRS A -4.1% 13,605,763 13,619,267 13,725,466 13,460,252 12,914,169
RHA B -1.8% 21,194,245 21,422,177 21,395,031 21,141,450 20,759,070
Facilicorp 13.2% 505,430 1,465,495 1,391,367 1,476,699 1,672,020
RHA
Fiscal-4 AmountFiscal-3 AmountFiscal-2 AmountPrev Fiscal AmountCurr Fiscal Amount % Change
Worked Hours
Fiscal-4 AmountFiscal-3 AmountFiscal-2 AmountPrev Fiscal AmountCurr Fiscal Amount % Change
Benefit Hours
RRS A Zone 1 3,602,712 3,587,069 3,671,560 3,578,998 3,474,314 -2.9% 718,344 743,028 748,820 731,015 699,845 -4.3% RRS A Zone 4 2,032,501 2,072,996 2,183,251 2,156,504 2,043,980 -5.2% 458,640 470,122 465,380 468,037 458,888 -2.0% RRS A Zone 5 2,388,590 2,331,237 2,262,392 2,193,189 2,134,355 -2.7% 499,553 505,495 496,141 469,103 443,272 -5.5% RRS A Zone 6 3,151,051 3,164,163 3,167,953 3,078,920 2,938,516 -4.6% 672,318 691,639 681,230 692,111 662,179 -4.3% RRS A Org 69,053 44,816 40,849 76,079 50,503 -33.6% 12,999 8,701 7,890 16,296 8,316 -49.0%
RHA B Zone 1 4,096,370 4,159,809 4,157,736 4,045,408 3,944,168 -2.5% 861,976 887,822 862,514 858,212 815,833 -4.9% RHA B Zone 2 6,817,720 6,899,837 6,934,792 6,950,676 6,926,607 -0.3% 1,403,120 1,428,561 1,440,559 1,439,572 1,410,067 -2.0% RHA B Zone 3 5,009,979 5,098,006 5,071,414 4,901,655 4,809,489 -1.9% 1,138,240 1,139,593 1,134,860 1,092,373 1,036,918 -5.1% RHA B Zone 7 1,509,784 1,448,656 1,436,649 1,478,181 1,440,220 -2.6% 312,072 303,822 296,565 301,740 304,004 0.8% RHA B Org 37,817 48,117 50,395 61,131 60,382 -1.2% 7,167 7,955 9,547 12,502 11,382 -9.0%
RRS A -4.0% -4.4% 11,243,908 2,361,854 11,200,282 2,418,986 11,326,005 2,399,461 11,083,690 2,376,562 10,641,668 2,272,500
RHA B -1.5% -3.4% 17,471,669 3,722,576 17,654,425 3,767,752 17,650,986 3,744,045 17,437,051 3,704,399 17,180,867 3,578,204
Facilicorp 16.1% 0.2% 455,911 49,519 1,218,591 246,905 1,155,409 235,958 1,207,605 269,094 1,402,503 269,517
Total -1.7% -3.6% 29,171,488 6,133,949 30,073,297 6,433,643 30,132,400 6,379,464 29,728,346 6,350,054 29,225,038 6,120,221
Table II-1: Worked and Benefit Hours Trends (Including Medical Hours) - 2009/2010 to 2013/2014
2013/20142012/20132011/20122010/20112009/2010
2010/2011 2011/2012 2012/2013 2013/2014
2013/20142012/20132011/20122010/20112009/2010
2009/2010
Note 1: Includes worked, purchased and benefit hours; excludes standby (on-call) hours.
May 2015 Section II - page 3

2013/2014 Annual Report of Hospital Services Section II - Compensation Expenses and StatisticsTable II-2: Total Worked and Benefit Hours by RHA by Facility (Excluding Medical) - 2013/2014 - Page 1 of 5
Note 1: Full-time Equivalents (FTEs) calculated as (Worked Hours + Benefit Hours + Purchased)/ 1950 hours. Note 2: Variation in the percent worked hours across RHAs may be due to different mixes of full-time and part-time employees. Note 3: Standby (on-call) and medical hours are excluded. Note 4: The facility type "Other Subservices" represents those facilities converted to CHCs that continue to provide subservices aligned with the regional facilities and Hospital Services (e.g. Lab, Diagnostic Imaging).
Facility Type Facility Worked Hours Benefit Hours Total Paid Hours % Worked/Total Total Calculated
FTEs
Acute Care Facilities Centre hospitalier universitaire Dr-Georges-L.-Dumont 2,843,514 584,499 3,428,013 82.9% 1,758 Hôpital Stella-Maris- de-Kent 176,967 33,811 210,778 84.0% 108
Extra-Mural Program PEM unité de Blanche Bourgeois 76,046 17,677 93,723 81.1% 48 PEM unité de Kent 34,218 7,578 41,796 81.9% 21 PEM unité de Shédiac 43,082 10,213 53,295 80.8% 27
Health Centres Centre médical régional de Shédiac 15,060 3,183 18,243 82.6% 9 Community Mental Health Centre de santé mentale communautaire de Moncton Beauséjour 37,292 8,207 45,499 82.0% 23
Centre de santé mentale communautaire de Richibucto 26,473 6,108 32,581 81.3% 17 Public Health Bureau de la Santé publique de Moncton Beauséjour 86,739 21,206 107,945 80.4% 55
Acute Care Facilities Hotel-Dieu Saint-Joseph de Saint-Quentin 106,474 22,857 129,331 82.3% 66 Hôpital général de Grand-Sault 212,475 45,728 258,203 82.3% 132 Hôpital régional d'Edmundston 1,404,579 331,904 1,736,484 80.9% 891
Extra-Mural Program PEM unité d'Edmundston 61,568 18,105 79,673 77.3% 41 PEM unité de Grand Sault 42,018 10,767 52,785 79.6% 27 PEM unité de Kedgwick 14,239 2,623 16,862 84.4% 9
Health Centres Centre de santé de Ste-Anne 4,342 1,353 5,695 76.2% 3 Community Mental Health Centre de santé mentale communautaire d'Edmundston 40,263 8,541 48,804 82.5% 25
Centre de santé mentale communautaire de Grand-Sault 34,114 8,251 42,365 80.5% 22 Public Health Santé publique d'Edmundston 38,049 8,760 46,809 81.3% 24
Acute Care Facilities Hôpital Régional de Campbellton 1,291,098 276,127 1,567,225 82.4% 804 Extra-Mural Program PEM unité de Restigouche 53,840 13,169 67,009 80.3% 34 Health Centres Centre de santé de Jacquet River 5,208 1,220 6,429 81.0% 3 Psychiatric Facilities Centre Hospitalier Restigouche 535,031 104,090 639,121 83.7% 328 Community Health Centres Centre de santé communautaire St-Joseph 25,479 6,623 32,102 79.4% 16 Community Mental Health Centre de santé mentale communautaire de Campbellton 73,284 15,650 88,934 82.4% 46 Other Subservices Dalhousie 94,492 19,544 114,036 82.9% 58 Public Health Santé publique de Campbellton 20,705 6,848 27,553 75.1% 14
RRS A Zone 1
RRS A Zone 1 Sub-Total 3,339,391 692,482 4,031,873 2,068 82.8%
RRS A Zone 4
RRS A Zone 4 Sub-Total 1,958,122 458,888 2,417,010 1,239 81.0%
RRS A Zone 5
RRS A Zone 5 Sub-Total 2,099,136 443,272 2,542,408 1,304 82.6%
May 2015 Section II - page 4

2013/2014 Annual Report of Hospital Services Section II - Compensation Expenses and StatisticsTable II-2: Total Worked and Benefit Hours by RHA by Facility (Excluding Medical) - 2013/2014 - Page 2 of 5
Note 1: Full-time Equivalents (FTEs) calculated as (Worked Hours + Benefit Hours + Purchased)/ 1950 hours. Note 2: Variation in the percent worked hours across RHAs may be due to different mixes of full-time and part-time employees. Note 3: Standby (on-call) and medical hours are excluded. Note 4: The facility type "Other Subservices" represents those facilities converted to CHCs that continue to provide subservices aligned with the regional facilities and Hospital Services (e.g. Lab, Diagnostic Imaging).
Facility Type Facility Worked Hours Benefit Hours Total Paid Hours % Worked/Total Total Calculated
FTEs
Acute Care Facilities Hôpital de Lamèque 56,492 12,474 68,966 81.9% 35 Hôpital de Tracadie -Sheila 501,559 110,901 612,460 81.9% 314 Hôpital de l'Enfant-Jésus RHSJ 260,127 53,404 313,531 83.0% 161 Hôpital régional Chaleur 1,677,417 381,009 2,058,426 81.5% 1,056
Extra-Mural Program PEM unité de Bathurst 50,824 11,035 61,860 82.2% 32 PEM unité de la Péninsule acadienne - Caraquet 29,900 8,110 38,010 78.7% 19 PEM unité de la Péninsule acadienne - Lamèque 21,002 6,477 27,479 76.4% 14 PEM unité de la Péninsule acadienne -Tracadie 33,001 9,563 42,563 77.5% 22
Health Centres Centre de santé Chaleur 5,678 886 6,564 86.5% 3 Centre de santé de Miscou 1,458 1,116 2,574 56.6% 1 Centre de santé de Paquetville 4,328 796 5,124 84.5% 3
Community Health Centres Centre de santé communautaire de Lamèque 85,748 16,637 102,384 83.8% 53 Centre de santé communautaire de St-Isidore 6,525 1,375 7,900 82.6% 4
Community Mental Health Centre de santé mentale communautaire de Bathurst 46,828 10,265 57,093 82.0% 29 Centre de santé mentale communautaire de Caraquet 65,104 14,168 79,273 82.1% 41
Public Health Santé publique de Bathurst 26,186 6,913 33,099 79.1% 17 Santé publique de Caraquet 27,876 7,217 35,093 79.4% 18
Acute Care Facilities Centre hospitalier universitaire Dr-Georges-L.-Dumont 13,395 2,175 15,571 86.0% 8 Hotel-Dieu Saint-Joseph de Saint-Quentin 962 178 1,141 84.4% 1 Hôpital Régional de Campbellton 9,427 1,557 10,984 85.8% 6 Hôpital Stella-Maris- de-Kent 755 140 894 84.4% 0 Hôpital de Lamèque 7 1 8 82.8% 0 Hôpital de Tracadie -Sheila 84 -4 80 105.0% 0 Hôpital de l'Enfant-Jésus RHSJ 1,263 227 1,490 84.8% 1 Hôpital général de Grand-Sault 980 177 1,157 84.7% 1 Hôpital régional Chaleur 10,493 1,648 12,141 86.4% 6 Hôpital régional d'Edmundston 10,812 1,788 12,600 85.8% 6
Psychiatric Facilities Centre Hospitalier Restigouche 1,524 281 1,805 84.4% 1 Community Health Centres Centre de santé communautaire de Lamèque 11 2 12 85.2% 0 Other Subservices Dalhousie 791 146 937 84.4% 0
RRS A Zone 6
RRS A Zone 6 Sub-Total 2,900,054 652,345 3,552,399 1,822 81.6%
RRS A Organisation
RRS A Organisation Sub-Total 50,503 8,316 58,819 30 85.9%
RRS A Total 10,347,206 2,255,303 12,602,509 6,463 82.1%
May 2015 Section II - page 5

2013/2014 Annual Report of Hospital Services Section II - Compensation Expenses and StatisticsTable II-2: Total Worked and Benefit Hours by RHA by Facility (Excluding Medical) - 2013/2014 - Page 3 of 5
Note 1: Full-time Equivalents (FTEs) calculated as (Worked Hours + Benefit Hours + Purchased)/ 1950 hours. Note 2: Variation in the percent worked hours across RHAs may be due to different mixes of full-time and part-time employees. Note 3: Standby (on-call) and medical hours are excluded. Note 4: The facility type "Other Subservices" represents those facilities converted to CHCs that continue to provide subservices aligned with the regional facilities and Hospital Services (e.g. Lab, Diagnostic Imaging).
Facility Type Facility Worked Hours Benefit Hours Total Paid Hours % Worked/Total Total Calculated
FTEs
Acute Care Facilities Sackville Memorial Hospital 160,814 30,902 191,716 83.9% 98 The Moncton Hospital 3,340,019 705,693 4,045,712 82.6% 2,075
Extra-Mural Program EMP Driscoll Unit 122,525 24,329 146,854 83.4% 75 EMP Tantramar Unit 20,315 3,789 24,104 84.3% 12
Health Centres Petitcodiac Health Centre 10,611 2,118 12,728 83.4% 7 Port Elgin and Region Health Centre 5,210 1,139 6,349 82.1% 3 Rexton Health Centre 11,167 1,887 13,055 85.5% 7
Community Health Centres Albert County Health and Wellness Centre 20,871 4,468 25,339 82.4% 13 Community Mental Health RHA 1SE Community Mental Health Centre 81,438 18,068 99,506 81.8% 51 Other Subservices Albert County 751 364 1,115 67.3% 1
Acute Care Facilities Charlotte County Hospital 285,311 56,150 341,461 83.6% 175 Grand Manan Hospital 43,249 8,205 51,454 84.1% 26 Saint John Regional Hospital 4,724,670 983,062 5,707,732 82.8% 2,927 St. Joseph's Hospital 649,957 129,199 779,156 83.4% 400 Sussex Health Centre 248,057 49,022 297,079 83.5% 152
Extra-Mural Program EMP Eastern Charlotte Unit 27,371 6,495 33,866 80.8% 17 EMP Kennebecasis Valley Unit 39,842 9,007 48,849 81.6% 25 EMP Saint John Unit 103,974 23,921 127,895 81.3% 66 EMP St. Stephen Unit 33,596 7,523 41,119 81.7% 21 EMP Sussex Unit 33,896 7,564 41,460 81.8% 21
Health Centres Campobello Health Centre 6,957 1,185 8,142 85.4% 4 Deer Island Health Centre 4,738 1,141 5,879 80.6% 3 Fundy Health Centre - Blacks Harbour 26,620 5,192 31,812 83.7% 16
Psychiatric Facilities Centracare 156,472 32,291 188,763 82.9% 97 Community Health Centres MediSanté 6,397 1,387 7,784 82.2% 4
St-Joseph's Community Health Centre 50,266 10,213 60,479 83.1% 31 Community Mental Health Saint John Community Mental Health Centre 102,836 23,909 126,745 81.1% 65
St. Stephen Community Mental Health Centre 38,159 7,695 45,854 83.2% 24 Sussex Community Mental Health Centre 26,566 6,289 32,855 80.9% 17
Public Health Saint John Public Health 81,345 16,495 97,840 83.1% 50
RHA B Zone 1
RHA B Zone 1 Sub-Total 3,773,721 792,757 4,566,478 2,342 82.6%
RHA B Zone 2
RHA B Zone 2 Sub-Total 6,690,279 1,385,945 8,076,224 4,142 82.8%
May 2015 Section II - page 6

2013/2014 Annual Report of Hospital Services Section II - Compensation Expenses and StatisticsTable II-2: Total Worked and Benefit Hours by RHA by Facility (Excluding Medical) - 2013/2014 - Page 4 of 5
Note 1: Full-time Equivalents (FTEs) calculated as (Worked Hours + Benefit Hours + Purchased)/ 1950 hours. Note 2: Variation in the percent worked hours across RHAs may be due to different mixes of full-time and part-time employees. Note 3: Standby (on-call) and medical hours are excluded. Note 4: The facility type "Other Subservices" represents those facilities converted to CHCs that continue to provide subservices aligned with the regional facilities and Hospital Services (e.g. Lab, Diagnostic Imaging).
Facility Type Facility Worked Hours Benefit Hours Total Paid Hours % Worked/Total Total Calculated
FTEs
Acute Care Facilities Dr. Everett Chalmers Regional Hospital 2,793,420 596,368 3,389,788 82.4% 1,738 Hotel-Dieu of St. Joseph 183,090 43,203 226,293 80.9% 116 Oromocto Public Hospital 319,900 68,776 388,676 82.3% 199 Upper River Valley Hospital 597,714 129,058 726,772 82.2% 373
Extra-Mural Program EMP Boiestown Office 4,057 1,070 5,127 79.1% 3 EMP Fredericton Unit 111,424 24,337 135,761 82.1% 70 EMP Harvey 0 0 0 0.0% 0 EMP Minto 0 0 0 0.0% 0 EMP Oromocto Unit 34,861 8,359 43,220 80.7% 22 EMP Perth Unit 33,026 7,338 40,364 81.8% 21 EMP Woodstock Unit 44,408 10,723 55,131 80.5% 28
Health Centres Boiestown Health Centre 3,824 711 4,535 84.3% 2 Chipman Health Centre 8,199 1,542 9,741 84.2% 5 Fredericton Junction Health Centre 6,334 1,292 7,626 83.1% 4 Harvey Health Centre 15,953 3,996 19,949 80.0% 10 McAdam Health Centre 15,549 3,861 19,410 80.1% 10 Nackawic Health Centre 3,924 1,198 5,122 76.6% 3 Stanley Health Services Centre 8,547 1,735 10,282 83.1% 5
Community Health Centres Central Miramichi Community Health Centre 18,821 4,840 23,661 79.5% 12 Centre de santé Noreen-Richard Health Centre 6,375 1,148 7,523 84.7% 4 Gibson Health Clinic 18,500 3,196 21,696 85.3% 11 Oromocto Health Clinic 1,681 303 1,984 84.7% 1 Queens North Community Health Centre 39,318 9,950 49,268 79.8% 25 Tobique Valley Community Health Centre 35,546 9,811 45,357 78.4% 23
Community Mental Health Fredericton Community Mental Health Centre 96,729 20,035 116,764 82.8% 60 Woodstock Community Mental Health Centre 48,232 9,197 57,429 84.0% 29
Other Subservices Minto 6,095 1,710 7,805 78.1% 4 Tobique Valley 5,117 1,105 6,222 82.2% 3 Upper Miramichi Health Services Centre - Doaktown 913 246 1,159 78.8% 1
Public Health Fredericton Public Health 60,418 14,308 74,726 80.9% 38 Woodstock Public Health 18,976 4,562 23,538 80.6% 12
Rehab Facilities Stan Cassidy Centre For Rehabilitation 193,200 38,130 231,330 83.5% 119
RHA B Zone 3
RHA B Zone 3 Sub-Total 4,734,151 1,022,108 5,756,259 2,952 82.2%
May 2015 Section II - page 7

2013/2014 Annual Report of Hospital Services Section II - Compensation Expenses and StatisticsTable II-2: Total Worked and Benefit Hours by RHA by Facility (Excluding Medical) - 2013/2014 - Page 5 of 5
Note 1: Full-time Equivalents (FTEs) calculated as (Worked Hours + Benefit Hours + Purchased)/ 1950 hours. Note 2: Variation in the percent worked hours across RHAs may be due to different mixes of full-time and part-time employees. Note 3: Standby (on-call) and medical hours are excluded. Note 4: The facility type "Other Subservices" represents those facilities converted to CHCs that continue to provide subservices aligned with the regional facilities and Hospital Services (e.g. Lab, Diagnostic Imaging).
Facility Type Facility Worked Hours Benefit Hours Total Paid Hours % Worked/Total Total Calculated
FTEs
Acute Care Facilities Miramichi Regional Hospital 1,272,858 269,300 1,542,158 82.5% 791 Extra-Mural Program EMP Blackville Office 5,727 1,355 7,081 80.9% 4
EMP Miramichi Unit 57,696 13,613 71,309 80.9% 37 EMP Neguac 4,740 1,018 5,758 82.3% 3
Health Centres Baie Ste. Anne Health Clinic 4,244 1,116 5,360 79.2% 3 Blackville Health Clinic 5,172 901 6,072 85.2% 3 Néguac Health Clinic 7,310 1,149 8,459 86.4% 4 Rogersville Health Clinic 5,838 874 6,713 87.0% 3
Community Mental Health Miramichi Community Mental Health Centre 45,779 8,629 54,408 84.1% 28 Public Health Miramichi Public Health 30,858 6,049 36,907 83.6% 19
Acute Care Facilities Charlotte County Hospital 947 164 1,111 85.3% 1 Dr. Everett Chalmers Regional Hospital 14,311 2,738 17,050 83.9% 9 Grand Manan Hospital 5 1 6 85.8% 0 Hotel-Dieu of St. Joseph 302 56 358 84.3% 0 Miramichi Regional Hospital 5,313 1,036 6,349 83.7% 3 Oromocto Public Hospital 161 41 202 79.9% 0 Sackville Memorial Hospital 115 23 138 83.6% 0 Saint John Regional Hospital 18,822 3,456 22,278 84.5% 11 St. Joseph's Hospital 1,344 256 1,600 84.0% 1 Sussex Health Centre 303 55 358 84.5% 0 The Moncton Hospital 16,060 3,077 19,137 83.9% 10 Upper River Valley Hospital 753 147 901 83.6% 0
Health Centres Fundy Health Centre - Blacks Harbour 659 111 770 85.6% 0 Harvey Health Centre 2 0 2 84.9% 0
Psychiatric Facilities Centracare 73 12 86 85.5% 0 Community Health Centres St-Joseph's Community Health Centre 1,159 195 1,354 85.6% 1
Tobique Valley Community Health Centre 5 1 6 85.9% 0 Other Subservices Albert County 2 0 3 86.7% 0
Minto 13 2 15 86.8% 0 Tobique Valley 10 2 12 86.8% 0 Upper Miramichi Health Services Centre - Doaktown 2 0 3 86.0% 0
Rehab Facilities Stan Cassidy Centre For Rehabilitation 19 7 26 73.5% 0
RHA B Zone 7
RHA B Zone 7 Sub-Total 1,440,220 304,004 1,744,224 894 82.6%
RHA B Organization
RHA B Organization Sub-Total 60,382 11,382 71,764 37 84.1%
RHA B Total 16,698,753 3,516,196 20,214,949 10,367 82.6%
28,448,462 6,041,015 34,489,477 17,687 269,517 1,672,020 1,402,503 83.9%
82.5% 857 Facilicorp Total
Total
May 2015 Section II - page 8

Section II - Compensation Expenses and Statistics2013/2014 Annual Report of Hospital Services
Table II-3: Total Worked and Benefit Hours by Functional Area by RHA (Excluding Medical) - 2013/2014 - Page 1
Note 1: Full-time Equivalent (FTEs) calculated as (Worked Hours + Benefit Hours + Purchased)/1950 hours. Note 2: Standby (on-call) and medical hours are excluded. Note 3: "Other Diagnostic and Therapeutics" includes Radiation Oncology, ECG, Physiotherapy, Occupational Therapy, etc. Note 4: Emergency Services may include hours related to inpatients who are admitted, but remain in the Emergency Room. Note 5: "Education" includes Medical Education where the program exists. Note 6: In RRS A Zone 4, Community Services represents Early Language Services.
Functional Centre Group Functional Area
Worked Hours
Benefit Hours
FTEs (calculated
)
RRS A Zone 1
RRS A % of Total FTEs
Worked Hours
Benefit Hours
FTEs (calculated
)
RRS A Zone 4
RRS A % of Total FTEs
Worked Hours
Benefit Hours
FTEs (calculated
)
RRS A Zone 5
RRS A % of Total FTEs
Administration & Support Administrative Support 164,267 34,123 102 4.9% 122,076 24,693 75 6.1% 131,404 31,337 83 6.4% Clinical Support 158,024 29,995 96 4.7% 114,565 22,716 70 5.7% 72,572 14,756 45 3.4% Hotel 299,072 54,898 182 8.8% 169,315 39,760 107 8.7% 212,080 41,247 130 10.0% Plant 94,008 13,380 55 2.7% 67,431 11,006 40 3.2% 72,961 16,856 46 3.5%
Nursing Inpatient Nursing Admin & Medical Resources 37,177 7,240 23 1.1% 43,866 11,510 28 2.3% 51,291 9,960 31 2.4% Acute Inpatient 524,464 108,742 325 15.7% 304,361 76,857 195 15.8% 213,569 44,116 132 10.1% Maternal and Newborn 62,424 14,805 40 1.9% 63,391 16,027 41 3.3% 54,838 10,776 34 2.6% Critical Care 82,728 18,834 52 2.5% 48,589 12,737 31 2.5% 31,394 7,594 20 1.5% Operating Room/PARR/Day Surgery 96,116 21,784 60 2.9% 58,101 16,803 38 3.1% 42,927 11,639 28 2.1% Mental Health 49,021 10,296 30 1.5% 35,045 8,653 22 1.8% 385,761 73,185 235 18.1%
Restorative Care Inpatient Rehabilitation 56,508 10,539 34 1.7% 0 0 0 0.0% 0 0 0 0.0% Extended (Chronic) Care 105,338 19,356 64 3.1% 75,782 17,542 48 3.9% 92,998 22,430 59 4.5%
Non-Inpatient Services Emergency Services 133,583 30,989 84 4.1% 99,019 20,597 61 4.9% 56,356 12,233 35 2.7% Ambulatory Care 289,773 66,572 183 8.8% 110,036 26,392 70 5.6% 66,504 16,903 43 3.3% Extra-Mural Program 143,775 32,865 91 4.4% 112,658 30,401 73 5.9% 52,288 12,760 33 2.6% Addiction 0 0 0 0.0% 33,419 8,696 22 1.7% 48,598 9,960 30 2.3% Community Services 52,741 9,391 32 1.5% 10,118 2,559 7 0.5% 33,848 8,631 22 1.7% Home Dialysis 0 0 0 0.0% 2,835 813 2 0.2% 0 0 0 0.0%
Diagnostic & Therapeutic Laboratory 180,859 35,881 111 5.4% 81,372 17,139 51 4.1% 73,086 16,865 46 3.5% Medical Imaging/Breast Screening 163,609 36,866 103 5.0% 73,147 16,856 46 3.7% 58,143 10,939 35 2.7% Other Diagnostic and Therapeutic 383,797 75,578 236 11.4% 189,162 41,462 118 9.5% 220,362 42,251 135 10.3%
Public & Mental Health Public Health 86,739 21,206 55 2.7% 38,049 8,760 24 1.9% 20,705 6,848 14 1.1% Community Mental Health 83,347 18,620 52 2.5% 74,377 16,792 47 3.8% 73,284 15,650 46 3.5%
Other Research and Education 52,728 10,938 33 1.6% 11,393 5,786 9 0.7% 11,025 1,973 7 0.5% Other Undistributed Expenses 39,293 9,584 25 1.2% 20,015 4,333 12 1.0% 23,141 4,361 14 1.1%
Sub Total 715,371 473,388 489,017 132,396 98,176 104,196 435 293 304 21.0% 23.6% 23.3%
Sub Total 851,930 553,353 779,780 181,701 142,587 157,271 530 357 481 25.6% 28.8% 36.9%
Sub Total 161,846 75,782 92,998 29,895 17,542 22,430 98 48 59 4.8% 3.9% 4.5%
Sub Total 619,872 368,083 257,594 139,817 89,457 60,488 390 235 163 18.8% 18.9% 12.5%
Sub Total 728,265 343,681 351,591 148,325 75,457 70,055 450 215 216 21.7% 17.3% 16.6%
Sub Total 170,086 112,427 93,989 39,826 25,551 22,498 108 71 60 5.2% 5.7% 4.6%
Sub Total 92,021 31,408 34,166 20,522 10,118 6,334 58 21 21 2.8% 1.7% 1.6% Total 3,339,391 1,958,122 2,099,136 692,482 458,888 443,272 2,068 1,239 1,304 100.0% 100.0% 100.0%
May 2015 Section II - page 9

Section II - Compensation Expenses and Statistics2013/2014 Annual Report of Hospital Services
Table II-3: Total Worked and Benefit Hours by Functional Area by RHA (Excluding Medical) - 2013/2014 - Page 1b
Note 1: Full-time Equivalent (FTEs) calculated as (Worked Hours + Benefit Hours + Purchased)/1950 hours. Note 2: Standby (on-call) and medical hours are excluded. Note 3: "Other Diagnostic and Therapeutics" includes Radiation Oncology, ECG, Physiotherapy, Occupational Therapy, etc. Note 4: Emergency Services may include hours related to inpatients who are admitted, but remain in the Emergency Room. Note 5: "Education" includes Medical Education where the program exists. Note 6: In RRS A Zone 4, Community Services represents Early Language Services.
Functional Centre Group Functional Area
Worked Hours
Benefit Hours
FTEs (calculated
)
RRS A Zone 6
RRS A % of Total FTEs
Worked Hours
Benefit Hours
FTEs (calculated
)
RRS A Organisation
RRS A % of Total FTEs
Worked Hours
Benefit Hours
FTEs (calculated
)
Total
RRS A % of Total FTEs
Administration & Support Administrative Support 156,672 32,581 97 5.3% 50,260 8,278 30 99.5% 624,679 131,012 388 6.0% Clinical Support 161,905 37,363 102 5.6% 0 0 0 0.0% 507,066 104,830 314 4.9% Hotel 210,898 43,695 131 7.2% 0 0 0 0.0% 891,365 179,599 549 8.5% Plant 124,634 17,125 73 4.0% 0 0 0 0.0% 359,034 58,367 214 3.3%
Nursing Inpatient Nursing Admin & Medical Resources 35,435 23,578 30 1.7% 0 0 0 0.0% 167,769 52,289 113 1.7% Acute Inpatient 479,608 102,340 298 16.4% 0 0 0 0.0% 1,522,002 332,055 951 14.7% Maternal and Newborn 74,034 19,877 48 2.6% 0 0 0 0.0% 254,687 61,486 162 2.5% Critical Care 49,759 12,289 32 1.7% 0 0 0 0.0% 212,470 51,454 135 2.1% Operating Room/PARR/Day Surgery 72,267 21,041 48 2.6% 0 0 0 0.0% 269,411 71,267 175 2.7% Mental Health 47,220 11,399 30 1.7% 0 0 0 0.0% 517,047 103,532 318 4.9%
Restorative Care Inpatient Rehabilitation 0 0 0 0.0% 0 0 0 0.0% 56,508 10,539 34 0.5% Extended (Chronic) Care 83,668 18,731 53 2.9% 0 0 0 0.0% 357,786 78,060 224 3.5%
Non-Inpatient Services Emergency Services 168,907 37,238 106 5.8% 0 0 0 0.0% 457,864 101,056 287 4.4% Ambulatory Care 175,913 46,484 114 6.3% 0 0 0 0.0% 642,226 156,351 410 6.3% Extra-Mural Program 133,204 34,854 86 4.7% 0 0 0 0.0% 441,925 110,880 283 4.4% Addiction 39,963 10,263 26 1.4% 0 0 0 0.0% 121,979 28,920 77 1.2% Community Services 64,148 13,276 40 2.2% 0 0 0 0.0% 160,855 33,857 100 1.5% Home Dialysis 2,020 317 1 0.1% 0 0 0 0.0% 4,855 1,130 3 0.0%
Diagnostic & Therapeutic Laboratory 163,590 30,597 100 5.5% 176 39 0 0.4% 499,083 100,521 307 4.8% Medical Imaging/Breast Screening 142,950 34,222 91 5.0% 0 0 0 0.0% 437,849 98,883 275 4.3% Other Diagnostic and Therapeutic 305,848 58,659 187 10.3% 68 0 0 0.1% 1,099,237 217,950 675 10.5%
Public & Mental Health Public Health 54,062 14,130 35 1.9% 0 0 0 0.0% 199,555 50,943 128 2.0% Community Mental Health 118,446 25,760 74 4.1% 0 0 0 0.0% 349,455 76,822 219 3.4%
Other Research and Education 15,108 5,520 11 0.6% 0 0 0 0.0% 90,254 24,217 59 0.9% Other Undistributed Expenses 19,795 1,005 11 0.6% 0 0 0 0.0% 102,245 19,282 62 1.0%
Sub Total 654,109 130,764 402 50,260 8,278 30 22.1% 99.5% 22.7% 2,382,144 473,809 1,465
Sub Total 758,323 190,524 487 0 0 0 26.7% 0.0% 28.7% 2,943,386 672,083 1,854
Sub Total 83,668 18,731 53 0 0 0 2.9% 0.0% 4.0% 414,294 88,599 258
Sub Total 584,154 142,432 373 0 0 0 20.5% 0.0% 17.9% 1,829,704 432,194 1,160
Sub Total 612,388 123,478 377 243 39 0 20.7% 0.5% 19.5% 2,036,169 417,354 1,258
Sub Total 172,509 39,890 109 0 0 0 6.0% 0.0% 5.4% 549,010 127,765 347
Sub Total 34,903 6,525 21 0 0 0 1.2% 0.0% 1.9% 192,499 43,499 121 Total 2,900,054 652,345 1,822 50,503 8,316 30 100.0% 100.0% 100.0% 10,347,206 2,255,303 6,463
May 2015 Section II - page 10

Section II - Compensation Expenses and Statistics2013/2014 Annual Report of Hospital Services
Table II-3: Total Worked and Benefit Hours by Functional Area by RHA (Excluding Medical) - 2013/2014 - Page 1c
Note 1: Full-time Equivalent (FTEs) calculated as (Worked Hours + Benefit Hours + Purchased)/1950 hours. Note 2: Standby (on-call) and medical hours are excluded. Note 3: "Other Diagnostic and Therapeutics" includes Radiation Oncology, ECG, Physiotherapy, Occupational Therapy, etc. Note 4: Emergency Services may include hours related to inpatients who are admitted, but remain in the Emergency Room. Note 5: "Education" includes Medical Education where the program exists. Note 6: In RRS A Zone 4, Community Services represents Early Language Services.
Functional Centre Group Functional Area
Worked Hours
Benefit Hours
FTEs (calculated
)
RHA B Zone 1
RHA B % of Total FTEs
Worked Hours
Benefit Hours
FTEs (calculated
)
RHA B Zone 2
RHA B % of Total FTEs
Worked Hours
Benefit Hours
FTEs (calculated
)
RHA B Zone 3
RHA B % of Total FTEs
Administration & Support Administrative Support 204,753 39,925 125 5.4% 284,601 57,364 175 4.2% 261,755 58,848 164 5.6% Clinical Support 152,674 30,151 94 4.0% 284,803 60,027 177 4.3% 182,001 36,883 112 3.8% Hotel 296,352 61,063 183 7.8% 685,105 139,363 423 10.2% 432,530 97,301 272 9.2% Plant 127,621 20,079 76 3.2% 262,977 32,335 151 3.7% 139,456 27,867 86 2.9%
Nursing Inpatient Nursing Admin & Medical Resources 68,706 33,655 52 2.2% 265,148 74,228 174 4.2% 108,831 23,717 68 2.3% Acute Inpatient 691,889 138,655 426 18.2% 1,069,522 226,659 665 16.0% 769,021 162,069 477 16.2% Maternal and Newborn 94,443 22,478 60 2.6% 101,014 24,513 64 1.6% 124,445 25,567 77 2.6% Critical Care 181,541 46,257 117 5.0% 256,264 53,760 159 3.8% 165,918 40,686 106 3.6% Operating Room/PARR/Day Surgery 151,188 41,056 99 4.2% 234,467 52,851 147 3.6% 165,995 36,867 104 3.5% Mental Health 71,318 12,608 43 1.8% 131,775 27,084 81 2.0% 48,862 11,788 31 1.1%
Restorative Care Inpatient Rehabilitation 33,805 6,625 21 0.9% 40,333 8,089 25 0.6% 111,851 23,374 69 2.3% Extended (Chronic) Care 71,597 15,843 45 1.9% 315,772 68,084 197 4.8% 102,834 20,113 63 2.1%
Non-Inpatient Services Emergency Services 177,363 41,113 112 4.8% 247,372 53,315 154 3.7% 235,176 55,070 149 5.0% Ambulatory Care 225,826 46,827 140 6.0% 403,070 88,196 252 6.1% 188,809 40,951 118 4.0% Extra-Mural Program 142,840 28,118 88 3.7% 238,679 54,510 150 3.6% 218,687 49,876 138 4.7% Addiction 59,054 12,714 37 1.6% 107,274 23,045 67 1.6% 44,872 12,108 29 1.0% Community Services 54,403 11,271 34 1.4% 55,406 12,522 35 0.8% 145,707 34,778 93 3.1% Home Dialysis 0 0 0 0.0% 11,699 2,334 7 0.2% 0 0 0 0.0%
Diagnostic & Therapeutic Laboratory 206,910 39,005 126 5.4% 303,858 61,211 187 4.5% 253,802 54,282 158 5.4% Medical Imaging/Breast Screening 167,403 32,373 102 4.4% 303,860 60,036 187 4.5% 206,184 39,071 126 4.3% Other Diagnostic and Therapeutic 394,426 75,804 241 10.3% 640,052 117,844 389 9.4% 518,376 101,420 318 10.8%
Public & Mental Health Public Health 0 0 0 0.0% 81,345 16,495 50 1.2% 79,394 18,870 50 1.7% Community Mental Health 81,438 18,068 51 2.2% 167,561 37,893 105 2.5% 144,961 29,232 89 3.0%
Other Research and Education 59,677 12,053 37 1.6% 85,920 16,047 52 1.3% 30,482 7,407 19 0.7% Other Undistributed Expenses 58,493 7,019 34 1.4% 112,402 18,140 67 1.6% 54,202 13,963 35 1.2%
Sub Total 781,400 1,517,486 1,015,742 151,217 289,089 220,899 478 926 634 20.4% 22.4% 21.5%
Sub Total 1,259,085 2,058,190 1,383,072 294,707 459,095 300,694 797 1,291 863 34.0% 31.2% 29.3%
Sub Total 105,402 356,105 214,685 22,468 76,173 43,487 66 222 132 2.8% 5.4% 4.5%
Sub Total 659,485 1,063,500 833,251 140,044 233,922 192,783 410 665 526 17.5% 16.1% 17.8%
Sub Total 768,739 1,247,770 978,362 147,183 239,091 194,773 470 762 602 20.1% 18.4% 20.4%
Sub Total 81,438 248,906 224,355 18,068 54,388 48,102 51 156 140 2.2% 3.8% 4.7%
Sub Total 118,170 198,322 84,684 19,071 34,187 21,370 70 119 54 3.0% 2.9% 1.8% Total 3,773,721 6,690,279 4,734,151 792,757 1,385,945 1,022,108 2,342 4,142 2,952 100.0% 100.0% 100.0%
May 2015 Section II - page 11

Section II - Compensation Expenses and Statistics2013/2014 Annual Report of Hospital Services
Table II-3: Total Worked and Benefit Hours by Functional Area by RHA (Excluding Medical) - 2013/2014 - Page 1d
Note 1: Full-time Equivalent (FTEs) calculated as (Worked Hours + Benefit Hours + Purchased)/1950 hours. Note 2: Standby (on-call) and medical hours are excluded. Note 3: "Other Diagnostic and Therapeutics" includes Radiation Oncology, ECG, Physiotherapy, Occupational Therapy, etc. Note 4: Emergency Services may include hours related to inpatients who are admitted, but remain in the Emergency Room. Note 5: "Education" includes Medical Education where the program exists. Note 6: In RRS A Zone 4, Community Services represents Early Language Services.
Functional Centre Group Functional Area
Worked Hours
Benefit Hours
FTEs (calculated
)
RHA B Zone 7
RHA B % of Total FTEs
Worked Hours
Benefit Hours
FTEs (calculated
)
RHA B Organization
RHA B % of Total FTEs
Worked Hours
Benefit Hours
FTEs (calculated
)
Total
RHA B % of Total FTEs
Administration & Support Administrative Support 77,690 19,739 50 5.6% 44,673 7,522 27 72.7% 873,472 183,398 542 5.2% Clinical Support 71,348 13,493 44 4.9% 2,968 1,001 2 5.5% 693,795 141,555 428 4.1% Hotel 139,604 31,724 88 9.8% 0 0 0 0.0% 1,553,591 329,451 966 9.3% Plant 59,597 7,915 35 3.9% 0 0 0 0.0% 589,650 88,196 348 3.4%
Nursing Inpatient Nursing Admin & Medical Resources 25,965 5,901 16 1.8% 0 0 0 0.0% 468,650 137,501 311 3.0% Acute Inpatient 230,336 46,319 142 15.9% 0 0 0 0.0% 2,760,768 573,701 1,710 16.5% Maternal and Newborn 44,186 12,311 29 3.2% 0 0 0 0.0% 364,088 84,869 230 2.2% Critical Care 44,814 8,752 27 3.1% 0 0 0 0.0% 648,537 149,454 409 3.9% Operating Room/PARR/Day Surgery 51,773 11,145 32 3.6% 0 0 0 0.0% 603,423 141,919 382 3.7% Mental Health 27,466 6,592 17 2.0% 0 0 0 0.0% 279,421 58,072 173 1.7%
Restorative Care Inpatient Rehabilitation 45,654 9,681 28 3.2% 0 0 0 0.0% 231,643 47,768 143 1.4% Extended (Chronic) Care 0 0 0 0.0% 0 0 0 0.0% 490,203 104,040 305 2.9%
Non-Inpatient Services Emergency Services 78,798 16,300 49 5.5% 0 0 0 0.0% 738,709 165,798 464 4.5% Ambulatory Care 55,978 12,539 35 3.9% 0 0 0 0.0% 873,682 188,513 545 5.3% Extra-Mural Program 65,918 15,711 42 4.7% 0 0 0 0.0% 666,124 148,215 418 4.0% Addiction 43,819 11,036 28 3.1% 0 0 0 0.0% 255,019 58,904 161 1.6% Community Services 27,844 5,112 17 1.9% 0 0 0 0.0% 283,359 63,683 178 1.7% Home Dialysis 0 0 0 0.0% 0 0 0 0.0% 11,699 2,334 7 0.1%
Diagnostic & Therapeutic Laboratory 59,586 12,308 37 4.1% 1,744 236 1 2.8% 825,900 167,042 509 4.9% Medical Imaging/Breast Screening 59,598 11,048 36 4.1% 1,664 272 1 2.7% 738,708 142,800 452 4.4% Other Diagnostic and Therapeutic 141,125 27,500 86 9.7% 5,130 864 3 8.4% 1,699,110 323,432 1,037 10.0%
Public & Mental Health Public Health 30,858 6,049 19 2.1% 0 0 0 0.0% 191,597 41,414 119 1.2% Community Mental Health 45,779 8,629 28 3.1% 0 0 0 0.0% 439,739 93,822 274 2.6%
Other Research and Education 7,829 3,012 6 0.6% 4,203 1,486 3 7.9% 188,110 40,004 117 1.1% Other Undistributed Expenses 4,657 1,187 3 0.3% 0 0 0 0.0% 229,754 40,309 138 1.3%
Sub Total 348,239 72,871 216 47,641 8,524 29 24.1% 78.3% 22.0% 3,710,509 742,600 2,284
Sub Total 424,540 91,021 264 0 0 0 29.6% 0.0% 31.0% 5,124,888 1,145,517 3,216
Sub Total 45,654 9,681 28 0 0 0 3.2% 0.0% 4.3% 721,846 151,808 448
Sub Total 272,356 60,698 171 0 0 0 19.1% 0.0% 17.1% 2,828,593 627,447 1,772
Sub Total 260,309 50,855 160 8,538 1,372 5 17.8% 13.8% 19.3% 3,263,718 633,275 1,998
Sub Total 76,636 14,679 47 0 0 0 5.2% 0.0% 3.8% 631,336 135,236 393
Sub Total 12,485 4,199 9 4,203 1,486 3 1.0% 7.9% 2.5% 417,864 80,313 255 Total 1,440,220 304,004 894 60,382 11,382 37 100.0% 100.0% 100.0% 16,698,753 3,516,196 10,367
May 2015 Section II - page 12

Section II - Compensation Expenses and Statistics2013/2014 Annual Report of Hospital Services
Table II-3: Total Worked and Benefit Hours by Functional Area by RHA (Excluding Medical) - 2013/2014 - Page 1e
Note 1: Full-time Equivalent (FTEs) calculated as (Worked Hours + Benefit Hours + Purchased)/1950 hours. Note 2: Standby (on-call) and medical hours are excluded. Note 3: "Other Diagnostic and Therapeutics" includes Radiation Oncology, ECG, Physiotherapy, Occupational Therapy, etc. Note 4: Emergency Services may include hours related to inpatients who are admitted, but remain in the Emergency Room. Note 5: "Education" includes Medical Education where the program exists. Note 6: In RRS A Zone 4, Community Services represents Early Language Services.
Functional Centre Group Functional Area
Worked Hours
Benefit Hours
FTEs (calculated
)
Facilicorp
Facilicorp % of Total FTEs
Worked Hours
Benefit Hours
FTEs (calculated
)
Total % of Total FTEs
Administration & Support Administrative Support 855,510 172,405 527 61.5% 2,353,661 486,815 1,457 8.2% Clinical Support 171,399 34,745 106 12.3% 1,372,260 281,130 848 4.8% Hotel 375,594 62,366 225 26.2% 2,820,551 571,416 1,739 9.8% Plant 0 0 0 0.0% 948,684 146,564 562 3.2%
Nursing Inpatient Nursing Admin & Medical Resources 0 0 0 0.0% 636,419 189,790 424 2.4% Acute Inpatient 0 0 0 0.0% 4,282,770 905,756 2,661 15.0% Maternal and Newborn 0 0 0 0.0% 618,775 146,355 392 2.2% Critical Care 0 0 0 0.0% 861,007 200,909 545 3.1% Operating Room/PARR/Day Surgery 0 0 0 0.0% 872,834 213,187 557 3.1% Mental Health 0 0 0 0.0% 796,468 161,604 491 2.8%
Restorative Care Inpatient Rehabilitation 0 0 0 0.0% 288,151 58,307 178 1.0% Extended (Chronic) Care 0 0 0 0.0% 847,989 182,100 528 3.0%
Non-Inpatient Services Emergency Services 0 0 0 0.0% 1,196,573 266,854 750 4.2% Ambulatory Care 0 0 0 0.0% 1,515,908 344,864 954 5.4% Extra-Mural Program 0 0 0 0.0% 1,108,049 259,095 701 4.0% Addiction 0 0 0 0.0% 376,998 87,823 238 1.3% Community Services 0 0 0 0.0% 444,214 97,540 278 1.6% Home Dialysis 0 0 0 0.0% 16,554 3,464 10 0.1%
Diagnostic & Therapeutic Laboratory 0 0 0 0.0% 1,324,983 267,563 817 4.6% Medical Imaging/Breast Screening 0 0 0 0.0% 1,176,557 241,683 727 4.1% Other Diagnostic and Therapeutic 0 0 0 0.0% 2,798,347 541,382 1,713 9.7%
Public & Mental Health Public Health 0 0 0 0.0% 391,152 92,357 248 1.4% Community Mental Health 0 0 0 0.0% 789,194 170,644 492 2.8%
Other Research and Education 0 0 0 0.0% 278,365 64,222 176 1.0% Other Undistributed Expenses 0 0 0 0.0% 331,999 59,591 201 1.1%
Sub Total 26.0% 1,402,503 269,517 857 100.0% 7,495,156 1,485,925 4,606
Sub Total 28.7% 0 0 0 0.0% 8,068,274 1,817,600 5,070
Sub Total 4.0% 0 0 0 0.0% 1,136,140 240,407 706
Sub Total 16.6% 0 0 0 0.0% 4,658,296 1,059,641 2,932
Sub Total 18.4% 0 0 0 0.0% 5,299,887 1,050,628 3,257
Sub Total 4.2% 0 0 0 0.0% 1,180,346 263,001 740
Sub Total 2.1% 0 0 0 0.0% 610,363 123,812 377 Total 100.0% 1,402,503 269,517 857 100.0% 28,448,462 6,041,015 17,687
May 2015 Section II - page 13

Section II - Compensation Expenses and Statistics2013/2014 Annual Report of Hospital Services
Table II-4: Salaries Expense Per Paid Hour by Functional Area by RHA (Excluding Medical) - 2013/2014
Note 1: Salaries include benefits and worked salaries but excludes benefit contributions. Note 2: Paid Hours includes benefit and worked hours. Note 3: Standby (on-call) hours are excluded. Note 4: "Other Diagnostic and Therapeutics" includes Radiation Oncology, ECG, Physiotherapy, Occupational Therapy etc. Note 5: "Education" includes Medical Education where the program exists. Note 6: Most RHAs have reported expenses for purchased services, but have not reported hours, therefore inflating the hourly rate. Note 7: In RRS A Zone 4, Addiction represents the addictions outpatient clinics and Community Services represents the inpatient part of addiction services.
Functional Centre Group Functional Area
Avg
RRS A Zone 1
Avg
RRS A Zone 4
Avg
RRS A Zone 5
Avg
RRS A Zone 6
Avg
RRS A Org
Régie régionale de la santé A Régie régionale
de la santé A Avg
Avg
RHA B Zone 1
Avg
RHA B Zone 2
Avg
RHA B Zone 3
Avg
RHA B Zone 7
Avg
RHA B Org
Regional Health Authority B Regional Health
Authority B Avg
Facilicorp Avg
Provincial Avg
Administration & Support Administrative Support 29.24 30.13 26.54 28.93 46.89 30.12 26.96 28.90 26.75 28.22 53.43 28.95 28.48 29.09 Clinical Support 22.98 22.11 22.76 21.74 0.00 22.35 23.04 21.80 23.26 24.06 41.01 22.78 32.04 23.78 Hotel 18.79 18.84 18.26 17.73 0.00 18.42 18.93 18.29 18.71 18.63 0.00 18.56 18.73 18.54 Plant 22.19 22.57 24.39 22.13 0.00 22.71 22.95 22.14 24.40 22.23 0.00 22.88 0.00 22.82
Nursing Inpatient Nursing Admin & Medical Resources 36.87 38.48 35.57 34.09 0.00 36.17 34.41 28.89 29.16 34.15 0.00 30.16 0.00 31.76 Acute Inpatient 31.88 29.36 28.95 31.04 0.00 30.69 32.54 30.95 31.66 30.75 0.00 31.53 0.00 31.23 Maternal and Newborn 37.73 33.31 32.58 35.32 0.00 34.83 36.07 35.69 35.59 37.37 0.00 35.97 0.00 35.50 Critical Care 36.89 36.57 35.63 36.55 0.00 36.55 38.60 37.08 37.61 37.40 0.00 37.67 0.00 37.39 Operating Room/PARR/Day Surgery 32.62 33.46 32.16 34.25 0.00 33.18 33.06 34.84 34.08 36.30 0.00 34.30 0.00 33.95 Mental Health 33.02 33.92 28.02 33.24 0.00 29.41 33.29 33.02 33.74 34.92 0.00 33.41 0.00 30.82
Restorative Care Inpatient Rehabilitation 28.84 0.00 0.00 0.00 0.00 28.84 32.13 32.59 31.54 28.74 0.00 31.25 0.00 30.79 Extended (Chronic) Care 29.53 27.33 29.20 26.98 0.00 28.37 31.06 30.88 30.58 0.00 0.00 30.85 0.00 29.80
Non-Inpatient Services Emergency Services 34.38 35.46 34.81 34.34 0.00 34.65 35.30 35.65 35.32 33.78 0.00 35.26 0.00 35.03 Ambulatory Care 34.33 34.18 33.60 34.50 0.00 34.27 33.06 33.07 33.14 33.18 0.00 33.09 0.00 33.60 Extra-Mural Program 35.14 35.16 34.86 35.13 0.00 35.11 36.42 35.34 35.56 36.43 0.00 35.75 0.00 35.49 Addiction 0.00 31.99 28.71 32.12 0.00 30.76 35.26 30.25 33.51 32.97 0.00 32.46 0.00 31.91 Community Services 31.36 39.54 34.66 34.39 0.00 33.82 33.29 36.68 31.29 28.84 0.00 32.49 0.00 32.97 Home Dialysis 0.00 31.30 0.00 44.46 0.00 36.44 0.00 36.87 0.00 0.00 0.00 36.87 0.00 36.74
Diagnostic & Therapeutic Laboratory 28.19 29.27 27.34 26.54 81.15 27.73 27.92 28.12 28.78 27.71 47.27 28.28 0.00 28.07 Medical Imaging/Breast Screening 27.36 28.35 27.20 27.74 0.00 27.63 28.96 27.64 28.73 30.46 52.24 28.52 0.00 28.18 Other Diagnostic and Therapeutic 33.77 29.87 30.75 30.61 50.49 31.61 32.72 33.40 31.80 30.16 54.78 32.54 0.00 32.18
Public & Mental Health Public Health 37.69 36.03 37.63 38.64 0.00 37.63 0.00 38.42 38.92 38.45 0.00 38.63 0.00 38.12 Community Mental Health 34.29 33.41 31.66 35.10 0.00 33.82 33.72 32.92 33.69 35.00 0.00 33.53 0.00 33.66
Other Research and Education 42.48 33.48 36.06 33.68 0.00 38.81 39.50 30.52 34.67 38.02 34.23 34.48 0.00 35.93 Other Undistributed Expenses 34.72 69.64 66.05 16.07 0.00 45.61 34.85 29.03 30.13 176.64 0.00 33.91 0.00 37.54
Weighted Average 22.52 22.37 21.60 22.48 22.60 23.04 22.12 22.24 22.99 23.36 26.36 52.55 46.89 22.47
Weighted Average 33.33 32.91 32.24 33.92 33.18 31.90 29.64 32.47 31.83 32.52 0.00 0.00 0.00 32.92
Weighted Average 28.74 31.08 31.07 31.40 29.29 27.33 29.20 26.98 28.44 30.05 0.00 0.00 0.00 30.98
Weighted Average 33.68 34.08 34.13 34.61 34.29 34.75 33.36 34.45 34.30 34.23 0.00 0.00 0.00 34.18
Weighted Average 29.66 30.36 30.69 30.61 30.93 29.40 29.44 28.84 29.79 30.26 0.00 52.78 73.82 30.55
Weighted Average 36.39 35.58 34.69 33.72 36.04 34.29 33.07 36.24 35.23 35.15 0.00 0.00 0.00 35.08
Weighted Average 86.57 31.75 29.68 37.28 39.11 54.68 56.42 24.84 42.31 36.79 0.00 34.23 0.00 34.17 Total Weighted Average 30.41 30.66 30.36 29.83 31.07 30.80 30.26 28.88 29.84 30.12 30.11 26.36 51.13 47.02
May 2015 Section II - page 14

Section II - Compensation Expenses and Statistics2013/2014 Annual Report of Hospital Services
Table II-5: Total UPP and MOS Worked Hours by Functional Area by RHA (Excluding Medical) - 2013/2014 - Page 1
Note 1: Community Services may include Early Language Services in some RHAs. Note 2: Worked hours include purchased hours and exclude standby (on-call) hours.
Functonal Center
MOS Hours UPP Hours % MOSRRS A Zone 1
MOS Hours UPP Hours % MOSRRS A Zone 4
MOS Hours UPP Hours % MOSRRS A Zone 5
RRS A
Administration & Support Administrative Support 34,103 130,164 20.8% 42,920 79,156 35.2% 31,924 99,481 24.3% Clinical Support 28,141 129,883 17.8% 7,249 107,316 6.3% 6,459 66,114 8.9% Hotel 9,880 289,192 3.3% 9,380 159,935 5.5% 8,733 203,347 4.1% Plant 13,521 80,487 14.4% 3,846 63,585 5.7% 9,669 63,292 13.3%
Nursing Inpatient Nursing Admin. & Medical Resources 32,927 4,250 88.6% 42,735 1,130 97.4% 39,975 11,316 77.9% Acute Inpatient 81,819 442,645 15.6% 28,311 276,050 9.3% 17,369 196,200 8.1% Maternal and Newborn 7,412 55,012 11.9% 7,884 55,507 12.4% 6,115 48,724 11.2% Critical Care 12,587 70,141 15.2% 4,885 43,704 10.1% 3,157 28,238 10.1% Operating Room/PARR/Day Surgery 18,347 77,769 19.1% 16,462 41,639 28.3% 8,408 34,518 19.6% Mental Health 11,548 37,473 23.6% 5,865 29,180 16.7% 25,534 360,227 6.6%
Restorative Care Inpatient Rehabilitation 6,333 50,175 11.2% 0 0 0.0% 0 0 0.0% Extended (Chronic) Care 11,039 94,299 10.5% 6,580 69,201 8.7% 8,308 84,691 8.9%
Non-Inpatient Services Emergency Services 26,755 106,828 20.0% 18,687 80,331 18.9% 7,721 48,635 13.7% Ambulatory Care 60,850 228,923 21.0% 24,046 85,989 21.9% 8,948 57,556 13.5% Extra-Mural Program 22,890 120,885 15.9% 19,441 93,217 17.3% 8,228 44,060 15.7% Addiction 0 0 0.0% 3,706 29,713 11.1% 6,180 42,418 12.7% Community Services 16,541 36,200 31.4% 3,437 6,680 34.0% 11,472 22,376 33.9% Home Dialysis 0 0 0.0% 1,136 1,698 40.1% 0 0 0.0%
Diagnostic & Therapeutic Laboratory 21,702 159,157 12.0% 6,273 75,100 7.7% 13,168 59,918 18.0% Medical Imaging/Breast Screening 74,292 89,317 45.4% 34,037 39,110 46.5% 24,423 33,720 42.0% Other Diagnostic and Therapeutic 54,349 329,448 14.2% 29,187 159,975 15.4% 25,811 194,551 11.7%
Public & Mental Health Public Health 9,744 76,995 11.2% 7,785 30,265 20.5% 2,568 18,137 12.4% Community Mental Health 15,540 67,807 18.6% 16,666 57,712 22.4% 13,954 59,330 19.0%
Other Research and Education 25,842 26,886 49.0% 5,317 6,076 46.7% 4,156 6,868 37.7% Other Undistributed Expenses 3,336 35,957 8.5% 3,143 16,871 15.7% 8,580 14,562 37.1%
85,645 63,395 56,784 629,726 409,992 432,233 12.0% 13.4% 11.6% Sub Total
164,640 106,143 100,558 687,290 447,210 679,223 19.3% 19.2% 12.9% Sub Total
17,372 6,580 8,308 144,474 69,201 84,691 10.7% 8.7% 8.9% Sub Total
127,036 70,454 42,549 492,836 297,629 215,045 20.5% 19.1% 16.5% Sub Total
150,343 69,497 63,402 577,922 274,184 288,189 20.6% 20.2% 18.0% Sub Total
25,284 24,450 16,522 144,802 87,976 77,467 14.9% 21.7% 17.6% Sub Total
29,178 8,461 12,736 62,843 22,948 21,430 31.7% 26.9% 37.3% Sub Total
Total 599,498 348,980 300,859 2,739,893 1,609,141 1,798,277 18.0% 17.8% 14.3%
May 2015 Section II - page 15

Section II - Compensation Expenses and Statistics2013/2014 Annual Report of Hospital Services
Table II-5: Total UPP and MOS Worked Hours by Functional Area by RHA (Excluding Medical) - 2013/2014 - Page 1b
Note 1: Community Services may include Early Language Services in some RHAs. Note 2: Worked hours include purchased hours and exclude standby (on-call) hours.
Functonal Center
MOS Hours UPP Hours % MOSRRS A Zone 6
MOS Hours UPP Hours % MOSRRS A Organisation
MOS Hours UPP HoursTotal
RRS A RRS A % MOS
Administration & Support Administrative Support 43,946 112,726 28.0% 40,957 9,303 81.5% 193,850 430,829 31.0% Clinical Support 26,911 134,993 16.6% 0 0 0.0% 68,760 438,306 13.6% Hotel 5,220 205,678 2.5% 0 0 0.0% 33,214 858,152 3.7% Plant 10,459 114,175 8.4% 0 0 0.0% 37,494 321,539 10.4%
Nursing Inpatient Nursing Admin. & Medical Resources 32,423 3,013 91.5% 0 0 0.0% 148,060 19,709 88.3% Acute Inpatient 56,030 423,578 11.7% 0 0 0.0% 183,529 1,338,473 12.1% Maternal and Newborn 8,439 65,595 11.4% 0 0 0.0% 29,849 224,838 11.7% Critical Care 6,516 43,243 13.1% 0 0 0.0% 27,144 185,326 12.8% Operating Room/PARR/Day Surgery 16,407 55,860 22.7% 0 0 0.0% 59,625 209,786 22.1% Mental Health 10,664 36,556 22.6% 0 0 0.0% 53,611 463,436 10.4%
Restorative Care Inpatient Rehabilitation 0 0 0.0% 0 0 0.0% 6,333 50,175 11.2% Extended (Chronic) Care 9,852 73,816 11.8% 0 0 0.0% 35,779 322,007 10.0%
Non-Inpatient Services Emergency Services 32,876 136,031 19.5% 0 0 0.0% 86,039 371,825 18.8% Ambulatory Care 43,882 132,031 24.9% 0 0 0.0% 137,727 504,499 21.4% Extra-Mural Program 28,419 104,784 21.3% 0 0 0.0% 78,978 362,947 17.9% Addiction 5,896 34,067 14.8% 0 0 0.0% 15,781 106,198 12.9% Community Services 25,273 38,876 39.4% 0 0 0.0% 56,723 104,132 35.3% Home Dialysis 0 2,020 0.0% 0 0 0.0% 1,136 3,719 23.4%
Diagnostic & Therapeutic Laboratory 12,707 150,882 7.8% 176 0 100.0% 54,026 445,057 10.8% Medical Imaging/Breast Screening 57,760 85,190 40.4% 0 0 0.0% 190,512 247,337 43.5% Other Diagnostic and Therapeutic 38,478 267,370 12.6% 68 0 100.0% 147,892 951,344 13.5%
Public & Mental Health Public Health 11,341 42,722 21.0% 0 0 0.0% 31,437 168,118 15.8% Community Mental Health 22,837 95,609 19.3% 0 0 0.0% 68,996 280,458 19.7%
Other Research and Education 6,571 8,538 43.5% 0 0 0.0% 41,886 48,368 46.4% Other Undistributed Expenses 3,152 16,643 15.9% 0 0 0.0% 18,211 84,033 17.8%
86,537 567,572 13.2% 14.0% Sub Total 40,957 9,303 81.5% 333,318 2,048,826
130,477 627,845 17.2% 17.0% Sub Total 0 0 0.0% 501,818 2,441,568
9,852 73,816 11.8% 10.2% Sub Total 0 0 0.0% 42,112 372,182
136,346 447,809 23.3% 20.6% Sub Total 0 0 0.0% 376,385 1,453,319
108,945 503,443 17.8% 19.3% Sub Total 243 0 100.0% 392,431 1,643,738
34,178 138,331 19.8% 18.3% Sub Total 0 0 0.0% 100,434 448,576
9,723 25,180 27.9% 31.2% Sub Total 0 0 0.0% 60,097 132,401
Total 516,058 2,383,996 17.8% 17.5% 41,200 9,303 81.6% 1,806,595 8,540,611
May 2015 Section II - page 16

Section II - Compensation Expenses and Statistics2013/2014 Annual Report of Hospital Services
Table II-5: Total UPP and MOS Worked Hours by Functional Area by RHA (Excluding Medical) - 2013/2014 - Page 1c
Note 1: Community Services may include Early Language Services in some RHAs. Note 2: Worked hours include purchased hours and exclude standby (on-call) hours.
Functonal Center
MOS Hours UPP Hours % MOSRHA B Zone 1
MOS Hours UPP Hours % MOSRHA B Zone 2
MOS Hours UPP Hours % MOSRHA B Zone 3
RHA B
Administration & Support Administrative Support 75,696 129,057 37.0% 86,768 197,833 30.5% 72,713 189,042 27.8% Clinical Support 12,046 140,628 7.9% 24,266 260,537 8.5% 17,174 164,827 9.4% Hotel 22,458 273,894 7.6% 34,349 650,756 5.0% 17,878 414,652 4.1% Plant 9,024 118,597 7.1% 25,429 237,548 9.7% 12,984 126,472 9.3%
Nursing Inpatient Nursing Admin. & Medical Resources 60,236 8,470 87.7% 187,218 77,930 70.6% 89,138 19,693 81.9% Acute Inpatient 94,546 597,343 13.7% 119,589 949,933 11.2% 66,124 702,897 8.6% Maternal and Newborn 12,528 81,916 13.3% 10,867 90,147 10.8% 13,867 110,578 11.1% Critical Care 22,374 159,167 12.3% 15,894 240,370 6.2% 19,936 145,982 12.0% Operating Room/PARR/Day Surgery 41,673 109,515 27.6% 40,091 194,376 17.1% 31,348 134,647 18.9% Mental Health 8,051 63,266 11.3% 8,149 123,626 6.2% 8,636 40,226 17.7%
Restorative Care Inpatient Rehabilitation 2,408 31,398 7.1% 9,379 30,954 23.3% 10,565 101,286 9.4% Extended (Chronic) Care 8,831 62,766 12.3% 25,148 290,624 8.0% 8,544 94,290 8.3%
Non-Inpatient Services Emergency Services 48,985 128,378 27.6% 39,352 208,020 15.9% 18,517 216,659 7.9% Ambulatory Care 78,380 147,446 34.7% 88,064 315,006 21.8% 44,438 144,371 23.5% Extra-Mural Program 20,763 122,077 14.5% 45,507 193,172 19.1% 39,991 178,696 18.3% Addiction 7,572 51,482 12.8% 14,721 92,553 13.7% 5,067 39,805 11.3% Community Services 19,865 34,538 36.5% 10,435 44,971 18.8% 61,625 84,082 42.3% Home Dialysis 0 0 0.0% 2,982 8,717 25.5% 0 0 0.0%
Diagnostic & Therapeutic Laboratory 23,210 183,700 11.2% 36,166 267,692 11.9% 18,633 235,169 7.3% Medical Imaging/Breast Screening 49,201 118,202 29.4% 122,038 181,822 40.2% 69,724 136,460 33.8% Other Diagnostic and Therapeutic 54,547 339,879 13.8% 66,267 573,785 10.4% 65,675 452,701 12.7%
Public & Mental Health Public Health 0 0 0.0% 9,871 71,474 12.1% 4,527 74,867 5.7% Community Mental Health 9,004 72,434 11.1% 32,133 135,428 19.2% 8,617 136,344 5.9%
Other Research and Education 14,438 45,239 24.2% 53,892 32,028 62.7% 4,217 26,265 13.8% Other Undistributed Expenses 18,679 39,814 31.9% 21,926 90,476 19.5% 7,048 47,154 13.0%
119,224 170,812 120,749 662,176 1,346,674 894,993 15.3% 11.3% 11.9% Sub Total
239,408 381,808 229,049 1,019,678 1,676,382 1,154,023 19.0% 18.6% 16.6% Sub Total
11,239 34,527 19,109 94,164 321,578 195,576 10.7% 9.7% 8.9% Sub Total
175,565 201,061 169,638 483,921 862,439 663,613 26.6% 18.9% 20.4% Sub Total
126,958 224,471 154,032 641,780 1,023,299 824,330 16.5% 18.0% 15.7% Sub Total
9,004 42,004 13,144 72,434 206,902 211,211 11.1% 16.9% 5.9% Sub Total
33,117 75,818 11,265 85,053 122,504 73,419 28.0% 38.2% 13.3% Sub Total
Total 714,515 1,130,501 716,986 3,059,206 5,559,778 4,017,165 18.9% 16.9% 15.1%
May 2015 Section II - page 17

Section II - Compensation Expenses and Statistics2013/2014 Annual Report of Hospital Services
Table II-5: Total UPP and MOS Worked Hours by Functional Area by RHA (Excluding Medical) - 2013/2014 - Page 1d
Note 1: Community Services may include Early Language Services in some RHAs. Note 2: Worked hours include purchased hours and exclude standby (on-call) hours.
Functonal Center
MOS Hours UPP Hours % MOSRHA B Zone 7
MOS Hours UPP Hours % MOSRHA B Organization
MOS Hours UPP HoursTotal
RHA B RHA B % MOS
Administration & Support Administrative Support 35,179 42,512 45.3% 42,305 2,368 94.7% 312,661 560,812 35.8% Clinical Support 13,859 57,489 19.4% 2,968 0 100.0% 70,314 623,481 10.1% Hotel 10,921 128,683 7.8% 0 0 0.0% 85,606 1,467,985 5.5% Plant 26,485 33,112 44.4% 0 0 0.0% 73,922 515,729 12.5%
Nursing Inpatient Nursing Admin. & Medical Resources 25,489 476 98.2% 0 0 0.0% 362,081 106,569 77.3% Acute Inpatient 25,080 205,256 10.9% 0 0 0.0% 305,339 2,455,429 11.1% Maternal and Newborn 6,864 37,322 15.5% 0 0 0.0% 44,125 319,963 12.1% Critical Care 6,932 37,882 15.5% 0 0 0.0% 65,136 583,401 10.0% Operating Room/PARR/Day Surgery 8,518 43,255 16.5% 0 0 0.0% 121,630 481,794 20.2% Mental Health 4,772 22,695 17.4% 0 0 0.0% 29,608 249,813 10.6%
Restorative Care Inpatient Rehabilitation 4,432 41,222 9.7% 0 0 0.0% 26,784 204,859 11.6% Extended (Chronic) Care 0 0 0.0% 0 0 0.0% 42,523 447,680 8.7%
Non-Inpatient Services Emergency Services 19,038 59,760 24.2% 0 0 0.0% 125,892 612,817 17.0% Ambulatory Care 21,421 34,556 38.3% 0 0 0.0% 232,303 641,379 26.6% Extra-Mural Program 14,096 51,823 21.4% 0 0 0.0% 120,357 545,767 18.1% Addiction 7,708 36,111 17.6% 0 0 0.0% 35,068 219,951 13.8% Community Services 16,491 11,352 59.2% 0 0 0.0% 108,416 174,944 38.3% Home Dialysis 0 0 0.0% 0 0 0.0% 2,982 8,717 25.5%
Diagnostic & Therapeutic Laboratory 9,125 50,462 15.3% 1,744 0 100.0% 88,878 737,022 10.8% Medical Imaging/Breast Screening 16,641 42,957 27.9% 1,664 0 100.0% 259,268 479,441 35.1% Other Diagnostic and Therapeutic 26,726 114,399 18.9% 5,130 0 100.0% 218,346 1,480,764 12.9%
Public & Mental Health Public Health 5,002 25,855 16.2% 0 0 0.0% 19,400 172,196 10.1% Community Mental Health 7,533 38,246 16.5% 0 0 0.0% 57,287 382,452 13.0%
Other Research and Education 7,307 521 93.3% 2,111 2,092 50.2% 81,965 106,145 43.6% Other Undistributed Expenses 4,657 0 100.0% 0 0 0.0% 52,310 177,444 22.8%
86,444 261,795 24.8% 14.6% Sub Total 45,273 2,368 95.0% 542,502 3,168,006
77,655 346,886 18.3% 18.1% Sub Total 0 0 0.0% 927,919 4,196,968
4,432 41,222 9.7% 9.6% Sub Total 0 0 0.0% 69,307 652,539
78,754 193,602 28.9% 22.1% Sub Total 0 0 0.0% 625,018 2,203,575
52,492 207,818 20.2% 17.4% Sub Total 8,538 0 100.0% 566,491 2,697,227
12,535 64,101 16.4% 12.1% Sub Total 0 0 0.0% 76,688 554,648
11,964 521 95.8% 32.1% Sub Total 2,111 2,092 50.2% 134,275 283,589
Total 324,276 1,115,945 22.5% 17.6% 55,922 4,460 92.6% 2,942,200 13,756,553
May 2015 Section II - page 18
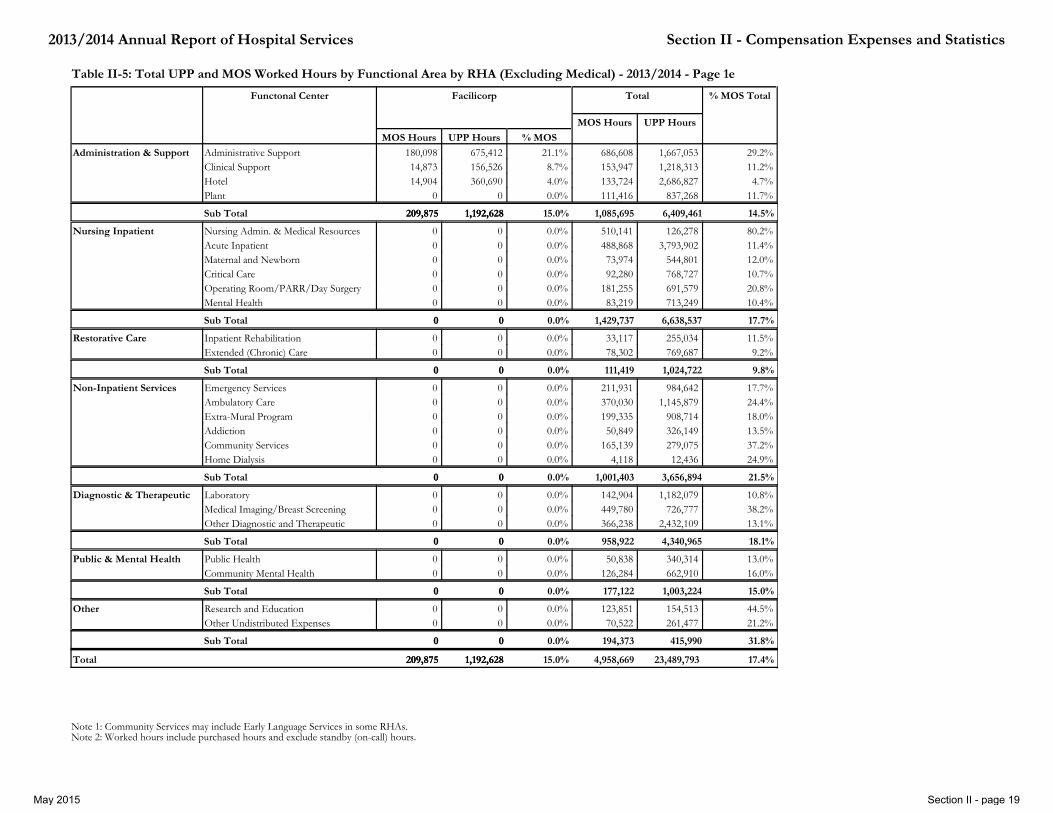
Section II - Compensation Expenses and Statistics2013/2014 Annual Report of Hospital Services
Table II-5: Total UPP and MOS Worked Hours by Functional Area by RHA (Excluding Medical) - 2013/2014 - Page 1e
Note 1: Community Services may include Early Language Services in some RHAs. Note 2: Worked hours include purchased hours and exclude standby (on-call) hours.
Functonal Center
MOS Hours UPP Hours % MOSFacilicorp
Facilicorp
MOS Hours UPP Hours
Total % MOS Total
Administration & Support Administrative Support 180,098 675,412 21.1% 686,608 1,667,053 29.2% Clinical Support 14,873 156,526 8.7% 153,947 1,218,313 11.2% Hotel 14,904 360,690 4.0% 133,724 2,686,827 4.7% Plant 0 0 0.0% 111,416 837,268 11.7%
Nursing Inpatient Nursing Admin. & Medical Resources 0 0 0.0% 510,141 126,278 80.2% Acute Inpatient 0 0 0.0% 488,868 3,793,902 11.4% Maternal and Newborn 0 0 0.0% 73,974 544,801 12.0% Critical Care 0 0 0.0% 92,280 768,727 10.7% Operating Room/PARR/Day Surgery 0 0 0.0% 181,255 691,579 20.8% Mental Health 0 0 0.0% 83,219 713,249 10.4%
Restorative Care Inpatient Rehabilitation 0 0 0.0% 33,117 255,034 11.5% Extended (Chronic) Care 0 0 0.0% 78,302 769,687 9.2%
Non-Inpatient Services Emergency Services 0 0 0.0% 211,931 984,642 17.7% Ambulatory Care 0 0 0.0% 370,030 1,145,879 24.4% Extra-Mural Program 0 0 0.0% 199,335 908,714 18.0% Addiction 0 0 0.0% 50,849 326,149 13.5% Community Services 0 0 0.0% 165,139 279,075 37.2% Home Dialysis 0 0 0.0% 4,118 12,436 24.9%
Diagnostic & Therapeutic Laboratory 0 0 0.0% 142,904 1,182,079 10.8% Medical Imaging/Breast Screening 0 0 0.0% 449,780 726,777 38.2% Other Diagnostic and Therapeutic 0 0 0.0% 366,238 2,432,109 13.1%
Public & Mental Health Public Health 0 0 0.0% 50,838 340,314 13.0% Community Mental Health 0 0 0.0% 126,284 662,910 16.0%
Other Research and Education 0 0 0.0% 123,851 154,513 44.5% Other Undistributed Expenses 0 0 0.0% 70,522 261,477 21.2%
14.5% Sub Total 209,875 1,192,628 209,875 1,192,628 15.0% 1,085,695 6,409,461
17.7% Sub Total 0 0 0 0 0.0% 1,429,737 6,638,537
9.8% Sub Total 0 0 0 0 0.0% 111,419 1,024,722
21.5% Sub Total 0 0 0 0 0.0% 1,001,403 3,656,894
18.1% Sub Total 0 0 0 0 0.0% 958,922 4,340,965
15.0% Sub Total 0 0 0 0 0.0% 177,122 1,003,224
31.8% Sub Total 0 0 0 0 0.0% 194,373 415,990
Total 17.4% 209,875 1,192,628 209,875 1,192,628 15.0% 4,958,669 23,489,793
May 2015 Section II - page 19

Section II - Compensation Expenses and Statistics 2013/2014 Annual Report of Hospital Services
Table II - 6: Breakdown of Benefit Contributions by RHA - 2013/2014
RRS A Zone 1
RRS A Zone 4
RRS A Zone 5
RRS A Zone 6
RRS A Org
Total
Régie régionale de la santé A
RHA B Zone 1
RHA B Zone 2
RHA B Zone 3
RHA B Zone 7
RHA B Org
Total
Regional Health Authority B Facilicorp Total
Canada Pension Plan 4,565,747 2,764,539 2,746,261 3,968,966 76,057 14,121,570 5,273,256 8,978,438 6,680,950 2,015,415 90,932 23,038,991 1,758,982 38,919,543 Group Life Insurance 232,693 145,658 131,124 206,228 5,029 720,733 262,401 437,939 326,288 96,973 6,339 1,129,940 79,346 1,930,018 Health Care/Dental Insurance 2,724,144 1,884,162 1,933,427 2,736,727 39,603 9,318,063 3,008,327 4,895,363 3,818,789 1,270,976 57,951 13,051,406 1,245,503 23,614,972 Provincial Pension Plan 6,504,847 3,492,319 3,747,757 5,239,188 245,614 19,229,724 6,873,682 11,325,470 8,376,824 2,554,648 329,810 29,460,434 411,737 49,101,895 Retirement Benefits & Other Pensions 3,248,550 2,889,929 2,762,750 3,966,210 0 12,867,439 3,580,002 4,855,373 3,537,053 1,288,806 0 13,261,233 4,264,285 30,392,958 Unemployment Insurance 2,452,729 1,449,960 1,449,497 2,093,363 47,776 7,493,326 2,810,592 4,786,382 3,527,940 1,029,145 47,680 12,201,739 896,884 20,591,948 Workers Compensation Plan Insurance 1,420,733 982,153 1,389,209 1,002,794 0 4,794,889 2,015,270 4,118,483 2,221,777 784,843 0 9,140,373 332,810 14,268,072 Other Benefit Contributions 0 217,226 0 24,125 0 241,351 31,656 0 157,834 0 0 189,490 2,209,169 2,640,010
23,855,187 39,397,448 28,647,455 9,040,805 21,149,443 13,825,948 14,160,024 19,237,601 Total 11,198,716 532,710 414,079 68,787,094 101,473,606 181,459,416
May 2015 Section II - page 20

Section II - Compensation Expenses and Statistics2013/2014 Annual Report of Hospital Services
Note 1: Full time represents all employees who work fulltime hours (37.5 hours per week). Part time employees work less than 37.5 hours per week. Note 2: Permanent employees represent all employees hired into a full time or part time position with no anticipated end date. Temporary positions on the other hand generally have an anticipated end date and would include casuals, term and personal service contracts. Note 3: FacilicorpNB includes Fundy Linen employees. Note 4: Report excludes Health Council employees reported in RRS A Zone 1.
Figure II-7(b): Percentage of Permanent and Temporary Employees
Table II-7(a): Number of Full-Time and Part-Time Employees as of March 2014
Region Full-Time Part-Time Total
RRS A - ZONE 1 1,577 635 2,212 RRS A - ZONE 4 838 509 1,347 RRS A - ZONE 5 948 339 1,287 RRS A - ZONE 6 1,303 700 2,003 RHA B - ZONE 1 1,787 775 2,562 RHA B - ZONE 2 2,898 1,697 4,595 RHA B - ZONE 3 2,040 1,318 3,358 RHA B - ZONE 7 669 350 1,019 FACILICORP 739 184 923
12,799 6,507 19,306 Total
Table II-7(b): Number of Permanent and Temporary Employees as of March 2014
Region Permanent Temporary Total
RRS A - ZONE 1 1,995 217 2,212 RRS A - ZONE 4 1,240 107 1,347 RRS A - ZONE 5 1,182 105 1,287 RRS A - ZONE 6 1,777 226 2,003 RHA B - ZONE 1 2,312 250 2,562 RHA B - ZONE 2 3,971 624 4,595 RHA B - ZONE 3 2,908 450 3,358 RHA B - ZONE 7 855 164 1,019 FACILICORP 763 160 923
17,003 2,303 19,306 Total
Figure II-7(a): Percentage of Full-Time and Part-Time Employees
May 2015 Section II - page 21

Section II - Compensation Expenses and Statistics2013/2014 Annual Report of Hospital Services
Table II-7(c): Age Distribution by RHA as of March 2014
Region < 35 35 <45 45 <55 55+ Total
RRS A - ZONE 1 739 572 632 269 2,212 RRS A - ZONE 4 386 329 433 199 1,347 RRS A - ZONE 5 306 259 490 232 1,287 RRS A - ZONE 6 484 557 691 271 2,003 RHA B - ZONE 1 625 625 767 545 2,562 RHA B - ZONE 2 1,069 1,014 1,500 1,012 4,595 RHA B - ZONE 3 829 863 1,062 604 3,358 RHA B - ZONE 7 232 300 293 194 1,019 FACILICORP 204 261 315 143 923
4,874 4,780 6,183 3,469 19,306 Total
Figure II-7(c): Percentage of Age Grouping
May 2015 Section II - page 22

Section III
Clinical Statistics Discharge Abstract Database


Section III: Summary of Clinical Statistics – DAD (Discharge Abstract Database) This section is of interest for those who wish to understand the volume and scope of patient activity provided by each RHA. At the end of this summary, a listing will indicate the different levels of care found in each facility in each RHA. This section provides a summary of the patient activity for inpatient (level of care) and day surgery services in New Brunswick. A number of tables in this section provide comparisons between 2009/10 and 2013/14. The inpatient and day surgery information is derived from the Canadian Institute for Health Information (CIHI) Discharge Abstract Database (DAD), to which health facilities submit patient activity data on a regular basis. The only exception is that inpatient information from the Stan Cassidy Centre for Rehabilitation is derived from the Canadian Institute for Health Information (CIHI) National Rehabilitation Reporting System (NRS), to which this facility started to submit patient activity data on a regular basis in 2004/05. In fiscal 2006/07, The Moncton Hospital also started submitting rehabilitation data to the NRS. The objective of these reports is to present a cross section of the patient activity without reference to benchmarks or performance targets. Clinical and operational indicators may be developed for future reports. The following is a description of the information presented in this Section of the Report: NOTE: Starting April 1st 2001/02, the Department of Health mandated that all Regional Health Authorities abstract by level of care. This means that if a patient needs services from more than one level of care inside the same facility, the patient is discharged from the current level of care, e.g. acute care and admitted to their next level of care, which could be chronic/extended care, rehabilitation or Veterans Affairs Canada (VAC). Of note is that some of the Regional Health Authorities had implemented level of care abstracting as far back as 1997/98. Inpatient Level of Care Activity (Separations and Days Stay by RHA) Health facilities in the province of New Brunswick provide inpatient services for acute (adult and newborn), chronic/extended care, rehabilitation, psychiatric facility patients and for patients funded by Veterans Affairs Canada (VAC). Table III-1(a): Acute care (level of care) inpatient separations, days stay and weighted cases by Regional Health Authority Because the Case Mix Group (CMGTM) and Resource Intensity Weight (RIWTM) tools are designed for acute care inpatient discharges only, the tables in this year’s Annual Report that use CMGs, and RIWs (weighted cases) include only acute care inpatient cases. Separations and days stay are included for the Regional Health Authorities, which abstract inpatients under the acute care level of care. The fiscal 2007/08 CMG+ grouper methodology has been redeveloped by CIHI and it is now based on ICD10CA diagnosis and CCI intervention activity and cost data. Cases have been grouped into Case Mix Groups (CMGs) using the 2013 CMG+ Grouper for all years. Table III-1(b): Chronic/Extended care (level of care) inpatient separations and days stay by Regional Health Authority Separations and days stay are included for the Regional Health Authorities, which abstract inpatients under the chronic/extended level of care. Table III-1(c): Rehabilitation (level of care) inpatient separations and days stay by Regional Health Authority Separations and days stay are included for the Regional Health Authorities, which abstract inpatients under the rehabilitation level of care.
May 2015 Section III - Page 1

Table III-1(d): VAC (level of care) inpatient separations and days stay by Regional Health Authority Separations and days stay are included for the Regional Health Authorities, which abstract inpatients under the VAC level of care. Table III-1(e): Psychiatric Facilities (level of care) inpatient separations and days stay by Regional Health Authority Separations and days stay are included for the Regional Health Authorities, which abstract inpatients under the psychiatric level of care. Table III-1(f): Total Newborns by Regional Health Authority Note that the data also includes newborns that were born to non-residents of the province of New Brunswick. Table III-1(g): Total Newborns by Regional Health Authority by Gender Four out of five years of data show that there are slightly more males than females born in the RHAs except for fiscal 2009/10 where the data are equal. Table III-1(h): Total Deaths (All Inpatient Levels of Care) by Regional Health Authority These data only includes inpatients deaths which could also include patients from other provinces who were inpatients in the RHAs. It excludes any patient who died in ambulatory care. Table III-1(i): Total Deaths (All Inpatient Levels of Care) by Regional Health Authority by Gender Three out of five years of data show that are slightly more males than females who died in the RHAs except for fiscal 2011/12 where the data are equal and fiscal 2012/13 where there is a 6% difference. Table III-1(j): Acute care (Level of care) Total Deliveries by Regional Health Authority It includes the total vaginal births and the total caesarean sections in the province and the data are showing that deliveries have been decreasing gradually during these five fiscal years. The caesarean section rate in the last five years was the highest in fiscal 2009/10. Table III-2: Day Surgery Activity (Cases and Weighted Cases by Regional Health Authority) Starting with fiscal 2003/04, the day surgeries will include the cases done in the MIS day surgery functional centre. Starting with fiscal 2011/12, as part of the redevelopment of the methodology, the Comprehensive Ambulatory Classification System will be the only grouping methodology to support both databases (DAD and NACRS). The weighted cases are based on fiscal 2013 CACS methodology. Table III-3(a): Total Surgical Episodes in the Main OR (Inpatient & Day Surgery Episodes) and Caesarean Sections in the Delivery Room by Regional Health Authority An episode is recorded each time a patient goes to the operating room during an admission. There can be multiple interventions during one episode. Additionally, caesarean sections which are also performed in the Delivery Room have been added to these data. The day surgery total includes cataract surgery performed in the ambulatory care level of care for RRS A Zone 1 starting with fiscal 2006/07 and for RHA B Zone 1 starting with fiscal 2008/09. Interventions which were cancelled; previous interventions and interventions which were performed out of hospital have been excluded from the data. Table III-3(b): All Inpatient Separations (cases) - Top 25 Principle Interventions (Main OR) and principle Caesarean Sections (Delivery Room) in the province
May 2015 Section III - Page 2

Caesarean sections, knee and hip replacements are the first three interventions in fiscal 2013/14. The number of knee and hip replacements has been increasing consistently during the last five years except for fiscal 2012/13 where hip replacements have shown a slight decrease. Table III-4(a): Acute Care Separations – Top 25 Case Mix Groups (CMG+) in the Province This table provides acute care separations and days stay for the highest volume Case Mix Groups (CMGs). The fiscal 2007/08 CMG+ grouper methodology has been redeveloped by CIHI and it is now based on ICD10CA diagnosis and CCI intervention activity and cost data. Cases have been grouped into Case Mix Groups (CMGs) using the 2013 CMG+ Grouper for all years. While five years of data are shown (2009/10 to 2013/14), the sorting is done based on 2013/14 separations. A newborn CMG ranked first with 3,250 separations and this CMG is ranked first across all five years. Further analysis would be required to determine the appropriateness of the utilization patterns seen in this table. Table III-4(b): Acute Care Separations (Cases) - Top 10 Case Mix Groups (CMG+) by Regional Health Authority The following table provide acute are separations and days stay for the highest volume Case Mix Groups (CMG+) inside each RHA. While five years of data are shown (2009/10 to 2013/14), the sorting is done based on 2013/14 separations. A newborn CMG in RRS A Zone 1 is ranked first across all five years and a respiratory CMG in RRS A Zone 4 is ranked first across all five years. Table III-4(c): Acute Care Separations (Cases) - Top 10 Case Mix Groups (CMG+) by Regional Health Authority The following table provide acute are separations and days stay for the highest volume Case Mix Groups (CMG+) inside each RHA. While five years of data are shown (2009/10 to 2013/14), the sorting is done based on 2013/14 separations. A respiratory CMG in RRS A Zone 5 and RRS A Zone 6 is ranked first across all five years. Table III-4(d): Acute Care Separations (Cases) - Top 10 Case Mix Groups (CMG+) by Regional Health Authority The following table provide acute are separations and days stay for the highest volume Case Mix Groups (CMG+) inside each RHA. While five years of data are shown (2009/10 to 2013/14), the sorting is done based on 2013/14 separations. A newborn CMG in RHA B Zone 1 is only ranked first for three years and a circulatory system CMG in RHA B Zone 2 is also only ranked first for three years. Table III-4(e): Acute Care Separations (Cases) - Top 10 Case Mix Groups (CMG+) by Regional Health Authority The following table provide acute are separations and days stay for the highest volume Case Mix Groups (CMG+) inside each RHA. While five years of data are shown (2009/10 to 2013/14), the sorting is done based on 2013/14 separations. A newborn CMG in RHA B Zone 3 is ranked first across all five years and a respiratory CMG in RHA B Zone 7 is ranked first across all five years. Table III-5(a): Days Surgery Separations (Cases) – Top 25 Comprehensive Ambulatory Classification System (CACS) groups in the Province This table provides the number of day surgery cases for the highest volume of Comprehensive Ambulatory Classification System (CACS) groups. The 2007/08 DPG grouper had been updated by CIHI to enhance the methodology and align it with CACS (Comprehensive Ambulatory Classification System) but starting with fiscal 2011/12, as part of the redevelopment of the methodology, the Comprehensive Ambulatory Classification System will be the only grouping methodology to support both databases (DAD and NACRS). Cases have been grouped into Comprehensive Ambulatory Classification System (CACSs) groups using the 2013 CACS Grouper for all years. An ophthalmology CACS group ranked first with 7,879 cases.
May 2015 Section III - Page 3

Table III-5(b): Days Surgery Separations (Cases) – Top 10 Comprehensive Ambulatory Classification System (CACS) groups by Regional Health Authority This table provides the number of day surgery cases for the highest volume of Comprehensive Ambulatory Classification System (CACS) groups. While five years of data are shown (2009/10 to 2013/14), the sorting is done based on 2013/14 cases. A male reproductive CACS group in RRS A Zone 1 is only ranked first for two years and a cataract CACS group in RRS A Zone 4 is ranked first across all five years. Table III-5(c): Days Surgery Separations (Cases) – Top 10 Comprehensive Ambulatory Classification System (CACS) groups by Regional Health Authority This table provides the number of day surgery cases for the highest volume of Comprehensive Ambulatory Classification System (CACS) groups. While five years of data are shown (2009/10 to 2013/14), the sorting is done based on 2013/14 cases. A nervous system CACS group in RRS A Zone 5 is only ranked first for one year and a cataract CACS group in RRS A Zone 6 is ranked first across all five years. Table III-5(d): Days Surgery Separations (Cases) – Top 10 Comprehensive Ambulatory Classification System (CACS) groups by Regional Health Authority This table provides the number of day surgery cases for the highest volume of Comprehensive Ambulatory Classification System (CACS) groups. While five years of data are shown (2009/10 to 2013/14), the sorting is done based on 2013/14 cases. A lower limb CACS group in RHA B Zone 1 is only ranked first for three years and a cataract CACS group in RHA B Zone 2 is ranked first across all five years. Table III-5(e): Days Surgery Separations (Cases) – Top 10 Comprehensive Ambulatory Classification System (CACS) groups by Regional Health Authority This table provides the number of day surgery cases for the highest volume of Comprehensive Ambulatory Classification System (CACS) groups. While five years of data are shown (2009/10 to 2013/14), the sorting is done based on 2013/14 cases. A cataract CACS group in RHA B Zone 3 and RHA B Zone 7 is ranked first across all five years. Table III - 6: Acute Care Separations with Alternate Level of Care (ALC) Days by Regional Health Authority This table provides the number of separations with ALC (alternate level of care) days, the average age and the median age of the ALC patient. It does not include their total days stay while in hospital. A patient becomes ALC when he/she is occupying an acute care bed in a facility and does not require the intensity of resources/services provided. It does not include the patients with ALC days who have yet to be discharged from hospital.
May 2015 Section III - Page 4
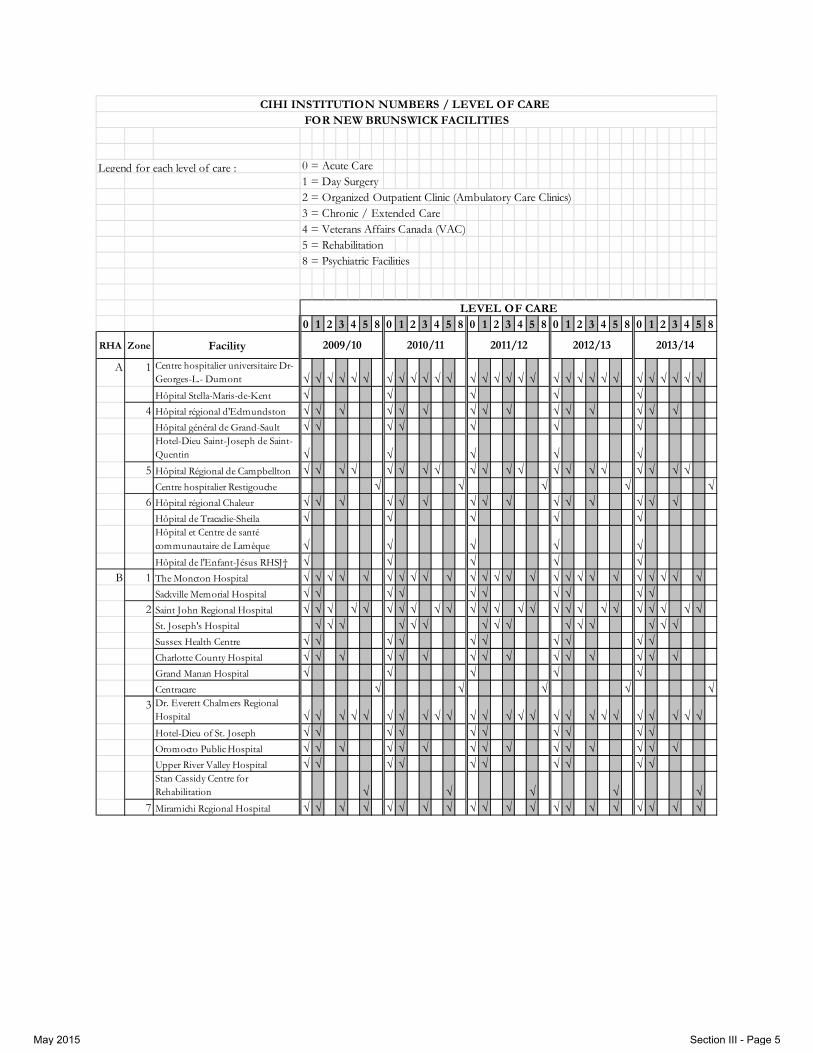
Legend for each level of care : 0 = Acute Care1 = Day Surgery2 = Organized Outpatient Clinic (Ambulatory Care Clinics)3 = Chronic / Extended Care4 = Veterans Affairs Canada (VAC)5 = Rehabilitation 8 = Psychiatric Facilities
0 1 2 3 4 5 8 0 1 2 3 4 5 8 0 1 2 3 4 5 8 0 1 2 3 4 5 8 0 1 2 3 4 5 8
RHA Zone Facility
A 1 Centre hospitalier universitaire Dr-Georges-L.- Dumont √ √ √ √ √ √ √ √ √ √ √ √ √ √ √ √ √ √ √ √ √ √ √ √ √ √ √ √ √ √Hôpital Stella-Maris-de-Kent √ √ √ √ √
4 Hôpital régional d'Edmundston √ √ √ √ √ √ √ √ √ √ √ √ √ √ √Hôpital général de Grand-Sault √ √ √ √ √ √ √Hotel-Dieu Saint-Joseph de Saint-Quentin √ √ √ √ √
5 Hôpital Régional de Campbellton √ √ √ √ √ √ √ √ √ √ √ √ √ √ √ √ √ √ √ √Centre hospitalier Restigouche √ √ √ √ √
6 Hôpital régional Chaleur √ √ √ √ √ √ √ √ √ √ √ √ √ √ √Hôpital de Tracadie-Sheila √ √ √ √ √Hôpital et Centre de santé communautaire de Lamèque √ √ √ √ √Hôpital de l'Enfant-Jésus RHSJ† √ √ √ √ √
B 1 The Moncton Hospital √ √ √ √ √ √ √ √ √ √ √ √ √ √ √ √ √ √ √ √ √ √ √ √ √Sackville Memorial Hospital √ √ √ √ √ √ √ √ √ √
2 Saint John Regional Hospital √ √ √ √ √ √ √ √ √ √ √ √ √ √ √ √ √ √ √ √ √ √ √ √ √St. Joseph's Hospital √ √ √ √ √ √ √ √ √ √ √ √ √ √ √Sussex Health Centre √ √ √ √ √ √ √ √ √ √Charlotte County Hospital √ √ √ √ √ √ √ √ √ √ √ √ √ √ √Grand Manan Hospital √ √ √ √ √Centracare √ √ √ √ √
3 Dr. Everett Chalmers Regional Hospital √ √ √ √ √ √ √ √ √ √ √ √ √ √ √ √ √ √ √ √ √ √ √ √ √Hotel-Dieu of St. Joseph √ √ √ √ √ √ √ √ √ √Oromocto Public Hospital √ √ √ √ √ √ √ √ √ √ √ √ √ √ √Upper River Valley Hospital √ √ √ √ √ √ √ √ √ √Stan Cassidy Centre for Rehabilitation √ √ √ √ √
7 Miramichi Regional Hospital √ √ √ √ √ √ √ √ √ √ √ √ √ √ √ √ √ √ √ √
2013/14
LEVEL OF CARE
CIHI INSTITUTION NUMBERS / LEVEL OF CARE FOR NEW BRUNSWICK FACILITIES
2009/10 2010/11 2011/12 2012/13
May 2015 Section III - Page 5


2013/14 Annual Report of Hospital Services Section III - Clinical statistics, Discharge Abstract Database
Table III - 1(a): Acute Care (Level of Care) Inpatient Separations, Days Stay and Weighted Cases by Regional Health Authority - 2009/10 to 2013/14
a) Separations (Inpatient Cases: the sum of discharges, deaths, sign outs, transfers out, and transfers from one level of care to another.)
RHA 2009/10 2010/11 2011/12 2012/13 2013/14 2009/10 2010/11 2011/12 2012/13 2013/14RRS A Zone 1 9,467 9,947 10,063 9,971 10,135 -3.2% 5.1% 1.2% -0.9% 1.6%RRS A Zone 4 6,508 6,465 6,378 6,300 6,126 -3.7% -0.7% -1.3% -1.2% -2.8%RRS A Zone 5 4,626 4,855 4,847 4,508 4,395 -8.1% 5.0% -0.2% -7.0% -2.5%RRS A Zone 6 9,542 9,532 9,588 9,387 9,087 -6.3% -0.1% 0.6% -2.1% -3.2%
RRS A 30,143 30,799 30,876 30,166 29,743 -5.1% 2.2% 0.3% -2.3% -1.4%RHA B Zone 1 15,650 15,684 15,522 15,370 15,211 -3.1% 0.2% -1.0% -1.0% -1.0%RHA B Zone 2 19,489 20,297 20,278 19,673 19,473 -4.8% 4.1% -0.1% -3.0% -1.0%RHA B Zone 3 18,557 18,183 18,256 17,475 17,568 -0.3% -2.0% 0.4% -4.3% 0.5%RHA B Zone 7 5,888 5,849 5,769 5,589 5,232 -4.5% -0.7% -1.4% -3.1% -6.4%
RHA B 59,584 60,013 59,825 58,107 57,484 -3.0% 0.7% -0.3% -2.9% -1.1%
Total 89,727 90,812 90,701 88,273 87,227 -3.7% 1.2% -0.1% -2.7% -1.2%
b) Total Days Stay (Total Length of Stay (LOS) = the sum of all patients' LOS) d) Average Length of Stay (ALOS)
RHA 2009/10 2010/11 2011/12 2012/13 2013/14 2009/10 2010/11 2011/12 2012/13 2013/14RRS A Zone 1 88,189 90,633 89,715 93,874 91,699 4.9% 2.8% -1.0% 4.6% -2.3% RRS A Zone 1 9.3 9.1 8.9 9.4 9.0RRS A Zone 4 53,749 55,811 57,874 60,078 54,633 -2.5% 3.8% 3.7% 3.8% -9.1% RRS A Zone 4 8.3 8.6 9.1 9.5 8.9RRS A Zone 5 36,395 38,851 38,106 37,563 39,505 4.6% 6.7% -1.9% -1.4% 5.2% RRS A Zone 5 7.9 8.0 7.9 8.3 9.0RRS A Zone 6 83,779 80,760 72,560 86,169 81,997 5.6% -3.6% -10.2% 18.8% -4.8% RRS A Zone 6 8.8 8.5 7.6 9.2 9.0
RRS A 262,112 266,055 258,255 277,684 267,834 3.5% 1.5% -2.9% 7.5% -3.5% RRS A 8.7 8.6 8.4 9.2 9.0RHA B Zone 1 131,907 122,319 126,928 122,777 125,689 5.1% -7.3% 3.8% -3.3% 2.4% RHA B Zone 1 8.4 7.8 8.2 8.0 8.3RHA B Zone 2 171,808 188,513 171,997 173,496 181,371 2.8% 9.7% -8.8% 0.9% 4.5% RHA B Zone 2 8.8 9.3 8.5 8.8 9.3RHA B Zone 3 139,479 151,052 140,218 146,424 147,060 -3.7% 8.3% -7.2% 4.4% 0.4% RHA B Zone 3 7.5 8.3 7.7 8.4 8.4RHA B Zone 7 43,199 46,166 44,090 44,048 47,990 0.0% 6.9% -4.5% -0.1% 8.9% RHA B Zone 7 7.3 7.9 7.6 7.9 9.2
RHA B 486,393 508,050 483,233 486,745 502,110 1.2% 4.5% -4.9% 0.7% 3.2% RHA B 8.2 8.5 8.1 8.4 8.7
Total 748,505 774,105 741,488 764,429 769,944 2.0% 3.4% -4.2% 3.1% 0.7% Total 8.3 8.5 8.2 8.7 8.8
c) Weighted Cases (RIW) Resource Intensity Weight e) Average RIW
RHA 2009/10 2010/11 2011/12 2012/13 2013/14 2009/10 2010/11 2011/12 2012/13 2013/14RRS A Zone 1 15,146 16,363 15,400 16,415 15,917 5.2% 8.0% -5.9% 6.6% -3.0% RRS A Zone 1 1.6008 1.6451 1.5304 1.6463 1.5705RRS A Zone 4 9,070 8,999 9,510 10,049 9,148 -3.6% -0.8% 5.7% 5.7% -9.0% RRS A Zone 4 1.3936 1.3920 1.4910 1.5951 1.4932RRS A Zone 5 5,595 5,830 5,666 5,596 5,959 3.9% 4.2% -2.8% -1.2% 6.5% RRS A Zone 5 1.2095 1.2009 1.1690 1.2415 1.3559RRS A Zone 6 13,370 13,075 11,905 14,169 13,383 3.5% -2.2% -8.9% 19.0% -5.5% RRS A Zone 6 1.4012 1.3717 1.2416 1.5094 1.4728
RRS A 43,181 44,268 42,481 46,230 44,406 2.6% 2.5% -4.0% 8.8% -3.9% RRS A 1.4328 1.4373 1.3758 1.5325 1.4930RHA B Zone 1 23,762 22,767 23,514 23,103 23,102 5.5% -4.2% 3.3% -1.7% 0.0% RHA B Zone 1 1.5183 1.4518 1.5150 1.5031 1.5188RHA B Zone 2 33,839 35,188 33,407 33,750 34,938 0.3% 4.0% -5.1% 1.0% 3.5% RHA B Zone 2 1.7363 1.7336 1.6475 1.7156 1.7942RHA B Zone 3 23,050 24,346 23,321 23,865 24,136 -2.5% 5.6% -4.2% 2.3% 1.1% RHA B Zone 3 1.2423 1.3394 1.2776 1.3658 1.3739RHA B Zone 7 6,994 7,290 7,115 7,201 7,821 -0.8% 4.2% -2.4% 1.2% 8.6% RHA B Zone 7 1.1878 1.2464 1.2333 1.2884 1.4949
RHA B 87,645 89,591 87,358 87,919 89,997 0.8% 2.2% -2.5% 0.6% 2.4% RHA B 1.4710 1.4931 1.4603 1.5131 1.5656
Total 130,826 133,859 129,838 134,150 134,403 1.4% 2.3% -3.0% 3.3% 0.2% Total 1.4582 1.4742 1.4315 1.5197 1.5408
Note 2: Since April 1st 2001, all RHAs have implemented level of care abstracting.
Note 4: Weighted cases (derived from RIW's) are assigned to separations based on the 2013 methodology for all five years. This affects comparability with previous years' reports. Note 5: Fiscal 2010/11 data for RHA A Zone 6 has been updated to reflect the deletion of two separations which were in the DB twice.
Note 3: Source data were extracted from the 3M system, except the weighted cases from 2009/10 to 2012/13, with data submitted by hospitals to CIHI through the Discharge Abstract Database (DAD). The weighted cases which were extracted from HFUMS was provided by CIHI and based on fiscal 2013 methodology.
2010/11 2013/142012/13
Note 1: Separations are described now by level of care. Previously, separations included patients treated in Acute, Chronic, Rehabilitation and Psychiatric inpatients units in acute care facilities, excluding Psychiatric Hospitals, and Veterans Affairs Canada (VAC) (includes newborns, excludes stillbirths).
2011/12Year to Year % Change
Separations (Cases)
Days Stay
Weighted Cases
2013/14
2009/10
2012/132009/10 2010/11
RHA
Year to Year % Change
RHA 2011/12Year to Year % Change
May 2015 Section III - Page 7

2013/14 Annual Report of Hospital Services Section III - Clinical statistics, Discharge Abstract Database
Figure III - 1(a)(i): Acute Care (Level of Care) Inpatient Separations by RHA - 2009/10 to 2013/14
Figure III - 1(a)(ii): Acute Care (Level of Care) Inpatient Days Stay by RHA - 2009/10 to 2013/14
0
5,000
10,000
15,000
20,000
25,000
RRS A Zone 1 RRS A Zone 4 RRS A Zone 5 RRS A Zone 6 RHA B Zone 1 RHA B Zone 2 RHA B Zone 3 RHA B Zone 7
Sep
arat
ion
s (C
ases
)
2009/10
2010/11
2011/12
2012/13
2013/14
0
25,000
50,000
75,000
100,000
125,000
150,000
175,000
200,000
RRS A Zone 1 RRS A Zone 4 RRS A Zone 5 RRS A Zone 6 RHA B Zone 1 RHA B Zone 2 RHA B Zone 3 RHA B Zone 7
Acu
te C
are
Inp
atie
nt
Day
s St
ay
2009/10
2010/11
2011/12
2012/13
2013/14
May 2015 Section III - Page 8

2013/14 Annual Report of Hospital Services Section III - Clinical statistics, Discharge Abstract Database
Figure III - 1(a)(iii): Acute Care (Level of Care) Inpatient Average Length of Stay (LOS) by RHA - 2009/10 to 2013/14
0.0
2.0
4.0
6.0
8.0
10.0
12.0
RRS A Zone 1 RRS A Zone 4 RRS A Zone 5 RRS A Zone 6 RHA B Zone 1 RHA B Zone 2 RHA B Zone 3 RHA B Zone 7
AL
OS
2009/10 2010/11 2011/12
2012/13 2013/14
May 2015 Section III - Page 9
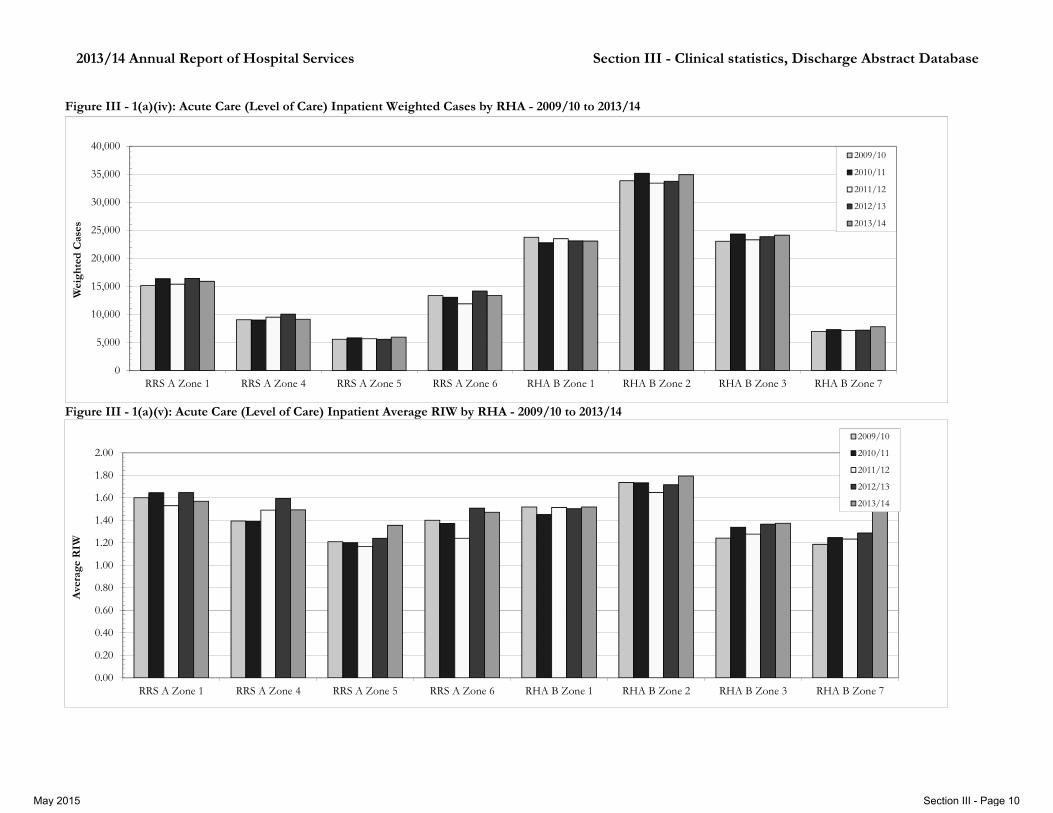
2013/14 Annual Report of Hospital Services Section III - Clinical statistics, Discharge Abstract Database
Figure III - 1(a)(iv): Acute Care (Level of Care) Inpatient Weighted Cases by RHA - 2009/10 to 2013/14
Figure III - 1(a)(v): Acute Care (Level of Care) Inpatient Average RIW by RHA - 2009/10 to 2013/14
0.00
0.20
0.40
0.60
0.80
1.00
1.20
1.40
1.60
1.80
2.00
RRS A Zone 1 RRS A Zone 4 RRS A Zone 5 RRS A Zone 6 RHA B Zone 1 RHA B Zone 2 RHA B Zone 3 RHA B Zone 7
Ave
rage
RIW
2009/10
2010/11
2011/12
2012/13
2013/14
0
5,000
10,000
15,000
20,000
25,000
30,000
35,000
40,000
RRS A Zone 1 RRS A Zone 4 RRS A Zone 5 RRS A Zone 6 RHA B Zone 1 RHA B Zone 2 RHA B Zone 3 RHA B Zone 7
Wei
ghte
d C
ases
2009/10
2010/11
2011/12
2012/13
2013/14
May 2015 Section III - Page 10

2013/14 Annual Report of Hospital Services Section III - Clinical statistics, Discharge Abstract Database
Table III - 1(b): Chronic/Extended Care (Level of Care) Inpatient Separations and Days Stay by Regional Health Authority - 2009/10 to 2013/14
a) Separations (Inpatient Cases: the sum of discharges, deaths, sign outs, transfers out, and transfers from one level of care to another.)
RHA 2009/10 2010/11 2011/12 2012/13 2013/14 2009/10 2010/11 2011/12 2012/13 2013/14RRS A Zone 1 52 63 56 61 85 -1.9% 21.2% -11.1% 8.9% 39.3%RRS A Zone 4 127 157 143 212 171 -5.9% 23.6% -8.9% 48.3% -19.3%RRS A Zone 5 125 139 190 160 239 -17.2% 11.2% 36.7% -15.8% 49.4%RRS A Zone 6 193 202 196 119 156 22.2% 4.7% -3.0% -39.3% 31.1%
RRS A 497 561 585 552 651 0.0% 12.9% 4.3% -5.6% 17.9%RHA B Zone 1 285 276 244 220 215 13.1% -3.2% -11.6% -9.8% -2.3%RHA B Zone 2 419 433 446 404 379 -12.2% 3.3% 3.0% -9.4% -6.2%RHA B Zone 3 240 274 238 150 173 5.3% 14.2% -13.1% -37.0% 15.3%RHA B Zone 7 18 21 24 36 31 5.9% 16.7% 14.3% 50.0% -13.9%
RHA B 962 1,004 952 810 798 -1.2% 4.4% -5.2% -14.9% -1.5%
Total 1,459 1,565 1,537 1,362 1,449 -0.8% 7.3% -1.8% -11.4% 6.4%
b) Total Days Stay (Total Length of Stay (LOS) = the sum of all patients' LOS) c) Average Length of Stay (ALOS)
RHA 2009/10 2010/11 2011/12 2012/13 2013/14 2009/10 2010/11 2011/12 2012/13 2013/14RRS A Zone 1 10,814 8,380 6,665 7,659 10,577 48.8% -22.5% -20.5% 14.9% 38.1% RRS A Zone 1 208.0 133.0 119.0 125.6 124.4RRS A Zone 4 10,892 12,944 9,765 12,956 10,752 0.5% 18.8% -24.6% 32.7% -17.0% RRS A Zone 4 85.8 82.4 68.3 61.1 62.9RRS A Zone 5 8,297 9,520 11,731 9,045 9,154 17.5% 14.7% 23.2% -22.9% 1.2% RRS A Zone 5 66.4 68.5 61.7 56.5 38.3RRS A Zone 6 18,833 21,449 16,230 12,396 17,687 24.5% 13.9% -24.3% -23.6% 42.7% RRS A Zone 6 97.6 106.2 82.8 104.2 113.4
RRS A 48,836 52,293 44,391 42,056 48,170 21.2% 7.1% -15.1% -5.3% 14.5% RRS A 98.3 93.2 75.9 76.2 74.0RHA B Zone 1 13,129 12,017 11,423 11,313 11,346 6.9% -8.5% -4.9% -1.0% 0.3% RHA B Zone 1 46.1 43.5 46.8 51.4 52.8RHA B Zone 2 40,330 45,154 39,658 41,534 46,294 6.5% 12.0% -12.2% 4.7% 11.5% RHA B Zone 2 96.3 104.3 88.9 102.8 122.1RHA B Zone 3 8,300 7,916 7,428 4,644 9,855 -9.6% -4.6% -6.2% -37.5% 112.2% RHA B Zone 3 34.6 28.9 31.2 31.0 57.0RHA B Zone 7 1,711 1,778 1,614 5,010 2,591 31.2% 3.9% -9.2% 210.4% -48.3% RHA B Zone 7 95.1 84.7 67.3 139.2 83.6
RHA B 63,470 66,865 60,123 62,501 70,086 4.7% 5.3% -10.1% 4.0% 12.1% RHA B 66.0 66.6 63.2 77.2 87.8
Total 112,306 119,158 104,514 104,557 118,256 11.3% 6.1% -12.3% 0.0% 13.1% Total 77.0 76.1 68.0 76.8 81.6
Note 2: Since April 1st 2001, all RHAs have implemented level of care abstracting.Note 3: Source data were extracted from the 3M system with data submitted by hospitals to CIHI through the Discharge Abstract Database (DAD).
Separations (Cases)
Days Stay
Year to Year % Change
Year to Year % Change
Note 1: Separations are described now by level of care. Previously, separations included patients treated in Acute, Chronic, Rehabilitation and Psychiatric inpatients units in acute care facilities, excluding Psychiatric Hospitals, and Veterans Affairs Canada (VAC) (includes newborns, excludes stillbirths).
RHA 2009/10 2010/11 2011/12 2013/142012/13
May 2015 Section III - Page 11

2013/14 Annual Report of Hospital Services Section III - Clinical statistics, Discharge Abstract Database
Table III - 1(c): Rehab Care (Level of Care) Inpatient Separations and Days Stay by Regional Health Authority - 2009/10 to 2013/14
a) Separations (Inpatient Cases: the sum of discharges, deaths, sign outs, transfers out, and transfers from one level of care to another.)
RHA 2009/10 2010/11 2011/12 2012/13 2013/14 2009/10 2010/11 2011/12 2012/13 2013/14RRS A Zone 1 225 241 242 255 260 11.9% 7.1% 0.4% 5.4% 2.0%
RRS A 225 241 242 255 260 11.9% 7.1% 0.4% 5.4% 2.0%RHA B Zone 1 92 113 107 80 80 -12.4% 22.8% -5.3% -25.2% 0.0%RHA B Zone 2 118 117 103 105 106 0.0% -0.8% -12.0% 1.9% 1.0%RHA B Zone 3 255 254 261 258 234 2.8% -0.4% 2.8% -1.1% -9.3%RHA B Zone 7 126 90 123 101 94 -18.7% -28.6% 36.7% -17.9% -6.9%
RHA B 591 574 594 544 514 -5.6% -2.9% 3.5% -8.4% -5.5%
Total 816 815 836 799 774 -1.3% -0.1% 2.6% -4.4% -3.1%
b) Total Days Stay (Total Length of Stay (LOS) = the sum of all patients' LOS) c) Average Length of Stay (ALOS)
RHA 2009/10 2010/11 2011/12 2012/13 2013/14 2009/10 2010/11 2011/12 2012/13 2013/14RRS A Zone 1 9,232 9,071 8,406 8,836 9,089 1.9% -1.7% -7.3% 5.1% 2.9% RRS A Zone 1 41.0 37.6 34.7 34.7 35.0
RRS A 9,232 9,071 8,406 8,836 9,089 1.9% -1.7% -7.3% 5.1% 2.9% RRS A 41.0 37.6 34.7 34.7 35.0RHA B Zone 1 2,553 3,456 3,105 2,728 2,641 -1.3% 35.4% -10.2% -12.1% -3.2% RHA B Zone 1 27.8 30.6 29.0 34.1 33.0RHA B Zone 2 4,277 4,659 4,803 4,594 4,871 -12.7% 8.9% 3.1% -4.4% 6.0% RHA B Zone 2 36.2 39.8 46.6 43.8 46.0RHA B Zone 3 11,765 11,631 11,804 12,491 11,388 2.7% -1.1% 1.5% 5.8% -8.8% RHA B Zone 3 46.1 45.8 45.2 48.4 48.7RHA B Zone 7 6,059 5,621 6,653 4,223 4,223 -9.7% -7.2% 18.4% -36.5% 0.0% RHA B Zone 7 48.1 62.5 54.1 41.8 44.9
RHA B 24,654 25,367 26,365 24,036 23,123 -7.6% 2.9% 3.9% -8.8% -3.8% RHA B 41.7 44.2 44.4 44.2 45.0
Total 33,886 34,438 34,771 32,872 32,212 -5.2% 1.6% 1.0% -5.5% -2.0% Total 41.5 42.3 41.6 41.1 41.6
Note 2: Since April 1st 2001, all RHAs have implemented level of care abstracting.
Year to Year % Change
Year to Year % Change
Separations (Cases)
Days Stay
Note 3: Source data were extracted from the 3M system, with data submitted by hospitals to CIHI through the Discharge Abstract Database (DAD) and starting in 2004/05, from the National Rehabilitation Reporting System (NRS) for the Stan Cassidy Centre for Rehabilitation and 2006/07 for The Moncton Hospital.
Note 1: Separations are described now by level of care. Previously, separations included patients treated in Acute, Chronic, Rehabilitation and Psychiatric inpatients units in acute care facilities, excluding Psychiatric Hospitals, and Veterans Affairs Canada (VAC) (includes newborns, excludes stillbirths).
RHA 2013/142009/10 2012/132010/11 2011/12
May 2015 Section III - Page 12

2013/14 Annual Report of Hospital Services Section III - Clinical statistics, Discharge Abstract Database
Table III - 1(d): VAC Care (Level of Care) Inpatient Separations and Days Stay by Regional Health Authority - 2009/10 to 2013/14
a) Separations (Inpatient Cases: the sum of discharges, deaths, sign outs, transfers out, and transfers from one level of care to another.)
RHA 2009/10 2010/11 2011/12 2012/13 2013/14 2009/10 2010/11 2011/12 2012/13 2013/14RRS A Zone 1 23 25 30 15 21 64.3% 8.7% 20.0% -50.0% 40.0%RRS A Zone 5 10 14 11 15 5 11.1% 40.0% -21.4% 36.4% -66.7%
RRS A 33 39 41 30 26 43.5% 18.2% 5.1% -26.8% -13.3%RHA B Zone 2 54 56 57 47 58 5.9% 3.7% 1.8% -17.5% 23.4%RHA B Zone 3 20 34 30 35 38 -25.9% 70.0% -11.8% 16.7% 8.6%
RHA B 74 90 87 82 96 -5.1% 21.6% -3.3% -5.7% 17.1%
Total 107 129 128 112 122 5.9% 20.6% -0.8% -12.5% 8.9%
b) Total Days Stay (Total Length of Stay (LOS) = the sum of all patients' LOS) c) Average Length of Stay (ALOS)
RHA 2009/10 2010/11 2011/12 2012/13 2013/14 2008/09 2009/10 2010/11 2011/12 2012/13RRS A Zone 1 17,288 19,893 16,227 7,147 12,969 70.6% 15.1% -18.4% -56.0% 81.5% RRS A Zone 1 751.7 795.7 540.9 476.5 617.6RRS A Zone 5 5,487 5,873 6,965 9,101 4,237 -10.4% 7.0% 18.6% 30.7% -53.4% RRS A Zone 5 548.7 419.5 633.2 606.7 847.4
RRS A 22,775 25,766 23,192 16,248 17,206 40.1% 13.1% -10.0% -29.9% 5.9% RRS A 690.2 660.7 565.7 541.6 661.8RHA B Zone 2 29,683 47,800 31,368 22,538 27,465 16.7% 61.0% -34.4% -28.1% 21.9% RHA B Zone 2 549.7 853.6 550.3 479.5 473.5RHA B Zone 3 15,139 25,853 21,487 18,576 19,342 14.3% 70.8% -16.9% -13.5% 4.1% RHA B Zone 3 757.0 760.4 716.2 530.7 509.0
RHA B 44,822 73,653 52,855 41,114 46,807 15.9% 64.3% -28.2% -22.2% 13.8% RHA B 605.7 818.4 607.5 501.4 487.6
Total 67,597 99,419 76,047 57,362 64,013 23.0% 47.1% -23.5% -24.6% 11.6% Total 631.7 770.7 594.1 512.2 524.7
Note 2: Since April 1st 2001, all RHAs have implemented level of care abstracting.Note 3: Source data were extracted from the 3M system, with data submitted by hospitals to CIHI through the Discharge Abstract Database (DAD).
Note 1: Separations are described now by level of care. Previously, separations included patients treated in Acute, Chronic, Rehabilitation and Psychiatric inpatients units in acute care facilities, excluding Psychiatric Hospitals, and Veterans Affairs Canada (VAC) (includes newborns, excludes stillbirths).
RHA 2013/142012/132009/10 2010/11
Separations (Cases)
Days Stay
Year to Year % Change
Year to Year % Change2011/12
May 2015 Section III - Page 13

2013/14 Annual Report of Hospital Services Section III - Clinical statistics, Discharge Abstract Database
Table III - 1(e): Psychiatric Facilities Inpatient Separations and Days Stay by Regional Health Authority - 2009/10 to 2013/14
a) Separations (Inpatient Cases: the sum of discharges, deaths, sign outs, transfers out, and transfers from one level of care to another.)
RHA 2009/10 2010/11 2011/12 2012/13 2013/14 2009/10 2010/11 2011/12 2012/13 2013/14RRS A Zone 5 285 269 274 332 266 13.5% -5.6% 1.9% 21.2% -19.9%
RRS A 285 269 274 332 266 13.5% -5.6% 1.9% 21.2% -19.9%RHA B Zone 2 8 3 8 19 20 -20.0% -62.5% 166.7% 137.5% 5.3%
RHA B 8 3 8 19 20 -20.0% -62.5% 166.7% 137.5% 5.3%
Total 293 272 282 351 286 12.3% -7.2% 3.7% 24.5% -18.5%
b) Total Days Stay (Total Length of Stay (LOS) = the sum of all patients' LOS) c) Average Length of Stay (ALOS)
RHA 2009/10 2010/11 2011/12 2012/13 2013/14 2009/10 2010/11 2011/12 2012/13 2013/14RRS A Zone 5 52,657 148,122 108,522 86,868 168,894 15.1% 181.3% -26.7% -20.0% 94.4% RRS A Zone 5 184.8 550.6 396.1 261.7 634.9
RRS A 52,657 148,122 108,522 86,868 168,894 15.1% 181.3% -26.7% -20.0% 94.4% RRS A 184.8 550.6 396.1 261.7 634.9RHA B Zone 2 7,861 2,159 19,157 23,144 9,494 -74.3% -72.5% 787.3% 20.8% -59.0% RHA B Zone 2 982.6 719.7 2,394.6 1,218.1 474.7
RHA B 7,861 2,159 19,157 23,144 9,494 -74.3% -72.5% 787.3% 20.8% -59.0% RHA B 982.6 719.7 2,394.6 1,218.1 474.7
Total 60,518 150,281 127,679 110,012 178,388 -20.7% 148.3% -15.0% -13.8% 62.2% Total 206.5 552.5 452.8 313.4 623.7
Note 2: Since April 1st 2001, all RHAs have implemented level of care abstracting.Note 3: Source data were extracted from the 3M system, with data submitted by hospitals to CIHI through the Discharge Abstract Database (DAD).
Note 1: Separations are described now by level of care. Previously, separations included patients treated in Acute, Chronic, Rehabilitation and Psychiatric inpatients units in acute care facilities, excluding Psychiatric Hospitals, and Veterans Affairs Canada (VAC) (includes newborns, excludes stillbirths).
RHA 2013/142012/132009/10 2010/11
Separations (Cases)
Days Stay
Year to Year % Change
Year to Year % Change2011/12
May 2015 Section III - Page 14

2013/14 Annual Report of Hospital Services Section III - Clinical statistics, Discharge Abstract Database
Table III - 1(f): Total Newborns by Regional Health Authority - 2009/10 to 2013/14
RHA 2009/10 2010/11 2011/12 2012/13 2013/14 2009/10 2010/11 2011/12 2012/13 2013/14RRS A Zone 1 832 814 787 805 720 -0.2% -2.2% -3.3% 2.3% -10.6%RRS A Zone 4 389 413 400 345 364 -12.4% 6.2% -3.1% -13.8% 5.5%RRS A Zone 5 212 253 198 192 207 -21.2% 19.3% -21.7% -3.0% 7.8%RRS A Zone 6 599 539 531 534 489 1.9% -10.0% -1.5% 0.6% -8.4%
RRS A 2,032 2,019 1,916 1,876 1,780 -4.8% -0.6% -5.1% -2.1% -5.1%RHA B Zone 1 1,357 1,306 1,329 1,342 1,388 9.6% -3.8% 1.8% 1.0% 3.4%RHA B Zone 2 1,710 1,747 1,679 1,629 1,485 -3.6% 2.2% -3.9% -3.0% -8.8%RHA B Zone 3 1,981 1,891 1,852 1,856 1,857 2.7% -4.5% -2.1% 0.2% 0.1%RHA B Zone 7 371 403 378 395 410 -2.1% 8.6% -6.2% 4.5% 3.8%
RHA B 5,419 5,347 5,238 5,222 5,140 1.9% -1.3% -2.0% -0.3% -1.6%
Total 7,451 7,366 7,154 7,098 6,920 0.0% -1.1% -2.9% -0.8% -2.5%
Note 1: Newborns are discharged from the acute care level of care.Note 2: Includes newborns who were born in the hospital.Note 3: Includes newborns who were born to non-residents of the province of New Brunswick (e.g. patients from Nova Scotia, Quebec).Note 4: Excludes newborns who were born on the way to the hospital (e.g. in an ambulance, car or at home) Note 5: Source data were extracted from the 3M system, with data submitted by hospitals to CIHI through the Discharge Abstract Database (DAD).
Figure III - 1(f)(i): Total Newborns by RHA - 2009/10 to 2013/14
Newborns Year to Year % Change
0
500
1,000
1,500
2,000
2,500
RRS A Zone 1 RRS A Zone 4 RRS A Zone 5 RRS A Zone 6 RHA B Zone 1 RHA B Zone 2 RHA B Zone 3 RHA B Zone 7
Tota
l New
born
s
2009/10
2010/11
2011/12
2012/13
2013/14
May 2015 Section III - Page 15

2013/14 Annual Report of Hospital Services Section III - Clinical statistics, Discharge Abstract Database
Table III - 1(g): Total Newborns by Regional Health Authority by Gender - 2009/10 to 2013/14
Females Males Females Males Females Males Females Males Females MalesRRS A Zone 1 408 424 395 419 357 430 371 434 355 365RRS A Zone 4 205 184 201 212 186 214 168 177 172 192RRS A Zone 5 112 100 119 134 106 92 101 91 95 112RRS A Zone 6 289 310 268 271 271 260 263 271 235 254
RRS A 1,014 1,018 983 1,036 920 996 903 973 857 923RHA B Zone 1 701 656 650 656 644 685 643 699 706 682RHA B Zone 2 827 883 861 886 835 844 777 852 753 732RHA B Zone 3 996 985 933 958 926 926 941 915 885 972RHA B Zone 7 188 183 211 192 180 198 193 202 210 200
RHA B 2,712 2,707 2,655 2,692 2,585 2,653 2,554 2,668 2,554 2,586
Total 3,726 3,725 3,638 3,728 3,505 3,649 3,457 3,641 3,411 3,509
Note 1: Excludes hermaphrodites.Note 2: Source data were extracted from the 3M system, with data submitted by hospitals to CIHI through the Discharge Abstract Database (DAD).
Figure III - 1(g)(i) Provincial Percentage of Newborns by Gender - 2009/10 to 2013/14
2009/10 2010/11 2011/12
2012/13 2013/14
Newborns2013/14
RHA2009/10 2011/122010/11 2012/13
49%51%
Females Males
49%51%
Females Males
49%51%
Females Males
49%51%
Females Males
50%50%
Females Males
May 2015 Section III - Page 16

2013/14 Annual Report of Hospital Services Section III - Clinical statistics, Discharge Abstract Database
Table III - 1(h): Total Deaths (All Inpatient Levels of Care) by Regional Health Authority - 2009/10 to 2013/14
RHA 2009/10 2010/11 2011/12 2012/13 2013/14 2009/10 2010/11 2011/12 2012/13 2013/14RRS A Zone 1 445 461 474 467 454 6.7% 3.6% 2.8% -1.5% -2.8%RRS A Zone 4 270 249 269 293 289 -0.7% -7.8% 8.0% 8.9% -1.4%RRS A Zone 5 175 217 168 215 168 -17.1% 24.0% -22.6% 28.0% -21.9%RRS A Zone 6 424 434 381 410 418 -4.3% 2.4% -12.2% 7.6% 2.0%
RRS A 1,314 1,361 1,292 1,385 1,329 -2.2% 3.6% -5.1% 7.2% -4.0%RHA B Zone 1 566 554 577 569 575 0.2% -2.1% 4.2% -1.4% 1.1%RHA B Zone 2 977 884 897 911 906 -0.3% -9.5% 1.5% 1.6% -0.5%RHA B Zone 3 781 825 822 792 927 -1.1% 5.6% -0.4% -3.6% 17.0%RHA B Zone 7 240 228 228 179 218 3.4% -5.0% 0.0% -21.5% 21.8%
RHA B 2,564 2,491 2,524 2,451 2,626 -0.1% -2.8% 1.3% -2.9% 7.1%
Total 3,878 3,852 3,816 3,836 3,955 -0.8% -0.7% -0.9% 0.5% 3.1%
Note 1: Includes all inpatient levels of care (Acute, Chronic/Extended care, VAC, Rehab and Psychiatric facilities)Note 2: Includes adults, children and newborns.Note 3: Excludes patients who may have died in the Emergency Room (ER), Outpatient Department (OPD) or were dead on arrival (DOA). Note 4: Includes deaths of patients who are non-residents of the province of New Brunswick (e.g. patients from Nova Scotia, Quebec).Note 5: Excludes stillbirths.
Figure III - 1(h)(i) Total Deaths (All Inpatient Levels of Care) by RHA - 2009/10 to 2013/14
Deaths
Note 6: Source data were extracted from the 3M system, with data submitted by hospitals to CIHI through the Discharge Abstract Database (DAD) and starting in 2004/05, from the National Rehabilitation Reporting System (NRS) for the Stan Cassidy Centre for Rehabilitation and 2006/07 for The Moncton Hospital.
Year to Year % Change
0
100
200
300
400
500
600
700
800
900
1,000
1,100
RRS A Zone 1 RRS A Zone 4 RRS A Zone 5 RRS A Zone 6 RHA B Zone 1 RHA B Zone 2 RHA B Zone 3 RHA B Zone 7
Tota
l Dea
ths
2009/10
2010/11
2011/12
2012/13
2013/14
May 2015 Section III - Page 17

2013/14 Annual Report of Hospital Services Section III - Clinical statistics, Discharge Abstract Database
Table III - 1(i): Total Deaths (All Inpatient Levels of Care) by Regional Health Authority by Gender - 2009/10 to 2013/14
Females Males Females Males Females Males Females Males Females MalesRRS A Zone 1 205 240 229 232 225 249 246 221 227 227RRS A Zone 4 133 137 123 126 134 135 147 146 141 148RRS A Zone 5 98 77 112 105 82 86 101 114 81 87RRS A Zone 6 201 223 219 215 174 207 179 231 195 223
RRS A 637 677 683 678 615 677 673 712 644 685RHA B Zone 1 280 286 275 279 265 312 286 283 274 301RHA B Zone 2 479 498 428 456 407 490 430 481 421 485RHA B Zone 3 395 386 414 411 417 405 403 389 469 458RHA B Zone 7 111 129 115 113 108 120 93 86 108 110
RHA B 1,265 1,299 1,232 1,259 1,197 1,327 1,212 1,239 1,272 1,354
Total 1,902 1,976 1,915 1,937 1,812 2,004 1,885 1,951 1,916 2,039
Note 1: Excludes hermaphrodites or transsexuals
Figure III - 1(i)(i) Provincial Percentage of Deaths by Gender - 2009/10 to 2013/14
2009/10 2010/11 2011/12
2012/13 2013/14
Note 2: Source data were extracted from the 3M system, with data submitted by hospitals to CIHI through the Discharge Abstract Database (DAD) and starting in 2004/05, from the National Rehabilitation Reporting System (NRS) for the Stan Cassidy Centre for Rehabilitation and 2006/07 for The Moncton Hospital.
Deaths2013/14
RHA2011/122010/11 2012/132009/10
48%52%
Females Males
49%51%
Females Males
47%53%
Females Males
50%50%
Females Males
49%51%
Females Males
May 2015 Section III - Page 18

2013/14 Annual Report of Hospital Services Section III - Clinical statistics, Discharge Abstract Database
Table III - 1(j): Acute care (Level of care) Total Deliveries by Regional Health Authority - 2009/10 to 2013/14
(a) Vaginal births
RHA 2009/10 2010/11 2011/12 2012/13 2013/14RRS A Zone 1 607 586 580 568 531RRS A Zone 4 269 298 278 230 263RRS A Zone 5 127 165 118 131 141RRS A Zone 6 435 385 383 374 299
RRS A 1,438 1,434 1,359 1,303 1,234RHA B Zone 1 864 869 921 930 1,007RHA B Zone 2 1305 1361 1327 1,280 1,161RHA B Zone 3 1362 1331 1305 1,278 1,279RHA B Zone 7 245 274 233 237 261
RHA B 3,776 3,835 3,786 3,725 3,708
Total 5,214 5,269 5,145 5,028 4,942
(b) Caesarean Sections
RHA 2009/10 2010/11 2011/12 2012/13 2013/14 RHA 2009/10 2010/11 2011/12 2012/13 2013/14RRS A Zone 1 213 215 200 231 187 RRS A Zone 1 26.0% 26.8% 25.6% 28.9% 26.0%RRS A Zone 4 117 115 117 108 98 RRS A Zone 4 30.3% 27.8% 29.6% 32.0% 27.1%RRS A Zone 5 85 87 80 65 66 RRS A Zone 5 40.1% 34.5% 40.4% 33.2% 31.9%RRS A Zone 6 157 152 140 154 181 RRS A Zone 6 26.5% 28.3% 26.8% 29.2% 37.7%
RRS A 572 569 537 558 532 RRS A 28.5% 28.4% 28.3% 30.0% 30.1%
RHA B Zone 1 454 403 388 376 352 RHA B Zone 1 34.4% 31.7% 29.6% 28.8% 25.9%
RHA B Zone 2 399 370 337 326 314 RHA B Zone 2 23.4% 21.4% 20.3% 20.3% 21.3%RHA B Zone 3 605 538 536 548 558 RHA B Zone 3 30.8% 28.8% 29.1% 30.0% 30.4%RHA B Zone 7 123 129 146 156 145 RHA B Zone 7 33.4% 32.0% 38.5% 39.7% 35.7%
RHA B 1,581 1,440 1,407 1,406 1,369 RHA B 29.5% 27.3% 27.1% 27.4% 27.0%
Total 2,153 2,009 1,944 1,964 1,901 Total 29.2% 27.6% 27.4% 28.1% 27.8%
(c) Total Deliveries
RHA 2009/10 2010/11 2011/12 2012/13 2013/14RRS A Zone 1 820 801 780 799 718RRS A Zone 4 386 413 395 338 361RRS A Zone 5 212 252 198 196 207RRS A Zone 6 592 537 523 528 480
RRS A 2,010 2,003 1,896 1,861 1,766
RHA B Zone 1 1,318 1,272 1,309 1,306 1,359
RHA B Zone 2 1,704 1,731 1,664 1,606 1,475RHA B Zone 3 1,967 1,869 1,841 1,826 1,837RHA B Zone 7 368 403 379 393 406
RHA B 5,357 5,275 5,193 5,131 5,077
Total 7,367 7,278 7,089 6,992 6,843
Note 1: Includes all patients who delivered a newborn or a stillborn in an acute care hospital facility. Note 2: Excludes deliveries where an abortion intervention was performed.Note 3: Source data were extracted from the 3M system, with data submitted by hospitals to CIHI through the Discharge Abstract Database (DAD).
Percentage of Caesarean Sections
Vaginal births
Caesarean sections
All deliveries
May 2015 Section III - Page 19
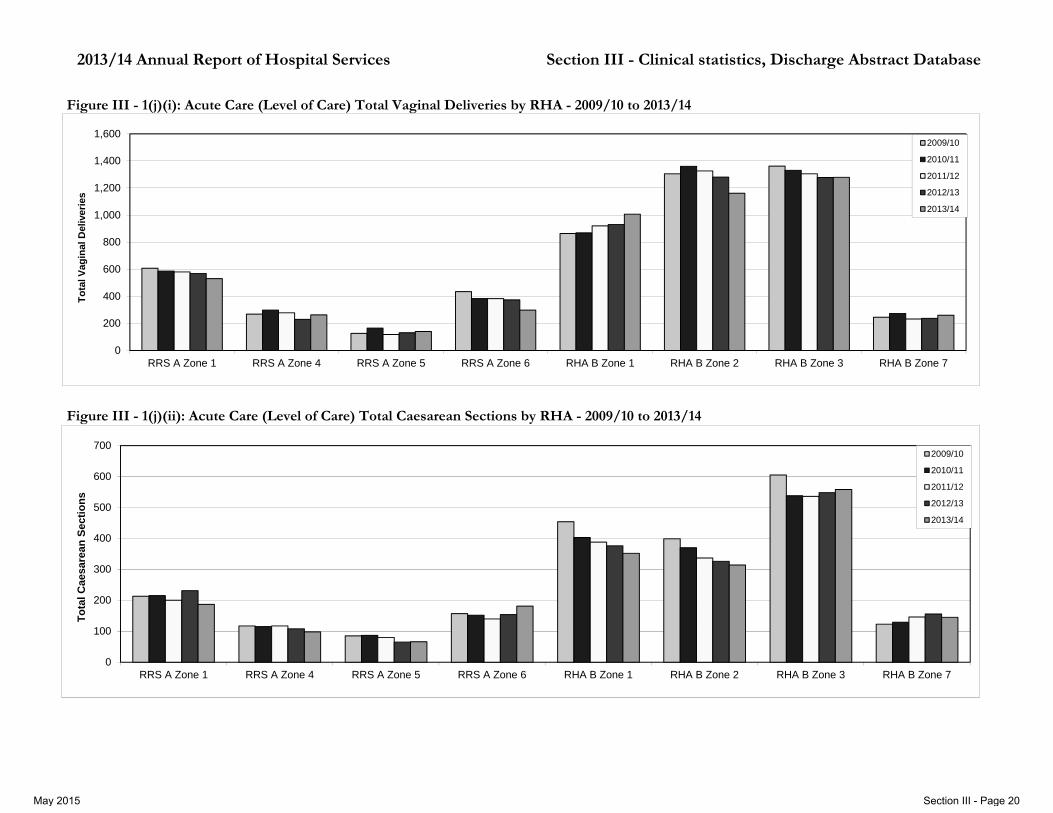
2013/14 Annual Report of Hospital Services Section III - Clinical statistics, Discharge Abstract Database
Figure III - 1(j)(i): Acute Care (Level of Care) Total Vaginal Deliveries by RHA - 2009/10 to 2013/14
Figure III - 1(j)(ii): Acute Care (Level of Care) Total Caesarean Sections by RHA - 2009/10 to 2013/14
0
200
400
600
800
1,000
1,200
1,400
1,600
RRS A Zone 1 RRS A Zone 4 RRS A Zone 5 RRS A Zone 6 RHA B Zone 1 RHA B Zone 2 RHA B Zone 3 RHA B Zone 7
Tota
l Vag
inal
Del
iver
ies
2009/10
2010/11
2011/12
2012/13
2013/14
0
100
200
300
400
500
600
700
RRS A Zone 1 RRS A Zone 4 RRS A Zone 5 RRS A Zone 6 RHA B Zone 1 RHA B Zone 2 RHA B Zone 3 RHA B Zone 7
Tota
l Cae
sare
an S
ectio
ns
2009/10
2010/11
2011/12
2012/13
2013/14
May 2015 Section III - Page 20

2013/14 Annual Report of Hospital Services Section III - Clinical statistics, Discharge Abstract Database
Figure III - 1(j)(iv): Acute Care (Level of Care) % Caesarean Sections by RHA - 2009/10 to 2013/14
Figure III - 1(j)(iii): Acute Care (Level of Care) Total Deliveries (vaginal & caesarean section) by RHA - 2009/10 to 2013/14
0
500
1,000
1,500
2,000
2,500
RRS A Zone 1 RRS A Zone 4 RRS A Zone 5 RRS A Zone 6 RHA B Zone 1 RHA B Zone 2 RHA B Zone 3 RHA B Zone 7
Tota
l Del
iver
ies
2009/10
2010/11
2011/12
2012/13
2013/14
0%
5%
10%
15%
20%
25%
30%
35%
40%
45%
RRS A Zone 1 RRS A Zone 4 RRS A Zone 5 RRS A Zone 6 RHA B Zone 1 RHA B Zone 2 RHA B Zone 3 RHA B Zone 7
% C
aesa
rean
Sec
tions
2009/10 2010/11 2011/12
2012/13 2013/14
May 2015 Section III - Page 21

2013/14 Annual Report of Hospital Services Section III - Clinical statistics, Discharge Abstract Database
Table III - 2: Total Day Surgery Cases, Weighted Cases and Average CACS Weight by Regional Health Authority - 2009/10 to 2013/14
a) Day Surgery Cases
RHA 2009/10 2010/11 2011/12 2012/13 2013/14 2009/10 2010/11 2011/12 2012/13 2013/14RRS A Zone 1 4,113 4,444 4,596 4,406 4,341 -4.4% 8.0% 3.4% -4.1% -1.5%RRS A Zone 4 2,744 2,669 2,927 2,974 3,200 5.3% -2.7% 9.7% 1.6% 7.6%RRS A Zone 5 1,644 1,629 1,640 1,762 1,957 2.3% -0.9% 0.7% 7.4% 11.1%RRS A Zone 6 4,243 3,979 3,985 3,560 3,479 -2.1% -6.2% 0.2% -10.7% -2.3%
RRS A 12,744 12,721 13,148 12,702 12,977 -0.8% -0.2% 3.4% -3.4% 2.2%RHA B Zone 1 7,809 4,561 4,490 4,191 4,390 -8.2% -41.6% -1.6% -6.7% 4.7%RHA B Zone 2 9,950 10,298 10,277 10,719 10,666 0.2% 3.5% -0.2% 4.3% -0.5%RHA B Zone 3 12,624 12,670 12,949 12,886 13,448 9.3% 0.4% 2.2% -0.5% 4.4%RHA B Zone 7 2,700 2,720 2,739 2,998 2,860 6.5% 0.7% 0.7% 9.5% -4.6%
RHA B 33,083 30,249 30,455 30,794 31,364 1.7% -8.6% 0.7% 1.1% 1.9%
Total 45,827 42,970 43,603 43,496 44,341 1.0% -6.2% 1.5% -0.2% 1.9%
b) Day Surgery Weighted Cases (derived from the Comprehensive Ambulatory Classification System (CACS) Weights)
RHA 2009/10 2010/11 2011/12 2012/13 2013/14 2009/10 2010/11 2011/12 2012/13 2013/14RRS A Zone 1 1,088 1,213 1,355 1,320 1,321 -5.0% 11.5% 11.7% -2.6% 0.1%RRS A Zone 4 533 518 603 616 682 5.1% -2.8% 16.6% 2.2% 10.7%RRS A Zone 5 368 352 367 404 446 2.9% -4.2% 4.1% 10.0% 10.6%RRS A Zone 6 984 925 926 862 859 1.0% -5.9% 0.1% -7.0% -0.3%
RRS A 2,972 3,008 3,252 3,202 3,309 -0.4% 1.2% 8.1% -1.5% 3.3%RHA B Zone 1 1,591 1,261 1,264 1,239 1,328 -6.3% -20.8% 0.3% -2.0% 7.2%RHA B Zone 2 2,358 2,388 2,429 2,491 2,454 3.4% 1.3% 1.7% 2.5% -1.5%RHA B Zone 3 2,646 2,601 2,643 2,611 2,722 7.8% -1.7% 1.6% -1.2% 4.3%RHA B Zone 7 629 637 639 684 675 6.4% 1.3% 0.3% 7.0% -1.3%
RHA B 7,223 6,886 6,975 7,024 7,178 2.8% -4.7% 1.3% 0.7% 2.2%
Total 10,195 9,895 10,227 10,225 10,487 1.9% -3.0% 3.4% 0.0% 2.6%
c) Average CACS WeightRHA 2009/10 2010/11 2011/12 2012/13 2013/14
RRS A Zone 1 0.2646 0.2730 0.2949 0.2995 0.3043RRS A Zone 4 0.1941 0.1940 0.2062 0.2073 0.2132RRS A Zone 5 0.2238 0.2164 0.2238 0.2291 0.2281RRS A Zone 6 0.2318 0.2325 0.2324 0.2421 0.2469
RRS A 0.2332 0.2365 0.2473 0.2521 0.2550RHA B Zone 1 0.2037 0.2764 0.2816 0.2956 0.3024RHA B Zone 2 0.2369 0.2319 0.2364 0.2324 0.2300RHA B Zone 3 0.2096 0.2053 0.2041 0.2026 0.2024RHA B Zone 7 0.2329 0.2341 0.2333 0.2280 0.2360
RHA B 0.2183 0.2276 0.2290 0.2281 0.2289
Total 0.2225 0.2303 0.2346 0.2351 0.2365
Note 1: The CACS weights (derived from RIW's) are based on the 2013 grouper for all five years. This affects the comparability with previous years' reports.
Note 3: Source data were extracted from the 3M system, except the weighted cases from 2009/10 to 2012/13 with data submitted by hospitals to CIHI through the Discharge Abstract Database (DAD). The weighted cases which were extracted from HFUMS was provided by CIHI and based on fiscal 2013 methodology.
Note 2: The present day surgery definition does not allow for consistent reporting of day surgery procedures/interventions. The data must not be compared from one RHA to the other. Starting with 2003/04, the day surgeries will only include the cases done in the MIS day surgery functional centre.
Total Day Surgery Cases
Weighted Cases (RIW)
Year to Year % Change
Year to Year % Change
May 2015 Section III - Page 22

2013/14 Annual Report of Hospital Services Section III - Clinical statistics, Discharge Abstract Database
Figure III - 2(i): Total Day Surgery Cases by RHA - 2009/10 to 2013/14
Figure III - 2(ii): Total Day Surgery Weighted Cases by RHA - 2009/10 to 2013/14
0
2,000
4,000
6,000
8,000
10,000
12,000
14,000
RRS A Zone 1 RRS A Zone 4 RRS A Zone 5 RRS A Zone 6 RHA B Zone 1 RHA B Zone 2 RHA B Zone 3 RHA B Zone 7
Day
Su
rger
y C
ases
2009/10
2010/11
2011/12
2012/13
2013/14
0
500
1,000
1,500
2,000
2,500
3,000
RRS A Zone 1 RRS A Zone 4 RRS A Zone 5 RRS A Zone 6 RHA B Zone 1 RHA B Zone 2 RHA B Zone 3 RHA B Zone 7
Day
Su
rger
y W
eigh
ted
Cas
es
2009/10
2010/11
2011/12
2012/13
2013/14
May 2015 Section III - Page 23

2013/14 Annual Report of Hospital Services Section III - Clinical statistics, Discharge Abstract Database
Figure III - 2(iii): Average CACS Weight per Day Surgery Case by RHA - 2009/10 to 2013/14
0.00
0.05
0.10
0.15
0.20
0.25
0.30
0.35
RRS A Zone 1 RRS A Zone 4 RRS A Zone 5 RRS A Zone 6 RHA B Zone 1 RHA B Zone 2 RHA B Zone 3 RHA B Zone 7
Ave
rage
CA
CS
Wei
ght
2009/102010/112011/122012/132013/14
May 2015 Section III - Page 24

2013/14 Annual Report of Hospital Services Section III - Clinical statistics, Discharge Abstract Database
Table III - 3(a): Total Surgical Episodes Performed in the Main OR and Total Caesarean Sections in the Delivery Room by Regional Health Authority - 2009/10 to 2013/14
(a) Inpatient Episodes in the Main OR and Caesarean Sections in the Delivery Room
RHA 2009/10 2010/11 2011/12 2012/13 2013/14 2009/10 2010/11 2011/12 2012/13 2013/14 RHA 2009/10 2010/11 2011/12 2012/13 2013/14RRS A Zone 1 3,134 3,244 3,367 3,286 2,817 -6.0% 3.5% 3.8% -2.4% -14.3% RRS A Zone 1 40.1% 39.3% 39.0% 39.1% 36.9%RRS A Zone 4 1,675 1,742 1,685 1,684 1,585 -2.7% 4.0% -3.3% -0.1% -5.9% RRS A Zone 4 38.9% 40.3% 37.6% 36.9% 34.1%RRS A Zone 5 1,134 1,079 1,076 780 676 5.6% -4.9% -0.3% -27.5% -13.3% RRS A Zone 5 41.2% 40.3% 40.4% 31.2% 26.0%RRS A Zone 6 2,781 2,754 2,692 2,651 2,351 -10.8% -1.0% -2.3% -1.5% -11.3% RRS A Zone 6 40.0% 41.3% 40.6% 43.0% 40.9%
RRS A 8,724 8,819 8,820 8,401 7,429 -5.7% 1.1% 0.0% -4.8% -11.6% RRS A 40.0% 40.2% 39.4% 38.8% 36.0%RHA B Zone 1 4,565 4,614 4,648 4,454 3,869 2.2% 1.1% 0.7% -4.2% -13.1% RHA B Zone 1 35.2% 43.3% 43.6% 44.4% 40.0%RHA B Zone 2 5,645 5,514 5,676 5,424 5,138 -4.8% -2.3% 2.9% -4.4% -5.3% RHA B Zone 2 37.7% 36.2% 37.3% 35.0% 33.9%RHA B Zone 3 4,304 4,260 4,083 4,080 3,643 -0.3% -1.0% -4.2% -0.1% -10.7% RHA B Zone 3 27.3% 27.5% 26.4% 27.1% 24.1%RHA B Zone 7 1,570 1,425 1,554 1,508 1,323 0.4% -9.2% 9.1% -3.0% -12.3% RHA B Zone 7 37.1% 34.7% 36.6% 33.8% 32.0%
RHA B 16,084 15,813 15,961 15,466 13,973 -1.2% -1.7% 0.9% -3.1% -9.7% RHA B 33.5% 34.8% 35.0% 34.3% 31.7%
Total 24,808 24,632 24,781 23,867 21,402 -2.8% -0.7% 0.6% -3.7% -10.3% Total 35.6% 36.6% 36.4% 35.8% 33.1%
(b) Day Surgery Episodes in the Main OR
RHA 2009/10 2010/11 2011/12 2012/13 2013/14 2009/10 2010/11 2011/12 2012/13 2013/14 RHA 2009/10 2010/11 2011/12 2012/13 2013/14RRS A Zone 1 4,677 5,002 5,264 5,114 4,822 -5.0% 6.9% 5.2% -2.8% -5.7% RRS A Zone 1 59.9% 60.7% 61.0% 60.9% 63.1%RRS A Zone 4 2,636 2,585 2,802 2,880 3,066 4.1% -1.9% 8.4% 2.8% 6.5% RRS A Zone 4 61.1% 59.7% 62.4% 63.1% 65.9%RRS A Zone 5 1,617 1,597 1,585 1,724 1,921 2.4% -1.2% -0.8% 8.8% 11.4% RRS A Zone 5 58.8% 59.7% 59.6% 68.8% 74.0%RRS A Zone 6 4,176 3,908 3,932 3,509 3,399 1.4% -6.4% 0.6% -10.8% -3.1% RRS A Zone 6 60.0% 58.7% 59.4% 57.0% 59.1%
RRS A 13,106 13,092 13,583 13,227 13,208 -0.4% -0.1% 3.8% -2.6% -0.1% RRS A 60.0% 59.8% 60.6% 61.2% 64.0%RHA B Zone 1 8,395 6,032 6,013 5,580 5,805 -0.1% -28.1% -0.3% -7.2% 4.0% RHA B Zone 1 64.8% 56.7% 56.4% 55.6% 60.0%
RHA B Zone 2 9,347 9,711 9,559 10,060 10,006 0.1% 3.9% -1.6% 5.2% -0.5% RHA B Zone 2 62.3% 63.8% 62.7% 65.0% 66.1%RHA B Zone 3 11,467 11,207 11,394 10,999 11,490 8.1% -2.3% 1.7% -3.5% 4.5% RHA B Zone 3 72.7% 72.5% 73.6% 72.9% 75.9%RHA B Zone 7 2,657 2,680 2,689 2,954 2,809 6.6% 0.9% 0.3% 9.9% -4.9% RHA B Zone 7 62.9% 65.3% 63.4% 66.2% 68.0%
RHA B 31,866 29,630 29,655 29,593 30,110 3.4% -7.0% 0.1% -0.2% 1.7% RHA B 66.5% 65.2% 65.0% 65.7% 68.3%
Total 44,972 42,722 43,238 42,820 43,318 2.2% -5.0% 1.2% -1.0% 1.2% Total 64.4% 63.4% 63.6% 64.2% 66.9%
(c) All Main OR Episodes and Caesarean Sections in the Delivery Room
RHA 2009/10 2010/11 2011/12 2012/13 2013/14 2009/10 2010/11 2011/12 2012/13 2013/14RRS A Zone 1 7,811 8,246 8,631 8,400 7,639 -5.4% 5.6% 4.7% -2.7% -9.1%
RRS A Zone 4 4,311 4,327 4,487 4,564 4,651 1.4% 0.4% 3.7% 1.7% 1.9%
RRS A Zone 5 2,751 2,676 2,661 2,504 2,597 3.7% -2.7% -0.6% -5.9% 3.7%
RRS A Zone 6 6,957 6,662 6,624 6,160 5,750 -3.9% -4.2% -0.6% -7.0% -6.7%
RRS A 21,830 21,911 22,403 21,628 20,637 -2.5% 0.4% 2.2% -3.5% -4.6%RHA B Zone 1 12,960 10,646 10,661 10,034 9,674 0.7% -17.9% 0.1% -5.9% -3.6%
RHA B Zone 2 14,992 15,225 15,235 15,484 15,144 -1.8% 1.6% 0.1% 1.6% -2.2%
RHA B Zone 3 15,771 15,467 15,477 15,079 15,133 5.7% -1.9% 0.1% -2.6% 0.4%
RHA B Zone 7 4,227 4,105 4,243 4,462 4,132 4.2% -2.9% 3.4% 5.2% -7.4%
RHA B 47,950 45,443 45,616 45,059 44,083 1.8% -5.2% 0.4% -1.2% -2.2%
Total 69,780 67,354 68,019 66,687 64,720 0.4% -3.5% 1.0% -2.0% -2.9%
Note 1: This report has been reorganized to present operative episodes based on the discharge date as these data are extracted from the Discharge Abstract Database (DAD).
Note 2: An episode is recorded each time a patient goes to the operating room during an admission. There can be multiple procedures during one episode. Note 3: Interventions which were cancelled, previous surgeries and interventions which were performed out of hospital have been excluded from the data.Note 4: Source data were extracted from the 3M system, with data submitted by hospitals to CIHI through the Discharge Abstract Database (DAD). Note 5: The day surgery total includes cataract surgery performed in the ambulatory care location for RRS A Zone 1 starting with fiscal 2006/07 and for RHA B Zone 1 starting with fiscal 2008/09.
Year to Year % Change
Day Surgery Year to Year % Change
Total All
Percentage of All Main OR Episodes and Caesarean Sections
Percentage of All Main OR Episodes and Caesarean Sections
Year to Year % ChangeInpatient
May 2015 Section III - Page 25

2013/14 Annual Report of Hospital Services Section III - Clinical statistics, Discharge Abstract Database
Rank Cases Rank Cases Rank Cases Rank Cases Rank CasesCaesarean section delivery 1 1,896 1 1,964 1 1,943 1 2,008 1 2,153Implantation of internal device, knee joint 2 1,466 2 1,464 2 1,417 2 1,204 3 1,166Implantation of internal device, hip joint 3 1,180 4 1,123 4 1,167 4 1,100 5 1,000Excision total, uterus and surrounding structures 4 1,120 3 1,132 3 1,186 3 1,153 2 1,228Excision total, gallbladder 5 928 5 937 5 1,057 5 1,057 4 1,024Excision total, appendix 6 782 6 778 6 770 6 792 6 765Fusion, spinal vertebrae 7 535 8 553 9 494 13 397 13 363Repair, muscles of the chest and abdomen 8 529 7 585 7 598 7 549 7 537Excision partial, large intestine 9 503 9 527 10 490 9 488 10 475Bypass, coronary arteries 10 451 11 448 11 463 10 475 9 511Implantation of internal device, heart NEC 11 370 12 362 14 366 11 421 12 427Fixation, femur 12 346 15 292 15 306 15 312 16 294Excision partial, prostate 13 331 10 487 8 507 8 543 8 529Fixation, ankle joint 14 315 13 317 13 395 14 362 14 331Fixation, hip joint 15 261 16 268 17 247 17 263 25 199Excision partial, rectum 16 256 17 263 19 238 20 226 19 254Fixation, radius and ulna 17 238 18 251 20 225 19 250 17 278Excision total, tonsils and adenoids 18 224 14 309 12 413 12 401 11 454Excision partial, thyroid gland 19 212 20 192 19 232 22 213 20 235Excision partial, bladder NEC 20 191 19 220 21 213 21 225 21 229Excision total with reconstruction, aortic valve 21 186 24 166 24 180 28 177 26 175Excision total, ovary with fallopian tube 22 185 21 189 22 210 22 213 22 206Excision partial, small intestine 23 177 25 165 27 161 29 155 28 157Fixation, tibia and fibula 24 174 22 184 26 173 25 201 22 206Repair, vagina NEC 25 168 23 181 22 195 18 252 17 274Total Inpatient Principle Interventions for top 25 13,024 13,357 13,646 13,437 13,470Total Inpatient Principle Interventions for province 21,889 22,601 23,910 23,362 23,330Top 25 - % of Total Principle Interventions 59.5% 59.1% 57.1% 57.5% 57.7%
Note 1: Inpatient principle interventions which were cancelled, previous surgeries and interventions which were performed out of hospital have been excluded from the data.Note 2: Source data were extracted from the 3M system with data submitted by hospitals to CIHI through the Discharge Abstract Database (DAD). Note 3: Abbreviations: NEC = Not elsewhere classified.
Table III - 3(b): All Inpatient Separations (cases) - Top 25 Principle Interventions (Main OR) and principle Caesarean Sections (Delivery Room) in the province - 2009/10 to 2013/14
2011/12Principle Intervention Description
2013/14 2012/13 2010/11 2009/10
May 2015 Section III - Page 26

2013/14 Annual Report of Hospital Services Section III - Clinical statistics, Discharge Abstract Database
Table III - 4(a): Acute Care Separations (Cases) - Top 25 Case Mix Groups (CMG+) in the Province - 2009/10 to 2013/14
Rank Cases Days Stay Rank Cases Days Stay Rank Cases Days Stay Rank Cases Days Stay Rank Cases Days Stay
576 Normal Newborn, Singleton Vaginal Delivery 1 3,250 5,659 1 3,420 6,165 1 3,703 6,790 1 3,881 7,187 1 3,889 7,507139 Chronic Obstructive Pulmonary Disease 2 3,008 30,616 2 3,003 28,413 2 3,032 29,870 2 3,081 30,349 2 2,836 27,845194 Myocardial Infarction/Shock/Arrest without Coronary Angiogram 3 1,658 10,431 6 1,594 8,674 9 1,473 8,203 9 1,549 8,557 9 1,517 9,296196 Heart Failure without Coronary Angiogram 4 1,558 17,530 5 1,659 18,374 6 1,621 18,937 5 1,676 19,865 5 1,647 18,256138 Viral/Unspecified Pneumonia 5 1,545 13,464 3 1,723 14,085 4 1,754 12,383 6 1,616 12,551 6 1,618 12,394565 Vaginal Birth without Anaesthetic without Non-Major Obstetric/Gynecologic
Intervention 6 1,523 3,221 4 1,661 3,445 5 1,712 3,601 4 1,713 3,656 4 1,744 3,829249 Non-severe Enteritis 7 1,503 6,147 8 1,437 6,380 3 1,767 6,614 10 1,519 7,093 10 1,469 6,096810 Palliative Care 8 1,479 25,305 10 1,380 24,519 8 1,504 28,214 7 1,595 32,549 7 1,553 27,489202 Arrhythmia without Coronary Angiogram 9 1,459 7,253 7 1,526 7,878 7 1,553 7,879 8 1,555 8,341 8 1,538 8,002601 Newborn/Neonate 2500+ grams, Other Minor Problem 10 1,401 3,781 14 1,195 3,512 17 1,087 3,387 19 1,019 3,166 20 968 3,314321 Unilateral Knee Replacement 11 1,385 6,482 11 1,369 6,843 13 1,303 6,804 15 1,111 6,448 18 1,053 6,396562 Vaginal Birth with Anaesthetic and Non-Major Obstetric/Gynecologic
Intervention 12 1,362 4,083 12 1,296 3,708 11 1,368 3,829 12 1,377 3,999 12 1,352 4,067563 Vaginal Birth with Anaesthetic without Non-Major Obstetric/Gynecologic
Intervention 13 1,354 3,284 9 1,414 3,526 12 1,317 3,239 11 1,392 3,289 13 1,346 3,185502 Hysterectomy with Non Malignant Diagnosis 14 1,079 2,591 16 1,093 2,868 16 1,160 3,216 16 1,094 3,159 15 1,199 3,587208 Angina (except Unstable)/Chest Pain without Coronary Angiogram 15 1,046 3,415 13 1,254 3,573 10 1,450 4,477 3 1,723 5,151 3 1,801 5,150
257 Symptom/Sign of Digestive System 16 1,035 4,825 17 1,057 4,929 15 1,229 6,122 13 1,282 5,821 14 1,301 5,522175 Percutaneous Coronary Intervention with MI/Shock/Arrest/Heart Failure 17 1,028 2,691 18 1,006 2,773 21 934 2,719 21 915 2,704 23 878 2,642577 Normal Newborn Multiple/Caesarean Delivery 18 1,013 2,653 15 1,154 3,142 14 1,245 3,545 14 1,274 3,706 11 1,378 4,039811 General Symptom/Sign 19 1,008 22,927 19 985 20,626 20 984 19,625 20 989 18,563 21 958 20,720806 Convalescence 20 973 6,165 20 964 6,239 19 1,056 6,124 18 1,069 7,491 16 1,173 9,388693 Depressive Episode without ECT 21 915 11,464 22 874 12,310 22 898 12,055 21 915 11,650 19 1,044 13,195560 Caesarean Section with uterine scar, no induction 22 793 2,353 30 698 2,071 31 680 2,007 29 749 2,302 26 775 2,362320 Unilateral Hip Replacement 23 757 4,128 31 692 4,035 28 715 5,136 31 658 4,265 33 593 4,305204 Unstable Angina/Atherosclerotic Heart Disease without Coronary Angiogram 24 750 4,195 21 877 4,572 18 1,074 5,787 17 1,075 6,102 17 1,127 6,599437 Diabetes 25 735 5,715 25 726 5,733 25 767 6,150 25 814 7,922 25 796 5,248
33,617 210,378 34,057 208,393 35,386 216,713 35,641 225,886 35,553 220,43387,227 769,944 88,273 764,429 90,701 741,488 90,812 774,105 89,727 748,50538.5% 38.6% 39.0% 39.2% 39.6%
Note 4: Abbreviations: ECT = Electroconvulsive therapy, MI = Myocardial infarction.
Note 3: Source data were extracted from the 3M system for 2013/14 with data submitted by hospitals to CIHI through the Discharge Abstract Database (DAD). The regrouped data for all fiscal years, except 2013/14, which was extracted from HFUMS was provided by CIHI and based on fiscal 2013 methodology. This affects the comparability with previous years' reports.
Total Separations for Top 25 CMGs
Total Separations for Province
Top 25 - % of Total Separations
Note 1: Separations are described now by level of care. Previously, separations included patients treated in Acute, Chronic, Rehabilitation and Psychiatric inpatients units in acute care facilities, excluding Psychiatric Hospitals, and Veterans Affairs Canada (VAC) (includes newborns, excludes stillbirths).
Note 2: The fiscal 2007/08 CMG+ grouper methodology has been redeveloped by CIHI and it is now based on ICD10CA diagnosis and CCI intervention activity and cost data. Cases have been grouped into Case Mix Groups (CMGs) using the 2013 CMG+ Grouper for all years. CMGs are ranked in descending order based on 2013/14 separations.
CMG+2013/14 2010/11 2009/102011/122012/13
CMG+ Description
May 2015 Section III - Page 27

2013/14 Annual Report of Hospital Services Section III - Clinical statistics, Discharge Abstract Database
Table III - 4(b): Acute Care Separations (Cases) - Top 10 Case Mix Groups (CMG+) by Regional Health Authority - 2009/10 to 2013/14
Rank CasesDays Stay
Rank CasesDays Stay
Rank CasesDays Stay
Rank CasesDays Stay
Rank CasesDays Stay
576 Normal Newborn, Singleton Vaginal Delivery 1 362 713 1 376 769 1 365 746 1 315 628 1 369 773139 Chronic Obstructive Pulmonary Disease 2 259 2,634 2 249 1,998 2 232 2,487 2 251 3,070 4 202 1,893811 General Symptom/Sign 3 206 5,717 6 187 5,588 9 160 6,225 10 147 4,714 13 135 5,823563 Vaginal Birth with Anaesthetic without Non-Major Obstetric/Gynecologic
Intervention 4 192 549 3 212 618 3 216 558 3 227 551 2 216 522196 Heart Failure without Coronary Angiogram 5 189 1,714 7 175 1,692 7 174 1,751 7 194 1,960 7 170 1,928249 Non-severe Enteritis 5 189 612 5 192 839 5 195 636 12 140 566 14 132 396138 Viral/Unspecified Pneumonia 7 180 1,342 4 193 1,537 6 193 1,196 6 201 1,945 3 208 1,893565 Vaginal Birth without Anaesthetic without Non-Major
Obstetric/Gynecologic Intervention 8 173 459 9 173 394 4 203 435 5 202 443 5 200 461194 Myocardial Infarction/Shock/Arrest without Coronary Angiogram 9 172 990 12 148 732 15 120 731 11 142 792 8 165 1,325601 Newborn/Neonate 2500+ grams, Other Minor Problem 10 163 502 10 163 545 8 167 586 3 227 689 6 172 584
2,085 15,232 2,068 14,712 2,025 15,351 2,046 15,358 1,969 15,59810,135 91,699 9,971 93,874 10,063 89,715 9,947 90,633 9,467 88,18920.6% 20.7% 20.1% 20.6% 20.8%
Rank CasesDays Stay
Rank CasesDays Stay
Rank CasesDays Stay
Rank CasesDays Stay
Rank CasesDays Stay
139 Chronic Obstructive Pulmonary Disease 1 311 3,320 1 317 4,252 1 277 3,241 1 275 3,013 1 275 2,770576 Normal Newborn, Singleton Vaginal Delivery 2 201 379 5 165 314 2 209 406 2 237 478 2 222 436202 Arrhythmia without Coronary Angiogram 3 179 960 3 173 952 3 185 842 3 184 1,113 4 156 725687 Stress Reaction/Adjustment Disorder 4 163 906 2 194 981 4 178 850 4 165 852 5 151 706194 Myocardial Infarction/Shock/Arrest without Coronary Angiogram 5 139 1,034 4 166 1,188 5 165 858 9 131 681 7 133 924693 Depressive Episode without ECT 6 138 1,109 8 125 1,112 6 147 1,324 5 156 1,165 3 177 1,398563 Vaginal Birth with Anaesthetic without Non-Major Obstetric/Gynecologic
Intervention 7 125 259 13 89 187 14 82 189 14 84 182 14 86 196249 Non-severe Enteritis 8 124 494 17 67 260 9 134 399 8 132 451 6 145 434806 Convalescence 9 118 541 11 98 450 12 102 446 12 102 441 12 116 524810 Palliative Care 10 117 1,495 6 155 2,923 11 103 1,875 13 96 1,331 13 110 1,465
1,615 10,497 1,549 12,619 1,582 10,430 1,562 9,707 1,571 9,5786,126 54,633 6,300 60,078 6,378 57,874 6,465 55,811 6,508 53,749
26.4% 24.6% 24.8% 24.2% 24.1%
Note 4: Abbreviations: ECT = Electroconvulsive therapy.
2010/11 2009/10
2010/11 2009/10
RRS A Zone 4
2011/122013/14CMG+
RHA Zone
2011/12
CMG+ Description
2013/14
2012/13
2012/13
Total separations for Top 10 CMGs
RRS A Zone 1
Top 10 - % of Total Separations
Total separations for RHA and Zone
Total separations for Top 10 CMGs
RHA Zone
CMG+ CMG+ Description
Note 3: Source data were extracted from the 3M system for 2013/14, with data submitted by hospitals to CIHI through the Discharge Abstract Database. The regrouped data for all fiscal years, except 2013/14, which was extracted from HFUMS was provided by CIHI and based on fiscal 2013 methodology. This affects the comparability with previous years' reports.
Note 2: The fiscal 2007/08 CMG+ grouper methodology has been redeveloped by CIHI and it is now based on ICD10CA diagnosis and CCI intervention activity and cost data. Cases have been grouped into Case Mix Groups (CMGs) using the 2013 CMG+ Grouper for all years. CMGs are ranked in descending order based on 2013/14 separations.
Note 1: Separations are described now by level of care. Previously, separations included patients treated in Acute, Chronic, Rehabilitation and Psychiatric inpatients units in acute care facilities, excluding Psychiatric Hospitals, and Veterans Affairs Canada (VAC) (includes newborns, excludes stillbirths).
Total separations for RHA and Zone
Top 10 - % of Total Separations
May 2015 Section III - Page 28

2013/14 Annual Report of Hospital Services Section III - Clinical statistics, Discharge Abstract Database
Table III - 4(c): Acute Care Separations (Cases) - Top 10 Case Mix Groups (CMG+) by Regional Health Authority - 2009/10 to 2013/14
Rank CasesDays Stay
Rank CasesDays Stay
Rank CasesDays Stay
Rank CasesDays Stay
Rank CasesDays Stay
139 Chronic Obstructive Pulmonary Disease 1 247 2,514 1 252 2,052 1 291 2,634 1 282 2,462 1 250 2,120194 Myocardial Infarction/Shock/Arrest without Coronary Angiogram 2 160 1,009 2 155 1,046 3 127 603 3 123 764 3 106 957196 Heart Failure without Coronary Angiogram 3 110 1,143 6 106 1,341 5 110 1,222 5 109 1,123 6 102 927202 Arrhythmia without Coronary Angiogram 4 108 694 7 99 593 7 99 580 7 106 615 7 98 573249 Non-severe Enteritis 5 105 449 5 112 412 2 133 556 4 122 517 2 121 451811 General Symptom/Sign 6 100 3,278 12 81 2,057 16 76 1,950 13 73 1,592 14 74 1,125806 Convalescence 7 95 419 3 129 783 6 106 929 11 85 1,047 3 106 1,209576 Normal Newborn, Singleton Vaginal Delivery 8 94 154 9 88 149 8 92 159 2 125 228 5 103 205810 Palliative Care 8 94 1,510 4 116 1,706 17 75 1,096 6 107 2,813 7 98 1,597693 Depressive Episode without ECT 10 92 1,412 11 82 1,566 14 77 1,423 16 72 1,467 11 84 1,426
1,205 12,582 1,220 11,705 1,186 11,152 1,204 12,628 1,142 10,590
4,395 39,505 4,508 37,563 4,847 38,106 4,855 38,851 4,656 37,011
27.4% 27.1% 24.5% 24.8% 24.5%
Rank CasesDays Stay
Rank CasesDays Stay
Rank CasesDays Stay
Rank CasesDays Stay
Rank CasesDays Stay
139 Chronic Obstructive Pulmonary Disease 1 371 3,450 1 374 3,256 1 386 3,202 1 353 3,232 1 316 3,473809 Awaiting Placement 2 239 5,756 3 254 6,151 6 197 4,054 13 149 6,601 33 75 4,179194 Myocardial Infarction/Shock/Arrest without Coronary Angiogram 3 238 1,213 6 194 870 9 185 1,077 6 203 1,082 8 175 904138 Viral/Unspecified Pneumonia 4 224 1,816 4 249 2,101 3 252 1,783 4 224 1,759 4 218 1,795810 Palliative Care 5 200 3,135 5 198 3,566 4 212 3,269 8 199 2,280 6 204 2,436576 Normal Newborn, Singleton Vaginal Delivery 6 196 371 2 257 503 2 267 538 2 258 531 2 292 630249 Non-severe Enteritis 7 192 706 7 171 824 7 192 744 5 208 814 12 146 913502 Hysterectomy with Non Malignant Diagnosis 8 181 441 20 101 234 25 93 221 16 112 277 14 142 376202 Arrhythmia without Coronary Angiogram 9 173 843 8 160 1,085 8 187 954 10 189 1,085 9 171 1,080196 Heart Failure without Coronary Angiogram 10 149 1,834 10 155 1,509 13 161 1,887 7 200 2,020 9 171 2,072
2,163 19,565 2,113 20,099 2,132 17,729 2,095 19,681 1,910 17,858
9,087 81,997 9,387 86,169 9,588 72,560 9,534 80,776 9,560 84,472
23.8% 22.5% 22.2% 22.0% 20.0%Top 10 - % of Total Separations
Note 2: The fiscal 2007/08 CMG+ grouper methodology has been redeveloped by CIHI and it is now based on ICD10CA diagnosis and CCI intervention activity and cost data. Cases have been grouped into Case Mix Groups (CMGs) using the 2013 CMG+ Grouper for all years. CMGs are ranked in descending order based on 2013/14 separations.
Note 3: Source data were extracted from the 3M system for 2013/14, with data submitted by hospitals to CIHI through the Discharge Abstract Database. The regrouped data for all fiscal years, except 2013/14, which was extracted from HFUMS was provided by CIHI and based on fiscal 2013 methodology. This affects the comparability with previous years' reports.
2011/12
Total separations for Top 10 CMGs
CMG+ DescriptionCMG+RHA Zone
2012/132013/14
Total separations for RHA and Zone
Note 1: Separations are described now by level of care. Previously, separations included patients treated in Acute, Chronic, Rehabilitation and Psychiatric inpatients units in acute care facilities, excluding Psychiatric Hospitals, and Veterans Affairs Canada (VAC) (includes newborns, excludes stillbirths).
2012/132013/14 2011/12
Total separations for Top 10 CMGs
Total separations for RHA and Zone
RRS A Zone 5
RRS A Zone 6
2010/11 2009/10
2010/11 2009/10
Top 10 - % of Total Separations
RHA Zone
CMG+ CMG+ Description
May 2015 Section III - Page 29

2013/14 Annual Report of Hospital Services Section III - Clinical statistics, Discharge Abstract Database
Table III - 4(d): Acute Care Separations (Cases) - Top 10 Case Mix Groups (CMG+) by Regional Health Authority - 2009/10 to 2013/14
Rank CasesDays Stay
Rank CasesDays Stay
Rank CasesDays Stay
Rank CasesDays Stay
Rank CasesDays Stay
576 Normal Newborn, Singleton Vaginal Delivery 1 653 1,083 1 618 1,039 1 587 1,069 2 514 922 2 499 893208 Angina (except Unstable)/Chest Pain without Coronary Angiogram 2 407 837 2 493 1,106 2 542 1,444 1 745 1,825 1 767 1,590563 Vaginal Birth with Anaesthetic without Non-Major Obstetric/Gynecologic
Intervention 3 341 771 4 339 825 10 272 734 10 235 513 11 242 575139 Chronic Obstructive Pulmonary Disease 4 330 3,084 3 396 3,280 3 344 2,767 4 303 3,652 6 306 3,256565 Vaginal Birth without Anaesthetic without Non-Major Obstetric/Gynecologic
Intervention 5 312 583 6 316 578 9 291 624 6 282 637 5 307 639601 Newborn/Neonate 2500+ grams, Other Minor Problem 6 309 750 9 254 652 5 325 913 3 351 954 3 371 1,079321 Unilateral Knee Replacement 7 282 1,346 5 318 1,562 4 336 1,593 15 211 1,042 16 199 1,050249 Non-severe Enteritis 8 275 989 7 295 1,310 6 315 1,098 9 251 928 11 242 930196 Heart Failure without Coronary Angiogram 9 264 2,470 10 242 2,261 13 231 2,726 13 224 2,539 10 257 2,804202 Arrhythmia without Coronary Angiogram 10 261 1,051 8 291 1,308 7 299 1,499 8 272 1,443 4 317 1,649
3,434 12,964 3,562 13,921 3,542 14,467 3,388 14,455 3,507 14,46515,211 125,689 15,370 122,777 15,522 126,928 15,684 122,319 15,650 131,90722.6% 23.2% 22.8% 21.6% 22.4%
Rank CasesDays Stay
Rank CasesDays Stay
Rank CasesDays Stay
Rank CasesDays Stay
Rank CasesDays Stay
175 Percutaneous Coronary Intervention with MI/Shock/Arrest/Heart Failure 1 976 2,420 1 931 2,373 1 882 2,379 2 879 2,496 2 853 2,504576 Normal Newborn, Singleton Vaginal Delivery 2 710 1,223 2 811 1,466 2 874 1,474 1 1,099 1,913 1 1,065 2,045139 Chronic Obstructive Pulmonary Disease 3 633 7,059 3 595 5,448 3 592 6,791 3 646 6,137 3 631 6,821196 Heart Failure without Coronary Angiogram 4 407 4,956 4 461 5,461 4 430 5,428 6 388 5,116 6 383 4,467138 Viral/Unspecified Pneumonia 5 399 3,834 5 407 2,960 4 430 3,444 7 370 2,523 7 364 2,589562 Vaginal Birth with Anaesthetic and Non-Major Obstetric/Gynecologic
Intervention 6 397 1,163 6 389 1,119 8 373 1,053 5 425 1,227 4 442 1,212601 Newborn/Neonate 2500+ grams, Other Minor Problem 7 353 1,123 9 349 1,088 9 350 1,068 29 159 565 30 142 592321 Unilateral Knee Replacement 8 334 1,241 10 303 1,100 10 327 1,486 12 298 1,577 13 262 1,488565 Vaginal Birth without Anaesthetic without Non-Major Obstetric/Gynecologic
Intervention 9 323 686 7 378 796 6 405 826 8 358 738 9 316 652313 Spinal Vertebrae Intervention 10 305 1,761 13 257 1,306 16 248 1,259 18 221 1,311 15 222 1,489
4,837 25,466 4,881 23,117 4,911 25,208 4,843 23,603 4,680 23,85919,473 181,371 19,673 173,496 20,279 171,999 20,297 188,513 19,489 171,80824.8% 24.8% 24.2% 23.9% 24.0%
Note 4: Abbreviation: MI= Myocardial infarction.
Note 3: Source data were extracted from the 3M system for 2013/14, with data submitted by hospitals to CIHI through the Discharge Abstract Database. The regrouped data for all fiscal years, except 2013/14, which was extracted from HFUMS was provided by CIHI and based on fiscal 2013 methodology. This affects the comparability with previous years' reports.
Total separations for RHA and Zone
Top 10 - % of Total Separations
Note 1: Separations are described now by level of care. Previously, separations included patients treated in Acute, Chronic, Rehabilitation and Psychiatric inpatients units in acute care facilities, excluding Psychiatric Hospitals, and Veterans Affairs Canada (VAC) (includes newborns, excludes stillbirths).
2011/12RHA Zone
Total separations for Top 10 CMGs
Note 2: The fiscal 2007/08 CMG+ grouper methodology has been redeveloped by CIHI and it is now based on ICD10CA diagnosis and CCI intervention activity and cost data. Cases have been grouped into Case Mix Groups (CMGs) using the 2013 CMG+ Grouper for all years. CMGs are ranked in descending order based on 2013/14 separations.
2013/14
RHA B Zone 2
CMG+ Description2012/13 2010/11 2009/10
CMG+
Total separations for RHA and Zone
2010/11 2009/10
Top 10 - % of Total Separations
2011/12
Total separations for Top 10 CMGs
RHA Zone
CMG+ CMG+ Description2012/132013/14
RHA B Zone 1
May 2015 Section III - Page 30

2013/14 Annual Report of Hospital Services Section III - Clinical statistics, Discharge Abstract Database
Table III - 4(e): Acute Care Separations (Cases) - Top 10 Case Mix Groups (CMG+) by Regional Health Authority - 2009/10 to 2013/14
Rank CasesDays Stay
Rank CasesDays Stay
Rank CasesDays Stay
Rank CasesDays Stay
Rank CasesDays Stay
576 Normal Newborn, Singleton Vaginal Delivery 1 830 1,324 1 916 1,522 1 1,127 1,998 1 1,119 1,994 1 1,141 2,067139 Chronic Obstructive Pulmonary Disease 2 630 6,240 2 598 6,119 2 620 5,123 2 678 6,037 2 595 5,012565 Vaginal Birth without Anaesthetic without Non-Major
Obstetric/Gynecologic Intervention 3 458 933 3 497 1,018 3 512 1,056 3 531 1,051 3 582 1,295194 Myocardial Infarction/Shock/Arrest without Coronary Angiogram 4 408 2,534 4 422 2,039 8 368 1,863 4 435 2,559 6 426 2,485601 Newborn/Neonate 2500+ grams, Other Minor Problem 5 397 921 10 298 826 45 93 810 38 114 401 34 130 471321 Unilateral Knee Replacement 9 338 1,568 9 308 1,406 16 265 1,220 11 310 1,415 10 345 1,871562 Vaginal Birth with Anaesthetic and Non-Major Obstetric/Gynecologic
Intervention 7 331 1,063 12 297 814 12 325 851 12 306 947 18 259 792810 Palliative Care 6 317 5,337 17 235 3,927 7 369 8,212 7 387 8,135 8 366 6,414208 Angina (except Unstable)/Chest Pain without Coronary Angiogram 8 310 1,042 5 347 965 5 431 1,346 5 432 1,449 4 505 1,713202 Arrhythmia without Coronary Angiogram 10 293 1,491 8 330 1,620 13 310 1,490 9 334 1,780 13 335 1,552
4,312 22,453 4,248 20,256 4,420 23,969 4,646 25,768 4,684 23,672
17,568 147,060 17,475 146,424 18,256 140,218 18,183 151,052 18,557 139,479
24.5% 24.3% 24.2% 25.6% 25.2%
Rank CasesDays Stay
Rank CasesDays Stay
Rank CasesDays Stay
Rank CasesDays Stay
Rank CasesDays Stay
139 Chronic Obstructive Pulmonary Disease 1 227 2,315 1 222 2,008 1 290 3,625 1 293 2,746 1 261 2,500576 Normal Newborn, Singleton Vaginal Delivery 2 204 412 2 189 403 2 182 400 2 214 493 2 198 458194 Myocardial Infarction/Shock/Arrest without Coronary Angiogram 3 178 769 3 152 947 5 124 576 8 129 576 5 126 627249 Non-severe Enteritis 4 129 537 4 149 637 3 175 694 3 156 676 5 126 467577 Normal Newborn Multiple/Caesarean Delivery 5 128 361 8 115 322 6 119 359 14 89 280 15 93 304810 Palliative Care 6 113 2,950 18 74 2,535 12 100 1,816 7 131 4,685 9 118 2,925806 Convalescence 7 108 1,043 5 128 1,452 9 110 986 5 142 1,383 4 143 1,859138 Viral/Unspecified Pneumonia 8 102 627 12 87 668 8 111 720 12 104 862 14 99 888202 Arrhythmia without Coronary Angiogram 9 101 632 7 121 561 4 128 856 6 141 642 7 125 842257 Symptom/Sign of Digestive System 10 100 385 10 96 309 7 112 369 4 145 417 3 152 885
1,390 10,031 1,333 9,842 1,451 10,401 1,544 12,760 1,441 11,755
5,232 47,990 5,589 44,048 5,769 44,090 5,849 46,166 5,888 43,199
26.6% 23.9% 25.2% 26.4% 24.5%
2009/10
2010/11 2009/10
2011/12
2011/12
2010/11
Note 3: Source data were extracted from the 3M system for 2013/14, with data submitted by hospitals to CIHI through the Discharge Abstract Database. The regrouped data for all fiscal years, except 2013/14, which was extracted from HFUMS was provided by CIHI and based on fiscal 2013 methodology. This affects the comparability with previous years' reports.
RHA B Zone 7
Total separations for RHA and Zone
Note 2: The fiscal 2007/08 CMG+ grouper methodology has been redeveloped by CIHI and it is now based on ICD10CA diagnosis and CCI intervention activity and cost data. Cases have been grouped into Case Mix Groups (CMGs) using the 2013 CMG+ Grouper for all years. CMGs are ranked in descending order based on 2013/14 separations.
Note 1: Separations are described now by level of care. Previously, separations included patients treated in Acute, Chronic, Rehabilitation and Psychiatric inpatients units in acute care facilities, excluding Psychiatric Hospitals, and Veterans Affairs Canada (VAC) (includes newborns, excludes stillbirths).
Top 10 - % of Total Separations
Total separations for Top 10 CMGs
2012/13
2012/132013/14
RHA Zone
CMG+ CMG+ Description2013/14
RHA Zone
Top 10 - % of Total Separations
RHA B Zone 3
CMG+ Description
Total separations for RHA and Zone
CMG+
Total separations for Top 10 CMGs
May 2015 Section III - Page 31

2013/14 Annual Report of Hospital Services Section III - Clinical statistics, Discharge Abstract Database
Table III - 5(a): Day Surgery Separations (Cases) - Top 25 Comprehensive Ambulatory Classification System (CACS) groups in the Province - 2009/10 to 2013/14
Rank Cases Rank Cases Rank Cases Rank Cases Rank CasesC060 Cataract Removal/Lens Insertion 1 7,879 1 7,357 1 7,431 1 7,102 1 7,710C457 Cystoscopy (Bladder Inspection) 2 1,912 2 1,940 3 1,810 2 1,933 2 3,498C466 Dilation/Curettage and Endometrial Ablation 4 1,669 4 1,578 6 1,378 6 1,527 6 1,510C253 Hernia Repair, Open Approach 3 1,602 3 1,813 2 1,832 3 1,909 3 1,792C109 Dental/Peridontal Intervention 5 1,405 5 1,507 4 1,497 4 1,588 7 1,503C302 Other Knee Intervention, excluding cruciate repair 8 1,265 8 1,195 5 1,419 5 1,568 4 1,791C282 Cholecystectomy 6 1,244 6 1,316 8 1,236 7 1,191 8 1,184C303 Other Lower Limb Intervention 10 1,172 10 1,120 13 1,096 13 925 19 617E755 Intervention Not Carried Out 12 1,148 12 1,067 9 1,175 11 1,084 9 1,040C251 Inspection Digestive Tract 7 1,114 7 1,237 7 1,265 8 1,189 10 1,015C456 Other Minor Lower Urinary Tract Intervention 9 1,073 9 1,175 12 1,100 9 1,173 5 1,745C101 Tonsillectomy/Adenoidectomy 11 1,062 11 1,091 10 1,165 10 1,165 11 1,000C455 Lower Urinary Tract Intervention 13 948 13 973 14 948 15 844 14 902C105 Myringotomy with Tubes 14 838 14 950 11 1,147 12 965 12 951C351 Complete and Partial Mastectomy 22 823 16 774 15 871 14 858 13 922C352 Plastic and Other Breast Intervention 17 779 18 712 19 608 18 636 16 664C305 Shoulder Intervention 16 774 15 781 16 839 16 737 15 823C005 Carpal Tunnel Release, Open Approach 18 699 20 653 18 648 17 723 19 617C460 Vasectomy 21 690 21 582 22 555 24 518 23 520C254 Partial Excision Anus, Rectum, Intestine 15 659 17 746 20 592 19 583 22 534C463 Other Male Reproductive Intervention 18 545 19 674 17 651 21 563 18 629C465 Tubal Ligation 23 538 23 494 21 562 20 568 21 574C354 Face and Neck Skin Intervention 20 524 22 568 23 542 22 562 17 648C310 Open Fixation/Fusion without Graft 24 476 25 428 29 388 29 401 34 354C151 Respiratory Biopsy/Endoscopy, excluding Laryngoscopy 25 465 28 388 33 361 27 423 24 489
31,303 31,119 31,116 30,735 33,03244,341 43,496 43,603 42,970 45,82770.6% 71.5% 71.4% 71.5% 72.1%
Note 3: Starting with 2003/04, the day surgeries will only include the cases done in the MIS day surgery functional centre.
Note 1: The 2007/08 DPG grouper had been updated by CIHI to enhance the methodology and align it with CACS (Comprehensive Ambulatory Classification System). Starting with fiscal 2011/12, as part of the redevelopment of the methodology, the Comprehensive Ambulatory Classification System will be the only grouping methodology to support both databases (DAD and NACRS). Note 2: Cases have been grouped into the Comprehensive Ambulatory Classification System (CACSs) using the 2013 CACS Grouper for all years. CACSs are ranked in descending order based on the 2013/14 separations.
Note 4: Source data were extracted from the 3M system for 2013/14, with data submitted by hospitals to CIHI through the Discharge Abstract Database. The regrouped data for all fiscal years, except 2013/14, which was extracted from HFUMS was provided by CIHI and based on fiscal 2013 methodology. This affects the comparability with previous years' reports.
2013/14 2012/13 2011/12 2010/11 2009/10CACS CACS Description
Total Separations for Top 25 CACSs
Total Separations for Province
Top 25 - % of Total Separations
May 2015 Section III - Page 32

2013/14 Annual Report of Hospital Services Section III - Clinical statistics, Discharge Abstract Database
Table III - 5(b): Day Surgery Separations (Cases) - Top 10 Comprehensive Ambulatory Classification System (CACS) groups by Regional Health Authority - 2009/10 to 2013/14
Rank Cases Rank Cases Rank Cases Rank Cases Rank CasesC463 Other Male Reproductive Intervention 1 278 1 352 2 378 2 302 2 317C701 Electroconvulsive Therapy (ECT) 2 262 2 302 1 441 1 395 1 353C303 Other Lower Limb Intervention 3 259 3 198 6 183 3 199 16 77C302 Other Knee Intervention, excluding cruciate repair 4 202 4 195 3 223 4 183 3 272C210 Vascular Access 5 182 7 154 9 145 11 130 11 98C105 Myringotomy with Tubes 6 156 6 169 4 193 8 167 11 98C101 Tonsillectomy/Adenoidectomy 7 154 10 142 7 168 6 181 10 105C213 Percutaneous Transluminal Vascular Intervention (Except Heart) 7 154 7 154 10 141 5 182 7 130C282 Cholecystectomy 9 150 5 173 5 188 9 165 5 170C253 Hernia Repair, Open Approach 10 117 11 134 11 138 10 162 6 153
1,914 1,973 2,198 2,066 1,7734,341 4,406 4,596 4,444 4,113
44.1% 44.8% 47.8% 46.5% 43.1%
Rank Cases Rank Cases Rank Cases Rank Cases Rank CasesC060 Cataract Removal/Lens Insertion 1 714 1 594 1 643 1 570 1 561C457 Cystoscopy (Bladder Inspection) 2 450 2 542 2 502 2 509 2 517C456 Other Minor Lower Urinary Tract Intervention 3 177 3 186 3 172 3 188 3 207C253 Hernia Repair, Open Approach 4 127 4 152 4 120 5 124 4 148C005 Carpal Tunnel Release, Open Approach 5 114 5 116 5 102 4 130 5 105C101 Tonsillectomy/Adenoidectomy 6 100 9 61 8 67 9 51 15 36E755 Intervention Not Carried Out 7 94 11 52 7 72 7 53 6 72C303 Other Lower Limb Intervention 8 87 6 78 12 47 15 39 28 18C282 Cholecystectomy 9 73 7 67 9 64 6 78 9 61C151 Respiratory Biopsy/Endoscopy, excluding Laryngoscopy 10 69 17 41 18 39 10 49 11 39
2,005 1,889 1,828 1,791 1,7643,200 2,974 2,927 2,669 2,744
62.7% 63.5% 62.5% 67.1% 64.3%
Note 2: Cases have been grouped into the Comprehensive Ambulatory Classification System (CACSs) using the 2013 CACS Grouper for all years. CACSs are ranked in descending order based on the 2013/14 separations. Note 3: Starting with 2003/04, the day surgeries will only include the cases done in the MIS day surgery functional centre.
Note 1: The 2007/08 DPG grouper had been updated by CIHI to enhance the methodology and align it with CACS (Comprehensive Ambulatory Classification System). Starting with fiscal 2011/12, as part of the redevelopment of the methodology, the Comprehensive Ambulatory Classification System will be the only grouping methodology to support both databases (DAD and NACRS).
Note 4: Source data were extracted from the 3M system for 2013/14, with data submitted by hospitals to CIHI through the Discharge Abstract Database. The regrouped data for all fiscal years, except 2013/14, which was extracted from HFUMS was provided by CIHI and based on fiscal 2013 methodology. This affects the comparability with previous years' reports.
Top 10 - % of Total Separations
RHA Zone
CACS CACS Description2013/14 2010/11 2009/10
RRS A Zone 1
Total separations for Top 10 CACS
Total separations for RHA and Zone
2012/13 2011/12
2010/11 2009/10
Total separations for RHA and Zone
Top 10 - % of Total Separations
RHA Zone
CACS CACS Description2013/14 2012/13 2011/12
RRS A Zone 4
Total separations for Top 10 CACS
May 2015 Section III - Page 33

2013/14 Annual Report of Hospital Services Section III - Clinical statistics, Discharge Abstract Database
Table III - 5(c): Day Surgery Separations (Cases) - Top 10 Comprehensive Ambulatory Classification System (CACS) groups by Regional Health Authority - 2009/10 to 2013/14
Rank Cases Rank Cases Rank Cases Rank Cases Rank CasesC010 Other Nervous System Intervention 1 323 2 165 3 100 7 74 14 37C060 Cataract Removal/Lens Insertion 2 273 1 277 1 245 1 265 1 248C252 Hernia Repair, Endoscopic Approach 3 88 41 5 59 N/R - - 39 5C109 Dental/Peridontal Intervention 4 85 5 69 6 73 8 70 4 92C453 Destruction Calculi ESWL (Extracorporeal Approach) Upper Urinary Tract 5 79 7 66 5 75 3 91 5 88C282 Cholecystectomy 6 76 4 93 16 36 - - - - C459 Prostate Resection and Biopsy 7 69 9 57 29 12 39 5 44 N/RC253 Hernia Repair, Open Approach 8 54 3 105 2 110 2 136 2 122C354 Face and Neck Skin Intervention 9 52 13 45 15 37 11 40 12 49C310 Open Fixation/Fusion without Graft 10 49 22 22 21 23 21 19 17 27
1,148 904 713 700 6721,957 1,762 1,640 1,629 1,644
58.7% 51.3% 43.5% 43.0% 40.9%
Rank Cases Rank Cases Rank Cases Rank Cases Rank CasesC060 Cataract Removal/Lens Insertion 1 901 1 1,055 1 1,428 1 1,396 1 1,488C466 Dilation/Curettage and Endometrial Ablation 2 227 6 127 10 78 5 139 5 167C455 Lower Urinary Tract Intervention 3 226 3 190 2 276 2 213 3 183C253 Hernia Repair, Open Approach 4 199 2 191 3 216 3 211 2 193C282 Cholecystectomy 5 151 4 170 7 122 6 114 7 122C302 Other Knee Intervention, excluding cruciate repair 6 139 5 129 4 155 4 166 4 169C303 Other Lower Limb Intervention 7 125 8 111 9 115 8 102 9 94C470 Termination of Pregnancy 8 121 7 121 6 125 7 109 8 111E755 Intervention Not Carried Out 9 83 14 56 14 50 12 66 12 65C305 Shoulder Intervention 10 82 10 83 11 76 16 57 13 63
2,254 2,233 2,641 2,573 2,6553,479 3,560 3,985 3,979 4,243
64.8% 62.7% 66.3% 64.7% 62.6%
Note 2: Cases have been grouped into the Comprehensive Ambulatory Classification System (CACSs) using the 2013 CACS Grouper for all years. CACSs are ranked in descending order based on the 2013/14 separations. Note 3: Starting with 2003/04, the day surgeries will only include the cases done in the MIS day surgery functional centre.
Note 5: Abbreviation: ESWL= Extracorporeal Shock Wave Lithotripsy.
Note 1: The 2007/08 DPG grouper had been updated by CIHI to enhance the methodology and align it with CACS (Comprehensive Ambulatory Classification System). Starting with fiscal 2011/12, as part of the redevelopment of the methodology, the Comprehensive Ambulatory Classification System will be the only grouping methodology to support both databases (DAD and NACRS).
Note 4: Source data were extracted from the 3M system for 2013/14, with data submitted by hospitals to CIHI through the Discharge Abstract Database. The regrouped data for all fiscal years, except 2013/14, which was extracted from HFUMS was provided by CIHI and based on fiscal 2013 methodology. This affects the comparability with previous years' reports.
Top 10 - % of Total Separations
RHA Zone
CACS CACS Description2013/14 2010/11 2009/10
RRS A Zone 5
Total separations for Top 10 CACS
Total separations for RHA and Zone
2012/13 2011/12
2010/11 2009/10
Total separations for RHA and Zone
Top 10 - % of Total Separations
RHA Zone
CACS CACS Description2013/14 2012/13 2011/12
RRS A Zone 6
Total separations for Top 10 CACS
May 2015 Section III - Page 34

2013/14 Annual Report of Hospital Services Section III - Clinical statistics, Discharge Abstract Database
Table III - 5(d): Day Surgery Separations (Cases) - Top 10 Comprehensive Ambulatory Classification System (CACS) groups by Regional Health Authority - 2009/10 to 2013/14
Rank Cases Rank Cases Rank Cases Rank Cases Rank CasesC303 Other Lower Limb Intervention 1 371 1 340 1 402 2 262 19 133C352 Plastic and Other Breast Intervention 2 262 2 229 9 176 11 153 15 146C253 Hernia Repair, Open Approach 3 224 3 214 6 225 3 256 6 266C351 Complete and Partial Mastectomy 4 213 6 184 8 182 9 165 12 174E755 Intervention Not Carried Out 5 212 7 181 5 229 7 189 14 154C455 Lower Urinary Tract Intervention 6 190 4 207 11 147 12 149 13 173C101 Tonsillectomy/Adenoidectomy 7 187 5 188 3 235 4 255 11 198C105 Myringotomy with Tubes 8 184 8 172 2 236 5 209 7 264C109 Dental/Peridontal Intervention 9 165 9 162 10 153 8 173 16 136C302 Other Knee Intervention, excluding cruciate repair 10 148 12 145 4 233 1 321 4 420
2,156 2,022 2,218 2,132 2,0644,390 4,191 4,490 4,561 7,809
49.1% 48.2% 49.4% 46.7% 26.4%
Rank Cases Rank Cases Rank Cases Rank Cases Rank CasesC060 Cataract Removal/Lens Insertion 1 2,600 1 2,379 1 2,354 1 2,154 1 1,947C109 Dental/Peridontal Intervention 2 672 2 791 2 651 2 793 2 686C466 Dilation/Curettage and Endometrial Ablation 3 602 3 589 3 504 3 542 3 501C253 Hernia Repair, Open Approach 4 355 4 393 4 434 4 447 4 385C302 Other Knee Intervention, excluding cruciate repair 5 353 7 281 5 358 5 420 5 377C251 Inspection Digestive Tract 6 318 7 281 8 245 9 257 11 219C456 Other Minor Lower Urinary Tract Intervention 7 286 6 290 7 285 8 273 8 277C282 Cholecystectomy 8 265 5 297 6 340 7 300 6 308C305 Shoulder Intervention 9 210 11 226 13 213 11 213 9 238C254 Partial Excision Anus, Rectum, Intestine 10 197 14 181 16 143 15 161 19 138
5,858 5,708 5,527 5,560 5,07610,666 10,719 10,277 10,298 9,95054.9% 53.3% 53.8% 54.0% 51.0%
Note 2: Cases have been grouped into the Comprehensive Ambulatory Classification System (CACSs) using the 2013 CACS Grouper for all years. CACSs are ranked in descending order based on the 2013/14 separations. Note 3: Starting with 2003/04, the day surgeries will only include the cases done in the MIS day surgery functional centre.
Note 1: The 2007/08 DPG grouper had been updated by CIHI to enhance the methodology and align it with CACS (Comprehensive Ambulatory Classification System). Starting with fiscal 2011/12, as part of the redevelopment of the methodology, the Comprehensive Ambulatory Classification System will be the only grouping methodology to support both databases (DAD and NACRS).
Note 4: Source data were extracted from the 3M system for 2013/14, with data submitted by hospitals to CIHI through the Discharge Abstract Database. The regrouped data for all fiscal years, except 2013/14, which was extracted from HFUMS was provided by CIHI and based on fiscal 2013 methodology. This affects the comparability with previous years' reports.
Top 10 - % of Total Separations
RHA Zone
CACS CACS Description2013/14 2010/11 2009/10
RHA B Zone 1
Total separations for Top 10 CACS
Total separations for RHA and Zone
2012/13 2011/12
2010/11 2009/10
Total separations for RHA and Zone
Top 10 - % of Total Separations
RHA Zone
CACS CACS Description2013/14 2012/13 2011/12
RHA B Zone 2
Total separations for Top 10 CACS
May 2015 Section III - Page 35

2013/14 Annual Report of Hospital Services Section III - Clinical statistics, Discharge Abstract Database
Table III - 5(e): Day Surgery Separations (Cases) - Top 10 Comprehensive Ambulatory Classification System (CACS) groups by Regional Health Authority - 2009/10 to 2013/14
Rank Cases Rank Cases Rank Cases Rank Cases Rank CasesC060 Cataract Removal/Lens Insertion 1 2,545 1 2,084 1 1,890 1 1,851 1 1,887C457 Cystoscopy (Bladder Inspection) 2 1,278 2 1,215 2 1,182 2 1,262 2 1,420C251 Inspection Digestive Tract 3 775 3 918 3 998 3 912 3 783C253 Hernia Repair, Open Approach 4 485 4 565 4 545 4 809 4 478C466 Dilation/Curettage and Endometrial Ablation 5 454 7 422 8 378 7 396 6 434C460 Vasectomy 6 429 11 307 11 313 12 292 13 265E755 Intervention Not Carried Out 7 390 8 364 7 381 8 382 8 336C456 Other Minor Lower Urinary Tract Intervention 8 375 6 440 5 417 5 443 5 457C254 Partial Excision Anus, Rectum, Intestine 9 355 5 445 9 343 9 322 10 299C005 Carpal Tunnel Release, Open Approach 10 339 14 269 14 279 14 260 21 174
7,425 7,029 6,726 6,929 6,53313,448 12,886 12,949 12,670 12,62355.2% 54.5% 51.9% 54.7% 51.8%
Rank Cases Rank Cases Rank Cases Rank Cases Rank CasesC060 Cataract Removal/Lens Insertion 1 827 1 939 1 851 1 850 1 787C109 Dental/Peridontal Intervention 2 196 2 191 2 212 2 224 2 232C456 Other Minor Lower Urinary Tract Intervention 3 136 3 146 3 121 3 125 4 106C466 Dilation/Curettage and Endometrial Ablation 4 128 4 114 5 105 4 118 3 116C454 Removal and Destruction Calculi Upper Urinary Tract 5 77 9 61 9 54 14 41 11 51C005 Carpal Tunnel Release, Open Approach 6 71 5 79 6 65 10 43 6 72C282 Cholecystectomy 7 66 6 73 8 57 8 60 5 81C302 Other Knee Intervention, excluding cruciate repair 8 58 9 61 17 37 9 47 13 47C459 Prostate Resection and Biopsy 8 58 8 62 4 110 5 95 8 64C465 Tubal Ligation 10 57 14 44 12 53 12 42 9 61
1,674 1,770 1,665 1,645 1,6172,860 2,998 2,739 2,720 2,700
58.5% 59.0% 60.8% 60.5% 59.9%
Note 2: Cases have been grouped into the Comprehensive Ambulatory Classification System (CACSs) using the 2013 CACS Grouper for all years. CACSs are ranked in descending order based on the 2013/14 separations. Note 3: Starting with 2003/04, the day surgeries will only include the cases done in the MIS day surgery functional centre.
Note 1: The 2007/08 DPG grouper had been updated by CIHI to enhance the methodology and align it with CACS (Comprehensive Ambulatory Classification System). Starting with fiscal 2011/12, as part of the redevelopment of the methodology, the Comprehensive Ambulatory Classification System will be the only grouping methodology to support both databases (DAD and NACRS).
Note 4: Source data were extracted from the 3M system for 2013/14, with data submitted by hospitals to CIHI through the Discharge Abstract Database. The regrouped data for all fiscal years, except 2013/14, which was extracted from HFUMS was provided by CIHI and based on fiscal 2013 methodology. This affects the comparability with previous years' reports.
Top 10 - % of Total Separations
RHA Zone
CACS CACS Description2013/14 2010/11 2009/10
RHA B Zone 3
Total separations for Top 10 CACS
Total separations for RHA and Zone
2012/13 2011/12
2010/11 2009/10
Total separations for RHA and Zone
Top 10 - % of Total Separations
RHA Zone
CACS CACS Description2013/14 2012/13 2011/12
RHA B Zone 7
Total separations for Top 10 CACS
May 2015 Section III - Page 36

2013/14 Annual Report of Hospital Services Section III - Clinical statistics, Discharge Abstract Database
Table III - 6: Acute Care Separations with Alternate Level of Care (ALC) Days by Regional Health Authority - 2009/10 to 2013/14
a) Separations with ALC days
RHA 2009/10 2010/11 2011/12 2012/13 2013/14 2009/10 2010/11 2011/12 2012/13 2013/14RRS A Zone 1 295 397 355 485 504 -11.7% 34.6% -10.6% 36.6% 3.9%RRS A Zone 4 359 428 439 406 386 -13.9% 19.2% 2.6% -7.5% -4.9%RRS A Zone 5 246 258 307 247 266 -12.5% 4.9% 19.0% -19.5% 7.7%RRS A Zone 6 952 1,127 1,286 1,376 1,447 21.3% 18.4% 14.1% 7.0% 5.2%
RRS A 1,852 2,210 2,387 2,514 2,603 1.9% 19.3% 8.0% 5.3% 3.5%RHA B Zone 1 301 265 265 268 351 -8.8% -12.0% 0.0% 1.1% 31.0%RHA B Zone 2 869 965 876 907 880 -2.8% 11.0% -9.2% 3.5% -3.0%RHA B Zone 3 632 640 558 529 431 -10.1% 1.3% -12.8% -5.2% -18.5%RHA B Zone 7 166 208 226 199 246 -12.6% 25.3% 8.7% -11.9% 23.6%
RHA B 1,968 2,078 1,925 1,903 1,908 -7.0% 5.6% -7.4% -1.1% 0.3%
Total 3,820 4,288 4,312 4,417 4,511 -2.9% 12.3% 0.6% 2.4% 2.1%
b) ALC Days
RHA 2009/10 2010/11 2011/12 2012/13 2013/14 2009/10 2010/11 2011/12 2012/13 2013/14 RHA 2009/10 2010/11 2011/12 2012/13 2013/14RRS A Zone 1 18,687 19,183 18,597 20,255 18,649 20.4% 2.7% -3.1% 8.9% -7.9% RRS A Zone 1 21.2% 21.2% 20.7% 21.6% 20.3%
RRS A Zone 4 8,097 14,015 13,841 15,672 13,063 -15.9% 73.1% -1.2% 13.2% -16.6% RRS A Zone 4 15.1% 25.1% 23.9% 26.1% 23.9%
RRS A Zone 5 7,348 6,939 7,358 7,912 11,617 92.6% -5.6% 6.0% 7.5% 46.8% RRS A Zone 5 20.2% 17.9% 19.3% 21.1% 29.4%
RRS A Zone 6 23,462 23,271 18,657 31,602 29,236 39.6% -0.8% -19.8% 69.4% -7.5% RRS A Zone 6 28.0% 28.8% 25.7% 36.7% 35.7%
RRS A 57,594 63,408 58,453 75,441 72,565 25.8% 10.1% -7.8% 29.1% -3.8% RRS A 22.0% 23.8% 22.6% 27.2% 27.1%
RHA B Zone 1 24,993 16,009 23,080 19,914 23,290 35.4% -35.9% 44.2% -13.7% 17.0% RHA B Zone 1 18.9% 13.1% 18.2% 16.2% 18.5%
RHA B Zone 2 38,926 51,394 35,448 42,186 50,339 34.3% 32.0% -31.0% 19.0% 19.3% RHA B Zone 2 22.7% 27.3% 20.6% 24.3% 27.8%
RHA B Zone 3 22,323 30,032 23,193 27,706 25,945 -12.1% 34.5% -22.8% 19.5% -6.4% RHA B Zone 3 16.0% 19.9% 16.5% 18.9% 17.6%
RHA B Zone 7 11,012 13,764 11,608 10,591 15,066 9.6% 25.0% -15.7% -8.8% 42.3% RHA B Zone 7 25.5% 29.8% 26.3% 24.0% 31.4%
RHA B 97,254 111,199 93,329 100,397 114,640 17.4% 14.3% -16.1% 7.6% 14.2% RHA B 20.0% 21.9% 19.3% 20.6% 22.8%
Total 154,848 174,607 151,782 175,838 187,205 20.4% 12.8% -13.1% 15.8% 6.5% Total 20.7% 22.6% 20.5% 23.0% 24.3%
c) Average Age of Patient with ALC Days d) Median Age of Patient with ALC Days
RHA 2009/10 2010/11 2011/12 2012/13 2013/14 2009/10 2010/11 2011/12 2012/13 2013/14RRS A Zone 1 71 75 76 69 71 79 79 78 78 78
RRS A Zone 4 78 77 76 78 78 82 80 81 77 79
RRS A Zone 5 75 78 78 75 75 79 82 81 81 81
RRS A Zone 6 73 73 71 72 73 80 80 81 80 80
RRS A 73 75 74 73 73 78 77 75 76 76
RHA B Zone 1 78 79 79 80 78 81 81 81 80 81
RHA B Zone 2 77 77 77 75 77 83 84 84 83 82
RHA B Zone 3 76 75 74 75 76 80 81 81 80 81
RHA B Zone 7 75 78 75 74 75 81 81 81 79 81
RHA B 77 77 76 76 77 82 82 80 81 79
Total 75 76 75 74 75 80 80 80 79 79
Note 2: A nursing home opened in fiscal 2009/10 in both health region 1 (February 2010) and health region 2 (March 2010).
Note 4: Excludes the patients with ALC days who are currently in the hospital and have not yet been discharged.Note 5: Excludes the total days stay for the patients discharged with ALC days.
Note 3: A nursing home opened in fiscal 2010/11 in health region 3 (June 2010).
Average Age
Separations (Cases) Year to Year % Change
ALC Days Year to Year % Change
Median Age
Note 1: When a patient is occupying an acute care bed in a facility and does not require the intensity of resources/services provided, the patient must be designated Alternate Level of Care (ALC) at that time by a physician or her/his delegate.
ALC Days as a % of the Total Days Stay
May 2015 Section III - Page 37


Section IV
Expenses and Statistics By Functional Centre


2013/2014 Annual Report of Hospital Services
Section IV: Summary of Expenses and Statistics by Functional Centre These reports present financial and statistical data at the functional centre, or departmental level. Section IV includes information related to workload and a number of indicators calculated for each functional centre. These indicators include the number of personnel worked hours per patient day, per case or per visit as well as workload units per worked hour. Note that workload units are measured in minutes. This is an indicator of labour productivity; a ratio of 50 for example indicates that 50 workload units (or standard minutes) worth of service were delivered in a worked hour (or in 60 minutes). This would be interpreted as a productivity of 83%. A number of other factors (besides labour productivity) drive the indicator values including the quality of the workload measurement system used to produce the workload data. Service recipient activities are unit-producing personnel activities that involve the delivery of services to or on behalf of a specific service recipient. These activities directly contribute to the fulfillment of the primary service mandate of the functional centre. Examples include assessment; therapeutic interventions or consultation/collaboration. Non-service recipient activities are unit-producing personnel activities that are integral to the functional centre's operations, but do not involve the delivery of services to service recipients and/or their significant others. Examples may include attendance at mandatory education/in-service programs; research; participation in meetings or activities to maintain the functioning of the department. Expenses reported in Section IV exclude Admin Allocation, Medical Compensation and Interdepartmental Expenses. The cost per unit of service calculated for some patient care functional centres should not be used to evaluate the relative performance or efficiency of the RHAs. Indicators are shown to provide general information on the functional centre activities within each RHA. In 2004/05, an internal allocation formula of the full costs of Nursing Administration (Nursing Inpatient Administration, Clinical Resources, and Clinic Administration), Medical Resources and Diagnostic & Therapeutic Administration (Diagnostic Imaging, Clinical Lab, Rehab Services) was applied to the consuming functional centres based on % of total expenses represented by the consuming functional centres. In 2007/08, this allocation was removed to facilitate calculation of indicators using direct expenses only. As of 2001/02, RHAs began applying consistent definitions in the assignment of compensation data to broad occupation groups. There are three such groups: Unit Producing Personnel (UPP), Management & Operational Support (MOS), and Medical Staff (MED). See the Glossary for definitions of the broad occupation groups. In all indicators in this section that use worked hours (e.g., workload units per worked hour) only UPP worked hours are used since MOS and Medical hours do not have corresponding workload units for comparison. The following are the general categories of functional centre activity provided in Section IV: Table IV-1(a) – IV-1(d): Nursing Inpatient Expenses, Worked and Benefit Hours, Statistics, Workload Units and Indicators by Functional Centre These tables provide more information on the relationship between nursing labour resources (measured through UPP worked hours), nursing workload units and nursing patient activity (measured through patient days).
May 2015 Section IV - Page 1

2013/2014 Annual Report of Hospital Services
Total costs include not just nurses’ compensation but all costs incurred by the nursing functional centres including clerical and management staff, drugs, medical and surgical supplies, and so on. The inpatient cost per day in more resource intensive functional centres like the Intensive Care Unit is obviously much higher than in a regular medical or surgical unit. Extended Care units, on the other hand, are less resource intensive and have a lower cost per day than the average acute care unit. The UPP Hours per Patient Day is an indicator that is driven by both the demand for nursing services as determined by the acuity of the case load and by the staffing patterns and productivity of the nursing staff. Service recipient workload units per patient day are a measure to assist in determining resources to meet the demand for care, whereas workload units per worked hour is a measure of the staff productivity while engaged in meeting the mandate of the functional centre. Variations across functional centres are reflective of the care requirements for the defined patient populations. Note that RHAs with smaller hospitals are often disadvantaged from an efficiency perspective due to diseconomies of scale. Table IV-2(a) – IV 2(c): Operating Room/Recovery Room/Day Surgery Expenses, Hours, Statistics and Indicators These tables provide similar information as IV-1 above for the Operating Room (OR). Note that OR activity is not measured by patient days but by surgical cases/visits. Surgical cases/visits may be for inpatients or day patients. Other outpatient cases refer to non-surgical cases that may be conducted in one of the surgical functional centres (e.g. ECT, Angio). Cost per surgical case applies the costs of the Operating Room/Recovery Room/Day Surgery to the total number of surgical and non-surgical cases conducted. The volumes reported through MIS may vary from those abstracted within the DAD as there is a difference in how the two databases apply the definition. MIS information is intended to be used to measure staff utilization/productivity. Note: The wide variation in workload indicators is reflective of the level of implementation of workload measurement in the functional centres, therefore should not be used for comparative purposes. Table IV-3: Ambulatory Care Service Activity by RHA This table trends the number of visits to the Emergency Room, Day/Night Care and Clinics as well as outpatient visits to inpatient nursing unit. A decrease was noted in ER visits (3.4%). It must also be recognized that RHAs may not all use consistent definitions for reporting of ambulatory visits in prior years. The MIS Coordinator Committee continues to work on eliminating these inconsistencies. Table IV-4(a) – IV-4(d): Emergency Room/Day Night Care/Clinics Expenses, Hours, Statistics and Indicators These tables provide similar information as IV-3 above for the Ambulatory Care services (include Emergency Room and Day/Night Care and Clinics) in greater detail. Other visits in ER include scheduled visits that occur in the absence of a formal clinic structure therefore services are offered out of the ER. Emergency visits are now reported by triage level 1 to 5. Note that ambulatory care activity is measured by patient visits. “Patient Days in the ER” is a statistics that is included because it indicates the degree to which the RHA’s ER provided care to admitted patients who could not be transferred immediately to an inpatient bed. Because the costs associated with these inpatient days cannot be easily identified, the cost per visit would be higher for an ER with more patient days. Tables IV-5(a) – IV-5(d) Clinical Laboratory Expenses, Worked and Benefit Hours, Workload Units by Service Type and by Service Recipient, and Indicators These tables provide statistics and indicators for Clinical Laboratory. Table IV-5(a) provides the breakdown of workload units by Laboratory functional centre. The workload units give an indication of the labour resources consumed in providing the various laboratory services. For example, the table can be interpreted as indicating that provincially, 24.0% of clinical laboratory resources were spent in Clinical Chemistry (Table IV-
May 2015 Section IV - Page 2

2013/2014 Annual Report of Hospital Services
5(d)). Table IV-5(b) provides information on the breakdown of workload by recipients of laboratory services (inpatients, outpatients, quality control, etc.). Table IV-5(c) provides the indicators including cost per workload unit and workload units per worked hour for the various laboratory functional centres. Note: In 2009/10, the functional centre groupings for Clinical Laboratory were adjusted based on new national MIS Standards. This will impact comparisons to previous years for some functional centres. Workload units reported should not be compared to other jurisdictions as NB still uses pre-2009 CIHI Standards Tables IV-6(a) – IV-6(c) Diagnostic Imaging Expenses, Worked and Benefit Hours, Workload Units by Service Type, Exams/Procedures and Indicators These tables provide very similar information as IV-5 above but for Diagnostic Imaging. Inpatient workload is responsible for only 16.2% of the workload in Diagnostic Imaging [(Table IV-6(b)]. Note that the workload units per exam indicator presented in Table IV-6(c) is a measure of the average labour resource intensity of the exams taken at each RHA. In 2007/08, these tables were revised to separate the services provided by Radiography, Mammography and Interventional/Angiography. Comparison to previous annual reports is not recommended because of this change. Tables IV-7(a) – IV- 7(c) Electrodiagnostic, Non Invasive Cardiology and Vascular Lab Expenses, Worked and Benefit Hours, Workload Units by Service Recipient and Indicators These tables provide similar information as IV-6 above but for Electrodiagnostic, Non Invasive Cardiology, Echocardiology and Vascular Lab. Reporting of workload became a requirement for 2005/06. Patient activity is measured by exams. In 2007/08, these tables were revised to separate Echocardiology from Non-Invasive Cardiology. Table IV-7(b) provides the breakdown of workload units by service and non service recipient for the functional centres. Table IV-7(c) provides indicators of costs and resource per unit of activity for the disciplines presented in IV-7(a). Comparison across RHAs is not recommended because of differences in practice patterns and standards. Tables IV-8(a) – IV- 8(e) Other Diagnostic and Therapeutic Expenses, Worked and Benefit Hours, Workload Units by Service Recipient and Indicators These tables provide similar information as IV-7 above but for Other Diagnostic and Therapeutic Services. Reporting of therapeutic workload became a requirement for 2004/05. Patient activity for therapeutic services is measured by attendances and telephone contacts. An attendance day is counted for each day of care provided to a patient regardless of the number of interventions provided in that day. If an outpatient visits physiotherapy 20 times during the year (on 20 different days) then 20 attendance days are recorded. The therapeutic disciplines continue work to enhance the quality of reported data. Expenses excludes admin allocation, medical compensation and interdepartmental. Standby hours are excluded. Expenses and workload units associated with Addiction Services, Community Health Centres, Health Service Centres and the Extra-Mural Program are excluded from this data. RHA B Zone 3 includes data for Stan Cassidy Centre for Rehabilitation (provincial tertiary rehabilitation centre). Speech Language Pathology excludes the Early Language Services Program.
May 2015 Section IV - Page 3

2013/2014 Annual Report of Hospital Services
Fiscal year 2009/10, Radiation Oncology was added to the tables in this section. The discipline is currently in the process of auditing the data to validate the workload measurement results. It must be noted that treatment fractionations and techniques vary across the two centres which contributes to differences in the indicator results. Reporting in RHA B Zone 2 includes the FTEs for three administrative staff and two RNs. Refer to Glossary for additional definitions. Table IV-8(b) provides the breakdown of workload units by service recipient for many of the other diagnostic and therapeutic functional centres (besides Laboratory and Imaging). Non service recipient workload includes activities that contribute to the development of patient care standards and clinical best practices (e.g. research, professional practice committee participation, education/training, quality improvement initiatives). Table IV-8(c) provides indicators of costs and resource per unit of activity for the disciplines presented in IV-8(a). Comparison across RHAs is not recommended because of differences in practice patterns and standards. Table IV-8(d) describes the percentage relationship between inpatient and outpatient workload. Table IV-8(e) provides a summary of the service recipient productivity (Service Recipient workload hours divided by UPP worked hours x 100) compared to total productivity (Total workload hours divided by UPP worked hours x 100). Tables IV-9(a) – IV-9(e): Extra-Mural Expenses, Worked and Benefit Hours, Workload Units by Discipline and Indicators These tables provide a breakdown of costs, service activity statistics and workload by RHA and by service provider discipline. Indicators include measures of cost and workload per attendance day, worked hours and by workload unit. Similarly to other disciplines the indicators are measures of resource productivity and staff outputs, and cost of service provision. Costs per worked hours can be influenced by travel associated with provision of care. Table IV-10(a) and (b): Laundry and Patient Food Services Indicators These tables provide cost per unit of activity indicators for two support functional centres, Laundry and Patient Food Services. The two are selected simply because there are reliable statistics for measuring their activity: Kilograms of laundry cleaned for Laundry Services and patient Meal Days for Patient Food Services. In fiscal year 2007/08, Table IV-10(b) was revised to include non-service recipient Meal Days. This revision provides a better reflection of the actual activity that occurs within the Patient Food Services functional centre. Non-service recipient Meal Days may include meals provided to patients outside the organization. In fiscal year 2012/13, Laundry Services were transitioned to FacilicorpNB. Reporting standards/processes are currently being refined and validated. A patient meal day consists of a patient’s food consumption which is equivalent to three meals and supplemental nourishment for a day. Costs may be impacted by methods associated with meal preparation and distribution. It is advisable not to draw comparative conclusions based on the cost per patient meal day by RHA alone as there are many variables that influence the variations in cost (e.g. number of patients per facility and the number of facilities within the RHA; processes around delivery of service.) Notes are included below each table to explain inclusions, exclusions and any unique circumstances within RHAs that result in significant differences in the data.
May 2015 Section IV - Page 4

2013/2014 Annual Report of Hospital Services Section IV - Functional Centre Report
Table IV-1(a): Nursing Inpatient Total Expenses, Worked Hours, Benefit Hours and Patient Days by Functional Centre - 2013/2014 - Page 1 of 2Region
Expenses UPP - Worked Hours
Benefit Hours Patient Days
Inpatient Medical
Expenses UPP - Worked Hours
Benefit Hours Patient Days
Inpatient Surgical
Expenses UPP - Worked Hours
Benefit Hours Patient Days
Combined Medical/Surgical
RRS A Zone 1 15,956,303 265,933 56,889 47,437 7,767,851 133,096 27,465 21,272 0 0 0 0 RRS A Zone 4 5,347,258 107,931 27,492 17,956 3,456,343 61,688 15,842 7,979 3,026,101 63,158 17,062 10,304 RRS A Zone 5 4,711,251 102,350 19,865 16,156 0 0 0 0 3,003,329 57,104 12,607 7,092 RRS A Zone 6 16,939,778 325,406 69,013 47,758 3,424,869 58,582 12,693 7,937 0 0 0 0
RHA B Zone 1 21,479,535 362,841 71,773 62,272 8,736,551 145,972 29,961 23,475 2,864,707 49,066 9,335 7,353 RHA B Zone 2 23,746,432 480,601 98,984 81,856 21,077,299 373,235 79,666 50,931 2,646,128 51,071 11,024 8,815 RHA B Zone 3 16,629,238 324,470 65,906 54,398 8,592,164 153,518 32,569 24,309 10,021,617 182,370 41,115 29,829 RHA B Zone 7 5,991,656 121,988 23,282 21,526 3,519,000 63,886 12,137 10,377 0 0 0 0
42,954,589 14,649,063 6,029,430 801,620 253,366 120,262 173,258 56,000 29,668 129,307 37,188 17,396 RRS A
67,846,861 41,925,015 15,532,452 1,289,899 736,612 282,507 259,944 154,333 61,474 220,052 109,092 45,997 RHA B
Total 110,801,451 56,574,077 21,561,883 2,091,519 989,978 402,769 433,203 210,333 91,142 349,359 146,280 63,393
Region
Expenses UPP - Worked Hours
Benefit Hours Patient Days
Psychiatry
Expenses UPP - Worked Hours
Benefit Hours Patient Days
Inpatient Rehabilitation Unit
Expenses UPP - Worked Hours
Benefit Hours Patient Days
Palliative Care
RRS A Zone 1 2,380,288 37,473 7,945 6,698 2,432,011 50,175 9,145 9,383 1,069,273 18,224 3,322 2,051 RRS A Zone 4 1,752,249 29,180 7,479 3,754 0 0 0 0 0 0 0 0 RRS A Zone 5 15,480,811 360,227 65,275 55,656 0 0 0 0 1,071,626 19,764 4,444 1,884 RRS A Zone 6 2,326,282 36,556 7,836 8,814 0 0 0 0 717,693 13,007 2,580 3,370
RHA B Zone 1 3,302,921 63,266 11,140 8,110 1,597,016 31,398 6,261 5,104 0 0 0 0 RHA B Zone 2 6,269,173 123,626 25,667 21,988 1,909,841 30,954 6,353 6,452 1,344,775 21,071 4,414 2,700 RHA B Zone 3 2,408,380 40,226 9,722 6,937 5,244,331 101,286 21,178 15,033 0 0 0 0 RHA B Zone 7 1,426,343 22,695 5,250 3,060 1,961,224 41,222 8,928 7,849 0 0 0 0
RRS A 21,939,630 463,436 88,534 74,922 2,432,011 50,175 9,145 9,383 2,858,593 50,995 10,347 7,305
RHA B 13,406,817 249,813 51,780 40,095 10,712,412 204,859 42,720 34,438 1,344,775 21,071 4,414 2,700
Total 35,346,448 713,249 140,314 115,017 13,144,423 255,034 51,865 43,821 4,203,367 72,066 14,761 10,005
Note 1: Psychiatry includes nursing units in the regional hospitals and the psychiatric facilities (Restigouche and Centracare). Note 2: Hours may relate to outpatient activities for which there are no patient days. Therefore RHAs with higher outpatient activity in their inpatient units may appear to have higher Hours per Day ratio. Note 3: In RHA B Zone 7 Intensive Care includes telemetry monitoring. Note 4: Expenses excludes administration allocation, medical compensation and interdepartmental.
May 2015 Section IV - Page 5

2013/2014 Annual Report of Hospital Services Section IV - Functional Centre Report
Table IV-1(a): Nursing Inpatient Total Expenses, Worked Hours, Benefit Hours and Patient Days by Functional Centre - 2013/2014 - Page 2 of 2Region
Expenses UPP - Worked Hours
Benefit Hours Patient Days
Intensive Care
Expenses UPP - Worked Hours
Benefit Hours Patient Days
Obstetrics
Expenses UPP - Worked Hours
Benefit Hours Patient Days
Pediatrics
RRS A Zone 1 5,002,282 70,141 16,433 4,271 3,751,479 55,012 13,782 5,524 1,670,331 25,392 6,024 3,447 RRS A Zone 4 3,138,743 43,704 11,310 2,456 3,480,422 55,507 14,438 6,067 2,413,198 43,273 10,416 4,445 RRS A Zone 5 1,888,439 28,238 6,183 1,434 2,652,554 48,724 9,546 5,371 0 0 0 0 RRS A Zone 6 3,617,585 43,243 11,041 2,033 4,265,785 65,595 17,865 5,639 1,609,699 26,583 5,695 3,216
RHA B Zone 1 11,722,293 159,167 41,914 8,948 5,283,217 81,916 20,140 8,986 2,443,578 39,464 8,675 3,787 RHA B Zone 2 15,568,302 240,370 49,777 14,187 5,693,878 90,147 22,563 9,376 1,754,582 23,955 8,607 2,517 RHA B Zone 3 10,396,088 145,982 36,336 9,814 7,001,647 110,578 23,101 10,556 2,421,650 42,539 8,293 4,404 RHA B Zone 7 2,821,151 37,882 7,587 2,231 2,713,551 37,322 10,733 4,802 1,349,600 19,381 5,822 2,709
13,647,049 14,150,240 5,693,228 185,326 224,838 95,247 44,967 55,631 22,135 10,194 22,601 11,108 RRS A
40,507,834 20,692,292 7,969,410 583,401 319,963 125,340 135,614 76,536 31,397 35,180 33,720 13,417 RHA B
Total 54,154,883 34,842,533 13,662,638 768,727 544,801 220,587 180,582 132,167 53,532 45,374 56,321 24,525
Region
Expenses UPP - Worked Hours
Benefit Hours Patient Days
Extended Care
Expenses UPP - Worked Hours
Benefit Hours Patient Days
Total
RRS A Zone 1 4,532,326 94,299 17,308 23,152 44,562,145 749,745 158,313 123,235 RRS A Zone 4 3,077,164 69,201 16,214 11,923 25,691,476 473,643 120,252 64,884 RRS A Zone 5 4,440,497 84,691 19,207 16,203 33,248,508 701,097 137,127 103,796 RRS A Zone 6 3,328,428 73,816 16,504 16,021 36,230,119 642,789 143,227 94,788
RHA B Zone 1 3,210,274 62,766 13,067 13,008 60,640,091 995,856 212,266 141,043 RHA B Zone 2 13,904,083 290,624 62,739 69,874 93,914,493 1,725,654 369,794 268,696 RHA B Zone 3 4,462,008 94,290 18,492 22,688 67,177,124 1,195,259 256,712 177,968 RHA B Zone 7 0 0 0 0 19,782,526 344,376 73,738 52,554
RRS A 15,378,414 322,007 69,233 67,299 139,732,248 2,567,274 558,920 386,703
RHA B 21,576,365 447,680 94,298 105,570 241,514,233 4,261,145 912,510 640,261
Total 36,954,780 769,687 163,531 172,869 381,246,481 6,828,418 1,471,430 1,026,964
Note 1: Psychiatry includes nursing units in the regional hospitals and the psychiatric facilities (Restigouche and Centracare). Note 2: Hours may relate to outpatient activities for which there are no patient days. Therefore RHAs with higher outpatient activity in their inpatient units may appear to have higher Hours per Day ratio. Note 3: In RHA B Zone 7 Intensive Care includes telemetry monitoring. Note 4: Expenses excludes administration allocation, medical compensation and interdepartmental.
May 2015 Section IV - Page 6

2013/2014 Annual Report of Hospital Services Section IV - Functional Centre Report
Table IV-1(b): Nursing Inpatient Workload Units by Functional Centre - 2013/2014 - Page 1 of 2
Region
Service Recipient Workload Units
Non Service Recipient
Workload Units
Total Workload Units
Inpatient Medical
Service Recipient Workload Units
Non Service Recipient
Workload Units
Total Workload Units
Inpatient Surgical
Service Recipient Workload Units
Non Service Recipient
Workload Units
Total Workload Units
Combined Medical/Surgical
RRS A Zone 1 10,917,430 1,761,365 12,678,795 5,725,056 1,041,710 6,766,766 0 0 0 RRS A Zone 4 5,002,460 774,050 5,776,510 2,262,685 383,982 2,646,667 2,279,127 450,559 2,729,686 RRS A Zone 5 3,488,011 334,213 3,822,224 0 0 0 1,624,935 143,485 1,768,420 RRS A Zone 6 14,365,633 2,411,862 16,777,495 2,122,286 561,058 2,683,344 0 0 0
RHA B Zone 1 16,497,178 2,137,444 18,634,622 6,661,060 590,862 7,251,922 2,441,760 163,766 2,605,526 RHA B Zone 2 22,489,233 3,129,124 25,618,357 19,262,509 1,787,794 21,050,303 2,732,062 342,461 3,074,523 RHA B Zone 3 15,276,904 1,243,361 16,520,265 7,442,288 547,061 7,989,349 8,557,760 785,644 9,343,404 RHA B Zone 7 5,564,044 713,156 6,277,200 3,166,691 310,230 3,476,921 0 0 0
5,281,490 1,986,750 594,044 33,773,534 10,110,027 3,904,062 39,055,024 12,096,777 4,498,106 RRS A
7,223,085 3,235,947 1,291,871 59,827,359 36,532,548 13,731,582 67,050,444 39,768,495 15,023,453 RHA B
Total 12,504,575 5,222,697 1,885,915 93,600,893 46,642,575 17,635,644 106,105,468 51,865,272 19,521,559
Region
Service Recipient Workload Units
Non Service Recipient
Workload Units
Total Workload Units
Psychiatry
Service Recipient Workload Units
Non Service Recipient
Workload Units
Total Workload Units
Inpatient Rehabilitation Unit
Service Recipient Workload Units
Non Service Recipient
Workload Units
Total Workload Units
Palliative Care
RRS A Zone 1 1,130,790 173,267 1,304,057 2,037,718 349,132 2,386,850 702,607 164,894 867,501 RRS A Zone 4 860,960 264,603 1,125,563 0 0 0 0 0 0 RRS A Zone 5 0 0 0 0 0 0 535,895 70,635 606,530 RRS A Zone 6 1,859,756 235,589 2,095,345 0 0 0 1,399,551 180,775 1,580,326
RHA B Zone 1 2,088,932 288,972 2,377,904 1,517,518 100,432 1,617,950 0 0 0 RHA B Zone 2 8,159,530 753,005 8,912,535 1,619,968 247,154 1,867,122 997,387 250,535 1,247,922 RHA B Zone 3 1,809,989 403,024 2,213,013 4,463,195 432,056 4,895,251 0 0 0 RHA B Zone 7 860,690 155,456 1,016,146 1,955,900 273,133 2,229,033 0 0 0
RRS A 3,851,506 673,459 4,524,965 2,037,718 349,132 2,386,850 2,638,053 416,304 3,054,357
RHA B 12,919,141 1,600,457 14,519,598 9,556,581 1,052,775 10,609,356 997,387 250,535 1,247,922
Total 16,770,647 2,273,916 19,044,563 11,594,299 1,401,907 12,996,206 3,635,440 666,839 4,302,279
Note 1: One workload unit is equivalent to one minute of time. Note 2: In RHA B Zone 7 Intensive Care includes telemetry monitoring. Note 3: In RRS A Zone 5, Centre Hospitalier Restigouche and regional psychiatric unit do not collect workload units. This impacts their total indicator results where workload units are part of the calculations. Note 4: Expenses excludes admin allocation, medical compensation and interdepartmental.
May 2015 Section IV - Page 7

2013/2014 Annual Report of Hospital Services Section IV - Functional Centre Report
Table IV-1(b): Nursing Inpatient Workload Units by Functional Centre - 2013/2014 - Page 2 of 2
Region
Service Recipient Workload Units
Non Service Recipient
Workload Units
Total Workload Units
Intensive Care
Service Recipient Workload Units
Non Service Recipient
Workload Units
Total Workload Units
Obstetrics
Service Recipient Workload Units
Non Service Recipient
Workload Units
Total Workload Units
Pediatrics
RRS A Zone 1 2,586,918 251,681 2,838,599 1,650,824 403,419 2,054,243 846,428 222,505 1,068,933 RRS A Zone 4 1,958,282 298,439 2,256,721 1,807,291 381,631 2,188,922 1,600,664 350,164 1,950,828 RRS A Zone 5 860,293 113,950 974,243 1,286,938 185,917 1,472,855 0 0 0 RRS A Zone 6 1,636,540 296,973 1,933,513 1,590,500 402,866 1,993,366 529,070 267,885 796,955
RHA B Zone 1 7,976,450 561,164 8,537,614 3,376,836 615,430 3,992,266 1,318,567 245,222 1,563,789 RHA B Zone 2 11,776,273 1,908,819 13,685,092 3,465,886 576,547 4,042,433 895,619 204,162 1,099,781 RHA B Zone 3 5,767,353 949,009 6,716,362 4,545,296 734,400 5,279,696 1,531,117 212,959 1,744,076 RHA B Zone 7 1,788,543 258,727 2,047,270 1,653,575 333,871 1,987,446 814,489 184,238 998,727
961,043 1,373,833 840,554 7,042,033 6,335,553 2,976,162 8,003,076 7,709,386 3,816,716 RRS A
3,677,719 2,260,248 846,581 27,308,619 13,041,593 4,559,792 30,986,338 15,301,841 5,406,373 RHA B
Total 4,638,762 3,634,081 1,687,135 34,350,652 19,377,146 7,535,954 38,989,414 23,011,227 9,223,089
Region
Service Recipient Workload Units
Non Service Recipient
Workload Units
Total Workload Units
Extended Care
Service Recipient Workload Units
Non Service Recipient
Workload Units
Total Workload Units
Total
RRS A Zone 1 4,371,083 396,671 4,767,754 29,968,854 4,764,644 34,733,498 RRS A Zone 4 2,864,492 451,791 3,316,283 18,635,961 3,355,219 21,991,180 RRS A Zone 5 2,614,060 231,435 2,845,495 10,410,132 1,079,635 11,489,767 RRS A Zone 6 3,736,188 645,697 4,381,885 27,239,524 5,002,705 32,242,229
RHA B Zone 1 2,638,235 418,035 3,056,270 44,516,536 5,121,327 49,637,863 RHA B Zone 2 16,643,698 2,173,534 18,817,232 88,042,165 11,373,135 99,415,300 RHA B Zone 3 4,718,305 430,330 5,148,635 54,112,207 5,737,844 59,850,051 RHA B Zone 7 0 0 0 15,803,932 2,228,811 18,032,743
RRS A 13,585,823 1,725,594 15,311,417 86,254,471 14,202,203 100,456,674
RHA B 24,000,238 3,021,899 27,022,137 202,474,840 24,461,117 226,935,957
Total 37,586,061 4,747,493 42,333,554 288,729,311 38,663,320 327,392,631
Note 1: One workload unit is equivalent to one minute of time. Note 2: In RHA B Zone 7 Intensive Care includes telemetry monitoring. Note 3: In RRS A Zone 5, Centre Hospitalier Restigouche and regional psychiatric unit do not collect workload units. This impacts their total indicator results where workload units are part of the calculations. Note 4: Expenses excludes admin allocation, medical compensation and interdepartmental.
May 2015 Section IV - Page 8
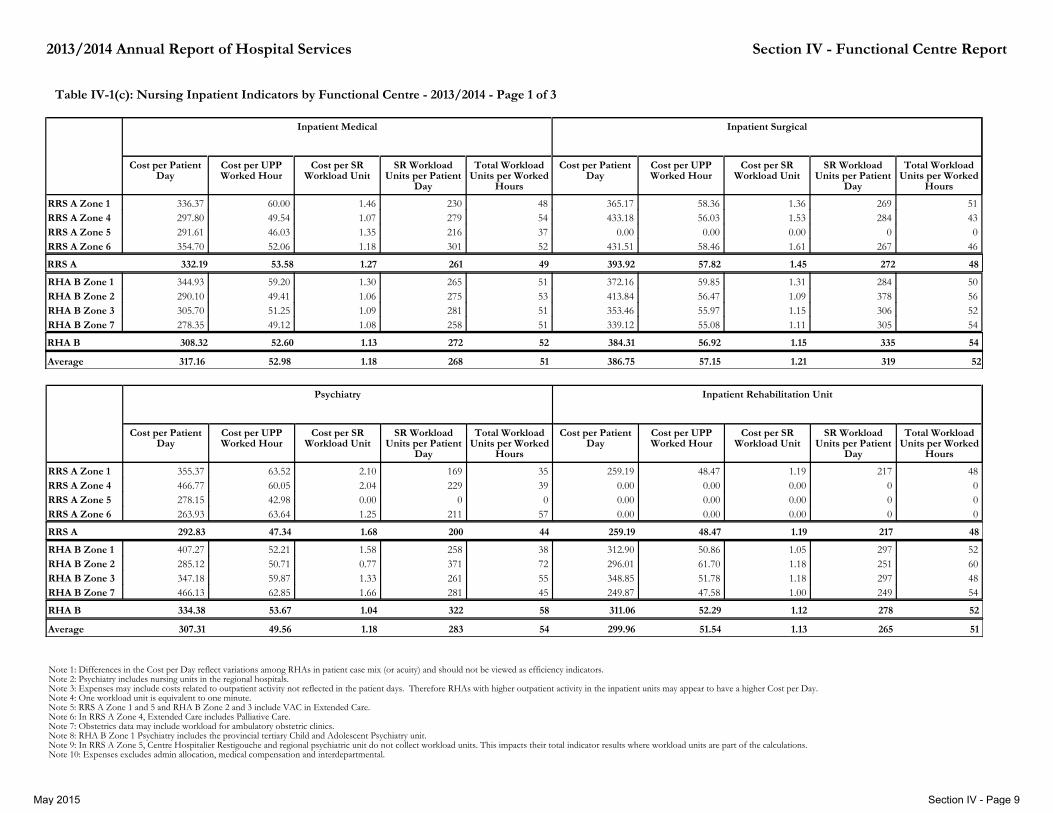
2013/2014 Annual Report of Hospital Services Section IV - Functional Centre Report
Table IV-1(c): Nursing Inpatient Indicators by Functional Centre - 2013/2014 - Page 1 of 3
Region
Cost per Patient Day
Cost per UPP Worked Hour
Cost per SR Workload Unit
SR Workload Units per Patient
Day
Total Workload Units per Worked
Hours
Inpatient Medical
Cost per Patient Day
Cost per UPP Worked Hour
Cost per SR Workload Unit
SR Workload Units per Patient
Day
Total Workload Units per Worked
Hours
Inpatient Surgical
RRS A Zone 1 336.37 60.00 1.46 230 48 365.17 58.36 1.36 269 51 RRS A Zone 4 297.80 49.54 1.07 279 54 433.18 56.03 1.53 284 43 RRS A Zone 5 291.61 46.03 1.35 216 37 0.00 0.00 0.00 0 0 RRS A Zone 6 354.70 52.06 1.18 301 52 431.51 58.46 1.61 267 46
RHA B Zone 1 344.93 59.20 1.30 265 51 372.16 59.85 1.31 284 50 RHA B Zone 2 290.10 49.41 1.06 275 53 413.84 56.47 1.09 378 56 RHA B Zone 3 305.70 51.25 1.09 281 51 353.46 55.97 1.15 306 52 RHA B Zone 7 278.35 49.12 1.08 258 51 339.12 55.08 1.11 305 54
332.19RRS A 393.92 53.58 57.82 1.27 1.45 261 27249 48
308.32RHA B 384.31 52.60 56.92 1.13 1.15 272 33552 54
Average 386.75 57.15 1.21 319 52317.16 52.98 1.18 268 51
RHA Zone
Cost per Patient Day
Cost per UPP Worked Hour
Cost per SR Workload Unit
SR Workload Units per Patient
Day
Total Workload Units per Worked
Hours
Psychiatry
Cost per Patient Day
Cost per UPP Worked Hour
Cost per SR Workload Unit
SR Workload Units per Patient
Day
Total Workload Units per Worked
Hours
Inpatient Rehabilitation Unit
RRS A Zone 1 355.37 63.52 2.10 169 35 259.19 48.47 1.19 217 48 RRS A Zone 4 466.77 60.05 2.04 229 39 0.00 0.00 0.00 0 0 RRS A Zone 5 278.15 42.98 0.00 0 0 0.00 0.00 0.00 0 0 RRS A Zone 6 263.93 63.64 1.25 211 57 0.00 0.00 0.00 0 0
RHA B Zone 1 407.27 52.21 1.58 258 38 312.90 50.86 1.05 297 52 RHA B Zone 2 285.12 50.71 0.77 371 72 296.01 61.70 1.18 251 60 RHA B Zone 3 347.18 59.87 1.33 261 55 348.85 51.78 1.18 297 48 RHA B Zone 7 466.13 62.85 1.66 281 45 249.87 47.58 1.00 249 54
292.83 259.19 RRS A 48.47 47.34 1.68 1.19 200 217 44 48
334.38 311.06 RHA B 52.29 53.67 1.04 1.12 322 278 58 52
Average 54 283 1.18 49.56 307.31 299.96 51.54 1.13 265 51
Note 1: Differences in the Cost per Day reflect variations among RHAs in patient case mix (or acuity) and should not be viewed as efficiency indicators. Note 2: Psychiatry includes nursing units in the regional hospitals. Note 3: Expenses may include costs related to outpatient activity not reflected in the patient days. Therefore RHAs with higher outpatient activity in the inpatient units may appear to have a higher Cost per Day. Note 4: One workload unit is equivalent to one minute. Note 5: RRS A Zone 1 and 5 and RHA B Zone 2 and 3 include VAC in Extended Care. Note 6: In RRS A Zone 4, Extended Care includes Palliative Care. Note 7: Obstetrics data may include workload for ambulatory obstetric clinics. Note 8: RHA B Zone 1 Psychiatry includes the provincial tertiary Child and Adolescent Psychiatry unit. Note 9: In RRS A Zone 5, Centre Hospitalier Restigouche and regional psychiatric unit do not collect workload units. This impacts their total indicator results where workload units are part of the calculations. Note 10: Expenses excludes admin allocation, medical compensation and interdepartmental.
May 2015 Section IV - Page 9
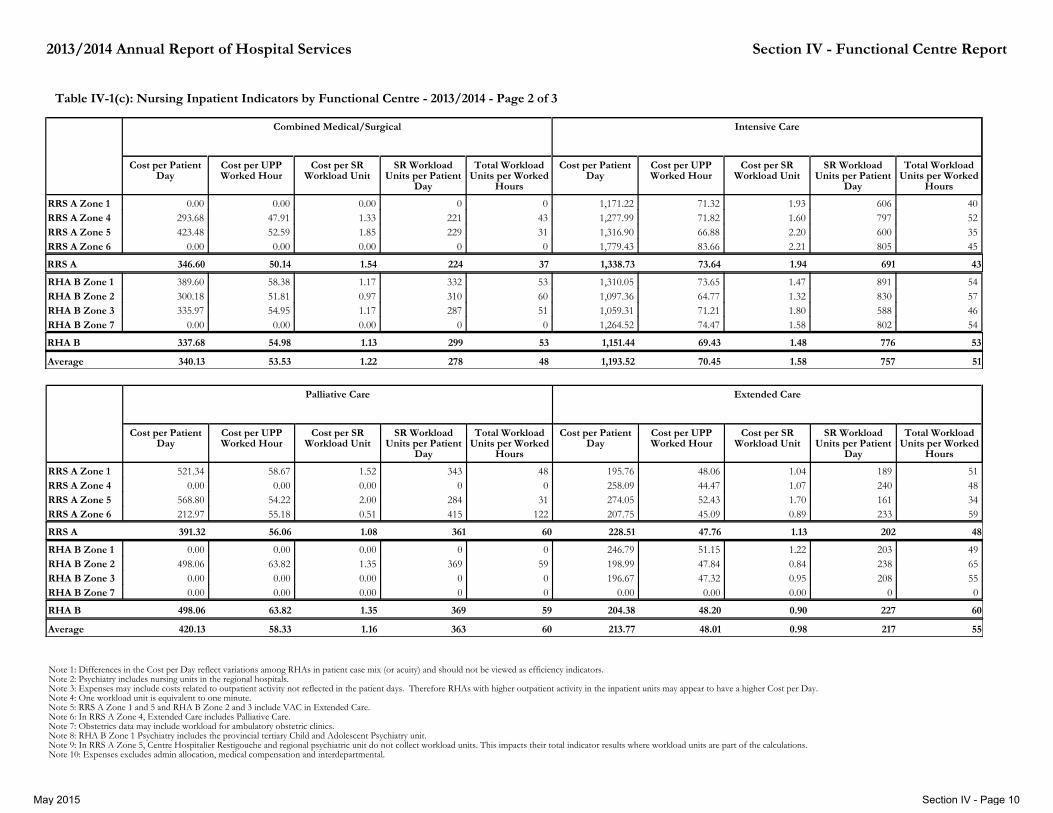
2013/2014 Annual Report of Hospital Services Section IV - Functional Centre Report
Table IV-1(c): Nursing Inpatient Indicators by Functional Centre - 2013/2014 - Page 2 of 3
Region
Cost per Patient Day
Cost per UPP Worked Hour
Cost per SR Workload Unit
SR Workload Units per Patient
Day
Total Workload Units per Worked
Hours
Combined Medical/Surgical
Cost per Patient Day
Cost per UPP Worked Hour
Cost per SR Workload Unit
SR Workload Units per Patient
Day
Total Workload Units per Worked
Hours
Intensive Care
RRS A Zone 1 0.00 0.00 0.00 0 0 1,171.22 71.32 1.93 606 40 RRS A Zone 4 293.68 47.91 1.33 221 43 1,277.99 71.82 1.60 797 52 RRS A Zone 5 423.48 52.59 1.85 229 31 1,316.90 66.88 2.20 600 35 RRS A Zone 6 0.00 0.00 0.00 0 0 1,779.43 83.66 2.21 805 45
RHA B Zone 1 389.60 58.38 1.17 332 53 1,310.05 73.65 1.47 891 54 RHA B Zone 2 300.18 51.81 0.97 310 60 1,097.36 64.77 1.32 830 57 RHA B Zone 3 335.97 54.95 1.17 287 51 1,059.31 71.21 1.80 588 46 RHA B Zone 7 0.00 0.00 0.00 0 0 1,264.52 74.47 1.58 802 54
RRS A 346.60 1,338.73 50.14 73.64 1.54 1.94 224 69137 43
RHA B 337.68 1,151.44 54.98 69.43 1.13 1.48 299 77653 53
Average 1,193.52 70.45 1.58 757 51340.13 53.53 1.22 278 48
RHA Zone
Cost per Patient Day
Cost per UPP Worked Hour
Cost per SR Workload Unit
SR Workload Units per Patient
Day
Total Workload Units per Worked
Hours
Palliative Care
Cost per Patient Day
Cost per UPP Worked Hour
Cost per SR Workload Unit
SR Workload Units per Patient
Day
Total Workload Units per Worked
Hours
Extended Care
RRS A Zone 1 521.34 58.67 1.52 343 48 195.76 48.06 1.04 189 51 RRS A Zone 4 0.00 0.00 0.00 0 0 258.09 44.47 1.07 240 48 RRS A Zone 5 568.80 54.22 2.00 284 31 274.05 52.43 1.70 161 34 RRS A Zone 6 212.97 55.18 0.51 415 122 207.75 45.09 0.89 233 59
RHA B Zone 1 0.00 0.00 0.00 0 0 246.79 51.15 1.22 203 49 RHA B Zone 2 498.06 63.82 1.35 369 59 198.99 47.84 0.84 238 65 RHA B Zone 3 0.00 0.00 0.00 0 0 196.67 47.32 0.95 208 55 RHA B Zone 7 0.00 0.00 0.00 0 0 0.00 0.00 0.00 0 0
391.32 228.51 RRS A 47.76 56.06 1.08 1.13 361 20260 48
498.06 204.38 RHA B 48.20 63.82 1.35 0.90 369 22759 60
Average 420.13 58.33 1.16 363 60 213.77 48.01 0.98 217 55
Note 1: Differences in the Cost per Day reflect variations among RHAs in patient case mix (or acuity) and should not be viewed as efficiency indicators. Note 2: Psychiatry includes nursing units in the regional hospitals. Note 3: Expenses may include costs related to outpatient activity not reflected in the patient days. Therefore RHAs with higher outpatient activity in the inpatient units may appear to have a higher Cost per Day. Note 4: One workload unit is equivalent to one minute. Note 5: RRS A Zone 1 and 5 and RHA B Zone 2 and 3 include VAC in Extended Care. Note 6: In RRS A Zone 4, Extended Care includes Palliative Care. Note 7: Obstetrics data may include workload for ambulatory obstetric clinics. Note 8: RHA B Zone 1 Psychiatry includes the provincial tertiary Child and Adolescent Psychiatry unit. Note 9: In RRS A Zone 5, Centre Hospitalier Restigouche and regional psychiatric unit do not collect workload units. This impacts their total indicator results where workload units are part of the calculations. Note 10: Expenses excludes admin allocation, medical compensation and interdepartmental.
May 2015 Section IV - Page 10

2013/2014 Annual Report of Hospital Services Section IV - Functional Centre Report
Table IV-1(c): Nursing Inpatient Indicators by Functional Centre - 2013/2014 - Page 3 of 3
Region
Cost per Patient Day
Cost per UPP Worked Hour
Cost per SR Workload Unit
SR Workload Units per Patient
Day
Total Workload Units per Worked
Hours
Obstetrics
Cost per Patient Day
Cost per UPP Worked Hour
Cost per SR Workload Unit
SR Workload Units per Patient
Day
Total Workload Units per Worked
Hours
Pediatrics
RRS A Zone 1 679.12 68.19 2.27 299 37 484.58 65.78 1.97 246 42 RRS A Zone 4 573.66 62.70 1.93 298 39 542.90 55.77 1.51 360 45 RRS A Zone 5 493.87 54.44 2.06 240 30 0.00 0.00 0.00 0 0 RRS A Zone 6 756.48 65.03 2.68 282 30 500.53 60.55 3.04 165 30
RHA B Zone 1 587.94 64.50 1.56 376 49 645.25 61.92 1.85 348 40 RHA B Zone 2 607.28 63.16 1.64 370 45 697.09 73.24 1.96 356 46 RHA B Zone 3 663.29 63.32 1.54 431 48 549.88 56.93 1.58 348 41 RHA B Zone 7 565.09 72.71 1.64 344 53 498.19 69.63 1.66 301 52
RRS A 626.09 512.53 62.94 59.77 2.23 1.91 280 268 34 40
RHA B 613.65 593.98 64.67 63.58 1.59 1.75 387 340 48 43
Average 61.94 1.81 307 42 557.09 618.64 63.95 1.80 344 42
RHA ZoneAverage Cost per
Patient DayAverage Cost per
UPP Worked Hour
Average Cost per SR Workload Unit
Average SR Workload Units per Patient Day
Average Total Workload Units per
Worked Hours
RRS A Zone 1 361.60 59.44 1.49 243 46 RRS A Zone 4 395.96 54.24 1.38 287 46 RRS A Zone 5 320.33 47.42 3.19 100 16 RRS A Zone 6 382.22 56.36 1.33 287 50
RHA B Zone 1 429.94 60.89 1.36 316 50 RHA B Zone 2 349.52 54.42 1.07 328 58 RHA B Zone 3 377.47 56.20 1.24 304 50 RHA B Zone 7 376.42 57.44 1.25 301 52
RRS A 361.34 54.43 1.62 223 39
RHA B 377.21 56.68 1.19 316 53
Average 371.24 55.83 1.32 281 48
Note 1: Differences in the Cost per Day reflect variations among RHAs in patient case mix (or acuity) and should not be viewed as efficiency indicators. Note 2: Psychiatry includes nursing units in the regional hospitals. Note 3: Expenses may include costs related to outpatient activity not reflected in the patient days. Therefore RHAs with higher outpatient activity in the inpatient units may appear to have a higher Cost per Day. Note 4: One workload unit is equivalent to one minute. Note 5: RRS A Zone 1 and 5 and RHA B Zone 2 and 3 include VAC in Extended Care. Note 6: In RRS A Zone 4, Extended Care includes Palliative Care. Note 7: Obstetrics data may include workload for ambulatory obstetric clinics. Note 8: RHA B Zone 1 Psychiatry includes the provincial tertiary Child and Adolescent Psychiatry unit. Note 9: In RRS A Zone 5, Centre Hospitalier Restigouche and regional psychiatric unit do not collect workload units. This impacts their total indicator results where workload units are part of the calculations. Note 10: Expenses excludes admin allocation, medical compensation and interdepartmental.
May 2015 Section IV - Page 11

2013/2014 Annual Report of Hospital Services Section IV - Functional Centre Report
Table IV-1(d): Nursing Inpatient Percentage of Total Workload by RHA - 2013/2014
Region Inpatient Medical % Inpatient Surgical % Combined Medical/Surgical %
Intensive Care % Obstetrics % Pediatrics %
RRS A Zone 1 36.5% 19.5% 0.0% 8.2% 5.9% 3.1% RRS A Zone 4 26.3% 12.0% 12.4% 10.3% 10.0% 8.9% RRS A Zone 5 33.3% 0.0% 15.4% 8.5% 12.8% 0.0% RRS A Zone 6 52.0% 8.3% 0.0% 6.0% 6.2% 2.5%
RHA B Zone 1 37.5% 14.6% 5.2% 17.2% 8.0% 3.2% RHA B Zone 2 25.8% 21.2% 3.1% 13.8% 4.1% 1.1% RHA B Zone 3 27.6% 13.3% 15.6% 11.2% 8.8% 2.9% RHA B Zone 7 34.8% 19.3% 0.0% 11.4% 11.0% 5.5%
38.9% 12.0% 4.5% 8.0% 7.7% 3.8% RRS A
29.5% 17.5% 6.6% 13.7% 6.7% 2.4% RHA B
Average 32.4% 15.8% 6.0% 11.9% 7.0% 2.8%
Region Psychiatry % Inpatient Rehabilitation Unit %
Palliative Care % Extended Care % All Functional Centers %
RRS A Zone 1 3.8% 6.9% 2.5% 13.7% 100.0% RRS A Zone 4 5.1% 0.0% 0.0% 15.1% 100.0% RRS A Zone 5 0.0% 0.0% 5.3% 24.8% 100.0% RRS A Zone 6 6.5% 0.0% 4.9% 13.6% 100.0%
RHA B Zone 1 4.8% 3.3% 0.0% 6.2% 100.0% RHA B Zone 2 9.0% 1.9% 1.3% 18.9% 100.0% RHA B Zone 3 3.7% 8.2% 0.0% 8.6% 100.0% RHA B Zone 7 5.6% 12.4% 0.0% 0.0% 100.0%
4.5% 2.4% 3.0% 15.2% 100.0% RRS A
6.4% 4.7% 0.5% 11.9% 100.0% RHA B
Average 5.8% 4.0% 1.3% 12.9% 100.0%
Note 1: In RRS A Zone 5, Centre Hospitalier Restigouche and regional psychiatric unit do not collect workload units. This impacts their total indicator results where workload units are part of the calculations.
May 2015 Section IV - Page 12

2013/2014 Annual Report of Hospital Services Section IV - Functional Centre Report
Table IV-2(a): Operating Room/Recovery Room/Day Surgery Total Expenses, Worked Hours and Statistics - 2013/2014
RHA Zone
Expenses UPP - Worked Hours UPP - Benefit Hours Inpatient Surgical Cases Day Surgery Surgical Cases
Other Outpatient Cases Total Surgical Cases
RRS A Zone 1 12,900,591 77,769 18,004 2,830 5,105 0 7,935 RRS A Zone 4 6,685,712 41,639 12,230 1,628 2,969 0 4,597 RRS A Zone 5 4,052,840 34,518 10,452 768 1,935 0 2,703 RRS A Zone 6 9,175,851 55,860 16,100 2,164 3,399 0 5,563
RHA B Zone 1 18,780,414 109,515 32,758 3,816 3,932 14 7,762 RHA B Zone 2 30,242,675 182,141 44,096 5,877 11,762 0 17,639 RHA B Zone 3 18,819,255 134,647 30,521 3,999 12,814 -1 16,812 RHA B Zone 7 5,899,450 43,255 8,664 1,411 2,805 6 4,222
RRS A 32,814,994 209,786 56,786 7,390 13,408 0 20,798
RHA B 73,741,795 469,559 116,039 15,103 31,313 19 46,435
Total 106,556,789 679,344 172,825 22,493 44,721 19 67,233
Note 1: Other Outpatient Cases' refers to non-surgical cases/procedures conducted in these functional centres. Note 2: Expenses excludes admin allocation, medical compensation and interdepartmental. Note 3: Number of cases within this table may not match those reported in Section III. This report includes cases where only resources of the OR/RR/DS functional centres are required. Note 4: In RHA B Zone 2, Obstetrical staff performed 343 surgical cases in the OBS suite which are excluded from this report. Note 5: In RRS A Zone 1, Other outpatient cases are included under Day Surgery Surgical Cases as the outpatient cases are either performed in the OR, or in the Ambulatory Clinic by OR staff.
May 2015 Section IV - Page 13

2013/2014 Annual Report of Hospital Services Section IV - Functional Centre Report
Table IV-2(b): Operating Room/Recovery Room/Day Surgery Workload Units - 2013/2014
RHA Zone
Service Recipient Workload Units Non Service Recipient Workload Units
Total Workload Units
RRS A Zone 1 2,631,242 275,842 2,907,084 RRS A Zone 4 1,542,677 174,667 1,717,344 RRS A Zone 5 953,044 165,636 1,118,680 RRS A Zone 6 2,019,707 292,006 2,311,713
RHA B Zone 1 4,530,950 667,863 5,198,813 RHA B Zone 2 5,787,906 899,738 6,687,644 RHA B Zone 3 4,382,433 503,559 4,885,992 RHA B Zone 7 1,796,595 359,281 2,155,876
RRS A 908,151 7,146,670 8,054,821
RHA B 2,430,441 16,497,884 18,928,325
Total 3,338,592 23,644,554 26,983,146
Note 1: RHA B, Zone 2 and Zone 3 do not have workload fully implemented in OR/RR and Day Surgery.
May 2015 Section IV - Page 14

2013/2014 Annual Report of Hospital Services Section IV - Functional Centre Report
Region Cost per Surgical Case Cost per UPP Worked Hour Cost per SR Workload Unit SR Workload Units per Case Average Workload Units per Worked Hour
RRS A Zone 1 1,625.78 165.88 4.90 331.60 37.38 RRS A Zone 4 1,454.36 160.57 4.33 335.58 41.24 RRS A Zone 5 1,499.39 117.41 4.25 352.59 32.41 RRS A Zone 6 1,649.44 164.27 4.54 363.06 41.38
RHA B Zone 1 2,419.53 171.49 4.14 583.73 47.47 RHA B Zone 2 1,714.53 166.04 5.23 328.13 36.72 RHA B Zone 3 1,119.39 139.77 4.29 260.67 36.29 RHA B Zone 7 1,397.31 136.39 3.28 425.53 49.84
1,577.80 RRS A 156.42 4.59 343.62 38.40
1,588.06 RHA B 157.04 4.47 355.29 40.31
1,584.89 156.85 4.51 351.68 39.72 Average
Table IV-2(c): Operating Room/Recovery Room/Day Surgery Indicators - 2013/2014
Note 1: Calculation of indicators includes Other Outpatient Cases. Note 2: RHA B, Zone 2 and Zone 3 do not have workload fully implemented in OR/RR and Day Surgery.
May 2015 Section IV - Page 15

Section IV - Functional Centre Report2013/2014 Annual Report of Hospital Services
Table IV-3: Ambulatory Care Service Activity by Regional Health Authority - 2013/2014
Org Short Name
Fiscal - 4 AmountFiscal - 3 AmountFiscal - 2 AmountPrev Fiscal AmountCurr Fiscal Amount % Change
Emergency Room Visits
Fiscal - 4 AmountFiscal - 3 AmountFiscal - 2 AmountPrev Fiscal AmountCurr Fiscal Amount % Change
Day/Night Care and Clinic Visits
RRS A Zone 1 90,455 92,331 90,200 88,793 84,760 -4.5% 140,751 154,513 159,215 158,220 170,493 7.8% RRS A Zone 4 69,777 71,169 66,494 68,120 62,988 -7.5% 101,928 106,291 109,889 92,126 95,945 4.1% RRS A Zone 5 27,490 27,231 26,024 24,242 23,057 -4.9% 21,776 22,743 29,097 28,826 28,481 -1.2% RRS A Zone 6 59,576 57,424 56,822 81,691 80,713 -1.2% 77,007 74,184 132,861 110,859 106,636 -3.8%
RHA B Zone 1 72,116 72,179 75,496 73,172 70,714 -3.4% 103,519 111,801 110,819 106,689 108,084 1.3% RHA B Zone 2 138,360 139,727 138,926 132,373 126,799 -4.2% 199,201 204,335 210,176 207,648 203,389 -2.1% RHA B Zone 3 123,428 129,629 127,661 122,537 121,728 -0.7% 76,283 76,930 94,231 90,284 89,005 -1.4% RHA B Zone 7 37,643 37,395 37,174 36,189 35,015 -3.2% 35,409 34,002 33,529 35,957 38,311 6.5%
RRS A 247,298 341,462 248,155 357,731 239,540 431,062 262,846 390,031 251,518 401,555 -4.3% 3.0%
RHA B 371,547 414,412 378,930 427,068 379,257 448,755 364,271 440,578 354,256 438,789 -2.7% -0.4% Total
618,845 755,874 627,085 784,799 618,797 879,817 627,117 830,609 605,774 840,344 -3.4% 1.2%
Note 1: Visits to Health Centres and Community Health Centres are excluded. Note 2: Visits by both outpatients and inpatients are included for some RHAs (i.e., an inpatient visit to an outpatient clinic would be included). Note 3: Visits to inpatient functional centers include outpatient visits to inpatient nursing units and may include Emergency Room visits in small facilities (i.e. Grand Manan). Note 4: The significant increase in RRS A, Zone 6 (43.8%) is due to ER visits being reported to the hospital that were formerly reported to Centre de santé communautaire de l'Enfant-Jésus RHSJ.
Org Short Name
Fiscal - 4 AmountFiscal - 3 AmountFiscal - 2 AmountPrev Fiscal AmountCurr Fiscal Amount % Change
Visits to IP Functional Centres
Fiscal - 4 AmountFiscal - 3 AmountFiscal - 2 AmountPrev Fiscal AmountCurr Fiscal Amount
Total % Change
RRS A Zone 1 1,033 1,129 1,522 1,721 1,171 -32.0% 232,239 247,973 250,937 248,734 256,424 3.1% RRS A Zone 4 3,105 7,318 2,469 2,719 2,630 -3.3% 174,810 184,778 178,852 162,965 161,563 -0.9% RRS A Zone 5 0 0 0 16 0 -100.0% 49,266 49,974 55,121 53,084 51,538 -2.9% RRS A Zone 6 564 310 717 932 750 -19.5% 137,147 131,918 190,400 193,482 188,099 -2.8%
RHA B Zone 1 3,393 3,317 2,299 2,437 2,538 4.1% 179,028 187,297 188,614 182,298 181,336 -0.5% RHA B Zone 2 19,309 26,061 20,541 20,412 17,631 -13.6% 356,870 370,123 369,643 360,433 347,819 -3.5% RHA B Zone 3 13,522 15,124 4,211 4,049 4,437 9.6% 213,233 221,683 226,103 216,870 215,170 -0.8% RHA B Zone 7 2,331 245 306 390 323 -17.2% 75,383 71,642 71,009 72,536 73,649 1.5%
RRS A -0.1% 4,702 8,757 4,708 5,388 4,551 -15.5% 593,462 614,643 675,310 658,265 657,624
RHA B -1.7% 38,555 44,747 27,357 27,288 24,929 -8.6% 824,514 850,745 855,369 832,137 817,974 Total -1.0% 43,257 53,504 32,065 32,676 29,480 -9.8% 1,417,976 1,465,388 1,530,679 1,490,402 1,475,598
2009/2010 2010/2011 2011/2012 2012/2013 2013/2014 2009/2010 2010/2011 2011/2012 2012/2013 2013/2014
2009/2010 2010/2011 2011/2012 2012/2013 2013/2014 2009/2010 2010/2011 2011/2012 2012/2013 2013/2014
May 2015 Section IV - Page 16

2009/2010
2012/2013
2011/2012
2010/2011
2013/2014
Figure IV-3(i) : Total Emergency Room Visits by RHA - 2013/2014
Figure IV-3(ii) : Total Day/ Night Care and Clinic Visits by RHA - 2013/2014
2009/2010
2010/2011
2012/2013
2011/2012
2013/2014
2013/2014 Annual Report of Hospital Services Section IV - Functional Centre Report
May 2015 Section IV - Page 17

2013/2014 Annual Report of Hospital Services Section IV - Functional Centre Report
Regions
Total Expenses UPP Worked Hours
ER Visits Other Visits Total Visits Patient Days in ER
Emergency Room
Total Expenses UPP Worked Hours
Total Visits
Day/Night Care & Clinics
RRS A Zone 1 7,485,915 106,828 82,285 2,475 84,760 2,646 27,367,965 216,564 170,493 RRS A Zone 4 5,733,906 80,331 62,988 0 62,988 1,427 8,957,100 84,110 95,945 RRS A Zone 5 3,122,386 48,635 23,055 2 23,057 415 3,360,243 38,440 28,481 RRS A Zone 6 9,504,093 136,031 80,713 0 80,713 1,297 15,756,711 132,252 106,636
RHA B Zone 1 10,000,689 128,378 68,193 2,521 70,714 2,484 21,003,605 144,326 108,084 RHA B Zone 2 14,430,143 208,020 126,799 0 126,799 1,530 37,459,592 316,541 203,389 RHA B Zone 3 13,658,917 216,659 121,051 677 121,728 4,098 16,698,976 144,363 89,005 RHA B Zone 7 4,314,746 59,760 35,015 0 35,015 1,900 4,601,016 32,861 38,311
RRS A 25,846,299 55,442,019 371,825 471,366 249,041 2,477 251,518 401,555 5,785
RHA B 42,404,496 79,763,188 612,817 638,091 351,058 3,198 354,256 438,789 10,012
Total 68,250,795 135,205,207 984,642 1,109,458 600,099 5,675 605,774 840,344 15,797
Table IV-4(a) - Emergency Room, Day Night Care & Clinics - Total Expenses, Worked Hours, Statistics - 2013/2014
Note 1: UPP Worked Hours includes Unit Production Personnel worked and purchased service hours, and excludes MOS, Medical, and Standby hours. Note 2: Health Centre and Community Health Centre visits, hours, and expenses are not included in this table. Note 3: Emergency Room expenses in some RHAs reflect costs associated with overflow beds. Note 4: In some RHAs, Emergency visits in small facilities are reported under Nursing Inpatient functional centres and, as such, would be excluded from the table above (i.e. Grand Manan) Note 5: RHAs may have patient days in the Emergency, resulting in differences in hours and cost per visit. A patient day in the Emergency occurs when a patient is admitted to and remains in the Emergency as at midnight, or is admitted to and discharged from Emergency in the same day. Note 6: Other visits are scheduled clinic visits that occur in ER. Note 7: Day/Night Care and Clinics includes Dialysis and Medical Oncology. Note 8: In RRS A Zone 1, only the Nursing Care Follow-up Visits for Hôpital Stella-Maris-De-Kent are reported in Other Visits, whereas these types of visits are performed by nursing staff of the Ambulatory Clinic at the Hôpital régional Dr-Georges-L.-Dumont. Note 9: In RHA B Zone 2, Non-Inpatient Emergency Services includes Trauma Centre expenses ($803,646).
May 2015 Section IV - Page 18

Section IV - Functional Centre Report2013/2014 Annual Report of Hospital Services
Table IV-4(b) - Emergency Room Visits by Triage Level - 2013/2014
Level 1Visits Triage
Level 2 Visits Triage
Level 3 Visits Triage
Level 4 Visits Triage
Level 5 Visits Triage Other Visits
Emergency Room Total
RRS A Zone 1 102 6,374 26,590 40,734 8,485 2,475 84,760 RRS A Zone 4 76 2,534 20,119 31,343 8,916 0 62,988 RRS A Zone 5 153 3,334 6,055 11,339 2,174 2 23,057 RRS A Zone 6 143 4,555 18,387 40,964 16,664 0 80,713
RHA B Zone 1 274 8,510 22,123 29,840 7,446 2,521 70,714 RHA B Zone 2 720 13,430 45,094 60,496 7,059 0 126,799 RHA B Zone 3 350 7,992 28,807 55,667 28,235 677 121,728 RHA B Zone 7 128 4,454 10,876 17,278 2,279 0 35,015
474 16,797 71,151 124,380 36,239 2,477 RRS A 251,518
1,472 34,386 106,900 163,281 45,019 3,198 RHA B 354,256
Total 1,946 51,183 178,051 287,661 81,258 5,675 605,774
Note 1: Health Centre and Community Health Centre visits are excluded. Note 2: In some RHAs, Emergency visits in small facilities are reported under Nursing Inpatient functional centres and, as such, would be excluded from the table above (i.e. Grand Manan). Note 3: RHAs may have patient days in the Emergency, resulting in differences in hours and cost per visit. A patient day in the Emergency occurs when a patient is admitted and remains in the ER. Note 4: Day/Night Care and Clinics includes Dialysis and Medical Oncology. Note 5: Other Visits are scheduled clinic visits that occur in ER.
May 2015 Section IV - Page 19

2013/2014 Annual Report of Hospital Services Section IV - Functional Centre Report
Table IV-4(c): Emergency Room Visits by Triage Level and Time of Day - 2013/2014
Note 1: Health Center and Community Health Centre visits and hours are excluded. Note 2: In some RHAs, Emergency visits in small facilities are reported under Nursing Inpatient functional centers and, as such, would be excluded from table above (i.e. Grand Manan). Note 3: RHAs may not always apply consistent definition for ambulatory care visits, which affects the comparability of the data in this table. Note 4: Other visits are scheduled clinic visits that occur in ER.
Region
0800 to 1600 1600 to 2400 2400 to 0800Level 1
Visits Triage
0800 to 1600 1600 to 2400 2400 to 0800Level 2
Visits Triage
0800 to 1600 1600 to 2400 2400 to 0800Level 3
Visits Triage
Emergency Room Visits
RRS A Zone 1 39 46 17 2,958 2,440 976 12,477 10,574 3,539 RRS A Zone 4 38 18 20 1,149 1,052 333 9,714 7,991 2,414 RRS A Zone 5 69 61 23 1,494 1,313 527 2,765 2,456 834 RRS A Zone 6 62 50 31 1,981 1,869 705 8,125 7,841 2,421
RHA B Zone 1 90 110 74 3,345 3,581 1,584 9,634 9,212 3,277 RHA B Zone 2 275 308 137 6,282 5,085 2,063 22,367 17,456 5,271 RHA B Zone 3 139 131 80 3,373 3,265 1,354 13,864 11,490 3,453 RHA B Zone 7 52 51 25 2,141 1,720 593 5,072 4,320 1,484
208 175 91 7,582 6,674 2,541 33,081 28,862 9,208 RRS A
556 600 316 15,141 13,651 5,594 50,937 42,478 13,485 RHA B
Total 764 775 407 22,723 20,325 8,135 84,018 71,340 22,693
Region
0800 to 1600 1600 to 2400 2400 to 0800Level 4
Visits Triage
0800 to 1600 1600 to 2400 2400 to 0800Level 5
Visits Triage Total
Emergency Room Visits
RRS A Zone 1 22,559 14,429 3,746 5,678 2,168 639 82,285 RRS A Zone 4 17,326 11,056 2,961 5,575 2,708 633 62,988 RRS A Zone 5 5,806 4,172 1,361 1,271 691 212 23,055 RRS A Zone 6 20,957 15,328 4,679 9,962 4,748 1,954 80,713
RHA B Zone 1 15,312 11,680 2,848 4,298 2,688 460 68,193 RHA B Zone 2 35,425 21,347 3,724 4,252 2,146 661 126,799 RHA B Zone 3 30,670 20,875 4,122 16,486 9,383 2,366 121,051 RHA B Zone 7 9,403 6,014 1,861 1,390 659 230 35,015
RRS A 66,648 44,985 12,747 22,486 10,315 3,438 249,041
RHA B 90,810 59,916 12,555 26,426 14,876 3,717 351,058
Total 157,458 104,901 25,302 48,912 25,191 7,155 600,099
May 2015 Section IV - Page 20

2013/2014 Annual Report of Hospital Services Section IV - Functional Centre Report
Regions
Total Cost per Visit Total Cost per UPP Worked Hour
Total UPP Worked Hours per Visit
Emergency Room
Total Cost per Visit Total Cost per UPP Worked Hour
Total UPP Worked Hours per Visit
Day/Night Care & Clinics Avg Cost per Visit Avg Cost per UPP Worked Hour
Avg UPP Worked Hours per Visit
RRS A Zone 1 88 70 1.3 161 126 1.3 137 108 1.3 RRS A Zone 4 91 71 1.3 93 106 0.9 92 89 1.0 RRS A Zone 5 135 64 2.1 118 87 1.3 126 74 1.7 RRS A Zone 6 118 70 1.7 148 119 1.2 135 94 1.4
RHA B Zone 1 141 78 1.8 194 146 1.3 173 114 1.5 RHA B Zone 2 114 69 1.6 184 118 1.6 157 99 1.6 RHA B Zone 3 112 63 1.8 188 116 1.6 144 84 1.7 RHA B Zone 7 123 72 1.7 120 140 0.9 122 96 1.3
103 RRS A 70 1.5 138 118 1.2 124 96 1.3
120 RHA B 69 1.7 182 125 1.5 154 98 1.6
Total 113 69 1.6 161 122 1.3 141 97 1.4
Table IV-4(d) - Emergency Room and Day Night Care & Clinics Indicators - 2013/2014
Note 1: Health Centre and Community Health Centre visits, hours, and expenses are excluded. Note 2: Emergency Room expenses in some RHAs reflect costs associated with overflow beds. Note 3: In some RHAs, Emergency visits in small facilities are reported under Nursing Inpatient functional centres and, as such, would be excluded from the table above (i.e. Grand Manan). Note 4: Day/Night Care and Clinics includes Dialysis and Medical Oncology. Note 5: Zone 2 Non-Inpatient Emergency Services includes Trauma Centre expenses ($803,646)..
May 2015 Section IV - Page 21

2013/2014 Annual Report of Hospital Services Section IV - Functional Centre Report
Table IV-5(a) - Clinical Laboratory Expenses, UPP Worked, UPP Benefit Hours and Workload Units by Functional Centre - 2013/2014 - Page 1 of 2
Region
Expenses UPP Worked Hours
UPP Benefit Hours
Workload Units
Anatomical Pathology
Expenses UPP Worked Hours
UPP Benefit Hours
Workload Units
Cytopathology
Expenses UPP Worked Hours
UPP Benefit Hours
Workload Units
Clinical Chemistry
RRS A Zone 1 1,261,158 16,548 4,308 1,261,160 361,599 5,174 1,886 405,028 2,528,154 19,605 3,967 2,452,424 RRS A Zone 4 536,579 8,935 2,484 531,122 173,729 3,383 493 173,948 1,188,947 10,138 2,728 1,119,683 RRS A Zone 5 187,554 3,643 538 288,035 123,843 2,989 604 70,934 1,251,369 13,300 3,524 907,533 RRS A Zone 6 732,756 9,305 2,086 1,002,287 395,554 7,156 1,419 351,705 1,944,118 15,760 2,958 1,714,453
RHA B Zone 1 1,535,675 20,364 3,310 2,849,008 470,243 10,310 1,880 430,850 3,544,853 27,822 4,174 3,681,276 RHA B Zone 2 2,075,087 30,022 5,392 1,904,207 672,258 15,270 2,666 674,700 5,139,518 44,199 11,393 5,153,207 RHA B Zone 3 1,495,741 19,737 3,670 2,229,645 554,558 11,909 2,080 447,947 4,080,762 39,651 8,695 4,866,473 RHA B Zone 7 428,118 5,381 1,889 446,751 110,706 2,697 558 74,854 1,330,052 10,929 2,459 1,239,755
3,082,604 1,001,615 6,194,093 RRS A 2,718,047 1,054,725 6,912,589 38,431 18,702 58,803 9,415 4,403 13,177
7,429,611 1,628,351 14,940,711 RHA B 5,534,621 1,807,765 14,095,185 75,504 40,186 122,601 14,261 7,184 26,721
Total 10,512,215 2,629,966 21,134,803 8,252,668 2,862,490 21,007,774 113,935 58,889 181,404 23,676 11,587 39,899
Region
Expenses UPP Worked Hours
UPP Benefit Hours
Workload Units
Pre/Post Analysis
Expenses UPP Worked Hours
UPP Benefit Hours
Workload Units
Transfusion Medicine
Expenses UPP Worked Hours
UPP Benefit Hours
Workload Units
Multi-functional Labs
RRS A Zone 1 2,642,931 40,875 7,971 1,287,878 352,202 4,684 635 326,794 599,658 9,839 1,147 724,901 RRS A Zone 4 385,265 11,535 1,993 364,011 190,197 2,570 563 119,572 1,266,759 18,924 3,457 1,259,655 RRS A Zone 5 459,175 14,547 3,714 412,574 239,368 3,435 1,335 146,743 252,664 4,133 763 420,571 RRS A Zone 6 669,993 16,679 3,740 1,038,755 200,559 1,705 186 156,545 3,163,812 59,799 9,816 3,887,976
RHA B Zone 1 2,096,314 46,474 10,168 1,739,570 681,334 10,201 1,206 468,885 763,964 12,945 1,541 718,150 RHA B Zone 2 1,789,031 53,745 9,159 3,982,626 1,295,563 17,921 4,616 723,272 1,210,959 17,033 2,497 837,462 RHA B Zone 3 1,289,260 34,887 7,361 1,714,106 647,265 8,918 2,024 399,695 4,271,274 71,562 15,729 5,895,930 RHA B Zone 7 784,118 16,723 2,944 976,727 180,325 2,624 873 214,582 0 0 0 0
RRS A 4,157,364 83,636 17,417 3,103,218 982,326 12,394 2,720 749,654 5,282,893 92,695 15,182 6,293,103
RHA B 5,958,723 151,829 29,632 8,413,029 2,804,487 39,664 8,719 1,806,434 6,246,196 101,540 19,767 7,451,542
Total 10,116,086 235,464 47,050 11,516,247 3,786,814 52,058 11,438 2,556,088 11,529,089 194,235 34,949 13,744,645
Note 1: Excludes Non-Service Recipient workload, admin allocation, medical compensation, interdepartmental expenses and standby hours. Note 2: The laboratories in the small facilities of all RHAs are reported under the Multi-functional Labs. Note 3: RRS A Zone 1 has Molecular Diagnostics, RHA B Zone 2 has Cytogenetics and Microbiology Level 3, and RHA B Zone 3 has Immunology. Note 4: Receipt and Dispatch workload is not distributed the same in all RHAs. Note 5: RRS A Zone 5 Cytopathology is combined with Anatomical Pathology; Receipt and Dispatch is combined with Specimen Procurement. Note 6: RHA B Zone 7 expenses for Receipt & Dispatch include all Microbiology. Note 7: In RHA B Zone 2, Radioimmunassay procedures (83,386) and workload (653,102) are now reported in Clinical Laboratory instead of Radiology. Note 8: Workload units are based on CIHI pre-2009 methodology.
May 2015 Section IV - Page 22

2013/2014 Annual Report of Hospital Services Section IV - Functional Centre Report
Table IV-5(a) - Clinical Laboratory Expenses, UPP Worked, UPP Benefit Hours and Workload Units by Functional Centre - 2013/2014 - Page 2 of 2
Region
Expenses UPP Worked Hours
UPP Benefit Hours
Workload Units
Clinical Hematology
Expenses UPP Worked Hours
UPP Benefit Hours
Workload Units
Immunology, Histocompatibility/Immunogenetics, Diagnostic Genetics
Expenses UPP Worked Hours
UPP Benefit Hours
Workload Units
Microbiology
RRS A Zone 1 945,702 13,146 2,369 1,396,028 733,445 5,100 652 263,699 3,705,246 37,494 7,379 3,862,292 RRS A Zone 4 563,532 8,281 1,802 601,234 0 0 0 0 731,884 10,780 2,487 969,100 RRS A Zone 5 575,698 8,726 2,131 698,199 0 0 0 0 654,843 9,070 1,597 624,386 RRS A Zone 6 1,146,671 19,054 3,304 973,919 0 0 0 0 1,401,544 19,726 4,352 1,238,605
RHA B Zone 1 2,034,350 26,088 5,326 2,594,680 0 0 0 0 2,303,369 27,802 6,896 2,104,578 RHA B Zone 2 2,512,440 35,026 7,123 2,608,410 843,505 6,571 879 471,572 2,896,957 39,278 7,694 2,635,453 RHA B Zone 3 1,571,530 19,137 4,411 1,812,260 460,129 2,320 573 218,187 2,036,570 25,180 5,211 2,294,362 RHA B Zone 7 748,403 12,108 2,353 770,009 0 0 0 0 0 0 0 0
6,694,383 RRS A 3,669,380 263,699 3,231,603 733,445 6,493,516 49,206 5,100 77,070 9,605 652 15,815
7,034,393 RHA B 7,785,359 689,759 6,866,723 1,303,634 7,236,896 92,359 8,891 92,260 19,213 1,452 19,801
Total 13,728,776 11,454,738 953,458 10,098,327 2,037,079 13,730,412 141,565 13,991 169,330 28,819 2,104 35,616
Region
Expenses UPP Worked Hours
UPP Benefit Hours
Workload Units
Electron Microscopy
Expenses UPP Worked Hours
UPP Benefit Hours
Workload Units
Stem Cell Transplant Lab
Expenses UPP Worked Hours
UPP Benefit Hours
Workload Units
Total
RRS A Zone 1 0 0 0 0 0 0 0 0 13,130,095 152,465 30,314 11,980,204 RRS A Zone 4 0 0 0 0 0 0 0 0 5,036,893 74,547 16,006 5,138,325 RRS A Zone 5 0 0 0 0 0 0 0 0 3,744,515 59,844 14,206 3,568,975 RRS A Zone 6 0 0 0 0 0 0 0 0 9,655,006 149,183 27,861 10,364,244
RHA B Zone 1 0 0 0 0 0 0 0 0 13,430,102 182,006 34,501 14,586,996 RHA B Zone 2 46,849 937 254 0 125,742 1,647 209 0 18,607,910 261,649 51,882 18,990,909 RHA B Zone 3 0 0 0 0 0 0 0 0 16,407,088 233,301 49,754 19,878,605 RHA B Zone 7 0 0 0 0 0 0 0 0 3,581,722 50,462 11,076 3,722,678
RRS A 0 0 0 0 31,566,508 436,038 88,388 31,051,748 0 0 0 0
RHA B 46,849 937 254 0 52,026,822 727,418 147,213 57,179,188 125,742 1,647 209 0
Total 46,849 937 254 0 83,593,331 1,163,456 235,601 88,230,936 125,742 1,647 209 0
Note 1: Excludes Non-Service Recipient workload, admin allocation, medical compensation, interdepartmental expenses and standby hours. Note 2: The laboratories in the small facilities of all RHAs are reported under the Multi-functional Labs. Note 3: RRS A Zone 1 has Molecular Diagnostics, RHA B Zone 2 has Cytogenetics and Microbiology Level 3, and RHA B Zone 3 has Immunology. Note 4: Receipt and Dispatch workload is not distributed the same in all RHAs. Note 5: RRS A Zone 5 Cytopathology is combined with Anatomical Pathology; Receipt and Dispatch is combined with Specimen Procurement. Note 6: RHA B Zone 7 expenses for Receipt & Dispatch include all Microbiology. Note 7: In RHA B Zone 2, Radioimmunassay procedures (83,386) and workload (653,102) are now reported in Clinical Laboratory instead of Radiology. Note 8: Workload units are based on CIHI pre-2009 methodology.
May 2015 Section IV - Page 23

Section IV - Functional Centre Report2013/2014 Annual Report of Hospital Services
Table IV-5(b) - Clinical Laboratory - Distribution of Workload by Functional Centre and Source of Request - 2013/2014
Region
Inpatient Outpatient Referred In Total
Service Recipient Workload Units % Inpatient / Total Service
Recipient Workload
Quality Control & Calibration
Environmental Methods Development
Total
Other Technical Workload Units % Service Recipient
Workload / Total Workload
Total
RRS A Zone 1 2,897,089 5,004,462 2,843,872 10,745,423 27.0% 1,186,764 27,707 20,310 1,234,781 89.7% 11,980,204 RRS A Zone 4 1,103,749 2,616,174 670,805 4,390,728 25.1% 702,516 44,929 152 747,597 85.5% 5,138,325 RRS A Zone 5 717,773 2,213,572 235,212 3,166,557 22.7% 402,418 0 0 402,418 88.7% 3,568,975 RRS A Zone 6 1,832,681 6,931,616 688,092 9,452,389 19.4% 910,496 0 1,359 911,856 91.2% 10,364,244
RHA B Zone 1 3,161,009 7,295,596 1,869,064 12,325,669 25.6% 2,223,000 0 38,327 2,261,327 84.5% 14,586,996 RHA B Zone 2 3,550,093 7,180,948 6,166,167 16,897,208 21.0% 1,836,060 8,192 249,449 2,093,701 89.0% 18,990,909 RHA B Zone 3 2,389,736 8,179,402 6,316,971 16,886,109 14.2% 2,938,347 28,440 25,709 2,992,496 84.9% 19,878,605 RHA B Zone 7 798,784 1,943,146 445,356 3,187,286 25.1% 535,392 0 0 535,392 85.6% 3,722,678
6,551,292 16,765,824 4,437,981 3,202,194 72,636 21,821 RRS A 23.6% 89.4% 3,296,652 27,755,097 31,051,748
9,899,622 24,599,092 14,797,558 7,532,799 36,632 313,485 RHA B 20.1% 86.2% 7,882,916 49,296,272 57,179,188
Total 21.4% 87.3% 16,450,914 41,364,916 19,235,539 10,734,993 109,268 335,306 11,179,567 77,051,369 88,230,936
Note 1: Excludes Non-Service Recipient workload. Note 2: Some inpatient workload from a small facility that is performed at a regional facility from the same RHA is reported as "Referred In". Note 3: Some workload units under Methods Development are included in Quality Control and Calibration. Note 4: Workload units are based on CIHI pre-2009 methodology.
May 2015 Section IV - Page 24

2013/2014 Annual Report of Hospital Services Section IV - Functional Centre ReportTable IV-5(c) - Clinical Laboratory Indicators - 2013/2014
Region
Cost per Workload Unit
Workload Units per UPP Worked Hour
Anatomical Pathology
Cost per Workload Unit
Workload Units per UPP Worked Hour
Cytopathology
Cost per Workload Unit
Workload Units per UPP Worked Hour
Clinical Chemistry
Cost per Workload Unit
Workload Units per UPP Worked Hour
Clinical Hematology
Cost per Workload Unit
Workload Units per UPP Worked Hour
Immunology, Histocompatibility/Immunogenetics,
Diagnostic Genetics
RRS A Zone 1 1.00 76.21 0.89 78.28 1.03 125.09 0.68 106.19 2.78 51.71 RRS A Zone 4 1.01 59.44 1.00 51.41 1.06 110.44 0.94 72.61 0.00 0.00 RRS A Zone 5 0.65 79.07 1.75 23.73 1.38 68.24 0.82 80.01 0.00 0.00 RRS A Zone 6 0.73 107.71 1.12 49.15 1.13 108.79 1.18 51.11 0.00 0.00
RHA B Zone 1 0.54 139.91 1.09 41.79 0.96 132.32 0.78 99.46 0.00 0.00 RHA B Zone 2 1.09 63.43 1.00 44.18 1.00 116.59 0.96 74.47 1.79 71.77 RHA B Zone 3 0.67 112.97 1.24 37.61 0.84 122.73 0.87 94.70 2.11 94.05 RHA B Zone 7 0.96 83.02 1.48 27.75 1.07 113.44 0.97 63.60 0.00 0.00
RRS A 0.88 80.21 1.05 53.56 1.12 105.34 0.88 74.57 2.78 51.71
RHA B 0.74 98.40 1.11 40.52 0.94 121.86 0.88 84.29 1.89 77.58
0.79 92.26 1.09 0.99 44.66 116.51 Average 0.88 80.91 2.14 68.15
RHA Zone
Cost per Workload Unit
Workload Units per UPP Worked Hour
Stem Cell Transplant Lab Avg Cost per Workload Unit
Avg Workload Units per UPP Worked Hour
RRS A Zone 1 0.00 0.00 1.10 78.58 RRS A Zone 4 0.00 0.00 0.98 68.93 RRS A Zone 5 0.00 0.00 1.05 59.64 RRS A Zone 6 0.00 0.00 0.93 69.47
RHA B Zone 1 0.00 0.00 0.92 80.15 RHA B Zone 2 0.00 0.00 0.98 72.58 RHA B Zone 3 0.00 0.00 0.83 85.21 RHA B Zone 7 0.00 0.00 0.96 73.77
RRS A 1.02 71.21 0.00 0.00
RHA B 0.91 78.61 0.00 0.00
0.95 75.84 Average 0.00 0.00
Note 1: UPP Worked Hours include unit producing personnel worked and purchased service hours, and excludes Management and Operational Support and Medical personnel hours. Note 2: Excludes Non-Service Recipient workload. Note 3: The laboratories in small facilities are reported under the Multi-functional Labs. Note 4: RRS A Zone 1 has Molecular Diagnosis, RHA B Zone 2 has Cytogenetics and Microbiology level 3, and RHA B Zone 3 has Immunology. Note 5: Receipt and Dispatch workload is not distributed the same in all RHAs. Note 6: In RHA B Zone 2, Radioimmunassay procedures (83,386) and workload (653,102) are now reported in Clinical Laboratory instead of Radiology. Note 7: Workload units are based on CIHI pre-2009 methodology.
RegionCost per Workload
UnitWorkload Units per UPP Worked Hour
MicrobiologyCost per Workload
UnitWorkload Units per UPP Worked Hour
Pre/Post AnalysisCost per Workload
UnitWorkload Units per UPP Worked Hour
Transfusion MedicineCost per Workload
UnitWorkload Units per UPP Worked Hour
Multi-functional LabsCost per Workload
UnitWorkload Units per UPP Worked Hour
Electron Microscopy
RRS A Zone 1 0.96 103.01 2.05 31.51 1.08 69.77 0.83 73.68 0.00 0.00 RRS A Zone 4 0.76 89.90 1.06 31.56 1.59 46.53 1.01 66.57 0.00 0.00 RRS A Zone 5 1.05 68.84 1.11 28.36 1.63 42.72 0.60 101.75 0.00 0.00 RRS A Zone 6 1.13 62.79 0.64 62.28 1.28 91.80 0.81 65.02 0.00 0.00
RHA B Zone 1 1.09 75.70 1.21 37.43 1.45 45.97 1.06 55.48 0.00 0.00 RHA B Zone 2 1.10 67.10 0.45 74.10 1.79 40.36 1.45 49.17 0.00 0.00 RHA B Zone 3 0.89 91.12 0.75 49.13 1.62 44.82 0.72 82.39 0.00 0.00 RHA B Zone 7 0.00 0.00 0.80 58.41 0.84 81.78 0.00 0.00 0.00 0.00
RRS A 0.97 86.86 1.34 37.10 1.31 60.48 0.84 67.89 0.00 0.00
RHA B 1.03 76.25 0.71 55.41 1.55 45.54 0.84 73.39 0.00 0.00
1.00 81.08 Average 0.88 1.48 49.10 0.84 70.76 0.00 0.00 48.91
May 2015 Section IV - Page 25

2013/2014 Annual Report of Hospital Services Section IV - Functional Centre Report
Table IV-5(d) - Clinical Laboratory Percent of Total Workload by RHA - 2013/2014
Region
% of Total Workload
Anatomical Pathology
% of Total Workload
Cytopathology
% of Total Workload
Clinical Chemistry
% of Total Workload
Clinical Hematology
% of Total Workload
Immunology, Histocompatibility/
Immunogenetics, Diagnostic Genetics
% of Total Workload
Pre/Post Analysis
% of Total Workload
Transfusion Medicine
% of Total Workload
Microbiology
% of Total Workload
Multi-functional Labs
% of Total Workload
Total
RRS A Zone 1 10.5% 3.4% 20.5% 11.7% 2.2% 10.8% 2.7% 32.2% 6.1% 100.0% RRS A Zone 4 10.3% 3.4% 21.8% 11.7% 0.0% 7.1% 2.3% 18.9% 24.5% 100.0% RRS A Zone 5 8.1% 2.0% 25.4% 19.6% 0.0% 11.6% 4.1% 17.5% 11.8% 100.0% RRS A Zone 6 9.7% 3.4% 16.5% 9.4% 0.0% 10.0% 1.5% 12.0% 37.5% 100.0%
RHA B Zone 1 19.5% 3.0% 25.2% 17.8% 0.0% 11.9% 3.2% 14.4% 4.9% 100.0% RHA B Zone 2 10.0% 3.6% 27.1% 13.7% 2.5% 21.0% 3.8% 13.9% 4.4% 100.0% RHA B Zone 3 11.2% 2.3% 24.5% 9.1% 1.1% 8.6% 2.0% 11.5% 29.7% 100.0% RHA B Zone 7 12.0% 2.0% 33.3% 20.7% 0.0% 26.2% 5.8% 0.0% 0.0% 100.0%
9.9% RRS A 3.2% 19.9% 21.6% 100.0% 11.8% 0.8% 10.0% 2.4% 20.3%
13.0% RHA B 2.8% 26.1% 12.3% 100.0% 13.6% 1.2% 14.7% 3.2% 13.0%
Average 11.9% 3.0% 24.0% 15.6% 100.0% 13.0% 1.1% 13.1% 15.6% 2.9%
Note 1: Receipt and Dispatch workload is not distributed the same in all RHAs. Note 2: RRS A Zone 5 Cytopathology is combined with Anatomical Pathology; Receipt and Dispatch is combined with Specimen Procurement.
May 2015 Section IV - Page 26

2013/2014 Annual Report of Hospital Services Section IV - Functional Centre Report
Table IV-6(a): Diagnostic Imaging Expenses, UPP Worked Hours, UPP Benefit Hours, Workload Units and Exams/Procedures by Functional Centre - 2013/2014 - Page 1 of 2
Region
Expenses UPP Worked Hours
UPP Benefit Hours
Workload Units
Exams / Procedures
Radiography
Expenses UPP Worked Hours
UPP Benefit Hours
Workload Units
Exams / Procedures
Diagnostic Mammography
Expenses UPP Worked Hours
UPP Benefit Hours
Workload Units
Exams / Procedures
Interventional/Angiography
RRS A Zone 1 3,508,721 30,188 5,766 939,896 71,976 158,814 1,555 358 70,809 2,764 2,992,435 9,465 1,676 504,383 7,085 RRS A Zone 4 1,467,446 16,100 4,646 631,950 43,700 171,300 608 94 31,156 1,155 0 0 0 0 0 RRS A Zone 5 955,305 17,521 3,303 528,546 35,094 134,831 1,050 229 41,716 1,620 0 0 0 0 0 RRS A Zone 6 1,959,899 35,710 7,541 1,478,935 81,463 353,596 2,943 555 74,248 2,715 0 0 0 0 0
RHA B Zone 1 2,935,191 43,448 8,279 1,080,705 84,174 453,410 2,877 572 85,848 3,273 5,705,088 11,016 2,410 385,103 6,367 RHA B Zone 2 4,536,020 85,101 13,937 1,741,116 146,217 199,178 2,199 455 113,368 3,737 2,996,983 8,158 1,417 373,573 5,029 RHA B Zone 3 4,461,300 64,446 11,712 1,440,372 116,689 336,416 4,063 458 128,515 5,643 935,847 5,640 791 57,422 1,194 RHA B Zone 7 1,671,167 22,119 3,826 422,988 34,625 172,383 1,102 203 51,187 1,639 0 0 0 0 0
7,891,370 818,540 2,992,435 99,519 6,156 9,465 21,256 1,236 1,676 3,579,327 217,929 504,383 232,233 8,254 7,085 RRS A
13,603,677 1,161,388 9,637,918 215,114 10,242 24,814 37,754 1,689 4,618 4,685,181 378,918 816,098 381,705 14,292 12,590 RHA B21,495,047 1,979,927 12,630,353 314,633 16,398 34,279 59,010 2,924 6,294 8,264,508 596,847 1,320,481 613,938 22,546 19,675 Total
Region
Expenses UPP Worked Hours
UPP Benefit Hours
Workload Units
Exams / Procedures
Ultrasound
Expenses UPP Worked Hours
UPP Benefit Hours
Workload Units
Exams / Procedures
MRI
Expenses UPP Worked Hours
UPP Benefit Hours
Workload Units
Exams / Procedures
Combined Functions
RRS A Zone 1 716,676 10,164 1,890 617,315 19,788 900,546 6,858 1,897 581,594 9,252 552,005 7,297 968 226,681 19,569 RRS A Zone 4 302,513 3,223 1,858 240,872 6,409 532,115 1,805 188 118,475 2,667 330,708 4,310 1,388 133,809 6,413 RRS A Zone 5 405,765 5,565 1,030 309,994 9,011 196,940 1,547 34 61,470 1,477 0 0 0 0 0 RRS A Zone 6 512,893 7,232 2,816 388,663 11,883 840,069 3,792 1,095 118,602 2,883 393,747 5,909 1,657 159,052 7,714
RHA B Zone 1 701,975 9,324 1,239 443,553 11,134 1,085,052 10,499 1,864 377,038 9,259 458,708 8,036 770 186,685 13,369 RHA B Zone 2 1,212,312 19,400 3,488 854,670 25,554 1,020,335 6,699 2,442 279,735 7,954 0 0 0 0 0 RHA B Zone 3 1,103,179 16,343 4,097 879,870 26,351 731,411 9,105 1,368 212,890 6,252 0 0 0 0 0 RHA B Zone 7 339,643 5,066 971 211,425 6,105 528,656 5,108 459 98,403 2,247 0 0 0 0 0
RRS A 1,937,848 26,183 7,594 1,556,844 47,091 2,469,670 14,002 3,213 880,141 16,279 1,276,460 17,516 4,013 519,542 33,696
RHA B 3,357,109 50,133 9,795 2,389,518 69,144 3,365,454 31,411 6,133 968,066 25,712 458,708 8,036 770 186,685 13,369 5,294,957 76,316 17,389 3,946,362 116,235 5,835,124 45,412 9,346 1,848,207 41,991 1,735,168 25,552 4,783 706,227 47,065 Total
Note 1: Workload includes Technical Services Recipient and excludes Support, Transport. Starting 2010/11 Non-Service Recipient workload units are included. Note 2: Bone Densitometry may be reported in Nuclear Medicine or in Radiography. Note 3: Includes UPP benefit, worked and purchased hours. Excludes admin allocation, interdepartmental expenses, medical compensation, management and operational support and standby hours. Note 4: RRS A Zone 6 MRI expenses include the cost of transportation and maintenance of the MRI mobile unit for RRS A Zone 6. RRS A Zone 4 have had an MRI (magnetic resonance imaging) machine on site since November 2012, so the transportation and maintenance costs for the MRI trailer do not apply. Since November 2013 RRS A Zone 5 MRI expenses include the cost of transportation and maintenance of the MRI mobile unit for RRS A Zone 5 and RHA B Zone 3. Note 5: Breast screening in RHA B Zone 2 and 7 includes client teaching program. Note 6: Count of exams in certain modalities (e.g. MRI, CT) is inflated due to limited capabilities within the automated health information system. Note 7: This report excludes expenses and stats for RHA B Zone 2 Cardiac Catheterization Lab. Note 8: In 2010/11, RHA B Zone 3 Radiology expenses include service contracts from other modalities or other departments which may impact indicator results. Note 9: In RHA B Zone 7 and RRS A Zone 1, PACS expenses are reported under Radiology and under Research & Development in RRS A Zone 6. Note 10: In RHA B Zone 2, Radioimmunassay procedures (83,386) and workload (653,102) are now reported in Clinical Laboratory instead of Radiology.
May 2015 Section IV - Page 27

2013/2014 Annual Report of Hospital Services Section IV - Functional Centre Report
Table IV-6(a): Diagnostic Imaging Expenses, UPP Worked Hours, UPP Benefit Hours, Workload Units and Exams/Procedures by Functional Centre - 2013/2014 - Page 2 of 2
Region
Expenses UPP Worked Hours
UPP Benefit Hours
Workload Units
Exams / Procedures
Computed Tomography
Expenses UPP Worked Hours
UPP Benefit Hours
Workload Units
Exams / Procedures
Nuclear Medicine
Expenses UPP Worked Hours
UPP Benefit Hours
Workload Units
Exams / Procedures
PET Scan
RRS A Zone 1 1,051,933 7,821 1,819 510,822 16,140 1,243,555 8,268 1,654 302,629 6,484 547,512 1,388 230 94,548 610 RRS A Zone 4 493,667 4,908 1,008 266,206 9,740 898,620 4,890 1,216 348,625 5,041 0 0 0 0 0 RRS A Zone 5 719,224 3,943 1,202 399,763 15,764 0 0 0 0 0 0 0 0 0 0 RRS A Zone 6 981,072 12,933 1,872 437,592 12,970 1,396,870 7,931 1,906 596,338 10,426 0 0 0 0 0
RHA B Zone 1 1,427,752 13,481 1,902 534,891 20,255 1,010,189 9,487 1,438 596,086 5,092 0 0 0 0 0 RHA B Zone 2 1,661,834 15,656 3,273 576,791 23,703 1,124,462 10,569 2,461 517,214 4,277 751,387 2,818 368 166,674 647 RHA B Zone 3 1,761,867 15,903 2,904 624,321 27,767 1,049,754 7,590 1,368 234,079 5,358 0 0 0 0 0 RHA B Zone 7 512,006 4,255 645 251,170 10,325 0 0 0 0 0 0 0 0 0 0
3,245,897 3,539,045 547,512 29,605 21,090 1,388 5,901 4,776 230 1,614,383 1,247,592 94,548 54,614 21,951 610 RRS A
5,363,459 3,184,405 751,387 49,295 27,646 2,818 8,724 5,267 368 1,987,173 1,347,379 166,674 82,050 14,727 647 RHA B8,609,356 6,723,449 1,298,899 78,900 48,736 4,206 14,625 10,043 598 3,601,556 2,594,971 261,222 136,664 36,678 1,257 Total
Region
Expenses UPP Worked Hours
UPP Benefit Hours
Workload Units
Exams / Procedures
Breast Screening
Expenses UPP Worked Hours
UPP Benefit Hours
Workload Units
Exams / Procedures
Total
RRS A Zone 1 360,893 1,705 512 110,948 5,952 12,033,089 84,709 16,770 3,959,625 159,620 RRS A Zone 4 109,024 976 119 56,538 2,881 4,305,393 36,819 10,516 1,827,631 78,006 RRS A Zone 5 149,613 965 45 31,422 1,534 2,561,678 30,591 5,843 1,372,911 64,500 RRS A Zone 6 173,522 2,681 242 90,092 5,955 6,611,668 79,131 17,683 3,343,522 136,009
RHA B Zone 1 460,412 4,940 987 178,856 10,714 14,237,777 113,108 19,461 3,868,765 163,637 RHA B Zone 2 806,042 6,571 1,334 164,331 8,175 14,308,553 157,171 29,175 4,787,472 225,293 RHA B Zone 3 553,509 5,942 579 146,245 9,749 10,933,282 129,032 23,277 3,723,714 199,003 RHA B Zone 7 367,071 3,493 479 79,485 4,341 3,590,926 41,143 6,584 1,114,658 59,282
RRS A 793,053 6,327 918 289,000 16,322 25,511,829 231,250 50,813 10,503,689 438,135
RHA B 2,187,034 20,946 3,379 568,917 32,979 43,070,538 440,454 78,497 13,494,609 647,2152,980,087 27,273 4,297 857,917 49,301 Total 68,582,368 671,704 129,309 23,998,298 1,085,350
Note 1: Workload includes Technical Services Recipient and excludes Support, Transport. Starting 2010/11 Non-Service Recipient workload units are included. Note 2: Bone Densitometry may be reported in Nuclear Medicine or in Radiography. Note 3: Includes UPP benefit, worked and purchased hours. Excludes admin allocation, interdepartmental expenses, medical compensation, management and operational support and standby hours. Note 4: RRS A Zone 6 MRI expenses include the cost of transportation and maintenance of the MRI mobile unit for RRS A Zone 6. RRS A Zone 4 have had an MRI (magnetic resonance imaging) machine on site since November 2012, so the transportation and maintenance costs for the MRI trailer do not apply. Since November 2013 RRS A Zone 5 MRI expenses include the cost of transportation and maintenance of the MRI mobile unit for RRS A Zone 5 and RHA B Zone 3. Note 5: Breast screening in RHA B Zone 2 and 7 includes client teaching program. Note 6: Count of exams in certain modalities (e.g. MRI, CT) is inflated due to limited capabilities within the automated health information system. Note 7: This report excludes expenses and stats for RHA B Zone 2 Cardiac Catheterization Lab. Note 8: In 2010/11, RHA B Zone 3 Radiology expenses include service contracts from other modalities or other departments which may impact indicator results. Note 9: In RHA B Zone 7 and RRS A Zone 1, PACS expenses are reported under Radiology and under Research & Development in RRS A Zone 6. Note 10: In RHA B Zone 2, Radioimmunassay procedures (83,386) and workload (653,102) are now reported in Clinical Laboratory instead of Radiology.
May 2015 Section IV - Page 28

2013/2014 Annual Report of Hospital Services Section IV - Functional Centre Report
Table IV-6(b): Diagnostic Imaging Distribution of Workload and Exams by Source of Request - 2013/2014
Region Inpatient Workload Units
Outpatient Workload Units
Non-Service Recipient Workload Units
Total Workload Units % Inpatient of Total Workload Units
RRS A Zone 1 712,440 2,825,265 421,920 3,959,625 18.0%RRS A Zone 4 241,784 1,378,817 207,030 1,827,631 13.2%RRS A Zone 5 179,698 996,584 196,629 1,372,911 13.1%RRS A Zone 6 323,859 2,158,342 861,321 3,343,522 9.7%
RHA B Zone 1 713,661 2,645,468 509,636 3,868,765 18.4%RHA B Zone 2 890,146 3,585,698 311,628 4,787,472 18.6%RHA B Zone 3 655,893 3,067,726 95 3,723,714 17.6%RHA B Zone 7 168,978 844,220 101,460 1,114,658 15.2%
RRS A 1,457,781 7,359,008 10,503,689 13.9%1,686,900
RHA B 2,428,678 10,143,112 13,494,609 18.0%922,819
3,886,459 17,502,120 Total 16.2%23,998,298 2,609,719
Region Inpatient Exams / Procedures Outpatient Exams / Procedures
Total Exams / Procedures % Inpatient Exams / Procedures
RRS A Zone 1 29,390 130,230 159,620 18.4%RRS A Zone 4 9,680 68,326 78,006 12.4%RRS A Zone 5 7,242 57,258 64,500 11.2%RRS A Zone 6 17,518 118,491 136,009 12.9%
RHA B Zone 1 23,173 140,464 163,637 14.2%RHA B Zone 2 34,030 191,263 225,293 15.1%RHA B Zone 3 28,379 170,624 199,003 14.3%RHA B Zone 7 8,920 50,362 59,282 15.0%
RRS A 63,830 374,305 438,135 14.6%
RHA B 94,502 552,713 647,215 14.6%
Total 1,085,350 158,332 927,018 14.6%
Note 1: Workload includes Technical Services Recipient and excludes Support, Transport. Starting 2010/11 Non-Service Recipient workload units are included. Note 2: In RRS A Zone 1 Interventional Angiography includes the workload for 1 tech but the worked hrs for 3 technologists.
May 2015 Section IV - Page 29
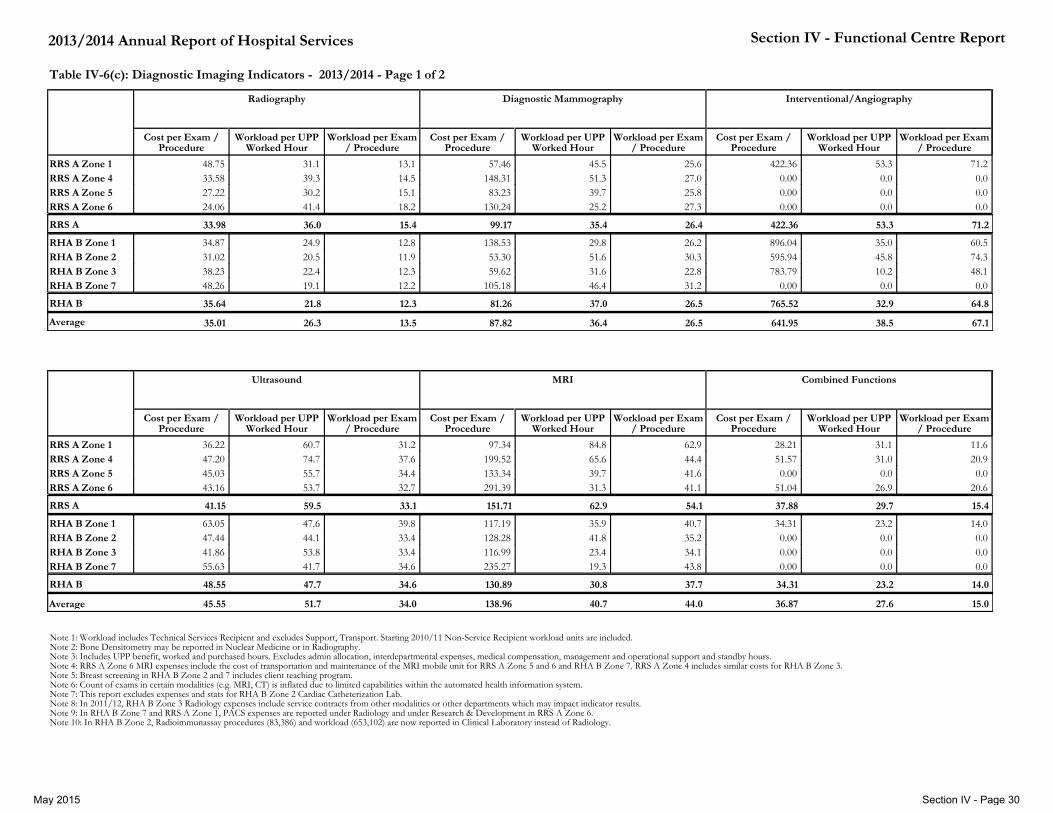
2013/2014 Annual Report of Hospital Services Section IV - Functional Centre Report
Region
Cost per Exam / Procedure
Workload per UPP Worked Hour
Workload per Exam / Procedure
Radiography
Cost per Exam / Procedure
Workload per UPP Worked Hour
Workload per Exam / Procedure
Diagnostic Mammography
Cost per Exam / Procedure
Workload per UPP Worked Hour
Workload per Exam / Procedure
Interventional/Angiography
RRS A Zone 1 48.75 31.1 13.1 57.46 45.5 25.6 422.36 53.3 71.2 RRS A Zone 4 33.58 39.3 14.5 148.31 51.3 27.0 0.00 0.0 0.0 RRS A Zone 5 27.22 30.2 15.1 83.23 39.7 25.8 0.00 0.0 0.0 RRS A Zone 6 24.06 41.4 18.2 130.24 25.2 27.3 0.00 0.0 0.0
RHA B Zone 1 34.87 24.9 12.8 138.53 29.8 26.2 896.04 35.0 60.5 RHA B Zone 2 31.02 20.5 11.9 53.30 51.6 30.3 595.94 45.8 74.3 RHA B Zone 3 38.23 22.4 12.3 59.62 31.6 22.8 783.79 10.2 48.1 RHA B Zone 7 48.26 19.1 12.2 105.18 46.4 31.2 0.00 0.0 0.0
RRS A 33.98 36.0 15.4 99.17 35.4 26.4 422.36 53.3 71.2
RHA B 35.64 21.8 12.3 81.26 37.0 26.5 765.52 32.9 64.8
Average 35.01 26.3 13.5 87.82 36.4 26.5 641.95 38.5 67.1
Region
Cost per Exam / Procedure
Workload per UPP Worked Hour
Workload per Exam / Procedure
Ultrasound
Cost per Exam / Procedure
Workload per UPP Worked Hour
Workload per Exam / Procedure
MRI
Cost per Exam / Procedure
Workload per UPP Worked Hour
Workload per Exam / Procedure
Combined Functions
RRS A Zone 1 36.22 60.7 31.2 97.34 84.8 62.9 28.21 31.1 11.6 RRS A Zone 4 47.20 74.7 37.6 199.52 65.6 44.4 51.57 31.0 20.9 RRS A Zone 5 45.03 55.7 34.4 133.34 39.7 41.6 0.00 0.0 0.0 RRS A Zone 6 43.16 53.7 32.7 291.39 31.3 41.1 51.04 26.9 20.6
RHA B Zone 1 63.05 47.6 39.8 117.19 35.9 40.7 34.31 23.2 14.0 RHA B Zone 2 47.44 44.1 33.4 128.28 41.8 35.2 0.00 0.0 0.0 RHA B Zone 3 41.86 53.8 33.4 116.99 23.4 34.1 0.00 0.0 0.0 RHA B Zone 7 55.63 41.7 34.6 235.27 19.3 43.8 0.00 0.0 0.0
RRS A 41.15 59.5 33.1 151.71 62.9 54.1 37.88 29.7 15.4
RHA B 48.55 47.7 34.6 130.89 30.8 37.7 34.31 23.2 14.0
Average 138.96 36.87 40.7 27.6 44.0 15.0 51.7 34.0 45.55
Table IV-6(c): Diagnostic Imaging Indicators - 2013/2014 - Page 1 of 2
Note 1: Workload includes Technical Services Recipient and excludes Support, Transport. Starting 2010/11 Non-Service Recipient workload units are included. Note 2: Bone Densitometry may be reported in Nuclear Medicine or in Radiography. Note 3: Includes UPP benefit, worked and purchased hours. Excludes admin allocation, interdepartmental expenses, medical compensation, management and operational support and standby hours. Note 4: RRS A Zone 6 MRI expenses include the cost of transportation and maintenance of the MRI mobile unit for RRS A Zone 5 and 6 and RHA B Zone 7. RRS A Zone 4 includes similar costs for RHA B Zone 3. Note 5: Breast screening in RHA B Zone 2 and 7 includes client teaching program. Note 6: Count of exams in certain modalities (e.g. MRI, CT) is inflated due to limited capabilities within the automated health information system. Note 7: This report excludes expenses and stats for RHA B Zone 2 Cardiac Catheterization Lab. Note 8: In 2011/12, RHA B Zone 3 Radiology expenses include service contracts from other modalities or other departments which may impact indicator results. Note 9: In RHA B Zone 7 and RRS A Zone 1, PACS expenses are reported under Radiology and under Research & Development in RRS A Zone 6. Note 10: In RHA B Zone 2, Radioimmunassay procedures (83,386) and workload (653,102) are now reported in Clinical Laboratory instead of Radiology.
May 2015 Section IV - Page 30

2013/2014 Annual Report of Hospital Services Section IV - Functional Centre Report
Region
Cost per Exam / Procedure
Workload per UPP Worked Hour
Workload per Exam / Procedure
Computed Tomography
Cost per Exam / Procedure
Workload per UPP Worked Hour
Workload per Exam / Procedure
Nuclear Medicine
Cost per Exam / Procedure
Workload per UPP Worked Hour
Workload per Exam / Procedure
PET Scan
RRS A Zone 1 65.18 65.3 31.6 191.79 36.6 46.7 897.56 68.1 155.0 RRS A Zone 4 50.68 54.2 27.3 178.26 71.3 69.2 0.00 0.0 0.0 RRS A Zone 5 45.62 101.4 25.4 0.00 0.0 0.0 0.00 0.0 0.0 RRS A Zone 6 75.64 33.8 33.7 133.98 75.2 57.2 0.00 0.0 0.0
RHA B Zone 1 70.49 39.7 26.4 198.39 62.8 117.1 0.00 0.0 0.0 RHA B Zone 2 70.11 36.8 24.3 262.91 48.9 120.9 1,161.34 59.1 257.6 RHA B Zone 3 63.45 39.3 22.5 195.92 30.8 43.7 0.00 0.0 0.0 RHA B Zone 7 49.59 59.0 24.3 0.00 0.0 0.0 0.00 0.0 0.0
RRS A 59.43 54.5 29.6 161.22 59.2 56.8 897.56 68.1 155.0
RHA B 65.37 40.3 24.2 216.23 48.7 91.5 1,161.34 59.1 257.6
Average 63.00 183.31 45.6 53.2 26.4 70.8 1,033.33 62.1 207.8
Region
Cost per Exam / Procedure
Workload per UPP Worked Hour
Workload per Exam / Procedure
Breast Screening Total Cost per Exam / Procedure
Total Workload per UPP Worked Hour
Total Workload per Exam / Procedure
RRS A Zone 1 60.63 65.1 18.6 75.39 46.7 24.8 RRS A Zone 4 37.84 57.9 19.6 55.19 49.6 23.4 RRS A Zone 5 97.53 32.6 20.5 39.72 44.9 21.3 RRS A Zone 6 29.14 33.6 15.1 48.61 42.3 24.6
RHA B Zone 1 42.97 36.2 16.7 87.01 34.2 23.6 RHA B Zone 2 98.60 25.0 20.1 63.51 30.5 21.2 RHA B Zone 3 56.78 24.6 15.0 54.94 28.9 18.7 RHA B Zone 7 84.56 22.8 18.3 60.57 27.1 18.8
RRS A 48.59 45.7 17.7 58.23 45.4 24.0
RHA B 66.32 27.2 17.3 66.55 30.6 20.9
Average 60.45 31.5 17.4 22.1 35.7 63.19
Table IV-6(c): Diagnostic Imaging Indicators - 2013/2014 - Page 2 of 2
Note 1: Workload includes Technical Services Recipient and excludes Support, Transport. Starting 2010/11 Non-Service Recipient workload units are included. Note 2: Bone Densitometry may be reported in Nuclear Medicine or in Radiography. Note 3: Includes UPP benefit, worked and purchased hours. Excludes admin allocation, interdepartmental expenses, medical compensation, management and operational support and standby hours. Note 4: RRS A Zone 6 MRI expenses include the cost of transportation and maintenance of the MRI mobile unit for RRS A Zone 5 and 6 and RHA B Zone 7. RRS A Zone 4 includes similar costs for RHA B Zone 3. Note 5: Breast screening in RHA B Zone 2 and 7 includes client teaching program. Note 6: Count of exams in certain modalities (e.g. MRI, CT) is inflated due to limited capabilities within the automated health information system. Note 7: This report excludes expenses and stats for RHA B Zone 2 Cardiac Catheterization Lab. Note 8: In 2011/12, RHA B Zone 3 Radiology expenses include service contracts from other modalities or other departments which may impact indicator results. Note 9: In RHA B Zone 7 and RRS A Zone 1, PACS expenses are reported under Radiology and under Research & Development in RRS A Zone 6. Note 10: In RHA B Zone 2, Radioimmunassay procedures (83,386) and workload (653,102) are now reported in Clinical Laboratory instead of Radiology.
May 2015 Section IV - Page 31

2013/2014 Annaul Report of Hospital Services Section IV - Functional Centre Report
Region
Service Provider
Productivity %
Total Productivity %
Ultrasound
Service Provider
Productivity %
Total Productivity %
Radiography
Service Provider
Productivity %
Total Productivity %
PET Scan
Service Provider
Productivity %
Total Productivity %
Nuclear Medicine
Service Provider
Productivity %
Total Productivity %
MRI
Service Provider
Productivity %
Total Productivity %
Interventional/Angiography
RRS A Zone 1 96.4% 101.2% 48.0% 51.9% 87.6% 113.5% 52.0% 61.0% 128.7% 141.3% 69.1% 88.8% RRS A Zone 4 117.5% 124.6% 58.7% 65.4% 0.0% 0.0% 104.5% 118.8% 106.8% 109.4% 0.0% 0.0% RRS A Zone 5 86.3% 92.8% 41.5% 50.3% 0.0% 0.0% 0.0% 0.0% 53.3% 66.2% 0.0% 0.0% RRS A Zone 6 85.5% 89.6% 44.9% 69.0% 0.0% 0.0% 96.1% 125.3% 46.4% 52.1% 0.0% 0.0%
RHA B Zone 1 73.1% 79.3% 37.5% 41.5% 0.0% 0.0% 74.8% 104.7% 52.5% 59.9% 54.4% 58.3% RHA B Zone 2 73.4% 73.4% 34.1% 34.1% 58.5% 98.6% 43.1% 81.6% 69.6% 69.6% 76.3% 76.3% RHA B Zone 3 89.7% 89.7% 37.2% 37.3% 0.0% 0.0% 51.4% 51.4% 39.0% 39.0% 17.0% 17.0% RHA B Zone 7 65.7% 69.6% 29.5% 31.9% 0.0% 0.0% 0.0% 0.0% 27.8% 32.1% 0.0% 0.0%
RRS A 69.1% 88.8% 95.2% 104.8% 80.8% 98.6% 87.6% 113.5% 47.5% 59.9% 93.8% 99.1%
RHA B 53.1% 54.8% 48.2% 51.4% 56.3% 81.2% 58.5% 98.6% 35.3% 36.3% 77.9% 79.4%
Total 57.5% 64.2% 62.7% 67.8% 66.9% 88.7% 68.1% 103.5% 39.1% 43.8% 83.4% 86.2%
Table IV-6(d): Diagnostic Imaging Productivity Percentage - 2013/2014
Region
Service Provider
Productivity %
Total Productivity %
Diagnostic Mammography
Service Provider
Productivity %
Total Productivity %
Computed Tomography
Service Provider
Productivity %
Total Productivity %
Combined Functions
Service Provider
Productivity %
Total Productivity %
Breast Screening Overall Service Provider
Productivity %
Overall Total Productivity %
RRS A Zone 1 62.5% 75.9% 101.0% 108.9% 46.7% 51.8% 90.1% 108.5% 69.6% 77.9% RRS A Zone 4 72.0% 85.5% 82.2% 90.4% 35.1% 51.7% 77.2% 96.6% 73.4% 82.7% RRS A Zone 5 49.7% 66.2% 147.1% 169.0% 0.0% 0.0% 39.7% 54.3% 64.1% 74.8% RRS A Zone 6 29.6% 42.0% 41.7% 56.4% 34.0% 44.9% 56.0% 56.0% 52.3% 70.4%
RHA B Zone 1 39.7% 49.7% 62.4% 66.1% 27.6% 38.7% 50.6% 60.3% 49.5% 57.0% RHA B Zone 2 85.9% 85.9% 61.4% 61.4% 0.0% 0.0% 41.7% 41.7% 47.5% 50.8% RHA B Zone 3 52.7% 52.7% 65.4% 65.4% 0.0% 0.0% 41.0% 41.0% 48.1% 48.1% RHA B Zone 7 57.2% 77.4% 91.2% 98.4% 0.0% 0.0% 31.1% 37.9% 41.0% 45.2%
RRS A 66.0% 76.1% 39.5% 49.4% 78.1% 90.9% 45.5% 59.0% 63.5% 75.7%
RHA B 41.8% 45.3% 27.6% 38.7% 65.5% 67.2% 56.7% 61.7% 47.6% 51.1%
Total 47.4% 52.4% 35.8% 46.1% 70.3% 76.1% 52.5% 60.7% 53.1% 59.5%
May 2015 Section IV - Page 32
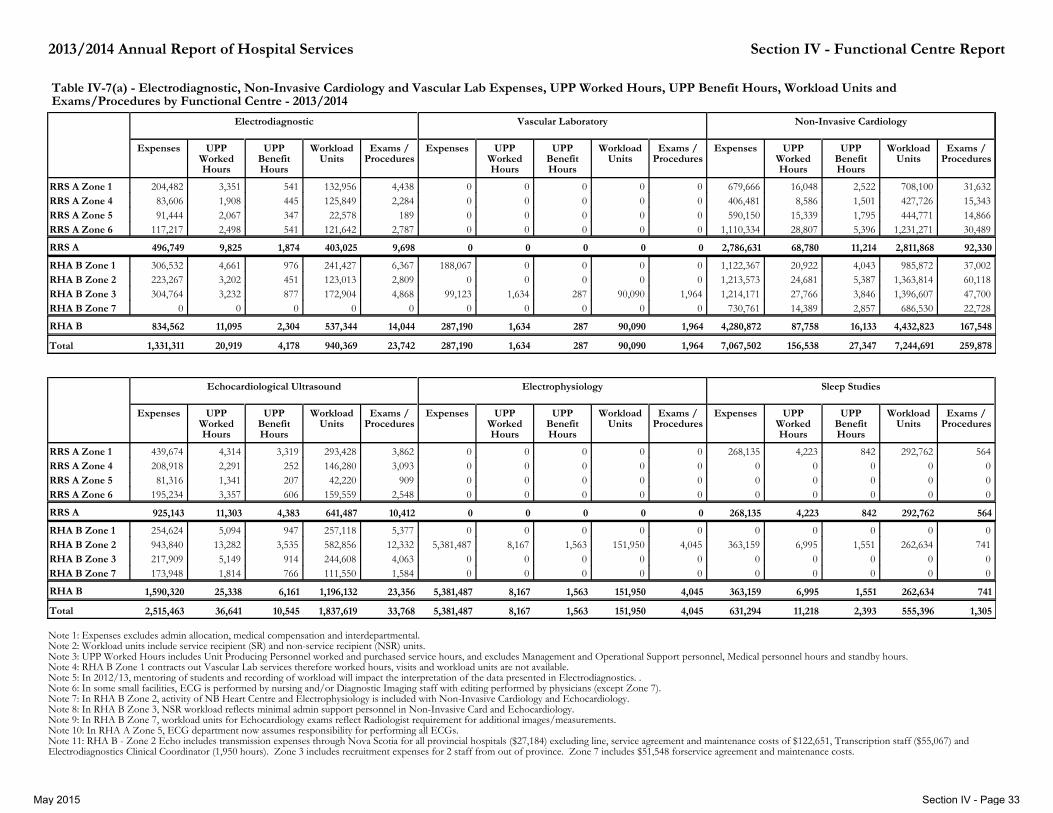
2013/2014 Annual Report of Hospital Services Section IV - Functional Centre Report
Table IV-7(a) - Electrodiagnostic, Non-Invasive Cardiology and Vascular Lab Expenses, UPP Worked Hours, UPP Benefit Hours, Workload Units and Exams/Procedures by Functional Centre - 2013/2014
Region
Expenses UPP Worked Hours
UPP Benefit Hours
Workload Units
Exams / Procedures
Electrodiagnostic
Expenses UPP Worked Hours
UPP Benefit Hours
Workload Units
Exams / Procedures
Vascular Laboratory
Expenses UPP Worked Hours
UPP Benefit Hours
Workload Units
Exams / Procedures
Non-Invasive Cardiology
RRS A Zone 1 204,482 3,351 541 132,956 4,438 0 0 0 0 0 679,666 16,048 2,522 708,100 31,632 RRS A Zone 4 83,606 1,908 445 125,849 2,284 0 0 0 0 0 406,481 8,586 1,501 427,726 15,343 RRS A Zone 5 91,444 2,067 347 22,578 189 0 0 0 0 0 590,150 15,339 1,795 444,771 14,866 RRS A Zone 6 117,217 2,498 541 121,642 2,787 0 0 0 0 0 1,110,334 28,807 5,396 1,231,271 30,489
RHA B Zone 1 306,532 4,661 976 241,427 6,367 188,067 0 0 0 0 1,122,367 20,922 4,043 985,872 37,002 RHA B Zone 2 223,267 3,202 451 123,013 2,809 0 0 0 0 0 1,213,573 24,681 5,387 1,363,814 60,118 RHA B Zone 3 304,764 3,232 877 172,904 4,868 99,123 1,634 287 90,090 1,964 1,214,171 27,766 3,846 1,396,607 47,700 RHA B Zone 7 0 0 0 0 0 0 0 0 0 0 730,761 14,389 2,857 686,530 22,728
RRS A 496,749 2,786,631 9,825 68,780 1,874 11,214 403,025 2,811,868 0 0 0 0 9,698 0 92,330
RHA B 834,562 4,280,872 11,095 87,758 2,304 16,133 537,344 4,432,823 287,190 1,634 287 90,090 14,044 1,964 167,548
Total 1,331,311 7,067,502 20,919 156,538 4,178 27,347 940,369 7,244,691 23,742 259,878 1,964 90,090 287 1,634 287,190
Region
Expenses UPP Worked Hours
UPP Benefit Hours
Workload Units
Exams / Procedures
Echocardiological Ultrasound
Expenses UPP Worked Hours
UPP Benefit Hours
Workload Units
Exams / Procedures
Electrophysiology
Expenses UPP Worked Hours
UPP Benefit Hours
Workload Units
Exams / Procedures
Sleep Studies
RRS A Zone 1 439,674 4,314 3,319 293,428 3,862 0 0 0 0 0 268,135 4,223 842 292,762 564 RRS A Zone 4 208,918 2,291 252 146,280 3,093 0 0 0 0 0 0 0 0 0 0 RRS A Zone 5 81,316 1,341 207 42,220 909 0 0 0 0 0 0 0 0 0 0 RRS A Zone 6 195,234 3,357 606 159,559 2,548 0 0 0 0 0 0 0 0 0 0
RHA B Zone 1 254,624 5,094 947 257,118 5,377 0 0 0 0 0 0 0 0 0 0 RHA B Zone 2 943,840 13,282 3,535 582,856 12,332 5,381,487 8,167 1,563 151,950 4,045 363,159 6,995 1,551 262,634 741 RHA B Zone 3 217,909 5,149 914 244,608 4,063 0 0 0 0 0 0 0 0 0 0 RHA B Zone 7 173,948 1,814 766 111,550 1,584 0 0 0 0 0 0 0 0 0 0
RRS A 925,143 11,303 4,383 641,487 10,412 0 0 0 0 0 268,135 4,223 842 292,762 564
RHA B 1,590,320 25,338 6,161 1,196,132 23,356 5,381,487 8,167 1,563 151,950 4,045 363,159 6,995 1,551 262,634 741
Total 2,515,463 36,641 10,545 1,837,619 33,768 5,381,487 8,167 1,563 151,950 4,045 631,294 11,218 2,393 555,396 1,305
Note 1: Expenses excludes admin allocation, medical compensation and interdepartmental. Note 2: Workload units include service recipient (SR) and non-service recipient (NSR) units. Note 3: UPP Worked Hours includes Unit Producing Personnel worked and purchased service hours, and excludes Management and Operational Support personnel, Medical personnel hours and standby hours. Note 4: RHA B Zone 1 contracts out Vascular Lab services therefore worked hours, visits and workload units are not available. Note 5: In 2012/13, mentoring of students and recording of workload will impact the interpretation of the data presented in Electrodiagnostics. . Note 6: In some small facilities, ECG is performed by nursing and/or Diagnostic Imaging staff with editing performed by physicians (except Zone 7). Note 7: In RHA B Zone 2, activity of NB Heart Centre and Electrophysiology is included with Non-Invasive Cardiology and Echocardiology. Note 8: In RHA B Zone 3, NSR workload reflects minimal admin support personnel in Non-Invasive Card and Echocardiology. Note 9: In RHA B Zone 7, workload units for Echocardiology exams reflect Radiologist requirement for additional images/measurements. Note 10: In RHA A Zone 5, ECG department now assumes responsibility for performing all ECGs. Note 11: RHA B - Zone 2 Echo includes transmission expenses through Nova Scotia for all provincial hospitals ($27,184) excluding line, service agreement and maintenance costs of $122,651, Transcription staff ($55,067) and Electrodiagnostics Clinical Coordinator (1,950 hours). Zone 3 includes recruitment expenses for 2 staff from out of province. Zone 7 includes $51,548 forservice agreement and maintenance costs.
May 2015 Section IV - Page 33

2013/2014 Annual Report of Hospital Services Section IV - Functional Centre Report
Table IV-7(a) - Electrodiagnostic, Non-Invasive Cardiology and Vascular Lab Expenses, UPP Worked Hours, UPP Benefit Hours, Workload Units and Exams/Procedures by Functional Centre - 2013/2014
Region
Expenses UPP Worked Hours
UPP Benefit Hours
Workload Units Exams / Procedures
Total
RRS A Zone 1 1,591,957 27,936 7,224 1,427,246 40,496 RRS A Zone 4 699,005 12,785 2,198 699,855 20,720 RRS A Zone 5 762,910 18,748 2,349 509,569 15,964 RRS A Zone 6 1,422,785 34,663 6,543 1,512,472 35,824
RHA B Zone 1 1,871,589 30,676 5,965 1,484,417 48,746 RHA B Zone 2 8,125,326 56,327 12,487 2,484,267 80,045 RHA B Zone 3 1,835,966 37,781 5,924 1,904,209 58,595 RHA B Zone 7 904,709 16,203 3,623 798,080 24,312
RRS A 4,476,657 94,131 18,314 4,149,142 113,004
RHA B 12,737,591 140,987 27,999 6,670,973 211,698
Total 17,214,248 235,118 46,313 10,820,115 324,702
Note 1: Expenses excludes admin allocation, medical compensation and interdepartmental. Note 2: Workload units include service recipient (SR) and non-service recipient (NSR) units. Note 3: UPP Worked Hours includes Unit Producing Personnel worked and purchased service hours, and excludes Management and Operational Support personnel, Medical personnel hours and standby hours. Note 4: RHA B Zone 1 contracts out Vascular Lab services therefore worked hours, visits and workload units are not available. Note 5: In 2012/13, mentoring of students and recording of workload will impact the interpretation of the data presented in Electrodiagnostics. . Note 6: In some small facilities, ECG is performed by nursing and/or Diagnostic Imaging staff with editing performed by physicians (except Zone 7). Note 7: In RHA B Zone 2, activity of NB Heart Centre and Electrophysiology is included with Non-Invasive Cardiology and Echocardiology. Note 8: In RHA B Zone 3, NSR workload reflects minimal admin support personnel in Non-Invasive Card and Echocardiology. Note 9: In RHA B Zone 7, workload units for Echocardiology exams reflect Radiologist requirement for additional images/measurements. Note 10: In RHA A Zone 5, ECG department now assumes responsibility for performing all ECGs. Note 11: RHA B - Zone 2 Echo includes transmission expenses through Nova Scotia for all provincial hospitals ($27,184) excluding line, service agreement and maintenance costs of $122,651, Transcription staff ($55,067) and Electrodiagnostics Clinical Coordinator (1,950 hours). Zone 3 includes recruitment expenses for 2 staff from out of province. Zone 7 includes $51,548 forservice agreement and maintenance costs.
May 2015 Section IV - Page 34

2013/2014 Annual Report of Hospital Services Section IV - Functional Centre Report
Table IV-7(b) - Electrodiagnostic, Non-Invasive Cardiology and Vascular Lab Workload Units by Functional Centre - 2013/2014
Region
SR Workload Units NSR Workload Units
Workload Units
Electrodiagnostic
SR Workload Units NSR Workload Units
Workload Units
Vascular Laboratory
SR Workload Units NSR Workload Units
Workload Units
Non-Invasive Cardiology
RRS A Zone 1 127,734 5,222 132,956 0 0 0 661,957 46,143 708,100 RRS A Zone 4 104,884 20,965 125,849 0 0 0 380,142 47,584 427,726 RRS A Zone 5 15,702 6,876 22,578 0 0 0 356,470 88,301 444,771 RRS A Zone 6 109,052 12,590 121,642 0 0 0 779,985 451,286 1,231,271
RHA B Zone 1 209,718 31,709 241,427 0 0 0 869,435 116,437 985,872 RHA B Zone 2 91,146 31,867 123,013 0 0 0 1,113,791 250,023 1,363,814 RHA B Zone 3 153,467 19,437 172,904 57,330 32,760 90,090 973,639 422,968 1,396,607 RHA B Zone 7 0 0 0 0 0 0 573,147 113,383 686,530
357,372 2,178,554 45,653 633,314 403,025 2,811,868 RRS A 0 0 0
454,331 3,530,012 83,013 902,811 537,344 4,432,823 RHA B 57,330 32,760 90,090
Total 811,703 5,708,566 128,666 1,536,125 940,369 7,244,691 57,330 32,760 90,090
Region
SR Workload Units
NSR Workload Units
Workload Units
Echocardiological Ultrasound
SR Workload Units
NSR Workload Units
Workload Units
Electrophysiology
SR Workload Units
NSR Workload Units
Workload Units
Sleep Studies
SR Workload Units
NSR Workload Units
Workload Units
Total
RRS A Zone 1 215,409 78,019 293,428 0 0 0 260,262 32,500 292,762 1,265,362 161,884 1,427,246 RRS A Zone 4 134,580 11,700 146,280 0 0 0 0 0 0 619,606 80,249 699,855 RRS A Zone 5 30,234 11,986 42,220 0 0 0 0 0 0 402,406 107,163 509,569 RRS A Zone 6 144,872 14,687 159,559 0 0 0 0 0 0 1,033,909 478,563 1,512,472
RHA B Zone 1 226,968 30,150 257,118 0 0 0 0 0 0 1,306,121 178,296 1,484,417 RHA B Zone 2 467,819 115,037 582,856 127,284 24,666 151,950 213,743 48,891 262,634 2,013,783 470,484 2,484,267 RHA B Zone 3 185,206 59,402 244,608 0 0 0 0 0 0 1,369,642 534,567 1,904,209 RHA B Zone 7 77,854 33,696 111,550 0 0 0 0 0 0 651,001 147,079 798,080
RRS A 525,095 116,392 641,487 0 0 0 260,262 32,500 292,762 3,321,283 827,859 4,149,142
RHA B 957,847 238,285 1,196,132 127,284 24,666 151,950 213,743 48,891 262,634 5,340,547 1,330,426 6,670,973
Total 1,482,942 354,677 1,837,619 127,284 24,666 151,950 474,005 81,391 555,396 8,661,830 2,158,285 10,820,115
Note 1: Expenses excludes admin allocation, medical compensation and interdepartmental. Note 2: Workload units include service recipient (SR) and non-service recipient (NSR) units. Note 3: UPP Worked Hours includes Unit Producing Personnel worked and purchased service hours, and excludes Management and Operational Support personnel, Medical personnel hours and standby hours. Note 4: RHA B Zone 1 contracts out Vascular Lab services therefore worked hours, visits and workload units are not available. Note 5: In 2012/13, mentoring of students and recording of workload will impact the interpretation of the data presented in Electrodiagnostics. Note 6: In some small facilities, ECG is performed by nursing and/or Diagnostic Imaging staff with editing performed by physicians (except Zone 7). Note 7: In RHA B Zone 2, activity of NB Heart Centre and Electrophysiology is included with Non-Invasive Cardiology and Echocardiology. Note 8: In RHA B Zone 3, NSR workload reflects minimal admin support personnel in Non-Invasive Card and Echocardiology. Note 9: In RHA A Zone 5, NSR was not reported during the integration of a new employee in Echocardiology Note 10: It is anticipated that the transition to new workload data collection system will result in improved data quality of statistics. Note 11: In RHA B Zones 1 and 3, significant progress has been made in standardizing workload collection in Electrodiagnostics.
May 2015 Section IV - Page 35

2013/2014 Annual Report of Hospital Services Section IV - Functional Centre Report
Table IV-7(c) - Electrodiagnostic, Non-Invasive Cardiology and Vascular Laboratory Indicators - 2013/2014
Region
Cost per Workload Unit
Workload per UPP Worked Hour
Workload per Exam / Procedure
Electrodiagnostic
Cost per Workload Unit
Workload per UPP Worked Hour
Workload per Exam / Procedure
Vascular Laboratory
Cost per Workload Unit
Workload per UPP Worked Hour
Workload per Exam / Procedure
Non-Invasive Cardiology
RRS A Zone 1 1.54 39.68 29.96 0.00 0.00 0.00 0.96 44.12 22.39 RRS A Zone 4 0.66 65.96 55.10 0.00 0.00 0.00 0.95 49.81 27.88 RRS A Zone 5 4.05 10.92 119.46 0.00 0.00 0.00 1.33 29.00 29.92 RRS A Zone 6 0.96 48.69 43.65 0.00 0.00 0.00 0.90 42.74 40.38
RHA B Zone 1 1.27 51.80 37.92 0.00 0.00 0.00 1.14 47.12 26.64 RHA B Zone 2 1.81 38.42 43.79 0.00 0.00 0.00 0.89 55.26 22.69 RHA B Zone 3 1.76 53.50 35.52 1.10 55.13 45.87 0.87 50.30 29.28 RHA B Zone 7 0.00 0.00 0.00 0.00 0.00 0.00 1.06 47.71 30.21
RRS A 1.23 41.02 41.56 0.99 40.88 30.45 0.00 0.00 0.00
RHA B 1.55 48.43 38.26 0.97 50.51 26.46 1.10 55.13 45.87
Average 1.42 44.95 39.61 0.98 46.28 27.88 1.10 55.13 45.87
Region
Cost per Workload Unit
Workload per UPP Worked
Hour
Workload per Exam /
Procedure
Echocardiological Ultrasound
Cost per Workload Unit
Workload per UPP Worked
Hour
Workload per Exam /
Procedure
Electrophysiology
Cost per Workload Unit
Workload per UPP Worked
Hour
Workload per Exam /
Procedure
Sleep Studies Overall Cost per Workload
Unit
Overall Workload per UPP Worked
Hour
Overall Workload per
Exam
RRS A Zone 1 1.50 68.02 75.98 0.00 0.00 0.00 0.92 69.33 519.08 1.12 51.09 35.24 RRS A Zone 4 1.43 63.86 47.29 0.00 0.00 0.00 0.00 0.00 0.00 1.00 54.74 33.78 RRS A Zone 5 1.93 31.48 46.45 0.00 0.00 0.00 0.00 0.00 0.00 1.50 27.18 31.92 RRS A Zone 6 1.22 47.53 62.62 0.00 0.00 0.00 0.00 0.00 0.00 0.94 43.63 42.22
RHA B Zone 1 0.99 50.48 47.82 0.00 0.00 0.00 0.00 0.00 0.00 1.13 48.39 30.45 RHA B Zone 2 1.62 43.88 47.26 35.42 18.61 37.56 1.38 37.55 354.43 3.27 44.10 31.04 RHA B Zone 3 0.89 47.51 60.20 0.00 0.00 0.00 0.00 0.00 0.00 0.96 50.40 32.50 RHA B Zone 7 1.56 61.50 70.42 0.00 0.00 0.00 0.00 0.00 0.00 1.13 49.26 32.83
RRS A 1.08 44.08 36.72 1.44 56.75 61.61 519.08 69.33 0.92 0.00 0.00 0.00
RHA B 1.88 47.32 31.51 1.33 47.21 51.21 354.43 37.55 1.38 35.42 18.61 37.56
Average 1.57 46.02 33.32 1.37 50.15 54.42 425.59 49.51 1.14 35.42 18.61 37.56
Note 1: Expenses excludes admin allocation, medical compensation and interdepartmental. Note 2: Workload units include service recipient (SR) and non-service recipient (NSR) units. Note 3: UPP Worked Hours includes Unit Producing Personnel worked and purchased service hours, and excludes Management and Operational Support personnel, Medical personnel hours and standby hours. Note 4: RHA B Zone 1 contracts out Vascular Lab services therefore worked hours, visits and workload units are not available. Note 5: In 2012/13, mentoring of students and recording of workload will impact the interpretation of the data presented in Electrodiagnostics. Note 6: In some small facilities, ECG is performed by nursing and/or Diagnostic Imaging staff with editing performed by physicians (except Zone 7). Note 7: In RHA B Zone 2, activity of NB Heart Centre and Electrophysiology is included with Non-Invasive Cardiology and Echocardiology. Note 8: In RHA B Zone 3, NSR workload reflects minimal admin support personnel in Non-Invasive Card and Echocardiology. Note 9: In RHA B Zones 1 and 3, significant progress has been made in standardizing workload collection in Electrodiagnostics.
May 2015 Section IV - Page 36

Section IV - Functional Centre ReportSection IV - Functional Centre ReportSection IV - Functional Centre Report2013/2014 Annual Report of Hospital Services
Organization English Short Name
Expenses UPP - Worked Hours
UPP - Benefit Hours
Attendance Days - Face to Face
Attendance Days - Telephone
Physiotherapy
Expenses UPP - Worked Hours
UPP - Benefit Hours
Attendance Days - Face to Face
Attendance Days - Telephone
Occupational Therapy
RRS A Zone 1 1,890,714 36,788 7,894 31,551 308 1,226,842 25,235 4,790 14,800 512 RRS A Zone 4 1,233,754 22,784 5,901 21,093 886 697,756 11,371 2,281 8,578 167 RRS A Zone 5 1,315,969 28,015 5,047 23,734 1,613 1,161,620 23,426 5,829 10,030 119 RRS A Zone 6 1,627,022 31,642 6,264 28,302 855 1,014,978 19,135 4,604 8,950 626
RHA B Zone 1 2,779,250 57,705 11,825 49,367 482 1,486,686 28,005 5,223 14,303 738 RHA B Zone 2 3,984,188 85,191 15,212 85,056 285 2,275,533 44,422 8,917 28,477 907 RHA B Zone 3 4,088,802 86,359 16,635 74,358 2,441 2,777,922 52,305 11,607 24,553 778 RHA B Zone 7 801,059 16,571 3,300 14,684 63 509,578 8,739 1,946 6,053 243
6,067,459 4,101,197 119,230 79,166 25,106 17,504 104,680 42,358 3,662 1,424 RRS A
11,653,299 7,049,719 245,826 133,471 46,972 27,693 223,465 73,386 3,271 2,666 RHA B
Total 17,720,758 11,150,916 365,056 212,637 72,078 45,197 328,145 115,744 6,933 4,090
Table IV-8(a): Other Diagnostic and Therapeutic Total Expenses, Worked Hours and Statistics by Functional Centre - 2013/2014 - Page 1
Organization English Short Name
Expenses UPP - Worked Hours
UPP - Benefit Hours
Attendance Days - Face to Face
Attendance Days - Telephone
Audiology
Expenses UPP - Worked Hours
UPP - Benefit Hours
Attendance Days - Face to Face
Attendance Days - Telephone
Speech Language Pathology
RRS A Zone 1 300,911 4,795 976 2,549 235 668,225 10,839 1,904 3,748 634 RRS A Zone 4 223,569 4,030 843 3,050 546 329,771 4,309 626 2,526 95 RRS A Zone 5 202,896 2,443 508 1,144 12 383,868 5,827 897 2,743 285 RRS A Zone 6 628,753 6,002 1,445 2,444 291 929,916 12,734 2,376 4,857 790
RHA B Zone 1 407,727 6,448 1,351 3,497 224 1,046,607 16,118 3,817 8,372 424 RHA B Zone 2 578,975 9,106 1,587 4,637 170 1,328,260 21,599 4,396 10,767 1,468 RHA B Zone 3 492,369 5,367 1,125 3,682 357 1,614,731 27,271 4,905 9,710 863 RHA B Zone 7 194,675 2,332 370 999 32 302,412 5,114 711 1,941 55
RRS A 1,356,129 17,270 3,771 9,187 1,084 2,311,781 33,708 5,802 13,874 1,804
RHA B 1,673,746 23,253 4,434 12,815 783 4,292,010 70,102 13,829 30,790 2,810
Total 3,029,875 40,524 8,205 22,002 1,867 6,603,790 103,810 19,632 44,664 4,614
Note 1: The type of clinical nutrition services/interventions provided at Centre Hospitalier Restigouche does not enable reporting of attendance days for all patient types as often the face to face intervention is with nursing staff. Note 2: Diet technicians who provide care directly related to patients do not report workload except in RHA B Zone 2. Note 3: In RHA B Zone 7, Clinical Nutrition does not include expenses and workload for diabetic clinic. Note 4: In RRS A Zone 6, Audiology includes the provincial program of Cochlear implant. Note 5: For Radiation Oncology, Zone 2 includes the FTEs for 2.8 MOS CUPE staff and two RNs.
May 2015 Section IV - Page 37

Section IV - Functional Centre ReportSection IV - Functional Centre ReportSection IV - Functional Centre Report2013/2014 Annual Report of Hospital Services
Organization English Short Name
Expenses UPP - Worked Hours
UPP - Benefit Hours
Attendance Days - Face to Face
Attendance Days - Telephone
Social Work
Expenses UPP - Worked Hours
UPP - Benefit Hours
Attendance Days - Face to Face
Attendance Days - Telephone
Psychology
RRS A Zone 1 876,844 15,725 3,582 5,054 2,399 724,834 13,085 2,719 4,715 424 RRS A Zone 4 586,872 9,001 2,485 3,978 3,323 153,826 2,838 728 1,051 162 RRS A Zone 5 1,042,282 18,281 2,886 7,201 4,050 837,748 12,209 3,650 2,643 66 RRS A Zone 6 699,318 12,914 2,734 4,485 1,782 641,931 10,705 1,793 3,326 526
RHA B Zone 1 1,069,132 19,740 4,120 7,320 1,451 1,019,984 14,078 4,726 4,936 218 RHA B Zone 2 1,345,949 25,997 4,290 26,688 1,445 593,315 9,323 1,788 1,969 280 RHA B Zone 3 1,795,631 33,068 7,319 14,776 3,492 1,081,096 19,633 3,566 5,752 396 RHA B Zone 7 453,618 7,530 1,632 3,388 824 0 0 0 0 0
3,205,315 2,358,339 55,921 38,838 11,686 8,890 20,718 11,735 11,554 1,178 RRS A
4,664,331 2,694,395 86,334 43,034 17,361 10,080 52,172 12,657 7,212 894 RHA B
Total 7,869,646 5,052,734 142,256 81,872 29,047 18,970 72,890 24,392 18,766 2,072
Table IV-8(a): Other Diagnostic and Therapeutic Total Expenses, Worked Hours and Statistics by Functional Centre - 2013/2014 - Page 1b
Organization English Short Name
Expenses UPP - Worked Hours
UPP - Benefit Hours
Attendance Days - Face to Face
Attendance Days - Telephone
Recreation
Expenses UPP - Worked Hours
UPP - Benefit Hours
Attendance Days - Face to Face
Attendance Days - Telephone
Child Life
RRS A Zone 1 202,080 3,230 677 15,800 0 0 0 0 0 0 RRS A Zone 4 128,379 3,429 592 5,981 0 0 0 0 0 0 RRS A Zone 5 469,112 10,724 2,221 13,918 0 0 0 0 0 0 RRS A Zone 6 0 0 0 0 0 0 0 0 0 0
RHA B Zone 1 202,501 4,909 985 10,175 0 76,929 1,750 281 1,601 5 RHA B Zone 2 751,518 17,426 3,601 37,698 1 204,305 5,831 821 3,448 0 RHA B Zone 3 399,060 7,481 2,352 9,247 61 82,957 2,657 349 2,459 0 RHA B Zone 7 98,829 2,525 431 3,666 0 0 0 0 0 0
RRS A 799,571 17,383 3,491 35,699 0 0 0 0 0 0
RHA B 1,451,908 32,342 7,369 60,786 62 364,191 10,238 1,451 7,508 5
Total 2,251,478 49,725 10,860 96,485 62 364,191 10,238 1,451 7,508 5
Note 1: The type of clinical nutrition services/interventions provided at Centre Hospitalier Restigouche does not enable reporting of attendance days for all patient types as often the face to face intervention is with nursing staff. Note 2: Diet technicians who provide care directly related to patients do not report workload except in RHA B Zone 2. Note 3: In RHA B Zone 7, Clinical Nutrition does not include expenses and workload for diabetic clinic. Note 4: In RRS A Zone 6, Audiology includes the provincial program of Cochlear implant. Note 5: For Radiation Oncology, Zone 2 includes the FTEs for 2.8 MOS CUPE staff and two RNs.
May 2015 Section IV - Page 38
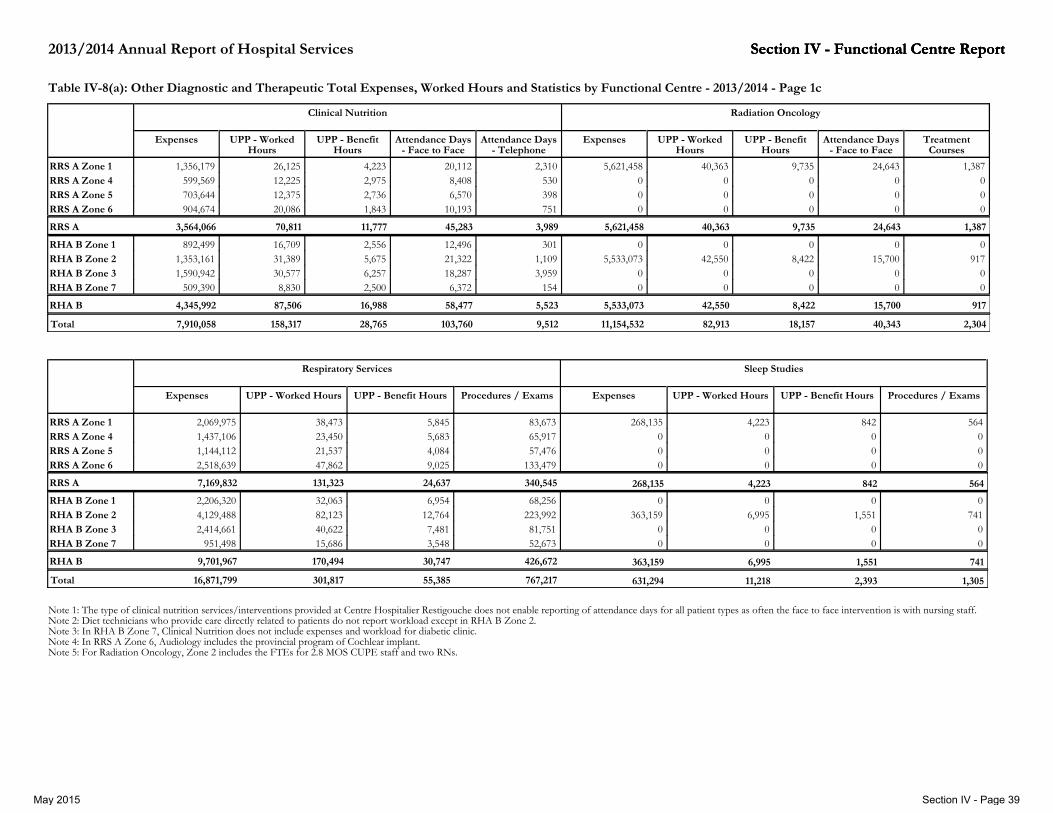
Section IV - Functional Centre ReportSection IV - Functional Centre ReportSection IV - Functional Centre Report2013/2014 Annual Report of Hospital Services
Organization English Short Name
Expenses UPP - Worked Hours
UPP - Benefit Hours
Attendance Days - Face to Face
Attendance Days - Telephone
Clinical Nutrition
Expenses UPP - Worked Hours
UPP - Benefit Hours
Attendance Days - Face to Face
Treatment Courses
Radiation Oncology
RRS A Zone 1 1,356,179 26,125 4,223 20,112 2,310 5,621,458 40,363 9,735 24,643 1,387 RRS A Zone 4 599,569 12,225 2,975 8,408 530 0 0 0 0 0 RRS A Zone 5 703,644 12,375 2,736 6,570 398 0 0 0 0 0 RRS A Zone 6 904,674 20,086 1,843 10,193 751 0 0 0 0 0
RHA B Zone 1 892,499 16,709 2,556 12,496 301 0 0 0 0 0 RHA B Zone 2 1,353,161 31,389 5,675 21,322 1,109 5,533,073 42,550 8,422 15,700 917 RHA B Zone 3 1,590,942 30,577 6,257 18,287 3,959 0 0 0 0 0 RHA B Zone 7 509,390 8,830 2,500 6,372 154 0 0 0 0 0
3,564,066 70,811 11,777 45,283 3,989 RRS A 5,621,458 40,363 9,735 24,643 1,387
4,345,992 87,506 16,988 58,477 5,523 RHA B 5,533,073 42,550 8,422 15,700 917
Total 7,910,058 158,317 28,765 103,760 9,512 11,154,532 82,913 18,157 40,343 2,304
Table IV-8(a): Other Diagnostic and Therapeutic Total Expenses, Worked Hours and Statistics by Functional Centre - 2013/2014 - Page 1c
Organization English Short Name
Expenses UPP - Worked Hours UPP - Benefit Hours Procedures / Exams
Respiratory Services
Expenses UPP - Worked Hours UPP - Benefit Hours Procedures / Exams
Sleep Studies
RRS A Zone 1 2,069,975 38,473 5,845 83,673 268,135 4,223 842 564 RRS A Zone 4 1,437,106 23,450 5,683 65,917 0 0 0 0 RRS A Zone 5 1,144,112 21,537 4,084 57,476 0 0 0 0 RRS A Zone 6 2,518,639 47,862 9,025 133,479 0 0 0 0
RHA B Zone 1 2,206,320 32,063 6,954 68,256 0 0 0 0 RHA B Zone 2 4,129,488 82,123 12,764 223,992 363,159 6,995 1,551 741 RHA B Zone 3 2,414,661 40,622 7,481 81,751 0 0 0 0 RHA B Zone 7 951,498 15,686 3,548 52,673 0 0 0 0
RRS A 7,169,832 131,323 24,637 340,545 268,135 4,223 842 564
RHA B 9,701,967 170,494 30,747 426,672 363,159 6,995 1,551 741
Total 16,871,799 301,817 55,385 767,217 631,294 11,218 2,393 1,305
Note 1: The type of clinical nutrition services/interventions provided at Centre Hospitalier Restigouche does not enable reporting of attendance days for all patient types as often the face to face intervention is with nursing staff. Note 2: Diet technicians who provide care directly related to patients do not report workload except in RHA B Zone 2. Note 3: In RHA B Zone 7, Clinical Nutrition does not include expenses and workload for diabetic clinic. Note 4: In RRS A Zone 6, Audiology includes the provincial program of Cochlear implant. Note 5: For Radiation Oncology, Zone 2 includes the FTEs for 2.8 MOS CUPE staff and two RNs.
May 2015 Section IV - Page 39
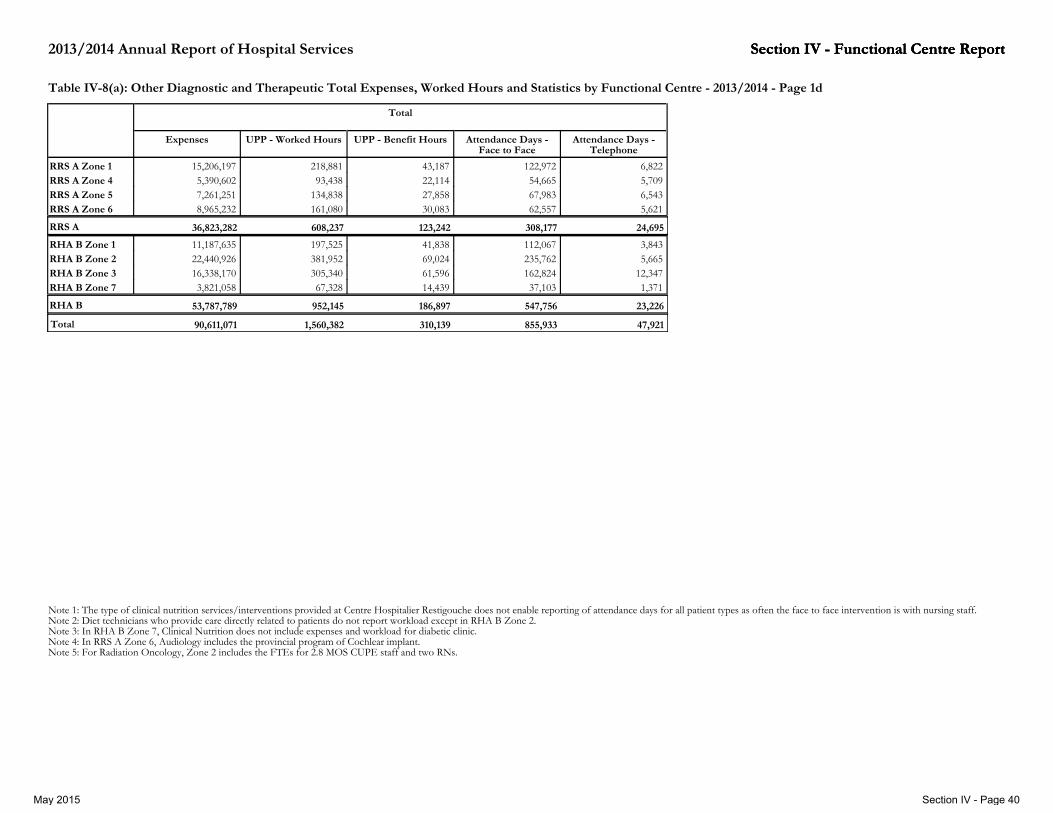
Section IV - Functional Centre ReportSection IV - Functional Centre ReportSection IV - Functional Centre Report2013/2014 Annual Report of Hospital Services
Organization English Short Name
Expenses UPP - Worked Hours UPP - Benefit Hours Attendance Days - Face to Face
Attendance Days - Telephone
Total
RRS A Zone 1 15,206,197 218,881 43,187 122,972 6,822 RRS A Zone 4 5,390,602 93,438 22,114 54,665 5,709 RRS A Zone 5 7,261,251 134,838 27,858 67,983 6,543 RRS A Zone 6 8,965,232 161,080 30,083 62,557 5,621
RHA B Zone 1 11,187,635 197,525 41,838 112,067 3,843 RHA B Zone 2 22,440,926 381,952 69,024 235,762 5,665 RHA B Zone 3 16,338,170 305,340 61,596 162,824 12,347 RHA B Zone 7 3,821,058 67,328 14,439 37,103 1,371
RRS A 36,823,282 608,237 123,242 308,177 24,695
RHA B 53,787,789 952,145 186,897 547,756 23,226
Total 90,611,071 1,560,382 310,139 855,933 47,921
Table IV-8(a): Other Diagnostic and Therapeutic Total Expenses, Worked Hours and Statistics by Functional Centre - 2013/2014 - Page 1d
Note 1: The type of clinical nutrition services/interventions provided at Centre Hospitalier Restigouche does not enable reporting of attendance days for all patient types as often the face to face intervention is with nursing staff. Note 2: Diet technicians who provide care directly related to patients do not report workload except in RHA B Zone 2. Note 3: In RHA B Zone 7, Clinical Nutrition does not include expenses and workload for diabetic clinic. Note 4: In RRS A Zone 6, Audiology includes the provincial program of Cochlear implant. Note 5: For Radiation Oncology, Zone 2 includes the FTEs for 2.8 MOS CUPE staff and two RNs.
May 2015 Section IV - Page 40

Section IV - Functional Centre ReportSection IV - Functional Centre ReportSection IV - Functional Centre Report2013/2014 Annual Report of Hospital Services
Table IV-8(b): Other Diagnostic and Therapeutic Total Workload by Functional Centre and Source of Request - 2013/2014 - Page 1
Organization English Short Name
Inpatient Outpatient Other Service Recipient
Non Service Recipient
Workload Units
Total
Physiotherapy
Inpatient Outpatient Other Service Recipient
Non Service Recipient
Workload Units
Total
Occupational Therapy
RRS A Zone 1 986,287 692,480 13,260 380,086 2,072,113 835,064 209,483 1,985 322,435 1,368,967 RRS A Zone 4 699,137 450,990 0 156,782 1,306,909 379,097 154,605 0 94,175 627,877 RRS A Zone 5 735,017 515,945 30,863 232,460 1,514,285 880,800 127,160 43,045 257,225 1,308,230 RRS A Zone 6 585,296 684,204 22,330 515,727 1,807,557 428,945 413,601 14,755 206,529 1,063,830
RHA B Zone 1 1,526,159 1,000,210 0 532,794 3,059,163 671,018 538,282 0 304,494 1,513,794 RHA B Zone 2 2,641,012 1,361,219 11,656 745,499 4,759,386 1,355,071 568,570 7,355 442,557 2,373,553 RHA B Zone 3 1,989,322 1,746,129 45,135 1,014,408 4,794,994 1,276,944 725,882 80,198 780,877 2,863,901 RHA B Zone 7 484,234 280,099 700 189,548 954,581 303,416 94,144 385 107,354 505,299
RRS A 3,005,737 2,523,906 2,343,619 904,849 66,453 59,785 1,285,055 880,364 6,700,864 4,368,904
RHA B 6,640,727 3,606,449 4,387,657 1,926,878 57,491 87,938 2,482,249 1,635,282 13,568,124 7,256,547 Total 9,646,464 6,130,355 6,731,276 2,831,727 123,944 147,723 3,767,304 2,515,646 20,268,988 11,625,451
Organization English Short Name
Inpatient Outpatient Other Service Recipient
Non Service Recipient
Workload Units
Total
Audiology
Inpatient Outpatient Other Service Recipient
Non Service Recipient
Workload Units
Total
Speech Language Pathology
RRS A Zone 1 7,635 171,726 0 71,400 250,761 133,501 319,813 185 113,169 566,668 RRS A Zone 4 26,696 144,949 0 53,245 224,890 93,020 122,135 0 24,740 239,895 RRS A Zone 5 6,430 81,710 5,850 14,180 108,170 160,300 133,680 7,580 37,300 338,860 RRS A Zone 6 18,980 301,050 1,300 11,040 332,370 103,630 549,030 3,470 181,790 837,920
RHA B Zone 1 12,650 277,092 0 72,325 362,067 198,529 536,273 0 174,759 909,561 RHA B Zone 2 40,685 324,341 10,525 83,795 459,346 316,080 621,793 0 271,233 1,209,106 RHA B Zone 3 6,820 186,115 3,906 72,774 269,615 254,313 824,634 42,646 413,394 1,534,987 RHA B Zone 7 2,045 84,002 850 29,636 116,533 88,567 141,026 320 59,196 289,109
RRS A 59,741 490,451 699,435 1,124,658 7,150 11,235 149,865 356,999 916,191 1,983,343
RHA B 62,200 857,489 871,550 2,123,726 15,281 42,966 258,530 918,582 1,207,561 3,942,763 Total 121,941 1,347,940 1,570,985 3,248,384 22,431 54,201 408,395 1,275,581 2,123,752 5,926,106
Note 1: Outpatient Workload may include Day Surgery and Community Health Centres for some RHAs. Note 2: "Other Service Recipient" Workload includes Sold Services. Note 3: In some RHAs collection of Service Recipient workload by students may affect cost and workload indicators. Note 4: In RRS A, hospital-based therapies working in a community setting report worked hrs, expenses but no workload. This impacts indicators such as productivity. Note 5: In RRS A Zone 6, Audiology includes the provincial program of Cochlear implant. Note 6: Child Life Non-Service Recipient workload may include workload for the orientation and co-ordination of volunteers for Child Life service delivery. Note 7: RHA B Zone 2, Respiratory workload is a combination of standard and actual times. Procedure definition and standard unit values are not always applicable due to multi-tasking. Note 8: In RHA B Zone 3, other service recipient workload for OT includes a staff ergonomic assessment program. Note 9: For Radiation Oncology, Zone 2 includes nursing workload units for two RNs.
May 2015 Section IV - Page 41

Section IV - Functional Centre ReportSection IV - Functional Centre ReportSection IV - Functional Centre Report2013/2014 Annual Report of Hospital Services
Table IV-8(b): Other Diagnostic and Therapeutic Total Workload by Functional Centre and Source of Request - 2013/2014 - Page 1b
Organization English Short Name
Inpatient Outpatient Other Service Recipient
Non Service Recipient
Workload Units
Total
Social Work
Inpatient Outpatient Other Service Recipient
Non Service Recipient
Workload Units
Total
Psychology
RRS A Zone 1 403,181 320,361 1,345 209,968 934,855 184,034 298,251 3,025 280,937 766,247 RRS A Zone 4 375,842 30,753 0 86,271 492,866 78,949 31,746 0 51,402 162,097 RRS A Zone 5 837,310 70,690 13,490 167,520 1,089,010 392,800 71,505 25,255 151,290 640,850 RRS A Zone 6 458,070 119,210 12,180 101,480 690,940 192,136 256,337 25,297 131,815 605,585
RHA B Zone 1 633,993 178,919 0 193,618 1,006,530 370,444 261,539 0 160,858 792,841 RHA B Zone 2 1,060,030 186,097 0 195,213 1,441,340 103,172 305,625 0 80,820 489,617 RHA B Zone 3 1,100,800 351,191 57,087 392,161 1,901,239 359,766 326,514 93,769 236,247 1,016,296 RHA B Zone 7 188,331 88,921 46,745 86,273 410,270 0 0 0 0 0
RRS A 2,074,403 847,919 541,014 657,839 27,015 53,577 565,239 615,444 3,207,671 2,174,779
RHA B 2,983,154 833,382 805,128 893,678 103,832 93,769 867,265 477,925 4,759,379 2,298,754 Total 5,057,557 1,681,301 1,346,142 1,551,517 130,847 147,346 1,432,504 1,093,369 7,967,050 4,473,533
Organization English Short Name
Inpatient Outpatient Other Service Recipient
Non Service Recipient
Workload Units
Total
Recreation
Inpatient Outpatient Other Service Recipient
Non Service Recipient
Workload Units
Total
Child Life
RRS A Zone 1 161,632 0 0 17,068 178,700 0 0 0 0 0 RRS A Zone 4 171,415 0 0 40,209 211,624 0 0 0 0 0 RRS A Zone 5 487,656 0 200 113,060 600,916 0 0 0 0 0 RRS A Zone 6 0 0 0 0 0 0 0 0 0 0
RHA B Zone 1 209,896 0 0 50,588 260,484 38,394 28,444 127 4,585 71,550 RHA B Zone 2 805,280 2,054 0 218,143 1,025,477 169,884 26,615 695 10,175 207,369 RHA B Zone 3 314,642 990 742 117,244 433,618 74,207 19,976 6,380 24,425 124,988 RHA B Zone 7 108,664 0 0 31,502 140,166 0 0 0 0 0
RRS A 820,703 0 0 0 200 0 170,337 0 991,240 0
RHA B 1,438,482 282,485 3,044 75,035 742 7,202 417,477 39,185 1,859,745 403,907 Total 2,259,185 282,485 3,044 75,035 942 7,202 587,814 39,185 2,850,985 403,907
Note 1: Outpatient Workload may include Day Surgery and Community Health Centres for some RHAs. Note 2: "Other Service Recipient" Workload includes Sold Services. Note 3: In some RHAs collection of Service Recipient workload by students may affect cost and workload indicators. Note 4: In RRS A, hospital-based therapies working in a community setting report worked hrs, expenses but no workload. This impacts indicators such as productivity. Note 5: In RRS A Zone 6, Audiology includes the provincial program of Cochlear implant. Note 6: Child Life Non-Service Recipient workload may include workload for the orientation and co-ordination of volunteers for Child Life service delivery. Note 7: RHA B Zone 2, Respiratory workload is a combination of standard and actual times. Procedure definition and standard unit values are not always applicable due to multi-tasking. Note 8: In RHA B Zone 3, other service recipient workload for OT includes a staff ergonomic assessment program. Note 9: For Radiation Oncology, Zone 2 includes nursing workload units for two RNs.
May 2015 Section IV - Page 42

Section IV - Functional Centre ReportSection IV - Functional Centre ReportSection IV - Functional Centre Report2013/2014 Annual Report of Hospital Services
Table IV-8(b): Other Diagnostic and Therapeutic Total Workload by Functional Centre and Source of Request - 2013/2014 - Page 1c
Organization English Short Name
Inpatient Outpatient Other Service Recipient
Non Service Recipient
Workload Units
Total
Respiratory Services
Inpatient Outpatient Other Service Recipient
Non Service Recipient
Workload Units
Total
Clinical Nutrition
RRS A Zone 1 751,081 357,673 0 238,379 1,347,133 582,409 449,534 17,820 421,801 1,471,564 RRS A Zone 4 522,356 271,777 0 239,182 1,033,315 259,153 235,712 0 191,818 686,683 RRS A Zone 5 384,596 176,680 0 192,009 753,285 319,390 182,455 3,400 215,635 720,880 RRS A Zone 6 963,565 628,233 0 476,495 2,068,293 330,947 339,799 9,300 479,402 1,159,448
RHA B Zone 1 810,459 340,618 0 412,573 1,563,650 351,135 373,512 270 206,086 931,003 RHA B Zone 2 2,289,322 450,646 0 620,531 3,360,499 953,104 498,169 5,521 282,915 1,739,709 RHA B Zone 3 943,832 406,359 0 458,876 1,809,067 547,999 609,984 177,804 455,681 1,791,468 RHA B Zone 7 396,226 105,346 0 167,059 668,631 275,216 156,383 5,021 109,022 545,642
RRS A 2,621,598 1,491,899 1,434,363 1,207,500 0 30,520 1,146,065 1,308,656 5,202,026 4,038,575
RHA B 4,439,839 2,127,454 1,302,969 1,638,048 0 188,616 1,659,039 1,053,704 7,401,847 5,007,822 Total 7,061,437 3,619,353 2,737,332 2,845,548 0 219,136 2,805,104 2,362,360 12,603,873 9,046,397
Organization English Short Name
Inpatient Outpatient Other Service Recipient
Non Service Recipient
Workload Units
Total
Radiation Oncology
Inpatient Outpatient Other Service RecipientNon Service Recipient Workload UnitsTotal
Sleep Studies
RRS A Zone 1 67,213 1,276,966 0 452,382 1,796,561 1,525 258,737 0 32,500 292,762 RRS A Zone 4 0 0 0 0 0 0 0 0 0 0 RRS A Zone 5 0 0 0 0 0 0 0 0 0 0 RRS A Zone 6 0 0 0 0 0 0 0 0 0 0
RHA B Zone 1 0 0 0 0 0 0 0 0 0 0 RHA B Zone 2 232,931 1,322,787 18,177 415,127 1,989,022 6,412 207,331 0 48,891 262,634 RHA B Zone 3 0 0 0 0 0 0 0 0 0 0 RHA B Zone 7 0 0 0 0 0 0 0 0 0 0
RRS A 1,525 258,737 0 32,500 292,762 67,213 1,276,966 0 452,382 1,796,561
RHA B 6,412 207,331 0 48,891 262,634 232,931 1,322,787 18,177 415,127 1,989,022Total 7,937 466,068 0 81,391 555,396 300,144 2,599,753 18,177 867,509 3,785,583
Note 1: Outpatient Workload may include Day Surgery and Community Health Centres for some RHAs. Note 2: "Other Service Recipient" Workload includes Sold Services. Note 3: In some RHAs collection of Service Recipient workload by students may affect cost and workload indicators. Note 4: In RRS A, hospital-based therapies working in a community setting report worked hrs, expenses but no workload. This impacts indicators such as productivity. Note 5: In RRS A Zone 6, Audiology includes the provincial program of Cochlear implant. Note 6: Child Life Non-Service Recipient workload may include workload for the orientation and co-ordination of volunteers for Child Life service delivery. Note 7: RHA B Zone 2, Respiratory workload is a combination of standard and actual times. Procedure definition and standard unit values are not always applicable due to multi-tasking. Note 8: In RHA B Zone 3, other service recipient workload for OT includes a staff ergonomic assessment program. Note 9: For Radiation Oncology, Zone 2 includes nursing workload units for two RNs.
May 2015 Section IV - Page 43

Section IV - Functional Centre ReportSection IV - Functional Centre ReportSection IV - Functional Centre Report2013/2014 Annual Report of Hospital Services
Table IV-8(b): Other Diagnostic and Therapeutic Total Workload by Functional Centre and Source of Request - 2013/2014 - Page 1d
Organization English Short Name
Inpatient Outpatient Other Service Recipient
Non Service Recipient Workload
Units
Total
Total
RRS A Zone 1 4,113,562 4,355,024 37,620 2,540,125 11,046,331 RRS A Zone 4 2,605,665 1,442,667 0 937,824 4,986,156 RRS A Zone 5 4,204,299 1,359,825 129,683 1,380,679 7,074,486 RRS A Zone 6 3,081,569 3,291,464 88,632 2,104,278 8,565,943
RHA B Zone 1 4,822,677 3,534,889 397 2,112,680 10,470,643 RHA B Zone 2 9,972,983 5,875,247 53,929 3,414,899 19,317,058 RHA B Zone 3 6,868,645 5,197,774 507,667 3,966,087 16,540,173 RHA B Zone 7 1,846,699 949,921 54,021 779,590 3,630,231
RRS A 14,005,095 10,448,980 255,935 6,962,906 31,672,916
RHA B 23,511,004 15,557,831 616,014 10,273,256 49,958,105 Total 37,516,099 26,006,811 871,949 17,236,162 81,631,021
Note 1: Outpatient Workload may include Day Surgery and Community Health Centres for some RHAs. Note 2: "Other Service Recipient" Workload includes Sold Services. Note 3: In some RHAs collection of Service Recipient workload by students may affect cost and workload indicators. Note 4: In RRS A, hospital-based therapies working in a community setting report worked hrs, expenses but no workload. This impacts indicators such as productivity. Note 5: In RRS A Zone 6, Audiology includes the provincial program of Cochlear implant. Note 6: Child Life Non-Service Recipient workload may include workload for the orientation and co-ordination of volunteers for Child Life service delivery. Note 7: RHA B Zone 2, Respiratory workload is a combination of standard and actual times. Procedure definition and standard unit values are not always applicable due to multi-tasking. Note 8: In RHA B Zone 3, other service recipient workload for OT includes a staff ergonomic assessment program. Note 9: For Radiation Oncology, Zone 2 includes nursing workload units for two RNs.
May 2015 Section IV - Page 44

Section IV - Functional Centre ReportSection IV - Functional Centre ReportSection IV - Functional Centre Report2013/2014 Annual Report of Hospital Services
Organization English Short Name
Cost per Attendance Day
Cost per SR Workload Workload Units per UPP Worked Hour
Workload Units per Attendance Day
Physiotherapy
Cost per Attendance Day
Cost per SR Workload Workload Units per UPP Worked Hour
Workload Units per Attendance Day
Occupational Therapy
RRS A Zone 1 59.93 1.12 56.3 65.7 82.89 1.17 54.2 92.5 RRS A Zone 4 58.49 1.07 57.4 62.0 81.34 1.31 55.2 73.2 RRS A Zone 5 55.45 1.03 54.1 63.8 115.81 1.11 55.8 130.4 RRS A Zone 6 57.49 1.26 57.1 63.9 113.41 1.18 55.6 118.9
RHA B Zone 1 56.30 1.10 53.0 62.0 103.94 1.23 54.1 105.8 RHA B Zone 2 46.84 0.99 55.9 56.0 79.91 1.18 53.4 83.3 RHA B Zone 3 54.99 1.08 55.5 64.5 113.14 1.33 54.8 116.6 RHA B Zone 7 54.55 1.05 57.6 65.0 84.19 1.28 57.8 83.5
RRS A 57.96 1.12 56.2 64.0 96.82 1.18 55.2 103.1
RHA B 52.15 1.05 55.2 60.7 96.06 1.25 54.4 98.9
Total 96.34 1.22 54.7 100.4 54.00 1.07 55.5 61.8
Organization English Short Name
Cost per Attendance Day
Cost per SR Workload Workload Units per UPP Worked Hour
Workload Units per Attendance Day
Audiology
Cost per Attendance Day
Cost per SR Workload Workload Units per UPP Worked Hour
Workload Units per Attendance Day
Speech Language Pathology
RRS A Zone 1 118.05 1.68 52.3 98.4 178.29 1.47 52.3 151.2 RRS A Zone 4 73.30 1.30 55.8 73.7 130.55 1.53 55.7 95.0 RRS A Zone 5 177.36 2.16 44.3 94.6 139.94 1.27 58.2 123.5 RRS A Zone 6 257.26 1.96 55.4 136.0 191.46 1.42 65.8 172.5
RHA B Zone 1 116.59 1.41 56.1 103.5 125.01 1.42 56.4 108.6 RHA B Zone 2 124.86 1.54 50.4 99.1 123.36 1.42 56.0 112.3 RHA B Zone 3 133.72 2.50 50.2 73.2 166.30 1.44 56.3 158.1 RHA B Zone 7 194.87 2.24 50.0 116.6 155.80 1.32 56.5 148.9
RRS A 147.61 1.77 53.0 99.7 166.63 1.42 58.8 143.0
RHA B 130.61 1.76 51.9 94.2 139.40 1.42 56.2 128.1
Total 1.77 52.4 96.5 137.71 147.85 1.42 57.1 132.7
Table IV-8(c): Other Diagnostic and Therapeutic Indicators - 2013/2014 - Page 1
Note 1: "Other Service Recipient" Workload includes Sold Services. Note 2: In RRS A, hospital-based therapies working in a community setting report worked hrs, expenses but no workload. This impacts indicators such as productivity. Note 3: The type of clinical nutrition services/interventions provided at Centre Hospitalier Restigouche does not enable reporting of attendance days for all patient types as often the face to face intervention is with nursing staff. Note 4: In RRS A Zone 6, Audiology includes the provincial program of Cochlear implant. Note 5: Child Life Non-Service Recipient workload may include workload for the orientation and co-ordination of volunteers for Child Life service delivery. Note 6: In RHA B Zone 1, Recreation Therapy includes the expenses and worked hours for 1 FTE Activity Worker but excludes the corresponding workload units. Note 7: For Radiation Oncology, Zone 2 includes the FTEs for 2.8 MOS CUPE staff and two RNs. Note 8: For Radiation Oncology, treatment fractionations and techniques vary across centres which accounts for differences in indicator results. Note 9: Radiation Oncology depreciation expense on high cost equipment significantly impacts indicators. Note 10: For Radiation Oncology, Zone 2 includes nursing workload units, worked hours and compensation for two RNs.
May 2015 Section IV - Page 45

Section IV - Functional Centre ReportSection IV - Functional Centre ReportSection IV - Functional Centre Report2013/2014 Annual Report of Hospital Services
Organization English Short Name
Cost per Attendance Day
Cost per SR Workload Workload Units per UPP Worked Hour
Workload Units per Attendance Day
Social Work
Cost per Attendance Day
Cost per SR Workload Workload Units per UPP Worked Hour
Workload Units per Attendance Day
Psychology
RRS A Zone 1 173.50 1.21 59.5 185.0 153.73 1.49 58.6 162.5 RRS A Zone 4 147.53 1.44 54.8 123.9 146.36 1.39 57.1 154.2 RRS A Zone 5 144.74 1.13 59.6 151.2 316.97 1.71 52.5 242.5 RRS A Zone 6 155.92 1.19 53.5 154.1 193.00 1.35 56.6 182.1
RHA B Zone 1 146.06 1.32 51.0 137.5 206.64 1.61 56.3 160.6 RHA B Zone 2 50.43 1.08 55.4 54.0 301.33 1.45 52.5 248.7 RHA B Zone 3 121.52 1.19 57.5 128.7 187.95 1.39 51.8 176.7 RHA B Zone 7 133.89 1.40 54.5 121.1 0.00 0.00 0.0 0.0
RRS A 154.71 1.21 57.4 154.8 200.97 1.51 56.0 185.3
RHA B 89.40 1.20 55.1 91.2 212.88 1.48 53.4 181.6
Total 107.97 1.20 56.0 109.3 207.15 1.49 54.6 183.4
Organization English Short Name
Cost per Attendance Day
Cost per SR Workload Workload Units per UPP Worked Hour
Workload Units per Attendance Day
Recreation
Cost per Attendance Day
Cost per SR Workload Workload Units per UPP Worked Hour
Workload Units per Attendance Day
Child Life
RRS A Zone 1 12.79 1.25 55.3 11.3 0.00 0.00 0.0 0.0 RRS A Zone 4 21.46 0.75 61.7 35.4 0.00 0.00 0.0 0.0 RRS A Zone 5 33.71 0.96 56.0 43.2 0.00 0.00 0.0 0.0 RRS A Zone 6 0.00 0.00 0.0 0.0 0.00 0.00 0.0 0.0
RHA B Zone 1 19.90 0.96 53.1 25.6 48.05 1.15 40.9 44.7 RHA B Zone 2 19.94 0.93 58.8 27.2 59.25 1.04 35.6 60.1 RHA B Zone 3 43.16 1.26 58.0 46.9 33.74 0.82 47.0 50.8 RHA B Zone 7 26.96 0.91 55.5 38.2 0.00 0.00 0.0 0.0
RRS A 22.40 0.97 57.0 27.8 0.00 0.00 0.0 0.0
RHA B 23.89 1.01 57.5 30.6 48.51 1.00 39.5 53.8
Total 53.8 48.51 1.00 39.5 23.34 0.99 57.3 29.5
Table IV-8(c): Other Diagnostic and Therapeutic Indicators - 2013/2014 - Page 1b
Note 1: "Other Service Recipient" Workload includes Sold Services. Note 2: In RRS A, hospital-based therapies working in a community setting report worked hrs, expenses but no workload. This impacts indicators such as productivity. Note 3: The type of clinical nutrition services/interventions provided at Centre Hospitalier Restigouche does not enable reporting of attendance days for all patient types as often the face to face intervention is with nursing staff. Note 4: In RRS A Zone 6, Audiology includes the provincial program of Cochlear implant. Note 5: Child Life Non-Service Recipient workload may include workload for the orientation and co-ordination of volunteers for Child Life service delivery. Note 6: In RHA B Zone 1, Recreation Therapy includes the expenses and worked hours for 1 FTE Activity Worker but excludes the corresponding workload units. Note 7: For Radiation Oncology, Zone 2 includes the FTEs for 2.8 MOS CUPE staff and two RNs. Note 8: For Radiation Oncology, treatment fractionations and techniques vary across centres which accounts for differences in indicator results. Note 9: Radiation Oncology depreciation expense on high cost equipment significantly impacts indicators. Note 10: For Radiation Oncology, Zone 2 includes nursing workload units, worked hours and compensation for two RNs.
May 2015 Section IV - Page 46

Section IV - Functional Centre ReportSection IV - Functional Centre ReportSection IV - Functional Centre Report2013/2014 Annual Report of Hospital Services
Organization English Short Name
Cost per Procedure Cost per SR Workload Workload Units per UPP Worked Hour
Workload Units per Procedure
Respiratory Services
Cost per Attendance Day
Cost per SR Workload Workload Units per UPP Worked Hour
Workload Units per Attendance Day
Clinical Nutrition
RRS A Zone 1 24.74 1.87 35.0 16.1 67.43 1.29 56.3 73.2 RRS A Zone 4 21.80 1.81 44.1 15.7 71.31 1.21 56.2 81.7 RRS A Zone 5 19.91 2.04 35.0 13.1 107.10 1.39 58.3 109.7 RRS A Zone 6 18.87 1.58 43.2 15.5 88.75 1.33 57.7 113.7
RHA B Zone 1 32.32 1.92 48.8 22.9 71.42 1.23 55.7 74.5 RHA B Zone 2 18.44 1.51 40.9 15.0 63.46 0.93 55.4 81.6 RHA B Zone 3 29.54 1.79 44.5 22.1 87.00 1.19 58.6 98.0 RHA B Zone 7 18.06 1.90 42.6 12.7 79.94 1.17 61.8 85.6
RRS A 1.77 39.6 78.71 1.31 57.0 89.2 21.05 15.3
RHA B 1.69 43.4 74.32 1.10 57.2 85.6 22.74 17.3
Total 76.23 1.18 57.1 87.2 1.72 41.821.99 16.4
Organization English Short Name
Cost per Attendance Day
Cost per SR Workload
Cost per Treatment
Course
Workload Units per UPP Worked
Hour
Workload Units per Attendance
Day
Workload Units per Treatment
Course
Radiation Oncology
Cost per Procedure
Cost per SR Workload
Workload Units per UPP Worked
Hour
Workload Units per Procedure
Sleep Studies
RRS A Zone 1 228.12 4.18 4,052.96 44.5 72.9 1,295.3 475.4 1.03 69.3 519.1 RRS A Zone 4 0.00 0.00 0.00 0.0 0.0 0.0 0.0 0.00 0.0 0.0 RRS A Zone 5 0.00 0.00 0.00 0.0 0.0 0.0 0.0 0.00 0.0 0.0 RRS A Zone 6 0.00 0.00 0.00 0.0 0.0 0.0 0.0 0.00 0.0 0.0
RHA B Zone 1 0.00 0.00 0.00 0.0 0.0 0.0 0.0 0.00 0.0 0.0 RHA B Zone 2 352.43 3.52 6,033.89 46.7 126.7 2,169.1 490.1 1.70 37.5 354.4 RHA B Zone 3 0.00 0.00 0.00 0.0 0.0 0.0 0.0 0.00 0.0 0.0 RHA B Zone 7 0.00 0.00 0.00 0.0 0.0 0.0 0.0 0.00 0.0 0.0
RRS A 228.12 4.18 4,052.96 44.5 72.9 1,295.3 475.4 1.03 69.3 519.1
RHA B 352.43 3.52 6,033.89 46.7 126.7 2,169.1 490.1 1.70 37.5 354.4
Total 276.49 3.82 4,841.38 45.7 93.8 1,643.0 483.8 1.33 49.5 425.6
Table IV-8(c): Other Diagnostic and Therapeutic Indicators - 2013/2014 - Page 1c
Note 1: "Other Service Recipient" Workload includes Sold Services. Note 2: In RRS A, hospital-based therapies working in a community setting report worked hrs, expenses but no workload. This impacts indicators such as productivity. Note 3: The type of clinical nutrition services/interventions provided at Centre Hospitalier Restigouche does not enable reporting of attendance days for all patient types as often the face to face intervention is with nursing staff. Note 4: In RRS A Zone 6, Audiology includes the provincial program of Cochlear implant. Note 5: Child Life Non-Service Recipient workload may include workload for the orientation and co-ordination of volunteers for Child Life service delivery. Note 6: In RHA B Zone 1, Recreation Therapy includes the expenses and worked hours for 1 FTE Activity Worker but excludes the corresponding workload units. Note 7: For Radiation Oncology, Zone 2 includes the FTEs for 2.8 MOS CUPE staff and two RNs. Note 8: For Radiation Oncology, treatment fractionations and techniques vary across centres which accounts for differences in indicator results. Note 9: Radiation Oncology depreciation expense on high cost equipment significantly impacts indicators. Note 10: For Radiation Oncology, Zone 2 includes nursing workload units, worked hours and compensation for two RNs.
May 2015 Section IV - Page 47

Section IV - Functional Centre ReportSection IV - Functional Centre ReportSection IV - Functional Centre Report2013/2014 Annual Report of Hospital Services
Organization English Short Name Average Cost per Attendance Day
Average Cost per SR Workload
Average Workload per UPP Worked Hours
Average Workload per Attendance Day
RRS A Zone 1 106.82 1.79 50.5 78.9 RRS A Zone 4 72.32 1.33 53.4 72.3 RRS A Zone 5 89.98 1.28 52.5 93.0 RRS A Zone 6 103.05 1.39 53.2 103.9
RHA B Zone 1 80.14 1.34 53.0 79.5 RHA B Zone 2 77.67 1.41 50.6 67.7 RHA B Zone 3 85.51 1.30 54.2 90.5 RHA B Zone 7 77.34 1.34 53.9 79.8
RRS A 96.22 1.49 52.1 85.9
RHA B 80.48 1.36 52.5 77.7
Total 86.15 1.41 52.3 80.6
Table IV-8(c): Other Diagnostic and Therapeutic Indicators - 2013/2014 - Page 1d
Note 1: "Other Service Recipient" Workload includes Sold Services. Note 2: In RRS A, hospital-based therapies working in a community setting report worked hrs, expenses but no workload. This impacts indicators such as productivity. Note 3: The type of clinical nutrition services/interventions provided at Centre Hospitalier Restigouche does not enable reporting of attendance days for all patient types as often the face to face intervention is with nursing staff. Note 4: In RRS A Zone 6, Audiology includes the provincial program of Cochlear implant. Note 5: Child Life Non-Service Recipient workload may include workload for the orientation and co-ordination of volunteers for Child Life service delivery. Note 6: In RHA B Zone 1, Recreation Therapy includes the expenses and worked hours for 1 FTE Activity Worker but excludes the corresponding workload units. Note 7: For Radiation Oncology, Zone 2 includes the FTEs for 2.8 MOS CUPE staff and two RNs. Note 8: For Radiation Oncology, treatment fractionations and techniques vary across centres which accounts for differences in indicator results. Note 9: Radiation Oncology depreciation expense on high cost equipment significantly impacts indicators. Note 10: For Radiation Oncology, Zone 2 includes nursing workload units, worked hours and compensation for two RNs.
May 2015 Section IV - Page 48

Section IV - Functional Centre ReportSection IV - Functional Centre ReportSection IV - Functional Centre Report2013/2014 Annual Report of Hospital Services
Table IV-8(d): Other Diagnostic and Therapeutic Percent Workload by Service Recipient - 2013/2014 - Page 1
Organization English Short Name
Inpatient Outpatient Other Service Recipient Workload
Non Service Recipient Workload
Total
Physiotherapy
Inpatient Outpatient Other Service Recipient Workload
Non Service Recipient Workload
Total
Occupational Therapy
RRS A Zone 1 47.6% 33.4% 0.6% 18.3% 100.0% 61.0% 15.3% 0.1% 23.6% 100.0% RRS A Zone 4 53.5% 34.5% 0.0% 12.0% 100.0% 60.4% 24.6% 0.0% 15.0% 100.0% RRS A Zone 5 48.5% 34.1% 2.0% 15.4% 100.0% 67.3% 9.7% 3.3% 19.7% 100.0% RRS A Zone 6 32.4% 37.9% 1.2% 28.5% 100.0% 40.3% 38.9% 1.4% 19.4% 100.0%
RHA B Zone 1 49.9% 32.7% 0.0% 17.4% 100.0% 44.3% 35.6% 0.0% 20.1% 100.0% RHA B Zone 2 55.5% 28.6% 0.2% 15.7% 100.0% 57.1% 24.0% 0.3% 18.6% 100.0% RHA B Zone 3 41.5% 36.4% 0.9% 21.2% 100.0% 44.6% 25.3% 2.8% 27.3% 100.0% RHA B Zone 7 50.7% 29.3% 0.1% 19.9% 100.0% 60.0% 18.6% 0.1% 21.2% 100.0%
RRS A 44.9% 35.0% 1.0% 19.2% 100.0% 57.8% 20.7% 1.4% 20.2% 100.0%
RHA B 48.9% 32.3% 0.4% 18.3% 100.0% 49.7% 26.6% 1.2% 22.5% 100.0%
Total 47.6% 33.2% 0.6% 100.0% 18.6% 52.7% 24.4% 1.3% 21.6% 100.0%
Organization English Short Name
Inpatient Outpatient Other Service Recipient Workload
Non Service Recipient Workload
Total
Audiology
Inpatient Outpatient Other Service Recipient Workload
Non Service Recipient Workload
Total
Speech Language Pathology
RRS A Zone 1 3.0% 68.5% 0.0% 28.5% 100.0% 23.6% 56.4% 0.0% 20.0% 100.0% RRS A Zone 4 11.9% 64.5% 0.0% 23.7% 100.0% 38.8% 50.9% 0.0% 10.3% 100.0% RRS A Zone 5 5.9% 75.5% 5.4% 13.1% 100.0% 47.3% 39.4% 2.2% 11.0% 100.0% RRS A Zone 6 5.7% 90.6% 0.4% 3.3% 100.0% 12.4% 65.5% 0.4% 21.7% 100.0%
RHA B Zone 1 3.5% 76.5% 0.0% 20.0% 100.0% 21.8% 59.0% 0.0% 19.2% 100.0% RHA B Zone 2 8.9% 70.6% 2.3% 18.2% 100.0% 26.1% 51.4% 0.0% 22.4% 100.0% RHA B Zone 3 2.5% 69.0% 1.4% 27.0% 100.0% 16.6% 53.7% 2.8% 26.9% 100.0% RHA B Zone 7 1.8% 72.1% 0.7% 25.4% 100.0% 30.6% 48.8% 0.1% 20.5% 100.0%
RRS A 6.5% 76.3% 0.8% 16.4% 100.0% 24.7% 56.7% 0.6% 18.0% 100.0%
RHA B 5.2% 72.2% 1.3% 21.4% 100.0% 21.7% 53.9% 1.1% 23.3% 100.0%
Total 22.7% 54.8% 0.9% 21.5% 100.0% 5.7% 1.1% 74.0% 19.2% 100.0%
Note 1: Outpatient Workload may include Day Surgery for some RHAs. Note 2: "Other Service Recipient" Workload includes Sold Services. Note 3: In RRS A, hospital-based therapies working in a community setting report worked hrs, expenses but no workload. This impacts indicators such as productivity. Note 4: Speech Language Pathology excludes the Early Language Services Program. Note 5: Child Life Non-Service Recipient workload may include workload for the orientation and co-ordination of volunteers for Child Life service delivery. Note 6: Attendance days for Respiratory Services were discontinued in 2008/09 and replaced by procedures. Note 7: For Radiation Oncology, Zone 2 includes the workload units for two RNs. Note 8: For Radiation Oncology, treatment fractionations and techniques vary across centres which accounts for differences in indicator results.
May 2015 Section IV - Page 49

Section IV - Functional Centre ReportSection IV - Functional Centre ReportSection IV - Functional Centre Report2013/2014 Annual Report of Hospital Services
Table IV-8(d): Other Diagnostic and Therapeutic Percent Workload by Service Recipient - 2013/2014 - Page 1b
Organization English Short Name
Inpatient Outpatient Other Service Recipient Workload
Non Service Recipient Workload
Total
Social Work
Inpatient Outpatient Other Service Recipient Workload
Non Service Recipient Workload
Total
Psychology
RRS A Zone 1 43.1% 34.3% 0.1% 22.5% 100.0% 24.0% 38.9% 0.4% 36.7% 100.0% RRS A Zone 4 76.3% 6.2% 0.0% 17.5% 100.0% 48.7% 19.6% 0.0% 31.7% 100.0% RRS A Zone 5 76.9% 6.5% 1.2% 15.4% 100.0% 61.3% 11.2% 3.9% 23.6% 100.0% RRS A Zone 6 66.3% 17.3% 1.8% 14.7% 100.0% 31.7% 42.3% 4.2% 21.8% 100.0%
RHA B Zone 1 63.0% 17.8% 0.0% 19.2% 100.0% 46.7% 33.0% 0.0% 20.3% 100.0% RHA B Zone 2 73.5% 12.9% 0.0% 13.5% 100.0% 21.1% 62.4% 0.0% 16.5% 100.0% RHA B Zone 3 57.9% 18.5% 3.0% 20.6% 100.0% 35.4% 32.1% 9.2% 23.2% 100.0% RHA B Zone 7 45.9% 21.7% 11.4% 21.0% 100.0% 0.0% 0.0% 0.0% 0.0% 0.0%
RRS A 64.7% 16.9% 0.8% 17.6% 100.0% 39.0% 30.2% 2.5% 28.3% 100.0%
RHA B 62.7% 16.9% 2.2% 18.2% 100.0% 36.3% 38.9% 4.1% 20.8% 100.0%
Total 37.6% 34.7% 3.3% 24.4% 100.0% 63.5% 16.9% 1.6% 18.0% 100.0%
Organization English Short Name
Inpatient Outpatient Other Service Recipient Workload
Non Service Recipient Workload
Total
Recreation
Inpatient Outpatient Other Service Recipient Workload
Non Service Recipient Workload
Total
Child Life
RRS A Zone 1 90.4% 0.0% 0.0% 9.6% 100.0% 0.0% 0.0% 0.0% 0.0% 0.0% RRS A Zone 4 81.0% 0.0% 0.0% 19.0% 100.0% 0.0% 0.0% 0.0% 0.0% 0.0% RRS A Zone 5 81.2% 0.0% 0.0% 18.8% 100.0% 0.0% 0.0% 0.0% 0.0% 0.0% RRS A Zone 6 0.0% 0.0% 0.0% 0.0% 0.0% 0.0% 0.0% 0.0% 0.0% 0.0%
RHA B Zone 1 80.6% 0.0% 0.0% 19.4% 100.0% 53.7% 39.8% 0.2% 6.4% 100.0% RHA B Zone 2 78.5% 0.2% 0.0% 21.3% 100.0% 81.9% 12.8% 0.3% 4.9% 100.0% RHA B Zone 3 72.6% 0.2% 0.2% 27.0% 100.0% 59.4% 16.0% 5.1% 19.5% 100.0% RHA B Zone 7 77.5% 0.0% 0.0% 22.5% 100.0% 0.0% 0.0% 0.0% 0.0% 0.0%
RRS A 82.8% 0.0% 0.0% 17.2% 100.0% 0.0% 0.0% 0.0% 0.0% 0.0%
RHA B 77.3% 0.2% 0.0% 22.4% 100.0% 69.9% 18.6% 1.8% 9.7% 100.0%
Total 69.9% 18.6% 1.8% 9.7% 100.0% 79.2% 0.1% 0.0% 20.6% 100.0%
Note 1: Outpatient Workload may include Day Surgery for some RHAs. Note 2: "Other Service Recipient" Workload includes Sold Services. Note 3: In RRS A, hospital-based therapies working in a community setting report worked hrs, expenses but no workload. This impacts indicators such as productivity. Note 4: Speech Language Pathology excludes the Early Language Services Program. Note 5: Child Life Non-Service Recipient workload may include workload for the orientation and co-ordination of volunteers for Child Life service delivery. Note 6: Attendance days for Respiratory Services were discontinued in 2008/09 and replaced by procedures. Note 7: For Radiation Oncology, Zone 2 includes the workload units for two RNs. Note 8: For Radiation Oncology, treatment fractionations and techniques vary across centres which accounts for differences in indicator results.
May 2015 Section IV - Page 50

Section IV - Functional Centre ReportSection IV - Functional Centre ReportSection IV - Functional Centre Report2013/2014 Annual Report of Hospital Services
Table IV-8(d): Other Diagnostic and Therapeutic Percent Workload by Service Recipient - 2013/2014 - Page 1c
Organization English Short Name
Inpatient Outpatient Other Service Recipient Workload
Non Service Recipient Workload
Total
Respiratory Services
Inpatient Outpatient Other Service Recipient Workload
Non Service Recipient Workload
Total
Clinical Nutrition
RRS A Zone 1 55.8% 26.6% 0.0% 17.7% 100.0% 39.6% 30.5% 1.2% 28.7% 100.0% RRS A Zone 4 50.6% 26.3% 0.0% 23.1% 100.0% 37.7% 34.3% 0.0% 27.9% 100.0% RRS A Zone 5 51.1% 23.5% 0.0% 25.5% 100.0% 44.3% 25.3% 0.5% 29.9% 100.0% RRS A Zone 6 46.6% 30.4% 0.0% 23.0% 100.0% 28.5% 29.3% 0.8% 41.3% 100.0%
RHA B Zone 1 51.8% 21.8% 0.0% 26.4% 100.0% 37.7% 40.1% 0.0% 22.1% 100.0% RHA B Zone 2 68.1% 13.4% 0.0% 18.5% 100.0% 54.8% 28.6% 0.3% 16.3% 100.0% RHA B Zone 3 52.2% 22.5% 0.0% 25.4% 100.0% 30.6% 34.0% 9.9% 25.4% 100.0% RHA B Zone 7 59.3% 15.8% 0.0% 25.0% 100.0% 50.4% 28.7% 0.9% 20.0% 100.0%
RRS A 50.4% 27.6% 0.0% 22.0% 100.0% 36.9% 29.9% 0.8% 32.4% 100.0%
RHA B 60.0% 17.6% 0.0% 22.4% 100.0% 42.5% 32.7% 3.8% 21.0% 100.0%
Total 40.0% 31.5% 2.4% 26.1% 100.0% 56.0% 21.7% 0.0% 22.3% 100.0%
Organization English Short Name
Inpatient Outpatient Other Service Recipient Workload
Non Service Recipient Workload
Total
Radiation Oncology
Inpatient Outpatient Other Service Recipient Workload
Non Service Recipient Workload
Total
Sleep Studies
RRS A Zone 1 3.7% 71.1% 0.0% 25.2% 100.0% 0.5% 88.4% 0.0% 11.1% 100.0% RRS A Zone 4 0.0% 0.0% 0.0% 0.0% 0.0% 0.0% 0.0% 0.0% 0.0% 0.0% RRS A Zone 5 0.0% 0.0% 0.0% 0.0% 0.0% 0.0% 0.0% 0.0% 0.0% 0.0% RRS A Zone 6 0.0% 0.0% 0.0% 0.0% 0.0% 0.0% 0.0% 0.0% 0.0% 0.0%
RHA B Zone 1 0.0% 0.0% 0.0% 0.0% 0.0% 0.0% 0.0% 0.0% 0.0% 0.0% RHA B Zone 2 11.7% 66.5% 0.9% 20.9% 100.0% 2.4% 78.9% 0.0% 18.6% 100.0% RHA B Zone 3 0.0% 0.0% 0.0% 0.0% 0.0% 0.0% 0.0% 0.0% 0.0% 0.0% RHA B Zone 7 0.0% 0.0% 0.0% 0.0% 0.0% 0.0% 0.0% 0.0% 0.0% 0.0%
RRS A 0.5% 88.4% 0.0% 11.1% 100.0% 3.7% 71.1% 0.0% 25.2% 100.0%
RHA B 2.4% 78.9% 0.0% 18.6% 100.0% 11.7% 66.5% 0.9% 20.9% 100.0%
Total 1.4% 83.9% 0.0% 14.7% 100.0% 7.9% 68.7% 0.5% 22.9% 100.0%
Note 1: Outpatient Workload may include Day Surgery for some RHAs. Note 2: "Other Service Recipient" Workload includes Sold Services. Note 3: In RRS A, hospital-based therapies working in a community setting report worked hrs, expenses but no workload. This impacts indicators such as productivity. Note 4: Speech Language Pathology excludes the Early Language Services Program. Note 5: Child Life Non-Service Recipient workload may include workload for the orientation and co-ordination of volunteers for Child Life service delivery. Note 6: Attendance days for Respiratory Services were discontinued in 2008/09 and replaced by procedures. Note 7: For Radiation Oncology, Zone 2 includes the workload units for two RNs. Note 8: For Radiation Oncology, treatment fractionations and techniques vary across centres which accounts for differences in indicator results.
May 2015 Section IV - Page 51

Section IV - Functional Centre ReportSection IV - Functional Centre ReportSection IV - Functional Centre Report2013/2014 Annual Report of Hospital Services
Table IV-8(d): Other Diagnostic and Therapeutic Percent Workload by Service Recipient - 2013/2014 - Page 1d
Organization English Short Name Total Inpatient % Total Outpatient % Total Other Service Recipient %
Total Non Service Recipient %
Total Workload %
RRS A Zone 1 37.2% 39.4% 0.3% 23.0% 100.0% RRS A Zone 4 52.3% 28.9% 0.0% 18.8% 100.0% RRS A Zone 5 59.4% 19.2% 1.8% 19.5% 100.0% RRS A Zone 6 36.0% 38.4% 1.0% 24.6% 100.0%
RHA B Zone 1 46.1% 33.8% 0.0% 20.2% 100.0% RHA B Zone 2 51.6% 30.4% 0.3% 17.7% 100.0% RHA B Zone 3 41.5% 31.4% 3.1% 24.0% 100.0% RHA B Zone 7 50.9% 26.2% 1.5% 21.5% 100.0%
RRS A 44.2% 33.0% 0.8% 22.0% 100.0%
RHA B 47.1% 31.1% 1.2% 20.6% 100.0%
Total 46.0% 31.9% 1.1% 21.1% 100.0%
Note 1: Outpatient Workload may include Day Surgery for some RHAs. Note 2: "Other Service Recipient" Workload includes Sold Services. Note 3: In RRS A, hospital-based therapies working in a community setting report worked hrs, expenses but no workload. This impacts indicators such as productivity. Note 4: Speech Language Pathology excludes the Early Language Services Program. Note 5: Child Life Non-Service Recipient workload may include workload for the orientation and co-ordination of volunteers for Child Life service delivery. Note 6: Attendance days for Respiratory Services were discontinued in 2008/09 and replaced by procedures. Note 7: For Radiation Oncology, Zone 2 includes the workload units for two RNs. Note 8: For Radiation Oncology, treatment fractionations and techniques vary across centres which accounts for differences in indicator results.
May 2015 Section IV - Page 52

Note 1: In some RHAs, productivity indicators are impacted by staff requirements to travel between sites to deliver care. Note 2: In RRS A, hospital-based therapies working in a community setting report worked hrs, expenses but no workload. This impacts indicators such as productivity.
Section IV - Functional Centre ReportSection IV - Functional Centre ReportSection IV - Functional Centre Report2013/2014 Annual Report of Hospital Services
Organization English Short Name
Service Recipient
Productivity %
Total Productivity %
Physiotherapy
Service Recipient
Productivity %
Total Productivity %
Occupational Therapy
Service Recipient
Productivity %
Total Productivity %
Social Work
Service Recipient
Productivity %
Total Productivity %
Psychology
Service Recipient
Productivity %
Total Productivity %
Respiratory Services
Service Recipient
Productivity %
Total Productivity %
Clinical Nutrition
RRS A Zone 1 76.7% 93.9% 69.1% 90.4% 76.8% 99.1% 61.8% 97.6% 48.0% 58.4% 67.0% 93.9% RRS A Zone 4 84.1% 95.6% 78.2% 92.0% 75.3% 91.3% 65.0% 95.2% 56.4% 73.4% 67.5% 93.6% RRS A Zone 5 76.3% 90.1% 74.8% 93.1% 84.0% 99.3% 66.8% 87.5% 43.4% 58.3% 68.0% 97.1% RRS A Zone 6 68.0% 95.2% 74.7% 92.7% 76.1% 89.2% 73.8% 94.3% 55.4% 72.0% 56.4% 96.2%
RHA B Zone 1 73.0% 88.4% 72.0% 90.1% 68.6% 85.0% 74.8% 93.9% 59.8% 81.3% 72.3% 92.9% RHA B Zone 2 78.5% 93.1% 72.4% 89.1% 79.9% 92.4% 73.1% 87.5% 55.6% 68.2% 77.4% 92.4% RHA B Zone 3 73.0% 92.5% 66.4% 91.3% 76.1% 95.8% 66.2% 86.3% 55.4% 74.2% 72.8% 97.6% RHA B Zone 7 76.9% 96.0% 75.9% 96.4% 71.7% 90.8% 0.0% 0.0% 53.3% 71.0% 82.4% 103.0%
RRS A 64.3% 95.1% 73.4% 92.0% 75.7% 93.7% 66.9% 93.3% 51.5% 66.0% 78.8% 95.6%
RHA B 75.3% 95.4% 70.2% 90.6% 75.2% 92.0% 70.5% 89.0% 56.1% 72.4% 75.1% 91.9%
Total 70.4% 95.2% 71.4% 91.1% 75.3% 92.5% 68.8% 91.1% 54.1% 69.6% 76.6% 93.3%
Table IV-8(e) Other Diagnostic and Therapeutic Productivity Percentage - 2013/2014
Organization English Short Name
Service Recipient
Productivity %
Total Productivity
%
Audiology
Service Recipient
Productivity %
Total Productivity
%
Speech Language Pathology
Service Recipient
Productivity %
Total Productivity
%
Recreation
Service Recipient
Productivity %
Total Productivity
%
Child Life
Service Recipient
Productivity %
Total Productivity
%
Radiation Oncology
Service Recipient
Productivity %
Total Productivity
%
Sleep Studies Overall Service
Recipient Productivity
%
Overall Total Productivity
%
RRS A Zone 1 62.3% 87.2% 69.7% 87.1% 83.4% 92.2% 0.0% 0.0% 55.5% 74.2% 102.7% 115.5% 64.8% 84.1% RRS A Zone 4 71.0% 93.0% 83.2% 92.8% 83.3% 102.9% 0.0% 0.0% 0.0% 0.0% 0.0% 0.0% 72.2% 88.9% RRS A Zone 5 64.1% 73.8% 86.3% 96.9% 75.8% 93.4% 0.0% 0.0% 0.0% 0.0% 0.0% 0.0% 70.4% 87.4% RRS A Zone 6 89.2% 92.3% 85.9% 109.7% 0.0% 0.0% 0.0% 0.0% 0.0% 0.0% 0.0% 0.0% 66.9% 88.6%
RHA B Zone 1 74.9% 93.6% 76.0% 94.1% 71.3% 88.4% 63.8% 68.1% 0.0% 0.0% 0.0% 0.0% 70.5% 88.3% RHA B Zone 2 68.7% 84.1% 72.4% 93.3% 77.2% 98.1% 56.4% 59.3% 61.6% 77.9% 50.9% 62.6% 69.4% 84.3% RHA B Zone 3 61.1% 83.7% 68.5% 93.8% 70.5% 96.6% 63.1% 78.4% 0.0% 0.0% 0.0% 0.0% 68.6% 90.3% RHA B Zone 7 62.1% 83.3% 74.9% 94.2% 71.7% 92.5% 0.0% 0.0% 0.0% 0.0% 0.0% 0.0% 70.6% 89.9%
RRS A 74.0% 88.4% 0.0% 0.0% 55.5% 74.2% 78.7% 95.0% 80.4% 98.1% 67.7% 86.8% 102.7% 115.5%
RHA B 68.0% 86.6% 59.4% 65.8% 61.6% 77.9% 74.3% 95.8% 71.9% 93.7% 69.5% 87.4% 50.9% 62.6%
Total 59.4% 65.8% 58.7% 76.1% 75.9% 95.6% 74.7% 95.1% 68.8% 87.2% 70.5% 87.3% 70.4% 82.5%
May 2015 Section IV - Page 53

2013/2014 Annual Report of Hospital Services Section IV - Functional Centre Report
Table IV-9(a): Extra Mural Total Expenses, Worked Hours and Statistics by Functional Centre - 2013/2014 - Page 1 of 3
RHA ZoneExpenses UPP - Worked
HoursUPP - Benefit
HoursAttendance
DaysVisits Telephone
Contacts
EMP Nursing
Expenses UPP - Worked Hours
UPP - Benefit Hours
Attendance Days
Visits Telephone Contacts
EMP Occupational Therapy
RRS A Zone 1 5,005,928 77,462 17,409 45,821 47,094 16,091 756,318 15,208 3,427 7,081 7,347 2,050 RRS A Zone 4 3,869,359 59,755 15,573 34,016 34,863 15,320 494,027 9,926 1,948 2,862 2,912 1,739 RRS A Zone 5 1,520,407 24,341 7,244 13,386 13,503 4,760 257,246 6,333 1,164 1,148 1,167 1,056 RRS A Zone 6 4,517,192 67,016 18,955 31,208 31,694 14,352 611,470 11,554 2,943 2,997 3,057 1,431
RHA B Zone 1 5,478,443 79,471 16,701 38,176 38,838 11,419 632,816 13,493 2,105 3,157 3,216 1,874 RHA B Zone 2 7,730,499 120,209 28,557 69,346 70,548 19,124 1,195,059 24,466 4,805 7,849 8,013 4,913 RHA B Zone 3 8,116,493 117,524 27,892 62,292 63,003 20,929 946,393 19,644 4,234 7,284 7,422 2,924 RHA B Zone 7 2,416,292 33,102 9,198 20,087 20,804 7,560 397,147 7,180 1,822 3,182 3,718 994
228,575 43,021 59,181 9,482 127,154 14,483 50,523 6,276 RRS A 14,912,885 2,119,061 124,431 14,088
350,305 64,783 82,349 12,966 193,193 22,369 59,032 10,705 RHA B 23,741,727 3,171,415 189,901 21,472
Total 578,880 107,804 141,529 22,448 320,347 36,852 109,555 16,981 38,654,613 5,290,476 314,332 35,560
Expenses UPP - Worked Hours
UPP - Benefit Hours
Attendance Days
Visits Telephone Contacts
EMP Speech Language
Expenses UPP - Worked Hours
UPP - Benefit Hours
Attendance Days
Visits Telephone Contacts
EMP Clinical Nutrition
RRS A Zone 1 90,968 1,642 277 650 660 195 230,691 4,402 1,056 1,707 1,713 448 RRS A Zone 4 90,009 1,661 238 733 743 125 229,281 3,840 1,646 1,579 1,589 786 RRS A Zone 5 81,453 1,753 254 382 389 251 85,298 1,627 329 587 589 162 RRS A Zone 6 83,212 1,641 -242 465 471 432 229,792 3,796 1,323 1,690 1,703 571
RHA B Zone 1 101,293 1,513 436 244 244 204 229,591 4,112 761 1,516 1,522 1,114 RHA B Zone 2 114,958 2,334 407 836 844 732 478,787 9,002 2,109 3,572 3,600 1,866 RHA B Zone 3 243,939 4,006 1,063 1,345 1,359 196 459,915 8,766 1,928 4,280 4,302 1,771 RHA B Zone 7 166,244 2,033 351 553 599 157 60,113 1,271 -11 346 348 202
RRS A 345,642 6,697 527 2,263 1,003 775,062 13,666 4,353 5,594 1,967 2,230 5,563
RHA B 626,434 9,886 2,257 3,046 1,289 1,228,408 23,151 4,787 9,772 4,953 2,978 9,714
Total 972,076 16,583 2,785 5,309 2,292 2,003,470 36,817 9,140 15,366 6,920 5,208 15,277
Note 1: All numbers include clients and not uniquely identified service recipients. Note 2: Worked hours include regular, overtime and callback. Note 3: All statistics presented in this table, including telephone contacts, are based on the MIS guidelines definitions. Note 4: Excludes Administration, Discharge coordinators and EMP Aide/Personal Care contracted services.
May 2015 Section IV - Page 54
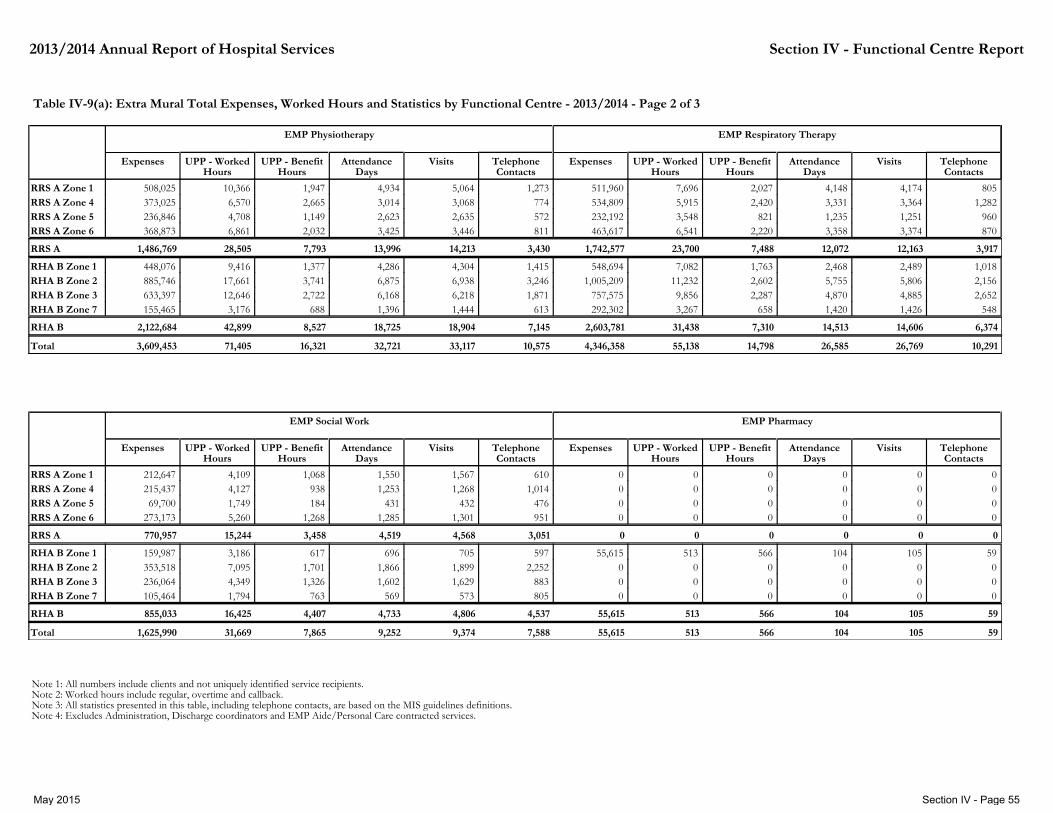
2013/2014 Annual Report of Hospital Services Section IV - Functional Centre Report
Table IV-9(a): Extra Mural Total Expenses, Worked Hours and Statistics by Functional Centre - 2013/2014 - Page 2 of 3
RHA ZoneExpenses UPP - Worked
HoursUPP - Benefit
HoursAttendance
DaysVisits Telephone
Contacts
EMP Physiotherapy
Expenses UPP - Worked Hours
UPP - Benefit Hours
Attendance Days
Visits Telephone Contacts
EMP Respiratory Therapy
RRS A Zone 1 508,025 10,366 1,947 4,934 5,064 1,273 511,960 7,696 2,027 4,148 4,174 805 RRS A Zone 4 373,025 6,570 2,665 3,014 3,068 774 534,809 5,915 2,420 3,331 3,364 1,282 RRS A Zone 5 236,846 4,708 1,149 2,623 2,635 572 232,192 3,548 821 1,235 1,251 960 RRS A Zone 6 368,873 6,861 2,032 3,425 3,446 811 463,617 6,541 2,220 3,358 3,374 870
RHA B Zone 1 448,076 9,416 1,377 4,286 4,304 1,415 548,694 7,082 1,763 2,468 2,489 1,018 RHA B Zone 2 885,746 17,661 3,741 6,875 6,938 3,246 1,005,209 11,232 2,602 5,755 5,806 2,156 RHA B Zone 3 633,397 12,646 2,722 6,168 6,218 1,871 757,575 9,856 2,287 4,870 4,885 2,652 RHA B Zone 7 155,465 3,176 688 1,396 1,444 613 292,302 3,267 658 1,420 1,426 548
28,505 23,700 7,793 7,488 14,213 12,163 3,430 3,917 RRS A 1,486,769 1,742,577 13,996 12,072
42,899 31,438 8,527 7,310 18,904 14,606 7,145 6,374 RHA B 2,122,684 2,603,781 18,725 14,513
Total 71,405 55,138 16,321 14,798 33,117 26,769 10,575 10,291 3,609,453 4,346,358 32,721 26,585
Expenses UPP - Worked Hours
UPP - Benefit Hours
Attendance Days
Visits Telephone Contacts
EMP Social Work
Expenses UPP - Worked Hours
UPP - Benefit Hours
Attendance Days
Visits Telephone Contacts
EMP Pharmacy
RRS A Zone 1 212,647 4,109 1,068 1,550 1,567 610 0 0 0 0 0 0 RRS A Zone 4 215,437 4,127 938 1,253 1,268 1,014 0 0 0 0 0 0 RRS A Zone 5 69,700 1,749 184 431 432 476 0 0 0 0 0 0 RRS A Zone 6 273,173 5,260 1,268 1,285 1,301 951 0 0 0 0 0 0
RHA B Zone 1 159,987 3,186 617 696 705 597 55,615 513 566 104 105 59 RHA B Zone 2 353,518 7,095 1,701 1,866 1,899 2,252 0 0 0 0 0 0 RHA B Zone 3 236,064 4,349 1,326 1,602 1,629 883 0 0 0 0 0 0 RHA B Zone 7 105,464 1,794 763 569 573 805 0 0 0 0 0 0
RRS A 770,957 15,244 3,458 4,568 3,051 4,519 0 0 0 0 0 0
RHA B 855,033 16,425 4,407 4,806 4,537 4,733 55,615 513 566 104 105 59
Total 1,625,990 31,669 7,865 9,374 7,588 9,252 55,615 513 566 104 105 59
Note 1: All numbers include clients and not uniquely identified service recipients. Note 2: Worked hours include regular, overtime and callback. Note 3: All statistics presented in this table, including telephone contacts, are based on the MIS guidelines definitions. Note 4: Excludes Administration, Discharge coordinators and EMP Aide/Personal Care contracted services.
May 2015 Section IV - Page 55

2013/2014 Annual Report of Hospital Services Section IV - Functional Centre Report
Table IV-9(a): Extra Mural Total Expenses, Worked Hours and Statistics by Functional Centre - 2013/2014 - Page 3 of 3
RHA ZoneExpenses UPP - Worked
HoursUPP - Benefit
HoursAttendance
DaysVisits Telephone
Contacts
EMP Rehab Assistant
Expenses UPP - Worked Hours
UPP - Benefit Hours
Attendance Days
Visits Telephone Contacts
Total
RRS A Zone 1 0 0 0 0 0 0 7,316,538 120,885 27,211 65,891 67,619 21,472 RRS A Zone 4 29,383 1,423 116 1,092 1,098 110 5,835,329 93,217 25,543 47,880 48,905 21,150 RRS A Zone 5 0 0 0 411 415 35 2,483,141 44,060 11,145 20,203 20,381 8,272 RRS A Zone 6 48,951 1,642 125 631 634 164 6,596,279 104,311 28,624 45,059 45,680 19,582
RHA B Zone 1 0 0 0 0 0 0 7,654,516 118,787 24,326 50,647 51,423 17,700 RHA B Zone 2 0 0 0 0 0 0 11,763,777 191,999 43,922 96,099 97,648 34,289 RHA B Zone 3 0 0 0 0 0 0 11,393,775 176,791 41,452 87,841 88,818 31,226 RHA B Zone 7 0 0 0 14 14 3 3,593,028 51,823 13,469 27,567 28,926 10,882
RRS A 22,231,288 362,473 92,523 179,033 182,585 70,476 78,334 3,064 240 2,134 2,147 309
RHA B 34,405,096 539,400 123,169 262,154 266,815 94,097 0 0 0 14 14 3
Total 56,636,384 901,873 215,692 441,187 449,400 164,573 78,334 3,064 240 2,148 2,161 312
Note 1: All numbers include clients and not uniquely identified service recipients. Note 2: Worked hours include regular, overtime and callback. Note 3: All statistics presented in this table, including telephone contacts, are based on the MIS guidelines definitions. Note 4: Excludes Administration, Discharge coordinators and EMP Aide/Personal Care contracted services.
May 2015 Section IV - Page 56

2013/2014 Annual Report of Hospital Services Section IV - Functional Centre Report
Table IV-9(b): Extra Mural Workload Units by Functional Centre - 2013/2014
Region
Service Recipient Workload
Units
Travel to/from Service Recipient
(NSR activity) Workload Units
Non Service Recipient Workload
Units
Total Workload
Units
EMP Nursing
Service Recipient Workload
Units
Travel to/from Service Recipient
(NSR activity) Workload Units
Non Service Recipient Workload
Units
Total Workload
Units
EMP Occupational Therapy
Service Recipient Workload
Units
Travel to/from Service Recipient
(NSR activity) Workload Units
Non Service Recipient Workload
Units
Total Workload
Units
EMP Physiotherapy
RRS A Zone 1 2,966,672 773,046 499,990 4,239,709 652,135 112,546 140,222 904,903 403,717 77,022 90,651 571,390 RRS A Zone 4 2,521,153 439,676 416,075 3,376,904 435,290 58,149 57,793 551,232 266,126 43,013 47,907 357,046 RRS A Zone 5 811,625 244,068 209,638 1,265,332 211,310 28,719 34,594 274,623 159,889 49,583 58,859 268,331 RRS A Zone 6 2,455,133 500,844 566,028 3,522,005 505,496 53,674 83,619 642,789 258,005 63,575 61,383 382,963
RHA B Zone 1 2,890,746 566,643 882,546 4,339,935 527,183 61,105 156,993 745,281 328,623 73,613 114,326 516,562 RHA B Zone 2 4,224,667 1,167,043 933,298 6,325,008 938,490 161,294 237,438 1,337,222 664,619 148,576 164,024 977,218 RHA B Zone 3 4,204,403 1,193,696 913,440 6,311,538 805,659 163,440 141,338 1,110,437 483,023 138,581 95,972 717,577 RHA B Zone 7 1,195,337 346,998 235,497 1,777,832 254,933 63,658 106,474 425,066 122,255 29,710 26,805 178,770
8,754,583 1,804,231 1,087,737 12,403,949 2,373,548 1,579,730 RRS A 1,957,635 253,089 233,194 1,691,731 316,228 258,799
12,515,153 2,526,265 1,598,520 18,754,313 3,618,006 2,390,127 RHA B 3,274,379 449,498 390,480 2,964,781 642,244 401,127
Total 21,269,736 4,330,496 2,686,257 31,158,262 5,991,554 3,969,857 5,232,014 702,587 623,674 4,656,512 958,471 659,926
Region
Service Recipient Workload
Units
Travel to/from Service Recipient
(NSR activity) Workload Units
Non Service Recipient Workload
Units
Total Workload
Units
EMP Clinical Nutrition
Service Recipient Workload
Units
Travel to/from Service Recipient
(NSR activity) Workload Units
Non Service Recipient Workload
Units
Total Workload
Units
EMP Social Work
Service Recipient Workload
Units
Travel to/from Service Recipient
(NSR activity) Workload Units
Non Service Recipient Workload
Units
Total Workload
Units
EMP Pharmacy
RRS A Zone 1 125,147 41,220 75,523 241,890 170,010 37,535 25,850 233,395 0 0 0 0 RRS A Zone 4 153,915 40,032 21,467 215,415 168,176 32,669 30,901 231,746 0 0 0 0 RRS A Zone 5 54,130 16,645 19,346 90,121 74,150 12,670 11,655 98,475 0 0 0 0 RRS A Zone 6 145,678 44,426 41,481 231,586 218,204 29,986 37,589 285,779 0 0 0 0
RHA B Zone 1 172,136 28,659 37,940 238,735 138,248 29,107 20,493 187,848 18,460 3,035 7,575 29,070 RHA B Zone 2 312,225 85,504 87,186 484,914 280,892 54,678 72,270 407,840 0 0 0 0 RHA B Zone 3 328,953 98,716 75,208 502,877 168,923 43,268 39,768 251,959 0 0 0 0 RHA B Zone 7 39,485 10,495 20,969 70,949 70,062 14,031 17,221 101,314 0 0 0 0
RRS A 478,870 779,012 630,540 849,394 0 0 142,324 112,860 0 157,817 105,994 0
RHA B 852,799 1,297,476 658,125 948,961 18,460 29,070 223,374 141,084 3,035 221,303 149,752 7,575
Total 1,331,669 2,076,487 1,288,665 1,798,356 18,460 29,070 365,698 253,944 3,035 379,120 255,746 7,575
Note 1: All numbers include clients and not uniquely identified service recipients. Note 2: Workload Units are reported in minutes. Note 3: Excludes Administration, Discharge Planners and EMP Aide/Personal Care contracted services.
May 2015 Section IV - page 57

2013/2014 Annual Report of Hospital Services Section IV - Functional Centre Report
Table IV-9(b): Extra Mural Workload Units by Functional Centre - 2013/2014
Region
Service Recipient Workload
Units
Travel to/from Service Recipient
(NSR activity) Workload Units
Non Service Recipient Workload
Units
Total Workload
Units
EMP Respiratory Therapy
Service Recipient Workload
Units
Travel to/from Service Recipient
(NSR activity) Workload Units
Non Service Recipient Workload
Units
Total Workload
Units
EMP Speech Language
RRS A Zone 1 239,801 84,835 53,082 377,718 60,310 13,850 16,245 90,405 RRS A Zone 4 259,344 43,255 39,460 342,059 74,450 20,275 7,180 101,905 RRS A Zone 5 128,386 29,635 31,661 189,681 69,620 12,055 4,056 85,731 RRS A Zone 6 251,475 56,550 45,069 353,095 74,540 16,330 8,906 99,776
RHA B Zone 1 246,063 59,905 108,349 414,317 54,190 10,539 17,075 81,804 RHA B Zone 2 420,297 125,577 98,383 644,257 87,670 23,548 19,015 130,233 RHA B Zone 3 363,086 126,212 85,217 574,515 131,650 36,551 44,856 213,057 RHA B Zone 7 104,525 33,075 48,592 186,192 75,789 15,856 14,934 106,579
879,006 1,262,553 RRS A 278,920 377,818 214,275 62,511 169,272 36,387
1,133,971 1,819,282 RHA B 349,299 531,672 344,769 86,494 340,542 95,879
Total 2,012,977 3,081,835 628,219 909,490 559,044 149,005 509,813 132,266
Region
Service Recipient Workload
Units
Travel to/from Service Recipient
(NSR activity) Workload Units
Non Service Recipient Workload
Units
Total Workload
Units
EMP Rehab Assistant
Service Recipient Workload
Units
Travel to/from Service Recipient
(NSR activity) Workload Units
Non Service Recipient Workload
Units
Total Workload
Units
Total
RRS A Zone 1 0 0 0 0 4,617,792 1,140,056 901,562 6,659,411 RRS A Zone 4 65,685 16,365 19,721 101,771 3,944,139 693,436 640,504 5,278,079 RRS A Zone 5 47,662 12,750 16,936 77,348 1,556,772 406,126 386,744 2,349,642 RRS A Zone 6 56,810 18,445 12,970 88,225 3,965,341 783,832 857,045 5,606,218
RHA B Zone 1 0 0 0 0 4,375,649 832,605 1,345,298 6,553,552 RHA B Zone 2 0 0 450 450 6,928,860 1,766,218 1,612,064 10,307,142 RHA B Zone 3 0 0 0 0 6,485,697 1,800,465 1,395,798 9,681,960 RHA B Zone 7 951 660 3,224 4,835 1,863,337 514,484 473,717 2,851,537
RRS A 267,345 170,157 47,561 49,627 14,084,044 3,023,450 2,785,855 19,893,349
RHA B 5,285 951 660 3,674 19,653,543 4,913,772 4,826,876 29,394,191
Total 272,630 171,108 48,221 53,301 33,737,587 7,937,222 7,612,731 49,287,540
Note 1: All numbers include clients and not uniquely identified service recipients. Note 2: Workload Units are reported in minutes. Note 3: Excludes Administration, Discharge Planners and EMP Aide/Personal Care contracted services.
May 2015 Section IV - page 58

2013/2014 Annual Report of Hospital Services Section IV - Functional Centre Report
Table IV-9(c): Extra Mural Indicators by Functional Centre - 2013/2014
Region
Cost per Visit
Cost per UPP
Worked Hour
Total Workload Units per Worked
Hour
EMP Nursing
Cost per Visit
Cost per UPP
Worked Hour
Total Workload Units per Worked
Hour
EMP Occupational Therapy
Cost per Visit
Cost per UPP
Worked Hour
Total Workload Units per Worked
Hour
EMP Physiotherapy
Cost per Visit
Cost per UPP
Worked Hour
Total Workload Units per Worked
Hour
EMP Respiratory Therapy
Cost per Visit
Cost per UPP
Worked Hour
Total Workload Units per Worked
Hour
EMP Speech Language
RRS A Zone 1 106.30 64.62 54.73 102.94 49.73 59.50 100.32 49.01 55.12 122.65 66.52 49.08 137.83 55.40 55.06RRS A Zone 4 110.99 64.75 56.51 169.65 49.77 55.53 121.59 56.78 54.35 158.98 90.42 57.83 121.14 54.18 61.34RRS A Zone 5 112.60 62.46 51.98 220.43 40.62 43.36 89.88 50.31 56.99 185.60 65.44 53.46 209.39 46.46 48.90RRS A Zone 6 142.53 67.40 52.55 200.02 52.92 55.63 107.04 53.76 55.81 137.41 70.88 53.98 176.67 50.71 60.80
RHA B Zone 1 141.06 68.94 54.61 196.77 46.90 55.23 104.11 47.59 54.86 220.45 77.47 58.50 415.14 66.94 54.06RHA B Zone 2 110.56 64.31 52.62 149.79 48.85 54.66 128.20 50.15 55.33 173.25 89.50 57.36 136.69 49.25 55.80RHA B Zone 3 128.83 69.06 53.70 127.51 48.18 56.53 101.87 50.09 56.74 155.08 76.86 58.29 179.50 60.89 53.18RHA B Zone 7 116.15 73.00 53.71 106.82 55.32 59.20 107.66 48.94 56.28 204.98 89.46 56.99 277.54 81.79 52.43
RRS A 117.28 65.24 54.27 146.31 49.26 55.17 104.61 52.16 55.42 143.27 73.53 53.27 152.74 51.61 56.41
RHA B 123.29 67.77 53.54 142.00 48.95 55.85 112.46 49.48 55.71 178.32 82.82 57.87 205.86 63.37 53.78
120.90 143.70 109.09 162.39 Average 66.77 49.08 50.55 78.83 53.83 55.58 55.60 55.89 54.84 58.62 183.20
RHA Zone
Cost per Visit
Cost per UPP
Worked Hour
Total Workload Units per Worked
Hour
EMP Clinical Nutrition
Cost per Visit
Cost per UPP
Worked Hour
Total Workload Units per Worked
Hour
EMP Social Work
Cost per Visit
Cost per UPP
Worked Hour
Total Workload Units per Worked
Hour
EMP Pharmacy
Cost per Visit
Cost per UPP
Worked Hour
Total Workload Units per Worked
Hour
EMP Rehab Assistant Total Cost per Visit
Total Cost per UPP Worked
Hour
Total Workload Units per Worked
Hour
RRS A Zone 1 134.67 52.41 54.95 135.70 51.75 56.80 0.00 0.00 0.00 0.00 0.00 0.00 108.20 60.52 55.09 RRS A Zone 4 144.29 59.71 56.10 169.90 52.20 56.15 0.00 0.00 0.00 26.76 20.65 71.53 119.32 62.60 56.62 RRS A Zone 5 144.82 52.41 55.38 161.34 39.86 56.32 0.00 0.00 0.00 0.00 0.00 0.00 121.84 56.36 53.33 RRS A Zone 6 134.93 60.53 61.00 209.97 51.94 54.34 0.00 0.00 0.00 77.21 29.82 53.74 144.40 63.24 53.75
RHA B Zone 1 150.85 55.83 58.05 226.93 50.21 58.95 529.66 108.41 56.67 0.00 0.00 0.00 148.85 64.44 55.17 RHA B Zone 2 133.14 53.19 53.87 186.26 49.83 57.48 0.00 0.00 0.00 0.00 0.00 0.00 121.34 61.27 53.68 RHA B Zone 3 106.91 52.47 57.37 144.91 54.28 57.93 0.00 0.00 0.00 0.00 0.00 0.00 128.28 64.45 54.77 RHA B Zone 7 172.74 47.30 55.83 184.06 58.79 56.47 0.00 0.00 0.00 0.00 0.00 0.00 124.21 69.33 55.02
RRS A 138.55 56.72 57.01 168.77 50.57 55.72 121.76 61.33 54.88 0.00 0.00 0.00 87.25 25.56 36.49
RHA B 125.76 53.06 56.04 177.95 52.06 57.78 129.29 63.78 54.49 529.66 108.41 56.67 0.00 0.00 0.00
130.42 173.48 126.22 Average 54.42 51.34 62.80 56.40 56.79 54.65 529.66 108.41 56.67 88.97 25.56 36.25
Note 1: All numbers include clients and not uniquely identified service recipients. Note 2: Excludes Administration, Discharge Planners and EMP Aide/Personal Care contracted services.
May 2015 Section IV - page 59

Section IV - Functional Centre Report2013/2014 Annual Report of Hospital Services
Table IV-9(d): Extra-Mural - Total Expense (Shareable and Non Shareable) by Expense Account Type - 2013/2014
Account Type
RRS A Zone 1
RRS A Zone 4
RRS A Zone 5
RRS A Zone 6
Total
Régie régionale de la santé A
RHA B Zone 1
RHA B Zone 2
RHA B Zone 3
RHA B Zone 7
Total
Regional Health Authority B Total
SALARIES 6,206,578 5,030,554 2,267,429 5,904,618 19,409,179 6,226,620 10,361,320 9,549,221 2,973,771 29,110,931 48,520,110 BENEFIT CONTRIBUTIONS 918,853 776,257 335,783 877,568 2,908,462 847,267 1,454,127 1,381,278 433,766 4,116,439 7,024,901 MEDICAL & SURGICAL SUPPLIES 454,668 330,593 116,867 389,108 1,291,236 645,928 774,469 738,722 240,585 2,399,704 3,690,940 DRUGS 228,725 169,312 14,084 189,374 601,495 471,063 98,205 199,952 126,752 895,973 1,497,468 EQUIPMENT EXPENSE 604,038 318,354 224,581 492,109 1,639,082 403,206 695,625 700,761 287,847 2,087,439 3,726,521 OXYGEN 149,117 224,918 74,438 143,764 592,236 218,004 501,310 316,937 159,051 1,195,302 1,787,538 OTHER SUPPLIES 85,042 113,052 58,237 94,230 350,562 139,841 286,963 371,494 99,534 897,832 1,248,394 SUNDRY 394,375 359,338 19,363 618,772 1,391,849 502,037 1,011,193 584,082 62,152 2,159,464 3,551,313 REFERRED-OUT SERVICES 294,706 87,941 34,634 97,312 514,592 168,260 206,737 187,117 95,872 657,985 1,172,578 EQUIPMENT EXPENSE - AMORTIZATION 2,627 7,345 0 2,176 12,148 12,482 16,290 10,540 2,208 41,520 53,667 BUILDINGS & GROUNDS EXPENSE - UNDISTRIBUTED 7,591 25,511 0 3,333 36,436 0 8,033 0 0 8,033 44,469
Total 9,634,708 15,414,272 14,040,103 4,481,539 9,346,321 7,443,175 3,145,417 8,812,364 28,747,277 43,570,622 72,317,900
Note 1: Amortization is included in the functional centre expenses. Note 2: Vehicle expenses may have been reported under "Equipment Expenses", "Sundry" or "Other Supplies" depending on the nature of the expense. Note 3: Expenses for Drugs may be reported under "Other Supplies". Note 4: Excludes medical expenses, Administration, Discharge Planners and EMP Aide/Personal Care contracted services. Note 5: Includes costs associated with other Community Health Programs (eg. directors, managers, administrative staff)
May 2015 Section IV - Page 60

Section IV - Functional Centre Report2013/2014 Annual Report of Hospital Services
Table IV-9(e): Extra Mural Admissions, Discharges and Select Indicators 2013/2014
RHA Admissions Discharges Expenses Admissions per 1000 Population Estimate
Cost per EMP Discharge
RRS A Zone 1 2,940 2,546 9,346,321 3,671 RHA B Zone 1 2,286 2,466 9,634,708 3,907
RHA B Zone 2 4,985 5,060 15,414,272 29 3,046 RHA B Zone 3 3,905 3,753 14,040,103 23 3,741 RRS A Zone 4 1,653 1,733 7,443,175 33 4,295 RRS A Zone 5 786 741 3,145,417 29 4,245 RRS A Zone 6 2,303 2,247 8,812,364 29 3,922 RHA B Zone 7 1,236 1,185 4,481,539 27 3,782
5,226 5,012 18,981,030 26 3,787
20,094 19,731 72,317,900 27 Total 3,665
Note 1: This table considers Health Regions instead of RHAs because of population estimates. Note 2: Excludes medical expenses, Administration, Discharge Planners and EMP Aide/Personal Care contracted services Note 3: Includes costs associated with other Community Health Programs (e.g. directors, managers, administrative staff)
May 2015 Section IV - Page 61

2013/2014 Annual Report of Hospital Services Section IV - Functional Centre Report
Table IV-10(a): Laundry Services - 2013/2014
Note 1: A Patient (Service Recipient) Meal Day consists of a patient's food consumption (the equivalent of three meals and supplemental nourishments) for a day. Note 2: A Non-Patient (Non-Service Recipient) Meal Day is one that is provided to staff and visitors, and other clients who do not receive clinical services like meals on wheels' clients or nursing homes. Note 3: Non patient meal days have been added to the report to provide better reflection of actual activity within Food Services. Cost for these meal days must be recovered. Note 4: In Zone 7, Patient Food Services expenses include $9,272 for infant formula as a result of working towards the Baby-Friendly designation while no newborn days/Meal Days are credited. This translates into $0.16 of the patient meal day cost being attributed to formula costs. All the other zones still obtain formulas free of charge. Note 5: Hôpital régional Chaleur contracts out both Clinical Nutrition and Food Services. Note 6: In RRS A Zone 5, Hôpital régional de Campbellton supports the food production needs of Addiction Services, other in-house clients and Psychiatry which affects the total cost per meal-day of the RHA due to economies of scale. Since revenues are netted against expenses, the RHA's reported total cost per meal day comes out lower than the actual. Note 7: The cost per meal day of a small facility's production kitchen is usually higher than that of a larger facility due to economies of scale. The Meal Day cost of an RHA with a larger number of small facilities (e.g. RHA B Zone 3 with 6 operational kitchens) can be higher. The following identifies the number of hospital facilities supported by food services in each RHA: RRS A Zone 1 (3 facilities); RRS A Zone 4 (3 facilities); RRS A Zone 5 (4 sites); RRS A Zone 6 (4 facilities); RHA B Zone 1 (2 facilities); RHA B Zone 2 (7 facilities); RHA B Zone 3 (6 facilities); RHA B Zone 7 (1 facility). Note 8: In RRS A Zone 6 under Non-Patient Food Services, meal days are included for the Hôpital régional Chaleur while the corresponding expenses are not. Note 9: RHA B Zone 2 expenses include $238,238 in shared management salary/benefit for Food Services, Environmental Services and Patient Service Workers programs in 4 facilities. This additional cost has a significant impact on cost per meal day.
Region
Total Expenses ($) Kg Laundry Cost per Kg Laundry ($)
Laundry
RRS A Zone 1 1,304,803 815,822 1.60 RRS A Zone 4 1,225,111 629,622 1.95 RRS A Zone 5 1,173,022 574,085 2.04 RRS A Zone 6 1,276,647 799,942 1.60
RHA B Zone 1 2,172,468 1,419,520 1.53 RHA B Zone 2 6,815,338 2,496,527 2.73 RHA B Zone 3 2,343,475 1,648,648 1.42 RHA B Zone 7 976,612 386,733 2.53
2,819,471 4,979,583 RRS A 1.77
5,951,428 12,307,892 RHA B 2.07
Total 1.97 8,770,899 17,287,475
RHA Zone
Total Direct Expenses ($)
Patient Meal Days (SR)
Non-Patient Meal Days
(NSR)
Total Total Meal Days
Cost per Meal Day ($)
Patient Food Services
Total Direct Expenses ($)
Non-Patient Meal Days
(NSR)
Total Total Meal Days
Cost per Meal Day ($)
Non-Patient Food Services % Patient Meal Days
% Non-Patient Meal Days
RRS A Zone 1 4,013,472 140,967 1,074 142,041 28.26 875,948 48,205 48,205 18.17 74.1% 25.9% RRS A Zone 4 2,568,730 70,837 0 70,837 36.26 552,765 21,079 21,079 26.22 77.1% 22.9% RRS A Zone 5 3,219,228 109,454 0 109,454 29.41 217,427 9,230 9,230 23.56 92.2% 7.8% RRS A Zone 6 3,979,575 99,922 0 99,922 39.83 227,856 44,244 44,244 5.15 69.3% 30.7%
RHA B Zone 1 4,180,012 145,527 0 145,527 28.72 605,905 24,275 24,275 24.96 85.7% 14.3% RHA B Zone 2 8,562,190 280,223 27,710 307,933 27.81 2,690,291 91,874 91,874 29.28 70.1% 29.9% RHA B Zone 3 6,768,608 187,780 0 187,780 36.05 1,527,890 54,833 54,833 27.86 77.4% 22.6% RHA B Zone 7 1,833,884 59,228 0 59,228 30.96 427,682 12,468 12,468 34.30 82.6% 17.4%
RRS A 421,180 13,781,006 1,873,996 1,074 122,758 422,254 122,758 77.3% 32.64 15.27 22.7%
RHA B 672,758 21,344,695 5,251,767 27,710 183,450 700,468 183,450 76.1% 30.47 28.63 23.9%
306,208 7,125,763 28,784 1,093,938 Total 35,125,700 306,208 1,122,722 76.6% 31.29 23.27 23.4%
Note 1: In 2012/13, Laundry completed the transition to FacilicorpNB.
Table IV-10(b): Food Services - 2013/2014
May 2015 Section IV - Page 62

Section V
Surgical Wait Time Trends


2013/2014 Annual Report of Hospital Services
Section V: Surgical Wait times Trends This section will assist in the understanding of surgical wait time for the province of New Brunswick and individual Zones. The Provincial Surgical Access Registry is integrated with each of the province’s eight Zones and their respective perioperative systems. It contains information on every patient waiting for surgery or having had surgery in the province of New Brunswick. This system is used to monitor and manage access to surgery. Section V provides detailed information on surgical wait time. The wait time begins when the patient and the surgeon determine that the patient needs surgery and the booking request is received at the hospital. The wait time ends when the surgery is performed. The wait time reports show the median wait time in days that patients experience while waiting for surgery. This is reported for the province and each Zone. Wait times for cancer cases are reported separately. Surgical volumes are reported for both completed and cases waiting for the province and each Zone. New Brunswick has developed a clinical acuity model which standardizes the definition and time frames attached to patient prioritization. Each surgical request is prioritized by the surgeon who will be performing the surgery. The prioritization process follows the provincial clinical acuity model; this is calculated in the surgical access registry. The clinical acuity model has four categories. (See table below)
New Brunswick Clinical Acuity Model
Category Recommended Time
Frame December 31, 2014
Target I Within 3 weeks 90%
II Within 6 weeks 90%
III Within 3 months 90%
IV Within 12 months 100%
All surgeries to be completed within 12 months
100%
In December 2005 the provinces and territories established Pan Canadian benchmarks which were evidence based. (See table below)
Pan Canadian Benchmarks
Benchmarked procedures Recommended
Time Frame December 31, 2014 Target
Hip Replacement Surgery Within 26 weeks 85%
Knee Replacement Surgery Within 26 weeks 75%
Cataract Surgery Within 16 weeks 90%
Coronary Artery Bypass Graft Surgery – Level I Within 2 weeks 90%
Coronary Artery Bypass Graft Surgery – Level II Within 2-6 weeks 85%
Coronary Artery Bypass Graft Surgery – Level III Within 6-26 weeks 100%
Hip fracture fixation Within 48 hours 95%
May 2015 Section V - Page 1

2013/2014 Annual Report of Hospital Services
Recognizing that the recommended time frames in the clinical acuity model and the Pan Canadian benchmarks cannot be achieved in a short period of time, New Brunswick has set yearly targets (as indicated in the preceding tables) to achieve those time frames. Targets will be set for subsequent years. This section illustrates where surgical wait time is in relation to achieving the targets. Notes are included below many of the tables to explain certain inclusions, exclusions or variations in the data. Tables V-1(a) through V-1(d): Surgical Wait times (Median) in days for Surgeries Waiting and Completed Information is provided on median wait times provincially and by Zone. The wait time data is based on surgeries waiting at the end of each fiscal year, and also for surgeries completed during each fiscal year. The wait time for surgeries waiting is calculated from the date the surgical request is received at the OR booking office at the hospital, through to March 31st for each fiscal year. The wait time for surgeries completed is based on the surgeries completed during each fiscal year. Time frames in which a patient was not available to have surgery were excluded from the wait time calculation. The wait time is measured in days. The data excludes surgeries done emergently. Table V-1(a) and V-1(b) show the wait time for all surgeries, while Table V-1(c) and V-1(d) show the wait time for surgeries performed for proven or suspected cancer. Tables V-2(a) through V-2(f) Surgical Volumes for Surgeries Waiting and Completed Information is provided on the volume of surgeries waiting at the end of each fiscal year and the volume of surgeries completed during the same time frame. Surgeries that waited longer than 12 months and those that were completed having waited longer than 12 months are shown. Table V-2(a), V-2(c) and V-2(e) show the volume for surgeries waiting. Table V-2(b), V-2(d) and V-2(f) show the volume of surgical cases completed. Tables V-3(a) through V-3(e): Clinical Acuity Model Target Timeframe Information is provided on surgeries completed according to each component of the clinical acuity model’s target time frames. Recognizing that the recommended time frames in the clinical acuity model cannot be achieved in a short period of time, New Brunswick has set yearly targets (as indicated in the preceding tables) to achieve those time frames. Tables V-4(a) through V-4(e): Pan Canadian Benchmark Procedure Targets Information is provided on surgeries completed according to each of the surgical Pan Canadian benchmarks. Recognizing that the recommended time frames in the Pan Canadian benchmarks cannot be achieved in a short period of time, New Brunswick has set yearly targets (as indicated in the preceding tables) to achieve those time frames.
May 2015 Section V - Page 2

2012/2013 Annual Report of Hospital Services Section V - Surgical Wait Times
Median wait time for all Surgeries Waiting (in
days)
as of Mar. 31, 2011
as of Mar. 31, 2012
as of Mar. 31, 2013
% change from 10/11 to
12/13
Median wait time for all Surgeries Completed (in
days)2010/2011 2011/2012 2012/2013
% change from 10/11 to
12/13
Vitalité Zone 1 62 64 76 23% Vitalité Zone 1 48 45 39 -19%Vit lité Z 4 21 20 24 14% Vit lité Z 4 28 33 27 4%
Table V-1(a) Surgical Wait Time (Median) in days for surgeries waiting, by Zone - 2010/2011 to 2012/2013
Table V-1(b) Surgical Wait Time (Median) in days for surgeries completed, by Zone - 2010/2011 to 2012/2013
0
20
40
60
80
100
120
Wai
t Tim
e in
Day
s
Surgeries Waiting
as of Mar. 31, 2011 as of Mar. 31, 2012 as of Mar. 31, 2013
0
20
40
60
80
100
120
Wai
t Tim
e in
Day
s
Surgeries Completed
2010/2011 2011/2012 2012/2013
Vitalité Zone 4 21 20 24 14% Vitalité Zone 4 28 33 27 -4%Vitalité Zone 5 31 31 34 10% Vitalité Zone 5 36 30 36 0%Vitalité Zone 6 48 46 26 -46% Vitalité Zone 6 37 25 25 -32%Horizon Zone 1 99 92 82 -17% Horizon Zone 1 28 33 27 -4%Horizon Zone 2 64 73 74 16% Horizon Zone 2 49 44 36 -27%Horizon Zone 3 31 31 44 42% Horizon Zone 3 34 36 36 6%
Horizon Zone 7 14 14 17 21% Horizon Zone 7 21 21 25 19%
Provincial 51 55 58 14% Provincial 36 35 33 -8%
Note 3: Excludes emergency cases
Note 4: Excludes time for which the patient is not available for surgery
Note 5: Source data is from the Provincial Surgical Access Registry
Note 1: The median represents the wait time in days where ½ of the cases wait less than the median and ½ of the cases wait longer than the median.Note 2: Includes cases done in the Operating room by a surgeon for a procedure deemed surgical in nature
May 2015 Section V - Page 3
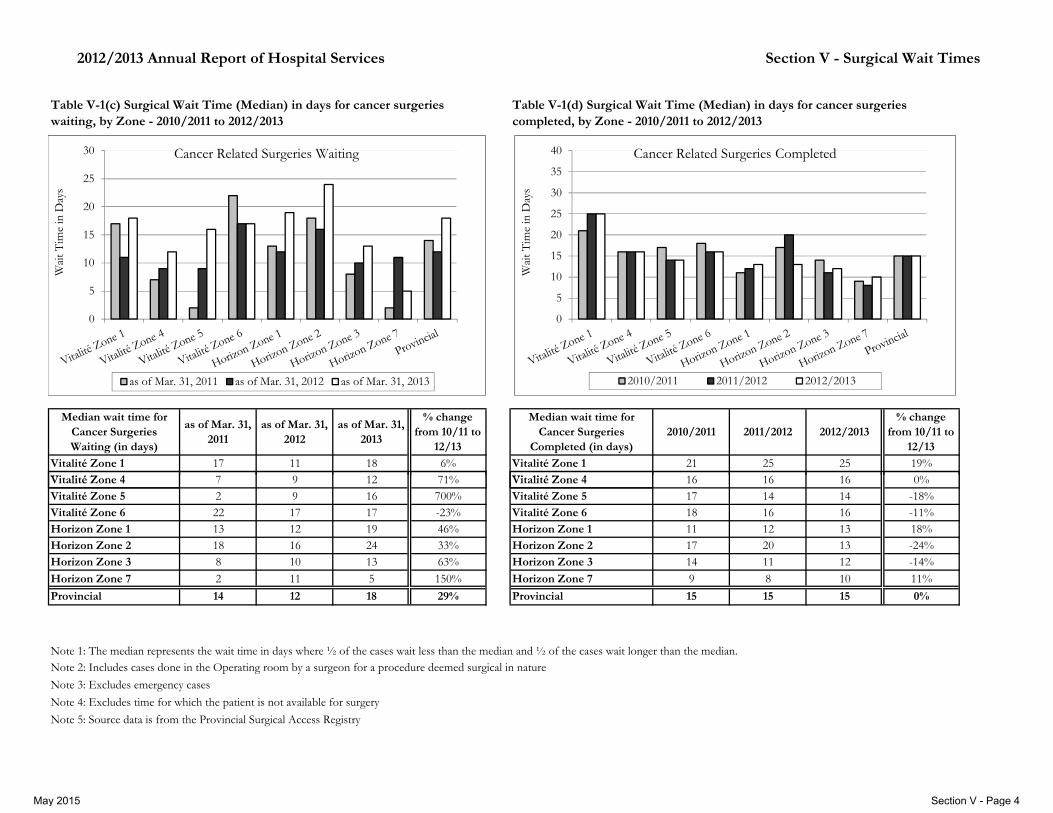
2012/2013 Annual Report of Hospital Services Section V - Surgical Wait Times
Median wait time for Cancer Surgeries Waiting (in days)
as of Mar. 31, 2011
as of Mar. 31, 2012
as of Mar. 31, 2013
% change from 10/11 to
12/13
Median wait time for Cancer Surgeries
Completed (in days)2010/2011 2011/2012 2012/2013
% change from 10/11 to
12/13
Vitalité Zone 1 17 11 18 6% Vitalité Zone 1 21 25 25 19%Vit lité Z 4 7 9 12 71% Vit lité Z 4 16 16 16 0%
Table V-1(c) Surgical Wait Time (Median) in days for cancer surgeries waiting, by Zone - 2010/2011 to 2012/2013
Table V-1(d) Surgical Wait Time (Median) in days for cancer surgeries completed, by Zone - 2010/2011 to 2012/2013
0
5
10
15
20
25
30
Wai
t Tim
e in
Day
s
Cancer Related Surgeries Waiting
as of Mar. 31, 2011 as of Mar. 31, 2012 as of Mar. 31, 2013
0
5
10
15
20
25
30
35
40
Wai
t Tim
e in
Day
s
Cancer Related Surgeries Completed
2010/2011 2011/2012 2012/2013
Vitalité Zone 4 7 9 12 71% Vitalité Zone 4 16 16 16 0%Vitalité Zone 5 2 9 16 700% Vitalité Zone 5 17 14 14 -18%Vitalité Zone 6 22 17 17 -23% Vitalité Zone 6 18 16 16 -11%Horizon Zone 1 13 12 19 46% Horizon Zone 1 11 12 13 18%Horizon Zone 2 18 16 24 33% Horizon Zone 2 17 20 13 -24%Horizon Zone 3 8 10 13 63% Horizon Zone 3 14 11 12 -14%
Horizon Zone 7 2 11 5 150% Horizon Zone 7 9 8 10 11%
Provincial 14 12 18 29% Provincial 15 15 15 0%
Note 3: Excludes emergency cases
Note 4: Excludes time for which the patient is not available for surgery
Note 5: Source data is from the Provincial Surgical Access Registry
Note 1: The median represents the wait time in days where ½ of the cases wait less than the median and ½ of the cases wait longer than the median.Note 2: Includes cases done in the Operating room by a surgeon for a procedure deemed surgical in nature
May 2015 Section V - Page 4

2012/2013 Annual Report of Hospital Services Section V - Surgical Wait Times
Table V-2(a): Number of surgeries waiting for the province - 2010/2011 to 2012/2013
Table V-2(b): Number of surgeries completed for the province - 2010/2011 to 2012/2013
656 641 586
14,767 14,636 14,909
0
2,000
4,000
6,000
8,000
10,000
12,000
14,000
16,000
18,000
as of Mar. 31, 2011 as of Mar. 31, 2012 as of Mar. 31, 2013
Number of surgeries waiting
883 830 639
54,898 55,463 54,712
0
10,000
20,000
30,000
40,000
50,000
60,000
2010/2011 2011/2012 2012/2013
Number of surgeries completed
Note 2: Excludes emergency casesNote 3: Source data is from the Provincial Surgical Access Registry
Note 1: Includes cases waiting to be done in the Operating room by a surgeon for a procedure deemed surgical in nature
Waiting >12 months Waiting <12 months Having waited>12 months Having waited<12 months
May 2015 Section V - Page 5
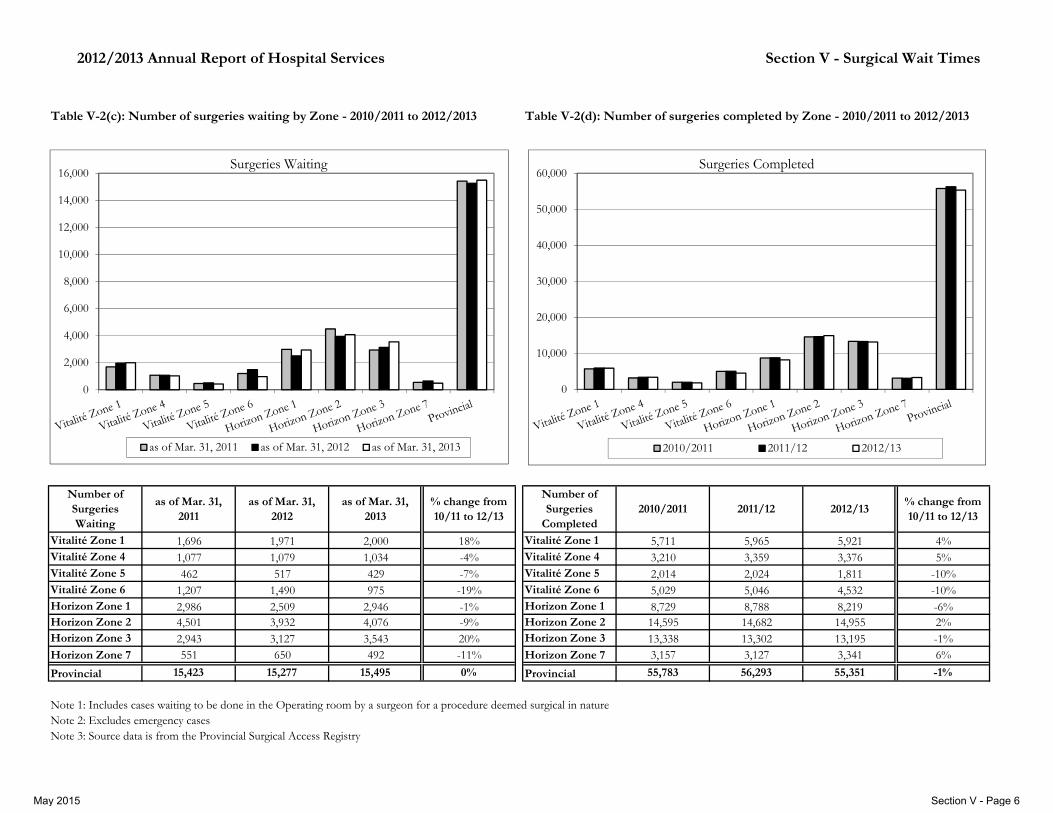
2012/2013 Annual Report of Hospital Services Section V - Surgical Wait Times
Table V-2(c): Number of surgeries waiting by Zone - 2010/2011 to 2012/2013 Table V-2(d): Number of surgeries completed by Zone - 2010/2011 to 2012/2013
0
2,000
4,000
6,000
8,000
10,000
12,000
14,000
16,000Surgeries Waiting
as of Mar. 31, 2011 as of Mar. 31, 2012 as of Mar. 31, 2013
0
10,000
20,000
30,000
40,000
50,000
60,000Surgeries Completed
2010/2011 2011/12 2012/13
Number of Surgeries Waiting
as of Mar. 31, 2011
as of Mar. 31, 2012
as of Mar. 31, 2013
% change from 10/11 to 12/13
Number of Surgeries
Completed2010/2011 2011/12 2012/13
% change from 10/11 to 12/13
Vitalité Zone 1 1,696 1,971 2,000 18% Vitalité Zone 1 5,711 5,965 5,921 4%Vitalité Zone 4 1,077 1,079 1,034 -4% Vitalité Zone 4 3,210 3,359 3,376 5%Vitalité Zone 5 462 517 429 -7% Vitalité Zone 5 2,014 2,024 1,811 -10%Vitalité Zone 6 1,207 1,490 975 -19% Vitalité Zone 6 5,029 5,046 4,532 -10%Horizon Zone 1 2,986 2,509 2,946 -1% Horizon Zone 1 8,729 8,788 8,219 -6%Horizon Zone 2 4,501 3,932 4,076 -9% Horizon Zone 2 14,595 14,682 14,955 2%Horizon Zone 3 2,943 3,127 3,543 20% Horizon Zone 3 13,338 13,302 13,195 -1%Horizon Zone 7 551 650 492 -11% Horizon Zone 7 3,157 3,127 3,341 6%
Provincial 15,423 15,277 15,495 0% Provincial 55,783 56,293 55,351 -1%
Note 2: Excludes emergency casesNote 3: Source data is from the Provincial Surgical Access Registry
Note 1: Includes cases waiting to be done in the Operating room by a surgeon for a procedure deemed surgical in nature
May 2015 Section V - Page 6

2012/2013 Annual Report of Hospital Services Section V - Surgical Wait Times
Number of as of Mar 31 as of Mar 31 as of Mar 31 % change from
Number of % change from
Table V-2(e): Number of surgeries waiting longer than 12 months by Zone - 2010/2011 to 2012/2013
Table V-2(f): Number of surgeries completed having waited longer than 12 months by Zone - 2010/2011 to 2012/2013
0
100
200
300
400
500
600
700
800
900 Surgeries Waiting
as of Mar. 31, 2011 as of Mar. 31, 2012 as of Mar. 31, 2013
0
100
200
300
400
500
600
700
800
900 Surgeries Completed
2010/2011 2011/2012 2012/2013
Surgeries Waiting
as of Mar. 31, 2011
as of Mar. 31, 2012
as of Mar. 31, 2013
% change from 10/11 to 12/13
Surgeries Completed
2010/2011 2011/2012 2012/2013% change from 10/11 to 12/13
Vitalité Zone 1 78 151 160 105% Vitalité Zone 1 156 135 132 -15%Vitalité Zone 4 0 0 0 - Vitalité Zone 4 0 0 0 -Vitalité Zone 5 0 1 0 - Vitalité Zone 5 2 0 9 350%Vitalité Zone 6 34 18 4 -88% Vitalité Zone 6 48 54 24 -50%Horizon Zone 1 405 337 315 -22% Horizon Zone 1 438 409 249 -43%Horizon Zone 2 116 108 69 -41% Horizon Zone 2 182 180 172 -5%Horizon Zone 3 23 26 38 65% Horizon Zone 3 57 52 53 -7%Horizon Zone 7 0 0 0 - Horizon Zone 7 0 0 0 -
Provincial 656 641 586 -11% Provincial 883 830 639 -28%
Note 2: Excludes emergency casesNote 3: Source data is from the Provincial Surgical Access RegistryNote 4: The number of surgeries presented in the tables above are included in the total surgical volumes presented in table V-2(c) and 2(d).
Note 1: Includes cases waiting to be done in the Operating room by a surgeon for a procedure deemed surgical in nature
May 2015 Section V - Page 7

2012/2013 Annual Report of Hospital Services Section V - Surgical Wait Times
Table V-3(a) - Category I: Percent of Surgeries Completed within 3 weeks
Surgeries Completed 2010/2011 2011/2012 2012/2013% change from 10/11 to 12/13
Dec 2013 NB Target
Table V-3 - Clinical Acuity Model Target Timeframe by Zone - 2010/2011 to 2012/2013
0%
10%
20%
30%
40%
50%
60%
70%
80%
90%
100%
Vitalité Zone 1 Vitalité Zone 4 Vitalité Zone 5 Vitalité Zone 6 Horizon Zone 1 Horizon Zone 2 Horizon Zone 3 Horizon Zone 7 Province
gVitalité Zone 1 44% 40% 44% 0% 95%Vitalité Zone 4 66% 59% 76% 10% 95%Vitalité Zone 5 55% 61% 76% 21% 95%Vitalité Zone 6 60% 66% 63% 3% 95%Horizon Zone 1 58% 60% 66% 8% 95%Horizon Zone 2 47% 47% 57% 10% 95%Horizon Zone 3 68% 70% 74% 6% 95%Horizon Zone 7 69% 71% 82% 13% 95%
Province 55% 55% 62% 7% 95%
Note 1: Includes cases waiting to be done in the Operating room by a surgeon for a procedure deemed surgical in natureNote 2: Excludes emergency casesNote 3: Excludes time for which the patient is not available for surgeryNote 4: Source data is from the Provincial Surgical Access Registry
May 2015 Section V - Page 8

2012/2013 Annual Report of Hospital Services Section V - Surgical Wait Times
Table V-3(b) - Category II: Percent of Surgeries Completed within 6 weeks
Surgeries Completed 2010/2011 2011/2012 2012/2013% change from 10/11 to 12/13
Dec 2013 NB Target
Vitalité Zone 1 54% 53% 60% 6% 90%Vitalité Zone 4 74% 78% 83% 9% 90%Vi li é Z 5 %
0%
10%
20%
30%
40%
50%
60%
70%
80%
90%
100%
Vitalité Zone 1 Vitalité Zone 4 Vitalité Zone 5 Vitalité Zone 6 Horizon Zone 1 Horizon Zone 2 Horizon Zone 3 Horizon Zone 7 Province
Vitalité Zone 5 59% 60% 61% 2% 90%Vitalité Zone 6 65% 73% 74% 9% 90%Horizon Zone 1 58% 57% 62% 4% 90%Horizon Zone 2 52% 52% 60% 8% 90%Horizon Zone 3 67% 63% 58% -9% 90%Horizon Zone 7 87% 84% 86% -1% 90%
Province 62% 61% 63% 1% 90%
Note 1: Includes cases waiting to be done in the Operating room by a surgeon for a procedure deemed surgical in natureNote 2: Excludes emergency casesNote 3: Excludes time for which the patient is not available for surgeryNote 4: Source data is from the Provincial Surgical Access Registry
May 2015 Section V - Page 9

2012/2013 Annual Report of Hospital Services Section V - Surgical Wait Times
Table V-3(c) - Category III: Percent of Surgeries Completed within 3 months
Surgeries Completed 2010/2011 2011/2012 2012/2013% change from 10/11 to 12/13
Dec 2013 NB Target
Vitalité Zone 1 61% 55% 57% -4% 90%Vitalité Zone 4 90% 85% 92% 2% 90%Vi li é Z 5 %
0%
10%
20%
30%
40%
50%
60%
70%
80%
90%
100%
Vitalité Zone 1 Vitalité Zone 4 Vitalité Zone 5 Vitalité Zone 6 Horizon Zone 1 Horizon Zone 2 Horizon Zone 3 Horizon Zone 7 Province
Vitalité Zone 5 84% 86% 79% -5% 90%Vitalité Zone 6 76% 72% 87% 11% 90%Horizon Zone 1 61% 58% 64% 3% 90%Horizon Zone 2 61% 61% 67% 6% 90%Horizon Zone 3 79% 77% 77% -2% 90%Horizon Zone 7 94% 91% 92% -2% 90%
Province 71% 69% 73% 2% 90%
Note 1: Includes cases waiting to be done in the Operating room by a surgeon for a procedure deemed surgical in natureNote 2: Excludes emergency casesNote 3: Excludes time for which the patient is not available for surgeryNote 4: Source data is from the Provincial Surgical Access Registry
May 2015 Section V - Page 10
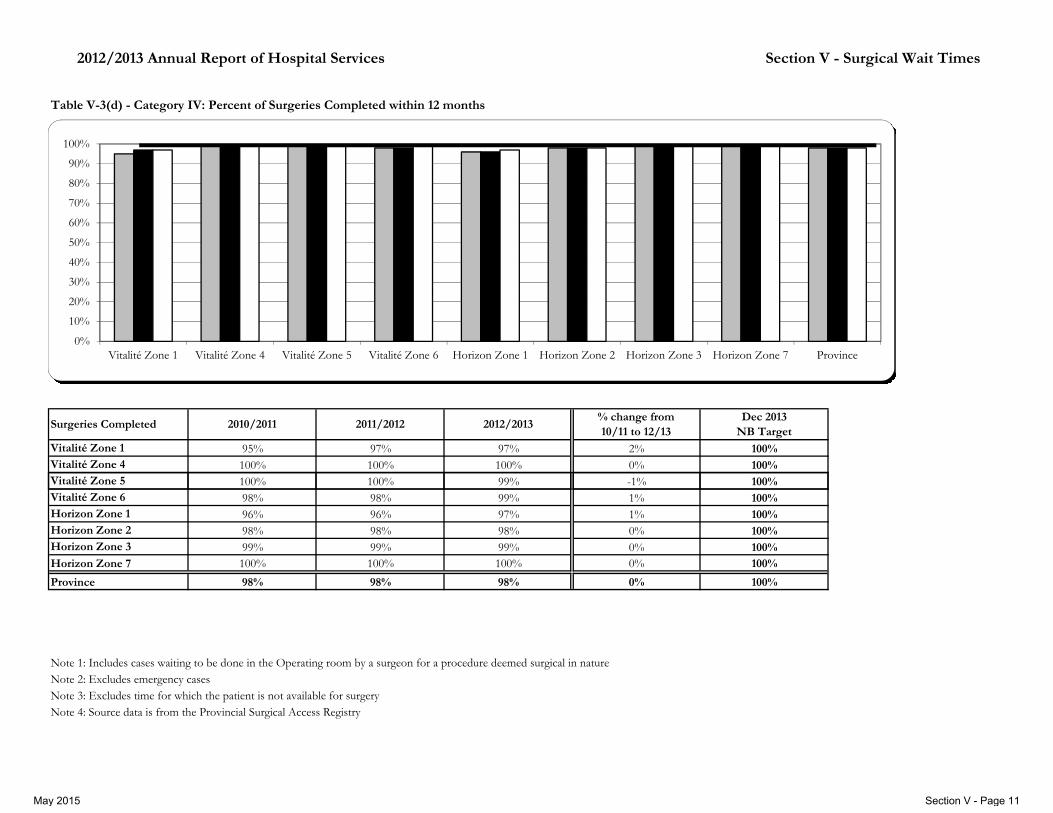
2012/2013 Annual Report of Hospital Services Section V - Surgical Wait Times
Table V-3(d) - Category IV: Percent of Surgeries Completed within 12 months
Surgeries Completed 2010/2011 2011/2012 2012/2013% change from 10/11 to 12/13
Dec 2013 NB Target
Vitalité Zone 1 95% 97% 97% 2% 100%Vitalité Zone 4 100% 100% 100% 0% 100%Vi li é Z 5 %
0%
10%
20%
30%
40%
50%
60%
70%
80%
90%
100%
Vitalité Zone 1 Vitalité Zone 4 Vitalité Zone 5 Vitalité Zone 6 Horizon Zone 1 Horizon Zone 2 Horizon Zone 3 Horizon Zone 7 Province
Vitalité Zone 5 100% 100% 99% -1% 100%Vitalité Zone 6 98% 98% 99% 1% 100%Horizon Zone 1 96% 96% 97% 1% 100%Horizon Zone 2 98% 98% 98% 0% 100%Horizon Zone 3 99% 99% 99% 0% 100%Horizon Zone 7 100% 100% 100% 0% 100%
Province 98% 98% 98% 0% 100%
Note 1: Includes cases waiting to be done in the Operating room by a surgeon for a procedure deemed surgical in natureNote 2: Excludes emergency casesNote 3: Excludes time for which the patient is not available for surgeryNote 4: Source data is from the Provincial Surgical Access Registry
May 2015 Section V - Page 11

2012/2013 Annual Report of Hospital Services Section V - Surgical Wait Times
Table V-3(e) - All Surgeries: Percent of Surgeries Completed within 12 months
Surgeries Completed 2010/2011 2011/2012 2012/2013% change from 10/11 to 12/13
Dec 2013 NB Target
Vitalité Zone 1 97% 98% 98% 1% 100%Vitalité Zone 4 100% 100% 100% 0% 100%Vi li é Z 5 %
0%
10%
20%
30%
40%
50%
60%
70%
80%
90%
100%
Vitalité Zone 1 Vitalité Zone 4 Vitalité Zone 5 Vitalité Zone 6 Horizon Zone 1 Horizon Zone 2 Horizon Zone 3 Horizon Zone 7 Province
Vitalité Zone 5 100% 100% 99% -1% 100%Vitalité Zone 6 99% 99% 99% 0% 100%Horizon Zone 1 95% 95% 97% 2% 100%Horizon Zone 2 98% 99% 99% 1% 100%Horizon Zone 3 99% 100% 100% 1% 100%Horizon Zone 7 100% 100% 100% 0% 100%
Province 98% 98% 99% 1% 100%
Note 1: Includes cases waiting to be done in the Operating room by a surgeon for a procedure deemed surgical in natureNote 2: Excludes emergency casesNote 3: Excludes time for which the patient is not available for surgeryNote 4: Source data is from the Provincial Surgical Access Registry
May 2015 Section V - Page 12

2012/2013 Annual Report of Hospital Services Section V - Surgical Wait Times
Table V-4(a) - Hip Replacement Surgery: percent completed within 26 weeks
Surgeries Completed 2010/2011 2011/2012 2012/2013% change from 10/11 to 12/13
Dec 2013 NB Target
Vi li é Z 1 %
Table V-4 - Pan Canadian Benchmark procedure targets by Zone - 2010/2011 to 2012/2013
0%
10%
20%
30%
40%
50%
60%
70%
80%
90%
100%
Vitalité Zone 1 Vitalité Zone 4 Vitalité Zone 5 Vitalité Zone 6 Horizon Zone 1 Horizon Zone 2 Horizon Zone 3 Horizon Zone 7 Province
Vitalité Zone 1 63% 52% 70% 7% 85%Vitalité Zone 4 97% 100% 95% -2% 85%Vitalité Zone 5 83% 59% 47% -36% 85%Vitalité Zone 6 93% 100% 85% -8% 85%Horizon Zone 1 57% 55% 66% 9% 85%Horizon Zone 2 57% 66% 67% 10% 85%Horizon Zone 3 93% 78% 76% -17% 85%Horizon Zone 7 100% 100% 100% 0% 85%
Province 74% 70% 73% -1% 85%
Note 1: Includes cases waiting to be done in the Operating room by a surgeon for a procedure deemed surgical in natureNote 2: Excludes emergency casesNote 3: Excludes time for which the patient is not available for surgeryNote 4: Source data is from the Provincial Surgical Access Registry
May 2015 Section V - Page 13

2012/2013 Annual Report of Hospital Services Section V - Surgical Wait Times
Table V-4(b) - Knee Replacement Surgery: percent completed within 26 weeks
Surgeries Completed 2010/2011 2011/2012 2012/2013% change from 10/11 to 12/13
Dec 2013 NB Target
Vitalité Zone 1 39% 40% 41% 2% 75%Vi li é Z 4 97% 100% 92% 5% 75%
0%
10%
20%
30%
40%
50%
60%
70%
80%
90%
100%
Vitalité Zone 1 Vitalité Zone 4 Vitalité Zone 5 Vitalité Zone 6 Horizon Zone 1 Horizon Zone 2 Horizon Zone 3 Horizon Zone 7 Province
Vitalité Zone 4 97% 100% 92% -5% 75%Vitalité Zone 5 88% 58% 49% -39% 75%Vitalité Zone 6 86% 88% 85% -1% 75%Horizon Zone 1 41% 42% 48% 7% 75%Horizon Zone 2 47% 45% 56% 9% 75%Horizon Zone 3 87% 73% 57% -30% 75%Horizon Zone 7 100% 100% 99% -1% 75%
Province 64% 57% 59% -5% 75%
Note 1: Includes cases waiting to be done in the Operating room by a surgeon for a procedure deemed surgical in natureNote 2: Excludes emergency casesNote 3: Excludes time for which the patient is not available for surgeryNote 4: Source data is from the Provincial Surgical Access Registry
May 2015 Section V - Page 14

2012/2013 Annual Report of Hospital Services Section V - Surgical Wait Times
Table V-4(c) - High-Risk Cataract Surgery: percent completed within 16 weeks
Surgeries Completed 2010/2011 2011/2012 2012/2013% change from 10/11 to 12/13
Dec 2013 NB Target
Vitalité Zone 1 90% 98% 97% 7% 90%Vitalité Zone 4 87% 59% 48% -39% 90%Vi li é Z 5 %
0%
10%
20%
30%
40%
50%
60%
70%
80%
90%
100%
Vitalité Zone 1 Vitalité Zone 4 Vitalité Zone 5 Vitalité Zone 6 Horizon Zone 1 Horizon Zone 2 Horizon Zone 3 Horizon Zone 7 Province
Vitalité Zone 5 91% 89% 87% -4% 90%Vitalité Zone 6 87% 93% 97% 10% 90%Horizon Zone 1 79% 100% 100% 21% 90%Horizon Zone 2 84% 90% 75% -9% 90%Horizon Zone 3 93% 90% 89% -4% 90%Horizon Zone 7 98% 100% 81% -17% 90%
Province 89% 91% 82% -7% 90%
Note 1: Includes cases waiting to be done in the Operating room by a surgeon for a procedure deemed surgical in natureNote 2: Excludes emergency casesNote 3: Excludes time for which the patient is not available for surgeryNote 4: Source data is from the Provincial Surgical Access Registry
May 2015 Section V - Page 15

2012/2013 Annual Report of Hospital Services Section V - Surgical Wait Times
Surgeries Completed 2010/2011 2011/2012 2012/2013% change from 10/11 to 12/13
Dec 2013 NB Target
Level I - completed within 83% 100% 75% -8% 90%
L l II l d i hi 82% 84% 85% 3% 85%
Table V-4(d) - Coronary Artery Bypass Graft Surgery: Level I (percent completed within 2 weeks), Level II (percent completed within 2-6 weeks), and Level III (percent completed within 6-26 weeks)
0%
10%
20%
30%
40%
50%
60%
70%
80%
90%
100%
Level I - completed within 2 weeks Level II - completed within 2-6 weeks Level III - completed within 6-26 weeks
Level II - completed within 82% 84% 85% 3% 85%
Level III - completed withi 99% 100% 100% 1% 100%
Note 1: Includes cases waiting to be done in the Operating room by a surgeon for a procedure deemed surgical in natureNote 2: Excludes emergency casesNote 3: Excludes time for which the patient is not available for surgeryNote 4: Source data is from the Provincial Surgical Access Registry
May 2015 Section V - Page 16

2012/2013 Annual Report of Hospital Services Section V - Surgical Wait Times
Table V-4(e) - Hip Fracture Fixation: completed within 48 hours
Surgeries Completed 2010/2011 2011/2012 2012/2013% change from 10/11 to 12/13
Dec 2013 NB Target
Vitalité Zone 1 82% 89% 87% 5%Vitalité Zone 4 73% 81% 68% -5%Vi li é Z 5
0%
10%
20%
30%
40%
50%
60%
70%
80%
90%
100%
Vitalité Zone 1 Vitalité Zone 4 Vitalité Zone 5 Vitalité Zone 6 Horizon Zone 1 Horizon Zone 2 Horizon Zone 3 Horizon Zone 7 Province
Vitalité Zone 5 90% 84% 94% 4%Vitalité Zone 6 95% 91% 100% 5%Horizon Zone 1 84% 92% 89% 5%Horizon Zone 2 85% 81% 80% -5%Horizon Zone 3 81% 80% 82% 1%Horizon Zone 7 87% 82% 71% -16%
Province 84% 85% 83% -1% n/a
Note 1: Data for hip fracture fixation are obtained from the CIHI Discharge Abstract Database (DAD). Wait times are calculated from the admission date and time to the date and time the procedure commenced. Inpatient transfers from other facilities are included.
May 2015 Section V - Page 17


Section VI
Other Hospital Services Financial Data


2013/2014 Annual Report of Hospital Services
Section VI: Other Hospital Services Financial Data This section contains other financial data compiled by Hospital Services, most of which is derived from sources other than the RHA submissions. The following table is included:
- Capital Equipment Expenditures Paid by Hospital Services
May 2015 Section VI - Page 1


2013/2014 Annual Report of Hospital Services
Table VI-1: Capital Equipment Expenditures Paid by Hospital Services - 2013-2014
2006/07 2007/08 2008/09 2009/10 2010/11 2011/12 2012/13 2013/14Increase (Decrease)
from2012/13 to 2013/14
RHA A / Vitalité Health Network 5,263,994 3,138,602 5,149,772 3,224,479 3,850,015 5,788,201 9,427,283 10,883,074 1,455,791
RHA B / Horizon Health Network 8,512,994 6,861,123 8,068,325 6,775,521 6,149,985 8,524,173 13,530,555 17,032,330 3,501,775
FacilicorpNB 242,090 86,820 -155,270
TOTALS = 13,776,988 9,999,725 13,218,097 10,000,000 10,000,000 14,312,374 23,199,928 28,002,224 4,802,296
Note 1: FacilicorpNB expenditures represent laundry equipment purchases for various hospitals.
Section VI - Other Hospital Services Financial Data
May 2015 Section VI - Page 2


Glossary


2012/2013 Annual Report of Hospital Services
GLOSSARY OF TERMS
Administrative Support A functional area that includes: General Administration, Finance, Human Resources, Systems Support, Telecommunications, and Purchasing.
Ambulatory Care Pertains to those services that do not require an inpatient admission to a health care institution. Includes clinics and day/night care (e.g. dialysis). For annual report purposes, day surgery is reported with the operating room and not with ambulatory care
Amortization (also Depreciation)
An accounting procedure in which the cost or other recorded value of a fixed asset less any estimated value on disposal is distributed over its useful life in a systematic and rational manner. It is a process of allocation, not valuation.
Amortization Expenses The amortized portion of a capital acquisition (equipment or building).
Attendance Days The calendar days, during which primary service activities are provided face-to-face to a registered service recipient, and/or significant other(s), on behalf of the service recipient (used primarily in therapeutic functional centres). In Therapeutic functional centres, an attendance day is counted for each patient receiving service in any particular day.
Average Length of Stay (ALOS)
Calculated as the total Days Stay divided by the total Separations See Days Stay and Separations.
Benefit Contributions The employer and/or employee paid components of employment benefits such as Employment Insurance, Canada Pension Plan, Dental Plan, retirement allowance, etc.
Benefit Hours Those hours of absence for which compensation is paid. Examples include vacation, statutory holidays, sick, education or maternity leave, and the percentage of gross pay in lieu of vacation and statutory holidays which may be paid to part-time staff.
Buildings and Grounds Expenses
General buildings, building service equipment, grounds maintenance and renovation expenses, building service equipment repairs and building amortization expenses. Also includes waste disposal, municipal taxes and mortgage expenses.
Case Mix Group (CMG) Refers to groupings of acute inpatient cases based on diagnosis and procedure data provided by the patient abstract. Cases grouped under the same CMG are expected to be homogenous in terms of clinical characteristics and resource consumption. Examples of CMGs are: Acute Myocardial Infarction, Uncomplicated Vaginal Delivery, and Total Hip Replacement. CMGs are maintained and refined annually by the Canadian Institute for Health Information (CIHI). See also Resource Intensity Weights
Clinical Support An Administrative and Support functional area that includes: Volunteer Services, Bio-Medical Engineering, Registration (Admitting), Patient Transportation (including Ambulance Services), and Health Records.
Community Health Centre Community based organizations that provide core primary health care using a multidisciplinary approach.
Day Procedure Group (DPG) The equivalent of Case Mix Group for day surgery cases. See also Case Mix Group (CMG)
May 2015 Glossary - Page 1

2012/2013 Annual Report of Hospital Services
Days Stay A measure of days of care to patient discharged used in the CIHI Discharge Abstract Database (DAD). It is calculated as the total days for all patients discharged in the fiscal year. As such, the average length of stay would include all the days for each patient, even if the patient was admitted in the previous fiscal year. Similarly, no days stay are included for patients admitted but not discharged in the current fiscal year.
Drugs Include medications, oxygen and other gases, and total parenteral nutrition.
Equipment Expenses Include equipment maintenance/repairs, leasing/rental and minor equipment purchases and equipment amortization expenses.
Extra-Mural Program Refers to New Brunswick’s Home Care services program which is operated by the RHAs through a number of units across the province.
Fixed Assets A tangible non-current asset, such as land, building, equipment, etc., held for use rather than for sale.
Fixed Payments Funding provided by the Department of Health (includes Hospital Services Branch and the Mental Health Branch).
Full Time Employee Refers to all employees who work fulltime hours (37.5 hrs per week).
Full Time Equivalents (FTE) The total earned hours charged to a functional centre, expressed in terms of equivalent full-time positions, according to the health service organization’s normal earned hours per full-time position (usually 1,950 hours, or 37.5 hours per week 52 weeks). The above definition can be expressed by the following formula: Total Earned Hours (for all staff) In Period FTE = ---------------------------------------------------- Normal Earned Hours (full time)
Functional Area A grouping of functional centres (or hospital departments) with a common or related service delivery mandate. The individual departments that constitute each functional area are presented in Sections V-I(a) to V-I(e).
Functional Centre A subdivision of an organization used in a functional accounting system to record the direct expenses; statistics; and/or revenues, if any, which pertain to the function or activity being carried out. Analogous to a department, such as Health Records, or Medical Nursing unit. A subdivision of an organization that is used to record the financial and statistical data for the function or activity carried out. Examples include Emergency Services or Housekeeping.
Health Centres Community based facilities that provide primary care services but do not have an Emergency department.
HFUMS Database The Hospital Financial Utilization Management System (HFUMS) was set up as a central provincial database maintained at the Department of Health, and contains a variety of financial, statistical (e.g., MIS data) and clinical activity (ex: Discharge Abstract Database (DAD)) for the RHAs.
Hospitals Refers to the acute care facilities, two psychiatric facilities and one tertiary rehabilitation facility. Acute care facilities usually provide inpatient (beds), and Emergency services.
May 2015 Glossary - Page 2
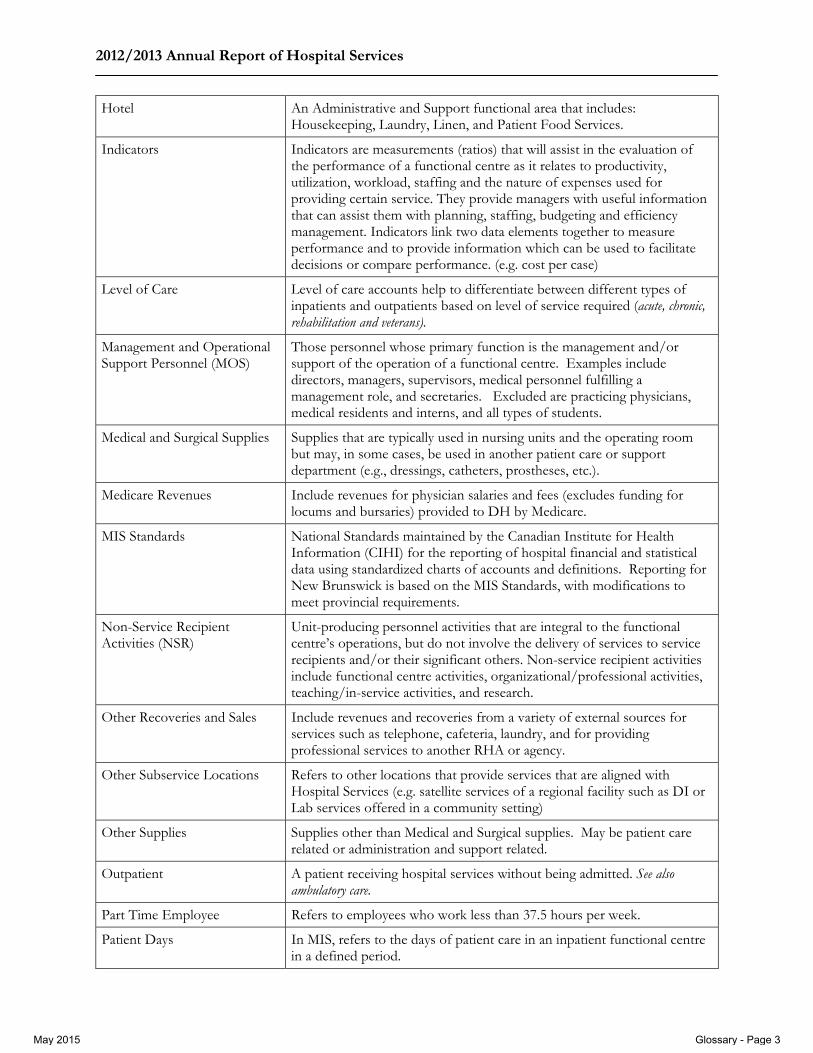
2012/2013 Annual Report of Hospital Services
Hotel An Administrative and Support functional area that includes: Housekeeping, Laundry, Linen, and Patient Food Services.
Indicators Indicators are measurements (ratios) that will assist in the evaluation of the performance of a functional centre as it relates to productivity, utilization, workload, staffing and the nature of expenses used for providing certain service. They provide managers with useful information that can assist them with planning, staffing, budgeting and efficiency management. Indicators link two data elements together to measure performance and to provide information which can be used to facilitate decisions or compare performance. (e.g. cost per case)
Level of Care Level of care accounts help to differentiate between different types of inpatients and outpatients based on level of service required (acute, chronic, rehabilitation and veterans).
Management and Operational Support Personnel (MOS)
Those personnel whose primary function is the management and/or support of the operation of a functional centre. Examples include directors, managers, supervisors, medical personnel fulfilling a management role, and secretaries. Excluded are practicing physicians, medical residents and interns, and all types of students.
Medical and Surgical Supplies Supplies that are typically used in nursing units and the operating room but may, in some cases, be used in another patient care or support department (e.g., dressings, catheters, prostheses, etc.).
Medicare Revenues Include revenues for physician salaries and fees (excludes funding for locums and bursaries) provided to DH by Medicare.
MIS Standards National Standards maintained by the Canadian Institute for Health Information (CIHI) for the reporting of hospital financial and statistical data using standardized charts of accounts and definitions. Reporting for New Brunswick is based on the MIS Standards, with modifications to meet provincial requirements.
Non-Service Recipient Activities (NSR)
Unit-producing personnel activities that are integral to the functional centre’s operations, but do not involve the delivery of services to service recipients and/or their significant others. Non-service recipient activities include functional centre activities, organizational/professional activities, teaching/in-service activities, and research.
Other Recoveries and Sales Include revenues and recoveries from a variety of external sources for services such as telephone, cafeteria, laundry, and for providing professional services to another RHA or agency.
Other Subservice Locations Refers to other locations that provide services that are aligned with Hospital Services (e.g. satellite services of a regional facility such as DI or Lab services offered in a community setting)
Other Supplies Supplies other than Medical and Surgical supplies. May be patient care related or administration and support related.
Outpatient A patient receiving hospital services without being admitted. See also ambulatory care.
Part Time Employee Refers to employees who work less than 37.5 hours per week.
Patient Days In MIS, refers to the days of patient care in an inpatient functional centre in a defined period.
May 2015 Glossary - Page 3

2012/2013 Annual Report of Hospital Services
Patient Service Revenues Include payments received for patient care from a variety of payers including out of province, private insurance, self pay, etc.
Permanent Employee Represents all employees hired into a full time or part time position with no anticipated end date.
Plant An Administrative and Support functional area that includes: Plant Administration, Plant Operation, Plant Security, and Plant Maintenance.
Procedure Term used in Clinical Laboratory and Respiratory Therapy to describe asequence of steps contributing to a diagnostic or therapeutic activity.
Productivity Pertains to the relationship between the staff worked hours and the products and/or services they provide. For a nurse, a productivity ratio may be hours spend providing nursing services (both service recipient and non service recipient) over total hours worked.
Referred Out (Contracted Out) Services
Include expenses (and related statistics) paid for both clinical and administrative and support services provided by an external agency (e.g., another RHA, private company, or out of province). Examples include contracted out laboratory tests, contracted out laundry, security services and service contracts. Note that contracted out expenses should only be recognized for services provided outside the RHA and not by other facilities within the RHA.
Resource Intensity Weight (RIW)
An RIW is a measure of relative resource consumption for cases grouped under Case Mix Groups (CMG). It is based on a national case cost database and calibrated annually by the Canadian Institute for Health Information (CIHI). The average case (nationally) would have an RIW of 1.0. The higher the average RIW for a hospital, the greater the average resource intensity (or cost) of its patients. Currently, RIWs are calculated for acute inpatient and day surgery cases only. In New Brunswick, however, acute and non acute cases are not always identified and coded (i.e., abstracted) separately, leading to non comparable CMGs and RIWs. See Case Mix Group
Salaries Compensation expenses that include both worked and benefit salaries (vacation, statutory holidays, lunch breaks, etc,).
Separations Separations are the sum of discharges, deaths, transfers out, and sign-outs against medical advice, that occur during the given fiscal year. Essentially, the number of separations is the number of inpatients who complete their hospital stay in a given year. Nationally, discharges include discharges from the hospital and from one level of care to another. In New Brunswick, the majority of the corporations only include discharges from the hospital.
Service Recipient (SR) A sub-classification of activity statistics that identifies the recipient of primary service activities of one or more functional centres of the health service organization. Service recipients include patients (e.g. acute inpatients, outpatients, etc.) and their significant others, and others as defined by the health service organization.
Sundry Expenses Include a variety of expenses not included in the other categories. Examples include: administration fees, bank charges, legal fees, telephone charges, mailing expenses, travel expenses, rent, minor departmental supplies, etc.
May 2015 Glossary - Page 4
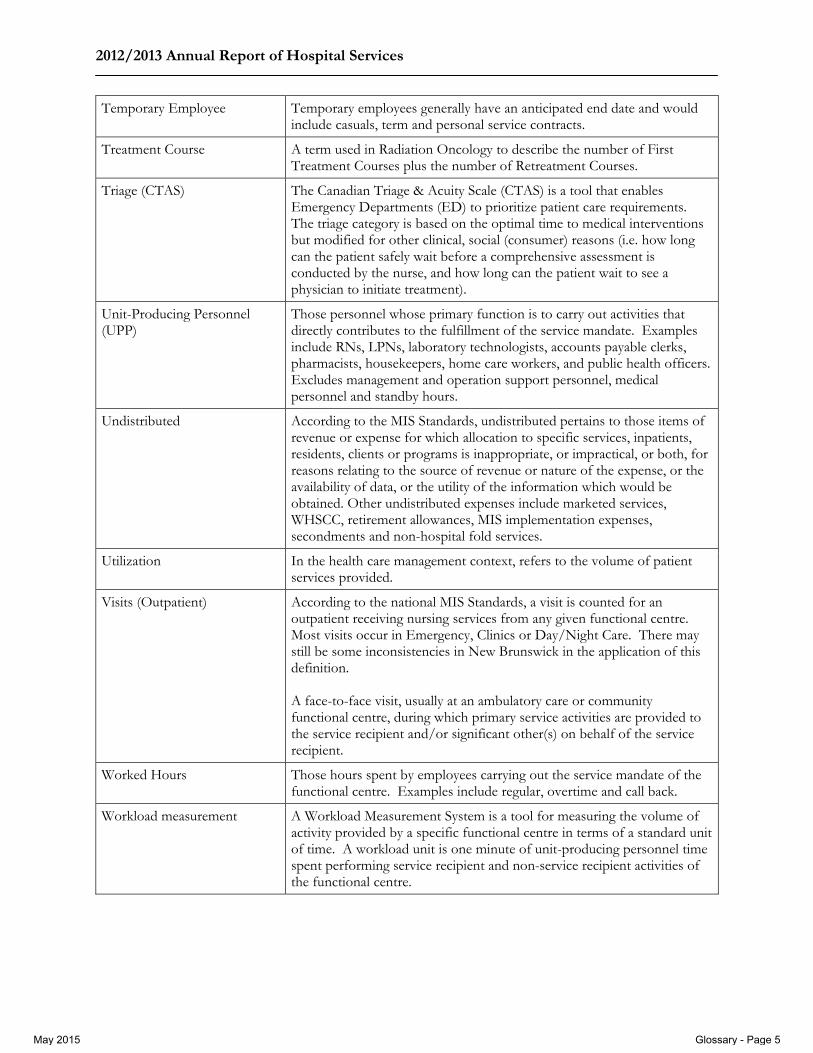
2012/2013 Annual Report of Hospital Services
Temporary Employee Temporary employees generally have an anticipated end date and would include casuals, term and personal service contracts.
Treatment Course A term used in Radiation Oncology to describe the number of First Treatment Courses plus the number of Retreatment Courses.
Triage (CTAS) The Canadian Triage & Acuity Scale (CTAS) is a tool that enables Emergency Departments (ED) to prioritize patient care requirements. The triage category is based on the optimal time to medical interventions but modified for other clinical, social (consumer) reasons (i.e. how long can the patient safely wait before a comprehensive assessment is conducted by the nurse, and how long can the patient wait to see a physician to initiate treatment).
Unit-Producing Personnel (UPP)
Those personnel whose primary function is to carry out activities that directly contributes to the fulfillment of the service mandate. Examples include RNs, LPNs, laboratory technologists, accounts payable clerks, pharmacists, housekeepers, home care workers, and public health officers. Excludes management and operation support personnel, medical personnel and standby hours.
Undistributed According to the MIS Standards, undistributed pertains to those items of revenue or expense for which allocation to specific services, inpatients, residents, clients or programs is inappropriate, or impractical, or both, for reasons relating to the source of revenue or nature of the expense, or the availability of data, or the utility of the information which would be obtained. Other undistributed expenses include marketed services, WHSCC, retirement allowances, MIS implementation expenses, secondments and non-hospital fold services.
Utilization In the health care management context, refers to the volume of patient services provided.
Visits (Outpatient) According to the national MIS Standards, a visit is counted for an outpatient receiving nursing services from any given functional centre. Most visits occur in Emergency, Clinics or Day/Night Care. There may still be some inconsistencies in New Brunswick in the application of this definition. A face-to-face visit, usually at an ambulatory care or community functional centre, during which primary service activities are provided to the service recipient and/or significant other(s) on behalf of the service recipient.
Worked Hours Those hours spent by employees carrying out the service mandate of the functional centre. Examples include regular, overtime and call back.
Workload measurement A Workload Measurement System is a tool for measuring the volume of activity provided by a specific functional centre in terms of a standard unit of time. A workload unit is one minute of unit-producing personnel time spent performing service recipient and non-service recipient activities of the functional centre.
May 2015 Glossary - Page 5
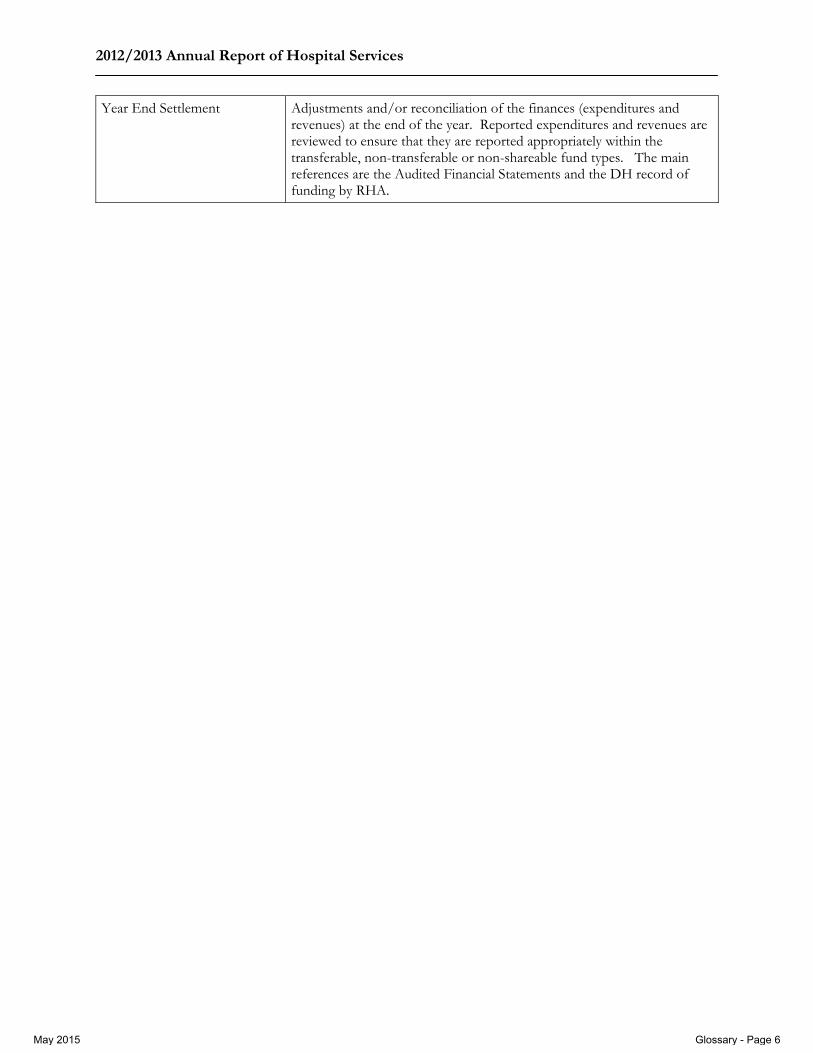
2012/2013 Annual Report of Hospital Services
Year End Settlement Adjustments and/or reconciliation of the finances (expenditures and revenues) at the end of the year. Reported expenditures and revenues are reviewed to ensure that they are reported appropriately within the transferable, non-transferable or non-shareable fund types. The main references are the Audited Financial Statements and the DH record of funding by RHA.
May 2015 Glossary - Page 6