Annual report insights 2014 Providing a clear steer - Deloitte
144
Annual report insights 2014 Providing a clear steer www.deloitte.co.uk/AnnualReportInsights @DeloitteUK #DeloitteReportInsights
-
Upload
khangminh22 -
Category
Documents
-
view
0 -
download
0
Transcript of Annual report insights 2014 Providing a clear steer - Deloitte

Annual report insights 2014Providing a clear steer
www.deloitte.co.uk/AnnualReportInsights @DeloitteUK #DeloitteReportInsights


Contents
1. Executive summary 2
2. How to use this document 5
3. Regulatory overview 7
4. Survey objectives 20
5. Overall impressions 21
6. Summary material 29
7. The strategic report 37
8. Principal risks 58
9. Key performance indicators 67
10. Going concern 80
11. Effective company stewardship 86
12. The work of the audit committee 96
13. The auditor’s report 102
14. Primary statements 111
15. Notes to the financial statements 122
Appendix 1 – Key messages on directors’ remuneration reports 135
Appendix 2 – Glossary of terms and abbreviations 138
Other resources available 141

Welcome to the latest edition of our annual report insights report, ‘Providing a clear steer’.
It has been an eventful year with the introduction of the new strategic report, debate around going concern and risk reporting and the need for directors to state that their annual report and accounts as a whole were ‘fair, balanced and understandable’.
Our report looks at how companies have gone about dealing with these challenges, the extent to which they have met the requirements and innovated, plus how well they have linked the narrative reporting to the financial reporting. And from this mass of information we have identified areas for improvement as well as providing best practice examples, enabling companies to tell their stories effectively and provide a clear steer to their readers.
Here Veronica Poole, head of UK corporate reporting within Deloitte, and William Touche, UK head of corporate governance within Deloitte, draw from their experience of the year, share their insight and thoughts on the highlights from the survey and look at the challenges ahead.
Narrative reportingQ: Companies were really up against it last year. How well did they cope with all the changes they had to face?A: Overall I think they have done well. All hundred companies surveyed included a strategic report although they really struggled to cut clutter. While we had hoped that the size of reports would start to fall, instead they have risen again. The average length of an annual report is up from 122 to 132 pages, much of it driven by an increase in the length of narrative reporting, in particular the new style remuneration reports. But on the plus side some companies have used the opportunity presented by all the changes to restructure their narrative reporting. This is important and it will hopefully give them a good foundation to embrace the Financial Reporting Council’s latest messages on clear and concise reporting.
Q: With reports getting longer how cohesive did they tend to be in telling their story? Were preparers managing to link together all the different components?A: Somewhat disappointingly there was a continued lack of cohesiveness, or in the FRC’s words linkage, between the story told in the narrative and the numbers in the back. Whilst the majority of companies made efforts to link some parts of their annual report, in particular the discussion around strategy to their KPIs, only 29% showed up-front, in their summary pages, how their report as a whole linked together. But all in all, companies are making steps in the right direction.
Q: What does the survey tell us about non-GAAP measures? They have been exercising regulators recently and there is a raft of proposals from various regulators and other bodies.A: Non-GAAP measures continue to be an important feature of annual reports: 86% of companies presented them in their summary pages and of those over 60% gave them greater prominence than associated GAAP measures. Furthermore, most companies use them on the face of the income statement. These findings will not please regulators. IOSCO is currently consulting on the use of non-GAAP measures and ESMA is expected to publish its guidelines on the subject before the year is out, so this is certainly an area that companies need to think about carefully when they prepare this year’s accounts.
Q: As we move into the new reporting season what other corporate reporting issues should companies be focusing on at this time?A: The new proposals around the reporting of going concern and risk reporting will come into effect for periods commencing on or after 1 October this year and merit close attention. Country-by-country reporting also comes into force from 1 January 2015 and will have a big impact for those in the extractive industries.
1. Executive summary
2

Corporate governanceQ: When it comes to corporate governance what are the messages we can learn from the survey?A: In terms of corporate governance messages from our survey, we have to remember that we have a comply or explain model in the UK, but nevertheless it is still quite surprising that only 57% of companies reported they were fully compliant with the UK Corporate Governance Code, which was the same level as the prior year. The most common areas of non-compliance are around the independence of directors and the composition of audit committees. And as we know the FRC is encouraging much more meaningful explanations for non-compliance to be included. But boards are making some, albeit slow progress, on getting women into the boardroom. 73% of companies have a woman on the board but the overall number of female directors remains quite disappointing – from 13% to 15%. There is still a need to boost the number of female directors on UK boards.
Q: This last year saw the introduction of the requirement for the directors to state that the report and accounts were “fair, balanced and understandable”. How well did companies cope with that?A: All but four of the companies in our sample included the new fair balanced and understandable statement, typically in the directors’ responsibility statement. And those four which did not were at the smaller end of the listed company spectrum. What was encouraging was that 23% chose to provide some description of the process they had undertaken to support the statement by the board. We hope that this enhances shareholder confidence that the new requirement was taken seriously and that the governance of the annual reporting process was robust.
Q: Audit committees were also given greater responsibilities this last year. How did that work out?A: Audit committee reporting has made a giant leap forward. Now two thirds of companies made the audit committee report a distinct section within the annual report, compared to only 45% – less than half – last year. This reflects the greater profile being given to the audit committee’s stewardship and reporting responsibilities. And audit committee chairmen are now taking much more ownership of the report as the very personal introductions imply. Nearly three quarters of companies report in this manner compared to less than half in the prior year. And of course the reporting of the significant issues considered by the audit committee coupled with the extended reporting by auditors provides investors with a much greater basis for engagement.
Q: And what challenges lie ahead?A: On the governance side, as with the world of narrative reporting, preparers will have few disclosure changes to contend with this year – for December 2014 year ends. However, the FRC’s finalised guidance on risk management and internal control is now out and companies are going to need to look closely at this, the governance implications of the new viability statement and the other revisions to the Code particularly on internal control and the reporting of weaknesses from the directors’ internal control review. And these apply for accounting periods beginning 1 October 2014.
Annual report insights 2014 3

Financial statementsQ: Moving back through the book to the financial statements what were the highlights amongst the back half of the report?A: A few companies are innovating in areas like presentation of accounting policies and are including narrative reporting in their financial statements. And non-GAAP measures are proving as popular as ever. As mentioned, some 68% included such metrics in their income statements. Encouragingly, many were adhering to the FRC’s reminders at the end of last year about the use of exceptional items, in that they were not describing recurring items as exceptional. And, even though there was pressure to cut clutter, some companies still included voluntary disclosures. Some 44% included net debt reconciliations or similar information and 10% included insight on tax governance and strategy.
Q: And what are the challenges ahead?A: 2014 will be the first year that many companies have had the IASB’s package on consolidations to deal with, including all the new disclosures required by IFRS 12. Looking further ahead there is the newly published standard on revenue recognition to prepare for.
And finallyQ: Integrated reporting was a much discussed topic through the year. How far did the discussions make it through into the reporting?A: With the focus on growth, long term investment and the broader role of business in the society, integrated reporting offers an excellent opportunity for companies to tell their value creation story. Although only five companies surveyed mentioned integrated reporting, the vast majority, 80%, already discuss value creation in their reports. Of course, integrated reporting is not really just about reporting, it is about integrated thinking and behaviours, integrated from strategy and business model to business performance, from internal performance management measures to external reporting.
The strategic report framework in the UK creates an excellent enabling environment and allows companies to experiment and innovate. Our survey and its findings will also help companies to innovate and enhance their reporting by drawing on the many best practice examples we have provided. Hopefully, with the developments around integrated reporting and the FRC’s encouragement for clear and concise reporting companies will feel empowered in their efforts to provide a clear steer to the readers of their reports.
4

This publication has been written with two main aims in mind. As well as being a survey, looking at historical trends in corporate reporting, it is also designed as a tool to help preparers develop and improve the structure and content of their annual report.
Therefore, whether you’re an audit committee member, you work in investor relations, you’re a company secretary or a finance director, there is something in here for you.
As well as statistics and insight into historical trends and current reporting practice, there are thoughts and ideas around the impact of current and future changes in reporting requirements, along with plenty of examples of better practice identified from companies across the FTSE.
In our accompanying guide, ‘A clear steer for your annual report’, we have distilled a wealth of ideas of pitfalls to avoid, regulatory developments to watch out for, ways in which you can choose to go above and beyond the minimum requirements and finally, areas that could be pruned to ‘cut the clutter’.
What are the benefits of a good annual report?The new narrative reporting legislation introduced last year provided preparers with an opportunity to revitalise their reports and improve communication with stakeholders. With a period of relative stability now upon us, at least in terms of narrative reporting, this publication provides inspiration on how to build on these existing reports, drawing in best practice and suggestions on how to successfully innovate. Investing time and effort to prepare a good annual report brings with it many benefits, a few of which are briefly outlined below.
• Investors are one of the main users of annual reports, but it’s not just existing investors who look at it, it’s potential investors too – a good annual report with clear communication of a business’s performance and its prospects can help attract additional investment, while a bad report could make a potential investor think twice.
• A strong annual report will provide good publicity with other stakeholders too, whether it be employees, customers, suppliers or society at large.
• The directors are responsible for preparing an annual report, including the financial statements, and under the 2012 UK Corporate Governance Code are required to state that they consider the annual report and the accounts, taken as a whole, is “fair, balanced and understandable”. A strong report will therefore reflect well on a company’s governance.
• The FRC’s Conduct Committee and its Financial Reporting Review Panel are responsible for monitoring the quality of corporate reporting in the UK. For obvious reasons it is desirable to avoid criticism from the regulator and the bad publicity this can bring.
• On a more positive note, prizes are awarded by a number of bodies for the best annual reports, bringing with them prestige and good publicity.
2. How to use this document
Annual report insights 2014 5

Which parts of this document are most relevant to me?The table below will help you identify those areas of the publication likely to be of most interest to you. For those looking for a quick steer on a specific disclosure issue, the electronic version of this pdf contains links to further guidance and examples of good practice within annual reports in all of the chapters listed below.
Theme Chapter What is examined
Background information
3 Regulatory overview Sets out the backdrop for the requirements that UK listed companies are subject to, including regulatory hotspots and items that are new for 2014.
4 Survey objectives Provides an overview of the survey methodology and aims.
Annual report as a whole
5 Overall impressions Trends in overall report structure, from the length of the report and its various sections to the speed of reporting timetables, the cohesiveness of the report as a whole and the extent to which reports are “integrated reports”.
Narrative reporting
6 Summary material How companies set the scene with an introductory summary section, covering the presentation of both financial and narrative information and the ways of linking this effectively to the rest of the report.
7 Strategic report Disclosures in the new strategic report, including the business model, objectives, strategy, presentation of business performance and new corporate social responsibility information such as gender analysis and human rights issues. Directors’ reports including carbon disclosures are also examined.
8 Principal risks Principal risks and uncertainties – commonly identified items, mitigating activities, ways of presenting the required information and linking to other parts of the annual report.
9 Key performance indicators
Key performance indicators – commonly identified measures, their understandability and linkage to other areas, including directors’ remuneration.
10 Going concern The assessment and reporting of going concern, including the impact of the Sharman report and the latest proposals in this area.
Corporate governance
11 Effective company stewardship
Compliance with the 2012 UK Corporate Governance Code. There are examples of good practice in reporting compliance and presenting this information in an interesting and engaging way.
12 The work of the audit committee
Audit committee reporting, in particular looking at the impact of the 2012 Code and FRC Guidance on Audit Committees and the information around significant issues the committee has considered in connection with the financial statements.
Financial statements
13 The auditor’s report An insight into the new style of enhanced auditor reports, including consistency with audit committee reports.
14 Primary statements The primary statements, use of non-GAAP measures, IAS 1 compliance and tax governance disclosures amongst other items.
15 Notes to the financial statements
The notes to the financial statements, including ideas for cutting clutter, impairment disclosures, discount rates, consistency with narrative reporting and much more.
6

The requirements for a UK listed company’s annual report are many and come from a variety of sources, the most significant of which include:
• the Companies Act 2006 and supporting statutory instruments;• the Disclosure and Transparency Rules (DTR);• the Listing Rules;• the UK Corporate Governance Code; and• International Financial Reporting Standards (IFRSs).
This section sets out an overview of the most significant regulatory requirements for UK listed companies’ annual reports – it is not a comprehensive guide to all the requirements. Other publications produced by Deloitte, such as GAAP: UK reporting and GAAP: Model annual report and financial statements for UK listed groups provide more comprehensive detail on the many requirements, with the latter publication presenting a model annual report for a UK listed group.
Following a summary of the regulatory landscape is a series of short guides, highlighting what the main requirements are for each of the following three components of a listed company’s annual report:
• narrative reports;• corporate governance statements (including directors’ remuneration reports); and• financial statements.
Also included, for each of these areas, is an indication of the main changes in 2014, regulatory hotspots and idea of what the future holds plus links to further resources. Information on all the areas discussed, including news articles, thought pieces and supporting resources can be found on Deloitte’s one-stop-shop for all accounting, governance and regulatory matters – www.ukaccountingplus.co.uk.
Regulatory landscapeThe Financial Reporting Council has launched a “Clear & Concise” initiative to “promote good communication in corporate reporting” and ensure that annual reports provide relevant information for investors. The FRC aims to change behaviour relating to financial reporting, calling for action by all those involved in the financial reporting process to focus on communication, placement of information and materiality.
The Clear & Concise initiative brings together activities from across the FRC including narrative reporting, reports from the Financial Reporting Lab and reporting by Corporate Reporting Review on areas in financial statements where ‘clutter’ is observed. One of the key documents is the Lab’s 2014 report “Towards clear and concise reporting”. Looking to the future, the Lab is looking for case studies of clear and concise reporting and has also undertaken projects on disclosure of dividend policy and capacity and corporate reporting in a digital world. Further insight on the work of the FRC can be found in their annual report (published in July 2014), together with their corporate reporting review (not yet published at the time of writing).
As outlined below and reflected in the timeline below the big change to 2014 annual reports will be the implementation of the IASB’s consolidation “package of five”. This gives preparers a chance to improve their existing narrative reporting and to deal with the changes arising as a result of amendments to the UK Corporate Governance Code, which become effective for periods commencing on or after 1 October 2014. Regulators’ areas of focus for 2014 reporting are identified in the following pages.
3. Regulatory overview
Annual report insights 2014 7
The world of corporate reporting in the UK
1 Jan 2014 1 Oct 2014 1 Jan 2015 1 Jan 2016 1 Jan 2017 1 Jan 2018
New IFRS consolidation Corporate Governance Proposed date for CMA’s Proposed date for EU’s New revenue IFRS New IFRS for financialstandards Code changes on going FTSE 350 audit non-financial plan reporting Instruments concern, risk reporting and tendering changes directors’ remuneration Proposed date for country for country by country reporting
Old UK GAAP superseded
Periods beginning on or after:
Other significant initiatives underway:
FRC’s clear and conciseinitiative
IASB disclosure initiative ESMA, IOSCO and IFACnon- GAAP measuresconsultaions
Financial reporting labprojects on dividendpolicy and digital reporting
IIRC integrated repotring framework issued in December 2013
IASB conceptual framework and FRC/European contribution to ‘getting a better framework’
8

Narrative reportingExisting requirementsSection 415 of the Companies Act 2006 (CA06) requires a directors’ report to be prepared as part of any UK company’s annual report. All UK companies other than those that meet the CA06 definition of “small” are also required to prepare a separate strategic report, which should be approved by the directors, although this approval may be combined with that of the directors’ report, as long as it is clear that each report has been approved by the board. The strategic report is required to contain:
• a fair review of the company’s business;
• a description of the principal risks and uncertainties facing the company; and
• to the extent necessary for an understanding of the development, performance or position of the company, analysis using financial key performance indicators (KPIs) and where appropriate, analysis using other KPIs, including information relating to environmental and employee matters.
For quoted companies the strategic report should also contain the following (although the first two items are only required to the extent necessary for an understanding of the company’s development, performance or position):
• information on the main trends and factors likely to affect the future development, performance and position of the company’s business;
• information on environmental matters, employees and social and community issues, including any policies in these areas and their effectiveness (if any of these disclosures are omitted this should be stated);
• a description of the company’s business model and its strategy (plus its objectives, as suggested by the UK Corporate Governance Code and the FRC’s guidance on the strategic report – see below); and
• a gender analysis of the parent company’s directors, the group’s senior management and the group’s employees as a whole.
Nowadays, this leaves relatively little content for inclusion in the directors’ report, but for quoted companies one substantial requirement is for certain information on greenhouse gases emissions to be disclosed therein. Often this is included alongside corporate social responsibility disclosures in the strategic report, and cross-referred to from the directors’ report.
Companies have the option to provide shareholders with the strategic report and other specified supplementary material, in place of the full annual report. This replaced the option of providing summary financial statements.
New
New for 2014The FRC has published finalised guidance on how to prepare a strategic report and providing examples of ways the different elements can successfully be linked together.
For years ending on or after 1 September 2014, there is a new requirement that a company’s report must either contain all of the information required by Listing Rule 9.8.4R in a single identifiable section or it must include a cross-reference table indicating where that information is set out. There are also extensive new disclosure requirements for companies with a ‘controlling shareholder’ as defined by the Listing Rules – broadly one who acting alone, or in concert with others, controls more than 30% of the voting rights. Otherwise, it is a relatively quiet year with few changes for preparers of narrative reporting to contend with.
Annual report insights 2014 9

Hotspots
Regulatory hotspots in 2014The following reflect areas that regulators are likely to focus on in reviewing 2014 accounts:
1. The use of non-GAAP measures has been the subject of several recent pronouncements. The FRC has been focusing on how companies determine what to strip out when presenting such measures, with challenges being raised where recurring items such as amortisation of intangible assets are excluded. Consistent application of a policy in this regard and provision of comparatives is important. Where exceptional debits are stripped out, so should be any similar credits, such as the reversal of an impairment, even if they arise in different periods. ESMA’s proposals, expected to be finalised before the year is out, focused more on the presentation of non-GAAP measures in a company’s communications, in particular their prominence compared to GAAP measures. Other concerns include situations where measures used in the narrative reporting are different from those presented to management (as disclosed in the IFRS 8 note) and those presented on the face of the income statement. A balanced commentary from management is expected in discussions that utilise adjusted measures.
2. KPIs should be clearly and consistently defined year on year, with an explanation of their calculation and reconciliations to statutory measures where appropriate. Linking them to the company’s strategy, business model, objectives and remuneration policy is a current hot topic.
3. Despite improvements in risk reporting in recent years, principal risks and uncertainties remain an area of regulatory focus. Companies should take care to make clear their “principal” risks and uncertainties and to describe their mitigating activities.
4. Directors’ remuneration reporting was expanded significantly last year and regulators will continue to scrutinise reports in the second year of the new regulations. Investors are likely to take a continued interest, particularly as this is the first year in which pay will be governed by policies that were subject to a binding vote.
What the future holdsGoing concern and risk reportingChanges to the reporting of going concern and risks will be required under the revised version of the UK Corporate Governance Code, effective for periods commencing on or after 1 October 2014, and are discussed below.
EU proposals for non-financial reportingIn April 2014 the European Parliament adopted an amendment to the EU Accounting Directive, which would apply to large public interest entities with more than 500 employees. Although these include listed companies the rules will also apply to unlisted companies such as banks, insurance companies and other companies that are designated as such by Member States. The amendment has still to be formally adopted but is likely to come into force in the UK by 2016.Companies within the scope of the directive will be required to disclose information in their annual reports on environmental, social and employee matters, respect for human rights, anti-corruption and bribery matters. The disclosure will need to include a description of the policy pursued by the company related to these matters, the results of these policies and the risks related to these matters and how the company manages those risks.
To a large extent, these new rules complement the narrative reporting regulations already in force in the UK. However, the new Directive will extend the level of disclosures required on diversity (for example policies on age, gender, educational and professional background) and will specifically require reporting on bribery and corruption matters for the first time. For large unquoted public interest companies, which are not required to include this information in their annual report under the existing regulations, the implementation of this Directive will represent a bigger change.
10

Integrated reportingIn December 2013 the International Integrated Reporting Council (IIRC) published the first version of its International Integrated Reporting Framework (<IR>). This sets out a framework for a more holistic approach to business reporting, encompassing not just the financial aspects of a business but the human, social and environmental aspects as well. The Framework is based around three fundamental concepts – the six capitals (financial, manufactured, intellectual, human, social and relationship and natural), the business model and value creation.
Currently there are no plans to mandate the application of integrated reporting in the UK. However, in the FRC’s view following the Guidance should result in reporting that is consistent with the International <IR> Framework.
Further details can be found at www.theiirc.org.
Country-by-country reportingIn August 2014 the Department for Business, Innovation and Skills (BIS) published the response to their March 2014 consultation on the implementation of EU country by country reporting requirements for “extractive industries”. The requirements include a provision for requiring large undertakings and all public-interest entities active in the extractive industry or the logging of primary forests to prepare and make public a report on payments made to governments on an annual basis.
Although the EU Directive permits the information either to be contained in the company’s annual financial report or in a separate stand-alone report, BIS will require that UK companies prepare a separate stand-alone report. The UK will introduce the new requirement for financial years beginning on or after 1 January 2015, one year earlier than required by the Directive.
The Financial Conduct Authority has also consulted on the implementation of the equivalent change to the Transparency Directive. This will require all “extractive industries” companies with securities admitted to trading on an EEA Regulated Market for which the FCA is the competent authority to prepare and file a similar report; again, the FCA proposes that these requirements will apply for financial years beginning on or after 1 January 2015.
Link to survey findingsChapters 6 to 10 of this publication examine the existing practices around narrative reporting, excluding corporate governance disclosures.
Where to find out more
FRC’s guidance on preparing a strategic report
Need to know newsletter on FRC’s guidance on preparing a strategic report
Deloitte’s practical guide to preparing a strategic report
FRC Financial Reporting Lab projects and reports
www.ukaccountingplus.co.uk also has the latest news on non-GAAP measures, country by country reporting and integrated reporting. Corporate governanceExisting requirementsListed companies are required by the Listing Rules to make certain disclosures about corporate governance in their annual reports. Companies with a premium listing are required to state how they have applied the main principles set out in the UK Corporate Governance Code (the Code), providing explanations for any failures to comply. The Code is accompanied by “Internal Control: Guidance to Directors” and the FRC’s “Guidance on Audit Committees”, both of which recommend various disclosures for inclusion in the annual report.
Under the Code the directors are required to state in the annual report that they consider “the annual report and accounts, taken as a whole, is fair, balanced and understandable and provides the information necessary for shareholders to assess the company’s performance, business model and strategy”. The board may ask the audit committee for advice in this area, but the board as a whole must form this judgement.
Annual report insights 2014 11

The Code also requires the audit committee’s report within the annual report to include information on the significant issues that it considered in relation to the financial statements and how these were addressed. An explanation of how the effectiveness of the external audit process was assessed should be provided as well. The FRC Financial Reporting Lab has published a report on audit committee reporting, which may prove useful in considering how best to prepare and present the required information.
Under the Code, FTSE 350 companies also need to put the audit out to tender at least every ten years, subject to transitional provisions – see below for further impending requirements around audit tendering and rotation.
In describing the work of the nomination committee the annual report should also include a description of the board’s policy on diversity, including gender, any measurable objectives it has set for implementing the policy, and progress on achieving the objectives.
The DTR also requires companies listed on the main market, amongst others, to include certain corporate governance disclosures, such as a description of the main features of the company’s internal control and risk management systems in relation to the financial reporting process.
The Listing Rules and the Code both require a statement by the directors that the business is a going concern, together with supporting assumptions or qualifications as necessary.
For periods commencing prior to 1 October 2014 this disclosure should be prepared in accordance with the “Going Concern and Liquidity Risk: Guidance for Directors of UK Companies 2009” published by the FRC in October 2009, which focuses on three key principles, discussed below.
• Assessing going concern: directors should make and document a rigorous assessment of whether the company is a going concern when preparing annual and half-yearly financial statements.
• The review period: directors should consider all available information about the future when concluding whether the company is a going concern at the date they approve the financial statements. Their review should usually cover a period of at least twelve months from the date of approval of the annual and half-yearly financial statements.
• Disclosures: directors should make balanced, proportionate and clear disclosures about going concern for the financial statements to give a true and fair view. Directors should disclose if the period they have reviewed is less than twelve months from the date of approval of the annual report and explain their justification for limiting the review period.
An updated version of this guidance was published in September 2014 and is discussed below.
12
Quoted companies reporting under CA06 are required to include a directors’ remuneration report. The remuneration report must contain a statement by the chair of the remuneration committee telling the story of the year in respect of remuneration.
Following this the report is split into a policy report (not subject to audit) and an annual report on remuneration (some elements of which are subject to audit). The policy report is subject to a binding shareholder vote.
The annual report on remuneration is subject to an annual advisory vote and includes a ‘single figure’ directors’ remuneration table. The GC100 Investor Group has published guidance on these new requirements.
A separate publication surveying the remuneration reports of FTSE 100 companies’ remuneration reports is described in Appendix 1 to this publication. Further information on this survey can be found at www.ukaccountingplus.com/en-gb/resources/other-regulatory/company-law/directors-remuneration.
New
New for 2014Although there are no significant changes to corporate governance disclosures in 2014 annual reports, a number of changes to the Code are effective for periods commencing on or after 1 October 2014. These changes are discussed below.
Hotspots
Regulatory hotspots in 2014The work of the audit committee will continue to come under scrutiny. Preparers should ensure consistent messaging insofar as it is appropriate between their audit committee reports, the auditor’s report and the critical judgements and key sources of estimation
uncertainty disclosed under IAS 1. Better explanations of any non-compliance with the Code are also a continued area of focus for regulators as are board diversity disclosures, with diversity referring to more than just gender diversity.
Moving away from disclosure hotspots, in its annual review of the Corporate Governance and Stewardship Codes for 2013, the FRC has stated it will be focusing on, amongst other things, reporting by small and mid-cap companies and board succession planning which is often highlighted as requiring attention during external effectiveness reviews. The FRC will undertake a project in 2014 to identify good practice to assist companies in meeting the Code principles on succession planning.
What the future holdsGoing concern and ongoing viability plus risk reportingUnder the most recent changes to the UK Corporate Governance Code (discussed in the corporate governance section below), for periods commencing on or after 1 October 2014 the following two board statements will be required:
• In annual and half-yearly financial statements, the directors should continue to state whether they considered it appropriate to adopt the going concern basis of accounting in preparing them, and identify any material uncertainties to the company’s ability to continue to do so over a period of at least twelve months from the date of approval of the financial statements; and
• The directors should state whether, taking account of the company’s current position and principal risks, they have a reasonable expectation that the company will be able to continue in operation and meet its liabilities as they fall due, drawing attention to any qualifications or assumptions as necessary. They should indicate the period covered by this statement, and why they consider that period to be appropriate.
The revised Code also requires boards to confirm that they have undertaken a robust assessment of principal risks and how those risks are managed and mitigated. Boards will have to monitor risk management and internal control systems on an ongoing basis, rather than once a year, and will need to explain actions taken to remedy and failings or weaknesses identified.
Supplementary guidance on solvency and liquidity risk management and the going concern basis of accounting is available for directors of banks.
Annual report insights 2014 13

Directors remuneration For periods commencing on or after 1 October 2014, the Code has been amended as follows:
• the Main Principle on remuneration has been amended to state that remuneration policies should be designed to promote the long-term success of the company;
• a new Code provision has been introduced requiring that company remuneration schemes should include arrangements for clawback and withholding of remuneration – as with the rest of the Code, companies will need to comply with this or explain their non-compliance; and
Another change, now broadened to apply to all AGM resolutions (rather than as originally proposed, just to those relating to directors’ remuneration), requires companies to set out how they intend to engage with shareholders on any AGM resolutions which have received a significant proportion of votes opposing.
Audit tenderingBefore the end of 2014 BIS are expected to consult on UK implementation of new EU legislation that will require all public interest entities to put their audits out to tender every ten years and rotate auditors after twenty years. The UK’s Competition and Markets Authority has also made an Order requiring FTSE 350 companies to put their audits out to tender every ten years; these rules will apply (subject to transitional provisions) in the same timescale as the EU audit legislation (i.e. with the earliest tenders being required when the EU law comes into force on 17 June 2017). The Order gives audit committees increased responsibilities for auditor independence and oversight; these changes take effect for financial years commencing on or after 1 January 2015.
Link to survey findingsChapters 11 and 12 examine existing practices around corporate governance disclosures in annual reports.
Where to find out more
FRC’s 2014 amendments to the Code, guidance on risk management and internal control, plus a Governance in brief newsletter on this topic
Governance in brief newsletter on CMA’s audit tendering proposals
Further information on Deloitte’s survey of FTSE 100 companies’ directors’ remuneration can be found at www.ukaccountingplus.com/en-gb/resources/other-regulatory/company-law/directors-remuneration, together with a practical guide to reporting under the regulations introduced in 2013.
GC100 guidance on directors’ remuneration
www.ukaccountingplus.co.uk also has the latest information on corporate governance matters.
14

Financial statementsExisting requirementsListed groups are required to prepare consolidated accounts under IFRSs as adopted by the EU. Listed entities that are not parent companies, such as many investment trusts, can still prepare UK GAAP financial statements, with the replacement standard, FRS 102 The Financial Reporting Standard applicable in the UK and Republic of Ireland, available for early adoption. In June 2014 the FRC published a statement reconfirming that the presentation of a true and fair view remains a fundamental requirement of financial reporting.
The separate financial statements of a ‘qualifying entity’ can be prepared under FRS 101 Reduced Disclosure Framework, which closely reflects IFRS accounting but with reduced disclosures. If eligible, this may be an attractive option for many parent companies’ separate financial statements and for their subsidiaries. Another option is to apply FRS 102 with reduced disclosure. To apply FRS 101 or FRS 102 with reduced disclosure a company must notify its shareholders in writing and they must not object to its use. Companies could provide this written notification in a note to their current financial statements, proposing FRS 101’s use in the following year’s financial statements.
The auditor’s report on the financial statements must comply with the requirements of ISA (UK and Ireland) 700. For those companies reporting under the Code, the auditor’s report includes material on the most significant risks of material misstatement, materiality and the scoping of their audit work.
New
New for 2014At the time of writing ESMA were expected to publish finalised guidance on the use of non-GAAP measures before the end of 2014 (see the narrative reporting regulatory hotspots above). IOSCO have also released a consultation on proposals regarding
the use of such measures.
Preparers may also wish to inspect the FRC Financial Reporting Lab’s 2014 report on “Accounting policies and integration of related financial information” for inspiration in preparing disclosures around accounting policies.
For many UK companies, this will be the year of adoption for the new IFRS consolidation standards, each of which brings its own challenges. Notably:
• IFRS 10 Consolidated Financial Statements necessitates a reconsideration of which entities form part of a consolidated group, based on a single definition of control and new guidance on concepts such as ‘de facto’ control, protective rights and decision making as ‘agent’ for another investor; and
• IFRS 11 Joint Arrangements requires a determination of the rights and obligations of the parties to such an arrangement. This is then used to decide whether equity accounting or a method similar to proportionate consolidation is applied to the arrangement.
• IFRS 12 Disclosure of Interests in Other Entities introduces extensive new disclosure requirements on the make up of a group, including describing the significant judgements made in applying its sister standards IFRS 10 and IFRS 11.
Annual report insights 2014 15

See the table below for a comprehensive listing of newly issued IFRSs becoming effective for the first time in 2014.
TitlePer IASB IFRSs, mandatory for accounting periods starting on
or after:
Per EU-endorsed IFRSs, mandatory for accounting periods starting on
or after:
Relevant for periods commencing before 1 January 2014 (e.g. September 2014 year-ends)
Amendments to IFRS 1 (Dec 2010) – Severe Hyperinflation and Removal of Fixed Dates for First-time Adopters 1 July 2011 1 January 2013
Amendments to IAS 12 (Dec 2010) – Deferred Tax: Recovery of Underlying Assets 1 January 2012 1 January 2013
IFRS 13 – Fair Value Measurement 1 January 2013 1 January 2013
IAS 19 (revised June 2011) – Employee Benefits 1 January 2013 1 January 2013
IFRIC 20 – Stripping Costs in the Production Phase of a Surface Mine 1 January 2013 1 January 2013
Amendments to IFRS 7 (Dec 2011) – Disclosures – Offsetting Financial Assets and Financial Liabilities 1 January 2013 1 January 2013
Amendments to IFRS 1 (March 2012) – Government Loans 1 January 2013 1 January 2013
Annual Improvements to IFRSs: 2009-2011 Cycle (May 2012) 1 January 2013 1 January 2013
Relevant for periods commencing on or after 1 January 2014
IFRS 10 – Consolidated Financial Statements 1 January 2013 1 January 2014
IFRS 11 – Joint Arrangements 1 January 2013 1 January 2014
IFRS 12 – Disclosure of Interests in Other Entities 1 January 2013 1 January 2014
IAS 27 (revised May 2011) – Separate Financial Statements 1 January 2013 1 January 2014
IAS 28 (revised May 2011) – Investments in Associates and Joint Ventures 1 January 2013 1 January 2014
Amendments to IFRS 10, IFRS 12 and IAS 27 (Oct 2012) – Investment Entities 1 January 2014 1 January 2014
Amendments to IAS 32 (Dec 2011) – Offsetting Financial Assets and Financial Liabilities 1 January 2014 1 January 2014
Amendments to IAS 36 (May 2013) – Recoverable Amount Disclosures for Non-Financial Assets 1 January 2014 1 January 2014
Amendments to IAS 39 (Jun 2013) – Novation of Derivatives and Continuation of Hedge Accounting 1 January 2014 1 January 2014
IFRIC 21 – Levies 1 January 2014 17 June 2014
Annual Improvements to IFRSs: 2010-12 Cycle (Dec 2013) * – See p.17 TBC – endorsement expected Q4 2014
16

* Annual improvements to IFRSs 2010-2012 Cycle issued in December 2013 amended a number of standards. The amendments to IFRS 2 apply prospectively to share-based payment transactions with a grant date on or after 1 July 2014. The amendments to IFRS 3 apply prospectively to business combinations for which the acquisition date is on or after 1 July 2014. All the other amendments have a mandatory effective date of periods beginning on or after 1 July 2014. Earlier application is permitted in all instances (subject to EU endorsement). Where applicable, entities should disclose if certain amendments within the improvements are effective whilst others are not.
Hotspots
Regulatory hotspots in 2014In addition to non-GAAP measures, described in the narrative reporting section of this regulatory overview, the list below reflects areas that regulators are likely to focus on in reviewing 2014 accounts:
1. Impairment models, particularly those ‘value in use models’ incorporating a ‘hockey stick’ growth forecast (high growth in the early years). Where companies have a model which has such a profile, they should be particularly prepared for regulatory scrutiny. Regulators will focus on value in use calculations they perceive to have a higher risk of impairment, challenging key assumptions and any applicable missing sensitivity disclosures. Impairment is also an area which highlights the need for consistency in an annual report. Are the forecasts and other assumptions in testing goodwill for impairment the same as those used for other areas such as deciding whether to recognise deferred tax assets? If not, could you explain why?
2. Revenue recognition, particularly in cases where there has been a change in business model, is another area where regulators will be on the lookout for unusual policies and for aggressive revenue recognition, particularly when a new line of business may be taking time to build momentum.
3. Critical judgements and key sources of estimation uncertainty – these should clearly identify where management has exercised judgement and its effect. Boilerplate should not be used. See also the linkage points below.
4. In the second year of application of the revised version of IAS 19, pensions accounting and disclosures under scrutiny. Regulators are also set to focus on any pensions “structuring” that has been set up for a desired accounting effect and on disclosure of minimum funding requirements.
5. When going about the task of preparing a cash flow statement, it is tempting to assume that, since IAS 7 Statement of Cash Flows contains fewer headline categories than FRS 1 Cash flow statements, it is more flexible but in reality there is unlikely to be much of a grey area as to whether a transaction is operating, investing or financing in nature. Also, make sure that all numbers purporting to be cash flows actually are cash flows!
6. Fair value measurements under IFRS 13 and disclosure of related risks under IFRS 13 and IFRS 7 continue to be particularly relevant for financial institutions.
Impairment is also an area which highlights the need for consistency in an annual report. Are the forecasts and other assumptions in testing goodwill for impairment the same as those used for other areas such as deciding whether to recognise deferred tax assets?
Annual report insights 2014 17

What the future holdsVarious new IFRSs will come into effect in the coming years as set out in the table below, with each item ‘clickable’ for further information. As described above, old UK GAAP will cease to exist for periods commencing on or after 1 January 2015.
TitlePer IASB IFRSs, mandatory for accounting periods starting on or after:
Per EU-endorsed IFRSs, mandatory for accounting periods starting on or after:
Amendments to IAS 19 (Nov 2013) – Defined Benefit Plans: Employee Contributions 1 July 2014 TBC – endorsement expected Q4 2014
Annual Improvements to IFRSs: 2011-13 Cycle (Dec 2013) – Annual Improvements to IFRSs: 2011-13 Cycle 1 July 2014 TBC – endorsement expected Q4 2014
Amendments to IFRS 10 and IAS 28 (Sept 2014) – Sale or Contribution of Assets between an Investor and its Associate or Joint Venture
1 January 2016 TBC – endorsement expected Q3 2015
Amendments to IFRS 11 (May 2014) – Accounting for Acquisitions of Interests in Joint Operations 1 January 2016 TBC – endorsement expected Q1 2015
IFRS 14 – Regulatory Deferral Accounts 1 January 20166) TBC
Amendments to IAS 16 and IAS 38 (May 2014) – Clarification of Acceptable Methods of Depreciation and Amortisation
1 January 2016 TBC – endorsement expected Q1 2015
Amendments to IAS 16 and IAS 41 (Jun 2014) – Agriculture: Bearer Plants 1 January 2016 TBC – endorsement expected Q1 – 2015
Amendments to IAS 27 (Aug 2014) – Equity Method in Separate Financial Statements 1 January 2016 TBC – endorsement expected Q3 2015
Annual Improvements to IFRSs 2012-2014 Cycle 1 January 2016 TBC
IFRS 15 – Revenue from Contracts with Customers 1 January 2017 TBC – endorsement expected Q2 2015
IFRS 9 – Financial Instruments 1 January 2018 TBC
18

Other significant projects being undertaken by the IASB at the time of writing included the following:
• a new standard for insurance accounting;• a new standard for lease accounting;• the conceptual framework; and• the disclosure initiative, a broad-based initiative to explore how IFRS disclosures
can be improved.
Link to survey findingsChapters 13 to 15 examine existing practices around disclosures in financial statements.
Where to find out morewww.ukaccountingplus.co.uk has all the latest information on IFRSs as well as resources for transitioning to new UK GAAP, plus IASB and FRC projects.
Annual report insights 2014 19

The main objectives of the survey were to discover:
• the level of cohesiveness in annual reports where companies link together a company’s strategy, KPIs, business model, remuneration and financial results;
• the way companies are structuring their narrative reporting, and the extent to which the new strategic report has provided an opportunity for innovation;
• the content of strategic reports, including the level of detail provided, the ways that business models are described and common themes on key performance indicators and principal risks and uncertainties;
• the use of non-GAAP measures in both narrative and financial reporting and which items are commonly being excluded from adjusted earnings measures;
• the level of compliance reported by companies with the UK Corporate Governance Code and common areas of non-compliance;
• how well companies deal with the significant volume of disclosures required by IFRSs, including areas of regulatory focus such as critical accounting judgments and key sources of estimation uncertainty; and
• how the results varied depending on the size of the company and compared with similar surveys performed in previous years.
The annual reports of 100 UK listed companies were surveyed to determine current practice. This sample of 100 excluded investment trusts due to their specialised nature. Investment trusts are those companies classified by the London Stock Exchange in the non-equity or equity investment instruments sectors (this excludes real estate investment trusts).
In certain instances, example disclosures have been included from companies that were not included within our survey but which, having become aware of them, were deemed suitable for inclusion as a result of their usefulness and innovation.
In the current year we have aligned our larger category of companies sampled to reflect those in the FTSE 350 as at 30 April 2014. The “other” group captures companies outside of the FTSE 350. We have also rebalanced the number of companies selected in each of these categories to better reflect the proportion of companies other than investment trusts in the FTSE 350 (55) and outside the FTSE 350 (45). In previous years the large number of small investment trusts listed on the main market meant that we picked a greater proportion of small companies. This year’s revised approach means that our overall averages now more accurately reflect an “average” company that is not an investment trust. Our overall comparatives have also been restated to reflect this re-balancing and the differing trends between those in the FTSE 350 and those outside.
The overall sample is, as far as possible, consistent with that used in last year’s survey. As a result of takeovers, mergers, de-listings and changes in market capitalisations over the last 12 months, the sample could not be identical. Replacements and additional reports were selected evenly across both categories. The annual reports used those for years ending on or after 30 September 2013 and published before 15 August 2014. Any companies within our sample that failed to meet the DTR requirement to publish their annual report within four months of their year end were removed from our sample and replacements chosen at random.
4. Survey objectives
20

This chapter examines the general trends in overall annual report structure, including the length of the report, the effectiveness of communication, the structure of the annual report, the reporting timetable and the use of preliminary announcements.
Length of the reportThe length of annual reports has been a talking point for several years. Over the past few years, various publications have been produced aimed at combatting a perceived ‘disclosure overload’ which was felt by many to be causing annual reports to be of excessive length. More recently, the debate in this area has broadened to also focus on the quality of disclosures rather than just quantity, with the CFA Institute1 and ICAEW Financial Reporting Faculty2 both indicating that the problem is not necessarily excessively long disclosures but insufficient focus on the areas that are significant to individual businesses.
Standard setters are responding to these challenges. In its Guidance on the Strategic Report3 (the “FRC Guidance”), published in June 2014 as the first step in its new programme of work to promote clear and concise reporting, the FRC encourages companies to only include information that is material to their business in their strategic report. Some areas that companies may wish to focus on regarding this are the length of divisional operating reviews and the length of corporate social responsibility (CSR) disclosures – these in particular can often be more effective if a summary is presented in the annual report, with a cross-reference to more detail in a standalone CSR report. In relation to the financial statements, the IASB continues work on its disclosure initiative, with ongoing projects on the application of materiality to disclosures and financial statement presentation. It has also published a recent exposure draft of amendments to IAS 1,4 aimed at removing perceived impediments to preparers exercising their judgement in presenting their financial reports. Ideas for your annual report, which accompanies this publication, includes further thoughts on how companies can make their report as clear and concise as possible.
5. Overall impressions
Top tips
• Try to keep your annual report clear and concise – we saw annual reports continue to get longer, with an 8% increase in average length from 122 to 132 pages.
• Use changes in reporting requirements as a chance to refresh the relevant sections of your report rather than adding new material on top of old – the new strategic report and remuneration report have led to an increase in the average length of narrative from 70 to 77 pages.
• Link different elements of the report together – 64% of our sample included some linkage between sections but for most there is still room for improvement.
• Are you making the most effective use of electronic communication tools? Fewer companies produced an ‘enhanced’ electronic version of their report this year – only 44% compared to 54% last year.
Keep an eye on
• The speed of your reporting – despite the changes in reporting requirements, the median reporting time decreased to just 62 days (2013: 63 days).
• Your regulatory dissemination requirements – 12 of our companies produced a preliminary announcement based on unaudited results (2013: 10), with the remainder releasing a statement shortly after the approval of the annual report but prior to its publication.
1 http://www.cfapubs.org/doi/pdf/10.2469/ccb.v2013.n12.1
2 http://www.icaew.com/~/media/Files/Technical/Financial-reporting/Information%20for%20better%20markets/frd-final.pdf
3 https://www.frc.org.uk/Our-Work/Publications/Accounting-and-Reporting-Policy/Guidance-on-the-Strategic-Report.pdf
4 http://www.ifrs.org/Current-Projects/IASB-Projects/Amendments-to-IAS-1/ED-March-2014/Documents/ED-Disclosure-Initiative-Amendments-IAS-1-March-2014.pdf
Annual report insights 2014 21

However, there is no evidence that markets penalise companies for excessively long reports and regulators have so far been unwilling to challenge companies for disclosing too much rather than too little. Unless this changes, the upward trend in report lengths seen in recent years is likely to continue, as demonstrated by our survey results this year – see figure 5.1. As discussed in the regulatory overview, a whole raft of new reporting requirements have become effective for UK quoted companies since our last survey and it is no surprise that, as a result of these, annual reports have on average got longer again despite calls to ‘cut the clutter’. Not since our 2006 survey, the year in which UK companies applied IFRSs for the first time, have we seen such a large year on year increase.
Interestingly, as illustrated by figure 5.2, the change is most noticeable amongst the smaller listed companies surveyed – an average increase of 16%, compared to just 3% for the FTSE 350. This is due to the fact that some, if not all, of the companies in the FTSE 350 were already ‘looking forward’ to these new requirements in their previous reporting, including for example business models, reporting of greenhouse gas emissions and even in a few cases enhanced auditor reporting. This early adoption was much less prevalent amongst smaller companies, meaning that they have had to add more to their reports to meet these new requirements. As in previous years, the longest reports in our sample were the banks, with an average report length of 468 pages (2013: 415).
The shortest reports, unsurprisingly from companies outside the FTSE 350, were 43 pages long (2013: 25). Both were amongst the very smallest companies in our survey and, while cutting clutter is to be encouraged, these perhaps go a bit too far – they chose not to include any pictures or charts, opting instead for largely unbroken text. Both also included very limited detail on their corporate social responsibility activities.
-5
0
5
10
15
20
2013-20142012-20132011-20122010-20112009-20102008-20092007-20082006-20072005-20062003-20052000-20031996-2000
Figure 5.1. How has the average length of the annual report changed over time?
Increase in number of pages
119
6
15
47
-2
1 35
10
4
0
40
80
120
160
200
OthersFTSE 350Overall
Figure 5.2. How long is the annual report?
Number of pages
132 122 156 151 101 87
2014 2013
22

Directors’ remuneration reportingThe introduction of revised directors’ remuneration reporting requirements this year has had a significant effect on the length of remuneration reports. While some companies partially adopted the revised requirements early last year, for most companies the amount of information required on remuneration and the company’s associated policy went well beyond that which they had previously been providing. Figure 5.3 shows the effect of this change, as well as the average length of the components of the remuneration report for 2014.
0
4
8
12
16
20
OthersFTSE 350Overall
Figure 5.3. How long is the directors' remuneration report?
Number of pages
7
8
2
5
7
1
7
9
2
11 14 72014 2013
Remuneration policy Annual report on remuneration Other information
2014 2013 2014 2013
The ‘other information’ included is typically an introduction from the chairman of the remuneration committee discussing its activities during the year, although some companies also included other useful information – CLS Holdings plc presented a one and a half page ‘at a glance’ summary of the remuneration policy report for users interested in just the key messages. See Appendix 1 for key messages from a separate Deloitte survey on the first new-style directors’ remuneration reports.
CLS Holdings plc Annual Report 2014 (p47)
Annual report insights 2014 23

CLS Holdings plc Annual Report 2014 (p48)
Auditor reportingAs discussed further in chapter 13, the annual reports surveyed this year have included new enhanced auditor’s reports, which give a lot more detail on what the auditor has done to form their opinion on the financial statements rather than just simply noting whether or not their opinion is qualified. As a result of this extra information, auditors’ reports have got longer. The average group audit report was 3.4 pages long, compared to the one or sometimes two pages seen last year. Some companies also have a separate audit report for the parent company, or other report from their auditor (for example on the operation of internal controls), resulting in statements from the auditor running to as many as seven pages of the annual report for two of the companies in our sample!
Effectiveness of communicationWith reports getting longer and containing more information, companies are having to focus more on how their annual report can effectively communicate with its users. This involves more than just putting the right information in – visual engagement, ease of navigation and effective use of interactivity (in electronic reports) are all equally important. The FRC guidance reinforces these sentiments by discussing the communication principles to be adopted in preparing a strategic report, which are covered in more detail in chapter 3.
It was encouraging to see an improvement in the use of pictures and graphics in this year’s survey, with 85% of companies judged to have a visually engaging report compared to 83% last year. However, ease of navigation has moved in the opposite direction, with only 74% of reports judged easy to navigate compared to 79% in 2013. This is due to the increased amount of information required to be presented this year – the longer a report, the more thought needs to go into ensuring that there is good use of cross-referencing and that the information flows well to ensure that the reader doesn’t get ‘lost’.
The number of companies producing ‘enhanced’ electronic reports has also decreased this year. Where last year 54% of companies produced an enhanced electronic report (either an HTML version or an enhanced pdf with electronic navigation features), this year only 44% did so. Figure 5.4 shows the level of electronic enhancement added to reports by companies. It may be that having tested the water in previous years preparers have now decided that the benefits of these enhanced electronic versions do not justify the time, effort and cost. The FRC’s Financial Reporting Lab is currently undertaking a long-term project Corporate Reporting in a Digital World5 looking at how companies use digital media in their corporate reporting communications to investors and how investors use what is produced. It will be interesting to see if investors view sophisticated electronic reporting as an unnecessary gimmick or a key part of effective communication in today’s digital world.
5 https://frc.org.uk/Our-Work/Publications/Financial-Reporting-Lab/Call-for-participants-Corporate-reporting-in-a-Dig.pdf
24

Figure 5.4.
What type of pdf reports are prepared by companies?
What proportion of companies produce an HTML report?
132 151 101 87
Basic pdf Enhanced pdf No HTML version
Enhanced HTML content
Basic HTML version
68%
83%
% 16%
16%
It is mainly FTSE 350 companies producing HTML reports (23 out of the 32 companies). Such companies usually have larger investor relations departments, which gives them more resources to allocate to producing a dedicated online report. We have also analysed the HTML reports into ‘basic’ and ‘enhanced’ reports – an enhanced report is one where the company has created additional specific content for the HTML report, such as videos to illustrate key messages (for example Aviva PLC) or an interactive map of the company’s operating locations (for example CLS Holdings plc).
Structure of the annual reportAs a result of the substantial changes in narrative reporting requirements, in particular the new directors’ remuneration report format, the proportion of narrative information to financial information is higher in the annual reports surveyed this year than last year, as shown by figure 5.5. For the first time, companies outside the FTSE 350 have, on average, more narrative information than financial statements in their reports this year.
While the content and presentation of financial statements are heavily prescribed by IFRSs, companies have a lot more scope to shape their narrative reporting to fit their particular circumstances – and indeed are encouraged to.
0%
10%
20%
30%
40%
50%
60%
70%
OthersFTSE 350Overall
Figure 5.5. What percentage of the report consists of narrative information?
57% 54% 60% 58% 53% 49%
2014 2013
For example, while all companies are required to present certain information for the business as a whole, presenting segmental analysis by geography or business type in the front half is also common. However, for some companies this lack of prescription around the way narrative information is presented can lead to confusing, bloated and poorly-structured reports. Some ideas for how companies can avoid this and ensure that their narrative reporting is clear and concise are set out in Towards Clear & Concise Reporting,6 the latest report from the FRC’s Financial Reporting Lab.
One issue highlighted in the FRC’s strategic report guidance (see chapter 3 for more details) is unnecessary duplication of information and the inclusion of immaterial information. The idea of the strategic report is that it should capture only information that is of strategic importance to the business. One example of good practice in this area seen in this year’s survey is shown by Barclays PLC. Given that they have a report which runs to over 400 pages in total, Barclays have done well to keep their strategic report to just 50 pages for example by including detailed regulatory risk information in separate risk review and risk management sections and putting the detailed financial review in a separate section. The inclusion of a governance overview and summary risk report in the strategic report also helps to link this to the detailed information in the governance section. 6 https://www.frc.org.uk/Our-Work/
Publications/Financial-Reporting-Lab/FRC-Lab-Towards-Clear-Concise-Reporting.pdf
Annual report insights 2014 25
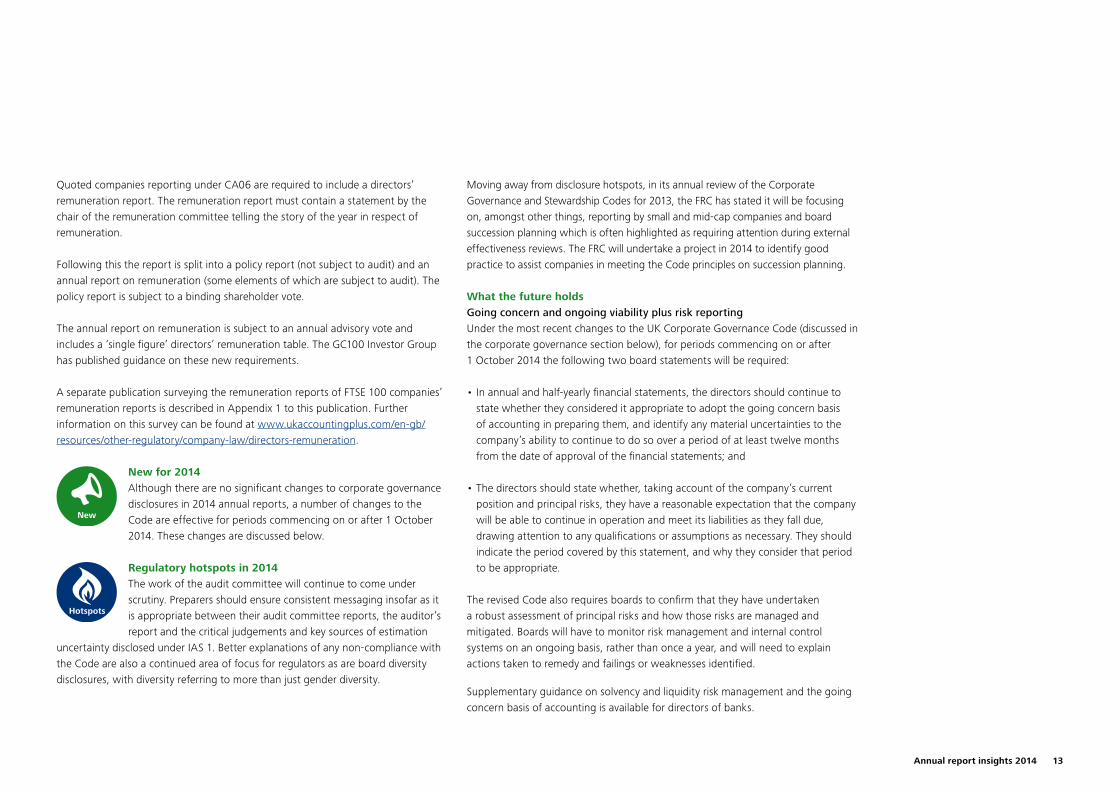
Another good example of how information can be cut down is given by Mitie Group plc, who have substantially cut down on the amount of CSR information in their annual report by including only essential information on corporate social responsibility in the strategic report, with a cross-reference to a separate sustainability report.
Mitie Group plc Annual Report 2013 (p34 and p35)
26

The importance of demonstrating the links between different pieces of information presented in the annual report is a key theme of the FRC’s guidance – this is further highlighted by the increasing proportion of narrative information we have seen in our survey data. Linkage helps a user understand the relationships and interdependencies between different aspects of a business, thus facilitating a deeper insight. For example, how do the KPIs measure the effectiveness of the company’s business model and strategy, and the achievement of its objectives?
And which elements of its strategy could be affected by the principal risks identified? How do the various corporate responsibility commitments discussed help the company to deliver value to its shareholders? In each subsequent chapter you will see a discussion of the links that can be drawn between various sections of the report, as well as some examples of how this can be done effectively.
0%
20%
40%
60%
80%
100%
OthersFTSE 350Overall
Figure 5.6. How much linkage is evident in annual reports?
Percentage of companies
36% 20% 57%
55%
9%
68%
13%
39%
5%
No clear evidence Limited amount Comprehensive
Figure 5.6 shows an overall assessment of how well companies link together the information in their reports. It is not surprising to see more of the FTSE 350 including linkage (and a greater proportion of them making an effort to ensure that it is clear and consistent) in their reports than smaller companies – the longer a report is, the more important linkage is. However, the number of companies including no clear evidence of linkage is undesirably high and we would hope to see this statistic decrease in future years, particularly given the final publication of the FRC Guidance, which includes numerous examples of how linkage can be achieved. Ideas for your annual report, which accompanies this publication, includes further thoughts on how companies can demonstrate linkage. In our 2013 survey, only 32% of companies were assessed as having a reasonable amount of linkage in their reports, so it is evident that there has been progress in this area during the year.
Integrated reportingIn many respects, assessing the impact that integrated reporting has had on corporate reporting in the UK is surprisingly difficult. In terms of our survey data, only five of the companies in our sample mentioned integrated reporting specifically in their annual reports, and only two reported that they had followed the IIRC’s <IR> Framework. However, if one studies the <IR> Framework and then looks at a UK listed company’s annual report, a lot of the elements called for are consistent. This is because many of the key ideas have been reflected in the UK reporting environment in other ways. One example is that the Act calls for companies to talk about various non-financial resources in their strategic report, mirroring the call from <IR> to focus on more than just the finances by introducing the concept of ‘capitals’ e.g. human and natural capital. Another is the focus on linkage in the FRC’s strategic report guidance, moving companies towards the integrated thinking that is a key part of <IR>. Indeed, the FRC have stated that they believe preparing an annual report in accordance with the Guidance will result in a report that is consistent with the <IR> Framework7.
7 https://frc.org.uk/News-and-Events/FRC-Press/Press/2014/June/FRC’s-work-to-encourage-clear-and-concise-reportin.aspx
Annual report insights 2014 27

Some of the other specific points called for by <IR> are considered in the other chapters of this publication. For example, how well companies include a discussion of value creation as part of their business model is discussed in chapter 7, as is corporate social responsibility reporting – which can be seen as a discussion of non-financial capital identified in the <IR> framework.
Reporting timetableDespite the additional challenges for companies this year in complying with a number of new reporting requirements, it is interesting to note that there has been a further acceleration of reporting timetables, with the median company reporting in 62 days (2013: 63). While some companies take full advantage of the four months allowed by the UK Listing Authority’s Disclosure and Transparency Rules (DTR), others like to get their report out as quickly as possible, with the fastest (a telecommunications business) doing so in just 37 days (2013: 39). Figure 5.7 shows a box-plot of the reporting times for companies in our survey.
30
50
70
90
110
130
OthersFTSE 350Overall
Figure 5.7. How quickly was the annual report approved?
Number of days
726255
37
98
645854
37
121
86
6959
42
121
However, the time between year-end and the reporting date is only one half of this picture. Most companies begin putting together their annual report months in advance of the year-end, building a template and creating a narrative arc into which the final figures can be swiftly fitted once they are produced. Obviously, as this is an internal process we are unable to collect data on it in our surveying. Nevertheless, Ideas for your annual report, which accompanies this publication, gives our thoughts on how companies can structure this process to produce a high-quality report that nevertheless can be produced quickly after year-end, increasing the timeliness of the information it provides to shareholders.
Preliminary announcementsAlthough preliminary announcements are no longer required by the Listing Rules, 96 companies produced similar announcements which were often referred to as ‘preliminary announcements’. Given DTR 2.2 (disclosure of price sensitive information) and Listing Rule 9.7A.2 (announcement of dividend and distribution decisions) require announcements of this type of information to be made as soon as possible, for practicality most companies choose to issue a ‘preliminary announcement’ when their annual report is approved, with the full “glossy” report published on the company’s website at a later date.
Of the companies in our sample, 12 (2013: 10) produced a preliminary announcement which was based on unaudited results. Five of these were companies in the FTSE 100, with three in the FTSE 250 and four smaller companies. Of the remaining companies, 84 (2013: 80) produced a preliminary announcement based on their audited results (although one of these made no mention of the audit, it was published on the same day as the annual report was approved), and four published their full annual report in unedited text.
Most companies begin putting together their annual report months in advance of the year-end, building a template and creating a narrative arc into which the final figures can be swiftly fitted once they are produced.
28

As discussed in chapter 5, annual reports are getting longer and the quantity of information they are required to provide is also increasing. Equally, users and regulators are calling for clearer signposting of key information. Although there is no requirement to do so, the presentation of a short summary section at the front of an annual report can be an effective tool in cutting through the clutter, bringing together key financial and narrative information in one place and showing the links between them.
The use of such a summary section is becoming ubiquitous – in our survey this year 99% (2013: 97%) of the companies we looked at presented some form of summary information at the start of their annual report. Figure 6.1 shows the historical trend in this area.
Figure 6.1. What percentage of annual reports include a summary information section?
88%
92%
97%
83%
99%
80%
90%
100%
20142013201220112010
With the use of summary information becoming so prevalent, regulators are starting to pay more attention to the kind of information it contains. In its recent consultation on operating procedures for reviewing corporate reporting8, the FRC has specifically noted that its Conduct Committee may in future comment on aspects of an entity’s annual report other than compliance with mandatory requirements to encourage improvements to the quality of its future reporting.
While there are no direct requirements as to the narrative content of a summary section, it does still fall within the remit of the newly required directors’ ‘fair, balanced and understandable’ statement9 and the general duty of the auditors to report that information contained in the annual report is not inconsistent or misleading. Particularly in relation to the ‘balanced’ aspect of this statement, directors should exercise caution when presenting ‘highlights of the year’ in the summary section to ensure that they are not giving more prominence to positive events compared to those which are less favourable – in our view, several of the reports in our survey sample could be open to challenge in this regard.
6. Summary material
Top tips
• Summary sections are a great place to show how the report links together, but only 29% of the reports we looked at did this.
• Include a good balance of narrative and financial information – 95% of companies (2013: 94%) presented financial highlights in their summary, with 92% (2013: 90%) presenting narrative information.
• Think about the relationship between the metrics presented in your summary and your KPIs – only 15% (2013: 19%) of companies presented non-financial KPIs in the summary section, with 67% (2013: 66%) presenting financial KPIs.
Keep an eye on
• Prominence of non-GAAP measures – 86% (2013: 83%) of reports included non-GAAP financial measures, with 63% of these giving them more prominence than the associated GAAP measures, something that could leave them open to regulatory challenge.
• An effective summary section is now seen as an integral part of the annual report – 99% (2013: 97%) of companies included one.
8 https://frc.org.uk/Our-Work/Publications/Corporate-Reporting-Review/Consultation-Paper-Revised-operating-procedures-fo-File.pdf
9 The statement required by provision C.1.1 of the UK Corporate Governance Code 2012 that “the annual report and accounts, taken as a whole, is fair, balanced and understandable and includes and provides the information necessary for shareholders to assess the company’s performance, business model and strategy.”
Annual report insights 2014 29

What kind of information is included in the summary section?Figure 6.2 shows the type of information presented by companies in their summary information sections. 95% (2013: 94%) included some financial information, usually a summary of the results for the year. 92% (2013: 90%) presented some narrative information, with the common types of narrative information listed in figure 6.2.
0%
20%
40%
60%
80%
100%
CustomersProductsOperatinglocations
StrategyWhat thecompany does
Financialhighlights
Figure 6.2. What kind of information is presented in the summary pages?
Percentage of companies presenting this information
95% 88% 53% 55% 55% 22%
However, many companies also included other types of information. For example:
• a list or timeline showing key events that had occurred during the year (for example Vodafone Group Plc);
• case studies of key projects (for example Morgan Sindall Group plc);
• an investment proposition, setting out how the company will deliver shareholder returns (for example Brewin Dolphin Holdings PLC); and
• awards won by the company (for example St James’s Place plc).
Unsurprisingly, most companies presented a brief overview of what they do as part of the narrative summary. Including this may seem like stating the obvious but it is very helpful to the user, giving a context to the rest of the information presented in the report. This year more companies linked this discussion to the business model that is now specifically required in the strategic report. Although the number of companies including the entire business model in the summary section is still in the minority, as shown by figure 6.2 many include some elements of their business model, for example the locations they operate in, the products they create and the customers that they serve. A good example of an overview of the key elements of the business is given by Croda International Plc.
Croda Annual Report 2013 (p3)
30

In general, businesses tend to focus on those elements that are most important to their business model. For example, a multinational might present a map of the world showing where they operate. As illustrated by figure 6.2, many companies talked about their products but fewer went on to provide a corresponding discussion of their customers. Developing the discussion of a company’s products to include its target markets is a good example of the linkage between what a company does and its strategy (discussed below) – showing not just what it is doing but why. Companies which operate in the middle of the supply chain, and therefore have a smaller number of more significant direct customers, were more likely to include a discussion of this in the summary than retail businesses with a very diverse customer base. For those companies undergoing a strategic transformation, a discussion of this in the summary section is common, as this has a big impact on the whole report. An example of such a company is Thomas Cook Group plc.
Thomas Cook Group plc Annual Report 2013 (p1)
Having set out what a company does and why, the best summary sections that we saw then went on to discuss how the company’s strategy, objectives, risks and KPIs link together, in effect providing an overview of the entire report.
Figure 6.3 sets out the proportion of companies that linked together some or all of these aspects in their summary section.
0% 10% 20% 30% 40% 50% 60% 70%
Figure 6.3. Do companies link together various elements of their report in the summary
2%
29%
69%
55%
Yes No No summary
Another way in which the most effective companies relate their summary sections to the rest of the report is by including cross-references from the summary information to more detail presented later on. 37% of companies surveyed provided such references this year, an improvement on 27% last year.
As discussed in chapter 5, the idea of linkage is a key theme of the FRC Guidance, which encourages companies to illustrate the links between different sections of their strategic report but also within the annual report more widely. While some companies are doing well in this area, for many there is more work to do.
Annual report insights 2014 31

The summary section of the report can be a very effective location to demonstrate these links at a high level, with a summary of each section of the report linking to the more detailed information given later on. Good examples of summary sections that display both are BT Group plc, SEGRO plc and Croda International Plc.
BT Group Annual Report 2014 (p6 and p7)
32

SEGRO plc Annual Report 2013 (p4 and p5)
Annual report insights 2014 33

Presentation of financial highlightsAs shown by figure 6.2, the vast majority of companies we surveyed presented some sort of financial summary information at the beginning of their annual report. Inevitably, companies want to explain their results in the most meaningful way and the use of pure IFRS figures may not always allow them to do this. For this reason, most companies present some ‘non-GAAP’ information – typically figures that are adjusted in some way to exclude ‘exceptional’ or ‘one-off’ items. Figure 6.4 shows how many companies present such non-GAAP information and the level of consistency seen between the measures presented in the summary section and any adjusted measures presented in the financial statements themselves.
Figure 6.4. How consistent are non-GAAP measures in the summary?
88%
No non-GAAP measures
Consistent with both I/S and IFRS 8
Consistent with I/S only
Consistent with IFRS 8 only
Based on industry guidelines
Not consistent with other information
34%
15%
14%20%
4%
13%
There have been several recent regulatory developments in relation to the presentation of non-GAAP measures. As well as the information set out below, these are also discussed in chapter 3 (the regulatory overview) and, specifically in the context of the income statement, in chapter 14. Our April 2014 Accounting roundup also includes further details on this topic.
In December 2013, the FRC published a press notice10 reminding boards of what they should consider when they present exceptional or similar items, including how a company should identify items to be excluded when presenting non-GAAP measures.
Both the European Securities and Markets Authority (ESMA)11 and the International Federation of Accountants (IFAC)12 published draft proposals on the topic of non-GAAP measures in February 2014. The ESMA proposals focus mainly on the presentation of alternative performance measures (APMs), as they describe them. In particular, they propose that “APMs that are presented outside financial statements should be displayed with less prominence, emphasis or authority than measures directly stemming from financial statements prepared in accordance with the applicable financial reporting framework”. This is a significantly more aggressive stance than regulators have taken to date – with the FRC, for example, suggesting that non-GAAP measures should not be given greater prominence than GAAP measures but that equal prominence would be acceptable.
Of the companies in our sample, only one (other than those that did not identify any non-GAAP measures) gave greater prominence to GAAP measures over non-GAAP measures. 63% of companies that presented non-GAAP measures either presented them with greater prominence than the associated GAAP measures, or did not present the associated GAAP measure in their summary at all. In fact six companies presented only non-GAAP measures in their summary section, with no GAAP figures at all. This is an area in which we would expect to see significant change when final guidance is published by regulators, assuming that it is consistent with the position already being taken on a case by case basis. With many companies already out of line with the regulatory position, changes are likely to be necessary to comply with the published requirements. While there may be some debate over what is meant by ‘equal prominence’ or ‘less prominence’, it seems unlikely that presenting a non-GAAP measure as a financial highlight without the associated GAAP measure will be seen as appropriate.
10 https://www.frc.org.uk/News-and-Events/FRC-Press/Press/2013/December/FRC-seeks-consistency-in-the-reporting-of-exceptio.aspx
11 http://www.esma.europa.eu/system/files/2014-174_esma_consults_on_guidelines_on_alternative_performance_measures_13.02.2014_0.pdf
12 http://www.ifac.org/sites/default/files/publications/files/Developing-and-Reporting-Supplementary-Financial-Measures-Guidance-Exposure-Draft-PAIB-Feb-2014_0.pdf. Registration (which is free) is required to view this.
34

In our view it is surprising to see 20% of the companies we surveyed presenting measures of revenue or profitability in the summary information that are not clearly evident in the back half of the report. It is easy to see why investors would be interested in the performance measures presented in the IFRS 8 Segmental analysis note, as these are the measures monitored by management. Equally, where certain non-recurring items are presented separately on the face of the income statement it makes sense to present the resulting underlying measure in the front half of the report.
Where there is specific guidance for a particular industry, for example the guidelines for the real estate industry produced by the European Public Real-Estate Association (EPRA) or the use of European Embedded Value (EEV) reporting in the insurance industry, it is understandable to see non-GAAP measures presented on these bases in the front half. However, presenting non-GAAP measures in the front half that do not tie to the back half can reduce their usefulness to investors as it is less transparent how these measures have been calculated or why they are appropriate.
Inclusion of KPIs in the summary sectionAnother interesting comparison to draw is between the information presented by companies as KPIs in their narrative reporting and the information included in the summary section. It is intriguing that, while 68% of the companies surveyed identified at least one non-financial measure as a KPI (2013: 68%), only 15% presented any of these measures in the summary section (2013: 19%). This compares to the 67% (2013: 66%) that presented financial KPIs as part of their summary section. This suggests that non-financial KPIs are still ‘second class citizens’ to some extent, although the most progressive companies do recognise that non-financial KPIs can give investors insight into the resources of the business that are not reflected on its balance sheet but are integral to the company’s business model and success.
Chapter 7 looks in more detail at how well companies integrate the discussion of non-financial resources into their strategic reports.
Figure 6.5. Are measures presented in the summary section the same as KPIs?
88%
All are KPIs Mixture All non-KPIs No clear KPIs
68%
5%8%
19%
Figure 6.5 shows how the measures presented by companies in their summary sections related to their KPIs.
In general, we see a mixture of KPIs and non-KPIs being used in the summary information. By their very nature, one would expect a company’s KPIs to capture the essence of its success or failure in executing its strategy – in this respect it is surprising that only 13% (2013: 13%) presented all of their KPIs in the summary information.
In general, we see a mixture of KPIs and non-KPIs being used in the summary information. By their very nature, one would expect a company’s KPIs to capture the essence of its success or failure in executing its strategy …
Annual report insights 2014 35

However, presenting measures such as revenue, profit before tax or earnings per share in the summary section is likely to be useful to investors regardless of whether these are specifically identified as KPIs by the company. We would not expect such measures to be identified as KPIs by every company.
A good example of a summary section which sets out an overview of the company’s business and strategy and then links this to its KPIs is Speedy Hire Plc. Another such example is given by SEGRO plc.
The types of measures identified by companies as KPIs are discussed in more detail in chapter 8.
Speedy Hire Plc Annual Report 2014 (p2)
36

The reports that we have looked at this year were the first to include the newly required strategic report, a component of the annual report that is distinct from the directors’ report and which replaces the business review that was previously required. All companies in our survey took on board this change. In practice, most listed companies used to present their business review separately from the rest of the directors’ report (of which the business review was a part) and so this in itself did not necessarily require big changes in the structure of annual reports.
Having said this, the FRC encouraged companies to use this change as an opportunity to refresh their reporting and there have been some notable improvements.
The regulatory overview in chapter 3 sets out details of the changes in requirements as a result of the new legislation. The overall aim of the strategic report is to present a fair review of the company’s business, including the development and performance of the business during the year and its position at the year-end. Some of the key elements of this which are discussed in this chapter are:
• a description of the company’s business model;
• a discussion of the company’s objectives and strategy; and
• relevant information regarding corporate social responsibility activities, including employees, the environment, social and community issues and human rights.
Although the new legislation strictly requires disclosure of greenhouse gas emissions in the directors’ report not the strategic report, in practice most companies have used the ability to ‘elevate’ this information to the strategic report, so it is also covered in this chapter.
The strategic report is also required to contain a discussion of principal risks and uncertainties and key performance indicators relevant to the business. Both of these areas have dedicated chapters of their own – see chapter 8 for principal risks and chapter 9 for KPIs.
Unsurprisingly, we have seen the legal changes reflected in the data from this year’s survey. For example, all but two companies included a specific section discussing their business model in their 2014 reports, although it is worth noting that 75% included some discussion of their business model in their 2013 accounts.
7. The strategic report
Top tips
• A meaningful visual representation of your business model can significantly improve the clarity of the disclosure – 59% of companies included this (2013: 53%).
• Clearly set out your objectives for the business – 54% of companies identified both financial and non-financial objectives.
• Link your strategy and objectives to the KPIs that measure their success – 54% (2013: 41%) of companies did this.
• Put in place a process to identify information that is of strategic importance – 97% of companies promoted some information from the directors’ report to the strategic report, with future developments (96%) and greenhouse gas emissions (70%) the most common.
Keep an eye on
• Signposting the discussion of your business model – 94% of this year’s reports did this (2013: 53%).
• The required formats for greenhouse gas and gender diversity disclosures – 13% of reports did not clearly comply with the new greenhouse gas emissions reporting requirements while 27% did not do so for gender disclosures.
Annual report insights 2014 37

Two other recent developments in relation to the strategic report are the release in December 2013 by the International Integrated Reporting Council (IIRC) of the final version of its International Integrated Reporting Framework (<IR> Framework)13 and, more recently, the publication of its final Guidance on the Strategic Report14 by the FRC in June 2013. Both of these are discussed in detail in the regulatory overview.
Five of the companies in our sample mentioned integrated reporting in their reports, with two actually reporting that they comply with the Framework in the current year (although one of those, Mondi plc, is a group with a dual listing in the UK and South Africa and as such is required by South African law to prepare an integrated report) and the other three mentioning as something they will look to in the future.
The business modelProbably the most significant change to reporting requirements introduced by the new legislation was a specific requirement for quoted companies to discuss their business models in their annual reports. There was no explicit requirement to do this in the previous legislation, although many companies did so as the UK Corporate Governance Code included a provision requiring it (operating, as usual, on a ‘comply or explain’ basis). 94% of the reports surveyed in 2014 (2013: 53%) included a clear section of their annual report dedicated to a discussion of the business model – although it is worth noting that a further 23% of reports in 2013 (2014: 2%) did include a section discussing the information one would expect to find in a business model without describing it as such. 0 10 20 30 40 50 60 70 80
Figure 7.1. How much detail do companies provide on their business model?
Comprehensive coverage Shorter summary with cross-references
Brief description No business model presented
0% 20% 40% 60% 80% 100%
2013
2014
58%
78%
9% 10% 23%
15%
4%3%
As shown by figure 7.1, the level of detail given by companies in their business model has also improved following the change in legislation. In theory the business model should set out how the company generates and preserves value over the long term, although in our view this is not something that all of the business model disclosures we saw actually did – see the ‘Value creation’ section below for more detail. At the highest level, the business model is a description of what the business does and why and how it does it. It should provide shareholders with an understanding of how the entity is structured, the market in which it operates and how the entity engages with the market (e.g. what part of the value chain it operates in, its main products, services, customers and its distribution methods). It should also describe the nature of the relationships, resources and other inputs that are necessary for the successful continuation of the business.
13 http://www.theiirc.org/wp-content/uploads/2013/12/13-12-08-THE-INTERNATIONAL-IR-FRAMEWORK-2-1.pdf
14 https://www.frc.org.uk/Our-Work/Publications/Accounting-and-Reporting-Policy/Guidance-on-the-Strategic-Report.pdf
38

A good example of a business model that is very comprehensive is Rexam PLC, which provided comprehensive narrative detail and two diagrammatic representations – one showing the way the business transforms inputs into outputs, including the different stakeholders that it generates value for, such as paying cash returns to shareholders, salaries to employees, taxes to the government and purchases from suppliers. The other diagram demonstrated focused on how it created shareholder value through its activities while maintaining a target return on capital employed.
Rexam PLC Annual Report 2013 (p12 and p13)
Annual report insights 2014 39

A good example of a short summary with differentiating factors and cross-references to detailed discussions elsewhere is given by St. Modwen Properties PLC.
St. Modwen Properties PLC Annual Report 2013 (p6 and p7)
40

Another practice that has become more common this year is the inclusion of a visual representation of a company’s business model, with 59% of companies including one (2013: 53%). This can be very effective – however the use of a picture needs to go hand in hand with an appropriate level of supporting narrative. The picture also needs to be specific to the company. In some cases the visual representations were superficial, with abstract diagrams, which once analysed, did not communicate how the business creates value.
One area in which the use of a clear and effective diagram can be very helpful is in demonstrating linkages between the different elements of a company’s business model, for example the inputs, processes and outputs involved. It can also help to highlight how the business generates value. A good example of effective use of a visual representation is given by International Personal Finance plc.
International Personal Finance plc Annual Report 2013 (p4)
The idea of linkage, ensuring that a company demonstrates how all of the different sections of the strategic report relate to one another, is one of the key themes of the FRC Guidance. One could argue that the business model should be at the heart of the annual report, and is therefore a natural place to demonstrate how it all links together. One company that has shown this linkage effectively is Halma plc.
Halma plc Annual Report 2013 (p15)
Annual report insights 2014 41

Value creationOne of the key themes of integrated reporting is the idea of value creation. Of course, the aim of all businesses is to create value for their shareholders in some way, but a good business model disclosure should set out exactly how the business creates value. This is consistent with the FRC Guidance which refers to how an entity generates or preserves value over the longer term, and how it captures that value. At a high level this may be as simple as whether it aims to return as much cash as possible to investors or retain it in the business for reinvestment, with capital growth providing shareholder return. However, the best reports go much further than this – identifying the key differentiating factors within a business that allow it to generate value within each of its activities. They also identify how value is created for other stakeholders, not just the owners of the business.
Figure 7.2 illustrates how many companies discuss their value creation activities. One of the particular ideas of the <IR> Framework is that companies should discuss value creation in the short, medium and long term, i.e. not just how they create value now but how they will ensure that they continue to create value in the future.
While most companies discuss their value creation activities in some way, only a minority have this future focus to their discussion.
0%
20%
40%
60%
80%
100%
OthersFTSE 350Overall
Figure 7.2. How many companies discuss value creation?
50% 39% 64%
30%
9%
39%
13%
18%
Specific detail including development over timeSome discussion
Of course, the aim of all businesses is to create value for their shareholders in some way, but a good business model disclosure should set out exactly how the business creates value.
42

Good examples of business models that include a discussion of value creation and preservation are BTG plc and North Midland Construction PLC.
North Midland Construction PLC Annual Report 2013 (p10 and p11)
Annual report insights 2014 43

Both the <IR> Framework and FRC Guidance talk about the importance of non-financial resources, as well as financial ones, to a business. For example, no business can operate without employees, customers and suppliers – understanding the strength of these relationships can be as important to understanding its overall health as understanding the state of its debt facilities.
The best business model descriptions incorporate non-financial resources, such as relationships, intellectual property and natural resources. It is encouraging that 87% of the reports we surveyed included some discussion of non-financial resources in their business model – a good example of this is provided by Xchanging plc.
Xchanging plc Annual Report 2013 (p8 and p9)
44

Market overviewAnother useful piece of the puzzle, which provides context for the other elements of the strategic report, is an overview of the markets that the company operates in. Clearly explaining the markets that a business operates in, including the current trends and expected future developments in how they operate, provides information on the opportunities available for a company to exploit and the threats to which it is exposed. This is something that was presented by 57% of the companies in our sample. This illustration can be a useful aid in explaining why the company has adopted the strategy that it has. A good example of such an overview, which goes on to explain how the company is responding to the trends in its market, is given by TT Electronics plc.
TT Electronics plc Annual Report (p12 and p13)
Annual report insights 2014 45

Objectives and strategyAlthough company law does not require a business to include a discussion of its objectives in its annual report, this is something that the FRC Guidance suggests should be included – after all, a description of the strategy is required and without the objectives that it is working towards it would seem rather meaningless. Also, the Code notes that the annual report should contain an explanation of ‘the strategy for delivering the objectives of the company’ (Provision C.1.2). At a high level, all companies ultimately have an objective of maximising shareholder value. However, most companies identify more specific objectives setting out how they will achieve this aim. Figure 7.3 shows the types of objectives identified.
Figure 7.3. What type of objectives are identified by companies?
88%
Both financial and non-financial
Financial only
Non-financial only
No objectives identified54%
17%
1%
28%
Overall most companies identify both financial and non-financial objectives, which is encouraging evidence that businesses are recognising the importance of maintaining a balanced view of the company. Ultimately, successful pursuit of carefully selected non-financial goals is likely to make achieving a company’s financial targets, arguably of primary importance to the investor, that much easier. The merits of non-financial goals are supported by the IIRC’s Integrated Reporting Framework and FRC Guidance.
Only 41% of the companies we surveyed included a discussion of their long-term objectives for the development of the business. This links to the proportion of companies that discuss how the business creates value in the short, medium and long term, as discussed above in the context of the business model. It is important for companies to focus on the long term health of the business as well as its immediate future, an idea that is picked up in the latest proposals on going concern (see chapter 10) and the IIRC’s Integrated Reporting Framework. Setting out clear long-term objectives is also likely to be helpful in illustrating the link between executive remuneration and long-term performance, a key element of the remuneration policy that companies are required to present under the new remuneration reporting rules.
Linking the objectives of the business to the strategy that is intended to achieve them is also key. Unsurprisingly, all of the companies we surveyed discussed their strategy in some way.
46

Examples of companies that set out their objectives and clearly demonstrate the links between these, their strategy and their business models, are Croda International Plc and SEGRO plc.
Croda International Plc Annual Report 2013 (p16, above and right)
Annual report insights 2014 47

Another important link to draw out is between the company’s objectives and strategy and its key performance indicators. Clearly setting out how the company measures achievement of its objectives and the successful implementation of its strategy can be a valuable aid to shareholders looking for a concrete way in which to assess the performance of management. Figure 7.4 shows that this is an area where there has been a noticeable improvement year-on-year, although the smaller companies in our sample are still lagging behind the FTSE 350.
0%
20%
40%
60%
80%
100%
OthersFTSE 350Overall
Figure 7.4. How clear is the link between strategy and performance measures?
54% 41% 70% 56% 34% 22%
2014 2013
Two good examples of how this linkage can be demonstrated are shown by IP Group plc and Mitie Group plc. IP Group plc uses a table which sets out each element of their strategy, their progress in 2014, future targets and the related KPIs. Mitie Group plc uses a narrative flow, with each KPI embedded within the relevant component of the group’s strategy.
Mitie Group plc Annual Report 2013 (p9)
48

IP Group plc Annual Report 2013 (p10 and p11)
Annual report insights 2014 49

Corporate social responsibilityThe level of information on corporate social responsibility (CSR) that companies should present in their annual reports is an area of current debate. On the one hand, there are those that see the annual report as a medium for communication with a wide variety of stakeholders, many of whom are interested in this information. On the other, there are those that argue that the primary purpose of the annual report is communication with shareholders, and that the information in the annual report should be restricted to that which is material to those shareholders. The FRC Guidance takes the latter view, at least in relation to the information included in the strategic report. In the context of integrated reporting, the discussion of corporate social responsibility can be seen as a discussion of the use by the company and its impact on some of the non-financial capital identified in the <IR> framework. See chapter 3 for more information on integrated reporting.
Many companies nowadays produce a CSR report as a separate document to the annual report. Many also include a separate CSR section within the annual report itself, rather than presenting all of their CSR information within the strategic report. 21% of the companies surveyed this year included a specific reference to a separate CSR report within their annual report, with all but two of these coming from the FTSE 350.
A good example of including only a summary of the strategically relevant information in the annual report, with a cross-reference to a separate CSR report, is given by Mitie Group plc. Another company that demonstrates the strategic relevance of CSR, by linking CSR priorities with their principal risks, is Pendragon PLC.
Pendragon PLC Annual Report (p60)
The new narrative reporting regulations introduced several new requirements as regards CSR disclosures. Companies are now required to include a specific discussion of the impact of human rights issues on them, where this is relevant to an understanding of their business. Also, there are specific new numerical disclosures required of the company’s gender diversity and its greenhouse gas emissions.
The level of information on corporate social responsibility (CSR) that companies should present in their annual reports is an area of current debate.
50

Overall quality of CSR disclosuresFigure 7.5 shows the level of detail that companies gave in their reports this year. There is a good level of disclosure across the board, with the areas of environmental impact and employee-related issues showing the best level of meaningful or detailed disclosures.
Linking CSR information to the strategy of the business, for example by relating it to KPIs, is a theme that emerges from the FRC Guidance.
Ensuring that information presented does link in this way can help companies to ensure that the information they are presenting is material. Indeed, for some companies, where one or more of these areas is not strategically important, just a brief comment may be all that is needed.
See chapter 9 for more information on the kinds of non-financial KPIs presented by the companies we surveyed.
Figure 7.5. How much detail have companies given about their corporate social responsibility?
50% 39% 64%
30%
9%
39%
13%
18%
Detailed analysis including a link to KPIs Detailed analysis of strategic importance Meaningful commentary specific to company Brief comment
0%
20%
40%
60%
80%
100%
Human rightsSocial and communityDiversityEmployee-relatedGreenhouse gasesEnvironmental
16%
32%
32%
19%
25%
40%
17%
15%
17%
45%
12%25%
46%
37%
10%
23%
49%
14%
32%
35%
5%
4%3%
Annual report insights 2014 51

Human rightsThe newly required disclosure on human rights is an example of such scalable material, where several companies in our sample merely noted that there were no significant human rights exposures inherent in their business model. These were mostly service businesses or those with operations solely in the UK, where there are no obvious sources of human rights issues – labour legislation is strong and there is no significant supply chain to worry about. Nevertheless, even for these companies there are issues to consider – for example, modern slavery in the UK is an issue of current political focus.
A good example of human rights disclosure is given by BT Group plc, who not only set out their internal policy but also discuss their supply chain assurance process regarding human rights.
BT Group plc Annual Report 2014 (p29)
BT Group plc Annual Report 2014 (p48)
52

Looking to the future, when the new EU non-financial reporting directive is implemented in the UK, companies will be required to include a report on bribery and corruption matters. 69% of the reports surveyed this year included a mention of how the company addresses the possibility of bribery or corruption, either in the strategic report itself or, quite often, in the corporate governance statement. Exactly how this information is required to be presented in the future will depend on how the EU directive is incorporated into UK law, but it is encouraging to see a high level of companies are already considering this area in some way.
Greenhouse gas reportingNot every company has provided emissions data that obviously complies with the new regulations – only 87% of the reports surveyed clearly did so, with a further 7% providing some numerical information. Of those that provided no quantification of total emissions, two took advantage of the exemption available from disclosure in the first year of application where collecting the relevant data is not practical, two claimed that emissions were immaterial, one provided an intensity measure but no absolute figure and one made no mention of greenhouse gas emissions.
31% of companies went further than the statutory requirements by also disclosing ‘scope 3’ emissions data covering emissions from business travel.
This information is particularly relevant for service businesses with a lot of international travel involved in their operations, such as consultancy firms, where these are much more significant than scope 1 and 2. This is an area where the FTSE 350 is leading the way, with 43% of those companies providing this information compared to 16% of those outside the FTSE 350. Some companies also give more detailed sub-analysis than required by law, for example showing emissions by business unit or by country.
89% of companies provided the required intensity measure relating their greenhouse gas emissions to an operational metric for their business. In addition, one company discussed the intensity measure they used but did not actually give the numerical figure for it. The regulations give companies a completely free choice of what intensity measure to use – figure 7.6 shows the metrics selected by the companies surveyed.
Several companies in fact presented more than one such metric, with one company presenting five different measures. A revenue comparison was noticeably more popular amongst the smaller companies in our sample, with 55% of those giving this comparison compared to 48% of the FTSE 350. Other measures were comparably less popular for the smaller companies.
Figure 7.6. What operational measures did companies choose to compare to greenhouse gas emissions?
0
20
40
60
Operational areaProfit earnedAssets employedQuantity of productCustomer numbersEmployee numbersRevenue generated
51 24 15 101 23
Annual report insights 2014 53

As one would expect, the intensity ratios chosen by companies are reflective of the different environments in which they operate. One example of this is that service businesses are more likely to choose an employee-based metric whereas manufacturing businesses are more likely to use a production-based metric. Equally, the use of a ratio comparing emissions to the company’s operational area is more likely to make sense for a business operating in a real-estate intensive industry, such as property investment.
The flexibility allowed by law can, however, be a double-edged sword. For example, although 42 companies presented a revenue-based intensity measure, not all of these were the same, which could make comparison difficult. Tonnes of emissions per million pounds of revenue was the most popular measure, but tonnes per thousand pounds and kilogrammes per pound were also selected by some companies. It will be interesting to see whether there is more standardisation in this area in future years.
Some good examples of greenhouse gas emissions disclosures are given by St James’s Place plc, who give a good level of detail on their emissions targets and progress against them; Xaar plc, who give a good clear summary of the assessment parameters they have used; and Brammer plc, who give a lot of detail on the exact sources of their emissions.
St James’s Place plc Annual Report 2013 (p45)
54

Diversity disclosuresThe new regulations require the total number (not percentage) of employees of each gender to be stated, as well as the split for directors of the parent company and the split for ‘senior managers’, which for legal purposes includes at least all subsidiaries’ directors other than those who are directors of the parent. Given some of the directors of subsidiaries included in the group may not perform senior management roles for the group, e.g. where the subsidiary is small, the FRC Guidance notes that companies may wish to provide an additional, more meaningful, split of senior managers to identify those employees who are genuinely seen as the business leaders of tomorrow. Companies must be careful to still include data that meets the legal requirement as well – the Guidance includes an example of how this could be done.
In 2014, 95% of companies gave some numerical information about gender diversity (2013: 25%). One of those which gave no information did not actually have any employees, as all of its operations are run by external contractors. For the others there does not seem to be a clear reason why this information was not given, as the law provides no exemptions in this area.
However, the detailed requirements of the law seem to have tripped up quite a large number of companies. 18% failed to give absolute numbers, giving only percentages, while 5% failed to identify the information for the three distinct groups required. It will be interesting to see whether these companies rectify these (admittedly fairly minor) failings in next year’s survey.
Some examples of gender diversity disclosures that go beyond the legal requirements are Johnson Matthey Plc, who give information on various levels of management and also their new recruits and NMC Health plc, who give a detailed breakdown by business unit and job type. PayPoint plc give a good example of the kind of other areas of diversity that companies can also report on, such as ethnic minority representation, disabled employees and age range of workforce.
Johnson Matthey Plc Annual report (p56)
NMC Health plc Annual Report (p29)
Annual report insights 2014 55

Legal issuesApprovalOnly 73% of companies clearly demonstrated compliance with the legal requirement that the strategic report should be approved by the board. It is not clear whether this approval needs to be separate from that for the directors’ report – the law makes no mention of combined approval, although Companies House have accepted annual reports with this as long as the approval clearly relates to the directors’ report and strategic report. 67% of the companies in our sample included an approval for the strategic report that was clearly separate from the approval for the directors’ report, indicating that the majority of companies are viewing this as the correct way to approach the requirement.
Relationship with the directors’ reportSeveral companies indicated that their strategic report was a component of the directors’ report, usually incorporating it by cross-reference.
This incorporation was necessary with the old business review to ensure that it was included in the ‘safe harbour’ provisions applicable to the director’ report. However, the strategic report is a legally separate component of the annual report (and is covered by safe harbour provisions in its own right) and so should be a separate report. Two of the companies surveyed did not clearly identify a section of their report as the strategic report, instead using a slightly different term such as strategic review.
Another slightly fiddly legal area is the inclusion of information in the strategic report that is, by law, required to be included in the directors’ report. The law provides an option for companies to ‘promote’ to the strategic report various disclosures, which would otherwise be required in the directors’ report, if they are of strategic importance – an option that 97% of the companies we surveyed took advantage of. Figure 7.7 shows the most common disclosures that were promoted in this way.
* For research and development and post balance sheet events, the percentage quoted is the percentage of those companies with significant research and development activities or post balance-sheet events.
Figure 7.7. What information is promoted to the strategic report?
Percentage of companies promoting
0%
20%
40%
60%
80%
100%
Employment of disabledEmployee involvementPost balance sheet events*Research & development*Future developmentsGreenhouse Gas emissions
70% 96% 61% 33% 61%15 58%
56

Unsurprisingly, almost all companies promoted the directors’ report discussion of future developments to the strategic report, combining it with the latter’s similar disclosure of the main trends and factors likely to affect the future development of the company’s business, thus avoiding repetition. Such material is also likely to be of sufficient strategic importance to merit promotion. Several other areas – greenhouse gases, employee involvement and employment of the disabled – sit naturally alongside the discussions of environmental matters and the company’s employees which are, again, required to be included in the strategic report, although they will not necessarily be of strategic importance to all companies.
When promoting this information, the law requires that the directors’ report must include a statement setting out the information that has been included in the strategic report rather than the directors’ report. This is something that companies were not so good at doing, with only 43% of them clearly disclosing the information that had been promoted to the strategic report. A further 27% included some cross-referencing but did not do so for all of the relevant disclosures.
A simple but effective way of doing this is demonstrated by Johnson Matthey Plc in their annual report and accounts 2014.
Johnson Matthey Plc Annual Report 2014 (p126)
Annual report insights 2014 57

8. Principal risks
This chapter looks in more detail at the identification and reporting of principal risks and uncertainties by the companies in our sample. Company law requires all companies (other than small companies) to present a description of the principal risks and uncertainties that they face in their strategic report. Although the law does not explicitly require it, it is widely accepted that a key part of this description is a discussion of the mitigating activities undertaken by the company to manage this risk. Indeed, the FRRP have historically said that they expect the mitigating activities to be disclosed and the FRC Guidance recommends such disclosure. In their latest consultation on updates to the UK Corporate Governance Code, the FRC has also proposed introducing a specific requirement for companies to explain how their risks are managed and mitigated.
94% (2013: 93%) of companies included a discussion of risk mitigation, with 86% (2013: 74%) making a clear distinction between the discussion of the risk and the associated risk management activity, allowing users to easily distinguish the two.
Identification of risksNumber of principal risksIt is important that the discussion focuses only on the principal risks and does not become a long list of potential risks, some of which may be unlikely and of low potential impact. The FRC Guidance equates the use of the term ‘principal’ with their idea of materiality in the context of narrative reporting, i.e. that they should be the risks that could influence the economic decisions of shareholders. 95% of the companies surveyed clearly indicated that the risks discussed were the principal risks to the business (2013: 87%). Restricting the discussion to only those risks that are most important also allows a company to give a full discussion of each risk without creating a statement of excessive length, providing more meaningful information to users.
Top tips
• Identify an appropriate number of principal risks – the median number identified by companies in our sample was 9 (2013: 9).
• Make clear the specific relevance of each of the risks identified to your business – 64% (2013: 59%) of companies did this for all of their principal risks.
• Keep your risks up to date – considerably fewer companies identified principal risks around the state of the economy (57% compared to 72% last year) and financing issues (37% compared to 48%).
• Demonstrate active risk management by showing how risk priorities have changed since last year – 33% (2013: 21%) of companies did this.
• Link your risk discussion to other areas of your report, such as strategic priorities – 22% of companies clearly linked their risk discussion with the other information presented in the report in some way.
Keep an eye on
• What risks your peers are identifying as principal – operational issues, demand risk, people retention and regulatory compliance were the most common.
• Clearly identifying your discussion of principal risks – 95% (2013: 87%) of companies clearly did this.
• Discussing your mitigating actions for each risk – 94% (2013: 93%) of companies discuss the actions being taken in response to the risks identified.
58

Figure 8.1 shows the number of risks identified by companies in our 2014 survey sample, plotted on a cumulative basis. So, for example, we can see that 50% of the FTSE 350 companies that we surveyed identified fewer than ten principal risks.
Figure 8.1. How many risks are identified by companies in 2014?
Number of risks
Cumulative percentage of companies
0% 10% 20% 30% 40% 50% 60% 70% 80% 90% 100%
20181614121086420
FTSE 350 Others
Even 56% of the FTSE 100 companies in our sample identified fewer than 10 risks, so it is clearly not the case that a larger company needs to identify more risks in this discussion.
Types of risks discussedThe risk overview should discuss general business risks, not just financial risks such as the availability of finance – although these are an important piece of the puzzle. The FRC’s latest consultation on implementation of the Sharman report includes a proposed new provision in the Code requiring that companies specifically discuss the risks that would threaten their business model, future performance, solvency or liquidity. Only one of the companies in our sample specifically referred to any of its risks having an impact on solvency in its report, so this is an area that many companies may need to consider more carefully going forward. We were pleased to note that all of the companies in our 2014 survey (2013: 98%) included a holistic discussion of financial and non-financial risks.
Figure 8.2 shows the types of risk identified most commonly by companies. It is apparent that companies are less concerned about the state of the global and UK economies than they were last year. The improvement in the overall economic outlook has also led to a reduction in the number of companies identifying financing issues and IFRS 7 financial risks, such as managing foreign exchange exposures, as principal risks.
Figure 8.2. What are the main categories of risk disclosed?
0%
20%
40%
60%
80%
100%
OtherTaxAcquisition-related
Environmentalissues
Legalaction,
litigation
PensionsR&DCost of rawmaterial
FXIFRS 7Financial risks
ITReputation/Brand
Financingissues
Regulation,legislation
PeopleDemandOperationalissues
Stateof the
economy
57% 72% 77% 82% 76% 75% 67% 69% 76% 76% 37% 48% 41% 47% 49% 47% 50% 55% 35% 39% 30% 30% 33% 28% 23% 30% 27% 23% 23% 23% 24% 22% 14% 14% 62% 64%
2014 2013
Annual report insights 2014 59
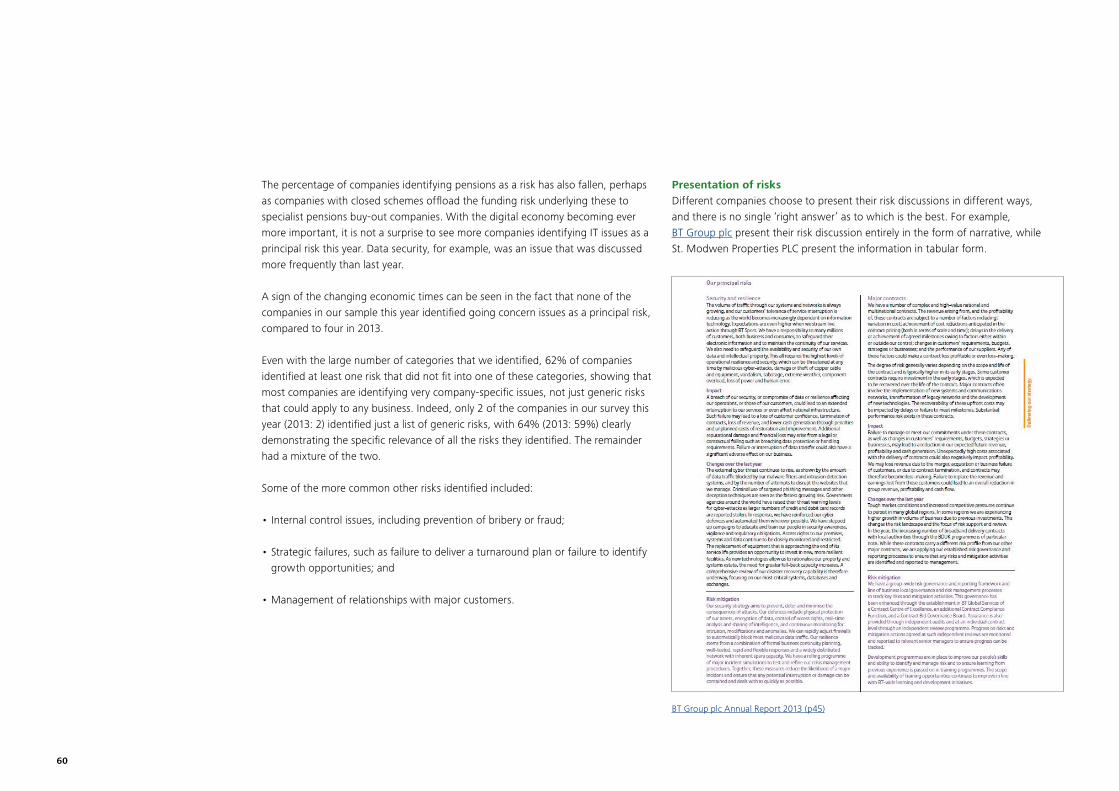
The percentage of companies identifying pensions as a risk has also fallen, perhaps as companies with closed schemes offload the funding risk underlying these to specialist pensions buy-out companies. With the digital economy becoming ever more important, it is not a surprise to see more companies identifying IT issues as a principal risk this year. Data security, for example, was an issue that was discussed more frequently than last year.
A sign of the changing economic times can be seen in the fact that none of the companies in our sample this year identified going concern issues as a principal risk, compared to four in 2013.
Even with the large number of categories that we identified, 62% of companies identified at least one risk that did not fit into one of these categories, showing that most companies are identifying very company-specific issues, not just generic risks that could apply to any business. Indeed, only 2 of the companies in our survey this year (2013: 2) identified just a list of generic risks, with 64% (2013: 59%) clearly demonstrating the specific relevance of all the risks they identified. The remainder had a mixture of the two.
Some of the more common other risks identified included:
• Internal control issues, including prevention of bribery or fraud;
• Strategic failures, such as failure to deliver a turnaround plan or failure to identify growth opportunities; and
• Management of relationships with major customers.
Presentation of risksDifferent companies choose to present their risk discussions in different ways, and there is no single ‘right answer’ as to which is the best. For example, BT Group plc present their risk discussion entirely in the form of narrative, while St. Modwen Properties PLC present the information in tabular form.
BT Group plc Annual Report 2013 (p45)
60

St. Modwen Properties PLC Annual Report 2013 (p46 and p47)
Annual report insights 2014 61

The FRC’s latest proposed risk and going concern guidance states that the descriptions of the principal risks and uncertainties should be sufficiently specific that a shareholder can understand why they are important to the company. This was something that was done in 64% of the reports we surveyed (2013: 59%). It goes on to say that the report might include a description of the likelihood of the risk event, an indication of the circumstances under which the risk might be most relevant to the company and its possible impact on the company. This guidance, together with other changes to the Code (see chapter 3) is set to be effective for periods commencing on or after 1 October 2014.
Domino Printing Sciences plc Annual Report 2013 (p23)
The best risk reports already explain why certain risks are their principal risks by giving an idea of the perceived likelihood of occurrence of each risk and the potential impact on the business if it does occur. Although this is clearly useful information, only a small minority (6% of the companies surveyed) currently present it in their report – all of these were in the FTSE 350. Perhaps it has historically been seen as too commercially sensitive. Two of the possible approaches to disclosing this that we have seen are a table, as demonstrated by Domino Printing Sciences plc, and a ‘heatmap’, as demonstrated by Premier Oil plc.
Premier Oil plc Annual Report 2013 (p71)
62

Both of these examples also illustrate how a company can indicate the changes in its risk landscape since the prior year. The FRC’s proposed risk guidance states that significant changes in principal risks such as a change in the likelihood or possible effect, or the inclusion of new risks, should be highlighted and explained. This is something that is currently discussed by a much higher proportion of companies, with 33% of companies doing so this year (2013: 21%). Again, a much higher proportion of companies in the FTSE 350 (45%) did this than the smaller companies surveyed (18%).
A common way of disclosing changes is to use simple increase/no change/decrease indicators, such as arrows, to indicate the change in risk – Savills plc gives an example of this approach. However, an approach that may be more insightful is to give a narrative description of the change, as this allows a company to explain not just that there has been a change but why, linking this to other changes in the business. An effective example of this is given by Gresham Computing plc. Describing changes to risks also evidences that effective ongoing governance processes are in place.
Gresham Computing plc Annual Report 2013 (p10)
Annual report insights 2014 63

Intermediate Capital Group plc Annual Report 2013 (p31)
Another interesting idea, illustrated by Intermediate Capital Group plc, is to present a summary of the warning signs or “key risk indicators” monitored by management, giving a clear indication of how they will identify if the events that they are concerned about occur.
Linkage of risks to the rest of the reportPrincipal risks are another area where linkage to other information elsewhere in the report, as advocated by the FRC Guidance, can help users understand the bigger picture. Showing which of a company’s strategic priorities are affected by the risks identified is one of the more obvious links that can be drawn – 18% of the reports in our sample demonstrated this relationship. An example of how this can be done is shown by Hill & Smith Holdings PLC.
Hill & Smith Holdings PLC Annual Report 2013 (p16)
64

Another link that can be drawn is between risks and key performance indicators. This gives users an idea of how the risks identified could affect the company’s performance and how this impact can be measured. This link was much more rarely presented, with only three companies giving this information. An example is IP Group plc.
IP Group plc Annual Report 2013 (p34 and p35)
Annual report insights 2014 65

Rather than linking to a specific element of the report, such as strategy or KPIs, a few companies gave a more general link to other sections of the report which discussed the area affected by the risk. This can really show how the whole report ties together, for example linking the discussion of the markets a business operates in to the risks arising from its operating environment or linking the risks around environmental performance to the discussion of CSR and stakeholder engagement. An example of this approach is shown by Shaftesbury PLC.
Shaftesbury PLC Annual Report 2013 (p49)
Another useful link that can be made is between the analysis of principal risks and the review of the company’s risk management activities required by the Code, which is usually included in the company’s corporate governance section. Many companies include details of their risk assessment process in the strategic report alongside the discussion of the principal risks identified. An example of this is given by National Express Group PLC.
National Express Group PLC Annual Report 2013 (p24)
Another thing seen in the best reports is that the link between principal risks and the rest of the business is made up front in the summary section of the report – SEGRO plc give a good example of how to do this (see chapter 6).
66

Legally, all companies (other than small companies) are required to include in their strategic report an analysis of the business using key performance indicators (KPIs). Unless a company qualifies as medium-sized, this discussion must, where appropriate, include non-financial KPIs as well as financial ones.
Key performance indicators are unquestionably one of the most important pieces of information included in a company’s annual report. They are crucial in showing investors how the company has performed against its objectives and how effectively it has implemented its strategy. However, a truly useful discussion of KPIs is just that – a discussion. It goes beyond just giving some numerical measures to include a discussion of why these measures are important and what the figures presented actually tell a reader about the company’s performance during the year.
Presentation of KPIs91% of the companies we surveyed clearly identified which performance measures they considered to be KPIs (2013: 89%). Although there is no explicit legal requirement to identify which measures are considered to be KPIs, it seems clear to us that to do so makes the information more useful to users. 89% (2013: 84%) gave the values of their KPIs in the current year, rather than just listing which measures they considered to be KPIs – again, the inclusion of this information would seem to be necessary in order to comply with the spirit of the law.
Something which is less clear is whether the most effective way to present KPIs is in a separate section of their own or as part of a narrative flow, perhaps in the discussion of the strategy.
9. Key performance indicators
Top tips
• Identify a balanced selection of KPIs – on average companies identify 5 financial KPIs but only 2 non-financial KPIs (2013: 5 financial and 2 non-financial).
• Consider what type of non-financial indicators are really important to understanding the position and potential of the business – the most popular types of non-financial KPI we saw were employee-related, such as an employee engagement index.
• Give an indication of future expectations for your KPIs, helping readers assess their relative performance – only 30% of companies gave this information (2013: 31%).
• Highlight links between KPIs and directors’ remuneration – 33% of companies have a link between their KPIs and the measures used to assess directors’ remuneration (2013: 35%), although significantly fewer clearly demonstrate these links.
Keep an eye on
• The requirement to present appropriate non-financial KPIs – only 64% of companies clearly identify one or more of these (2013: 68%).
• How clearly the relationship between financial KPIs and IFRS measures – 64% of companies with financial KPIs failed to provide a reconciliation showing this.
Annual report insights 2014 67

Figure 9.1 shows that the use of a separate section is the most prevalent presentation, and seems to be increasing in its popularity (it was only used by 62% of the companies surveyed in 2013), but both approaches can be effective when used well. In particular, incorporating KPIs into the narrative can help show why these particular measures have been selected.
Figure 9.1. How do companies present their KPIs?
Separate section Incorporated into text Not clearly identified
73%
10%
17%
Incorporating KPIs into the narrative can help show why these particular measures have been selected.
68

A good example of the narrative flow approach is given by Mitie Group plc, who incorporate their KPIs into the discussion of their strategy, while Rotork plc gives a good example of the separate section approach. The use of the narrative flow approach is slightly more common in the FTSE 350, with 18% of those companies using it compared to 16% of the other companies in our sample.
Rotork plc Annual Report 2013 (p28 and p29)
Annual report insights 2014 69
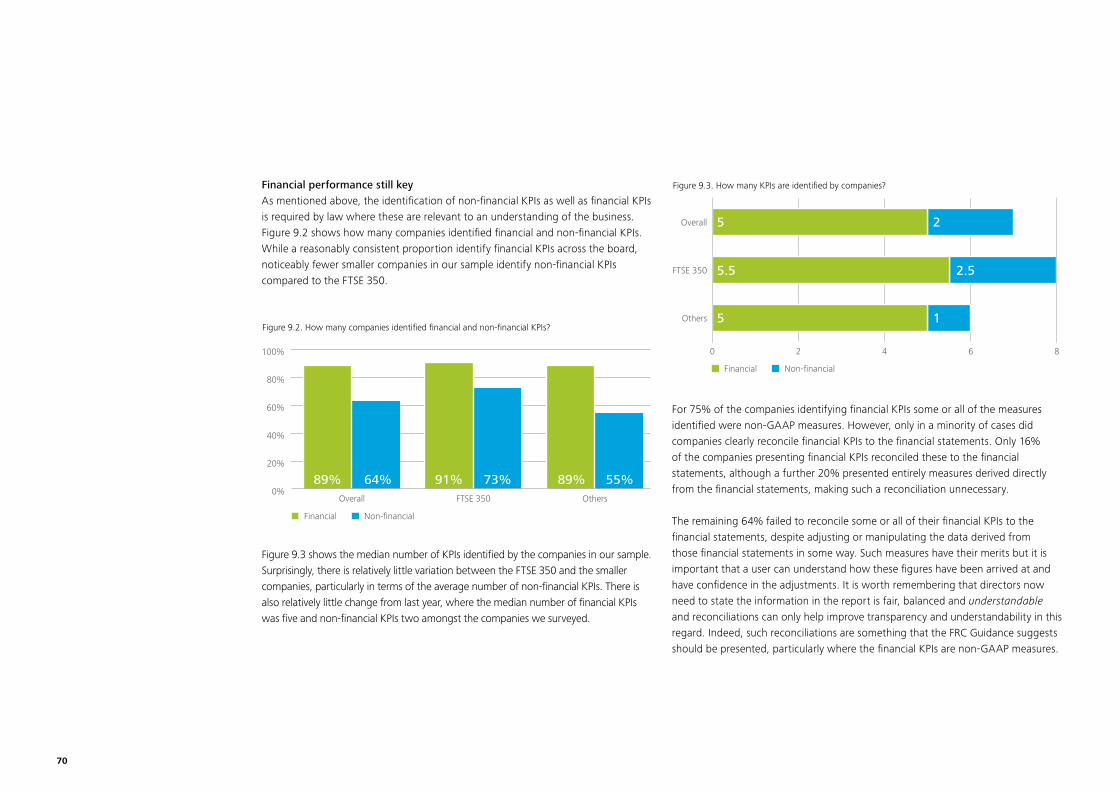
Financial performance still keyAs mentioned above, the identification of non-financial KPIs as well as financial KPIs is required by law where these are relevant to an understanding of the business. Figure 9.2 shows how many companies identified financial and non-financial KPIs. While a reasonably consistent proportion identify financial KPIs across the board, noticeably fewer smaller companies in our sample identify non-financial KPIs compared to the FTSE 350.
0%
20%
40%
60%
80%
100%
OthersFTSE 350Overall
Figure 9.2. How many companies identified financial and non-financial KPIs?
89% 64% 91% 73% 89% 55%
Financial Non-financial
Figure 9.3 shows the median number of KPIs identified by the companies in our sample. Surprisingly, there is relatively little variation between the FTSE 350 and the smaller companies, particularly in terms of the average number of non-financial KPIs. There is also relatively little change from last year, where the median number of financial KPIs was five and non-financial KPIs two amongst the companies we surveyed.
0 10 20 30 40 50 60 70 80
Figure 9.3. How many KPIs are identified by companies?
Financial Non-financial
0 2 4 6 8
Others
FTSE 350
Overall
5
5
5.5
1
2
2.5
For 75% of the companies identifying financial KPIs some or all of the measures identified were non-GAAP measures. However, only in a minority of cases did companies clearly reconcile financial KPIs to the financial statements. Only 16% of the companies presenting financial KPIs reconciled these to the financial statements, although a further 20% presented entirely measures derived directly from the financial statements, making such a reconciliation unnecessary.
The remaining 64% failed to reconcile some or all of their financial KPIs to the financial statements, despite adjusting or manipulating the data derived from those financial statements in some way. Such measures have their merits but it is important that a user can understand how these figures have been arrived at and have confidence in the adjustments. It is worth remembering that directors now need to state the information in the report is fair, balanced and understandable and reconciliations can only help improve transparency and understandability in this regard. Indeed, such reconciliations are something that the FRC Guidance suggests should be presented, particularly where the financial KPIs are non-GAAP measures.
70

BT Group plc show an effective way of providing a reconciliation unobtrusively, by presenting detailed reconciliations in an appendix. See chapter 6 for a wider discussion of the use of non-GAAP measures in summary information sections and the regulatory overview in chapter 3 for a discussion of their use more generally in annual reports.
Another interesting question is whether, for a business that has multiple operating units that function largely independently and perhaps in different markets, it is more useful to present KPIs for the whole business or for individual operating units. In practice, the latter may be most useful to investors, as measures that cover the entire group may be unnecessarily generic and not give a particularly good insight into its operations – this group-wide information may be best left to financial highlights of the sort typically presented in a company’s initial summary section (see chapter 6). An example of using different KPIs for different operating units is given by Findel plc.
Findel plc Annual Report 2013 (p8)
Non-financial KPIsFigure 9.4 shows the most common types of non-financial KPI identified by companies in our 2014 survey sample, including those measures identified as KPIs in the CSR report as well as the main body of the strategic report.
0%
5%
10%
15%
20%
25%
30%
35%
40%
45%
Customer relatedHealth & safetyEnvironmentEmployee related
Figure 9.4. What type of non-financial KPIs are included within the annual report?
36% 41% 26% 29% 28%30% 20% 27%
2014 2013
It is interesting to see the prevalence of employee-related KPIs (such as employee satisfaction) and environmental KPIs (such as waste generated) declining since last year, particularly given the promotion of initiatives such as integrated reporting and the perceived focus on discussions around corporate social responsibility. This has partly arisen because some of the companies in our sample have revised their KPIs in the light of strategic or other changes, with part of the drop also attributable to the change in our sample this year (see Appendix 1 for more detail on this). Where companies have revised their KPIs this has not always resulted in a drop in the number of non-financial KPIs – in some instances the focus has shifted away from the areas set out above towards more operational measures.
Annual report insights 2014 71

The UNITE Group plc Annual Report 2013 (p25)
Particularly in relation to non-financial KPIs, it is important to identify the source of the underlying data used to calculate them, so that users can get a better understanding of its reliability. This is one of the pieces of information that the FRC Guidance recommends should be presented to help users understand the KPIs presented. However, it was quite rare to see this information clearly presented among the companies in our sample – only 14% of the companies in our sample gave this information for some or all of their non-financial measures. A good example of a company that identifies a good proportion of non-financial KPIs (safety, customer satisfaction, employee satisfaction, perception of business partners) and gives the source of the data used to calculate them is the UNITE Group plc.
Placing KPIs in contextPurposeAs mentioned at the beginning of the chapter, the best examples of KPI presentation go much further than just presenting the measures themselves. The first key thing is to set out why the particular measures selected are of particular relevance to the company – ‘its purpose’, in the words of the FRC Guidance. One very effective way of doing this is by demonstrating a link between the KPIs presented and the discussion of the company’s strategy. Showing how the KPIs link to the company’s strategy really underlines why it is these particular measures that are important for assessing the progress of the company. Further discussion of how this linkage can be demonstrated is included in chapter 7. Figure 9.5 shows how well companies presented this information.
Particularly in relation to non-financial KPIs, it is important to identify the source of the underlying data used to calculate them, so that users can get a better understanding of its reliability.
72

0%
20%
40%
60%
80%
OthersFTSE 350Overall
Figure 9.5. How many companies provide a clear indication of the purpose of each KPI?
47% 61% 30%
18%
9%
9%
7%
13%
More general discussion of purposeClear link to strategy
Some examples of companies that present this information in an effective way are Croda International Plc, which lists the strategic objective measures by each KPI, and Cobham plc, which presents its KPIs within its discussion of strategic priorities.
Croda International Plc Annual Report 2013 (p22)
Annual report insights 2014 73

Cobham plc Annual Report 2013 (p12 and p13)
74

DefinitionOnce the purpose of each KPI has been clearly set out, it is then important to set out how the KPI is defined and its calculation method. This is another piece of information recommended by the FRC Guidance and, particularly in the case of financial measures, allows investors to reverse-engineer the calculation.
They may wish to do this so that they can recalculate it themselves, or perhaps see how it would react to potential future scenarios. It also encourages transparency and helps to discourage companies from selecting measures that are too complicated to understand. This definition can be included either as part of the KPI section itself or in a glossary at the end of the report. Figure 9.6 shows how many companies provided a clear explanation of how each of their KPIs is calculated.
0%
20%
40%
60%
80%
100%
OthersFTSE 350Overall
Figure 9.6. How many companies clearly define their KPIs?
61% 51% 73% 65% 45% 33%
2014 2013
A good example of a company that presents such a clear explanation is TT Electronics plc.
TT Electronics plc Annual Report 2013 (p22)
Annual report insights 2014 75

Comparative information and targetsThe current performance of a company against its KPIs can be put into perspective in two key ways. Firstly, by the provision of historical comparatives, and secondly by the disclosure of future targets.
Only four of the companies in our sample did not provide historical comparatives for their KPIs. Figure 9.7 shows the number of years of comparative KPIs provided by the companies surveyed.
0%
5%
10%
15%
20%
25%
30%
35%
40%
45%
4 or more3210
Figure 9.7. How many years’ worth of comparatives do companies present for KPIs?
Number of companies
4% 5% 28% 36% 28% 4%19% 26% 24%5%
2014 2013
Number of years of comparative data
76

It is noticeable that overall the number of comparatives presented in 2014 is higher than in 2013, enabling a more insightful trend analysis. Nevertheless, giving a single year of comparatives remains the most popular choice. Giving four years’ worth of comparatives also remains popular – perhaps because it provides a link with the five year summary of financial results that UK companies often still present. One of the companies in our survey this year even went as far as to give nine years’ worth of comparatives!
Provision of future targets was less popular, with the percentage of companies giving some information on future targets (30%) roughly the same as last year (31%). The reluctance amongst the majority of companies to disclose this information may be due to perceived commercial sensitivity, however it can be of great value to investors looking for concrete information about the future prospects of the company, including what the directors view as ‘success’ in terms of strategic implementation. It also makes it easier for them to compare actual performance against previously stated targets, which may be another area of sensitivity for some companies. However, others are quite open about their performance against targets, giving an indication of whether they are on target or have work to do to achieve the desired level.
Croda International Plc give a good example of a basic way in which future targets can be set out in a table of KPIs. Brewin Dolphin Holdings PLC give a more innovative approach, with ‘Key performance illustrations’. which set out a visual picture of their targets and progress towards them.
Brewin Dolphin Holdings PLC Annual Report 2013 (p15)
Annual report insights 2014 77

Other linkagesAnother link that can be usefully made is between KPIs and the company’s principal risks, showing which risks might affect the future performance of the company against each of its KPIs. IP Group plc give a good illustration of how this linkage can be presented. Brewin Dolphin Holdings PLC also present a link to ‘potential challenges’ that might affect each KPI, giving similar information, although this does not provide a direct link to the identified principal risks.
IP Group plc Annual Report 2013 (p30 and p31)
78

More common, particularly given the revised remuneration reporting requirements introduced this year (see appendix 1 for survey findings on the first new directors’ remuneration reports) alongside the new narrative reporting requirements, is a link between the company’s KPIs and the measures used to assess executive remuneration. Although for 33% of companies the measures used to assess performance-based pay are closely aligned with the company’s KPIs, significantly fewer of them illustrate this fact clearly. Some that do show this effectively are Essentra plc, which uses symbols to show which KPIs are relevant to which of its remuneration schemes, and IP Group plc, which uses narrative to show this information.
Overall, we would suggest that the more links that can be drawn, the more useful KPI information is – as mentioned previously, linkage is one of the key themes of the FRC Guidance and this is an area to which it is particularly relevant. A figure in isolation is far less meaningful than one which is woven into the accompanying narrative.
Essentra plc Annual Report 2013 (p19)
A figure in isolation is far less meaningful than one which is woven into the accompanying narrative.
Annual report insights 2014 79

As we commented in our survey last year, going concern disclosures are a continued area of focus for regulators and investors. With the recent publication of the 2014 Corporate Governance Code, we finally have a regulatory solution to the perceived problem highlighted by the 2008 financial crisis – companies signed off as a going concern by their directors and auditors becoming insolvent within the twelve month period that going concern assessment was supposed to cover.
However, it is not a solution that pleases everyone – the FRC has had to conduct a delicate balancing act, balancing the demands of investors who want as much comfort as possible with the concerns of directors and auditors over the level of assurance that they can give over future events. The final updated Code is largely in line with the third consultation draft published by the FRC in April 2014 and will be effective for periods commencing on or after 1 October 2014. See further discussion of this in the regulatory overview in chapter 3.
The revised Code requires two board statements. It keeps the existing going concern statement for accounting purposes relatively intact but introduces a new ‘statement of ongoing viability’, in which directors will be required to state whether they have a reasonable expectation that the company will be able to continue in operation and meet its liabilities as they fall due taking account of their current position and principal risks, and specify the period covered by this statement (expected to be significantly longer than twelve months) and why they consider it appropriate.
With the goalposts still moving in relation to this during the period of our survey, it is not a great surprise that companies have not made significant efforts to comply with these, or any of the FRC’s previous draft proposals in this area. Only four companies made any mention of going concern or solvency in their discussion of principal risks, something called for by the FRC’s November 2013 proposals. Similarly, only five companies made any reference to developments in going concern reporting since the FRC’s 2009 guidance15 on the subject.
10. Going concern
Top tips
• Make your going concern disclosure meaningful – only 69% of companies gave clear, high quality going concern statements.
• Give an idea of the timeframe covered by your going concern assessment – 31% of companies (2013: 30%) gave some indication of this.
Keep an eye on
• The requirements of the 2014 Code and associated guidance – with uncertainty throughout the period surveyed around the implementation of the recommendations of the Sharman inquiry, there was little progress in the quality of going concern disclosures compared to last year.
• Potential going concern uncertainties – 10% (2013: 10%) of the companies surveyed discussed uncertainties in their going concern statement. None of these were serious enough to warrant an emphasis of matter in the audit report.
15 Going Concern and Liquidity Risk: Guidance for Directors
80

Placement of going concern statement
Figure 10.1. Where is the going concern statement positioned?
88%
Corporate Governance Statement
Directors’ Report
Strategic Report
Other
28%
44%
21%
7%
Figure 10.1 shows where the reports surveyed in 2014 positioned their main statement on going concern – many reports also included a brief statement in one or more of the other sections listed, with a cross-reference to the substantive detail. This data is almost identical to that obtained from our 2013 survey, with those companies that now include the main detailed statement in their strategic report including this information in the business review last year. Inclusion in the strategic report may become more popular once companies implement the Code changes, which increase the linkage between this discussion and the assessment of a company’s principal risks.
Of the companies that included their statement in an ‘other’ location, five included the detailed assessment of going concern in the financial statements themselves, with just a short cross-reference to this in the narrative report. One company included the detail in the statement of directors’ responsibilities accompanying the financial statements, and one included a short statement in the directors’ report with a cross-reference to detail given in an appendix.
Only four companies made any mention of going concern or solvency in their discussion of principal risks, something called for by the FRC’s November 2013 proposals. Similarly, only five companies made any reference to developments in going concern reporting since the FRC’s 2009 guidance on the subject.
Annual report insights 2014 81

Quality of going concern disclosuresDuring the period under review, the latest authoritative guidance on going concern disclosures was still the FRC’s October 2009 guidance Going Concern and Liquidity Risk: Guidance for Directors of UK Companies 2009. Figure 10.2 shows how well the companies in our sample have applied the recommendations of that guidance to produce a balanced, proportionate and clear disclosure that includes the key information considered by the directors and gives cross-references to other information included elsewhere in the annual report.
0%
20%
40%
60%
80%
100%
OthersFTSE 350Overall
Figure 10.2. How good are going concern disclosures?
69% 77% 59%
23%
18%13%
17%13%9%
Specific statement with clear cross-referencing to other relevant information
Specific statement but with no cross-referencing
Bland, uninformative statement
The degree of cross-references given between disclosures on going concern within the annual report was slightly mixed. Cross-references to risk discussions were common, with 55% of companies giving these – typically to the discussion of financial risk management in the notes to the financial statements. As discussed in chapter 8, very few companies made a clear link between their discussion of principal risks and going concern, something we would expect to see made more clearly when the proposed Code changes come into force. 53% gave a cross-reference to specific details of the company’s liquidity position set out elsewhere in the report. 55% also gave a cross-reference to other discussions relevant to an understanding of the future position and prospects of the company, although the majority of these (38% of the companies in our sample) simply gave a cross-reference to the entire strategic report. While this may ensure that all relevant information is scoped into the going concern statement, it is not really very helpful in highlighting relevant information to a user.
Although the FRC encouraged companies to have regard to the principles of the Sharman report while they were developing final guidance for companies, there was relatively little evidence of this in the reports we surveyed.
The only company in our sample that made an explicit reference to the Sharman report in relation to its assessment of going concern was National Grid plc. While it is understandable that companies are waiting for definitive guidance from the FRC before revisiting their approach in this area, given the desire from investors for more detail around long-term viability it is somewhat surprising that there have not been more efforts by companies to provide this information voluntarily.
82

National Grid plc Annual Report 2013 (p52)
Another company that made an effort to specifically explain the key risks to its going concern status and how these had been managed, something that has been called for throughout the FRC’s consultations, was NMC Health plc.
NMC Health plc Annual Report 2013 (p41)
Annual report insights 2014 83

Two key elements of the best going concern disclosures are a clear discussion of the timeframe covered by the company’s forecasts and a discussion of the time period considered by the company for going concern purposes. These will not necessarily be the same – although a company may prepare forecasts looking quite a long way into the future, the length of the business cycle and the inherent uncertainty of the forecasting process may mean that it is neither necessary nor appropriate to consider going concern over the full forecast period. Figure 10.3 shows the length of forecasts or budgets prepared for going concern purposes by the companies in our survey.
These results are almost identical to those of our survey last year. There does not appear to be any clear reason why companies should not give this information. It seems likely that most simply feel that investors trust them to be reviewing forecasts for an appropriate period without needing to be told what this is. However, more transparency will be required in this area under the latest FRC proposals.
Figure 10.3. Is the period of forecasts or budgets disclosed?
88%
No
Yes, 12 months from the balance sheet date
Yes, 12 months from signing date
Yes, longer than 12 months from the signing date
73%
8%
4%
15%
Two key elements of the best going concern disclosures are a clear discussion of the timeframe covered by the company’s forecasts and a discussion of the time period considered by the company for going concern purposes. These will not necessarily be the same …
84

Also in line with our findings from last year, very few companies (just four of the reports we looked at) gave any detail on what period they consider to be the ‘foreseeable future’ for going concern assessment purposes. With the proposed new statement of ongoing viability expected to cover ‘significantly longer than twelve months’ and companies needing to disclose the timeframe covered, it will be interesting to see what periods they choose – although this will not be something that we see in our survey data until the year after next. With this new statement being introduced to cover the longer term, it is expected that the period covered explicitly by the going concern statement will revert to the twelve months relevant to the basis of financial statements preparation.
Going concern uncertaintiesIn the light of the improving state of the UK economy, it is no surprise that the percentage of companies in our sample discussing uncertainties in their going concern statements has remained low, with only 10% of the companies we surveyed doing so (2013: 10%). None of the companies in our 2014 sample had either a qualification or an emphasis of matter around going concern in its audit report.
Of those highlighting such uncertainties:
• five discussed concern about their financing position, including the potential for an increase in interest rates;
• five discussed concerns around trading volumes; and
• three discussed the potential impact of continuing global economic weakness.
In the light of the improving state of the UK economy, it is no surprise that the percentage of companies in our sample discussing uncertainties in their going concern statements has remained low, with only 10% of the companies we surveyed doing so.
Annual report insights 2014 85

When the FRC issued the 2012 edition of the UK Corporate Governance Code, Baroness Hogg, the Chairman at the time, said the reporting changes were “designed to give investors greater insight into what company boards and audit committees are doing to promote their interests, and to provide them with a better basis for engagement”. In other words, if the new strategic report is designed to provide a clear picture of the objectives and performance of the business, the corporate governance statement is there to demonstrate the board’s stewardship of the business.
The changes included in the 2012 UK Corporate Governance Code were intended to provide shareholders with a more dynamic statement on the activities of the board and its committees. For example the changes included encouragement to provide more meaningful explanations of non-compliances with the Code and the enhanced reporting by audit committees on the significant issues considered and the external audit relationship.
So has the new regime had the desired effect? As described further below, the results have been mixed. For the purposes of this section of our survey we felt it was important to highlight differences in the results between FTSE 100, FTSE 250 and other listed companies.
11. Effective company stewardship
Top tips
• Include a statement on whether you have fully or partially complied with the UK Corporate Governance Code (“the Code”) – 57% (2013: 57%) of companies fully complied.
• Explain any areas of the Code which you did not comply with – the most common areas of non-compliance were board independence and composition of the audit committee.
• Consider the benefits that diversity can bring to the boardroom – the proportion of companies with female directors has increased to 73% (2013: 69%) and the overall population of female directors has also risen from 13% to 15%.
Keep an eye on
• Make sure you include the new statement from the board that the annual report and accounts as a whole are fair, balanced and understandable – four companies, all from our smaller listed companies category failed to do so.
86

The number of companies reporting full compliance with the 2012 Code has remained constant year-on-year at 57%.
Compliance with the CodeThe number of companies reporting full compliance with the 2012 Code has remained constant year-on-year at 57%. Our results showed that compliance rates are lowest among the FTSE 250 companies sampled (50%) compared with 83% for the FTSE 100 companies surveyed and 52% for the companies outside the FTSE 350. The result for the smaller listed companies compared to the FTSE 250 companies is likely to reflect the relaxations within the Code for smaller listed companies which make full compliance relatively easier to achieve.
Of those companies reporting partial compliance with the Code it is interesting to note the proportion of those companies stating that the non-compliance is temporary.
0%
20%
40%
60%
80%
100%
OthersFTSE 250FTSE 100
Figure 11.1. Companies reporting temporary non-compliance with the Code
100% 53% 38%
13%
18%
These temporary non-compliances were most regularly caused by the sudden departure of a board member and actions were underway to address the issue.
Despite the recommendation in the preamble to the Code, the percentage of those companies indicating non-compliance who have given a real justification for the non-compliance has remained constant at 60%. Johnson Matthey and Barclays plc provided the following justifications for their temporary non-compliances:
Johnson Matthey Annual Reports and Accounts 2014 (p85)
Annual report insights 2014 87

Barclays plc Annual Report 2013 (p77)
Figures 11.2 and 11.3 show the most common areas of non-compliance with the Code amongst the FTSE 250 and smaller companies respectively, showing all provisions with three or more instances of non-compliance reported. As indicated above, all of the FTSE 100 non-compliances were said to be temporary and there was no commonality in the areas of non-compliance.
0
2
4
6
8
10
E.1.1 Dialoguewith shareholders
A.3.1 Chairmanindependence
D.2.1 Remcocomposition
C.3.1 ACcomposition
B.1.2 Half NEDsindependent
Figure 11.2. What were the most common areas of Code non-compliance for FTSE 250 companies?
Number of occurrences of each
6 5 5 33
0
2
4
6
8
10
B.2.3 NEDsspecific terms
D.2.1 Remcocomposition
B.1.2 Half NEDs
independent
C.3.1 ACcomposition
B.6 Performance evaluation
A.2.1 Chairman/
CEO
B.2.1 Nomination
Co
Figure 11.3. What were the most common areas of Code non-compliance for other companies?
Number of occurrences of each
8 6 6 6 6 5 45 3
As in previous years, a quick scan of the figures above indicates that the majority of these non-compliances arise from the provisions in relation to the composition of the board and its committees, rather that the operational processes in place.
88

Ownership of corporate governanceAs the leader of the board (as opposed to the chief executive who is responsible for running the business) the chairman is responsible for ensuring that it fulfils its responsibilities effectively. The preface to the Code encourages chairmen to report personally on how the principles relating to the role and effectiveness of the board have been applied. It is becoming more and more common for the chairman to clearly demonstrate their responsibility for leading the board, for example by discussing corporate governance matters and the implementation of the Code in their ‘Chairman’s statement’ at the beginning of the narrative report or by providing a formal introduction to the corporate governance disclosures.
67% of chairmen (2013: 61%) clearly took ownership of the corporate governance disclosures, with 35% (2013: 40%) including some discussion of corporate governance in their Chairman’s statement at the beginning of the annual report. The most common approach from chairmen was to provide a chairman’s introduction letter to shareholders at the start of the corporate governance statement. A good example of this sort of introduction is provided by Chesnara plc.
Chesnara Annual Report & Accounts 2013 (p52)
Annual report insights 2014 89

Board diversityDiversity continues to be a hot topic, in the context of board composition as well as the wider staff population (as discussed in chapter 7). With the Lord Davies target year of 2015 approaching for the number of women on FTSE 100 boards to be 25%, gender diversity receives significant focus in disclosures around board composition. Figure 11.4 shows the distribution of companies which have female directors – encouragingly, the overall percentage of companies with female directors has risen slightly from 69% last year to 73% in 2014 but it is important to recognise that this arises largely from women taking non-executive director, rather than executive director, roles. Larger companies in particular are gaining the value of a female perspective, with 89% of the companies surveyed from the FTSE 350 having at least one woman on the board (100% of the FTSE 100 companies surveyed), compared to 50% of smaller companies. The highest proportion of women on a single board was 38% (2013: 38%).
Figure 11.4. How many companies have female directors?
88%
No female directors
Female non-exec(s) only
Female execs(s) only
Both female exec(s) and non-exec(s)
28
5
60
7
Looking at the total population of directors in our surveyed companies, the overall percentage of female directors has also risen from 13% to 15%. The number of companies providing a target for women on boards was 33% in the FTSE 100 and just 8% in the FTSE 250 companies surveyed. None of the smaller listed company population provided a target for the number of women on boards.
It is important to remember that when the Code talks of board diversity, it is diversity in its broadest sense which is important. It was encouraging to see that 52% of companies surveyed made reference to the wider aspects of diversity in their disclosures. The most common areas mentioned were skills, knowledge and experience but other areas referred to include:
• Nationality.
• Ethnicity.
• Disability.
• Perspectives.
• Religious beliefs.
• Personal attributes.
• Age.
• Regional and international experience.
… the overall percentage of companies with female directors has risen slightly from 69% last year to 73% in 2014 …
90

Lonmin plc provided some interesting graphics on the diversity of the board. Marks and Spencer Group plc also provide a good example of disclosures covering matters such as board experience, nationality and length of tenure.
Lonmin Plc Annual Report and Accounts 2013 (p46)
Marks and Spencer Group plc Annual report and financial statements 2014 (p37)
Annual report insights 2014 91

Fair, balanced and understandableOne of the provisions of the 2012 Code which has prompted a significant amount of debate is provision C.1.1 that requires the directors to make a statement that “the annual report and accounts, taken as a whole, is fair, balanced and understandable and provides the information necessary for shareholders to assess the company’s performance, business model and strategy.” Last year 16 companies from our sample voluntarily adopted the new Code provision early and provided the new board statement. This year, as expected, this number has increased significantly with all but four of the smaller listed companies providing the fair, balanced and understandable statement.
84% of these statements were included within the statement of directors’ responsibilities with the remainder included in either the directors’ report, the corporate governance statement or the audit committee report.
23% of companies providing the statement included further details of the process undertaken to support the statement within the corporate governance section of the annual report, whether in the audit committee report or elsewhere. Including such detail can give shareholders confidence that a robust process has been undertaken for the preparation of the annual report.
Examples of these enhanced disclosures were from Spectris plc and Anglo American plc.
Spectris plc Annual Report and Accounts 2013 (p53)
92

Anglo American plc Annual Report 2013
Board performance evaluation and succession planningAnother area in which practices are improving is the robustness of the process used by the companies in our survey to appraise the performance of the board and its individual directors and committees. The Code recommends that companies in the FTSE 350 should have board performance evaluations externally facilitated at least once every three years, but this is an idea that is also gaining credence amongst smaller listed companies.
While in the prior year 59% of the companies surveyed indicated that they had undertaken an external performance evaluation or would do so in the next two years, in 2014 this figure fell to 53% of companies. This is much more prevalent in the top 350 companies, with 86% (2013: 91%) of them doing so. The reason this is not 100% of the FTSE 350 surveyed is due to a combination of some companies having undertaken an internal performance evaluation process during the year and making no reference to when the next external evaluation will take place and a very small minority who simply failed to meet the Code requirement to mention either an internal or external evaluation process.
Annual report insights 2014 93
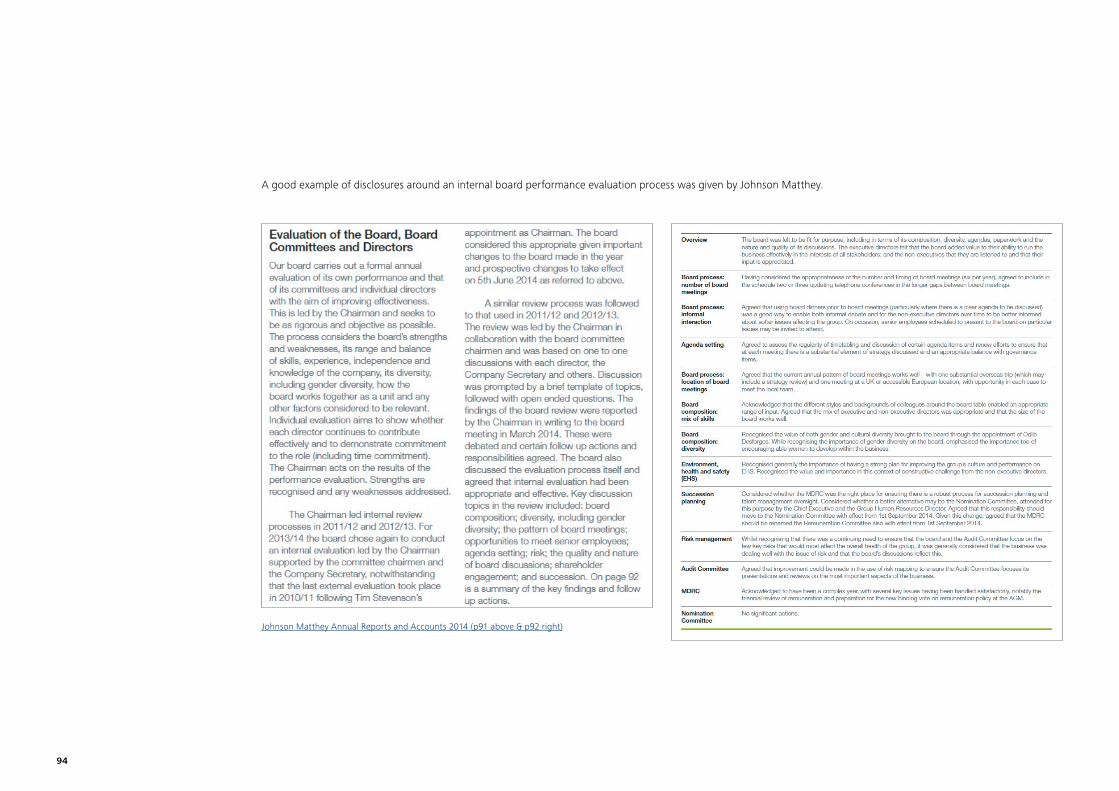
A good example of disclosures around an internal board performance evaluation process was given by Johnson Matthey.
Johnson Matthey Annual Reports and Accounts 2014 (p91 above & p92 right)
94

In its report Developments in Corporate Governance 201316 the FRC noted that succession planning should be an area of focus for companies this year and with that in mind we surveyed succession planning disclosures to determine the nature and extent of disclosures in this area. The results showed that, on the whole, references to succession planning tended to be very brief and were usually restricted to a confirmation that succession planning had been considered by the board and/or nomination committee with little or no further detail. The chart on the right sets out what we observed in relation to the extent of succession planning across the organisations surveyed.
Figure 11.5. Which positions did succession planning address?
88%
Executives only
Board only
Board and senior management
Not specific
No reference
29
25
9
34
3
…on the whole, references to succession planning tended to be very brief and were usually restricted to a confirmation that succession planning had been considered by the board and/or nomination committee with little or no further detail.
16 https://www.frc.org.uk/Our-Work/Publications/Corporate-Governance/Developments-in-Corporate-Governance-2013.pdf#page=5
Annual report insights 2014 95

The 2012 Code significantly increased the reporting responsibilities of the audit committee. In the past, audit committee reporting has focused largely on what the responsibilities of the audit committee are, who the members are and how many times the audit committee met. The 2012 Code places more emphasis on presenting details in the annual report as to what the audit committee has done during the year under review to fulfil its responsibilities. This level of transparency gives shareholders a much clearer picture of what the key issues considered by the committee are and how they were addressed and what the audit committee does to oversee the external audit relationship.
Presentation of the audit committee reportThe 2012 Code requires there to be a separate section of the report which describes the work of the audit committee in discharging its responsibilities. All of the companies in our survey presented an audit committee report in accordance with the Code. Although the Code specifies that information on the work of the audit committee should be included in a ‘separate section of the annual report’, this could be a subsection within the overall corporate governance report. However, reflecting the increasing profile of the audit committee’s activities, the number of companies presenting a stand-alone audit committee report within the corporate governance section of the annual report has increased significantly, with 67 companies (2013: 45) presenting such a report. This separation is useful as it provides a clear definition between the work of the audit committee and the work of the board as a whole.
In line with this rise, there is also an increase in the number of companies where the audit committee chairman takes clear ownership of the audit committee report, from 42 in 2013 to 71 in 2014. This was done usually either by the committee chairman signing the report or presenting an introductory summary.
Significant issues considered by the audit committeeThe revisions to the Code require audit committees to describe the significant issues considered in relation to the financial statements and how those issues were addressed. In addition, it is important to note that the 2013 revisions to auditor reporting, which came into force for periods ending on or after 30 September 2013 (i.e. at the same time as the 2012 Code) now require auditors to report on the key risks of material misstatement which they focused on and which required the most audit effort. We examine the correlation between the significant issues discussed by the audit committee and the risks disclosed by the auditors in chapter 13.
12. The work of the audit committee
Top tips
• Given the increased responsibilities of audit committees, consider presenting their work in a clear, separate report within the annual report – 67% (2013:45%) of companies elected to do so this year.
• The audit committee chairman could take clear ownership of the audit committee report, for example by personally introducing it – the number already doing so rose from 42 in 2013 to 71 in 2014.
Keep an eye on
• Identify an appropriate number of significant financial statements issues which the audit committees considered – the average number of significant issues disclosure by FTSE 100 audit committees in our sample was six, and was four for both the FTSE 250 and smaller listed companies surveyed.
• Keep up to date on the developments around audit tendering and consider disclosing when you might next put your audit out to tender – 35 companies. (2013: 35) did so this year.
The 2012 Code has significantly increased the reporting responsibilities of the audit committee.
96

Only four of the companies we surveyed had failed to disclose the significant issues considered by the audit committee. These were in the smaller listed company group. One had stated that there were no significant issues in relation to the financial statements and the others appeared to have overlooked the new requirement.
The average number of issues disclosed across the three company size categories was as set out in figure 12.1.
Figure 12.1 How many significant financial reporting issues were identified by the audit committee?
330
2
4
6
8
10
12
OtherFTSE 250FTSE 100
6 4 42
11
1
8
1
8
Using our own judgement we rated the disclosures on the significant issues as brief, moderate or comprehensive. 33% were deemed to be brief, 51% moderate and only 16% comprehensive.
The FRC’s Financial Reporting Lab’s report Reporting of Audit Committees suggests the following for the discussion of significant issues:
• Reporting should be bespoke, company specific and tailored to the year under review.
• Providing context to the issue helps to communicate the specific story, e.g. quantifying the issue, identifying the related business unit, geography, contract or transaction type, describing the nature of the issue as being related to a specific policy or involving a specific assumption or estimate.
• Providing greater depth on how the audit committee fulfilled its role and the robustness of the steps it undertook to assess each significant issue and reach conclusions.
• Using more descriptive, ‘active’ language stated in the past tense, as this provides assurance that the audit committee has positively taken specific steps to address the issue.
• Disclosing ranges or scenarios taken into consideration, key assumptions, and whether reported amounts fall within an acceptable range.
Annual report insights 2014 97

The following diagram takes the issue of goodwill impairment as an example and shows the range of disclosures observed from those which are minimal and more generic to those which provide context, company specific detail and references to other, relevant disclosures within the financial statements.
Good examples of disclosures on significant issues were given by ITV plc and Tullow Oil plc. In particular, both these companies make it clear which issues are recurring issues for the audit committee and which are one-off items for the particular year.
ITV plc Annual Report and Accounts for the year ended 31 December 2013 (pages 77-79, truncated)
98
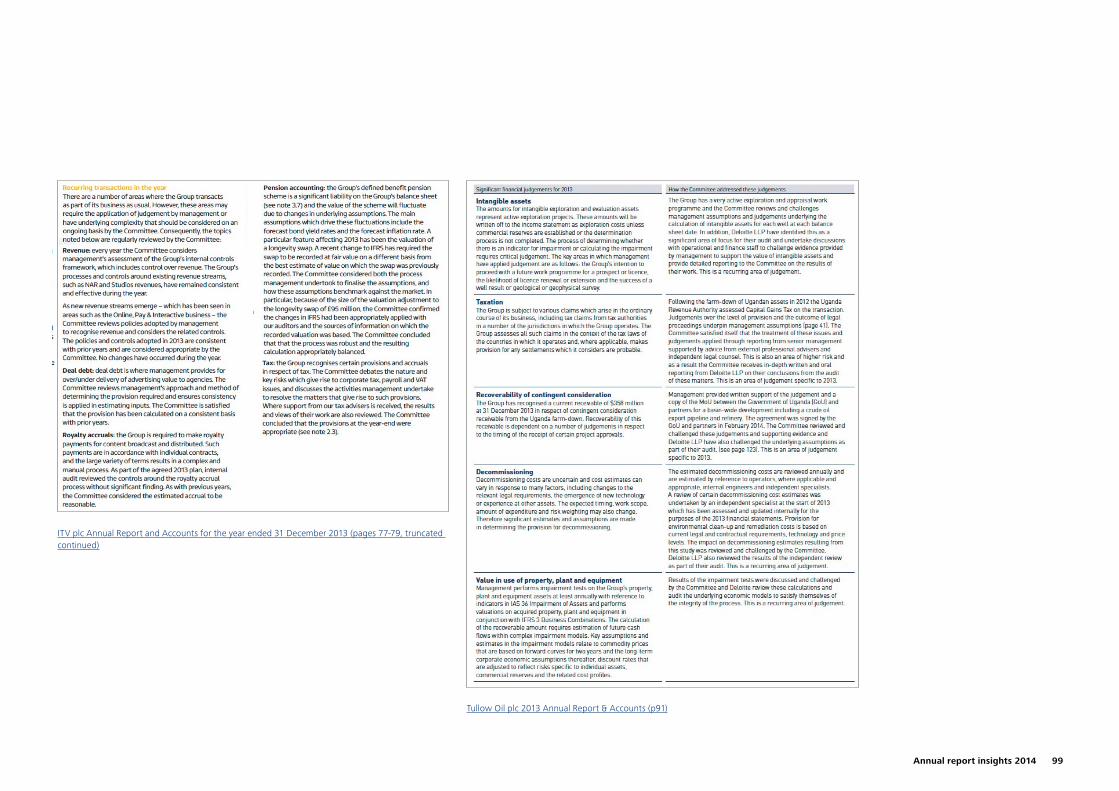
Tullow Oil plc 2013 Annual Report & Accounts (p91)
ITV plc Annual Report and Accounts for the year ended 31 December 2013 (pages 77-79, truncated continued)
Annual report insights 2014 99

Effectiveness of the external audit processThere was a mixed response to the new requirement for the audit committee to explain how it has assessed the effectiveness of the external audit process. All of the FTSE 100 companies surveyed included an explanation, as did 95% of the FTSE 250 companies and 61% of the smaller listed companies. Again we rated the disclosures on this assessment as brief, moderate or comprehensive. 59% were deemed to brief, 30% moderate and only 11% comprehensive.
Good examples of comprehensive disclosures on the assessment of the effectiveness of the external audit process which explain the process undertaken, the method of assessment, key parties involved and the particular aspects of the audit process assessed were given by Marks and Spencer plc and Bodycote plc.
Marks and Spencer Group plc Annual report and financial statements 2014 (p48)
Marks and Spencer Group plc Annual report and financial statements 2014 (p48 continued)
100

Bodycote plc Annual report for the year ended 31 December 2013 (p 45)
Audit tenderingThe frequency of audit tendering and the relationship between the external auditor and the companies they are auditing has been a key area of focus since the 2008 financial crisis. The 2012 Code introduced a requirement for companies to put their audit out to tender at least once every ten years and to provide disclosures around the length of the existing audit relationship and details on tendering policy. In addition the European Commission and the Competition & Markets Authority are also introducing new rules around mandatory tendering and rotation. At the time of writing the detailed implementation rules are still to be finalised.
As expected, in light of the new Code provision, the number of companies providing information on the tenure of the incumbent auditor has increased from 48% to 75% and the number providing the date of the last tender has increased from 24% to 44%. Across the companies surveyed the average length of tenure of the auditor was 14 years (FTSE 100: 28 years, FTSE 250: 11 years and Other: 10 years).
Only 11% of companies surveyed committed to a tendering frequency going forward and all of these were every 10 years, as in the Code provision. 35% of companies provided an indication of when an audit tender would be undertaken typically taking advantage of the transitional arrangements allowed for the Code provision and/or coinciding with the rotation of the current engagement partner. Some companies made the point that the current regulatory uncertainty on implementation of mandatory tendering and rotation meant that it was not convenient for a tender process to be undertaken at the present time.
As expected, in light of the new Code provision, the number of companies providing information on the tenure of the incumbent auditor has increased from 48% to 75% …
Annual report insights 2014 101

Highlights
• All companies in our sample published an enhanced auditor’s report including the auditor’s comments on risks, materiality and scope.
• The average number of audit risks disclosed for FTSE 100 companies was 5, with 4 the average for both the FTSE 250 and smaller companies surveyed.
• There was a high degree of cross-over between audit committee significant issues and the auditor’s audit risks, although in a number on instances one of them identified issues that the other did not comment on.
• 95% of audit reports disclosed the basis on which the auditor had determined materiality and 98% disclosed the level at which misstatements were reported to the audit committee, despite no statutory requirement to do so.
The enhanced audit reportThe 2013 revisions to audit reporting came into force for periods ended on or after 30 September 2013, at the same time as the 2012 Code. These revisions constituted a fundamental change to the nature of the audit report, moving away from standard or “boilerplate” information to require description of areas that are unique to the individual company. The changes open the black box of audit to discuss risks, materiality and the auditor’s response.
Although the audit report is written by the auditor, it is read in conjunction with the audit committee report and to present a clear picture to shareholders it is important that these are broadly consistent. In addition, there are areas of presentation or content that audit committees and preparers may wish to discuss with their auditor to align the report more closely with the remainder of the annual report.
By now the majority of companies affected have already published their annual report including a new-style “enhanced” audit report, including all of the companies in our sample. Shareholders have welcomed the new style of reporting, particularly the identification of the risks that took up most of the auditors’ attention and the basis used for materiality. Auditors and audit committees have started to consider their approach to the second year of enhanced reporting. Over the first year of reporting, we saw a trend for auditors to provide more focussed entity-specific information on risks as both they and audit committees grew more confident. We expect this to continue in year two; we also expect more insight around materiality.
Vodafone Group plc is an example of a company that has already published its second enhanced audit report. Both the format and the content have moved on considerably. New content includes new risks and responses, information on misstatements and explanations of changes to risks and materiality compared to the prior year’s audit report.
13. The auditor’s report
Although the audit report is written by the auditor, it is read in conjunction with the audit committee report and to present a clear picture to shareholders it is important that these are broadly consistent.
102

Vodafone Group Plc Annual Report 2014 (p92 and p93)
Annual report insights 2014 103

Significant issues and audit risksThere is a high degree of cross-over between the significant issues relating to financial reporting disclosed by the audit committee and the risks disclosed by the auditor. We would expect both the audit committee and the auditor to focus their attention on material, judgemental matters and therefore this is not surprising.
The following figure compares the average number of significant issues disclosed in the audit committee report to the number of risks in the audit report. This does not include significant issues for the four audit committees that chose not to disclose any.
Vodafone Group Plc Annual Report 2014 (continued, p94)
Figure 13.1 How many significant financial statements issues and audit risks were disclosed?
Number of financial statements issues disclosed
33
Number of audit risks disclosed
33
0
2
4
6
8
10
12
OtherFTSE 250FTSE 100
6 4 42
11
1
8
1
8
0
3
6
9
OtherFTSE 250FTSE 100
5 4 4
2
8
2
6
1
7
104

43 audit committees discussed significant issues that were not disclosed as risks by the auditor. The most common of these were going concern (14 companies), identification and disclosure of exceptional or non-recurring items (8 companies), current or deferred tax (6 companies), accounting matters relating to acquisitions or disposals (6 companies) and provisions for a variety of exposures (5 companies).
55 audit reports disclosed one or more risks (on average two) that were not discussed as significant issues by the audit committee. The risks most commonly identified for disclosure by the auditors are shown above.
A change in auditing standards required the auditor to report by exception if they felt the audit committee had not adequately reported on risks which they had discussed with the committee. No auditor did so; unsurprisingly, those risks discussed by auditors but not by audit committees were often those which auditing standards require auditors to always treat as significant.
Using our own judgement we rated the auditors’ disclosures on the risks as brief, moderate or comprehensive. The results were as set out in figure 13.3.
Figure 13.3. How extensive were the auditors’ disclosures on risks?
Brief Moderate Comprehensive
16%15%
69%
Figure 13.2 What were the most common audit risks not disclosed as significant issues by the audit committee?
Number of companies
0
20
40
60
80
Inventory valuationRetirement benefitsManagement overrideof controls
TaxationCarrying value or impairmentof goodwill or intangible assets
Revenuerecognition
64 60 36 36 1915 19
Annual report insights 2014 105

We expect that the descriptions of risks in audit reports may become more concise as we move into year two as the depth of audit committee descriptions of the equivalent significant issues improves.
The majority of audit reports in our sample used a tabular structure to show the details of the risk and the scope of work performed in response to the risk. A good example is BT Group plc:
BT Group plc Annual Report & Form 20-F 2014 (p121)
Critical accounting judgements and key sources of estimation uncertainty and audit risksThere is also a high degree of cross-over between the critical accounting judgements and key sources of estimation uncertainty discussed in the notes to the financial statements and the risks disclosed by the auditor.
74 audit reports disclosed an average of two risks that were not identified as part of the critical accounting judgements and key sources of estimation uncertainty in the financial statements. For the other audit reports, each of the risks correlated to a critical accounting judgement or key source of estimation uncertainty.
This is not as close a correlation as we have seen with the audit committee significant risks, largely due to the nature of some of the risks discussed in audit reports, which include fraud risks, IT and access control risks and others that do not relate directly to accounting judgements and estimation uncertainty.
Findings on audit risks Although there is currently no requirement for auditors to go beyond a description of the risks they considered and their audit response, we are aware that three companies have published audit reports which provided the auditors’ findings – Rolls Royce, New World Resources and Kazakhmys. An extract of a risk including findings from New World Resources is shown.
New World Resources Annual Report and Accounts 2013 (p115)
Investors are understandably keen to see this insight, although in the absence of a regulatory requirement it requires agreement by the audit committee. We will be interested to see what happens in 2016 when EU audit reform legislation will require auditors of public interest entities to provide “observations” as part of their report. We hope that regulators and standard setters will engage with audit committees to enable auditors to meet investor expectations for greater disclosure about the outcome of the auditor’s work.
106

MisstatementsAlongside the increasing visibility of the risks, materiality and scope of the audit, some audit committees have increased transparency regarding dealings with auditors beyond the explicit requirements of the Code. Audit committees in our sample reported discussions with their auditors on areas of audit planning including materiality, identification of risks and approach to testing of controls during the audit.
An associated trend is that some audit committees choose to discuss misstatements identified by the auditor and/or by management, although the extent of the discussion varies. 9 of the companies in our sample mentioned misstatements in the audit committee report and of these 4 included some discussion of their approach to understanding the impact of misstatements. None of the companies that mentioned misstatements included further discussion of individual misstatements.
A good example is TT Electronics.
TT Electronics plc Annual Report 2013 (p58)
This extract from the Vodafone audit report shows how the auditor can disclose misstatements. It is the only company in our sample which does so.
Vodafone Group Plc Annual Report 2014 (p53)
The 2012 Code has significantly increased the reporting responsibilities of the audit committee.
Annual report insights 2014 107

MaterialityThe auditor is required to describe how they applied the concept of materiality in planning and performing the audit, including as a minimum the threshold used by the auditor as being materiality for the financial statements as a whole. Almost all auditors explained the basis on which they had determined materiality – 88% gave materiality as a percentage of a benchmark; a further 7% explained the benchmark used but without giving the percentage. Investors have broadly welcomed this information, although some have asked for more information on the application in practice – for example, an understanding of what auditors do if they discover an immaterial error.
Figure 13.4 What is the basis on which the auditor determined materiality?
Number of companies
OtherTotal assetsRevenueEquity/net assetsProfit before tax
4Range: 1%-3%
Mode 2%
71Range: 2%-10%
Mode 5%
9Range: 0.5%-2.1%
Mode 0.5%
7Range: 0.5%-3%
Mode 1%4
108

44 of the auditors that used profit before tax as a basis, used an adjusted measure, and of these, only 50% (22) used a measure that was already discussed by the company in its financial statements, often as a non-GAAP profit measure. For 10 of these companies, it was not possible to reperform the calculation from the information provided in the audit report and financial statements.
Amortisation of acquired intangible assets is identified in the FRC’s ‘Audit Quality Thematic Review – Materiality’ as a specific example of a recurring item where they would have questions for the auditor if it was excluded from the profit measure used to determine materiality. 14 of the auditors using adjusted measures were clear that amortisation of acquired intangible assets was adjusted out of the profit measure used to determine materiality. In 4 cases it was not possible to tell from the information provided. We consider the information on materiality more useful if the user can reproduce and reach their own conclusions on the results based on the annual report. 3% used a second materiality figure to audit certain elements of the financial statements. 14% disclosed performance materiality and 98% disclosed the level at which differences identified were reported to the audit committee. Although it is not required by the standard, it is important for readers to understand the quantitative level at which differences are considered by the audit committee.
The Pendragon audit report adopted an innovative approach and used a diagram to show materiality.
Pendragon PLC 2013 Annual Report
Although it is not required by the standard, it is important for readers to understand the quantitative level at which differences are considered by the audit committee.
Annual report insights 2014 109

Scope of the audit97 companies presented audit reports where there was a description of how the auditor approached the overall engagement, in addition to the responses to specific audit risks. Of these, 77 companies provided sufficient information for the reader to understand how much of the group had been audited, generally with reference to financial statement measures such as profit and revenue. Many provided enough disclosure for the reader to put figures relating to coverage in the context of the audited group.
Xaar plc and Halma plc are good examples of companies where the audit report provided diagrams to show coverage of different financial statement measures.
Xaar plc Annual Report and Accounts 2013
70 audit reports discussed component audits, with the remainder either not mentioning component audits or auditing the whole business centrally.
Using our own judgement we rated the auditors’ disclosures on interaction with component auditors as detailed, less detailed or not containing any specific detail. The results were as shown in figure 13.5.
Figure 13.5. How comprehensive was the discussion on interaction with component auditors?
Detailed Less detailed No specific detail
30%34%
36%
This is perhaps the area of the audit report where investors will need most help understanding the linkage with audit quality. International Standard on Auditing 600, which covers the approach to group audits, is one of the most complex. The interaction between group structure, the degree to which group-wide controls exist, the relative size of components and the location of risks within the group all interact to drive the auditor’s scoping decision. As a result, a higher degree of group coverage is not automatically a sign of a “better” audit – it is a question of whether sufficient audit effort has been exerted in the areas most likely to give rise to material misstatement of the group financial statements. Again, we hope that increased transparency in this area will lead to debate between auditors, audit committees and investors to improve investors’ insight into audit quality and the audit committee’s decisions around tendering and re-appointment.
110

14. Primary statements
Telling a story with words is one thing but to try and tell a story with numbers is an altogether different challenge. IFRSs contain many disclosure requirements, but in certain areas there is flexibility around how information is presented, with opportunities for preparers to communicate their performance in what they believe to be the most effective fashion. For example, IAS 1 Presentation of Financial Statements permits extra line items to be included in the income statement where relevant to an understanding of performance. Plenty of companies make use of this flexibility in presenting non-GAAP measures (see below).
IAS 1 also makes clear that disclosures required by IFRSs need not be presented if the information is immaterial and the IASB has proposed changes to IAS 1 to further this point as part of their disclosure initiative project. Preparers should remember this when looking to cut clutter from their annual reports (see our accompanying publication A clear steer for your annual report).
Income statementsA company’s profit or loss for the year is one of the most important parts of any annual report. In telling their story many regard profit or loss as more important than other comprehensive income, the latter capturing items such as actuarial movements on defined benefit pensions, certain foreign exchange differences and the revaluation of property, plant and equipment. Perhaps for this reason, 83 companies elected to present a statement of profit or loss separately from their statement of comprehensive income, as permitted by IAS 1. Of the 17 companies presenting a single statement of profit or loss and other comprehensive income, seven were in the FTSE 350.
IAS 1 also requires companies to present an analysis of expenses recognised in profit and loss using a classification based on either their nature or function within the company and encourages this to be presented in the statement presenting profit and loss and other comprehensive income (rather than the notes). IAS 1 states that this choice should be made on the basis of whichever approach provides information that is reliable and more relevant.
Top tips
• Take care in using non-GAAP measures – an area of regulatory focus in recent times, 68% included such metrics on the face of their income statement.
• Explain why items are stripped out of any non-GAAP measures – 79% of companies with non-GAAP measures made sure they did this, as requested by the FRC.
• Consider including a net debt reconciliation – 44 companies included information of this kind despite not currently being required by IFRSs.
• Consider voluntarily including information on tax governance and strategy – an area of media scrutiny, ten companies in our FTSE 350 sample provided such information.
• If you have joint ventures and are accounting for them under proportional consolidation make sure you’re ready for IFRS 11, assuming you haven’t already transitioned – four out of six companies with such JVs identified that the transition would have a significant impact.
Keep an eye on
• Keep items of an operating nature, such as restructuring expenses, within operating profit – 43 out of 45 companies did so.
• Don’t fall into the trap of describing recurring items as exceptional or non-recurring – most companies successfully avoided this.
• If presenting an adjusted EPS figure, make sure you include both basic and diluted figures under that basis – 19% of those with adjusted figures forgot the diluted figure.
Annual report insights 2014 111

Consistent with previous years, the most popular presentation of expenses is classification by function (presenting items such as cost of sales and administrative expenses), with 51% of companies (2013: 46%) choosing this option, as shown in figure 14.1.
Figure 14.1. How are operating expenses presented on the face of the income statement?
Nature Function Mixed Not classified
8%
51%
23%
18%
While presentation by function was a clear preference for the smaller companies (64% of the ’other’ group adopting it), the presentation chosen by FTSE 350 companies was more varied, with function chosen by 41% of the companies, nature by 9% and a mixture of the two by 21%. 29% chose not to classify the expenses on the face of the income statement. A ‘mixed’ presentation could be open to challenge given that IAS 1 requires presentation by nature or function.
Where expenses were not classified on the face of the income statement and an analysis was instead provided in the notes to the financial statements, 52% presented the analysis based on nature, 35% by function and only 13% had a mixed classification.
Where the classification of expenses is by function (and, for the purposes of our survey, mixed), companies are nevertheless required by IAS 1 to disclose further information on the nature of expenses in the notes, including depreciation, amortisation and employee benefits expense. There were 80 companies for which this was the case and all but five of them provided the required information. Although the five outliers reported some information on the nature of certain expenses, there did not appear to be enough to clearly demonstrate compliance with IAS 1’s requirements.
Operating profitOne metric that most companies seem to feel is helpful in describing their performance is operating profit. For companies outside the financial services industry this tends to reflect profitability before items such as investment income, finance costs and tax. Old UK GAAP required such a measure to be presented, but even now 91% of the companies surveyed (2013: 91%) still present an operating profit line, despite IFRS containing no requirement to do so. 8% of these did however (2013: 8%) present the equivalent of an operating profit line, but using a different name, such as trading income.
Whilst the presentation of an operating profit line is still popular with IFRS reporters, an important difference compared to old UK GAAP is the treatment of certain exceptional items. Old UK GAAP required the three items shown in figure 14.2 to be presented below operating profit (technically, under old UK GAAP the reorganisation or restructurings would have needed to be ‘fundamental’), whereas the basis for conclusions to IAS 1 indicates that where such a measure is presented it would be misleading to exclude items of an operating nature, such as inventory write-downs, restructuring and relocation expenses. Because of this, it came as little surprise to see that nearly all companies with the types of expenses shown in 14.2 presented them above their operating profit line.
112

However, the treatment of these types of expenses when it came to companies’ non-GAAP measures was a different story, as set out above.
Non-GAAP performance measuresNon-GAAP measures are any measures of an entity’s performance or position other than those specifically defined in accounting standards. As noted above, operating profit is technically a non-GAAP measure under IFRSs, but for the purposes of the discussion that follows it has not been included as such. The presentation of non-GAAP measures in the narrative reporting is discussed in chapter 6 and chapter 9.
An area of much debate over the last year, the use of non-GAAP measures remains as popular as ever, with, on the face of it, little evidence that the FRC’s announcement in December 201317 on the use of exceptional items has had much impact. However, delving deeper reveals that many companies are abiding by certain of the FRC’s ‘reminders’, although in some cases this compliance was perhaps more from a technical perspective rather than adhering to the ‘spirit’ of the reminders.
The European Securities and Markets Authority (ESMA), the International Federation of Accountants (IFAC), the International Accounting Standards Board (IASB) and the International Financial Reporting Standards Interpretations Committee (IFRSIC) have also all contributed to the debate, as set out below and in the regulatory overview at chapter 3.
68% of companies (2013: 61%) presented non-GAAP measures on the face of their income statement. The proportion of companies presenting such measures is fairly similar for the FTSE 350 and the other group.
The basis for conclusions to the latest proposed amendments to IAS 1 states that ‘the IASB does not want to propose amendments that could be seen as encouraging the proliferation of ‘non-GAAP’ measures’. However, the FRCs response to the ED encouraged the IASB to consider the disclosure and placement of alternative performance measures as part of the wider disclosure initiative project as in some cases alternative performance measures provide useful insight and enable users to make better decisions. We also consider that, when applied properly, non-GAAP measures can add value to an entity’s communication with investors by providing insight into the metrics that management uses to run the business.
Figure 14.2. Where are the following items presented?
0
20
40
60
Profit/losses on the disposal of fixed assetsCosts of reorganisation or restructuringProfit/loss on the sale or termination of an operation
51 23 15 102 1 43 1 1 36 1 53
Above operating profit Below operating profit No evidence
17 https://www.frc.org.uk/News-and-Events/FRC-Press/Press/2013/December/FRC-seeks-consistency-in-the-reporting-of-exceptio.aspx
Annual report insights 2014 113

Every company that presented a non-GAAP measure on the face of its income statement defined the measure, making clear the items stripped out in order to arrive at it. Where this was not already apparent on the face of the income statement an analysis of the items excluded tended to be provided in the first few notes to the accounts. Occasionally it was provided right at the back as one of the last notes to the accounts, which given that they were describing “exceptional” items seemed a little questionable in terms of the prominence they had been afforded, albeit there are no rules on the order in which notes should be presented.
Clarity in how the measures are arrived at is essential and it comes as no surprise that the draft guidelines recently proposed by ESMA18 would, inter alia, require definitions and reconciliations to amounts reported in the financial statements.
In the FRC’s December press notice, the Financial Reporting Review Panel (FRRP) stated that they believe the approach taken in justifying additional items that qualify for separate presentation should also be clearly disclosed. Of those presenting non-GAAP measures, 79% provided justifications for why items had been stripped out, with generic descriptions tending to be presented within the accounting policies note and any more detailed discussion presented alongside the numerical breakdown of the constituent items. For example, the descriptions of exceptional items commonly indicated that the items stripped out required separate presentation from the remaining results of the group due to their one-off nature and that this would allow users of the financial statements to better understand the elements of financial performance in the period plus enable comparison with prior periods.
A good example was presented by National Grid.
National Grid Annual Report and Accounts 2013/14
Clarity in how the measures are arrived at is essential and it comes as no surprise that the draft guidelines recently proposed by ESMA would, inter alia, require definitions and reconciliations to amounts reported in the financial statements.
18 http://www.esma.europa.eu/content/ESMA-Guidelines-Alternative-Performance-Measures
114

The description of the non-GAAP measures was fairly mixed (see figure 14.3), with terms such as profits “before exceptional items”, “underlying” profits and “adjusted” profits being the most popular. The only category to increase in popularity in the year was “before exceptional items”, which had previously only been used by 10% of those presenting non-GAAP measures, although this is perhaps a little surprising given the FRC’s press notice. The other groups all saw small falls, but their usage remained relatively constant.
Figure 14.3. How are the non-GAAP performance measures broadly described?
88%
Before exceptional items
underlying
Adjusted
No description
Other
25%
22%27%
10%
16%
The items that were excluded from the results to calculate the non-GAAP measures, however, were described slightly differently. The most common description of excluded items was “Exceptional”, as shown in figure 14.4. Accordingly, most companies would do well to pay close attention to the FRRP’s reminders, which explicitly refer to the use of exceptional items, although they are also relevant for other similar metrics.
Figure 14.4. How are the excluded items broadly described?
88%
Exceptional Non-underlying Non-recurring
Other
Adjustments No description
47%
10%
6%
6%7%
24%
One of the FRRP’s reminders was that where the same category of material items recurs each year, and in similar amounts, companies should consider whether such amounts should be included within underlying profit. As figure 14.5 shows, the types of items that are stripped out was relatively consistent compared to the previous year. Common items such as profits or losses on sale or termination of an operation or restructuring costs, whilst typically included in arriving at operating profit, tended to be stripped out in arriving at adjusted earnings measures. Where companies infrequently undertake such activities such an approach appears reasonable.
Annual report insights 2014 115

Meanwhile, amortisation of intangibles, often of intangibles acquired in a business combination, was stripped out slightly more often in the companies we surveyed this year. Although the presentation of amortisation year after year as “exceptional” or “non-recurring” could be open to challenge very few companies fell into this trap. Instead, those companies stripping out amortisation tended to adopt other approaches, for example including it in an ‘adjustments’ column or presenting profit before exceptional items and amortisation. Whilst technically appearing to comply with the FRRP’s reminders it could be questioned whether this complies with the spirit of those reminders. On the other hand, the usefulness of measures such as EBITDA seems to be accepted by many.
Another reminder was that the approach to identifying items as exceptional should be even-handed between gains and losses. Whilst the presentation of non-GAAP measures that strip out certain expenses is common, in 2014 is was also noted that a number of companies stripped out one-off credits, such as pension curtailments, leasing items and other non-recurring income. Such a balance helps contributes towards efforts to ensure reports are fair, balanced and understandable.
Companies also adopted a variety of structures in presenting non-GAAP measures in their income statement. 47% of companies inserted an extra column and 40% inserted additional line items. In January 2014 the IFRSIC stated that the addition of pro forma columns to the primary statements appears “unlikely” to satisfy the requirements of IAS 1. However, this is a commonly accepted practice in jurisdictions that include the UK and Deloitte’s recommendation was that if the committee believes such a presentation should be prohibited then an amendment should be made to IAS 1 as part of the IASB’s disclosure initiative project. No such amendment was proposed in the IASB’s exposure draft of amendments to IAS 1 released in March 2014, although the project is ongoing.
Figure 14.5. What do non-GAAP measures strip out?
0%
20%
40%
60%
AmortisationFinancial instrumentsadjustments
ImpairmentAcquisition related costsDisposal of fixed assetsRestructuring costsSale or terminationof operations
34% 30% 56% 52% 15% 16% 22% 27% 34% 37% 40% 43% 53% 45%
2014 2013
116

A few companies tried to be innovative in the way that they reported non-GAAP measures, for example Marks and Spencer Group plc included a separate box immediately after the income statement. This approach could be said to aid transparency in keeping non-GAAP measures clearly separated from GAAP measures. Vodafone Group Plc had a dedicated “non-GAAP information” section at the end of the back half of the annual report, with extensive commentary on the reasons why these items were disclosed and useful linkage to internal management reporting (based on that disclosed under IFRS 8).
Marks and Spencer Group plc Annual report and financial statements 2014 (p88)
Vodafone Group Plc Annual Report 2014
Annual report insights 2014 117

It seems likely that non-GAAP measures will still be used for the foreseeable future and it will be interesting to see how the various regulators and standard setters further the debate and requirements in this area. The key challenge is to provide useful information without creating inconsistencies and without confusing the reader. Of course, the use of non-GAAP measures is also captured by the directors’ statement that the annual report and accounts taken as a whole is “fair, balanced and understandable” and some of audit committees may wish to state that their use is a significant issue they have considered (see chapter 12).
Earnings per shareAdjusted EPS figures also remained very popular amongst reporters. Similar to the previous year 63% (2013: 67%) of the companies chose to disclose additional EPS numbers based upon a non-statutory measure.
IAS 33 specifies that where additional EPS figures are provided, both the adjusted basic measure and the adjusted diluted figures should be presented with equal prominence and included in the notes to the financial statements. The implication from this wording could be that one should not present such measures on the face of the income statement. However, of the companies presenting additional EPS figures, 51% presented them on the face of the income statement while the remaining 49% presented them only in the notes to the financial statements.
81% of companies (2013: 87%) presenting an additional basic EPS measure also presented an additional diluted measure, in line with the requirements of the standard.
IAS 33 requires basic and diluted EPS to be presented for profit/loss for continuing operations, and for the total profit/loss attributable to shareholders. Of those 16 entities with discontinued operations in the year all met the IAS 33 requirements to disclose a separate figure for continuing operations on the face of the income statement and a separate figure for discontinued operations on the face or in the notes.
Tax The issues of tax charges and tax paid, especially by large international conglomerates, as well as tax governance, continue to appear in the headlines of UK business news. Perhaps as a response to this, seven companies that we surveyed, all from FTSE 350 group, went beyond the statutory requirements for accounting purposes and provided information on tax governance, tax charges and/or tax payments to UK and/or global tax authorities in their annual report. Another three companies, again all in the FTSE 350, did not provide tax governance information but did voluntarily provide information on the tax charges or payments to UK and/or global tax authorities.
The issues of tax charges and tax paid, especially by large international conglomerates, as well as tax governance, continue to appear in the headlines of UK business news.
118

An example of disclosure in this area is provided by the Weir Group PLC.
The Weir Group PLC Annual Report and Financial Statements 2013 (p46)
Share of results of associates and joint ventures52 companies within the survey had interests in associates and joint ventures. IAS 1 requires that the share of the profit or loss of associates and joint ventures that are equity accounted for must be presented on the face of the income statement in a separate line. Six (2013: five) companies with interests in associates or joint ventures under the equity method of accounting did not present their share of profit or loss on the face of the income statement (as required by IAS 1). Two of them explicitly stated that this was due to materiality. Regulators have confirmed that negative statements of this sort are not required, although many seem to prefer to play it safe and include a confirmation.
One additional company made clear that their joint ventures were immaterial but there was no evidence of which method of accounting they had been applying.
IFRS 11 Joint Arrangements, replaces IAS 31, the existing accounting standards for joint ventures, effective for periods beginning on or after 1 January 2013 for companies which comply with IFRSs as issued by the IASB but a year later for those reporting under IFRSs as adopted by the EU. The two main changes brought in by IFRS 11 are that:
• joint arrangements are now categorised by focusing on the rights and obligations of the parties to the joint arrangement, whereas previous accounting was driven by the structure of the joint arrangement; and
• the choice of accounting method for jointly controlled entities is removed under IFRS 11 – the equity method is required for all joint ventures, and proportionate consolidation is not permitted.
43 companies had evidence of interests in joint arrangements within the financial statements. Of these, six chose to account for them using proportionate consolidation under IAS 31. Four of these six identified that the forthcoming adoption of IFRS 11 would have a significant impact on the financial statements (see chapter 15 for more detail on these types of disclosures).
Annual report insights 2014 119

Discontinued operationsIAS 1 requires that if there are discontinued operations in the period, the total profit or loss from these discontinued operations must be shown as a single line item on the face of the income statement. The order of the items required to be disclosed on the face of the income statement (as listed in IAS 1:82) suggests that the results from the discontinued operations should come below the tax expense line although this is not an explicit requirement of the standard.
Out of the 16 companies that clearly had discontinued operations, all complied with the requirement to show the total profit or loss from as a single line item. One company remained silent on whether they had any discontinued operations or not, although there was no evidence to suggest that they had any. All other companies included an explicit statement that all results were derived from continuing operations.
Balance sheetIAS 1 has its own terminology for the primary statements, which periodically undergoes revisions, but it does permit flexibility around this labelling and does not mandate the use of its terminology. For example, IAS 1 refers to the “statement of financial position” but most companies (75%) still refer to a “balance sheet”.
IAS 1 also allows flexibility over how the various categories of items within it are presented. 72 companies presented the information on a net assets basis i.e. with assets followed by liabilities, with a subtotal corresponding to a net assets and total equity figure. 27 companies presented a total assets figure followed by total equity and liabilities. The one remaining company presented total assets less current liabilities followed by non-current liabilities and equity.
The majority of companies presented two balance sheets, with just 9 companies presenting a third balance sheet due to retrospective application of an accounting policy or a correction of a prior year error. However, 63 companies had such restatements – 21 of these made an explicit statement that no third balance sheet had been presented on the grounds that the restatement had had no material impact on that third balance sheet. No such statement is required though and the remaining 33 companies remained silent as to why they had omitted a third balance sheet, leaving readers to draw their own conclusions.
Net Debt Because of the importance of net debt disclosure to many investors (as evidenced by the FRC lab’s project in September 2012), the IASB decided at its March 2014 meeting to undertake a narrow-scope project which would amend IAS 7 Statement of Cash Flows to address net debt disclosures. This project will consider introducing disclosures that reconcile financing cashflows to amounts included in the balance sheet.
Because of the importance of net debt disclosure to many investors (as evidenced by the FRC lab’s project in September 2012), the IASB decided at its March 2014 meeting to undertake a narrow-scope project which would amend IAS 7 Statement of Cash Flows to address net debt disclosures.
120

Despite their usefulness to investors and their natural linkage to capital management and going concern disclosures, a large number (56) of companies did not disclose a net debt reconciliation or a reconciliation of cash flows to debt movements. As shown by figure 14.6, these voluntary reconciliations were more often presented by those in the FTSE 350.
Figure 14.6 Has the company disclosed further information around debt?
FTSE 350 Other group
151 101 87
Net debt reconciliation Reconciliation of cashflows to debt Neither Both
20%
5%
45%
30%
7%
70%
7%
16%
Parent company reportingThe long awaited standard replacing old UK GAAP was published by the FRC last year and is mandatory for periods beginning on or after 1 January 2015, with early adoption permitted. Listed companies are required by the EU IAS Regulation to present IFRS consolidated financial statements, but they have a choice as to whether to present the parent’s separate financial statements using IFRS or UK GAAP. With the publication of ‘new UK GAAP’, parent companies now have a choice of full IFRSs, FRS 101 or FRS 102 for their individual financial statements. Interestingly, of the companies surveyed, 50% adopted old UK GAAP for parent reporting, 49% did IFRS and only one applied FRS 101 early.
UK company law also provides an exemption from publishing a parent company-only income statement/profit and loss account. 92 companies (2013: 95) took advantage of this exemption. The legal exemption is not clear as to whether it extends to the statement of other comprehensive income (for IFRS reporters) or the statement of total recognised gains and losses (for UK GAAP reporters). Of those companies taking advantage of the exemption, five (2013: four) presented a separate company-only statement of other comprehensive income/statement of total recognised gains and losses, although it does not appear unreasonable to omit this statement given that it is still a statement of financial performance.
Annual report insights 2014 121

The notes to the financial statements not only provide information explicitly required by IFRSs, they should also contain any other information that is relevant to an understanding of the financial statements. Nowadays the list of IFRS disclosure requirements alone is fairly extensive, with most new standards introducing additional disclosure requirements. It therefore came as little surprise that the average length of the financial statements rose to 55 pages this year (2013: 53 pages), with the FTSE 350 averaging 60 pages and other companies 47 pages.
As set out in the regulatory overview in chapter 3, there are various initiatives underway to try and address the disclosure overload perceived by many, including the FRC’s clear and concise project and the IASB’s disclosure initiative. In the mean-time however it seems as though companies have struggled to cut clutter from their financial statements. The IASB’s latest proposals to amend IAS 1 would further clarify that immaterial disclosure need not be provided, that preparers need not adhere to the ordering of notes suggested by IAS 1 and examples of significant accounting policies would also be removed. These efforts may help preparers in their battle against clutter, whilst encouraging greater levels of innovation in the notes to the financial statements, for example by linking to narrative reporting as set out below.
Linkage to narrative reportingIn July 2014 the FRC’s financial reporting lab issued a report: Accounting policies and integration of related financial information.19 The report considered the views of companies and investors on the presentation of accounting policies, the notes to the financial statements more generally and the integration of narrative reporting with the primary statements. On this final point the prevailing view amongst investors was that it was not appropriate for management commentary to be included in the financial statements.
Accordingly, the vast majority of annual reports present management’s commentary in the front half and the financial statements and notes in the back half. Some companies have nevertheless experimented in this area, presenting narrative reporting in amongst their primary statements, for example National Grid PLC (illustrated below) and Vodafone PLC. The FRC lab’s report stated that a small proportion of investors do prefer this presentation, as it aids management in their efforts to tell the company’s story. Companies may therefore wish to engage with their primary audience to understand what presentation they would favour.
15. Notes to the financial statements
Top tips
• See whether there are immaterial disclosures that can be cut from your financial statements – regulators are keen to promote this message at a time when the average length of financial statements increased from 53 pages to 55 pages.
• Make sure the financial statements are consistent with the story told in the narrative reporting, virtually all companies with impairments, restructuring expenses or exceptional items in their financial statements made sure they were discussed with suitable prominence in the front-half.
• Although 89% of companies present their accounting policies together immediately after the financial statements, some investors prefer other presentations – see what your investors would like.
• Capital risk management disclosures are material in nature in the eyes of regulators and should not be boilerplate in nature – 90% of companies provided disclosure in this area, although 22% of disclosures were generic.
Keep an eye on
• Make sure the notes are consistent internally – six of the ten companies that had goodwill but no sensitivity analysis had nevertheless identified the potential impairment of goodwill as a key source of estimation uncertainty, which might suggest a disconnect.
• Check through IFRS 3’s extensive disclosure requirements carefully – of those entities with a business combination in the period, 81% provided disclosures which were considered to meet all, or nearly all, of IFRS 3’s requirements.
• Goodwill impairment disclosures will always be an area of focus for regulators so get them right! Only 70% of companies clearly disclosed the allocation of significant goodwill to the underlying cash-generating units as required by IAS 36.
19 https://www.frc.org.uk/Our-Work/Publications/Financial-Reporting-Lab/Accounting-policies-and-integration-of-related-fin.pdf
122

National Grid Annual Report and Accounts 2013/14
Annual report insights 2014 123

Regardless of whether narrative reporting is presented within the financial statements, integration of the front and back half is vital – a reader should not take away a completely different message when reading one half compared to the other. 69 companies in our sample were seen to have reported significant restructuring costs, impairment charges or exceptional items in their financial statements. Encouragingly, in all but one instance these items were commented on in the front half of the annual report with what was deemed a reasonable degree of prominence, rather than being buried in the narrative reporting.
Structure of notesAs mentioned above, proposals already exist to clarify that the order of notes need not reflect the order in which they are listed in IAS 1. As set out in the FRC lab’s report, differing views exist on whether companies would be best off retaining this ordering, since it aids comparability and is still adopted by the majority of companies, or innovating. For example, IMI PLC split their notes into five sections – the basis of preparation, results for the year, operating assets and liabilities, capital structure and financing costs and other notes. This structure may help some readers more readily understand a company’s story.
Choice for accounting policies One of the few areas where a handful of companies have started to mix things up and present information in a more engaging fashion is around significant accounting policies. The tradition has been to present this information as note 1 to the financial statements and as shown by figure 15.1 this remains the favoured position. An example of an alternative approach, presenting accounting policies in the relevant note, was provided by BAE Systems plc. In respect of the location of accounting policies, each approach has its own merits but, per the FRC’s report, for investors the most important thing is the content rather than the location.
Figure 15.1. How are the accounting policies presented?
88%
Seperate note immediately after primary statements
Before the primary statements
Combined with the relavant note
Seperate appendix or other
2%4%
89%
5%
Where accounting policies were presented in a separate note, the length of the policies was similar to last year, varying from two and half to twenty pages (2013: three to nineteen pages) and averaging six and a half pages. The longest accounting policies were presented by a bank in the FTSE 350 group and one company which had extended disclosures in the accounting policies section due to a prior year restatement. Excluding these two companies, page length ranged from two and a half to thirteen pages, and averaged six; there was no noticeable difference in lengths between the FTSE 350 and the other group.
In accordance with IAS 8 Accounting policies, Changes in Accounting Estimates and Errors companies are required to disclose if there have been any changes in accounting policies, such as adopting a new or revised standard.
Nowadays the list of IFRS disclosure requirements alone is fairly extensive, with most new standards introducing additional disclosure requirements. It therefore came as little surprise that the average length of the financial statements rose to 55 pages this year …
124

Nine companies early adopted standards this year, compared to none in the previous year. Six non SEC-registrants elected to adopt the new consolidation “package of five” early, implementing the IASB’s effective date of periods commencing on or after 1 January 2013, rather than taking advantage of the EU deferral by a year, although in most cases this had little or no impact. Three other companies early adopted an amendment to IAS 36 in order to take advantage of a small reduction in disclosures.
Companies are also required to disclose known or reasonably estimable information relevant to assessing the possible impact that a standard in issue but not yet effective will have. As shown by figure 15.2, the majority of companies this year tended to give a high-level indication that standards on the way were not expected to have a material impact or that their impact had not yet been assessed. In the previous year companies had tended to give more detail in this area, primarily because of the impact of IAS 19 revised Employee Benefits, which had a more widespread effect.
Figure 15.2. How detailed are the disclosures regarding standards in issue but not yet effective?
List of new standards only
List of new standards and statement that no material impact or not assessed
List of new standards and statement and some basic information on impact
List of new standards and statement and some information on impact
Statement that no significant impact but no list of items
No clear disclosure
4%5%
69%
6%
8%
8%
Critical judgements and key sources of estimation uncertaintyUnder IAS 1 companies are required to disclose the judgements that management have made in applying their accounting policies and that have the most significant effect on the amounts recognised in the financial statements. Similarly, disclosure is required of key assumptions concerning the future and other major sources of estimation uncertainty at the balance sheet date that have a significant risk of causing a material adjustment to the carrying amounts of assets and liabilities within the next financial year.
By their very nature, these areas will attract considerable attention from regulators and other stakeholders. One would also expect a reasonable degree of correlation between these items, the issues concerning the financial statements disclosed by the audit committee and the auditor’s key risks (see chapter 13).
69% of companies (2013: 69%) did not differentiate between critical judgements and key sources of estimation uncertainty, but simply presented a combined list of the two. Whilst presentation alongside one another may be harmless enough, preparers should remember that these are two distinct requirements. An example of a judgement would be where a conclusion was reached that a subsidiary is controlled despite less than 50% of the voting rights being held. Estimation uncertainty on the other hand could arise in determining the useful life of property, plant and equipment. 4% of companies disclosed information only about either critical judgements or key sources of estimation uncertainty but without mentioning the other.
70% of companies (2013: 75%) did not differentiate between critical judgements and key sources of estimation uncertainty, but simply presented a combined list of the two.
Annual report insights 2014 125

One company did not clearly disclose a section in relation to key sources of estimation uncertainty and critical judgements, instead highlighting any use of judgement under each relevant accounting policy. One company was also bold enough to assert that there were no critical accounting estimates or judgements in the current or prior year. A few companies included key numbers in their disclosures or cross-referenced to the notes with further information. A good example of concise, company-specific disclosure in this area, with appropriate linkage to other parts of the financial statements, was presented by Evraz plc, an extract of which is reproduced below.
Evraz plc Annual Report and Accounts 2013
The combined number of critical judgements and key sources of estimation uncertainty disclosed has remained static compared to the prior year, with the largest number being 14 and the average being five. The average among both groups of companies was five, thus implying that the size of a company does not necessarily dictate the number of judgements and uncertainties.
126

As shown in figure 15.3, the underlying areas common to a majority of companies remain the same as last year, with goodwill and acquisitions, pensions, tax and provisions being the most common areas of judgement and estimation uncertainty. The most popular item – accounting for goodwill and business combinations reflects the difficulties preparers face as highlighted in EFRAG’s response to the IASB’s request for information on implementing IFRS 3(2008). Identifying what constitutes a business and intangible assets, measuring fair values and testing goodwill for impairment are all areas that challenge preparers.
In 2014, only three companies identified the application of the going concern basis of accounting as being a critical judgement or key source of estimation uncertainty, as was the case in 2013.
58 companies identified issues other than those noted in figure 15.3 as being critical judgements and key sources of estimation uncertainty. Common themes emerging include the valuation of investment property, the measurement of contingent consideration and the determination of fair values, reflecting the impact of IFRS 13.
Recognising the importance of revenue recognitionOne of the key metrics for any business, revenue attracts a lot of attention from shareholders, regulators and auditors alike. Despite this, many companies provide scant detail on how they actually account for revenue and what their policy is for recognising revenue. 42% of companies surveyed were deemed to have provided only generic disclosure regarding revenue recognition, rather than meaningful company-specific information. IFRS 15 Revenue from Contracts with Customers was published in May 2014 and, in keeping with tradition, introduced a number of new disclosure requirements. This is likely to lead to more disclosure about revenue recognition policies but there will be a wait for improvement given the IASB’s effective date is 2017.
Going concern problems going but not goneThe requirements for disclosure around going concern within the annual report are discussed in detail in chapter 10. As shown by figure 15.4, just under half the companies surveyed either included detailed or relevant disclosure around going concern in the financial statements or provided a clear cross-reference to relevant disclosure in the narrative reporting. 41% stated that the financial statements were prepared on a going concern basis yet did not expand on this. The remaining 12% gave no meaningful insight at all on going concern within the financial statements, albeit in some of these cases there were generic descriptions of managing capital to ensure companies could continue as going concerns.
Figure 15.3. How many companies include the following items as critical judgements or key sources of estimation uncertainty?
0
20
40
60
80
Impairment(generic issues)
Share basedpayments
RevenueRecognition
Current AssetsFinancialInstruments
Tangible &Fixed Assets
IntangiblesProvisionsTaxPensionsGoodwill &acquisitions
71 65 56 67 56 51 54 56 43 56 24 22 24 25 35 27 32 33 12 14 34% 237
2014 2013
Annual report insights 2014 127

Figure 15.4. How detailed are the going concern disclosed in the financial statements?
0%
10%
20%
30%
40%
50%
No meaningful insight at allMentions adoption of goingconcern accounting basis,
but nothing else
Detailed or some relevantdisclosure in financial statements
Cross reference fromfinancial statements todisclosure in narrative
38% 41% 34% 9% 7% 13%11% 41% 39% 43% 12% 11%15 36
Total Top 350 Other group
Operating segmentsFourteen companies (2013: fifteen) only identified one reportable segment. These companies explained their decision in an average of 58 words (2013: 40).
Given IFRS 8’s focus on disclosing information that is as reported to the chief operating decision maker, it would not be unreasonable to assume that the identification of reportable segments within the financial statements would be the same as how the company and its operations are described in the front-half of the annual report i.e. the narrative reporting. The reportable segments disclosed by 17% of companies in their financial statements were different to how the company analysed their operations in the narrative reporting in the front half of the annual report. This was an improvement from the prior year where inconsistencies were observed for 27% of the companies and suggests preparers may be taking on board some of the regulators’ messages around the importance of linkage.
Goodwill and business combinations36 companies surveyed (2013: 46) had business combinations in the year. Of these, 26 were in the top 350 group (2013: 28) and the remaining 10 were from the other group (2013: 18). IFRS 3 Business Combinations has extensive disclosure requirements where companies have acquired a business during the period. Of those entities with a business combination in the period, 81% (2013: 78%) provided disclosures which were considered to meet all, or nearly all, of IFRS 3’s disclosure requirements. For the companies recognising goodwill in a business combination 90% disclosed information on what gave rise to that goodwill. EFRAG’s response to the IASB’s request for information on the implementation of IFRS 3(2008) stated that users believe this information is often “boiler plate” in nature and that there is a need for more transparency on expected synergies.
128

Testing times for goodwillIAS 36 Impairment of Assets requires goodwill to be tested for impairment annually and as part of this has a number of disclosure requirements, as noted below. By its very nature this continues to be an area of focus for auditors and regulators alike.
80 companies surveyed recognised goodwill on their balance sheets at the end of the current reporting period (2013: 86). Of these, only 70% of companies disclosed the allocation of significant goodwill to the underlying cash-generating units (CGUs) as required by IAS 36. In a number of cases where this information was not disclosed an allocation by operating segment was provided, but it was not made clear whether the operating segments corresponded to CGUs.
Assets are tested for impairment by comparing the asset’s carrying amount to its recoverable amount; recoverable amount is calculated as the higher of the asset’s value in use and its fair value less costs to sell. Three companies justified the carrying value of goodwill by reference to fair value less costs to sell, while all others had a recoverable amount based on value in use.
For those entities with recoverable amounts based on value in use, IAS 36 requires disclosure of the period over which management’s projections of cash flows are based on approved budgets or forecasts and, where this exceeds five years an explanation of why that longer period is justified. 94% of companies using value in use to support goodwill disclosed the period covered by budgets or forecasts. Only three companies indicated that the period was more than five years, with two providing an explanation to justify the longer period.
Value in use calculations may extrapolate cash flow projections beyond the period covered by budgets or forecasts by applying a steady or declining growth rate (unless an increasing rate is justified). Where the growth rate exceeds the long term industry average a justification should be provided. 36% of companies using the value in use method explicitly stated that the growth rate applied did not exceed the long-term average growth rates for the relevant country or market, albeit there is no requirement for a negative statement like this; a further 9% implied that this was the case. The remaining companies remained silent as to whether their long term growth rate exceeded the average, although in a number of cases the growth rate applied was nil.
94% of companies using the value in use method (2013: 91%) disclosed the discount rate used. 8% of companies using the value in use method only had one CGU with significant goodwill; of the remaining companies, only 55% indicated that they had used more than one discount rate for different CGUs or groups of CGUs. Unless cash-flows are risk-adjusted the discount rate applied to an individual CGU should reflect the risks specific to that CGU.
Both the value in use method and the calculation of a CGU’s fair value less costs to sell require the use of estimates and assumptions. For CGUs with significant goodwill, if a reasonably possible change in a key assumption would lead to an impairment, IAS 36 requires the disclosure of further relevant sensitivity information.
80 companies surveyed recognised goodwill on their balance sheets at the end of the current reporting period.
Annual report insights 2014 129

As shown by figure 15.5, 53% of companies with goodwill (2013: 48%) provided either detailed or high-level sensitivity analysis. Just over a third of companies of companies with goodwill included a negative statement that there were no reasonably possible changes that would cause an impairment. Six of the ten companies that had goodwill but no sensitivity analysis had nevertheless identified the potential impairment of goodwill as a key source of estimation uncertainty. This suggests that there may be some disconnect between the different disclosure elements in the financial statements.
Figure 15.5. Were additional sensitivity disclosures provided regarding goodwill impairment?
Detailed sensitivity analysis
High-level sensitivity analysis
Negative statement only
No sensitivity analysis
9%
44%
12%
35%
Other intangible assetsSixteen companies (2013: 10) surveyed had no intangible assets (excluding goodwill) recognised on their balance sheets at their reporting date. Thirteen of these were from the ‘other group’. Figure 15.6 further analyses the number of classes of intangibles companies have identified.
15% of companies with intangible assets (other than goodwill) disclosed that one or more classes of intangible assets had been assessed to have an indefinite life. IAS 38 Intangible Assets requires the reasons supporting the assessment of an indefinite useful life to be disclosed, including the factors that played a significant role in determining that the asset has an indefinite useful life. It is encouraging to see that 92% of companies with intangible assets assessed to have an indefinite life included the reasons supporting the judgement. A good example of justification in this regard was presented by LSL Property Services plc.
LSL Property Services plc Annual Report and Accounts 2013
Figure 15.6. How many classes of intangibles (other than goodwill) are recognised?
0
10
20
30
6 or more543210
16 10 13 16 17 14 21 28 19 14 9 9 5 8
2014 2013
130

Impairments91 companies (2013: 81) surveyed recognised an impairment loss in the year. Figure 15.7 indicates what was impaired in the period. Of those financial assets impaired in 2014, trade receivables remained the most commonly impaired item.
Figure 15.7. What has been impaired during the year?
0
20
40
60
80
100
OtherIntangiblesGoodwillProperty, plant and equipmentFinancial assets(including trade receivables)
89 74 26 18 15 14 19 12 249
2014 July-05 2012
For all material impairments, IAS 36 requires the events and circumstances that led to the recognition of the impairment loss to be disclosed. The vast majority of companies had provided such information. The majority of “other” impairment losses related to inventory write-offs.
It is encouraging to see that 92% of companies with intangible assets assessed to have an indefinite life included the reasons supporting the judgement.
Annual report insights 2014 131

Share based paymentsThe disclosure requirements of IFRS 2 Share-based Payment are extensive. 93 companies surveyed (2013: 96) had share based payment schemes. The pattern has changed from last year with one page being the most common length of disclosures which might indicate an effort to cut clutter. Only one company with a share-based payment charge went so far as to exclude any IFRS 2 disclosures, although the IFRS 2 charge was relatively small in this case so perhaps disclosures were omitted on the grounds of materiality.
Figure 15.8. How long are the share-based payment disclosures (to the nearest page)?
0%
20%
40%
60%
80%
5 or more43210
1% 56% 47% 68% 21% 26% 34% 15% 38% 8% 6% 10% 19% 5% 6% 5% 7%4%
6%3%
9%0%2% 5%
2014 Total 2014 Top 350 2014 Other group 2013 Total
Number of pages
132

Financial Instruments IFRS 7 Financial Instruments: Disclosures requires disclosure of information about the significance of financial instruments to an entity, and the nature and extent of risks arising from those financial instruments, both in qualitative and quantitative terms. For example, IFRS 7 requires fair value to be disclosed for classes of assets and liabilities measured at amortised cost, although there are exceptions for items whose carrying amount approximates fair value, such as trade receivables. 52% of companies with non-current financial liabilities held at amortised disclosed the corresponding fair values, 43% provided a negative statement that the carrying value approximated fair value and only 5% failed to provide any information.
IFRS 13 Fair Value Measurement became effective for periods beginning on or after 1 January 2013, providing guidance on how fair value should be measured for most items required to be measured on this basis. Of the companies surveyed 46 had disclosed items whose fair values involved the use of level 3 inputs (unobservable). Out of them 17% did not appear to disclose information around the unobservable inputs and any quantitative factors as required by IFRS 13.
Capital risk management 90% of the companies surveyed included disclosures in their financial statements related to capital management, which the FRRP consider to be material by their nature. However, 22% of these disclosures where either poor of boilerplate. The best disclosures met all of IAS 1’s disclosure requirements around capital risk management, including objectives, policies and processes and a description of what is managed as capital. Figure 15.9 provides more detail on the information clearly disclosed.
60%
70%
80%
90%
100%
The definition of ‘capital’Capital management objectives
Figure 15.9. Of those companies referring to capital management in the financial statements, what detail has been clearly disclosed?
88% 82% 73% 75%
FTSE 350 Other group
Annual report insights 2014 133

Auditors’ remuneration and independenceThe vast majority of companies, 97%, received some form of non-audit services from their auditors – a frequent area of focus and debate for regulators. It was good to see that 60% of companies either disclosed their policy on non-audit services or cross reference to their website. Figure 15.10 provides further analysis on disclosed policies.
Figure 15.10. Does the policy on the provision of non-audit services describe those services which are prohibited, those which are pre-approved and those which specific approval is required?
0%
20%
40%
60%
No mention of a policyImplies there’s a policy,but no detail disclosed
NoPolicy not stated in full,but cross reference to website
Yes
53% 39% 7% 7% 7%11% 45% 43% 19% 5120% 1%36
134

Following the introduction of legislation that has had a significant impact on quoted companies’ directors’ remuneration reports, our survey Providing a clear steer examined the average length of directors’ remuneration reports, including the constituent components (see chapter 5) and the linkage of remuneration to key performance indicators (see chapter 10).
We have also recently conducted a review of the new remuneration reports of around 70% of FTSE 100 companies with financial years ending up to February 2014. This review, which forms part of our soon to be published guide to directors’ remuneration in FTSE 100 companies, focuses on some of the key disclosures where there are choices and decisions to be made about what and how information should be disclosed and the specific aspects of the new disclosure where companies and investors are focusing attention. This appendix presents the findings from this other review.
Some parts of the regulations are less prescriptive than others and companies have had to make many judgment calls on the level of detail to include. In the first year of reporting, before best practice begins to emerge, this has clearly been a challenge and it is not surprising that we are seeing differences in the level of information being disclosed and the format and presentation of this data.
The directors’ remuneration report must contain a statement by the chair of the remuneration committee. This should include details of the major decisions on directors’ remuneration, any substantial changes relating to directors’ remuneration made during the year and the context in which those changes occurred and decisions have been taken. The statement provides an opportunity to tell the story of the year in respect of remuneration, setting the scene for the details to follow and ensuring there are no major surprises in store. All companies have included this statement; however, the content varies considerably. Most companies have provided a good summary of any proposed changes in remuneration arrangements for the coming year with some explanation and justification. Only around half provide details of the context in which decisions were taken and very few provided details of the relationship between remuneration and the business strategy.
The other two main components of the new-style reports are a policy report, setting out a company’s policy on directors’ remuneration, and an annual remuneration report, which reviews the historical remuneration. Some of the key findings from our review are as set out in the following pages.
Appendix 1 – Key messages on directors’ remuneration reports
Some parts of the regulations are less prescriptive than others and companies have had to make many judgment calls on the level of detail to include. In the first year of reporting, before best practice begins to emerge, this has clearly been a challenge …
Annual report insights 2014 135

Policy report
• In almost all companies the policy takes effect from the date of the AGM.
• Salary policy maximum – most companies typically state that increases will be in line with other employees but retain flexibility to award higher increases in specific circumstances. Around 10% of companies include some indication of an absolute limit on the salary and just over 10% disclose an overall maximum increase.
• Pension – most companies disclose the current maximum contribution to pension plans or the maximum salary supplement.
• Other benefits – most companies list the benefits currently provided, with most retaining flexibility to change in response to changing circumstances. All companies may provide relocation and expatriate allowances but for a number of companies this only applies for new recruits. Around a quarter of companies include a maximum value of benefits either as an absolute amount or as a percentage of salary.
• Maximum incentive awards – most companies disclose the limit on the annual bonus and in many cases, where this varies by individual, the individual limits are included. Only around 7% of companies include an overall maximum bonus in the policy which may only be used in exceptional circumstances such as recruitment. Where there is an exceptional maximum in the long term plan (around 50% of companies) most companies also include the usual and maximum in the policy.
• Performance measures and targets – for annual bonus, most companies disclose only the broad measures on which bonus is based with an indication of the overall weighting, perhaps between financial and non-financial, but with flexibility to change. Including the specific measures in the long term plan is more common but most do not include the targets in the policy report.
• Recruitment policy – Around two thirds specifically note that a new recruit may be appointed on a lower than market rate salary with phased increases to bring to market level.
– 40% of companies have no flexibility to make awards (other than buy-outs) outside of normal limits. Around a third may make awards up to exceptional limits.
– Over 15% of companies may make variable pay awards in excess of disclosed.
Key themes emerging from the new policy report
136

Key themes emerging from the annual remuneration report
Annual remuneration report
• The lack of disclosure in relation to bonus payouts has been one of the key issues raised by shareholders during the 2014 AGM season.
– Almost 90% of companies disclose the retrospective bonus measures although where these are non-financial in nature specific details are not always given.
– Around 70% of companies disclose the weightings that apply to these measures.
– Just over 20% provide full details of financial targets with a similar number providing partial disclosure. Around a quarter of companies give some indication of the targets for non-financial measures but very few give specific details.
– In total just under half provide some disclosure in relation to targets. Where there is no disclosure of targets around two thirds provide a good level of detail of the degree to which the targets were achieved. However, around 10% gave almost no details of either the targets or the degree of achievement.
• Almost half of companies disclose the retrospective measures and the weighting of the measures used for awards made under long term plans vesting in respect of the year under review. Around 85% disclosure the specific targets.
• Implementation in the next financial period – most companies disclose information about salaries (85% of companies) and fees (60% of companies) to be paid in the next financial period and the level of awards to be made under incentive plans, or at least confirm that these will be in line with those disclosed in the policy.
• Companies are not disclosing prospective bonus performance targets on the grounds that they are commercially sensitive. However around two thirds are disclosing some degree of information at least around the financial measures on which the bonus will be based.
• Just over half of companies provide full disclosure of the measures and targets relating to prospective long term awards with a further 20% making partial disclosure, typically disclosing the measures but not the actual targets.
• Relative spend on pay – almost half of companies show the minimum requirements (employee costs and dividend/buybacks). Around a third include a measure of profit. A small number of companies include additional information.
Annual report insights 2014 137

BIS The Department for Business, Innovation and Skills
BR Business ReviewThe Companies Act 2006 requires that directors’ reports include a Business Review.
CEO Chief Executive Officer
CGU Cash generating unit
CODM Chief Operating Decision Maker
Competition CommissionAn independent public body which helps to ensure healthy competition between companies in the UK for the ultimate benefit of consumers and the economy.
Conduct CommitteeThe Conduct Committee of the FRC have taken on the legal powers of the FRRP, following the FRC’s restructuring.
CSR Corporate social responsibilityCorporate social responsibility is about how businesses take account of their economic, social and environmental impact. The Companies Act 2006 requires that companies disclose information, about environmental matters, their employees, and social and community issues, in their annual report.
DTR Disclosure and Transparency RulesThese rules of the FCA include requirements for periodic financial reporting to meet the requirements of the EU Transparency Directive.
EBITDA Earnings before interest, tax and amortisation
EC European Commission
EDTF Enhanced Disclosure Task ForceEstablished by the Financial Stability Board in May 2012, the Task Force aims to improve the risk disclosures of banks and other financial institutions.
EPS Earnings per share
ESMA European Securities and Markets AuthorityAn independent EU Authority that seeks to ensure the integrity, transparency, efficiency and orderly functioning of securities markets, as well as enhancing investor protection.
EU European Union
FCA Financial Conduct AuthorityOriginating from the former Financial Services Authority, the FCA acts as the Competent Authority for setting and enforcing the rules applicable to listed companies and those admitted to trading on a regulated market.
FRC’s Financial Reporting LabFacilitated by a steering group and FRC staff, the Lab provides an environment where investors and companies can come together to develop pragmatic solutions to reporting needs.
FRC Financial Reporting CouncilThe UK’s independent regulator responsible for promoting confidence in corporate reporting and governance and issuing accounting standards.
Appendix 2 – Glossary of terms and abbreviations
138

FRRP Financial Reporting Review PanelThe Panel’s role, in order to fulfil the Conduct Committee’s responsibilities, is to ensure that the annual accounts of public companies and large private companies comply with the Companies Act 2006 and applicable accounting standards.
FTSE 100/350 Financial Times Stock Exchange top 100/350 companies (share index)
GAAP Generally accepted accounting practice
IAS International Accounting Standard
IASB International Accounting Standards BoardThe IASB is an independent body that issues International Financial Reporting Standards.
IFRSIC International Financial Reporting Standards Interpretations Committee (formerly IFRIC)IFRIC is the term given to describe Interpretations issued by the Committee which has been renamed the IFRS Interpretation Committee (IFRSIC). It develops interpretations of IFRSs and IASs, works on the annual improvements process and provides timely guidance on financial reporting issues not specifically addressed by the existing standards.
IFRS International Financial Reporting Standard(s)
IIRC International Integrated Reporting CouncilGlobal body aiming to create a globally accepted framework for a process that results in communications by an organisation about value creation over time.
KPI Key performance indicatorA factor by reference to which the development, performance or position of the company’s business can be measured effectively.
Listed companyA company, any class of whose securities is listed (i.e. admitted to the Official List of the UK Listing Authority).
Listing RulesThe Listing Rules made by the UK Listing Authority for the purposes of Part VI of the Financial Services and Markets Act 2000 and published in the manual entitled ‘The Listing Rules’ as from time to time amended.
Market capitalisationA measure of company size calculated as share price multiplied by the number of shares in issue at a certain point in time.
PPE Property, plant and equipment
Quoted companySection 385 of the Companies Act 2006 defines a quoted company as a company whose equity share capital:
a) has been included in the official list in accordance with the provisions of Part 6 of the Financial Services and Markets Act 2000; or
b) is officially listed in an EEA State; or
c) is admitted to dealing on either the New York Stock Exchange or the exchange known as Nasdaq.
Annual report insights 2014 139

Regulated marketRegulated market is defined in the Markets in Financial Instruments Directive. The European Commission website also includes a list of regulated markets at: http://ec.europa.eu/internal_market/securities/isd/index_en.htm
SEC U.S. Securities and Exchange CommissionRegulator of all securities commissions within the United States of America.
SOCIE Statement of Changes in Equity
SORIE Statement of Recognised Income and Expense
SORP Statement of Recommended Practice
STRGL Statement of total recognised gains and losses
UK Corporate Governance CodeThe UK Corporate Governance Code sets out standards of good practice on issues such as board composition and development, remuneration, accountability and audit, and relations with shareholders. All companies with a previous listing are required under the Listing Rules to report in their annual report on how they have applied the UK Corporate Governance Code.
UKLA UK Listing AuthorityThe FCA acting in its capacity as the competent authority for the purposes of Part VI of the Financial Services and Markets Act 2000.
140

Deloitte would be pleased to advise on specific application of the principles set out in this publication. Professional advice should be obtained as this general advice cannot be relied upon to cover specific situation; application will depend on the particular circumstances involved. If you would like further, more detailed information or advice, or would like to meet with us to discuss your reporting issues, please contact your local Deloitte partner or:
Tracy [email protected]
James [email protected]
Corinne [email protected]
Amanda [email protected]
Christos [email protected]
Peter [email protected]
UK Accounting PlusFor the latest news and resources on UK accounting, reporting and corporate governance, go to www.ukaccountingplus.co.uk. UK Accounting Plus is the UK-focused version of Deloitte’s hugely successful and long-established global accounting news and comment service, IAS Plus.
GAAP 2015 Model annual report and financial statements for UK listed groups (due out around the end of 2014)This Deloitte publication illustrates the disclosures in force for December 2014 year ends, including material encompassing all of the revised reporting requirements discussed herein. If you would like to obtain a copy of this publication please speak to your Deloitte contact.
Other resources available
Annual report insights 2014 141

Deloitte refers to one or more of Deloitte Touche Tohmatsu Limited (“DTTL”), a UK private company limited by guarantee, and its network of member firms, each of which is a legally separate and independent entity. Please see www.deloitte.co.uk/about for a detailed description of the legal structure of DTTL and its member firms.
Deloitte LLP is the United Kingdom member firm of DTTL.
This publication has been written in general terms and therefore cannot be relied on to cover specific situations; application of the principles set out will depend upon the particular circumstances involved and we recommend that you obtain professional advice before acting or refraining from acting on any of the contents of this publication. Deloitte LLP would be pleased to advise readers on how to apply the principles set out in this publication to their specific circumstances. Deloitte LLP accepts no duty of care or liability for any loss occasioned to any person acting or refraining from action as a result of any material in this publication.
© 2014 Deloitte LLP. All rights reserved.
Deloitte LLP is a limited liability partnership registered in England and Wales with registered number OC303675 and its registered office at 2 New Street Square, London EC4A 3BZ, United Kingdom. Tel: +44 (0) 20 7936 3000 Fax: +44 (0) 20 7583 1198.
Designed and produced by The Creative Studio at Deloitte, London. 37935A