Annual Report 2021 - Nishat Mills Limited
247
Nishat Mills Limited Annual Report | 2021 Growing Inclusively
-
Upload
khangminh22 -
Category
Documents
-
view
0 -
download
0
Transcript of Annual Report 2021 - Nishat Mills Limited

Nishat Mills Limited
Annual Report | 2021
Growing Inclusively
CORPORATECompany Information ................................................................................. 2Directors’ Profile.......................................................................................... 4Vision and Mission ..................................................................................... 6Chairman’s Review Report ......................................................................... 7Directors’ Report ........................................................................................ 8Financial Highlights .................................................................................. 21Statement of Compliance with Listed Companies (Code of Corporate Governance) Regulations, 2019 ............................................................ 23Independent Auditors’ Review Report to the Members on the Statement of Compliance contained in Listed Companies (Code of Corporate Governance) Regulations, 2019 ........................................... 26Notice of Annual General Meeting ........................................................... 27
FINANCIAL STATEMENTS OF NISHAT MILLS LIMITEDIndependent Auditor’s Report to the members ....................................... 34Statement of Financial Position ................................................................ 40Statement of Profit or Loss ....................................................................... 42Statement of Comprehensive Income ...................................................... 43Statement of Changes in Equity ............................................................... 44Statement of Cash Flows ......................................................................... 45Notes to the Financial Statements ........................................................... 46
CONSOLIDATED FINANCIAL STATEMENTS OF NISHAT MILLS LIMITED AND ITS SUBSIDIARIESDirectors’ Report .................................................................................... 118Independent Auditor’s Report to the members ..................................... 119Consolidated Statement of Financial Position ....................................... 126Consolidated Statement of Profit or Loss ............................................. 128Consolidated Statement of Comprehensive Income ............................ 129Consolidated Statement of Changes in Equity ..................................... 130Consolidated Statement of Cash Flows ................................................. 131Notes to the Consolidated Financial Statements .................................. 132Pattern of Holding of the Shares ............................................................ 221Directors’ Report Consolidated in Urdu ................................................. 228Directors’ Report in Urdu ....................................................................... 240Forms of Proxy in Urdu & English
CONTENTS
Annual Report 2021 01

JS Bank LimitedMeezan Bank LimitedMCB Bank LimitedMCB Islamic Bank LimitedNational Bank of Pakistan Pak Brunei Investment Company LimitedPakistan Kuwait Investment Company (Private) Limited Samba Bank LimitedSilk Bank LimitedSoneri Bank LimitedSummit Bank LimitedStandard Chartered Bank (Pakistan) LimitedThe Bank of PunjabThe Bank of Punjab - Taqwa Islamic BankingThe Bank of KhyberUnited Bank Limited
COMPANY INFORMATIONChief Financial OfficerMr. Mohammad Azam
Company SecretaryMr. Khalid Mahmood Chohan
AuditorsRiaz Ahmad & CompanyChartered Accountants
Legal Advisor Mr. M. Aurangzeb Khan, Advocate, Chamber No. 6, District Court, Faisalabad.
Bankers to the CompanyAlbaraka Bank (Pakistan) LimitedAllied Bank LimitedAskari Bank LimitedBank Alfalah LimitedBank Al Habib LimitedBank Islami Pakistan LimitedCitibank N.A.Dubai Islamic Bank Pakistan Limited Faysal Bank LimitedFaysal Bank Limited - Islamic BankingHabib Bank LimitedHabib Metropolitan Bank Limited Industrial and Commercial Bank of China Limited
Board of DirectorsMian Umer ManshaChief Executive Officer
Mian Hassan ManshaChairman
Mrs. Mehak AdiMrs. Sara AqeelSyed Zahid HussainMr. Farid Noor Ali FazalMr. Mahmood Akhtar
Audit CommitteeMrs. Mehak AdilChairperson / Member
Syed Zahid HussainMember
Mr. Mahmood AkhtarMember
Human Resource & Remuneration (HR & R)CommitteeMrs. Sara AqeelChairperson / Member
Mian Umer ManshaMember
Mr. Mahmood AkhtarMember
Nishat Mills Limited02
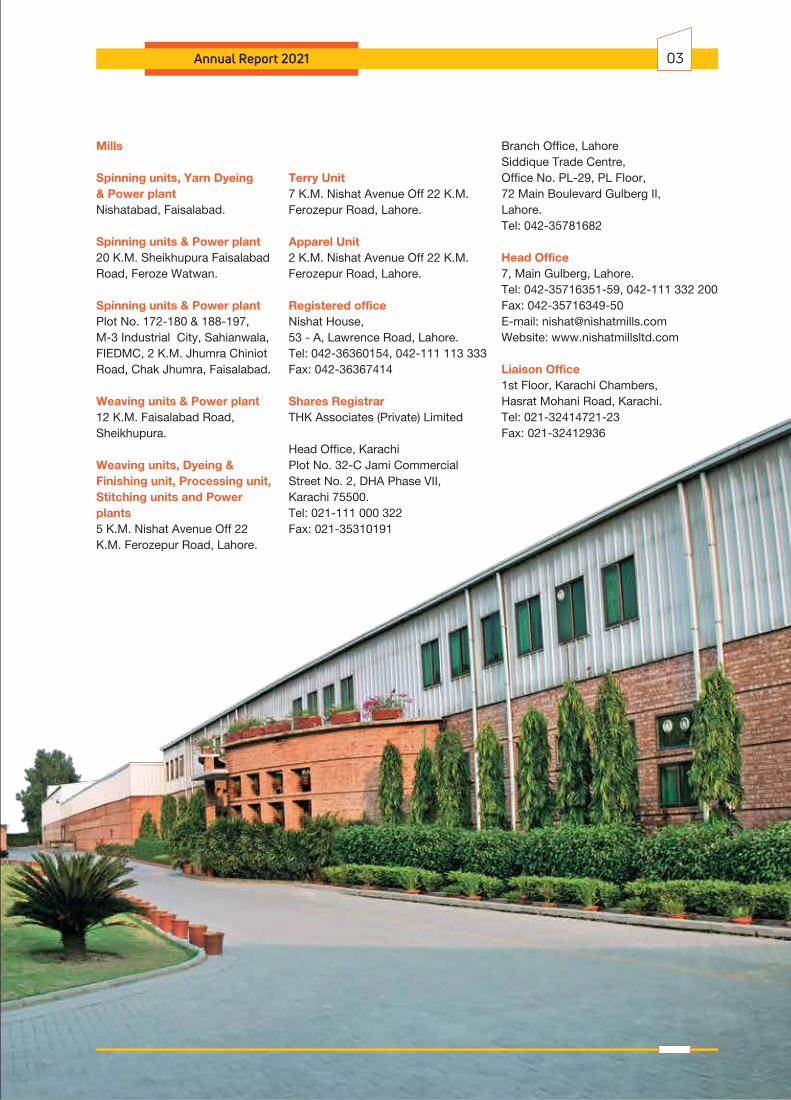
Terry Unit7 K.M. Nishat Avenue Off 22 K.M. Ferozepur Road, Lahore.
Apparel Unit2 K.M. Nishat Avenue Off 22 K.M. Ferozepur Road, Lahore.
Registered officeNishat House, 53 - A, Lawrence Road, Lahore.Tel: 042-36360154, 042-111 113 333 Fax: 042-36367414
Shares RegistrarTHK Associates (Private) Limited
Head Office, KarachiPlot No. 32-C Jami Commercial Street No. 2, DHA Phase VII,Karachi 75500.Tel: 021-111 000 322Fax: 021-35310191
Mills
Spinning units, Yarn Dyeing& Power plantNishatabad, Faisalabad.
Spinning units & Power plant20 K.M. Sheikhupura FaisalabadRoad, Feroze Watwan.
Spinning units & Power plantPlot No. 172-180 & 188-197,M-3 Industrial City, Sahianwala, FIEDMC, 2 K.M. Jhumra Chiniot Road, Chak Jhumra, Faisalabad.
Weaving units & Power plant12 K.M. Faisalabad Road, Sheikhupura.
Weaving units, Dyeing & Finishing unit, Processing unit, Stitching units and Power plants5 K.M. Nishat Avenue Off 22 K.M. Ferozepur Road, Lahore.
Branch Office, LahoreSiddique Trade Centre, Office No. PL-29, PL Floor, 72 Main Boulevard Gulberg II, Lahore.Tel: 042-35781682
Head Office7, Main Gulberg, Lahore.Tel: 042-35716351-59, 042-111 332 200Fax: 042-35716349-50E-mail: [email protected] Website: www.nishatmillsltd.com
Liaison Office1st Floor, Karachi Chambers, Hasrat Mohani Road, Karachi. Tel: 021-32414721-23Fax: 021-32412936
Annual Report 2021 03

DIRECTORS’ PROFILE
Mian Umer Mansha received his Bachelors degree from Babson College, Boston, USA. He has been serving on the Board of Directors of various listed companies for more than 26 years.
He also serves on the Board of AdamjeeInsurance Company Limited, MCB Bank Limited, Adamjee Life Assurance Company Limited, Nishat Dairy (Private) Limited,Nishat Hotels and Properties Limited,Nishat (Raiwind) Hotels and Properties Limited, Nishat Developers(Private) Limited, Nishat Sutas Dairy Limited, HyundaiNishat Motor (Private) Limited, NishatAgriculture Farming (Private) Limited, Nishat Agrotech Farms (Private) Limited andNational Textile Foundation.
Mian Hassan Mansha has been serving on the Board of various listed companies for several years. He also serves on the Board of Nishat Power Limited, Security GeneralInsurance Company Limited, Lalpir Power Limited, Pakgen Power Limited, Nishat Hotels and Properties Limited, Nishat (Aziz Avenue) Hotels and Properties Limited, Nishat (Raiwind) Hotels and Properties Limited, Nishat Dairy (Private) Limited, PakistanAviators and Aviation (Private) Limited,Nishat Real Estate DevelopmentCompany (Private) Limited, NishatAgriculture Farming (Private) Limited and Hyundai Nishat Motor (Private) Limited.
Syed Zahid Hussain is a seasoned professional inPakistan’s corporate world. He possesses multi-faceted talents and has attainedexemplaryaccomplishments. He has in-depthknowledge of a wide range of subjects and has extensivelydiversified experience and exposure in senior positions. He hasearned B.Sc, LLB and MA in InternationalRelations. He has a vast experience of working as Chairman / Chief Executive / Director of various state owned enterprises and listed companies. He has also served as the High Commissioner / Ambassador ofPakistan in Kenya, with accredited assignments of Ambassadorship in Tanzania, Uganda, Rwanda, Krundse, Ethiopia and Eritrea. He is a fellow member of the Institute ofManagement, England, InternationalBiographical, Center, the USA and theInstitute of Marketing Management, Karachi.
Mr. Farid Noor Ali Fazal is a Bachelor ofCommerce, Bachelor of Laws and Bachelor of Management. He has more than 48 years’experience of marketing. He worked on various positions in Middle East and USA. He is associated with cement industry in one form or the other and was the acting chairman of All Pakistan Cement ManufacturersAssociation in 2002. He also serves on theBoard of D. G. Khan Cement Company Limited and Nishat Paper ProductsCompany Limited.
Mian Umer ManshaChief Executive Officer
Mian Hassan ManshaChairman
Syed Zahid HussainNon-Executive Director
Mr. Farid Noor Ali FazalNon-Executive Director
Nishat Mills Limited04
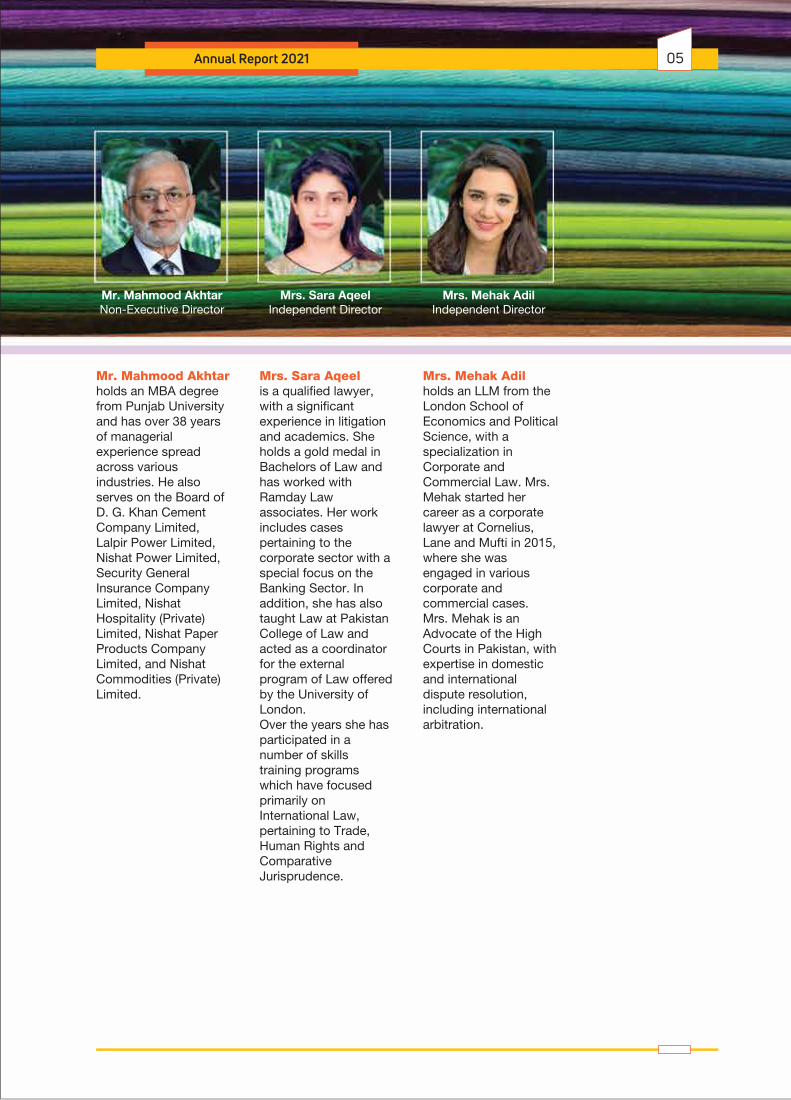
Mr. Mahmood Akhtar holds an MBA degree from Punjab Universityand has over 38 years of managerial experience spread across various industries. He also serves on the Board ofD. G. Khan Cement Company Limited, Lalpir Power Limited,Nishat Power Limited, Security GeneralInsurance Company Limited, NishatHospitality (Private) Limited, Nishat Paper Products Company Limited, and Nishat Commodities (Private) Limited.
Mrs. Sara Aqeel is a qualified lawyer, with a significant experience in litigation and academics. She holds a gold medal inBachelors of Law and has worked withRamday Law associates. Her work includes casespertaining to thecorporate sector with a special focus on theBanking Sector. In addition, she has also taught Law at Pakistan College of Law and acted as a coordinator for the externalprogram of Law offered by the University ofLondon. Over the years she has participated in a number of skills training programswhich have focused primarily onInternational Law, pertaining to Trade, Human Rights and ComparativeJurisprudence.
Mrs. Mehak Adil holds an LLM from theLondon School ofEconomics and Political Science, with a specialization in Corporate andCommercial Law. Mrs. Mehak started hercareer as a corporate lawyer at Cornelius,Lane and Mufti in 2015, where she wasengaged in various corporate andcommercial cases. Mrs. Mehak is anAdvocate of the High Courts in Pakistan, with expertise in domestic and internationaldispute resolution, including international arbitration.
Mr. Mahmood AkhtarNon-Executive Director
Mrs. Sara AqeelIndependent Director
Mrs. Mehak AdilIndependent Director
Annual Report 2021 05
VISION STATEMENT: To be and remain industry lead by safeguarding stakeholders’ interest, serving community and playing a meaningful role in the economy of Pakistan.
MISSION STATEMENT: To increase financial returns by pursuing sustainable business, producing the best quality products and providing excellent customer services while adopting best practices.
VISION, MISSION & CORE VALUES
Value Slogan
CORE VALUES:
Connotation
Nishat is open to innovation & creativity at organization level, systems level and individual level.
Be Open to Newness
Novelty
Nishat operates through lawful means and fulfils its legal, moral and ethical responsibilities.
Be HonestIntegrity
Nishat ensures best use of environmental resources by adopting benchmark process and bringing continuous improvement in the same.
Be Sensitive to Environment
Sustainability
Nishat encourages culture of mutual respect, support and develops congenial environment for people at workplace.
Be EmpathicHumbleness
Nishat believes in 'participative decision making' and assures that everyone should take responsibility for all decisions at all levels.
Be ResponsibleAccountability
Nishat trusts its employees the most and believes in attaining sustainable competitive advantage through its Human Capital.
Trust the PeopleTrust
Nishat Mills Limited06
I am pleased to present you the annual report of Nishat Mills Limited (the “Company”) for the year ended 30 June 2021. I congratulate all shareholders and other stakeholders about the exceptional financial performance of the Company during the year. The Board of Directors (the “Board”) expects the Company will maintain this spectacular growth trajectory in the coming years considering bright future prospects of textile sector.
The Company has a seven-member Board which comprises of individuals with diverse and multi-generational background having core competencies, knowledge, skills and experience relevant to the business of the Company. The Company follows the best practices relating to corporate governance and complies with all the relevant requirements of Companies Act, 2017 and the Listed Companies (Code of Corporate Governance) Regulations, 2019 (the “Code”) with respect to composition, meetings and procedures of the Board of Directors (the “Board”) and its Committees. During the year, Mrs. Sara Aqeel obtained Certificate of Directors Education from Pakistan Institute of Corporate Governance in accordance with the requirements of the Code.
The Board has developed a mechanism for annual evaluation of Board’s own performance, Members of the Board and its Committees in compliance with the provisions of Listed Companies (Code of Corporate Governance) Regulations, 2019. The performance evaluation mechanism ensures that all statutory and legal requirements are fulfilled with regard to procedures, meetings and oversight role of the Board. The Board carried out annual evaluation of Board’s own performance, Members of the Board and its Committees on 28 April 2021. The performance of the Board, its Members and Committees was satisfactory.
During the financial year 2020-21, the Board successfully achieved targets and objectives set for the growth of the Company by performing the following functions:
• Performed effective and robust oversight.• Reviewed and approved overall corporate strategy, annual business plan, key financial performance
indicators and other budgetary targets.• Ensured the quality and appropriateness of financial reporting and the transparency of disclosures in
annual and quarterly financial statements.• Carried out risk assessment, especially, of regulatory and legal requirements, market trends, cotton
supply and price, energy availability and cost, foreign exchange fluctuations, interest rate and liquidity risks.
• Reviewed effectiveness of internal control system.• Performed the due diligence of investments and evaluated returns.• Reviewed and approved the financing / borrowing facilities.• Ensured timely dissemination of price sensitive and inside information to relevant regulatory
authorities.
Mian Hassan ManshaChairman
Lahore20 September 2021
CHAIRMAN’S REVIEW REPORT
Annual Report 2021 07

Directors’Report
FINANCIAL REVIEW
Financial Performance
Profit after tax of the Company increased exponentially byRs. 2,416.186 million (68.91%) in the current financial year as compared to the corresponding last year. The Company achieved such unprecedented growth in profitability despite significant increase in raw material cost and adverse impact of coronavirus pandemic.
Topline of the Company grew to Rs. 71,431.010 million which is historically the highest ever revenue. Its main reason was remarkable increase in local sales by Rs. 8,229.101 million on account of both quantity and rate variances. Export sales also increased by Rs. 1,018.229 million mainly due to quantity variance. Duty drawback incentive on export sales also contributed to increase in revenue by Rs. 388.220 million in the current year as compared to the corresponding last year. The Company also achieved 10% growth in garments and home
2021 2020Rupees (000) Rupees (000)
Financial highlights
Revenue 71,431,010 60,904,096Gross profit 9,317,855 7,276,126EBITDA 11,137,991 8,719,892Depreciation 2,838,310 2,738,196Finance cost 1,229,179 1,502,412Dividend Income 2,722,637 2,044,302Pre-tax profit 7,070,502 4,479,284After tax profit 5,922,470 3,506,284
Directors of Nishat Mills
Limited (“the Company”)
are pleased to present
the annual report of the
Company for the year
ended 30 June 2021
along with the financial
statements and auditors’
report thereon.
Nishat Mills Limited08

Annual Report 2021 09
textile exports in terms of US Dollars in the current year as compared to the corresponding last year which made it eligible to avail the remaining 50% duty drawback incentive available on achievement of 10% growth in exports as stipulated in “Duty Drawback on Taxes Order 2018-21”.
Last five years’ review of gross profit shows that it has increased steadily over the period. It increased by 2,041.729 million (28.06%) from Rs. 7,276.126 million in the last corresponding year to Rs. 9,317.855 million in the current year. The Company achieved this unprecedented increase due to better cost management, otherwise raw material cost had increased significantly during the financial year under review.
EBITDA of the Company impressively increased by Rs. 2,418.099 million (27.73%) in the current financial year as compared to the corresponding last year. This shows a strong liquidity, as a result of exceptional profits which has enabled the Company to easily finance its working capital needs.
Once again, well-diversified portfolio of long-term equity investments contributed fairly in the
profitability of the Company. Dividend income increased by 33.18% from Rs. 2,044.302 million to Rs. 2,722.637 million.
Finance cost of the Company decreased by 18.19% from Rs. 1,502.412 million to Rs. 1,229.179 million in the current year as compared to the corresponding last year. The main reasons for decrease in finance cost was reduction in average borrowing cost of the Company and increased cash inflows.
Fixed Capital Expenditure
Acquisition of innovative technologies and continuous BMR is pivot to the long-term investment strategy of the Company in order to meet present and future demands of the customers. The Company invested Rs. 7,615.598 million into new projects as compared to the last year when we expended Rs. 5,132.005 million.
Working Capital Management
As a result of remarkable profitability, cash flow position of the Company has further improved in this year. Current and quick ratios have increased from 1.36 to 1.39 and 0.59 to 0.76 respectivley.
80,000,000
60,000,000
40,000,000
20,000,000
10,000,000
-
2016-17
Revenue
Years
Rup
ees
(000
)
2017-18 2018-19 2020-212019-20
10,000,0009,000,0008,000,0007,000,0006,000,0005,000,0004,000,0003,000,0002,000,0001,000,000
-2016-17
Gross Profit
Years
Rup
ees
(000
)
2017-18 2018-19 2020-212019-20
12,000,000
10,000,000
8,000,000
6,000,000
4,000,000
2,000,000
-2016-17
EBITDA
Years
Rup
ees
(000
)
2017-18 2018-19 2020-212019-20
4,000,000
3,000,000
2,000,000
1,000,000
-
2016-17
Dividend Income
Years
Rup
ees
(000
)
2017-18 2018-19 2020-212019-20
1,800,0001,600,0001,400,0001,200,0001,000,000
800,000600,000400,000200,000
-2016-17
Finance Cost
Years
Rup
ees
(000
)
2017-18 2018-19 2020-212019-20
8,000,000
6,000,000
4,000,000
2,000,000
-2016-17
Fixed Capital Expenditure
Years
Rup
ees
(000
)
2017-18 2018-19 2020-212019-20

Nishat Mills Limited10
Earnings per share
Earnings per share (EPS) of the Company increased from Rs. 9.97 in the corresponding last year to Rs. 16.84 in the current year which is a remarkable increase of Rs. 6.87 (68.91%). This unprecedented growth in earnings is reflective of management’s commitment to enhance shareholders’ wealth.
Appropriations
The Board of Directors of the Company has recommended 40% cash dividend (2020: 40%) and transferring of Rupees 4,516 million (2020: Rupees 2,101 million) to general reserve.
SEGMENT ANALYSIS
Spinning
Raw cotton prices increased consistently during the financial year 2020-21 due to shortage of local cotton, ban on imports from India and increase in the rates of imported cotton mainly as a result of buying of US cotton by China under a trade deal with US.
The management successfully mitigated the risk of hike in cotton prices by procuring major portion of its required cotton stocks by the end of October 2020.
Apart from adverse impact of Covid-19 pandemic on demand of textile products, cotton prices continuously and disproportionately increased as compared to yarn prices during the first half of the financial year 2020-21 which caused severe business challenge for Spinning Division. However, ban on cotton yarn imports from India and sizeable orders received by local fabric manufacturers due to health conditions in neighboring countries impacted by Covid-19 pandemic, subsequently, resulted in rapid hike in local yarn prices. Yarn prices in international market also followed the local market trends, but impact of expensive cotton on yarn prices in local market was more pervasive as compared to international yarn market. Therefore, during the second half of financial year, yarn prices in local market increased exceptionally and in export market improved reasonably.
1.40
1.35
1.30
1.25
1.20
1.15
2016-17
Current Ratio
Years
Rat
io
2017-18 2018-19 2020-212019-20
0.80
0.60
0.40
0.20
-
2016-17
Quick Ratio
Years
Rat
io
2017-18 2018-19 2020-212019-20
20.00
15.00
10.00
5.00
-
2016-17
Earnings per Share
Years
Rup
ees
per
Sha
re
2017-18 2018-19 2020-212019-20
Nishat Group (“the Group”) is one of the largest and leading business houses in Pakistan. It operates in 12 sectors of national economy. The Group has 2 textile companies: Nishat Mills Limited and Nishat Linen (Private) Limited. Nishat Mills Limited is the parent company while Nishat Linen (Private) Limited is its wholly owned subsidiary. The principal objects of the Subsidiary are to operate retail outlets for sale of textile and other products and to sell the textile products by processing the textile goods in own and outside manufacturing facilities.
Financial performance of both of these textile companies was exceptional during the year. Consolidated Earnings per Share (EPS) recorded an exponential growth of Rs. 10.34 (104.02%) from Rs. 9.94 in the corresponding last year to Rs. 20.28 in the current year. The review of last five years indicates that consolidated EPS was the highest during financial year 2021.
25.00
20.00
15.00
10.00
5.00
-
2016-17
Consolidated Earnings per Share of Nishat Mills Limited and Nishat Linen (Private) Limited
Years
Ru
pe
es
pe
r S
ha
re
2017-18 2018-19 2020-212019-20

Annual Report 2021 11
Weaving
During the financial year 2020-21, Weaving Division could not perform to its potential due to multiple waves of coronavirus in Europe where its main customer base is located. It severely affected retail sector; therefore, fashion business remained slow throughout the year. However, technical fabric business, particularly abrasives, showed positive trend due to shortage of fabric in the supply chain and increasing demand. Similarly, sale of workwear cloth also increased because of increase in demand soon after softening of lockdown restrictions world over.
A new weaving unit comprising 130 wider width Airjet looms will be commissioned into production in October, 2021 which will enable us to produce a wide range of greige cloth and fulfill increased demand of home textile sector.
In future, key part of our strategy is to increase our share in export of high value products. The Division expects a growth in profitability due to market driven exchange rate and rise in greige cloth prices during the next year.
Dyeing
Dyeing Division faced unprecedented difficulties due to imposition of coronavirus restrictions all over the world in order to reduce spread of disease. Since the people have to work and stay at home, demand for branded fashion apparel decreased significantly. But Dyeing Division performed well and sustained under these unparalleled circumstances despite decrease in sales of processing cloth by 21.87% in current financial year as compared to the corresponding last financial year.
Vaccination process, which was rolled out in the world at the end of the second quarter of the current financial year, has started showing positive results. Lots of Covid-19 restrictions have been lifted in U.S. and Europe. Due to significant improvement in Covid-19 situation, brands and retailers in U.S. and Europe are anticipating substantial growth in demand of apparel in Spring / Summer seasons of financial year 2021-22. This is the reason that almost all of our customers have increased their order quantities for these seasons as compared to previous year.
40,000
30,000
20,000
10,000
-2016-17
Yarn Sales Quantity
Years
Kg
s (0
00)
2017-18 2018-19 2020-212019-20
500
400
300
200
100
-2016-17
Yarn Sales Rate
Years
Rup
ees
Per
Kg
2017-18 2018-19 2020-212019-20
90,000
85,000
80,000
75,000
70,0002016-17
Grey Cloth Sales Quantity
Years
Met
ers
(000
)
2017-18 2018-19 2020-212019-20
20,000,000
15,000,000
10,000,000
5,000,000
-2016-17
Grey Cloth Sales Value
Years
Rup
ees
(000
)
2017-18 2018-19 2020-212019-20
200
150
100
50
-2016-17
Grey Cloth Sales Rate
Years
Rup
ees
per
met
er
2017-18 2018-19 2020-212019-20
14,000,000
12,000,000
10,000,000
8,000,000
6,000,000
4,000,000
2,000,000
-2016-17
Yarn Sales Value
Years
Rup
ees
(000
)
2017-18 2018-19 2020-212019-20
Nishat Mills Limited12
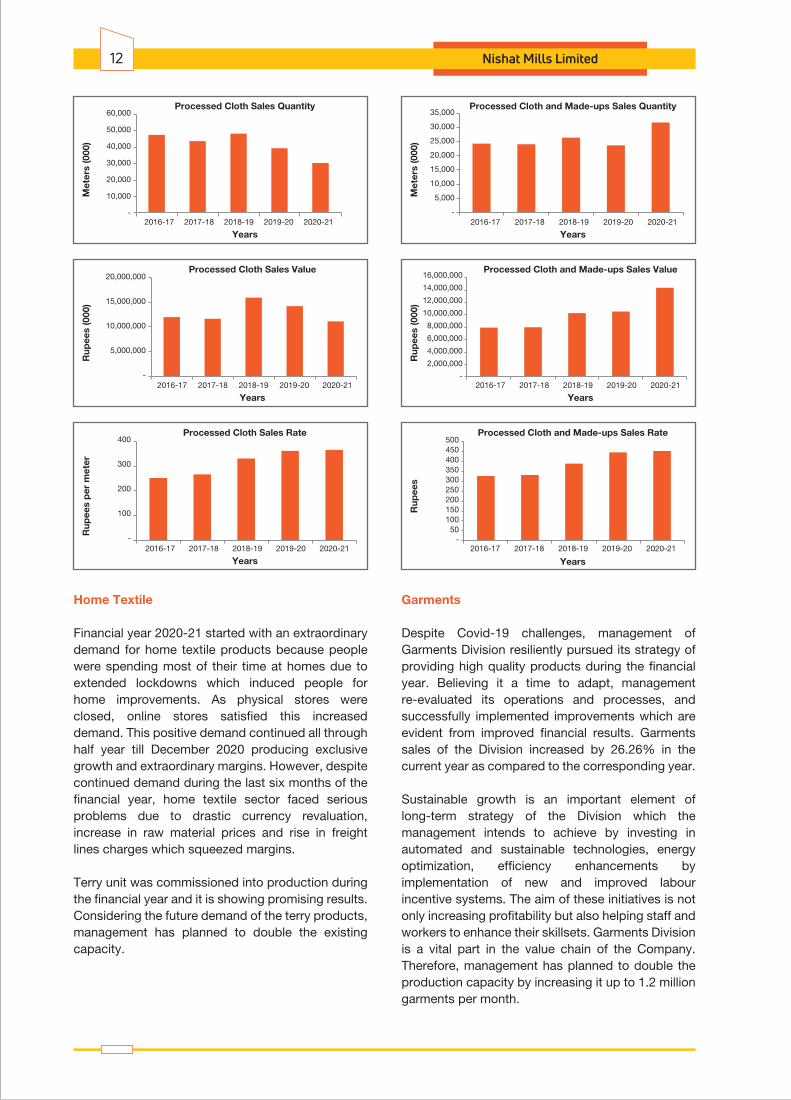
Home Textile
Financial year 2020-21 started with an extraordinary demand for home textile products because people were spending most of their time at homes due to extended lockdowns which induced people for home improvements. As physical stores were closed, online stores satisfied this increased demand. This positive demand continued all through half year till December 2020 producing exclusive growth and extraordinary margins. However, despite continued demand during the last six months of the financial year, home textile sector faced serious problems due to drastic currency revaluation, increase in raw material prices and rise in freight lines charges which squeezed margins.
Terry unit was commissioned into production during the financial year and it is showing promising results. Considering the future demand of the terry products, management has planned to double the existing capacity.
Garments
Despite Covid-19 challenges, management of Garments Division resiliently pursued its strategy of providing high quality products during the financial year. Believing it a time to adapt, management re-evaluated its operations and processes, and successfully implemented improvements which are evident from improved financial results. Garments sales of the Division increased by 26.26% in the current year as compared to the corresponding year.
Sustainable growth is an important element of long-term strategy of the Division which the management intends to achieve by investing in automated and sustainable technologies, energy optimization, efficiency enhancements by implementation of new and improved labour incentive systems. The aim of these initiatives is not only increasing profitability but also helping staff and workers to enhance their skillsets. Garments Division is a vital part in the value chain of the Company. Therefore, management has planned to double the production capacity by increasing it up to 1.2 million garments per month.
60,000
50,000
40,000
30,000
20,000
10,000
-2016-17
Processed Cloth Sales Quantity
Years
Met
ers
(000
)
2017-18 2018-19 2019-20 2020-21
20,000,000
15,000,000
10,000,000
5,000,000
-2016-17
Processed Cloth Sales Value
Years
Rup
ees
(000
)
2017-18 2018-19 2019-20 2020-21
400
300
200
100
-2016-17
Processed Cloth Sales Rate
Years
Rup
ees
per
met
er
2017-18 2018-19 2019-20 2020-21
35,000
30,000
25,000
20,000
15,000
10,000
5,000
-2016-17
Processed Cloth and Made-ups Sales Quantity
Years
Met
ers
(000
)
2017-18 2018-19 2019-20 2020-21
16,000,000
14,000,000
12,000,000
10,000,000
8,000,000
6,000,000
4,000,000
2,000,000
-2016-17
Processed Cloth and Made-ups Sales Value
Years
Rup
ees
(000
)
2017-18 2018-19 2019-20 2020-21
50045040035030025020015010050
-2016-17
Processed Cloth and Made-ups Sales Rate
Years
Rup
ees
2017-18 2018-19 2020-212019-20

Annual Report 2021 13
Power Generation
The Company is committed to invest in diversified and sustainable energy projects such as solar power. Existing solar power generation capacity is 3.54 MW. Installation of further 3.20 MW solar power plant at Spinning Division, Feroze Watwan is underway. Management has also finalized the plan for acquisition of 3.53 MW solar power plant for Weaving Division, Bhikki. Another 900 KWh solar power plant will be installed on the roof top of new factory building of Garments Division, Lahore in order to enhance existing solar power capacity of the Division to 2.10 MW.
As energy requirements of Garments Division are expected to grow due to anticipated increase in production, a plan is in process to acquire a 2.5 MW gas engine with waste heat recovery boiler and air compressor.
RISKS AND OPPORTUNITIES
Nishat Mills Limited takes risks and creates opportunities in the normal course of business. Taking risk is important to remain competitive and
maintain sustainable success. Our risk and opportunity management encompass an effective framework to conduct business in a well-controlled environment where risks are mitigated and opportunities are availed. Each risk and opportunity are properly weighted and considered before making any choice. Decisions are formulated only if opportunities outweigh risks.
Following is the summary of risks and strategies to mitigate those risks:
STRATEGIC RISKS
We are operating in a competitive environment where innovation, quality and cost matters. This risk is mitigated through continuous research & development and persistent introduction of new technologies under BMR. Strategic risk is considered as the most crucial of all the risks. Head of all business divisions meet at regular intervals to form an integrated approach towards tackling risks present both at the international and national level.
BUSINESS RISKS
The Company faces a number of following business risks:
Cotton Supply and Price
The supply and prices of cotton is subject to the act of nature and demand dynamics of local and international cotton markets. There is always a risk of non-availability of cotton and upward shift in the cotton prices in local and international markets. The Company mitigates this risk by the procurement of the cotton in bulk at the start of the harvesting season.
Export Demand and Price
The exports are major part of our revenue. We face the risk of pandemics, competition and decline in demand of our products in international markets. We minimize this risk by building strong relations with customers, broadening our customer base, developing innovative products without compromising on quality and providing timely deliveries to customers.
Energy Availability and Cost
The rising cost and un-availability of energy i.e. electricity and gas shortage is a major threat to manufacturing industry. This risk, if remains
10,000
8,000
6,000
4,000
2,000
-2016-17
Garments Sales Quantity
Years
Gar
men
ts (0
00)
2017-18 2018-19 2020-212019-20
9,000,0008,000,0007,000,0006,000,0005,000,0004,000,0003,000,0002,000,0001,000,000
-2016-17
Garments Sales Value
Years
Rup
ees
(000
)
2017-18 2018-19 2020-212019-20
1,200
1,000
800
600
400
200
-2016-17
Garments Sales Rate
Years
Rup
ees
per
gar
men
t
2017-18 2018-19 2020-212019-20

unmitigated, can render us misfit to compete in the international markets. The Company has mitigated the risk of rising energy cost by opting for diversified fuels such as coal, furnace oil, bio-mass, diesel along with solar energy. The measures to conserve energy have also been taken at all manufacturing facilities of the Company. Likewise, risk of non-availability of the energy has been minimized by installing power plants for generating electricity at all locations of the Company along with securing electricity connections from WAPDA.
FINANCIAL RISKS
The Board of Directors of the Company is responsible to formulate the financial risk management policies which are implemented by the Finance Department of the Company. The Company faces the following financial risks:
Currency risk
The Company is exposed to currency risk arising from various currency exposures, primarily with respect to United States Dollar (USD), Arab Emirates Dirham (AED), Euro and Japanese Yen (JPY). The Company’s foreign exchange risk exposure is restricted to the bank balances and the amounts receivable / payable from / to the foreign entities.
Interest rate risk
The Company’s interest rate risk arises from long term financing, short term borrowings, loans and advances to subsidiary companies and bank balances in saving accounts. Financial instruments at fixed rate expose the Company to fair value interest rate risk.
Credit risk
The Company’s credit exposure to credit risk and impairment losses relates to its trade debts. This risk is mitigated by the fact that majority of our customers have a strong financial standing and we have a long-standing business relationship with all our customers. We do not expect nonperformance by our customers; hence, the credit risk is minimal.
Liquidity risk
It is at the minimum due to the availability of enough funds through committed credit facilities from the Banks and Financial institutions.
Capital risk
When managing capital, it is our objective to safeguard the Company’s ability to continue as a going concern in order to provide returns for shareholders and benefits to other stakeholders and to maintain an optimal capital structure to reduce the cost of capital. The Company maintains low leveraged capital structure. We monitor the capital structure on the basis of the gearing ratio.
OPPORTUNITIES
As the leading textile company of the country, the Company is in a position to avail and exploit a number of opportunities. Following is the summary of some exciting opportunities:
• Regionally diversified customer base across the world provides a sustainable growth to export sales;
• Vibrant local and international subsidiary companies create demand for our products;
• Vertical integration makes it possible to exploit operational synergies;
• Abundant supply of cotton in the country;
• High population growth of the country is a source of suitable manpower and a stimulus in creating the demand for textile products.
TEXTILE INDUSTRY OVERVIEW
Financial year 2020-21 was very tough for the textile sector because coronavirus outbreak severely affected the world economy. The year was marred by repeated lockdowns and restrictions because second and third waves of pandemic hit the world. As vaccination process has already been started, hopefully, coronavirus restrictions will be lifted soon in the export market.
Textile industry remained under tremendous pressure because of skyrocketing raw material cost. We have been facing an unprecedented rise in the price of cotton and synthetic fiber since the beginning of the second quarter of current financial year. While the total requirement of Pakistan textile industry is 15 million bales per year, country could produce only half of the required quantity as indicated by following chart:
Nishat Mills Limited14

SUBSIDIARY COMPANIES
The Company has also annexed consolidated financial statements along with separate financial statements in accordance with the requirements of International Financial Reporting Standards and Companies Act, 2017. Following is a brief description of all subsidiary companies of Nishat Mills Limited:
1. Nishat Power Limited
The Company owns and controls 51.01% shares of this subsidiary. The subsidiary is listed on Pakistan Stock Exchange Limited. The principle business of the subsidiary is to build, operate and maintain a fuel powered station having gross capacity of 200MW in Jamber Kalan, Tehsil Pattoki, District Kasur, Punjab, Pakistan. The subsidiary commenced its commercial production on 09 June 2010.
2. Nishat Linen (Private) Limited
This is a wholly owned subsidiary of the Company. The principle objects of the Subsidiary are to operate retail outlets for sale of textile and other products and to sell the textile products by processing the textile goods in own and outside manufacturing facilities. The subsidiary started its operations in July 2011 and is presently operating 109 retail outlets including e-stores in Pakistan.
3. Nishat Hospitality (Private) Limited This is a wholly owned subsidiary of the
Company. Subsidiary’s object is to run a chain of hotels across the country. Currently it is operating a four star hotel in Lahore on international standards under the name of “The Nishat St. James Hotel”. The subsidiary started its operations on 01 March 2014.
Source: Pakistan Bureau of Statistics.
4. Nishat Commodities (Private) Limited
This is a wholly owned subsidiary of the Company. The principle object of the subsidiary is to carry on the business of trading of commodities including fuels, coals, building material in any form or shape manufactured, semi-manufactured, raw materials and their import and sale in Pakistan. The subsidiary started its operations in March 2016.
5. Lalpir Solar Power (Private) Limited
Lalpir Solar Power (Private) Limited is a Private Limited Company incorporated in Pakistan on 09 November 2015. It is a wholly owned subsidiary of Nishat Power Limited which is a subsidiary of Nishat Mills Limited. The subsidiary did not started its commercial operations because it did not get Power Acquisition Request and Consent from Central Power Purchasing Agency. Therefore, voluntary winding up of the company under the Companies Act, 2017 is being considered.
6. Nishat Linen Trading LLC
Nishat Linen Trading LLC is a Limited Liability Company incorporated in Dubai, UAE. It is a wholly owned subsidiary of the Company. The subsidiary is principally engaged in trading of textile, blankets, towels, linens, ready-made garments, garments accessories and leather products along with ancillaries thereto through retail outlets and warehouses across United Arab Emirates. The subsidiary started its commercial operations in May 2011 and is presently operating 14 retail outlets in UAE.
7. Nishat International FZE
This is also a wholly owned subsidiary of Nishat Mills Limited. It was incorporated as a Free Zone Establishment Limited Liability Company in Jebel Ali Free Zone, Dubai according to the laws of United Arab Emirates (UAE). It has been
Annual Report 2021 15
Year Hectare % Change Bales % Change (kgs / Hec) % Change
(000) (000)
2016-17 2,489 - 10,671 - 729 -
2017-18 2,700 8.5 11,946 11.9 753 3.3
2018-19 2,373 (12.1) 9,861 (17.5) 707 (6.1)
2019-20 2,517 6.1 9,148 (7.2) 618 (12.6)
2020-21 (P) 2,079 (17.4) 7,064 (22.8) 578 (6.5)
registered in the FZE register on February 07, 2013. The principal activity of the Subsidiary Company is trading in textile products such as blankets, towels & linens, ready-made garments, garments accessories and leather products such as shoes, handbags and all such ancillaries thereto.
8. China Guangzhou Nishat Global Co., Ltd.
China Guangzhou Nishat Global Co., Ltd. is incorporated in Yuexiu District, Guangzhou, China, as Foreign Invested Commercial Enterprises “FICE”, in accordance with the Law of Peoples Republic of China on Foreign-Capital enterprises and other relevant Laws and Regulations. China Guangzhou Nishat Global Co., Ltd. is a wholly owned subsidiary of Nishat International FZE which is a wholly owned subsidiary of Nishat Mills Limited. The principal business of the Subsidiary is wholesale, commission agency (excluding auction), import and export of textile goods and women fashion accessories. The subsidiary started its commercial operations in January 2014.
9. Nishat USA Inc.
The subsidiary is a corporation service company incorporated in the State of New York. It is a wholly owned subsidiary of the Company and was acquired by the Company on 01 October 2008. The corporation is a liaison office of the Company’s marketing department providing access, information and other services relating to US Market.
CORPORATE SOCIAL RESPONSIBILITY
The Company spends a lot of resources and undertakes efforts for the welfare of society. Following is the brief snapshot of corporate social responsibility:
Occupational Safety and Health
The Company is committed to provide a safe and healthy workplace by complying with the relevant safety and health regulations. Therefore, management has taken appropriate steps during Covid-19 pandemic to protect health of its employees and restrict the spread of virus. The Company has taken a number of steps such as arrangement of awareness sessions about the virus, installation of sanitizing walk through gates,
Nishat Mills Limited16

checking of temperature at all entry points, provision of hand sanitizers, implementation of emergency response plan and installation of face scans attendance system in order to avoid physical contact with objects. Management has continuously encouraged its employees to get themselves and their families vaccinated. The Company also arranged vaccination facilities at its factory locations. We have also prepared a database where the information about vaccinated people is stores along with “Immunization Certificate for Covid-19” number issued by Ministry of National Health Services Regulations and Coordination.
Community Welfare Schemes
General public welfare is one of the top priorities of the Company; therefore, management has taken a number of initiatives to help society. We supported CARE Foundation, an NGO, to establish a school of 1,000 children at Bhikki in 2011. CARE foundation works to educate and empower underprivileged children and has established such schools across Pakistan. The Company is also pivotal in providing trained manpower to the nation by arranging training of thousands of young people each year.
We arrange medical camps for malaria, typhoid, dengue, eye sight and polio vaccination for workers, their families and general public living near manufacturing facilities. The Company has also established dispensaries under the supervision of qualified doctors at its mills which are equipped with ambulances.
Equal Opportunity Employer
Diversity and inclusion are ingrained in our values and culture. Therefore, we provide equal opportunity for employment and career progression to women, disabled and minorities. There is fair representation of women at the Board of Directors of the Company. All Board committees are headed by female directors. Women also occupies senior management positions who actively formulate and control strategic direction of the Company. Since recognition of women rights is a social matter, we celebrate women’s achievements in the social, economic, cultural, and political spheres on 8th March of every year.
Annual Report 2021 17

CORPORATE GOVERNANCE
Best Corporate Practices
Directors are committed to good corporate governance and comply with the requirements of the Listed Companies (Code of Corporate Governance) Regulations, 2019.
The statement of compliance with the Listed Companies (Code of Corporate Governance) Regulations, 2019 is enclosed.
Board Committees:
Audit Committee
The audit committee is performing its duties in line with its terms of reference as determined by the Board of Directors. During the year under review, four Audit Committee Meetings were held, attendance position was as under:-
No. ofSr.# Name of Director Meetings Attended
1 Mrs. Mehak Adil (Member/Chairperson) 32 Syed Zahid Hussain (Member) 43 Mr. Mahmood Akhtar (Member) 4
Human Resource & Remuneration (HR&R) Committee
The Human Resource & Remuneration Committee is performing its duties in line with its terms of reference as determined by the Board of Directors. During the year under review, two Human Resource & Remuneration Committee Meetings were held, attendance position was as under:-
No. ofSr.# Name of Director Meetings Attended 1 Mian Umer Mansha (Member) 22 Mrs. Sara Aqeel (Member/Chairperson) 23 Mr. Mahmood Akhtar (Member) 2
Environment Protection
The Company’s approach towards environment includes both preservation of natural resources and procurement of alternative technologies to ensure environmental sustainability. Every year the Company arranges plantation of thousands of trees at its manufacturing facilities and nearby localities with the objective to curtail pollution. Waste water is treated in Effluent Water Treatment Plants before discharge. The Company is investing heavily in solar energy. At present, 3.54 MW of electricity is generated from solar power plants and projects of 7.63 MW are under acquisition and installation phase.
Waste Recycling
Waste recycling is another way to protect environment and discharge our responsibility towards society. The Company has installed water treatment plants, cotton recycling plants and oil recycling machines at different sites to recycle the water, waste cloth and oil for maximum saving of natural resources.
Energy Conservation
The Company is committed to reduce use of fossil fuels for electricity generation and decrease in emission of CO2 in environment. We have installed LED lights, powerless ventilators, solar power plants, natural lights (solatubes), solar water heating systems and waste heat recovery units at our production facilities.
Consumer Protection Measures
The Company observes international safety standards during manufacturing and shipment of its goods to the customers. We installed metal detectors for prevention and detection of any harmful substance in the products.
The Company meets the Oeko Tex Standards 100 which is an independent testing and certification system for textile raw materials, intermediate and end products at all stages of production. The Company has also acquired C-TPAT Certification (Customs-Trade Partnership against Terrorism) for all of its production facilities. C-TPAT is a voluntary supply chain security program aimed at improving the security of private companies’ supply chains with respect to terrorism. Further, the Company has obtained SA-8000, WRAP and SEDEX certifications.
Nishat Mills Limited18
Meetings of the Board of Directors
During the year under review, five meetings of the Board of Directors of the Company were held in Pakistan and the attendance position was as follows:
No. ofSr.# Name of Director Meetings Attended 1 Mian Umer Mansha 5 (Chief Executive Officer) 2 Mian Hassan Mansha (Chairman) 5 3 Syed Zahid Hussain 5 4 Mr. Mahmood Akhtar 5 5 Mr. Farid Noor Ali Fazal 5 6 Mrs. Sara Aqeel 5 7 Mrs. Mehak Adil 4
Directors’ Statement
Following is the Directors’ statement on Corporate and Financial Reporting framework:
1. The financial statements, prepared by the management of the Company, present fairly its state of affairs, the result of its operations, cash flows and changes in equity.
2. Proper books of account of the Company have been maintained.
3. Appropriate accounting policies have been consistently applied in preparation of the financial statements and accounting estimates are based on reasonable and prudent judgment.
4. International Financial Reporting Standards, as applicable in Pakistan, have been followed in preparation of financial statements.
5. The system of internal control is sound in design and has been effectively implemented and monitored.
6. There are no significant doubts upon the Company’s ability to continue as a going concern.
7. There has been no material departure from the best practices of corporate governance.
8. Value of investments in respect of retirement benefits fund: Provident Fund: 30th June, 2021: Rs. 4,407.174 million Un-audited, (2020: Rs. 3,765.537 million Audited).
Transactions with related parties
The Company has fully complied with best practices on Transfer Pricing as contained in Companies (Related Party Transactions and Maintenance of Related Records) Regulations, 2018 while executing all transactions with related parties. The detail of arrangements for transactions, as approved by the Board during the year, other than transactions in the ordinary course of business is as follows:
1. Further investment of up to Rs. 2 billion as loan and advances in Nishat Linen (Private) Limited, a wholly owned subsidiary, in accordance with our investment policy to earn higher interest rate as compared to other investment opportunities available to the Company.
2. The issuance of corporate guarantees up to Rs. 2,250 million to the lenders of Nishat Sutas Dairy (Private) Limited, an associated company, to ensure smooth availability of the credit facilities to the associated from Banks / financial institutions.
3. Sale of land to Nishat Sutas Dairy (Private) Limited, an associated company, to earn capital gain.
Auditors
Riaz Ahmad & Company, Chartered Accountants, current auditors will retire on the conclusion of Annual General Meeting of the Company. Being eligible, they have offered themselves for reappointment for the year ending 30 June 2022. As suggested by Audit Committee, the Board of Directors has recommended reappointment of Riaz Ahmad & Company, Chartered Accountants for approval of shareholders in forth coming Annual General Meeting.
SUBSEQUENT EVENTS
The Board of Directors of the Company has proposed a cash dividend of Rupees 4 per share in their meeting held on 20 September 2021.
Annual Report 2021 19
Internal Audit function duly established by the Board. Audit Committee reviews the internal control system on quarterly basis in accordance with the term of its reference.
DIRECTORS’ REMUNERATION
The Board of Directors has approved Directors’ Remuneration Policy. The main features of the policy are as follows:
• The Company shall not pay remuneration to its non-executive directors including independent directors except for meeting fee for attending meetings of Board and its Committees.
• The Company will reimburse or incur expenses of travelling and accommodation of Directors in relation to attending meetings of the Board and its Committees.
• The Directors’ Remuneration Policy will be reviewed and approved by the Board of Directors from time to time.
PATTERN OF SHAREHOLDING
A statement of the pattern of shareholding as at June 30, 2021, which is required to be disclosed under the reporting framework, is annexed to this report.
ACKNOWLEDGEMENT
Directors are pleased and thankful to the employees for their continued dedication of efforts for the Company.
No other material changes and commitments affecting the financial position of the Company occurred between 30 June 2021 and 20 September 2021.
FUTURE PROSPECTS
Major challenge affecting the Company in the financial year 2021-22 is continuously rising prices of cotton which will have negative impact on the dynamics of international textile markets and, resultantly, on profitability of the Company. On the other hand, appreciation of USD against PKR determined by interaction of the market forces would have a positive effect on the earnings.
Expansion projects initiated by the Company under Temporary Economic Refinance Facility (TERF) are underway and expected to be completed as per schedule. The new open-end yarn unit having production capacity of 700 bags per day is expected to be commissioned in the second quarter of the financial year 2021-22. Other major project of 130 wider width looms is expected to start its commercial production in October 2021.
ADEQUACY OF INTERNAL FINANCIAL CONTROLS
The Company has established an effective and efficient system of internal and financial controls to safeguard the assets of the Company, prevent and detect fraud and ensure compliance with all statutory and legal requirements. The internal control structure is regularly reviewed and monitored by the
Mian Umer Mansha Farid Noor Ali FazalChief Executive Officer Director
Lahore20 September 2021
For and on behalf of the Board of Directors.
Nishat Mills Limited20

Rupees in thousand 2021 2020 2019 2018 2017 2016
Summarized Statement of Financial Position
Non-Current Assets
Property, Plant and Equipment 35,926,594 31,292,722 28,968,219 28,180,049 27,767,699 24,715,095
Long Term Investments 48,620,695 37,979,074 34,930,333 44,757,279 60,008,322 55,399,080
Other Non-Current Assets 1,104,867 865,591 849,580 756,020 756,107 634,214
Current Assets
Stores, Spares and Loose Tools 2,605,602 2,256,569 3,102,988 1,714,031 2,106,878 1,269,509
Stock in Trade 17,972,691 20,753,543 17,008,459 12,243,652 12,722,712 9,933,736
Short Term Investments - - - 2,581,520 2,535,973 2,065,217
Other Current Assets 24,881,925 17,513,415 15,685,813 12,503,482 11,632,584 12,582,368
Total Assets 131,112,374 110,660,914 100,545,392 102,736,033 117,530,275 106,599,219
Shareholders' Equity 85,747,779 71,427,860 66,615,270 75,713,145 88,762,796 82,155,155
Non-Current liabilities
Long Term Financing 11,577,915 9,222,781 5,259,927 5,190,839 5,245,629 4,629,456
Deferred Liabilities 1,055,992 302,672 215,440 571,833 783,292 261,567
Current Liabilities
Short Term Borrowings 18,718,262 19,329,768 17,982,262 12,507,590 14,697,393 10,475,657
Current Portion of Non-Current Liabilities 4,206,123 703,032 1,784,470 2,144,900 2,093,024 1,980,768
Other Current Liabilities 9,806,303 9,674,801 8,688,023 6,607,726 5,948,141 7,096,616
Total Equity and Liabilities 131,112,374 110,660,914 100,545,392 102,736,033 117,530,275 106,599,219
Statement of Profit or Loss
Revenue 71,431,010 60,904,096 63,499,029 53,729,124 49,247,657 47,999,179
Gross Profit 9,317,855 7,276,126 7,656,601 5,550,446 5,379,838 6,239,391
EBITDA 11,137,991 8,719,892 11,211,441 8,395,775 8,233,100 8,937,616
Other Income 3,750,188 3,032,390 5,158,380 4,102,639 4,259,666 4,079,054
Profit Before Tax 7,070,502 4,479,284 6,897,048 4,957,127 5,020,342 5,725,038
Profit After Tax 5,922,470 3,506,284 5,859,048 4,097,127 4,262,342 4,923,038
Cash Flows
Operating Activities 5,722,435 1,560,005 905,102 2,153,808 (1,381,006) 4,704,482
Cash Flow from Investing Activities (3,378,461) (4,828,502) (3,957,796) 1,851,315 (3,890,837) 735,980
Cash Flow from Financing Activities 2,800,130 2,820,113 3,524,492 (3,944,241) 3,200,620 (3,377,513)
Changes in Cash & Cash Equivalents 5,144,104 (448,384) 471,798 60,882 (2,071,223) 2,062,949
Cash and Cash Equivalents at Year End 5,272,345 128,241 576,625 104,827 43,945 2,115,168
Ratios
Profitability Ratios
Gross profit % 13.04 11.95 12.06 10.33 10.92 13.00
EBITDA to sales % 15.59 14.32 17.66 15.63 16.72 18.62
Pre tax Profit % 9.90 7.35 10.86 9.23 10.19 11.93
After tax Profit % 8.29 5.76 9.23 7.63 8.65 10.26
Return on Equity % 7.54 5.08 8.23 4.98 4.99 6.22
Return on Capital Employed % 9.26 7.82 11.16 6.75 6.53 8.01
Operating Leverage Ratio 2.24 7.38 2.42 0.03 (4.75) (1.66)
FINANCIAL HIGHLIGHTS
Annual Report 2021 21

2021 2020 2019 2018 2017 2016
Liquidity Ratios
Current Ratio 1.39 1.36 1.26 1.37 1.28 1.32
Quick Ratio 0.76 0.59 0.55 0.71 0.62 0.75
Cash to Current Liabilities Times 0.16 0.00 0.02 0.00 0.00 0.11
Cash Flows from Operations to Sales Times 0.08 0.03 0.01 0.04 (0.03) 0.10
Activity / Turnover Ratios
Inventory Turnover Ratio Times 3.21 2.84 3.82 3.86 3.87 4.12
No. of Days in Inventory Days 113.71 128.87 95.55 94.56 94.32 88.83
Debtors Turnover Ratio Times 13.19 13.54 14.53 17.12 21.89 18.22
No. of Days in Receivables Days 27.67 27.03 25.12 21.32 16.67 20.09
Creditors Turnover Ratio Times 3.75 3.49 4.39 4.46 4.30 4.65
No. of Days in Creditors Days 97.33 104.87 83.14 81.84 84.88 78.71
Operating Cycle Days 44.05 51.03 37.53 34.04 26.11 30.21
Total Assets Turnover Ratio Times 0.54 0.55 0.63 0.52 0.42 0.45
Fixed Assets turnover Ratio Times 1.99 1.95 2.19 1.91 1.77 1.94
Investment / Market Ratios
Earnings Per Share Rs. 16.84 9.97 16.66 11.65 12.12 14.00
Price Earning Ratio Times 5.54 7.82 5.60 12.10 13.09 7.71
Dividend Yield Ratio % 4.29 5.13 4.29 3.37 3.15 4.63
Dividend Payout Ratio % 23.75 40.12 24.01 40.77 41.24 35.71
Dividend Cover Ratio Times 4.21 2.49 4.17 2.45 2.42 2.80
Dividend Per Share Rs. 4.00 4.00 4.00 4.75 5.00 5.00
Break-up Value Rs. 243.88 203.15 189.46 215.34 252.45 233.66
Proposed Dividend % 40.00 40.00 40.00 47.50 50 50
Market value per share
Closing Rs. 93.30 78.01 93.34 140.92 158.68 107.90
High Rs. 124.89 119.75 153.73 171.56 185.63 86.83
Low Rs. 79.73 53.00 91.69 130.03 110.65 122.05
Capital Structure Ratios
Financial Leverage Ratio % 38.83 40.96 37.57 26.21 24.83 20.80
Weighted Average Cost of Debt % 3.93 5.54 7.44 4.75 4.68 5.82
Debt to Equity Ratio % 13.50 12.91 7.90 6.86 5.91 5.64
Interest Cover Ratio Times 6.75 3.98 5.13 5.99 6.49 6.47
Gearing Ratio % 27.97 29.06 27.31 20.77 19.89 17.22
Production machines
No. of Spindles 263,832 262,035 247,968 238,032 230,736 227,640
No. of Looms 790 790 790 794 795 805
No. of Thermosole Dyeing Machines 5 5 5 5 5 6
No. of Rotary Printing Machines 4 4 4 4 4 4
No. of Digital Printing Machines 10 10 9 8 7 2
No. of Stitching Machines 4,489 3,592 4,149 4,239 3,757 3,400
Nishat Mills Limited22
STATEMENT OF COMPLIANCEwith Listed Companies (Code of Corporate Governance) Regulations, 2019
Non-Executive Directors Mian Hassan Mansha Syed Zahid Hussain Mr. Mahmood Akhtar Mr. Farid Noor Ali Fazal
Executive Director Mian Umer Mansha (Chief Executive Officer)
Category Names
Independent Directors Mrs. Sara Aqeel Mrs. Mehak Adil
Name of company : Nishat Mills LimitedYear ended : June 30, 2021
The company has complied with the requirements of the Regulations in the following manner:
1. The total number of directors are Seven (7) as per the following:
a. Male: 5 b. Female: 2
2. The composition of board is as follows:
3. The Directors have confirmed that none of them is serving as a director on more than seven listed companies, including this company;
4. The company has prepared a code of conduct and has ensured that appropriate steps have been taken to disseminate it throughout the company along with its supporting policies and procedures;
5. The Board has developed a vision / mission statement, overall corporate strategy and significant policies of the company. The Board has ensured that complete record of particulars of the significant policies along with their date of approval or updating is maintained by the company;
6. All the powers of the Board have been duly exercised and decisions on relevant matters have been taken by the Board / shareholders as empowered by the relevant provisions of the Act and these Regulations;
7. The meetings of the Board were presided over by the Chairman and, in his absence, by a director elected by the Board for this purpose. The Board has complied with the requirements of Act and the Regulations with respect to frequency, recording and circulating minutes of meeting of the Board;
8. The Board have a formal policy and transparent procedures for remuneration of directors in accordance with the Act and these Regulations;
9. The Board has arranged Director’s Training Program for the following:
Names of Directors Mr. Mahmood Akhtar Mr. Farid Noor Ali Fazal Mrs. Sara Aqeel
Following Directors meet the exemption criteria of minimum of 14 years of education and 15 years of experience on the Boards of listed companies, hence are exempt from Director’s Training Program.
Names of Directors Mian Umer Mansha Syed Zahid Hussain
Annual Report 2021 23
10. The Board has approved appointment of chief financial officer, company secretary and head of internal audit, including their remuneration and terms and conditions of employment and complied with relevant requirements of the Regulations;
11. Chief financial officer and chief executive officer duly endorsed the financial statements before approval of the Board;
12. The Board has formed committees comprising of members given below:
a) Audit Committee:
Names Designation held
Mrs. Mehak Adil Chairperson Syed Zahid Hussain Member Mr. Mahmood Akhtar Member
b) HR and Remuneration Committee:
Names Designation held
Mrs. Sara Aqeel Chairperson Mian Umer Mansha Member Mr. Mahmood Akhtar Member
13. The terms of reference of the aforesaid committees have been formed, documented and advised to the committee for compliance.
14. The frequency of meetings (quarterly / half yearly / yearly) of the committee were as per following:
a) Audit Committee:
Four quarterly meetings were held during the financial year ended June 30, 2021.
b) HR and Remuneration Committee:
Two meetings of HR and Remuneration Committee were held during the financial year ended June 30, 2021.
15. The Board has set up an effective internal audit function who are considered suitably qualified and experienced for the purpose and are conversant with the policies and procedures of the company;
16. The statutory auditors of the company have confirmed that they have been given a satisfactory rating under the Quality Control Review program of the Institute of Chartered Accountants of Pakistan and registered with Audit Oversight Board of Pakistan, that they and all their partners are in compliance with International Federation of Accountants (IFAC) guidelines on code of ethics as adopted by the Institute of Chartered Accountants of Pakistan and that they and the partners of the firm involved in the audit are not a close relative (spouse, parent, dependent and non-dependent children) of the chief executive officer, chief financial officer, head of internal audit, company secretary or director of the company;
17. The statutory auditors or the persons associated with them have not been appointed to provide other services except in accordance with the Act, these Regulations or any other regulatory requirement and the auditors have confirmed that they have observed IFAC guidelines in this regard;
18. We confirm that all requirements of regulations 3, 6, 7, 8, 27, 32, 33 and 36 of the Regulations have been complied with; and
19. Explanation for non-compliance with requirements, other than regulations 3, 6, 7, 8, 27, 32, 33 and 36 are below:
Nishat Mills Limited24

Annual Report 2021 25
Sr. No.
Nomination CommitteeThe Board may constitute a separate committee, designated as the nomination committee, of such number and class of directors, as it may deem appropriate in its circumstances.
Currently, the Board has not constituted a separate nomination committee and the functions are being performed by the human resource and remuneration committee.
1 29
Risk Management CommitteeThe Board may constitute the risk management committee, of such number and class of directors, as it may deem appropriate in its circumstances, to carry out a review of effectiveness of risk management procedures and present a report to the Board.
Currently, the Board has not constituted a risk management committee and a senior officer of the Company performs the requisite functions and apprise the Board accordingly.
2 30
RegulationNumber
Requirement Explanation of Non-Compliance
Disclosure of significant policies on website The Company may post key elements of its significant policies, brief synopsis of terms of reference of the Board’s committees on its website and key elements of the directors’ remuneration policy.
Although these are well circulated among the relevant employees and directors, the Board shall consider posting such policies and synopsis on its website in near future.
3 35
Directors’ TrainingIt is encouraged that by June 30, 2021 at least 75% of the directors on the Board have acquired the prescribed certification under any director training program offered by institutions, local or foreign, that meet the criteria specified by the Commission and approved by it.
5 out of 7 directors of the Company have either acquired Directors’ Training Program certification or are exempt from Director’s Training Program. The Company has planned to arrange Directors’ Training Program certification for remaining two directors before June 30, 2022.
4 19(1)
Directors’ TrainingCompanies are encouraged to arrange training for at least one female executive every year under the Directors’ Training Program from year July 2020.
The Company has planned to arrange Directors’ Training Program certification for female executives over the next few years.
5 19(3)
Responsibilities of the Board and its membersThe Board is responsible for adoption of corporate governance practices by the company.
Non-mandatory provisions of the Regulations are partially complied. The company is deliberating on full compliance with all the provisions of the Regulations.
6 10(1)
20. The two elected independent directors have requisite competencies, skills, knowledge and experience to discharge and execute their duties competently, as per applicable laws and regulations. As they fulfill the necessary requirements as per applicable laws and regulations, hence, appointment of a third independent director is not warranted.
Mian Hassan ManshaChairman
Lahore20 September 2021

Nishat Mills Limited26
INDEPENDENT AUDITOR’S REVIEW REPORTTo the members of Nishat Mills Limited
Review Report on the Statement of Compliance contained in Listed Companies (Code of Corporate Governance) Regulations, 2019
We have reviewed the enclosed Statement of Compliance with the Listed Companies (Code of Corporate Governance) Regulations, 2019 (the Regulations) prepared by the Board of Directors of Nishat Mills Limited (the Company) for the year ended 30 June 2021 in accordance with the requirements of regulation 36 of the Regulations.
The responsibility for compliance with the Regulations is that of the Board of Directors of the Company. Our responsibility is to review whether the Statement of Compliance reflects the status of the Company’s compliance with the provisions of the Regulations and report if it does not and to highlight any non-compliance with the requirements of the Regulations. A review is limited primarily to inquiries of the Company’s personnel and review of various documents prepared by the Company to comply with the Regulations.
As a part of our audit of the financial statements we are required to obtain an understanding of the accounting and internal control systems sufficient to plan the audit and develop an effective audit approach. We are not required to consider whether the Board of Directors’ statement on internal control covers all risks and controls or to form an opinion on the effectiveness of such internal controls, the Company’s corporate governance procedures and risks.
The Regulations require the Company to place before the Audit Committee, and upon recommendation of the Audit Committee, place before the Board of Directors for their review and approval, its related party transactions. We are only required and have ensured compliance of this requirement to the extent of the approval of the related party transactions by the Board of Directors upon recommendation of the Audit Committee.
Based on our review, nothing has come to our attention which causes us to believe that the Statement of Compliance does not appropriately reflect the Company's compliance, in all material respects, with the requirements contained in the Regulations as applicable to the Company for the year ended 30 June 2021.
RIAZ AHMAD & COMPANYChartered Accountants
LahoreSeptember 24, 2021

Notice is hereby given that Annual General Meeting of the Members of Nishat Mills Limited (the “Company”) will be held on October 28, 2021 (Thursday) at 03:30 p.m. at Emporium Mall, the Nishat Hotel, Trade and Finance Centre Block, Near Expo Centre, Abdul Haq Road, Johar Town, Lahore, to transact the following business:
1. To receive, consider and adopt the Audited Un-consolidated and Consolidated Financial Statements of the Company for the year ended June 30, 2021 together with the Chairman Review, Directors’ and Auditors’ reports thereon.
2. To approve Final Cash Dividend @ 40% [i.e. Rs. 4/- (Rupees Four Only) Per Ordinary Share] as recommended by the Board of Directors.
3. To appoint statutory Auditors for the year ending June 30, 2022 and fix their remuneration.
By order of the Board
Lahore (KHALID MAHMOOD CHOHAN)September 20, 2021 COMPANY SECRETARY
NOTES:
BOOK CLOSURE NOTICE:
The Ordinary Shares Transfer Books of the Company will remain closed from 21-10-2021 to 28-10-2021 (both days inclusive) for entitlement of 40% Final Cash Dividend [i.e. Rs.4/- (Rupees Four Only) Per Ordinary Share] for the year ended June 30, 2021 and attending and voting at Annual General Meeting. Physical transfers / CDS Transactions IDs received in order in all respects up to 1:00 p.m. on 20-10-2021 at the office of Share Registrar, THK Associates (Private) Limited, Karachi Office: 32-C, Jami Commercial Street No. 2, DHA Phase VII, Karachi, Lahore Office: Siddique Trade Centre, Office No. PL-29, PL Floor, 72 Main Boulevard, Gulberg II, Lahore, shall be considered in time for entitlement of above said 40% Final Cash Dividend and attending of AGM.
PROXIES:
A member eligible to attend and vote at this meeting may appoint another member his / her proxy to attend and vote instead of him / her. Proxies in order to be effective must reach the Company’s registered office not less than 48 hours before the time for holding the meeting. Proxies of the Members through CDC shall be accompanied with attested copies of their CNIC. In case of corporate entity, the Board’s Resolution / power of attorney with specimen signature shall be furnished along with proxy form to the Company. The shareholders through CDC are requested to bring original CNIC, Account Number and Participant Account Number to produce at the time of attending the meeting.
Shareholders are requested to immediately notify the change in address, if any.
Members who have deposited their shares into Central Depository Company of Pakistan Limited (“CDC”) will further have to follow the under mentioned guidelines as laid down by the Securities and Exchange Commission of Pakistan.
A. For Attending the Meeting
a. In case of Individuals, the account holder and / or sub-account holder and their registration details are uploaded as per the CDC Regulations, shall authenticate his / her identity by showing his / her original CNIC or, original Passport at the time of attending the Meeting.
b. In case of corporate entity, the Board’s resolution / power of attorney with specimen signature of the nominee shall be produced (unless it has been provided earlier) at the time of the Meeting.
NOTICE OF ANNUAL GENERAL MEETING
Annual Report 2021 27

Nishat Mills Limited28
B. For Appointing Proxies
a. In case of individuals, the account holder and / or sub-account holder and their registration details are uploaded as per the CDC Regulations, shall submit the proxy form as per above requirements.
b. The proxy form shall be witnessed by two persons, whose names, addresses and CNIC numbers shall be mentioned on the form.
c. Attested copies of the CNIC or the passport of beneficial owners and the proxy shall be furnished with the proxy form.
d. The proxy shall produce his original CNIC or original passport at the time of the Meeting.
e. In case of corporate entity, the Board’s resolution / power of attorney with specimen signature shall be furnished (unless it has been provided earlier) along with proxy form to the Company.
DEDUCTION OF WITHHOLDING TAX ON DIVIDEND:
Pursuant to the provisions of the Finance Act, 2020 the rates of deduction of income tax from dividend payments under the Income Tax Ordinance, 2001 have been revised as follows:
- Filer 15% - Non-Filer 30%
All shareholders are advised to check their status on Active Taxpayers List (ATL) available on FBR Website and may, if required, take necessary actions for inclusion of their name in ATL to avail the lower rate of tax deduction.
DEDUCTION OF WITHHOLDING TAX ON DIVIDEND IN CASE OF JOINT ACCOUNT HOLDERS:
All shareholders who hold shares jointly are requested to provide following information regarding shareholding proportions of Principal Shareholder and Joint-holder(s) in respect of shares held by them to our Share Registrar THK Associates (Private) Limited, Karachi Office: 32-C, Jami Commercial Street No. 2, DHA Phase VII, Karachi, Lahore Office: Siddique Trade Centre, Office No. PL-29, PL Floor, 72 Main Boulevard, Gulberg II, Lahore, latest by October 20, 2021, otherwise each joint holder shall be assumed to have an equal number of shares.
Signature of Primary Shareholder_______________________________
EXEMPTION OF WITHHOLDING TAX:
Withholding tax exemption from dividend income, shall only be allowed if copy of valid tax exemption certificate is made available to our Share Registrar Office, Share Registrar THK Associates (Private) Limited, Karachi Office: 32-C, Jami Commercial Street No. 2, DHA Phase VII, Karachi, Lahore Office: Siddique Trade Centre, Office No.PL-29, PL Floor, 72 Main Boulevard, Gulberg II, Lahore, up to October 20, 2021.
SUBMISSION OF COPY OF CNIC (MANDATORY):
Individuals including all joint holders holding physical share certificates are requested to submit a copy of their valid CNIC if not already provided to the Company or our Share Registrar, THK Associates (Private) Limited, Karachi Office: 32-C, Jami Commercial Street No. 2, DHA Phase VII, Karachi, Lahore Office: Siddique Trade Centre, Office No.PL-29, PL Floor, 72 Main Boulevard, Gulberg II, Lahore. The Shareholders while sending CNIC must quote their respective folio numbers.
Name of the Company Nishat Mills Limited
Folio No. / CDS A/C No.
No. of Shares Held
Principal Name & CNIC
Shareholder Shareholding Proportion (No. of Shares)
Joint Name & CNIC
Shareholder(s) Shareholding Proportion (No. of Shares)

Annual Report 2021 29
In case of non-receipt of the copy of a valid CNIC, the Company would be unable to comply with SRO 831(1)/2012 dated July 05, 2012 of SECP and would be constrained under SECP’s Order dated June 08, 2016 under Section 251(2) of the Companies Ordinance, 1984 to withhold the dispatch of dividend warrants to such shareholders.
ZAKAT DECLARATION (CZ-50):
Zakat will be deducted from the dividends at source under the Zakat & Usher Laws and will be deposited within the prescribed period with the relevant authority. Please submit your Zakat declarations under Zakat and Usher Ordinance, 1980 & Rule 4 of Zakat (Deduction & Refund) Rules, 1981 CZ-50 Form, in case you want to claim exemption, with your brokers or the Central Depository Company of Pakistan Limited (in case the shares are held in CDC-Sub Account or CDC Investor Account) or to our Share Registrar, THK Associates (Private) Limited, Karachi Office: 32-C, Jami Commercial Street No. 2, DHA Phase VII, Karachi, Lahore Office: Siddique Trade Centre, Office No. PL-29, PL Floor, 72 Main Boulevard, Gulberg II, Lahore. The Shareholders while sending the Zakat Declarations, as the case may be must quote company name and their respective folio numbers.
Shareholders should also notify our Share Registrar, THK Associates (Private) Limited regarding any change in their addresses.
MANDATORY PAYMENT OF CASH DIVIDEND THROUGH ELECTRONIC MODE:
The provisions of Section 242 of the Companies Act, 2017 require the listed companies that any dividend payable in cash shall only be paid through electronic mode directly into the bank account designated by the entitled shareholders. The shareholders who have not provided their bank account details so far are advised to provide their below electronic dividend mandate information to Company’s Share Registrar at the address given above and update their CDC accounts / Sub accounts as the case may be, enabling the Company to credit your future dividend promptly, if any.
Signature of Shareholder_______________________________
TRANSMISSION OF ANNUAL FINANCIAL STATEMENTS THROUGH EMAIL:
In pursuance of the directions given by the Securities and Exchange Commission of Pakistan (SECP) vide SRO 787 (I) / 2014 dated September 8, 2014, those shareholders who desire to receive Annual Financial Statements in future through email instead of receiving the same by Post are advised to give their formal consent along with their valid email address on a standard request form which is available at the Company’s website i.e. www.nishatmillsltd.com and send the said form duly signed by the shareholder along with copy of his / her CNIC to the Company’s Share Registrar THK Associates (Private) Limited. Please note that giving email address for receiving of Annual Financial Statements instead of receiving the same by post is optional, in case you do not wish to avail this facility please ignore this notice, Financial Statements will be sent in compact disk to the registered address of the shareholders.
Folio No. / Investor Account Number / CDCSub Account No.
Title of Account
IBAN Number
Bank Name
Branch
Branch Address
Mobile Number
Name of Network(if ported)
Email Address
Nishat Mills Limited30
CIRCULATION OF ANNUAL REPORTS THROUGH DIGITAL STORAGE:
Pursuant to the SECP’s notification SRO 470 (I) / 2016 dated 31st May, 2016 the Members of Nishat Mills Limited in EOGM held on 31st March 2017 had accorded their consent for transmission of annual reports including audited annual financial statements and other information contained therein of the Company through CD / DVD / USB instead of transmitting the same in hard copies. The shareholders who wish to receive hard copies of the aforesaid documents may send to the Company Secretary / Share registrar, the standard request form available on the Company’s website and the Company will provide the aforesaid documents to the shareholders on demand, free of cost, within one week of such demand.
UNCLAIMED DIVIDEND / SHARES:
Shareholders who could not collect their dividend / physical shares are advised to contact our Share Registrar to collect / enquire about their unclaimed dividend or shares, if any.
VIDEO CONFERENCE FACILITY:
In terms of the Companies Act, 2017, members residing in a city holding at least 10% of the total paid up share capital may demand the facility of video-link for participating in the annual general meeting. The request for video-link facility shall be received by the Share Registrar at their address at least 7 days prior to the date of the meeting on the Standard Form available on the website of the Company.
VIDEO LINK FACILITY FOR MEETING:
In light of COVID-19 situation, the Securities and Exchange Commission of Pakistan (“SECP”) has advised vide Circular No. 4 of 2021 dated 15 February, 2021 to provide participation of the members through electronic means. The members can attend the AGM via video link using smart phones / tablets. To attend the meeting through video link, members and their proxies are requested to register themselves by providing the following information along with valid copy of Computerized National Identity Card (both sides) / passport, attested copy of board resolution / power of attorney (in case of corporate shareholders) through email at [email protected] or [email protected] by October 23, 2021.
CONVERSION OF PHYSICAL SHARES INTO BOOK ENTRY FORM:
As per Section 72 of the Companies Act, 2017, all existing companies are required to convert their physical shares into book-entry form within a period not exceeding four years from the date of commencement of the Companies Act, 2017.
The Securities & Exchange Commission of Pakistan through its circular # CSD/ED/Misc./2016-639-640 dated March 26, 2021 has advised the listed companies to pursue their such members who still hold shares in physical form, to convert their shares into book-entry form.
We hereby request all members who are holding shares in physical form to convert their shares into book-entry form at the earliest. They are also suggested to contact the Central Depository Company of Pakistan Limited or any active member / stock broker of the Pakistan Stock Exchange to open an account in the Central Depository System and to facilitate conversion of physical shares into book-entry form. Members are informed that holding shares in book-entry form has several benefits including but not limited to secure and convenient custody of shares, conveniently tradeable and transferable, no risk of the loss, damage or theft, no stamp duty on transfer of shares in book-entry form and hassle free credit of bonus or right shares.
We once again strongly advise members of the Company, in their best interest, to convert their physical shares into book-entry form at earliest.
Name of Member /Proxyholder
Folio No. / CDCAccount No.
Cell No. /Whatsapp No.
Email IDCNIC No.
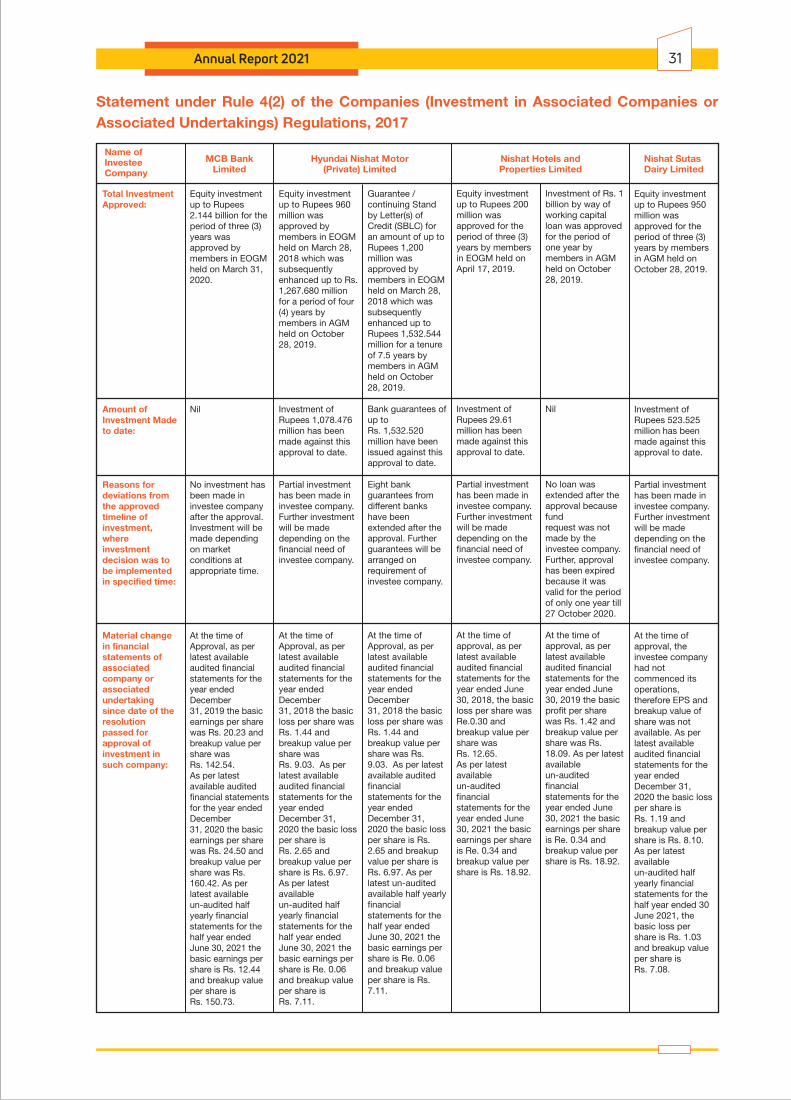
Statement under Rule 4(2) of the Companies (Investment in Associated Companies or Associated Undertakings) Regulations, 2017
Total Investment Approved:
Amount of Investment Made to date:
Reasons for deviations from the approved timeline of investment, where investment decision was to be implemented in specified time:
Material change in financial statements of associated company or associated undertaking since date of the resolution passed for approval of investment in such company:
Equity investmentup to Rupees 2.144 billion for the period of three (3) years was approved by members in EOGM held on March 31, 2020.
Nil
No investment has been made in investee company after the approval. Investment will be made depending on market conditions at appropriate time.
At the time ofApproval, as per latest availableaudited financialstatements for the year endedDecember31, 2019 the basic earnings per share was Rs. 20.23 andbreakup value per share was Rs. 142.54.As per latest available audited financial statements for the year endedDecember31, 2020 the basic earnings per share was Rs. 24.50 andbreakup value per share was Rs.160.42. As per latest available un-audited half yearly financial statements for thehalf year ended June 30, 2021 the basic earnings per share is Rs. 12.44 and breakup value per share is Rs. 150.73.
Equity investment up to Rupees 950 million was approved for the period of three (3) years by members in AGM held on October 28, 2019.
Investment of Rupees 523.525 million has been made against this approval to date.
Partial investment has been made in investee company. Further investment will be made depending on the financial need of investee company.
At the time of approval, the investee company had not commenced its operations, therefore EPS and breakup value of share was not available. As per latest available audited financial statements for the year ended December 31, 2020 the basic loss per share is Rs. 1.19 and breakup value per share is Rs. 8.10. As per latest available un-audited half yearly financial statements for the half year ended 30 June 2021, the basic loss per share is Rs. 1.03 and breakup value per share is Rs. 7.08.
Equity investment up to Rupees 960 million was approved by members in EOGM held on March 28, 2018 which was subsequently enhanced up to Rs. 1,267.680 million for a period of four (4) years by members in AGM held on October 28, 2019.
Investment of Rupees 1,078.476 million has been made against this approval to date.
Partial investment has been made in investee company. Further investment will be made depending on the financial need of investee company.
At the time ofApproval, as per latest availableaudited financialstatements for the year endedDecember31, 2018 the basic loss per share was Rs. 1.44 and breakup value per share was Rs. 9.03. As per latest available audited financial statements for the year ended December 31, 2020 the basic loss per share is Rs. 2.65 and breakup value per share is Rs. 6.97. As per latest available un-audited half yearly financial statements for the half year ended June 30, 2021 the basic earnings per share is Re. 0.06 and breakup value per share is Rs. 7.11.
Guarantee / continuing Stand by Letter(s) of Credit (SBLC) for an amount of up to Rupees 1,200 million was approved by members in EOGM held on March 28, 2018 which was subsequently enhanced up to Rupees 1,532.544 million for a tenure of 7.5 years by members in AGM held on October 28, 2019.
Bank guarantees of up to Rs. 1,532.520 million have been issued against this approval to date.
Eight bank guarantees from different banks have been extended after the approval. Further guarantees will be arranged on requirement of investee company.
At the time ofApproval, as per latest availableaudited financialstatements for the year endedDecember31, 2018 the basic loss per share was Rs. 1.44 and breakup value per share was Rs. 9.03. As per latest available audited financial statements for the year ended December 31, 2020 the basic loss per share is Rs. 2.65 and breakup value per share is Rs. 6.97. As per latest un-audited available half yearly financial statements for the half year ended June 30, 2021 the basic earnings per share is Re. 0.06 and breakup value per share is Rs. 7.11.
Equity investment up to Rupees 200 million was approved for the period of three (3) years by members in EOGM held on April 17, 2019.
Investment of Rupees 29.61 million has been made against this approval to date.
Partial investment has been made in investee company. Further investment will be made depending on the financial need of investee company.
At the time of approval, as per latest available audited financial statements for the year ended June 30, 2018, the basic loss per share was Re.0.30 and breakup value per share was Rs. 12.65.As per latest available un-audited financial statements for the year ended June 30, 2021 the basic earnings per share is Re. 0.34 and breakup value per share is Rs. 18.92.
Investment of Rs. 1 billion by way of working capital loan was approved for the period of one year by members in AGMheld on October 28, 2019.
Nil
No loan was extended after the approval because fund request was not made by the investee company. Further, approval has been expired because it was valid for the period of only one year till 27 October 2020.
At the time of approval, as per latest available audited financial statements for the year ended June 30, 2019 the basic profit per share was Rs. 1.42 and breakup value per share was Rs. 18.09. As per latest available un-audited financial statements for the year ended June 30, 2021 the basic earnings per share is Re. 0.34 and breakup value per share is Rs. 18.92.
Hyundai Nishat Motor(Private) Limited
Nishat Hotels andProperties Limited
Nishat Sutas Dairy Limited
MCB BankLimited
Name of InvesteeCompany
Annual Report 2021 31


Nishat Mills LimitedFinancial Statements of
for the year ended June 30, 2021

1.
Sr.No.
Key audit matters How the matters were addressed in our audit
INDEPENDENT AUDITOR’S REPORT
Inventory existence and valuation
Inventory as at 30 June 2021 amounted to Rupees 20,578.293 million, break up of which is as follows:
- Stores, spare parts and loose tools Rupees 2,605.602 million
- Stock-in-trade Rupees 17,972.691
million
Inventory is measured at the lower of cost
Our procedures over existence and valuation of inventory included, but were not limited to:
• To test the quantity of inventories at all locations, we assessed the corresponding inventory observation instructions and participated in inventory counts on sites. Based on samples, we performed test counts and compared the quantities counted by us with the results of the counts of the management.
To the members of Nishat Mills Limited
Report on the Audit of the Financial Statements
Opinion
We have audited the annexed financial statements of Nishat Mills Limited (the Company), which comprise the statement of financial position as at 30 June 2021, and the statement of profit or loss, the statement of comprehensive income, the statement of changes in equity, the statement of cash flows for the year then ended, and notes to the financial statements, including a summary of significant accounting policies and other explanatory information, and we state that we have obtained all the information and explanations which, to the best of our knowledge and belief, were necessary for the purposes of the audit.
In our opinion and to the best of our information and according to the explanations given to us, the statement of financial position, the statement of profit or loss, the statement of comprehensive income, the statement of changes in equity and the statement of cash flows together with the notes forming part thereof conform with the accounting and reporting standards as applicable in Pakistan and give the information required by the Companies Act, 2017 (XIX of 2017), in the manner so required and respectively give a true and fair view of the state of the Company's affairs as at 30 June 2021 and of the profit, other comprehensive income, the changes in equity and its cash flows for the year then ended.
Basis for Opinion
We conducted our audit in accordance with International Standards on Auditing (ISAs) as applicable in Pakistan. Our responsibilities under those standards are further described in the Auditor’s Responsibilities for the Audit of the Financial Statements section of our report. We are independent of the Company in accordance with the International Ethics Standards Board for Accountants’ Code of Ethics for Professional Accountants as adopted by the Institute of Chartered Accountants of Pakistan (the Code) and we have fulfilled our other ethical responsibilities in accordance with the Code. We believe that the audit evidence we have obtained is sufficient and appropriate to provide a basis for our opinion.
Key Audit Matters
Key audit matters are those matters that, in our professional judgment, were of most significance in our audit of the financial statements of the current period. These matters were addressed in the context of our audit of the financial statements as a whole, and in forming our opinion thereon, and we do not provide a separate opinion on these matters.
Following are the key audit matters:
Nishat Mills Limited34
and net realizable value.
We identified existence and valuation of inventory as a key audit matter due to its size, representing 15.70% of the total assets of the Company as at 30 June 2021, and the judgment involved in valuation.
For further information on inventory, refer to the following:
- Summary of significant accounting policies, Inventories note 2.17 to the financial statements.
- Stores, spares parts and loose tools note 18 and Stock-in-trade note 19 to the financial statements.
• For a sample of inventory items, re-performed the weighted average cost calculation and compared the weighted average cost appearing on valuation sheets.
• We tested that the ageing report used by management correctly aged inventory items by agreeing a sample of aged inventory items to the last recorded invoice.
• On a sample basis, we tested the net realizable value of inventory items to recent selling prices and re-performed the calculation of the inventory write down, if any.
• We assessed the percentage write down applied to older inventory with reference to historic inventory write downs and recoveries on slow moving inventory.
• In the context of our testing of the calculation, we analysed individual cost components and traced them back to the corresponding underlying documents. We furthermore challenged changes in unit costs.
• We also made enquires of management, including those outside of the finance function, and considered the results of our testing above to determine whether any specific write downs were required.
Investments in equity securities
Quoted investments:
The Company’s portfolio of quoted investments, except for investment in quoted subsidiary company, makes up 27.83% of total assets. Due to materiality of quoted investments in the context of the financial statements as a whole and the requirements of applicable accounting and reporting standards relating to classification, measurement and disclosures of investments in related parties, they are considered to be the area which had the greatest effect on our overall audit strategy and allocation of resources in planning and completing our audit.
Our procedures included, but were not limited to:
• We documented and assessed the processes and controls in place to record investment transactions and to value the portfolio.
• We agreed the valuation of all of quoted investments from prices quoted on Pakistan Stock Exchange Limited and redemption price in case of open-end mutual fund except for investment in subsidiary company measured at cost less impairment loss, if any, in accordance with the provisions of IAS 27 ‘Separate Financial Statements’.
• We agreed the holding of all quoted investments from the Account Balance Report of Central Depository Company of Pakistan Limited, Statement of Account, in case of open-end mutual fund and physical share certificates in hand.
• We verified the accuracy of management’s
Sr.No.
2.
Key audit matters How the matters were addressed in our audit
Annual Report 2021 35
Un-quoted investments:
Investments in unquoted equity securities except for investments in unquoted subsidiary companies are accounted for as financial assets at fair value through other comprehensive income and are subject to fair valuation at each reporting date. Investments in unquoted subsidiary companies are stated at cost less impairment loss, if any. The investments as at 30 June 2021 are valued by an independent professional valuer. With reference to the valuation, management estimated the fair value of the investments at Rupees 7,603.461 million at year end.
Investee companies are operating in Insurance, Packaging, Dairy, Hotel and Shopping Mall, Automobile and Energy sectors and therefore, fair values are highly dependent on their expansion plans and significant management judgements. Accordingly, the valuation of the investments was considered as one of the key audit matters.
The fair values were determined based on the present value technique. The valuations involved significant judgements and estimates from management, including future business growth driven by future expansion plans, future products selling prices and operating costs of the investee, discount rate, etc.
For further information, refer to the following:
- Summary of significant accounting policies, Investments note 2.10 to the financial statements.
- Long term investments note 15 to the
financial statements.
judgement used in classification of quoted investments in related parties.
Our procedures included, but were not limited to:
• We evaluated the independent professional valuer’s competence, capabilities and objectivity.
• We assessed the valuation methodology used by the independent professional valuer to estimate the fair value of the investments.
• We checked, on a sample basis, the accuracy and reasonableness of the input data provided by management to the independent professional valuer, to supporting evidence, such as approved budgets and considering the reasonableness of these budgets by comparing the budgets to the historical results and market data.
• We assessed the reasonableness of cash flows projection, challenging and performing audit procedures on management’s assumptions such as the future business growth driven by future expansion plan, future products selling prices and operating costs, discount rate by comparing the assumptions to historical results and published market and industry data and comparing the current year’s results with the prior year forecast and other relevant information. Our internal valuation expert has been engaged to assist the review on valuation methodology and discount rate. In addition, we had discussed with the management of the investee companies to understand the business and assessed if there was any inconsistency in the assumptions used in the cash flows projection.
• We agreed holding of all un-quoted investments from physical share certificates in hand.
• We performed sensitivity analysis in consideration of the potential impact of reasonably possible upside or downside changes in these key assumptions.
• We verified the accuracy of management calculation used for the impairment testing, in case of subsidiary companies carried at cost less impairment loss, if any.
Capital expenditures
The Company is investing significant amounts in its operations and there are a number of areas where management judgement impacts the carrying value of
Our procedures included, but were not limited to:
• We tested operating effectiveness of controls in place over the property, plant and equipment
Sr.No.
3.
Key audit matters How the matters were addressed in our audit
Nishat Mills Limited36
property, plant and equipment and its respective depreciation profile. These include among other the decision to capitalize or expense costs; and review of useful life of the assets including the impact of changes in the Company’s strategy.
We focused on this area since the amounts have a significant impact on the financial position of the Company and there is significant management judgment required that has significant impact on the reporting of the financial position for the Company. Therefore, considered as one of the key audit matters.
For further information, refer to the following:
- Summary of significant accounting policies, property, plant, equipment and deprecation note 2.6 to the financial statements.
- Property, plant and equipment note 13 to the financial statements.
cycle including the controls over whether costs incurred on activities is capital or operating in nature.
• We evaluated the appropriateness of capitalization policies and depreciation rates.
• We performed tests of details on costs capitalized.
• We verified the accuracy of management’s calculation used for the impairment testing.
Sr.No.
Key audit matters How the matters were addressed in our audit
Revenue recognition
The Company recognized net revenue of Rupees 71,431.010 million for the year ended 30 June 2021.
We identified recognition of revenue as a key audit matter because revenue is one of the key performance indicator of the Company and gives rise to an inherent risk that revenue could be subject to misstatement to meet expectations or targets.
For further information, refer to the following:
- Summary of significant accounting policies, Revenue recognition note 2.24 to the financial statements.
- Revenue note 27 to the financial statements.
Our procedures included, but were not limited to:
• We obtained an understanding of the process relating to recognition of revenue and testing the design, implementation and operating effectiveness of key internal controls over recording of revenue.
• We compared a sample of revenue transactions recorded during the year with sales orders, sales invoices, delivery documents and other relevant underlying documents.
• We compared a sample of revenue transactions recorded around the year-end with the sales orders, sales invoices, delivery documents and other relevant underlying documentation to assess if the related revenue was recorded in the appropriate accounting period.
• We assessed whether the accounting policies for revenue recognition complies with the requirements of IFRS 15 ‘Revenue from Contracts with Customers’.
• We also considered the appropriateness of disclosures in the financial statements.
4.
Annual Report 2021 37
Information Other than the Financial Statements and Auditor’s Report Thereon
Management is responsible for the other information. The other information comprises the information included in the annual report, but does not include the financial statements and our auditor’s report thereon.
Our opinion on the financial statements does not cover the other information and we do not express any form of assurance conclusion thereon.
In connection with our audit of the financial statements, our responsibility is to read the other information and, in doing so, consider whether the other information is materially inconsistent with the financial statements or our knowledge obtained in the audit or otherwise appears to be materially misstated. If, based on the work we have performed, we conclude that there is a material misstatement of this other information, we are required to report that fact. We have nothing to report in this regard.
Responsibilities of Management and Board of Directors for the Financial Statements
Management is responsible for the preparation and fair presentation of the financial statements in accordance with the accounting and reporting standards as applicable in Pakistan and the requirements of Companies Act, 2017 (XIX of 2017) and for such internal control as management determines is necessary to enable the preparation of financial statements that are free from material misstatement, whether due to fraud or error.
In preparing the financial statements, management is responsible for assessing the Company’s ability to continue as a going concern, disclosing, as applicable, matters related to going concern and using the going concern basis of accounting unless management either intends to liquidate the Company or to cease operations, or has no realistic alternative but to do so.
Board of directors are responsible for overseeing the Company’s financial reporting process.
Auditor’s Responsibilities for the Audit of the Financial Statements
Our objectives are to obtain reasonable assurance about whether the financial statements as a whole are free from material misstatement, whether due to fraud or error, and to issue an auditor’s report that includes our opinion. Reasonable assurance is a high level of assurance, but is not a guarantee that an audit conducted in accordance with ISAs as applicable in Pakistan will always detect a material misstatement when it exists. Misstatements can arise from fraud or error and are considered material if, individually or in the aggregate, they could reasonably be expected to influence the economic decisions of users taken on the basis of these financial statements.
As part of an audit in accordance with ISAs as applicable in Pakistan, we exercise professional judgment and maintain professional skepticism throughout the audit. We also:
• Identify and assess the risks of material misstatement of the financial statements, whether due to fraud or error, design and perform audit procedures responsive to those risks, and obtain audit evidence that is sufficient and appropriate to provide a basis for our opinion. The risk of not detecting a material misstatement resulting from fraud is higher than for one resulting from error, as fraud may involve collusion, forgery, intentional omissions, misrepresentations, or the override of internal control.
• Obtain an understanding of internal control relevant to the audit in order to design audit procedures that are appropriate in the circumstances, but not for the purpose of expressing an opinion on the effectiveness of the Company’s internal control.
• Evaluate the appropriateness of accounting policies used and the reasonableness of accounting estimates and related disclosures made by management.
• Conclude on the appropriateness of management’s use of the going concern basis of accounting and,
based on the audit evidence obtained, whether a material uncertainty exists related to events or conditions that may cast significant doubt on the Company’s ability to continue as a going concern. If we conclude that a material uncertainty exists, we are required to draw attention in our auditor’s report to the
Nishat Mills Limited38
Annual Report 2021 39
related disclosures in the financial statements or, if such disclosures are inadequate, to modify our opinion. Our conclusions are based on the audit evidence obtained up to the date of our auditor’s report. However, future events or conditions may cause the Company to cease to continue as a going concern.
• Evaluate the overall presentation, structure and content of the financial statements, including the disclosures, and whether the financial statements represent the underlying transactions and events in a manner that achieves fair presentation.
We communicate with the board of directors regarding, among other matters, the planned scope and timing of the audit and significant audit findings, including any significant deficiencies in internal control that we identify during our audit.
We also provide the board of directors with a statement that we have complied with relevant ethical requirements regarding independence, and to communicate with them all relationships and other matters that may reasonably be thought to bear on our independence, and where applicable, related safeguards.
From the matters communicated with the board of directors, we determine those matters that were of most significance in the audit of the financial statements of the current period and are therefore the key audit matters. We describe these matters in our auditor’s report unless law or regulation precludes public disclosure about the matter or when, in extremely rare circumstances, we determine that a matter should not be communicated in our report because the adverse consequences of doing so would reasonably be expected to outweigh the public interest benefits of such communication.
Report on Other Legal and Regulatory Requirements
Based on our audit, we further report that in our opinion:
a) proper books of account have been kept by the Company as required by the Companies Act, 2017 (XIX of 2017);
b) the statement of financial position, the statement of profit or loss, the statement of comprehensive income, the statement of changes in equity and the statement of cash flows together with the notes thereon have been drawn up in conformity with the Companies Act, 2017 (XIX of 2017) and are in agreement with the books of account and returns;
c) investments made, expenditure incurred and guarantees extended during the year were for the purpose of the Company’s business; and
d) zakat deductible at source under the Zakat and Ushr Ordinance, 1980 (XVIII of 1980), was deducted by the Company and deposited in the Central Zakat Fund established under section 7 of that Ordinance.
The engagement partner on the audit resulting in this independent auditor’s report is Syed Mustafa Ali.
RIAZ AHMAD & COMPANYChartered Accountants
LahoreDate: 24 September 2021
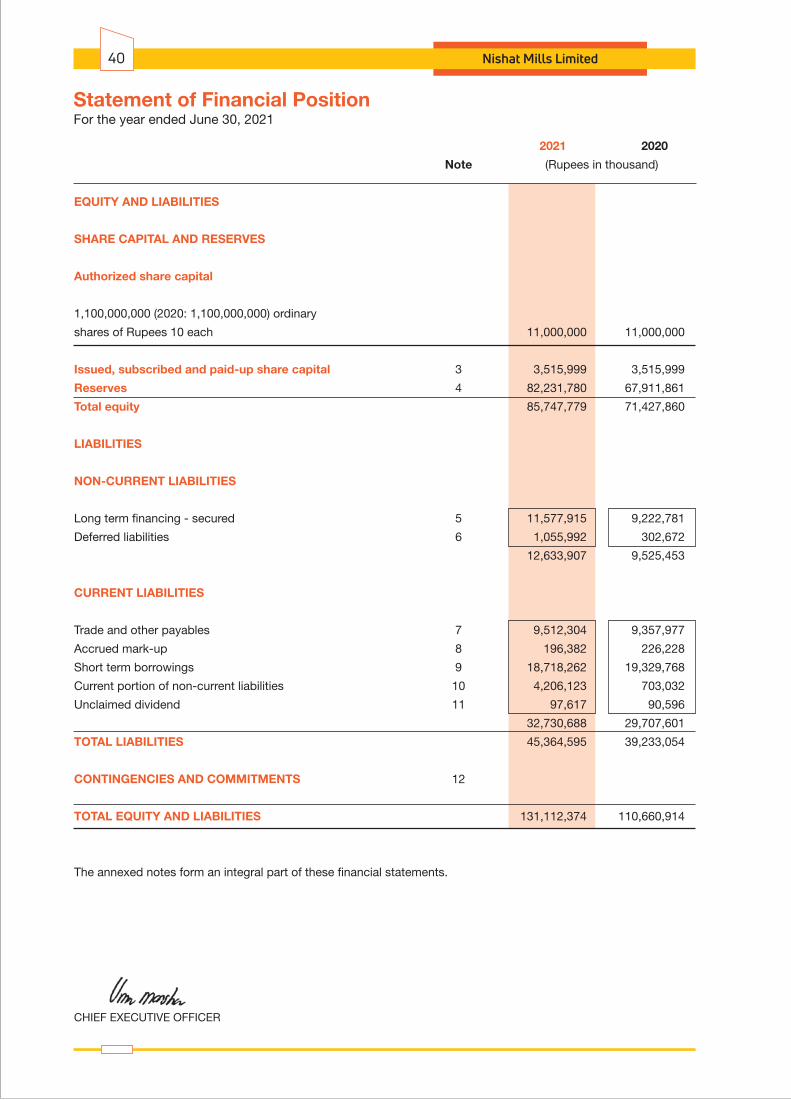
For the year ended June 30, 2021Statement of Financial Position
2021 2020
Note (Rupees in thousand)
EQUITY AND LIABILITIES
SHARE CAPITAL AND RESERVES
Authorized share capital
1,100,000,000 (2020: 1,100,000,000) ordinary
shares of Rupees 10 each 11,000,000 11,000,000
Issued, subscribed and paid-up share capital 3 3,515,999 3,515,999
Reserves 4 82,231,780 67,911,861
Total equity 85,747,779 71,427,860
LIABILITIES
NON-CURRENT LIABILITIES
Long term financing - secured 5 11,577,915 9,222,781
Deferred liabilities 6 1,055,992 302,672
12,633,907 9,525,453
CURRENT LIABILITIES
Trade and other payables 7 9,512,304 9,357,977
Accrued mark-up 8 196,382 226,228
Short term borrowings 9 18,718,262 19,329,768
Current portion of non-current liabilities 10 4,206,123 703,032
Unclaimed dividend 11 97,617 90,596
32,730,688 29,707,601
TOTAL LIABILITIES 45,364,595 39,233,054
CONTINGENCIES AND COMMITMENTS 12
TOTAL EQUITY AND LIABILITIES 131,112,374 110,660,914
The annexed notes form an integral part of these financial statements.
CHIEF EXECUTIVE OFFICER
Nishat Mills Limited40

CHIEF FINANCIAL OFFICERDIRECTOR
2021 2020
Note (Rupees in thousand)
ASSETS
NON-CURRENT ASSETS
Property, plant and equipment 13 35,926,594 31,292,722
Investment properties 14 479,506 455,544
Long term investments 15 48,620,695 37,979,074
Long term loans 16 468,377 305,264
Long term deposits 17 156,984 104,783
85,652,156 70,137,387
CURRENT ASSETS
Stores, spare parts and loose tools 18 2,605,602 2,256,569
Stock-in-trade 19 17,972,691 20,753,543
Trade debts 20 6,549,252 4,285,103
Loans and advances 21 7,675,599 8,868,122
Advance income tax - net 22 572,307 559,080
Short term deposits and prepayments 23 80,828 67,629
Other receivables 24 4,702,709 3,568,565
Accrued interest 25 28,885 36,675
Cash and bank balances 26 5,272,345 128,241
45,460,218 40,523,527
TOTAL ASSETS 131,112,374 110,660,914
Annual Report 2021 41

2021 2020
Note (Rupees in thousand)
REVENUE 27 71,431,010 60,904,096
COST OF SALES 28 (62,113,155) (53,627,970)
GROSS PROFIT 9,317,855 7,276,126
DISTRIBUTION COST 29 (3,096,473) (2,875,340)
ADMINISTRATIVE EXPENSES 30 (1,340,093) (1,238,301)
OTHER EXPENSES 31 (331,796) (213,179)
(4,768,362) (4,326,820)
4,549,493 2,949,306
OTHER INCOME 32 3,750,188 3,032,390
PROFIT FROM OPERATIONS 8,299,681 5,981,696
FINANCE COST 33 (1,229,179) (1,502,412)
PROFIT BEFORE TAXATION 7,070,502 4,479,284
TAXATION 34 (1,148,032) (973,000)
PROFIT AFTER TAXATION 5,922,470 3,506,284
EARNINGS PER SHARE - BASIC AND
DILUTED (RUPEES) 35 16.84 9.97
The annexed notes form an integral part of these financial statements.
CHIEF EXECUTIVE OFFICER CHIEF FINANCIAL OFFICERDIRECTOR
For the year ended June 30, 2021Statement of Profit or Loss
Nishat Mills Limited42
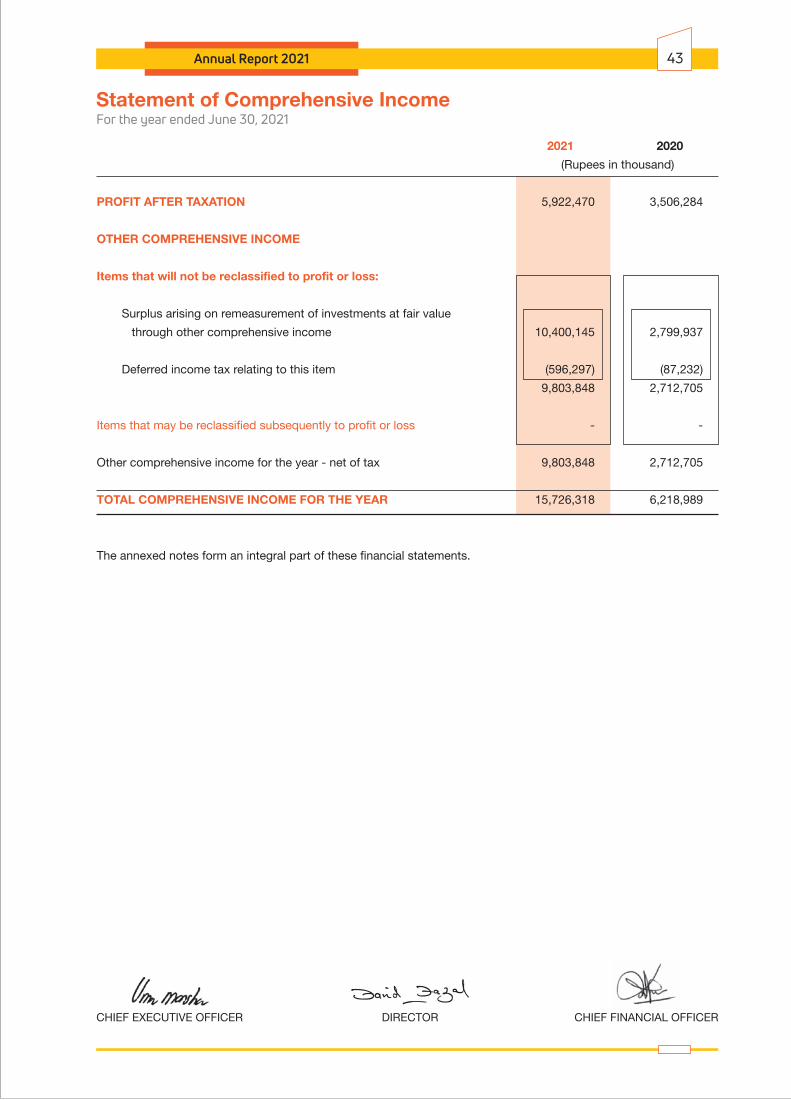
2021 2020
(Rupees in thousand)
PROFIT AFTER TAXATION 5,922,470 3,506,284
OTHER COMPREHENSIVE INCOME
Items that will not be reclassified to profit or loss:
Surplus arising on remeasurement of investments at fair value
through other comprehensive income 10,400,145 2,799,937
Deferred income tax relating to this item (596,297) (87,232)
9,803,848 2,712,705
Items that may be reclassified subsequently to profit or loss - -
Other comprehensive income for the year - net of tax 9,803,848 2,712,705
TOTAL COMPREHENSIVE INCOME FOR THE YEAR 15,726,318 6,218,989
The annexed notes form an integral part of these financial statements.
CHIEF EXECUTIVE OFFICER CHIEF FINANCIAL OFFICERDIRECTOR
Annual Report 2021 43
For the year ended June 30, 2021Statement of Comprehensive Income

(Rup
ees
in t
hous
and
)
Res
erve
s
Cap
ital
Res
erve
sR
even
ue R
eser
ves
Sha
reC
apit
alTo
tal
Eq
uity
Prem
ium
on
Issu
e of
Righ
t Sha
res
Fair
valu
ere
serv
e FV
TOCI
inve
stm
ents
Gen
eral
Res
erve
Una
pp
rop
-ri
ated
Pro
fit
Tota
lS
ub T
ota
lS
ub T
ota
l
Bala
nce
as a
t 01
July
201
9
3,51
5,99
9 5,
499,
530
11,0
26,4
53
16,5
25,9
83
40,7
79,0
28
5,79
4,26
0 46
,573
,288
63
,099
,271
66
,615
,270
Tran
sact
ion
with
ow
ners
- F
inal
div
iden
d fo
r the
yea
r
en
ded
30 J
une
2019
@ R
upee
s 4.
00 p
er s
hare
-
- -
- -
(1,4
06,3
99)
(1,4
06,3
99)
(1,4
06,3
99)
(1,4
06,3
99)
Tran
sfer
red
to g
ener
al re
serv
e
-
- -
- 4,
386,
000
(4,3
86,0
00)
- -
-
Prof
it fo
r the
yea
r
-
- -
- -
3,50
6,28
4 3,
506,
284
3,50
6,28
4 3,
506,
284
Othe
r com
preh
ensi
ve in
com
e fo
r the
yea
r
- -
2,71
2,70
5 2,
712,
705
- -
- 2,
712,
705
2,71
2,70
5
Tota
l com
preh
ensi
ve in
com
e fo
r the
yea
r
-
- 2,
712,
705
2,71
2,70
5 -
3,50
6,28
4 3,
506,
284
6,21
8,98
9 6,
218,
989
Bala
nce
as a
t 30
June
202
0
3,5
15,9
99
5,49
9,53
0 13
,739
,158
19
,238
,688
45
,165
,028
3,
508,
145
48,6
73,1
73
67,9
11,8
61
71,4
27,8
60
Tran
sact
ion
with
ow
ners
- F
inal
div
iden
d fo
r the
yea
r
en
ded
30 J
une
2020
@ R
upee
s 4.
00 p
er s
hare
-
- -
- -
(1,4
06,3
99)
(1,4
06,3
99)
(1,4
06,3
99)
(1,4
06,3
99)
Tran
sfer
red
to g
ener
al re
serv
e
-
- -
- 2,
101,
000
(2,1
01,0
00)
- -
-
Prof
it fo
r the
yea
r
-
- -
- -
5,92
2,47
0 5,
922,
470
5,92
2,47
0 5,
922,
470
Othe
r com
preh
ensi
ve in
com
e fo
r the
yea
r
-
- 9,
803,
848
9,80
3,84
8 -
- -
9,80
3,84
8 9,
803,
848
Tota
l com
preh
ensi
ve in
com
e fo
r the
yea
r
-
- 9,
803,
848
9,80
3,84
8 -
5,92
2,47
0 5,
922,
470
15,7
26,3
18
15,7
26,3
18
Bala
nce
as a
t 30
June
202
1
3,5
15,9
99
5,49
9,53
0 23
,543
,006
29
,042
,536
47
,266
,028
5,
923,
216
53,1
89,2
44
82,2
31,7
80
85,7
47,7
79
The
anne
xed
note
s fo
rm a
n in
tegr
al p
art o
f the
se fi
nanc
ial s
tate
men
ts.
CH
IEF
EX
EC
UTI
VE
OFF
ICE
RC
HIE
F FI
NA
NC
IAL
OFF
ICE
RD
IRE
CTO
R
For the year ended June 30, 2021Statement of Changes In Equity
Nishat Mills Limited44
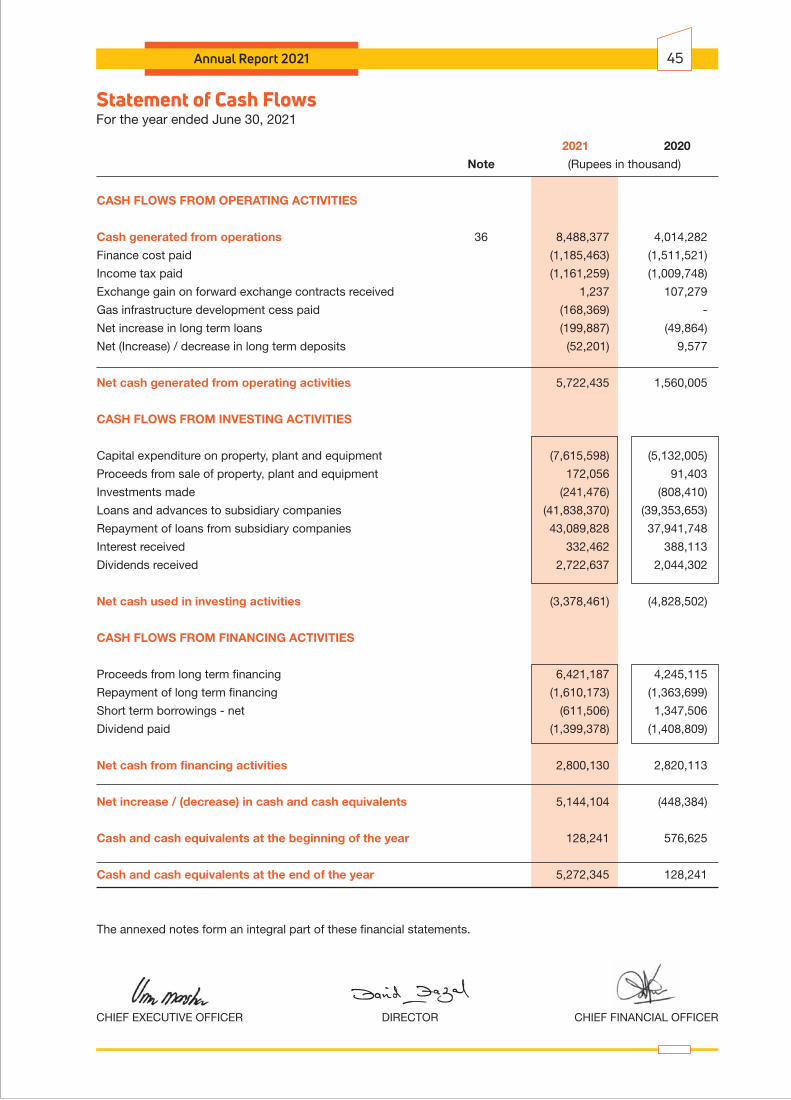
2021 2020
Note (Rupees in thousand)
CASH FLOWS FROM OPERATING ACTIVITIES
Cash generated from operations 36 8,488,377 4,014,282
Finance cost paid (1,185,463) (1,511,521)
Income tax paid (1,161,259) (1,009,748)
Exchange gain on forward exchange contracts received 1,237 107,279
Gas infrastructure development cess paid (168,369) -
Net increase in long term loans (199,887) (49,864)
Net (Increase) / decrease in long term deposits (52,201) 9,577
Net cash generated from operating activities 5,722,435 1,560,005
CASH FLOWS FROM INVESTING ACTIVITIES
Capital expenditure on property, plant and equipment (7,615,598) (5,132,005)
Proceeds from sale of property, plant and equipment 172,056 91,403
Investments made (241,476) (808,410)
Loans and advances to subsidiary companies (41,838,370) (39,353,653)
Repayment of loans from subsidiary companies 43,089,828 37,941,748
Interest received 332,462 388,113
Dividends received 2,722,637 2,044,302
Net cash used in investing activities (3,378,461) (4,828,502)
CASH FLOWS FROM FINANCING ACTIVITIES
Proceeds from long term financing 6,421,187 4,245,115
Repayment of long term financing (1,610,173) (1,363,699)
Short term borrowings - net (611,506) 1,347,506
Dividend paid (1,399,378) (1,408,809)
Net cash from financing activities 2,800,130 2,820,113
Net increase / (decrease) in cash and cash equivalents 5,144,104 (448,384)
Cash and cash equivalents at the beginning of the year 128,241 576,625
Cash and cash equivalents at the end of the year 5,272,345 128,241
The annexed notes form an integral part of these financial statements.
CHIEF EXECUTIVE OFFICER CHIEF FINANCIAL OFFICERDIRECTOR
Annual Report 2021 45
For the year ended June 30, 2021Statement of Cash Flows

1 THE COMPANY AND ITS OPERATIONS
1.1 Nishat Mills Limited (the Company) is a public limited Company incorporated in Pakistan under the Companies Act, 1913 (Now Companies Act, 2017) and listed on Pakistan Stock Exchange Limited. Its registered office is situated at 53-A, Lawrence Road, Lahore. The Company is engaged in the business of textile manufacturing and of spinning, combing, weaving, bleaching, dyeing, printing, stitching, apparel, buying, selling and otherwise dealing in yarn, linen, cloth and other goods and fabrics made from raw cotton, synthetic fibre and cloth and to generate, accumulate, distribute, supply and sell electricity.
1.2 Geographical location and addresses of all business units are as follows:
Sr. No.
1 Spinning units, yarn dyeing unit and power plant Nishatabad, Faisalabad. 2 Spinning units and power plant Plot No. 172-180 and 188-197, M-3 Industrial City, Sahianwala, FIEDMC, 2 K.M., Jhumra Chiniot Road, Chak Jhumra, Faisalabad. 3 Spinning units and power plant 20 K.M., Sheikhupura Road, Feroze Wattwan. 4 Weaving units and power plant 12 K.M., Faisalabad Road, Sheikhupura. 5 Weaving units, dyeing and finishing unit, 5 K.M., Nishat Avenue Off 22 K.M., Ferozepur processing unit, stitching units and power plants Road, Lahore. 6 Terry unit 7 K.M., Nishat Avenue Off 22 K.M., Ferozepur Road, Lahore. 7 Apparel unit 2 K.M., Nishat Avenue Off 22 K.M., Ferozepur Road, Lahore. 8 Head office 7-Main Gulberg, Lahore. 9 Office 1st Floor, Karachi Chambers, Hasrat Mohani Road, Karachi. 10 Registered office Nishat House, 53-A, Lawrence Road, Lahore.
1.3 These financial statements are the separate financial statements of the Company. Consolidated financial statements of the Company are prepared separately. Details of the Company’s investments in subsidiaries and associates are stated in note 15 to these financial statements.
2 SUMMARY OF SIGNIFICANT ACCOUNTING POLICIES
The significant accounting policies applied in the preparation of these financial statements are set out below. These policies have been consistently applied to all years presented unless otherwise stated:
2.1 Basis of preparation
a) Statement of compliance
These financial statements have been prepared in accordance with the accounting and reporting standards as applicable in Pakistan. The accounting and reporting standards applicable in Pakistan comprise of:
- International Financial Reporting Standards (IFRSs) issued by the International Accounting Standards Board (IASB) as notified under the Companies Act, 2017; and
- Provisions of and directives issued under the Companies Act, 2017.
Where provisions of and directives issued under the Companies Act, 2017 differ from the IFRSs, the provisions of and directives issued under the Companies Act, 2017 have been followed.
b) Accounting convention
These financial statements have been prepared under the historical cost convention except as otherwise stated in the respective accounting policies.
AddressManufacturing units and offices
For the year ended June 30, 2021Notes to the Financial Statements
Nishat Mills Limited46
c) Critical accounting estimates and judgments
The preparation of financial statements in conformity with the approved accounting standards requires the use of certain critical accounting estimates. It also requires the management to exercise its judgment in the process of applying the Company's accounting policies. Estimates and judgments are continually evaluated and are based on historical experience and other factors, including expectations of future events that are believed to be reasonable under the circumstances. The areas where various assumptions and estimates are significant to the Company's financial statements or where judgments were exercised in application of accounting policies are as follows:
Financial instruments – fair value
The fair value of financial instruments that are not traded in an active market is determined by using valuation techniques based on assumptions that are dependent on conditions existing at the reporting date.
Useful lives, patterns of economic benefits and impairment
Estimates with respect to residual values and useful lives and pattern of flow of economic benefits are based on the analysis of the management of the Company. Further, the Company reviews the value of assets for possible impairment on an annual basis. Any change in the estimates in the future might affect the carrying amount of respective item of property, plant and equipment and investment properties with a corresponding effect on the depreciation charge and impairment.
Inventories
Inventory write-down is made based on the current market conditions, historical experience and selling goods of similar nature. It could change significantly as a result of changes in market conditions. A review is made on each reporting date on inventories for excess inventories, obsolescence and declines in net realisable value and an allowance is recorded against the inventory balances for any such declines.
Income tax
In making the estimates for income tax currently payable by the Company, the management takes into account the current income tax law and the decisions of appellate authorities on certain issues in the past.
Allowance for expected credit losses
The allowance for Expected Credit Losses (ECLs) assessment requires a degree of estimation and judgement. It is based on the lifetime expected credit loss, grouped based on days overdue, and makes assumptions to allocate an overall expected credit loss rate for each group. These assumptions include recent sales experience and historical collection rates.
Provisions
As the actual outflows can differ from estimates made for provisions due to changes in laws, regulations, public expectations, technology, prices and conditions, and can take place many years in the future, the carrying amounts of provisions are reviewed at each reporting date and adjusted to take account of such changes. Any adjustments to the amount of previously recognised provision is recognised in the statement of profit or loss unless the provision was originally recognised as part of cost of an asset.
Contingencies
The Company reviews the status of all pending litigations and claims against the Company. Based on the judgment and the advice of the legal advisors for the estimated financial outcome, appropriate disclosure or provision is made. The actual outcome of these litigations and claims can have an effect
Annual Report 2021 47

on the carrying amounts of the liabilities recognized at the statement of financial position date.
Impairment of investments in subsidiaries
In making an estimate of recoverable amount of the Company's investments in subsidiaries, the management considers future cash flows.
Revenue from contracts with customers involving sale of goods
When recognizing revenue in relation to the sale of goods to customers, the key performance obligation of the Company is considered to be the point of delivery of the goods to the customer, as this is deemed to be the time that the customer obtains control of the promised goods and therefore the benefits of unimpeded access.
d) Amendments to published approved accounting standards that are effective in current year and are relevant to the Company
Following amendments to published approved accounting standards are mandatory for the Company’s accounting periods beginning on or after 01 July 2020:
• IAS 1 (Amendments) ‘Presentation of Financial Statements’ and IAS 8 (Amendments) ‘Accounting Policies, Changes in Accounting Estimates and Errors’;
• International Accounting Standards Board’s revised Conceptual Framework – March 2018 • IFRS 3 (Amendments) ‘Business Combination’; • IFRS 16 (Amendments) ‘Leases’; • Interest Rate Benchmark Reform which amended IFRS 9 ‘Financial Instruments’, IAS 39
‘Financial Instruments: Recognition and Measurement’ and IFRS 7 ‘Financial Instruments: Disclosures’.
The above-mentioned amendments to approved accounting standards did not have any impact on the amounts recognised in prior period and are not expected to significantly affect the current or future periods.
e) Amendments to published approved accounting standards that are effective in current year but not relevant to the Company
There are amendments to published standards that are mandatory for accounting periods beginning on or after 01 July 2020 but are considered not to be relevant or do not have any significant impact on the Company’s financial statements and are therefore not detailed in these financial statements.
f) Amendments to published approved accounting standards that are not yet effective but relevant to the Company
Following amendments to existing standards have been published and are mandatory for the Company’s accounting periods beginning on or after 01 July 2021 or later periods:
Classification of liabilities as current or non-current (Amendments to IAS 1 ‘Presentation of Financial Statements’) effective for the annual period beginning on or after 01 January 2023. These amendments in the standards have been added to further clarify when a liability is classified as current. The standard also amends the aspect of classification of liability as non-current by requiring the assessment of the entity’s right at the end of the reporting period to defer the settlement of liability for at least twelve months after the reporting period. An entity shall apply those amendments retrospectively in accordance with IAS 8 ‘Accounting Policies, Changes in Accounting Estimates and Errors’.
Onerous Contracts – Cost of Fulfilling a Contract (Amendments to IAS 37 ‘Provisions, Contingent Liabilities and Contingent Assets’) effective for the annual period beginning on or after 01 January 2022 amends IAS 1 ‘Presentation of Financial Statements’ by mainly adding paragraphs which
For the year ended June 30, 2021Notes to the Financial Statements
Nishat Mills Limited48
clarifies what comprise the cost of fulfilling a contract. Cost of fulfilling a contract is relevant when determining whether a contract is onerous. An entity is required to apply the amendments to contracts for which it has not yet fulfilled all its obligations at the beginning of the annual reporting period in which it first applies the amendments (the date of initial application). Restatement of comparative information is not required, instead the amendments require an entity to recognize the cumulative effect of initially applying the amendments as an adjustment to the opening balance of retained earnings or other component of equity, as appropriate, at the date of initial application.
Property, Plant and Equipment: Proceeds before Intended Use (Amendments to IAS 16 ‘Property, Plant and Equipment’) effective for the annual period beginning on or after 1 January 2022. Clarifies that sales proceeds and cost of items produced while bringing an item of property, plant and equipment to the location and condition necessary for it to be capable of operating in the manner intended by management e.g. when testing etc., are recognized in profit or loss in accordance with applicable Standards. The entity measures the cost of those items applying the measurement requirements of IAS 2 ‘Inventories’. The standard also removes the requirement of deducting the net sales proceeds from cost of testing. An entity shall apply those amendments retrospectively, but only to items of property, plant and equipment that are brought to the location and condition necessary for them to be capable of operating in the manner intended by management on or after the beginning of the earliest period presented in the financial statements in which the entity first applies the amendments. The entity shall recognize the cumulative effect of initially applying the amendments as an adjustment to the opening balance of retained earnings (or other component of equity, as appropriate) at the beginning of that earliest period presented.
The following annual improvements to IFRS standards 2018-2020 are effective for annual reporting periods beginning on or after 01 January 2022:
- IFRS 9 ‘Financial Instruments’ – The amendment clarifies that an entity includes only fees paid or received between the entity (the borrower) and the lender, including fees paid or received by either the entity or the lender on the other’s behalf, when it applies the ‘10 per cent’ test in paragraph B3.3.6 of IFRS 9 in assessing whether to derecognize a financial liability.
- IFRS 16 ‘Leases’ – The amendment partially amends Illustrative Example 13 accompanying IFRS 16 ‘Leases’ by excluding the illustration of reimbursement of leasehold improvements by the lessor. The objective of the amendment is to resolve any potential confusion that might arise in lease incentives.
Disclosure of Accounting Policies (Amendments to IAS 1 ‘Presentation of Financial Statements’ and IFRS Practice Statement 2 ‘Making Materiality Judgement’) effective for annual periods beginning on or after 01 January 2023. These amendments are intended to help preparers in deciding which accounting policies to disclose in their financial statements. Earlier, IAS 1 states that an entity shall disclose its ‘significant accounting policies’ in their financial statements. These amendments shall assist the entities to disclose their ‘material accounting policies’ in their financial statements.
Covid-19-Related Rent Concessions (Amendment to IFRS 16 ‘Leases’) effective for annual reporting periods beginning on or after 01 April 2021. These amendments permit a lessee to apply the practical expedient regarding COVID-19-related rent concessions. The entity shall recognize the cumulative effect of initially applying the amendments as an adjustment to the opening balance of retained earnings (or other component of equity, as appropriate) at the beginning of that earliest period presented.
Deferred Tax related to Assets and Liabilities arising from a Single Transaction (Amendments to IAS 12 ‘Income taxes’) effective for annual periods beginning on or after 01 January 2023. These amendments clarify how companies account for deferred tax on transactions such as leases and decommissioning obligations.
Change in definition of Accounting Estimate (Amendments to IAS 8 ‘Accounting Policies, Changes in Accounting Estimates and Errors) effective for annual periods beginning on or after 1 January 2023. This change replaced the definition of Accounting Estimate with a new definition, intended to help
Annual Report 2021 49

entities to distinguish between accounting policies and accounting estimates.
The International Accounting Standards Board (IASB) has published 'Reference to the Conceptual Framework (Amendments to IFRS 3)' with amendments to IFRS 3 'Business Combinations' that update an outdated reference in IFRS 3 without significantly changing its requirements. Effective for business combinations for which the acquisition date is on or after the beginning of annual period beginning on or after 01 January 2022. The amendments also add to IFRS 3 an exception to its requirement for an entity to refer to the Conceptual Framework to determine what constitutes an asset or a liability. The standard is effective for transactions in the future and therefore would not have an impact on past financial statements.
Interest Rate Benchmark Reform – Phase 2 which amended IFRS 9 ‘Financial Instruments’, IAS 39 ‘Financial Instruments: Recognition and Measurement’, IFRS 4 ‘Insurance Contracts’ and IFRS 7 ‘Financial Instruments: Disclosures’ is applicable for annual financial periods beginning on or after 01 January 2021. The changes made relate to the modification of financial assets, financial liabilities and lease liabilities, specific hedge accounting requirements, and disclosure requirements applying IFRS 7 to accompany the amendments regarding modifications and hedge accounting.
The above amendments and improvements are likely to have no significant impact on the financial statements.
g) Standards and amendments to approved published standards that are not yet effective and not considered relevant to the Company
There are other standards and amendments to published standards that are mandatory for accounting periods beginning on or after 01 July 2021 but are considered not to be relevant or do not have any significant impact on the Company’s financial statements and are therefore not detailed in these financial statements.
2.2 Employee benefit
The Company operates an approved funded provident fund scheme covering all its permanent employees and permanent employees of a Group Company. Equal monthly contributions are made both by the Company, other Group Company and employees at the rate of 9.5 percent of the basic salary to the fund. The Company's contributions to the fund are charged to statement of profit or loss.
2.3 Taxation
Current
Provision for current tax is based on the taxable income for the year determined in accordance with the prevailing law for taxation of income. The charge for current tax is calculated using prevailing tax rates or tax rates expected to apply to the profit for the year, if enacted. The charge for current tax also includes adjustments, where considered necessary, to provision for tax made in previous years arising from assessments framed during the year for such years.
Deferred
Deferred tax is accounted for using the liability method in respect of all temporary differences arising from differences between the carrying amount of assets and liabilities in the financial statements and the corresponding tax bases used in the computation of the taxable profit. Deferred tax liabilities are generally recognized for all taxable temporary differences and deferred tax assets to the extent that it is probable that taxable profits will be available against which the deductible temporary differences, unused tax losses and tax credits can be utilized.
Deferred tax is calculated at the rates that are expected to apply to the period when the differences reverse based on tax rates that have been enacted or substantively enacted by the reporting date. Deferred tax is charged or credited in the statement of profit or loss, except to the extent that it relates to
For the year ended June 30, 2021Notes to the Financial Statements
Nishat Mills Limited50

items recognized in other comprehensive income or directly in equity. In this case, the tax is also recognized in other comprehensive income or directly in equity, respectively.
2.4 Functional and presentation currency
Items included in the financial statements of the Company are measured using the currency of the primary economic environment in which the Company operates (the functional currency). The financial statements are presented in Pak Rupees, which is the Company’s functional and presentation currency. Figures are rounded off to the nearest thousand of Pak Rupees.
2.5 Foreign currency transactions and translation
All monetary assets and liabilities in foreign currencies are translated into Pak Rupees at exchange rates prevailing at the reporting date. Transactions in foreign currencies are translated into Pak Rupees at exchange rates prevailing at the dates of the transactions. Foreign exchange gains and losses resulting from the settlement of such transactions and from the translation at year end exchange rates of monetary assets and liabilities denominated in foreign currencies are charged or credited to statement of profit or loss. Non-monetary assets and liabilities that are measured in terms of historical cost in a foreign currency are translated into Pak Rupees at exchange rates prevailing at the date of transaction. Non-monetary assets and liabilities denominated in foreign currency that are stated at fair value are translated into Pak Rupees at exchange rates prevailing at the date when fair values are determined.
2.6 Property, plant, equipment and depreciation
Operating fixed assets
Operating fixed assets except freehold land are stated at cost less accumulated depreciation and accumulated impairment losses (if any). Cost of operating fixed assets consists of historical cost, borrowing cost pertaining to erection / construction period of qualifying assets and other directly attributable costs of bringing the asset to working condition. Freehold land is stated at cost less any recognized impairment loss.
Subsequent costs are included in the asset’s carrying amount or recognized as a separate asset, as appropriate, only when it is probable that future economic benefits associated with the item will flow to the Company and the cost of the item can be measured reliably. All other repair and maintenance costs are charged to statement of profit or loss during the period in which they are incurred.
Depreciation
Depreciation on operating fixed assets is charged to the statement of profit or loss applying the reducing balance method so as to write off the cost / depreciable amount of the assets over their estimated useful lives at the rates given in note 13.1. The Company charges the depreciation on additions from the date when the asset is available for use and on deletions up to the date when the asset is de-recognized. The residual values and useful lives are reviewed by the management, at each financial year-end and adjusted if impact on depreciation is significant.
De-recognition
An item of operating fixed assets is de-recognized upon disposal or when no future economic benefits are expected from its use or disposal. Any gain or loss arising on de-recognition of the asset is included in the statement of profit or loss in the year the asset is de-recognized.
Capital work-in-progress
Capital work-in-progress is stated at cost less identified impairment losses, if any. All expenditure connected with specific assets incurred during installation and construction period are carried under capital work-in-progress. These are transferred to operating fixed assets as and when these are available for use.
Annual Report 2021 51
2.7 Investment properties
Land and buildings held for capital appreciation or to earn rental income are classified as investment properties. Investment properties except land, are stated at cost less accumulated depreciation and any recognized impairment loss. Land is stated at cost less any recognized impairment loss. Depreciation on buildings is charged to the statement of profit or loss applying the reducing balance method so as to write off the cost of buildings over their estimated useful lives at a rate of 10% per annum.
2.8 Right-of-use assets
A right-of-use asset is recognized at the commencement date of a lease. The right-of-use asset is measured at cost, which comprises the initial amount of the lease liability, adjusted for, as applicable, any lease payments made at or before the commencement date net of any lease incentives received, any initial direct costs incurred, and, except where included in the cost of inventories, an estimate of costs expected to be incurred for dismantling and removing the underlying asset, and restoring the site or asset.
Right-of-use assets are depreciated on a straight-line basis over the unexpired period of the lease or the estimated useful life of the asset, whichever is shorter. Where the Company expects to obtain ownership of the leased asset at the end of the lease term, the depreciation is charged over its estimated useful life. Right-of use assets are subject to impairment or adjusted for any re-measurement of lease liabilities.
The Company has elected not to recognize a right-of-use asset and corresponding lease liability for short-term leases with terms of 12 months or less and leases of low-value assets. Lease payments on these assets are charged to income as incurred.
2.9 Lease liabilities
A lease liability is recognized at the commencement date of a lease. The lease liability is initially recognized at the present value of the lease payments to be made over the term of the lease, discounted using the interest rate implicit in the lease or, if that rate cannot be readily determined, the Company's incremental borrowing rate. Lease payments comprise of fixed payments less any lease incentives receivable, variable lease payments that depend on an index or a rate, amounts expected to be paid under residual value guarantees, exercise price of a purchase option when the exercise of the option is reasonably certain to occur, and any anticipated termination penalties. The variable lease payments that do not depend on an index or a rate are expensed in the period in which they are incurred.
Lease liabilities are measured at amortised cost using the effective interest method. The carrying amounts are re-measured if there is a change in the following: future lease payments arising from a change in an index or a rate used; residual guarantee; lease term; certainty of a purchase option and termination penalties. When a lease liability is re-measured, an adjustment is made to the corresponding right-of-use asset, or to statement of profit or loss if the carrying amount of the right-of-use asset is fully written down.
2.10 Investments and other financial assets
a) Classification
The Company classifies its financial assets in the following measurement categories:
• those to be measured subsequently at fair value (either through other comprehensive income, or through profit or loss), and
• those to be measured at amortized cost
The classification depends on the Company’s business model for managing the financial assets and the contractual terms of the cash flows.
For the year ended June 30, 2021Notes to the Financial Statements
Nishat Mills Limited52
For assets measured at fair value, gains and losses will either be recorded in profit or loss or other comprehensive income. For investments in debt instruments, this will depend on the business model in which the investment is held. For investments in equity instruments, this will depend on whether the Company has made an irrevocable election at the time of initial recognition to account for the equity investment at fair value through other comprehensive income. The Company reclassifies debt investments when and only when its business model for managing those assets changes.
b) Measurement
At initial recognition, the Company measures a financial asset at its fair value plus, in the case of a financial asset not at fair value through profit or loss, transaction costs that are directly attributable to the acquisition of the financial asset. Transaction costs of financial assets carried at fair value through profit or loss are expensed in profit or loss.
Financial assets with embedded derivatives are considered in their entirety when determining whether their cash flows are solely payment of principal and interest.
Debt instruments
Subsequent measurement of debt instruments depends on the Company’s business model for managing the asset and the cash flow characteristics of the asset. There are three measurement categories into which the Company classifies its debt instruments:
Amortized cost
Financial assets that are held for collection of contractual cash flows where those cash flows represent solely payments of principal and interest are measured at amortised cost. Interest income from these financial assets is included in other income using the effective interest rate method. Any gain or loss arising on derecognition is recognised directly in profit or loss and presented in other income / (other expenses) together with foreign exchange gains and losses. Impairment losses are presented as separate line item in the statement of profit or loss.
Fair value through other comprehensive income (FVTOCI)
Financial assets that are held for collection of contractual cash flows and for selling the financial assets, where the assets’ cash flows represent solely payments of principal and interest, are measured at FVTOCI. Movements in the carrying amount are taken through other comprehensive income, except for the recognition of impairment losses (and reversal of impairment losses), interest income and foreign exchange gains and losses which are recognised in profit or loss. When the financial asset is derecognised, the cumulative gain or loss previously recognised in other comprehensive income is reclassified from equity to profit or loss and recognised in other income / (other expenses). Interest income from these financial assets is included in other income using the effective interest rate method. Foreign exchange gains and losses are presented in other income / (other expenses) and impairment losses are presented as separate line item in the statement of profit or loss.
Fair value through profit or loss (FVTPL)
Assets that do not meet the criteria for amortised cost or FVTOCI are measured at FVTPL. A gain or loss on a debt instrument that is subsequently measured at FVTPL is recognised in profit or loss and presented net within other income / (other expenses) in the period in which it arises.
Equity instruments
The Company subsequently measures all equity investments at fair value for financial instruments quoted in an active market, the fair value corresponds to a market price (level 1). For financial instruments that are not quoted in an active market, the fair value is determined using valuation techniques including reference to recent arm’s length market transactions or transactions involving financial instruments which
Annual Report 2021 53

are substantially the same (level 2), or discounted cash flow analysis including, to the greatest possible extent, assumptions consistent with observable market data (level 3).
Fair value through other comprehensive income (FVTOCI)
Where the Company’s management has elected to present fair value gains and losses on equity investments in other comprehensive income, there is no subsequent reclassification of fair value gains and losses to profit or loss. Impairment losses (and reversal of impairment losses) on equity investments measured at FVTOCI are not reported separately from other changes in fair value.
Fair value through profit or loss (FVTPL)
Changes in the fair value of equity investments at fair value through profit or loss are recognised in other income / (other expenses) in the statement of profit or loss as applicable.
Dividends from such investments continue to be recognised in profit or loss as other income when the Company’s right to receive payments is established.
2.11 Financial liabilities – classification and measurement
Financial liabilities are classified as measured at amortized cost or FVTPL. A financial liability is classified as at FVTPL if it is classified as held-for-trading, it is a derivative or it is designated as such on initial recognition. Financial liabilities at FVTPL are measured at fair value and net gains and losses, including any interest expense, are recognized in profit or loss. Other financial liabilities are subsequently measured at amortized cost using the effective interest method. Interest expense and foreign exchange gains and losses are recognized in statement of profit or loss. Any gain or loss on de-recognition is also included in profit or loss.
2.12 Impairment of financial assets
The Company recognizes loss allowances for ECLs on:
- Financial assets measured at amortized cost; - Debt investments measured at FVTOCI; and - Contract assets.
The Company measures loss allowances at an amount equal to lifetime ECLs, except for the following, which are measured at 12-month ECLs:
- Debt securities that are determined to have low credit risk at the reporting date; and
- Other debt securities and bank balances for which credit risk (i.e. the risk of default occurring over the expected life of the financial instrument) has not increased significantly since initial recognition.
12-month ECLs are the portion of ECLs that result from default events that are possible within the 12
months after the reporting date (or a shorter period if the expected life of the instrument is less than 12 months).
When determining whether the credit risk of a financial asset has increased significantly since initial recognition and when estimating ECLs, the Company considers reasonable and supportable information that is relevant and available without undue cost or effort. This includes both quantitative and qualitative information and analysis, based on the Company’s historical experience and informed credit assessment and including forward-looking information.
The Company assumes that the credit risk on a financial asset has increased significantly if it is more than past due for a reasonable period of time. Lifetime ECLs are the ECLs that result from all possible default events over the expected life of a financial instrument. 12-month ECLs are the portion of ECLs that result from default events that are possible within the 12 months after the reporting date (or a shorter period if
For the year ended June 30, 2021Notes to the Financial Statements
Nishat Mills Limited54
the expected life of the instrument is less than 12 months). The maximum period considered when estimating ECLs is the maximum contractual period over which the Company is exposed to credit risk.
The Company has elected to measure loss allowances for trade debts using IFRS 9 simplified approach and has calculated ECLs based on lifetime ECLs. The Company has established a matrix that is based on the Company's historical credit loss experience, adjusted for forward-looking factors specific to the debtors and the economic environment. When determining whether the credit risk of a financial asset has increased significantly since initial recognition and when estimating ECLs, the Company considers reasonable and supportable information that is relevant and available without undue cost or effort. This includes both quantitative and qualitative information and analysis, based on the Company's historical experience and informed credit assessment including forward-looking information.
Loss allowances for financial assets measured at amortized cost are deducted from the gross carrying amount of the assets.
The gross carrying amount of a financial asset is written off when the Company has no reasonable expectations of recovering of a financial asset in its entirety or a portion thereof. The Company individually makes an assessment with respect to the timing and amount of write-off based on whether there is a reasonable expectation of recovery. The Company expects no significant recovery from the amount written off. However, financial assets that are written off could still be subject to enforcement activities in order to comply with the Company's procedures for recovery of amounts due.
At each reporting date, the Company assesses whether financial assets carried at amortised cost and debt securities at FVTOCI are credit-impaired. A financial asset is ‘credit-impaired’ when one or more events that have a detrimental impact on the estimated future cash flows of the financial asset have occurred.
Evidence that a financial asset is credit-impaired includes the following observable data:
- significant financial difficulty of the debtor; - a breach of contract such as a default; - the restructuring of a loan or advance by the Company on terms that the Company would not
consider otherwise; - it is probable that the debtor will enter bankruptcy or other financial reorganization; or - the disappearance of an active market for a security because of financial difficulties.
2.13 De-recognition of financial assets and financial liabilities
a) Financial assets
The Company derecognizes a financial asset when the contractual rights to the cash flows from the asset expire, or it transfers the rights to receive the contractual cash flows in a transaction in which substantially all of the risks and rewards of ownership of the financial asset are transferred, or it neither transfers nor retains substantially all of the risks and rewards of ownership and does not retain control over the transferred asset. Any interest in such derecognized financial assets that is created or retained by the Company is recognized as a separate asset or liability.
b) Financial liabilities
The Company derecognizes a financial liability (or a part of financial liability) from its statement of financial position when the obligation specified in the contract is discharged or cancelled or expires.
2.14 Offsetting of financial instruments
Financial assets and financial liabilities are set off and the net amount is reported in the financial statements when there is a legal enforceable right to set off and the Company intends either to settle on a net basis or to realize the assets and to settle the liabilities simultaneously.
Annual Report 2021 55
2.15 Investment in subsidiaries
Investments in subsidiaries are stated at cost less impairment loss, if any, in accordance with the provisions of IAS 27 'Separate Financial Statements'.
2.16 Investment in associates - (with significant influence)
The Company is required to prepare separate financial statements, hence, in accordance with the requirements of IAS 27 'Separate Financial Statements', the investments in associates are accounted for in accordance with IFRS 9 'Financial Instruments’ and are classified as fair value through other comprehensive income (FVTOCI).
2.17 Inventories
Inventories, except for stock in transit and waste stock / rags, are stated at lower of cost and net realizable value. Cost is determined as follows:
Stores, spare parts and loose tools
Useable stores, spare parts and loose tools are valued principally at moving average cost, while items considered obsolete are carried at nil value. Items in transit are valued at cost comprising invoice value plus other charges paid thereon.
Stock-in-trade
Cost of raw material, work-in-process and finished goods is determined as follows:
(i) For raw materials: Annual average basis. (ii) For work-in-process and finished goods: Average manufacturing cost including a portion of production overheads.
Materials in transit are valued at cost comprising invoice value plus other charges paid thereon. Waste stock / rags are valued at net realizable value.
Net realizable value signifies the estimated selling price in the ordinary course of business less the estimated costs of completion and the estimated costs necessary to make a sale.
2.18 Trade debts and other receivables
Trade debts are initially recognised at fair value and subsequently measured at amortised cost using the effective interest method, less any allowance for expected credit losses.
Other receivables are recognised at amortised cost, less any allowance for expected credit losses.
2.19 Non–current assets (or disposal groups) held for sale
Non-current assets (or disposal groups) are classified as assets held for sale when their carrying amount is to be recovered principally through a sale transaction and a sale is considered highly probable. They are stated at the lower of carrying amount and fair value less costs to sell.
2.20 Borrowings
Financing and borrowings are recognized initially at fair value and are subsequently stated at amortized cost. Any difference between the proceeds and the redemption value is recognized in the statement of profit or loss over the period of the borrowings using the effective interest method.
For the year ended June 30, 2021Notes to the Financial Statements
Nishat Mills Limited56

2.21 Borrowing cost
Interest, mark-up and other charges on long-term finances are capitalized up to the date of commissioning of respective qualifying assets acquired out of the proceeds of such long-term finances. All other interest, mark-up and other charges are recognized in statement of profit or loss.
2.22 Share capital
Ordinary shares are classified as share capital. Incremental costs directly attributable to the issue of new shares are shown in equity as a deduction, net of tax.
2.23 Trade and other payables
Liabilities for trade and other amounts payable are initially recognized at fair value, which is normally the transaction cost.
2.24 Revenue recognition
Sale of goods
Revenue from the sale of goods is recognised at the point in time when the customer obtains control of the goods, which is generally at the time of delivery.
Processing services
The Company provides processing services to local customers. These services are sold separately and the Company’s contract with the customer for services constitute a single performance obligation.
Revenue from services is recognized at the point in time, generally at the time of dispatch. There are no terms giving rise to variable consideration under the Company’s contracts with its customers.
Interest
Interest income is recognised as interest accrues using the effective interest method. This is a method of calculating the amortised cost of a financial asset and allocating the interest income over the relevant period using the effective interest rate, which is the rate that exactly discounts estimated future cash receipts through the expected life of the financial asset to the net carrying amount of the financial asset.
Rent
Rent revenue from investment properties is recognised on a straight-line basis over the lease term. Lease incentives granted are recognised as part of the rental revenue. Contingent rentals are recognised as income in the period when earned.
Sale of electricity
Revenue from sale of electricity is recognized at the time of transmission.
Dividend
Dividend on investments is recognized when right to receive the dividend is established.
Other revenue
Other revenue is recognised when it is received or when the right to receive payment is established.
Annual Report 2021 57

2.25 Contract assets
Contract assets arise when the Company performs its performance obligations by transferring goods to a customer before the customer pays its consideration or before payment is due. Contract assets are treated as financial assets for impairment purposes.
2.26 Customer acquisition costs
Customer acquisition costs are capitalised as an asset where such costs are incremental to obtaining a contract with a customer and are expected to be recovered. Customer acquisition costs are amortised on a straight-line basis over the term of the contract.
Costs to obtain a contract that would have been incurred regardless of whether the contract was obtained or which are not otherwise recoverable from a customer are expensed as incurred to profit or loss. Incremental costs of obtaining a contract where the contract term is less than one year is immediately expensed to profit or loss.
2.27 Customer fulfilment costs
Customer fulfilment costs are capitalised as an asset when all the following are met: (i) the costs relate directly to the contract or specifically identifiable proposed contract; (ii) the costs generate or enhance resources of the Company that will be used to satisfy future performance obligations; and (iii) the costs are expected to be recovered. Customer fulfilment costs are amortised on a straight-line basis over the term of the contract.
2.28 Right of return assets
Right of return assets represents the right to recover inventory sold to customers and is based on an estimate of customers who may exercise their right to return the goods and claim a refund. Such rights are measured at the value at which the inventory was previously carried prior to sale, less expected recovery costs and any impairment.
2.29 Contract liabilities
Contract liability is the obligation of the Company to transfer goods to a customer for which the Company has received consideration from the customer. If a customer pays consideration before the Company transfers goods, a contract liability is recognized when the payment is made. Contract liabilities are recognized as revenue when the Company performs its performance obligations under the contract.
2.30 Refund liabilities
Refund liabilities are recognised where the Company receives consideration from a customer and expects to refund some, or all, of that consideration to the customer. A refund liability is measured at the amount of consideration received or receivable for which the Company does not expect to be entitled and is updated at the end of each reporting period for changes in circumstances. Historical data is used across product lines to estimate such returns at the time of sale based on an expected value methodology.
2.31 Provisions
Provisions are recognized when the Company has a legal or constructive obligation as a result of past events and it is probable that an outflow of resources embodying economic benefits will be required to settle the obligations and a reliable estimate of the amount can be made.
2.32 Earnings per share
The Company presents earnings per share (EPS) data for its ordinary shares. EPS is calculated by dividing the profit or loss attributable to ordinary shareholders of the Company by the weighted average number of ordinary shares outstanding during the year.
For the year ended June 30, 2021Notes to the Financial Statements
Nishat Mills Limited58

2.33 Contingent assets
Contingent assets are disclosed when the Company has a possible asset that arises from past events and whose existence will only be confirmed by the occurrence or non-occurrence of one or more uncertain future events not wholly within the control of the Company. Contingent assets are not recognized until their realization becomes certain.
2.34 Contingent liabilities
Contingent liability is disclosed when the Company has a possible obligation as a result of past events whose existence will only be confirmed by the occurrence or non-occurrence of one or more uncertain future events not wholly within the control of the Company. Contingent liabilities are not recognized, only disclosed, unless the possibility of a future outflow of resources is considered remote. In the event that the outflow of resources associated with a contingent liability is assessed as probable, and if the size of the outflow can be reliably estimated, a provision is recognized in the financial statements.
2.35 Impairment of non-financial assets
Assets that have an indefinite useful life are not subject to depreciation and are tested annually for impairment. Assets that are subject to depreciation are reviewed for impairment at each statement of financial position date or whenever events or changes in circumstances indicate that the carrying amount may not be recoverable. An impairment loss is recognized for the amount for which assets carrying amount exceeds its recoverable amount. Recoverable amount is the higher of an asset’s fair value less costs to sell and value in use. For the purposes of assessing impairment, assets are grouped at the lowest levels for which there are separately identifiable cash flows (cash-generating units). Non-financial assets that suffered an impairment are reviewed for possible reversal of the impairment at each reporting date. Reversals of the impairment losses are restricted to the extent that the asset’s carrying amount does not exceed the carrying amount that would have been determined, net of depreciation or amortization, if impairment losses had not been recognized. An impairment loss or reversal of impairment loss is recognized in the statement of profit or loss.
2.36 Derivative financial instruments
Derivatives are initially recognized at fair value. Any directly attributable transaction costs are recognized in the statement of profit or loss as incurred. They are subsequently remeasured at fair value on regular basis and at each reporting date as a minimum, with all their gains and losses, realized and unrealized, recognized in the statement of profit or loss.
2.37 Cash and cash equivalents
Cash and cash equivalents comprise cash in hand, cash at banks on current, saving and deposit accounts and other short term highly liquid instruments that are readily convertible into known amounts of cash and which are subject to insignificant risk of changes in values.
2.38 Ijara contracts
Under the Ijarah contracts the Company obtains usufruct of an asset for an agreed period for an agreed consideration. The Company accounts for its Ijarah contracts in accordance with the requirements of IFAS 2 ‘Ijarah’. Accordingly, the Company as a Mustaj’ir (lessee) in the Ijarah contract recognises the Ujrah (lease) payments as an expense in the profit and loss on straight line basis over the Ijarah term.
2.39 Segment reporting
Segment reporting is based on the operating (business) segments of the Company. An operating segment is a component of the Company that engages in business activities from which it may earn revenues and incur expenses, including revenues and expenses that relate to the transactions with any of the Company's other components. An operating segment's operating results are reviewed regularly by the chief executive officer to make decisions about resources to be allocated to the segment and assess its performance, and for which discrete financial information is available.
Annual Report 2021 59
Segment results that are reported to the chief executive officer include items directly attributable to a segment as well as those that can be allocated on a reasonable basis. Those incomes, expenses, assets, liabilities and other balances which cannot be allocated to a particular segment on a reasonable basis are reported as unallocated.
The Company has following reportable business segments: Spinning at Faisalabad (I and II) and Feroze
Wattwan (I and II) (Producing different quality of yarn including dyed yarn and sewing thread using natural and artificial fibres), Weaving at Bhikki and Lahore (Producing different quality of greige fabric using yarn), Dyeing (Producing dyed fabric using different qualities of greige fabric), Home Textile (Manufacturing of home textile articles using processed fabric produced from greige fabric), Terry (Manufacturing of terry and bath products), Garments (Manufacturing of garments using processed fabric) and Power Generation (Generation and distribution of power using gas, oil, steam, coal and biomass).
Transaction among the business segments are recorded at cost. Inter segment sales and purchases are eliminated from the total.
2.40 Government grants
Grants from the government are recognised at their fair value where there is a reasonable assurance that the grant will be received and the Company will comply with all attached conditions.
Government grants relating to costs are deferred and recognised in the profit or loss over the period necessary to match them with the costs that they are intended to compensate.
Government grants relating to the purchase of property, plant and equipment are included in non-current liabilities as deferred income and are credited to profit or loss over the expected lives of the related assets.
2.41 Dividend and other appropriations
Dividend distribution to the Company's shareholders is recognized as a liability in the Company's financial statements in the period in which the dividends are declared and other appropriations are recognized in the period in which these are approved by the Board of Directors.
3 ISSUED, SUBSCRIBED AND PAID-UP SHARE CAPITAL
2021 2020 2021 2020
(Number of Shares) Note (Rupees in thousand)
270,446,606 270,446,606 Ordinary shares of Rupees 10 each fully paid-up in cash 2,704,466 2,704,466
2,804,079 2,804,079 Ordinary shares of Rupees 10 each issued to shareholders of Nishat Apparel Limited under the Scheme of Amalgamation 28,041 28,041
23,577,990 23,577,990 Ordinary shares of Rupees 10 each issued as fully paid for consideration other than cash 3.1 235,780 235,780
54,771,173 54,771,173 Ordinary shares of Rupees 10 each issued as fully paid bonus shares 547,712 547,712
351,599,848 351,599,848 3,515,999 3,515,999
3.1 These mainly include shares issued to members of Umer Fabrics Limited as per the Scheme of Arrangement as approved by the Honourable Lahore High Court, Lahore.
For the year ended June 30, 2021Notes to the Financial Statements
Nishat Mills Limited60
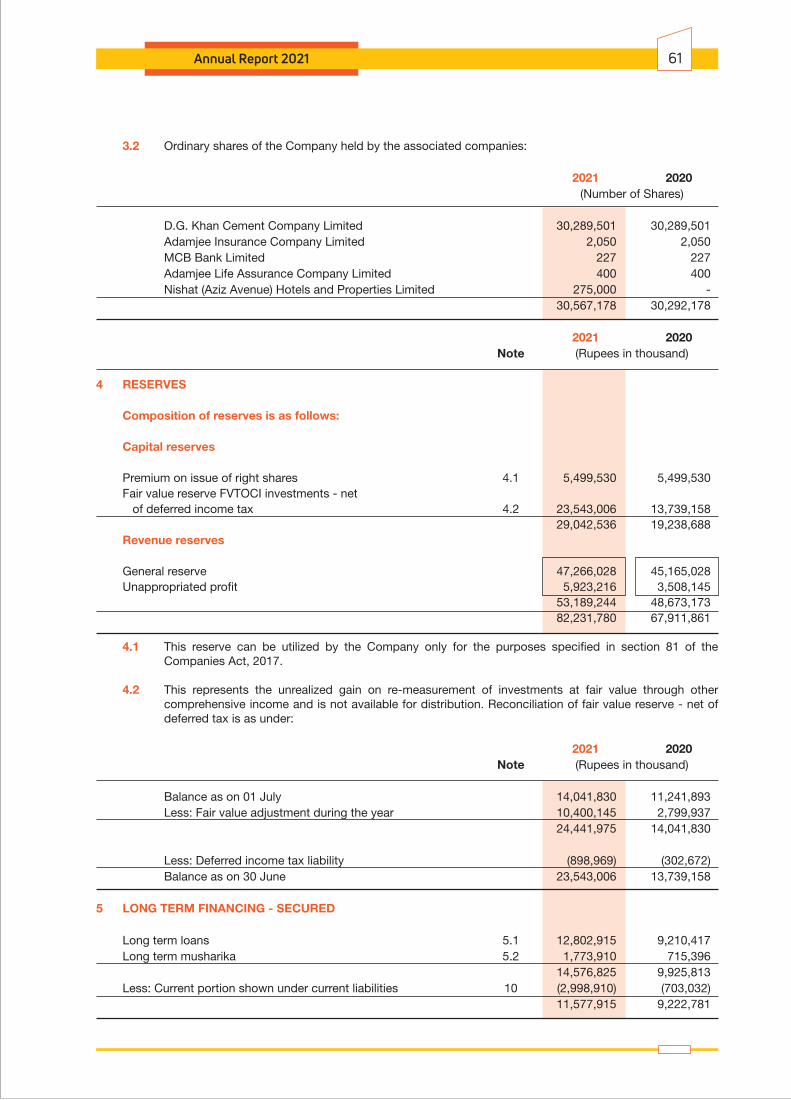
3.2 Ordinary shares of the Company held by the associated companies:
2021 2020 (Number of Shares)
D.G. Khan Cement Company Limited 30,289,501 30,289,501 Adamjee Insurance Company Limited 2,050 2,050 MCB Bank Limited 227 227 Adamjee Life Assurance Company Limited 400 400 Nishat (Aziz Avenue) Hotels and Properties Limited 275,000 - 30,567,178 30,292,178
2021 2020 Note (Rupees in thousand)
4 RESERVES
Composition of reserves is as follows:
Capital reserves
Premium on issue of right shares 4.1 5,499,530 5,499,530 Fair value reserve FVTOCI investments - net of deferred income tax 4.2 23,543,006 13,739,158 29,042,536 19,238,688 Revenue reserves
General reserve 47,266,028 45,165,028 Unappropriated profit 5,923,216 3,508,145 53,189,244 48,673,173 82,231,780 67,911,861
4.1 This reserve can be utilized by the Company only for the purposes specified in section 81 of the Companies Act, 2017.
4.2 This represents the unrealized gain on re-measurement of investments at fair value through other comprehensive income and is not available for distribution. Reconciliation of fair value reserve - net of deferred tax is as under:
2021 2020 Note (Rupees in thousand)
Balance as on 01 July 14,041,830 11,241,893 Less: Fair value adjustment during the year 10,400,145 2,799,937 24,441,975 14,041,830
Less: Deferred income tax liability (898,969) (302,672) Balance as on 30 June 23,543,006 13,739,158
5 LONG TERM FINANCING - SECURED
Long term loans 5.1 12,802,915 9,210,417 Long term musharika 5.2 1,773,910 715,396 14,576,825 9,925,813 Less: Current portion shown under current liabilities 10 (2,998,910) (703,032) 11,577,915 9,222,781
Annual Report 2021 61

Lender 2021 2020Interest
RepricingInterestPayable
Rate ofInterest Per
Annum
Number ofInstallments
Security
(Rupees in thousand)
5.1 Long term loans
Twenty four Quarterly Quarterlyequal quarterly installments commenced on 24 August 2014 and ended on 24 May 2021(Note 5.4).
First pari passu hypothecation charge of Rupees 1,334 million over all present and future plant, machinery and equipment of the Company (excluding plant and machinery in respect of which the Company has already created exclusive charges in the favour of its existing creditors).
3 Monthoffer KIBOR
+ 0.50%
Allied Bank - 16,060Limited
First pari passu charge of Rupees 1,267 million over all present and future plant, machinery and equipment of the Company (excluding plant and machinery in respect of which the Company has already created exclusive charges in the favour of its existing charge holders / creditors).
Two hundred - Quarterlyand twenty unequal installments commenced on 27 March 2018 and ending on 05 June 2024 (Note 5.4).
First pari passu charge of Rupees 1,333 million (inclusive of 25% margin on all present and future plant and machinery of the Company).
SBP rate for LTFF
+ 0.25%
Allied Bank 571,582 609,478Limited
Two hundred - Quarterlyand twenty unequalinstallments commenced on 26 January 2020 and ending on 17 September 2026(Note 5.4).
First pari passu charge of Rupees 1,267 million over all present and future plant, machinery and equipment of the Company (excluding plant and machinery in respect of which the Company has already created exclusive charges in the favour of its existing creditors).
SBP rate for LTFF
+ 0.25%
Allied Bank 869,087 908,011Limited
Four hundred - Quarterlyand eighty four unequal installments commenced on 28 December 2018and ending on13 July 2025(Note 5.4).
First pari passu hypothecation charge of Rupees 1,334 million over all present and future plant, machinery and equipment of the Company (excluding plant and machinery in respect of which the Company has already created exclusive charges in the favour of its existing creditors).
SBP rate for LTFF
+ 0.25%
Allied Bank 739,561 772,933Limited
Sixty unequal - Quarterlyinstallments commencing on24 January 2022 and ending on 28 October 2026.
SBP rate for LTFF
+ 0.35%
Allied Bank 222,715 222,715Limited
Four hundred and - Quarterlyforty three unequalinstallments commenced on 18 May 2021 and ending on11 February 2027.
SBP rate for LTFF
+ 0.50%
Twenty equal - Quarterlyquarterly installmentscommenced on14 May 2021 and ending on14 February 2026.
SBP rate for financing
power plants using
renewable energy
+ 0.50%
545,572 546,274
95,000 100,000
863,287 868,989
For the year ended June 30, 2021Notes to the Financial Statements
Nishat Mills Limited62
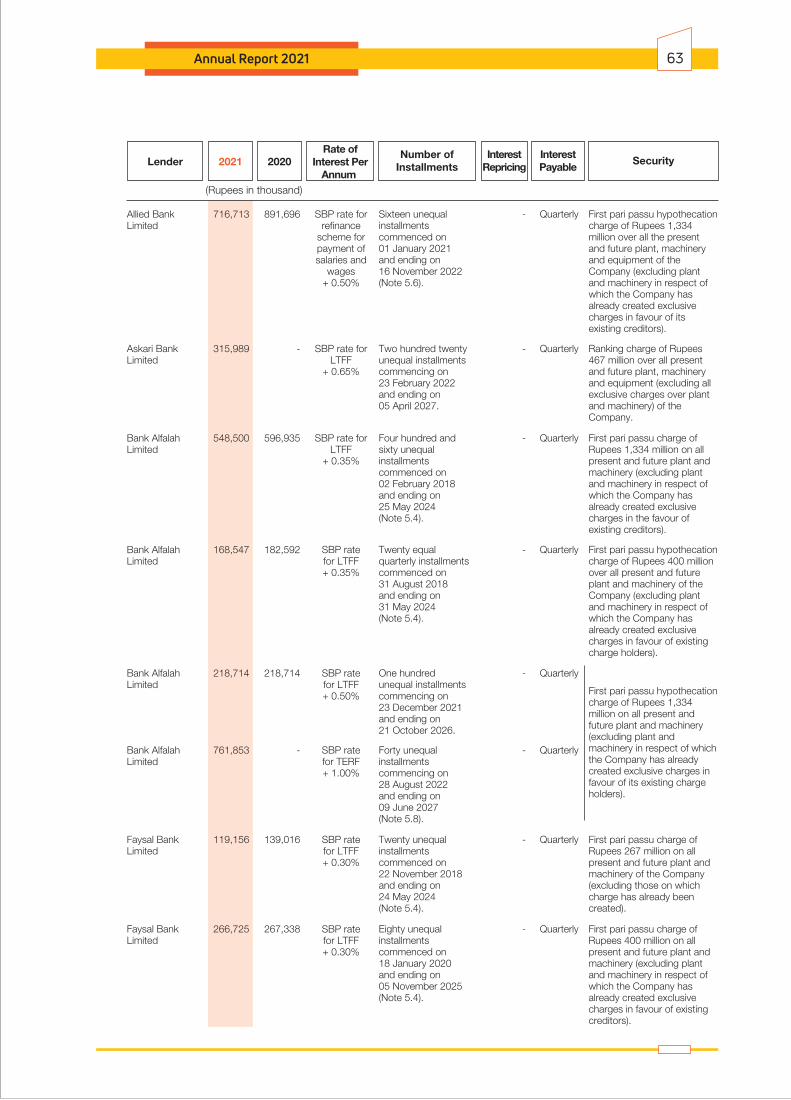
Lender 2021 2020Interest
RepricingInterestPayable
Rate ofInterest Per
Annum
Number ofInstallments
Security
(Rupees in thousand)
Sixteen unequal - Quarterlyinstallments commenced on 01 January 2021 and ending on 16 November 2022(Note 5.6).
First pari passu hypothecation charge of Rupees 1,334 million over all the present and future plant, machinery and equipment of the Company (excluding plant and machinery in respect of which the Company has already created exclusive charges in favour of its existing creditors).
SBP rate for refinance
scheme for payment of salaries and
wages + 0.50%
Allied Bank 716,713 891,696Limited
One hundred - Quarterlyunequal installments commencing on 23 December 2021 and ending on 21 October 2026.
First pari passu hypothecation charge of Rupees 1,334 million on all present and future plant and machinery (excluding plant and machinery in respect of which the Company has already created exclusive charges in favour of its existing charge holders).
SBP ratefor LTFF + 0.50%
Bank Alfalah 218,714 218,714Limited
Forty unequal - Quarterlyinstallments commencing on 28 August 2022 and ending on 09 June 2027(Note 5.8).
SBP ratefor TERF+ 1.00%
Bank Alfalah 761,853 -Limited
Faysal Bank 119,156 139,016Limited
Twenty unequal - Quarterlyinstallments commenced on 22 November 2018 and ending on 24 May 2024 (Note 5.4).
First pari passu charge of Rupees 267 million on all present and future plant and machinery of the Company (excluding those on which charge has already been created).
SBP ratefor LTFF + 0.30%
Faysal Bank 266,725 267,338Limited
Eighty unequal - Quarterlyinstallments commenced on18 January 2020 and ending on 05 November 2025(Note 5.4).
First pari passu charge of Rupees 400 million on all present and future plant and machinery (excluding plant and machinery in respect of which the Company has already created exclusive charges in favour of existing creditors).
SBP ratefor LTFF + 0.30%
Ranking charge of Rupees 467 million over all present and future plant, machinery and equipment (excluding all exclusive charges over plant and machinery) of the Company.
Two hundred twenty - Quarterlyunequal installmentscommencing on 23 February 2022 and ending on 05 April 2027.
SBP rate for LTFF
+ 0.65%
Askari Bank 315,989 -Limited
First pari passu charge of Rupees 1,334 million on all present and future plant and machinery (excluding plant and machinery in respect of which the Company has already created exclusive charges in the favour of existing creditors).
Four hundred and - Quarterlysixty unequal installments commenced on 02 February 2018and ending on 25 May 2024 (Note 5.4).
SBP rate for LTFF
+ 0.35%
Bank Alfalah 548,500 596,935Limited
First pari passu hypothecation charge of Rupees 400 million over all present and future plant and machinery of the Company (excluding plant and machinery in respect of which the Company has already created exclusive charges in favour of existing charge holders).
Twenty equal - Quarterlyquarterly installmentscommenced on 31 August 2018and ending on 31 May 2024 (Note 5.4).
SBP ratefor LTFF+ 0.35%
Bank Alfalah 168,547 182,592Limited
Annual Report 2021 63

Lender 2021 2020Interest
RepricingInterestPayable
Rate ofInterest Per
Annum
Number ofInstallments
Security
(Rupees in thousand)
Twenty equal - Quarterlyquarterly installments commenced on 27 February 2020 and ending on27 November 2025(Note 5.4).
SBP ratefor LTFF+ 0.25%
Habib Bank 668,592 705,753Limited
Twenty equal - Quarterlyquarterly installmentscommenced on 27 February 2020 and ending on27 November 2024.
First pari passu charge of Rupees 4,084 million over all present and future plant, machinery and equipment of the Company (excluding plant and machinery in respect of which the Company has already created exclusive charges in the favour of its existing creditors).
SBP rate for financing
power plants using
renewable energy
+ 0.25%
192,827 231,392
861,419 937,145
One hundred and - Quarterlytwenty unequalinstallments commenced on 12 April 2017 andending on03 June 2023(Note 5.4).
First pari passu hypothecation charge of Rupees 534 million on all present and future plant and machinery (excluding plant and machinery which is under exclusive charges in favour of creditors).
SBP rate for LTFF+ 0.50%
National Bank 39,028 44,466of Pakistan
Sixty four unequal Quarterly Quarterlyinstallments commencing on17 September 2023and ending on 23 June 2031(Note. 5.5).
Ranking charge of Rupees 1,334 million on present and future plant and machinery (excluding plant and machinery in respect of which the Company has already created exclusive charges in favour of its existing charges holders / creditors).
3 Monthoffer
KIBOR+ 1.50%
National Bank 139,545 -of Pakistan
One hundred - Quarterlyunequal installmentscommencing on24 September 2021and ending on22 July 2026.
First pari passu hypothecation charge of Rupees 1,334 million over plant and machinery (excluding plant and machinery in respect of which the Company has already created exclusive charges in favour of its existing charge holders).
SBP ratefor LTFF+ 0.65%
Habib 997,499 866,900MetropolitanBank Limited
Ninety six unequal - Quarterlyinstallments commencing on19 July 2023 andending on11 June 2031(Note 5.8).
Ranking charge of Rupees 1,334 million over plant and machinery of the Company.
SBP ratefor TERF+ 0.85%
Habib 842,390 -MetropolitanBank Limited
One hundred and - Quarterlyeighty unequal installments commenced on 17 September 2017 and ending on 25 November 2023(Note 5.4).
Note 5.3 SBP ratefor LTFF+ 0.40%
Habib Bank 424,904 461,591Limited
For the year ended June 30, 2021Notes to the Financial Statements
Nishat Mills Limited64

Lender 2021 2020Interest
RepricingInterestPayable
Rate ofInterest Per
Annum
Number ofInstallments
Security
(Rupees in thousand)
Three hundred - Quarterlyand twenty unequalinstallmentscommenced on30 August 2018and ending on28 December 2024(Note 5.4).
First pari passu charge of Rupees 400 million over all the present and future plant and machinery of the Company with 25% margin excluding those assets (part of the plant and machinery) on which the Company has created exclusive charges in favour of existing creditors.
SBP rate for LTFF+ 0.25%
Pak Brunei 188,286 202,474InvestmentCompany Limited
One hundred and - Quarterlysixty unequal installments commenced on11 June 2016 andending on26 January 2023(Note 5.4).
First pari passu charge of Rupees 400 million on all present and future plant and machinery of the Company with 25% margin.
Ranking hypothecation charge of Rupees 267 million on plant and machinery of the Company (excluding plant and machinery in respect of which the Company has already created exclusive charges in favour of its existing charge holders / creditors).
SBP rate for LTFF+ 1.00%
Pakistan Kuwait 35,679 42,174InvestmentCompany (Private)Limited
Two hundred and - Quarterlyfifty eight unequal installments commenced on15 September 2016and ending on29 September 2023(Note 5.4).
SBP rate for LTFF+ 0.75%
14,807 16,440
50,486 58,614
Seventy two unequal - Quarterlyinstallmentscommenced on10 May 2021 and ending on13 January 2028.
First pari passu hypothecation charge of Rupees 1,334 million on all present and future plant and machinery (excluding plant and machinery in respect of which the Company has already created exclusive charges in favour of its existing charge holders / creditors) of the Company with 25% margin.
SBP rate for LTFF
+ 0.65%
Pakistan Kuwait 981,040 998,210InvestmentCompany (Private)Limited
One hundred and - Quarterlysixty unequal installments commenced on 30 January 2017 andending on 07 April 2023(Note 5.4).
First pari passu charge of Rupees 667 million on all present and future plant and machinery (other than the specific machinery against which exclusive charges have already been created in favour of existing charge holders) of the Company.
SBP rate for LTFF
+ 0.50%
The Bank 146,755 169,255of Punjab
Thirty two equal Quarterly Quarterlyinstallments commencing on 28 September 2023 and ending on 28 June 2031(Note. 5.5).
Ranking charge of Rupees 3,000 million over all present and future plant and machinery (excluding those assets over which exclusive charges have already been created in favour of existing creditors) of the Company.
3 Monthoffer
KIBOR+ 1.25%
United Bank 110,980 -Limited
Four hundred eighty - Quarterlyunequal installmentscommencing on08 July 2023 andending on11 June 2031(Note 5.8).
SBP ratefor TERF+ 1.25%
1,860,869 -
1,971,849 -
12,802,915 9,210,417
Annual Report 2021 65

Lender 2021 2020Interest
RepricingInterestPayable
Rate ofInterest Per
Annum
Number ofInstallments
Security
(Rupees in thousand)
Fifty six unequal Quarterly Quarterlyinstallments commenced on19 May 2016 andended on01 June 2021(Note 5.4).
First pari passu charge of Rupees 2,200 million over present and future plant, machinery and equipment of the Company (excluding plant and machinery in respect of which the Company has already created exclusive charges in favour of its existing charge holders / creditors).
Note 5.33 Month offer KIBOR + 0.35%
Habib Bank - 27,896Limited
Seventeen unequal Quarterly Quarterlyinstallments commenced on14 February 2019and ended on25 May 2021.
Specific charge of Rupees 1,339 million over fixed assets of the Company inclusive of 25% margin.
3 Month offer KIBOR
Standard - 687,500Chartered Bank(Pakistan) Limited
Eight equal quarterly - Quarterlyinstallments commenced on 30 March 2021 and ending on 30 December 2022(Note 5.7).
First pari passu charge of Rupees 1,333 million over all the present and future plant, machinery and equipment of the Company (excluding plant and machinery in respect of which the Company has already created exclusive charges in favour of its existing creditors).
SBP rate for Islamic
refinance scheme for payment of salaries and
wages + 0.50%
Faysal Bank 707,633 -Limited
Two hundred - Quarterlyunequal installmentscommencing on 24 March 2022 and ending on 25 June 2027.
SBP rate for ILTFF
+ 0.70%
Faysal Bank 803,328 -Limited
Forty unequal - Quarterlyinstallments commencing on 07 July 2022 andending on26 February 2027.
SBP rate for Islamic
renewable energy
financing scheme+ 0.70%
262,949 -
1,066,277 - 1,773,910 715,396
14,576,825 9,925,813
5.2 Long term musharika
5.3 Long term loan and long term musharika from Habib Bank Limited are secured against first pari passu hypothecation charge of Rupees 4,000 million on present and future fixed assets of the Company excluding specific and exclusive charges.
5.4 Repayment period includes deferment of repayment of principal loan amount by one year in accordance with the State Bank of Pakistan BPRD Circular Letter No. 13 of 2020 dated 26 March 2020.
5.5 During the year, these long term loans did not carry rate of interest of State Bank of Pakistan Temporary Economic Refinance Facility (TERF). Hence, does not contain any element of government grant.
5.6 This long term loan is obtained by the Company under SBP Refinance Scheme for payment of salaries and wages . This is recognized and measured in accordance with IFRS 9 'Financial Instruments'. Fair value adjustment is recognized at discount rate ranging from 6.87% to 7.36% per annum.
5.7 This long term musharika is obtained by the Company under SBP Islamic Refinance Scheme for payment of salaries and wages . This is recognized and measured in accordance with IFRS 9 'Financial Instruments'. Fair value adjustment is recognized at discount rate ranging from 7.45% to 7.49% per annum.
5.8 These loans are obtained by the Company under SBP Temporary Economic Refinance Facility (TERF). These are recognized and measured in accordance with IFRS 9 'Financial Instruments'. Fair value adjustment is recognized at discount rate of 2.60% per annum.
For the year ended June 30, 2021Notes to the Financial Statements
Nishat Mills Limited66

Annual Report 2021 67
2021 2020
Note (Rupees in thousand)
6 DEFERRED LIABILITIES
Deferred income tax 6.1 898,969 302,672
Gas Infrastructure Development Cess (GIDC) payable 6.2 78,039 -
Deferred income - Government grant 6.3 78,984 -
1,055,992 302,672
6.1 This represents deferred income tax liability on unrealized gain on remeasurement of investments at fair value through other comprehensive income. Provision for deferred income tax on other temporary differences was not considered necessary as the Company is chargeable to tax under section 169 of the Income Tax Ordinance, 2001.
6.2 Gas Infrastructure Development Cess (GIDC) Payable
2021 2020
Note (Rupees in thousand)
Gas Infrastructure Development Cess payable at amortized cost 1,299,041 -
Add: Adjustment due to impact of IFRS 9 33 73,562 -
Less: Payments made during the year (168,369) -
Balance as on 30 June 1,204,234 -
Less: Current portion shown under current liabilities 10 (1,126,195) -
78,039 -
6.2.1 This represents Gas Infrastructure Development Cess (GIDC) that was levied through GIDC Act, 2015. During the year, Honourable Supreme Court of Pakistan upheld the GIDC Act, 2015 to be constitutional and intra vires. The Company has filed a review petition in Honourable Sindh High Court, Karachi which is pending adjudication. GIDC payable has been recognized at amortized cost in accordance with IFRS 9.
2021 2020
Note (Rupees in thousand)
6.3 Deferred income - Government grant
Government grant recognized during the year 253,819 -
Less: Amortized during the year (93,817) -
160,002 -
Less: Current portion shown under current liabilities 10 (81,018) -
78,984 -
6.3.1 The State Bank of Pakistan (SBP), through its Circular No. 01 and 02 of 2020 dated 17 March 2020 and Circular No. 09 of 2020 dated 08 May 2020 introduced a Temporary Economic Refinance Facility (TERF) for setting of new industrial units and for undertaking Balancing, Modernization and Replacement and / or expansion of projects / businesses and through Circular No. 06 of 2020 dated 10 April 2020 introduced a Refinance Scheme for payment of wages and salaries to the workers and employees of business concerns. These refinances were available through Banks / DFIs. One of the key feature of these refinance facilities is that borrowers can obtain loan at mark-up rates that are below normal lending rates. As per International Accounting Standard (IAS) 20 'Accounting for Government Grants and Disclosure of Government Assistance', the benefit of a Government loan at a below-market rate of interest is treated as a Government grant. The Company has obtained these loans as disclosed in note 5 to the financial statements. In accordance with IFRS 9 'Financial Instruments', loans obtained under the refinance

facilities were initially recognized at fair value which is the present value of loans proceeds received, discounted using prevailing market rates of interest for a similar instrument. Hence, the benefit of the below-market rate of interest has been measured as the difference between the initial carrying value of the loan determined in accordance with IFRS 9 and the proceeds received. This benefit is accounted for and presented as deferred grant in accordance with IAS 20. The grant is being amortized in the statement of profit or loss, in line with the recognition of interest expense the grant is compensating. There are no unfulfilled conditions or contingencies attached to this grant.
2021 2020
Note (Rupees in thousand)
7 TRADE AND OTHER PAYABLES
Creditors 7.1 5,637,086 6,167,454
Sindh infrastructure cess payable 7.2 614,314 521,840
Accrued liabilities 1,627,183 1,415,195
Contract liabilities - unsecured 7.1 1,173,749 956,879
Securities from contractors - Interest free and
repayable on completion of contracts 7.3 13,940 13,561
Retention money payable 64,126 32,156
Payable to Employees' Provident Fund Trust 33 39,988
Income tax deducted at source 846 782
Fair value of forward exchange contracts 57,429 6,206
Workers' profit participation fund 7.4 318,505 203,916
Workers' welfare fund 5,093 -
9,512,304 9,357,977
7.1 These include amounts due to following related parties:
Creditors
Nishat Linen (Private) Limited - subsidiary company 165,768 103,068
Nishat USA Inc. - subsidiary company 3,502 3,665
Nishat Hospitality (Private) Limited - subsidiary company - 132
Hyundai Nishat Motor (Private) Limited - associated company - 37
D.G. Khan Cement Company Limited - associated company - 8,376
Security General Insurance Company Limited
- associated company 10,489 25,008
Adamjee Insurance Company Limited - associated company 20,626 15,382
Nishat Hotels and Properties Limited - associated company 17 289
Sanifa Agri Services Limited - associated company - 403
Nishat (Chunian) Limited - related party 46,530 173,798
246,932 330,158
Contract liabilities - unsecured
Nishat Hotels and Properties Limited - associated company - 820
Nishat (Chunian) Limited - related party 10 -
10 820
For the year ended June 30, 2021Notes to the Financial Statements
Nishat Mills Limited68
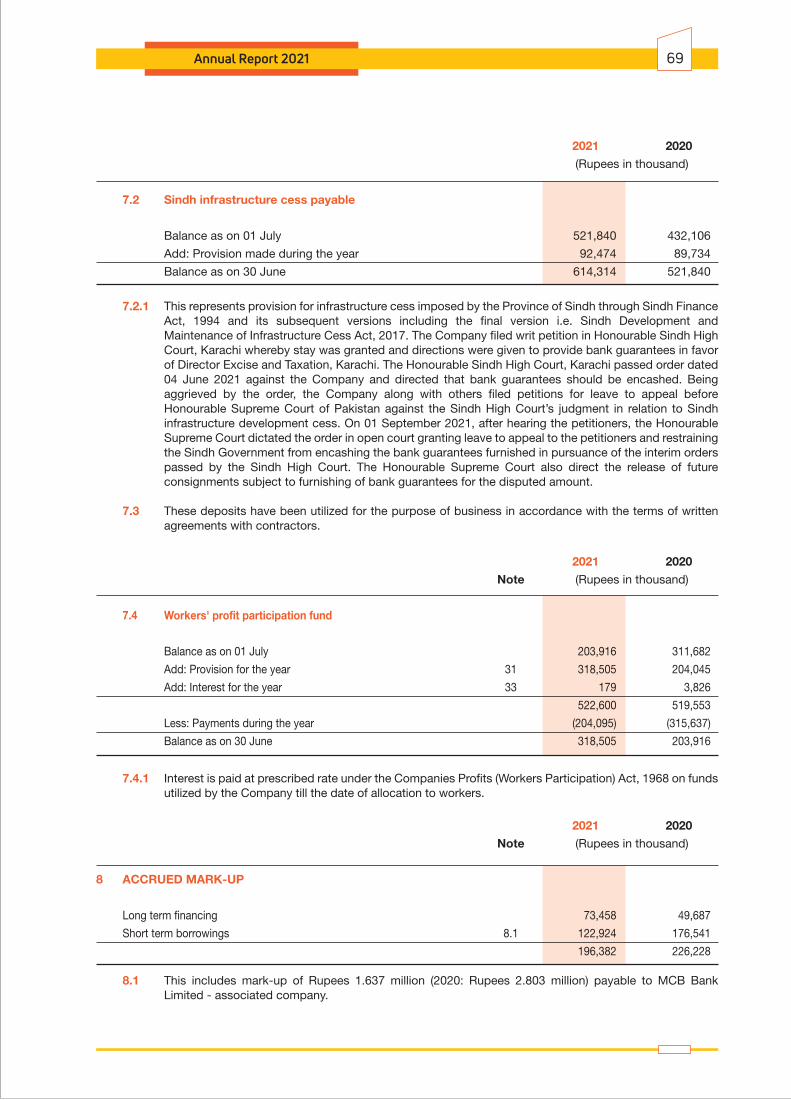
Annual Report 2021 69
2021 2020
(Rupees in thousand)
7.2 Sindh infrastructure cess payable
Balance as on 01 July 521,840 432,106
Add: Provision made during the year 92,474 89,734
Balance as on 30 June 614,314 521,840
7.2.1 This represents provision for infrastructure cess imposed by the Province of Sindh through Sindh Finance Act, 1994 and its subsequent versions including the final version i.e. Sindh Development and Maintenance of Infrastructure Cess Act, 2017. The Company filed writ petition in Honourable Sindh High Court, Karachi whereby stay was granted and directions were given to provide bank guarantees in favor of Director Excise and Taxation, Karachi. The Honourable Sindh High Court, Karachi passed order dated 04 June 2021 against the Company and directed that bank guarantees should be encashed. Being aggrieved by the order, the Company along with others filed petitions for leave to appeal before Honourable Supreme Court of Pakistan against the Sindh High Court’s judgment in relation to Sindh infrastructure development cess. On 01 September 2021, after hearing the petitioners, the Honourable Supreme Court dictated the order in open court granting leave to appeal to the petitioners and restraining the Sindh Government from encashing the bank guarantees furnished in pursuance of the interim orders passed by the Sindh High Court. The Honourable Supreme Court also direct the release of future consignments subject to furnishing of bank guarantees for the disputed amount.
7.3 These deposits have been utilized for the purpose of business in accordance with the terms of written agreements with contractors.
2021 2020
Note (Rupees in thousand)
7.4 Workers' profit participation fund
Balance as on 01 July 203,916 311,682
Add: Provision for the year 31 318,505 204,045
Add: Interest for the year 33 179 3,826
522,600 519,553
Less: Payments during the year (204,095) (315,637)
Balance as on 30 June 318,505 203,916
7.4.1 Interest is paid at prescribed rate under the Companies Profits (Workers Participation) Act, 1968 on funds utilized by the Company till the date of allocation to workers.
2021 2020
Note (Rupees in thousand)
8 ACCRUED MARK-UP
Long term financing 73,458 49,687
Short term borrowings 8.1 122,924 176,541
196,382 226,228
8.1 This includes mark-up of Rupees 1.637 million (2020: Rupees 2.803 million) payable to MCB Bank Limited - associated company.
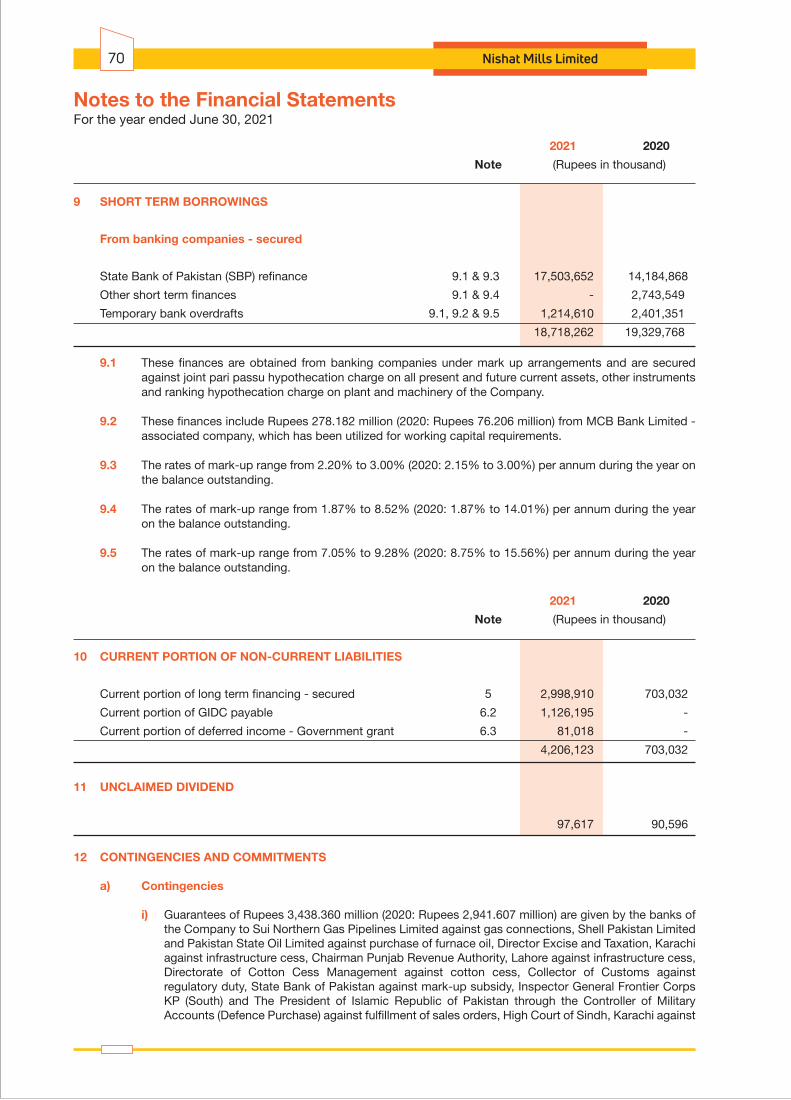
For the year ended June 30, 2021Notes to the Financial Statements
Nishat Mills Limited70
2021 2020
Note (Rupees in thousand)
9 SHORT TERM BORROWINGS
From banking companies - secured
State Bank of Pakistan (SBP) refinance 9.1 & 9.3 17,503,652 14,184,868
Other short term finances 9.1 & 9.4 - 2,743,549
Temporary bank overdrafts 9.1, 9.2 & 9.5 1,214,610 2,401,351
18,718,262 19,329,768
9.1 These finances are obtained from banking companies under mark up arrangements and are secured against joint pari passu hypothecation charge on all present and future current assets, other instruments and ranking hypothecation charge on plant and machinery of the Company.
9.2 These finances include Rupees 278.182 million (2020: Rupees 76.206 million) from MCB Bank Limited - associated company, which has been utilized for working capital requirements.
9.3 The rates of mark-up range from 2.20% to 3.00% (2020: 2.15% to 3.00%) per annum during the year on the balance outstanding.
9.4 The rates of mark-up range from 1.87% to 8.52% (2020: 1.87% to 14.01%) per annum during the year on the balance outstanding.
9.5 The rates of mark-up range from 7.05% to 9.28% (2020: 8.75% to 15.56%) per annum during the year on the balance outstanding.
2021 2020
Note (Rupees in thousand)
10 CURRENT PORTION OF NON-CURRENT LIABILITIES
Current portion of long term financing - secured 5 2,998,910 703,032
Current portion of GIDC payable 6.2 1,126,195 -
Current portion of deferred income - Government grant 6.3 81,018 -
4,206,123 703,032
11 UNCLAIMED DIVIDEND
97,617 90,596
12 CONTINGENCIES AND COMMITMENTS
a) Contingencies
i) Guarantees of Rupees 3,438.360 million (2020: Rupees 2,941.607 million) are given by the banks of the Company to Sui Northern Gas Pipelines Limited against gas connections, Shell Pakistan Limited and Pakistan State Oil Limited against purchase of furnace oil, Director Excise and Taxation, Karachi against infrastructure cess, Chairman Punjab Revenue Authority, Lahore against infrastructure cess, Directorate of Cotton Cess Management against cotton cess, Collector of Customs against regulatory duty, State Bank of Pakistan against mark-up subsidy, Inspector General Frontier Corps KP (South) and The President of Islamic Republic of Pakistan through the Controller of Military Accounts (Defence Purchase) against fulfillment of sales orders, High Court of Sindh, Karachi against

Annual Report 2021 71
the matter of importation of LED lights and to the bank of Hyundai Nishat Motor (Private) Limited (associated company) to secure financial assistance to the associated company. Further, the Company has issued cross corporate guarantees of Rupees 1,173.333 million (2020: Rupees 266.667 million), Rupees 41.600 million (2020: Rupees 21.600 million) and Rupees 1,750 million (2020: Rupees Nil) on behalf of Nishat Linen (Private) Limited - wholly owned subsidiary company, Nishat Hospitality (Private) Limited - wholly owned subsidiary company and Nishat Sutas Dairy Limited - associated company respectively to secure the obligations of subsidiary companies and associated company towards their lenders.
ii) Post dated cheques of Rupees 10,758.912 million (2020: Rupees 8,223.314 million) are issued to customs authorities in respect of duties on imported items availed on the basis of consumption and export plans. If documents of exports are not provided on due dates, cheques issued as security shall be encashable.
b) Commitments
i) Contracts for capital expenditure are approximately of Rupees 3,469.028 million (2020: Rupees 297.715 million).
ii) Letters of credit other than for capital expenditure are of Rupees 4,219.586 million (2020: Rupees 2,146.440 million).
iii) Outstanding foreign currency forward contracts of Rupees 6,400.041 million (2020: Rupees 389.348 million).
2021 2020
Note (Rupees in thousand)
13 PROPERTY, PLANT AND EQUIPMENT
Operating fixed assets 13.1 29,713,681 28,834,861
Capital work-in-progress 13.2 6,212,913 2,457,861
35,926,594 31,292,722

For the year ended June 30, 2021Notes to the Financial Statements
Nishat Mills Limited72
At
30 J
une
2019
Cos
t 1
,810
,233
11
,496
,248
35
,828
,163
1,
008,
932
425,
869
436,
140
235,
063
657,
474
51,8
98,1
22A
ccum
ulat
ed d
epre
ciat
ion
- (4
,924
,129
) (1
6,87
5,97
0)
(612
,922
) (2
43,5
26)
(255
,210
) (1
93,2
28)
(342
,238
) (2
3,44
7,22
3)N
et b
ook
valu
e 1,
810,
233
6,57
2,11
9 18
,952
,193
39
6,01
0 18
2,34
3 18
0,93
0 41
,835
31
5,23
6 28
,450
,899
Year
end
ed 3
0 Ju
ne 2
020
Op
enin
g ne
t b
ook
valu
e
1,81
0,23
3 6,
572,
119
18,9
52,1
93
396,
010
182,
343
180,
930
41,8
35
315,
236
28,4
50,8
99A
dd
ition
s 26
,823
39
3,81
8 2,
582,
793
10,3
79
5,68
6 18
,699
24
,577
14
6,23
0 3,
209,
005
Dis
pos
als:
C
ost
- (4
,300
) (1
43,8
85)
(1,5
75)
- (2
30)
(2,3
95)
(82,
596)
(2
34,9
81)
A
ccum
ulat
ed d
epre
ciat
ion
- 3,
302
100,
439
1,00
1 -
83
1,68
7 54
,733
16
1,24
5
-
(998
) (4
3,44
6)
(574
) -
(147
) (7
08)
(27,
863)
(7
3,73
6)D
epre
ciat
ion
char
ge
- (6
60,1
11)
(1,9
27,0
42)
(40,
130)
(1
8,53
8)
(19,
574)
(1
5,94
2)
(69,
970)
(2
,751
,307
)C
losi
ng n
et b
ook
valu
e 1,
837,
056
6,30
4,82
8 19
,564
,498
36
5,68
5 16
9,49
1 17
9,90
8 49
,762
36
3,63
3 28
,834
,861
At
30 J
une
2020
Cos
t
1,83
7,05
6 11
,885
,766
38
,267
,071
1,
017,
736
431,
555
454,
609
257,
245
721,
108
54,8
72,1
46A
ccum
ulat
ed d
epre
ciat
ion
- (5
,580
,938
) (1
8,70
2,57
3)
(652
,051
) (2
62,0
64)
(274
,701
) (2
07,4
83)
(357
,475
) (2
6,03
7,28
5)N
et b
ook
valu
e 1,
837,
056
6,30
4,82
8 19
,564
,498
36
5,68
5 16
9,49
1 17
9,90
8 49
,762
36
3,63
3 28
,834
,861
Year
end
ed 3
0 Ju
ne 2
021
Op
enin
g ne
t b
ook
valu
e
1,8
37,0
56
6,30
4,82
8 19
,564
,498
36
5,68
5 16
9,49
1 17
9,90
8 49
,762
36
3,63
3 28
,834
,861
Ad
diti
ons
20,8
23
515,
129
3,13
5,51
4 31
,570
17
,196
38
,765
23
,453
18
6,73
9 3,
969,
189
Rev
ersa
l of p
rovi
sion
(9
8,52
8)
- -
- -
- -
- (9
8,52
8)
Tran
sfer
red
to
inve
stm
ent
pro
per
ties:
C
ost
(19,
541)
(9
9,41
0)
- -
- -
- -
(118
,951
)
Acc
umul
ated
dep
reci
atio
n -
90,1
55
- -
- -
- -
90,1
55
(1
9,54
1)
(9,2
55)
- -
- -
- -
(28,
796)
Dis
pos
als:
C
ost
(62,
001)
-
(142
,994
) -
- -
(1,9
86)
(78,
346)
(2
85,3
27)
A
ccum
ulat
ed d
epre
ciat
ion
- -
118,
234
- -
- 1,
583
46,0
56
165,
873
(62,
001)
-
(24,
760)
-
-
- (4
03)
(32,
290)
(1
19,4
54)
Dep
reci
atio
n ch
arge
-
(651
,571
) (2
,020
,417
) (3
8,03
1)
(17,
857)
(1
9,81
6)
(18,
358)
(7
7,54
1)
(2,8
43,5
91)
Clo
sing
net
boo
k va
lue
1,
677,
809
6,15
9,13
1 20
,654
,835
35
9,22
4 16
8,83
0 19
8,85
7 54
,454
44
0,54
1 29
,713
,681
At
30 J
une
2021
Cos
t 1
,677
,809
12
,301
,485
41
,259
,591
1,
049,
306
448,
751
493,
374
278,
712
829,
501
58,3
38,5
29A
ccum
ulat
ed d
epre
ciat
ion
- (6
,142
,354
) (2
0,60
4,75
6)
(690
,082
) (2
79,9
21)
(294
,517
) (2
24,2
58)
(388
,960
) (2
8,62
4,84
8)N
et b
ook
valu
e 1
,677
,809
6,
159,
131
20,6
54,8
35
359,
224
168,
830
198,
857
54,4
54
440,
541
29,7
13,6
81
Ann
ual r
ate
of
dep
reci
atio
n (%
) -
10
10
10
10
10
30
20
Furn
itur
e,fi
xtur
es a
ndo
ffice
equi
pm
ent
Free
hold
land
Bui
ldin
gs
on
free
hold
land
Pla
nt a
ndm
achi
nery
Ele
ctri
cin
stal
lati
ons
Fact
ory
equi
pm
ent
Co
mp
uter
equi
pm
ent
Vehi
cles
To
tal
13.1
Op
erat
ing
fix
ed a
sset
s
(Rup
ees
in t
hous
and
)

Annual Report 2021 73
Free
hold
Lan
d
Land
68K
-1/2
S
- 61
,984
-
61,9
84
67,0
00
5,01
6 N
egot
iatio
n N
isha
t Sut
as D
airy
Lim
ited
- ass
ocia
ted
com
pany
, Lah
ore.
61,9
84
- 61
,984
67
,000
5,
016
Pla
nt a
nd M
achi
nery
Pic
anol
Opt
imax
(Dob
by) L
oom
4
24,5
40
17,4
75
7,06
5 9,
000
1,93
5 N
egot
iatio
n U
nion
Den
im M
ills, K
arac
hi.
Rot
ary
Prin
ting
Mac
hine
Sto
rk
1 56
,794
47
,877
8,
917
9,00
0 83
N
egot
iatio
n La
hore
Dye
ing
& Pr
intin
g M
ills L
imite
d, L
ahor
e.Sa
vio C
one
Win
der
1 9,
394
7,81
2 1,
582
1,58
1 (1
) N
egot
iatio
n Ve
nus
Indu
strie
s (P
rivat
e) L
imite
d, F
aisa
laba
d.Ai
r Com
pres
sor &
Air
Dry
er
6 20
,183
18
,804
1,
379
3,50
0 2,
121
Neg
otia
tion
Gag
an T
extil
e, K
arac
hi.
Toyo
ta A
ir Je
t Loo
ms
3 7,
174
5,93
9 1,
235
4,35
0 3,
115
Neg
otia
tion
Gag
an T
extil
e, K
arac
hi.
Toyo
ta A
ir Je
t Loo
ms
3 9,
566
7,92
3 1,
643
5,80
0 4,
157
Neg
otia
tion
Gag
an T
extil
e, K
arac
hi.
Stitc
hing
Mac
hine
s 12
5 3,
525
2,75
9 76
6 58
3 (1
83)
Neg
otia
tion
Mr.
Hab
ib-u
r-Reh
man
, Fai
sala
bad.
Chi
ller L
G D
oubl
e St
eam
1
5,32
9 4,
369
960
1,45
5 49
5 N
egot
iatio
n Ic
eber
g In
dust
ries
(Priv
ate)
Lim
ited,
Lah
ore.
136,
505
112,
958
23,5
47
35,2
69
11,7
22
Vehi
cles
Hon
da C
ivic
LE
-16A
-174
5 1
3,07
2 1,
706
1,36
6 2,
700
1,33
4 N
egot
iatio
n M
r. A
bdul
lah
Kha
lid, L
ahor
e.To
yota
Cor
olla
LE
C-1
5-64
51
1 1,
683
1,11
0 57
3 85
1 27
8 C
ompa
ny's
Pol
icy
Mr.
Mat
een
Java
id, C
ompa
ny's
em
ploy
ee, F
aisa
laba
d.To
yota
Cor
olla
LE
C-1
5-25
19
1 1,
693
1,13
7 55
6 90
3 34
7 C
ompa
ny's
Pol
icy
Mr.
Sard
ar M
ahm
ood
Akht
ar, C
ompa
ny's
em
ploy
ee, L
ahor
e.H
onda
City
LE
B-1
6-12
69
1 1,
706
1,07
4 63
2 91
0 27
8 C
ompa
ny's
Pol
icy
Mr.
Mum
taz
Has
san,
Com
pany
's e
mpl
oyee
, Lah
ore.
Suz
uki S
wift
LE
F-16
-270
2
1 1,
332
809
523
709
186
Com
pany
's P
olic
y M
r. Ka
mra
n Sh
afiq
ue H
ashm
i, C
ompa
ny's
em
ploy
ee, L
ahor
e.H
yund
ai T
ucso
n A
AC
-254
1
5,80
9 70
2 5,
107
5,50
0 39
3 N
egot
iatio
n M
r. M
usa
Ayu
b K
han,
Lah
ore.
Suz
uki S
wift
LE
D-1
6-32
39
1 1,
328
807
521
708
187
Com
pany
's P
olic
y M
r. Ik
hlaq
Ahm
ad, C
ompa
ny's
em
ploy
ee, L
ahor
e.To
yota
Cor
olla
LE
B-1
8A-4
941
1 2,
927
1,01
4 1,
913
2,92
7 1,
014
Neg
otia
tion
Mr.
Naj
am Y
ousa
f, C
ompa
ny’s
em
ploy
ee, L
ahor
e.H
onda
Civ
ic L
EH
-16-
6047
1
2,43
6 1,
463
973
1,31
2 33
9 C
ompa
ny's
Pol
icy
Mr.
Naj
am Y
ousa
f, C
ompa
ny’s
em
ploy
ee, L
ahor
e.To
yota
Cor
olla
LE
F-15
-546
0 1
1,68
4 1,
073
611
899
288
Com
pany
's P
olic
y M
r. R
ana
Ham
mad
Lat
if Kh
an, C
ompa
ny's
em
ploy
ee, L
ahor
e.S
uzuk
i Cul
tus
LEH
-17-
3801
1
1,27
6 63
0 64
6 87
5 22
9 N
egot
iatio
n M
r. K
ashi
f Naz
ir, C
ompa
ny's
ex-
empl
oyee
, Fai
sala
bad.
Hon
da C
ity L
EB
-18A
-442
4 1
1,34
8 49
0 85
8 1,
183
325
Neg
otia
tion
Mr.
Ras
hid
Ali,
Com
pany
's e
x-em
ploy
ee, F
aisa
laba
d.S
uzuk
i Sw
ift L
EC
-16-
1538
1
1,46
8 92
3 54
5 78
3 23
8 C
ompa
ny's
Pol
icy
Mr.
Rah
at A
li, C
ompa
ny's
em
ploy
ee, F
aisa
laba
d.To
yota
Cor
olla
LE
F-15
-183
1 1
1,69
5 1,
152
543
905
362
Com
pany
's P
olic
y M
r. M
ukht
ar A
hmad
, Com
pany
's e
mpl
oyee
, Lah
ore.
Toyo
ta C
orol
la L
ED
-18-
2590
1
1,82
5 70
5 1,
120
1,75
0 63
0 In
sura
nce
Cla
im
Sec
urity
Gen
eral
Insu
ranc
e C
ompa
ny L
imite
d
- as
soci
ated
com
pany
, Lah
ore.
31,2
82
14,7
95
16,4
87
22,9
15
6,42
8
Aggr
egat
e of
oth
er it
ems
of p
rope
rty,
pl
ant a
nd e
quip
men
t with
indi
vidu
al
bo
ok v
alue
s no
t exc
eedi
ng R
upee
s 50
0,00
0
55,
556
38,1
20
17,4
36
46,8
72
29,4
36
28
5,32
7 16
5,87
3 11
9,45
4 17
2,05
6 52
,602
13.1
.1
Det
ail o
f o
per
atin
g fi
xed
ass
ets,
exc
eed
ing
the
bo
ok
valu
e o
f R
upee
s 50
0,00
0, d
isp
ose
d o
f d
urin
g t
he y
ear
is a
s fo
llow
s:
Des
crip
tio
nA
ccu
mu
late
dd
epre
ciat
ion
Net
bo
ok
valu
e S
ale
pro
ceed
sG
ain
/(L
oss
) M
od
e o
fd
isp
osa
lP
arti
cula
rs o
f p
urc
has
ers
Qu
anti
tyN
os.
Co
st
(Rup
ees
in t
hous
and
)

2021 2020
Note (Rupees in thousand)
13.1.2 Depreciation charge for the year has
been allocated as follows:
Cost of sales 28 2,751,106 2,642,450
Distribution cost 29 10,415 8,322
Administrative expenses 30 71,955 82,994
Capital work-in-progress 10,115 17,541
2,843,591 2,751,307
13.1.3 Particulars of immovable properties (i.e. land and buildings) are as follows:
Manufacturing units and office Address Area of land
Acres
Manufacturing units
Spinning units and Yarn dyeing unit Nishatabad, Faisalabad. 86.56 Spinning units and Power plant Plot No. 172-180 & 188-197, M-3 Industrial City, 90.45 Sahianwala, FIEDMC, 2 K.M., Jhumra Chiniot Road, Chak Jhumra, Faisalabad.
Spinning units and Power plant 20 K.M., Sheikhupura Road, Feroze Wattwan. 67.12
Weaving units and Power plant 12 K.M., Faisalabad Road, Sheikhupura. 85.53
Weaving units, Dyeing and finishing 5 K.M., Nishat Avenue, Off 22 K.M., Ferozepur 115.64 units, Processing unit, Stitching Road, Lahore. units and Power plants
Terry unit 7 K.M., Nishat Avenue, Off 22 K.M., Ferozepur 12.54 Road, Lahore.
Apparel unit 2 K.M., Nishat Avenue, Off 22 K.M., Ferozepur 16.32 Road, Lahore.
Office 7-Main Gulberg, Lahore. 1.12
475.28
For the year ended June 30, 2021Notes to the Financial Statements
Nishat Mills Limited74
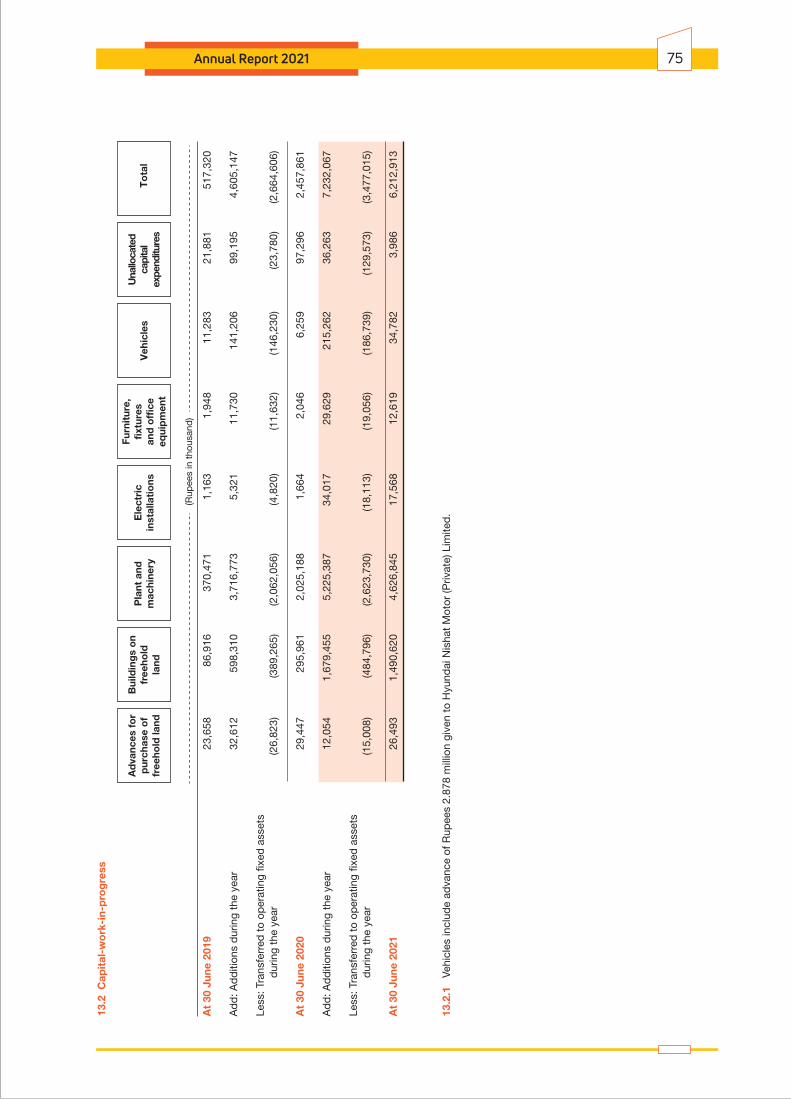
Annual Report 2021 75
Furn
itur
e,fix
ture
san
d o
ffic
eeq
uip
men
t
Ad
vanc
es f
or
pur
chas
e o
ffr
eeho
ld la
nd
Bui
ldin
gs
on
free
hold
land
Pla
nt a
ndm
achi
nery
Ele
ctri
cin
stal
lati
ons
Veh
icle
sU
nallo
cate
dca
pita
lex
pend
iture
sT
ota
l
13.2
Cap
ital
-wo
rk-i
n-p
rog
ress
(Rup
ees
in t
hous
and
)
At
30 J
une
2019
23
,658
86
,916
37
0,47
1 1,
163
1,94
8 11
,283
21
,881
51
7,32
0
Ad
d: A
dd
ition
s d
urin
g th
e ye
ar
32,6
12
598,
310
3,71
6,77
3 5,
321
11,7
30
141,
206
99,1
95
4,60
5,14
7
Less
: Tra
nsfe
rred
to
oper
atin
g fix
ed a
sset
s
d
urin
g th
e ye
ar
(26,
823)
(3
89,2
65)
(2,0
62,0
56)
(4,8
20)
(11,
632)
(1
46,2
30)
(23,
780)
(2
,664
,606
)
At
30 J
une
2020
29
,447
29
5,96
1 2,
025,
188
1,66
4 2,
046
6,25
9 97
,296
2,
457,
861
Ad
d: A
dd
ition
s d
urin
g th
e ye
ar
12,0
54
1,67
9,45
5 5,
225,
387
34,0
17
29,6
29
215,
262
36,2
63
7,23
2,06
7
Less
: Tra
nsfe
rred
to
oper
atin
g fix
ed a
sset
s
d
urin
g th
e ye
ar
(15,
008)
(4
84,7
96)
(2,6
23,7
30)
(18,
113)
(1
9,05
6)
(186
,739
) (1
29,5
73)
(3,4
77,0
15)
At
30 J
une
2021
26
,493
1,
490,
620
4,62
6,84
5 17
,568
12
,619
34
,782
3,
986
6,21
2,91
3
13.2
.1
Vehi
cles
incl
ude
adva
nce
of R
upee
s 2.
878
mill
ion
give
n to
Hyu
ndai
Nis
hat
Mot
or (P
rivat
e) L
imite
d.
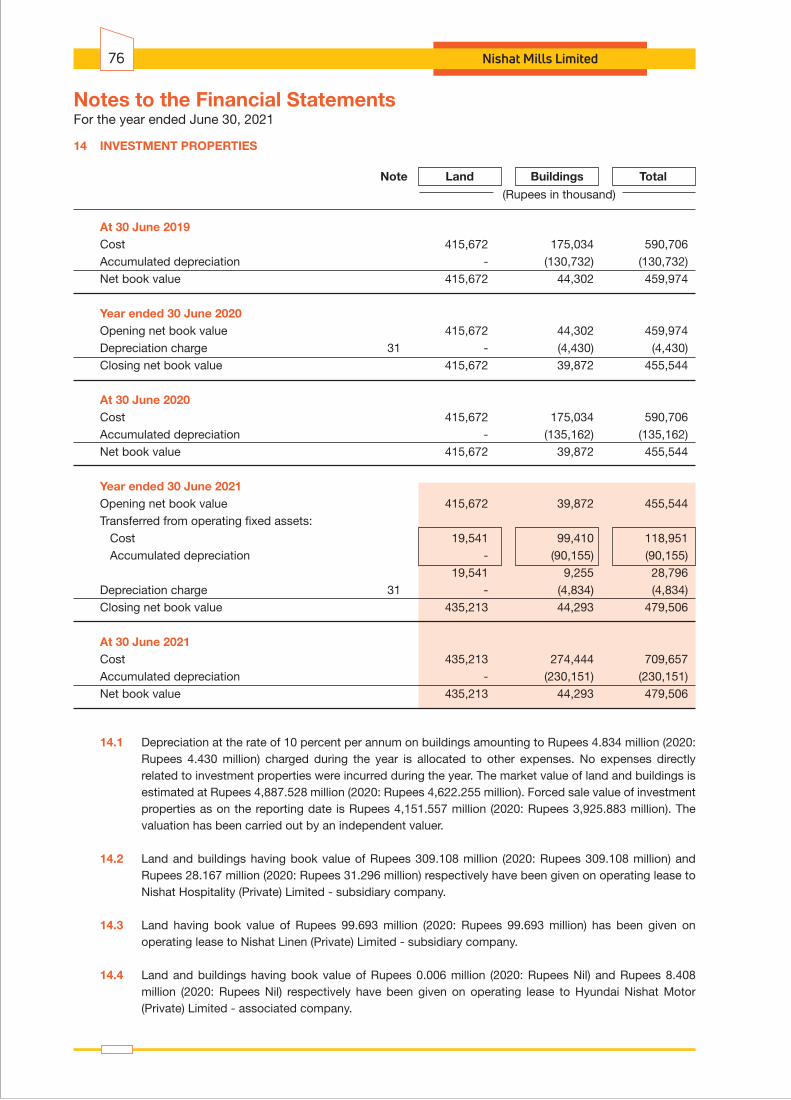
14 INVESTMENT PROPERTIES
Note Land Buildings Total
(Rupees in thousand)
At 30 June 2019 Cost 415,672 175,034 590,706 Accumulated depreciation - (130,732) (130,732) Net book value 415,672 44,302 459,974
Year ended 30 June 2020 Opening net book value 415,672 44,302 459,974 Depreciation charge 31 - (4,430) (4,430) Closing net book value 415,672 39,872 455,544
At 30 June 2020 Cost 415,672 175,034 590,706 Accumulated depreciation - (135,162) (135,162) Net book value 415,672 39,872 455,544
Year ended 30 June 2021 Opening net book value 415,672 39,872 455,544 Transferred from operating fixed assets: Cost 19,541 99,410 118,951 Accumulated depreciation - (90,155) (90,155) 19,541 9,255 28,796 Depreciation charge 31 - (4,834) (4,834) Closing net book value 435,213 44,293 479,506
At 30 June 2021 Cost 435,213 274,444 709,657 Accumulated depreciation - (230,151) (230,151) Net book value 435,213 44,293 479,506
14.1 Depreciation at the rate of 10 percent per annum on buildings amounting to Rupees 4.834 million (2020: Rupees 4.430 million) charged during the year is allocated to other expenses. No expenses directly related to investment properties were incurred during the year. The market value of land and buildings is estimated at Rupees 4,887.528 million (2020: Rupees 4,622.255 million). Forced sale value of investment properties as on the reporting date is Rupees 4,151.557 million (2020: Rupees 3,925.883 million). The valuation has been carried out by an independent valuer.
14.2 Land and buildings having book value of Rupees 309.108 million (2020: Rupees 309.108 million) and Rupees 28.167 million (2020: Rupees 31.296 million) respectively have been given on operating lease to Nishat Hospitality (Private) Limited - subsidiary company.
14.3 Land having book value of Rupees 99.693 million (2020: Rupees 99.693 million) has been given on operating lease to Nishat Linen (Private) Limited - subsidiary company.
14.4 Land and buildings having book value of Rupees 0.006 million (2020: Rupees Nil) and Rupees 8.408 million (2020: Rupees Nil) respectively have been given on operating lease to Hyundai Nishat Motor (Private) Limited - associated company.
For the year ended June 30, 2021Notes to the Financial Statements
Nishat Mills Limited76
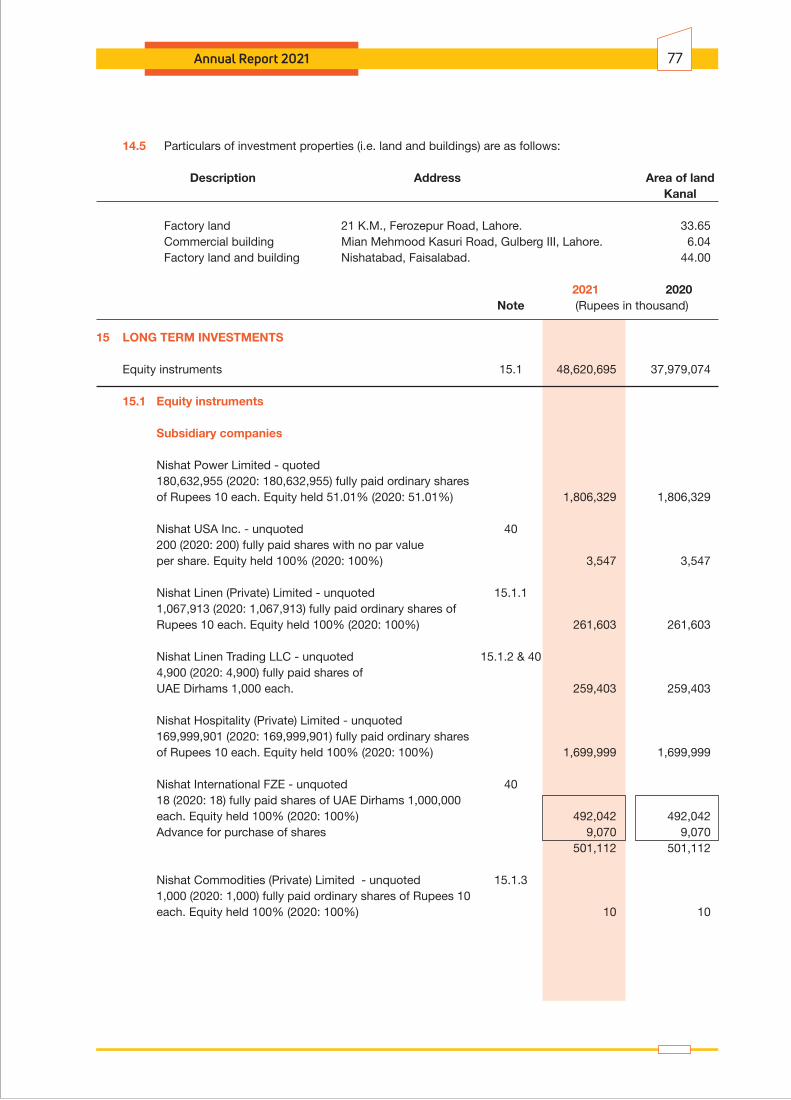
Annual Report 2021 77
14.5 Particulars of investment properties (i.e. land and buildings) are as follows:
Description Address Area of land Kanal
Factory land 21 K.M., Ferozepur Road, Lahore. 33.65 Commercial building Mian Mehmood Kasuri Road, Gulberg III, Lahore. 6.04 Factory land and building Nishatabad, Faisalabad. 44.00
2021 2020 Note (Rupees in thousand)
15 LONG TERM INVESTMENTS
Equity instruments 15.1 48,620,695 37,979,074
15.1 Equity instruments
Subsidiary companies
Nishat Power Limited - quoted 180,632,955 (2020: 180,632,955) fully paid ordinary shares of Rupees 10 each. Equity held 51.01% (2020: 51.01%) 1,806,329 1,806,329
Nishat USA Inc. - unquoted 40 200 (2020: 200) fully paid shares with no par value per share. Equity held 100% (2020: 100%) 3,547 3,547
Nishat Linen (Private) Limited - unquoted 15.1.1 1,067,913 (2020: 1,067,913) fully paid ordinary shares of Rupees 10 each. Equity held 100% (2020: 100%) 261,603 261,603
Nishat Linen Trading LLC - unquoted 15.1.2 & 40 4,900 (2020: 4,900) fully paid shares of UAE Dirhams 1,000 each. 259,403 259,403
Nishat Hospitality (Private) Limited - unquoted 169,999,901 (2020: 169,999,901) fully paid ordinary shares of Rupees 10 each. Equity held 100% (2020: 100%) 1,699,999 1,699,999
Nishat International FZE - unquoted 40 18 (2020: 18) fully paid shares of UAE Dirhams 1,000,000 each. Equity held 100% (2020: 100%) 492,042 492,042 Advance for purchase of shares 9,070 9,070 501,112 501,112
Nishat Commodities (Private) Limited - unquoted 15.1.3 1,000 (2020: 1,000) fully paid ordinary shares of Rupees 10 each. Equity held 100% (2020: 100%) 10 10

2021 2020 Note (Rupees in thousand)
Equity instruments Fair value through other comprehensive income Associated companies (with significant influence) D.G. Khan Cement Company Limited - quoted 137,574,201 (2020: 137,574,201) fully paid ordinary shares of Rupees 10 each. Equity held 31.40% (2020: 31.40%) 3,418,145 3,418,145
Nishat Paper Products Company Limited - unquoted 15.1.4 11,634,199 (2020: 11,634,199) fully paid ordinary shares of Rupees 10 each. Equity held 25% (2020: 25%) 106,802 106,802
Lalpir Power Limited - quoted 15.1.5 109,393,555 (2020: 109,393,555) fully paid ordinary shares of Rupees 10 each. Equity held 28.80% (2020: 28.80%) 1,640,306 1,640,306
Pakgen Power Limited - quoted 15.1.5 102,524,728 (2020: 102,524,728) fully paid ordinary shares of Rupees 10 each. Equity held 27.55% (2020: 27.55%) 1,272,194 1,272,194
Nishat Dairy (Private) Limited - unquoted 15.1.6 60,000,000 (2020: 60,000,000) fully paid ordinary shares of Rupees 10 each. Equity held 12.24% (2020: 12.24%) 496,200 496,200
Nishat Energy Limited - unquoted 15.1.7 250,000 (2020: 250,000) fully paid ordinary shares of Rupees 10 each. Equity held 25% (2020: 25%) - -
Nishat Hotels and Properties Limited - unquoted 15.1.8 74,022,917 (2020: 74,022,917) fully paid ordinary shares of Rupees 10 each. Equity held 6.08% (2020: 7.40%) 740,229 740,229
Hyundai Nishat Motor (Private) Limited - unquoted 15.1.9 & 113,847,600 (2020: 89,700,000) fully paid ordinary shares of 15.1.10 Rupees 10 each. Equity held 12% (2020: 12%) 1,138,476 897,000
Security General Insurance Company Limited - unquoted 15.1.11 10,226,244 (2020: 10,226,244) fully paid ordinary shares of Rupees 10 each. Equity held 15.02% (2020: 15.02%) 11,188 11,188
Nishat Sutas Dairy Limited - unquoted 15.1.12 16,630,000 (2020: 16,630,000) fully paid ordinary shares of Rupees 10 each. Equity held 34.46% (2020: 34.46%) 166,300 166,300
Equity instruments Fair value through other comprehensive income Associated companies (others)
MCB Bank Limited - quoted 88,015,291 (2020: 88,015,291) fully paid ordinary shares of Rupees 10 each. Equity held 7.43% (2020: 7.43%) 10,208,262 10,208,262
Adamjee Insurance Company Limited - quoted 102,809 (2020: 102,809) fully paid ordinary shares of Rupees 10 each. Equity held 0.03% (2020: 0.03%) 2,116 2,116
For the year ended June 30, 2021Notes to the Financial Statements
Nishat Mills Limited78
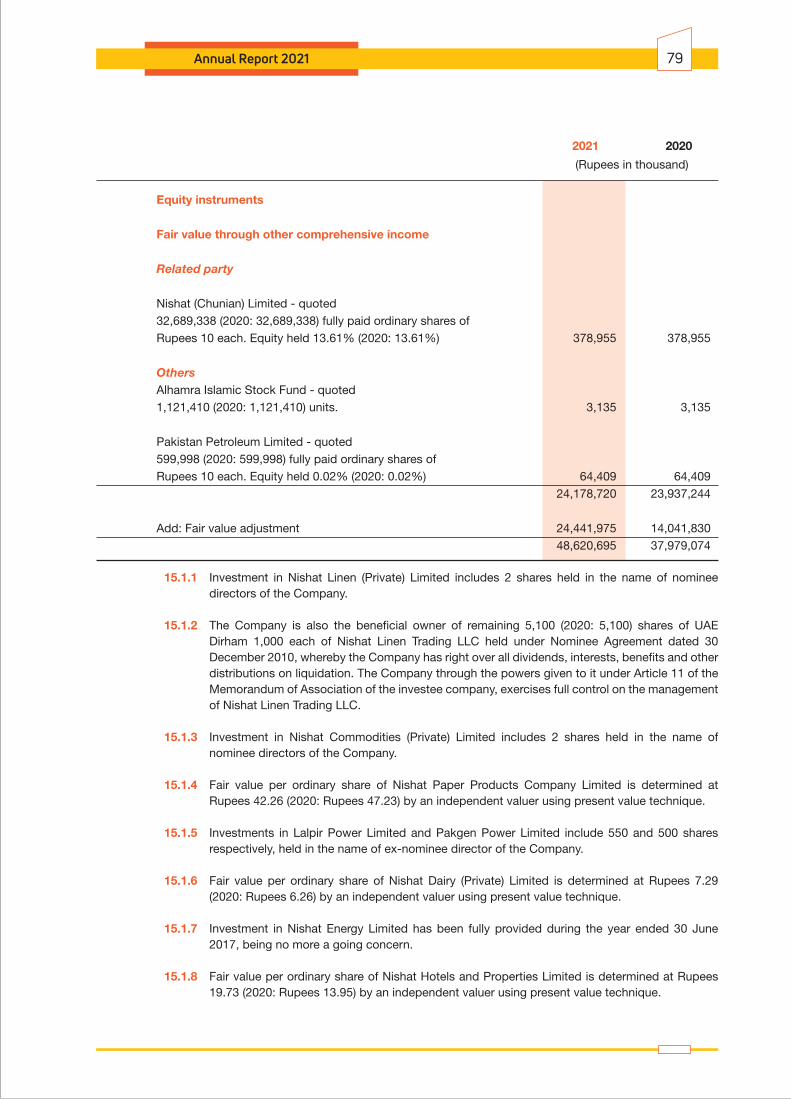
Annual Report 2021 79
2021 2020
(Rupees in thousand)
Equity instruments
Fair value through other comprehensive income
Related party
Nishat (Chunian) Limited - quoted 32,689,338 (2020: 32,689,338) fully paid ordinary shares of Rupees 10 each. Equity held 13.61% (2020: 13.61%) 378,955 378,955
Others Alhamra Islamic Stock Fund - quoted 1,121,410 (2020: 1,121,410) units. 3,135 3,135
Pakistan Petroleum Limited - quoted 599,998 (2020: 599,998) fully paid ordinary shares of Rupees 10 each. Equity held 0.02% (2020: 0.02%) 64,409 64,409 24,178,720 23,937,244
Add: Fair value adjustment 24,441,975 14,041,830 48,620,695 37,979,074
15.1.1 Investment in Nishat Linen (Private) Limited includes 2 shares held in the name of nominee directors of the Company.
15.1.2 The Company is also the beneficial owner of remaining 5,100 (2020: 5,100) shares of UAE Dirham 1,000 each of Nishat Linen Trading LLC held under Nominee Agreement dated 30 December 2010, whereby the Company has right over all dividends, interests, benefits and other distributions on liquidation. The Company through the powers given to it under Article 11 of the Memorandum of Association of the investee company, exercises full control on the management of Nishat Linen Trading LLC.
15.1.3 Investment in Nishat Commodities (Private) Limited includes 2 shares held in the name of nominee directors of the Company.
15.1.4 Fair value per ordinary share of Nishat Paper Products Company Limited is determined at Rupees 42.26 (2020: Rupees 47.23) by an independent valuer using present value technique.
15.1.5 Investments in Lalpir Power Limited and Pakgen Power Limited include 550 and 500 shares respectively, held in the name of ex-nominee director of the Company.
15.1.6 Fair value per ordinary share of Nishat Dairy (Private) Limited is determined at Rupees 7.29 (2020: Rupees 6.26) by an independent valuer using present value technique.
15.1.7 Investment in Nishat Energy Limited has been fully provided during the year ended 30 June 2017, being no more a going concern.
15.1.8 Fair value per ordinary share of Nishat Hotels and Properties Limited is determined at Rupees 19.73 (2020: Rupees 13.95) by an independent valuer using present value technique.

For the year ended June 30, 2021Notes to the Financial Statements
Nishat Mills Limited80
15.1.9 Investment in Hyundai Nishat Motor (Private) Limited includes 4 shares held in the name of nominee directors of the Company.
15.1.10 Fair value per ordinary share of Hyundai Nishat Motor (Private) Limited is determined at Rupees 38.42 (2020: Rupees 12.20) by an independent valuer using present value technique.
15.1.11 Fair value per ordinary share of Security General Insurance Company Limited is determined at Rupees 65.87 (2020: Rupees 57.79) by an independent valuer using present value technique.
15.1.12 Nishat Sutas Dairy Limited has not yet started its operations, hence, cost of investment is considered as an appropriate estimate of fair value.
2021 2020 Note (Rupees in thousand)
16 LONG TERM LOANS
Considered good: Executives - secured 16.1 & 16.2 408,852 226,090 Other employees - secured 16.2 217,059 199,934 625,911 426,024
Less: Current portion shown under current assets 21 Executives 93,079 59,288 Other employees 64,455 61,472 157,534 120,760 468,377 305,264
16.1 Maximum aggregate balance due from executives at the end of any month during the year was Rupees 408.852 million (2020: Rupees 226.809 million).
16.2 These represent loans given to executives and other employees as per the Company's policy for house construction and general purposes. These are secured against balance to the credit of employees in the provident fund trust and are recoverable in equal monthly installments. Interest charged during the year range from 0% to 4% (2020: 0% to 4%) per annum on the balance outstanding.
16.3 The fair value adjustment in accordance with the requirements of IFRS 9 'Financial Instruments' arising in respect of staff loans is not considered material and hence not recognized.
17 LONG TERM DEPOSITS
Security deposits 156,984 104,783
18 STORES, SPARE PARTS AND LOOSE TOOLS
Stores 18.1 1,761,183 1,549,127
Spare parts 842,338 707,508
Loose tools 6,222 4,152
2,609,743 2,260,787
Less: Provision for slow moving, obsolete and damaged store items 18.2 (4,141) (4,218)
2,605,602 2,256,569

Annual Report 2021 81
18.1 These include stores in transit of Rupees 274.334 million (2020: Rupees 215.818 million).
18.2 Provision for slow moving, obsolete and damaged store items
2021 2020
Note (Rupees in thousand)
Balance as on 01 July 4,218 4,224
Less: Provision reversed during the year 32 (77) (6)
Balance as on 30 June 4,141 4,218
19 STOCK IN TRADE
Raw materials 9,283,755 12,821,768
Work-in-process 19.2 2,814,471 2,032,268
Finished goods 19.3 5,874,465 5,899,507
17,972,691 20,753,543
19.1 Stock in trade of Rupees 503.811 million (2020: Rupees 564.159 million) is being carried at net realizable value.
19.2 This includes stock of Rupees 17.961 million (2020: Rupees 11.612 million) sent to outside parties for processing.
19.3 Finished goods include stock in transit of Rupees 1,888.392 million (2020: Rupees 1,296.236 million).
19.4 The aggregate amount of write-down of inventories to net realizable value recognized as an expense during the year was Rupees 22.161 million (2020: Rupees 20.298 million).
2021 2020
Note (Rupees in thousand)
20 TRADE DEBTS
Considered good:
Secured (against letters of credit) 1,048,918 1,004,826 Unsecured: - Related parties 20.3 & 20.4 365,157 512,589 - Others 5,150,837 2,783,184 6,564,912 4,300,599 Less: Allowance for expected credit losses 20.5 (15,660) (15,496) 6,549,252 4,285,103
20.1 Foreign jurisdictions of trade debts
Europe 1,826,134 1,315,838 Asia, Africa and Australia 1,061,145 702,049 United States of America and Canada 1,178,982 559,675 4,066,261 2,577,562
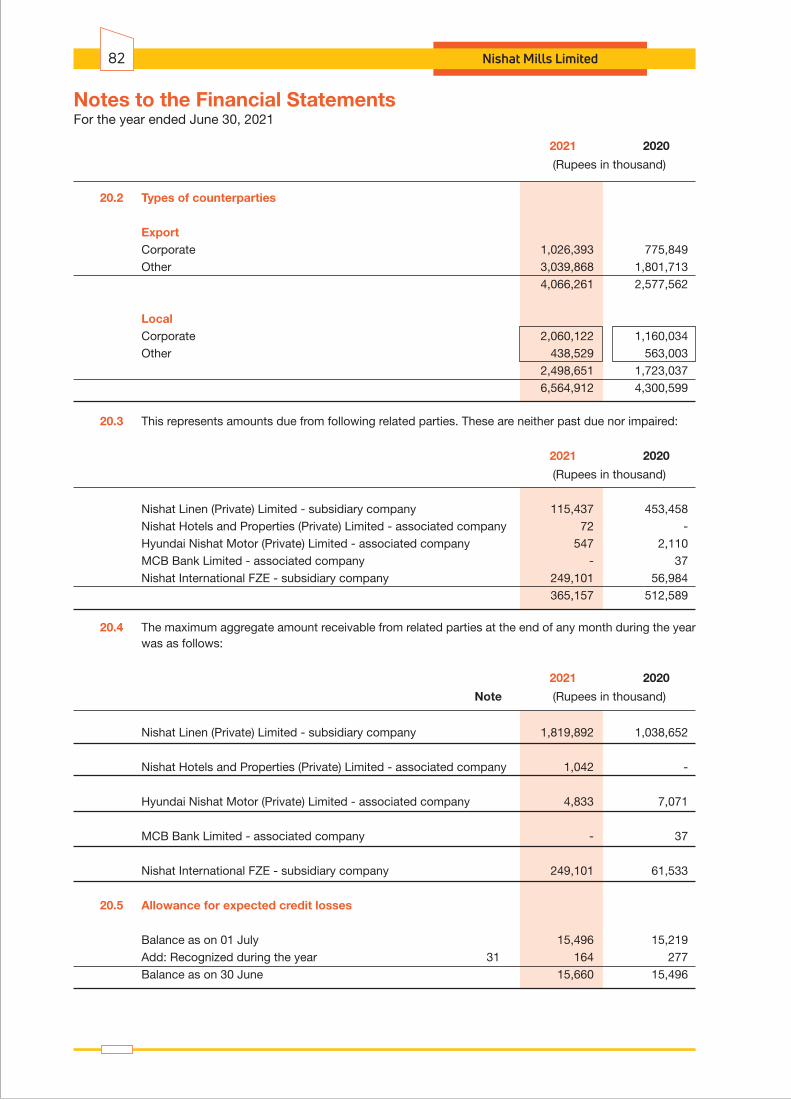
For the year ended June 30, 2021Notes to the Financial Statements
Nishat Mills Limited82
2021 2020
(Rupees in thousand)
20.2 Types of counterparties
Export Corporate 1,026,393 775,849 Other 3,039,868 1,801,713 4,066,261 2,577,562
Local Corporate 2,060,122 1,160,034 Other 438,529 563,003 2,498,651 1,723,037 6,564,912 4,300,599
20.3 This represents amounts due from following related parties. These are neither past due nor impaired:
2021 2020
(Rupees in thousand)
Nishat Linen (Private) Limited - subsidiary company 115,437 453,458 Nishat Hotels and Properties (Private) Limited - associated company 72 - Hyundai Nishat Motor (Private) Limited - associated company 547 2,110 MCB Bank Limited - associated company - 37 Nishat International FZE - subsidiary company 249,101 56,984 365,157 512,589
20.4 The maximum aggregate amount receivable from related parties at the end of any month during the year was as follows:
2021 2020
Note (Rupees in thousand)
Nishat Linen (Private) Limited - subsidiary company 1,819,892 1,038,652
Nishat Hotels and Properties (Private) Limited - associated company 1,042 -
Hyundai Nishat Motor (Private) Limited - associated company 4,833 7,071
MCB Bank Limited - associated company - 37
Nishat International FZE - subsidiary company 249,101 61,533
20.5 Allowance for expected credit losses
Balance as on 01 July 15,496 15,219 Add: Recognized during the year 31 164 277 Balance as on 30 June 15,660 15,496
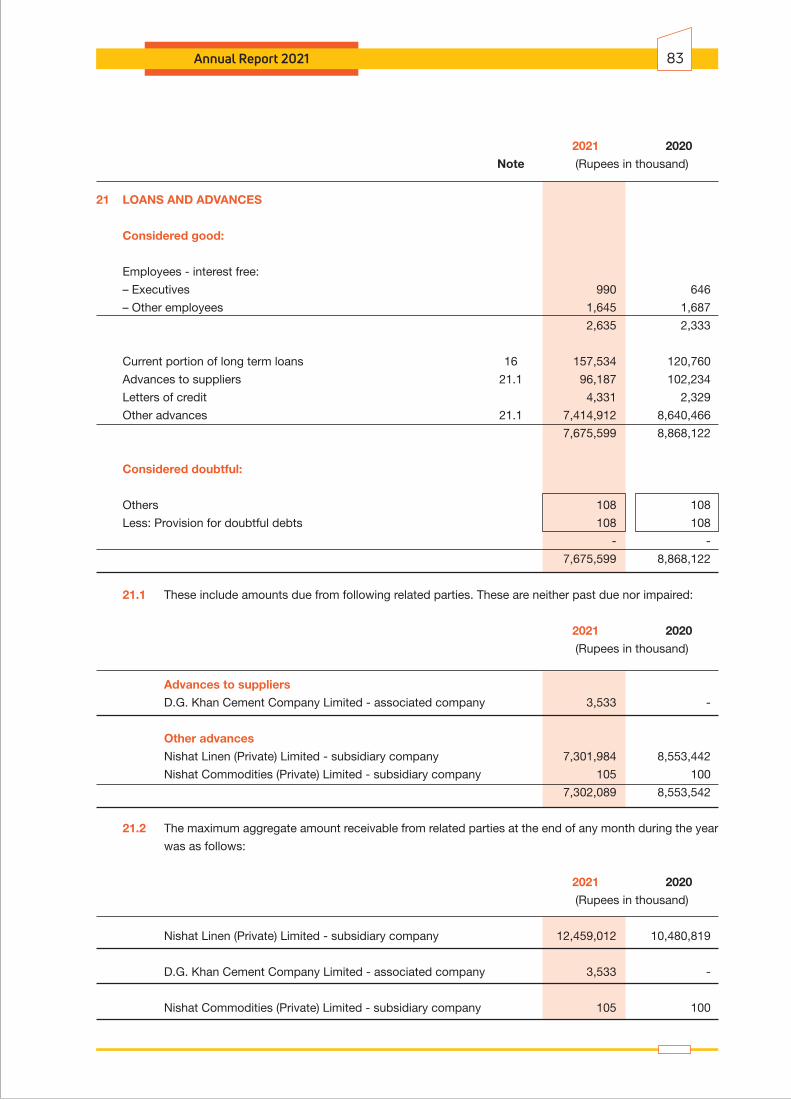
Annual Report 2021 83
2021 2020
Note (Rupees in thousand)
21 LOANS AND ADVANCES
Considered good:
Employees - interest free:
– Executives 990 646
– Other employees 1,645 1,687
2,635 2,333
Current portion of long term loans 16 157,534 120,760
Advances to suppliers 21.1 96,187 102,234
Letters of credit 4,331 2,329
Other advances 21.1 7,414,912 8,640,466
7,675,599 8,868,122
Considered doubtful:
Others 108 108
Less: Provision for doubtful debts 108 108
- -
7,675,599 8,868,122
21.1 These include amounts due from following related parties. These are neither past due nor impaired:
2021 2020
(Rupees in thousand)
Advances to suppliers
D.G. Khan Cement Company Limited - associated company 3,533 -
Other advances
Nishat Linen (Private) Limited - subsidiary company 7,301,984 8,553,442
Nishat Commodities (Private) Limited - subsidiary company 105 100
7,302,089 8,553,542
21.2 The maximum aggregate amount receivable from related parties at the end of any month during the year
was as follows:
2021 2020
(Rupees in thousand)
Nishat Linen (Private) Limited - subsidiary company 12,459,012 10,480,819
D.G. Khan Cement Company Limited - associated company 3,533 -
Nishat Commodities (Private) Limited - subsidiary company 105 100

2021 2020 Note (Rupees in thousand)
22 ADVANCE INCOME TAX - NET
Advance income tax 1,720,339 1,532,080 Provision for taxation (1,148,032) (973,000) 572,307 559,080
23 SHORT TERM DEPOSITS AND PREPAYMENTS
Deposits 486 486 Prepayments 80,342 67,143 80,828 67,629
24 OTHER RECEIVABLES
Considered good:
Export rebate and claims 124,772 167,730 Duty draw back 1,218,043 576,897 Sales tax refundable 3,274,640 2,745,670 Fair value of forward exchange contracts 8,672 345 Miscellaneous receivables 24.1 76,582 77,923 4,702,709 3,568,565
24.1 These include Rupees 41.677 million (2020: Rupees 41 million) receivable from Nishat Hospitality (Private) Limited - subsidiary company. It is in the ordinary course of business, interest free and past due. The maximum aggregate amount receivable from Nishat Hospitality (Private) Limited - subsidiary company at the end of any month during the year was Rupees 62.253 million (2020: Rupees 41 million). The age analysis of this balance is more than 6 months (2020: 1 to 6 months).
25 ACCRUED INTEREST
2021 2020 Note (Rupees in thousand)
On short term loans and advances to: Nishat Linen (Private) Limited - subsidiary company 25.1 17,642 36,659 Profit receivable on bank deposits 25.2 11,243 16 28,885 36,675
25.1 These are neither past due nor impaired. The maximum aggregate amount receivable from related parties at the end of any month during the year was as follows:
Nishat Linen (Private) Limited - subsidiary company 41,855 51,544 Nishat Hospitality (Private) Limited - subsidiary company - 56
25.2 Profit on bank deposits of Rupees 11.243 million (2020: Rupees Nil) is receivable from MCB Bank Limited - associated company. These are neither past due nor impaired. The maximum aggregate amount receivable from MCB Bank Limited - associated company at the end of any month during the year was Rs 11.243 million.
For the year ended June 30, 2021Notes to the Financial Statements
Nishat Mills Limited84

2021 2020 Note (Rupees in thousand)
26 CASH AND BANK BALANCES
With banks:
On current accounts 26.1 & 26.2 Including US$ 195,575 (2020: US$ 37,817) 178,051 20,870
Term deposit receipts 26.3 & 26.4 5,075,000 90,596
On PLS saving accounts 26.5 Including US$ 117 (2020: US$ 117) 242 20 5,253,293 111,486 Cash in hand 19,052 16,755 5,272,345 128,241
26.1 Cash at banks includes balance of Rupees 3.906 million (2020: Rupees 3.649 million) with MCB Bank Limited - associated company.
26.2 Cash at banks includes balance of Rupees 0.443 million (2020: Rupees 0.074 million) with MCB Islamic Bank Limited - related party.
26.3 The term deposits with banking companies having maturity period upto one month carried rate of profit ranging from 6.35% to 7.20% (2020: 6.40% to 14%) per annum.
26.4 This represents term deposit receipt of Rupees 5,075 million (2020: Rupees Nil) having maturity period of 30 days and carry profit at the rate ranging from 6.70% to 6.80% (2020: Nil) per annum with MCB Bank Limited - associated company.
26.5 Rate of profit on bank deposits range from 5.50% to 5.55% (2020: 8% to 8.75%) per annum.
2021 2020 Note (Rupees in thousand) 27 REVENUE
Revenue from contracts with customers:
Export sales 46,364,366 45,346,137 Local sales 27.1 18,021,220 9,792,119 Processing income 6,021,237 5,159,573 70,406,823 60,297,829 Export rebate 228,790 199,090 Duty draw back 795,397 407,177 71,431,010 60,904,096
27.1 Local sales
Sales 27.1.1 21,902,683 12,336,152 Less: Sales tax (3,881,463) (2,544,033) 18,021,220 9,792,119
27.1.1 These include sales of Rupees 10,063.857 million (2020: Rupees 2,977.374 million) made to direct exporters against standard purchase orders (SPOs). Further, local sales include waste sales of Rupees 2,055.750 million (2020: Rupees 1,329.396 million).
Annual Report 2021 85

Reg
ion
Eur
ope
280
,073
41
7,37
1 8,
297,
897
8,54
6,07
0 40
7,56
6 37
9,90
9 9,
163,
902
6,79
6,64
8 4,
259,
144
4,25
4,27
0 -
- 22
,408
,582
20
,394
,268
Uni
ted
Sta
tes
of A
mer
ica
and
Can
ada
111
,351
17
4,34
0 66
6,99
8 95
0,99
3 14
,967
19
,056
3,
272,
902
1,94
2,77
0 3,
552,
638
1,77
7,27
6 -
-
7,
618,
856
4,86
4,43
5
Asi
a, A
fric
a, A
ustr
alia
5
,418
,179
5,
840,
160
2,04
5,85
5 2,
059,
456
7,71
7,40
3 11
,339
,362
1,
794,
530
1,10
8,86
4 38
5,14
8 34
5,85
9 -
-
17
,361
,115
20
,693
,701
Pak
ista
n 1
0,86
3,27
9 5,
101,
420
6,27
9,48
3 3,
848,
734
3,50
4,26
3 2,
948,
002
3,17
3,66
8 2,
880,
932
167,
945
129,
377
53,8
19
43,2
27
24,0
42,4
57
14,9
51,6
92
1
6,67
2,88
2 11
,533
,291
17
,290
,233
15
,405
,253
11
,644
,199
14
,686
,329
17
,405
,002
12
,729
,214
8,
364,
875
6,50
6,78
2 53
,819
43
,227
71
,431
,010
60
,904
,096
Tim
ing
of
reve
nue
reco
gni
tio
n
Pro
duc
ts a
nd s
ervi
ces
tran
sfer
red
at
a p
oint
in t
ime
16,
672,
882
11,5
33,2
91
17,2
90,2
33
15,4
05,2
53
11,6
44,1
99
14,6
86,3
29
17,4
05,0
02
12,7
29,2
14
8,36
4,87
5 6,
506,
782
53,8
19
43,2
27
71,4
31,0
10
60,9
04,0
96
Pro
duc
ts a
nd s
ervi
ces
tran
sfer
red
ove
r tim
e -
-
- -
- -
- -
- -
- -
- -
16
,672
,882
11
,533
,291
17
,290
,233
15
,405
,253
11
,644
,199
14
,686
,329
17
,405
,002
12
,729
,214
8,
364,
875
6,50
6,78
2 53
,819
43
,227
71
,431
,010
6
0,90
4,09
6
Maj
or
pro
duc
ts /
ser
vice
line
s
Yar
n 1
6,43
9,07
3 11
,217
,597
-
- -
- -
- -
- -
- 16
,439
,073
11
,217
,597
Com
ber
Noi
l 2
33,8
09
315,
694
- -
- -
- -
- -
- -
233,
809
315,
694
Gre
y C
loth
-
-
17,2
90,2
33
15,4
05,2
53
- -
- -
- -
- -
17,2
90,2
33
15,4
05,2
53
Pro
cess
Clo
th
-
- -
- 11
,644
,199
14
,686
,329
-
- -
- -
- 11
,644
,199
14
,686
,329
Mad
e U
ps
-
- -
- -
- 16
,381
,568
12
,729
,214
-
- -
- 16
,381
,568
12
,729
,214
Gar
men
ts
-
- -
- -
- -
- 8,
364,
875
6,50
6,78
2 -
- 8,
364,
875
6,50
6,78
2
Tow
els
and
Bat
h R
obe
-
- -
- -
- 1,
023,
434
- -
- -
- 1,
023,
434
-
Ele
ctric
ity
-
- -
- -
- -
- -
- 53
,819
43
,227
53
,819
43
,227
1
6,67
2,88
2 11
,533
,291
17
,290
,233
15
,405
,253
11
,644
,199
14
,686
,329
17
,405
,002
12
,729
,214
8,
364,
875
6,50
6,78
2 53
,819
43
,227
71
,431
,010
60
,904
,096
27.2
Th
e am
ount
of R
upee
s 50
7.19
8 m
illio
n in
clud
ed in
con
trac
t lia
bili
ties
(Not
e 7)
at
30 J
une
2020
has
bee
n re
cogn
ised
as
reve
nue
in 2
021
(202
0: R
upee
s 20
6.54
7 m
illio
n).
27.3
D
isag
gre
gat
ion
of
reve
nue
fro
m c
ont
ract
s w
ith
cust
om
ers
In
the
follo
win
g ta
ble
, rev
enue
from
con
trac
ts w
ith c
usto
mer
s is
dis
aggr
egat
ed b
y p
rimar
y ge
ogra
phi
cal m
arke
t, m
ajor
pro
duc
ts a
nd s
ervi
ce li
nes
and
tim
ing
of r
even
ue r
ecog
nitio
n:
27.4
R
even
ue is
rec
ogni
sed
at
poi
nt in
tim
e as
per
the
ter
ms
and
con
diti
ons
of u
nder
lyin
g co
ntra
cts
with
cus
tom
ers.
Des
crip
tio
nS
pin
ning
Wea
ving
Dye
ing
Ho
me
Tex
tile
and
Ter
ryG
arm
ents
Po
wer
Gen
erat
ion
To
tal
2021
2020
2021
2020
2021
2020
2021
2020
2021
2020
2021
2020
2021
2020
(Rup
ees
in t
hous
and
)
For the year ended June 30, 2021Notes to the Financial Statements
Nishat Mills Limited86

Annual Report 2021 87
2021 2020 Note (Rupees in thousand)
28 COST OF SALES
Raw materials consumed 28.1 35,741,113 31,278,042 Processing charges 368,169 368,437 Salaries, wages and other benefits 28.2 7,396,591 6,363,510 Stores, spare parts and loose tools consumed 7,683,252 6,797,584 Packing materials consumed 1,817,735 1,320,633 Repair and maintenance 451,401 367,026 Fuel and power 6,071,039 5,990,329 Insurance 45,340 50,123 Other factory overheads 544,570 508,668 Depreciation 13.1.2 2,751,106 2,642,450 62,870,316 55,686,802
Work-in-process Opening stock 2,032,268 2,015,512 Closing stock (2,814,471) (2,032,268) (782,203) (16,756) Cost of goods manufactured 62,088,113 55,670,046
Finished goods Opening stock 5,899,507 3,857,431 Closing stock (5,874,465) (5,899,507) 25,042 (2,042,076) 62,113,155 53,627,970
28.1 Raw materials consumed
Opening stock 12,821,768 11,135,516 Add: Purchased during the year 32,203,100 32,964,294 45,024,868 44,099,810 Less: Closing stock (9,283,755) (12,821,768) 35,741,113 31,278,042
28.2 Salaries, wages and other benefits include provident fund contribution of Rupees 197.258 million (2020: Rupees 185.766 million) by the Company.

2021 2020 Note (Rupees in thousand)
29 DISTRIBUTION COST
Salaries and other benefits 29.1 536,995 500,062 Outward freight and handling 1,442,292 1,218,212 Commission to selling agents 774,117 666,384 Royalty 29.2 9,103 11,591 Fuel cost 139,261 177,148 Travelling and conveyance 23,604 126,211 Rent, rates and taxes 11,932 17,085 Postage and telephone 92,383 95,856 Insurance 16,802 18,932 Vehicles’ running 21,090 17,695 Entertainment 7,350 7,223 Printing and stationery 3,526 2,794 Repair and maintenance 5,571 7,603 Fee and subscription 2,032 222 Depreciation 13.1.2 10,415 8,322 3,096,473 2,875,340
29.1 Salaries and other benefits include provident fund contribution of Rupees 27.278 million (2020: Rupees 25.794 million) by the Company.
29.2 Particulars of royalty paid during the year are as follows:
Relationship with the Name of the company Registered address Company or directors
Related / Other (Rupees in thousand)
American and Efird LLC 22 American Street, Other 5,967 6,299 Mount Holly, North Carolina, 28120.
2021 2020 Note (Rupees in thousand)
30 ADMINISTRATIVE EXPENSES
Salaries and other benefits 30.1 987,202 883,755 Vehicles’ running 47,109 42,813 Travelling and conveyance 14,880 30,456 Rent, rates and taxes 2,489 2,787 Insurance 8,715 8,916 Entertainment 29,416 24,082 Legal and professional 21,110 23,114 Auditor's remuneration 30.2 6,380 5,807 Advertisement 346 1,488 Postage and telephone 7,340 6,900 Electricity and gas 12,281 10,525 Printing and stationery 23,532 20,540 Repair and maintenance 48,084 38,514 Fee and subscription 8,851 7,253 Depreciation 13.1.2 71,955 82,994 Miscellaneous 50,403 48,357 1,340,093 1,238,301
2021 2020
For the year ended June 30, 2021Notes to the Financial Statements
Nishat Mills Limited88
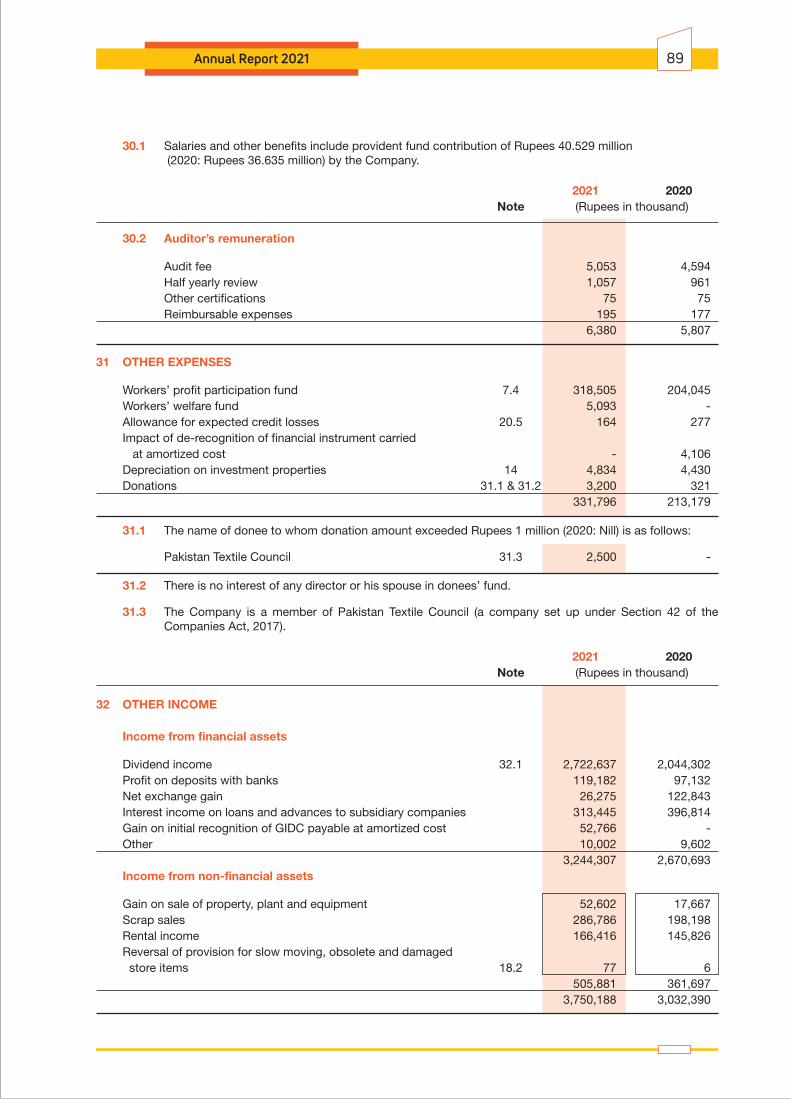
Annual Report 2021 89
30.1 Salaries and other benefits include provident fund contribution of Rupees 40.529 million (2020: Rupees 36.635 million) by the Company.
2021 2020 Note (Rupees in thousand) 30.2 Auditor’s remuneration
Audit fee 5,053 4,594 Half yearly review 1,057 961 Other certifications 75 75 Reimbursable expenses 195 177 6,380 5,807
31 OTHER EXPENSES
Workers’ profit participation fund 7.4 318,505 204,045 Workers’ welfare fund 5,093 - Allowance for expected credit losses 20.5 164 277 Impact of de-recognition of financial instrument carried at amortized cost - 4,106 Depreciation on investment properties 14 4,834 4,430 Donations 31.1 & 31.2 3,200 321 331,796 213,179
31.1 The name of donee to whom donation amount exceeded Rupees 1 million (2020: Nill) is as follows:
Pakistan Textile Council 31.3 2,500 -
31.2 There is no interest of any director or his spouse in donees’ fund.
31.3 The Company is a member of Pakistan Textile Council (a company set up under Section 42 of the Companies Act, 2017).
2021 2020 Note (Rupees in thousand) 32 OTHER INCOME
Income from financial assets
Dividend income 32.1 2,722,637 2,044,302 Profit on deposits with banks 119,182 97,132 Net exchange gain 26,275 122,843 Interest income on loans and advances to subsidiary companies 313,445 396,814 Gain on initial recognition of GIDC payable at amortized cost 52,766 - Other 10,002 9,602 3,244,307 2,670,693 Income from non-financial assets
Gain on sale of property, plant and equipment 52,602 17,667 Scrap sales 286,786 198,198 Rental income 166,416 145,826 Reversal of provision for slow moving, obsolete and damaged store items 18.2 77 6 505,881 361,697 3,750,188 3,032,390
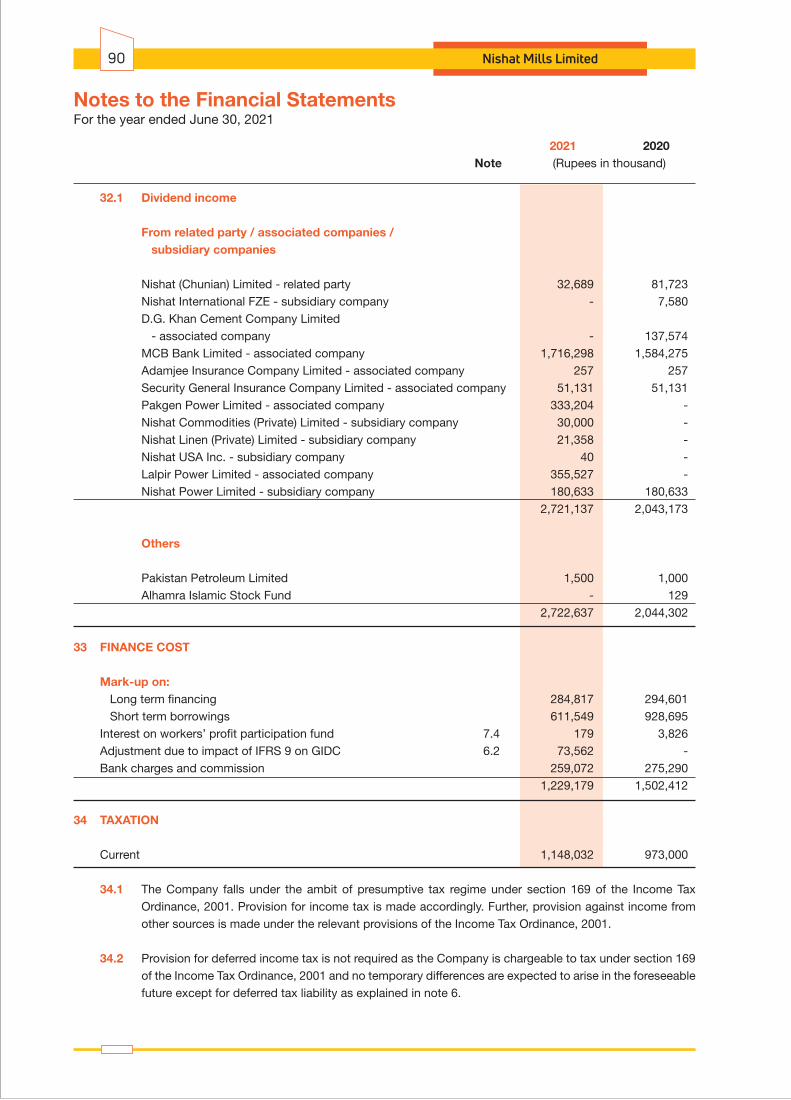
2021 2020 Note (Rupees in thousand)
32.1 Dividend income
From related party / associated companies / subsidiary companies
Nishat (Chunian) Limited - related party 32,689 81,723 Nishat International FZE - subsidiary company - 7,580 D.G. Khan Cement Company Limited - associated company - 137,574 MCB Bank Limited - associated company 1,716,298 1,584,275 Adamjee Insurance Company Limited - associated company 257 257 Security General Insurance Company Limited - associated company 51,131 51,131 Pakgen Power Limited - associated company 333,204 - Nishat Commodities (Private) Limited - subsidiary company 30,000 - Nishat Linen (Private) Limited - subsidiary company 21,358 - Nishat USA Inc. - subsidiary company 40 - Lalpir Power Limited - associated company 355,527 - Nishat Power Limited - subsidiary company 180,633 180,633 2,721,137 2,043,173
Others
Pakistan Petroleum Limited 1,500 1,000 Alhamra Islamic Stock Fund - 129 2,722,637 2,044,302
33 FINANCE COST
Mark-up on: Long term financing 284,817 294,601 Short term borrowings 611,549 928,695 Interest on workers’ profit participation fund 7.4 179 3,826 Adjustment due to impact of IFRS 9 on GIDC 6.2 73,562 - Bank charges and commission 259,072 275,290 1,229,179 1,502,412
34 TAXATION
Current 1,148,032 973,000
34.1 The Company falls under the ambit of presumptive tax regime under section 169 of the Income Tax Ordinance, 2001. Provision for income tax is made accordingly. Further, provision against income from other sources is made under the relevant provisions of the Income Tax Ordinance, 2001.
34.2 Provision for deferred income tax is not required as the Company is chargeable to tax under section 169 of the Income Tax Ordinance, 2001 and no temporary differences are expected to arise in the foreseeable future except for deferred tax liability as explained in note 6.
For the year ended June 30, 2021Notes to the Financial Statements
Nishat Mills Limited90

Annual Report 2021 91
2021 2020 (Rupees in thousand)
34.3 Reconciliation between tax expense and accounting profit
Accounting profit before taxation 7,070,502 4,479,284 Applicable tax rate 29% 29%
Tax on accounting profit 2,050,446 1,298,992
Tax effect of dividend income taxed at a lower rate (446,372) (299,732) Tax effect of final tax regime income taxed at a lower rate (160,505) 150,236 Tax effect of income that are not considered in determining taxable liability (297,014) (175,818) Others 1,477 (678) 1,148,032 973,000
35 EARNINGS PER SHARE - BASIC AND DILUTED There is no dilutive effect on the basic earnings per share which is based on:
2021 2020
Profit attributable to ordinary shareholders (Rupees in thousand) 5,922,470 3,506,284
Weighted average number of ordinary shares (Numbers) 351,599,848 351,599,848
Earnings per share (Rupees) 16.84 9.97
2021 2020 Note (Rupees in thousand)
36 CASH GENERATED FROM OPERATIONS
Profit before taxation 7,070,502 4,479,284 Adjustments for non-cash charges and other items:
Depreciation 2,838,310 2,738,196 Gain on sale of property, plant and equipment (52,602) (17,667) Dividend income (2,722,637) (2,044,302) Allowance for expected credit losses 164 277 Net exchange gain (26,275) (122,843) Interest income on loans and advances to subsidiary companies (313,445) (396,814) Impact of de-recognition of financial instrument carried at amortized cost - 4,106 Finance cost 1,229,179 1,502,412 Reversal of provision for slow moving, obsolete and damaged store items (77) (6) Gain on initial recognition of GIDC payable at amortised cost (110,431) - Working capital changes 36.1 575,689 (2,128,361)
8,488,377 4,014,282
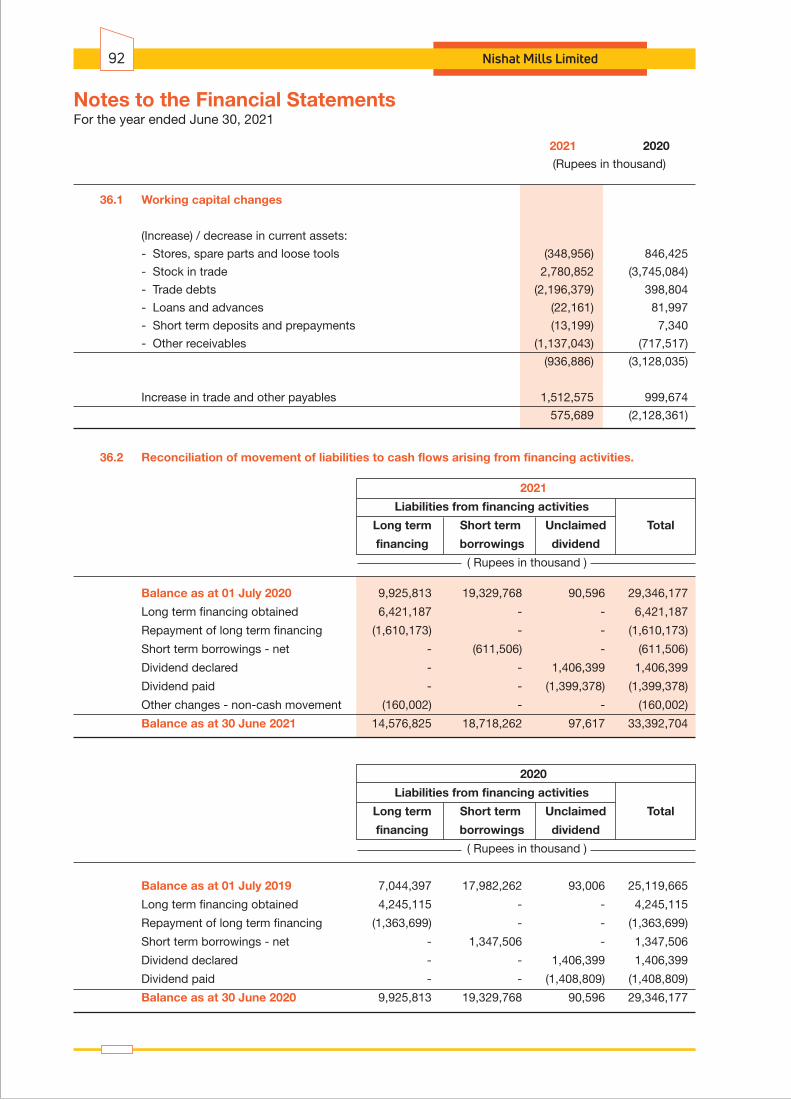
For the year ended June 30, 2021Notes to the Financial Statements
Nishat Mills Limited92
36.2 Reconciliation of movement of liabilities to cash flows arising from financing activities.
2021
Liabilities from financing activities
Long term Short term Unclaimed Total
financing borrowings dividend
( Rupees in thousand )
Balance as at 01 July 2020 9,925,813 19,329,768 90,596 29,346,177
Long term financing obtained 6,421,187 - - 6,421,187
Repayment of long term financing (1,610,173) - - (1,610,173)
Short term borrowings - net - (611,506) - (611,506)
Dividend declared - - 1,406,399 1,406,399
Dividend paid - - (1,399,378) (1,399,378)
Other changes - non-cash movement (160,002) - - (160,002)
Balance as at 30 June 2021 14,576,825 18,718,262 97,617 33,392,704
2020
Liabilities from financing activities
Long term Short term Unclaimed Total
financing borrowings dividend
( Rupees in thousand )
Balance as at 01 July 2019 7,044,397 17,982,262 93,006 25,119,665
Long term financing obtained 4,245,115 - - 4,245,115
Repayment of long term financing (1,363,699) - - (1,363,699)
Short term borrowings - net - 1,347,506 - 1,347,506
Dividend declared - - 1,406,399 1,406,399
Dividend paid - - (1,408,809) (1,408,809)
Balance as at 30 June 2020 9,925,813 19,329,768 90,596 29,346,177
2021 2020
(Rupees in thousand)
36.1 Working capital changes
(Increase) / decrease in current assets:
- Stores, spare parts and loose tools (348,956) 846,425
- Stock in trade 2,780,852 (3,745,084)
- Trade debts (2,196,379) 398,804
- Loans and advances (22,161) 81,997
- Short term deposits and prepayments (13,199) 7,340
- Other receivables (1,137,043) (717,517)
(936,886) (3,128,035)
Increase in trade and other payables 1,512,575 999,674
575,689 (2,128,361)

Annual Report 2021 93
37 EVENTS AFTER THE REPORTING PERIOD
The Board of Directors of the Company has proposed a cash dividend for the year ended 30 June 2021 of Rupees 4 per share (2020: Rupees 4 per share) at their meeting held on 20 September, 2021. The Board of Directors also proposed to transfer Rupees 4,516 million (2020: Rupees 2,101 million) from un-appropriated profit to general reserve. However, these events have been considered as non-adjusting events under IAS 10 'Events after the Reporting Period' and have not been recognized in these financial statements.
38 REMUNERATION OF CHIEF EXECUTIVE OFFICER, DIRECTOR AND EXECUTIVES
The aggregate amount charged in the financial statements for remuneration including all benefits to Chief Executive Officer, Director and Executives of the Company is as follows:
38.1 Chief Executive Officer and certain executives of the Company are provided with Company maintained vehicles and certain executives are also provided with free housing facility alongwith utilities.
38.2 Aggregate amount charged in the financial statements for meeting fee to five directors (2020: five directors) was Rupees 1.490 million (2020: Rupees 1.080 million).
38.3 No remuneration was paid to non-executive directors of the Company.
38.4 This represents remuneration including all benefits paid to a director for the period from July 2019 to March 2020. As on the reporting date, there are no paid directors of the Company.
Chief Executive Officer Director Executives2021 2020 2021 2020 2021 2020
( Rupees in thousand )
Managerial remuneration 37,189 32,503 - 11,163 683,563 554,058
Allowances
Cost of living allowance - - - 1 1,023 781
House rent 13,521 13,001 - 216 174,176 148,293
Conveyance - - - - 904 880
Medical 3,380 3,250 - 912 57,482 47,939
Utilities - - - 3,385 75,673 61,649
Special allowance - - - 2 646 529
Contribution to provident fund trust - - - 871 56,650 47,016
Leave encashment - - - - 18,091 12,867
54,090 48,754 - 16,550 1,068,208 874,012
Number of persons 1 1 Note 38.4 Note 38.4 261 222

39 TRANSACTIONS WITH RELATED PARTIES The related parties comprise subsidiary companies, associated undertakings, other related parties, post
employment benefit plan and key management personnel. The Company in the normal course of business carries out transactions with various related parties. Detail of transactions with related parties, other than those which have been specifically disclosed elsewhere in these financial statements are as follows:
2021 2020
(Rupees in thousand)
Subsidiary companies
Investment made - 405,000 Dividend income 232,031 188,213 Purchase of goods and services 963,962 472,165 Sale of goods and services 8,069,801 7,303,323 Interest income 313,445 396,814 Rental income 77,710 61,810 Short term loans given 41,838,370 39,353,653 Repayment of short term loans 43,089,828 37,941,748
Associated companies
Investment made 241,476 403,300 Purchase of goods and services 155,859 76,595 Sale of goods and services 37,912 12,181 Interest income 28,572 - Rental income 6,035 1,228 Purchase of operating fixed assets 44,434 - Sale of operating fixed assets 67,000 819 Dividend income 2,456,417 1,773,237 Dividend paid 122,105 121,487 Insurance premium paid 160,090 144,897 Insurance claims received 59,983 50,440 Finance cost 8,230 14,811
Other related parties
Dividend income 32,689 81,723 Purchase of goods and services 2,440,916 2,699,390 Sale of goods and services 536,703 176,937 Company’s contribution to provident fund trust 266,667 249,304
39.1 Detail of compensation to key management personnel comprising of chief executive officer, director and executives is disclosed in note 38.
For the year ended June 30, 2021Notes to the Financial Statements
Nishat Mills Limited94

Annual Report 2021 95
39.2 Following are the related parties with whom the Company had entered into transactions or have arrangements / agreements in place:
Transactions entered or agreements and / or arrangements in Percentage of place during the shareholding financial year ended
2021 2020
Nishat USA Inc. Wholly owned subsidiary company Yes Yes 100 Nishat Agriculture Farming (Private) Limited Common directorship No Yes None Nishat Dairy (Private) Limited Common directorship and shareholding Yes No 12.24 Nishat Sutas Dairy Limited Common directorship and shareholding Yes Yes 31.46 Nishat Hotels and Properties Limited Common directorship and shareholding Yes Yes 6.08 Nishat (Raiwind) Hotels and Properties Limited Common directorship No No None Nishat (Aziz Avenue) Hotels and Properties Limited Common directorship No No None Security General Insurance Company Limited Common directorship and shareholding Yes Yes 15.02 Nishat Commodities Wholly owned subsidiary company and (Private) Limited common directorship Yes Yes 100 Nishat Hospitality (Private) Limited Wholly owned subsidiary company Yes Yes 100 Nishat Power Limited Common directorship and subsidiary company Yes Yes 51.01 Nishat Energy Limited Shareholding No No 25 Pakgen Power Limited Common directorship and shareholding Yes No 27.55 Lalpir Power Limited Common directorship and shareholding Yes No 28.80 Nishat Paper Products Company Limited Common directorship and shareholding No No 25 Nishat Linen (Private) Limited Wholly owned subsidiary company Yes Yes 100 Nishat Linen Trading LLC Wholly owned subsidiary company No No 100 Nishat International FZE Wholly owned subsidiary company Yes Yes 100 China Guangzhou Nishat Wholly owned subsidiary of Nishat Global Co., Ltd. International FZE (subsidiary company) No No 100 Pakistan Aviators and Aviation (Private) Limited Common directorship No No None Nishat Developers (Private) Limited Common directorship No No None Nishat Real Estates Development Company (Private) Limited Common directorship No No None Hyundai Nishat Motor (Private) Limited Common directorship and shareholding Yes Yes 12 D.G. Khan Cement Company Limited Common directorship and shareholding Yes Yes 31.40 Adamjee Life Assurance Company Limited Common directorship Yes Yes None Adamjee Insurance Company Limited Common directorship and shareholding Yes Yes 0.03 MCB Bank Limited Common directorship and shareholding Yes Yes 7.43 MCB Islamic Bank Limited Wholly owned subsidiary of associated company No Yes None Nishat (Chunian) Limited Shareholding Yes Yes 13.61 Lalpir Solar Power Wholly owned subsidiary of Nishat (Private) Limited Power Limited (subsidiary company) No No 51.01 Nishat Agrotech Farms Supplies (Private) Limited Common directorship No No None Nishat Chunian Power Executive of the Company is appointed Limited (NCPL) as Director on the Board of NCPL No No None Sanifa Agri Services Limited Associate of wholly owned subsidiary company No Yes None Nishat Mills Employees Provident Fund Trust Post-employment benefit plan Yes Yes None
Name of the related party Basis of relationship

39.3 Particulars of companies incorporated outside Pakistan with whom the Company had entered into transactions or had agreements and / or arrangements in place are as follows:
Nishat USA Inc. USA Wholly owned subsidiary company 100
Nishat Linen Trading LLC UAE Wholly owned subsidiary company 100
Nishat International FZE UAE Wholly owned subsidiary company 100
China Guangzhou Nishat Global Co., Ltd. China Wholly owned subsidiary of 100
Nishat International FZE
Name of the Company Country ofincorporation Basis of association Percentage of
shareholding
For the year ended June 30, 2021Notes to the Financial Statements
Nishat Mills Limited96
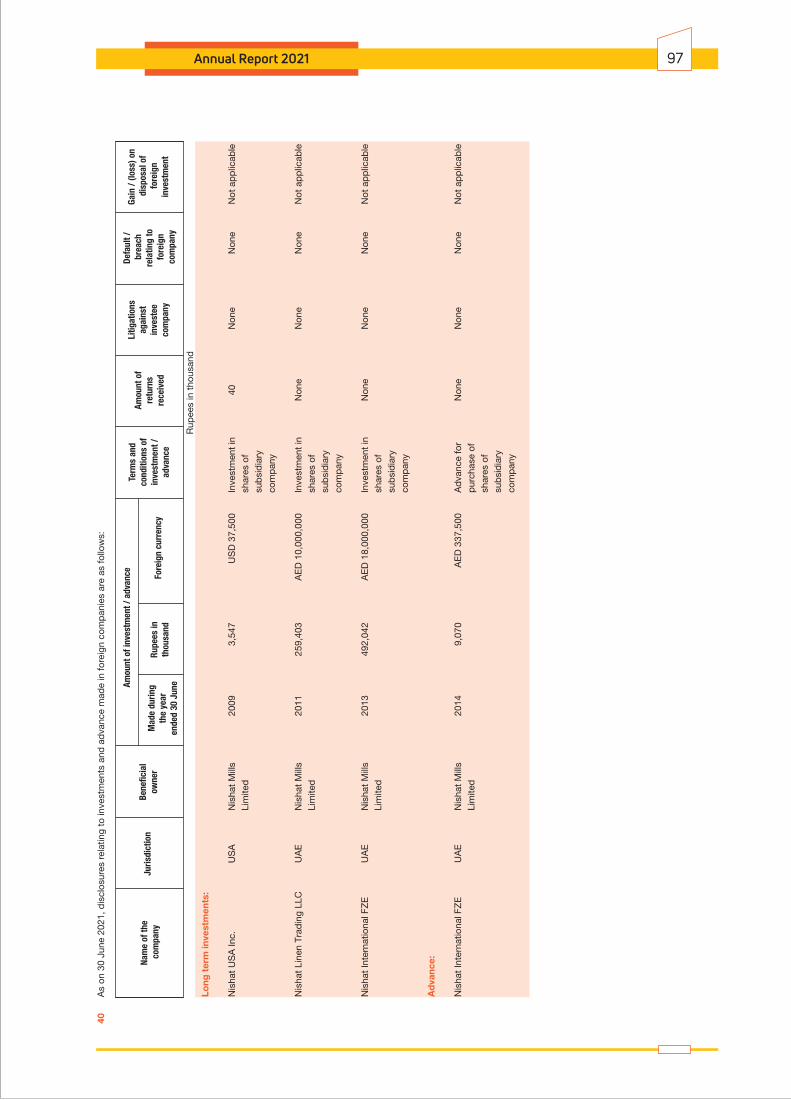
Annual Report 2021 97
Long
ter
m in
vest
men
ts:
Nis
hat
US
A In
c.
US
A
Nis
hat
Mill
s
2009
3
,547
U
SD
37,
500
In
vest
men
t in
40
N
one
Non
e N
ot a
pp
licab
le
Li
mite
d
sh
ares
of
sub
sid
iary
com
pan
y
Nis
hat
Line
n Tr
adin
g LL
C
UA
E
Nis
hat
Mill
s
2011
2
59,4
03
AE
D 1
0,00
0,00
0
Inve
stm
ent
in
Non
e N
one
Non
e N
ot a
pp
licab
le
Li
mite
d
sh
ares
of
sub
sid
iary
com
pan
y
Nis
hat
Inte
rnat
iona
l FZ
E
UA
E
Nis
hat
Mill
s 20
13
492
,042
A
ED
18,
000,
000
In
vest
men
t in
N
one
Non
e N
one
Not
ap
plic
able
Lim
ited
shar
es o
f
su
bsi
dia
ry
co
mp
any
A
dva
nce:
Nis
hat
Inte
rnat
iona
l FZ
E
UA
E
Nis
hat
Mill
s 20
14
9,0
70
AE
D 3
37,5
00
Ad
vanc
e fo
r N
one
Non
e N
one
Not
ap
plic
able
Lim
ited
pur
chas
e of
shar
es o
f
su
bsi
dia
ry
co
mp
any
40
As
on 3
0 Ju
ne 2
021,
dis
clos
ures
rel
atin
g to
inve
stm
ents
and
ad
vanc
e m
ade
in fo
reig
n co
mp
anie
s ar
e as
follo
ws:
Gain
/ (lo
ss) o
n d
ispo
sal o
f fo
reig
nin
vest
men
t
Defa
ult /
bre
ach
rela
ting
to fo
reig
n c
ompa
ny
Litig
atio
nsag
ains
tin
vest
eeco
mpa
ny
Amou
nt o
fre
turn
s re
ceiv
ed
Term
s an
dco
nditi
ons
ofin
vest
men
t /ad
vanc
eRu
pees
inth
ousa
nd
Mad
e du
ring
the
year
ende
d 30
Jun
e
Nam
e of
the
com
pany
Bene
ficia
low
ner
Fore
ign
curr
ency
Rup
ees
in t
hous
and
Juris
dict
ion
Amou
nt o
f inv
estm
ent /
adv
ance

41
PR
OV
IDE
NT
FU
ND
A
s at
the
rep
ortin
g d
ate,
The
Nis
hat M
ills
Em
plo
yees
Pro
vid
ent F
und
Tru
st is
in th
e p
roce
ss o
f reg
ular
izin
g its
inve
stm
ents
in a
ccor
dan
ce w
ith s
ectio
n 21
8 of
the
Com
pan
ies
Act
, 201
7
and
the
reg
ulat
ions
form
ulat
ed fo
r th
is p
urp
ose
by
Sec
uriti
es a
nd E
xcha
nge
Com
mis
sion
of P
akis
tan.
42
NU
MB
ER
OF
EM
PLO
YE
ES
2021
20
20
N
umb
er o
f em
plo
yees
as
on 3
0 Ju
ne
20
,599
18
,278
A
vera
ge n
umb
er o
f em
plo
yees
dur
ing
the
year
19,3
69
18,5
58
Long
ter
m in
vest
men
ts:
Nis
hat
US
A In
c.
US
A
Nis
hat
Mill
s
2009
3
,547
U
SD
37,
500
In
vest
men
t in
N
one
Non
e N
one
Not
ap
plic
able
Lim
ited
shar
es o
f
su
bsi
dia
ry
co
mp
any
Nis
hat
Line
n Tr
adin
g LL
C
UA
E
Nis
hat
Mill
s
2011
2
59,4
03
AE
D 1
0,00
0,00
0
Inve
stm
ent
in
Non
e N
one
Non
e N
ot a
pp
licab
le
Li
mite
d
sh
ares
of
sub
sid
iary
com
pan
y
Nis
hat
Inte
rnat
iona
l FZ
E
UA
E
Nis
hat
Mill
s 20
13
492
,042
A
ED
18,
000,
000
In
vest
men
t in
7,
580
Non
e N
one
Not
ap
plic
able
Lim
ited
shar
es o
f
su
bsi
dia
ry
co
mp
any
A
dva
nce:
Nis
hat
Inte
rnat
iona
l FZ
E
UA
E
Nis
hat
Mill
s
2014
9
,070
A
ED
337
,500
A
dva
nce
for
Non
e N
one
Non
e N
ot a
pp
licab
le
Li
mite
d
p
urch
ase
of
sh
ares
of
sub
sid
iary
com
pan
y
40.1
A
s on
30
June
202
0, d
iscl
osur
es r
elat
ing
to in
vest
men
ts a
nd a
dva
nce
mad
e in
fore
ign
com
pan
ies
are
as fo
llow
s:
Gai
n /
(loss
)o
n d
isp
osa
l o
f fo
reig
nin
vest
men
t
Def
ault
/ b
reac
hre
lati
ng t
o f
ore
ign
co
mp
any
Liti
gat
ions
agai
nst
inve
stee
com
pan
y
Am
oun
t o
fre
turn
s re
ceiv
ed
Rup
ees
in t
hous
and
Term
s an
dco
ndit
ions
of
inve
stm
ent
/ad
vanc
e
Rup
ees
inth
ous
and
Mad
e d
urin
gth
e ye
aren
ded
30
June
Nam
e o
f th
e c
om
pan
yB
enef
icia
lo
wne
rFo
reig
n cu
rren
cyJu
risd
icti
on
Am
oun
t o
f in
vest
men
t /
adva
nce
For the year ended June 30, 2021Notes to the Financial Statements
Nishat Mills Limited98
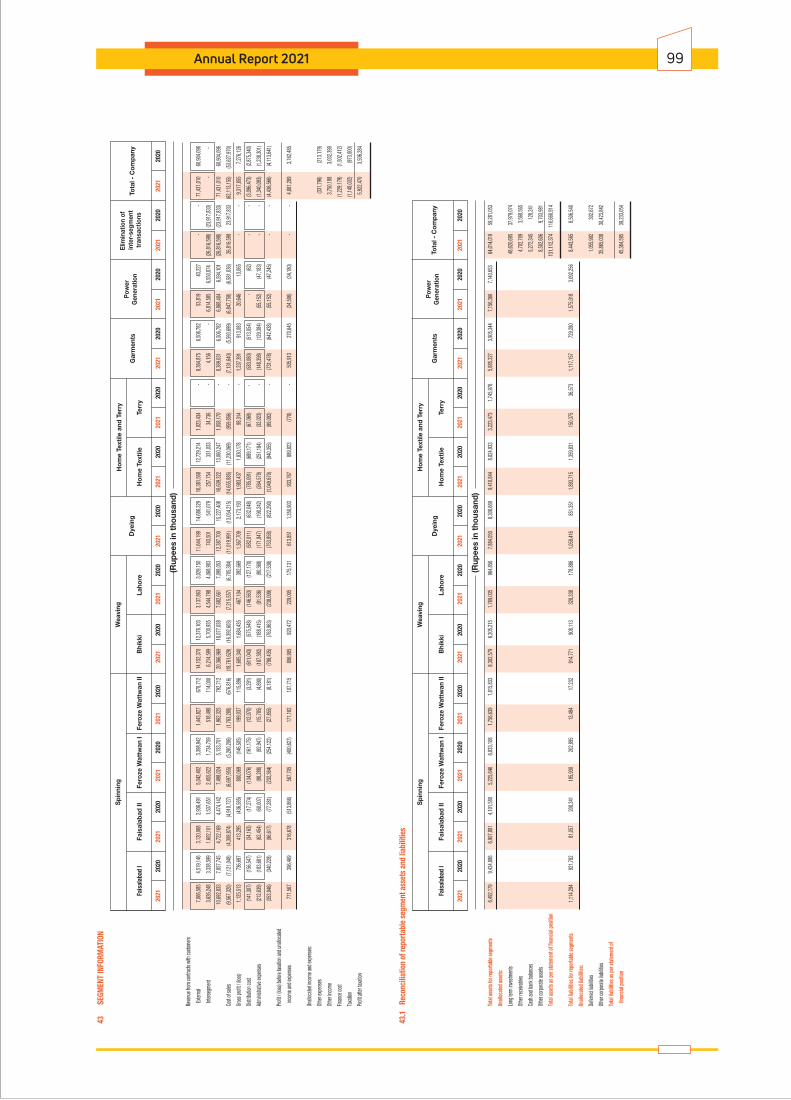
Annual Report 2021 99
Wea
ving
Spi
nnin
g
Dye
ing
Hom
e Te
xtile
Hom
e Te
xtile
and
Ter
ryPo
wer
Gen
erat
ion
Tota
l - C
ompa
ny
2021
2020
2021
2020
2021
2020
2021
2020
(Rup
ees
in th
ousa
nd)
2021
2021
2020
2021
2020
2020
2021
2020
2021
2020
2021
2021
2020
2021
2020
2020
Fais
alab
ad I
Fais
alab
ad II
Fero
ze W
attw
an II
Fero
ze W
attw
an I
Bhi
kki
Laho
re
2021
2020
Elim
inat
ion
of
inte
r-se
gmen
ttr
ansa
ctio
nsTe
rry
Gar
men
ts
43
SEGM
ENT
INFO
RMAT
ION
Reve
nue f
rom co
ntrac
ts wi
th cu
stome
rs
Exte
rnal
7,066
,585
4,519
,146
3,120
,068
2,936
,491
5,042
,402
3,398
,942
1,44
3,827
67
8,712
14
,152,3
70
12,37
6,103
3,1
37,86
3 3,0
29,15
0 11
,644,1
99
14,68
6,329
16
,381,5
68
12,72
9,214
1,0
23,43
4 -
8,36
4,875
6,5
06,78
2 53
,819
43,22
7 -
- 71
,431,0
10
60,90
4,096
Inte
rsegm
ent
3,626
,248
3,338
,599
1,602
,101
1,537
,651
2,455
,622
1,73
4,759
51
8,498
11
4,000
6,2
14,59
9 5,7
00,93
5 4,5
44,79
8 4,0
68,90
3 74
3,501
54
1,079
25
7,754
33
1,033
34
,736
- 4,1
56
- 6,8
14,58
5 6,5
50,87
4 (26
,816,5
98)
(23,91
7,833
) -
-
10
,692,8
33
7,857
,745
4,722
,169
4,474
,142
7,498
,024
5,133
,701
1,962
,325
792,7
12
20,36
6,969
18
,077,0
38
7,682
,661
7,098
,053
12,38
7,700
15
,227,4
08
16,63
9,322
13
,060,2
47
1,058
,170
- 8,3
69,03
1 6,5
06,78
2 6,8
68,40
4 6,5
94,10
1 (26
,816,5
98)
(23,91
7,833
) 71
,431,0
10
60,90
4,096
Cost
of sa
les
(9,56
7,320
) (7,
121,0
48)
(4,30
8,874
) (4,
910,7
27)
(6,69
7,955
) (5,
280,2
06)
(1,76
3,288
) (67
6,816
) (1
8,761
,629)
(16,39
2,603
) (7,
215,5
57)
(6,70
5,384
) (11
,019,9
91)
(13,05
4,215
) (14
,655,8
85)
(11,23
0,069
) (95
9,856
) -
(7,13
1,640
) (5,
593,6
99)
(6,84
7,758
) (6,
581,0
36)
26,81
6,598
23
,917,8
33
(62,11
3,155
) (53
,627,9
70)
Gros
s prof
it / (lo
ss)
1,125
,513
736,6
97
413,2
95
(436,5
85)
800,0
69
(146,5
05)
199,0
37
115,8
96
1,605
,340
1,684
,435
467,1
04
392,6
69
1,367
,709
2,17
3,193
1,9
83,43
7 1,8
30,17
8 98
,314
- 1,2
37,39
1 91
3,083
20
,646
13,06
5 -
- 9,3
17,85
5 7,2
76,12
6
Distrib
ution
cost
(14
1,307
) (15
6,547
) (34
,163)
(17,2
74)
(134,0
76)
(161,1
75)
(12,07
0) (3,
291)
(611,0
43)
(575
,548)
(146,5
63)
(127,1
70)
(582
,011)
(632
,048)
(785
,091)
(689,1
71)
(67,06
9) -
(583,0
80)
(513
,054)
- (62
) -
- (3,
096,4
73)
(2,87
5,340
)
Admi
nistra
tive e
xpen
ses
(212,6
39)
(183,6
81)
(62,4
54)
(60,00
7) (9
8,288
) (9
2,947
) (1
5,785
) (4
,890)
(187
,392)
(188
,415)
(91,5
36)
(90,3
68)
(171,8
47)
(190,2
42)
(264,5
79)
(251
,184)
(32,02
3) -
(148,3
98)
(129,3
84)
(55,15
2) (4
7,183
) -
- (1
,340,0
93)
(1,23
8,301
)
(3
53,94
6) (34
0,228
) (96
,617)
(77,28
1) (23
2,364
) (25
4,122
) (27
,855)
(8,18
1) (79
8,435
) (76
3,963
) (23
8,099
) (21
7,538
) (75
3,858
) (8
22,29
0) (1,
049,6
70)
(940,3
55)
(99,09
2) -
(731,4
78)
(642,4
38)
(55,15
2) (47
,245)
- -
(4,43
6,566
) (4,
113,6
41)
Profi
t / (lo
ss) b
efore
taxati
on an
d una
lloca
ted
inc
ome a
nd ex
pens
es
771,5
67
396,4
69
316,6
78
(513
,866)
567,7
05
(400,6
27)
171,1
82
107,7
15
806,9
05
920,4
72
229,0
05
175,1
31
613,8
51
1,350
,903
933,7
67
889,8
23
(778
) -
505,9
13
270,6
45
(34,50
6) (34
,180)
- -
4,881
,289
3,162
,485
Unall
ocate
d inc
ome a
nd ex
pens
es:
Othe
r exp
ense
s
(3
31,79
6) (2
13,17
9)
Othe
r inco
me
3,75
0,188
3,
032,3
90
Finan
ce co
st
(1,22
9,179
) (1
,502,4
12)
Taxa
tion
(1,14
8,032
) (9
73,00
0)
Profi
t afte
r tax
ation
5,
922,4
70
3,506
,284
Wea
ving
Spi
nnin
g
Dye
ing
Hom
e Te
xtile
and
Ter
ry
Hom
e Te
xtile
Pow
erG
ener
atio
nTo
tal -
Com
pany
2021
2020
2021
2020
2021
2020
(Rup
ees
in th
ousa
nd)
2021
2021
2020
2021
2020
2020
2021
2020
2021
2020
2021
2021
2020
2021
2020
2020
Fais
alab
ad I
Fais
alab
ad II
Fero
ze W
attw
an II
Fero
ze W
attw
an I
Bhi
kki
Laho
re
2021
2020
Terr
yG
arm
ents
43.1
Re
conc
iliat
ion
of re
porta
ble
segm
ent a
sset
s an
d lia
bilit
ies
Total
asse
ts for
repo
rtable
segm
ents
6,49
2,179
9,
434,8
86
6,907
,881
4,101
,580
5,225
,646
6,833
,108
1,756
,639
1,81
5,833
8,3
02,57
9 6,2
05,21
5 1,7
69,03
5 96
4,856
7,
884,0
50
8,308
,669
9,410
,844
8,82
4,933
3,
223,4
73
1,745
,976
5,88
5,327
3,9
05,34
4 7,1
56,36
6 7,1
40,65
3 64
,014,0
19
59,28
1,053
Unall
ocate
d ass
ets:
Long
term
inve
stmen
ts
48
,620,6
95
37,97
9,074
Othe
r rec
eivab
les
4,70
2,709
3,
568,5
65
Cash
and b
ank b
alanc
es
5,27
2,345
12
8,241
Othe
r corp
orate
asse
ts
8,
502,6
06
9,703
,981
Total
asse
ts as
per s
tatem
ent o
f fina
ncial
posit
ion
131,1
12,37
4 11
0,660
,914
Total
liabil
ities f
or re
porta
ble se
gmen
ts 1
,114,2
94
921,7
82
81,05
7 20
8,341
19
5,930
20
2,895
13
,494
17,23
2 91
4,771
90
8,113
32
8,338
17
8,886
1,0
59,41
6 85
1,351
1,8
93,71
5 1,3
59,83
1 15
0,375
36
,573
1,117
,157
729,2
80
1,575
,018
3,092
,256
8,443
,565
8,506
,540
Unall
ocate
d liab
ilities
:
Defer
red lia
bilitie
s
1,
055,9
92
302,6
72
Othe
r corp
orate
liabil
ities
35,86
5,038
30
,423,8
42
Total
liabil
ities a
s per
state
ment
of
fina
ncial
posit
ion
45,36
4,595
39
,233,0
54
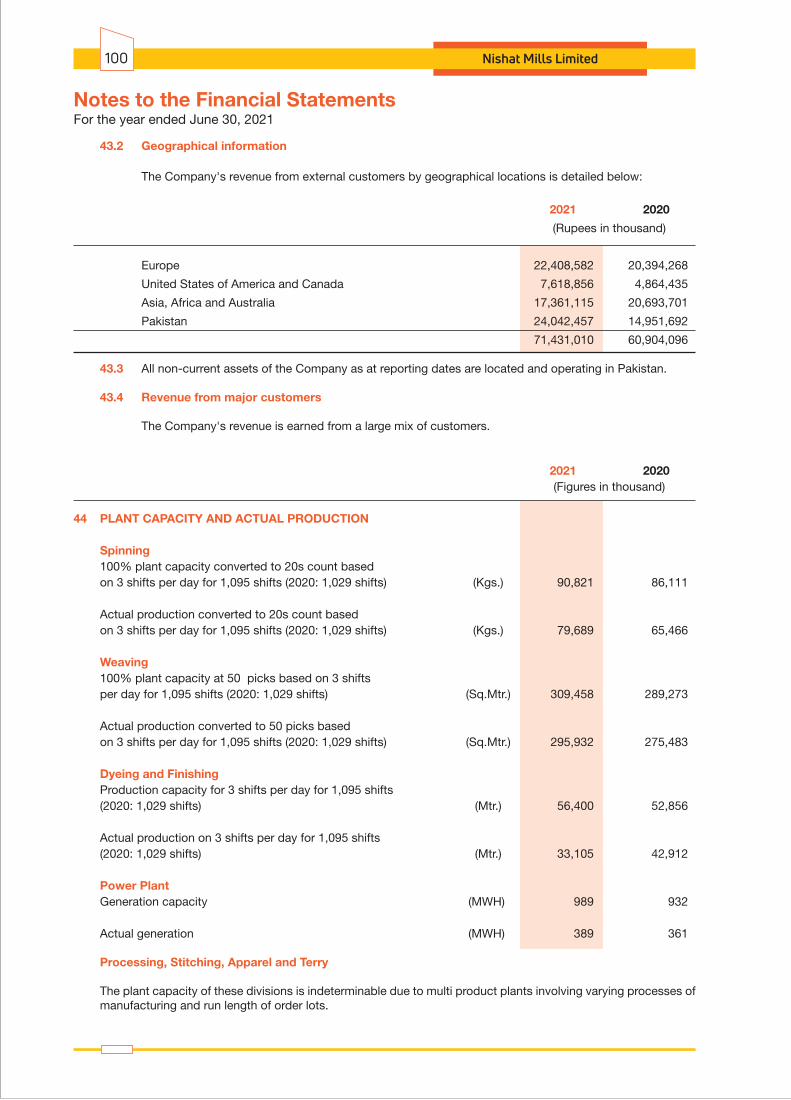
43.2 Geographical information
The Company's revenue from external customers by geographical locations is detailed below:
2021 2020
(Rupees in thousand)
Europe 22,408,582 20,394,268
United States of America and Canada 7,618,856 4,864,435
Asia, Africa and Australia 17,361,115 20,693,701
Pakistan 24,042,457 14,951,692
71,431,010 60,904,096
43.3 All non-current assets of the Company as at reporting dates are located and operating in Pakistan.
43.4 Revenue from major customers
The Company's revenue is earned from a large mix of customers. 2021 2020 (Figures in thousand)
44 PLANT CAPACITY AND ACTUAL PRODUCTION
Spinning 100% plant capacity converted to 20s count based on 3 shifts per day for 1,095 shifts (2020: 1,029 shifts) (Kgs.) 90,821 86,111
Actual production converted to 20s count based on 3 shifts per day for 1,095 shifts (2020: 1,029 shifts) (Kgs.) 79,689 65,466
Weaving 100% plant capacity at 50 picks based on 3 shifts per day for 1,095 shifts (2020: 1,029 shifts) (Sq.Mtr.) 309,458 289,273
Actual production converted to 50 picks based on 3 shifts per day for 1,095 shifts (2020: 1,029 shifts) (Sq.Mtr.) 295,932 275,483
Dyeing and Finishing Production capacity for 3 shifts per day for 1,095 shifts (2020: 1,029 shifts) (Mtr.) 56,400 52,856
Actual production on 3 shifts per day for 1,095 shifts (2020: 1,029 shifts) (Mtr.) 33,105 42,912
Power Plant Generation capacity (MWH) 989 932
Actual generation (MWH) 389 361
Processing, Stitching, Apparel and Terry
The plant capacity of these divisions is indeterminable due to multi product plants involving varying processes of manufacturing and run length of order lots.
For the year ended June 30, 2021Notes to the Financial Statements
Nishat Mills Limited100
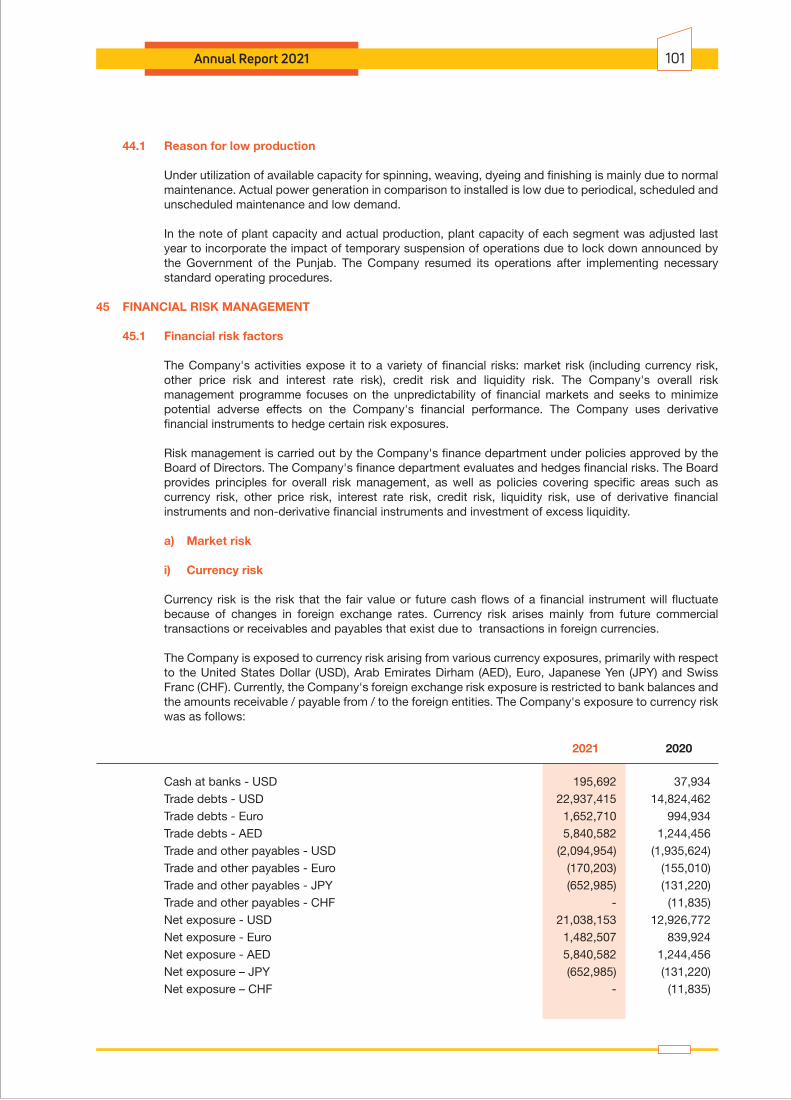
Annual Report 2021 101
44.1 Reason for low production
Under utilization of available capacity for spinning, weaving, dyeing and finishing is mainly due to normal maintenance. Actual power generation in comparison to installed is low due to periodical, scheduled and unscheduled maintenance and low demand.
In the note of plant capacity and actual production, plant capacity of each segment was adjusted last year to incorporate the impact of temporary suspension of operations due to lock down announced by the Government of the Punjab. The Company resumed its operations after implementing necessary standard operating procedures.
45 FINANCIAL RISK MANAGEMENT
45.1 Financial risk factors The Company's activities expose it to a variety of financial risks: market risk (including currency risk,
other price risk and interest rate risk), credit risk and liquidity risk. The Company's overall risk management programme focuses on the unpredictability of financial markets and seeks to minimize potential adverse effects on the Company's financial performance. The Company uses derivative financial instruments to hedge certain risk exposures.
Risk management is carried out by the Company's finance department under policies approved by the Board of Directors. The Company's finance department evaluates and hedges financial risks. The Board provides principles for overall risk management, as well as policies covering specific areas such as currency risk, other price risk, interest rate risk, credit risk, liquidity risk, use of derivative financial instruments and non-derivative financial instruments and investment of excess liquidity.
a) Market risk
i) Currency risk
Currency risk is the risk that the fair value or future cash flows of a financial instrument will fluctuate because of changes in foreign exchange rates. Currency risk arises mainly from future commercial transactions or receivables and payables that exist due to transactions in foreign currencies.
The Company is exposed to currency risk arising from various currency exposures, primarily with respect to the United States Dollar (USD), Arab Emirates Dirham (AED), Euro, Japanese Yen (JPY) and Swiss Franc (CHF). Currently, the Company's foreign exchange risk exposure is restricted to bank balances and the amounts receivable / payable from / to the foreign entities. The Company's exposure to currency risk was as follows:
2021 2020
Cash at banks - USD 195,692 37,934 Trade debts - USD 22,937,415 14,824,462 Trade debts - Euro 1,652,710 994,934 Trade debts - AED 5,840,582 1,244,456 Trade and other payables - USD (2,094,954) (1,935,624) Trade and other payables - Euro (170,203) (155,010) Trade and other payables - JPY (652,985) (131,220) Trade and other payables - CHF - (11,835) Net exposure - USD 21,038,153 12,926,772 Net exposure - Euro 1,482,507 839,924 Net exposure - AED 5,840,582 1,244,456 Net exposure – JPY (652,985) (131,220) Net exposure – CHF - (11,835)

For the year ended June 30, 2021Notes to the Financial Statements
Nishat Mills Limited102
The following significant exchange rates were applied during the year:
2021 2020
Rupees per US Dollar Average rate 159.53 158.82 Reporting date rate 157.60 168.25
Rupees per Euro Average rate 189.17 175.53 Reporting date rate 185.80 189.11
Rupees per AED Average rate 43.22 43.20 Reporting date rate 42.65 45.79
Rupees per JPY Average rate 1.49 1.47 Reporting date rate 1.42 1.57
Rupees per CHF Average rate 174.46 163.18 Reporting date rate 168.81 177.43
Sensitivity analysis
If the functional currency, at reporting date, had weakened / strengthened by 5% against the USD, Euro, AED, JPY and CHF with all other variables held constant, the impact on profit after taxation for the year would have been Rupees 180.540 million (2020: Rupees 112.317 million) higher / lower mainly as a result of exchange gains / losses on translation of foreign exchange denominated financial instruments. Currency risk sensitivity to foreign exchange movements has been calculated on a symmetric basis. In management's opinion, the sensitivity analysis is unrepresentative of inherent currency risk as the year end exposure does not reflect the exposure during the year.
ii) Other price risk
Other price risk represents the risk that the fair value or future cash flows of a financial instrument will fluctuate because of changes in market prices (other than those arising from interest rate risk or currency risk), whether those changes are caused by factors specific to the individual financial instrument or its issuer, or factors affecting all similar financial instruments traded in the market. The Company is not exposed to commodity price risk.
Sensitivity analysis
The table below summarizes the impact of increase / decrease in the Pakistan Stock Exchange (PSX) Index on the Company's equity (fair value reserve FVTOCI investments). The analysis is based on the assumption that the equity index had increased / decreased by 5% with all other variables held constant and all the Company's equity instruments moved according to the historical correlation with the index:
Impact on statement of other Index comprehensive income (fair value reserve)
2021 2020 (Rupees in thousand)
PSX (5% increase) 1,806,663 1,464,979 PSX (5% decrease) (1,806,663) (1,464,979)
Equity (fair value reserve) would increase / decrease as a result of gains / losses on equity investments classified as FVTOCI.z
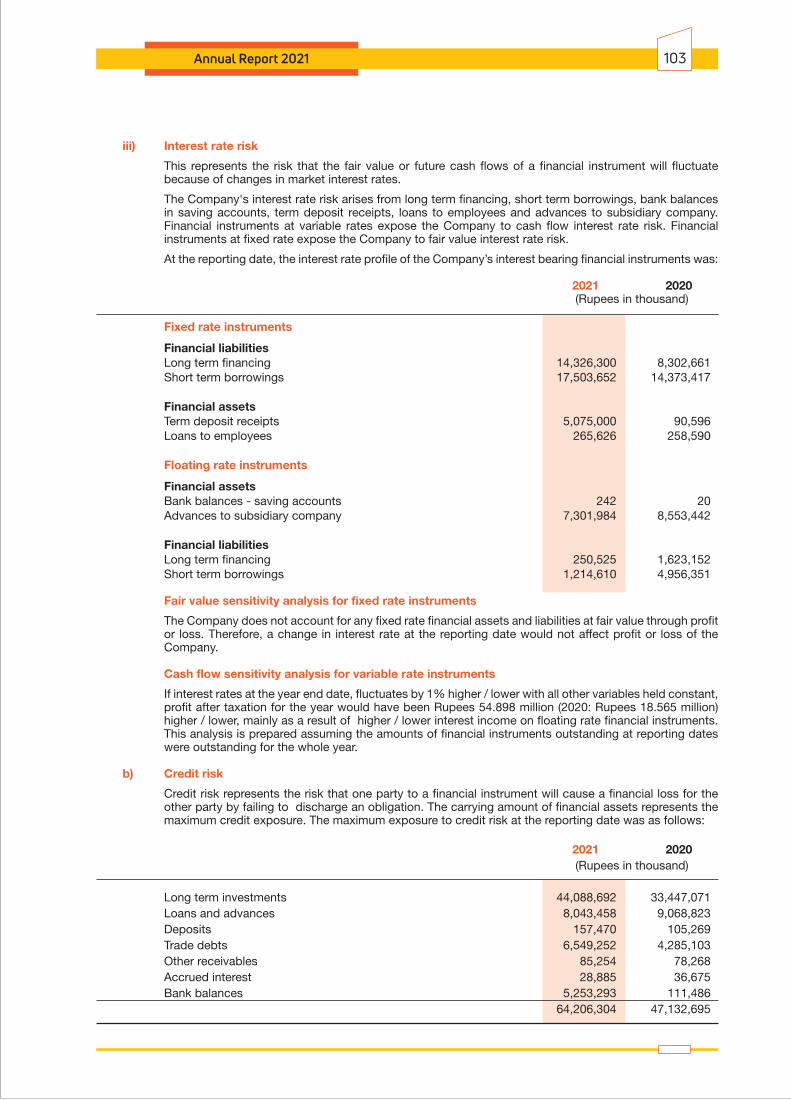
Annual Report 2021 103
iii) Interest rate risk
This represents the risk that the fair value or future cash flows of a financial instrument will fluctuate because of changes in market interest rates.
The Company's interest rate risk arises from long term financing, short term borrowings, bank balances in saving accounts, term deposit receipts, loans to employees and advances to subsidiary company. Financial instruments at variable rates expose the Company to cash flow interest rate risk. Financial instruments at fixed rate expose the Company to fair value interest rate risk.
At the reporting date, the interest rate profile of the Company’s interest bearing financial instruments was:
2021 2020 (Rupees in thousand)
Fixed rate instruments
Financial liabilities Long term financing 14,326,300 8,302,661 Short term borrowings 17,503,652 14,373,417
Financial assets Term deposit receipts 5,075,000 90,596 Loans to employees 265,626 258,590
Floating rate instruments
Financial assets Bank balances - saving accounts 242 20 Advances to subsidiary company 7,301,984 8,553,442
Financial liabilities Long term financing 250,525 1,623,152 Short term borrowings 1,214,610 4,956,351 Fair value sensitivity analysis for fixed rate instruments
The Company does not account for any fixed rate financial assets and liabilities at fair value through profit or loss. Therefore, a change in interest rate at the reporting date would not affect profit or loss of the Company.
Cash flow sensitivity analysis for variable rate instruments
If interest rates at the year end date, fluctuates by 1% higher / lower with all other variables held constant, profit after taxation for the year would have been Rupees 54.898 million (2020: Rupees 18.565 million) higher / lower, mainly as a result of higher / lower interest income on floating rate financial instruments. This analysis is prepared assuming the amounts of financial instruments outstanding at reporting dates were outstanding for the whole year.
b) Credit risk
Credit risk represents the risk that one party to a financial instrument will cause a financial loss for the other party by failing to discharge an obligation. The carrying amount of financial assets represents the maximum credit exposure. The maximum exposure to credit risk at the reporting date was as follows:
2021 2020 (Rupees in thousand)
Long term investments 44,088,692 33,447,071 Loans and advances 8,043,458 9,068,823 Deposits 157,470 105,269 Trade debts 6,549,252 4,285,103 Other receivables 85,254 78,268 Accrued interest 28,885 36,675 Bank balances 5,253,293 111,486 64,206,304 47,132,695
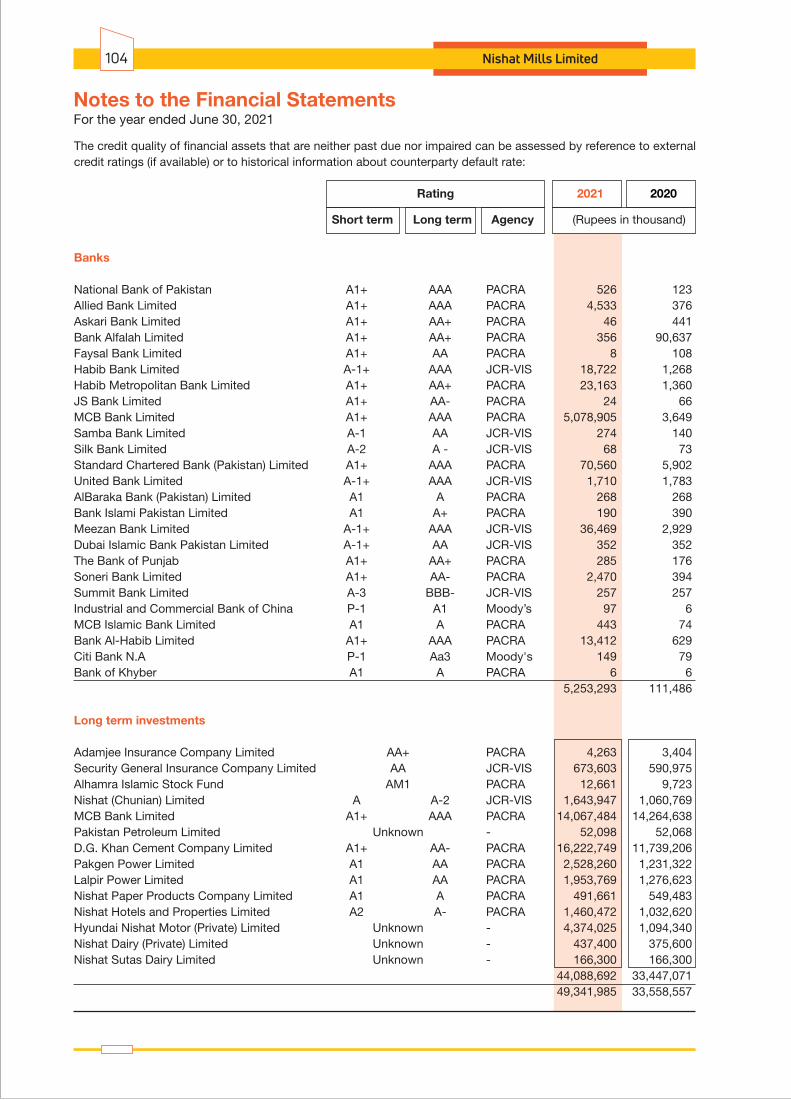
Rating 2021 2020
Short term Long term Agency (Rupees in thousand)
The credit quality of financial assets that are neither past due nor impaired can be assessed by reference to external credit ratings (if available) or to historical information about counterparty default rate:
Banks
National Bank of Pakistan A1+ AAA PACRA 526 123Allied Bank Limited A1+ AAA PACRA 4,533 376Askari Bank Limited A1+ AA+ PACRA 46 441Bank Alfalah Limited A1+ AA+ PACRA 356 90,637Faysal Bank Limited A1+ AA PACRA 8 108Habib Bank Limited A-1+ AAA JCR-VIS 18,722 1,268Habib Metropolitan Bank Limited A1+ AA+ PACRA 23,163 1,360JS Bank Limited A1+ AA- PACRA 24 66MCB Bank Limited A1+ AAA PACRA 5,078,905 3,649Samba Bank Limited A-1 AA JCR-VIS 274 140Silk Bank Limited A-2 A - JCR-VIS 68 73Standard Chartered Bank (Pakistan) Limited A1+ AAA PACRA 70,560 5,902United Bank Limited A-1+ AAA JCR-VIS 1,710 1,783AlBaraka Bank (Pakistan) Limited A1 A PACRA 268 268Bank Islami Pakistan Limited A1 A+ PACRA 190 390Meezan Bank Limited A-1+ AAA JCR-VIS 36,469 2,929Dubai Islamic Bank Pakistan Limited A-1+ AA JCR-VIS 352 352The Bank of Punjab A1+ AA+ PACRA 285 176Soneri Bank Limited A1+ AA- PACRA 2,470 394Summit Bank Limited A-3 BBB- JCR-VIS 257 257Industrial and Commercial Bank of China P-1 A1 Moody’s 97 6MCB Islamic Bank Limited A1 A PACRA 443 74Bank Al-Habib Limited A1+ AAA PACRA 13,412 629Citi Bank N.A P-1 Aa3 Moody's 149 79Bank of Khyber A1 A PACRA 6 6 5,253,293 111,486
Long term investments
Adamjee Insurance Company Limited AA+ PACRA 4,263 3,404Security General Insurance Company Limited AA JCR-VIS 673,603 590,975Alhamra Islamic Stock Fund AM1 PACRA 12,661 9,723Nishat (Chunian) Limited A A-2 JCR-VIS 1,643,947 1,060,769MCB Bank Limited A1+ AAA PACRA 14,067,484 14,264,638Pakistan Petroleum Limited Unknown - 52,098 52,068D.G. Khan Cement Company Limited A1+ AA- PACRA 16,222,749 11,739,206Pakgen Power Limited A1 AA PACRA 2,528,260 1,231,322Lalpir Power Limited A1 AA PACRA 1,953,769 1,276,623Nishat Paper Products Company Limited A1 A PACRA 491,661 549,483Nishat Hotels and Properties Limited A2 A- PACRA 1,460,472 1,032,620Hyundai Nishat Motor (Private) Limited Unknown - 4,374,025 1,094,340Nishat Dairy (Private) Limited Unknown - 437,400 375,600Nishat Sutas Dairy Limited Unknown - 166,300 166,300 44,088,692 33,447,071 49,341,985 33,558,557
For the year ended June 30, 2021Notes to the Financial Statements
Nishat Mills Limited104

Lossallowance
Tradedebts
Expectedloss rate
Lossallowance
Tradedebts
Local sales Export sales
(Rupees in thousand)%% (Rupees in thousand)
Expectedloss rate
Lossallowance
Tradedebts
Expectedloss rate
Lossallowance
Tradedebts
Local sales Export sales
(Rupees in thousand)%% (Rupees in thousand)
Expectedloss rate
The Company's exposure to credit risk and allowance for expected credit losses related to trade debts is disclosed in Note 20.
Due to the Company's long standing business relationships with these counterparties and after giving due consideration to their strong financial standing, the management does not expect non-performance by these counterparties on their obligations to the Company. Accordingly, the credit risk is minimal.
Trade debts
The Company applies the IFRS 9 simplified approach to measure expected credit losses which uses a lifetime expected loss allowance for all trade debts.
To measure the expected credit losses, trade receivables have been grouped based on shared credit risk characteristics and the days past due. These trade receivables are netted off with the collateral obtained, if any, from these customers to calculate the net exposure towards these customers. The Company has concluded that the expected loss rates for trade debts against local sales are different from the expected loss rates for trade debts against export sales.
The expected loss rates are based on the payment profiles of sales over a period of 36 months before 30 June 2021 and the corresponding historical credit losses experienced within this period. The historical loss rates are adjusted to reflect current and forward-looking information on macroeconomic factors affecting the ability of the customers to settle the receivables. The Company has identified the Gross Domestic Product, Unemployment, Interest and the inflation Index of the country in which it majorly sells its goods and services to be the most relevant factors, and accordingly adjusts the historical loss rates based on expected changes in these factors.
On that basis, the loss allowance as at 30 June 2021 and 30 June 2020 was determined as follows:
At 30 June 2021
Not past due 0% 2,477,007 - 0% 4,066,261 - Up to 30 days 0.20% 109 0.22 0.00% - - 31 to 60 days 15.27% 1,984 303 0.00% - - 61 to 90 days 30.63% 35 11 0.00% - - 91 to 180 days 57.69% 36 21 0.00% - - 181 to 360 days 68.48% 13,182 9,027 0.00% - - Above 360 days 100.00% 6,298 6,298 100.00% - - 2,498,651 15,660 4,066,261 - Trade debts which are not subject to risk of default - - - - Total 2,498,651 15,660 4,066,261 -
At 30 June 2020
Not past due 0% 1,612,944 - 0% 2,577,562 - Up to 30 days 0.66% 69,723 460 0.00% - - 31 to 60 days 21.12% 24,000 5,069 0.00% - - 61 to 90 days 32.15% 8,598 2,283 0.00% - - 91 to 180 days 57.64% 40 23 0.00% - - 181 to 360 days 75.14% 279 208 0.00% - - Above 360 days 100.00% 7,453 7,453 100.00% - - 1,723,037 15,496 2,577,562 - Trade debts which are not subject to risk of default - - - - Total 1,723,037 15,496 2,577,562 -
Annual Report 2021 105

For the year ended June 30, 2021Notes to the Financial Statements
Nishat Mills Limited106
Carryingamount
Contractualcash flows
6 monthsor less
6-12months
1-2Years
More than2 Years
(Rupees in thousand)
Carryingamount
Contractualcash flows
6 monthsor less
6-12months
1-2Years
More than2 Years
(Rupees in thousand)
c) Liquidity risk
Liquidity risk is the risk that an entity will encounter difficulty in meeting obligations associated with financial liabilities.
The Company manages liquidity risk by maintaining sufficient cash and the availability of funding through an adequate amount of committed credit facilities. At 30 June 2021, the Company had Rupees 38,572.153 million (2020: Rupees 33,658.337 million) available borrowing limits from financial institutions and Rupees 5,272.345 million (2020: Rupees 128.241 million) cash and bank balances. The management believes the liquidity risk to be low. Following are the contractual maturities of financial liabilities, including interest payments. The amount disclosed in the table are undiscounted cash flows:
Contractual maturities of financial liabilities as at 30 June 2021
Non-derivative financial liabilities:
Long term financing 14,576,825 15,810,353 1,594,565 1,744,091 3,250,652 9,221,045
Trade and other payables 7,342,335 7,342,335 7,342,335 - - -
Unclaimed dividend 97,617 97,617 97,617 - - -
Short term borrowings 18,718,262 19,074,836 19,024,948 49,888 - -
Accrued mark-up 196,382 196,382 196,382 - - -
Derivative financial liabilities 57,429 57,429 57,429 - - -
40,988,850 42,578,952 28,313,276 1,793,979 3,250,652 9,221,045
Contractual maturities of financial liabilities as at 30 June 2020
Non-derivative financial liabilities:
Long term financing 9,925,813 10,698,231 158,930 806,388 2,755,819 6,977,094
Trade and other payables 7,628,366 7,628,366 7,628,366 - - -
Unclaimed dividend 90,596 90,596 90,596 - - -
Short term borrowings 19,329,768 19,885,294 19,771,393 113,901 - -
Accrued mark-up 226,228 226,228 226,228 - - -
Derivative financial liabilities 6,206 6,206 6,206 - - -
37,206,977 38,534,921 27,881,719 920,289 2,755,819 6,977,094
The contractual cash flows relating to the above financial liabilities have been determined on the basis of interest rates / mark-up rates effective as at 30 June. The rates of interest / mark-up have been disclosed in note 5 and note 9 to these financial statements.
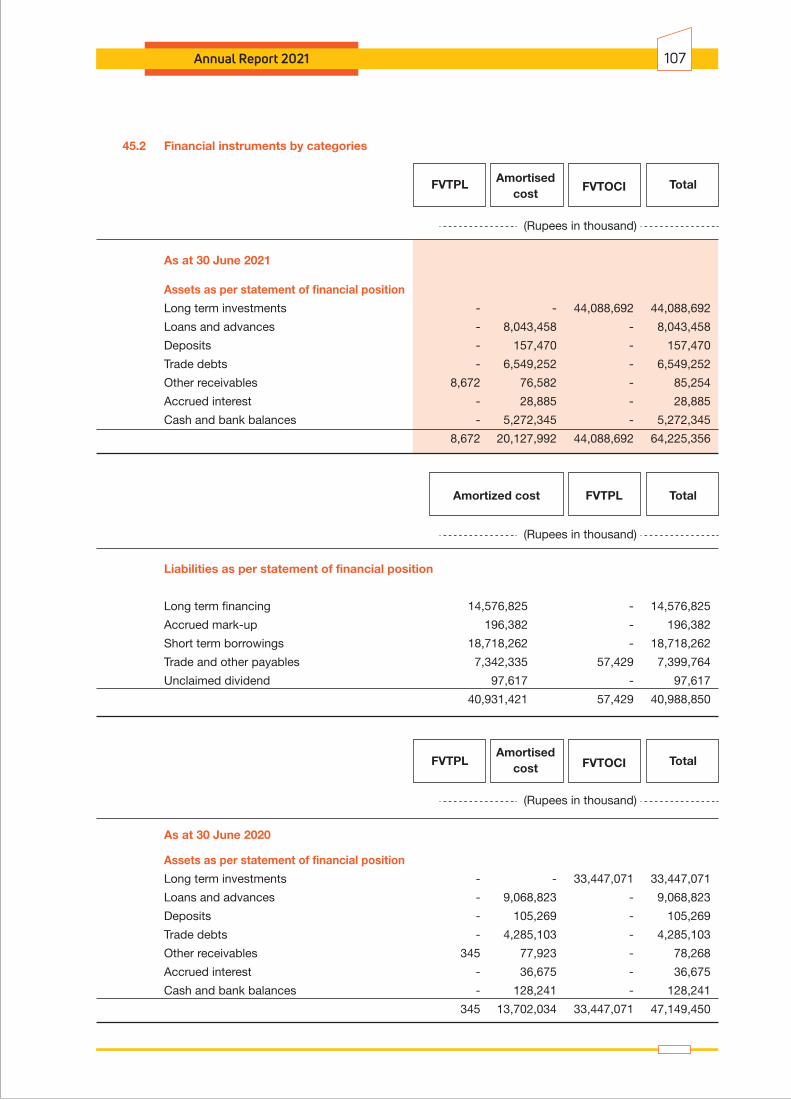
45.2 Financial instruments by categories
Amortised cost
(Rupees in thousand)
As at 30 June 2021
Assets as per statement of financial position
Long term investments - - 44,088,692 44,088,692
Loans and advances - 8,043,458 - 8,043,458
Deposits - 157,470 - 157,470
Trade debts - 6,549,252 - 6,549,252
Other receivables 8,672 76,582 - 85,254
Accrued interest - 28,885 - 28,885
Cash and bank balances - 5,272,345 - 5,272,345
8,672 20,127,992 44,088,692 64,225,356
(Rupees in thousand)
Liabilities as per statement of financial position
Long term financing 14,576,825 - 14,576,825
Accrued mark-up 196,382 - 196,382
Short term borrowings 18,718,262 - 18,718,262
Trade and other payables 7,342,335 57,429 7,399,764
Unclaimed dividend 97,617 - 97,617
40,931,421 57,429 40,988,850
Amortised cost
(Rupees in thousand)
As at 30 June 2020
Assets as per statement of financial position
Long term investments - - 33,447,071 33,447,071
Loans and advances - 9,068,823 - 9,068,823
Deposits - 105,269 - 105,269
Trade debts - 4,285,103 - 4,285,103
Other receivables 345 77,923 - 78,268
Accrued interest - 36,675 - 36,675
Cash and bank balances - 128,241 - 128,241
345 13,702,034 33,447,071 47,149,450
TotalFVTOCIFVTPL
TotalFVTOCIFVTPL
TotalFVTPLAmortized cost
Annual Report 2021 107

For the year ended June 30, 2021Notes to the Financial Statements
Nishat Mills Limited108
Liabilities as per statement of financial position
Long term financing 9,925,813 - 9,925,813 Accrued mark-up 226,228 - 226,228 Short term borrowings 19,329,768 - 19,329,768 Trade and other payables 7,628,366 6,206 7,634,572 Unclaimed dividend 90,596 - 90,596 37,200,771 6,206 37,206,977
45.3 Reconciliation of financial assets and financial liabilities to the line items presented in the statement of financial position is as follows:
Assets Long term investments 44,088,692 4,532,003 48,620,695 Loans and advances 8,043,458 100,518 8,143,976 Deposits and prepayments 157,470 80,342 237,812 Trade debts 6,549,252 - 6,549,252 Other receivables 85,254 4,617,455 4,702,709 Accrued interest 28,885 - 28,885 Cash and bank balances 5,272,345 - 5,272,345 64,225,356 9,330,318 73,555,674
Liabilities Long term financing 14,576,825 - 14,576,825 Accrued mark-up 196,382 - 196,382 Short term borrowings 18,718,262 - 18,718,262 Trade and other payables 7,399,764 2,112,540 9,512,304 Unclaimed dividend 97,617 - 97,617 40,988,850 2,112,540 43,101,390
TotalFVTPLAmortized cost
Assets as perstatement of
financialposition
Financialassets
Non-financialassets
2021
(Rupees in thousand)
Liabilities asper statement
of financialposition
Financialliabilities
Non-financialliabilities
2021
(Rupees in thousand)
(Rupees in thousand)
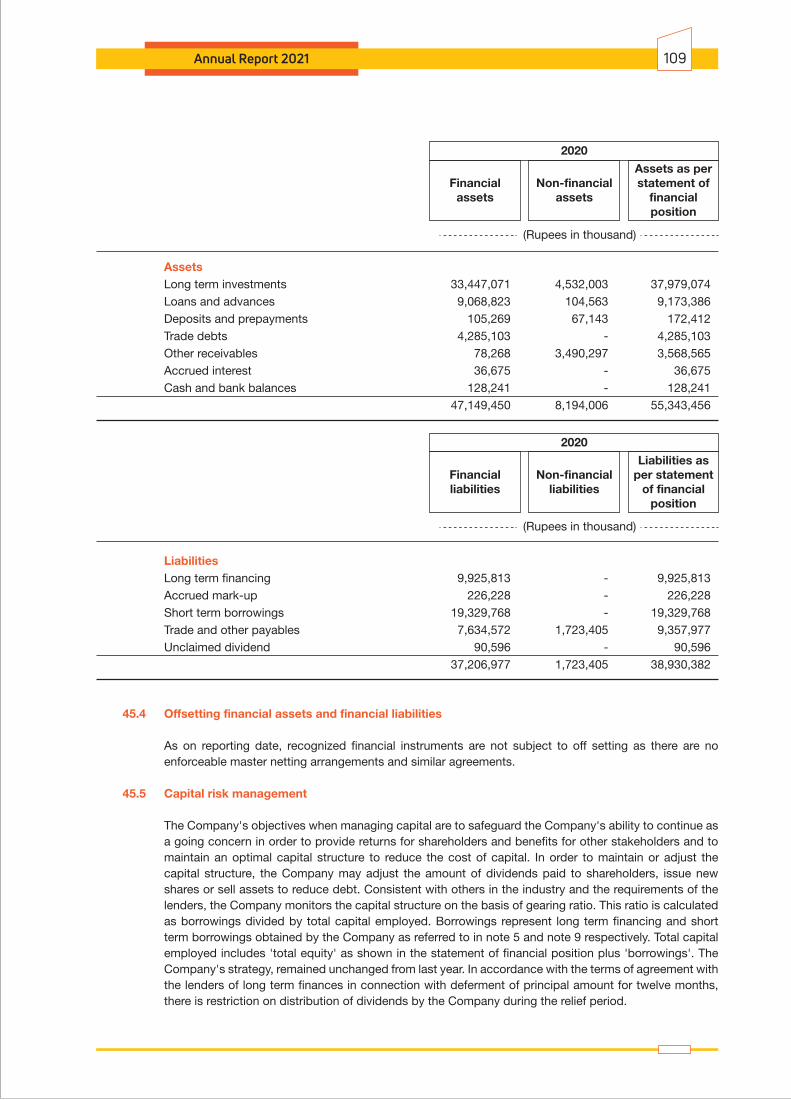
Assets Long term investments 33,447,071 4,532,003 37,979,074 Loans and advances 9,068,823 104,563 9,173,386 Deposits and prepayments 105,269 67,143 172,412 Trade debts 4,285,103 - 4,285,103 Other receivables 78,268 3,490,297 3,568,565 Accrued interest 36,675 - 36,675 Cash and bank balances 128,241 - 128,241 47,149,450 8,194,006 55,343,456
Liabilities Long term financing 9,925,813 - 9,925,813 Accrued mark-up 226,228 - 226,228 Short term borrowings 19,329,768 - 19,329,768 Trade and other payables 7,634,572 1,723,405 9,357,977 Unclaimed dividend 90,596 - 90,596 37,206,977 1,723,405 38,930,382
45.4 Offsetting financial assets and financial liabilities
As on reporting date, recognized financial instruments are not subject to off setting as there are no enforceable master netting arrangements and similar agreements.
45.5 Capital risk management
The Company's objectives when managing capital are to safeguard the Company's ability to continue as a going concern in order to provide returns for shareholders and benefits for other stakeholders and to maintain an optimal capital structure to reduce the cost of capital. In order to maintain or adjust the capital structure, the Company may adjust the amount of dividends paid to shareholders, issue new shares or sell assets to reduce debt. Consistent with others in the industry and the requirements of the lenders, the Company monitors the capital structure on the basis of gearing ratio. This ratio is calculated as borrowings divided by total capital employed. Borrowings represent long term financing and short term borrowings obtained by the Company as referred to in note 5 and note 9 respectively. Total capital employed includes 'total equity' as shown in the statement of financial position plus 'borrowings'. The Company's strategy, remained unchanged from last year. In accordance with the terms of agreement with the lenders of long term finances in connection with deferment of principal amount for twelve months, there is restriction on distribution of dividends by the Company during the relief period.
Assets as perstatement of
financialposition
Financialassets
Non-financialassets
2020
(Rupees in thousand)
Liabilities asper statement
of financialposition
Financialliabilities
Non-financialliabilities
2020
(Rupees in thousand)
Annual Report 2021 109
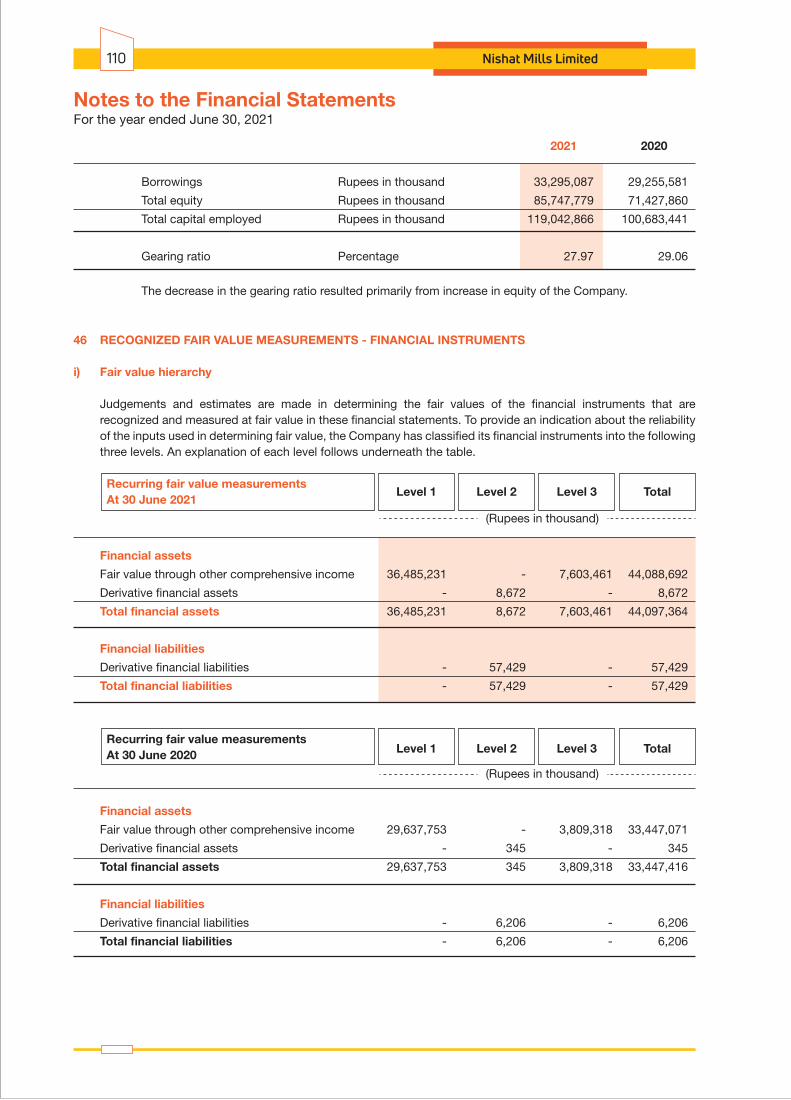
For the year ended June 30, 2021Notes to the Financial Statements
Nishat Mills Limited110
Level 1 Level 2 Level 3 Total
Level 1 Level 2 Level 3 Total
2021 2020
Borrowings Rupees in thousand 33,295,087 29,255,581
Total equity Rupees in thousand 85,747,779 71,427,860
Total capital employed Rupees in thousand 119,042,866 100,683,441
Gearing ratio Percentage 27.97 29.06
The decrease in the gearing ratio resulted primarily from increase in equity of the Company.
46 RECOGNIZED FAIR VALUE MEASUREMENTS - FINANCIAL INSTRUMENTS
i) Fair value hierarchy
Judgements and estimates are made in determining the fair values of the financial instruments that are recognized and measured at fair value in these financial statements. To provide an indication about the reliability of the inputs used in determining fair value, the Company has classified its financial instruments into the following three levels. An explanation of each level follows underneath the table.
Recurring fair value measurements At 30 June 2021
(Rupees in thousand)
Financial assets
Fair value through other comprehensive income 36,485,231 - 7,603,461 44,088,692
Derivative financial assets - 8,672 - 8,672
Total financial assets 36,485,231 8,672 7,603,461 44,097,364
Financial liabilities
Derivative financial liabilities - 57,429 - 57,429
Total financial liabilities - 57,429 - 57,429
Recurring fair value measurements At 30 June 2020
(Rupees in thousand)
Financial assets
Fair value through other comprehensive income 29,637,753 - 3,809,318 33,447,071
Derivative financial assets - 345 - 345
Total financial assets 29,637,753 345 3,809,318 33,447,416
Financial liabilities
Derivative financial liabilities - 6,206 - 6,206
Total financial liabilities - 6,206 - 6,206
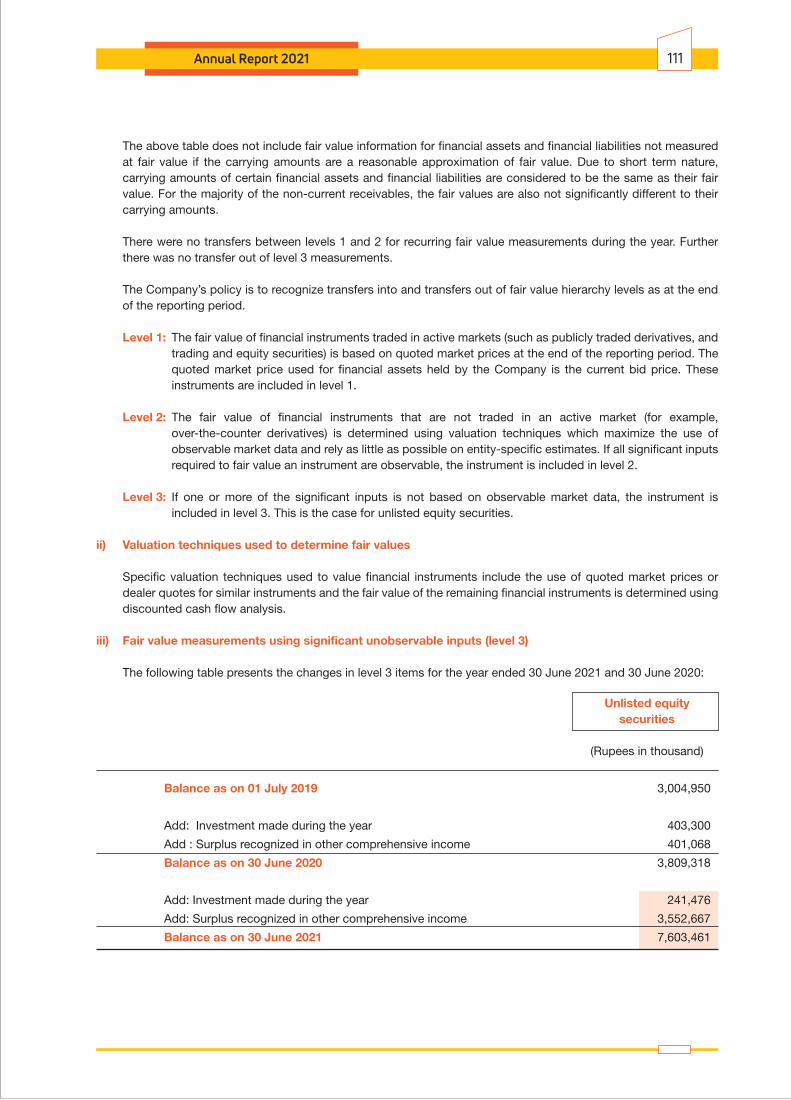
Annual Report 2021 111
The above table does not include fair value information for financial assets and financial liabilities not measured at fair value if the carrying amounts are a reasonable approximation of fair value. Due to short term nature, carrying amounts of certain financial assets and financial liabilities are considered to be the same as their fair value. For the majority of the non-current receivables, the fair values are also not significantly different to their carrying amounts.
There were no transfers between levels 1 and 2 for recurring fair value measurements during the year. Further there was no transfer out of level 3 measurements.
The Company’s policy is to recognize transfers into and transfers out of fair value hierarchy levels as at the end of the reporting period.
Level 1: The fair value of financial instruments traded in active markets (such as publicly traded derivatives, and trading and equity securities) is based on quoted market prices at the end of the reporting period. The quoted market price used for financial assets held by the Company is the current bid price. These instruments are included in level 1.
Level 2: The fair value of financial instruments that are not traded in an active market (for example, over-the-counter derivatives) is determined using valuation techniques which maximize the use of observable market data and rely as little as possible on entity-specific estimates. If all significant inputs required to fair value an instrument are observable, the instrument is included in level 2.
Level 3: If one or more of the significant inputs is not based on observable market data, the instrument is included in level 3. This is the case for unlisted equity securities.
ii) Valuation techniques used to determine fair values
Specific valuation techniques used to value financial instruments include the use of quoted market prices or dealer quotes for similar instruments and the fair value of the remaining financial instruments is determined using discounted cash flow analysis.
iii) Fair value measurements using significant unobservable inputs (level 3)
The following table presents the changes in level 3 items for the year ended 30 June 2021 and 30 June 2020:
Unlisted equity securities
(Rupees in thousand)
Balance as on 01 July 2019 3,004,950
Add: Investment made during the year 403,300
Add : Surplus recognized in other comprehensive income 401,068
Balance as on 30 June 2020 3,809,318
Add: Investment made during the year 241,476
Add: Surplus recognized in other comprehensive income 3,552,667
Balance as on 30 June 2021 7,603,461

There were no significant inter-relationships between unobservable inputs that materially affect fair values.
Valuation processes
Independent valuer performs the valuations of non-property items required for financial reporting purposes, including level 3 fair values. The independent valuer reports directly to the Chief Financial Officer. Discussions of valuation processes and results are held between the Chief Financial Officer and the valuation team at least once every year, in line with the Company’s annual reporting period.
(Rupees in thousand)
Fair value through other comprehensive income
Description Fair value at Unobservable inputs
Range of inputs(probability-
weighted average)
Relationship ofunobservable
inputs tofair value30 June 2021 30 June 202130 June 2020
Terminal growth 4.00% factor
Risk adjusted 16.86% discount rate
Increase / decrease in terminal growth factor by 1% and decrease / increase in discount rate by 1% would increase / decrease fair value by Rupees +138.796 million /- 102.381 million.
Nishat Paper Products 491,661 549,483Company Limited
Terminal growth 4.00% factor
Risk adjusted 15.09% discount rate
Increase / decrease in terminal growth factor by 1% and decrease / increase in discount rate by 1% would increase / decrease fair value by Rupees+ 84.000 million /- 58.200 million.
Nishat Dairy (Private) Limited 437,400 375,600
Terminal growth 4.00% factor
Risk adjusted 14.20% discount rate
Increase / decrease in terminal growth factor by 1% and decrease / increase in discount rate by 1% would increase / decrease fair value by Rupees +157.075 million /- 106.455 million.
Security General Insurance 673,603 590,975Company Limited
Terminal growth 4.00% factor
Risk adjusted 8.66% discount rate
Increase / decrease in terminal growth factor by 1% and decrease / increase in discount rate by 1% would increase / decrease fair value by Rupees + 1,272.454 million /- 518.901 million.
Nishat Hotels and 1,460,472 1,032,620Properties Limited
Terminal growth 4.00% factor
Risk adjusted 16.56% discount rate
Increase / decrease in terminal growth factor by 1% and decrease / increase in discount rate by 1% would increase / decrease fair value by Rupees + 631.854 million / - 474.745 million.
Hyundai Nishat Motor 4,374,025 1,094,340(Private) Limited
iv) Valuation inputs and relationships to fair value
The following table summarizes the quantitative information about the significant unobservable inputs used in level 3 fair value measurements.
For the year ended June 30, 2021Notes to the Financial Statements
Nishat Mills Limited112

Annual Report 2021 113
The main level 3 inputs used by the Company are derived and evaluated as follows:
Discount rates for financial instruments are determined using a capital asset pricing model to calculate a rate that reflects current market assessments of the time value of money and the risk specific to the asset.
Earnings growth factor for unlisted equity securities are estimated based on market information for similar types of companies.
Changes in level 2 and 3 fair values are analyzed at the end of yearly reporting period during the valuation discussion between the Chief Financial Officer and the independent valuer. As part of this discussion the independent valuer presents a report that explains the reason for the fair value movements.
47 FAIR VALUE MEASUREMENTS - NON-FINANCIAL ASSETS
i) Fair value hierarchy
Judgements and estimates are made for non-financial assets not measured at fair value in these financial statements but for which the fair value is described in these financial statements. To provide an indication about the reliability of the inputs used in determining fair value, the Company has classified its non-financial assets into the following three levels.
At 30 June 2021 Level 1 Level 2 Level 3 Total
(Rupees in thousand)
Investment properties - 4,887,528 - 4,887,528
Total non-financial assets - 4,887,528 - 4,887,528
At 30 June 2020 Level 1 Level 2 Level 3 Total
(Rupees in thousand)
Investment properties - 4,622,255 - 4,622,255
Total non-financial assets - 4,622,255 - 4,622,255
The Company’s policy is to recognize transfers into and transfers out of fair value hierarchy levels as at the end of the reporting period.
There were no transfers between levels 1 and 2 for recurring fair value measurements during the year. Further, there was no transfer in and out of level 3 measurements.
ii) Valuation techniques used to determine level 2 fair values
The Company obtains independent valuations for its investment properties at least annually. At the end of each reporting period, the management updates the assessment of the fair value of each property, taking into account the most recent independent valuations. The management determines a property’s value within a range of reasonable fair value estimates. The best evidence of fair value is current prices in an active market for similar properties.
Valuation processes
The Company engages external, independent and qualified valuer to determine the fair value of the Company’s investment properties at the end of every financial year. As at 30 June 2021, the fair values of the investment properties have been determined by Al-Hadi Financial & Legal Consultants (an approved valuer).
Changes in fair values are analyzed at the end of each year during the valuation discussion between the Chief Financial Officer and the valuer. As part of this discussion the team presents a report that explains the reason for the fair value movements.

48 DISCLOSURES BY COMPANY LISTED ON ISLAMIC INDEX
2021 2020
Note (Rupees in thousand)
Description
Loans / advances obtained as per Islamic mode: Loans 5 & 9 6,885,008 4,754,667 Advances 7 1,173,749 956,879
Shariah compliant bank deposits / bank balances Bank balances 26 37,722 4,336
Profit earned from shariah compliant bank deposits / bank balances Profit on deposits with banks 32 - -
Revenue earned from shariah compliant business 71,431,010 60,904,096
Gain / (loss) or dividend earned from shariah complaint investments Dividend income 32.1 1,500 401,059 Unrealized gain on remeasurement of investment at FVTOCI 4,483,573 3,488,630
Exchange gain earned 47,183 33,752
Mark-up paid on Islamic mode of financing 187,637 566,422
Profits earned or interest paid on any conventional loans / advances Profit earned on loans to subsidiary companies 313,445 396,814 Interest paid on loans 744,369 659,533 Profit earned on deposits with banks 119,182 97,132 Interest income on loans to employees 10,002 9,602
Relationship with shariah compliant banks
Name Relationship
Habib Bank Limited Bank balance and long term financing Standard Chartered Bank (Pakistan) Limited Bank balance, short term borrowings and long term (Saadiq Islamic Banking) financing Al-Baraka Bank (Pakistan) Limited Bank balance Bank Islami Pakistan Limited Bank balance and short term borrowings Meezan Bank Limited Bank balance, short term borrowings and long term financing Dubai Islamic Bank Pakistan Limited Bank balance and long term financing MCB Islamic Bank Limited Bank balance Faysal Bank Limited (Barkat Islami) Short term borrowings The Bank of Punjab (Taqwa Islamic Banking) Short term borrowings
For the year ended June 30, 2021Notes to the Financial Statements
Nishat Mills Limited114

Annual Report 2021 115
CHIEF EXECUTIVE OFFICER CHIEF FINANCIAL OFFICERDIRECTOR
2021 2020 2021 2020
FundedNon-funded
Total facilities 14,975,000 12,220,000 72,455,000 60,822,000
Utilized at the end of the year 8,764,087 5,099,551 40,093,760 34,284,112
Unutilized at the end of the year 6,210,913 7,120,449 32,361,240 26,537,888
50 IMPACT OF COVID-19 (CORONA VIRUS)
The pandemic of COVID-19 that has rapidly spread all across the world has not only endangered human lives but has also adversely impacted the global economy. During the year, the Government of the Punjab and Government of Sindh from time to time announced temporary smart lock downs as a measure to reduce the spread of the COVID -19. However, after implementing all the necessary Standard Operating Procedures (SOPs) to ensure safety of employees, the Company continued to carry out its operations and has taken all necessary steps to ensure smooth and adequate continuation of its business. Management is actively monitoring the impact of the pandemic on its financial condition, liquidity, operations, supply chain, and workforce, which at this point is not considered to be significant. During the year, the Company has availed SBP's refinance scheme for payment of wages and salaries and Temporary Economic Refinance Facility (TERF) as explained in note 5 to these financial statements. Further, management believes that the Company has sufficient liquidity available to continue to meet its financial commitments for the foreseeable future when they become due. From the very outset of COVID-19, the management has adopted various policies and practices to minimize adverse impact of COVID-19 on the business and is continuously monitoring the situation in order to proactively address any challenges which may arise from COVID-19.
51 DATE OF AUTHORIZATION FOR ISSUE
These financial statements were authorized for issue on 20 September, 2021 by the Board of Directors of the Company.
52 CORRESPONDING FIGURES
Corresponding figures have been re-arranged, wherever necessary, for the purpose of comparison. However, no significant rearrangements have been made.
53 GENERAL
Figures have been rounded off to the nearest thousand of Rupees unless otherwise stated.
(Rupees in thousand)
49 UNUTILIZED CREDIT FACILITIES


Nishat Mills LimitedConsolidated Financial Statements of
and its Subsidiaries for the year ended June 30, 2021
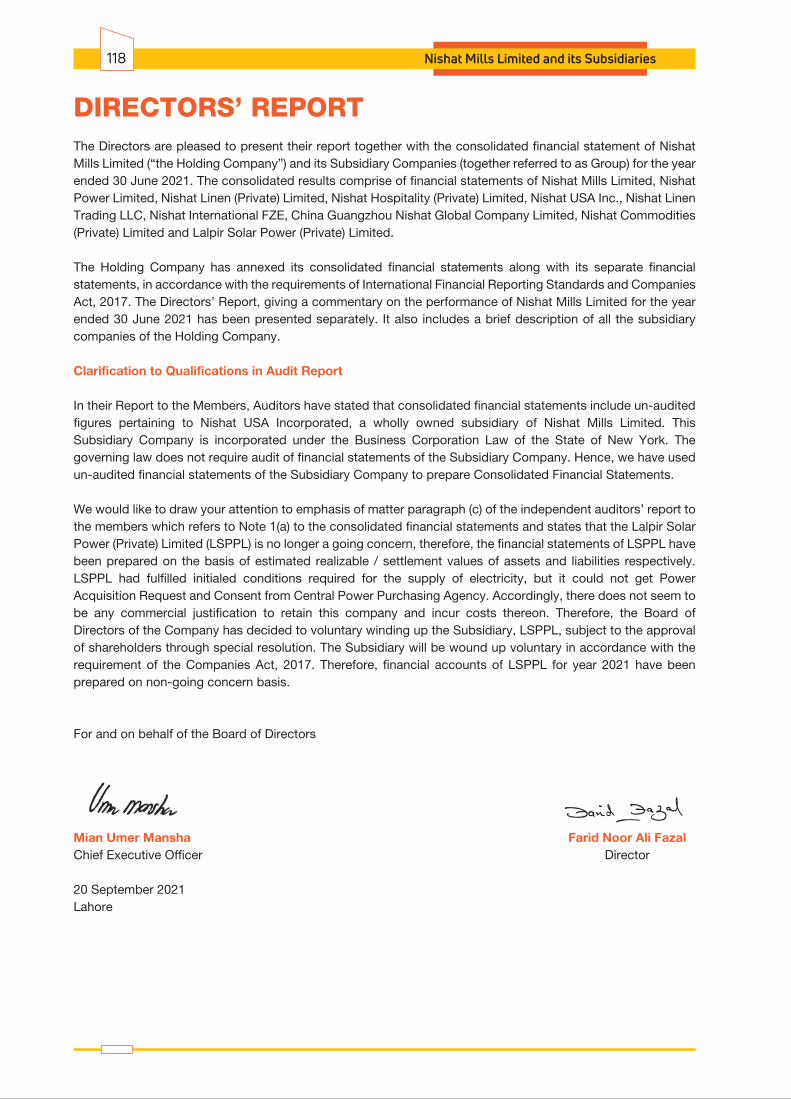
The Directors are pleased to present their report together with the consolidated financial statement of Nishat Mills Limited (“the Holding Company”) and its Subsidiary Companies (together referred to as Group) for the year ended 30 June 2021. The consolidated results comprise of financial statements of Nishat Mills Limited, Nishat Power Limited, Nishat Linen (Private) Limited, Nishat Hospitality (Private) Limited, Nishat USA Inc., Nishat Linen Trading LLC, Nishat International FZE, China Guangzhou Nishat Global Company Limited, Nishat Commodities (Private) Limited and Lalpir Solar Power (Private) Limited.
The Holding Company has annexed its consolidated financial statements along with its separate financial statements, in accordance with the requirements of International Financial Reporting Standards and Companies Act, 2017. The Directors’ Report, giving a commentary on the performance of Nishat Mills Limited for the year ended 30 June 2021 has been presented separately. It also includes a brief description of all the subsidiary companies of the Holding Company.
Clarification to Qualifications in Audit Report
In their Report to the Members, Auditors have stated that consolidated financial statements include un-audited figures pertaining to Nishat USA Incorporated, a wholly owned subsidiary of Nishat Mills Limited. This Subsidiary Company is incorporated under the Business Corporation Law of the State of New York. The governing law does not require audit of financial statements of the Subsidiary Company. Hence, we have used un-audited financial statements of the Subsidiary Company to prepare Consolidated Financial Statements.
We would like to draw your attention to emphasis of matter paragraph (c) of the independent auditors’ report to the members which refers to Note 1(a) to the consolidated financial statements and states that the Lalpir Solar Power (Private) Limited (LSPPL) is no longer a going concern, therefore, the financial statements of LSPPL have been prepared on the basis of estimated realizable / settlement values of assets and liabilities respectively. LSPPL had fulfilled initialed conditions required for the supply of electricity, but it could not get Power Acquisition Request and Consent from Central Power Purchasing Agency. Accordingly, there does not seem to be any commercial justification to retain this company and incur costs thereon. Therefore, the Board of Directors of the Company has decided to voluntary winding up the Subsidiary, LSPPL, subject to the approval of shareholders through special resolution. The Subsidiary will be wound up voluntary in accordance with the requirement of the Companies Act, 2017. Therefore, financial accounts of LSPPL for year 2021 have been prepared on non-going concern basis.
For and on behalf of the Board of Directors
Mian Umer Mansha Farid Noor Ali FazalChief Executive Officer Director
20 September 2021Lahore
DIRECTORS’ REPORT
Nishat Mills Limited and its Subsidiaries118
INDEPENDENT AUDITOR’S REPORTTo the members of Nishat Mills Limited
Qualified Opinion
We have audited the annexed consolidated financial statements of Nishat Mills Limited and its subsidiaries (the Group), which comprise the consolidated statement of financial position as at 30 June 2021, and the consolidated statement of profit or loss, the consolidated statement of comprehensive income, the consolidated statement of changes in equity and the consolidated statement of cash flows for the year then ended, and notes to the consolidated financial statements, including a summary of significant accounting policies and other explanatory information.
In our opinion, except for the effects of the matter described in the Basis for Qualified Opinion section of our report, the consolidated financial statements give a true and fair view of the consolidated financial position of the Group as at 30 June 2021, and its consolidated financial performance and its consolidated cash flows for the year then ended in accordance with the accounting and reporting standards as applicable in Pakistan.
Basis for Qualified Opinion
The financial statements of Nishat USA, Inc. (Subsidiary Company) for the year ended 30 June 2021 were unaudited. Hence, total assets of Rupees 15,014,570 as at 30 June 2021 and total turnover and net profit of Rupees 47,951,455 and Rupees 241,638 respectively for the year ended 30 June 2021 pertaining to the aforesaid Company have been incorporated in these consolidated financial statements by the management using un-audited financial statements.
We conducted our audit in accordance with International Standards on Auditing (ISAs) as applicable in Pakistan. Our responsibilities under those standards are further described in the Auditor’s Responsibilities for the Audit of the Consolidated Financial Statements section of our report. We are independent of the Group in accordance with the International Ethics Standards Board for Accountants’ Code of Ethics for Professional Accountants as adopted by the Institute of the Chartered Accountants of Pakistan (the Code), and we have fulfilled our other ethical responsibilities in accordance with the Code. We believe that the audit evidence we have obtained is sufficient and appropriate to provide a basis for our qualified opinion.
Emphasis of Matters
We draw attention to Note 1(a) to the consolidated financial statements, which states that the Lalpir Solar Power (Private) Limited – Subsidiary Company is no longer a going concern, therefore, the financial statements of Lalpir Solar Power (Private) Limited have been prepared on the basis of estimated realizable / settlement values of assets and liabilities respectively. Our opinion is not modified in respect of this matter.
Key Audit Matters Key audit matters are those matters that, in our professional judgment, were of most significance in our audit of the consolidated financial statements of the current period. These matters were addressed in the context of our audit of the consolidated financial statements as a whole, and in forming our opinion thereon, and we do not provide a separate opinion on these matters. In addition to the matter described in the Basis for Qualified Opinion section we have determined the matters described below to be the key audit matters to be communicated in our report.
Annual Report 2021 119
Accounting for equity accounted associates
Investments in equity-accounted associates amounted to Rupees 39,550 million (22.48% of total assets) as at 30 June 2021.
There is a risk that associates are not accounted for and disclosed properly.
As such, we have identified the impairment assessment, equity accounting and disclosure for the investments in equity accounted associates as representing key audit matters due to the significance of the balance to the consolidated financial statements as a whole.
The Group’s management conducts its impairment test to assess the recoverability of the equity accounted associates and considers whether there are indicators of impairment with respect to these investments. Impairment assessments of these investments require significant judgement and there is the risk that valuation of the investments may be incorrect and any potential impairment charge miscalculated.
For further information on investments in equity-accounted associates, refer to the following:
- Summary of significant accounting policies, Consolidation – Associates note 2.2(b) to the consolidated financial statements.
- Critical accounting estimates and judgements note 2.1(c)
- Long term investments note 18 to the consolidated financial statements.
Our procedures included, but were not limited to:
• We perused the supporting documentation and ensured that they are properly accounted for in accordance with International Accounting Standard (IAS) 28 ‘Investments in Associates and Joint Ventures’.
• We ensured proper equity accounting was carried out during the year by looking at the post-acquisition change in the Group’s share of net assets of the associates. In particular, we have:
- Tested additions of investments made during the year.
- Checked the accuracy for computation of share of dividend income and profit or loss and other comprehensive income of the associates.
• We assessed the adequacy of the disclosures presented within the consolidated financial statements to ensure they are in accordance with International Financial Reporting Standard (IFRS) 12 ‘Disclosure of Interests in Other Entities’.
• We sent group audit instructions to the respective component auditors to gain comfort on the audit procedures performed by the component auditors over the financial statements of associates.
• We evaluated the reasonableness of management’s assumptions and estimates used in determining the recoverable values of material investments. We assessed the assumptions and estimates based on our knowledge of the Group and the industries.
Assessment of control and significant influence on investments
There is a risk that management has made an error in judgement or may have not fully considered all rules, facts and circumstances in assessing whether the Group has control or significant influence on
Our procedures included, but were not limited to:
• We tested the design and implementation of key controls around the application of the accounting standards and evaluated the significant
Sr.No.
2.
Following are the key audit matters:
1.
Key audit matters How the matters were addressed in our audit
Nishat Mills Limited and its Subsidiaries120
its investments which may have significant consequences on the consolidated financial statements.
For further information, refer to the following:
- Summary of significant accounting policies, Consolidation note 2.2 to the consolidated financial statements.
- Note 1 and Note 18 to the consolidated financial statements.
judgements that management exercised in determining whether the Group controls or have significant influence over the investee companies.
• We reviewed documents to support any key judgments management has made in determining whether they control or have significant influence over an investee e.g. power over relevant activities.
• We have tested the consolidation process to assess whether the conclusions reached have been appropriately applied in the preparation of the consolidated financial statements and adequate disclosures have been made in the consolidated financial statements.
Inventory existence and valuation
Inventory of the textile business of the Group as at 30 June 2021 represented a material position in the consolidated statement of financial position.
Inventory is measured at the lower of cost and net realizable value.
We identified existence and valuation of inventory as a key audit matter due to its size, representing 15.79% of total assets of the Group as at 30 June 2021, and the judgment involved in valuation.
For further information on inventory, refer to the following:
- Summary of significant accounting policies, Inventories note 2.17 to the consolidated financial statements.
- Stores, spares and loose tools note 20 and Stock-in-trade note 21 to the consolidated financial statements.
Our procedures over existence and valuation of inventory included, but were not limited to:
• To test the quantity of inventories at all locations, we assessed the corresponding inventory observation instructions and participated in inventory counts on sites. Based on samples, we performed test counts and compared the quantities counted by us with the results of the counts of the management.
• For a sample of inventory items, re-performed the weighted average cost calculation and compared the weighted average cost appearing on valuation sheets.
• We tested that the ageing report used by management correctly aged inventory items by agreeing a sample of aged inventory items to the last recorded invoice.
• On a sample basis, we tested the net realizable value of inventory items to recent selling prices and re-performed the calculation of the inventory write down, if any.
• We assessed the percentage write down applied to older inventory with reference to historic inventory write downs and recoveries on slow moving inventory.
• In the context of our testing of the calculation, we analysed individual cost components and traced them back to the corresponding underlying documents. We furthermore challenged changes in unit costs.
• We also made enquires of management,
Sr.No.
3.
Key audit matters How the matters were addressed in our audit
Annual Report 2021 121
Capital expenditures
The textile business of the Group is investing significant amounts in its operations and there are a number of areas where management judgement impacts the carrying value of property, plant and equipment and its respective depreciation profile. These include among other the decision to capitalize or expense costs; and review of useful life of the assets including the impact of changes in the Group’s strategy.
We focused on this area since the amounts have a significant impact on the financial position of the Group and there is significant management judgment required that has significant impact on the reporting of the financial position for the Group. Therefore, considered as one of the key audit matters.
For further information, refer to the following:
- Summary of significant accounting policies, Property, plant, equipment and deprecation note 2.7 to the consolidated financial statements.
- Property, plant and equipment note 15 to the consolidated financial statements.
Our procedures included, but were not limited to:
• We tested operating effectiveness of controls in place over the property, plant and equipment cycle including the controls over whether costs incurred on activities is capital or operating in nature.
• We evaluated the appropriateness of capitalization policies and depreciation rates.
• We performed tests of details on costs capitalized.
• We verified the accuracy of management’s calculation used for the impairment testing.
including those outside of the finance function, and considered the results of our testing above to determine whether any specific write downs were required.
Sr.No.
Key audit matters How the matters were addressed in our audit
Revenue recognition
We identified recognition of revenue of textile business of the Group as a key audit matter because revenue is one of the key performance indicators and gives rise to an inherent risk that revenue could be subject to misstatement to meet expectations or targets.
For further information, refer to the following:
- Summary of significant accounting policies, Revenue from contracts with customers note 2.24 to the consolidated financial statements.
Our procedures included, but were not limited to:
• We obtained an understanding of the process relating to recognition of revenue and testing the design, implementation and operating effectiveness of key internal controls over recording of revenue.
• We compared a sample of revenue transactions recorded during the year with sales orders, sales invoices, delivery documents and other relevant underlying documents.
• We compared a sample of revenue transactions
5.
4.
Nishat Mills Limited and its Subsidiaries122

recorded around the year-end with the sales orders, sales invoices, delivery documents and other relevant underlying documentation to assess if the related revenue was recorded in the appropriate accounting period.
• We assessed whether the accounting policies for revenue recognition complies with the requirements of IFRS 15 ‘Revenue from Contracts with Customers’.
• We also considered the appropriateness of disclosures in the consolidated financial statements.
Sr.No.
Key audit matters How the matters were addressed in our audit
Master Agreement and PPA Amendment Agreement
On 12 February 2021, Nishat Power Limited – Subsidiary Company signed the Amend-ment to the Power Purchase Agreement (PPA) and Master Agreement (the Agree-ments) with Central Power Purchasing Agency (Guarantee) Limited (CPPA-G / Power Purchaser) whereby settlements relating to capacity revenue dispute and its receivable have been made. The settlement resulted in an impairment of Rupees 141.474 million. Further, pursuant to the PPA Amendment Agreement, the existing term of Power Purchase Agreement (PPA) of twenty-five years has been extended by 68 days. The Subsidiary Company in consider-ation also agreed to forgo certain amounts under the Final Award.
Further, subject to the terms of the PPA Amendment Agreement, the Subsidiary Company agreed to forgo its rights to late payment interest on late payment interest invoices.
Signing of the above-mentioned Agree-ments is a significant event during the year and the evaluation of its impact involves significant management judgment, there-fore, we considered this as a key audit matter.
For further information, refer to the following:
- Note 1(a) to the consolidated financial statements.
- Trade debts note 22.6 to the consolidated financial statements.
- Revenue note 30 to the consolidated financial statements.
We issued instructions to the component auditor. We, as group auditor, evaluated the procedures performed by the component auditor in respect of the Agreements. The procedures, amongst others included the following:
• Assessed whether the revenue and related trade debts / receivables have been recognized in accordance with the applicable accounting policies.
• Obtained and assessed details of the Agreements and discussed the same with the Subsidiary Company’s management.
• Inspected the minutes of the meetings of Board of Directors and Audit Committees during the year ended 30 June 2021.
• Checked that the invoices raised by the Subsidiary Company during the year are in accordance with the requirements of PPA and the aforesaid Agreements.
• Circularized confirmation of trade debts receivables to CPPA-G.
• Assessed the adequacy of impairment in relation to the disputed capacity receivables.
• Assessed adequacy of the accounting treatment and related disclosures made in the consolidated financial statements, with regards to applicable accounting and reporting standards.
6.
Annual Report 2021 123
Information Other than the Financial Statements and Auditor’s Report Thereon
Management is responsible for the other information. The other information comprises the information included in the annual report, but does not include the consolidated financial statements and our auditor’s report thereon.
Our opinion on the consolidated financial statements does not cover the other information and we do not express any form of assurance conclusion thereon.
In connection with our audit of the consolidated financial statements, our responsibility is to read the other information and, in doing so, consider whether the other information is materially inconsistent with the consolidated financial statements or our knowledge obtained in the audit or otherwise appears to be materially misstated.
If, based on the work we have performed, we conclude that there is a material misstatement of this other information, we are required to report that fact. As described in the Basis for Qualified Opinion section above, the Group should have consolidated Nishat USA, Inc. (Subsidiary Company) based on audited financial statements. Accordingly, we are unable to conclude whether or not the other information is materially misstated with respect to this matter.
Responsibilities of Management and the Board of Directors for the Consolidated Financial Statements
Management is responsible for the preparation and fair presentation of the consolidated financial statements in accordance with accounting and reporting standards as applicable in Pakistan and Companies Act, 2017 and for such internal control as management determines is necessary to enable the preparation of consolidated financial statements that are free from material misstatement, whether due to fraud or error.
In preparing the consolidated financial statements, management is responsible for assessing the Group’s ability to continue as a going concern, disclosing, as applicable, matters related to going concern and using the going concern basis of accounting unless management either intends to liquidate the Group or to cease operations, or has no realistic alternative but to do so.
The Board of Directors is responsible for overseeing the Group’s financial reporting process.
Auditor’s Responsibilities for the Audit of the Consolidated Financial Statements
Our objectives are to obtain reasonable assurance about whether the consolidated financial statements as a whole are free from material misstatement, whether due to fraud or error, and to issue an auditor’s report that includes our opinion. Reasonable assurance is a high level of assurance, but is not a guarantee that an audit conducted in accordance with ISAs as applicable in Pakistan will always detect a material misstatement when it exists. Misstatements can arise from fraud or error and are considered material if, individually or in the aggregate, they could reasonably be expected to influence the economic decisions of users taken on the basis of these consolidated financial statements.
As part of an audit in accordance with ISAs as applicable in Pakistan, we exercise professional judgment and maintain professional skepticism throughout the audit. We also:
• Identify and assess the risks of material misstatement of the consolidated financial statements, whether due to fraud or error, design and perform audit procedures responsive to those risks, and obtain audit evidence that is sufficient and appropriate to provide a basis for our opinion. The risk of not detecting a material misstatement resulting from fraud is higher than for one resulting from error, as fraud may involve collusion, forgery, intentional omissions, misrepresentations, or the override of internal control.
• Obtain an understanding of internal control relevant to the audit in order to design audit procedures that are appropriate in the circumstances, but not for the purpose of expressing an opinion on the effectiveness of the Group’s internal control.
Nishat Mills Limited and its Subsidiaries124
• Evaluate the appropriateness of accounting policies used and the reasonableness of accounting estimates and related disclosures made by management.
• Conclude on the appropriateness of management’s use of the going concern basis of accounting and, based on the audit evidence obtained, whether a material uncertainty exists related to events or conditions that may cast significant doubt on the Group’s ability to continue as a going concern. If we conclude that a material uncertainty exists, we are required to draw attention in our auditor’s report to the related disclosures in the consolidated financial statements or, if such disclosures are inadequate, to modify our opinion. Our conclusions are based on the audit evidence obtained up to the date of our auditor’s report. However, future events or conditions may cause the Group to cease to continue as a going concern.
• Evaluate the overall presentation, structure and content of the consolidated financial statements,
including the disclosures, and whether the consolidated financial statements represent the underlying transactions and events in a manner that achieves fair presentation.
• Obtain sufficient appropriate audit evidence regarding the financial information of the entities or business activities within the Group to express an opinion on the consolidated financial statements. We are responsible for the direction, supervision and performance of the group audit. We remain solely responsible for our audit opinion.
We communicate with the Board of Directors regarding, among other matters, the planned scope and timing of the audit and significant audit findings, including any significant deficiencies in internal control that we identify during our audit.
We also provide the Board of Directors with a statement that we have complied with relevant ethical requirements regarding independence, and to communicate with them all relationships and other matters that may reasonably be thought to bear on our independence, and where applicable, related safeguards. From the matters communicated with the Board of Directors, we determine those matters that were of most significance in the audit of the consolidated financial statements of the current period and are therefore the key audit matters. We describe these matters in our auditor’s report unless law or regulation precludes public disclosure about the matter or when, in extremely rare circumstances, we determine that a matter should not be communicated in our report because the adverse consequences of doing so would reasonably be expected to outweigh the public interest benefits of such communication. The engagement partner on the audit resulting in this independent auditor’s report is Syed Mustafa Ali.
RIAZ AHMAD & COMPANYChartered Accountants
LahoreDate: 24 September 2021
Annual Report 2021 125

2021 2020
Note (Rupees in thousand)
EQUITY AND LIABILITIES
SHARE CAPITAL AND RESERVES
Authorized share capital
1,100,000,000 (2020: 1,100,000,000) ordinaryshares of Rupees 10 each 11,000,000 11,000,000
Issued, subscribed and paid-up share capital 3 3,515,999 3,515,999Reserves 4 104,414,731 92,836,718
Equity attributable to equity holders of the Holding Company 107,930,730 96,352,717
Non-controlling interest 12,741,966 11,606,574
Total equity 120,672,696 107,959,291
LIABILITIES
NON-CURRENT LIABILITIES
Long term financing 5 11,705,985 9,372,451Lease liabilities 6 1,368,868 1,765,873Long term security deposits 7 269,078 271,133Retirement benefit obligation 23,008 19,466Deferred liabilities 8 2,572,634 1,974,551 15,939,573 13,403,474
CURRENT LIABILITIES
Trade and other payables 9 11,390,058 11,184,265Accrued mark-up 10 269,569 395,513Short term borrowings 11 22,385,156 24,080,517Current portion of non-current liabilities 12 5,144,607 1,263,901Unclaimed dividend 13 115,497 111,267 39,304,887 37,035,463
TOTAL LIABILITIES 55,244,460 50,438,937
CONTINGENCIES AND COMMITMENTS 14
TOTAL EQUITY AND LIABILITIES 175,917,156 158,398,228
The annexed notes form an integral part of these consolidated financial statements.
CHIEF EXECUTIVE OFFICER
As at June 30, 2021Consolidated Statement of Financial Position
Nishat Mills Limited and its Subsidiaries126

2021 2020
Note (Rupees in thousand)
ASSETS
NON-CURRENT ASSETS
Property, plant and equipment 15 47,644,512 43,724,143Intangible assets 16 - 1,259Right-of-use assets 17 1,739,404 2,030,736Long term investments 18 55,330,247 50,115,435Long term loans 19 532,541 361,635Long term deposits 277,579 225,882 105,524,283 96,459,090
CURRENT ASSETS
Stores, spare parts and loose tools 20 3,307,714 2,979,540Stock-in-trade 21 25,795,008 28,367,135Trade debts 22 27,111,194 23,604,593Loans and advances 23 1,089,975 719,759Advance income tax - net 24 1,054,299 652,738Short term deposits and prepayments 25 191,671 184,401Other receivables 26 5,431,355 4,652,267Accrued interest 27 13,659 2,301Short term investment 28 - 17,677Cash and bank balances 29 6,397,998 758,727 70,392,873 61,939,138
TOTAL ASSETS 175,917,156 158,398,228
CHIEF FINANCIAL OFFICERDIRECTOR
Annual Report 2021 127

2021 2020
Note (Rupees in thousand)
REVENUE 30 104,727,458 88,709,830
COST OF SALES 31 (86,066,252) (70,822,039)
GROSS PROFIT 18,661,206 17,887,791
DISTRIBUTION COST 32 (6,456,276) (6,093,102)
ADMINISTRATIVE EXPENSES 33 (2,182,075) (2,223,204)
OTHER EXPENSES 34 (597,767) (218,300)
(9,236,118) (8,534,606)
9,425,088 9,353,185
OTHER INCOME 35 2,732,075 2,351,438
PROFIT FROM OPERATIONS 12,157,163 11,704,623
FINANCE COST 36 (1,881,452) (2,957,854)
10,275,711 8,746,769
SHARE OF PROFIT FROM ASSOCIATES 18.2 2,848,522 864,092
PROFIT BEFORE TAXATION 13,124,233 9,610,861
TAXATION 37 (1,918,637) (839,106)
PROFIT AFTER TAXATION 11,205,596 8,771,755
SHARE OF PROFIT ATTRIBUTABLE TO:
EQUITY HOLDERS OF HOLDING COMPANY 9,896,748 6,352,753
NON-CONTROLLING INTEREST 1,308,848 2,419,002
11,205,596 8,771,755
EARNINGS PER SHARE - BASIC AND DILUTED (RUPEES) 38 28.15 18.07
The annexed notes form an integral part of these consolidated financial statements.
CHIEF EXECUTIVE OFFICER CHIEF FINANCIAL OFFICERDIRECTOR
For the year ended June 30, 2021Consolidated Statement of Profit or Loss
Nishat Mills Limited and its Subsidiaries128
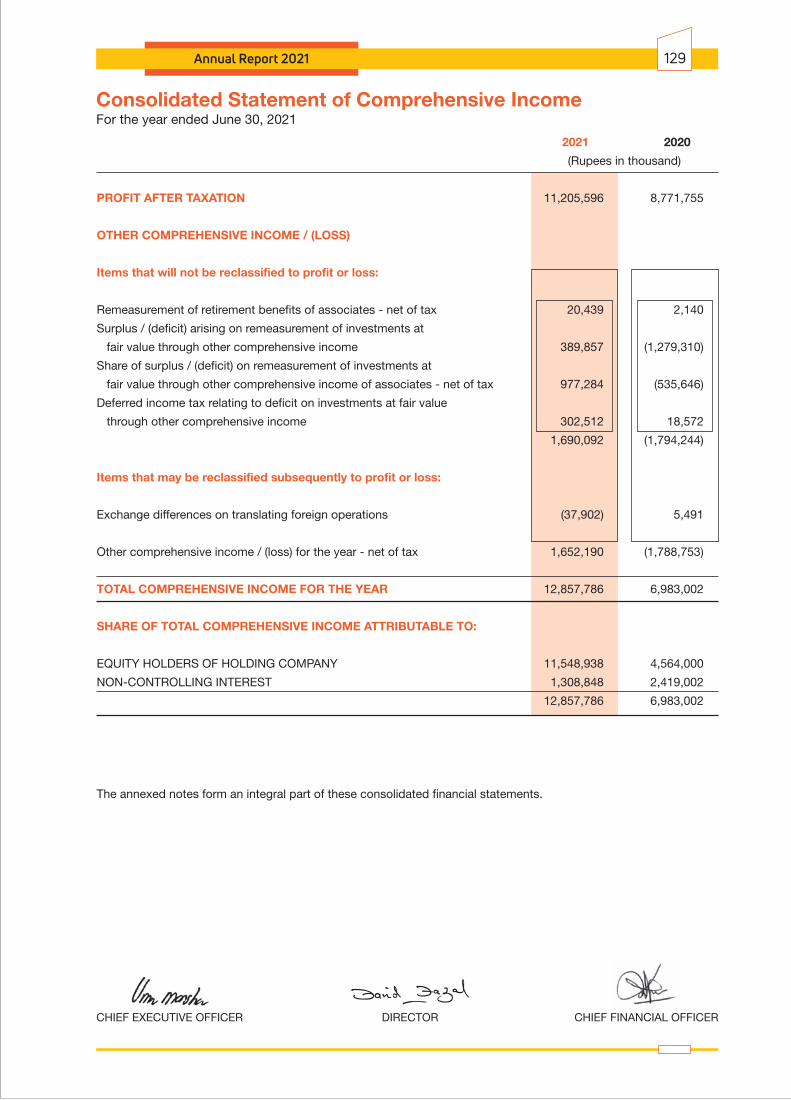
2021 2020
(Rupees in thousand)
PROFIT AFTER TAXATION 11,205,596 8,771,755
OTHER COMPREHENSIVE INCOME / (LOSS)
Items that will not be reclassified to profit or loss:
Remeasurement of retirement benefits of associates - net of tax 20,439 2,140
Surplus / (deficit) arising on remeasurement of investments at
fair value through other comprehensive income 389,857 (1,279,310)
Share of surplus / (deficit) on remeasurement of investments at
fair value through other comprehensive income of associates - net of tax 977,284 (535,646)
Deferred income tax relating to deficit on investments at fair value
through other comprehensive income 302,512 18,572
1,690,092 (1,794,244)
Items that may be reclassified subsequently to profit or loss:
Exchange differences on translating foreign operations (37,902) 5,491
Other comprehensive income / (loss) for the year - net of tax 1,652,190 (1,788,753)
TOTAL COMPREHENSIVE INCOME FOR THE YEAR 12,857,786 6,983,002
SHARE OF TOTAL COMPREHENSIVE INCOME ATTRIBUTABLE TO:
EQUITY HOLDERS OF HOLDING COMPANY 11,548,938 4,564,000
NON-CONTROLLING INTEREST 1,308,848 2,419,002
12,857,786 6,983,002
The annexed notes form an integral part of these consolidated financial statements.
CHIEF EXECUTIVE OFFICER CHIEF FINANCIAL OFFICERDIRECTOR
Annual Report 2021 129
For the year ended June 30, 2021Consolidated Statement of Comprehensive Income
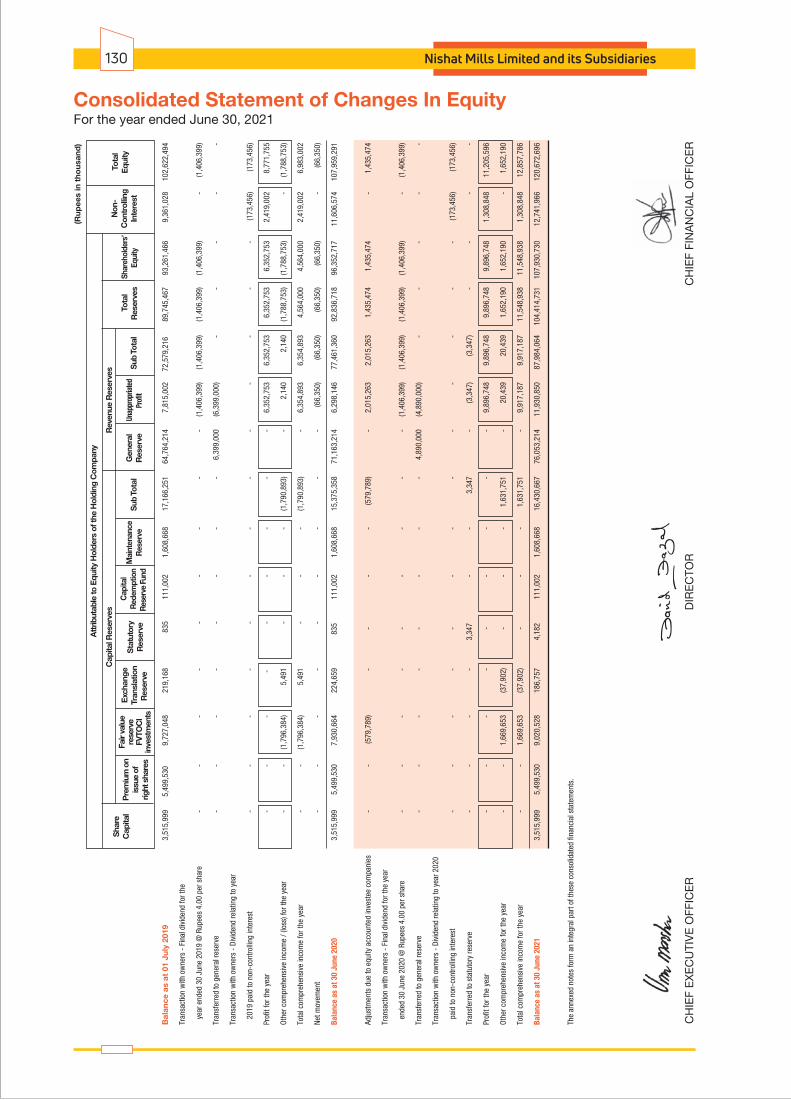
Sha
reC
apita
lP
rem
ium
on
issu
e of
right
sha
res
Exc
hang
eTr
ansl
atio
nR
eser
ve
Cap
ital
Red
empt
ion
Rese
rve
Fund
Non
-C
ontr
ollin
gIn
tere
stFa
ir va
lue
rese
rve
FVTO
CI
inve
stm
ents
Sta
tuto
ryR
eser
ve S
ub T
otal
Sub
Tot
al T
otal
Res
erve
s
Tot
alE
quity
Gen
eral
Res
erve
Mai
nten
ance
Res
erve
Unap
prop
riate
dPr
ofit
Shar
ehol
ders
’Eq
uity
Cap
ital R
eser
ves
Rev
enue
Res
erve
s
Attr
ibut
able
to E
quity
Hol
ders
of t
he H
oldi
ng C
ompa
ny
(Rup
ees
in t
hous
and
)
Bal
ance
as
at 0
1 Ju
ly 2
019
3,5
15,9
99
5,49
9,53
0
9,72
7,04
8 21
9,16
8 83
5 11
1,00
2 1,
608,
668
17,
166,
251
64,
764,
214
7,81
5,00
2 72
,579
,216
89
,745
,467
93
,261
,466
9,
361,
028
102,
622,
494
Tran
sact
ion
with
ow
ners
- F
inal
div
iden
d fo
r the
ye
ar e
nded
30
June
201
9 @
Rup
ees
4.00
per
sha
re
- -
- -
- -
- -
- (1
,406
,399
) (1
,406
,399
) (1
,406
,399
) (1
,406
,399
) -
(1,4
06,3
99)
Tran
sfer
red
to g
ener
al re
serv
e -
- -
- -
- -
- 6,
399,
000
(6,3
99,0
00)
- -
- -
-
Tran
sact
ion
with
ow
ners
- D
ivid
end
rela
ting
to y
ear
20
19 p
aid
to n
on-c
ontro
lling
inte
rest
-
- -
- -
- -
- -
- -
- -
(173
,456
) (1
73,4
56)
Prof
it fo
r the
yea
r -
- -
-
- -
- -
- 6,
352,
753
6,35
2,75
3 6,
352,
753
6,35
2,75
3 2,
419,
002
8,77
1,75
5
Othe
r com
preh
ensi
ve in
com
e / (
loss
) for
the
year
-
- (1
,796
,384
) 5,
491
- -
- (1
,790
,893
) -
2,14
0 2,
140
(1,7
88,7
53)
(1,7
88,7
53)
- (1
,788
,753
)
Tota
l com
preh
ensi
ve in
com
e fo
r the
yea
r -
- (1
,796
,384
) 5,
491
- -
- (1
,790
,893
) -
6,35
4,89
3 6,
354,
893
4,56
4,00
0 4,
564,
000
2,41
9,00
2 6,
983,
002
Net m
ovem
ent
- -
- -
- -
- -
- (6
6,35
0)
(66,
350)
(6
6,35
0)
(66,
350)
-
(66,
350)
Bala
nce
as a
t 30
June
202
0 3,
515,
999
5,49
9,53
0 7,
930,
664
224,
659
835
1
11,0
02
1,60
8,66
8 15
,375
,358
71
,163
,214
6,
298,
146
77,4
61,3
60
92,8
36,7
18
96,3
52,7
17
11,6
06,5
74
107,
959,
291
Adju
stm
ents
due
to e
quity
acc
ount
ed in
vest
ee c
ompa
nies
-
- (5
79,7
89)
- -
-
-
(579
,789
) -
2,01
5,26
3 2,
015,
263
1,43
5,47
4 1,
435,
474
- 1,
435,
474
Tran
sact
ion
with
ow
ners
- F
inal
div
iden
d fo
r the
yea
r
en
ded
30 J
une
2020
@ R
upee
s 4.
00 p
er s
hare
-
- -
- -
-
-
- -
(1,4
06,3
99)
(1,4
06,3
99)
(1,4
06,3
99)
(1,4
06,3
99)
- (1
,406
,399
)
Tran
sfer
red
to g
ener
al re
serv
e -
-
- -
-
-
- -
4,89
0,00
0 (4
,890
,000
) -
- -
- -
Tran
sact
ion
with
ow
ners
- D
ivid
end
rela
ting
to y
ear 2
020
pa
id to
non
-con
trolli
ng in
tere
st
- -
- -
-
-
- -
- -
- -
- (1
73,4
56)
(173
,456
)
Tran
sfer
red
to s
tatu
tory
rese
rve
- -
- -
3,34
7
-
- 3,
347
- (3
,347
) (3
,347
) -
- -
-
Prof
it fo
r the
yea
r -
- -
- -
-
-
- -
9,89
6,74
8 9,
896,
748
9,89
6,74
8 9,
896,
748
1,30
8,84
8 11
,205
,596
Othe
r com
preh
ensi
ve in
com
e fo
r the
yea
r -
- 1,
669,
653
(37,
902)
-
-
- 1,
631,
751
- 20
,439
20
,439
1,
652,
190
1,65
2,19
0 -
1,65
2,19
0
Tota
l com
preh
ensi
ve in
com
e fo
r the
yea
r -
- 1,
669,
653
(37,
902)
-
-
-
1,63
1,75
1 -
9,91
7,18
7 9,
917,
187
11,5
48,9
38
11,5
48,9
38
1,30
8,84
8 12
,857
,786
Bala
nce
as a
t 30
June
202
1 3,
515,
999
5,49
9,53
0 9,
020,
528
186,
757
4,18
2
111
,002
1,
608,
668
16,4
30,6
67
76,0
53,2
14
11,9
30,8
50
87,9
84,0
64
104,
414,
731
107,
930,
730
12,7
41,9
66
120,
672,
696
The
anne
xed
note
s fo
rm a
n in
tegr
al p
art o
f the
se c
onso
lidat
ed fi
nanc
ial s
tate
men
ts.
CH
IEF
EX
EC
UTI
VE
OFF
ICE
RC
HIE
F FI
NA
NC
IAL
OFF
ICE
RD
IRE
CTO
R
For the year ended June 30, 2021Consolidated Statement of Changes In Equity
Nishat Mills Limited and its Subsidiaries130

2021 2020
Note (Rupees in thousand)
CASH FLOWS FROM OPERATING ACTIVITIES
Cash generated from operations 39 13,601,745 10,125,221
Finance cost paid (1,933,834) (3,031,586)
Income tax paid (1,579,446) (1,296,718)
Long term security deposits (paid) / received (2,055) 54,103
Exchange gain on forward exchange contracts received 1,237 107,279
Gas infrastructure development cess paid (168,369) -
Net increase in retirement benefit obligation 2,550 151
Net increase in long term loans (211,159) (62,807)
Net increase in long term deposits (51,697) (11,981)
Net cash generated from operating activities 9,658,972 5,883,662
CASH FLOWS FROM INVESTING ACTIVITIES
Proceeds from sale of property, plant and equipment 397,167 97,272
Capital expenditure on property, plant and equipment (7,919,907) (5,791,497)
Dividends received 2,490,606 1,856,089
Investments made (259,820) (430,587)
Proceeds from sale of investments 36,021 -
Interest received 122,563 112,982
Net cash used in investing activities (5,133,370) (4,155,741)
CASH FLOWS FROM FINANCING ACTIVITIES
Proceeds from long term financing 6,744,988 4,454,967
Repayment of long term financing (1,756,252) (4,404,834)
Repayment of lease liabilities (566,179) (347,769)
Exchange differences on translation of net investments
in foreign subsidiaries (37,902) 15,704
Short term borrowings - net (1,695,361) (322,057)
Dividend paid (1,575,625) (1,585,627)
Net cash from / (used in) financing activities 1,113,669 (2,189,616)
Net increase / (decrease) in cash and cash equivalents 5,639,271 (461,695)
Cash and cash equivalents at the beginning of the year 758,727 1,220,422
Cash and cash equivalents at the end of the year 6,397,998 758,727
The annexed notes form an integral part of these consolidated financial statements.
CHIEF EXECUTIVE OFFICER CHIEF FINANCIAL OFFICERDIRECTOR
Annual Report 2021 131
For the year ended June 30, 2021Consolidated Statement of Cash Flows

1 THE GROUP AND ITS OPERATIONS
a) The Group consists of:
Holding Company
- Nishat Mills Limited
Subsidiary Companies
- Nishat Power Limited - Nishat Linen (Private) Limited - Nishat Hospitality (Private) Limited - Nishat USA, Inc. - Nishat Linen Trading LLC - Nishat International FZE - China Guangzhou Nishat Global Co., Ltd. - Nishat Commodities (Private) Limited - Lalpir Solar Power (Private) Limited
NISHAT MILLS LIMITED
Nishat Mills Limited is a public limited Company incorporated in Pakistan under the Companies Act, 1913 (Now Companies Act, 2017) and listed on Pakistan Stock Exchange Limited. Its registered office is situated at 53-A, Lawrence Road, Lahore. The Company is engaged in the business of textile manufacturing and of spinning, combing, weaving, bleaching, dyeing, printing, stitching, apparel, buying, selling and otherwise dealing in yarn, linen, cloth and other goods and fabrics made from raw cotton, synthetic fibre and cloth and to generate, accumulate, distribute, supply and sell electricity. Geographical location and addresses of all business units are as follows:
Sr. No.
1 Spinning units, yarn dyeing unit and power plant Nishatabad, Faisalabad. 2 Spinning units and power plant Plot No. 172-180 and 188-197, M-3 Industrial City, Sahianwala, FIEDMC, 2 K.M., Jhumra Chiniot Road, Chak Jhumra, Faisalabad. 3 Spinning units and power plant 20 K.M., Sheikhupura Road, Feroze Wattwan. 4 Weaving units and power plant 12 K.M., Faisalabad Road, Sheikhupura. 5 Weaving units, dyeing and finishing unit, 5 K.M., Nishat Avenue Off 22 K.M., Ferozepur processing unit, stitching units and power plants Road, Lahore. 6 Terry unit 7 K.M., Nishat Avenue Off 22 K.M., Ferozepur Road, Lahore. 7 Apparel unit 2 K.M., Nishat Avenue Off 22 K.M., Ferozepur Road, Lahore. 8 Head office 7-Main Gulberg, Lahore. 9 Office 1st Floor, Karachi Chambers, Hasrat Mohani Road, Karachi. 10 Registered office Nishat House, 53 - A, Lawrence Road, Lahore.
NISHAT POWER LIMITED
Nishat Power Limited is a public limited Company incorporated in Pakistan under the repealed Companies Ordinance, 1984 (Now Companies Act, 2017) and listed on Pakistan Stock Exchange Limited. The Company is a subsidiary of Nishat Mills Limited. The principal activity of the Company is to build, own, operate and maintain a fuel fired power station having gross capacity of 200 MW ISO in Jamber Kalan, Tehsil Pattoki, District Kasur, Punjab, Pakistan. Its
Manufacturing units and offices Address
For the year ended June 30, 2021Notes to the Consolidated Financial Statements
Nishat Mills Limited and its Subsidiaries132
registered office is situated at 53-A, Lawrence Road, Lahore. Its head office is situated at 1-B, Aziz Avenue, Canal Road, Gulberg V, Lahore. The Company had a Power Purchase Agreement (‘PPA’) with its sole customer, National Transmission and Despatch Company Limited (‘NTDC’) for twenty five years which commenced from 09 June 2010. During the year on 12 February 2021, the Company entered into a Novation Agreement to the PPA with NTDC and Central Power Purchasing Agency (Guarantee) Limited (‘CPPA-G’ and also referred to as the ‘Power Purchaser’), whereby, NTDC irrevocably transferred all of its rights, obligations and liabilities under the PPA to CPPA-G and thereafter, NTDC ceased to be a party to the PPA, and CPPA-G became a party to the PPA in place of NTDC. Further, on the same day, the Company entered into the PPA Amendment Agreement, whereby, the current Agreement Year that was ending on 08 June 2021 was extended by sixty eight (68) days to 15 August 2021. Therefore, the existing term of the PPA Agreement has been extended by sixty eight days to twenty five years and sixty eight days ending on 15 August 2035. Ownership interest held by non-controlling interests in Nishat Power Limited is 48.99% (2020: 48.99%).
Significant events during the period
Master Agreement and Power Purchase Amendment Agreement of Nishat Power Limited – Subsidiary Company
Nishat Power Limited – Subsidiary Company in the larger national interest and sustainability of the power sector, voluntarily agreed to alter its existing contractual arrangements with the CPPA-G for the sale and purchase of electricity. In this respect, the Subsidiary Company entered into a “Master Agreement” and a “PPA Amendment Agreement” (hereinafter referred to as the 'Agreements') on 12 February 2021. Under these Agreements, the Subsidiary Company and CPPA-G have primarily agreed on the following matters that are subject to fulfilment of certain terms and conditions mentioned in the Agreements:
- Mechanism of settlement of long outstanding acknowledged receivables as at 30 November 2020 aggregating to Rupees 14,252.802 million, in two installments;
- Discounts in tariff components i.e. Return on Equity (ROE) including Return on Equity During Construction (RoEDC) shall be changed to 17% per annum in Pak Rupee (PKR) calculated at PKR / USD exchange rate of PKR 148 / USD, with no future USD indexation. However, the existing ROE and RoEDC, together with applicable indexation, shall continue to be applied until the date when the applicable exchange rate under the present tariff reaches PKR 168 / USD, whereupon the revised RoE and RoEDC shall become applicable for reminder of the term of the PPA. The revised tariff will be effective subject to notification by Government of Pakistan ('GoP') and payment of first installment by CPPA-G;
- Any future savings in fuel, subject to certain conditions stipulated in the Master Agreement, shall be shared between CPPA-G and the Subsidiary Company on a sliding scale ratio ranging from 70:30 to 40:60 for any efficiency above NEPRA determined benchmark. Furthermore, any future savings in Operations & Maintenance ('O&M') shall be shared 50:50, subject to certain conditions stipulated in the Master Agreement;
- Delayed payment rate' as referred in note 22.6 of these consolidated financial statements has been amended to (a) for the first sixty (60) days, KIBOR plus two percent per annum, compounded semi-annually; (b) for any period thereafter sixty (60) days, KIBOR plus four-point five percent per annum, each compounded semi-annually. However, this shall come into effect after NEPRA approves the adjustment in tariff and its terms strictly per the scope of Tariff Adjustment Application and CPPA-G has paid the two installments as mentioned above in respect of long outstanding acknowledged receivables;
- Conversion of the PPA to 'Take and Pay Basis' when competitive trading arrangement is implemented and becomes fully operational, as per terms stipulated in the Generation License;
- On 07 August 2017, the Subsidiary Company instituted arbitration proceedings against NTDC / Government of Pakistan by filing a Request for Arbitration ('RFA') with the London Court of International Arbitration ('LCIA') (the 'Arbitration Proceedings') for disallowing an amount of Rupees 1,084.748 million relating to delayed payment charges on outstanding delayed payment invoices. In July 2020, a Final Award was given in favour of the Subsidiary Company,
Annual Report 2021 133

whereby, the Arbitrator accepted Subsidiary Company's request and directed NTDC / CPPA-G to pay to the Subsidiary Company (i) interest at the Delayed Payment Rate (DPR) on Delayed Payment (DP) invoices, which is estimated at Rupees 1,620.95 million up to 30 June 2021 and may vary as per legal advice (ii) DP invoices submitted pursuant to section 9.6 of the PPA consistent with the first-in-first-out principle (iii) pay legal costs in the sum of Rupees 12,771,207 (iv) hearing expenses in the sum of GBP 17,393 (equivalent to Rupees 3.802 million) and (v) Arbitration cost in the sum of GBP 44,136 (equivalent to Rupees 9.647 million).
During the year on 05 January 2021, CPPA-G filed a suit in Civil Court, Lahore, to set aside the Final Award issued by LCIA. Meanwhile, the Subsidiary Company also filed the Final Award for enforcement and implementation in Lahore High Court on 13 January 2021. Both the civil suit by CPPA-G and the enforcement application by the Subsidiary Company are pending adjudication.
However, under the Master Agreement, the CPPA-G has agreed to ensure that all present and future invoices shall follow the PPA's mandated FIFO payment principle. As long as this principle is followed by the CPPA-G in relation to past and future payments, the Subsidiary Company in consideration thereof has agreed to forgo and waive all of its claims of delayed payment charges on delayed payment invoices and it shall withdraw all such invoices. However, this will have no impact on the existing revenue and receivables of the Subsidiary Company, as the Subsidiary Company has not recognized the income and corresponding receivable for the said amounts on prudence basis.
- Amicable resolution of the capacity revenue dispute involving Rupees 816.033 million for the period ('disputed period') in which the plant was not fully available for power generation due to non-availability of fuel owing to non-payment by CPPA-G. Pursuant to the PPA Amendment Agreement, the disputed period has been treated as an Other Force Majeure Event (‘OFME’) under the PPA. The OFME period has commenced on 09 June 2021 and will end on 15 August 2021, consequently, the term of PPA has been extended by 68 days, till 15 August 2035. The accounting implications of the same have been detailed under note 22.6 to these consolidated financial statements.
Further, the management has also assessed the accounting implications of the above mentioned developments in relation to the impairment of cash generating unit ('CGU') comprising of tangible and intangible assets under IAS 36, ‘Impairment of assets’. However, according to management's assessment, there is no impact on these consolidated financial statements.
NISHAT LINEN (PRIVATE) LIMITED
Nishat Linen (Private) Limited, a wholly owned subsidiary of Nishat Mills Limited, is a private limited company incorporated in Pakistan under the repealed Companies Ordinance, 1984 (Now Companies Act, 2017) on 15 March 2011. The registered office of Nishat Linen (Private) Limited is situated at 7- Main, Gulberg Lahore. The principal objects of the Company are to operate retail outlets for sale of textile and other products and to sale the textile products by processing the textile goods in own and outside manufacturing facility. Geographical location and addresses of all business units are as follows:
Sr. No.
Manufacturing unit and office
1 Stitching Unit and office 21 K.M., Ferozepur Road, Lahore. Stores 1 Nishat Emporium Mall Shop # G-26, Nishat Emporium Mall, Abdul Haque Road, Johar Town, Lahore. 2 Swarovski-Emporium Mall Shop # KG-05, Ground Floor, Nishat Emporium Mall, Abdul
Haque Road, Johar Town, Lahore. 3 Gulberg Galleria Shop # 13, Ground Floor U/G1 & L/G2, Gulberg Galleria, 18-Main Boulevard, Gulberg III, Lahore.
Business Units Address
For the year ended June 30, 2021Notes to the Consolidated Financial Statements
Nishat Mills Limited and its Subsidiaries134

Annual Report 2021 135
Sr. No.
4 Packages Mall Packages Mall, Walton Road, Lahore. 5 Tariq Road Plot No. 172-5, P.E.C.H.S, Block 2, Tariq Road, Karachi. 6 Wapda Town Main Boulevard, Johar Town, (Opposite Shaukat Khanum
Hospital), Lahore. 7 Fashion Avenue Fashion Avenue, Shop No. 5-7, College Block, Main
Boulevard, Allama Iqbal Town, Lahore. 8 Fair Price Shop - Karachi Plot No. CA-1-2, Ali Centre, Alfalah Cooperative Housing Society Limited, Shah Faisal Colony, Karachi. 9 Canal West Bank Shop No. 1-3, Ground Floor Sraw Plaza, Near Muhafiz Town,
Phase 1, Canal West Bank Road, Lahore. 10 Phase IV DHA 176 DD, Commercial Area, Phase 4, DHA, Lahore. 11 Doctors Hospital 86 G/1, Johar Town (Opposite Doctors Hospital), Lahore. 12 Link Road Model Town Opposite Raja Sahib, Link Road Model Town, Lahore. 13 Sukkur Shop No. 63, Military Road, Sukkur. 14 Shadman 118-Shadman, Lahore. 15 FPS Chauburji Shop No. 2, Development Scheme, Chauburji, Lahore. 16 Gulshan Ravi Factory Outlet, Shop No. 12-C, Main Boulevard Gulshan
Ravi, Lahore. 17 Thokar Niaz Baig Factory Outlet, Ground Floor, 55th Avenue, Thokar Niaz Baig,
Raiwind Road, Lahore. 18 E-Store 21 K.M., Ferozepur Road, Lahore. 19 Clifton G.F2, Jamalistan Shopping Center, DC-1, Block 8, Clifton, Karachi. 20 Dolmen Clifton D-3, 1st Floor, Dolmen City, Block 4, Scheme 5, Clifton, Karachi. 21 Dolmen Tariq Road SF-21, 2nd Floor, Dolmen Mall, Block 3, P.E.C.H.S., Tariq Road, Karachi. 22 Wazirabad G-58, Hajipura, Wazirabad. 23 Ocean Mall Shop 250-254, 2nd Floor, Ocean Mall, Plot No. G-3, Khyaban-e-Iqbal, Block 9, Clifton, Karachi. 24 KDA Outlet Store NL Outlet Store, 565-A, Block 3, KDA Scheme 24,
Gulshan-e-Iqbal, Karachi. 25 Mariam Heights Shop No. 2, Mariam Heights, Plot No. 1, Main Shaheed-e-Millat Road (Opposite Naheed and Chase Super Market), Karachi. 26 Lucky One Mall Lucky One Mall, Shop No. F-31, 1st Floor, Block 21, F.B. Area, Main Rashid Minhas Road, Karachi. 27 Atrium Mall 1st Floor, Atrium Mall, Staff Lines, Fatima Jinnah Road,
Cantt. Karachi. 28 Millennium Mall Millennium Mall, Main Rashid Minhas Road, Adjacent Drive-In Cinema, Gulshan-e-Iqbal, Karachi. 29 ANB Center ANB Center, Plot No. 13-V, (Behind PSO Petrol Pump) Jinnah
Super Market, F-7 Markaz, Islamabad. 30 F-10 Block No. 7, Malik Arcade, F-10 Markaz, Islamabad. 31 Centaurus Mall Shop No. 120, 1st Floor, Centaurus Shopping Mall, Jinnah Avenue Plot No. 1, Blue Area, F-8/G-8, Islamabad. 32 Bahria Town Phase 7 Plaza 155, (Near Shaheen Chowk), Spring North, Phase 7, Bahria Town, Islamabad. 33 PWD Ground Floor, Plaza No. 10, Main Road, Block A, PWD, Islamabad.
Business Units Address

For the year ended June 30, 2021Notes to the Consolidated Financial Statements
Nishat Mills Limited and its Subsidiaries136
Sr. No.
34 World Trade Center World Trade Center, G.T. Road, Defence Housing Authority, Phase II, Islamabad. 35 Awami Trade Center Awami Trade Center, Ground Floor, 31-33, G-9 Markaz, Islamabad. 36 Adamjee Road Plot No. 5, Saddar, Adamjee Road, Rawalpindi. 37 Satellite Town Shop No. 3, Abbas Arcade, 5th Road, Satellite Town, Commercial Market, Rawalpindi. 38 Crystal Mall Crystal Mall, Main Bosan Road, Multan. 39 Gulshan Market Factory Outlet, Shop No. 3, Block-S, 100 Feet Road, Gulshan Market, New Multan Colony, Multan. 40 S.P Chowk Plot No. 1-A, S.P Chowk, Nusrat Road, Multan Cantt., Multan. 41 Masooma Shop No. 2-3, Masooma Shopping Center, Legacy Tower, Koh-e-Noor City, Jaranwala Road, Faisalabad. 42 D-Ground 1298/B, Chen One Road, Peoples Colony No. 1, Faisalabad. 43 Gulberg Road Shop No. P-424, Jinnah Colony, Gulberg Road, Faisalabad. 44 The Boulevard Mall Shop No. 1, Ground Floor, The Boulevard Mall, Near Suzuki Burj Motors, East Canal Road, Faisalabad. 45 Taj Shopping Center Ground Floor Taj Shopping Center, (Near National Bank) Govt. Girls College Road, Satellite Town, Gujranwala. 46 Fazal Centre Hall No. 5, Fazal Centre, G.T. Road, Rahwali Cantt., Gujranwala. 47 Town Branch JB Tower, Ground Floor, University Road, Peshawar. 48 Cantt Branch Deans Trade Center, Islamia Road Cantt., Peshawar. 49 Abdullah Mall Abdullah Mall, Ground Floor, Kutchery Road, Gujrat. 50 Sialkot 97-A, Liberty Market, Aziz Shaheed Road, (Near Silver Spoon Restaurant) Cantt., Sialkot. 51 Bahawalpur Shop No. 2, Haqqi Centre, (Opposite Commissioner House) Adjacent to DIG House, Bahawalpur. 52 Sargodha Shop No. 39, Raas Tower, Qasim Park, Opposite MCB Bank, Main University Road, Sargodha. 53 Abbottabad Mansehra Road, Opposite Faisal Bank, Abbottabad. 54 Mardan Afaq Centre, (Opposite Premier Sugar Mills) Nowshera Road, Mardan. 55 Sahiwal Azaan Heights, Jahaz Chowk, Sahiwal. 56 Swat Shop No. F-1 & F-2, Swat Trade Center, (Opposite Swat Serena Hotel) Allah Chowk, Saidu Sharif, Swat. 57 Mandi Bahauddin Shop No. G9, Ground Floor, Hakim Mall, Jail Road, Mandi Bahauddin. 58 Jhelum Shop No. 1-14, Ground Floor, Adnan Plaza, Jhelum. 59 Boulevard Mall First Floor A-14, Boulevard Mall, Auto Bhan Road, S.I.T.E., Hyderabad. 60 Burewala Opposite Imran Petroleum, Near Stadium Road, Multan Road, Burewala. 61 Quetta Shop No. 1, Ground Floor, Millennium Mall, Gulistan Road, Quetta. 62 Muzaffarabad Shop No. 1, Ground Floor, Al-Rahim Plaza, Neelum Valley Road (Lower Plate), Muzaffarabad. 63 Sheikhupura Lower Ground, Khanjee Center, Civil Quarter Road, Sheikhupura. 64 D.G. Khan Shop No. 32-33, Block No. 15, Traffic Chowk, Dera Ghazi Khan.
Business Units Address

Annual Report 2021 137
Sr. No.
65 Rahim Yar Khan 5-Model Town, Near Town Hall, Opposite U Microfinance Bank, Rahim Yar Khan. 66 Lalamusa Factory Outlet, Lower Ground Floor, City Mall, G.T. Road, Lalamusa. 67 Fair Price Shop Sukheki Nishat Dairy, Sukheki. 68 Wah Cantt Shop No. 7-8 Lower Ground & Shop No. 7-8 Ground Floor, City Centre Phase 2, New City, Wah Cantt. 69 Kasur Chandani Chowk, Plaza No. 216, Near Bank Alfalah, Railway Road, Kasur. 70 Fair Price Shop - Lahore 21 K.M., Ferozepur Road, Lahore. 71 Fair Price Shop – Bhikhi Nishat Mills Limited, Weaving Unit Bhikhi, Sheikhupura. 72 Fair Price Shop –Faisalabad Nishat Mills Limited, Nishatabad, Faisalabad. 73 Centaurus – Inglot Shop No. 315, 3rd Floor, The Centaurus Mall, F-8, Islamabad. 74 WTC – Inglot Shop No. 25, Hyperstar Floor Plot No. 1 Main G.T. Road DHA Phase 2, Islamabad. 75 DMC – Inglot D-3, 1st Floor, Dolmen City, Block 4, Scheme 5, Clifton, Karachi. 76 Emporium – Inglot Ground Floor, G-43, Emporium Mall, Lahore. 77 Swarovski Centaurus Plot No. 1, Tower A, 16th Floor, The Centaurus Mall, Islamabad. 78 Packages – Inglot Shop No. 1065, Ist Floor, Packages Mall, Lahore. 79 Crystal Mall – Inglot Crystal Mall, Chungi No. 9, Bosan Road, Multan. 80 Sargodha – Inglot Plot No. 39, Raas Tower, Qasim Park University Road, Sargodha. 81 Nishat Linen Tower 5-A-3, Mian Mahmood Ali Kasuri Road, Gulberg III, Lahore. 82 Factory Outlet - Lahore Karim Block, Allama Iqbal Town, Lahore. 83 The Mall – Karachi Shop No. 105, Ground Floor, Shanti Nagar, Main Rashid
Minhas Road, Opposite Aladin Amusement Park, Karachi. 84 Bahria Town - Rawalpindi Building 117, Civic Center, Phase 4, Bahria Town,
Rawalpindi. 85 Taj Shopping Center – Gujranwala Ground Floor, Taj Shopping Center, (Near National Bank) Govt. Girls College Road, Satellite Town, Gujranwala. 86 Al Barkat Center – Gujranwala Shop No. 1839-A, Al Barkat Center, Near Marinate
Restaurant, G.T. Road, Gujranwala. 87 Dera Ismail Khan Opposite Liaqat Park, East Circular Road, Dera Ismail Khan. 88 Jhang 1 K.M., Faisalabad Road, Jhang Sadar. 89 Layyah Shop No. 2, College Road, Layyah. 90 Mirpur Shop No. 64, Sector F-1, Kotli Road, Mirpur Azad Kashmir. 91 Okara Tehsil Road, A-Block, Okara. 92 Hafizabad Vanike Road, Hafizabad. 93 Attock Kamra Road, near Fuel Mart CNG Station, Attock. 94 Phalia Shop No. 01, French Galleria, Gujrat Road, Phalia. 95 Boulevard Mall – Inglot Shop No. 8, The Boulevard Mall, East Canal Road, Near Suzuki Burj Motors Showroom, Saeed Colony, Faisalabad. 96 Lucky Mall – Inglot Lucky One Mall, F-13, 1st Floor, Lucky One Mall, Rashid Minhas Road, Karachi. 97 Swarovski – DMC Swarovski Shop No. 11A, Ground Floor, World Trade Center, Islamabad. 98 Nishat Linen Tower – Inglot 5-A-3, Mian Mahmood Ali Kasuri Road, Gulberg III, Lahore. 99 Nishat Linen Tower – Swarovski 5-A-3, Mian Mahmood Ali Kasuri Road, Gulberg III, Lahore. 100 Swarovski-WTC Shop No. 11A, Ground Floor, World Trade Center, Islamabad.
Business Units Address

For the year ended June 30, 2021Notes to the Consolidated Financial Statements
Nishat Mills Limited and its Subsidiaries138
Sr. No.
101 Faisalabad Swarovski Shop No. G-10, Ground Floor, The Boulevard Shopping Mall, East Canal Road, Faisalabad. 102 North Nazimabad Karachi Plot No. D-10/A, Block H, Main Khayaban-e-Sher Shah Suri,
North Nazimabad, Karachi. 103 Hyderabad Shop No. 23-A, Unit 3, Main Auto Bhan Road, Hyderabad. 104 Vehari Shop No.1, Ground and First Floor, Mall of Vehari, Hasilpur Road, Vehari. 105 Daska Shop No.1, College Road, Daska. 106 Chandni Chowk Plot No. 221/B, 4th Road, Adjacent to KFC, Chandni Chowk, Satellite Town, Rawalpindi. 107 Gojra Opposite Paradise City, Jhang Road, Gojra. 108 Sahiwal Shop No.1, Girls College Road, Sahiwal. 109 Haripur Akhtar Nawaz Plaza, Main Haripur Road, Haripur.
NISHAT HOSPITALITY (PRIVATE) LIMITED
Nishat Hospitality (Private) Limited, a wholly owned subsidiary of Nishat Mills Limited, is a private limited company incorporated in Pakistan under the repealed Companies Ordinance, 1984 (Now Companies Act, 2017) on 01 July 2011. The registered office of Nishat Hospitality (Private) Limited is situated at 1-B Aziz Avenue, Canal Bank, Gulberg-V, Lahore. The principal business place of the Company is situated at 9-A, Mian Mehmood Ali Kasuri Road, Gulberg-III, Lahore. The principal activity of the Company is to carry on the business of hotels, cafes, restaurants and lodging or apartment houses, bakers and confectioners in Pakistan and outside Pakistan.
The Company has incurred a loss after taxation of Rupees 99.479 million during the year ended 30 June 2021 while the accumulated losses stand at Rupees 450 million (2020: Rupees 350 million) as at 30 June 2021. Current liabilities exceed current assets by Rupees 34 million (2020: Rupees 10 million). These conditions may cast significant doubt about the Company's ability to continue as a going concern. The continuation of the Company as a going concern is dependent on its ability to attain satisfactory levels of profitability and liquidity in future and maintain its liabilities at serviceable levels. The management has carried out a going concern assessment of the Company and believes that the going concern assumption used for the preparation of financial statements is appropriate and no material uncertainty exists. This assessment is based on:
a. Successful execution of the business projections approved by the Board of Directors ('BOD') that includes increase in revenue through increase in room rates and average occupancy, currently the room rates have been reduced due to covid, as per the projections the Company's cash flow for the next 5 years is positive, the major impact in the statement of profit or loss is of depreciation charged to right-of-use asset and finance cost charged on lease liability. The Company is expected to be in gross profits from the next year.
b. A resolution has been passed by the Board of Directors of the Holding Company wherein the Holding Company have committed to support the Company to continue as a going concern. In the past, the Holding Company has also provided support to the Company through short term loans.
Accordingly, no material uncertainties leading to a significant doubt about going concern have been identified.
NISHAT USA, INC.
Nishat USA, Inc. is a foreign subsidiary incorporated under the Business Corporation Laws of the State of New York. The registered office of Nishat USA, Inc. is situated at 676 Broadway, New York, NY 10012, U.S.A. The principal business of the Company is to provide marketing services to Nishat Mills Limited - Holding Company. Nishat Mills Limited acquired 100% shareholding of Nishat USA, Inc. on 01 October 2008.
Business Units Address
Annual Report 2021 139
NISHAT LINEN TRADING LLC
Nishat Linen Trading LLC is a limited liability company formed in pursuance to statutory provisions of the United Arab Emirates (UAE) Federal Law No. (8) of 1984 as amended and registered with the Department of Economic Development, Government of Dubai. Nishat Linen Trading LLC is a subsidiary of Nishat Mills Limited as Nishat Mills Limited, through the powers given to it under Article 11 of the Memorandum of Association, exercise full control on the management of Nishat Linen Trading LLC. Date of incorporation of the Company was 29 December 2010. The registered office of Nishat Linen Trading LLC is situated at P.O. Box 28189 Dubai, UAE. The principal business of Nishat Linen Trading LLC is to operate retail outlets in UAE for sale of textile and related products. The registered address of Nishat Linen Trading LLC in U.A.E. is located at Shop No. SC 128, Dubai Festival City, P.O. Box 28189 Dubai, United Arab Emirates and the branches are located at:
Sr. No. Business Units 1 Dubai Outlet Mall, Al Ain Street, Dubai, United Arab Emirates. 2 Shop No. 03 (A) , AL Esbeq BLDG, Souk Al Kabeer, DUBAI, United Arab Emirates. 3 Unit No. M-101C, Oasis Center Mall, Dubai, United Arab Emirates. 4 Unit No. 1543, Arabian Centre, Dubai, United Arab Emirates. 5 FC 34, Al Ghurair Mall, Dubai, United Arab Emirates. 6 Shop No. F232-F233, 2nd Floor, Mega Mall, Sharjah, United Arab Emirates. 7 E276, Second Floor, Al Wahda Mall, Abu Dhabi, United Arab Emirates. 8 Shop No. F-17 Al Ain Mall, Al Ain, United Arab Emirates. 9 Shop No. RB154-RB155-RB156, 1st Floor, Sharq Mall, Abu Dhabi, United Arab Emirates. 10 Shop No. U-029, 1st Floor, City Centre, Al Nahda Street, Sharjah, United Arab Emirates. 11 Shop No. B-016 2nd Floor City Centre Ajman Mall, Ajman , United Arab Emirates. 12 Shop No. C072, Ground Floor, Mirdif, Dubai, United Arab Emirates. 13 Shop No. B-015, 2nd Floor, City Centre, Al Zahia, Sharjah, United Arab Emirates.
NISHAT INTERNATIONAL FZE
Nishat International FZE is incorporated as free zone establishment with limited liability in accordance with the Law No. 9 of 1992 and licensed by the Registrar of Jebel Ali Free Zone Authority. Nishat International FZE is a wholly owned subsidiary of Nishat Mills Limited. Date of incorporation of the Company was 07 February 2013. The registered office of Nishat International FZE is situated at P.O. Box 114622, Jebel Ali Free Zone, Dubai. The principal business of the Company is trading in textile and related products.
CHINA GUANGZHOU NISHAT GLOBAL CO., LTD.
China Guangzhou Nishat Global Co., Ltd. is a Company incorporated in People's Republic of China on 25 November 2013. It is a wholly owned subsidiary of Nishat International FZE which is a wholly owned subsidiary of Nishat Mills Limited. The primary function of Nishat Global China Company Limited is to competitively source products for the retail outlets operated by Group companies in Pakistan and the UAE. The registered office of Nishat Global China Company Limited is situated at N801, No. 371-375 East Huanshi Road, Yuexiu District, Guangzhou City, China.
NISHAT COMMODITIES (PRIVATE) LIMITED
Nishat Commodities (Private) Limited is a private limited Company incorporated in Pakistan on 16 July 2015 under the repealed Companies Ordinance, 1984 (Now Companies Act, 2017). It is a wholly owned subsidiary of Nishat Mills Limited. Its registered office is situated at 53-A, Lawrence Road, Lahore. The principal object of the Company is to carry on the business of trading of commodities including fuels, coals, building material in any form or shape manufactured, semi-manufactured, raw materials and their import and sale in Pakistan. Geographical location and addresses of all business units are as follows:

For the year ended June 30, 2021Notes to the Consolidated Financial Statements
Nishat Mills Limited and its Subsidiaries140
addresses of all business units are as follows:
Sr. No. Business units Address
1 Head office 5 K.M., Nishat Avenue, Off 22 K.M., Ferozepur Road, Lahore. 2 Sub-office 1st Floor, Chamber Hasrat Mohani Road, Karachi. 3 Registered office Nishat House, 53-A, Lawrence Road, Lahore.
LALPIR SOLAR POWER (PRIVATE) LIMITED
Lalpir Solar Power (Private) Limited is a private limited Company incorporated in Pakistan on 19 November 2015 under the repealed Companies Ordinance, 1984 (Now Companies Act, 2017). It is a wholly owned subsidiary of Nishat Power Limited which is a subsidiary of Nishat Mills Limited. Its registered office is situated at 53-A, Lawrence Road, Lahore. The principal activity of the Company is to build, own, operate and maintain or invest in a solar PV power project having gross capacity upto 20 MWp. The Company achieved various milestones like approval of feasibility study, No Objection Certificate (NOC) from Environmental Protection Agency (EPA), approval of Grid Interconnection Study (GIS) from Multan Electric Power Company Limited (MEPCO) and from National Transmission and Despatch Company Limited (NTDCL). Further, consent for purchasing power from the project have also been provided by MEPCO. Generation Licence No. SPGL/26/2018 has been granted by National Electric Power Regulatory Authority (NEPRA) to the Company for its 11.120 MW Solar PV Power Project located at Mauza Verar, Sipra Mehmood Kot, District Muzaffargarh, in the province of Punjab, pursuant to Section 14(B) of the Regulation of Generation, Transmission and Distribution of Electric Power Act, 1997 / Amendment Act, 2018. The upfront solar tariff announced by NEPRA expired on 30 June 2016.
The management of the Company continuously tried its best to get Power Acquisition Request and Consent to Procure Power from Central Power Purchasing Agency (Guarantee) Limited (CPPA-G) so that development of the project can be moved forward. However, CPPA-G informed the Company that Ministry of Energy has conveyed the Cabinet Committee on Energy (CCoE) decision to CPPA-G and further sent a list of 145 projects as approved by the Cabinet for necessary action. The CPPA-G stated that power project of the Company is not included in the list of 145 projects, therefore, CPPA-G is of the view that request of the Company cannot be entertained. Furthermore, during the previous year, Alternate Energy Development Board (AEDB) informed that Solar PV Power Project of the Company is placed under category Ill of the amended decision of the CCoE. All category-Ill projects are allowed by the CCoE to proceed ahead subject to becoming successful in the competitive bidding process to be undertaken by AEDB, based on the quantum ascertained for each technology by Indicative Generation Capacity Expansion Plan (IGCEP) by NTDCL.
The management understand that to-date, no such competitive bidding process has been undertaken even the IGCEP has not been finalized to-date. The response of CPPA-G and AEDB have made the Solar PV Power Project of the Company more complicated. During the year, on request of the Company, the Letter of Intent had been cancelled by AEDB. Subsequent to the reporting period, on request of the Company, NEPRA has cancelled the Generation License of the Company. Hence, voluntary winding up of the Company under the Companies Act, 2017 is being considered.
In view of the aforesaid reasons, the Company is not considered a going concern.
b) Significant restrictions
Cash and bank balances held in foreign countries are subject to local exchange control regulations. These regulations provide for restrictions on exporting capital from these countries, other than through normal dividends. The carrying amount of these assets included within the consolidated financial statements to which these restrictions apply is Rupees 597.422 million (2020: Rupees 410.121 million).
2 SUMMARY OF SIGNIFICANT ACCOUNTING POLICIES
The significant accounting policies applied in the preparation of these consolidated financial statements are set out below. These policies have been consistently applied to all years presented, unless otherwise stated:
2.1 Basis of preparation
a) Statement of compliance
These consolidated financial statements have been prepared in accordance with the accounting and reporting standards as applicable in Pakistan. The accounting and reporting standards applicable in Pakistan comprise of:
- International Financial Reporting Standards (IFRSs) issued by the International Accounting Standards Board (IASB) as notified under the Companies Act, 2017; and
- Provisions of and directives issued under the Companies Act, 2017.
Where provisions of and directives issued under the Companies Act, 2017 differ from the IFRSs, the provisions of and directives issued under the Companies Act, 2017 have been followed.
b) Accounting convention
These consolidated financial statements have been prepared under the historical cost convention except as otherwise stated in the respective accounting policies.
c) Critical accounting estimates and judgments
The preparation of these consolidated financial statements in conformity with the approved accounting standards requires the use of certain critical accounting estimates. It also requires the management to exercise its judgment in the process of applying the accounting policies. Estimates and judgments are continually evaluated and are based on historical experience and other factors, including expectations of future events that are believed to be reasonable under the circumstances. The areas where various assumptions and estimates are significant to the consolidated financial statements or where judgments were exercised in application of accounting policies are as follows:
Financial instruments – fair value
The fair value of financial instruments that are not traded in an active market is determined by using valuation techniques based on assumptions that are dependent on conditions existing at the reporting date.
Useful lives, patterns of economic benefits and impairment
Estimates with respect to residual values and useful lives and pattern of flow of economic benefits are based on the analysis of the management. Further, the Group reviews the value of assets for possible impairment on an annual basis. Any change in the estimates in the future might affect the carrying amount of respective item of property, plant and equipment and investment properties with a corresponding effect on the depreciation charge and impairment.
Inventories
Inventory write-down is made based on the current market conditions, historical experience and selling goods of similar nature. It could change significantly as a result of changes in market conditions. A review is made on each reporting date on inventories for excess inventories, obsolescence and declines in net realisable value and an allowance is recorded against the inventory balances for any such declines.
Income tax
In making the estimates for income tax currently payable by the Group, the management takes into
Annual Report 2021 141
account the current income tax law and the decisions of appellate authorities on certain issues in the past.
Allowance for expected credit losses
The allowance for Expected Credit Losses (ECLs) assessment requires a degree of estimation and judgement. It is based on the lifetime expected credit loss, grouped based on days overdue, and makes assumptions to allocate an overall expected credit loss rate for each group. These assumptions include recent sales experience and historical collection rates.
Provisions
As the actual outflows can differ from estimates made for provisions due to changes in laws, regulations, public expectations, technology, prices and conditions, and can take place many years in the future, the carrying amounts of provisions are reviewed at each reporting date and adjusted to take account of such changes. Any adjustments to the amount of previously recognised provision is recognised in the consolidated statement of profit or loss unless the provision was originally recognised as part of cost of an asset.
Contingencies
The Group reviews the status of all pending litigations and claims against the Group. Based on the judgment and the advice of the legal advisors for the estimated financial outcome, appropriate disclosure or provision is made. The actual outcome of these litigations and claims can have an effect on the carrying amounts of the liabilities recognized at the consolidated statement of financial position date.
Revenue from contracts with customers involving sale of goods
When recognizing revenue in relation to the sale of goods to customers, the key performance obligation of the Group is considered to be the point of delivery of the goods to the customer, as this is deemed to be the time that the customer obtains control of the promised goods and therefore the benefits of unimpeded access.
Impairment of investments in equity method accounted for associates
In making an estimate of recoverable amount of the Group's investments in equity method accounted for associates, the management considers future cash flows.
d) Amendments to published approved accounting standards that are effective in current year and are relevant to the Group
Following amendments to published approved accounting standards are mandatory for the Group’s accounting periods beginning on or after 01 July 2020:
• IAS 1 (Amendments) ‘Presentation of Financial Statements’ and IAS 8 (Amendments) ‘Accounting Policies, Changes in Accounting Estimates and Errors’;
• International Accounting Standards Board’s revised Conceptual Framework – March 2018; • IFRS 3 (Amendments) ‘Business Combination’; • IFRS 16 (Amendments) ‘Leases’; • Interest Rate Benchmark Reform which amended IFRS 9 ‘Financial Instruments’, IAS 39
‘Financial Instruments: Recognition and Measurement’ and IFRS 7 ‘Financial Instruments: Disclosures’.
The above-mentioned amendments did not have any impact on the amounts recognised in prior periods and are not expected to significantly affect the current or future periods.
For the year ended June 30, 2021Notes to the Consolidated Financial Statements
Nishat Mills Limited and its Subsidiaries142

e) Amendments to published approved accounting standards that are effective in current year but not relevant to the Group
There are amendments to published standards that are mandatory for accounting period beginning on or after 01 July 2020 but are considered not to be relevant or do not have any significant impact on the Group's financial statements and are therefore not detailed in these consolidated financial statements.
f) Amendments to published approved accounting standards that are not yet effective but relevant to the Group
Following amendments to existing standards have been published and are mandatory for the Group’s accounting periods beginning on or after 01 July 2021 or later periods:
Classification of liabilities as current or non-current (Amendments to IAS 1 ‘Presentation of Financial Statements’) effective for the annual period beginning on or after 01 January 2023. These amendments in the standards have been added to further clarify when a liability is classified as current. The standard also amends the aspect of classification of liability as non-current by requiring the assessment of the entity’s right at the end of the reporting period to defer the settlement of liability for at least twelve months after the reporting period. An entity shall apply those amendments retrospectively in accordance with IAS 8 ‘Accounting Policies, Changes in Accounting Estimates and Errors’.
Onerous Contracts – Cost of Fulfilling a Contract (Amendments to IAS 37 ‘Provisions, Contingent Liabilities and Contingent Assets’) effective for the annual period beginning on or after 01 January 2022 amends IAS 1 ‘Presentation of Financial Statements’ by mainly adding paragraphs which clarifies what comprise the cost of fulfilling a contract. Cost of fulfilling a contract is relevant when determining whether a contract is onerous. An entity is required to apply the amendments to contracts for which it has not yet fulfilled all its obligations at the beginning of the annual reporting period in which it first applies the amendments (the date of initial application). Restatement of comparative information is not required, instead the amendments require an entity to recognize the cumulative effect of initially applying the amendments as an adjustment to the opening balance of retained earnings or other component of equity, as appropriate, at the date of initial application.
Property, Plant and Equipment: Proceeds before Intended Use (Amendments to IAS 16 ‘Property, Plant and Equipment’) effective for the annual period beginning on or after 1 January 2022. Clarifies that sales proceeds and cost of items produced while bringing an item of property, plant and equipment to the location and condition necessary for it to be capable of operating in the manner intended by management e.g. when testing etc., are recognized in profit or loss in accordance with applicable Standards. The entity measures the cost of those items applying the measurement requirements of IAS 2 ‘Inventories’. The standard also removes the requirement of deducting the net sales proceeds from cost of testing. An entity shall apply those amendments retrospectively, but only to items of property, plant and equipment that are brought to the location and condition necessary for them to be capable of operating in the manner intended by management on or after the beginning of the earliest period presented in the financial statements in which the entity first applies the amendments. The entity shall recognize the cumulative effect of initially applying the amendments as an adjustment to the opening balance of retained earnings (or other component of equity, as appropriate) at the beginning of that earliest period presented.
The following annual improvements to IFRS standards 2018-2020 are effective for annual reporting periods beginning on or after 01 January 2022:
- IFRS 9 ‘Financial Instruments’ – The amendment clarifies that an entity includes only fees paid or received between the entity (the borrower) and the lender, including fees paid or received by either the entity or the lender on the other’s behalf, when it applies the ‘10 per cent’ test in paragraph B3.3.6 of IFRS 9 in assessing whether to derecognize a financial liability.
Annual Report 2021 143
- IFRS 16 ‘Leases’ – The amendment partially amends Illustrative Example 13 accompanying IFRS 16 ‘Leases’ by excluding the illustration of reimbursement of leasehold improvements by the lessor. The objective of the amendment is to resolve any potential confusion that might arise in lease incentives.
- IAS 41 ‘Agriculture’ – The amendment removes the requirement in paragraph 22 of IAS 41 for entities to exclude taxation cash flows when measuring the fair value of a biological asset using a present value technique.
Disclosure of Accounting Policies (Amendments to IAS 1 ‘Presentation of Financial Statements’ and IFRS Practice Statement 2 ‘Making Materiality Judgement’) effective for annual periods beginning on or after 01 January 2023. These amendments are intended to help preparers in deciding which accounting policies to disclose in their financial statements. Earlier, IAS 1 states that an entity shall disclose its ‘significant accounting policies’ in their financial statements. These amendments shall assist the entities to disclose their ‘material accounting policies’ in their financial statements.
Covid-19-Related Rent Concessions (Amendment to IFRS 16 ‘Leases’) effective for annual reporting periods beginning on or after 01 April 2021. These amendments permit a lessee to apply the practical expedient regarding COVID-19-related rent concessions. The entity shall recognize the cumulative effect of initially applying the amendments as an adjustment to the opening balance of retained earnings (or other component of equity, as appropriate) at the beginning of that earliest period presented.
Deferred Tax related to Assets and Liabilities arising from a Single Transaction (Amendments to IAS 12 ‘Income taxes’) effective for annual periods beginning on or after 01 January 2023. These amendments clarify how companies account for deferred tax on transactions such as leases and decommissioning obligations.
Change in definition of Accounting Estimate (Amendments to IAS 8 ‘Accounting Policies, Changes in Accounting Estimates and Errors) effective for annual periods beginning on or after 1 January 2023. This change replaced the definition of Accounting Estimate with a new definition, intended to help entities to distinguish between accounting policies and accounting estimates.
The International Accounting Standards Board (IASB) has published 'Reference to the Conceptual Framework (Amendments to IFRS 3)' with amendments to IFRS 3 'Business Combinations' that update an outdated reference in IFRS 3 without significantly changing its requirements. Effective for business combinations for which the acquisition date is on or after the beginning of annual period beginning on or after 01 January 2022. The amendments also add to IFRS 3 an exception to its requirement for an entity to refer to the Conceptual Framework to determine what constitutes an asset or a liability. The standard is effective for transactions in the future and therefore would not have an impact on past financial statements.
Interest Rate Benchmark Reform – Phase 2 which amended IFRS 9 ‘Financial Instruments’, IAS 39 ‘Financial Instruments: Recognition and Measurement’, IFRS 4 ‘Insurance Contracts’ and IFRS 7 ‘Financial Instruments: Disclosures’ is applicable for annual financial periods beginning on or after 01 January 2021. The changes made relate to the modification of financial assets, financial liabilities and lease liabilities, specific hedge accounting requirements, and disclosure requirements applying IFRS 7 to accompany the amendments regarding modifications and hedge accounting.
The above amendments and improvements are likely to have no significant impact on the consolidated financial statements.
g) Standards and amendments to approved published standards that are not yet effective and not considered relevant to the Group
There are other standards and amendments to published standards that are mandatory for accounting periods beginning on or after 01 July 2021 but are considered not to be relevant or do
For the year ended June 30, 2021Notes to the Consolidated Financial Statements
Nishat Mills Limited and its Subsidiaries144
not have any significant impact on the Group's financial statements and are therefore not detailed in these consolidated financial statements.
2.2 Consolidation
a) Subsidiaries
Subsidiaries are all entities over which the Group has control. The Group controls an entity when the Group is exposed to, or has rights to, variable returns from its involvement with the entity and has the ability to affect those returns through its power to direct the activities of the entity. Subsidiaries are fully consolidated from the date on which control is transferred to the Group. They are deconsolidated from the date that control ceases.
The assets and liabilities of Subsidiary Companies have been consolidated on a line by line basis and carrying value of investments held by the Holding Company is eliminated against Holding Company's share in paid up capital of the Subsidiary Companies.
Intragroup balances and transactions have been eliminated.
Non-controlling interests are that part of net results of the operations and of net assets of Subsidiary Companies attributable to interest which are not owned by the Holding Company. Non-controlling interests are presented as separate item in the consolidated financial statements.
b) Associates
Associates are all entities over which the Group has significant influence but not control or joint control. Investments in associates are accounted for using the equity method of accounting, after initially being recognised at cost.
Under the equity method of accounting, the investments are initially recognised at cost and adjusted thereafter to recognise the Group’s share of the post-acquisition profits or losses of the investee in profit or loss, and the Group’s share of movements in other comprehensive income of the investee in other comprehensive income. Dividends received or receivable from associates are recognised as a reduction in the carrying amount of the investment.
When the Group’s share of losses in an equity-accounted investment equals or exceeds its interest in the entity, including any other unsecured long-term receivables, the Group does not recognise further losses, unless it has incurred obligations or made payments on behalf of the other entity.
Unrealised gains on transactions between the Group and its associates are eliminated to the extent of the Group’s interest in these entities. Unrealised losses are also eliminated unless the transaction provides evidence of an impairment of the asset transferred. Accounting policies of equity accounted investees have been changed where necessary to ensure consistency with the policies adopted by the Group.
Investments in equity method accounted for associates are tested for impairment in accordance with the provision of IAS 36 `Impairment of Assets`.
c) Translation of the financial statements of foreign subsidiaries
The financial statements of foreign subsidiaries of which the functional currency is different from that used in preparing the Group's financial statements are translated in functional currency of the Group. Statement of financial position items are translated at the exchange rate at the reporting date and statement of profit or loss items are converted at the average rate for the period. Any resulting translation differences are recognized under exchange translation reserve in consolidated reserves.
Annual Report 2021 145
2.3 Employee benefit
The Group operates approved funded provident fund scheme covering all permanent employees. Equal monthly contributions are made both by the employer and employees to the fund. The employer's contributions to the fund are charged to consolidated statement of profit or loss.
2.4 Taxation
Current Provision for current tax is based on the taxable income for the year determined in accordance with the
prevailing law for taxation of income. The charge for current tax is calculated using prevailing tax rates or tax rates expected to apply to the profit for the year if enacted. The charge for current tax also includes adjustments, where considered necessary, to provision for tax made in previous years arising from assessments framed during the year for such years.
The profits and gains of Nishat Power Limited - Subsidiary Company derived from electric power generation are exempt from tax in terms of Clause (132) of Part I of the Second Schedule to the Income Tax Ordinance, 2001, subject to the conditions and limitations provided therein. Under Clause 11(v) of Part IV of the Second Schedule to the Income Tax Ordinance, 2001, the Subsidiary Company is also exempt from levy of minimum tax on 'turnover' under section 113 of the Income Tax Ordinance, 2001. However, full provision is made in the consolidated statement of profit or loss on income from sources not covered under the above clauses at current rates of taxation after taking into account, tax credits and rebates available, if any.
Provision for income tax on the income of foreign subsidiaries - Nishat USA, Inc. and China Guangzhou Nishat Global Co., Ltd. is computed in accordance with the tax legislation in force in the country where the income is taxable.
Deferred Deferred tax is accounted for using the liability method in respect of all temporary differences arising from
differences between the carrying amount of assets and liabilities in the consolidated financial statements and the corresponding tax bases used in the computation of the taxable profit. Deferred tax liabilities are generally recognized for all taxable temporary differences and deferred tax assets to the extent that it is probable that taxable profits will be available against which the deductible temporary differences, unused tax losses and tax credits can be utilized.
Deferred tax is calculated at the rates that are expected to apply to the period when the differences reverse based on tax rates that have been enacted or substantively enacted by the reporting date. Deferred tax is charged or credited in the consolidated statement of profit or loss, except to the extent that it relates to items recognized in other comprehensive income or directly in equity. In this case the tax is also recognized in other comprehensive income or directly in equity, respectively.
Nishat Power Limited - Subsidiary Company has not made provision for deferred tax as the Subsidiary Company's management believes that the temporary differences will not reverse in the foreseeable future due to the fact that the profits and gains of the Company derived from electric power generation are exempt from tax subject to the conditions and limitations provided for in terms of Clause 132 of Part I of the Second Schedule to the Income Tax Ordinance, 2001.
2.5 Goodwill
Goodwill is measured as the excess of the sum of the consideration transferred, the amount of any non controlling interests in the acquiree, and the fair value of the acquirer’s previously held equity interest in the acquiree (if any) over the net of the acquisition date amounts of the identifiable assets acquired and the liabilities assumed. If, after reassessment, the net of the acquisition date amounts of the identifiable
For the year ended June 30, 2021Notes to the Consolidated Financial Statements
Nishat Mills Limited and its Subsidiaries146

assets acquired and liabilities assumed exceeds the sum of the consideration transferred, the amount of any non controlling interests in the acquiree and the fair value of the acquirer’s previously held interest in the acquiree (if any), the excess is recognised immediately in profit or loss as a bargain purchase gain. Goodwill is not amortised but is reviewed for impairment at least annually.
2.6 Foreign currencies
These consolidated financial statements are presented in Pak Rupees, which is the Group’s functional currency. All monetary assets and liabilities denominated in foreign currencies are translated into Pak Rupees at the rates of exchange prevailing at the reporting date, while the transactions in foreign currencies (except the results of foreign operation which are translated to Pak Rupees at the average rate of exchange for the year) during the year are initially recorded in functional currency at the rates of exchange prevailing at the transaction date. All non-monetary items are translated into Pak Rupees at exchange rates prevailing on the date of transaction or on the date when fair values are determined. Exchange gains and losses are recorded in the consolidated statement of profit or loss.
2.7 Property, plant, equipment and depreciation
Operating fixed assets
Operating fixed assets except freehold land are stated at cost less accumulated depreciation and accumulated impairment losses (if any). Cost of operating fixed assets consists of historical cost, borrowing cost pertaining to erection / construction period of qualifying assets and other directly attributable costs of bringing the asset to working condition. Freehold land is stated at cost less any recognized impairment loss.
Subsequent costs are included in the asset’s carrying amount or recognized as a separate asset, as appropriate, only when it is probable that future economic benefits associated with the item will flow to the Group and the cost of the item can be measured reliably. All other repair and maintenance costs are charged to consolidated statement of profit or loss during the period in which they are incurred. Major spare parts and stand-by equipment qualify as property, plant and equipment when an entity expects to use them for more than one year.
Depreciation
Depreciation on operating fixed assets is charged to consolidated statement of profit or loss applying the reducing balance method, except in case of Nishat Power Limited and Nishat Linen Trading LLC (Subsidiary Companies), where this accounting estimate is based on straight line method, so as to write off the cost / depreciable amount of the assets over their estimated useful lives at the rates given in Note 15.1. The depreciation is charged on additions from the date when the asset is available for use and on deletions upto the date when the asset is de-recognized. The residual values and useful lives are reviewed by the management, at each financial year end and adjusted if impact on depreciation is significant.
During the year ended 30 June 2021, the existing term of the PPA was extended by a period of 68 days as an 'Other Force Majeure Event', as referred to in Note 1(a) to these consolidated financial statements, thereby resulting in an increase in useful lives of buildings and roads on freehold land and plant and machinery of Nishat Power Limited - Subsidiary Company for the same number of days. Such a change in useful lives has been accounted for as a change in an accounting estimate in accordance with IAS 8 'Accounting Policies, Changes in Accounting Estimates and Errors'. The effect of this change in the accounting estimate on the profit before taxation for the year ended 30 June 2021, carrying amount of operating fixed assets as at the reporting date and future profits before taxation is not material, hence, has not been detailed in these consolidated financial statements.
De-recognition
An item of operating fixed assets is de-recognized upon disposal or when no future economic benefits
Annual Report 2021 147
are expected from its use or disposal. Any gain or loss arising on de-recognition of the asset is included in the consolidated statement of profit or loss in the year the asset is de-recognized.
Capital work-in-progress
Capital work-in-progress is stated at cost less identified impairment losses, if any. All expenditure connected with specific assets incurred during installation and construction period are carried under capital work-in-progress. These are transferred to operating fixed assets as and when these are available for use.
2.8 Investment properties
Land and buildings held for capital appreciation or to earn rental income are classified as investment properties. Investment properties except land, are stated at cost less accumulated depreciation and any recognized impairment loss. Land is stated at cost less any recognized impairment loss (if any). Depreciation is charged to consolidated statement of profit or loss applying the reducing balance method so as to write off the cost of buildings over its estimated useful lives at a rate of 10% per annum.
2.9 Intangible assets
Amortization on additions to intangible assets is charged from the date when the asset is acquired or capitalized upto the date when the asset is de-recognized.
2.10 Right-of-use assets
A right-of-use asset is recognized at the commencement date of a lease. The right-of-use asset is measured at cost, which comprises the initial amount of the lease liability, adjusted for, as applicable, any lease payments made at or before the commencement date net of any lease incentives received, any initial direct costs incurred, and, except where included in the cost of inventories, an estimate of costs expected to be incurred for dismantling and removing the underlying asset, and restoring the site or asset.
Right-of-use assets are depreciated on a straight line basis over the unexpired period of the lease or the estimated useful life of the asset, whichever is shorter. Where the Group expects to obtain ownership of the leased asset at the end of the lease term, the depreciation is charged over its estimated useful life. Right-of use assets are subject to impairment or adjusted for any re-measurement of lease liabilities.
The Group has elected not to recognize a right-of-use asset and corresponding lease liability for short-term leases with terms of 12 months or less and leases of low-value assets. Lease payments on these assets are charged to income as incurred.
2.11 Lease liabilities
A lease liability is recognized at the commencement date of a lease. The lease liability is initially recognized at the present value of the lease payments to be made over the term of the lease, discounted using the interest rate implicit in the lease or, if that rate cannot be readily determined, the Group's incremental borrowing rate. Lease payments comprise of fixed payments less any lease incentives receivable, variable lease payments that depend on an index or a rate, amounts expected to be paid under residual value guarantees, exercise price of a purchase option when the exercise of the option is reasonably certain to occur, and any anticipated termination penalties. The variable lease payments that do not depend on an index or a rate are expensed in the period in which they are incurred.
Lease liabilities are measured at amortised cost using the effective interest method. The carrying
amounts are re-measured if there is a change in the following: future lease payments arising from a change in an index or a rate used; residual guarantee; lease term; certainty of a purchase option and termination penalties. When a lease liability is re-measured, an adjustment is made to the corresponding right-of-use asset, or to consolidated statement of profit or loss if the carrying amount of the right-of-use asset is fully written down.
For the year ended June 30, 2021Notes to the Consolidated Financial Statements
Nishat Mills Limited and its Subsidiaries148

Nishat Power Limited - Subsidiary Company has a Power Purchase Agreement (PPA) with its sole customer, CPPA-G for twenty five years and sixty eight days which commenced from 09 June 2010. SECP through SRO 986(I)/2019 dated 02 September 2019, has granted exemption from the requirements of IFRS 16 to all companies to the extent of their power purchase agreements executed before 01 January 2019. Therefore, IFRS 16 will not have any impact on the consolidated financial statements to the extent of power purchase agreement of Nishat Power Limited - Subsidiary Company.
Under IFRS 16, the consideration required to be made by the lessee for the right to use the asset is to be accounted for as a finance lease. Nishat Power Limited - Subsidiary Company’s power plant’s control due to purchase of total output by CPPA-G appears to fall under the scope of finance lease under IFRS 16. Consequently, if Nishat Power Limited - Subsidiary Company was to follow IFRS 16 with respect to its power purchase agreement, the effect on these consolidated financial statements would be as follows:
2021 2020
(Rupees in thousand)
De-recognition of property, plant and equipment (8,467,959) (9,125,477)
De-recognition of trade debts (7,134,685) (6,065,265)
Recognition of lease debtor 10,748,829 9,738,063
Decrease in un-appropriated profit at the beginning of the year (5,452,679) (3,589,601) Increase / (decrease) in profit for the year 598,864 (1,863,078) Decrease in un-appropriated profit at the end of the year (4,853,815) (5,452,679)
2.12 Investments and other financial assets a) Classification
The Group classifies its financial assets in the following measurement categories:
• those to be measured subsequently at fair value (either through other comprehensive income, or through profit or loss), and
• those to be measured at amortized cost
The classification depends on the Group's business model for managing the financial assets and the contractual terms of the cash flows.
For assets measured at fair value, gains and losses will either be recorded in profit or loss or other comprehensive income. For investments in debt instruments, this will depend on the business model in which the investment is held. For investments in equity instruments, this will depend on whether the Group has made an irrevocable election at the time of initial recognition to account for the equity investment at fair value through other comprehensive income. The Group reclassifies debt investments when and only when its business model for managing those assets changes.
b) Measurement
At initial recognition, the Group measures a financial asset at its fair value plus, in the case of a financial asset not at fair value through profit or loss, transaction costs that are directly attributable to the acquisition of the financial asset. Transaction costs of financial assets carried at fair value through profit or loss are expensed in profit or loss.
Annual Report 2021 149
Financial assets with embedded derivatives are considered in their entirety when determining whether their cash flows are solely payment of principal and interest.
Debt instruments
Subsequent measurement of debt instruments depends on the Group's business model for managing the asset and the cash flow characteristics of the asset. There are three measurement categories into which the Group classifies its debt instruments:
Amortized cost
Financial assets that are held for collection of contractual cash flows where those cash flows represent solely payments of principal and interest are measured at amortised cost. Interest income from these financial assets is included in other income using the effective interest rate method. Any gain or loss arising on derecognition is recognised directly in profit or loss and presented in other income / (other expenses) together with foreign exchange gains and losses. Impairment losses are presented as separate line item in the consolidated statement of profit or loss.
Fair value through other comprehensive income (FVTOCI)
Financial assets that are held for collection of contractual cash flows and for selling the financial assets, where the assets’ cash flows represent solely payments of principal and interest, are measured at FVTOCI. Movements in the carrying amount are taken through other comprehensive income, except for the recognition of impairment losses (and reversal of impairment losses), interest income and foreign exchange gains and losses which are recognised in profit or loss. When the financial asset is derecognised, the cumulative gain or loss previously recognised in other comprehensive income is reclassified from equity to profit or loss and recognised in other income / (other expenses). Interest income from these financial assets is included in other income using the effective interest rate method. Foreign exchange gains and losses are presented in other income / (other expenses) and impairment losses are presented as separate line item in the consolidated statement of profit or loss.
Fair value through profit or loss (FVTPL)
Assets that do not meet the criteria for amortised cost or FVTOCI are measured at FVTPL. A gain or loss on a debt instrument that is subsequently measured at FVTPL is recognised in profit or loss and presented net within other income / (other expenses) in the period in which it arises.
Equity instruments
The Group subsequently measures all equity investments at fair value for financial instruments quoted in an active market, the fair value corresponds to a market price (level 1). For financial instruments that are not quoted in an active market, the fair value is determined using valuation techniques including reference to recent arm’s length market transactions or transactions involving financial instruments whichare substantially the same (level 2), or discounted cash flow analysis including, to the greatest possible extent, assumptions consistent with observable market data (level 3).
Fair value through other comprehensive income (FVTOCI)
Where the Group's management has elected to present fair value gains and losses on equity investments in other comprehensive income, there is no subsequent reclassification of fair value gains and losses to profit or loss. Impairment losses (and reversal of impairment losses) on equity investments measured at FVTOCI are not reported separately from other changes in fair value.
Fair value through profit or loss
Changes in the fair value of equity investments at fair value through profit or loss are recognised in
For the year ended June 30, 2021Notes to the Consolidated Financial Statements
Nishat Mills Limited and its Subsidiaries150

other income / (other expenses) in the consolidated statement of profit or loss as applicable.
Dividends from such investments continue to be recognised in profit or loss as other income when the Group's right to receive payments is established.
2.13 Financial liabilities – classification and measurement
Financial liabilities are classified as measured at amortized cost or FVTPL. A financial liability is classified as at FVTPL if it is classified as held-for-trading, it is a derivative or it is designated as such on initial recognition. Financial liabilities at FVTPL are measured at fair value and net gains and losses, including any interest expense, are recognized in profit or loss. Other financial liabilities are subsequently measured at amortized cost using the effective interest method. Interest expense and foreign exchange gains and losses are recognized in consolidated statement of profit or loss. Any gain or loss on de-recognition is also included in profit or loss.
2.14 Impairment of financial assets
a. Financial assets other than those due from Government of Pakistan The Group recognizes loss allowances for ECLs on:
- Financial assets measured at amortized cost; - Debt investments measured at FVTOCI; and - Contract assets.
The Group measures loss allowances at an amount equal to lifetime ECLs, except for the following, which are measured at 12-month ECLs:
- Debt securities that are determined to have low credit risk at the reporting date; and
- Other debt securities and bank balances for which credit risk (i.e. the risk of default occurring over the expected life of the financial instrument) has not increased significantly since initial recognition.
12-month ECLs are the portion of ECLs that result from default events that are possible within the 12
months after the reporting date (or a shorter period if the expected life of the instrument is less than 12 months).
When determining whether the credit risk of a financial asset has increased significantly since initial recognition and when estimating ECLs, the Group considers reasonable and supportable information that is relevant and available without undue cost or effort. This includes both quantitative and qualitative information and analysis, based on the Group’s historical experience and informed credit assessment and including forward-looking information.
The Group assumes that the credit risk on a financial asset has increased significantly if it is more than past due for a reasonable period of time. Lifetime ECLs are the ECLs that result from all possible default events over the expected life of a financial instrument. 12-month ECLs are the portion of ECLs that result from default events that are possible within the 12 months after the reporting date (or a shorter period if the expected life of the instrument is less than 12 months). The maximum period considered when estimating ECLs is the maximum contractual period over which the Group is exposed to credit risk.
The Group has elected to measure loss allowances for trade debts using IFRS 9 simplified approach and has calculated ECLs based on lifetime ECLs. The Group has established a matrix that is based on the Group 's historical credit loss experience, adjusted for forward-looking factors specific to the debtors and the economic environment. When determining whether the credit risk of a financial asset has increased significantly since initial recognition and when estimating ECLs, the Group considers reasonable and supportable information that is relevant and available without undue cost or effort. This includes both
Annual Report 2021 151
quantitative and qualitative information and analysis, based on the Group's historical experience and informed credit assessment including forward-looking information.
Loss allowances for financial assets measured at amortized cost are deducted from the gross carrying amount of the assets.
The gross carrying amount of a financial asset is written off when the Group has no reasonable expectations of recovering of a financial asset in its entirety or a portion thereof. The Group individually makes an assessment with respect to the timing and amount of write-off based on whether there is a reasonable expectation of recovery. The Group expects no significant recovery from the amount written off. However, financial assets that are written off could still be subject to enforcement activities in order to comply with the Group's procedures for recovery of amounts due.
At each reporting date, the Group assesses whether financial assets carried at amortised cost and debt securities at FVTOCI are credit-impaired. A financial asset is ‘credit-impaired’ when one or more events that have a detrimental impact on the estimated future cash flows of the financial asset have occurred.
Evidence that a financial asset is credit-impaired includes the following observable data:
- significant financial difficulty of the debtor; - a breach of contract such as a default; - the restructuring of a loan or advance by the Group on terms that the Group would not consider
otherwise; - it is probable that the debtor will enter bankruptcy or other financial reorganization; or - the disappearance of an active market for a security because of financial difficulties.
b. Financial assets other than those due from Government of Pakistan
In respect of financial assets due from the Government of Pakistan, SECP through SRO 985(I)/2019 dated 02 September 2019 notified that the requirements contained in IFRS 9 with respect to application of Expected Credit Losses (ECLs) method shall not be applicable till 30 June 2021 and that such companies shall follow relevant requirements of International Accounting Standard ('IAS') 39 in respect of above referred financial assets during the exemption period. Accordingly, the Group has not followed the requirements of IFRS 9 with respect to application of Expected Credit Losses in respect of trade debts and other receivables due from CPPA-G.
2.15 De-recognition of financial assets and financial liabilities
a) Financial assets
The Group derecognizes a financial asset when the contractual rights to the cash flows from the asset expire, or it transfers the rights to receive the contractual cash flows in a transaction in which substantially all of the risks and rewards of ownership of the financial asset are transferred, or it neither transfers nor retains substantially all of the risks and rewards of ownership and does not retain control over the transferred asset. Any interest in such derecognized financial assets that is created or retained by the Group is recognized as a separate asset or liability.
b) Financial liabilities
The Group derecognizes a financial liability (or a part of financial liability) from its consolidated statement of financial position when the obligation specified in the contract is discharged or cancelled or expires.
2.16 Offsetting of financial instruments
Financial assets and financial liabilities are set off and the net amount is reported in the consolidated financial statements when there is a legal enforceable right to set off and the Group intends either to settle
For the year ended June 30, 2021Notes to the Consolidated Financial Statements
Nishat Mills Limited and its Subsidiaries152
Annual Report 2021 153
on a net basis or to realize the assets and to settle the liabilities simultaneously.
2.17 Inventories
Inventories, except for stock in transit and waste stock / rags are stated at lower of cost and net realizable value. Cost is determined as follows:
Stores, spare parts and loose tools
Useable stores, spare parts and loose tools are valued principally at moving average cost, while items considered obsolete are carried at nil value. Items in transit are valued at cost comprising invoice value plus other charges paid thereon.
Stock-in-trade
Cost of raw material, work-in-process and finished goods is determined as follows:
(i) For raw materials: Annual average basis. (ii) For work-in-process and finished goods: Average manufacturing cost including a portion of production overheads.
Materials in transit are valued at cost comprising invoice value plus other charges paid thereon. Waste stock / rags are valued at net realizable value.
Net realizable value signifies the estimated selling price in the ordinary course of business less the estimated costs of completion and the estimated costs necessary to make a sale.
2.18 Trade debts and other receivables
Trade debts are initially recognised at fair value and subsequently measured at amortised cost using the effective interest method, less any allowance for expected credit losses.
Other receivables are recognised at amortised cost, less any allowance for expected credit losses.
However, in respect of companies holding financial assets due from the Government of Pakistan, SECP through SRO 985(I)/2019 dated 02 September 2019 has notified that the requirements contained in IFRS 9 with respect to application of expected credit losses method shall not be applicable till 30 June 2021 and that such companies shall follow relevant requirements of IAS 39 in respect of above referred financial assets during the exemption period.
2.19 Non–current assets (or disposal groups) held for sale
Non-current assets (or disposal groups) are classified as assets held for sale when their carrying amount is to be recovered principally through a sale transaction and a sale is considered highly probable. They are stated at the lower of carrying amount and fair value less costs to sell.
2.20 Borrowings
Financing and borrowings are recognized initially at fair value and are subsequently stated at amortized cost. Any difference between the proceeds and the redemption value is recognized in the consolidated statement of profit or loss over the period of the borrowings using the effective interest method.
2.21 Borrowing cost
Interest, mark-up and other charges on finances are capitalized up to the date of commissioning of respective qualifying assets acquired out of the proceeds of such finances. All other interest, mark-up and other charges are recognized in consolidated statement of profit or loss.

For the year ended June 30, 2021Notes to the Consolidated Financial Statements
Nishat Mills Limited and its Subsidiaries154
2.22 Share capital
Ordinary shares are classified as share capital. Incremental costs directly attributable to the issue of new shares are shown in equity as a deduction, net of tax.
2.23 Trade and other payables
Liabilities for trade and other amounts payable are initially recognized at fair value, which is normally the transaction cost.
2.24 Revenue recognition
Sale of goods
Revenue from the sale of goods is recognised at the point in time when the customer obtains control of the goods, which is generally at the time of delivery.
Processing services
The Group provides processing services to local customers. These services are sold separately and the Company’s contract with the customer for services constitute a single performance obligation.
Revenue from services is recognized at the point in time, generally at the time of dispatch. There are no terms giving rise to variable consideration under the Group’s contracts with its customers.
Interest
Interest income is recognised as interest accrues using the effective interest method. This is a method of calculating the amortised cost of a financial asset and allocating the interest income over the relevant period using the effective interest rate, which is the rate that exactly discounts estimated future cash receipts through the expected life of the financial asset to the net carrying amount of the financial asset.
Rent
Rent revenue from investment properties is recognised on a straight-line basis over the lease term. Lease incentives granted are recognised as part of the rental revenue. Contingent rentals are recognised as income in the period when earned.
Sale of electricity
Revenue from the sale of electricity to CPPA-G, the sole customer of Nishat Power Limited – Subsidiary Group, is recorded on the following basis:
Capacity purchase price revenue is recognized over time, based on the capacity made available to CPPA-G, at rates as specified under the PPA with CPPA-G, as amended from time to time; and Energy purchase price revenue is recognized at a ‘point in time’, as and when the Net Electrical Output (NEO) are delivered to NTDC.
Capacity and Energy revenue is recognized based on the rates determined under the mechanism laid down in the PPA.
Delayed payment mark-up on amounts due under the PPA is accrued on time proportion basis by reference to the amount outstanding and the applicable rate of return under the PPA.
Invoices are generally raised on a monthly basis and are due after 30 days from acknowledgment by CPPA-G.
Annual Report 2021 155
Dividend
Dividend on equity investments is recognized when right to receive the dividend is established.
Hotel business
Revenue from hotel ownership comprises amounts earned in respect of rental of rooms, food and beverage sales, and other ancillary services and goods supplied by the Group. For each of the revenue streams, the Group recognizes revenue over time or at a point in time specifically after the performance obligation of transfer of goods or services to the customer has been fulfilled. Revenue is recognized over the period when rooms are occupied or services are performed. Revenue from sale of food and beverages and goods is recognized at the point of sale when the food and beverages and goods are delivered to customers. Payment is due immediately when the hotel guests occupies the room and receives the services and goods.
Other revenue
Other revenue is recognised when it is received or when the right to receive payment is established.
2.25 Contract assets
Contract assets arise when the Group performs its performance obligations by transferring goods to a customer before the customer pays its consideration or before payment is due. Contract assets are treated as financial assets for impairment purposes.
2.26 Customer acquisition costs
Customer acquisition costs are capitalised as an asset where such costs are incremental to obtaining a contract with a customer and are expected to be recovered. Customer acquisition costs are amortised on a straight-line basis over the term of the contract.
Costs to obtain a contract that would have been incurred regardless of whether the contract was obtained or which are not otherwise recoverable from a customer are expensed as incurred to profit or loss. Incremental costs of obtaining a contract where the contract term is less than one year is immediately expensed to profit or loss.
2.27 Customer fulfilment costs
Customer fulfilment costs are capitalised as an asset when all the following are met: (i) the costs relate directly to the contract or specifically identifiable proposed contract; (ii) the costs generate or enhance resources of the Group that will be used to satisfy future performance obligations; and (iii) the costs are expected to be recovered. Customer fulfilment costs are amortised on a straight-line basis over the term of the contract.
2.28 Right of return assets
Right of return assets represents the right to recover inventory sold to customers and is based on an estimate of customers who may exercise their right to return the goods and claim a refund. Such rights are measured at the value at which the inventory was previously carried prior to sale, less expected recovery costs and any impairment.
2.29 Contract liabilities
Contract liability is the obligation of the Group to transfer goods to a customer for which the Group has received consideration from the customer. If a customer pays consideration before the Group transfers goods, a contract liability is recognized when the payment is made. Contract liabilities are recognized as revenue when the Group performs its performance obligations under the contract.

For the year ended June 30, 2021Notes to the Consolidated Financial Statements
Nishat Mills Limited and its Subsidiaries156
2.30 Refund liabilities
Refund liabilities are recognised where the Group receives consideration from a customer and expects to refund some, or all, of that consideration to the customer. A refund liability is measured at the amount of consideration received or receivable for which the Group does not expect to be entitled and is updated at the end of each reporting period for changes in circumstances. Historical data is used across product lines to estimate such returns at the time of sale based on an expected value methodology.
2.31 Provisions
Provisions are recognized when the Group has a legal or constructive obligation as a result of past events and it is probable that an outflow of resources embodying economic benefits will be required to settle the obligations and a reliable estimate of the amount can be made.
2.32 Earnings per share
Earnings per share (EPS) is calculated by dividing the profit or loss attributable to ordinary shareholders of the Holding Company by the weighted average number of ordinary shares outstanding during the year.
2.33 Contingent assets
Contingent assets are disclosed when the Group has a possible asset that arises from past events and whose existence will only be confirmed by the occurrence or non-occurrence of one or more uncertain future events not wholly within the control of the Group. Contingent assets are not recognized until their realization becomes certain.
2.34 Contingent liabilities
Contingent liability is disclosed when the Group has a possible obligation as a result of past events whose existence will only be confirmed by the occurrence or non-occurrence of one or more uncertain future events not wholly within the control of the Group. Contingent liabilities are not recognized, only disclosed, unless the possibility of a future outflow of resources is considered remote. In the event that the outflow of resources associated with a contingent liability is assessed as probable, and if the size of the outflow can be reliably estimated, a provision is recognized in the consolidated financial statements.
2.35 Impairment of non-financial assets
Assets that have an indefinite useful life are not subject to depreciation and are tested annually for impairment. Assets that are subject to depreciation are reviewed for impairment at each consolidated statement of financial position date or whenever events or changes in circumstances indicate that the carrying amount may not be recoverable. An impairment loss is recognized for the amount for which assets carrying amount exceeds its recoverable amount. Recoverable amount is the higher of an asset’s fair value less costs to sell and value in use. For the purposes of assessing impairment, assets are grouped at the lowest levels for which there are separately identifiable cash flows (cash-generating units). Non-financial assets that suffered an impairment are reviewed for possible reversal of the impairment at each reporting date. Reversals of the impairment losses are restricted to the extent that the asset’s carrying amount does not exceed the carrying amount that would have been determined, net of depreciation or amortization, if impairment losses had not been recognized. An impairment loss or reversal of impairment loss is recognized in the consolidated statement of profit or loss.
2.36 Derivative financial instruments
Derivative that do not qualify for hedge accounting are recognized in the consolidated statement of financial position at estimated fair value with corresponding effect to consolidated statement of profit or loss. Derivative financial instruments are carried as assets when fair value is positive and liabilities when fair value is negative.

Annual Report 2021 157
2.37 Cash and cash equivalents
Cash and cash equivalents comprise cash in hand, cash at banks on current, saving and deposit accounts and other short term highly liquid instruments that are readily convertible into known amounts of cash and which are subject to insignificant risk of changes in values.
2.38 Ijara contracts
Under the Ijarah contracts the Group obtains usufruct of an asset for an agreed period for an agreed consideration. The Group accounts for its Ijarah contracts in accordance with the requirements of IFAS 2 ‘Ijarah’. Accordingly, the Group as a Mustaj’ir (lessee) in the Ijarah contract recognises the Ujrah (lease) payments as an expense in the profit and loss on straight line basis over the Ijarah term.
2.39 Segment reporting
Segment reporting is based on the operating (business) segments of the Group. An operating segment is a component of the Group that engages in business activities from which it may earn revenues and incur expenses, including revenues and expenses that relate to the transactions with any of the Group's other components. An operating segment's operating results are reviewed regularly by the Group's chief operating decision makers to make decisions about resources to be allocated to the segment and assess its performance, and for which discrete financial information is available.
Segment results that are reported to the chief operating decision makers include items directly attributable to a segment as well as those that can be allocated on a reasonable basis. Those incomes, expenses, assets, liabilities and other balances which can not be allocated to a particular segment on a reasonable basis are reported as unallocated.
The Group has following reportable business segments: Spinning at Faisalabad (I and II), Feroze Wattwan (I and II) and Lahore (Producing different quality of yarn including dyed yarn and sewing thread using natural and artificial fibres), Weaving at Bhikki and Lahore (Producing different quality of greige fabric using yarn), Dyeing (Producing dyed fabric using different qualities of greige fabric), Home Textile (Manufacturing of home textile articles using processed fabric produced from greige fabric), Terry (Manufacturing of terry and bath products), Garments (Manufacturing of garments using processed fabric), Power Generation (Generation, transmission and distribution of power using gas, oil, steam, coal and biomass) and Hotel (Business of hotel and allied services).
Transaction among the business segments are recorded at cost. Inter segment sales and purchases are eliminated from the total.
2.40 Government grants
Grants from the government are recognised at their fair value where there is a reasonable assurance that the grant will be received and the Group will comply with all attached conditions.
Government grants relating to costs are deferred and recognised in the profit or loss over the period necessary to match them with the costs that they are intended to compensate.
Government grants relating to the purchase of property, plant and equipment are included in non-current liabilities as deferred income and are credited to profit or loss over the expected lives of the related assets.
2.41 Dividend and other appropriations
Dividend distribution to the shareholders is recognized as a liability in the consolidated financial statements in the periods in which the dividends are declared and other appropriations are recognized in the period in which these are approved by the Board of Directors.
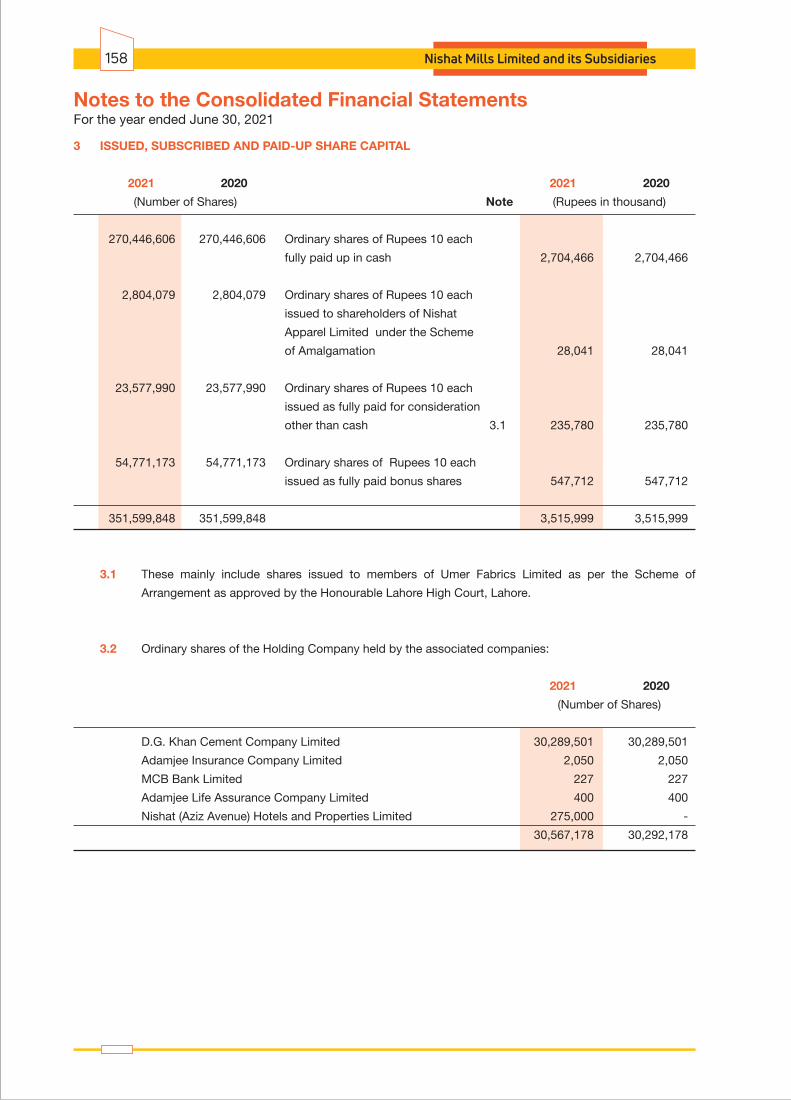
For the year ended June 30, 2021Notes to the Consolidated Financial Statements
Nishat Mills Limited and its Subsidiaries158
3 ISSUED, SUBSCRIBED AND PAID-UP SHARE CAPITAL
2021 2020 2021 2020
(Number of Shares) Note (Rupees in thousand)
270,446,606 270,446,606 Ordinary shares of Rupees 10 each
fully paid up in cash 2,704,466 2,704,466
2,804,079 2,804,079 Ordinary shares of Rupees 10 each
issued to shareholders of Nishat
Apparel Limited under the Scheme
of Amalgamation 28,041 28,041
23,577,990 23,577,990 Ordinary shares of Rupees 10 each
issued as fully paid for consideration
other than cash 3.1 235,780 235,780
54,771,173 54,771,173 Ordinary shares of Rupees 10 each
issued as fully paid bonus shares 547,712 547,712
351,599,848 351,599,848 3,515,999 3,515,999
3.1 These mainly include shares issued to members of Umer Fabrics Limited as per the Scheme of
Arrangement as approved by the Honourable Lahore High Court, Lahore.
3.2 Ordinary shares of the Holding Company held by the associated companies:
2021 2020
(Number of Shares)
D.G. Khan Cement Company Limited 30,289,501 30,289,501
Adamjee Insurance Company Limited 2,050 2,050
MCB Bank Limited 227 227
Adamjee Life Assurance Company Limited 400 400
Nishat (Aziz Avenue) Hotels and Properties Limited 275,000 -
30,567,178 30,292,178
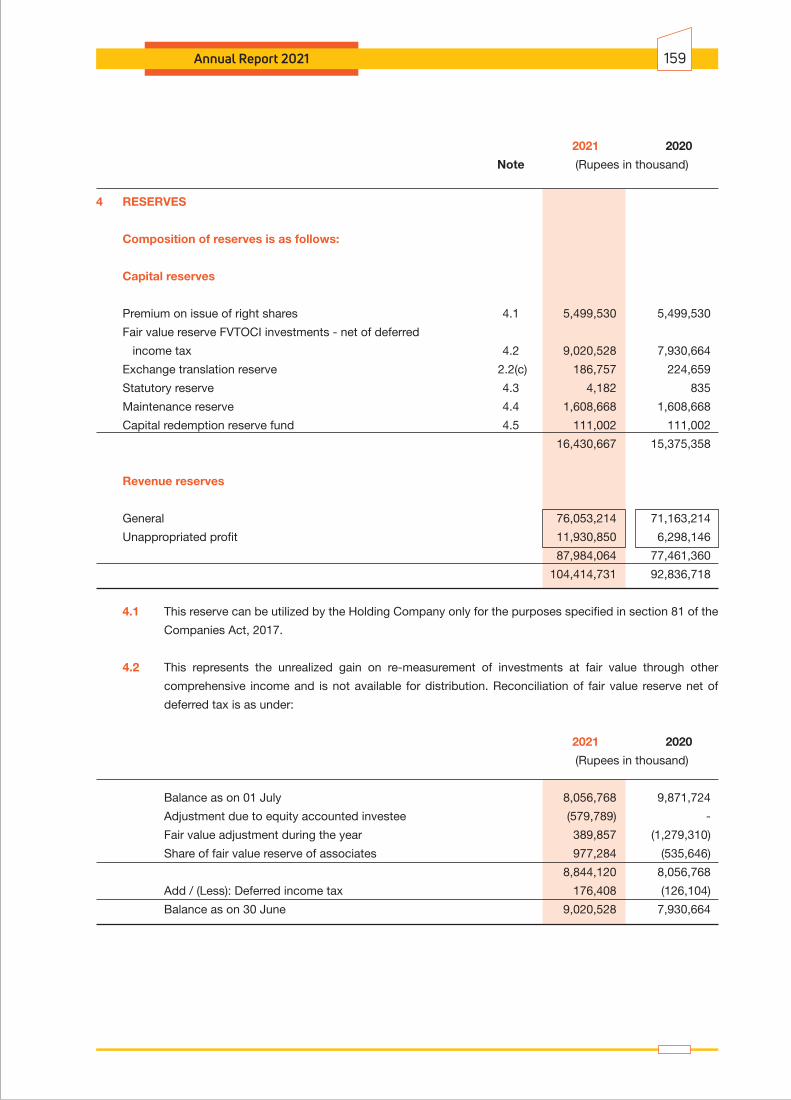
Annual Report 2021 159
2021 2020
Note (Rupees in thousand)
4 RESERVES
Composition of reserves is as follows:
Capital reserves
Premium on issue of right shares 4.1 5,499,530 5,499,530
Fair value reserve FVTOCI investments - net of deferred
income tax 4.2 9,020,528 7,930,664
Exchange translation reserve 2.2(c) 186,757 224,659
Statutory reserve 4.3 4,182 835
Maintenance reserve 4.4 1,608,668 1,608,668
Capital redemption reserve fund 4.5 111,002 111,002
16,430,667 15,375,358
Revenue reserves
General 76,053,214 71,163,214
Unappropriated profit 11,930,850 6,298,146
87,984,064 77,461,360
104,414,731 92,836,718
4.1 This reserve can be utilized by the Holding Company only for the purposes specified in section 81 of the
Companies Act, 2017.
4.2 This represents the unrealized gain on re-measurement of investments at fair value through other
comprehensive income and is not available for distribution. Reconciliation of fair value reserve net of
deferred tax is as under:
2021 2020
(Rupees in thousand)
Balance as on 01 July 8,056,768 9,871,724
Adjustment due to equity accounted investee (579,789) -
Fair value adjustment during the year 389,857 (1,279,310)
Share of fair value reserve of associates 977,284 (535,646)
8,844,120 8,056,768
Add / (Less): Deferred income tax 176,408 (126,104)
Balance as on 30 June 9,020,528 7,930,664

4.3 As required by UAE Federal Law No. (2) of 2015 and the Articles of Association of Nishat Linen Trading
LLC - Subsidiary Company, 10% of the profit for the year has to be transferred to a legal reserve until it
is equivalent to 50% of paid-up capital of the Subsidiary Company. This reserve is not available for
distribution.
4.4 This represents maintenance reserve set aside from retained earnings by Nishat Power Limited -
Subsidiary Company for the purpose of meeting repair and maintenance costs associated with major
maintenance of the plant in coming years. The reserve is not available for distribution of profits through
dividend and will be utilized on actual occurrence of expenditure.
4.5 An equity accounted associate created the fund for redemption of preference shares. The preference
shares were redeemed during the year ended 30 June 2007.
2021 2020
Note (Rupees in thousand)
5 LONG TERM FINANCING
From banking companies - secured
Long term loans 5.1 12,802,915 9,210,417
Long term musharika 5.2 2,144,200 923,197
Motor vehicles' loans 5.10 1,186 2,540
14,948,301 10,136,154
Less: Current portion shown under current liabilities 12 (3,242,316) (763,703)
11,705,985 9,372,451
For the year ended June 30, 2021Notes to the Consolidated Financial Statements
Nishat Mills Limited and its Subsidiaries160
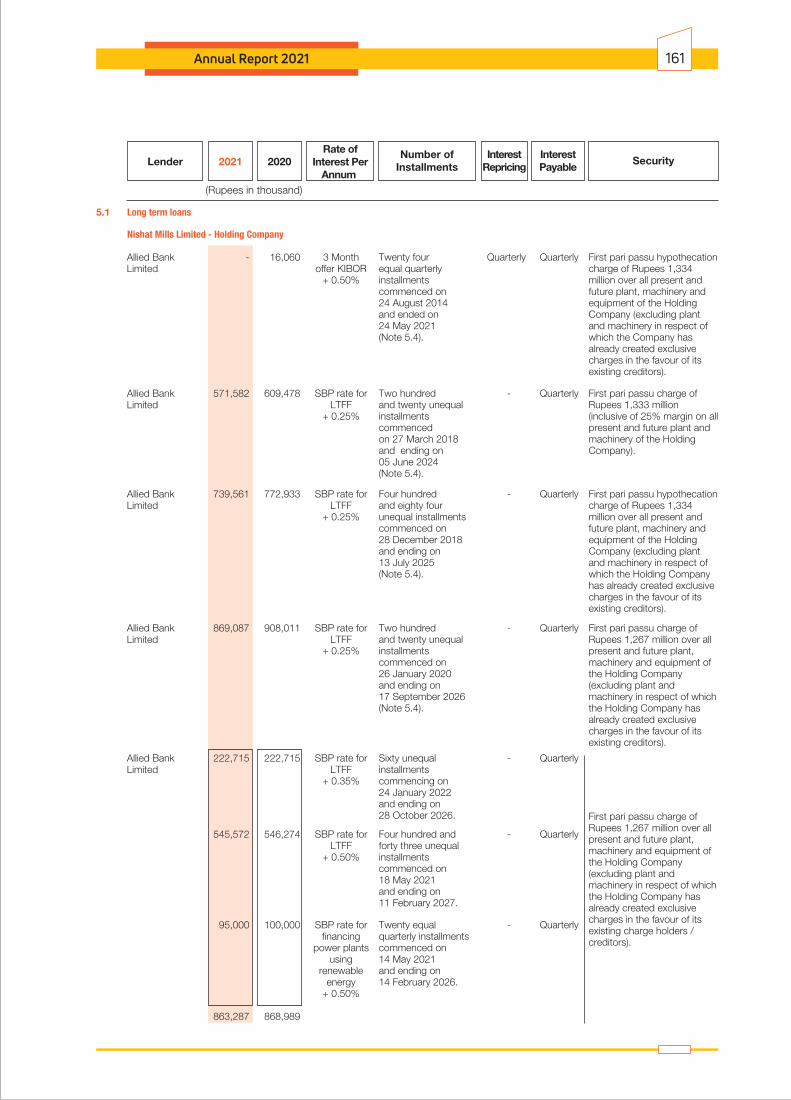
Annual Report 2021 161
Lender 2021 2020Interest
RepricingInterestPayable
Rate ofInterest Per
Annum
Number ofInstallments
Security
(Rupees in thousand)
5.1 Long term loans
Nishat Mills Limited - Holding Company
Twenty four Quarterly Quarterlyequal quarterly installments commenced on 24 August 2014 and ended on 24 May 2021(Note 5.4).
First pari passu hypothecation charge of Rupees 1,334 million over all present and future plant, machinery and equipment of the Holding Company (excluding plant and machinery in respect of which the Company has already created exclusive charges in the favour of its existing creditors).
3 Monthoffer KIBOR
+ 0.50%
Allied Bank - 16,060Limited
First pari passu charge of Rupees 1,267 million over all present and future plant, machinery and equipment of the Holding Company (excluding plant and machinery in respect of which the Holding Company has already created exclusive charges in the favour of its existing charge holders / creditors).
Two hundred - Quarterlyand twenty unequal installments commenced on 27 March 2018 and ending on 05 June 2024 (Note 5.4).
First pari passu charge of Rupees 1,333 million (inclusive of 25% margin on all present and future plant and machinery of the Holding Company).
SBP rate for LTFF
+ 0.25%
Allied Bank 571,582 609,478Limited
Two hundred - Quarterlyand twenty unequalinstallments commenced on 26 January 2020 and ending on 17 September 2026(Note 5.4).
First pari passu charge of Rupees 1,267 million over all present and future plant, machinery and equipment of the Holding Company (excluding plant and machinery in respect of which the Holding Company has already created exclusive charges in the favour of its existing creditors).
SBP rate for LTFF
+ 0.25%
Allied Bank 869,087 908,011Limited
Four hundred - Quarterlyand eighty four unequal installments commenced on 28 December 2018and ending on13 July 2025(Note 5.4).
First pari passu hypothecation charge of Rupees 1,334 million over all present and future plant, machinery and equipment of the Holding Company (excluding plant and machinery in respect of which the Holding Company has already created exclusive charges in the favour of its existing creditors).
SBP rate for LTFF
+ 0.25%
Allied Bank 739,561 772,933Limited
Sixty unequal - Quarterlyinstallments commencing on24 January 2022 and ending on 28 October 2026.
SBP rate for LTFF
+ 0.35%
Allied Bank 222,715 222,715Limited
Four hundred and - Quarterlyforty three unequalinstallments commenced on 18 May 2021 and ending on11 February 2027.
SBP rate for LTFF
+ 0.50%
Twenty equal - Quarterlyquarterly installmentscommenced on14 May 2021 and ending on14 February 2026.
SBP rate for financing
power plants using
renewable energy
+ 0.50%
545,572 546,274
95,000 100,000
863,287 868,989
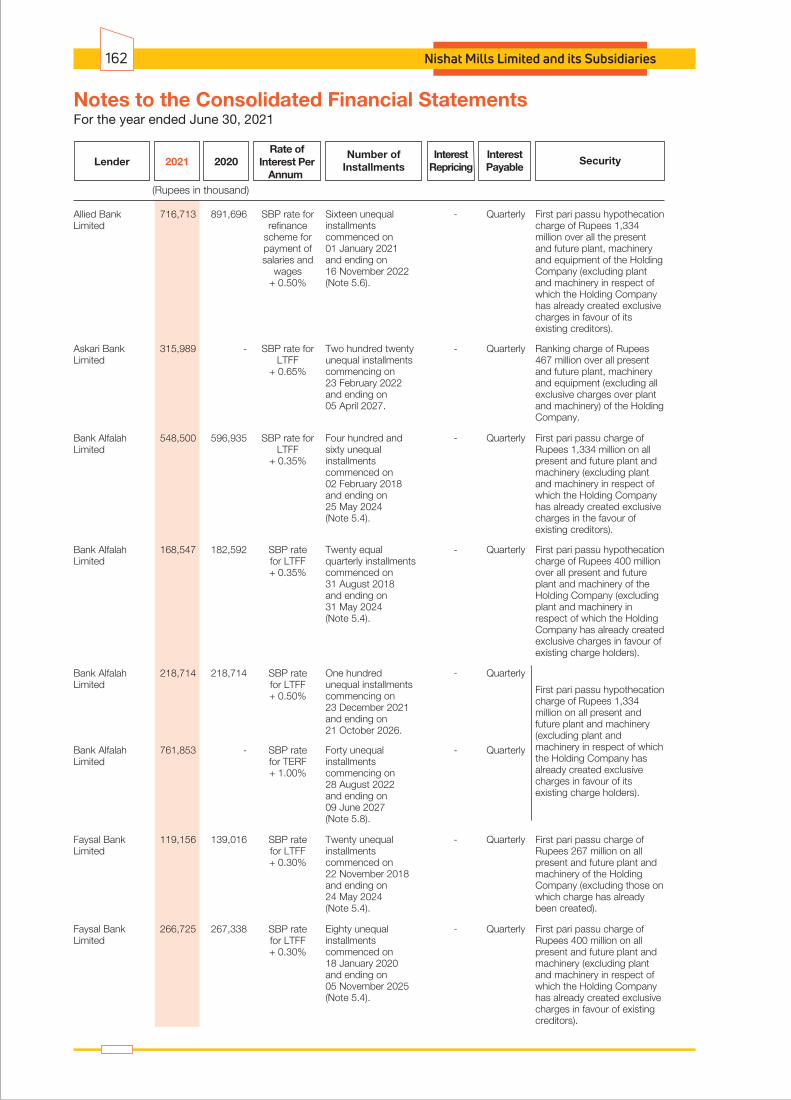
For the year ended June 30, 2021Notes to the Consolidated Financial Statements
Nishat Mills Limited and its Subsidiaries162
Lender 2021 2020Interest
RepricingInterestPayable
Rate ofInterest Per
Annum
Number ofInstallments
Security
(Rupees in thousand)
Sixteen unequal - Quarterlyinstallments commenced on 01 January 2021 and ending on 16 November 2022(Note 5.6).
First pari passu hypothecation charge of Rupees 1,334 million over all the present and future plant, machinery and equipment of the Holding Company (excluding plant and machinery in respect of which the Holding Company has already created exclusive charges in favour of its existing creditors).
SBP rate for refinance
scheme for payment of salaries and
wages + 0.50%
Allied Bank 716,713 891,696Limited
One hundred - Quarterlyunequal installments commencing on 23 December 2021 and ending on 21 October 2026.
First pari passu hypothecation charge of Rupees 1,334 million on all present and future plant and machinery (excluding plant and machinery in respect of which the Holding Company has already created exclusive charges in favour of its existing charge holders).
SBP ratefor LTFF + 0.50%
Bank Alfalah 218,714 218,714Limited
Forty unequal - Quarterlyinstallments commencing on 28 August 2022 and ending on 09 June 2027(Note 5.8).
SBP ratefor TERF+ 1.00%
Bank Alfalah 761,853 -Limited
Faysal Bank 119,156 139,016Limited
Twenty unequal - Quarterlyinstallments commenced on 22 November 2018 and ending on 24 May 2024 (Note 5.4).
First pari passu charge of Rupees 267 million on all present and future plant and machinery of the Holding Company (excluding those on which charge has already been created).
SBP ratefor LTFF + 0.30%
Faysal Bank 266,725 267,338Limited
Eighty unequal - Quarterlyinstallments commenced on18 January 2020 and ending on 05 November 2025(Note 5.4).
First pari passu charge of Rupees 400 million on all present and future plant and machinery (excluding plant and machinery in respect of which the Holding Company has already created exclusive charges in favour of existing creditors).
SBP ratefor LTFF + 0.30%
Ranking charge of Rupees 467 million over all present and future plant, machinery and equipment (excluding all exclusive charges over plant and machinery) of the Holding Company.
Two hundred twenty - Quarterlyunequal installmentscommencing on 23 February 2022 and ending on 05 April 2027.
SBP rate for LTFF
+ 0.65%
Askari Bank 315,989 -Limited
First pari passu charge of Rupees 1,334 million on all present and future plant and machinery (excluding plant and machinery in respect of which the Holding Company has already created exclusive charges in the favour of existing creditors).
Four hundred and - Quarterlysixty unequal installments commenced on 02 February 2018and ending on 25 May 2024 (Note 5.4).
SBP rate for LTFF
+ 0.35%
Bank Alfalah 548,500 596,935Limited
First pari passu hypothecation charge of Rupees 400 million over all present and future plant and machinery of the Holding Company (excluding plant and machinery in respect of which the Holding Company has already created exclusive charges in favour of existing charge holders).
Twenty equal - Quarterlyquarterly installmentscommenced on 31 August 2018and ending on 31 May 2024 (Note 5.4).
SBP ratefor LTFF+ 0.35%
Bank Alfalah 168,547 182,592Limited

Annual Report 2021 163
Lender 2021 2020Interest
RepricingInterestPayable
Rate ofInterest Per
Annum
Number ofInstallments
Security
(Rupees in thousand)
Twenty equal - Quarterlyquarterly installments commenced on 27 February 2020 and ending on27 November 2025(Note 5.4).
SBP ratefor LTFF+ 0.25%
Habib Bank 668,592 705,753Limited
Twenty equal - Quarterlyquarterly installmentscommenced on 27 February 2020 and ending on27 November 2024.
First pari passu charge of Rupees 4,084 million over all present and future plant, machinery and equipment of the Holding Company (excluding plant and machinery in respect of which the Holding Company has already created exclusive charges in the favour of its existing creditors).
SBP rate for financing
power plants using
renewable energy
+ 0.25%
192,827 231,392
861,419 937,145
One hundred and - Quarterlytwenty unequalinstallments commenced on 12 April 2017 andending on 03 June 2023(Note 5.4).
First pari passu hypothecation charge of Rupees 534 million on all present and future plant and machinery (excluding plant and machinery which is under exclusive charges in favour of creditors).
SBP rate for LTFF+ 0.50%
National Bank 39,028 44,466of Pakistan
Sixty four unequal Quarterly Quarterlyinstallments commencing on17 September 2023and ending on 23 June 2031(Note. 5.5).
Ranking charge of Rupees 1,334 million on present and future plant and machinery (excluding plant and machinery in respect of which the Holding Company has already created exclusive charges in favour of its existing charges holders / creditors).
3 Monthoffer
KIBOR+ 1.50%
National Bank 139,545 -of Pakistan
One hundred - Quarterlyunequal installmentscommencing on24 September 2021and ending on22 July 2026.
First pari passu hypothecation charge of Rupees 1,334 million over plant and machinery (excluding plant and machinery in respect of which the Holding Company has already created exclusive charges in favour of its existing charge holders).
SBP ratefor LTFF+ 0.65%
Habib 997,499 866,900MetropolitanBank Limited
Ninety six unequal - Quarterlyinstallments commencing on19 July 2023 andending on 11 June 2031(Note 5.8).
Ranking charge of Rupees 1,334 million over plant and machinery of the Holding Company.
SBP ratefor TERF+ 0.85%
Habib 842,390 -MetropolitanBank Limited
One hundred and - Quarterlyeighty unequal installments commenced on 17 September 2017 and ending on 25 November 2023(Note 5.4).
Note 5.3 SBP ratefor LTFF+ 0.40%
Habib Bank 424,904 461,591Limited
Three hundred - Quarterlyand twenty unequalinstallmentscommenced on30 August 2018and ending on28 December 2024(Note 5.4).
First pari passu charge of Rupees 400 million over all the present and future plant and machinery of the Holding Company with 25% margin excluding those assets (part of the plant and machinery) on which the Holding Company has created exclusive charges in favour of existing creditors.
SBP rate for LTFF+ 0.25%
Pak Brunei 188,286 202,474InvestmentCompany Limited

For the year ended June 30, 2021Notes to the Consolidated Financial Statements
Nishat Mills Limited and its Subsidiaries164
Lender 2021 2020Interest
RepricingInterestPayable
Rate ofInterest Per
Annum
Number ofInstallments
Security
(Rupees in thousand)
One hundred and - Quarterlysixty unequal installments commenced on11 June 2016 andending on26 January 2023(Note 5.4).
First pari passu charge of Rupees 400 million on all present and future plant and machinery of the Holding Company with 25% margin.
Ranking hypothecation charge of Rupees 267 million on plant and machinery of the Holding Company (excluding plant and machinery in respect of which the Holding Company has already created exclusive charges in favour of its existing charge holders / creditors).
SBP rate for LTFF+ 1.00%
Pakistan Kuwait 35,679 42,174InvestmentCompany (Private)Limited
Two hundred and - Quarterlyfifty eight unequal installments commenced on15 September 2016and ending on29 September 2023(Note 5.4).
SBP rate for LTFF+ 0.75%
14,807 16,440
50,486 58,614
Seventy two unequal - Quarterlyinstallmentscommenced on10 May 2021 and ending on13 January 2028.
First pari passu hypothecation charge of Rupees 1,334 million on all present and future plant and machinery (excluding plant and machinery in respect of which the Holding Company has already created exclusive charges in favour of its existing charge holders / creditors) of the Holding Company with 25% margin.
SBP rate for LTFF
+ 0.65%
Pakistan Kuwait 981,040 998,210InvestmentCompany (Private)Limited
One hundred and - Quarterlysixty unequal installments commenced on 30 January 2017 andending on 07 April 2023(Note 5.4).
First pari passu charge of Rupees 667 million on all present and future plant and machinery (other than the specific machinery against which exclusive charges have already been created in favour of existing charge holders) of the Holding Company.
SBP rate for LTFF
+ 0.50%
The Bank 146,755 169,255of Punjab
Thirty two equal Quarterly Quarterlyinstallments commencing on 28 September 2023 and ending on 28 June 2031(Note. 5.5).
Ranking charge of Rupees 3,000 million over all present and future plant and machinery (excluding those assets over which exclusive charges have already been created in favour of existing creditors) of the Holding Company.
3 Monthoffer
KIBOR+ 1.25%
United Bank 110,980 -Limited
Four hundred eighty - Quarterlyunequal installmentscommencing on08 July 2023 andending on11 June 2031(Note 5.8).
SBP ratefor TERF+ 1.25%
1,860,869 -
1,971,849 -
12,802,915 9,210,417
Fifty six unequal Quarterly Quarterlyinstallments commenced on19 May 2016 andended on01 June 2021(Note 5.4).
Note 5.33 Month offer KIBOR + 0.35%
Habib Bank - 27,896Limited
5.2 Long term musharikaNishat Mills Limited - Holding Company

Annual Report 2021 165
Lender 2021 2020Interest
RepricingInterestPayable
Rate ofInterest Per
Annum
Number ofInstallments
Security
(Rupees in thousand)
First pari passu charge of Rupees 2,200 million over present and future plant, machinery and equipment of the Holding Company (excluding plant and machinery in respect of which the Holding Company has already created exclusive charges in favour of its existing charge holders / creditors).
Seventeen unequal Quarterly Quarterlyinstallments commenced on14 February 2019and ended on25 May 2021.
Specific charge of Rupees 1,339 million over fixed assets of the Holding Company inclusive of 25% margin.
3 Month offer KIBOR
Standard - 687,500Chartered Bank(Pakistan) Limited
Eight equal quarterly - Quarterlyinstallments commenced on 30 March 2021 and ending on 30 December 2022(Note 5.7).
First pari passu charge of Rupees 1,333 million over all the present and future plant, machinery and equipment of the Holding Company (excluding plant and machinery in respect of which the Holding Company has already created exclusive charges in favour of its existing creditors).
SBP rate for Islamic
refinance scheme for payment of salaries and
wages + 0.50%
Faysal Bank 707,633 -Limited
Two hundred - Quarterlyunequal installmentscommencing on 24 March 2022 and ending on 25 June 2027.
SBP rate for ILTFF
+ 0.70%
Faysal Bank 803,328 -Limited
Forty unequal - Quarterlyinstallments commencing on 07 July 2022 andending on26 February 2027.
SBP rate for Islamic
renewable energy
financing scheme+ 0.70%
262,949 -
1,066,277 -
Cross corporate guarantee of Rupees 506.667 million of Nishat Mills Limited- Holding company.
Eight equal - Quarterlyquarterly installmentscommenced on30 March 2021 and ending on 30 December 2022(Note 5.7).
SBP rate for Islamic
refinance scheme for payment of salaries and
wages+ 0.50%
Faysal Bank 241,059 119,878 Limited
241,059 119,878
Nishat Linen (Private) Limited - Subsidiary Company
Cross corporate guarantee of Rupees 41.600 million of Nishat Mills Limited - Holding Company.
Eight equal - Quarterlyinstallments commencedon 31 March 2021and ending on31 December 2022(Note 5.7).
SBP rate for Salaries &
Wages+ 0.50%
Faysal Bank 18,523 14,100 Limited
18,523 14,100
Nishat Hospitality (Private) Limited - Subsidiary Company
Pari passu charge over all the present and future fuel stock / inventory and energy revenue receivables of Nishat Power Limited - Subsidiary Company.
Eight equal - Quarterlyinstallments commencedon 31 March 2021and ending on 31 December 2022(Note 5.9).
SBP rate for Salaries &
Wages + 0.50% to
0.75%
Faysal Bank 110,708 73,823Limited
110,708 73,823
2,144,200 923,197
Nishat Power Limited - Subsidiary Company
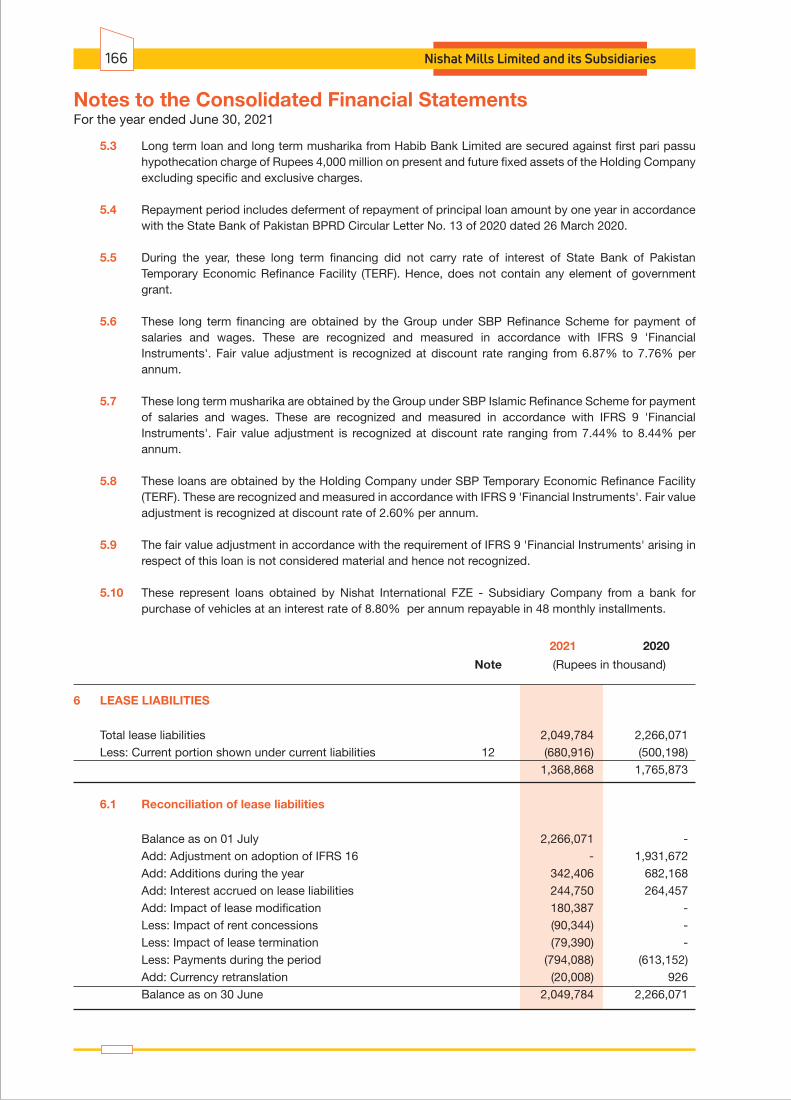
For the year ended June 30, 2021Notes to the Consolidated Financial Statements
Nishat Mills Limited and its Subsidiaries166
5.3 Long term loan and long term musharika from Habib Bank Limited are secured against first pari passu hypothecation charge of Rupees 4,000 million on present and future fixed assets of the Holding Company excluding specific and exclusive charges.
5.4 Repayment period includes deferment of repayment of principal loan amount by one year in accordance with the State Bank of Pakistan BPRD Circular Letter No. 13 of 2020 dated 26 March 2020.
5.5 During the year, these long term financing did not carry rate of interest of State Bank of Pakistan Temporary Economic Refinance Facility (TERF). Hence, does not contain any element of government grant.
5.6 These long term financing are obtained by the Group under SBP Refinance Scheme for payment of salaries and wages. These are recognized and measured in accordance with IFRS 9 'Financial Instruments'. Fair value adjustment is recognized at discount rate ranging from 6.87% to 7.76% per annum.
5.7 These long term musharika are obtained by the Group under SBP Islamic Refinance Scheme for payment of salaries and wages. These are recognized and measured in accordance with IFRS 9 'Financial Instruments'. Fair value adjustment is recognized at discount rate ranging from 7.44% to 8.44% per annum.
5.8 These loans are obtained by the Holding Company under SBP Temporary Economic Refinance Facility (TERF). These are recognized and measured in accordance with IFRS 9 'Financial Instruments'. Fair value adjustment is recognized at discount rate of 2.60% per annum.
5.9 The fair value adjustment in accordance with the requirement of IFRS 9 'Financial Instruments' arising in respect of this loan is not considered material and hence not recognized.
5.10 These represent loans obtained by Nishat International FZE - Subsidiary Company from a bank for purchase of vehicles at an interest rate of 8.80% per annum repayable in 48 monthly installments.
2021 2020
Note (Rupees in thousand)
6 LEASE LIABILITIES
Total lease liabilities 2,049,784 2,266,071 Less: Current portion shown under current liabilities 12 (680,916) (500,198) 1,368,868 1,765,873
6.1 Reconciliation of lease liabilities
Balance as on 01 July 2,266,071 - Add: Adjustment on adoption of IFRS 16 - 1,931,672 Add: Additions during the year 342,406 682,168 Add: Interest accrued on lease liabilities 244,750 264,457 Add: Impact of lease modification 180,387 - Less: Impact of rent concessions (90,344) - Less: Impact of lease termination (79,390) - Less: Payments during the period (794,088) (613,152) Add: Currency retranslation (20,008) 926 Balance as on 30 June 2,049,784 2,266,071

Annual Report 2021 167
2021 2020 (Rupees in thousand)
6.2 Maturity analysis of lease liabilities is as follows:
Upto 6 months 462,607 437,029 6-12 months 393,753 388,709 1-2 years 536,644 777,283 More than 2 years 1,200,654 1,376,248 2,593,658 2,979,269 Less: Future finance cost (543,874) (713,198) Present value of finance lease liabilities 2,049,784 2,266,071
7 LONG TERM SECURITY DEPOSITS
These represent interest free security deposits received from stockists in connection with 'Nishat Linen' retail outlets in Pakistan. These security deposits have been utilized for the purpose of business in accordance with the terms of written agreements with stockists.
2021 2020 Note (Rupees in thousand)
8 DEFERRED LIABILITIES
Deferred income tax 8.1 2,411,249 1,973,011 Gas Infrastructure Development Cess (GIDC) payable 8.2 78,039 - Deferred income - Government grant 8.3 81,409 - Accumulating compensated absences 1,937 1,540 2,572,634 1,974,551
8.1 Deferred income tax
The liability for deferred taxation originated due to temporary difference relating to:
Taxable temporary differences on:
Un-quoted equity investment at FVTOCI - 126,104 Investments in associates under equity method 3,085,803 2,566,707 Right-of-use assets 448,930 547,136 Accelerated tax depreciation 8.1.4 148,554 156,652 3,683,287 3,396,599
Deductible temporary difference on:
Turnover tax carried forward 8.1.5 (301,656) (588,552) Lease liabilities (552,889) (625,366) Equity Investments at FVTOCI (176,408) - Accumulating compensated absences 8.1.6 (561) (447) Unabsorbed tax depreciation losses 8.1.6 (205,297) (198,136) Others 8.1.6 (35,227) (11,087) (1,272,038) (1,423,588) 2,411,249 1,973,011
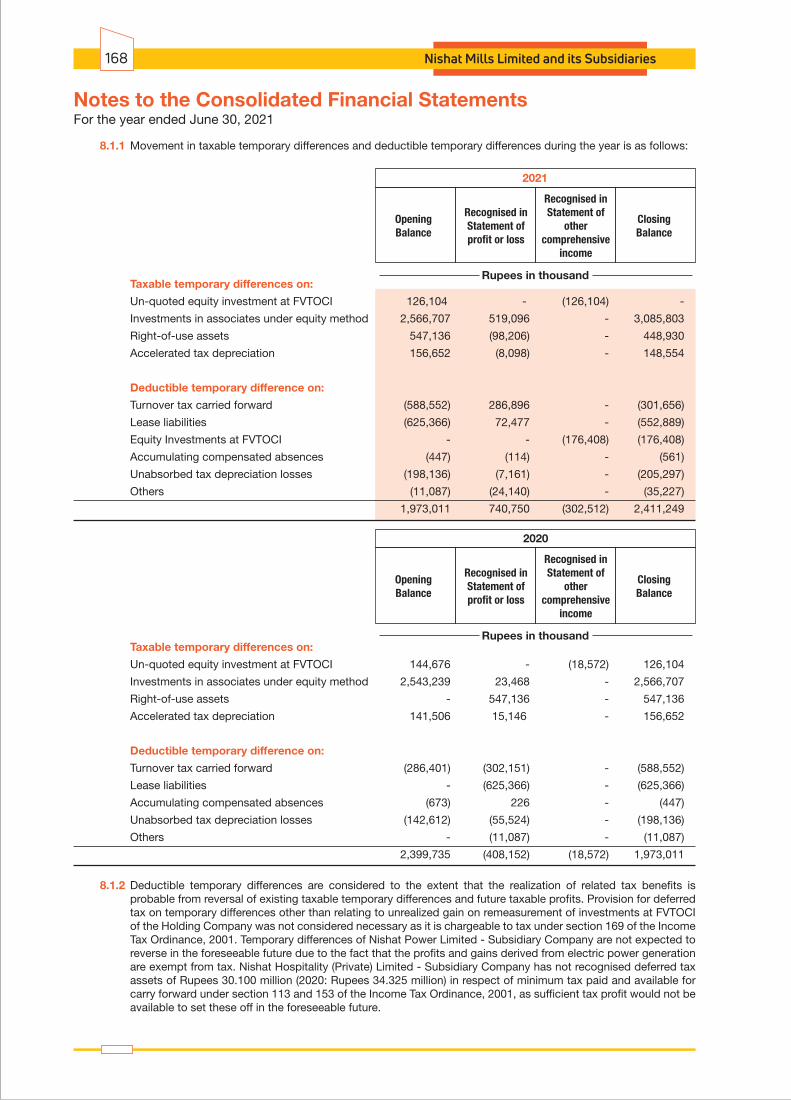
For the year ended June 30, 2021Notes to the Consolidated Financial Statements
Nishat Mills Limited and its Subsidiaries168
Recognised inStatement of
othercomprehensive
income
ClosingBalance
OpeningBalance
Recognised inStatement ofprofit or loss
2021
Rupees in thousand
8.1.1 Movement in taxable temporary differences and deductible temporary differences during the year is as follows:
Taxable temporary differences on:
Un-quoted equity investment at FVTOCI 126,104 - (126,104) -
Investments in associates under equity method 2,566,707 519,096 - 3,085,803
Right-of-use assets 547,136 (98,206) - 448,930
Accelerated tax depreciation 156,652 (8,098) - 148,554
Deductible temporary difference on:
Turnover tax carried forward (588,552) 286,896 - (301,656)
Lease liabilities (625,366) 72,477 - (552,889)
Equity Investments at FVTOCI - - (176,408) (176,408)
Accumulating compensated absences (447) (114) - (561)
Unabsorbed tax depreciation losses (198,136) (7,161) - (205,297)
Others (11,087) (24,140) - (35,227)
1,973,011 740,750 (302,512) 2,411,249
Taxable temporary differences on:
Un-quoted equity investment at FVTOCI 144,676 - (18,572) 126,104
Investments in associates under equity method 2,543,239 23,468 - 2,566,707
Right-of-use assets - 547,136 - 547,136
Accelerated tax depreciation 141,506 15,146 - 156,652
Deductible temporary difference on:
Turnover tax carried forward (286,401) (302,151) - (588,552)
Lease liabilities - (625,366) - (625,366)
Accumulating compensated absences (673) 226 - (447)
Unabsorbed tax depreciation losses (142,612) (55,524) - (198,136)
Others - (11,087) - (11,087)
2,399,735 (408,152) (18,572) 1,973,011
8.1.2 Deductible temporary differences are considered to the extent that the realization of related tax benefits is probable from reversal of existing taxable temporary differences and future taxable profits. Provision for deferred tax on temporary differences other than relating to unrealized gain on remeasurement of investments at FVTOCI of the Holding Company was not considered necessary as it is chargeable to tax under section 169 of the Income Tax Ordinance, 2001. Temporary differences of Nishat Power Limited - Subsidiary Company are not expected to reverse in the foreseeable future due to the fact that the profits and gains derived from electric power generation are exempt from tax. Nishat Hospitality (Private) Limited - Subsidiary Company has not recognised deferred tax assets of Rupees 30.100 million (2020: Rupees 34.325 million) in respect of minimum tax paid and available for carry forward under section 113 and 153 of the Income Tax Ordinance, 2001, as sufficient tax profit would not be available to set these off in the foreseeable future.
Recognised inStatement of
othercomprehensive
income
ClosingBalance
OpeningBalance
Recognised inStatement ofprofit or loss
2020
Rupees in thousand

Annual Report 2021 169
8.1.4 This relates to Nishat Hospitality (Private) Limited, Nishat Linen (Private) Limited and Nishat Commodities (Private) Limited - Subsidiary Companies.
8.1.5 This relates to Nishat Linen (Private) Limited - Subsidiary Company.
8.1.6 These relate to Nishat Hospitality (Private) Limited - Subsidiary Company.
2021 2020
Note (Rupees in thousand)
8.2 Gas Infrastructure Development Cess (GIDC) Payable
Gas Infrastructure Development Cess payable at amortized cost 1,299,041 -
Add: Adjustment due to impact of IFRS 9 36 73,562 -
Less: Payments made during the year (168,369) -
Balance as on 30 June 1,204,234 -
Less: Current portion shown under current liabilities 12 (1,126,195) -
78,039 -
8.2.1 This represents Gas Infrastructure Development Cess (GIDC) that was levied through GIDC Act, 2015. During the year, Honourable Supreme Court of Pakistan upheld the GIDC Act, 2015 to be constitutional and intra vires. Nishat Mills Limited - Holding Company has filed a review petition in Honourable Sindh High Court, Karachi which is pending adjudication. GIDC payable has been recognized at amortized cost in accordance with IFRS 9.
8.1.3 Minimum tax available for carry forward under Section 113 of the Income Tax Ordinance, 2001 is estimated at Rupees 301.656 million (2020: Rupees 588.552 million).
2020 274,691 2025
2019 26,965 2024
301,656
2020 283,106 2025
2019 99,892 2024
2018 94,852 2023
2016 110,702 2021
588,552
Amount ofminimum tax
Accounting yearin which
minimum taxwill expire
Accounting year to which theminimum tax relates
2021
Rupees in thousand
Amount ofminimum tax
Accounting yearin which
minimum taxwill expire
Accounting year to which theminimum tax relates
2020
Rupees in thousand
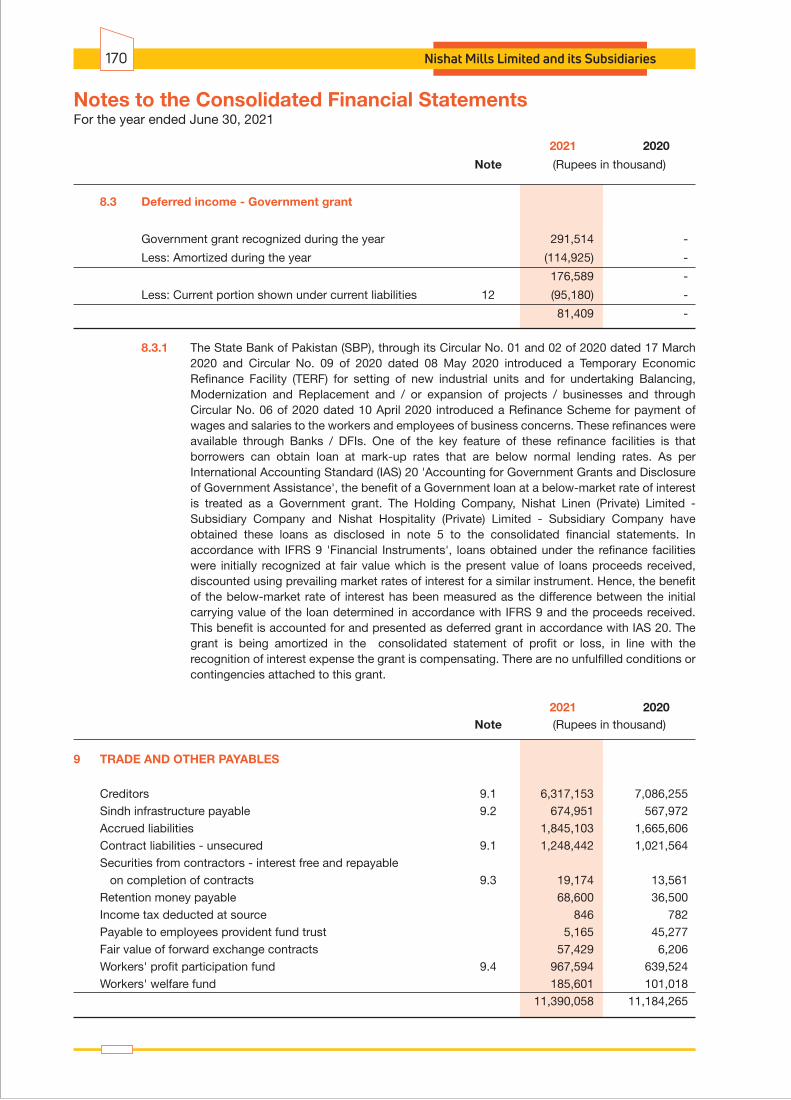
2021 2020
Note (Rupees in thousand)
8.3 Deferred income - Government grant
Government grant recognized during the year 291,514 -
Less: Amortized during the year (114,925) -
176,589 -
Less: Current portion shown under current liabilities 12 (95,180) -
81,409 -
8.3.1 The State Bank of Pakistan (SBP), through its Circular No. 01 and 02 of 2020 dated 17 March 2020 and Circular No. 09 of 2020 dated 08 May 2020 introduced a Temporary Economic Refinance Facility (TERF) for setting of new industrial units and for undertaking Balancing, Modernization and Replacement and / or expansion of projects / businesses and through Circular No. 06 of 2020 dated 10 April 2020 introduced a Refinance Scheme for payment of wages and salaries to the workers and employees of business concerns. These refinances were available through Banks / DFIs. One of the key feature of these refinance facilities is that borrowers can obtain loan at mark-up rates that are below normal lending rates. As per International Accounting Standard (IAS) 20 'Accounting for Government Grants and Disclosure of Government Assistance', the benefit of a Government loan at a below-market rate of interest is treated as a Government grant. The Holding Company, Nishat Linen (Private) Limited - Subsidiary Company and Nishat Hospitality (Private) Limited - Subsidiary Company have obtained these loans as disclosed in note 5 to the consolidated financial statements. In accordance with IFRS 9 'Financial Instruments', loans obtained under the refinance facilities were initially recognized at fair value which is the present value of loans proceeds received, discounted using prevailing market rates of interest for a similar instrument. Hence, the benefit of the below-market rate of interest has been measured as the difference between the initial carrying value of the loan determined in accordance with IFRS 9 and the proceeds received. This benefit is accounted for and presented as deferred grant in accordance with IAS 20. The grant is being amortized in the consolidated statement of profit or loss, in line with the recognition of interest expense the grant is compensating. There are no unfulfilled conditions or contingencies attached to this grant.
2021 2020 Note (Rupees in thousand)
9 TRADE AND OTHER PAYABLES
Creditors 9.1 6,317,153 7,086,255 Sindh infrastructure payable 9.2 674,951 567,972 Accrued liabilities 1,845,103 1,665,606 Contract liabilities - unsecured 9.1 1,248,442 1,021,564 Securities from contractors - interest free and repayable on completion of contracts 9.3 19,174 13,561 Retention money payable 68,600 36,500 Income tax deducted at source 846 782 Payable to employees provident fund trust 5,165 45,277 Fair value of forward exchange contracts 57,429 6,206 Workers' profit participation fund 9.4 967,594 639,524 Workers' welfare fund 185,601 101,018 11,390,058 11,184,265
For the year ended June 30, 2021Notes to the Consolidated Financial Statements
Nishat Mills Limited and its Subsidiaries170

2021 2020
(Rupees in thousand)
9.1 These include amounts due to following related parties:
Creditors
D.G. Khan Cement Company Limited - associated company 383 8,543
Security General Insurance Company Limited - associated company 12,837 31,332
Adamjee Insurance Company Limited - associated company 27,595 25,726
Sanifa Agri Services Limited - associated company - 2,379
Hyundai Nishat Motors (Private) Limited - associated company 59 37
Nishat (Chunian) Limited - related party 75,050 194,584
Nishat Hotels and Properties Limited - associated company 95 31,477
116,019 294,078
Contract liabilities - unsecured
Nishat (Chunian) Limited - related party 10 -
Nishat Hotels and Properties Limited - associated company - 820
10 820
9.2 Sindh infrastructure cess payable
Balance as on 01 July 567,973 466,336
Add: Provision made during the year 106,978 101,636
Balance as on 30 June 674,951 567,972
9.2.1 This represents provision for infrastructure cess imposed by the Province of Sindh through Sindh Finance Act, 1994 and its subsequent versions including the final version i.e. Sindh Development and Maintenance of Infrastructure Cess Act, 2017. Nishat Mills Limited - Holding Company, Nishat Commodities (Private) Limited - Subsidiary Company and Nishat Linen (Private) Limited - Subsidiary Company filed writ petition in Honourable Sindh High Court, Karachi whereby stay was granted and directions were given to provide bank guarantees in favor of Director Excise and Taxation, Karachi. The Honourable Sindh High Court, Karachi passed order dated 04 June 2021 against the Group Companies and directed that bank guarantees should be encashed. Being aggrieved by the order, the Group along with others filed petitions for leave to appeal before Honourable Supreme Court of Pakistan against the Sindh High Court’s judgment in relation to Sindh infrastructure development cess. On 01 September 2021, after hearing the petitioners, the Honourable Supreme Court dictated the order in open court granting leave to appeal to the petitioners and restraining the Sindh Government from encashing the bank guarantees furnished in pursuance of the interim orders passed by the Sindh High Court. The Honourable Supreme Court also directed to release the future consignments subject to furnishing of bank guarantees for the disputed amount.
9.3 These deposits have been utilized for the purpose of business in accordance with the terms of written agreements with contractors.
Annual Report 2021 171
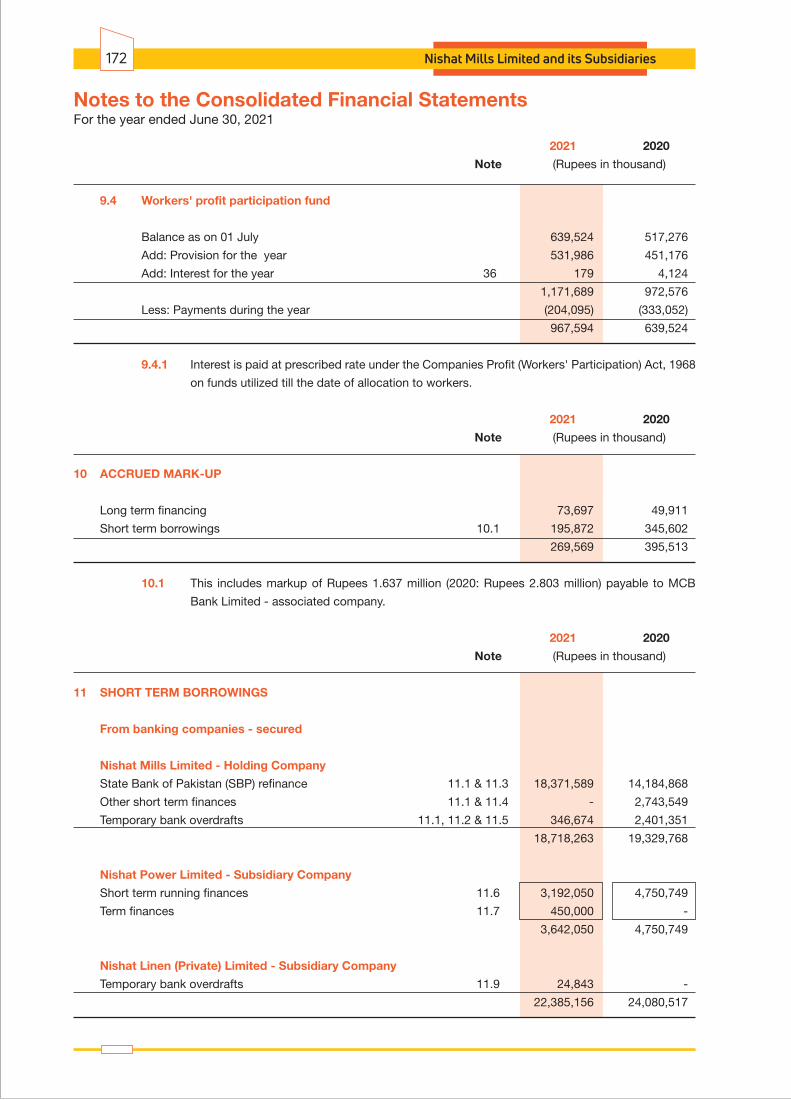
2021 2020
Note (Rupees in thousand)
9.4 Workers' profit participation fund
Balance as on 01 July 639,524 517,276
Add: Provision for the year 531,986 451,176
Add: Interest for the year 36 179 4,124
1,171,689 972,576
Less: Payments during the year (204,095) (333,052)
967,594 639,524
9.4.1 Interest is paid at prescribed rate under the Companies Profit (Workers' Participation) Act, 1968
on funds utilized till the date of allocation to workers.
2021 2020
Note (Rupees in thousand)
10 ACCRUED MARK-UP
Long term financing 73,697 49,911
Short term borrowings 10.1 195,872 345,602
269,569 395,513
10.1 This includes markup of Rupees 1.637 million (2020: Rupees 2.803 million) payable to MCB
Bank Limited - associated company.
2021 2020
Note (Rupees in thousand)
11 SHORT TERM BORROWINGS
From banking companies - secured
Nishat Mills Limited - Holding Company
State Bank of Pakistan (SBP) refinance 11.1 & 11.3 18,371,589 14,184,868
Other short term finances 11.1 & 11.4 - 2,743,549
Temporary bank overdrafts 11.1, 11.2 & 11.5 346,674 2,401,351
18,718,263 19,329,768
Nishat Power Limited - Subsidiary Company
Short term running finances 11.6 3,192,050 4,750,749
Term finances 11.7 450,000 -
3,642,050 4,750,749
Nishat Linen (Private) Limited - Subsidiary Company
Temporary bank overdrafts 11.9 24,843 -
22,385,156 24,080,517
For the year ended June 30, 2021Notes to the Consolidated Financial Statements
Nishat Mills Limited and its Subsidiaries172

11.1 These finances are obtained from banking companies under mark up arrangements and are secured against joint pari passu hypothecation charge on all present and future current assets, other instruments and ranking hypothecation charge on plant and machinery of the Holding Company.
11.2 These finances include Rupees 278.182 million (2020: Rupees 76.206 million) from MCB Bank Limited - associated company, which has been utilized for working capital requirements.
11.3 The rates of mark-up range from 2.20% to 3.00% (2020: 2.15% to 3.00%) per annum during the year on the balance outstanding.
11.4 The rates of mark-up range from 1.87% to 8.52% (2020: 1.87% to 14.01%) per annum during the year on the balance outstanding.
11.5 The rates of mark-up range from 7.05% to 9.28% (2020: 8.75% to 15.56%) per annum during the year on the balance outstanding.
11.6 The total running finance and running musharka main facilities obtained from various commercial banks under mark-up arrangements aggregate Rupees 10,251.52 million (2020: Rupees 10,251.52 million). Such facilities have been obtained at mark-up rates ranging from one month to three months KIBOR plus 0.2% to 2% per annum, payable quarterly, on the balance outstanding. The aggregate facilities are secured against charge on present and future current assets of Nishat Power Limited - Subsidiary Company. The mark-up rate charged during the year on the outstanding balance ranged from 7.46% to 12.19% (2020: 8.86% to 15.85%) per annum. Various sub facilities comprising money market loans and letters of guarantee have also been utilized under the aforementioned main facilities.
11.7 The total murabaha, term finance / money market main and sub-limit facilities obtained from various commercial banks under mark-up arrangements aggregate Rupees 1,400 million (2020: Rupees 1,650 million). Such facilities have been obtained at mark-up rates ranging from one week to six months KIBOR plus 0.10% to 0.40%, payable at the maturity of the respective murabaha transaction / term finance facility. The aggregate facilities are secured against charge on present and future current assets of Nishat Power Limited - Subsidiary Company. The mark-up rate charged during the year on the outstanding balance ranged from 7.55% to 7.72% (2020: 11% to 13.81%) per annum.
11.8 The main facilities for opening letters of credit and guarantees aggregate Rupees 750 million (2020: Rupees 500 million). The amount utilized at 30 June 2021, for letters of credit was Rupees 2.33 million (2020: Rupees Nil) and for letters of guarantee was Rupees 613.000 million (2020: Rupees 113.000 million). The aggregate facilities for opening letters of credit and guarantee are secured by charge on present and future current assets including fuel stocks / inventory of the Nishat Power Limited - Subsidiary Company and by lien over import documents.
11.9 This finance is obtained from Allied Bank Limited under mark up arrangement and is secured against first pari passu hypothecation charge over all present and future current assets of Nishat Linen (Private) Limited - Subsidiary Company and corporate guarantee from Nishat Mills Limited - Holding Company. The rate of mark up ranges from 8.54% to 8.84% (2020: Nil) per annum during the year on the balance outstanding.
2021 2020
Note (Rupees in thousand)
12 CURRENT PORTION OF NON-CURRENT LIABILITIES
Current portion of long term financing 5 3,242,316 763,703
Current portion of lease liabilities 6 680,916 500,198
Current portion of GIDC payable 8.2 1,126,195 -
Current portion of deferred income - Government grant 8.3 95,180 -
5,144,607 1,263,901
Annual Report 2021 173
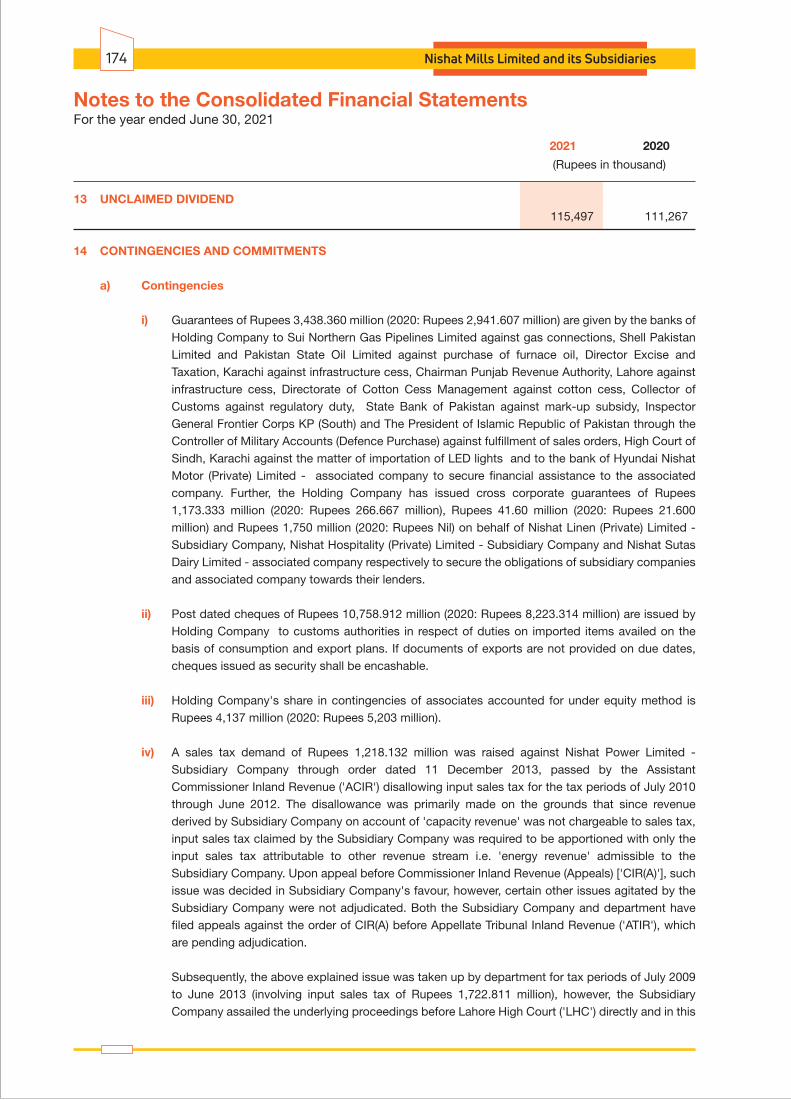
2021 2020
(Rupees in thousand)
13 UNCLAIMED DIVIDEND 115,497 111,267
14 CONTINGENCIES AND COMMITMENTS
a) Contingencies
i) Guarantees of Rupees 3,438.360 million (2020: Rupees 2,941.607 million) are given by the banks of Holding Company to Sui Northern Gas Pipelines Limited against gas connections, Shell Pakistan Limited and Pakistan State Oil Limited against purchase of furnace oil, Director Excise and Taxation, Karachi against infrastructure cess, Chairman Punjab Revenue Authority, Lahore against infrastructure cess, Directorate of Cotton Cess Management against cotton cess, Collector of Customs against regulatory duty, State Bank of Pakistan against mark-up subsidy, Inspector General Frontier Corps KP (South) and The President of Islamic Republic of Pakistan through the Controller of Military Accounts (Defence Purchase) against fulfillment of sales orders, High Court of Sindh, Karachi against the matter of importation of LED lights and to the bank of Hyundai Nishat Motor (Private) Limited - associated company to secure financial assistance to the associated company. Further, the Holding Company has issued cross corporate guarantees of Rupees 1,173.333 million (2020: Rupees 266.667 million), Rupees 41.60 million (2020: Rupees 21.600 million) and Rupees 1,750 million (2020: Rupees Nil) on behalf of Nishat Linen (Private) Limited - Subsidiary Company, Nishat Hospitality (Private) Limited - Subsidiary Company and Nishat Sutas Dairy Limited - associated company respectively to secure the obligations of subsidiary companies and associated company towards their lenders.
ii) Post dated cheques of Rupees 10,758.912 million (2020: Rupees 8,223.314 million) are issued by Holding Company to customs authorities in respect of duties on imported items availed on the basis of consumption and export plans. If documents of exports are not provided on due dates, cheques issued as security shall be encashable.
iii) Holding Company's share in contingencies of associates accounted for under equity method is Rupees 4,137 million (2020: Rupees 5,203 million).
iv) A sales tax demand of Rupees 1,218.132 million was raised against Nishat Power Limited - Subsidiary Company through order dated 11 December 2013, passed by the Assistant Commissioner Inland Revenue ('ACIR') disallowing input sales tax for the tax periods of July 2010 through June 2012. The disallowance was primarily made on the grounds that since revenue derived by Subsidiary Company on account of 'capacity revenue' was not chargeable to sales tax, input sales tax claimed by the Subsidiary Company was required to be apportioned with only the input sales tax attributable to other revenue stream i.e. 'energy revenue' admissible to the Subsidiary Company. Upon appeal before Commissioner Inland Revenue (Appeals) ['CIR(A)'], such issue was decided in Subsidiary Company's favour, however, certain other issues agitated by the Subsidiary Company were not adjudicated. Both the Subsidiary Company and department have filed appeals against the order of CIR(A) before Appellate Tribunal Inland Revenue ('ATIR'), which are pending adjudication.
Subsequently, the above explained issue was taken up by department for tax periods of July 2009 to June 2013 (involving input sales tax of Rupees 1,722.811 million), however, the Subsidiary Company assailed the underlying proceedings before Lahore High Court ('LHC') directly and in this
For the year ended June 30, 2021Notes to the Consolidated Financial Statements
Nishat Mills Limited and its Subsidiaries174
respect, through order dated 31 October 2016, LHC accepted the Subsidiary Company's stance and annulled the proceedings. The department has challenged the decision of LHC before Supreme Court of Pakistan and has also preferred an Intra Court Appeal against such order which are pending adjudication.
Similarly, for financial year 2014, Subsidiary Company's case was selected for 'audit' and such issue again formed the core of audit proceedings (involving input sales tax of Rupees 596.091 million). The Subsidiary Company challenged the jurisdiction in respect of audit proceedings before LHC and while LHC directed the management to join the subject proceedings, department was debarred from passing the adjudication order. During the year 2019, LHC dismissed the petition in favour of the department, by allowing the department to complete the audit proceedings that are pending for completion. During the year on 26 January 2021, the department raised demand against such proceedings, however, Subsidiary Company obtained interim relief from Appellate Tribunal Inland Revenue by applying stay against such demand. The matter is currently pending adjudication.
Similarly, during the year in respect of tax periods July 2016 to June 2017, Subsidiary Company's case was selected for 'audit' and such issue again formed the core of audit proceedings (involving input sales tax of Rupees 541.486 million). The proceedings are underway, however, matter is currently pending adjudication before ACIR.
Since the issue has already been decided in Subsidiary Company's favour on merits by LHC and based on advice of the Subsidiary Company's legal counsel, no provision on these accounts have been made in these consolidated financial statements.
v) On 16 April 2019, the Commissioner Inland Revenue through an order raised a demand of Rupees 179.046 million against Nishat Power Limited - Subsidiary Company, mainly on account of input tax claimed on inadmissible expenses in sales tax return for the tax periods of July 2014 to June 2017 and sales tax default on account of suppression of sales related to tax period June 2016. The Subsidiary Company filed application for grant of stay before the ATIR against recovery of the aforesaid demand that was duly granted. Further, the Subsidiary Company has filed appeals before CIR(A) and ATIR against the order which are pending adjudication. Management has strong grounds to believe that the case will be decided in Subsidiary Company's favour. Therefore, no provision has been made on this account in these consolidated financial statements.
vi) On 13 February 2019, National Electric Power Regulatory Authority ('NEPRA') issued a show cause to Nishat Power Limited - Subsidiary Company along with other Independent Power Producers to provide rationale of abnormal profits earned since commercial operation date (COD) that eventually led to initiation of proceedings against the Subsidiary Company by NEPRA on March 18, 2019. The Subsidiary Company challenged the authority of NEPRA to take suo moto action before the Islamabad High Court (IHC) wherein, on 1 April 2019, IHC provided interim relief by suspending the suo moto proceedings. The case is currently pending adjudication before IHC. Management is confident that based on the facts and law, there will be no adverse implications for the Subsidiary Company.
vii) On 16 March 2020, Government of Pakistan ('GoP') issued a report through which it was alleged that savings were made by the Independent Power Producers ('IPPs'), including Nishat Power Limited - Subsidiary Company, in the tariff components in violation of applicable GoP Policies, tariff determined by National Electric Power Regulatory Authority ('NEPRA') and the relevant Project Agreements. The Subsidiary Company rejected such claims, and discussions were made with the GoP to resolve the dispute.
Annual Report 2021 175

During the year on 12 February 2021, the Subsidiary Company under the Agreements as referred in note 1(a), agreed that the abovementioned dispute will be resolved through arbitration under the Arbitration Submission Agreement between the Subsidiary Company and GoP.
Management believes that there are strong grounds that the matter will ultimately be decided in Subsidiary Company's favor. Furthermore, its financial impact cannot be reasonably estimated at this stage, hence, no provision in this respect has been made in these consolidated financial statements.
viii) The banks have issued the following on behalf of Nishat Power Limited - Subsidiary Company:
(a) Letter of guarantee of Rupees 11.5 million (2020: Rupees 11.5 million) in favour of Director Excise and Taxation, Karachi, under direction of Sindh High Court in respect of suit filed for levy of infrastructure cess.
(b) Letters of guarantee of Rupees 600 million (2020: Rupees 100 million) in favour of fuel suppliers.
(c) Letter of guarantee of Rupees 1.5 million (2020: Rupees 1.5 million) in favour of Punjab Revenue Authority, Lahore.
ix) Guarantees of Rupees 107.350 million (2020: Rupees 100.350 million) are given by Nishat Linen
(Private) Limited - Subsidiary Company to Director Excise and Taxation, Karachi against infrastructure cess, Chairman Punjab Revenue Authority, Lahore against infrastructure cess and Collectors of Customs against import consignments.
x) Through notice dated 25 January 2018, issued by the Deputy Commissioner Inland Revenue (DCIR) under sections 161/205 of the Income Tax Ordinance, 2001, Nishat Linen (Private) Limited - Subsidiary Company had been called upon to demonstrate its compliance with various withholding provisions of the Income Tax Ordinance, 2001. The subject proceedings have been finalized through order dated 03 August 2018, whereby, aggregate default amounting to Rupees 2.551 million has been adjudged against the Subsidiary Company. Subsidiary Company’s appeal before Commissioner Inland Revenue (Appeals) [CIR(A)] was successful except for the legal issue amounting to Rupees 1.419 million. Appeal on this point has been filed before the Appellate Tribunal Inland Revenue which is pending adjudication. Subsidiary Company is confident of favorable outcome of its appeal based on advice of the tax advisor.
xi) Bank guarantee of Rupees 1.900 million (2020: Rupees 1.900 million) is given by the bank of Nishat Commodities (Private) Limited - Subsidiary Company in favour of Director, Excise and Taxation, Karachi to cover the disputed amount of Sindh infrastructure cess.
b) Commitments
i) Contracts for capital expenditure of the Group are approximately of Rupees 3,469.028 million (2020: Rupees 322.818 million).
ii) Letters of credit other than for capital expenditure of the Group are of Rupees 4,451.831 million (2020: Rupees 2,381.289 million).
iii) Outstanding foreign currency forward contracts of the Group are Rupees 6,400.041 million (2020: Rupees 389.348 million).
For the year ended June 30, 2021Notes to the Consolidated Financial Statements
Nishat Mills Limited and its Subsidiaries176
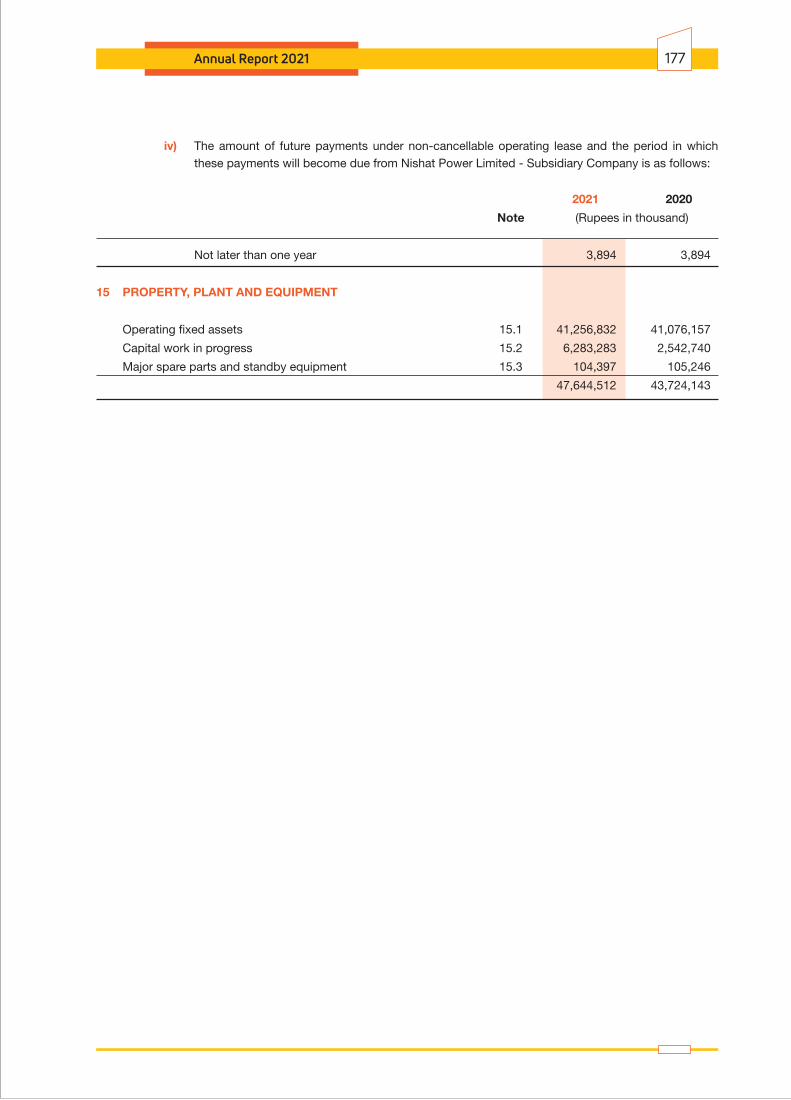
Annual Report 2021 177
iv) The amount of future payments under non-cancellable operating lease and the period in which these payments will become due from Nishat Power Limited - Subsidiary Company is as follows:
2021 2020
Note (Rupees in thousand)
Not later than one year 3,894 3,894
15 PROPERTY, PLANT AND EQUIPMENT
Operating fixed assets 15.1 41,256,832 41,076,157
Capital work in progress 15.2 6,283,283 2,542,740
Major spare parts and standby equipment 15.3 104,397 105,246
47,644,512 43,724,143
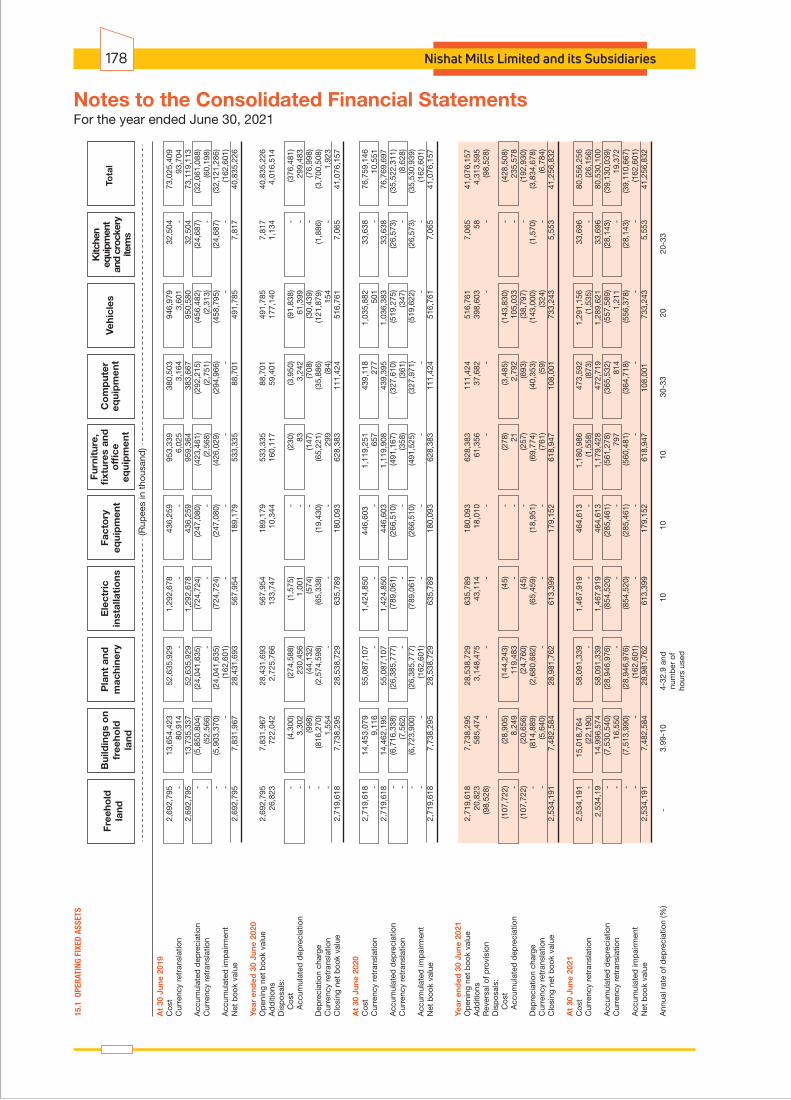
For the year ended June 30, 2021Notes to the Consolidated Financial Statements
Nishat Mills Limited and its Subsidiaries178
At
30 J
une
2019
Cos
t 2
,692
,795
13
,654
,423
52
,635
,929
1,
292,
678
436,
259
953
,339
38
0,50
3 94
6,97
9 32
,504
73
,025
,409
Cur
renc
y re
tran
slat
ion
- 80
,914
-
- -
6,02
5 3,
164
3,60
1 -
93,7
04
2,
692,
795
13,7
35,3
37
52,6
35,9
29
1,29
2,67
8 43
6,25
9 95
9,36
4 38
3,66
7 95
0,58
0 32
,504
73
,119
,113
Acc
umul
ated
dep
reci
atio
n -
(5,8
50,8
04)
(24,
041,
635)
(7
24,7
24)
(247
,080
) (4
23,4
61)
(292
,215
) (4
56,4
82)
(24,
687)
(3
2,06
1,08
8)C
urre
ncy
retr
ansl
atio
n -
(52,
566)
-
- -
(2,5
68)
(2,7
51)
(2,3
13)
- (6
0,19
8)
-
(5,9
03,3
70)
(24,
041,
635)
(7
24,7
24)
(247
,080
) (4
26,0
29)
(294
,966
) (4
58,7
95)
(24,
687)
(3
2,12
1,28
6)A
ccum
ulat
ed im
pai
rmen
t -
- (1
62,6
01)
- -
- -
- -
(162
,601
)N
et b
ook
valu
e 2,
692,
795
7,83
1,96
7 2
8,43
1,69
3 5
67,9
54
189,
179
533,
335
88,7
01
491,
785
7,81
7 40
,835
,226
Year
end
ed 3
0 Ju
ne 2
020
Op
enin
g ne
t b
ook
valu
e
2,69
2,79
5 7,
831,
967
28,4
31,6
93
567,
954
189,
179
533,
335
88,7
01
491,
785
7,81
7 40
,835
,226
Ad
diti
ons
26,8
23
722,
042
2,72
5,76
6 13
3,74
7 10
,344
16
0,11
7 59
,401
17
7,14
0 1,
134
4,01
6,51
4D
isp
osal
s:
Cos
t -
(4,3
00)
(274
,588
) (1
,575
) -
(230
) (3
,950
) (9
1,83
8)
- (3
76,4
81)
A
ccum
ulat
ed d
epre
ciat
ion
- 3,
302
230,
456
1,00
1 -
83
3,24
2 61
,399
-
299,
483
- (9
98)
(44,
132)
(5
74)
- (1
47)
(708
) (3
0,43
9)
- (7
6,99
8)D
epre
ciat
ion
char
ge
- (8
16,2
70)
(2,5
74,5
98)
(65,
338)
(1
9,43
0)
(65,
221)
(3
5,88
6)
(121
,879
) (1
,886
) (3
,700
,508
)C
urre
ncy
retr
ansl
atio
n -
1,
554
-
- -
299
(84)
15
4 -
1
,923
Clo
sing
net
boo
k va
lue
2
,719
,618
7,
738,
295
28,5
38,7
29
635,
789
180,
093
628,
383
111,
424
516
,761
7,
065
41,0
76,1
57
At
30 J
une
2020
Cos
t 2
,719
,618
14
,453
,079
55
,087
,107
1,
424,
850
446,
603
1,
119,
251
439,
118
1,03
5,88
2 33
,638
76
,759
,146
Cur
renc
y re
tran
slat
ion
-
9,1
16
- -
- 65
7 27
7 50
1 -
10,5
51
2
,719
,618
14
,462
,195
55
,087
,107
1,
424,
850
446,
603
1,11
9,90
8 43
9,39
5 1
,036
,383
33
,638
76
,769
,697
Acc
umul
ated
dep
reci
atio
n -
(6,7
16,3
38)
(26,
385,
777)
(7
89,0
61)
(266
,510
) (4
91,1
67)
(327
,610
) (5
19,2
75)
(26,
573)
(3
5,52
2,31
1)C
urre
ncy
retr
ansl
atio
n -
(7
,562
) -
-
- (3
58)
(361
) (3
47)
- (8
,628
)
-
(6
,723
,900
) (2
6,38
5,77
7)
(789
,061
) (2
66,5
10)
(491
,525
) (3
27,9
71)
(519
,622
) (2
6,57
3)
(35,
530,
939)
Acc
umul
ated
imp
airm
ent
-
- (1
62,6
01)
-
- -
- -
- (1
62,6
01)
Net
boo
k va
lue
2,71
9,61
8 7,
738,
295
28,5
38,7
29
635,
789
180,
093
628,
383
111,
424
516,
761
7,06
5 41
,076
,157
Year
end
ed 3
0 Ju
ne 2
021
Op
enin
g ne
t b
ook
valu
e 2,
719,
618
7,73
8,29
5 28
,538
,729
63
5,78
9 18
0,09
3 62
8,38
3 11
1,42
4 51
6,76
1 7,
065
41,0
76,1
57A
dd
ition
s 20
,823
58
5,47
4 3,
148,
475
43,1
14
18,0
10
61,3
56
37,6
82
398,
603
58
4,31
3,59
5R
ever
sal o
f pro
visi
on
(98,
528)
-
- -
- -
- -
- (9
8,52
8)D
isp
osal
s:
Cos
t (1
07,7
22)
(28,
905)
(1
44,2
43)
(45)
-
(278
) (3
,485
) (1
43,8
30)
- (4
28,5
08)
A
ccum
ulat
ed d
epre
ciat
ion
- 8
,249
11
9,48
3 -
- 21
2,
792
105,
033
- 23
5,57
8
(1
07,7
22)
(20,
656)
(2
4,76
0)
(45)
-
(257
) (6
93)
(38,
797)
-
(192
,930
)D
epre
ciat
ion
char
ge
- (8
14,8
89)
(2,6
80,6
82)
(65,
459)
(1
8,95
1)
(69,
774)
(4
0,35
3)
(143
,000
) (1
,570
) (3
,834
,678
)C
urre
ncy
retr
ansl
atio
n -
(5,6
40)
- -
- (7
61)
(59)
(3
24)
- (6
,784
)C
losi
ng n
et b
ook
valu
e
2,53
4,19
1 7,
482,
584
28,9
81,7
62
613,
399
179,
152
618,
947
108,
001
733,
243
5,55
3 41
,256
,832
At
30 J
une
2021
Cos
t 2,
534,
191
15,0
18,7
64
58,0
91,3
39
1,46
7,91
9 46
4,61
3 1,
180,
986
473,
592
1,29
1,15
6 3
3,69
6 80
,556
,256
Cur
renc
y re
tran
slat
ion
- (2
2,19
0)
- -
- (1
,558
) (8
73)
(1,5
35)
- (2
6,15
6)
2
,534
,19
14,9
96,5
74
58,0
91,3
39
1,46
7,91
9 46
4,61
3 1,
179,
428
472,
719
1,28
9,62
1 33
,696
80
,530
,100
Acc
umul
ated
dep
reci
atio
n -
(7,5
30,5
40)
(28,
946,
976)
(8
54,5
20)
(285
,461
) (5
61,2
78)
(365
,532
) (5
57,5
89)
(28,
143)
(3
9,13
0,03
9)C
urre
ncy
retr
ansl
atio
n -
16,5
50
- -
- 79
7 81
4 1,
211
- 19
,372
-
(7,5
13,9
90)
(28,
946,
976)
(8
54,5
20)
(285
,461
) (5
60,4
81)
(364
,718
) (5
56,3
78)
(28,
143)
(3
9,11
0,66
7)A
ccum
ulat
ed im
pai
rmen
t -
- (1
62,6
01)
- -
- -
- -
(162
,601
)N
et b
ook
valu
e 2
,534
,191
7,
482,
584
28,9
81,7
62
613,
399
179,
152
618,
947
108,
001
73
3,24
3 5,
553
41,2
56,8
32
Ann
ual r
ate
of d
epre
ciat
ion
(%)
- 3.
99-1
0 4-
32.9
and
10
10
10
30
-33
20
20-3
3
nu
mb
er o
f
ho
urs
used
Fu
rnit
ure
,fi
xtu
res
and
offi
ceeq
uip
men
t
Fre
eho
ldla
nd
Bu
ildin
gs
on
free
ho
ldla
nd
Pla
nt
and
mac
hin
ery
Ele
ctri
cin
stal
lati
on
sF
acto
ryeq
uip
men
tC
om
pu
ter
equ
ipm
ent
Kitc
hen
equi
pmen
tan
d cr
ocke
ryite
ms
Veh
icle
sTo
tal
15.1
OPE
RATI
NG F
IXED
ASS
ETS
(Rup
ees
in t
hous
and
)

Annual Report 2021 179
Free
hold
land
Land
68K
-1/2
S
61
,984
-
61,9
84
67,0
00
5,01
6 N
egot
iatio
n N
isha
t Sut
as D
airy
Lim
ited
- as
soci
ated
com
pany
,
La
hore
.
Land
DH
A P
hase
8
45
,721
-
45,7
21
151,
450
105,
729
Neg
otia
tion
Mr.
Muh
amm
ad R
aza
Seh
jpal
, Lah
ore.
107,
705
- 10
7,70
5 21
8,45
0 11
0,74
5
Build
ings
on
free
hold
land
Bui
ldin
g D
HA
Pha
se 8
28,9
05
8,24
9 20
,656
28
,905
8,
249
Neg
otia
tion
Mr.
Muh
amm
ad R
aza
Seh
jpal
, Lah
ore.
28,9
05
8,24
9 20
,656
28
,905
8,
249
Plan
t and
Mac
hine
ry
Pic
anol
Opt
imax
(Dob
by) L
oom
4
24,5
40
17,4
75
7,06
5 9,
000
1,93
5 N
egot
iatio
n U
nion
Den
im M
ills, K
arac
hi.
Rot
ary
Prin
ting
Mac
hine
Sto
rk
1 56
,794
47
,877
8,
917
9,00
0 83
N
egot
iatio
n La
hore
Dye
ing
& P
rintin
g M
ills L
imite
d, L
ahor
e.
Sav
io C
one
Win
der
1 9,
394
7,81
2 1,
582
1,58
1 (1
) N
egot
iatio
n Ve
nus
Indu
strie
s (P
rivat
e) L
imite
d, F
aisa
laba
d.
Air
Com
pres
sor
& A
ir D
ryer
6
20,1
83
18,8
04
1,37
9 3,
500
2,12
1 N
egot
iatio
n G
agan
Tex
tile,
Kar
achi
.
Toyo
ta A
ir Je
t Loo
ms
3 7,
174
5,93
9 1,
235
4,35
0 3,
115
Neg
otia
tion
Gag
an T
extil
e, K
arac
hi.
Toyo
ta A
ir Je
t Loo
ms
3 9,
566
7,92
3 1,
643
5,80
0 4,
157
Neg
otia
tion
Gag
an T
extil
e, K
arac
hi.
Stit
chin
g M
achi
nes
125
3,52
5 2,
759
766
583
(183
) N
egot
iatio
n M
r. H
abib
-ur-
Reh
man
, Fai
sala
bad.
Chi
ller
LG D
oubl
e S
team
1
5,32
9 4,
369
960
1,45
5 49
5 N
egot
iatio
n Ic
eber
g In
dust
ries
(Priv
ate)
Lim
ited,
Lah
ore.
136,
505
112,
958
23,5
47
35,2
69
11,7
22
15.1
.1
Det
ail o
f o
per
atin
g f
ixed
ass
ets,
exc
eed
ing
the
bo
ok
valu
e o
f R
upee
s 50
0,00
0 d
isp
ose
d o
f d
urin
g t
he y
ear
is a
s fo
llow
s:
Des
crip
tio
nA
ccum
ulat
edd
epre
ciat
ion
Net
bo
ok
valu
e S
ale
pro
ceed
sG
ain
/(lo
ss)
Mo
de
of
dis
po
sal
Par
ticu
lars
of
pur
chas
ers
Qua
ntit
yN
os.
Co
st
(Rup
ees
in t
hous
and
)

Vehi
cles
Hon
da C
ivic
LE
-16A
-174
5 1
3,07
2 1,
706
1,36
6 2,
700
1,33
4 N
egot
iatio
n M
r. A
bdul
lah
Kha
lid, L
ahor
e.To
yota
Cor
olla
LE
C-1
5-64
51
1 1,
683
1,11
0 57
3 85
1 27
8 C
ompa
ny's
Pol
icy
Mr.
Mat
een
Java
id, C
ompa
ny's
em
ploy
ee, F
aisa
laba
d.To
yota
Cor
olla
LE
C-1
5-25
19
1 1,
693
1,13
7 55
6 90
3 34
7 C
ompa
ny's
Pol
icy
M
r. S
arda
r M
ahm
ood
Akh
tar,
Com
pany
's e
mpl
oyee
,
Laho
re.
Hon
da C
ity L
EB
-16-
1269
1
1,70
6 1,
074
632
910
278
Com
pany
's P
olic
y M
r. M
umta
z H
assa
n, C
ompa
ny's
em
ploy
ee, L
ahor
e.S
uzuk
i Sw
ift L
EF-
16-2
702
1 1,
332
809
523
709
186
Com
pany
's P
olic
y M
r. K
amra
n S
hafiq
ue H
ashm
i, C
ompa
ny's
em
ploy
ee,
La
hore
.H
yund
ai T
ucso
n A
AC
-254
1
5,80
9 70
2 5,
107
5,50
0 39
3 N
egot
iatio
n M
r. M
usa
Ayu
b K
han,
Lah
ore.
Suz
uki S
wift
LE
D-1
6-32
39
1 1,
328
807
521
708
187
Com
pany
's P
olic
y M
r. Ik
hlaq
Ahm
ad, C
ompa
ny's
em
ploy
ee, L
ahor
e.To
yota
Cor
olla
LE
B-1
8A-4
941
1 2,
927
1,01
4 1,
913
2,92
7 1,
014
Neg
otia
tion
Mr.
Naj
am Y
ousa
f, C
ompa
ny’s
em
ploy
ee, L
ahor
e.H
onda
Civ
ic L
EH
-16-
6047
1
2,43
6 1,
463
973
1,31
2 33
9 C
ompa
ny's
Pol
icy
Mr.
Naj
am Y
ousa
f, C
ompa
ny’s
em
ploy
ee, L
ahor
e.To
yota
Cor
olla
LE
F-15
-546
0 1
1,68
4 1,
073
611
899
288
Com
pany
's P
olic
y M
r. R
ana
Ham
mad
Lat
if K
han,
Com
pany
's e
mpl
oyee
,
Laho
re.
Suz
uki C
ultu
s LE
H-1
7-38
01
1 1,
276
630
646
875
229
Neg
otia
tion
Mr.
Kas
hif N
azir,
Com
pany
's e
x-em
ploy
ee, F
aisa
laba
d.H
onda
City
LE
B-1
8A-4
424
1 1,
348
490
858
1,18
3 32
5 N
egot
iatio
n M
r. R
ashi
d A
li, C
ompa
ny's
ex-
empl
oyee
, Fai
sala
bad.
Suz
uki S
wift
LE
C-1
6-15
38
1 1,
468
923
545
783
238
Com
pany
's P
olic
y M
r. R
ahat
Ali,
Com
pany
's e
mpl
oyee
, Fai
sala
bad.
Toyo
ta C
orol
la L
EF-
15-1
831
1 1,
695
1,15
2 54
3 90
5 36
2 C
ompa
ny's
Pol
icy
Mr.
Muk
htar
Ahm
ad, C
ompa
ny's
em
ploy
ee, L
ahor
e.To
yota
Cor
olla
LE
D-1
8-25
90
1 1,
825
705
1,12
0 1,
750
630
Insu
ranc
e C
laim
S
ecur
ity G
ener
al In
sura
nce
Com
pany
Lim
ited
-
asso
ciat
ed c
ompa
ny, L
ahor
e.To
yota
Hilu
x LE
S-1
8-87
16
1 2,
625
959
1,66
6 2,
800
1,13
4 In
sura
nce
Cla
im
Sec
urity
Gen
eral
Insu
ranc
e C
ompa
ny L
imite
d -
as
soci
ated
com
pany
, Lah
ore.
Suz
uki S
wift
LE
C-1
7-57
79
1 1,
360
722
638
870
232
Neg
otia
tion
Mr.
Mun
ib G
hani
, Com
pany
's e
x-em
ploy
ee,
Laho
re.
Hon
da C
ivic
LE
-16A
-295
3 1
1,92
5 1,
133
792
1,08
4 29
2 C
ompa
ny's
Pol
icy
Mis
s S
obia
Ash
raf,
Com
pany
's e
x-em
ploy
ee, L
ahor
e.H
onda
City
LE
B-1
6-28
85
1 1,
695
1,05
0 64
5 90
4 25
9 C
ompa
ny's
Pol
icy
Mr.
Fais
al R
abba
ni, C
ompa
ny's
em
ploy
ee, L
ahor
e.H
onda
Civ
ic L
EB
-17-
2922
1
2,58
4 1,
852
732
732
- C
ompa
ny's
Pol
icy
Mr.
Mub
ashi
r S
addi
que,
Com
pany
’s e
mpl
oyee
,
Laho
re.
Hon
da C
ivic
LE
A-1
6A-7
755
1 3,
073
2,40
7 66
6 66
6 -
Com
pany
's P
olic
y M
r. M
uham
mad
Naw
az, C
ompa
ny's
em
ploy
ee,
La
hore
.
44
,544
22
,918
21
,626
29
,971
8,
345
Ag
greg
ate
of o
ther
item
s of
pro
pert
y,
plan
t and
equ
ipm
ent w
ith in
divi
dual
boo
k
val
ues
not e
xcee
ding
Rup
ees
500,
000
110,
849
91,4
53
19,3
96
84,5
72
65,1
76
428,
508
235,
578
192,
930
397,
167
204,
237
Des
crip
tio
nA
ccum
ulat
edd
epre
ciat
ion
Net
bo
ok
valu
e S
ale
pro
ceed
sG
ain
/(lo
ss)
Mo
de
of
dis
po
sal
Par
ticu
lars
of
pur
chas
ers
Qua
ntit
yN
os.
Co
st
(Rup
ees
in t
hous
and
)For the year ended June 30, 2021Notes to the Consolidated Financial Statements
Nishat Mills Limited and its Subsidiaries180
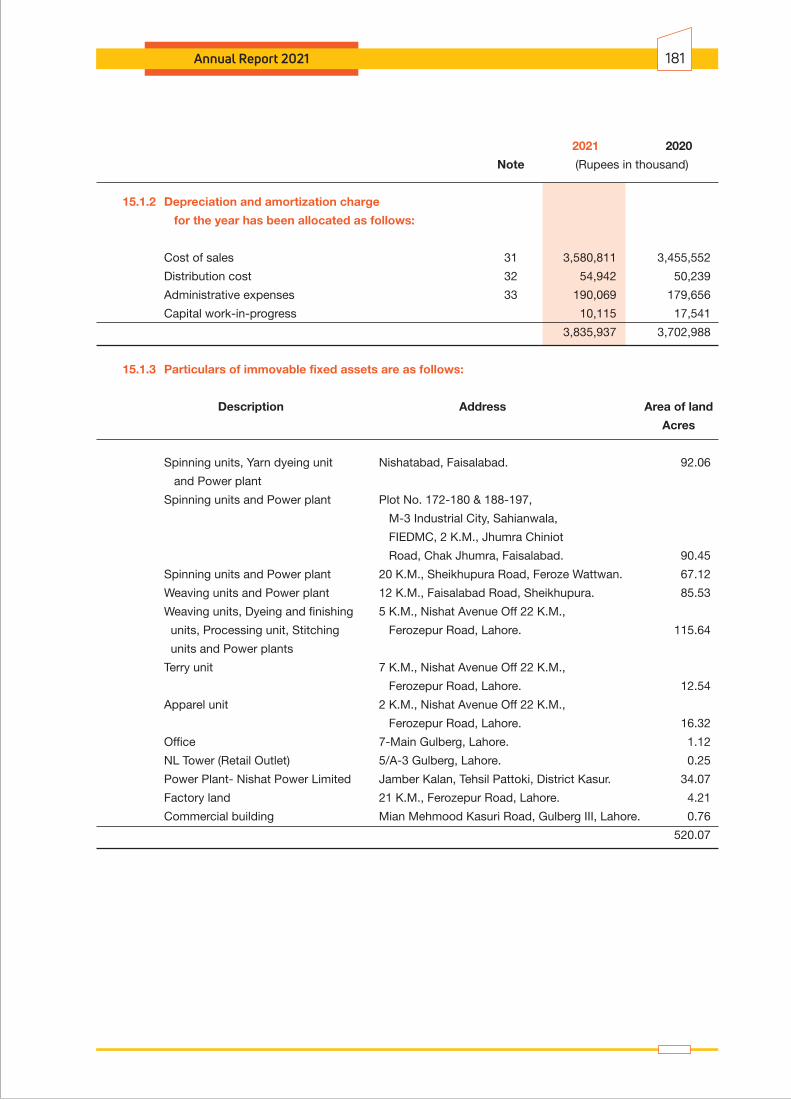
2021 2020
Note (Rupees in thousand)
15.1.2 Depreciation and amortization charge
for the year has been allocated as follows:
Cost of sales 31 3,580,811 3,455,552
Distribution cost 32 54,942 50,239
Administrative expenses 33 190,069 179,656
Capital work-in-progress 10,115 17,541
3,835,937 3,702,988
15.1.3 Particulars of immovable fixed assets are as follows:
Description Address Area of land
Acres
Spinning units, Yarn dyeing unit Nishatabad, Faisalabad. 92.06
and Power plant
Spinning units and Power plant Plot No. 172-180 & 188-197,
M-3 Industrial City, Sahianwala,
FIEDMC, 2 K.M., Jhumra Chiniot
Road, Chak Jhumra, Faisalabad. 90.45
Spinning units and Power plant 20 K.M., Sheikhupura Road, Feroze Wattwan. 67.12
Weaving units and Power plant 12 K.M., Faisalabad Road, Sheikhupura. 85.53
Weaving units, Dyeing and finishing 5 K.M., Nishat Avenue Off 22 K.M.,
units, Processing unit, Stitching Ferozepur Road, Lahore. 115.64
units and Power plants
Terry unit 7 K.M., Nishat Avenue Off 22 K.M.,
Ferozepur Road, Lahore. 12.54
Apparel unit 2 K.M., Nishat Avenue Off 22 K.M.,
Ferozepur Road, Lahore. 16.32
Office 7-Main Gulberg, Lahore. 1.12
NL Tower (Retail Outlet) 5/A-3 Gulberg, Lahore. 0.25
Power Plant- Nishat Power Limited Jamber Kalan, Tehsil Pattoki, District Kasur. 34.07
Factory land 21 K.M., Ferozepur Road, Lahore. 4.21
Commercial building Mian Mehmood Kasuri Road, Gulberg III, Lahore. 0.76
520.07
Annual Report 2021 181
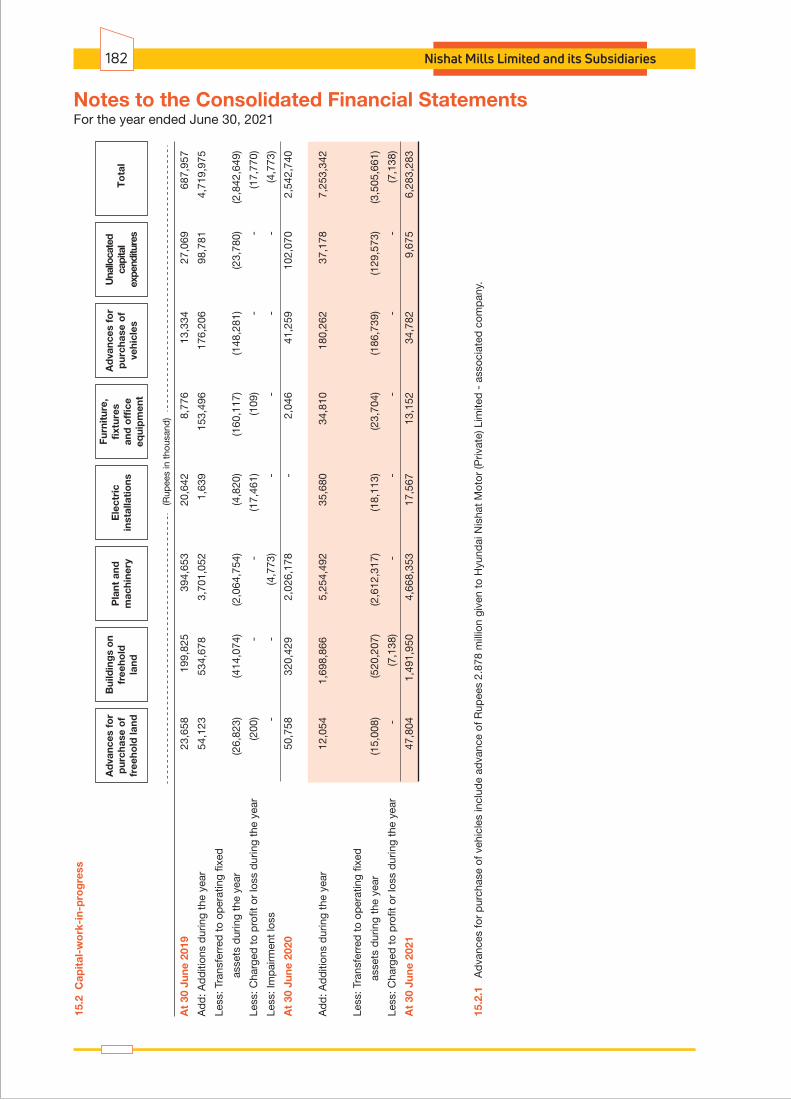
For the year ended June 30, 2021Notes to the Consolidated Financial Statements
Nishat Mills Limited and its Subsidiaries182
Furn
itur
e,fix
ture
san
d o
ffic
eeq
uip
men
t
Ad
vanc
es f
or
pur
chas
e o
ffr
eeho
ld la
nd
Bui
ldin
gs
on
free
hold
land
Pla
nt a
ndm
achi
nery
Ele
ctri
cin
stal
lati
ons
Ad
vanc
es f
or
pur
chas
e o
fve
hicl
es
Una
lloca
ted
capi
tal
expe
nditu
res
To
tal
15.2
Cap
ital
-wo
rk-i
n-p
rog
ress
(Rup
ees
in t
hous
and
)
At
30 J
une
2019
23
,658
19
9,82
5 39
4,65
3 20
,642
8,
776
13,3
34
27,0
69
687,
957
Ad
d: A
dd
ition
s d
urin
g th
e ye
ar
54,
123
534,
678
3
,701
,052
1,
639
153,
496
176,
206
98,7
81
4,71
9,97
5
Less
: Tra
nsfe
rred
to
oper
atin
g fix
ed
ass
ets
dur
ing
the
year
(2
6,82
3)
(414
,074
) (2
,064
,754
) (4
,820
) (1
60,1
17)
(148
,281
) (2
3,78
0)
(2,8
42,6
49)
Less
: Cha
rged
to
pro
fit o
r lo
ss d
urin
g th
e ye
ar
(200
) -
-
(1
7,46
1)
(109
) -
-
(17,
770)
Less
: Im
pai
rmen
t lo
ss
-
-
(4,7
73)
-
- -
- (4
,773
)
At
30 J
une
2020
5
0,75
8 32
0,42
9
2,0
26,1
78
- 2,
046
41,2
59
102,
070
2,54
2,74
0
Ad
d: A
dd
ition
s d
urin
g th
e ye
ar
12,
054
1,69
8,86
6
5,2
54,4
92
35,6
80
34,8
10
180,
262
37,1
78
7,25
3,34
2
Less
: Tra
nsfe
rred
to
oper
atin
g fix
ed
asse
ts d
urin
g th
e ye
ar
(15,
008)
(5
20,2
07)
(2,6
12,3
17)
(18,
113)
(2
3,70
4)
(186
,739
) (1
29,5
73)
(3,5
05,6
61)
Less
: Cha
rged
to
pro
fit o
r lo
ss d
urin
g th
e ye
ar
-
(7,1
38)
-
-
- -
- (7
,138
)
At
30 J
une
2021
4
7,80
4 1,
491,
950
4,66
8,35
3 17
,567
13
,152
34
,782
9,
675
6,28
3,28
3
15.2
.1
Ad
vanc
es fo
r p
urch
ase
of v
ehic
les
incl
ude
adva
nce
of R
upee
s 2.
878
mill
ion
give
n to
Hyu
ndai
Nis
hat
Mot
or (P
rivat
e) L
imite
d -
ass
ocia
ted
com
pan
y.

2021 2020
(Rupees in thousand)
15.3 Major spare parts and standby equipment
Opening balance 105,246 174,201 Add: Additions during the year 17,808 37,502 123,054 211,703 Less: Transferred during the year (18,657) (106,457) Closing balance 104,397 105,246
16 INTANGIBLE ASSETS
FRANCHISE COMPUTER FEE SOFTWARE (Rupees in thousand)
At 30 June 2019
Cost 9,834 25,178 35,012
Accumulated amortization (9,834) (21,439) (31,273)
Net book value - 3,739 3,739
Year ended 30 June 2020
Opening net book value - 3,739 3,739
Amortization charged - (2,480) (2,480)
Closing net book value - 1,259 1,259
At 30 June 2020
Cost 9,834 25,178 35,012
Accumulated amortization (9,834) (23,919) (33,753)
Net book value - 1,259 1,259
Year ended 30 June 2021
Opening net book value - 1,259 1,259
Amortization charged - (1,259) (1,259)
Closing net book value - - -
At 30 June 2021
Cost 9,834 25,178 35,012
Accumulated amortization (9,834) (25,178) (35,012)
Net book value - - -
Annual amortization rate (%) 20 20
Total
Annual Report 2021 183
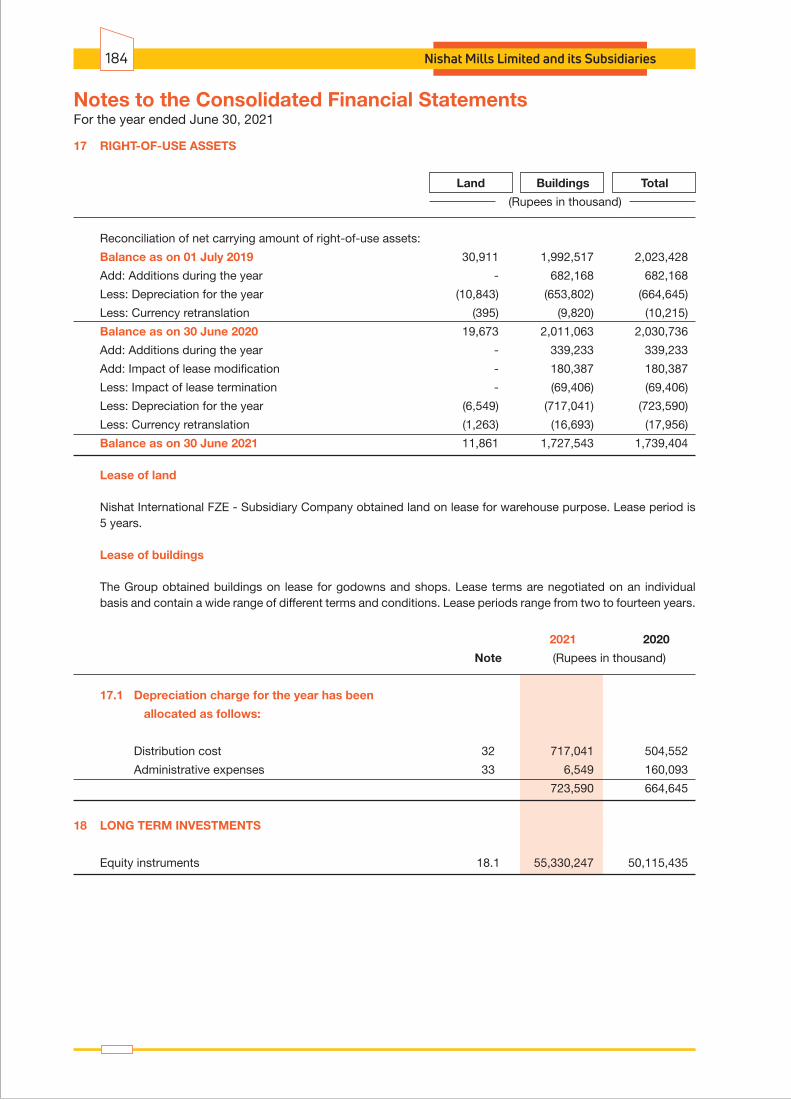
17 RIGHT-OF-USE ASSETS
Land Buildings Total
(Rupees in thousand)
Reconciliation of net carrying amount of right-of-use assets:
Balance as on 01 July 2019 30,911 1,992,517 2,023,428
Add: Additions during the year - 682,168 682,168
Less: Depreciation for the year (10,843) (653,802) (664,645)
Less: Currency retranslation (395) (9,820) (10,215)
Balance as on 30 June 2020 19,673 2,011,063 2,030,736
Add: Additions during the year - 339,233 339,233
Add: Impact of lease modification - 180,387 180,387
Less: Impact of lease termination - (69,406) (69,406)
Less: Depreciation for the year (6,549) (717,041) (723,590)
Less: Currency retranslation (1,263) (16,693) (17,956)
Balance as on 30 June 2021 11,861 1,727,543 1,739,404
Lease of land
Nishat International FZE - Subsidiary Company obtained land on lease for warehouse purpose. Lease period is 5 years.
Lease of buildings
The Group obtained buildings on lease for godowns and shops. Lease terms are negotiated on an individual basis and contain a wide range of different terms and conditions. Lease periods range from two to fourteen years.
2021 2020
Note (Rupees in thousand)
17.1 Depreciation charge for the year has been
allocated as follows:
Distribution cost 32 717,041 504,552
Administrative expenses 33 6,549 160,093
723,590 664,645
18 LONG TERM INVESTMENTS
Equity instruments 18.1 55,330,247 50,115,435
For the year ended June 30, 2021Notes to the Consolidated Financial Statements
Nishat Mills Limited and its Subsidiaries184
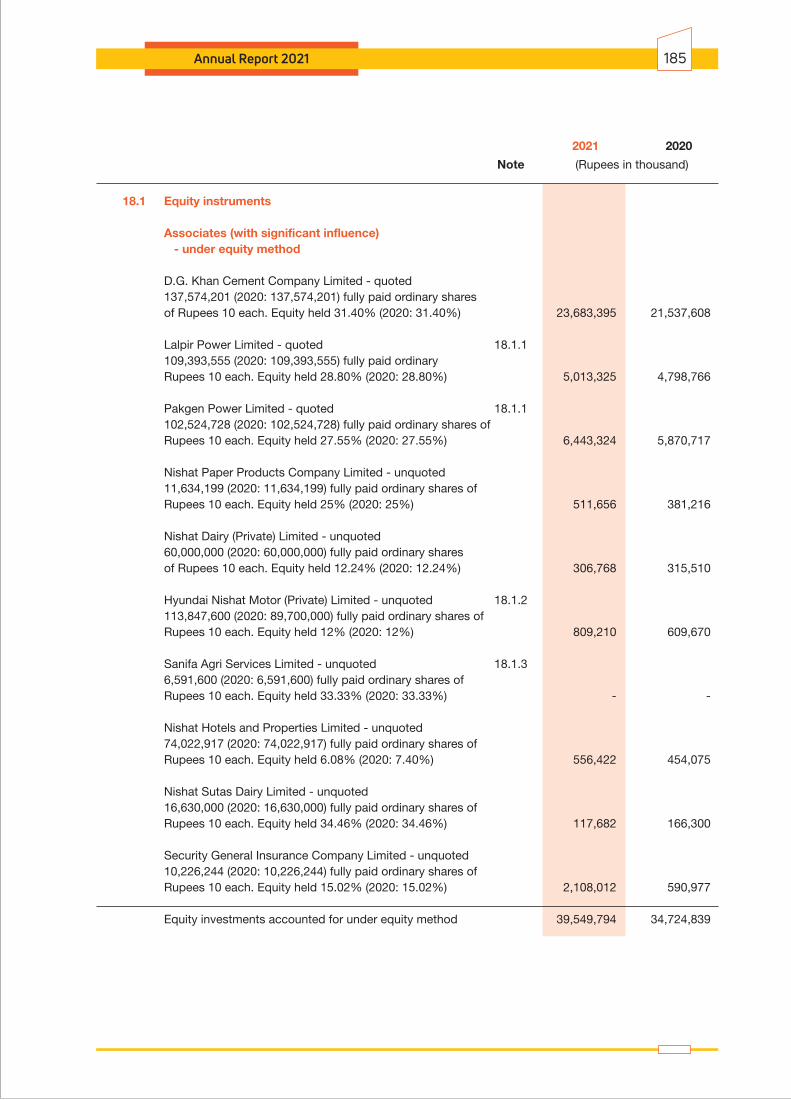
2021 2020
Note (Rupees in thousand)
18.1 Equity instruments
Associates (with significant influence) - under equity method
D.G. Khan Cement Company Limited - quoted 137,574,201 (2020: 137,574,201) fully paid ordinary shares of Rupees 10 each. Equity held 31.40% (2020: 31.40%) 23,683,395 21,537,608
Lalpir Power Limited - quoted 18.1.1 109,393,555 (2020: 109,393,555) fully paid ordinary Rupees 10 each. Equity held 28.80% (2020: 28.80%) 5,013,325 4,798,766
Pakgen Power Limited - quoted 18.1.1 102,524,728 (2020: 102,524,728) fully paid ordinary shares of Rupees 10 each. Equity held 27.55% (2020: 27.55%) 6,443,324 5,870,717
Nishat Paper Products Company Limited - unquoted 11,634,199 (2020: 11,634,199) fully paid ordinary shares of Rupees 10 each. Equity held 25% (2020: 25%) 511,656 381,216
Nishat Dairy (Private) Limited - unquoted 60,000,000 (2020: 60,000,000) fully paid ordinary shares of Rupees 10 each. Equity held 12.24% (2020: 12.24%) 306,768 315,510
Hyundai Nishat Motor (Private) Limited - unquoted 18.1.2 113,847,600 (2020: 89,700,000) fully paid ordinary shares of Rupees 10 each. Equity held 12% (2020: 12%) 809,210 609,670
Sanifa Agri Services Limited - unquoted 18.1.3 6,591,600 (2020: 6,591,600) fully paid ordinary shares of Rupees 10 each. Equity held 33.33% (2020: 33.33%) - -
Nishat Hotels and Properties Limited - unquoted 74,022,917 (2020: 74,022,917) fully paid ordinary shares of Rupees 10 each. Equity held 6.08% (2020: 7.40%) 556,422 454,075
Nishat Sutas Dairy Limited - unquoted 16,630,000 (2020: 16,630,000) fully paid ordinary shares of Rupees 10 each. Equity held 34.46% (2020: 34.46%) 117,682 166,300
Security General Insurance Company Limited - unquoted 10,226,244 (2020: 10,226,244) fully paid ordinary shares of Rupees 10 each. Equity held 15.02% (2020: 15.02%) 2,108,012 590,977
Equity investments accounted for under equity method 39,549,794 34,724,839
Annual Report 2021 185

2021 2020 (Rupees in thousand)
Equity instruments
Fair value through other comprehensive income
Associated companies (Others)
Adamjee Insurance Company Limited - quoted
102,809 (2020: 102,809) fully paid ordinary shares of
Rupees 10 each. Equity held 0.03% (2020: 0.03%) 2,116 2,116
MCB Bank Limited - quoted
88,015,291 (2020: 88,015,291) fully paid ordinary shares of
Rupees 10 each. Equity held 7.43% (2020: 7.43%) 12,851,084 12,851,084
12,853,200 12,853,200
Related party
Nishat (Chunian) Limited - quoted
32,689,338 (2020: 32,689,338) fully paid ordinary shares of
Rupees 10 each. Equity held 13.61% (2020: 13.61%) 378,955 378,955
Others
Alhamra Islamic Stock Fund - quoted
1,121,410 (2020: 1,121,410) units. 3,135 3,135
Pakistan Petroleum Limited - quoted
599,998 (2020: 599,998) fully paid ordinary shares of
Rupees 10 each. Equity held 0.02% (2020: 0.02%) 64,409 64,409
67,544 67,544
13,299,699 13,299,699
Add: Fair value adjustment 2,480,754 2,090,897
Equity investments classified at fair value through other
comprehensive income 15,780,453 15,390,596
55,330,247 50,115,435
18.1.1 Investments in Lalpir Power Limited and Pakgen Power Limited include 550 and 500 shares respectively, held in the name of ex- nominee director of the Holding Company.
18.1.2 Investments in Hyundai Nishat Motor (Private) Limited include 4 shares held in the name of nominee directors of the Holding Company.
18.1.3 This includes 1,600 (2020: 1,600) shares held in the name of chief financial officer of the Holding Company and senior officer of the Holding Company.
For the year ended June 30, 2021Notes to the Consolidated Financial Statements
Nishat Mills Limited and its Subsidiaries186

Nam
e o
f as
soci
ated
co
mp
any
No
teC
ount
ry o
fin
corp
orat
ion
% o
f o
wn
ersh
ipin
tere
stM
easu
rem
ent
met
ho
dQ
uo
ted
fai
r va
lue
Car
ryin
g a
mo
un
t
2021
2020
2021
2020
2020
2021
(Rup
ees
in t
hous
and
)
D
.G. K
han
Cem
ent C
ompa
ny L
imite
d 18
.4.1
P
akis
tan
31.4
0%
31.4
0%
Equi
ty m
etho
d 1,
622,
750
11,7
39,2
07
23,6
83,3
95
21,5
37,6
08
Nis
hat P
aper
Pro
duct
s C
ompa
ny L
imite
d 18
.4.2
P
akis
tan
25.0
0%
25.0
0%
Equi
ty m
etho
d -*
-*
5
11,6
56
381,
216
N
isha
t Dai
ry (P
rivat
e) L
imite
d 18
.4.3
P
akis
tan
12.2
4%
12.2
4%
Equi
ty m
etho
d -*
-
*
306,
768
315,
510
La
lpir
Pow
er L
imite
d 18
.4.4
P
akis
tan
28.8
0%
28.8
0%
Equi
ty m
etho
d 1,
953,
769
1,27
6,62
3 5,
013,
325
4,
798,
766
P
akge
n P
ower
Lim
ited
18.4
.5
Pak
ista
n 27
.55%
27
.55%
Eq
uity
met
hod
2,5
28,2
60
1,23
1,32
2 6,
443,
324
5,87
0,71
7
Nis
hat E
nerg
y Li
mite
d 18
.4.6
P
akis
tan
37.7
5%
37.7
5%
Equi
ty m
etho
d -
* -
*
- -
N
isha
t Hot
els
and
Pro
perti
es L
imite
d 18
.4.7
P
akis
tan
6.08
%
7.40
%
Equi
ty m
etho
d -*
-
*
556,
422
454
,075
Hyu
ndai
Nis
hat M
otor
(Priv
ate)
Lim
ited
18.4
.8
Pak
ista
n 12
.00%
12
.00%
Eq
uity
met
hod
-*
-*
809,
210
609,
670
S
anifa
Agr
i Ser
vice
s Li
mite
d 18
.4.9
P
akis
tan
33.3
3%
33.3
3%
Equi
ty m
etho
d -*
-*
-
-
S
ecur
ity G
ener
al In
sura
nce
Lim
ited
18.4
.10
Pak
ista
n 15
.02%
15
.02%
Eq
uity
met
hod
-*
-*
2,10
8,01
2 59
0,97
7
Nis
hat S
utas
Dai
ry L
imite
d 18
.4.1
1 P
akis
tan
34.4
6%
34.4
6%
Equi
ty m
etho
d -*
-*
11
7,68
2 16
6,30
0
18.4
.1
D.G
. Kha
n C
emen
t Com
pany
Lim
ited
is e
ngag
ed in
pro
duct
ion
and
sale
of c
linke
r, or
dina
ry p
ortla
nd a
nd s
ulph
ate
resi
stan
t cem
ent.
18
.4.2
N
isha
t Pap
er P
rodu
cts
Com
pany
Lim
ited
is e
ngag
ed in
the
man
ufac
ture
and
sal
e of
pap
er p
rodu
cts
and
pack
agin
g m
ater
ial.
18
.4.3
N
isha
t Dai
ry (P
rivat
e) L
imite
d is
eng
aged
in th
e bu
sine
ss o
f pro
duct
ion
of ra
w m
ilk.
18
.4.4
Th
e pr
inci
ple
activ
ities
of L
alpi
r Pow
er L
imite
d ar
e to
ow
n, o
pera
te a
nd m
aint
ain
an o
il fir
ed p
ower
sta
tion
havi
ng g
ross
cap
acity
of 3
62 M
W in
Meh
moo
d K
ot, M
uzaf
farg
arh,
Pun
jab,
Pak
ista
n.
18.4
.5
The
prin
cipl
e ac
tiviti
es o
f Pak
gen
Pow
er L
imite
d ar
e to
ow
n, o
pera
te a
nd m
aint
ain
an o
il fir
ed p
ower
sta
tion
havi
ng g
ross
cap
acity
of 3
65 M
W in
Meh
moo
d K
ot, M
uzaf
farg
arh,
Pun
jab,
Pak
ista
n.
18
.4.6
Th
e pr
inci
ple
activ
ity o
f Nis
hat E
nerg
y Li
mite
d is
to b
uild
, ow
n, o
pera
te a
nd m
aint
ain
coal
pow
er s
tatio
n ha
ving
gro
ss c
apac
ity o
f 660
MW
with
net
est
imat
ed g
ener
atio
n ca
paci
ty o
f 600
MW
at M
ouza
Am
eer P
ur, R
ahim
Yar
Kha
n, P
unja
b, P
akis
tan.
18
.4.7
Th
e pr
inci
ple
activ
ity o
f Nis
hat H
otel
s an
d P
rope
rties
Lim
ited
is to
est
ablis
h an
d m
anag
e sh
oppi
ng m
all a
nd h
otel
ope
ratio
ns in
Pak
ista
n.
18
.4.8
Th
e pr
inci
ple
activ
ity o
f Hyu
ndai
Nis
hat M
otor
(Priv
ate)
Lim
ited
is to
impo
rt, a
ssem
bly
and
dist
ribut
ion
of b
oth
pass
enge
r and
com
mer
cial
cat
egor
y au
tom
obile
s.
18
.4.9
Th
e pr
inci
ple
activ
ity o
f San
ifa A
gri S
ervi
ces
Lim
ited
is to
pro
duce
and
mar
ket h
igh
qual
ity c
otto
n se
eds
in P
akis
tan.
18.4
.10
The
prin
cipl
e ac
tivity
of S
ecur
ity G
ener
al In
sura
nce
Com
pany
Lim
ited
is to
pro
vide
gen
eral
insu
ranc
e se
rvic
es in
sph
eres
of f
ire, m
arin
e, m
otor
and
mis
cella
neou
s.
18.4
.11
The
prin
cipl
e ac
tivity
of N
isha
t Sut
as D
airy
Lim
ited
is to
man
ufac
ture
, pro
duce
, dis
tribu
te, m
arke
t, ac
quire
, pro
cess
, pac
kage
, sel
l, re
sell,
impo
rt, e
xpor
t, pr
eser
ve, d
eep
freez
e an
d ot
herw
ise
deal
in a
ll ty
pes
and
kind
s of
milk
and
dai
ry b
ased
pro
duct
s.
*N
o qu
oted
pric
e av
aila
ble.
D. G
. Kha
n C
emen
tCo
mpa
ny L
imite
d
18.2
Re
conc
iliat
ion
of in
vest
men
ts in
ass
ocia
tes
unde
r equ
ity m
etho
d:
Nish
at P
aper
Pro
duct
sCo
mpa
ny L
imite
dNi
shat
Dai
ry(P
rivat
e) L
imite
dLa
lpir
Pow
er L
imite
dPa
kgen
Pow
er L
imite
dNi
shat
Ene
rgy
Lim
ited
Secu
rity G
ener
al In
sura
nce
Com
pany
Lim
ited
Sani
fa A
gri
Serv
ices
Lim
ited
Nish
at S
utas
Dairy
Lim
ited
Nish
at H
otel
s an
dPr
oper
ties
Lim
ited
2021
2020
2020
2020
2020
2020
2020
2020
2020
2021
2021
2021
2021
2021
2021
Hyun
dai N
isha
t Mot
or(P
rivat
e) L
imite
d
2020
2021
2021
2021
2020
(Rup
ees
in th
ousa
nd)
2021
2020
Tota
l
2021
2020
Co
st
3,41
8,14
5 3,
418,
145
116,
342
116,
342
600,
000
600
,000
1,
640,
306
1,64
0,30
6 1,
272,
194
1,27
2,19
4 5,
000
5,00
0 74
0,22
9 74
0,22
9 1,
187,
899
897,
000
65,
916
65,9
16
1,97
7,02
8 5
90,9
77
166,
300
166,
300
11,1
89,3
59
9,51
2,40
9
Sh
are o
f pos
t acq
uisiti
on re
serv
es:
As
at 0
1 Ju
ly 18
,119
,463
19
,465
,168
26
4,87
4 23
4,77
3
(284
,490
) (2
69,8
74)
3,15
8,46
0 2,
346,
626
4,
598,
523
3,
537,
554
(3,3
14)
(3,3
14)
(286
,154
) (1
58,8
50)
(287
,330
) (9
6,12
2)
(65,
916)
(3
4,85
6)
- -
- -
25,2
14,1
16
25,0
21,1
05
Shar
e of
pro
fit / (
loss)
afte
r inc
ome
tax
1,16
8,48
0 (6
77,8
20)
131,
247
32,6
69
(8,7
42)
(14,
616)
57
0,01
4 81
4,51
8 90
4,09
1 1,
058,
913
- -
18,6
87
(127
,304
) (9
1,35
9)
(191
,208
) -
(31,
060)
16
2,68
4 -
(48,
618)
-
2,80
6,48
4 8
64,0
92
Prior
year
adju
stm
ents
-
- -
- -
- -
- -
- -
- 42
,038
-
- -
- -
- -
- -
42,0
38
-
Adjus
tmen
t due
to d
eem
ed d
ispos
al of
equit
y acc
ount
ed in
vest
ee
- -
- -
- -
- -
- -
- -
41,6
22
- -
- -
- -
- -
- 41
,622
-
Sh
are
of o
ther
com
preh
ensiv
e inc
ome
/ (los
s) 97
7,30
7 (5
30,3
11)
(807
) (2
,568
) -
- 72
(2
,684
) 1,
720
2,05
6 -
- -
- -
- -
- 19
,431
-
- -
997,
723
(533
,507
)
Divid
end
rece
ived
- (1
37,5
74)
- -
- -
(355
,527
) -
(333
,204
) -
- -
- -
- -
- -
(51,
131)
-
- -
(739
,862
) (1
37,5
74)
As
at 3
0 Ju
ne
2,1
45,7
87
(1,3
45,7
05)
130,
440
30,1
01
(8,7
42)
(14,
616)
2
14,5
59
811,
834
572,
607
1,06
0,96
9 -
- 1
02,3
47
(127
,304
) (9
1,35
9)
(191
,208
) -
(31,
060)
13
0,98
4 -
(48,
618)
-
3,14
8,00
5 19
3,01
1
20
,265
,250
1
8,11
9,46
3 39
5,31
4 26
4,87
4 (2
93,2
32)
(284
,490
) 3,
373,
019
3,
158,
460
5,17
1,13
0 4,
598,
523
(3,3
14)
(3,3
14)
(183
,807
) (2
86,1
54)
(378
,689
) (2
87,3
30)
(65,
916)
(6
5,91
6)
130,
984
- (4
8,61
8)
- 28
,362
,121
25
,214
,116
Im
pairm
ent lo
ss
- -
- -
- -
- -
- -
(1,6
86)
(1,6
86)
- -
- -
- -
- -
- -
(1,6
86)
(1,6
86)
As
at 3
0 Ju
ne
23,
683,
395
21,5
37,6
08
511,
656
381,
216
306,
768
315,
510
5,01
3,32
5 4,
798,
766
6,44
3,32
4 5,
870,
717
- -
556,
422
454,
075
809,
210
609,
670
- -
2,10
8,01
2 59
0,97
7 11
7,68
2 16
6,30
0 39
,549
,794
34
,724
,839
18.2.
1 Su
mmar
ized s
tatem
ent o
f fina
ncial
posit
ion
Cu
rrent
ass
ets
36,8
51,2
64
34,0
95,1
00
4,37
1,17
8 3,
598,
217
658,
496
612,
409
19,9
43,0
86
21,3
79,6
14
20,6
92,1
61
25,2
52,3
02
47
47
5,30
8,08
5 2,
300,
727
12,7
92,1
45
5,22
0,99
3 18
8,16
2 44
,253
-
- 28
0,37
6
-
Non-
curre
nt a
sset
s 10
1,04
3,43
3 95
,456
,434
1,
571,
757
1,58
5,16
1 2,
664,
456
2,66
7,95
8 6,
329,
438
7,
439,
204
5,53
0,19
9 6,
391,
553
- -
22,4
63,8
04
22,5
08,9
44
15,1
27,4
80
12,9
39,9
43
124,
376
131,
343
- -
303,
514
-
Tota
l ass
ets
137,
894,
697
129,
551,
534
5,94
2,93
5
5,18
3,37
8 3,
322,
952
3,2
80,3
67
26,2
72,5
24
28,8
18,8
18
26,2
22,3
60
31,6
43,8
55
47
47
27,
771,
889
24,8
09,6
71
27,9
19,6
25
18,
160,
936
312,
538
175,
596
28,1
26,7
27
- 58
3,89
0 -
Cu
rrent
liabil
ities
40,2
95,5
20
37,6
24,2
57
3,12
2,72
8 2,
778,
731
685,
045
701,
991
8,81
8,47
2 12
,090
,882
2,
808,
167
10,2
85,9
81
225
150
3,40
9,52
6 5,
373,
571
11,3
27,0
01
3,99
9,72
7 36
8,48
8
150,
145
- -
6,13
6 -
No
n-cu
rrent
liabil
ities
24,1
21,3
04
25,2
83,1
20
774,
345
880,
543
152,
352
21,2
55
46,6
88
65,5
64
25,0
42
47,3
39
- -
15,3
08,0
86
13,3
84,9
15
9,84
9,21
1 8,
668,
771
19,8
61
26,7
57
- -
- -
To
tal li
abilit
ies
64,4
16,8
24
62,
907,
377
3,89
7,07
3 3,
659,
274
837,
397
723,
246
8,86
5,16
0 12
,156
,446
2,
833,
209
10,3
33,3
20
225
150
18,7
17,6
12
18,7
58,4
86
21,1
76,2
12
12,
668,
498
388,
349
176,
902
14,
092,
026
- 6,
136
-
Shar
e de
posit
mon
ey
- -
- -
- -
- -
- -
- -
- -
- -
- -
- -
236,
238
-
Net a
ssets
73
,477
,873
66
,644
,157
2,
045,
862
1,52
4,10
4 2
,485
,555
2,
557,
121
17,4
07,3
64
16,6
62,3
72
23,3
89,1
51
21,3
10,5
35
(178
) (1
03)
9,05
4,27
7 6,
051,
185
6,74
3,41
3 5,
492,
438
(75,
811)
(1
,306
) 14
,034
,701
-
341,
516
-
Re
conc
iliatio
n to c
arry
ing am
ount
s:
As
at 0
1 Ju
ly
66,6
44,1
57
70,9
29,8
23
1,52
4,10
4 1,
403,
702
2,55
7,12
1 2,
676,
531
16,6
62,3
72
13,8
43,5
03
21,3
10,5
35
17,4
59,4
66
(103
) (2
8)
6,05
1,18
5 7,
771,
509
5,49
2,43
8 5,
110,
838
(1,3
06)
64,6
78
13,1
62,5
25
- 42
8,27
8 -
Pr
ior ye
ar a
djust
men
ts
- (1
,408
) -
- (1
41)
- -
- -
- -
- 1,
750,
645
(241
,551
) -
- -
- -
- -
-
Trans
actio
ns w
ith o
wner
s in t
heir c
apac
ity as
own
ers
- -
- -
- -
- -
- -
- -
1,00
0,00
0 -
2,01
2,30
0 1,
975,
000
- 28
,500
-
- -
-
Prof
it / (lo
ss) a
fter i
ncom
e ta
x 3,
721,
273
(2,1
58,6
61)
524,
987
130,
675
(71,
425)
(1
19,4
10)
1,9
79,2
18
2,82
8,18
7 3,
281,
639
3,84
3,60
6 (7
5)
(75)
25
2,44
7 (1
,478
,773
) (7
61,3
25)
(1,5
93,4
00)
(74,
505)
(9
4,48
4)
1,08
3,11
5 -
(86,
762)
-
Ot
her c
ompr
ehen
sive
incom
e / (
loss)
3,
112,
443
(1,6
87,4
78)
(3,2
29)
(10,
273)
-
- 25
0 (9
,318
) 6,
243
7,46
3 -
- -
- -
- -
- 12
9,37
3 -
- -
Di
viden
d pa
id -
(438
,119
) -
- -
- (1
,234
,476
) -
(1,2
09,2
66)
- -
- -
- -
- -
- (3
40,3
12)
- -
-
As
at 3
0 Ju
ne
73,4
77,8
73
66,6
44,1
57
2,04
5,86
2 1,
524,
104
2,48
5,55
5 2,
557,
121
17,4
07,3
64
16,6
62,3
72
23,
389,
151
21,3
10,5
35
(178
) (1
03)
9,05
4,27
7 6,
051,
185
6,74
3,41
3 5
,492
,438
(7
5,81
1)
(1,3
06)
14,0
34,7
01
- 34
1,51
6 -
Gr
oup'
s sha
re (%
) 31
.40%
31
.40%
25
.00%
25
.00%
12
.24%
12
.24%
28
.80%
28
.80%
27
.55%
27
.55%
37
.75%
37
.75%
6.
08%
7.
40%
12
.00%
12
.00%
33
.33%
33
.33%
15
.02%
15
.02%
34
.46%
-
Gr
oup'
s sha
re
23,0
72,0
03
20,9
26,2
16
511
,467
38
1,02
7 30
4,25
0
312,
992
5,01
3,32
5 4,
798,
766
6,
443,
324
5,87
0,71
7 -
- 55
0,14
2 44
7,79
6 80
9,21
0 65
9,09
3 -
- 2,
108,
012
- 11
7,68
2 -
Go
odwi
ll 6
11,3
92
611,
392
189
189
2,51
8 2,
518
- -
- -
- -
6,28
0 6,
279
- (4
9,42
3)
- -
- -
- -
Ca
rrying
am
ount
23
,683
,395
21
,537
,608
51
1,65
6 38
1,21
6 30
6,76
8 3
15,5
10
5,01
3,32
5 4,
798,
766
6,44
3,32
4 5,
870,
717
- -
556,
422
454,
075
809,
210
609,
670
- -
2,10
8,01
2 -
117,
682
-
18.2.
2 Su
mmar
ized s
tatem
ent o
f com
preh
ensiv
e inc
ome
Re
venu
e 4
5,10
7,69
0 38
,033
,124
3
,979
,518
4,
273,
014
2,02
6,53
8 1,
734,
733
15,1
06,5
83
10,6
73,9
57
13,4
75,0
15
10,4
44,9
56
- -
6,07
5,01
6 3,
855,
646
21,8
04,9
42
997,
604
256
,211
35
1,01
1 86
7,72
1 -
- -
Pr
ofit /
(loss
) for
the
year
3,
721,
273
(2,1
58,6
61)
524,
987
130,
675
(7
1,42
5)
(119
,410
) 1,
979,
218
2,82
8,18
7 3,
281,
639
3,84
3,60
6 (7
5)
(75)
25
2,44
7 (1
,478
,773
) (7
61,3
25)
(1,5
93,4
00)
(74,
505)
(9
4,48
4)
1,08
3,11
5 -
(86,
762)
-
Ot
her c
ompr
ehen
sive
incom
e / (
loss)
3,11
2,44
3 (1
,687
,478
) (3
,229
) (1
0,27
3)
- -
250
(9,3
18)
6,24
3 7,
463
- -
- -
- -
- -
129,
373
- -
-
Tota
l com
preh
ensiv
e inc
ome
/ (los
s)
6,83
3,71
6 (3
,846
,139
) 52
1,75
8 12
0,40
2 (7
1,42
5)
(119
,410
) 1,
979,
468
2,81
8,86
9 3,
287,
882
3,85
1,06
9 (7
5)
(75)
25
2,44
7 (1
,478
,773
) (7
61,3
25)
(1,5
93,4
00)
(74,
505)
(9
4,48
4)
1,21
2,48
8 -
(86,
762)
-
Di
viden
d re
ceive
d fro
m a
ssoc
iates
-
137,
574
- -
- -
355,
527
- 33
3,20
4 -
- -
- -
- -
- -
51,1
31
- -
-
18.3
Adam
jee In
sura
nce
Com
pany
Lim
ited
and
MCB
Ban
k Lim
ited
are
asso
ciate
d co
mpa
nies d
ue to
com
mon
dire
ctor
ship.
18.4
Inter
ests
in as
socia
tes
Annual Report 2021 187

2021 2020
Note (Rupees in thousand)
19 LONG TERM LOANS
Considered good: Executives - secured 19.1 & 19.2 441,035 253,434 Other employees - secured 19.2 270,603 247,045 711,638 500,479
Less: Current portion shown under current assets 23 Executives 97,851 63,365 Other employees 81,246 75,479 179,097 138,844 532,541 361,635
19.1 Maximum aggregate balance due from executives at the end of any month during the year was Rupees 445.436 million (2020: Rupees 254.502 million).
19.2 These represent house construction and motor vehicle loans given to executives and employees of the Holding Company, Nishat Linen (Private) Limited - Subsidiary Company and Nishat Power Limited - Subsidiary Company and are secured against balance to the credit of employee in the provident fund trusts of the respective Group companies and against registration of cars in the joint name of the respective Group companies and the employee. These are recoverable in equal monthly installments. Interest charged during the year range from 0% to 4% (2020: 0% to 4%) per annum on the balance outstandings.
19.3 The fair value adjustment in accordance with the requirements of IFRS 9 'Financial Instruments' arising in respect of staff loans is not considered material and hence not recognized.
20 STORES, SPARE PARTS AND LOOSE TOOLS
2021 2020
Note (Rupees in thousand)
Stores 20.1 1,798,256 1,599,830 Spare parts 1,497,981 1,369,757 Loose tools 15,618 14,171 3,311,855 2,983,758 Less: Provision for slow moving, obsolete and damaged store items 20.2 (4,141) (4,218) 3,307,714 2,979,540
20.1 This includes stores in transit of Rupees 276.755 million (2020: Rupees 215.881 million).
20.2 Provision for slow moving, obsolete and damaged store items
2021 2020
Note (Rupees in thousand)
Balance as on 01 July 4,218 4,224 Less: Provision reversed during the year 35 (77) (6) Balance as on 30 June 4,141 4,218
For the year ended June 30, 2021Notes to the Consolidated Financial Statements
Nishat Mills Limited and its Subsidiaries188
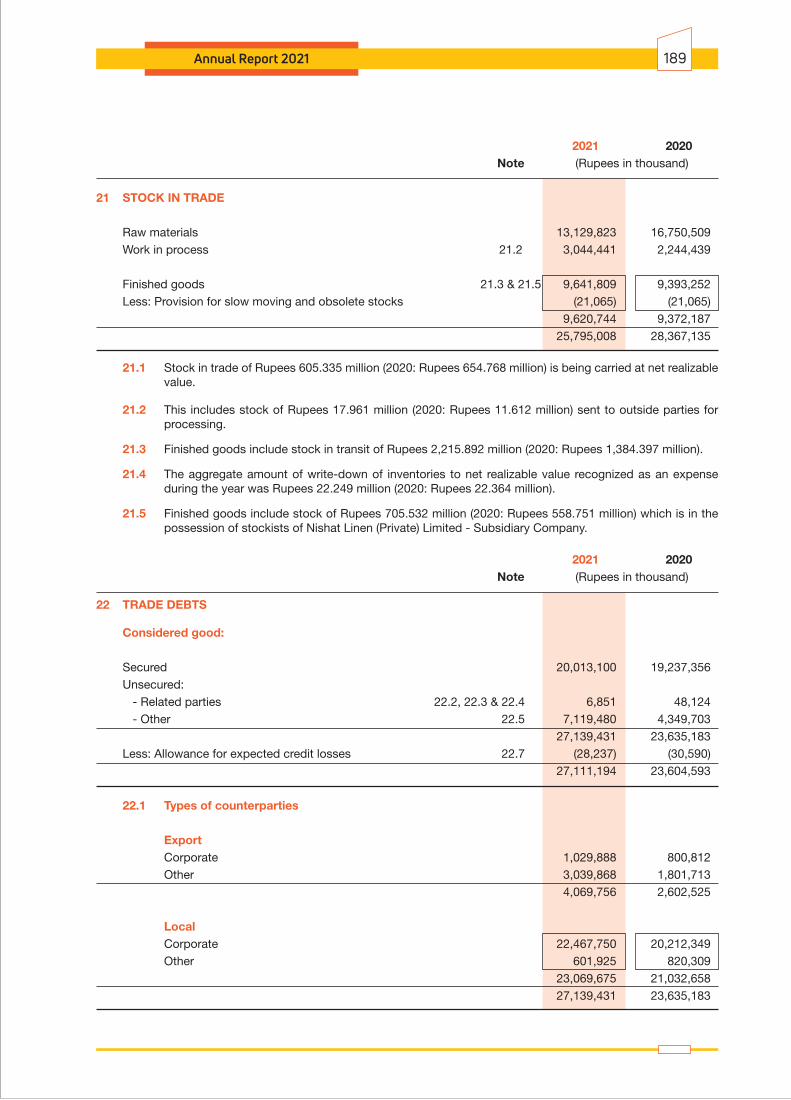
Annual Report 2021 189
2021 2020 Note (Rupees in thousand)
21 STOCK IN TRADE
Raw materials 13,129,823 16,750,509 Work in process 21.2 3,044,441 2,244,439
Finished goods 21.3 & 21.5 9,641,809 9,393,252 Less: Provision for slow moving and obsolete stocks (21,065) (21,065) 9,620,744 9,372,187 25,795,008 28,367,135
21.1 Stock in trade of Rupees 605.335 million (2020: Rupees 654.768 million) is being carried at net realizable value.
21.2 This includes stock of Rupees 17.961 million (2020: Rupees 11.612 million) sent to outside parties for processing.
21.3 Finished goods include stock in transit of Rupees 2,215.892 million (2020: Rupees 1,384.397 million).
21.4 The aggregate amount of write-down of inventories to net realizable value recognized as an expense during the year was Rupees 22.249 million (2020: Rupees 22.364 million).
21.5 Finished goods include stock of Rupees 705.532 million (2020: Rupees 558.751 million) which is in the possession of stockists of Nishat Linen (Private) Limited - Subsidiary Company.
2021 2020 Note (Rupees in thousand)
22 TRADE DEBTS
Considered good:
Secured 20,013,100 19,237,356 Unsecured: - Related parties 22.2, 22.3 & 22.4 6,851 48,124 - Other 22.5 7,119,480 4,349,703 27,139,431 23,635,183 Less: Allowance for expected credit losses 22.7 (28,237) (30,590) 27,111,194 23,604,593
22.1 Types of counterparties
Export Corporate 1,029,888 800,812 Other 3,039,868 1,801,713 4,069,756 2,602,525
Local Corporate 22,467,750 20,212,349 Other 601,925 820,309 23,069,675 21,032,658 27,139,431 23,635,183

2021 2020
(Rupees in thousand)
22.2 This represents amount due from following related parties:
Adamjee Insurance Company Limited - associated company 16 594 Hyundai Nishat Motor (Private) Limited - associated company 547 2,110 Adamjee Life Assurance Company Limited - associated company 18 1 Nishat Hotels and Properties Limited - associated company 2,926 4,729 MCB Bank Limited - associated company 70 104 Nishat (Chunian) Limited - related party 3,274 40,586 6,851 48,124
22.3 The maximum aggregate amount receivable from related parties at the end of any month during the year was as follows:
2021 2020
(Rupees in thousand)
Adamjee Insurance Company Limited - associated company 234 595 Hyundai Nishat Motor (Private) Limited - associated company 4,833 7,071 Adamjee Life Assurance Company Limited - associated company 72 130 Nishat Hotels and Properties Limited - associated company 1,327 6,491 MCB Bank Limited - associated company 1,190 1,559 MCB Islamic Bank Limited - related party - 679 Nishat (Chunian) Limited - related party 36,736 40,586
22.4 As at 30 June 2021, trade debts due from related parties amounting to Rupees 0.543 million (2020: Rupees 45.976 million) were pas due but not impaired. The ageing analysis of these trade debts is as follows:
2021 2020
(Rupees in thousand)
Upto 1 month 525 45,588 1 to 6 months 16 388 more than 6 months 2 - 543 45,976
22.5 Trade receivables of Nishat Power Limited - Subsidiary Company from CPPA-G are considered good. These are secured by a guarantee from the Government of Pakistan under the Implementation Agreement and are in the normal course of business and interest free, however, a delayed payment mark-up at the rate of three months KIBOR plus 4.5% per annum is charged in case the amounts are not paid within due dates. The rate of delayed payment mark-up charged during the year on outstanding amounts ranged from 11.53% to 18.42% (2020: 10.64% to 18.42%) per annum. Trade debts include unbilled receivables of Rupees 3,533.134 million (2020: Rupees 2,740.517 million).
22.6 Trade debts of Nishat Power Limited - Subsidiary Company - prior to the signing of the Agreements, as referred to in note 1(a) to these consolidated financial statements include an amount of Rupees 816.033 million relating to capacity revenue not acknowledged by NTDC/CPPA-G as the plant was not fully available for power generation. However, the sole reason of this under-utilization of plant capacity was non-availability of fuel owing to non-payment by NTDC/CPPA-G.
For the year ended June 30, 2021Notes to the Consolidated Financial Statements
Nishat Mills Limited and its Subsidiaries190

Since management considered that the primary reason for claiming these payments was that plant was available, however, it could not generate electricity due to non-payment by NTDC/CPPA-G, therefore, management believed that Nishat Power Limited - Subsidiary Company cannot be penalized in the form of payment deductions due to NTDC/CPPA-G’s default of making timely payments under the PPA. Hence, Nishat Power Limited - Subsidiary Company took up this issue in consultation with NTDC/CPPA-G and appointed an Expert for dispute resolution under the PPA.
On 15 August 2015, the Expert gave his determination whereby the aforesaid amount was determined to be payable to Nishat Power Limited - Subsidiary Company by NTDC/CPPA-G. Pursuant to the Expert’s determination, Nishat Power Limited - Subsidiary Company demanded the payment of the aforesaid amount of Rupees 816.033 million from NTDC/CPPA-G. The Subsidiary Company filed a request for arbitration in the London Court of International Arbitration ('LCIA'), whereby an Arbitrator was appointed.
On 29 October 2017, the Arbitrator declared his Final Award whereby he ordered NTDC/CPPA-G to pay to Nishat Power Limited - Subsidiary Company: i) Rupees 816.033 million pursuant to Expert’s determination; ii) Rupees 189.385 million being Pre award interest; iii) Rupees 9.203 million for breach of arbitration agreement; iv) Rupees 1.684 million and USD 612,310 (equivalent to Rupees 96.623 million) for Nishat Power Limited - Subsidiary Company's cost of proceedings; v) GBP 30,157 (equivalent to Rupees 6.592 million) for Nishat Power Limited - Subsidiary Company’s LCIA cost of Arbitration and vi) Interest at KIBOR + 4.5% compounded semi-annually from the date of Final Award until payment of these amounts by NTDC/CPPA-G (“the Final Award”) that works out to Rupees 504.044 million up to 30 June 2021. Thereafter, on 29 November 2017, Nishat Power Limited - Subsidiary Company filed an application before Lahore High Court for implementation / enforcement of Final Award that is pending adjudication. On prudence basis, the amounts other than the principal of Rupees 816.033 million were not recognised in these consolidated financial statements.
On 12 February 2021, as part of the PPA Amendment Agreement as referred to in note 1(a) to these consolidated financial statements, the CPPA-G and Nishat Power Limited - Subsidiary Company acknowledged that the dispute relating to withheld capacity payments of Rupees 816.033 million, which was awarded by the London Court of International Arbitration, has now been settled through the extended disputed period of 68 days which shall be treated as an "Other Force Majeure Event" under the PPA. Further, CPPA-G agreed to make certain payments to Nishat Power Limited - Subsidiary Company, subject to certain terms, as compensation of the withheld capacity payments. In return, Nishat Power Limited - Subsidiary Company agreed to forgo certain amounts declared under the Final Award as enumerated above. Further, subject to fulfillment of certain conditions, Nishat Power Limited - Subsidiary Company and CPPA-G agreed to file a joint application before the Lahore High Court for the withdrawal of the enforcement proceedings before the Honorable Lahore High Court.
Pursuant to the provisions of PPA Amendment Agreement as mentioned above, out of the recongized receivable of Rupees 816.033 million, Nishat Power Limited - Subsidiary Company has assessed that amounts aggregating Rupees 141.47 million are no longer recoverable and therefore, such amounts have been written off during the year in other expenses. On account of the remaining receivable, amounts aggregating Rupees 328.691 million have been duly verified by the CPPA-G for the year.
2021 2020
(Rupees in thousand)
22.7 Allowance for expected credit losses
Opening balance 30,590 28,453 (Less) / Add: (Reversal of allowance) / allowance for expected credit losses (2,353) 2,137 28,237 30,590
Annual Report 2021 191

2021 2020
Note (Rupees in thousand)
23 LOANS AND ADVANCES Considered good:
Employees - interest free: – Executives 990 646 – Other employees 10,801 13,188 11,791 13,834 Current portion of long term loans 19 179,097 138,844 Advances to suppliers 23.1 449,356 251,714 Letters of credit 4,586 2,575 Other advances 23.2 445,145 312,792 1,089,975 719,759
Considered doubtful:
Others 108 108 Less: Provision for doubtful debts 108 108 - - 1,089,975 719,759
23.1 These include Rupees 3.533 million (2020: Rupees Nil) due from D.G. Khan Cement Company Limited - associated company. This is neither past due nor impaired. Maximum aggregate amount receivable at the end of any month during the year was Rupees 3.533 million (2020: Rupees Nil).
23.2 These include Rupees 104.300 million (2020: Rupees 45.000 million) advanced to Sanifa Agri Services Limited - associated company. This is neither past due nor impaired. The maximum aggregate amount receivable at the end of any month during the year was 104.300 million (2020: Rupees 45.000 million).
2021 2020
(Rupees in thousand)
24 ADVANCE INCOME TAX - NET Advance income tax 2,235,684 1,938,825 Provision for taxation (1,181,385) (1,286,087) 1,054,299 652,738
25 SHORT TERM DEPOSITS AND PREPAYMENTS
Deposits 59,409 61,543 Prepayments 132,262 122,858 191,671 184,401
For the year ended June 30, 2021Notes to the Consolidated Financial Statements
Nishat Mills Limited and its Subsidiaries192
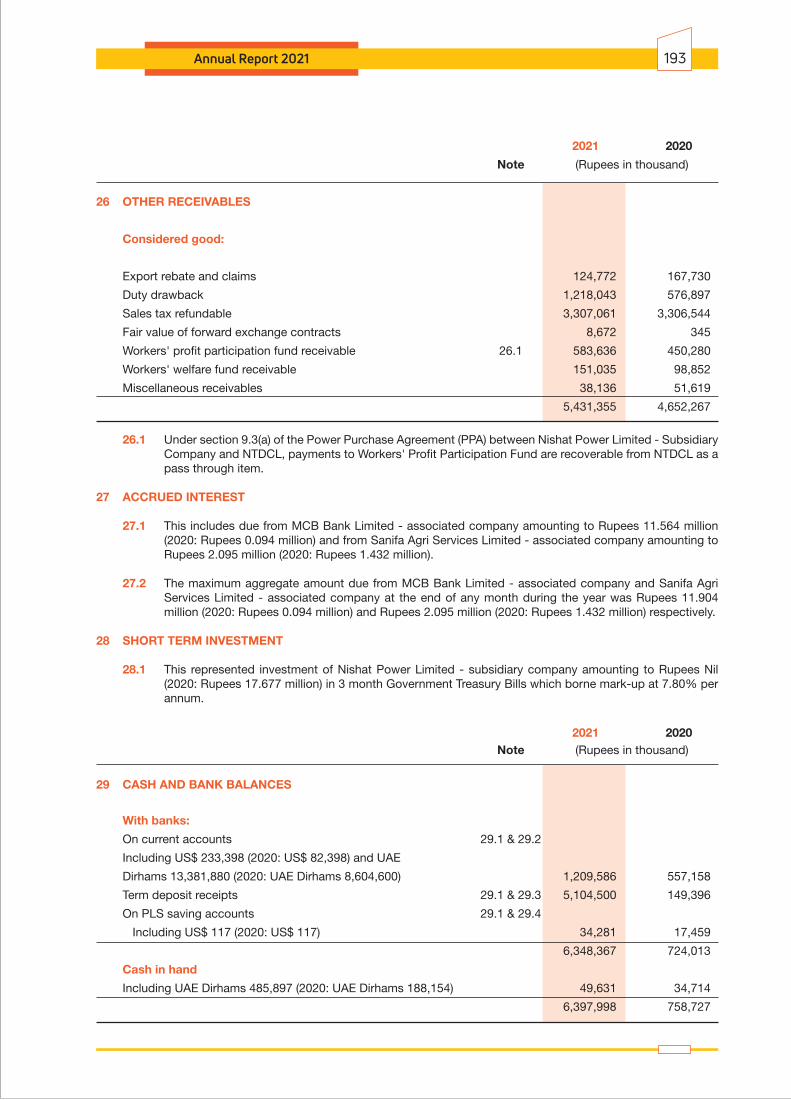
2021 2020
Note (Rupees in thousand)
26 OTHER RECEIVABLES
Considered good:
Export rebate and claims 124,772 167,730
Duty drawback 1,218,043 576,897
Sales tax refundable 3,307,061 3,306,544
Fair value of forward exchange contracts 8,672 345
Workers' profit participation fund receivable 26.1 583,636 450,280
Workers' welfare fund receivable 151,035 98,852
Miscellaneous receivables 38,136 51,619
5,431,355 4,652,267
26.1 Under section 9.3(a) of the Power Purchase Agreement (PPA) between Nishat Power Limited - Subsidiary Company and NTDCL, payments to Workers' Profit Participation Fund are recoverable from NTDCL as a pass through item.
27 ACCRUED INTEREST
27.1 This includes due from MCB Bank Limited - associated company amounting to Rupees 11.564 million (2020: Rupees 0.094 million) and from Sanifa Agri Services Limited - associated company amounting to Rupees 2.095 million (2020: Rupees 1.432 million).
27.2 The maximum aggregate amount due from MCB Bank Limited - associated company and Sanifa Agri Services Limited - associated company at the end of any month during the year was Rupees 11.904 million (2020: Rupees 0.094 million) and Rupees 2.095 million (2020: Rupees 1.432 million) respectively.
28 SHORT TERM INVESTMENT
28.1 This represented investment of Nishat Power Limited - subsidiary company amounting to Rupees Nil (2020: Rupees 17.677 million) in 3 month Government Treasury Bills which borne mark-up at 7.80% per annum.
2021 2020 Note (Rupees in thousand)
29 CASH AND BANK BALANCES
With banks:
On current accounts 29.1 & 29.2
Including US$ 233,398 (2020: US$ 82,398) and UAE
Dirhams 13,381,880 (2020: UAE Dirhams 8,604,600) 1,209,586 557,158
Term deposit receipts 29.1 & 29.3 5,104,500 149,396
On PLS saving accounts 29.1 & 29.4
Including US$ 117 (2020: US$ 117) 34,281 17,459
6,348,367 724,013
Cash in hand
Including UAE Dirhams 485,897 (2020: UAE Dirhams 188,154) 49,631 34,714
6,397,998 758,727
Annual Report 2021 193

29.1 Cash at banks includes balance of Rupees 5,128.271 million (2020: Rupees 31.700 million) with MCB Bank Limited - associated company.
29.2 Cash at banks includes balance of Rupees 0.705 million (2020: Rupees 0.077 million) with MCB Islamic Bank Limited - related party.
29.3 These represent term deposits with banking companies having maturity period of upto one month and carry profit at the rates ranging from 5.20% to 7.20% (2020: 6.40% to 6.50%) per annum.
29.4 Rate of profit on Pak Rupees bank deposits ranges from 5.50% to 7.00% (2020: 6.29% to 14.00%) per annum.
2021 2020
Note (Rupees in thousand)
30 REVENUE
Revenue from contracts with customers:
Export sales 47,467,270 45,725,446
Local sales 30.1 55,599,701 42,039,527
Processing income 636,300 338,590
103,703,271 88,103,563
Export rebate 228,790 199,090
Duty drawback 795,397 407,177
104,727,458 88,709,830
30.1 Local sales
Sales 30.1.1 66,349,789 50,174,951
Less: Sales tax 8,255,240 5,774,939
Less: Discount 2,494,848 2,360,485
55,599,701 42,039,527
30.1.1 These include sale of Rupees 10,063.857 million (2020: Rupees 2,977.374 million) made to direct exporters against standard purchase orders (SPOs). Further, local sales includes waste sales of Rupees 2,738.545 million (2020: Rupees 1,818.936 million).
For the year ended June 30, 2021Notes to the Consolidated Financial Statements
Nishat Mills Limited and its Subsidiaries194
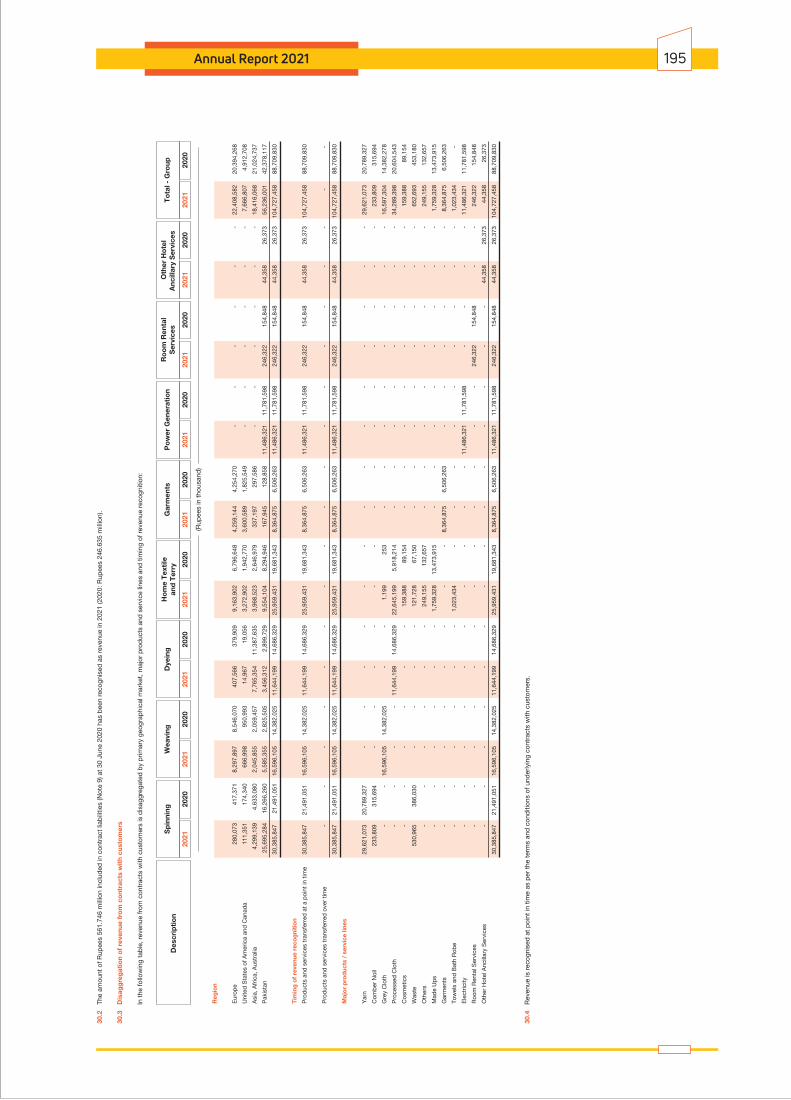
Annual Report 2021 195
(Rup
ees
in t
hous
and
)
To
tal -
Gro
up
2021
2020
Ro
om
Ren
tal
Ser
vice
s
2021
2020
Po
wer
Gen
erat
ion
2021
2020
Gar
men
ts
2021
2020
Ho
me
Tex
tile
and
Ter
ry
2021
2020
Dye
ing
2021
2020
Wea
ving
2021
2020
Sp
inni
ngD
escr
ipti
on
2021
2020
Oth
er H
ote
lA
ncill
ary
Ser
vice
s
2021
2020
Reg
ion
Eur
ope
280
,073
41
7,37
1 8,
297,
897
8
,546
,070
4
07,5
66
379
,909
9
,163
,902
6
,796
,648
4
,259
,144
4
,254
,270
-
-
-
-
-
-
2
2,40
8,58
2
20,
394,
268
Uni
ted
Sta
tes
of A
mer
ica
and
Can
ada
111,
351
174,
340
666,
998
9
50,9
93
14,
967
1
9,05
6
3,2
72,9
02
1,9
42,7
70
3,6
00,5
89
1,8
25,5
49
-
-
-
-
-
-
7,6
66,8
07
4,9
12,7
08
Asi
a, A
fric
a, A
ustr
alia
4,
299,
139
4,63
3,08
0 2,
045,
855
2
,059
,457
7
,765
,354
1
1,38
7,63
5
3,9
68,5
23
2,6
46,9
79
337
,197
2
97,5
86
-
-
-
-
-
-
18,
416,
068
2
1,02
4,73
7
Pak
ista
n 25
,695
,284
16
,266
,260
5,
585,
355
2
,825
,505
3
,456
,312
2
,899
,729
9
,554
,104
8
,294
,946
1
67,9
45
128
,858
1
1,48
6,32
1
11,
781,
598
2
46,3
22
154
,848
4
4,35
8
26,
373
5
6,23
6,00
1
42,
378,
117
30
,385
,847
21
,491
,051
16
,596
,105
1
4,38
2,02
5
11,
644,
199
1
4,68
6,32
9
25,
959,
431
1
9,68
1,34
3
8,3
64,8
75
6,5
06,2
63
11,
486,
321
1
1,78
1,59
8
246
,322
1
54,8
48
44,
358
2
6,37
3
104
,727
,458
8
8,70
9,83
0
Tim
ing
of
reve
nue
reco
gni
tio
n
Pro
duc
ts a
nd s
ervi
ces
tran
sfer
red
at
a p
oint
in t
ime
30,3
85,8
47
21,
491,
051
1
6,59
6,10
5
14,
382,
025
1
1,64
4,19
9
14,
686,
329
2
5,95
9,43
1
19,
681,
343
8
,364
,875
6
,506
,263
1
1,48
6,32
1
11,
781,
598
2
46,3
22
154
,848
4
4,35
8
26,
373
1
04,7
27,4
58
88,
709,
830
Pro
duc
ts a
nd s
ervi
ces
tran
sfer
red
ove
r tim
e -
-
-
-
-
-
-
-
-
-
-
-
-
-
-
-
-
-
30
,385
,847
2
1,49
1,05
1
16,
596,
105
1
4,38
2,02
5
11,
644,
199
1
4,68
6,32
9
25,
959,
431
1
9,68
1,34
3
8,3
64,8
75
6,5
06,2
63
11,
486,
321
1
1,78
1,59
8
246
,322
1
54,8
48
44,
358
2
6,37
3
104
,727
,458
8
8,70
9,83
0
Maj
or
pro
duc
ts /
ser
vice
line
s
Yar
n 29
,621
,073
2
0,78
9,32
7
-
-
-
-
-
-
-
-
-
-
-
-
-
-
29,
621,
073
2
0,78
9,32
7
Com
ber
Noi
l 23
3,80
9
315
,694
-
-
-
-
-
-
-
-
-
-
-
-
-
-
2
33,8
09
315
,694
Gre
y C
loth
-
-
1
6,59
6,10
5
14,
382,
025
-
-
1
,199
2
53
-
-
-
-
-
-
-
-
16,
597,
304
1
4,38
2,27
8
Pro
cess
ed C
loth
-
-
-
-
1
1,64
4,19
9
14,
686,
329
2
2,64
5,19
9
5,9
18,2
14
-
-
-
-
-
-
-
-
34,
289,
398
2
0,60
4,54
3
Cos
met
ics
-
-
-
-
-
-
159
,388
8
9,15
4
-
-
-
-
-
-
-
-
159
,388
8
9,15
4
Was
te
530,
965
3
86,0
30
-
-
-
-
121
,728
6
7,15
0
-
-
-
-
-
-
-
-
652
,693
4
53,1
80
Oth
ers
-
-
-
-
-
-
249
,155
1
32,6
57
-
-
-
-
-
-
-
-
249
,155
1
32,6
57
Mad
e U
ps
-
-
-
-
-
-
1,7
59,3
28
13,
473,
915
-
-
-
-
-
-
-
-
1
,759
,328
1
3,47
3,91
5
Gar
men
ts
-
-
-
-
-
-
-
-
8,3
64,8
75
6,5
06,2
63
-
-
-
-
-
-
8,3
64,8
75
6,5
06,2
63
Tow
els
and
Bat
h R
obe
-
-
-
-
-
-
1,0
23,4
34
-
-
-
-
-
-
-
-
-
1,0
23,4
34
-
Ele
ctric
ity
-
-
-
-
-
-
-
-
-
-
11,
486,
321
1
1,78
1,59
8
-
-
-
-
11,
486,
321
1
1,78
1,59
8
Roo
m R
enta
l Ser
vice
s
-
-
-
-
-
-
-
-
-
-
-
-
246
,322
1
54,8
48
-
-
246
,322
1
54,8
48
Oth
er H
otel
Anc
illar
y S
ervi
ces
-
-
-
-
-
-
-
-
-
-
-
-
-
-
4
4,35
8
26,
373
4
4,35
8
26,
373
3
0,38
5,84
7
21,
491,
051
1
6,59
6,10
5
14,
382,
025
1
1,64
4,19
9
14,
686,
329
2
5,95
9,43
1
19,
681,
343
8
,364
,875
6
,506
,263
1
1,48
6,32
1
11,
781,
598
2
46,3
22
154
,848
4
4,35
8
26,
373
1
04,7
27,4
58
88,
709,
830
30.2
Th
e am
ount
of R
upee
s 56
1.74
6 m
illio
n in
clud
ed in
con
trac
t lia
bili
ties
(Not
e 9)
at
30 J
une
2020
has
bee
n re
cogn
ised
as
reve
nue
in 2
021
(202
0: R
upee
s 24
6.63
5 m
illio
n).
30.3
D
isag
gre
gat
ion
of
reve
nue
fro
m c
ont
ract
s w
ith
cust
om
ers
In
the
follo
win
g ta
ble
, rev
enue
from
con
trac
ts w
ith c
usto
mer
s is
dis
aggr
egat
ed b
y p
rimar
y ge
ogra
phi
cal m
arke
t, m
ajor
pro
duc
ts a
nd s
ervi
ce li
nes
and
tim
ing
of r
even
ue r
ecog
nitio
n:
30.4
R
even
ue is
rec
ogni
sed
at
poi
nt in
tim
e as
per
the
ter
ms
and
con
diti
ons
of u
nder
lyin
g co
ntra
cts
with
cus
tom
ers.

For the year ended June 30, 2021Notes to the Consolidated Financial Statements
Nishat Mills Limited and its Subsidiaries196
2021 2020
Note (Rupees in thousand)
31 COST OF SALES
Raw materials consumed 56,873,417 45,987,292
Processing charges 782,206 742,535
Salaries, wages and other benefits 31.1 8,393,421 7,218,329
Stores, spare parts and loose tools consumed 7,822,218 6,971,855
Packing materials consumed 1,936,572 1,439,156
Repair and maintenance 490,681 413,155
Fuel and power 6,131,769 6,034,186
Insurance 341,551 326,699
Royalty 31.2 - 7,800
Other factory overheads 762,165 734,800
Depreciation and amortization 15.1.2 3,580,811 3,455,552
87,114,811 73,331,359
Work-in-process
Opening stock 2,244,439 2,218,560
Closing stock (3,044,441) (2,244,439)
(800,002) (25,879)
Cost of goods manufactured 86,314,809 73,305,480
Finished goods
Opening stock 9,393,252 6,909,811
Closing stock (9,641,809) (9,393,252)
(248,557) (2,483,441)
86,066,252 70,822,039
31.1 Salaries, wages and other benefits include provident fund contributions of Rupees 235.457 million (2020: Rupees 221.109 million) and Rupees 0.788 million (2020: Rupees 0.362 million) in respect of provision for compensated absences.
31.2 This represents the amount of royalty being paid to Saint James's Club Limited, London.
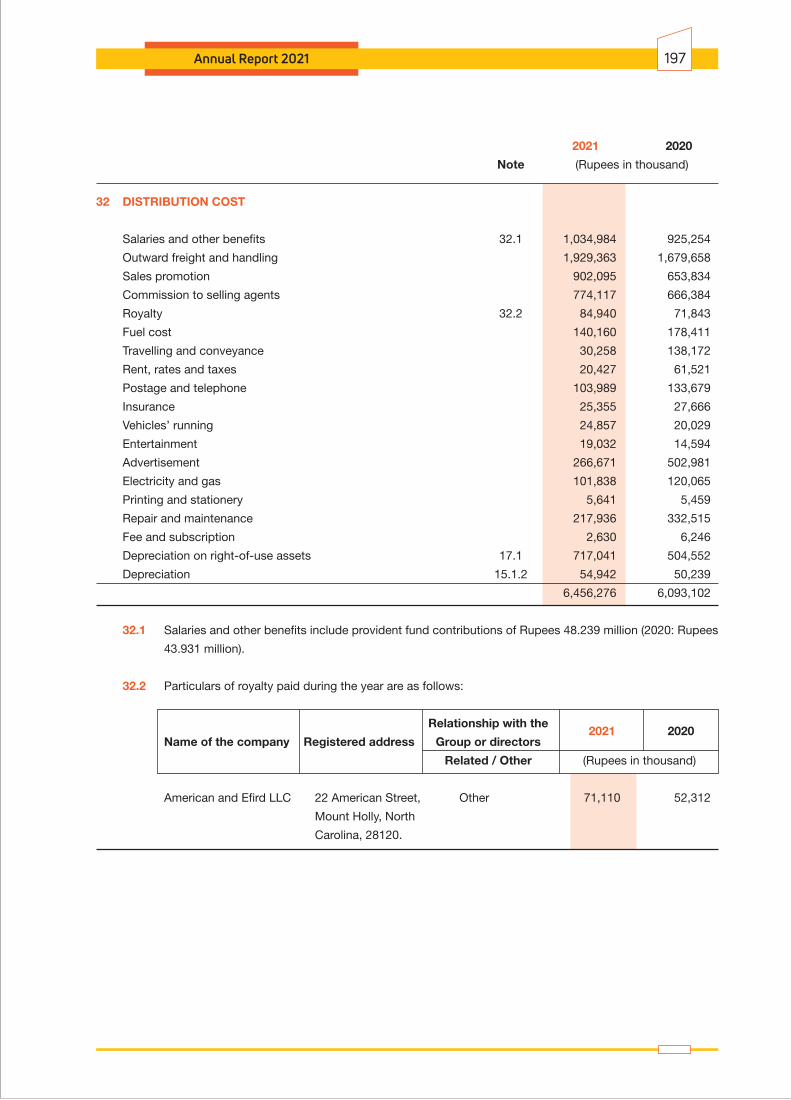
Annual Report 2021 197
2021 2020
Note (Rupees in thousand)
32 DISTRIBUTION COST
Salaries and other benefits 32.1 1,034,984 925,254
Outward freight and handling 1,929,363 1,679,658
Sales promotion 902,095 653,834
Commission to selling agents 774,117 666,384
Royalty 32.2 84,940 71,843
Fuel cost 140,160 178,411
Travelling and conveyance 30,258 138,172
Rent, rates and taxes 20,427 61,521
Postage and telephone 103,989 133,679
Insurance 25,355 27,666
Vehicles’ running 24,857 20,029
Entertainment 19,032 14,594
Advertisement 266,671 502,981
Electricity and gas 101,838 120,065
Printing and stationery 5,641 5,459
Repair and maintenance 217,936 332,515
Fee and subscription 2,630 6,246
Depreciation on right-of-use assets 17.1 717,041 504,552
Depreciation 15.1.2 54,942 50,239
6,456,276 6,093,102
32.1 Salaries and other benefits include provident fund contributions of Rupees 48.239 million (2020: Rupees
43.931 million).
32.2 Particulars of royalty paid during the year are as follows:
Relationship with the
Name of the company Registered address Group or directors
Related / Other (Rupees in thousand)
American and Efird LLC 22 American Street, Other 71,110 52,312
Mount Holly, North
Carolina, 28120.
2021 2020

2021 2020
Note (Rupees in thousand)
33 ADMINISTRATIVE EXPENSES
Salaries and other benefits 33.1 1,425,800 1,315,633 Vehicles’ running 56,088 53,359 Travelling and conveyance 136,397 158,229 Rent, rates and taxes 40,018 34,229 Insurance 19,829 20,094 Entertainment 33,605 27,786 Legal and professional 30,624 60,479 Auditors’ remuneration 33.2 16,868 15,556 Advertisement 594 1,805 Postage and telephone 25,197 25,396 Electricity and gas 25,040 20,630 Printing and stationery 26,578 23,077 Repair and maintenance 61,115 45,994 Fee and subscription 19,540 18,176 Depreciation on right-of-use assets 17.1 6,549 160,093 Depreciation 15.1.2 190,069 179,656 Miscellaneous 68,164 63,012 2,182,075 2,223,204
33.1 Salaries and other benefits include provident fund contributions of Rupees 53.647 million (2020: Rupees 50.105 million), Rupees 0.599 million (2020: Rupee 0.316 million) in respect of provision for compensated absences and Rupees 3.260 million (2020: Rupees 3.374 million) in respect of retirement benefit - gratuity.
2021 2020
(Rupees in thousand)
33.2 Auditors' remuneration
Riaz Ahmad and Company
Audit fee 6,090 5,631 Half yearly review 1,057 961 Other certifications 155 155 Reimbursable expenses 195 177 7,497 6,924
A.F. Ferguson and Company Statutory audit fee 2,640 2,490 Half yearly review 892 875 Tax services 1,926 495 Other certification services 155 380 Reimbursable expenses 171 332 5,784 4,572
Crowe Mak Audit fee 3,501 3,964 Reimbursable expenses 86 96 3,587 4,060 16,868 15,556
For the year ended June 30, 2021Notes to the Consolidated Financial Statements
Nishat Mills Limited and its Subsidiaries198
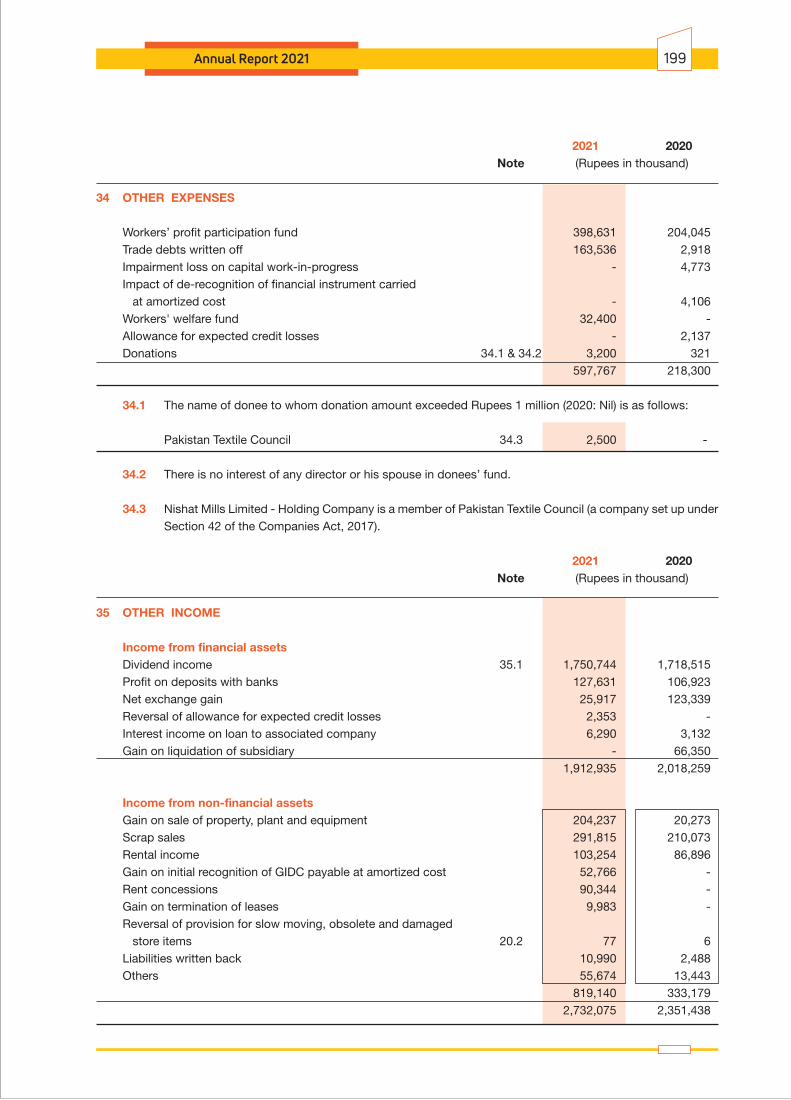
2021 2020 Note (Rupees in thousand)
34 OTHER EXPENSES
Workers’ profit participation fund 398,631 204,045 Trade debts written off 163,536 2,918 Impairment loss on capital work-in-progress - 4,773 Impact of de-recognition of financial instrument carried at amortized cost - 4,106 Workers' welfare fund 32,400 - Allowance for expected credit losses - 2,137 Donations 34.1 & 34.2 3,200 321 597,767 218,300
34.1 The name of donee to whom donation amount exceeded Rupees 1 million (2020: Nil) is as follows:
Pakistan Textile Council 34.3 2,500 -
34.2 There is no interest of any director or his spouse in donees’ fund. 34.3 Nishat Mills Limited - Holding Company is a member of Pakistan Textile Council (a company set up under
Section 42 of the Companies Act, 2017).
2021 2020 Note (Rupees in thousand)
35 OTHER INCOME
Income from financial assets Dividend income 35.1 1,750,744 1,718,515 Profit on deposits with banks 127,631 106,923 Net exchange gain 25,917 123,339 Reversal of allowance for expected credit losses 2,353 - Interest income on loan to associated company 6,290 3,132 Gain on liquidation of subsidiary - 66,350 1,912,935 2,018,259
Income from non-financial assets Gain on sale of property, plant and equipment 204,237 20,273 Scrap sales 291,815 210,073 Rental income 103,254 86,896 Gain on initial recognition of GIDC payable at amortized cost 52,766 - Rent concessions 90,344 - Gain on termination of leases 9,983 - Reversal of provision for slow moving, obsolete and damaged store items 20.2 77 6 Liabilities written back 10,990 2,488 Others 55,674 13,443 819,140 333,179 2,732,075 2,351,438
Annual Report 2021 199
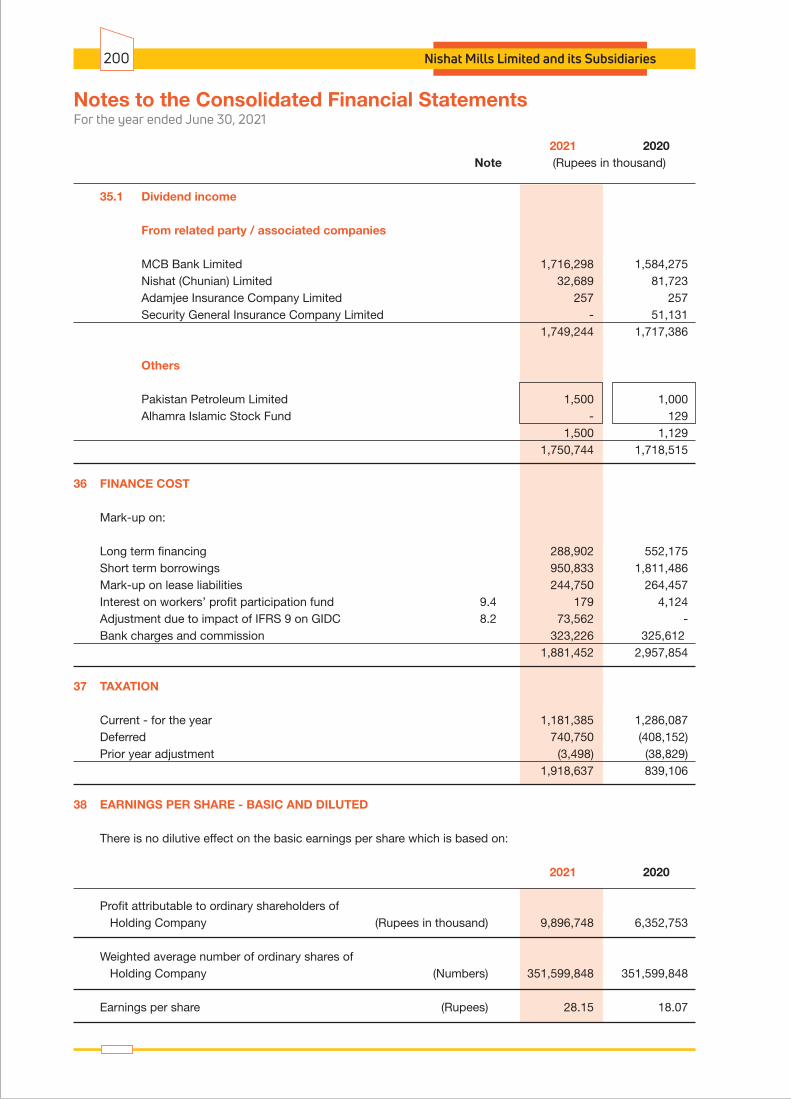
2021 2020 Note (Rupees in thousand)
35.1 Dividend income
From related party / associated companies
MCB Bank Limited 1,716,298 1,584,275 Nishat (Chunian) Limited 32,689 81,723 Adamjee Insurance Company Limited 257 257 Security General Insurance Company Limited - 51,131 1,749,244 1,717,386
Others
Pakistan Petroleum Limited 1,500 1,000 Alhamra Islamic Stock Fund - 129 1,500 1,129 1,750,744 1,718,515
36 FINANCE COST
Mark-up on:
Long term financing 288,902 552,175 Short term borrowings 950,833 1,811,486 Mark-up on lease liabilities 244,750 264,457 Interest on workers’ profit participation fund 9.4 179 4,124 Adjustment due to impact of IFRS 9 on GIDC 8.2 73,562 - Bank charges and commission 323,226 325,612 1,881,452 2,957,854
37 TAXATION
Current - for the year 1,181,385 1,286,087 Deferred 740,750 (408,152) Prior year adjustment (3,498) (38,829) 1,918,637 839,106
38 EARNINGS PER SHARE - BASIC AND DILUTED There is no dilutive effect on the basic earnings per share which is based on:
2021 2020
Profit attributable to ordinary shareholders of Holding Company (Rupees in thousand) 9,896,748 6,352,753
Weighted average number of ordinary shares of Holding Company (Numbers) 351,599,848 351,599,848
Earnings per share (Rupees) 28.15 18.07
For the year ended June 30, 2021Notes to the Consolidated Financial Statements
Nishat Mills Limited and its Subsidiaries200

Annual Report 2021 201
2021 2020
Note (Rupees in thousand)
39 CASH GENERATED FROM OPERATIONS
Profit before taxation 13,124,233 9,610,861
Adjustments for non-cash charges and other items:
Depreciation and amortization 3,825,822 3,685,447
Depreciation on right-of-use assets 723,590 664,645
Impairment loss on capital work-in-progress - 4,773
Impact of de-recognition of financial instrument carried at amortized cost - 4,106
Gain on liquidation of subsidiary - (66,350)
Trade debts written off 163,536 2,918
Reversal of provision for slow moving, obsolete and damaged store items (77) (6)
(Reversal of allowance) / allowance for expected credit losses (2,353) 2,137
Net exchange gain (25,917) (123,339)
Gain on sale of property, plant and equipment (204,237) (20,273)
Dividend income (1,750,744) (1,718,515)
Profit on deposits with banks (127,631) (106,923)
Interest income on loan to associated company (6,290) (3,132)
Share of profit from associates (2,848,522) (864,092)
Provision for accumulated compensated absences 1,388 677
Adjustment due to deemed disposal of equity accounted investee (41,622) -
Liabilities written back (10,990) (2,488)
Finance cost 1,881,452 2,957,854
Gain on initial recognition of GIDC payable at amortized cost (110,431) -
Rent concessions (90,344) -
Gain on termination of leases (9,983) -
Working capital changes 39.1 (889,135) (3,903,079)
13,601,745 10,125,221
39.1 Working capital changes
(Increase) / decrease in current assets:
- Stores, spare parts and loose tools (328,097) 928,557
- Stock in trade 2,572,127 (3,998,249)
- Trade debts (3,600,208) (1,799,160)
- Loans and advances (329,963) 135,144
- Short term deposits and prepayments (7,270) 45,734
- Other receivables (770,761) (954,056)
(2,464,172) (5,642,030)
Increase in trade and other payables 1,575,037 1,738,951
(889,135) (3,903,079)

Liabilities from financing activities
2021
39.2 Reconciliation of movement of liabilities to cash flows arising from financing activities.
(Rupees in thousand)
Balance as at 01 July 2020 10,136,154 2,266,071 24,080,517 111,267 224,659 36,818,668 Lease liabilities recognized - 342,406 - - - 342,406 Repayment of lease liabilities - (794,088) - - - (794,088) Financing obtained 6,744,988 - - - - 6,744,988 Repayment of financing (1,756,252) - - - - (1,756,252) Dividend declared - - - 1,579,855 - 1,579,855 Dividend paid - - - (1,575,625) - (1,575,625) Short term borrowings - net - - (1,695,361) - - (1,695,361) Exchange differences on translation of net investments in subsidiary companies - - - - (37,902) (37,902) Other changes - non-cash (176,589) - - - - (176,589) Interest accrued on lease liabilities - 244,750 - - - 244,750 Impact of lease modification - 180,387 - - - 180,387 Impact of rent concessions - (90,344) - - - (90,344) Impact of lease termination - (79,390) - - - (79,390) Currency retranslation - (20,008) - - - (20,008) Balance as at 30 June 2021 14,948,301 2,049,784 22,385,156 115,497 186,757 39,685,495
(Rupees in thousand)
Balance as at 01 July 2019 10,086,021 - 24,402,574 114,673 219,168 34,822,436 Lease liabilities recognized - 2,613,840 - - - 2,613,840 Repayment of lease liabilities - (347,769) - - - (347,769) Financing obtained 4,454,967 - - - - 4,454,967 Repayment of financing (4,404,834) - - - - (4,404,834) Dividend declared - - - 1,582,221 - 1,582,221 Dividend paid - - - (1,585,627) - (1,585,627) Short term borrowings - net - - (322,057) - - (322,057) Exchange differences on translation of net investments in subsidiary companies - - - - 5,491 5,491 Balance as at 30 June 2020 10,136,154 2,266,071 24,080,517 111,267 224,659 36,818,668
40 EVENTS AFTER THE REPORTING PERIOD
The Board of Directors of the Nishat Mills Limited - Holding Company has proposed a cash dividend for the year ended 30 June 2021 of Rupees 4.00 per share (2020: Rupees 4.00 per share) at their meeting held on 20 September, 2021. The Board of Directors also proposed to transfer Rupees 10,524 million (2020: Rupees 4,890 million) from un-appropriated profit to general reserve. However, these events have been considered as non-adjusting events under IAS 10 'Events after the Reporting Period' and have not been recognized in these consolidated financial statements.
Exchangetranslation
reserve
Unclaimeddividend
Short termborrowings
Long termfinancing
Leaseliabilities
Total
Exchangetranslation
reserve
Unclaimeddividend
Short termborrowings
Long termfinancing
Leaseliabilities
Total
Liabilities from financing activities
2020
For the year ended June 30, 2021Notes to the Consolidated Financial Statements
Nishat Mills Limited and its Subsidiaries202

Annual Report 2021 203
41.1 Chief Executive Officer and certain executives of the Holding Company are provided with Company maintained vehicles and certain executives are also provided with free housing facility along with utilities.
41.2 Aggregate amount charged in these consolidated financial statements for meeting fee to five directors (2020: five directors) of the Holding Company was Rupees 1.490 million (2020: Rupees 1.080 million).
41.3 No remuneration was paid to non-executive directors of the Holding Company.
41.4 This represents remuneration including all benefits paid to a director for the period from July 2019 to March 2020. As on the reporting date, there are no paid directors of the Holding Company.
41 REMUNERATION OF CHIEF EXECUTIVE OFFICER, DIRECTOR AND EXECUTIVES
The aggregate amount charged in these consolidated financial statements for remuneration including all benefits to Chief Executive Officer, Director and Executives of the Holding Company is as follows:
Chief Executive Officer Director Executives2021 2020 2021 2020 2021 2020
(Rupees in thousand)
Managerial remuneration 37,189 32,503 - 11,163 683,563 554,058
Allowances
Cost of living allowance - - - 1 1,023 781
House rent 13,521 13,001 - 216 174,176 148,293
Conveyance - - - - 904 880
Medical 3,380 3,250 - 912 57,482 47,939
Utilities - - - 3,385 75,673 61,649
Special allowance - - - 2 646 529
Contribution to provident fund trust - - - 871 56,650 47,016
Leave encashment - - - - 18,091 12,867
54,090 48,754 - 16,550 1,068,208 874,012
Number of persons 1 1 Note 41.4 Note 41.4 261 222
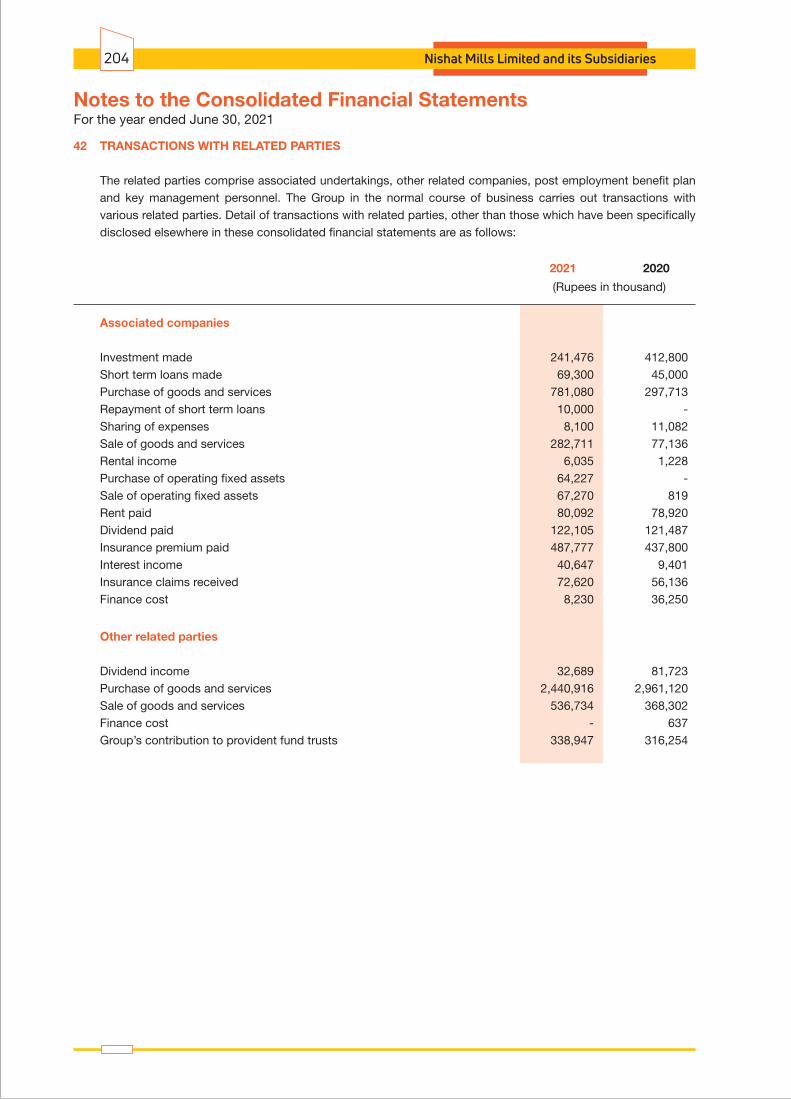
42 TRANSACTIONS WITH RELATED PARTIES The related parties comprise associated undertakings, other related companies, post employment benefit plan
and key management personnel. The Group in the normal course of business carries out transactions with various related parties. Detail of transactions with related parties, other than those which have been specifically disclosed elsewhere in these consolidated financial statements are as follows:
2021 2020
(Rupees in thousand)
Associated companies
Investment made 241,476 412,800 Short term loans made 69,300 45,000 Purchase of goods and services 781,080 297,713 Repayment of short term loans 10,000 - Sharing of expenses 8,100 11,082 Sale of goods and services 282,711 77,136 Rental income 6,035 1,228 Purchase of operating fixed assets 64,227 - Sale of operating fixed assets 67,270 819 Rent paid 80,092 78,920 Dividend paid 122,105 121,487 Insurance premium paid 487,777 437,800 Interest income 40,647 9,401 Insurance claims received 72,620 56,136 Finance cost 8,230 36,250
Other related parties
Dividend income 32,689 81,723 Purchase of goods and services 2,440,916 2,961,120 Sale of goods and services 536,734 368,302 Finance cost - 637 Group’s contribution to provident fund trusts 338,947 316,254
For the year ended June 30, 2021Notes to the Consolidated Financial Statements
Nishat Mills Limited and its Subsidiaries204

Annual Report 2021 205
42.1 Detail of compensation to key management personnel comprising of chief executive officer, directors and executives is disclosed in note 41.
42.2 Following are the related parties with whom the Group had entered into transactions or have arrangements / agreements in place:
Transactions entered or agreements and / or arrangements in place during the financial year ended
2021 2020
Nishat Agriculture Farming (Private) Limited Common directorship No Yes None Nishat Dairy (Private) Limited Common directorship and shareholding Yes Yes 12.24 Nishat Sutas Dairy Limited Common directorship and shareholding Yes Yes 34.46 Nishat Hotels and Properties Limited Common directorship and shareholding Yes Yes 6.08 Nishat (Raiwind) Hotels and Properties Limited Common directorship No No None Nishat (Aziz Avenue) Hotels and Properties Limited Common directorship No Yes None Security General Insurance Company Limited Common directorship and shareholding Yes Yes 15.02 Nishat Energy Limited Shareholding No No 37.75 Pakgen Power Limited Common directorship and shareholding Yes Yes 27.55 Lalpir Power Limited Common directorship and shareholding Yes Yes 28.80 Nishat Paper Products Company Limited Common directorship and shareholding No No 25.00 Pakistan Aviators and Aviation (Private) Limited Common directorship Yes Yes None Nishat Developers (Private) Limited Common directorship Yes Yes None Nishat Real Estates Development Company (Private) Limited Common directorship No No None Hyundai Nishat Motor (Private) Limited Common directorship and shareholding Yes Yes 12.00 D.G. Khan Cement Company Limited Common directorship and shareholding Yes Yes 31.40 Adamjee Life Assurance Company Limited Common directorship Yes Yes None Adamjee Insurance Company Limited Common directorship and shareholding Yes Yes 0.03 MCB Bank Limited Common directorship and shareholding Yes Yes 7.43 MCB Islamic Bank Limited Wholly owned subsidiary of associated company Yes Yes None Nishat (Chunian) Limited Shareholding Yes Yes 13.61 Nishat Agrotech Farms Supplies (Private) Limited Common directorship No No None Nishat Chunian Power Executive of the Holding Company is Limited (NCPL) appointed as Director on the Board of NCPL No No None Sanifa Agri Services Limited Associated Company Yes Yes None Employees Provident Fund Trusts Post-employment benefit plans Yes Yes None
Name of the related party Basis of relationship Percentage ofshareholding
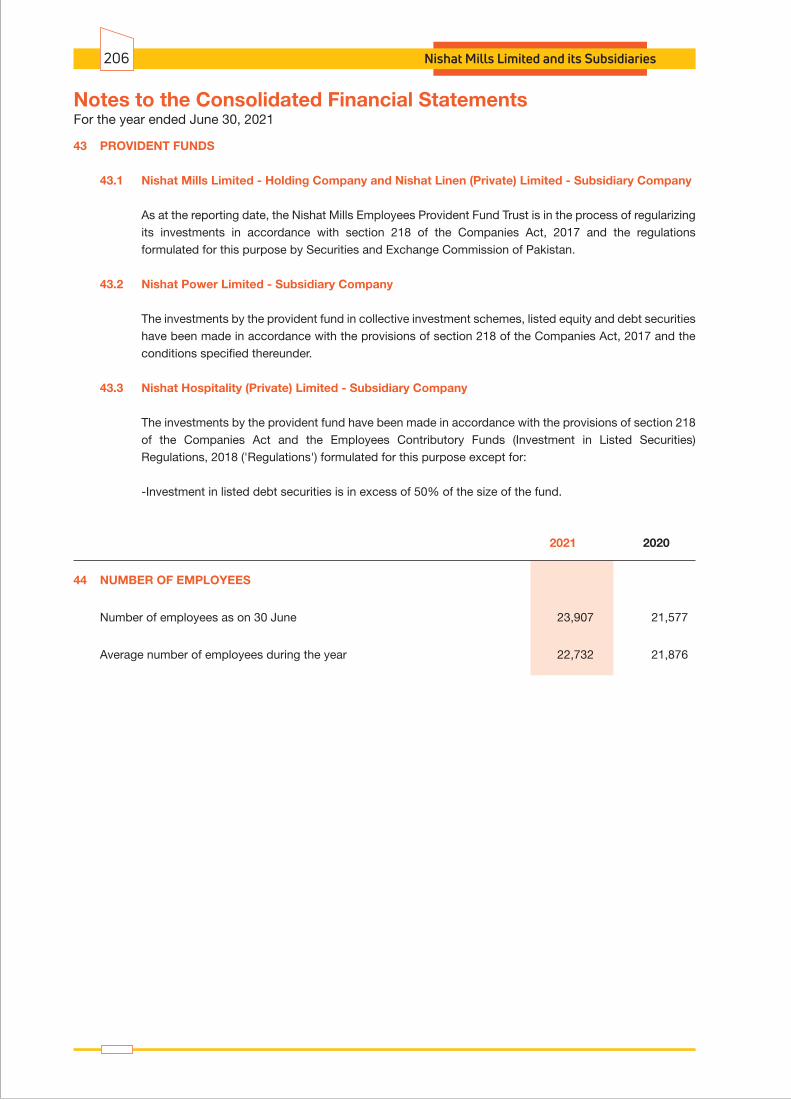
For the year ended June 30, 2021Notes to the Consolidated Financial Statements
Nishat Mills Limited and its Subsidiaries206
43 PROVIDENT FUNDS
43.1 Nishat Mills Limited - Holding Company and Nishat Linen (Private) Limited - Subsidiary Company
As at the reporting date, the Nishat Mills Employees Provident Fund Trust is in the process of regularizing its investments in accordance with section 218 of the Companies Act, 2017 and the regulations formulated for this purpose by Securities and Exchange Commission of Pakistan.
43.2 Nishat Power Limited - Subsidiary Company
The investments by the provident fund in collective investment schemes, listed equity and debt securities have been made in accordance with the provisions of section 218 of the Companies Act, 2017 and the conditions specified thereunder.
43.3 Nishat Hospitality (Private) Limited - Subsidiary Company
The investments by the provident fund have been made in accordance with the provisions of section 218 of the Companies Act and the Employees Contributory Funds (Investment in Listed Securities) Regulations, 2018 ('Regulations') formulated for this purpose except for:
-Investment in listed debt securities is in excess of 50% of the size of the fund.
2021 2020
44 NUMBER OF EMPLOYEES
Number of employees as on 30 June 23,907 21,577
Average number of employees during the year 22,732 21,876

2021 2020
(Figures in thousand)
45 PLANT CAPACITY AND ACTUAL PRODUCTION
a) Holding Company - Nishat Mills Limited
Spinning 100 % plant capacity converted to 20s count based on 3 shifts per day for 1,095 shifts (2020: 1,029 shifts) (Kgs.) 90,821 86,111
Actual production converted to 20s count based on 3 shifts per day for 1,095 shifts (2020: 1,029 shifts) (Kgs.) 79,689 65,466
Weaving 100 % plant capacity at 50 picks based on 3 shifts per day for 1,095 shifts (2020: 1,029 shifts) (Sq.Mtr) 309,458 289,273
Actual production converted to 50 picks based on 3 shifts per day for 1,095 shifts (2020: 1,029 shifts) (Sq.Mtr) 295,932 275,483 Dyeing and Finishing Production capacity for 3 shifts per day for 1,095 shifts (2020: 1,029 shifts) (Mtr) 56,400 52,856
Actual production on 3 shifts per day for 1,095 shifts (2020: 1,029 shifts) (Mtr) 33,105 42,912
Power Plant Generation capacity (MWH) 989 932
Actual generation (MWH) 389 361
Processing, Stitching, Apparel and Terry
The plant capacity of these divisions is indeterminable due to multi product plants involving varying processes of manufacturing and run length of order lots.
b) Subsidiary Company - Nishat Power Limited
Installed capacity [Based on 8,760 hours (2020: 8,784 hours)] MWH 1,711 1,715 Actual energy delivered MWH 523 277
c) Subsidiary Company - Nishat Hospitality (Private) Limited Total rooms available
Nishat Suites 31,753 21,789
45.1 REASON FOR LOW PRODUCTION
a) Under utilization of available capacity by the Holding Company for spinning, weaving, dyeing and finishing is mainly due to normal maintenance. Actual power generation in comparison to installed is low due to periodical, scheduled and unscheduled maintenance and low demand.
In the note of plant capacity and actual production, plant capacity of each segment of the Holding Company was adjusted last year to incorporate the impact of temporary suspension of operations due to lock down announced by the Government of the Punjab. The Holding Company resumed its operations after implementing necessary standard operating procedures.
b) Output produced by the plant of Nishat Power Limited - Subsidiary Company is dependent on the load demanded by CPPA-G and plant availability.
Annual Report 2021 207

(Ru
pees
in t
ho
usa
nd
)
We
avi
ng
Sp
inn
ing
Ga
rme
nts
Te
rry
Elim
inat
ion
of In
ter-
segm
ent t
rans
actio
nsF
ais
ala
ba
d-I
IF
ais
ala
ba
d-I
Fe
roze
Wa
ttw
an
I F
ero
ze W
att
wa
n I
IB
hik
ki
La
ho
reD
yein
gH
om
e T
exti
leP
ow
er
Ge
ne
rati
on
Ho
tel
To
tal -
Gro
up
20
21
20
20
20
21
20
20
20
21
20
20
20
21
20
20
20
21
20
20
20
21
20
20
20
21
20
20
20
21
20
20
20
21
20
20
20
21
20
21
20
20
20
21
20
20
20
20
20
21
20
20
20
21
20
20
20
21
20
20
La
ho
re
Re
venu
e
Exter
nal
4,1
19,7
86
2,07
3,19
5 2,
634,
067
2,93
6,49
1 4,
323,
324
2,65
9,04
2 1,
203,
589
599,
924
18,1
05,0
81
13,2
22,3
99
13,5
00,6
97
11,3
68,6
82
3,09
5,40
8 3,
013,
343
11,6
44,1
99
14,6
86,3
29
24,9
35,9
97
19,6
81,3
43
1,02
3,43
4 -
8,36
4,87
5 6,
506,
263
11,4
86,3
21
11,7
81,5
98
290,
680
181,
221
- -
104,7
27,45
8 88
,709
,830
Inters
egme
nt 6,
573,
047
5,78
4,55
0
2,08
8,10
2 1,
537,
651
3,17
4,70
0 2,
474,
659
758,
736
192,
788
253,
474
123,
278
6,86
6,27
2 6,
708,
356
4,58
7,25
3 4,
084,
710
743,
501
541,
079
262,
554
333,
275
34,7
36
- 4,
156
519
6,81
4,58
5 6,
550,
874
765
637
(32,1
61,8
81)
(28,
332,
376)
- -
10,6
92,8
33
7,85
7,74
5
4,72
2,16
9 4,
474,
142
7,49
8,02
4 5,
133,
701
1,96
2,32
5 79
2,71
2 18
,358
,555
13
,345
,677
20
,366
,969
18
,077
,038
7,
682,
661
7,09
8,05
3 12
,387
,700
15
,227
,408
25
,198
,551
20
,014
,618
1,
058,
170
- 8,
369,
031
6,50
6,78
2 18
,300
,906
18
,332
,472
29
1,44
5 18
1,85
8 (32
,161
,881
) (28
,332
,376
) 104
,727
,458
88
,709
,830
Co
st of
sales
(9,
572,
154)
(7,12
5,47
8) (4,
308,
874)
(4,91
0,72
7) (6,
697,
955)
(5,28
0,20
6) (1,
763,
288)
(676,
816)
(16,
567,
699)
(12,5
03,1
95)
(18,7
61,6
29)
(16,3
92,6
03)
(7,21
5,55
7) (6
,705
,384
) (11
,033
,997
) (13
,054
,215
) (19
,108
,577
) (1
4,77
8,88
4) (95
9,85
6) -
(7,13
1,64
0) (5,
593,
738)
(14,8
37,1
20)
(11,9
01,0
33)
(269,
787)
(232,
136)
32,1
61,8
81
28,3
32,3
76 (8
6,06
6,25
2) (7
0,82
2,03
9)
Gr
oss p
rofit /
(loss
) 1,
120,
679
732,
267
413,
295
(436,
585)
800,
069
(146,
505)
199,
037
115,
896
1,79
0,85
6 84
2,48
2 1,
605,
340
1,68
4,43
5 46
7,10
4 39
2,66
9 1,
353,
703
2,17
3,19
3 6,
089,
974
5,2
35,7
34
98,3
14
- 1,
237,
391
913,
044
3,46
3,78
6 6,
431,
439
21,6
58
(50,2
78)
- -
18,6
61,2
06
17,8
87,7
91
Di
stribu
tion c
ost
(141,
307)
(156,
547)
(34,1
63)
(17,2
74)
(134,
076)
(161,
175)
(12,0
70)
(3,29
1) (27
7,53
9) (19
1,20
1) (6
11,0
43)
(575
,548
) (1
46,5
63)
(127,
170)
(595,
743)
(643,
431)
(3,86
1,00
0) (3,
704,
478)
(67,0
69)
- (57
5,70
3) (51
2,92
5) -
(62)
- -
- -
(6,45
6,27
6) (6,
093,
102)
Ad
minis
trativ
e exp
ense
s (21
2,63
9) (18
3,68
1) (62
,454
) (60
,007
) (98
,288
) (92
,947
) (15
,785
) (4
,890
) (2,
660)
(1,66
3) (18
7,39
2) (1
88,4
15)
(91,
536)
(90,3
68)
(171
,847
) (19
0,24
2) (7
41,1
66)
(836,
471)
(32,0
23)
- (14
8,39
8) (12
9,38
4) (35
8,89
9) (38
4,06
3) (58
,988
) (61
,073
) -
- (2,
182,
075)
(2,22
3,20
4)
(353
,946
) (34
0,22
8) (96
,617
) (77
,281
) (23
2,36
4) (25
4,12
2) (27
,855
) (8,
181)
(280,
199)
(192,
864)
(798
,435
) (7
63,9
63)
(238
,099
) (21
7,53
8) (7
67,5
90)
(833
,673
) (4
,602
,166
) (4,
540,
949)
(99,0
92)
- (72
4,10
1) (64
2,30
9) (35
8,89
9) (38
4,12
5) (5
8,98
8) (61
,073
) -
- (8,
638,
351)
(8,31
6,30
6)
Pr
ofit
/ (los
s) be
fore t
axati
on an
d una
lloca
ted
incom
e and
expe
nses
7
66,7
33
392,
039
316,
678
(513,
866)
567,
705
(400,
627)
171,
182
107,
715
1,51
0,65
7 64
9,61
8 80
6,90
5 92
0,47
2 22
9,00
5 17
5,13
1 58
6,11
3 1,
339,
520
1,48
7,80
8 69
4,78
5 (77
8) -
513,
290
270,
735
3,10
4,88
7 6,
047,
314
(37,3
30)
(111,
351)
- -
10,0
22,8
55
9,57
1,48
5
Un
alloc
ated
inco
me a
nd ex
pens
es:
Ot
her e
xpen
ses
(597
,767
) (21
8,30
0)
Ot
her in
come
2
,732
,075
2,
351,
438
Fin
ance
cost
(1,88
1,45
2) (2,
957,
854)
Sh
are of
profi
t from
asso
ciates
2
,848
,522
86
4,09
2
Ta
xatio
n
(1,
918,
637)
(839,
106)
Pr
ofit a
fter t
axati
on
11,2
05,5
96
8,77
1,75
5
46.1
Reco
ncilia
tion o
f rep
orta
ble se
gmen
t ass
ets a
nd lia
biliti
es
46
SEGM
ENT
INFO
RMAT
ION
(Ru
pees
in t
ho
usa
nd
)
We
avi
ng
Sp
inn
ing
Ga
rme
nts
Te
rry
Fa
isa
lab
ad
-II
Fa
isa
lab
ad
-IF
ero
ze W
att
wa
n I
Fe
roze
Wa
ttw
an
II
Bh
ikk
iL
ah
ore
Dye
ing
Ho
me
Te
xti
leP
ow
er
Ge
ne
rati
on
Ho
tel
To
tal -
Gro
up
20
21
20
20
20
21
20
20
20
21
20
20
20
21
20
20
20
21
20
20
20
21
20
20
20
21
20
20
20
21
20
20
20
21
20
21
20
20
20
21
20
20
20
20
20
21
20
20
20
21
20
20
20
21
20
20
La
ho
re
To
tal a
sset
s for
repo
rtable
segm
ents
6,4
21,3
25
9,10
1,82
4 6,
907,
881
4,10
1,58
0 5,
225,
646
6,8
33,1
08
1,75
6,63
9 1,
815,
833
3,94
6,39
4 2,
705,
048
8,30
2,57
9 6,
172,
890
1,76
9,03
5 96
3,57
3 7,
893,
110
8,31
4,68
7 16
,494
,436
17
,235
,218
3,
223,
473
1,74
5,97
6 5,
885,
327
3,90
5,34
4 36
,562
,808
35
,676
,590
1,
255,
855
1,36
1,07
0 10
5,64
4,50
8 99
,932
,741
Un
alloc
ated
asse
ts:
Lo
ng te
rm in
vestm
ents
55,
330,
247
50,1
15,4
35
Sh
ort te
rm in
vestm
ent
- 17
,677
Ot
her r
eceiv
ables
5
,431
,355
4,
652,
267
Ca
sh an
d ban
k bala
nces
6
,397
,998
75
8,72
7
Ot
her c
orpora
te as
sets
3,1
13,0
48
2,92
1,38
1
To
tal a
sset
s as p
er co
nsoli
date
d sta
tem
ent
o
f fina
ncial
posit
ion
1
75,9
17,1
56 1
58,3
98,2
28
To
tal li
abilit
ies fo
r rep
orta
ble se
gmen
ts 9
50,5
85
841,
152
81,0
57
208,
341
19
5,93
0 20
2,89
5 13
,494
17
,232
25
9,48
6 53
9,42
3 91
4,77
1 90
8,11
3 32
8,33
8 17
8,88
6 1,
067,
200
861,
031
3,17
4,72
5 2,
563,
533
150,
375
36,5
73
1,11
5,09
8 72
7,22
1 6,
353,
665
8,72
1,22
2 58
,134
11
9,28
9 14
,662
,858
15
,924
,911
Un
alloc
ated
liabil
ities:
De
ferred
liabil
ities
2,5
72,6
34
1,9
73,0
11
Ot
her c
orpora
te lia
bilitie
s
3
8,00
8,96
8 32
,541
,015
To
tal li
abilit
ies as
per c
onso
lidat
ed
s
tate
men
t of f
inanc
ial po
sition
5
5,24
4,46
0 50
,438
,937
46.2
Geog
raph
ical in
form
ation
Th
e Grou
p's re
venu
e from
exter
nal c
ustom
ers by
geog
raphic
al loc
ation
is de
tailed
below
:
2021
20
20
(Rup
ees
in th
ousa
nd)
Eu
rope
22,4
08,5
82
20,3
94,2
68
As
ia, A
frica a
nd A
ustra
lia
18,4
16,0
68
21,0
24,7
37
Un
ited S
tates
of A
meric
a and
Can
ada
7,6
66,8
07
4,91
2,70
8
Pa
kistan
56
,236
,001
42
,378
,117
1
04,7
27,4
58
88,7
09,8
30
46.3
Signif
icant
non-
curre
nt as
sets
of the
Grou
p as a
t rep
orting
dates
are l
ocate
d and
opera
ting i
n Pak
istan
.
46.4
Reve
nue f
rom
majo
r cus
tom
ers
Ni
shat
Powe
r Lim
ited -
Sub
sidiar
y Com
pany
sells
elec
tricity
only
to CP
PA-G
whe
reas t
he G
roup's
reve
nue f
rom ot
her s
egme
nts is
earn
ed fr
om a
large
mix
of cu
stome
rs.
For the year ended June 30, 2021Notes to the Consolidated Financial Statements
Nishat Mills Limited and its Subsidiaries208
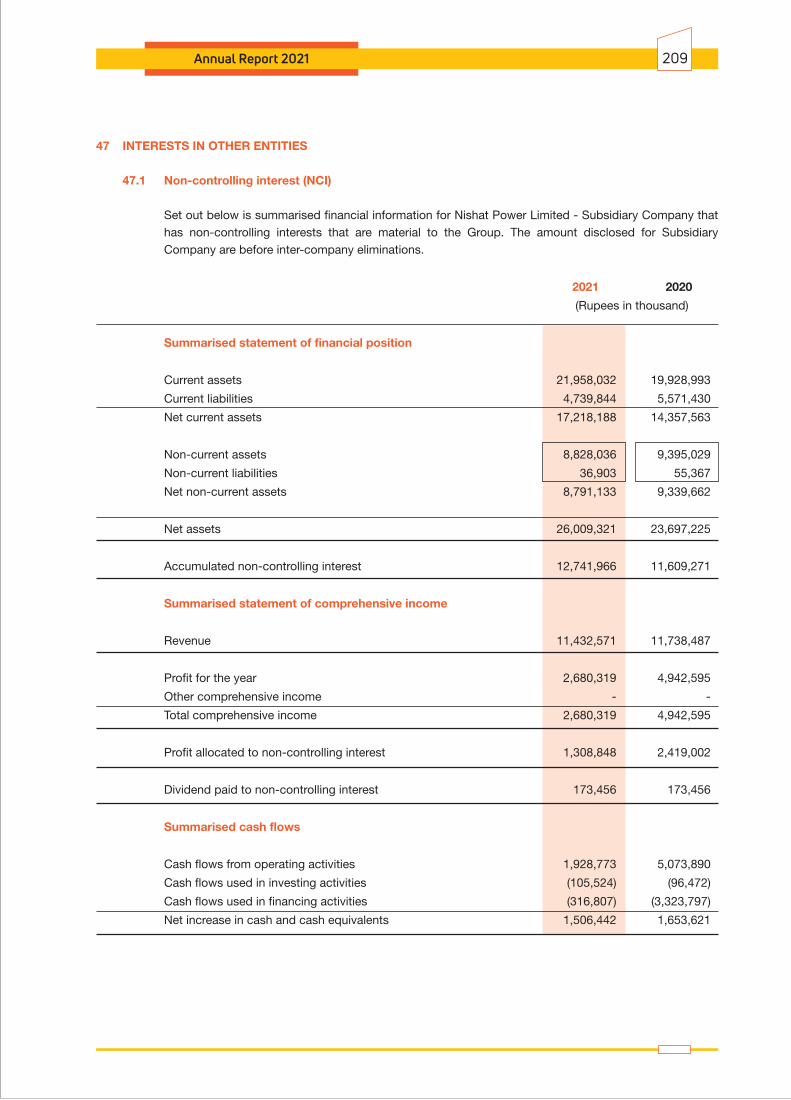
Annual Report 2021 209
47 INTERESTS IN OTHER ENTITIES
47.1 Non-controlling interest (NCI)
Set out below is summarised financial information for Nishat Power Limited - Subsidiary Company that has non-controlling interests that are material to the Group. The amount disclosed for Subsidiary Company are before inter-company eliminations.
2021 2020
(Rupees in thousand)
Summarised statement of financial position
Current assets 21,958,032 19,928,993
Current liabilities 4,739,844 5,571,430
Net current assets 17,218,188 14,357,563
Non-current assets 8,828,036 9,395,029
Non-current liabilities 36,903 55,367
Net non-current assets 8,791,133 9,339,662
Net assets 26,009,321 23,697,225
Accumulated non-controlling interest 12,741,966 11,609,271
Summarised statement of comprehensive income
Revenue 11,432,571 11,738,487
Profit for the year 2,680,319 4,942,595
Other comprehensive income - -
Total comprehensive income 2,680,319 4,942,595
Profit allocated to non-controlling interest 1,308,848 2,419,002
Dividend paid to non-controlling interest 173,456 173,456
Summarised cash flows
Cash flows from operating activities 1,928,773 5,073,890
Cash flows used in investing activities (105,524) (96,472)
Cash flows used in financing activities (316,807) (3,323,797)
Net increase in cash and cash equivalents 1,506,442 1,653,621
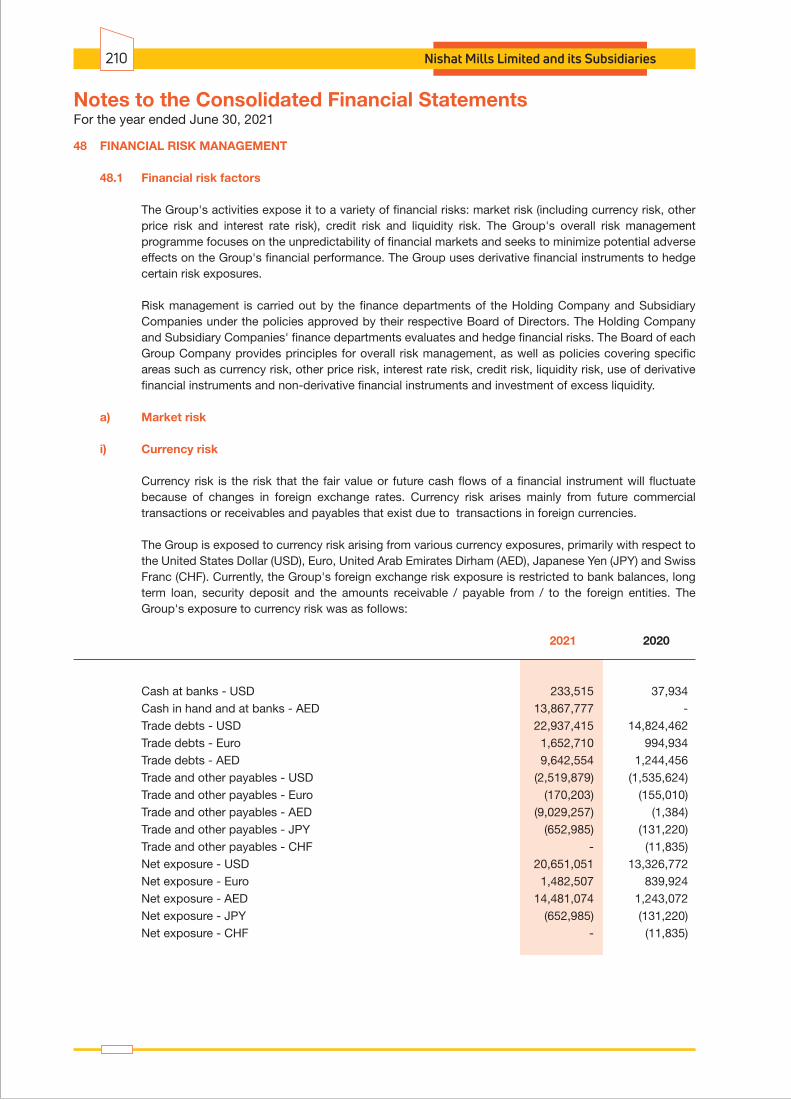
48 FINANCIAL RISK MANAGEMENT
48.1 Financial risk factors
The Group's activities expose it to a variety of financial risks: market risk (including currency risk, other price risk and interest rate risk), credit risk and liquidity risk. The Group's overall risk management programme focuses on the unpredictability of financial markets and seeks to minimize potential adverse effects on the Group's financial performance. The Group uses derivative financial instruments to hedge certain risk exposures.
Risk management is carried out by the finance departments of the Holding Company and Subsidiary Companies under the policies approved by their respective Board of Directors. The Holding Company and Subsidiary Companies' finance departments evaluates and hedge financial risks. The Board of each Group Company provides principles for overall risk management, as well as policies covering specific areas such as currency risk, other price risk, interest rate risk, credit risk, liquidity risk, use of derivative financial instruments and non-derivative financial instruments and investment of excess liquidity.
a) Market risk
i) Currency risk
Currency risk is the risk that the fair value or future cash flows of a financial instrument will fluctuate because of changes in foreign exchange rates. Currency risk arises mainly from future commercial transactions or receivables and payables that exist due to transactions in foreign currencies.
The Group is exposed to currency risk arising from various currency exposures, primarily with respect to the United States Dollar (USD), Euro, United Arab Emirates Dirham (AED), Japanese Yen (JPY) and Swiss Franc (CHF). Currently, the Group's foreign exchange risk exposure is restricted to bank balances, long term loan, security deposit and the amounts receivable / payable from / to the foreign entities. The Group's exposure to currency risk was as follows:
2021 2020
Cash at banks - USD 233,515 37,934 Cash in hand and at banks - AED 13,867,777 - Trade debts - USD 22,937,415 14,824,462 Trade debts - Euro 1,652,710 994,934 Trade debts - AED 9,642,554 1,244,456 Trade and other payables - USD (2,519,879) (1,535,624) Trade and other payables - Euro (170,203) (155,010) Trade and other payables - AED (9,029,257) (1,384) Trade and other payables - JPY (652,985) (131,220) Trade and other payables - CHF - (11,835) Net exposure - USD 20,651,051 13,326,772 Net exposure - Euro 1,482,507 839,924 Net exposure - AED 14,481,074 1,243,072 Net exposure - JPY (652,985) (131,220) Net exposure - CHF - (11,835)
For the year ended June 30, 2021Notes to the Consolidated Financial Statements
Nishat Mills Limited and its Subsidiaries210
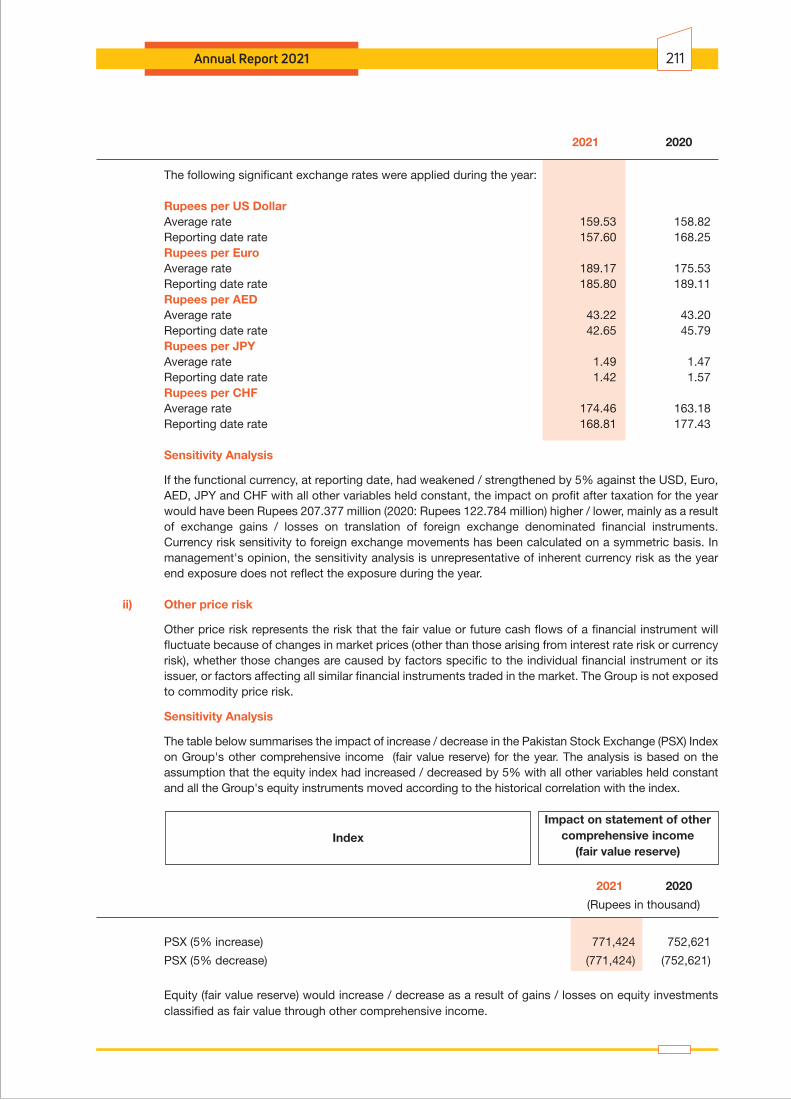
Annual Report 2021 211
2021 2020
The following significant exchange rates were applied during the year:
Rupees per US Dollar Average rate 159.53 158.82 Reporting date rate 157.60 168.25 Rupees per Euro Average rate 189.17 175.53 Reporting date rate 185.80 189.11 Rupees per AED Average rate 43.22 43.20 Reporting date rate 42.65 45.79 Rupees per JPY Average rate 1.49 1.47 Reporting date rate 1.42 1.57 Rupees per CHF Average rate 174.46 163.18 Reporting date rate 168.81 177.43 Sensitivity Analysis
If the functional currency, at reporting date, had weakened / strengthened by 5% against the USD, Euro, AED, JPY and CHF with all other variables held constant, the impact on profit after taxation for the year would have been Rupees 207.377 million (2020: Rupees 122.784 million) higher / lower, mainly as a result of exchange gains / losses on translation of foreign exchange denominated financial instruments. Currency risk sensitivity to foreign exchange movements has been calculated on a symmetric basis. In management's opinion, the sensitivity analysis is unrepresentative of inherent currency risk as the year end exposure does not reflect the exposure during the year.
ii) Other price risk
Other price risk represents the risk that the fair value or future cash flows of a financial instrument will fluctuate because of changes in market prices (other than those arising from interest rate risk or currency risk), whether those changes are caused by factors specific to the individual financial instrument or its issuer, or factors affecting all similar financial instruments traded in the market. The Group is not exposed to commodity price risk.
Sensitivity Analysis
The table below summarises the impact of increase / decrease in the Pakistan Stock Exchange (PSX) Index on Group's other comprehensive income (fair value reserve) for the year. The analysis is based on the assumption that the equity index had increased / decreased by 5% with all other variables held constant and all the Group's equity instruments moved according to the historical correlation with the index.
Impact on statement of other comprehensive income (fair value reserve)
2021 2020
(Rupees in thousand)
PSX (5% increase) 771,424 752,621
PSX (5% decrease) (771,424) (752,621)
Equity (fair value reserve) would increase / decrease as a result of gains / losses on equity investments classified as fair value through other comprehensive income.
Index
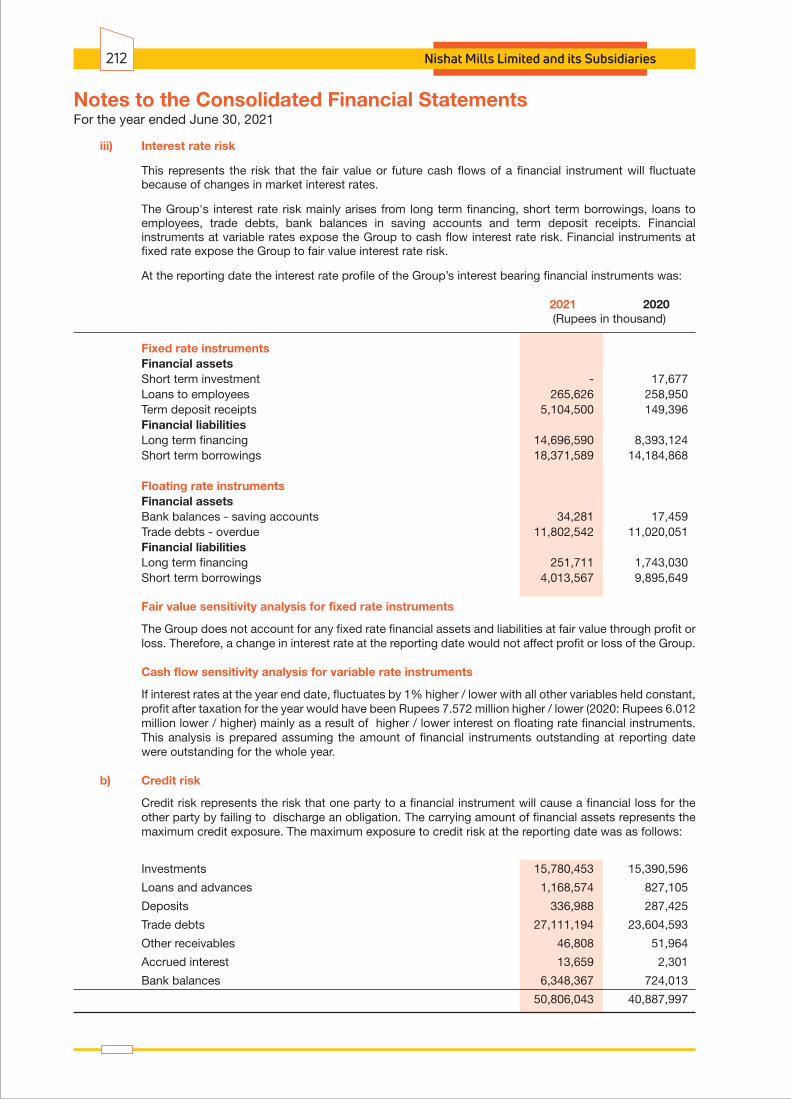
iii) Interest rate risk
This represents the risk that the fair value or future cash flows of a financial instrument will fluctuate because of changes in market interest rates.
The Group's interest rate risk mainly arises from long term financing, short term borrowings, loans to employees, trade debts, bank balances in saving accounts and term deposit receipts. Financial instruments at variable rates expose the Group to cash flow interest rate risk. Financial instruments at fixed rate expose the Group to fair value interest rate risk.
At the reporting date the interest rate profile of the Group’s interest bearing financial instruments was:
2021 2020 (Rupees in thousand)
Fixed rate instruments Financial assets Short term investment - 17,677 Loans to employees 265,626 258,950 Term deposit receipts 5,104,500 149,396 Financial liabilities Long term financing 14,696,590 8,393,124 Short term borrowings 18,371,589 14,184,868
Floating rate instruments Financial assets Bank balances - saving accounts 34,281 17,459 Trade debts - overdue 11,802,542 11,020,051 Financial liabilities Long term financing 251,711 1,743,030 Short term borrowings 4,013,567 9,895,649
Fair value sensitivity analysis for fixed rate instruments
The Group does not account for any fixed rate financial assets and liabilities at fair value through profit or loss. Therefore, a change in interest rate at the reporting date would not affect profit or loss of the Group.
Cash flow sensitivity analysis for variable rate instruments
If interest rates at the year end date, fluctuates by 1% higher / lower with all other variables held constant, profit after taxation for the year would have been Rupees 7.572 million higher / lower (2020: Rupees 6.012 million lower / higher) mainly as a result of higher / lower interest on floating rate financial instruments. This analysis is prepared assuming the amount of financial instruments outstanding at reporting date were outstanding for the whole year.
b) Credit risk
Credit risk represents the risk that one party to a financial instrument will cause a financial loss for the other party by failing to discharge an obligation. The carrying amount of financial assets represents the maximum credit exposure. The maximum exposure to credit risk at the reporting date was as follows:
Investments 15,780,453 15,390,596
Loans and advances 1,168,574 827,105
Deposits 336,988 287,425
Trade debts 27,111,194 23,604,593
Other receivables 46,808 51,964
Accrued interest 13,659 2,301
Bank balances 6,348,367 724,013
50,806,043 40,887,997
For the year ended June 30, 2021Notes to the Consolidated Financial Statements
Nishat Mills Limited and its Subsidiaries212

Annual Report 2021 213
Rating 2021 2020
Short term Long term Agency (Rupees in thousand)
The credit quality of financial assets that are neither past due nor impaired can be assessed by reference to external credit ratings (If available) or to historical information about counterparty default rate:
Banks
National Bank of Pakistan A1+ AAA PACRA 1,434 8,766Allied Bank Limited A1+ AAA PACRA 4,549 391Askari Bank Limited A1+ AA+ PACRA 61 454Bank Alfalah Limited A1+ AA+ PACRA 12,087 135,577Faysal Bank Limited A1+ AA PACRA 15,811 35,214Habib Bank Limited A-1+ AAA JCR-VIS 19,585 2,374Habib Metropolitan Bank Limited A1+ AA+ PACRA 23,163 1,360JS Bank Limited A1+ AA- PACRA 24 66MCB Bank Limited A1+ AAA PACRA 6,026,704 154,619Samba Bank Limited A1+ AAA JCR-VIS 274 298,056Silk Bank Limited A-1 AA JCR-VIS 68 73Standard Chartered Bank (Pakistan) Limited A-2 A - PACRA 80,265 37,610United Bank Limited A1+ AAA JCR-VIS 1,790 10,463Al Baraka Bank (Pakistan) Limited A-1+ AAA PACRA 268 269Citi Bank N.A. P-1 Aa3 Moody's 203 133Bank Islami Pakistan Limited A1 A+ PACRA 191 391Meezan Bank Limited A-1+ AAA JCR-VIS 36,573 5,320Dubai Islamic Bank Pakistan Limited A-1+ AA JCR-VIS 352 354The Bank of Punjab A1+ AA+ PACRA 297 189Soneri Bank Limited A1+ AA- PACRA 2,470 394Summit Bank Limited A-3 BBB- JCR-VIS 257 257Industrial and Commercial Bank of China P-1 A1 Moody’s 114 6MCB Islamic Bank Limited A1 A PACRA 705 239HAB Bank Unknown - 5,961 7,501Bank of China P-1 A1 Moody’s 4,913 16,548Habib Bank AG Zurich, UAE NP Caa1 Moody’s 53,957 6,752ICBC Standard Bank F1 A- Moody’s 42,788 -Bank Al-Habib Limited A1+ AAA PACRA 13,496 629Burj Bank Limited A-1 A+ JCR-VIS 1 2The Bank of Khyber A1 A PACRA 6 6 6,348,367 724,013
Investments
Adamjee Insurance Company Limited AA+ PACRA 4,263 3,404Alhamra Islamic Stock Fund AM1 PACRA 12,661 9,723Nishat (Chunian) Limited A A-2 JCR-VIS 1,643,947 1,060,767MCB Bank Limited A1+ AAA PACRA 14,067,484 14,264,635Pakistan Petroleum Limited Unknown - 52,098 52,067 15,780,453 15,390,596 22,128,820 16,114,609
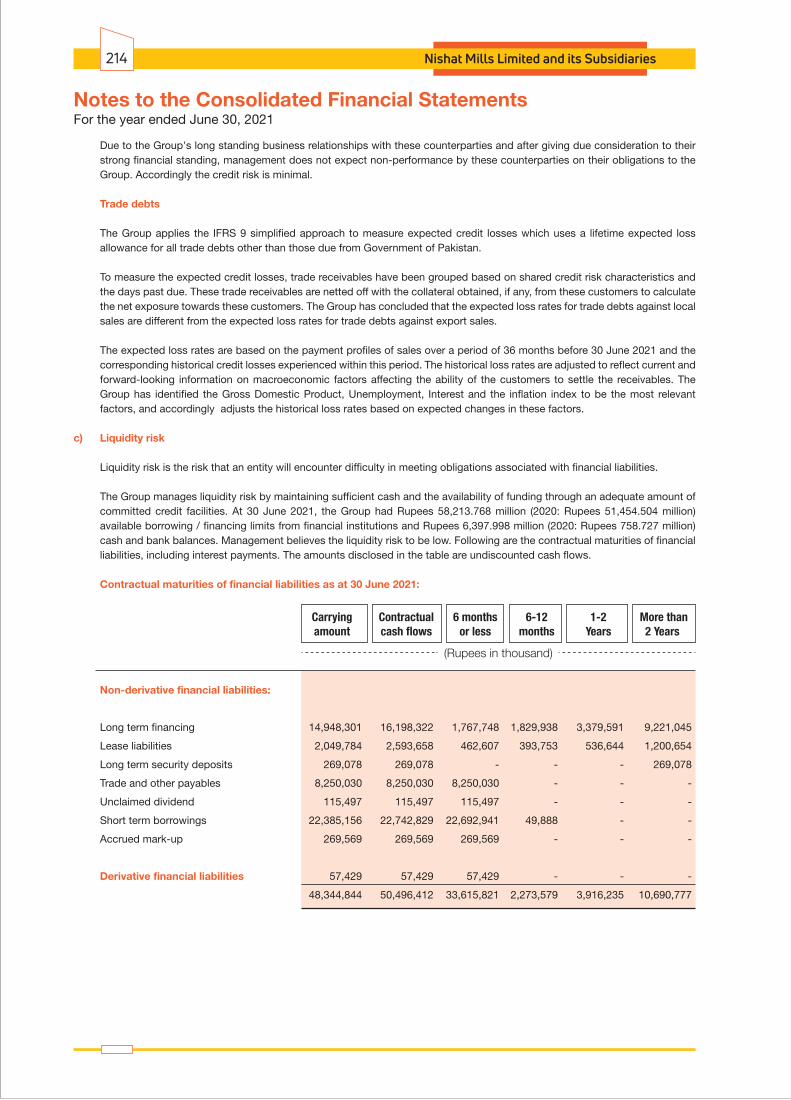
For the year ended June 30, 2021Notes to the Consolidated Financial Statements
Nishat Mills Limited and its Subsidiaries214
Carryingamount
Contractualcash flows
6 monthsor less
6-12months
1-2Years
More than2 Years
(Rupees in thousand)
Due to the Group's long standing business relationships with these counterparties and after giving due consideration to their strong financial standing, management does not expect non-performance by these counterparties on their obligations to the Group. Accordingly the credit risk is minimal.
Trade debts
The Group applies the IFRS 9 simplified approach to measure expected credit losses which uses a lifetime expected loss allowance for all trade debts other than those due from Government of Pakistan.
To measure the expected credit losses, trade receivables have been grouped based on shared credit risk characteristics and the days past due. These trade receivables are netted off with the collateral obtained, if any, from these customers to calculate the net exposure towards these customers. The Group has concluded that the expected loss rates for trade debts against local sales are different from the expected loss rates for trade debts against export sales.
The expected loss rates are based on the payment profiles of sales over a period of 36 months before 30 June 2021 and the corresponding historical credit losses experienced within this period. The historical loss rates are adjusted to reflect current and forward-looking information on macroeconomic factors affecting the ability of the customers to settle the receivables. The Group has identified the Gross Domestic Product, Unemployment, Interest and the inflation index to be the most relevant factors, and accordingly adjusts the historical loss rates based on expected changes in these factors.
c) Liquidity risk
Liquidity risk is the risk that an entity will encounter difficulty in meeting obligations associated with financial liabilities.
The Group manages liquidity risk by maintaining sufficient cash and the availability of funding through an adequate amount of committed credit facilities. At 30 June 2021, the Group had Rupees 58,213.768 million (2020: Rupees 51,454.504 million) available borrowing / financing limits from financial institutions and Rupees 6,397.998 million (2020: Rupees 758.727 million) cash and bank balances. Management believes the liquidity risk to be low. Following are the contractual maturities of financial liabilities, including interest payments. The amounts disclosed in the table are undiscounted cash flows.
Contractual maturities of financial liabilities as at 30 June 2021:
Non-derivative financial liabilities:
Long term financing 14,948,301 16,198,322 1,767,748 1,829,938 3,379,591 9,221,045
Lease liabilities 2,049,784 2,593,658 462,607 393,753 536,644 1,200,654
Long term security deposits 269,078 269,078 - - - 269,078
Trade and other payables 8,250,030 8,250,030 8,250,030 - - -
Unclaimed dividend 115,497 115,497 115,497 - - -
Short term borrowings 22,385,156 22,742,829 22,692,941 49,888 - -
Accrued mark-up 269,569 269,569 269,569 - - -
Derivative financial liabilities 57,429 57,429 57,429 - - -
48,344,844 50,496,412 33,615,821 2,273,579 3,916,235 10,690,777
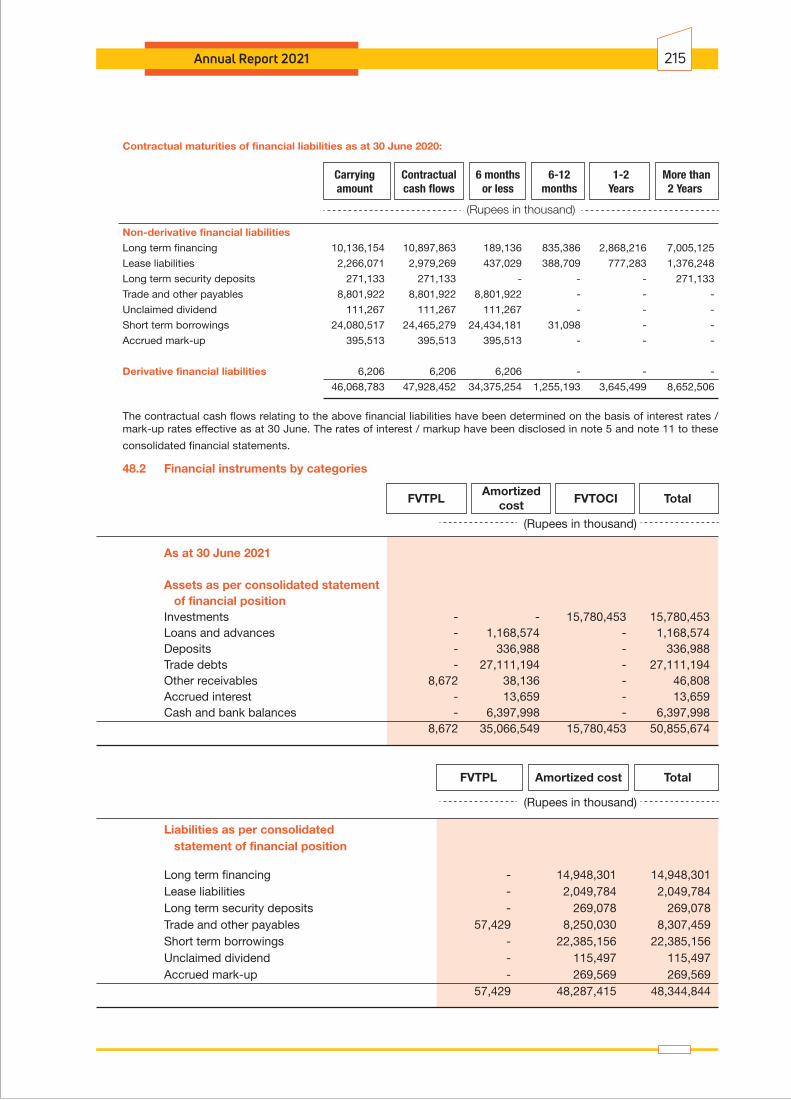
Contractual maturities of financial liabilities as at 30 June 2020:
Non-derivative financial liabilities
Long term financing 10,136,154 10,897,863 189,136 835,386 2,868,216 7,005,125
Lease liabilities 2,266,071 2,979,269 437,029 388,709 777,283 1,376,248
Long term security deposits 271,133 271,133 - - - 271,133
Trade and other payables 8,801,922 8,801,922 8,801,922 - - -
Unclaimed dividend 111,267 111,267 111,267 - - -
Short term borrowings 24,080,517 24,465,279 24,434,181 31,098 - -
Accrued mark-up 395,513 395,513 395,513 - - -
Derivative financial liabilities 6,206 6,206 6,206 - - -
46,068,783 47,928,452 34,375,254 1,255,193 3,645,499 8,652,506
The contractual cash flows relating to the above financial liabilities have been determined on the basis of interest rates / mark-up rates effective as at 30 June. The rates of interest / markup have been disclosed in note 5 and note 11 to these
consolidated financial statements.
Carryingamount
Contractualcash flows
6 monthsor less
6-12months
1-2Years
More than2 Years
(Rupees in thousand)
48.2 Financial instruments by categories
(Rupees in thousand)
As at 30 June 2021
Assets as per consolidated statement of financial position Investments - - 15,780,453 15,780,453 Loans and advances - 1,168,574 - 1,168,574 Deposits - 336,988 - 336,988 Trade debts - 27,111,194 - 27,111,194 Other receivables 8,672 38,136 - 46,808 Accrued interest - 13,659 - 13,659 Cash and bank balances - 6,397,998 - 6,397,998 8,672 35,066,549 15,780,453 50,855,674
(Rupees in thousand)
Liabilities as per consolidated statement of financial position
Long term financing - 14,948,301 14,948,301 Lease liabilities - 2,049,784 2,049,784 Long term security deposits - 269,078 269,078 Trade and other payables 57,429 8,250,030 8,307,459 Short term borrowings - 22,385,156 22,385,156 Unclaimed dividend - 115,497 115,497 Accrued mark-up - 269,569 269,569 57,429 48,287,415 48,344,844
TotalFVTPL FVTOCIAmortized
cost
TotalAmortized costFVTPL
Annual Report 2021 215
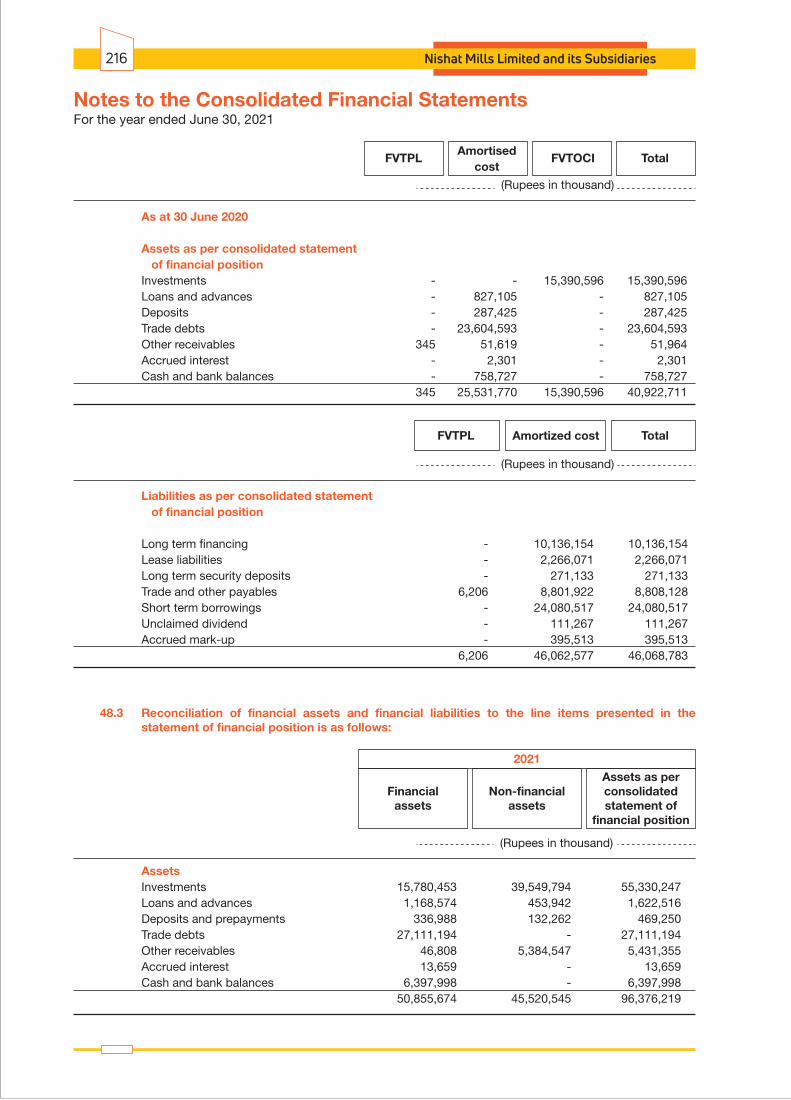
For the year ended June 30, 2021Notes to the Consolidated Financial Statements
Nishat Mills Limited and its Subsidiaries216
TotalFVTOCIFVTPLAmortised
cost
(Rupees in thousand)
As at 30 June 2020
Assets as per consolidated statement of financial position Investments - - 15,390,596 15,390,596 Loans and advances - 827,105 - 827,105 Deposits - 287,425 - 287,425 Trade debts - 23,604,593 - 23,604,593 Other receivables 345 51,619 - 51,964 Accrued interest - 2,301 - 2,301 Cash and bank balances - 758,727 - 758,727 345 25,531,770 15,390,596 40,922,711
(Rupees in thousand)
Liabilities as per consolidated statement of financial position
Long term financing - 10,136,154 10,136,154 Lease liabilities - 2,266,071 2,266,071 Long term security deposits - 271,133 271,133 Trade and other payables 6,206 8,801,922 8,808,128 Short term borrowings - 24,080,517 24,080,517 Unclaimed dividend - 111,267 111,267 Accrued mark-up - 395,513 395,513 6,206 46,062,577 46,068,783
48.3 Reconciliation of financial assets and financial liabilities to the line items presented in the statement of financial position is as follows:
Assets Investments 15,780,453 39,549,794 55,330,247 Loans and advances 1,168,574 453,942 1,622,516 Deposits and prepayments 336,988 132,262 469,250 Trade debts 27,111,194 - 27,111,194 Other receivables 46,808 5,384,547 5,431,355 Accrued interest 13,659 - 13,659 Cash and bank balances 6,397,998 - 6,397,998 50,855,674 45,520,545 96,376,219
TotalAmortized costFVTPL
Assets as perconsolidatedstatement of
financial position
Financialassets
Non-financialassets
2021
(Rupees in thousand)

Annual Report 2021 217
Liabilities Long term financing 14,948,301 - 14,948,301 Lease liabilities 2,049,784 - 2,049,784 Long term security deposits 269,078 - 269,078 Trade and other payables 8,307,459 3,082,599 11,390,058 Short term borrowings 22,385,156 - 22,385,156 Unclaimed dividend 115,497 - 115,497 Accrued mark-up 269,569 - 269,569 48,344,844 3,082,599 51,427,443
Assets Investments 15,390,596 34,742,516 50,133,112 Loans and advances 827,105 254,289 1,081,394 Deposits and prepayments 287,425 122,858 410,283 Trade debts 23,604,593 - 23,604,593 Other receivables 51,964 4,600,303 4,652,267 Accrued interest 2,301 - 2,301 Cash and bank balances 758,727 - 758,727 40,922,711 39,719,966 80,642,677
Liabilities Long term financing 10,136,154 - 10,136,154 Lease liabilities 2,266,071 - 2,266,071 Long term security deposits 271,133 - 271,133 Trade and other payables 8,808,128 2,376,137 11,184,265 Short term borrowings 24,080,517 - 24,080,517 Unclaimed dividend 111,267 - 111,267 Accrued mark-up 395,513 - 395,513 46,068,783 2,376,137 48,444,920
Liabilities asper consolidated
statement offinancial position
Financialliabilities
Non-financialliabilities
2021
(Rupees in thousand)
Liabilities asper consolidated
statement offinancial position
Financialliabilities
Non-financialliabilities
2020
(Rupees in thousand)
Assets as perconsolidatedstatement of
financial position
Financialassets
Non-financialassets
2020
(Rupees in thousand)

49 Capital risk management
The Group's objectives when managing capital are to safeguard the Group's ability to continue as a going concern in order to provide returns for shareholders and benefits for other stakeholders and to maintain an optimal capital structure to reduce the cost of capital. In order to maintain or adjust the capital structure, the Group may adjust the amount of dividends paid to shareholders, issue new shares or sell assets to reduce debt. Consistent with others in the industry and the requirements of the lenders, the Group monitors the capital structure on the basis of gearing ratio. This ratio is calculated as borrowings divided by total capital employed. Borrowings represent long term financing, short term borrowings obtained by the Group as referred to in note 5 and note 11 respectively. Total capital employed includes 'total equity' as shown in the consolidated statement of financial position plus 'borrowings'.
2021 2020
Borrowings Rupees in thousand 37,333,457 34,216,671
Total equity Rupees in thousand 120,672,696 107,959,291
Total capital employed Rupees in thousand 158,006,153 142,175,962
Gearing ratio Percentage 23.63 24.07
50 FAIR VALUE MEASUREMENTS - FINANCIAL INSTRUMENTS
i) Fair value hierarchy
Judgments and estimates are made in determining the fair values of the financial instruments that are recognised and measured at fair value in these consolidated financial statements. To provide an indication about the reliability of the inputs used in determining fair value, the Group has classified its financial instruments into the following three levels. An explanation of each level follows underneath the table.
Recurring fair value measurements At 30 June 2021
(Rupees in thousand)
Financial assets
Fair value through other
comprehensive income 15,780,453 - - 15,780,453
Derivative financial assets - 8,672 - 8,672
Total financial assets 15,780,453 8,672 - 15,789,125
Financial liabilities
Derivative financial liabilities - 57,429 - 57,429
Total financial liabilities - 57,429 - 57,429
Level 1 Level 2 Level 3 Total
For the year ended June 30, 2021Notes to the Consolidated Financial Statements
Nishat Mills Limited and its Subsidiaries218

Recurring fair value measurements At 30 June 2020
(Rupees in thousand)
Financial assets
Fair value through other
comprehensive income 15,390,596 - - 15,390,596
Derivative financial assets - 345 - 345
Total financial assets 15,390,596 345 - 15,390,941
Financial liabilities
Derivative financial liabilities - 6,206 - 6,206
Total financial liabilities - 6,206 - 6,206
The above table does not include fair value information for financial assets and financial liabilities not measured at fair value if the carrying amounts are a reasonable approximation of fair value. Due to short term nature, carrying amounts of certain financial assets and financial liabilities are considered to be the same as their fair value. For the majority of the non-current receivables, the fair values are also not significantly different to their carrying amounts.
There were no transfers between levels 1 and 2 for recurring fair value measurements during the year. Further there was no transfer out of level 3 measurements.
The Group’s policy is to recognise transfers into and transfers out of fair value hierarchy levels as at the end of the reporting period.
Level 1: The fair value of financial instruments traded in active markets (such as publicly traded derivatives, and equity securities) is based on quoted market prices at the end of the reporting period. The quoted market price used for financial assets held by the Group is the current bid price. These instruments are included in level 1.
Level 2: The fair value of financial instruments that are not traded in an active market (for example, over-the-counter derivatives) is determined using valuation techniques which maximise the use of observable market data and rely as little as possible on entity-specific estimates. If all significant inputs required to fair value an instrument are observable, the instrument is included in level 2.
Level 3: If one or more of the significant inputs is not based on observable market data, the instrument is included in level 3. This is the case for unlisted equity securities.
(ii) Valuation techniques used to determine fair values
Specific valuation techniques used to value financial instruments include the use of quoted market prices or dealer quotes for similar instruments.
Level 1 Level 2 Level 3 Total
Annual Report 2021 219
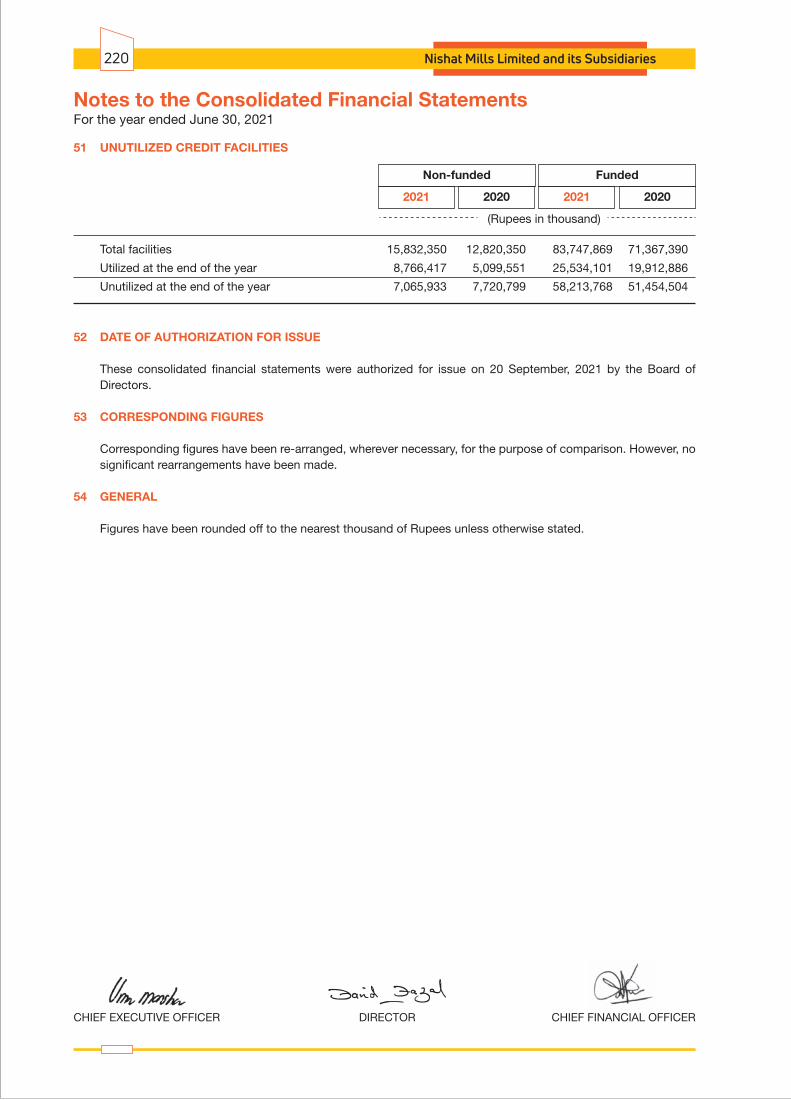
CHIEF EXECUTIVE OFFICER CHIEF FINANCIAL OFFICERDIRECTOR
2021 2020 2021 2020
FundedNon-funded
Total facilities 15,832,350 12,820,350 83,747,869 71,367,390
Utilized at the end of the year 8,766,417 5,099,551 25,534,101 19,912,886
Unutilized at the end of the year 7,065,933 7,720,799 58,213,768 51,454,504
52 DATE OF AUTHORIZATION FOR ISSUE
These consolidated financial statements were authorized for issue on 20 September, 2021 by the Board of Directors.
53 CORRESPONDING FIGURES
Corresponding figures have been re-arranged, wherever necessary, for the purpose of comparison. However, no significant rearrangements have been made.
54 GENERAL
Figures have been rounded off to the nearest thousand of Rupees unless otherwise stated.
(Rupees in thousand)
51 UNUTILIZED CREDIT FACILITIES
For the year ended June 30, 2021Notes to the Consolidated Financial Statements
Nishat Mills Limited and its Subsidiaries220

Annual Report 2021 221
Number ofShareholders
Having sharesPercentage
From ToShares Held
4,388 1 100 154,611 0.04 4,222 101 500 1,181,932 0.34 1,466 501 1,000 1,213,531 0.35 1,880 1,001 5,000 4,853,574 1.38 436 5,001 10,000 3,377,977 0.96 156 10,001 15,000 2,015,708 0.57 109 15,001 20,000 1,945,175 0.55 81 20,001 25,000 1,915,079 0.54 51 25,001 30,000 1,427,256 0.41 35 30,001 35,000 1,158,266 0.33 26 35,001 40,000 996,119 0.28 17 40,001 45,000 737,428 0.21 32 45,001 50,000 1,565,011 0.45 15 50,001 55,000 803,537 0.23 13 55,001 60,000 758,200 0.22 9 60,001 65,000 572,538 0.16 4 65,001 70,000 277,000 0.08 15 70,001 75,000 1,093,799 0.31 6 75,001 80,000 471,118 0.13 9 80,001 85,000 743,437 0.21 10 85,001 90,000 886,787 0.25 3 90,001 95,000 278,097 0.08 19 95,001 100,000 1,883,600 0.54 5 100,001 105,000 514,900 0.15 7 105,001 110,000 755,625 0.21 1 110,001 115,000 113,000 0.03 8 115,001 120,000 946,542 0.27 4 120,001 125,000 490,306 0.14 10 125,001 130,000 1,282,726 0.36 3 130,001 135,000 401,222 0.11 2 135,001 140,000 277,081 0.08 1 140,001 145,000 145,000 0.04 7 145,001 150,000 1,043,931 0.30 1 150,001 155,000 154,500 0.04 2 155,001 160,000 315,500 0.09 5 160,001 165,000 814,655 0.23 2 165,001 170,000 331,200 0.09 6 170,001 175,000 1,037,520 0.30 2 175,001 180,000 357,400 0.10 1 180,001 185,000 184,300 0.05 1 190,001 195,000 195,000 0.06 7 195,001 200,000 1,393,800 0.40 2 200,001 205,000 403,200 0.11 1 205,001 210,000 210,000 0.06 1 210,001 215,000 211,771 0.06 5 215,001 220,000 1,086,875 0.31 3 220,001 225,000 672,500 0.19 1 225,001 230,000 225,438 0.06 2 230,001 235,000 468,500 0.13 2 235,001 240,000 477,500 0.14
of the Shares held by the Shareholders of Nishat Mills Limited as at June 30, 2021Pattern of Holding
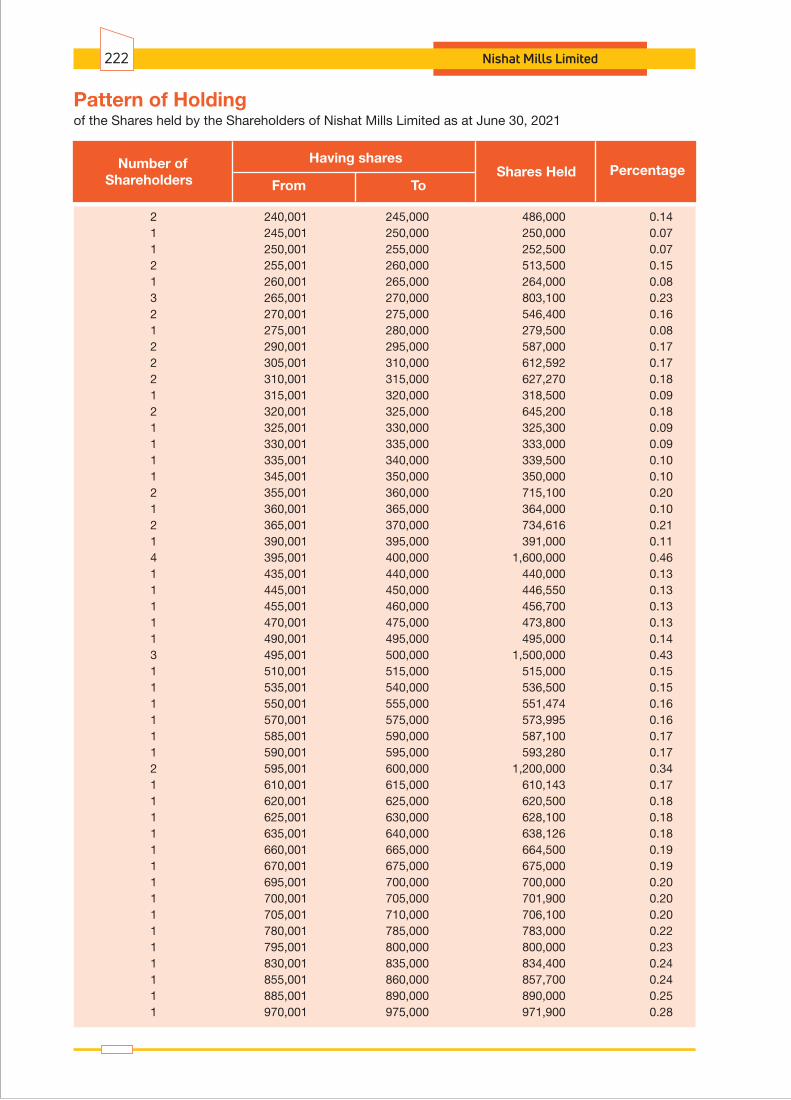
of the Shares held by the Shareholders of Nishat Mills Limited as at June 30, 2021Pattern of Holding
Number ofShareholders
Having sharesPercentage
From ToShares Held
2 240,001 245,000 486,000 0.14 1 245,001 250,000 250,000 0.07 1 250,001 255,000 252,500 0.07 2 255,001 260,000 513,500 0.15 1 260,001 265,000 264,000 0.08 3 265,001 270,000 803,100 0.23 2 270,001 275,000 546,400 0.16 1 275,001 280,000 279,500 0.08 2 290,001 295,000 587,000 0.17 2 305,001 310,000 612,592 0.17 2 310,001 315,000 627,270 0.18 1 315,001 320,000 318,500 0.09 2 320,001 325,000 645,200 0.18 1 325,001 330,000 325,300 0.09 1 330,001 335,000 333,000 0.09 1 335,001 340,000 339,500 0.10 1 345,001 350,000 350,000 0.10 2 355,001 360,000 715,100 0.20 1 360,001 365,000 364,000 0.10 2 365,001 370,000 734,616 0.21 1 390,001 395,000 391,000 0.11 4 395,001 400,000 1,600,000 0.46 1 435,001 440,000 440,000 0.13 1 445,001 450,000 446,550 0.13 1 455,001 460,000 456,700 0.13 1 470,001 475,000 473,800 0.13 1 490,001 495,000 495,000 0.14 3 495,001 500,000 1,500,000 0.43 1 510,001 515,000 515,000 0.15 1 535,001 540,000 536,500 0.15 1 550,001 555,000 551,474 0.16 1 570,001 575,000 573,995 0.16 1 585,001 590,000 587,100 0.17 1 590,001 595,000 593,280 0.17 2 595,001 600,000 1,200,000 0.34 1 610,001 615,000 610,143 0.17 1 620,001 625,000 620,500 0.18 1 625,001 630,000 628,100 0.18 1 635,001 640,000 638,126 0.18 1 660,001 665,000 664,500 0.19 1 670,001 675,000 675,000 0.19 1 695,001 700,000 700,000 0.20 1 700,001 705,000 701,900 0.20 1 705,001 710,000 706,100 0.20 1 780,001 785,000 783,000 0.22 1 795,001 800,000 800,000 0.23 1 830,001 835,000 834,400 0.24 1 855,001 860,000 857,700 0.24 1 885,001 890,000 890,000 0.25 1 970,001 975,000 971,900 0.28
Nishat Mills Limited222

Number ofShareholders
Having sharesPercentage
From ToShares Held
1 995,001 1,000,000 996,501 0.28 1 1,055,001 1,060,000 1,057,000 0.30 1 1,060,001 1,065,000 1,061,285 0.30 1 1,080,001 1,085,000 1,082,100 0.31 1 1,100,001 1,105,000 1,102,300 0.31 1 1,120,001 1,125,000 1,125,000 0.32 1 1,155,001 1,160,000 1,158,900 0.33 1 1,195,001 1,200,000 1,196,971 0.34 1 1,270,001 1,275,000 1,272,500 0.36 1 1,295,001 1,300,000 1,300,000 0.37 1 1,310,001 1,315,000 1,313,500 0.37 1 1,320,001 1,325,000 1,323,000 0.38 1 1,375,001 1,380,000 1,380,000 0.39 1 1,440,001 1,445,000 1,442,000 0.41 1 1,450,001 1,455,000 1,451,500 0.41 1 1,470,001 1,475,000 1,470,300 0.42 1 1,510,001 1,515,000 1,512,300 0.43 1 1,570,001 1,575,000 1,572,000 0.45 1 1,620,001 1,625,000 1,625,000 0.46 1 1,815,001 1,820,000 1,820,000 0.52 1 1,945,001 1,950,000 1,946,841 0.55 1 1,985,001 1,990,000 1,986,500 0.57 1 2,410,001 2,415,000 2,415,000 0.69 1 2,545,001 2,550,000 2,549,700 0.73 1 2,725,001 2,730,000 2,728,028 0.78 1 2,810,001 2,815,000 2,814,900 0.80 1 2,835,001 2,840,000 2,839,871 0.81 1 3,170,001 3,175,000 3,171,882 0.90 1 3,235,001 3,240,000 3,236,899 0.92 1 3,245,001 3,250,000 3,250,000 0.92 1 3,485,001 3,490,000 3,488,454 0.99 1 3,995,001 4,000,000 4,000,000 1.14 1 4,065,001 4,070,000 4,066,831 1.16 1 4,420,001 4,425,000 4,423,400 1.26 1 4,780,001 4,785,000 4,785,000 1.36 1 5,380,001 5,385,000 5,383,500 1.53 1 6,450,001 6,455,000 6,450,913 1.83 1 7,225,001 7,230,000 7,230,000 2.06 1 9,245,001 9,250,000 9,247,800 2.63 1 14,495,001 14,500,000 14,496,760 4.12 1 15,075,001 15,080,000 15,075,149 4.29 1 18,695,001 18,700,000 18,698,357 5.32 1 21,190,001 21,195,000 21,191,146 6.03 1 23,100,001 23,105,000 23,101,426 6.57 1 25,670,001 25,675,000 25,673,659 7.30 1 26,245,001 26,250,000 26,248,841 7.47 1 29,225,001 29,230,000 29,228,216 8.31 13,208 351,599,848 100.00
of the Shares held by the Shareholders of Nishat Mills Limited as at June 30, 2021Pattern of Holding
Annual Report 2021 223
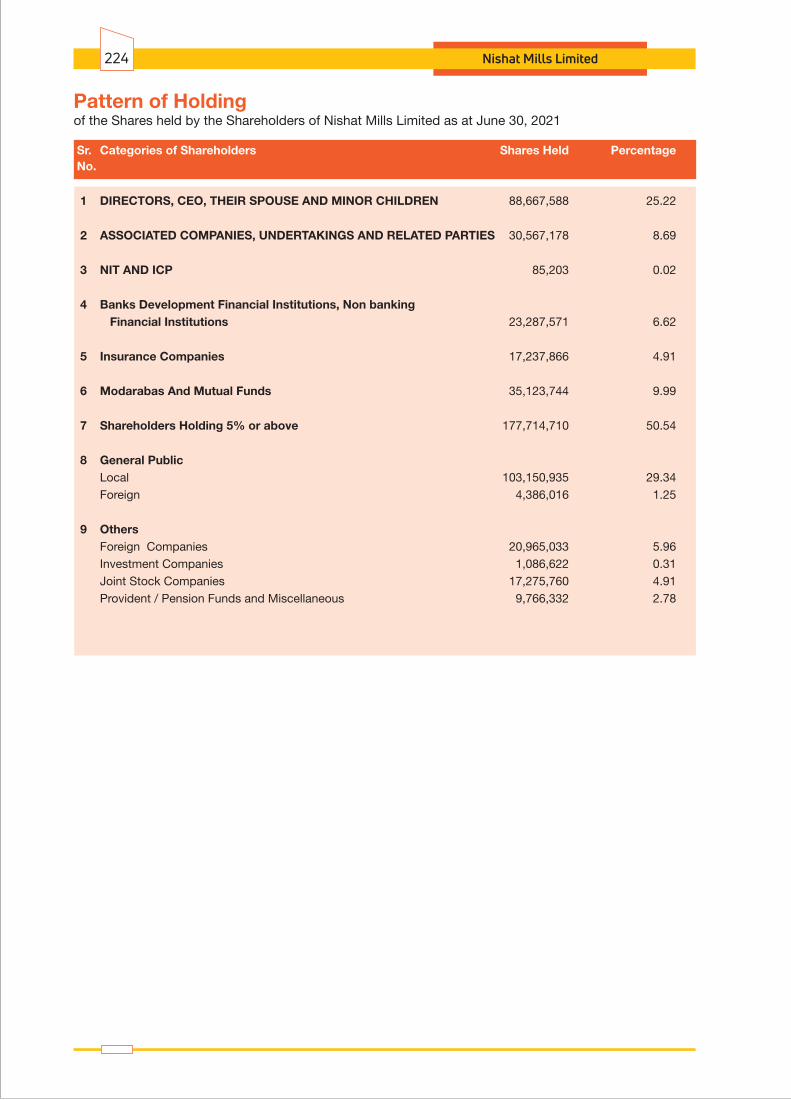
Nishat Mills Limited224
of the Shares held by the Shareholders of Nishat Mills Limited as at June 30, 2021Pattern of Holding
Sr. Categories of Shareholders Shares Held Percentage No.
1 DIRECTORS, CEO, THEIR SPOUSE AND MINOR CHILDREN 88,667,588 25.22
2 ASSOCIATED COMPANIES, UNDERTAKINGS AND RELATED PARTIES 30,567,178 8.69
3 NIT AND ICP 85,203 0.02
4 Banks Development Financial Institutions, Non banking Financial Institutions 23,287,571 6.62
5 Insurance Companies 17,237,866 4.91
6 Modarabas And Mutual Funds 35,123,744 9.99
7 Shareholders Holding 5% or above 177,714,710 50.54
8 General Public Local 103,150,935 29.34 Foreign 4,386,016 1.25
9 Others Foreign Companies 20,965,033 5.96 Investment Companies 1,086,622 0.31 Joint Stock Companies 17,275,760 4.91 Provident / Pension Funds and Miscellaneous 9,766,332 2.78
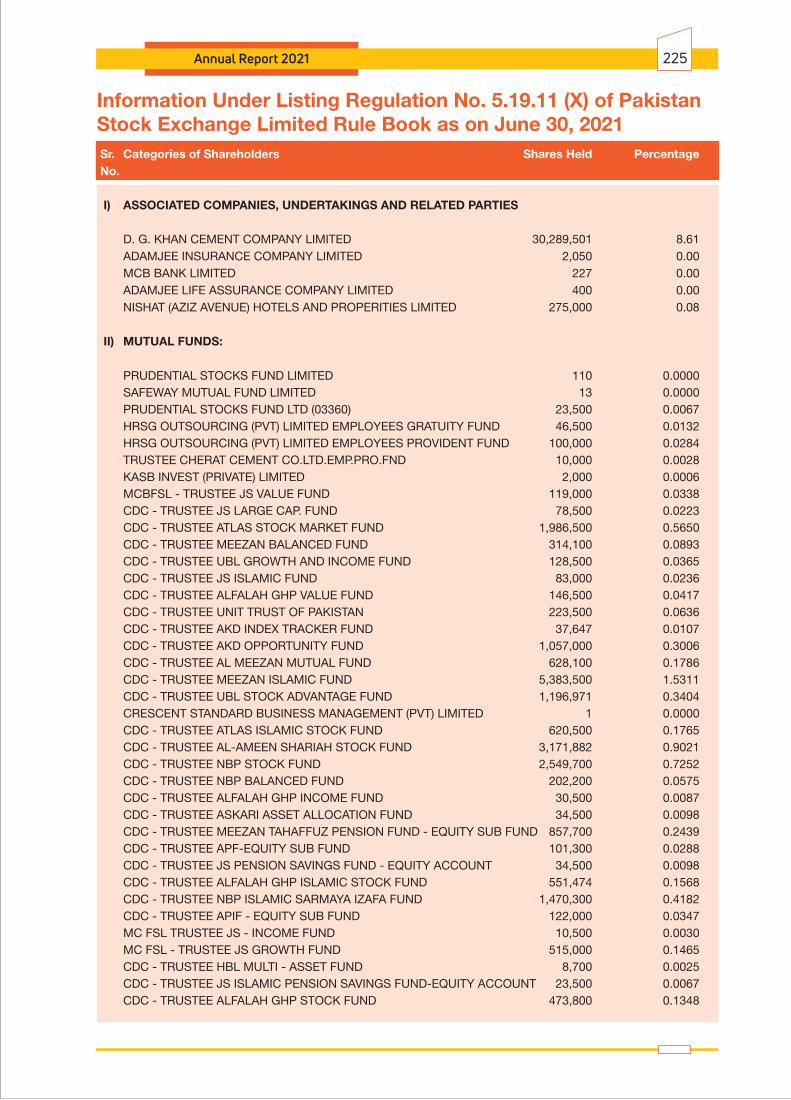
Annual Report 2021 225
Information Under Listing Regulation No. 5.19.11 (X) of PakistanStock Exchange Limited Rule Book as on June 30, 2021 Sr. Categories of Shareholders Shares Held Percentage No.
I) ASSOCIATED COMPANIES, UNDERTAKINGS AND RELATED PARTIES
D. G. KHAN CEMENT COMPANY LIMITED 30,289,501 8.61 ADAMJEE INSURANCE COMPANY LIMITED 2,050 0.00 MCB BANK LIMITED 227 0.00 ADAMJEE LIFE ASSURANCE COMPANY LIMITED 400 0.00 NISHAT (AZIZ AVENUE) HOTELS AND PROPERITIES LIMITED 275,000 0.08
II) MUTUAL FUNDS:
PRUDENTIAL STOCKS FUND LIMITED 110 0.0000 SAFEWAY MUTUAL FUND LIMITED 13 0.0000 PRUDENTIAL STOCKS FUND LTD (03360) 23,500 0.0067 HRSG OUTSOURCING (PVT) LIMITED EMPLOYEES GRATUITY FUND 46,500 0.0132 HRSG OUTSOURCING (PVT) LIMITED EMPLOYEES PROVIDENT FUND 100,000 0.0284 TRUSTEE CHERAT CEMENT CO.LTD.EMP.PRO.FND 10,000 0.0028 KASB INVEST (PRIVATE) LIMITED 2,000 0.0006 MCBFSL - TRUSTEE JS VALUE FUND 119,000 0.0338 CDC - TRUSTEE JS LARGE CAP. FUND 78,500 0.0223 CDC - TRUSTEE ATLAS STOCK MARKET FUND 1,986,500 0.5650 CDC - TRUSTEE MEEZAN BALANCED FUND 314,100 0.0893 CDC - TRUSTEE UBL GROWTH AND INCOME FUND 128,500 0.0365 CDC - TRUSTEE JS ISLAMIC FUND 83,000 0.0236 CDC - TRUSTEE ALFALAH GHP VALUE FUND 146,500 0.0417 CDC - TRUSTEE UNIT TRUST OF PAKISTAN 223,500 0.0636 CDC - TRUSTEE AKD INDEX TRACKER FUND 37,647 0.0107 CDC - TRUSTEE AKD OPPORTUNITY FUND 1,057,000 0.3006 CDC - TRUSTEE AL MEEZAN MUTUAL FUND 628,100 0.1786 CDC - TRUSTEE MEEZAN ISLAMIC FUND 5,383,500 1.5311 CDC - TRUSTEE UBL STOCK ADVANTAGE FUND 1,196,971 0.3404 CRESCENT STANDARD BUSINESS MANAGEMENT (PVT) LIMITED 1 0.0000 CDC - TRUSTEE ATLAS ISLAMIC STOCK FUND 620,500 0.1765 CDC - TRUSTEE AL-AMEEN SHARIAH STOCK FUND 3,171,882 0.9021 CDC - TRUSTEE NBP STOCK FUND 2,549,700 0.7252 CDC - TRUSTEE NBP BALANCED FUND 202,200 0.0575 CDC - TRUSTEE ALFALAH GHP INCOME FUND 30,500 0.0087 CDC - TRUSTEE ASKARI ASSET ALLOCATION FUND 34,500 0.0098 CDC - TRUSTEE MEEZAN TAHAFFUZ PENSION FUND - EQUITY SUB FUND 857,700 0.2439 CDC - TRUSTEE APF-EQUITY SUB FUND 101,300 0.0288 CDC - TRUSTEE JS PENSION SAVINGS FUND - EQUITY ACCOUNT 34,500 0.0098 CDC - TRUSTEE ALFALAH GHP ISLAMIC STOCK FUND 551,474 0.1568 CDC - TRUSTEE NBP ISLAMIC SARMAYA IZAFA FUND 1,470,300 0.4182 CDC - TRUSTEE APIF - EQUITY SUB FUND 122,000 0.0347 MC FSL TRUSTEE JS - INCOME FUND 10,500 0.0030 MC FSL - TRUSTEE JS GROWTH FUND 515,000 0.1465 CDC - TRUSTEE HBL MULTI - ASSET FUND 8,700 0.0025 CDC - TRUSTEE JS ISLAMIC PENSION SAVINGS FUND-EQUITY ACCOUNT 23,500 0.0067 CDC - TRUSTEE ALFALAH GHP STOCK FUND 473,800 0.1348

Nishat Mills Limited226
Sr. Categories of Shareholders Shares Held Percentage No.
CDC - TRUSTEE ALFALAH GHP ALPHA FUND 196,300 0.0558 CDC - TRUSTEE NIT-EQUITY MARKET OPPORTUNITY FUND 1,946,841 0.5537 CDC - TRUSTEE ABL STOCK FUND 536,500 0.1526 CDC - TRUSTEE FIRST HABIB STOCK FUND 18,000 0.0051 CDC - TRUSTEE LAKSON EQUITY FUND 706,100 0.2008 CDC - TRUSTEE NBP SARMAYA IZAFA FUND 235,000 0.0668 CDC - TRUSTEE NBP MAHANA AMDANI FUND - MT 39,500 0.0112 CDC-TRUSTEE HBL ISLAMIC STOCK FUND 45,100 0.0128 CDC - TRUSTEE NBP FINANCIAL SECTOR INCOME FUND 154,500 0.0439 CDC - TRUSTEE HBL IPF EQUITY SUB FUND 25,500 0.0073 CDC - TRUSTEE HBL PF EQUITY SUB FUND 26,000 0.0074 CDC - TRUSTEE KSE MEEZAN INDEX FUND 446,550 0.1270 MCBFSL - TRUSTEE PAK OMAN ADVANTAGE ASSET ALLOCATION FUND 31,500 0.0090 MCBFSL - TRUSTEE PAK OMAN ISLAMIC ASSET ALLOCATION FUND 58,000 0.0165 CDC-TRUSTEE FIRST HABIB ISLAMIC STOCK FUND 48,700 0.0139 CDC - TRUSTEE ATLAS INCOME FUND - MT 65,000 0.0185 CDC-TRUSTEE UBL INCOME OPPORTUNITY FUND 264,000 0.0751 MCBFSL - TRUSTEE ABL ISLAMIC STOCK FUND 293,800 0.0836 CDC - TRUSTEE UBL ASSET ALLOCATION FUND 36,100 0.0103 CDC - TRUSTEE FIRST CAPITAL MUTUAL FUND 30,000 0.0085 CDC - TRUSTEE AL-AMEEN ISLAMIC ASSET ALLOCATION FUND 293,200 0.0834 CDC - TRUSTEE AWT ISLAMIC STOCK FUND 162,000 0.0461 CDC-TRUSTEE AL-AMEEN ISLAMIC RET. SAV. FUND-EQUITY SUB FUND 323,200 0.0919 CDC - TRUSTEE NATIONAL INVESTMENT (UNIT) TRUST 3,236,899 0.9206 CDC - TRUSTEE HBL ISLAMIC EQUITY FUND 35,000 0.0100 CDC - TRUSTEE NBP ISLAMIC STOCK FUND 1,512,300 0.4301 CDC - TRUSTEE NBP INCOME OPPORTUNITY FUND - MT 47,000 0.0134 CDC - TRUSTEE AWT STOCK FUND 89,600 0.0255 CDC - TRUSTEE NIT ISLAMIC EQUITY FUND 355,100 0.1010 CDC-TRUSTEE NITIPF EQUITY SUB-FUND 25,000 0.0071 CDC-TRUSTEE NITPF EQUITY SUB-FUND 14,500 0.0041 CDC - TRUSTEE NBP SAVINGS FUND - MT 83,500 0.0237 CDC - TRUSTEE NBP ISLAMIC ACTIVE ALLOCATION EQUITY FUND 162,100 0.0461 CDC - TRUSTEE HBL ISLAMIC ASSET ALLOCATION FUND 22,200 0.0063 CDC - TRUSTEE FAYSAL MTS FUND - MT 10,000 0.0028 CDC - TRUSTEE MEEZAN ASSET ALLOCATION FUND 197,500 0.0562 CDC - TRUSTEE LAKSON TACTICAL FUND 86,987 0.0247 CDC - TRUSTEE LAKSON ISLAMIC TACTICAL FUND 74,199 0.0211 CDC - TRUSTEE ALFALAH GHP ISLAMIC DEDICATED EQUITY FUND 125,726 0.0358 CDC TRUSTEE - MEEZAN DEDICATED EQUITY FUND 127,200 0.0362 CDC - TRUSTEE FIRST HABIB ASSET ALLOCATION FUND 7,500 0.0021 MCBFSL - TRUSTEE AKD ISLAMIC STOCK FUND 110,000 0.0313 CDC - TRUSTEE JS ISLAMIC DEDICATED EQUITY FUND (JSIDEF) 5,139 0.0015 CDC - TRUSTEE NBP ISLAMIC REGULAR INCOME FUND 35,000 0.0100 CDC - TRUSTEE ATLAS ISLAMIC DEDICATED STOCK FUND 59,500 0.0169 CDC - TRUSTEE GOLDEN ARROW STOCK FUND 171,000 0.0486 CDC - TRUSTEE NIT ASSET ALLOCATION FUND 55,000 0.0156 CDC - TRUSTEE AGIPF EQUITY SUB-FUND 18,600 0.0053 CDC - TRUSTEE AGPF EQUITY SUB-FUND 12,800 0.0036
Information Under Listing Regulation No. 5.19.11 (X) of PakistanStock Exchange Limited Rule Book as on June 30, 2021
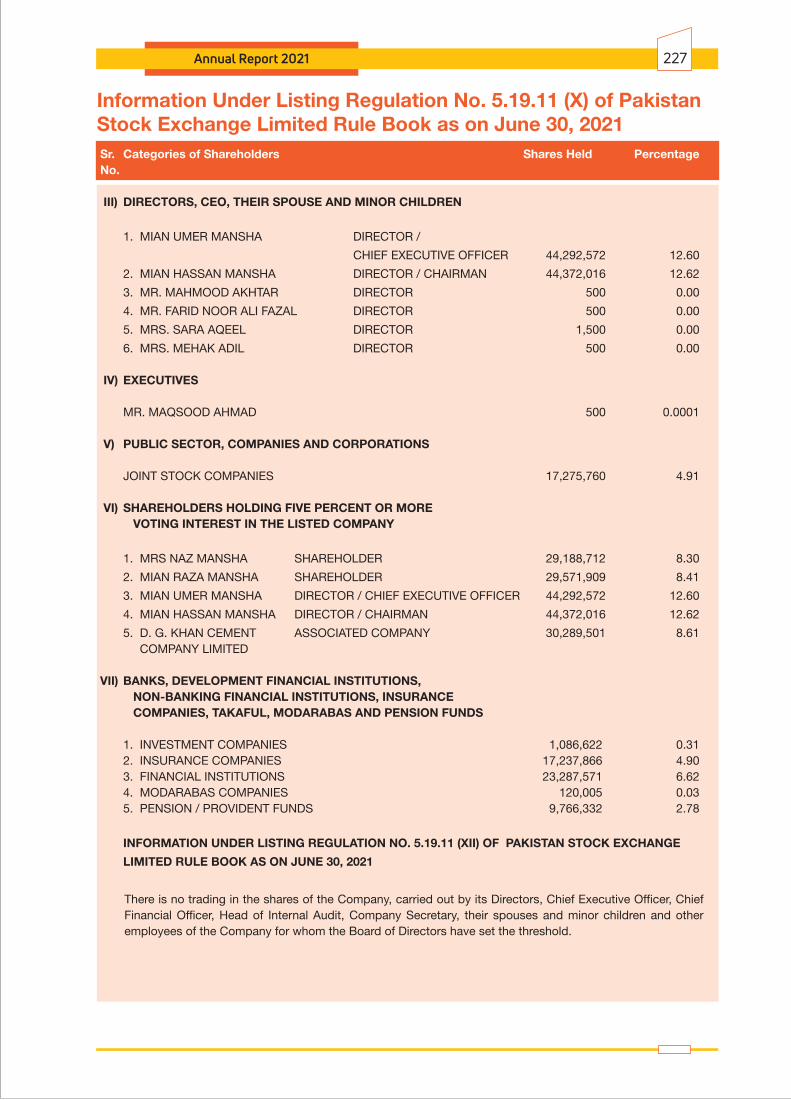
Annual Report 2021 227
Sr. Categories of Shareholders Shares Held Percentage No.
III) DIRECTORS, CEO, THEIR SPOUSE AND MINOR CHILDREN
1. MIAN UMER MANSHA DIRECTOR /
CHIEF EXECUTIVE OFFICER 44,292,572 12.60
2. MIAN HASSAN MANSHA DIRECTOR / CHAIRMAN 44,372,016 12.62
3. MR. MAHMOOD AKHTAR DIRECTOR 500 0.00
4. MR. FARID NOOR ALI FAZAL DIRECTOR 500 0.00
5. MRS. SARA AQEEL DIRECTOR 1,500 0.00
6. MRS. MEHAK ADIL DIRECTOR 500 0.00
IV) EXECUTIVES
MR. MAQSOOD AHMAD 500 0.0001
V) PUBLIC SECTOR, COMPANIES AND CORPORATIONS
JOINT STOCK COMPANIES 17,275,760 4.91
VI) SHAREHOLDERS HOLDING FIVE PERCENT OR MORE VOTING INTEREST IN THE LISTED COMPANY
1. MRS NAZ MANSHA SHAREHOLDER 29,188,712 8.30
2. MIAN RAZA MANSHA SHAREHOLDER 29,571,909 8.41
3. MIAN UMER MANSHA DIRECTOR / CHIEF EXECUTIVE OFFICER 44,292,572 12.60
4. MIAN HASSAN MANSHA DIRECTOR / CHAIRMAN 44,372,016 12.62
5. D. G. KHAN CEMENT ASSOCIATED COMPANY 30,289,501 8.61 COMPANY LIMITED
VII) BANKS, DEVELOPMENT FINANCIAL INSTITUTIONS, NON-BANKING FINANCIAL INSTITUTIONS, INSURANCE COMPANIES, TAKAFUL, MODARABAS AND PENSION FUNDS
1. INVESTMENT COMPANIES 1,086,622 0.31 2. INSURANCE COMPANIES 17,237,866 4.90 3. FINANCIAL INSTITUTIONS 23,287,571 6.62 4. MODARABAS COMPANIES 120,005 0.03 5. PENSION / PROVIDENT FUNDS 9,766,332 2.78
INFORMATION UNDER LISTING REGULATION NO. 5.19.11 (XII) OF PAKISTAN STOCK EXCHANGE
LIMITED RULE BOOK AS ON JUNE 30, 2021
There is no trading in the shares of the Company, carried out by its Directors, Chief Executive Officer, Chief Financial Officer, Head of Internal Audit, Company Secretary, their spouses and minor children and other employees of the Company for whom the Board of Directors have set the threshold.
Information Under Listing Regulation No. 5.19.11 (X) of PakistanStock Exchange Limited Rule Book as on June 30, 2021
Nishat Mills Limited228
Annual Report 2021 229

Nishat Mills Limited230
Annual Report 2021 231
Nishat Mills Limited232
Annual Report 2021 233

Nishat Mills Limited234

Annual Report 2021 235
Nishat Mills Limited236
Annual Report 2021 237
Nishat Mills Limited238
Annual Report 2021 239
Nishat Mills Limited240
(000) 2021(000) 2020
71,431,010
9,317,855
11,137,991
2,838,310
1,229,179
2,722,637
7,070,502
5,922,470
60,904,096
7,276,126
8,719,892
2,738,196
1,502,412
2,044,302
4,479,284
3,506,284

Form of Proxy
as witness may hand this day of 2021
Signed by the said member
in presence of
Signature of witness
Name
Address
CNIC #
Signature of witness
Name
Address
CNIC #
Please quote:
Pleaseaffix
revenuestampRs. 50
Signature(s) of Member(s)
I /We
of
being a member of Nishat Mills Limited, hereby appoint
of
or failing him/her
of
member(s) of the Company, as my/our proxy in my/our absence to attend and vote for me/us and on my/our behalf at the Annual General Meeting of the Company to be held on October 28, 2021 (Thursday), at 03:30 p.m at Emporium Mall, The Nishat Hotel, Trade and Finance Centre Block, Near Expo Centre, Abdul Haq Road, Johar Town, Lahore.
Folio No. Shares held CDC A/C. No.
Important: This instrument appointing a proxy, duly completed, must be received at the Registered Office of the Company at Nishat House, 53-A, Lawrence Road, Lahore not later than 48 hours before the time to holding the annual general meeting.

AFFIXCORRECTPOSTAGE
The Company Secretary
NISHAT MILLS LIMITEDNishat House, 53-A, Lawrence Road, Lahore.Tel: 042 - 36360154UAN: 042 - 111 113 333

2021
AFFIXCORRECTPOSTAGE
The Company Secretary
NISHAT MILLS LIMITEDNishat House, 53-A, Lawrence Road, Lahore.Tel: 042 - 36360154UAN: 042 - 111 113 333


VE
RS
AT
ILE
P
h: +
92 4
2 37
17 3
282
REGISTERED OFFICE:Nishat House, 53-A, Lawrence Road, LahoreTel: 042-36360154, 042-111 113 [email protected]