annual report 2020 | gea
220
ANNUAL REPORT 2020
-
Upload
khangminh22 -
Category
Documents
-
view
0 -
download
0
Transcript of annual report 2020 | gea

ANNUAL REPORT 2020

GEA significantly boosts profitability in 2020 and expects revenue and earnings to increase in 2021
GEA’s business model has demonstrated stability in the pandemic. Order intake and revenue remained significantly more stable than the industry average despite the Covid-19 pandemic. Consistently implemented efficiency measures enabled GEA to improve its net assets, financial position and results of operations in a challenging economic environment.
2020 forecasts met and partially exceeded• Revenue down 5.0% to EUR 4,635 million• EBITDA before restructuring measures up 11.1% to EUR 532 million, EBITDA margin up 170 basis points to 11.5%• ROCE significantly improved – up 650 basis points to 17.1%• Stringent net working capital management and strong cash generation• Net Working Capital/revenue nearly halved to 7.9%, down from 14.0%• Strong increase in net liquidity, rising by EUR 374 million to EUR 402 million
Dividend proposal: stable at EUR 0.85 per share
Outlook for 2021: Despite the ongoing pandemic, GEA expects slight organic growth in revenue, EBITDA before restructuring measures of between EUR 530 and EUR 580 million and ROCE of between 16 and 20 percent.
Financial Key Figures of GEA
(EUR million) 2020 2019Change
in %
Results of operationsOrder intake 4,703.0 4,931.1 –4.6Book-to-bill ratio 1.01 1.01 –Order backlog 2,298.5 2,412.4 –4.7Revenue 4,635.1 4,879.7 –5.0EBITDA before restructuring measures 532.5 479.2 11.1as % of revenue 11.5 9.8 –
EBITDA 478.3 374.4 27.8EBIT before restructuring measures 331.4 271.4 22.1as % of revenue 7.1 5.6 –
EBIT 221.2 –109.1 –EBT 197.1 –125.5 –Profit for the period 96.8 –170.7 –ROCE in %1 17.1 10.6 –
Financial positionCash flow from operating activities 717.8 483.2 48.6Cash flow from investing activities –92.2 –141.0 34.6Free cash flow 625.6 342.2 82.8
Net assetsNet working capital (reporting date) 366.8 682.0 –46.2as % of revenue (LTM) 7.9 14.0 –
Capital employed (reporting date) 1,642.0 2,141.1 –23.3Equity 1,921.4 2,090.1 –8.1Equity ratio in % 33.8 36.6 –Leverage2 –0.9 x –0.1 x –Net liquidity (+)/Net debt (-) 402.3 28.4 > 100
GEA SharesEarnings per share (EUR) 0.54 –0.95 –Earnings per share before restructuring measures (EUR) 1.03 0.98 5.1Market capitalization (EUR billion; reporting date) 5.3 5.3 –0.7
Employees (FTE; reporting date) 18,232 18,490 –1.4Total workforce (FTE; reporting date) 19,268 20,075 –4.0
1) Capital employed excluding goodwill from the acquisition of the former GEA AG by former Metallgesellschaft AG in 1999 (average of the last 4 quarters).2) Total net debt/cons. EBITDA based on frozen GAAP (covenant concept).
2GEA Annual Report 2020

To our Shareholders 4Achievement of Targets 2020 5GEA at a Glance 6GEA Executive Board 12Letter to Shareholders 13Report of the Supervisory Board 15GEA Shares/Investor Relations 20
Combined Group Management Report 23Fundamental Information about the Group 24Report on Economic Position 37Corporate Governance Statement 59Remuneration Report 67Non-financial Group Statement 83Report on Risks and Opportunities 104Report on Expected Developments 117
Consolidated Financial Statements 122Consolidated Balance Sheet 123Consolidated Income Statement 124Consolidated Statement of Comprehensive Income 125Consolidated Cash Flow Statement 126Consolidated Statement of Changes in Equity 127Notes to the Consolidated Financial Statements 128 1. Reporting Principles 128
2. Accounting Policies, Estimates and Management Judgment 130 3. Risk Management and Financial Instruments 142 4. Divestments 152 5. Consolidated Balance Sheet Disclosures: Assets 153 6. Consolidated Balance Sheet Disclosures: Liabilities 162 7. Consolidated Income Statement Disclosures 176 8. Contingent Liabilities, other Financial Obligations, Contingent Assets and Litigation 186 9. Segment Reporting 187 10. Other Disclosures 192 11. Events after the End of the Reporting Period 195 12. Supplemental Disclosures in Accordance with Section 315e of the HGB 196
Further Information 202Independent Auditor‘s Report 203Limited Assurance Report of the Independent Auditor regarding the Non-financial Group Statement 212Responsibility Statement 214Corporate Bodies and their Mandates 215Key Figures by Quarter 218Financial Calendar/Imprint 219
Contents
Cover image: GEA Remote Eye Wear
Near the beginning of the crisis, GEA acted quickly to provide its customers with
specialized, easily configurable remote support solutions so that they could access support from GEA’s experts without having to meet in person. One such solution, in addition to the protected video streaming service via a
commercially available mobile device, was the enhanced real-time communication made
possible by GEA Remote Eye Wear. More information about this can be
found in the “Research & Development” section.
3GEA Annual Report 2020

4GEA Annual Report 2020
Achievement of Targets 2020 5GEA at a Glance 6GEA Executive Board 12Letter to Shareholders 13Report of the Supervisory Board 15GEA Shares/Investor Relations 20
To our Shareholders

Fiscal year 2020
GEA successfully navigated the challenges of 2020, a year dominated by the global Covid-19 pandemic. The company was quick to respond to these exceptional circumstances and took swift precautions to ensure the safety of its employees and the continuation of business operations.
In addition, GEA further strengthened its position by pushing ahead with the implementation of efficiency measures. Despite the expected decline in order intake and revenue due to the pandemic, GEA was able to generate higher profit margins and considerably increase EBITDA before restructuring measures thanks to these efforts. Consequently, the group met, and in some cases even exceeded, its targets for revenue, earnings and return on capital employed (ROCE) in the past fiscal year. Major financial performance indicators, such as net working capital, free cash flow and liquidity, showed sustainable improvement.
Revenue At EUR 4.64 billion, revenue declined by 5.0 percent. At constant exchange rates, revenue declined by 2.6 percent. The change was therefore in line with the initial forecast of a slight decline in revenue on a currency-adjusted basis.
EBITDA before restructuring measures GEA generated EBITDA before restructuring measures of EUR 532 million. Adjusted for exchange rate effects, EBITDA came in at EUR 542 million, exceeding both the guidance range of between EUR 430 and 480 million issued in March 2020 and the higher expectations that emerged later in the year. At the end of July, guidance was raised to the upper end of the range. GEA again raised its guidance to more than EUR 500 million in early November.
Return on capital employed (ROCE) GEA achieved a ROCE of 17.1 percent. This figure significantly exceeds the guidance range of between 9.0 and 11.0 percent issued in March 2020. GEA also raised its ROCE guidance range to between 12.0 and 14.0 percent in July and again in early November to between 15.0 and 17.0 percent.
%
%
%
5GEA Annual Report 2020
Achievement of Targets 2020
GEA at a Glance
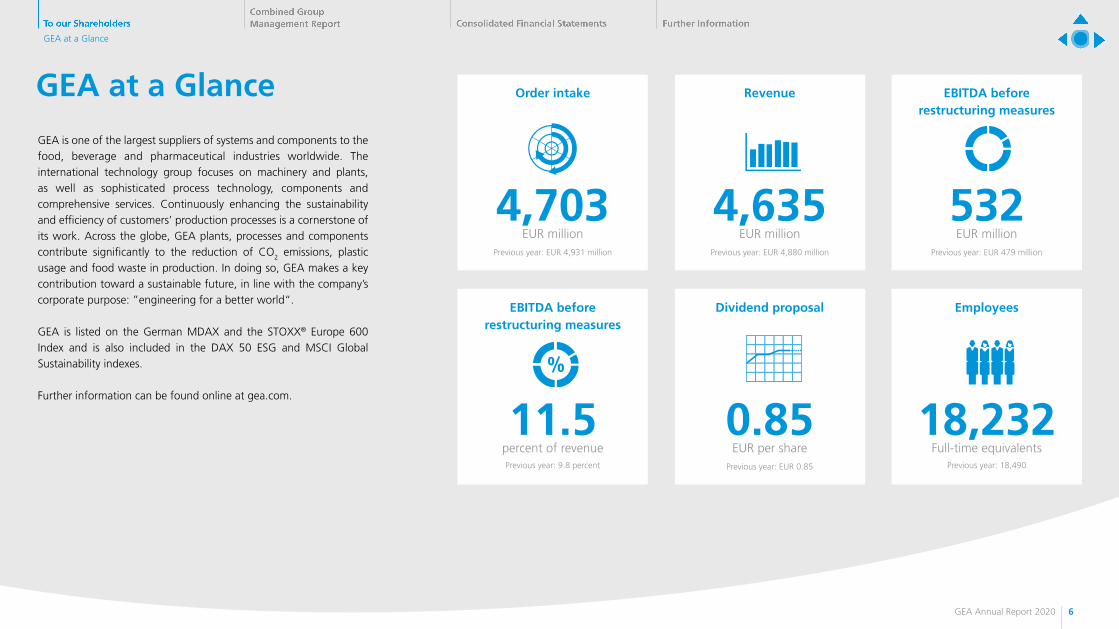
GEA is one of the largest suppliers of systems and components to the food, beverage and pharmaceutical industries worldwide. The international technology group focuses on machinery and plants, as well as sophisticated process technology, components and comprehensive services. Continuously enhancing the sustainability and efficiency of customers’ production processes is a cornerstone of its work. Across the globe, GEA plants, processes and components contribute significantly to the reduction of CO2 emissions, plastic usage and food waste in production. In doing so, GEA makes a key contribution toward a sustainable future, in line with the company’s corporate purpose: ”engineering for a better world“.
GEA is listed on the German MDAX and the STOXX® Europe 600 Index and is also included in the DAX 50 ESG and MSCI Global Sustainability indexes.
Further information can be found online at gea.com.
4,703 EUR million
Previous year: EUR 4,931 million
4,635 EUR million
Previous year: EUR 4,880 million
532 EUR million
Previous year: EUR 479 million
Order intake Revenue EBITDA before restructuring measures
11.5 percent of revenuePrevious year: 9.8 percent
0.85 EUR per share
Previous year: EUR 0.85
18,232Full-time equivalents
Previous year: 18,490
%
% %
EBITDA before restructuring measures
Dividend proposal Employees
%
%
6GEA Annual Report 2020
GEA at a Glance

Separation & Flow Technologies DivisionWorld-class performance from the process champions
1,192EUR million
Previous year: EUR 1,238 million
Revenue EBITDA before restructuring measures
EBITDA before restructuring measures
Employees
255EUR million
Previous year: EUR 247 million
21.4percent
Previous year: 20.0 percent
4,543 Full-time equivalents
Previous year: 4,455
Separators // Homogenizers // Valves & Pumps
Separation & Flow Technologies encompasses GEA process engineering components and machines that are at the heart of so many production processes: separators, decanters, homogenizers, valves and pumps.
These solutions contribute to a cleaner environment in many industrial applications and ensure the efficient separation and homogenization of liquids for use in diverse high-quality products that consumers enjoy and also rely on. GEA pumps and valves guarantee that raw materials and products move efficiently and safely through plants.
%
% %%
7GEA Annual Report 2020
GEA at a Glance
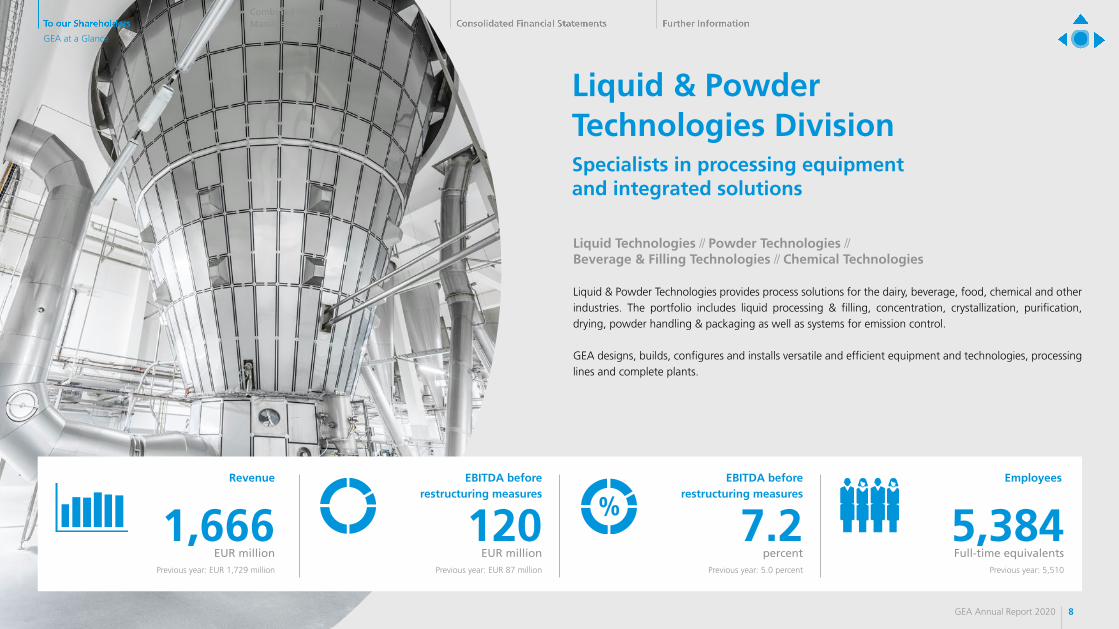
Liquid & Powder Technologies DivisionSpecialists in processing equipment and integrated solutions
1,666EUR million
Previous year: EUR 1,729 million
Revenue EBITDA before restructuring measures
EBITDA before restructuring measures
Employees
120EUR million
Previous year: EUR 87 million
7.2percent
Previous year: 5.0 percent
5,384 Full-time equivalents
Previous year: 5,510
Liquid Technologies // Powder Technologies // Beverage & Filling Technologies // Chemical Technologies
Liquid & Powder Technologies provides process solutions for the dairy, beverage, food, chemical and other industries. The portfolio includes liquid processing & filling, concentration, crystallization, purification, drying, powder handling & packaging as well as systems for emission control. GEA designs, builds, configures and installs versatile and efficient equipment and technologies, processing lines and complete plants.
%
% %%
8GEA Annual Report 2020
GEA at a Glance

Food & Healthcare Technologies DivisionSafe foods and medicines for a growing population
895EUR million
Previous year: EUR 963 million
Revenue EBITDA before restructuring measures
EBITDA before restructuring measures
Employees
79EUR million
Previous year: EUR 67 million
8.8percent
Previous year: 6.9 percent
3,411 Full-time equivalents
Previous year: 3,453
Pasta, Extrusion & Milling // Bakery // Slicing & Packaging // Food Solutions // Frozen Food // Pharma & Healthcare
Food & Healthcare Technologies provides solutions for food processing. This covers preparation, marinating and further processing of meat, poultry, seafood and vegan products, in addition to pasta and confectionary production, baking, slicing, packaging as well as frozen food processing. GEA also offers equipment for cereals handling and milling and for producing cereal-based snacks, breakfast cereals as well as dry and wet pet food. GEA solutions for the pharmaceutical, biopharmaceutical & nutraceutical sectors include components, equipment and entire plants for processing solid, liquid, semi-solid, viscous, hazardous and hygroscopic products, either for batch or continuous production.
%
% %%
9GEA Annual Report 2020
GEA at a Glance

Farm Technologies DivisionDeep roots to support customers in an evolving landscape
625EUR million
Previous year: EUR 656 million
Revenue EBITDA before restructuring measures
EBITDA before restructuring measures
Employees
67EUR million
Previous year: EUR 60 million
10.7percent
Previous year: 9.2 percent
1,913 Full-time equivalents
Previous year: 2,157
Milking & Dairy Farming: Milking & Feeding, Manure
Farm Technologies offers integrated customer solutions for efficient, high-quality milk production and livestock farming, including automatic milking and feeding systems, conventional milking solutions and digital herd management tools. GEA manure management solutions ensure operators have the right tools for safe and efficient storage, application and for creating side streams from this important resource.
The portfolio also includes a wide range of equipment and accessories to promote optimum cow health and comfort, such as teat sprays, brushes and mattresses.
%
% %%
10GEA Annual Report 2020
GEA at a Glance
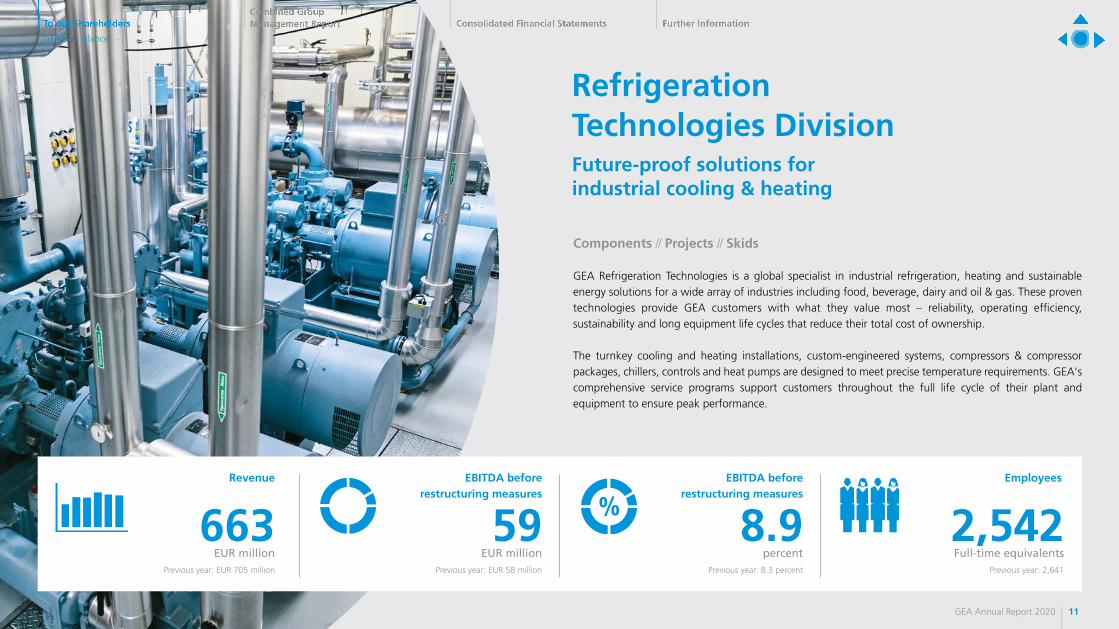
Refrigeration Technologies DivisionFuture-proof solutions for industrial cooling & heating
663EUR million
Previous year: EUR 705 million
Revenue EBITDA before restructuring measures
EBITDA before restructuring measures
Employees
59EUR million
Previous year: EUR 58 million
8.9percent
Previous year: 8.3 percent
2,542 Full-time equivalents
Previous year: 2,641
Components // Projects // Skids
GEA Refrigeration Technologies is a global specialist in industrial refrigeration, heating and sustainable energy solutions for a wide array of industries including food, beverage, dairy and oil & gas. These proven technologies provide GEA customers with what they value most – reliability, operating efficiency, sustainability and long equipment life cycles that reduce their total cost of ownership.
The turnkey cooling and heating installations, custom-engineered systems, compressors & compressor packages, chillers, controls and heat pumps are designed to meet precise temperature requirements. GEA‘s comprehensive service programs support customers throughout the full life cycle of their plant and equipment to ensure peak performance.
%
% %%
11GEA Annual Report 2020
GEA at a Glance

STEFAN KLEBERT CEO
Stefan Klebert took the helm of the Group in February 2019 and is the direct reporting line for the CEOs of the five operating divisions and the four CEOs of the regions. Various central func tions also report to Stefan Klebert, and he also serves as the group‘s Labor Relations Director.
MARCUS A. KETTERCFO
In addition to controlling, ac counting, treasury, tax, risk ma na gement and investor rela tions, Marcus A. Ketter is responsible for global IT and business pro cess management and out sour-cing. He has been a member of the Executive Board since May 2019.
JOHANNES GILOTHCOO
Since the start of 2020, Johan nes Giloth has been the board member responsible for a new executive mandate that encom passes worldwide procurement, production and supply chain, as well as corporate respon si-bility & QHSE.
GEA Executive Board
12GEA Annual Report 2020
GEA Executive Board

STEFAN KLEBERTCEO, GEA GROUP AKTIENGESELLSCHAFT
We began the past fiscal year convinced that our primary focus would be pushing ahead with our efficiency measures aimed at making the company even stronger. Who could have predicted that we would be confronted by an entirely different set of challenges? The unexpected and overwhelming theme of 2020 was, of course, the Covid-19 pandemic. GEA was not immune to its impact, which affected all areas of life and the economy worldwide.
As a company, we reacted quickly to the situation. Already in January, GEA set up a global task force and rapidly took appropriate measures to ensure the safety of its employees and the continuation of operations via local teams organized at each site. We consistently and systematically evaluated the experience gained in the spring, which meant that we were well prepared for the second wave at the end of the year. These extensive measures enabled us to safeguard both the health of our employees and the company’s economic performance, and reliably serve our customers.
Today, we can confidently say: GEA successfully navigated the challenges of 2020! We delivered, and in some cases, even over-delivered on our promises despite the global pandemic. We significantly exceeded our own ambitious EBITDA and ROCE expectations. We also sustainably improved key financial performance indicators, such as net working capital, free cash flow and liquidity. In fact, some of these figures have already reached the target levels that we originally set for 2022 as part of our medium-term financial planning.
Dear Shareholders,
Interview
Stefan Klebert
13GEA Annual Report 2020
Letter to Shareholders

14GEA Annual Report 2020
Letter to Shareholders
Alongside short-term measures to navigate the pandemic, our projects aimed at improving efficiency initiated in 2019 – and their systematic implementation – made a major contribution to GEA’s positive performance in the year under review. Our new organizational structure, which is based on decentralized responsibility for performance and local decision-making power, has paid off.
I would like to take this opportunity to thank our employees. They have handled this highly unusual situation with enormous commitment, while at the same time instituting the necessary changes.
The world remains in the grip of a historic pandemic. However, we cannot and do not intend to let this distract us from our efforts in combating climate change and becoming more sustainable. At GEA, our products are already helping mitigate key global challenges, such as increased urbanization, safeguarding global food supplies and conserving resources. As an international industrial solutions leader, we take our global responsibility very seriously, even in these unprecedented times, and remain committed to “engineering for a better world.” Our climate protection efforts were recognized once again with an “A-” rating in 2020 in the prestigious CDP sustainability ranking (formerly the Carbon Disclosure Project). GEA’s efforts in reducing its own water usage and in its many customer solutions were also assessed by CDP for the first time in 2020 and were immediately awarded an “A” rating. In both instances, GEA received the highest rating level (“Leadership”). It is our intent to make our commitment and actions even more transparent. To this end, we have once again expanded the breadth of the content included in our sustainability report and will publish it as a stand-alone document for the first time this year.
In the current fiscal year, we have no intention of resting on our laurels; we will press ahead with the course we have set for ourselves. The ongoing challenges of the Covid-19 pandemic notwithstanding, we remain fully confident in GEA’s potential for further growth. We are strongly positioned in attractive and growing markets, with most of our revenue being generated in the food and beverage industry and the pharmaceutical sector. These are key industries that remain stable – and are even in increasing demand – irrespective of the pandemic. Even if the pandemic continues to fundamentally shape global economic developments, we are able to once again confirm our medium-term financial targets and are setting even more ambitious ones in the areas where we made great progress last year.
We also intend to keep our dividend payment stable. Based on GEA’s excellent performance in fiscal year 2020, we intend to propose an unchanged dividend payout of EUR 0.85 per share at the Annual General Meeting. This once again underscores that GEA shares are a reliable dividend-paying equity investment, which, by the end of the year under review, had nearly fully recovered from the sharp decline caused by the market crash in March, despite the ongoing coronavirus crisis. This performance is clear evidence of capital market confidence in GEA. In short, we have every reason to be optimistic about the future. The measures we have taken are bearing fruit and our business model has proven stable, even in turbulent times. We want you, our valued shareholders, to continue to participate in GEA‘s successful development. We will be focusing our entire energy in the current fiscal year on ensuring that GEA remains a valuable investment. Thank you for the trust you have placed in us.
Stay healthy and let’s stay connected.
Sincerely,
Stefan Klebert
DR. HELMUT PERLETSUPERVISORY BOARD CHAIRMAN OF GEA GROUP AKTIENGESELLSCHAFT
During fiscal year 2020, the Supervisory Board performed the monitoring and advisory functions incumbent upon it by virtue of the law, the Articles of Association and the Rules of Procedure. In doing so, it regularly dealt with the progress and the prospects of the company as well as all specific material issues while continuously advising the Executive Board on matters relating to the management of the company.
The deliberations held during the Supervisory Board meetings and the meetings of its committees form the most important element for the discharge of our duties. In addition, the Executive Board – in compliance with its obligation to inform – kept the Supervisory Board and its committees up to date through regular, timely and comprehensive written and/or oral reports on all relevant matters and measures relating to the company, its course of business, corporate planning, strategy as well as the progress of the group. The Supervisory Board was involved in all decisions of fundamental importance to the company and assisted the Executive Board in an advisory capacity. The members of the Supervisory Board had ample opportunity to critically examine the reports and motions for resolution submitted by the Executive Board – both in the committees as well as during plenary meetings – and to put forward their own proposals. The chairs of the individual committees customarily attended the Supervisory Board meeting in the wake of their respective committee meetings in order to report on the financial results and the main discussion points that emerged from their committee meetings. Their reports frequently provided the full Supervisory Board with valuable and influential insights. In so doing, the in-depth preparatory work undertaken by the committees was instrumental in enhancing the overall effectiveness of the Supervisory Board’s activities.
Report of the Supervisory Board
15GEA Annual Report 2020
Report of the Supervisory Board

16GEA Annual Report 2020
Report of the Supervisory Board
Furthermore, the Chairman of the Supervisory Board and the Presiding Committee, the sitting Chairman and Chairwoman of the Audit Committee in office during the past fiscal year, and the Chairwoman of the Technology Committee all maintained regular contact with the Executive Board. Between meetings, the Chairman of the Supervisory Board and the CEO regularly discussed matters of strategy, planning, business progress, risk exposure, risk management and compliance. Outside of meetings, the former Chairman as well as the current Chairwoman of the Audit Committee remained in regular contact with members of the Executive Board, in particular with the CFO, in order to keep abreast of current developments relevant to the work of the Audit Committee and to discuss business if necessary. The employee representatives regularly deliberated on important agenda points during pre-meeting consultations with the Executive Board prior to full Supervisory Board meetings.
On a regular basis, the Supervisory Board received specific information on order intake, revenue and earnings, the employment situation in the group and its divisions, as well as on the latest developments concerning the Covid-19 pandemic and their impact on the group and its business activities. Detailed explanations were provided on deviations of business performance from plans and targets on the basis of supporting documents. Prior to and between the meetings, the Executive Board delivered written reports on significant events to the members of the Supervisory Board. Following deliberations at committee level, the future prospects and the strategic orientation of the company and its divisions, as well as corporate planning, were extensively discussed and jointly agreed upon with the Supervisory Board.
Following comprehensive scrutiny and deliberations as well as discussions at committee level, the members of the Supervisory Board cast their votes on the reports and motions for resolution submitted by the Executive Board insofar as this was appropriate or required by law, the provisions of the Articles of Association or the Rules of Procedure. For reasons duly substantiated, in particular in matters of special urgency, resolutions were adopted by written procedure.
In the year under review, there were no conflicts of interest involving members of the Executive Board or the Supervisory Board that would have required immediate disclosure to the Chairman of the Supervisory Board and communication to the Annual General Meeting.
Focus areas of Supervisory Board deliberationsIn fiscal year 2020, a total of eight meetings of the Supervisory Board were held. On these occasions, the Supervisory Board regularly discussed matters relating to the company’s business progress, its financial position, information related to initiatives in the areas of procurement and production, as well as share price performance. Apart from that, the following key topics were addressed:
At its meeting on February 12, 2020, the Supervisory Board addressed the preliminary financials 2019 and the achievement of targets for the 2019 remuneration of the Executive Board. The Supervisory Board also discussed and approved the Executive Board’s modifier targets in detail for 2020. The presentation on the background to the ad hoc announcement of January 27, 2020 and the reactions of the capital market to this ad hoc announcement were also discussed. At this meeting, the Supervisory Board also approved the premature, mutually agreed departure of Steffen Bersch from the Executive Board and discussed the reshuffling of responsibilities within the Executive Board after his departure.
Against the backdrop of the outbreak of the Covid-19 pandemic, one of the key issues addressed during the Supervisory Board meeting held on March 12, 2020 related to establishing guidance for 2020. The adoption of the annual financial statements, including the appropriation of net earnings and the approval of the consolidated financial statements for fiscal year 2019, were also addressed at this meeting. In addition, the Supervisory Board dealt in detail with the report of the Chief Compliance Officer on the past fiscal year 2019 and the determination of the proposed resolutions on the individual agenda items for the Annual General Meeting on fiscal year 2019, which was still scheduled for April 30, 2020 at that time. The Executive Board also informed the Supervisory Board about the results of the 2019 employee survey.
At the Board meeting on April 29, 2020, members of the Supervisory Board were informed, among other things, about GEA’s current situation due to the Covid-19 pandemic. At this meeting, the Supervisory Board also received a report on the status of the project to implement a uniform group-wide ERP system and approved the budget and important milestones for this project.

17GEA Annual Report 2020
Report of the Supervisory Board
At the Supervisory Board meeting on June 24, 2020, the Executive Board presented its observations on accelerating the process related to the 2020 annual financial statements and the preparation and publication of the 2020 annual report. Furthermore, the Supervisory Board addressed initiatives related to procurement, sustainability at GEA, as well as the human resources strategy and management development. The Supervisory Board also passed a resolution to modify the company pension scheme for former Executive Board members for fiscal year 2020. In addition, the Executive Board informed the Supervisory Board about the status of the sale of the compressor manufacturer Bock.
The annual strategy meeting of the Supervisory Board was held on June 25, 2020. Following the presentation of the corporate strategy by the CEO, the Supervisory Board addressed the profitability of the new plant business and – as a key issue – the production strategy. In addition, strategies for the Separation & Flow Technologies and Farm Technologies divisions were presented to the Supervisory Board by the division CEOs and subsequently discussed with them. Finally, the Supervisory Board took stock of the Executive Board’s crisis management with regard to the ongoing Covid-19 pandemic.
The subject of the extraordinary meeting of the Supervisory Board on August 18, 2020 was the global manufacturing strategy and the related establishment of a center of excellence for pumps and machining at the Polish site in Koszalin.
At its meeting on September 23, 2020, the Supervisory Board addressed the specifics related to the Annual General Meeting for fiscal year 2019, which was postponed to November 26, 2020 and held as a virtual event. At this meeting, the Supervisory Board also adopted the proposed resolutions for the individual items on the agenda of the virtual Annual General Meeting. On the recommendation of the Audit Committee, the members of the Supervisory Board also adopted a resolution recommending to the 2021 Annual General Meeting the appointment of the auditor of the company and the group for fiscal year 2021, and for the auditor to review the condensed interim financial statements and the interim group management report to be published in the 2021 half-yearly financial report. Furthermore, the Supervisory Board examined global portfolio management and the strategies of the Liquid and Powder Technologies and Refrigeration Technologies divisions. The new decentralized risk management concept was also presented.
At its meeting on December 17, 2020, the Supervisory Board deliberated on the medium-term planning 2021 until 2023 and approved the budget for 2021. In addition, the Supervisory Board reviewed the appropriateness of Executive Board and Supervisory Board remuneration as well as proposals to amend the Executive Board remuneration system. Succession planning for the Executive Board and management development were also covered in the December meeting. The Supervisory Board also adopted a resolution recommending the election of a new Supervisory Board member at the 2021 Annual General Meeting and resolved on amendments to the rules of procedure for the Presiding Committee and the Supervisory Board.
Work of the committeesThe Presiding Committee met four times in the past fiscal year. Its deliberations focused on strategic and Executive Board matters, particularly Executive Board remuneration and corporate governance issues.
The Audit Committee held nine meetings during the fiscal year. In the presence of the auditor, the CEO as well as the CFO, the committee focused on the annual financial statements in conjunction with the consolidated financial statements for 2019 as well as the 2020 quarterly statements and half-yearly financial reports. Furthermore, the Committee’s key activities included matters such as the effectiveness of the internal control, risk management and audit systems, the audit of the annual financial accounts as well as compliance. The Audit Committee also deliberated on the accounting process and was briefed at regular intervals on the risks and opportunities faced by the company. The auditors provided a detailed explanation of their audit activities and the audit process to the Audit Committee.
In addition, the Audit Committee, with the support of a project group set up for this purpose, conducted an auditor selection process during the past fiscal year in accordance with the requirements of the EU Statutory Audit Regulation with regard to the selection of the group auditor for fiscal year 2021. The Audit Committee, and in particular its former Chairman Hartmut Eberlein, were closely involved in all procedures and major decisions as part of their process responsibility and were kept up-to-date on the project group’s work and the status of the selection process. By resolution of the Audit Committee of May 13, 2020, GEA re-tendered the audit of the annual and consolidated financial statements as of December 31, 2021. As a result of the selection process, the Audit Committee submitted to the Supervisory Board, by way of a resolution dated August 25, 2020, a recommendation to the Annual General Meeting on the proposal of a group auditor for fiscal year 2021 in accordance with the provisions of the EU Statutory Audit Regulation, which the Supervisory Board addressed at its meeting on September 23, 2020. In accordance with the transitional provisions of the EU Statutory Audit Regulation, the invitation to tender for the selection of

18GEA Annual Report 2020
Report of the Supervisory Board
auditors is to be issued during the 2021 fiscal year at the latest. The Executive Board provided the Audit Committee with sufficient resources to support the selection process.
In addition, the Audit Committee submitted its proposal for the appointment of an auditor for the preceding fiscal year to the Supervisory Board, dealt with the engagement of the auditor of the annual financial accounts, determined the audit process and the key audit areas including audit fees, ensured the required independence of the auditor and addressed the permitted non-audit services provided by the latter for fiscal year 2020.
In the year under review, the Nomination Committee was convened on four occasions and dealt with matters of Supervisory Board succession planning.
In fiscal year 2020, the members of the Technology Committee held two meetings. The committee addressed the structure and tasks of the global technology organization within the group, its planned projects and issues relating to the development of a group-wide innovation and digitalization strategy. In addition, the Technology Committee discussed global megatrends and disruptive technologies in food production, as well as their potential impact on GEA’s business model and innovation strategy. The Technology Committee also discussed the means and resources available for research and development, as well as their allocation, with the Chief Technology Officer and the Executive Board members.
The Mediation Committee did not meet in the year under review.
The committee chairs briefed the Supervisory Board on the activities undertaken by their committees during the Supervisory Board meetings held in the wake of the respective committee meetings.
Length of Supervisory Board membership and disclosure of individual meeting attendance
Supervisory Board member
Length of timeon the Supervisory
Board
End of current
term
Supervisory Board and committee
meetings in 2020 Attendance Present
Dr. Helmut Perlet (Chairman) 15 years 2021 25 25 100%
Kurt-Jürgen Löw (Deputy Chairman)
14 years 202112 12 100%
Ahmad Bastaki 17 years 2021 16 16 100%
Hartmut Eberlein1 11 years 2021 15 15 100%
Rainer Gröbel 20 years 2021 12 12 100%
Colin Hall 2 years 2021 12 11 92%
Michaela Hubert 4 years 2021 14 11 79%
Michael Kämpfert 14 years 2021 17 16 94%
Eva-Maria Kerkemeier 9 years 2021 8 8 100%
Dr. Annette G. Köhler2 0.5 years 2021 2 2 100%
Brigitte Krönchen 6 years 2021 19 19 100%
Jean Spence 9 years 2021 14 14 100%
Dr. Molly Zhang 4 years 2021 10 10 100%
1) Left on September 30, 20202) Since October 1, 2020
Whenever Supervisory Board members were unable to attend meetings of the Supervisory Board or its committees, they asked to be excused and usually cast their votes in writing.
19GEA Annual Report 2020
Report of the Supervisory Board
Corporate governanceThe Supervisory Board continuously monitors the evolution of the standards set out by the Corporate Governance Code. The current Declaration of Conformity is based on the German Corporate Governance Code (GCGC) as amended on December 16, 2019, which has been in force since publication in the Federal Gazette by the Federal Ministry of Justice and Consumer Protection (BMJV) on March 20, 2020, and the GCGC as amended on February 7, 2017, which was valid until then. The Executive Board and the Supervisory Board issued the current Declaration of Conformity in accordance with section 161 of the Aktiengesetz (AktG – German Stock Corporation Act) on December 17, 2020, and made it permanently available to the shareholders on the company’s website gea.com. Further information on corporate governance can be found in the chapter titled “Corporate Governance Statement”.
Annual financial statements and consolidated financial statements 2020The 2020 annual financial statements of GEA Group Aktiengesellschaft, the consolidated financial statements prepared in accordance with IFRS and the combined management report were audited by KPMG AG Wirtschaftsprüfungsgesellschaft and received an unqualified audit opinion. Since fiscal year 2011, KPMG AG Wirtschaftsprüfungsgesellschaft, Berlin, has audited the financial statements of GEA Group Aktiengesellschaft and the group. The head auditor responsible for conducting the audit since fiscal year 2018 has been Michael Jessen.
In the presence of the auditors, the combined management report, the annual financial statements of GEA Group Aktiengesellschaft, the proposal for the appropriation of net earnings as well as the consolidated financial statements and the audit reports for fiscal year 2020 were extensively discussed during the meeting of the Audit Committee on March 2, 2021, and at the Supervisory Board meeting for balance sheet approval held on March 3, 2021. The auditors reported on the audit process and the key findings of their audit. They were also available to answer questions.
On the basis of the final result of the examination performed by the Audit Committee and after conducting its own scrutiny, the Supervisory Board agreed with the auditors’ findings at its meeting held on March 3, 2021, and found that there were no objections to be raised. The Supervisory Board approved the 2020 consolidated financial statements, the 2020 annual financial statements of GEA Group Aktiengesellschaft, as well as the combined management report. The annual financial statements of GEA Group Aktiengesellschaft are hereby adopted. The Supervisory Board considers the proposal for the appropriation of net earnings to be reasonable.
The review of the company’s consolidated non-financial statement for fiscal year 2020 by the Supervisory Board pursuant to section 171 (1) of the AktG was supported by a Limited Assurance Engagement conducted by KPMG. For this purpose, KPMG audited GEA’s risk assessment regarding relevant information about the company’s sustainability performance, evaluating the design and implementation of systems and processes designed to ascertain, process and monitor disclosures on environmental, employee-related and social matters, human rights, corruption and fraud, including data consolidation. Referring to the auditor’s findings, the Audit Committee also conducted its own audit proceedings to ensure that the data submitted complied with the legal requirements; the Chairwoman of the Audit Committee informed the Supervisory Board accordingly.
Changes in the composition of the Supervisory Board and the Executive BoardJohannes Giloth joined the Executive Board as Chief Operating Officer on January 20, 2020. He is responsible for the newly established procurement, production and supply chain function. Johannes Giloth was appointed for a three-year term.
Steffen Bersch stepped down from the Executive Board on February 29, 2020.
Hartmut Eberlein stepped down from the Supervisory Board with effect from September 30, 2020. Prof. Dr. Annette G. Köhler was appointed as a new member of the Supervisory Board by resolution of the Düsseldorf Local Court with effect from October 1, 2020, and was elected as a member of the Supervisory Board by the Annual General Meeting on November 26, 2020.
The Supervisory Board wishes to express its gratitude and appreciation to the senior management teams, employee representative bodies and, in particular, to all employees of GEA Group, thanking them for their personal commitment and all their work during the past fiscal year.
Düsseldorf, March 3, 2021
Dr. Helmut Perlet Chairman of the Supervisory Board

GEA Shares/Investor Relations
GEA shares in the capital markets
In a very challenging market environment dominated by the global Covid-19 pandemic, GEA’s share price nearly fully recovered from the steep decline experienced during the spring. Whereas, during the first half of the year the shares decreased by 4.5 percent and faced significantly less pressure than the MDAX index (–8.7 percent), their recovery in the second half of the year was less pronounced, rising 4.0 percent compared with the 19.2 percent rise in the MDAX. This led to a decline in the GEA Group Aktiengesellschaft share price of 0.7 percent for the year as a whole respectively an increase of 2.9 percent taking into account the reinvestment of the dividend payment of EUR 0.85, thereby underperforming the MDAX (+8.8 percent) and also lagging behind the performance of the European sector index STOXX® Europe TMI Industrial Engineering (+13.3 percent). On March 18, 2020, GEA shares reached EUR 14.53 (XETRA) – the lowest point of the year. The share price peaked at EUR 33.59 on July 23, 2020 and ended the year at EUR 29.28.
In addition to its long-running inclusion in the MDAX and other national and international indices, GEA was also among the first 50 companies included in the DAX 50 ESG Index at its inception in 2020 thanks to GEA’s exemplary approach to environmental, social and corporate governance issues.
Jan. Feb. Mar. Apr. May Jun. Jul. Aug. Sep. Oct. Nov. Dec.
GEA* MDAX DAX50 ESG STOXX® Europe TMI Industrial Engineering
–20%
–30%
–40%
–50%
–60%
–10%
0%
10%
20%
13.3%8.8%5.4%2.9%
*) Taking into account the reinvestment of the dividend payment of EUR 0.85
20GEA Annual Report 2020
GEA Shares/Investor Relations

Shareholder structure
The number of shares outstanding was 180,492,172 at year end, unchanged from the previous year. Market capitalization at the end of 2020 was approximately EUR 5.3 billion (previous year: EUR 5.3 billion).
In 2020, as in previous years, GEA performed regular analyses of its shareholder structure. The latest analysis identified 96.4 percent of all shares outstanding. According to the results, institutional investors held 75.6 percent of all shares, while 18.0 percent were held by major shareholders and 2.8 percent by retail investors.
GEA still has two investors – Kuwait Investment Office and Oliver Capital (the principal shareholder of Groupe Bruxelles Lambert) – that are deemed to be major shareholders according to the definition applied by the German stock exchange (Deutsche Börse AG) and therefore do not count as free float. According to the most recent voting rights announcements submitted to the company, the Kuwait Investment Office held 17,129,370 voting rights (through shares and instruments) as of April 19, 2016, which corresponded to some 9.5 percent of subscribed capital as of December 31, 2020. On November 30, 2020, Oliver Capital held a total of 15,357,460 voting rights (exclusively shares), which corresponded to some 8.5 percent of subscribed capitel as of December 31, 2020. The number of voting rights was again confirmed in a further notification at the end of January 2021. Therefore, the free float according to Deutsche Börse AG, was approximately 82 percent as of the reporting date.
Regional breakdown of institutional shareholders(in %)
37 United Kingdom (UK)
36 United States of America (USA)
11 Rest of Europe
4 France
6 Germany
Based on 75.6% of identified shares held by institutional investors
3 Norway
3 Rest of the world
Investment styles of institutional investors (in %)
50 Growth
3 Other
9 Hedge Funds
10 GARP*
11 Value
17 Index
*) Growth at a reasonable priceBased on 75.6% of identified shares held by institutional investors
21GEA Annual Report 2020
GEA Shares/Investor Relations
Investor relations activities
GEA engages in regular dialog with capital market participants in addition to quarterly financial reporting, and has continued this practice during the pandemic by means of virtual roadshows. GEA kept in close contact with investors in 2020 by participating in 14 mainly virtual investor conferences and hosting 13 virtual roadshows – some of which were attended by the company’s CEO and CFO. At these events, GEA held more than 150 meetings. Discussions focused on the impact of Covid-19 on the business performance as well as the progress of efficiency improvement measures initiated last year.
Dividend policy
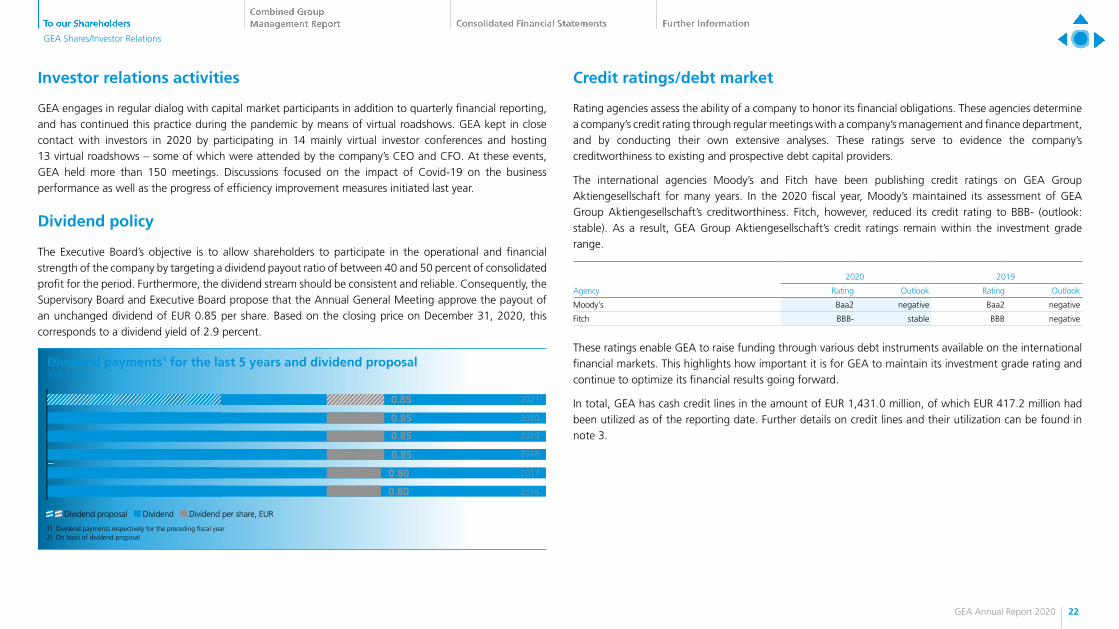
The Executive Board’s objective is to allow shareholders to participate in the operational and financial strength of the company by targeting a dividend payout ratio of between 40 and 50 percent of consolidated profit for the period. Furthermore, the dividend stream should be consistent and reliable. Consequently, the Supervisory Board and Executive Board propose that the Annual General Meeting approve the payout of an unchanged dividend of EUR 0.85 per share. Based on the closing price on December 31, 2020, this corresponds to a dividend yield of 2.9 percent.
Dividend payments1 for the last 5 years and dividend proposal(EUR million)
153.4 0.85
153.4 0.85
153.4 0.85
153.4 0.85
152.8 0.80
20212
2020
2019
2018
2017
2016154.0 0.80
Dividend proposal Dividend Dividend per share, EUR
1) Dividend payments respectively for the preceding fiscal year2) On basis of dividend proposal
Credit ratings/debt market
Rating agencies assess the ability of a company to honor its financial obligations. These agencies determine a company’s credit rating through regular meetings with a company’s management and finance department, and by conducting their own extensive analyses. These ratings serve to evidence the company’s creditworthiness to existing and prospective debt capital providers.
The international agencies Moody’s and Fitch have been publishing credit ratings on GEA Group Aktiengesellschaft for many years. In the 2020 fiscal year, Moody’s maintained its assessment of GEA Group Aktiengesellschaft’s creditworthiness. Fitch, however, reduced its credit rating to BBB- (outlook: stable). As a result, GEA Group Aktiengesellschaft’s credit ratings remain within the investment grade range.
2020 2019
Agency Rating Outlook Rating Outlook
Moody‘s Baa2 negative Baa2 negative
Fitch BBB- stable BBB negative
These ratings enable GEA to raise funding through various debt instruments available on the international financial markets. This highlights how important it is for GEA to maintain its investment grade rating and continue to optimize its financial results going forward.
In total, GEA has cash credit lines in the amount of EUR 1,431.0 million, of which EUR 417.2 million had been utilized as of the reporting date. Further details on credit lines and their utilization can be found in note 3.
22GEA Annual Report 2020
GEA Shares/Investor Relations

23GEA Annual Report 2020
Fundamental Information about the Group 24Report on Economic Position 37Corporate Governance Statement 59Remuneration Report 67
Non-financial Group Statement 83Report on Risks and Opportunities 104Report on Expected Developments 117
Combined Group Management Report

Fundamental Information about the Group
Group business model
Combined management report of GEA Group Aktiengesellschaft and the GEA Group
GEA Group Aktiengesellschaft is home to central management functions of the group. It has profit and loss transfer agreements in place with its main domestic subsidiaries. In addition, GEA Group Aktiengesellschaft conducts financial and liquidity management for the entire group. It also provides its subsidiaries with services from the Global Corporate Center on the basis of service agreements.
Since the course of business, the economic position, and the opportunities and risks associated with the future development of GEA Group Aktiengesellschaft do not differ from those of the group, the management reports of GEA Group Aktiengesellschaft and of the consolidated group have been combined in accordance with section 315 (5) of the Handelsgesetzbuch (HGB – German Commercial Code). In contrast to the consolidated financial statements which are prepared in accordance with IFRS, the annual financial statements of GEA Group Aktiengesellschaft are prepared in accordance with HGB and the Aktiengesetz (AktG – German Stock Corporation Act). All financial statements relate to the 2020 fiscal year (January 1 to December 31, 2020).
The management report also contains the non-financial statement along with the combined corporate governance statement. GEA also publishes a separate sustainability report. GEA’s non-financial reporting is carried out in accordance with the international standards of the Global Reporting Initiative (GRI).
Organization and structure
The groupThe GEA Group is an internationally active technology group that specializes in machinery and plant, together with process technology and components. As such, GEA provides solutions for sophisticated production processes in diverse end-user markets and offers a comprehensive service portfolio as well. In doing so, GEA helps its customers make their production processes ever more sustainable and efficient. GEA is one of the largest suppliers of systems and components to the food, beverage and pharmaceutical industries, as well as to a wide range of other processing industries, e.g. chemicals.
The group is a specialist in its respective core technologies and a leader in many of its markets worldwide. GEA promotes a strong innovation-led culture in order to maintain its technological edge in the future. Further details can be found under “Fundamental Information about the Group” in the section “Research and Development”.
The group’s enduring success is based on a number of global trends, including:1. Constant global population growth2. Significant growth of the middle class3. Growing desire for healthy, functional and safe nutrition4. High demand for efficient production methods that also conserve valuable resources
24GEA Annual Report 2020
Fundamental Information about the Group
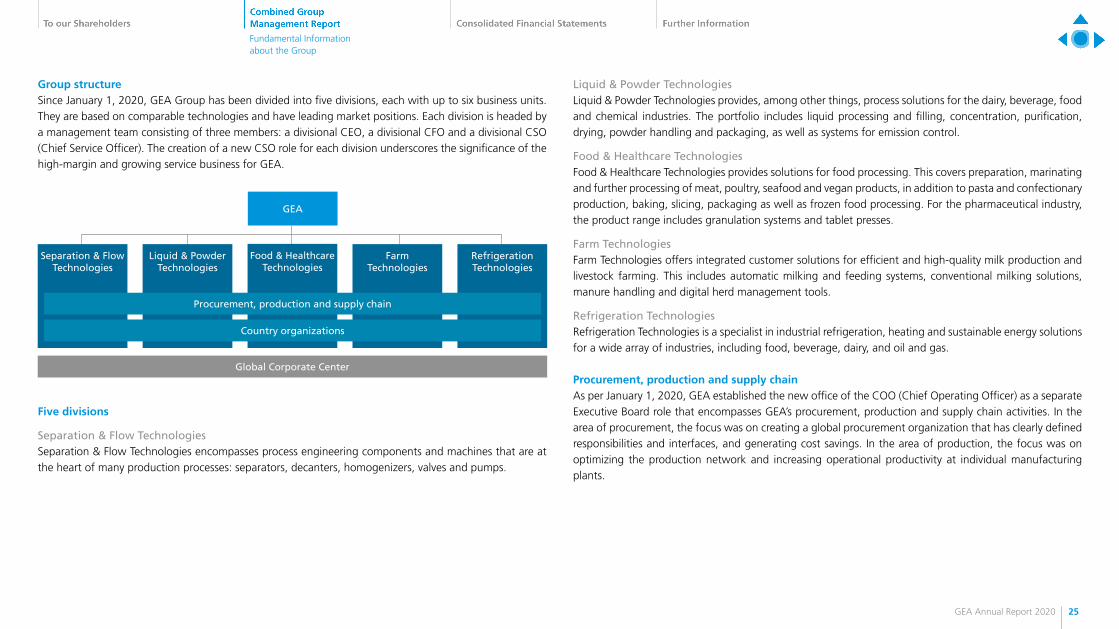
Group structureSince January 1, 2020, GEA Group has been divided into five divisions, each with up to six business units. They are based on comparable technologies and have leading market positions. Each division is headed by a management team consisting of three members: a divisional CEO, a divisional CFO and a divisional CSO (Chief Service Officer). The creation of a new CSO role for each division underscores the significance of the high-margin and growing service business for GEA.
GEA
Separation & Flow Technologies
Global Corporate Center
Liquid & PowderTechnologies
Food & Healthcare Technologies
FarmTechnologies
RefrigerationTechnologies
Procurement, production and supply chain
Country organizations
Five divisions
Separation & Flow TechnologiesSeparation & Flow Technologies encompasses process engineering components and machines that are at the heart of many production processes: separators, decanters, homogenizers, valves and pumps.
Liquid & Powder TechnologiesLiquid & Powder Technologies provides, among other things, process solutions for the dairy, beverage, food and chemical industries. The portfolio includes liquid processing and filling, concentration, purification, drying, powder handling and packaging, as well as systems for emission control.
Food & Healthcare TechnologiesFood & Healthcare Technologies provides solutions for food processing. This covers preparation, marinating and further processing of meat, poultry, seafood and vegan products, in addition to pasta and confectionary production, baking, slicing, packaging as well as frozen food processing. For the pharmaceutical industry, the product range includes granulation systems and tablet presses.
Farm TechnologiesFarm Technologies offers integrated customer solutions for efficient and high-quality milk production and livestock farming. This includes automatic milking and feeding systems, conventional milking solutions, manure handling and digital herd management tools.
Refrigeration TechnologiesRefrigeration Technologies is a specialist in industrial refrigeration, heating and sustainable energy solutions for a wide array of industries, including food, beverage, dairy, and oil and gas.
Procurement, production and supply chainAs per January 1, 2020, GEA established the new office of the COO (Chief Operating Officer) as a separate Executive Board role that encompasses GEA’s procurement, production and supply chain activities. In the area of procurement, the focus was on creating a global procurement organization that has clearly defined responsibilities and interfaces, and generating cost savings. In the area of production, the focus was on optimizing the production network and increasing operational productivity at individual manufacturing plants.
25GEA Annual Report 2020
Fundamental Information about the Group
Country organizationsSales to customers and local service activities are unified under the umbrella of a single country organization. The countries cooperate with the divisions in a matrix structure and are assigned to specific regions. The country organizations stand ready to serve their respective customers as a central point of contact, offering them local access to an extensive portfolio of products and services.
Global Corporate CenterCentral management and administrative functions, together with standardized administrative processes, are bundled within the Global Corporate Center (GCC). The Global Corporate Center performs the principal management functions for the entire group. GEA makes partial use of a Shared Service Center (SSC) for the areas of IT, Finance and Human Resources.
Discontinued operationsDiscontinued operations comprise the remaining risks from and the ongoing process of winding down operations discontinued in the past, such as from the sale of GEA Heat Exchangers in 2014, including individual legal disputes arising from them.
Significant changes
Supervisory BoardProf. Dr. Annette G. Köhler was appointed to the Supervisory Board of GEA Group Aktiengesellschaft by the Düsseldorf Local Court with effect from October 1, 2020. The recognized expert in national and international accounting and auditing has been teaching accounting, auditing and controlling at the University of Duisburg-Essen since 2005. She succeeds Hartmut Eberlein, whose resignation took effect on September 30, 2020. Professor Köhler stood for election by the shareholders at the Annual General Meeting on November 26, 2020. She was confirmed by the Annual General Meeting and also assumes the position of Chairwoman of the Supervisory Board’s Audit Committee.
On December 17, 2020, the Supervisory Board of GEA Group Aktiengesellschaft established the process for an orderly transition. After more than 15 years on GEA’s Supervisory Board, including almost five years as Chairman, Dr. Helmut Perlet will not stand for re-election when his mandate expires at the end of April 2021. Dr. Helmut Perlet is to be succeeded as Chairman of the Supervisory Board by Klaus Helmrich, who is currently a member of the Siemens AG Board of Directors. A proposed resolution to this effect was adopted by the Supervisory Board at its meeting on December 17, 2020, which will be put to the vote at the Annual General Meeting on April 30, 2021.
Executive BoardJohannes Giloth joined the GEA Group Aktiengesellschaft Executive Board effective January 20, 2020. Mr. Giloth joined GEA from the telecommunications group Nokia where he was Chief Procurement and Chief Supply Chain Officer for several years and successfully implemented projects to digitalize the company’s procurement and supply chain organizations.
On February 12, 2020, the Supervisory Board of GEA Group Aktiengesellschaft and Steffen Bersch, member of GEA’s Executive Board, mutually agreed to terminate the latter’s service agreement, which was due to expire on December 31, 2021. In doing so, the Board complied with Mr. Bersch’s wish to terminate his contract so that he could devote himself to new ventures outside the GEA Group.
Due to this decision, GEA’s Executive Board was reduced to three members. As of March 1, 2020, the three Executive Board members are: CEO Stefan Klebert, CFO Marcus A. Ketter and COO Johannes Giloth.
26GEA Annual Report 2020
Fundamental Information about the Group
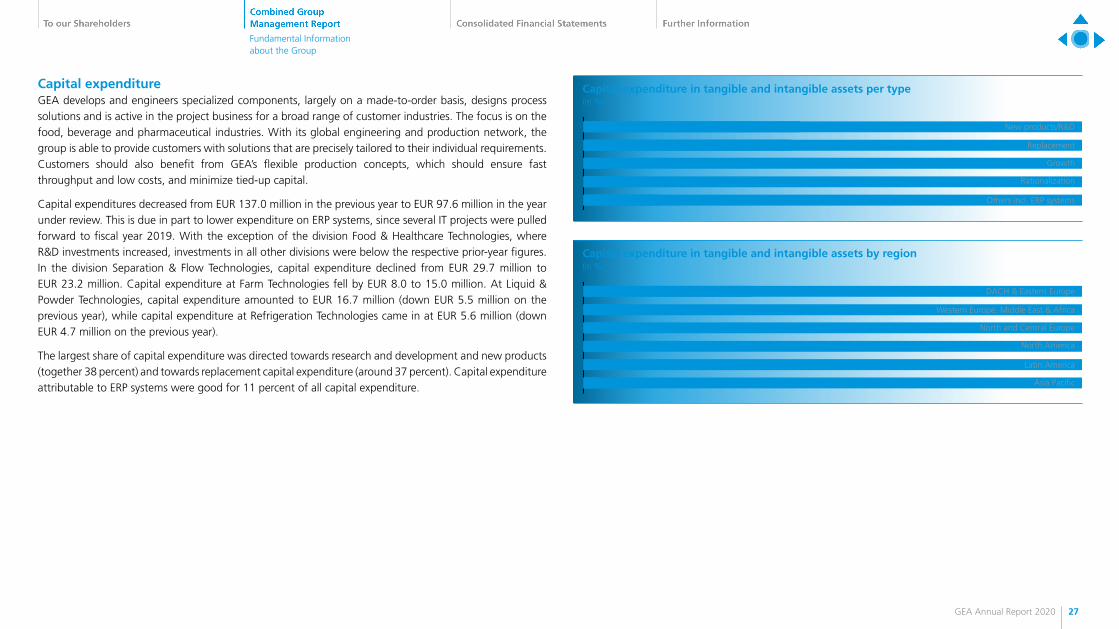
Capital expenditureGEA develops and engineers specialized components, largely on a made-to-order basis, designs process solutions and is active in the project business for a broad range of customer industries. The focus is on the food, beverage and pharmaceutical industries. With its global engineering and production network, the group is able to provide customers with solutions that are precisely tailored to their individual requirements. Customers should also benefit from GEA’s flexible production concepts, which should ensure fast throughput and low costs, and minimize tied-up capital.
Capital expenditures decreased from EUR 137.0 million in the previous year to EUR 97.6 million in the year under review. This is due in part to lower expenditure on ERP systems, since several IT projects were pulled forward to fiscal year 2019. With the exception of the division Food & Healthcare Technologies, where R&D investments increased, investments in all other divisions were below the respective prior-year figures. In the division Separation & Flow Technologies, capital expenditure declined from EUR 29.7 million to EUR 23.2 million. Capital expenditure at Farm Technologies fell by EUR 8.0 to 15.0 million. At Liquid & Powder Technologies, capital expenditure amounted to EUR 16.7 million (down EUR 5.5 million on the previous year), while capital expenditure at Refrigeration Technologies came in at EUR 5.6 million (down EUR 4.7 million on the previous year).
The largest share of capital expenditure was directed towards research and development and new products (together 38 percent) and towards replacement capital expenditure (around 37 percent). Capital expenditure attributable to ERP systems were good for 11 percent of all capital expenditure.
Capital expenditure in tangible and intangible assets per type(in %)
38.4
36.9
3.8
7.5
13.4
New products/R&D
Replacement
Growth
Rationalization
Others incl. ERP systems
Capital expenditure in tangible and intangible assets by region(in %)
60.1
11.7
14.2
6.9
0.7
DACH & Eastern Europe
Western Europe, Middle East & Africa
North and Central Europe
North America
Latin America
Asia Pacific6.3
27GEA Annual Report 2020
Fundamental Information about the Group

Management system
Basis of information Group reports are prepared with the aid of standard applications that are precisely tailored to the needs of GEA and subject to continuous enhancement. Standard reports prepared on the basis of unified data are used throughout the group to report net assets, financial position, and results of operations. These standard reports are supplemented by special analyses as well as analyses and reports related to specific businesses and strategic measures. Besides the budget for fiscal year 2021, corporate planning covers two further planning years.
In fiscal year 2020, regular reporting procedures were supplemented by committee meetings of the group’s management with an opportunity to share information on strategic and operational issues. In addition, the Executive Board of GEA Group Aktiengesellschaft met once a month. Furthermore, the Extended Management Board (Global Executive Committee, GEC), which comprises the Executive Board members, the heads of the divisions and sales regions, as well as the head of Human Resources, met to assist the Executive Board with decision preparation. The Executive Board meetings concentrated on issues of relevance to the group as a whole, whereas significant matters directly affecting the divisions and regions were discussed at the GEC meetings. In addition, the individual divisions regularly held meetings, which were attended by the management of the divisions as well as the extended management teams of the divisions. Such meetings entailed detailed discussions of the net assets, financial position, results of operations, and business development of the division concerned. Separate meetings for each division were also held to discuss earnings for the latest fiscal year and the business plan for the following years.
Key performance indicators
Key financial performance indicators in the management system in 2020GEA’s prime objective is to increase the value of the enterprise year on year. Trends in key indicators are, therefore, defining factors and an essential basis for the company’s lasting success.
In fiscal year 2020, the key financial performance indicators for GEA were as follows:
• Revenue • EBITDA before restructuring measures • Return on capital employed (ROCE)
EBITDA before restructuring measuresGEA uses EBITDA (earnings before interest, taxes, depreciation and amortization) as its key earnings indicator. EBITDA is adjusted to take account of the effect of restructuring expenditures. The restructuring measures concerned are outlined in terms of content, scope and definition, presented to the Chairman of the Supervisory Board by the CEO and jointly finalized. Only measures in excess of EUR 2 million are taken into account. Accordingly, this indicator is termed EBITDA before restructuring measures. If, in addition, the respective process requires approval in accordance with the rules of procedure of the Executive Board, it must be approved by the Supervisory Board as well.
28GEA Annual Report 2020
Fundamental Information about the Group

Return on capital employed (ROCE)The performance indicators revenue and EBITDA before restructuring measures are supplemented by another accounting ratio, namely the ROCE or the “return on capital employed”. The ROCE corresponds to the ratio of earnings before interest, taxes and restructuring measures (EBIT before restructuring measures) to the capital employed.
Capital employed includes (all items calculated as averages for the past four quarters): non-current assets less interest-bearing non-current assets and working capital plus other non-interest-bearing assets, liabilities and provisions less assets and liabilities in connection with income taxes. When calculating capital employed, the effects arising from the acquisition of the former GEA AG by the former Metallgesellschaft AG in 1999 and further effects from discontinued operations are not taken into account.
In order to anchor ROCE even more strongly at an operational level, the ROCE driver EBIT before restructuring measures is evaluated on a continuous basis. The same applies to working capital or the “ratio of working capital to revenue”, which is the key driver of capital employed.
As a strategic indicator, the ROCE measures the relative profitability of a company when compared with the weighted average cost of capital used (WACC). If the ROCE is above the WACC, this is an indication that the business is gaining in value as the expectations of the capital market have demonstrably been exceeded.
The difference between the expected ROCE and the WACC is a key criterion for investment and portfolio decisions. The group calculates WACC on the basis of specific peer-group information on beta factors, data on capital structure, and borrowing costs.
Furthermore, the indicators EBITDA before restructuring measures and ROCE are fixed elements of the remuneration model for Executive Board members. Further details can be found under “Remuneration Report”.
Other indicators in the management system in 2020GEA also routinely gathers various other performance indicators in order to obtain a meaningful picture of the overall situation.
As a leading indicator for sales the company evaluates metrics such as order intake.
To enable a rapid response to developments, the divisions provided regular forecasts – for the quarters and for the year as a whole – on the key performance indicators of revenue, EBITDA before restructuring measures and ROCE. Additionally, GEA makes estimates for other indicators, such as order intake, and publishes these together with the division forecasts.
Management of capital employedResources are allocated within the group primarily on the basis of strategic and medium-term planning. This provides the framework for preparing key decisions on core technologies, sales markets, and other strategically important variables.
Acquisitions and expansion investments are assessed not only on the basis of key performance indicators showing potential returns, but also in terms of their importance for achieving the group’s strategic goals. The key economic criterion for evaluating rationalization and expansion investments is the net present value. The payback period is also calculated as an additional benchmark for assessing the risk arising from changing economic conditions.
Working capital is another key element of capital employed. Working capital management begins before an order is accepted with the payment terms that are offered or negotiated.
29GEA Annual Report 2020
Fundamental Information about the Group

Project- and activity-based management In addition to general management with the aid of the key performance indicators described above, GEA has established individual assessment and approval procedures for customer and investment projects, utilizing specific thresholds for the different hierarchy levels. Customer projects are evaluated primarily on the basis of their expected margins (gross margin on a fully absorbed cost basis) and of their technical, commercial and contractual risk profile, with a particular emphasis on cash flow. Project management is also backed up by extensive project control not only at operating unit level but also – depending on the size of the project involved – at the division or group level in the form of a separate reporting system for large projects. In many cases, the findings gained from this analysis yield suggestions for improving internal processes, which can be used in subsequent projects. At group level, the analysis focuses on deviations between the calculated and the expected or realized contract margin.
30GEA Annual Report 2020
Fundamental Information about the Group

Research and Development
• 2.5 percent of revenue expensed in R&D (total R&D ratio: 2.8 percent) • 35 new products released • 53 new patent families filed • 557 people working in R&D
InnovationIn order to be able to continuously offer best-in-class technologies, innovation has been an important part of GEA’s DNA for decades. In general, innovation is focused on two areas: sustaining innovation and trend-driven innovation. To secure its leading positions, GEA focuses its investments on sustaining innovation. This addresses the ever-evolving customer needs and is based on many years of profound technology and application expertise within GEA. Subject-area experts at GEA’s numerous technology sites drive sustaining innovation in this area locally. Trend-driven innovations, on the other hand, take a longer-term view, target new markets and applications, and are inspired by emerging trends, technologies and changing end-consumer preferences. Currently, the most important mega trends are sustainability, digitalization, and novel foods known as “new food”. Trend-driven innovation is developed and managed by a central GEA team, which in turn works with local R&D teams.
SustainabilityAs a key mega trend, sustainability is an integral part of GEA’s corporate responsibility and represents an important objective for both, the company’s internal processes and its products. Ultimately, sustainability is demanded by the consumers and is therefore a particular focus in the consumer goods industry, for example in the food and beverage sector. GEA places great emphasis on improving the sustainability of its technologies and sees this as the basic prerequisite for the company’s social acceptance. Alongside conventional attributes such as functionality and cost-efficiency, sustainability is the most important feature expected by customers today. GEA sets very high standards for the sustainability of the technologies it provides to customers and sets ambitious targets for reducing energy and water consumption, waste streams and the use of plastic. Currently, one fourth of all innovation initiatives include clear targets for enhancing the sustainability of the technologies used. This development is likely to continue to gather pace.
Digitalization In addition to sustainability, digital products and services are of utmost importance to GEA and its customers. In this context, the company is focusing on developments in four categories: connected workforce, automated processes, advanced analytics and modeling & simulations. Through connected workforce, its own employees and those of its customers, GEA aims to ensure that all relevant information is quickly and easily available to customers when they need it. With automated processes, GEA helps its customers to manage their production sites efficiently by means of self-optimizing systems. This is based on a combination of artificial intelligence and in-depth process understanding. Advanced analytics as well as modeling & simulations provide data-driven insights and enable expedient decisions for customers and for GEA itself in day-to-day development processes.
Examples of new digital products and services include GEA Remote Services, GEA Virtual Process Testing, GEA InsightPartner for Breweries and Condition Monitoring Service-Level Agreements (SLAs, such as GEA PerformancePlus). With GEA Remote Services, GEA offers a comprehensive portfolio of digital solutions that enable interactive communication and immersive virtual reality experiences for GEA customers. This includes remote assistance from a GEA service engineer, who provides remote maintenance and repair support for on-site equipment. In addition, virtual factory acceptance tests (FATs) have become a reality and have led to savings in time, while reducing the necessity to travel.
With GEA PerformancePlus, GEA has successfully started to move from time and material-based service contracts to SLA-based service contracts based on the actual equipment use. With the help of condition monitoring, GEA has a remote view of the systems concerned and thus is able to conduct maintenance work at the right time.
31GEA Annual Report 2020
Fundamental Information about the Group

GEA OptiPartner is no longer only for the milk industry. The GEA InsightPartner version is now also available to the brewing industry and is offered to customers on a subscription basis. Customers can now benefit from the data-driven service to closely monitor production and reduce variations in beer quality. This enables them to increase production output while reducing unit production costs.
GEA Virtual Process Testing provides process know-how to customers virtually. This means that customers can now simulate and test the performance of processes virtually before investing in a physical plant. This has several benefits as it reduces risk, and saves time and costs. It allows customers to quickly and easily assess the impact of rebuilding or changing the settings of a production line. And all this without affecting the ongoing operation of the production lines.
New FoodConsumer attitudes towards food have changed in recent years. Environment and animal welfare are increasingly important and the trend towards health-promoting, safe and individualized food continues. In developing countries, the demand for high-quality protein-rich foods is growing even faster than the population. However, climate change shows that the share of agricultural land should be reduced in favor of natural areas. This is particularly true, since conventional meat production has a major environmental impact in terms of water consumption, air pollution, loss of biodiversity, and greenhouse gas emissions.
GEA is promoting the move towards a resource-conserving and ethically responsible production, which has given rise to new types of food known as “new food”. The technologies employed tap non-conventional, more sustainable sources especially for high-quality proteins. New food ranges from plant-based substitutes for dairy and meat, as well as insect protein to precision fermented proteins and cell-based meat. GEA has already been providing lines that cover each plant-based food production step for several years. This comprises the enzymatic treatment needed to produce plant-based dairy alternatives, the isolation of vegetable protein, and its processing to produce frozen plant-based patties. The demand for plant-based meat substitutes has surged in recent years. This is partly because start-ups have successfully learned how to mimic meat’s texture – for instance by extruding plant-based proteins – and flavor – by adding vegan heme, produced with precision fermentation. Likewise, in the production of plant-based dairy alternatives, ingredients from novel sources such as seeds, legumes, pulses, grains, and nuts are outpacing soy and – apart from milk – are partly replacing yogurts, creamers and cheese.
Precision fermented proteins are generated through genetically modified fungi or bacteria as “cell factories”. This makes it possible to produce almost any kind of protein very specifically – for instance whey protein as a functional ingredient to improve the sensory characteristics of vegan ice cream. As one of the leading suppliers of enzyme production lines, GEA has decades of experience in the area of precision fermentation. The competencies include upstream preparation of the nutrient solution and fermentation, as well as downstream separation and further processing. Cell-based meat – which is also known as cultured, cultivated or clean meat – is grown from individual animal cells outside of an animal in a bioreactor. This technology has seen significant improvements in its productivity and operational costs more recently, but it may take years before it becomes efficient enough for low-cost mass production. GEA offers a range of bioreactors for the production of monoclonal antibodies through animal cell proliferation, making GEA extremely well positioned to be a supplier to this industry. Likewise, GEA’s broad product portfolio for meat and meat substitute processing is well aligned with the diverse, individual downstream processes pursued by the cell-based meat industry.
Collaborative InnovationMost of GEA’s products need to be adapted to customers’ individual applications. The applications frequently differ substantially from previous versions, and working with customers helps in the selection and modification of existing technologies. Collaborating with customers, suppliers, academics, research partners and start-ups complements GEA’s in-house research and development activities. Through collaborative innovation, GEA taps into the innovation grid to work with the best possible partners. In this way, both the speed and the quality of the innovation process are enhanced.
32GEA Annual Report 2020
Fundamental Information about the Group

If the partner is a start-up, GEA can consult them on best practices, industry standards, and the capital and operational expenses that may need to be considered. Providing this support aligns with GEA’s corporate social responsibility as well as its general interest in learning from start-ups. GEA started working with five new start-ups in 2020.
A typical example of collaborative innovation with customers and industry partners is GEA’s newly opened Pet Food Experience Center (PEX) in Galliera Veneta, Italy. The new 1,000 square meter facility is home to a team of 30 GEA employees, including process technicians, analysts and mechanics, who now have access to a new pilot plant including a laboratory. Customers can test new recipes, experiment with product formulations and product shape, check the properties and quality of their final products, and get hands-on training in efficient processing and best practices.
Examples of new productsThe following five examples of products launched in 2020 illustrate GEA’s diverse innovation fields and the range of benefits offered to customers. Obviously, this is just a small selection of the 35 new products launched in 2020.
The GEA Blu-Red Fusion combines the successful GEA Blu chillers for cooling and the GEA Red heat pumps for heating in a single modular product. It enables high temperature lifts from a cooling side of -15°C to +15°C to a heating side of +70°C to +80°C.
Benefits: The leaner and more compact design makes an intermediate liquid cycle obsolete. This drastically reduces both the capital investment and footprint. Energy efficiency is easily increased by 10%, since power is not wasted on glycol or water pumps. The design remains flexible in terms of configuration and operation, and it operates with a minimum of ammonia. In contrast to most other refrigerants, ammonia has no potential for global warming, or for ozone depletion.
33GEA Annual Report 2020
Fundamental Information about the Group

The vertical food packaging machine GEA SmartPacker CX400 D-Zip can produce all common bag types and bag a wide variety of applications, including candy, nuts, frozen fruits and grated cheese.
Benefits: The vertical SmartPacker offers a capacity of up to 100 D-Zip bags per minute, more flexibility with regard to resealable bag style, higher uptime, fast changeover without special tools, front discharge, easy maintenance access, and a further reduced footprint. Our integrated new corner seal unit reduces the amount of plastic required for the zipper by approximately 15 percent by eliminating zipper-material in the cross seal. Additional plastic waste is avoided as no punching is required to make the zipper.
GEA offers visual and verbal communication opportunities for support to customers in two ways. Firstly, the GEA Remote Eye Wear glasses with an integrated high-resolution camera, a reliable microphone and an eye wear screen, which allows for voice-controlled, hands-free working. Secondly, a simplified version called GEA Remote Support, to be used with any smartphone or tablet, and initiated without a separate application via a secure data connection. This tool can easily be made available to a broader customer base.
Benefits: By videoconferencing with the GEA experts, customers can carry out repairs, optimize processes and perform inspections on their own. Further options include a chat function for noisy environments or recording a problem to be passed on to second-level GEA support. This fast and comprehensive service is intended to enhance GEA’s connection with its customers through the Covid-19 pandemic and beyond.
34GEA Annual Report 2020
Fundamental Information about the Group

GEA has also updated the GEA ConsiGma® portfolio of products. These are multipurpose manufacturing systems that convert pharmaceutical powder to coated tablets in an integrated process line. The flexible continuous processing technology simplifies the scale-up from development to production.
Benefits: The ConsiGma® 4.0 can now be installed as standalone or modular plant in both new and existing facilities that are already equipped with third-party machinery. Its ability to gather and analyze data regarding critical quality attributes in-process and in real-time results in faster and more efficient high-quality manufacturing processes.
The GEA SANICIP® II bag filter was released in mid-2020 and is used to capture the powder product downstream a spray dryer – typically in food and dairy applications.
Benefits: GEA SANICIP® II is the culmination of an extensive design optimization process using computational fluid dynamics. The patent pending inlet and dedusting system, with shorter filtration bags and smoother operation, offers longer bag life, easier maintenance, improved uptime due to extended cleaning intervals and greater reliability. Furthermore, the emission levels comply with the strictest European standards. The SANICIP® II is easy to integrate into a spray drying installation and thus reduces the overall installation footprint. Lastly, the SANICIP® II design is suited both to new, green-field plants and plant upgrades.
35GEA Annual Report 2020
Fundamental Information about the Group
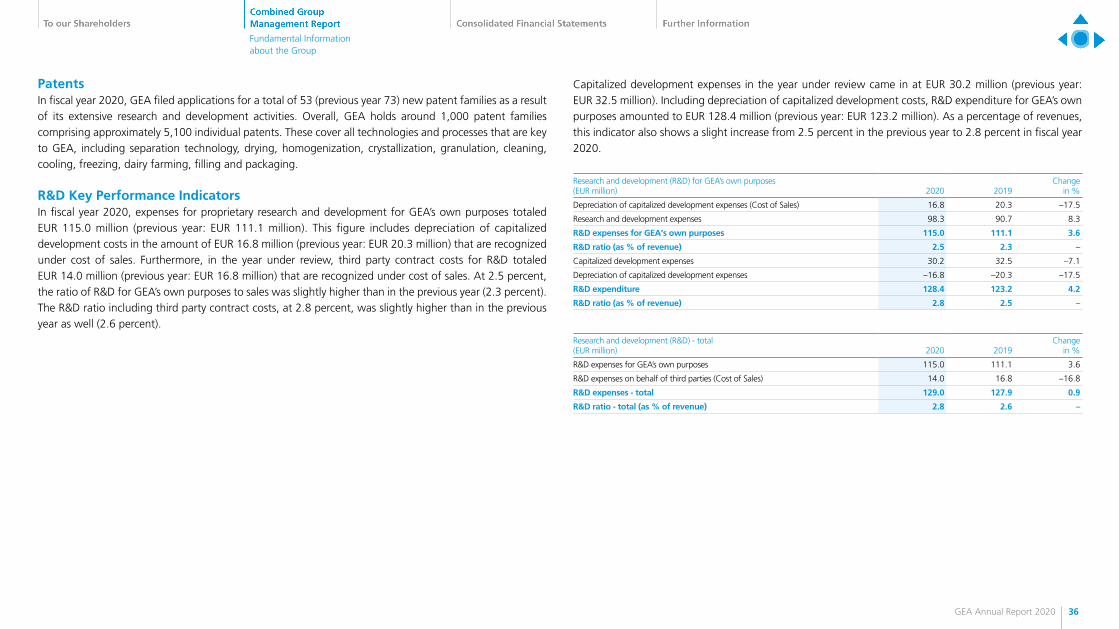
PatentsIn fiscal year 2020, GEA filed applications for a total of 53 (previous year 73) new patent families as a result of its extensive research and development activities. Overall, GEA holds around 1,000 patent families comprising approximately 5,100 individual patents. These cover all technologies and processes that are key to GEA, including separation technology, drying, homogenization, crystallization, granulation, cleaning, cooling, freezing, dairy farming, filling and packaging.
R&D Key Performance IndicatorsIn fiscal year 2020, expenses for proprietary research and development for GEA’s own purposes totaled EUR 115.0 million (previous year: EUR 111.1 million). This figure includes depreciation of capitalized development costs in the amount of EUR 16.8 million (previous year: EUR 20.3 million) that are recognized under cost of sales. Furthermore, in the year under review, third party contract costs for R&D totaled EUR 14.0 million (previous year: EUR 16.8 million) that are recognized under cost of sales. At 2.5 percent, the ratio of R&D for GEA’s own purposes to sales was slightly higher than in the previous year (2.3 percent). The R&D ratio including third party contract costs, at 2.8 percent, was slightly higher than in the previous year as well (2.6 percent).
Capitalized development expenses in the year under review came in at EUR 30.2 million (previous year: EUR 32.5 million). Including depreciation of capitalized development costs, R&D expenditure for GEA’s own purposes amounted to EUR 128.4 million (previous year: EUR 123.2 million). As a percentage of revenues, this indicator also shows a slight increase from 2.5 percent in the previous year to 2.8 percent in fiscal year 2020.
Research and development (R&D) for GEA’s own purposes(EUR million) 2020 2019
Changein %
Depreciation of capitalized development expenses (Cost of Sales) 16.8 20.3 –17.5
Research and development expenses 98.3 90.7 8.3
R&D expenses for GEA‘s own purposes 115.0 111.1 3.6
R&D ratio (as % of revenue) 2.5 2.3 –
Capitalized development expenses 30.2 32.5 –7.1
Depreciation of capitalized development expenses –16.8 –20.3 –17.5
R&D expenditure 128.4 123.2 4.2
R&D ratio (as % of revenue) 2.8 2.5 –
Research and development (R&D) - total(EUR million) 2020 2019
Changein %
R&D expenses for GEA’s own purposes 115.0 111.1 3.6
R&D expenses on behalf of third parties (Cost of Sales) 14.0 16.8 –16.8
R&D expenses - total 129.0 127.9 0.9
R&D ratio - total (as % of revenue) 2.8 2.6 –
36GEA Annual Report 2020
Fundamental Information about the Group

Report on Economic Position
Latin America 553
305 million
North and Central Europe 3,040
604 million
Asia Pacific 3,005
1.058 million
North America 1,618
865 million
DACH & Eastern Europe 6,883
1.022 million
= Employees (FTEs) = Revenue
Western Europe, Middle East & Africa 3,132
781 million
GEA in fiscal year 2020
The outlook for fiscal year 2020 was based on constant exchange rates and, in particular, on the assumption that demand in GEA’s sales markets will stagnate or even weaken slightly due to a strained economic environment. The outlook did not take into account possible acquisitions and divestments in 2020.
In the ad hoc announcement on July 30, 2020, GEA confirmed its outlook for revenue and raised its guidance for EBITDA before restructuring measures from EUR 430 million to EUR 480 million to “at minimum a figure at the upper end of the previous range of EUR 430 million to EUR 480 million.” The expectation for ROCE was also raised from 9.0 – 11.0 percent to 12.0 – 14.0 percent. In the quarterly statement for the third quarter, the outlook for revenue was reaffirmed, while the guidance for EBITDA before restructuring measures and for ROCE were further specified. The updated outlook for 2020 was the following:
• Revenue slightly declining (previous year EUR 4,880 million), • EBITDA before restructuring measures of more than EUR 500 million
(previous year: EUR 479 million) • ROCE of 15.0 to 17.0 percent (previous year: 10.6 percent).
The expectation of a slight decline in revenue was confirmed at minus 2.6 percent (at constant exchange rates). EBITDA before restructuring measures (EUR 542 million) and ROCE (17.1 percent), both at constant exchange rates, exceeded the most recently updated outlook and thus also the forecast in the 2019 Annual Report.
Further information on GEA’s business performance can be found in the “Current Position” section of this chapter.
37GEA Annual Report 2020
Report on Economic Position

Forecast fiscal year 2020
Forecast for 2020 (as per Annual Report 2019)
New forecast(ad-hoc 07/30/2020
or for divisions in the Q2 Financial Report)
New forecast(in Q3
announcement)2020
reported
2020at constant
exchange rates
Revenue performance* slightly declining slightly declining slightly declining –5.0% –2.6%
EBITDA before restructuring measures EUR 430 - 480 million
at least at the upper end
of the rangemore than
EUR 500 million EUR 532 million EUR 542 million
ROCE 9.0 – 11.0% 12.0 – 14.0% 15.0 – 17.0% 17.1% 17.1%
*) For revenue, “slight” corresponds to a change of up to +/- 5%, while changes of +/- 5% or more are referred to as “significant”.
The following tables show the outlook for the individual divisions and the respective target achievement:
Revenue development*
Forecast for 2020 (as per Annual Report 2019)
New forecast(ad-hoc 07/30/2020
or for divisions in the Q2 Financial Report)
New forecast(in Q3
announcement)2020
reported
2020at constant
exchange rates
Separation & Flow Technologies slightly declining slightly declining n.a. –3.7% –1.4%
Liquid & Powder Technologies slightly declining slightly declining n.a. –3.7% –1.7%
Food & Healthcare Technologies slightly declining significantly declining n.a. –7.0% –6.5%
Farm Technologies slightly declining significantly declining n.a. –4.8% –0.1%
Refrigeration Technologies slightly declining significantly declining n.a. –6.0% –3.2%
Consolidation – – – – –
*) For revenue, “slight” corresponds to a change of up to +/- 5%, while changes of +/- 5% or more are referred to as “significant”.
EBITDA before restructuring measures*
Forecast for 2020 (as per Annual Report 2019)
New forecast(ad-hoc 07/30/2020
or for divisions in the Q2 Financial Report)
New forecast(in Q3
announcement)2020
reported
2020at constant
exchange rates
Separation & Flow Technologies slightly declining slightly rising n.a. +3.3% +4.4%
Liquid & Powder Technologies significantly rising significantly rising n.a. +37.8% +39.8%
Food & Healthcare Technologies slightly declining significantly rising n.a. +18.3% +18.5%
Farm Technologies slightly declining slightly rising n.a. +11.0% +17.2%
Refrigeration Technologies slightly declining slightly declining n.a. +0.8% +3.2%
Others significantly declining significantly declining n.a. –21.4% –21.5%
Consolidation – – – – –
*) For result variables, “slight” corresponds to a change of up to +/- 10%, while changes of +/- 10% or more are considered “significant”.
ROCE*
Forecast for 2020 (as per Annual Report 2019)
New forecast(ad-hoc 07/30/2020
or for divisions in the Q2 Financial Report)
New forecast(in Q3
announcement)2020
reported
2020at constant
exchange rates
Separation & Flow Technologies slightly declining slightly rising n.a. +2.5% p. +2.5% p.
Liquid & Powder Technologies significantly rising significantly rising n.a. +156.8% p. +162.7% p.
Food & Healthcare Technologies slightly rising significantly rising n.a. +4.2% p. +4.2% p.
Farm Technologies slightly declining slightly rising n.a. +4.1% p. +4.7% p.
Refrigeration Technologies slightly declining slightly rising n.a. +5.0% p. +4.8% p.
*) GEA defines changes in ROCE as “slight” up to +/- 3% p. and as “significant” from +/- 3% p.
38GEA Annual Report 2020
Report on Economic Position

Macroeconomic environment
As a global technology company, GEA considers growth in gross domestic product (GDP) and hence the International Monetary Fund’s (IMF) assessments in this regard to be key benchmarks for its own development.
In fiscal year 2020, the global economy experienced a noticeable recession as a result of the Covid-19 pandemic. The IMF anticipates a significant decline in economic output of around 3.5 percent for 2020 (World Economic Outlook Update, January 2021). According to the latest estimates, industrialized countries are expected to record a decline of 4.9 percent despite extensive economic stimulus and monetary policy measures. For the USA, the IMF anticipates a decline of 3.4 percent and a contraction of 5.4 percent for Germany. More pronounced negative developments are expected for France, Italy and Spain - all of which were more severely affected by the pandemic. Only for China does the IMF forecast growth of 2.3 percent. Developments in emerging markets (excluding China) and in developing countries were noticeably impacted by the negative effects of the Covid-19 pandemic in 2020: according to the IMF, large economies such as India (-8.0 percent), Brazil (-4.5 percent) and Mexico (-8.5 percent) all recorded significant declines.
Figures published by the German Mechanical Engineering Industry Association (VDMA) are a reflection of the current situation in the engineering sector. Order intake in the German mechanical and plant engineering sector recorded a year-on-year decline of 11 percent in 2020. In particular, weaker foreign orders contributed to this decline, although domestic orders were also down. According to the VDMA, in addition to the consequences of the Covid-19 pandemic having a negative impact, the continuing protectionism in international trade and the far-reaching structural change in the automotive industry led to uncertainties and a reluctance to invest.
Business performance
The business performance is explained below for the continuing operations and thus GEA’s five divisions. The quarterly information contained in the management report are sourced from quarterly financial statements not subject to an auditor’s review and from the half-year report, which was reviewed by KPMG AG Wirtschaftsprüfungsgesellschaft. All amounts have been rounded to the nearest whole number using standard rounding rules. In individual cases, rounding differences may occur when adding individual values to the total value.
DisposalsGEA sold the Refrigeration Technologies Division’s compressor manufacturer Bock to NORD Holding, continuing its focus on the food, beverage and pharmaceutical industries as strategic core markets. The purchase agreement was signed on September 21, 2020. The sale was closed on February 26, 2021.
Moreover, GEA divested two companies previously operated under the Farm Technologies Division. These are the French company GEA Farm Technologies Japy SAS, a producer of milk cooling tanks based in Dijon, and Royal De Boer Stalinrichtingen B.V., a leading European supplier of barn equipment based in Leeuwarden, Netherlands. The purchase agreement with Mutares SE & Co. KGaA, a listed investment company, was signed on November 4. The sale was closed on December 31, 2020.
RestructuringIn fiscal year 2020, restructuring expenses of EUR 54.2 million were incurred in EBITDA (previous year: EUR 104.9 million). Of these restructuring expenses, EUR 49.2 million are cash items, of which EUR 38.2 million in the year under review. Restructuring expenses were incurred mainly for the optimization of both, the production landscape and the purchasing organization, for the implementation of the new group structure and for anticipated portfolio changes.
39GEA Annual Report 2020
Report on Economic Position

Current Position
Results of operations
Order intakeIn 2020, due to the pandemic, the group’s order intake amounted to EUR 4,703.0 million, 4.6 percent below the previous year’s level of EUR 4,931.1 million. This downward trend has been observed since the second quarter. In the reporting year, Farm Technologies was the only division showing an increased order intake. Order intake declined notably by 11.6 percent in the Refrigeration Technologies Division. Adjusted for the effect of exchange rate fluctuations (-2.5 percent), the group’s adjusted order intake decreased by 2.2 percent. With the exception of projects with order volumes ranging from EUR 1 to EUR 5 million, order intake decreased across all order sizes.
Order intake(EUR million) 2020 2019
Changein %
Adjusted growth
in %
Separation & Flow Technologies 1,211.6 1,271.8 –4.7 –2.4
Liquid & Powder Technologies 1,665.3 1,828.5 –8.9 –7.0
Food & Healthcare Technologies 854.2 914.4 –6.6 –6.0
Farm Technologies 677.0 641.8 5.5 10.7
Refrigeration Technologies 625.3 707.0 –11.6 –8.8
Consolidation –330.3 –432.4 23.6 –
GEA 4,703.0 4,931.1 –4.6 –2.2
Order intake declined, particularly in the food and beverage customer industries. By contrast, developments in the pharmaceuticals, chemicals, dairy processing and dairy farming customer industries were encouraging.
The decline in order intake was particularly pronounced in the Latin America region. Order intake only rose in the Western Europe, Middle East & Africa regions.
GEA secured 11 large orders (exceeding EUR 15 million) in the reporting year at a combined value of over EUR 270 million. Most orders came from the dairy and beverage sector. In addition, the company acquired a pharma project and posted a large order from the chemicals sector. The regional focus of these projects lay on the North America, Asia Pacific and Europe regions. In the previous year, GEA posted 17 large orders totaling more than EUR 350 million.
Order backlog The order backlog had, based on the order intake for the fiscal year ended December 31, 2020, a theoretical range of 5.9 months (previous year also 5.9 months). Depending on the type of business, the theoretical range was between 2.7 months for the Farm Technologies Division and 6.8 months and 8.5 months respectively for the Food & Healthcare Technologies and Liquid & Powder Technologies divisions.
Order backlog(EUR million) 12/31/2020 12/31/2019
Changein %
Change(absolute)
Separation & Flow Technologies 373.7 396.8 –5.8 –23.1
Liquid & Powder Technologies 1,177.4 1,254.1 –6.1 –76.7
Food & Healthcare Technologies 481.5 554.7 –13.2 –73.2
Farm Technologies 150.7 123.0 22.5 27.7
Refrigeration Technologies 235.8 283.8 –16.9 –48.1
Consolidation –120.7 –200.1 39.7 79.4
GEA 2,298.5 2,412.4 –4.7 –113.9
40GEA Annual Report 2020
Report on Economic Position
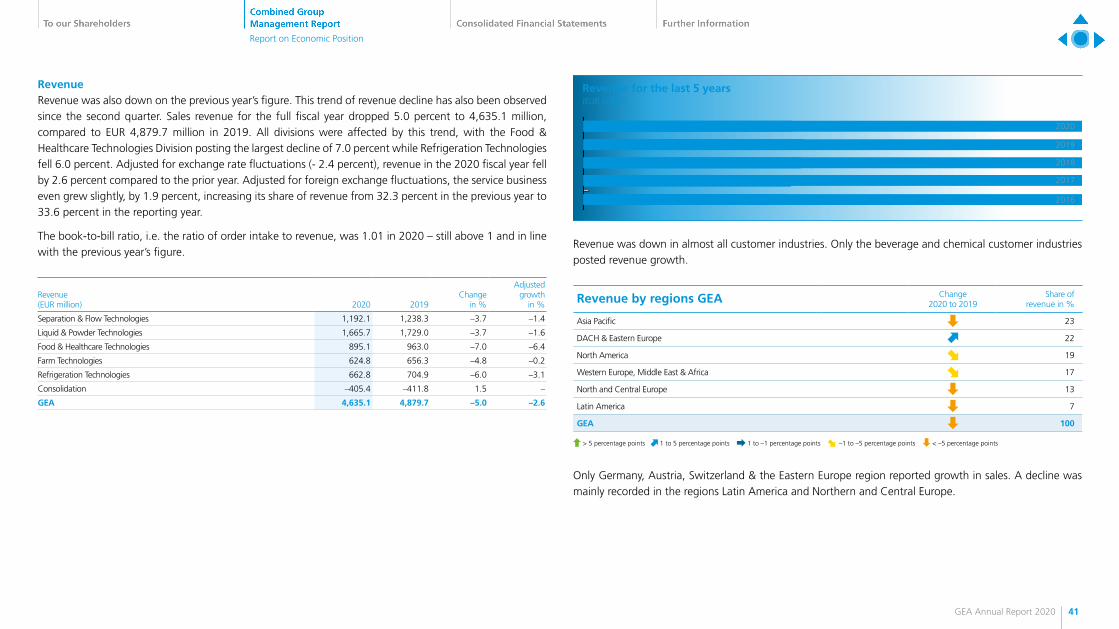
RevenueRevenue was also down on the previous year’s figure. This trend of revenue decline has also been observed since the second quarter. Sales revenue for the full fiscal year dropped 5.0 percent to 4,635.1 million, compared to EUR 4,879.7 million in 2019. All divisions were affected by this trend, with the Food & Healthcare Technologies Division posting the largest decline of 7.0 percent while Refrigeration Technologies fell 6.0 percent. Adjusted for exchange rate fluctuations (- 2.4 percent), revenue in the 2020 fiscal year fell by 2.6 percent compared to the prior year. Adjusted for foreign exchange fluctuations, the service business even grew slightly, by 1.9 percent, increasing its share of revenue from 32.3 percent in the previous year to 33.6 percent in the reporting year.
The book-to-bill ratio, i.e. the ratio of order intake to revenue, was 1.01 in 2020 – still above 1 and in line with the previous year’s figure.
Revenue(EUR million) 2020 2019
Changein %
Adjusted growth
in %
Separation & Flow Technologies 1,192.1 1,238.3 –3.7 –1.4
Liquid & Powder Technologies 1,665.7 1,729.0 –3.7 –1.6
Food & Healthcare Technologies 895.1 963.0 –7.0 –6.4
Farm Technologies 624.8 656.3 –4.8 –0.2
Refrigeration Technologies 662.8 704.9 –6.0 –3.1
Consolidation –405.4 –411.8 1.5 –
GEA 4,635.1 4,879.7 –5.0 –2.6
Revenue for the last 5 years (EUR million)
4,635
4,880
4,828
4,605
4,492
2020
2019
2018
2017
2016
Revenue was down in almost all customer industries. Only the beverage and chemical customer industries posted revenue growth.
Revenue by regions GEA Change 2020 to 2019
Share ofrevenue in %
Asia Pacific 23
DACH & Eastern Europe 22
North America 19
Western Europe, Middle East & Africa 17
North and Central Europe 13
Latin America 7
GEA 100
> 5 percentage points 1 to 5 percentage points 1 to –1 percentage points –1 to –5 percentage points < –5 percentage points
Only Germany, Austria, Switzerland & the Eastern Europe region reported growth in sales. A decline was mainly recorded in the regions Latin America and Northern and Central Europe.
41GEA Annual Report 2020
Report on Economic Position

Results of operationsIn fiscal year 2020, despite lower sales volume, EBITDA before restructuring measures came in at EUR 532.5 million, 11 percent higher than the prior-year figure of EUR 479.2 million. The corresponding margin of 11.5 percent was nearly 170 basis points above prior year figure. Particularly in the first two quarters, EBITDA before restructuring measures was notably higher than in the comparable prior-year quarters.
The cost of sales decreased disproportionately by EUR 259.5 million to EUR 3,219.0 million in fiscal year 2020. Gross margin improved notably by more than 180 basis points to 30.6 percent. Moreover, selling expenses decreased disproportionately to revenue by EUR 68.7 million down to EUR 546.6 million in 2020. In relation to revenue, this amounts to 11.8 percent, compared with 12.6 percent in the previous year. The main contributors to the improvement in the gross margin were the Liquid & Powder Technologies and Refrigeration Technologies divisions. Significant savings in selling expenses were realized at Liquid & Powder Technologies and Farm Technologies. These two divisions also played a major role in reducing personnel expenses by EUR 100.0 million to EUR 1,417.5 million.
The following table shows EBITDA before restructuring measures by division:
EBITDA before restructuring measures/EBITDA margin before restructuring measures(EUR million) 2020 2019
Changein %
Separation & Flow Technologies 255.3 247.1 3.3
Liquid & Powder Technologies 120.2 87.2 37.8
Food & Healthcare Technologies 79.0 66.8 18.3
Farm Technologies 66.9 60.3 11.0
Refrigeration Technologies 58.8 58.3 0.8
Others –47.3 –39.0 –21.4
Consolidation –0.4 –1.5 74.4
GEA 532.5 479.2 11.1
as % of revenue 11.5 9.8 –
The table below shows the reconciliation of EBITDA before restructuring measures via EBIT before restructuring measures to EBIT:
Reconciliation of EBITDA before restructuring measures to EBIT(EUR million) 2020 2019
Changein %
EBITDA before restructuring measures 532.5 479.2 11.1
Depreciation of property, plant, and equipment, investment property, and amortization of intangible assets –195.5 –202.3 –
Impairment losses and reversals of impairment losses on property, plant, and equipment, investment property, intangible assets, and goodwill –5.6 –5.4 –
Other impairment losses and reversals of impairment losses –0.0 –0.1 –
EBIT before restructuring measures 331.4 271.4 22.1
Restructuring measures –110.2 –380.5 –
EBIT 221.2 –109.1 –
The table below shows the key indicators affecting GEA’s results of operations:
Key figures: Results of operations(EUR million) 2020 2019
Changein %
Revenue 4,635.1 4,879.7 –5.0
EBITDA before restructuring measures 532.5 479.2 11.1
EBITDA 478.3 374.4 27.8
EBIT before restructuring measures 331.4 271.4 22.1
EBIT 221.2 –109.1 –
Interest result –24.1 –16.4 –46.5
EBT 197.1 –125.5 –
Income taxes 89.1 61.0 46.0
Profit after tax from continuing operations 108.0 –186.6 –
Profit/loss after tax from discontinued operations –11.2 15.9 –
Profit for the period 96.8 –170.7 –
In fiscal year 2020, GEA again managed to generate positive EBIT (EUR 221.2 million). In the prior year, a negative EBIT of EUR 109.1 million had to be reported, due to an impairment on the goodwill of the subsidiary Pavan S.p.A. (EUR 247.6 million). Other reasons for the significant increase in earnings were lower restructuring measures and improved operating results in fiscal year 2020. The EBIT margin in the reporting year was 4.8 percent, compared with –2.2 percent in the previous year. The EBIT margin adjusted for restructuring measures was 7.1 percent in the reporting year and thus, approximately 160 basis points above the prior year figure.
42GEA Annual Report 2020
Report on Economic Position

In the previous year, the net interest expense was improved by a one-off effect from the adjustment of the interest calculation method used to determine provisions for environmental protection and mining (EUR 11.5 million). As a result, the net interest expense of EUR 24.1 million in the reporting year was significantly higher than in the previous year (EUR –16.4 million). On the positive side, net interest income benefited from a lower underlying interest rate compared with the previous year due to the accrual of interest on pension provisions.
Income tax expense in the 2020 fiscal year of EUR 89.1 million (previous year: EUR 61.0 million) comprised current tax expense of EUR 72.3 million (previous year: EUR 82.3 million) and deferred tax expense of EUR 16.8 million (previous year: EUR 21.3 million deferred tax income). The tax rate in the reporting year was 45.2 percent (previous year: -48.6 percent; respectively adjusted for the non-tax-deductible effect of the impairment on the goodwill of Pavan, 50.0 percent). The divergence from the expected tax rate of 30.0 percent is largely due to non-tax-deductible expenses, changes in valuation allowances recognized on deferred tax assets as well as withholding and other foreign taxes.
The discontinued operations reported a loss of EUR 11.2 million in the reporting year, primarily due to the valuation of legacy liabilities from former mining activities. In the previous year, earnings from discontinued operations at EUR 15.9 million were well into positive territory on the back of adjustments to the method of interest calculation (EUR 21.2 million before income taxes). This was offset by a tax effect of EUR 4.7 million, the reversal of a tax provision, and a reimbursement from the Dörries Scharmann AG insolvency proceedings.
In the fiscal year, consolidated profit for the period increased to EUR 96.8 million (previous year: EUR -170.7 million), which was again almost entirely attributable to the shareholders of GEA Group Aktiengesellschaft. Based on the unchanged average number of shares compared to the previous year (180,528,462 shares), this translates to earnings per share of EUR 0.54 (previous year: EUR -0.95). Adjusted for restructuring measures, earnings per share were EUR 1.03 (previous year EUR 0.98).
In addition to holding company costs in the narrower sense, the results of operations of GEA Group Aktiengesellschaft are primarily driven by net investment income and net interest income. More in-depth information on the earnings situation is provided in the section entitled “Net assets, financial position, and results of operations of GEA Group Aktiengesellschaft”.
43GEA Annual Report 2020
Report on Economic Position

Financial positionGiven the market volatility and other factors, management of liquidity and centralized financial management remain crucial to the company’s continued success.
As of the reporting date, GEA’s cash credit lines and their utilization are as follows:
GEA cash credit lines incl. discontinued operations(EUR million) Maturity
12/31/2020approved
12/31/2020utilized
Borrower’s note loan (2023) February 2023 128 128
Borrower’s note loan (2025) February 2025 122 122
European Investment Bank (2025) December 2025 50 50
European Investment Bank (2027) March 2027 100 100
Bilateral credit lines until further notice 81 17
Syndicated credit line (“Club Deal”) August 2022 650 –
Syndicated credit line II August 2021 200 –
European Investment Bank III Juli 2021 100 –
Total 1,431 417
Principles and goalsThe group’s financial management encompasses liquidity management, group financing, and the management of interest rate and currency risks. As the group management company, GEA Group Aktiengesellschaft is responsible for GEA’s central financial management, which aims to reduce financing costs to the extent possible, optimize interest rates for financial investments, minimize counterparty credit risk, leverage economies of scale, hedge interest rate and exchange rate risk exposures as effectively as possible, and ensure compliance with loan covenants. GEA’s financing strategy is designed to not only meet its payment obligations at all times, but also to ensure that sufficient cash reserves are always available in the form of credit lines, in addition to maintaining a strategic cash position.
Cash flow from operating activities is the most important source of liquidity. Intragroup cash pooling aims to limit external cash investments and borrowings to the lowest level possible. To achieve this, GEA has established cash pooling groups in 17 countries that automatically balance the accounts of the participating group companies every day by crediting or debiting a target account at GEA Group Aktiengesellschaft. Any additional liquidity needs are generally serviced by Group Management, which also invests surplus liquidity. In a number of cases, however, liquidity peaks in individual countries cannot be reduced on a cross-border basis due to legal or tax-related reasons.
LiquidityThe key factors responsible for the change in net liquidity are shown in the following chart:
Net position 12/31/2019
+28
Net cash flow
+547
Free cash flow
+626
IFRS 16 Payments
–62
Interests paid
–16
Discontinued operations
–2
Dividends
–153
Currency effects
Others
–16–2
Net position 12/31/2020
+402
Change in net financial position(EUR million)
Net liquidity including the discontinued operations was EUR 402.3 million as of December 31, 2020, compared to EUR 28.4 million at the end of the previous year. Aside from realized EBITDA, this significant increase in liquidity is due to the considerable reduction in net working capital. The largest cash outflows are attributable to the dividend paid as well as to investments in property, plant and equipment and intangible assets of EUR 153.4 million and EUR 97.6 million, respectively.
44GEA Annual Report 2020
Report on Economic Position
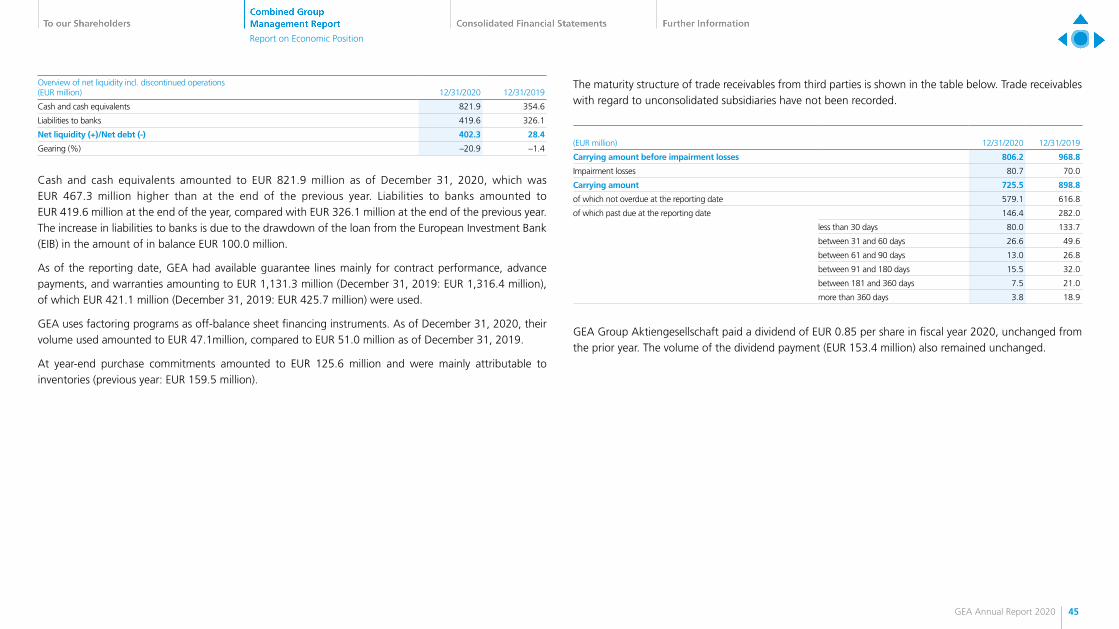
Overview of net liquidity incl. discontinued operations(EUR million) 12/31/2020 12/31/2019
Cash and cash equivalents 821.9 354.6
Liabilities to banks 419.6 326.1
Net liquidity (+)/Net debt (-) 402.3 28.4
Gearing (%) –20.9 –1.4
Cash and cash equivalents amounted to EUR 821.9 million as of December 31, 2020, which was EUR 467.3 million higher than at the end of the previous year. Liabilities to banks amounted to EUR 419.6 million at the end of the year, compared with EUR 326.1 million at the end of the previous year. The increase in liabilities to banks is due to the drawdown of the loan from the European Investment Bank (EIB) in the amount of in balance EUR 100.0 million.
As of the reporting date, GEA had available guarantee lines mainly for contract performance, advance payments, and warranties amounting to EUR 1,131.3 million (December 31, 2019: EUR 1,316.4 million), of which EUR 421.1 million (December 31, 2019: EUR 425.7 million) were used.
GEA uses factoring programs as off-balance sheet financing instruments. As of December 31, 2020, their volume used amounted to EUR 47.1million, compared to EUR 51.0 million as of December 31, 2019.
At year-end purchase commitments amounted to EUR 125.6 million and were mainly attributable to inventories (previous year: EUR 159.5 million).
The maturity structure of trade receivables from third parties is shown in the table below. Trade receivables with regard to unconsolidated subsidiaries have not been recorded.
(EUR million) 12/31/2020 12/31/2019
Carrying amount before impairment losses 806.2 968.8
Impairment losses 80.7 70.0
Carrying amount 725.5 898.8
of which not overdue at the reporting date 579.1 616.8
of which past due at the reporting date 146.4 282.0
less than 30 days 80.0 133.7
between 31 and 60 days 26.6 49.6
between 61 and 90 days 13.0 26.8
between 91 and 180 days 15.5 32.0
between 181 and 360 days 7.5 21.0
more than 360 days 3.8 18.9
GEA Group Aktiengesellschaft paid a dividend of EUR 0.85 per share in fiscal year 2020, unchanged from the prior year. The volume of the dividend payment (EUR 153.4 million) also remained unchanged.
45GEA Annual Report 2020
Report on Economic Position

Consolidated Cash Flow StatementThe consolidated cash flow statement can be summarized as follows:
Overview of cash flow statement(EUR million) 2020 2019
Changeabsolute
Cash flow from operating activities 717.8 483.2 234.6
Cash flow from investing activities –92.2 –141.0 48.8
Free cash flow 625.6 342.2 283.4
Cash flow from financing activities –138.6 –226.0 87.5
Net cash flow other discontinued operations –1.7 –11.9 10.2
Change in unrestricted cash and cash equivalents 467.7 106.7 361.0
Cash flow from operating activities attributable to the continuing operations amounted to EUR 717.8 million in the year under review, once again well above the previous year’s figure of EUR 483.2 million. The main drivers were a higher EBITDA and, above all, the further reduction in net working capital.
Cash flow from investing activities attributable to the continuing operations totaled EUR -92.2 million in the reporting year, compared to EUR -141.0 million in the previous year. In the 2020 fiscal year, this item includes mainly payments for investments in property, plant and equipment and intangible assets of EUR 97.6 million (previous year: EUR 137.0 million) as well as EUR 1.9 million in payments for disposals of companies (previous year: EUR 12.6 million).
In addition to the dividend payment, again EUR 153.4 million, cash flow from financing activities attributable to the continuing operations mainly reflected payments for lease liabilities of EUR 62.4 million and the drawdown of the loan from the European Investment Bank of in balance EUR 100.0 million. In the previous year this item also included the dividend payout and outflows for lease liabilities (EUR 63.5 million). Proceeds from raising finance loans and outflows for their repayment amounted to a net cash inflow of EUR 5.9 million in the previous year.
Cash flow from discontinued operations amounted to just EUR –1.7 million in the reporting year, compared to EUR –11.9 million in the previous year.
EBITDA before restruc-turing
Delta net working capital
Taxes Cash-out restructuring
Others Operating cash flow
Capex OthersNet effects from
divestment
Free cash flow
+532
+242 –60
–50 +54 +718 –98
+7–2 +626
Free cash flow(EUR million)
46GEA Annual Report 2020
Report on Economic Position

Net assets
Condensed balance sheet(EUR million) 12/31/2020
as % oftotal assets 12/31/2019
as % oftotal assets
Changein %
Assets
Non-current assets 2,899.7 51.0 3,066.6 53.7 –5.4
thereof goodwill 1,502.1 26.4 1,512.2 26.5 –0.7
thereof deferred taxes 333.8 5.9 351.6 6.2 –5.0
Current assets 2,787.2 49.0 2,643.9 46.3 5.4
thereof cash and cash equivalents 821.9 14.5 354.6 6.2 > 100
thereof assets held for sale 44.5 0.8 0.2 0.0 > 100
Total assets 5,686.9 100.0 5,710.6 100.0 –0.4
Equity and liabilities
Equity 1,921.4 33.8 2,090.1 36.6 –8.1
Non-current liabilities 1,639.7 28.8 1,540.8 27.0 6.4
thereof deferred taxes 98.6 1.7 104.3 1.8 –5.5
Current liabilities 2,125.8 37.4 2,079.7 36.4 2.2
thereorf liabilities held for sale 27.4 0.5 – – –
Total equity and liabilities 5,686.9 100.0 5,710.6 100.0 –0.4
Compared to December 31, 2020, the balance sheet was reduced slightly by EUR 23.7 million or 0.4 percent. Especially, cash and cash equivalents increased, while in contrast, inventories, trade receivables and construction contract receivables were significantly down. Non-current assets included a significant reduction in property, plant, and equipment and intangible assets. Of the reduction in property, plant, and equipment and intangible assets (incl. goodwill), EUR 39.4 million relates to assets of the compressor manufacturer Bock.
Equity was reduced by EUR 168.6 million. Whereas consolidated net income of EUR 96.8 million had a positive effect, the dividend payment (EUR 153.4 million), lower interest rates in the measurement of pension provisions (EUR 32.3 million) and effects from currency translation (EUR 81.4 million) reduced equity. Consequently, the equity ratio fell to 33.8 percent at the end of the fiscal year, compared to 36.6 percent on December 31, 2019.
Within non-current liabilities, liabilities to banks increased significantly due to the utilization of the loan from the EIB in the amount of in balance EUR 100.0 million, whereas lease liabilities were reduced as planned. For current liabilities, accounts payable were significantly reduced. By contrast, liabilities from construction contracts and from other taxes as well as other current provisions increased.
12/31/2019
Non-current assets
Current assets
Current liabilities
Equity
Non-current liabilities
Comparison of net assets (2020 vs. 2019) (EUR million)
AssetsEquity andliabilities
12/31/2020 12/31/2020 12/31/2019
2,644
3,067
5,711
2,787
2,900
5,687
2,126
1,921
1,640
5,687
2,080
2,090
1,541
5,711
47GEA Annual Report 2020
Report on Economic Position

Change in net working capital (continued operations)(EUR million)
Trade receivables
Contract assets
Inventories
Trade payables
Contract liabilities
Anticipated losses from construction contracts
Net working capital
Q4 2020
Q4 2019 - = 682915 741413 640741 6
- = 367744 624348 682666 1
Return on Capital Employed (ROCE)
Return on capital employed (ROCE)(average of the last 4 quarters) 12/31/2020 12/31/2019
EBIT before restructuring measures (EUR million) 331.4 271.4
Capital employed (EUR million)* 1,942.9 2,566.4
Return on capital employed (in %) 17.1 10.6
*) Capital employed excluding goodwill from the acquisition of the former GEA AG by former Metallgesellschaft AG in 1999 (average of the last 4 quarters); this also applies for the ROCE of the divisions.
The sharp rise in ROCE from 10.6 percent to 17.1 percent is attributable to both, the good earnings development and the significant decrease in capital employed. The decrease in capital employed is mainly due to two factors. On the one hand, a reduction of EUR 266.1 million in net working capital (partly due to the reduction of overdue receivables) and, on the other hand, the goodwill impairment of the Italian subsidiary Pavan S.p.A. recognized in December 2019 (EUR 247.6 million). This impairment reduced capital employed as of December 31, 2019, impacting only one of the four quarters during 2019 while the impairment impacted all four quarters of the fiscal year ending December 31, 2020. All capital employed items are calculated as an average of the last four quarters.
All divisions were able to increase ROCE in the reporting year compared to the previous year’s figure, in some cases significantly.
48GEA Annual Report 2020
Report on Economic Position

GEA’s divisions in the fiscal year
Separation & Flow Technologies
Separation & Flow Technologies(EUR million) 2020 2019
Changein %
Order intake 1,211.6 1,271.8 –4.7
Revenue 1,192.1 1,238.3 –3.7
EBITDA before restructuring measures 255.3 247.1 3.3
as % of revenue 21.4 20.0 –
EBITDA 241.1 230.8 4.5
EBIT before restructuring measures 210.9 206.8 2.0
EBIT 193.6 189.8 2.0
ROCE in % 23.0 20.5 –
In the reporting year, order intake was 4.7 percent below the prior-year figure mainly due to Covid-19. Adjusted for effects from exchange rate movements, order intake was down 2.4 percent. With the exception of Germany, Austria, Switzerland & Eastern Europe and Western Europe, Middle East & Africa, all regions recorded a decline in order intake. In the previous year, one large order worth EUR 17.4 million was secured.
Despite Covid-19, revenue in 2020 declined by only 3.7 percent compared with the previous year. Adjusted for the effects of exchange rate movements, revenue was down 1.4 percent on the previous year. With the exception of Germany, Austria, Switzerland & Eastern Europe, revenue declined in all regions. Despite the slight decline in service volumes, the share of total sales accounted for by service sales remained at a high level of 42.4 percent (previous year: 41.2 percent).
EBITDA before restructuring measures increased from EUR 247.1 million in the previous year to EUR 255.3 million in the reporting year, despite the lower revenue. The decline in earnings resulting from the lower revenue volume was more than cushioned by cost-cutting measures already introduced in the previous year. Moreover, earnings in the prior year were burdened by settlement of a dispute (EUR 13.9 million). The corresponding margin was 21.4 percent, compared with 20.0 percent in the previous year.
Liquid & Powder Technologies
Liquid & Powder Technologies(EUR million) 2020 2019
Changein %
Order intake 1,665.3 1,828.5 –8.9
Revenue 1,665.7 1,729.0 –3.7
EBITDA before restructuring measures 120.2 87.2 37.8
as % of revenue 7.2 5.0 –
EBITDA 124.1 55.3 > 100
EBIT before restructuring measures 80.4 43.0 86.9
EBIT 77.4 3.5 > 100
ROCE in % 173.8 17.0 –
Order intake in 2020 fell significantly by 8.9 percent compared with the previous year. Adjusted for effects from the development of exchange rates, order intake fell 7.0 percent, primarily caused by projects postponed by customers (Covid-19). In the reporting year, ten large orders totaling EUR 255 million were secured (previous year: 13 large orders with a combined value of approximately EUR 282 million).
In 2020, revenue was only 3.7 percent below the previous year’s level despite Covid-19, or down 1.6 percent adjusting for foreign exchange effects. This was largely due to restrictions on access to customer sites due to the pandemic, which also affected the service business. A decline in revenue was recorded primarily in Northern and Central Europe, Asia Pacific and Latin America. By contrast, North America and the Germany, Austria, Switzerland & Eastern Europe regions achieved double-digit growth rates in some cases. The share of service revenue increased despite an absolute decline in service volume from 22.2 percent in the previous year to 22.6 percent in 2020.
Despite lower revenue, the Liquid & Powder Technologies Division significantly increased its EBITDA before restructuring measures from EUR 87.2 million in the previous year to EUR 120.2 million in the reporting year. This was made possible, on the one hand, through the omission of effects burdening earnings specifically in connection with risk provisioning for milk-processing projects (EUR 24.5 million) and, on the other hand, through an improvement in the margin quality of projects, a higher proportion of high-margin service business, lower personnel expenses due to restructuring measures, and further savings in response to the Covid-19 pandemic. The corresponding margin improved significantly by around 220 basis points to 7.2 percent (previous year: 5.0 percent).
49GEA Annual Report 2020
Report on Economic Position
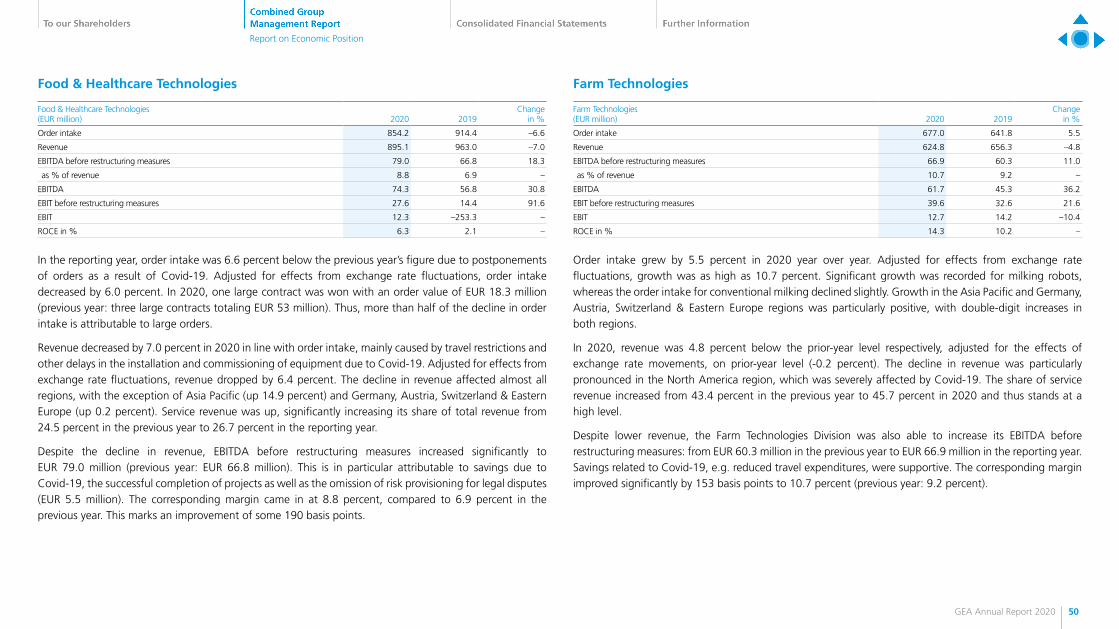
Food & Healthcare Technologies
Food & Healthcare Technologies(EUR million) 2020 2019
Changein %
Order intake 854.2 914.4 –6.6
Revenue 895.1 963.0 –7.0
EBITDA before restructuring measures 79.0 66.8 18.3
as % of revenue 8.8 6.9 –
EBITDA 74.3 56.8 30.8
EBIT before restructuring measures 27.6 14.4 91.6
EBIT 12.3 –253.3 –
ROCE in % 6.3 2.1 –
In the reporting year, order intake was 6.6 percent below the previous year’s figure due to postponements of orders as a result of Covid-19. Adjusted for effects from exchange rate fluctuations, order intake decreased by 6.0 percent. In 2020, one large contract was won with an order value of EUR 18.3 million (previous year: three large contracts totaling EUR 53 million). Thus, more than half of the decline in order intake is attributable to large orders.
Revenue decreased by 7.0 percent in 2020 in line with order intake, mainly caused by travel restrictions and other delays in the installation and commissioning of equipment due to Covid-19. Adjusted for effects from exchange rate fluctuations, revenue dropped by 6.4 percent. The decline in revenue affected almost all regions, with the exception of Asia Pacific (up 14.9 percent) and Germany, Austria, Switzerland & Eastern Europe (up 0.2 percent). Service revenue was up, significantly increasing its share of total revenue from 24.5 percent in the previous year to 26.7 percent in the reporting year.
Despite the decline in revenue, EBITDA before restructuring measures increased significantly to EUR 79.0 million (previous year: EUR 66.8 million). This is in particular attributable to savings due to Covid-19, the successful completion of projects as well as the omission of risk provisioning for legal disputes (EUR 5.5 million). The corresponding margin came in at 8.8 percent, compared to 6.9 percent in the previous year. This marks an improvement of some 190 basis points.
Farm Technologies
Farm Technologies(EUR million) 2020 2019
Changein %
Order intake 677.0 641.8 5.5
Revenue 624.8 656.3 –4.8
EBITDA before restructuring measures 66.9 60.3 11.0
as % of revenue 10.7 9.2 –
EBITDA 61.7 45.3 36.2
EBIT before restructuring measures 39.6 32.6 21.6
EBIT 12.7 14.2 –10.4
ROCE in % 14.3 10.2 –
Order intake grew by 5.5 percent in 2020 year over year. Adjusted for effects from exchange rate fluctuations, growth was as high as 10.7 percent. Significant growth was recorded for milking robots, whereas the order intake for conventional milking declined slightly. Growth in the Asia Pacific and Germany, Austria, Switzerland & Eastern Europe regions was particularly positive, with double-digit increases in both regions.
In 2020, revenue was 4.8 percent below the prior-year level respectively, adjusted for the effects of exchange rate movements, on prior-year level (-0.2 percent). The decline in revenue was particularly pronounced in the North America region, which was severely affected by Covid-19. The share of service revenue increased from 43.4 percent in the previous year to 45.7 percent in 2020 and thus stands at a high level.
Despite lower revenue, the Farm Technologies Division was also able to increase its EBITDA before restructuring measures: from EUR 60.3 million in the previous year to EUR 66.9 million in the reporting year. Savings related to Covid-19, e.g. reduced travel expenditures, were supportive. The corresponding margin improved significantly by 153 basis points to 10.7 percent (previous year: 9.2 percent).
50GEA Annual Report 2020
Report on Economic Position
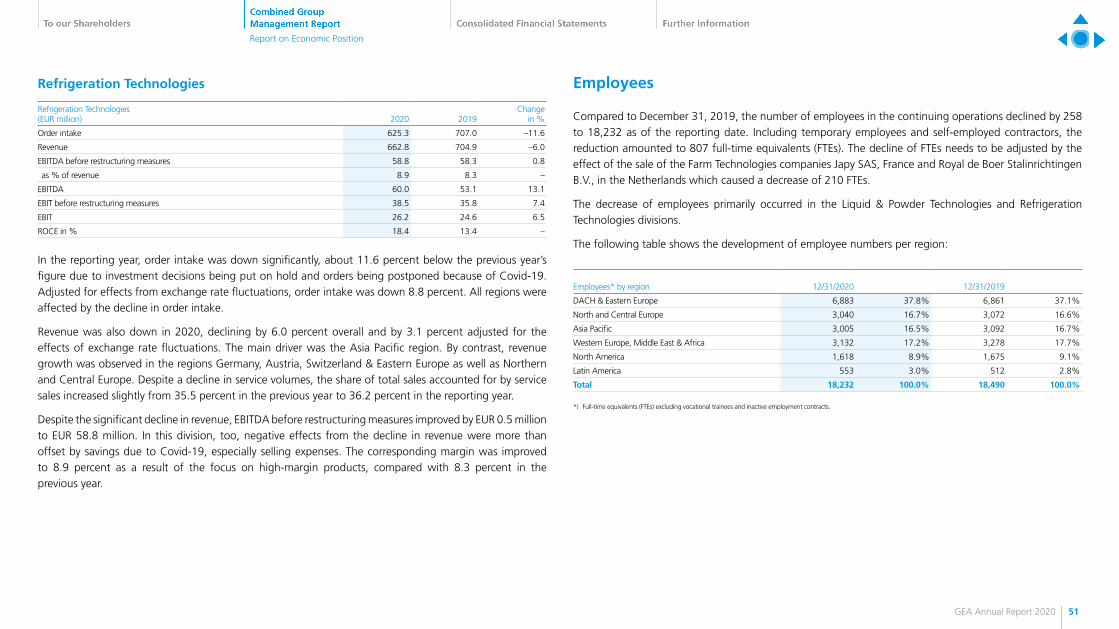
Refrigeration Technologies
Refrigeration Technologies(EUR million) 2020 2019
Changein %
Order intake 625.3 707.0 –11.6
Revenue 662.8 704.9 –6.0
EBITDA before restructuring measures 58.8 58.3 0.8
as % of revenue 8.9 8.3 –
EBITDA 60.0 53.1 13.1
EBIT before restructuring measures 38.5 35.8 7.4
EBIT 26.2 24.6 6.5
ROCE in % 18.4 13.4 –
In the reporting year, order intake was down significantly, about 11.6 percent below the previous year’s figure due to investment decisions being put on hold and orders being postponed because of Covid-19. Adjusted for effects from exchange rate fluctuations, order intake was down 8.8 percent. All regions were affected by the decline in order intake.
Revenue was also down in 2020, declining by 6.0 percent overall and by 3.1 percent adjusted for the effects of exchange rate fluctuations. The main driver was the Asia Pacific region. By contrast, revenue growth was observed in the regions Germany, Austria, Switzerland & Eastern Europe as well as Northern and Central Europe. Despite a decline in service volumes, the share of total sales accounted for by service sales increased slightly from 35.5 percent in the previous year to 36.2 percent in the reporting year.
Despite the significant decline in revenue, EBITDA before restructuring measures improved by EUR 0.5 million to EUR 58.8 million. In this division, too, negative effects from the decline in revenue were more than offset by savings due to Covid-19, especially selling expenses. The corresponding margin was improved to 8.9 percent as a result of the focus on high-margin products, compared with 8.3 percent in the previous year.
Employees
Compared to December 31, 2019, the number of employees in the continuing operations declined by 258 to 18,232 as of the reporting date. Including temporary employees and self-employed contractors, the reduction amounted to 807 full-time equivalents (FTEs). The decline of FTEs needs to be adjusted by the effect of the sale of the Farm Technologies companies Japy SAS, France and Royal de Boer Stalinrichtingen B.V., in the Netherlands which caused a decrease of 210 FTEs.
The decrease of employees primarily occurred in the Liquid & Powder Technologies and Refrigeration Technologies divisions.
The following table shows the development of employee numbers per region:
Employees* by region 12/31/2020 12/31/2019
DACH & Eastern Europe 6,883 37.8% 6,861 37.1%
North and Central Europe 3,040 16.7% 3,072 16.6%
Asia Pacific 3,005 16.5% 3,092 16.7%
Western Europe, Middle East & Africa 3,132 17.2% 3,278 17.7%
North America 1,618 8.9% 1,675 9.1%
Latin America 553 3.0% 512 2.8%
Total 18,232 100.0% 18,490 100.0%
*) Full-time equivalents (FTEs) excluding vocational trainees and inactive employment contracts.
51GEA Annual Report 2020
Report on Economic Position

Net Assets, Financial Position, and Results of Operations of GEA Group Aktiengesellschaft
In addition to the reporting by the group, the following section describes the performance of GEA Group Aktiengesellschaft (group management). The annual financial statements are prepared in accordance with the Handelsgesetzbuch (HGB - German Commercial Code) and the Aktiengesetz (AktG - German Stock Corporation Act). They are presented here in condensed form.
GEA Group Aktiengesellschaft oversees central management functions of the group. Furthermore, it provides its subsidiaries with services on the basis of service agreements. These include, in particular, services from the Global Corporate Center, global excellence functions (procurement, production and logistics), global IT, human resources and business process outsourcing (BPO) for finance functions. Profit and loss transfer agreements exist with key domestic subsidiaries. In turn, the economic position of GEA Group Aktiengesellschaft depends on its subsidiaries’ business development, which fundamentally corresponds to the development of GEA Group, as discussed in this chapter under section “Overall Assessment of Business Development”.
Net assets of GEA Group Aktiengesellschaft (HGB)(EUR million) 12/31/2020
as %of total assets 12/31/2019
as %of total assets
Assets
Intangible fixed assets 28.9 0.8 24.1 0.6
Tangible fixed assets 1.4 – 1.5 0.1
Long-term financial assets 2,319.2 60.1 2,337.4 63.4
Fixed assets 2,349.5 60.9 2,363.0 64.1
Receivables and other assets 924.0 24.0 1,160.0 31.4
thereof Receivables from affiliated companies 901.9 23.4 1,135.7 30.8
thereof Other assets 22.1 0.6 24.3 0.6
Cash 565.3 14.7 154.1 4.2
Current assets 1,489.3 38.7 1,314.1 35.6
Prepaid expenses 17.2 0.4 10.6 0.3
Total 3,856.0 100.0 3,687.7 100.0
Equity and liabilities
Subscribed capital 520.4 13.5 520.4 14.1
Capital reserves 250.8 6.5 250.8 6.8
Revenue reserves 436.7 11.3 479.7 13.0
Net retained profits 153.7 4.0 154.2 4.2
Equity 1,361.6 35.3 1,405.1 38.1
Provisions 287.5 7.5 290.0 7.9
Liabilities to banks 400.0 10.4 300.0 8.1
Verbindlichkeiten aus Lieferungen und Leistungen 25.5 0.7 29.0 0.8
Liabilities to affiliated companies 1,774.7 45.9 1,653.8 44.8
Other liabilities 6.7 0.2 9.8 0.3
Liabilities 2,206.9 57.2 1,992.6 54.0
Total 3,856.0 100.0 3,687.7 100.0
52GEA Annual Report 2020
Report on Economic Position

Total assets of GEA Group Aktiengesellschaft increased by EUR 168.3 million compared with the prior year period. The principal reason for this was an increase of EUR 411.2 in cash and cash equivalents resulting from GEA Group Aktiengesellschaft’s centralized liquidity management function for the GEA Group. As part of the group’s efforts to improve liquidity, receivables from affiliated companies were reduced by EUR 210.8 million while liabilities to affiliated companies increased by EUR 120.9 million. Receivables from affiliated companies were further reduced by EUR 23.0 million, mainly due to impairments from an affiliated company. In addition, a new bank loan of EUR 100 million was concluded to secure long-term group financing.
The decline in long-term financial assets was primarily due to repayments or refinancing of long-term loans through the granting of short-term loans in the amount of EUR 15.4 million and to write-downs of EUR 2.8 million on financial assets.
Equity decreased by a total of EUR 43.5 million. This reduction was the result of net income for the fiscal year of EUR 109.9 million less dividends paid of EUR 153.4 million. The equity ratio decreased by around 2.8 percentage points to 35.3 percent. In addition, withdrawals of EUR 43.0 million were made from other revenue reserves in the fiscal year.
There were only minor changes overall to the rest of the balance sheet items compared with the previous year.
Income statement of GEA Group Aktiengesellschaft (HGB)(EUR million)
01/01/2020 - 12/31/2020
01/01/2019 - 12/31/2019
Revenue 182.4 167.9
Other operating income 236.0 157.4
Cost for purchased services –95.6 –91.1
Personnel expenses –55.3 –62.4
Amortization amd writedowns of intangible fixed assets anddepreciation and writedowns of tangible fixed assets –28.2 –75.6
Other operating expenses –274.5 –223.5
Investment income 144.0 443.7
Net interest income 7.9 –21.1
Write-downs on financial assets and seurities held as current assets –2.8 –7.0
Taxes on income –3.6 –3.4
Net income after income tax 110.3 284.9
Other tax expenses –0.4 –0.4
Net income for the fiscal year 109.9 284.5
Retained profits brought forward 0.8 0.7
Withdrawals from other revenue resevers 43.0 –
Appropriation to other revenue reserves – –131.0
Net retained profits 153.7 154.2
53GEA Annual Report 2020
Report on Economic Position
The revenues of GEA Group Aktiengesellschaft essentially comprise charges of EUR 163.2 million (previous year: EUR 145.2 million) that were allocated to subsidiaries in the 2020 fiscal year and income of EUR 18.9 million (previous year: EUR 22.5 million) from the trademark fee. To this end, services rendered by group companies were initially charged to GEA Group Aktiengesellschaft before being passed on to subsidiaries in the form of intragroup allocations.
Currency translation gains and losses from own hedges and hedges for affiliated companies are reported gross within other operating income and expenses, as in the previous year. Currency translation gains of EUR 146.0 million (previous year: EUR 117.1 million) and currency translation losses of EUR 142.4 million (previous year: EUR 100.4 million) resulted in net income of EUR 3.6 million (previous year: EUR 16.7 million).
In addition to currency translation gains, other operating income mainly included income from the reversal of bad debt allowances to affiliated companies of EUR 60.2 million (previous year: EUR 0.0 million), income from recharging project costs incurred in previous years to group companies totaling EUR 12.9 million (previous year: EUR 22.2 million), as well as income from the reversal of provisions totaling EUR 11.6 million (previous year: EUR 11.8 million).
Cost for purchased services – totaling EUR 51.4 million (previous year: EUR 53.4 million) – mainly comprises services provided by other group companies required to execute the functions of the Global Corporate Center, the global excellence functions (procurement, production and logistics), global IT, human resources, as well as for business process outsourcing (BPO) for finance functions. In addition, expenditure for external service providers amounted to EUR 44.0 million (previous year: EUR 37.3 million).
Personnel expenses declined by EUR 7.1 million compared with the previous year. The previous year’s personnel expenses included expenses for additions to provisions for severance payments as part of the group’s reorganization in the amount of EUR 7.5 million.
In addition to scheduled write-downs on assets of EUR 5.2 million (previous year: EUR 7.7 million), impairments include allowances on receivables from affiliated companies of EUR 23.0 million (previous year: EUR 67.9 million).
In addition to currency translation losses, other operating expenses mainly comprise outlay for expert opinions and consulting, IT expenditure and licenses, expenses for the addition to the provisions for negative consequences from mining, and other third-party services. In particular, the expenses for IT and licenses included ongoing expenses from the introduction of a uniform global ERP system. The expenses from the addition to provisions for consequential mining costs resulted mainly from the change in the method of calculating the expected increase in costs. Starting from December 31, 2020, this will be derived from the long-term development of a publicly available long-term price index (in the previous year the rate of increase in costs was derived from internal planning values).
Investment income is the result of income from profit and loss transfer agreements totaling EUR 215.9 million (previous year: EUR 479.7 million), EUR 79.9 million (previous year: EUR 40.5 million) in expenses from profit and loss transfer agreements, and income from other equity investments amounting to EUR 8.0 million (previous year: EUR 4.5 million). Investment income is only comparable to a limited extent due to income from the contribution of an investment at fair value above the carrying amount as well as to a counter-effect from a write-down on interests in affiliated companies, which in the previous year led to an increase in income from profit and loss transfer agreements in the amount of EUR 331.3 million.
Income from profit transfer agreements mainly comprise profits transferred by GEA Group Holding GmbH, GEA Brewery Systems GmbH, GEA Mechanical Equipment GmbH, GEA Refrigeration Germany GmbH and GEA Bischoff GmbH. Expenses for loss absorption mainly comprise assumed losses from GEA Refrigeration Technologies GmbH, GEA Farm Technologies GmbH, GEA TDS GmbH, GEA Wiegand GmbH and LL Plant Engineering GmbH.
Net interest income rose by EUR 29.0 million to EUR 7.9 million (previous year: EUR -21.1 million). This resulted primarily from the change in the measurement of non-current provisions, which are discounted at an alternative interest rate of 2.96 percent as from December 31, 2020, insofar as cash outflows with a term of more than 50 years are expected. The interest rate is derived from the so-called “ultimate forward rate” published by the European Insurance and Occupational Pensions Authority. The changed procedure leads to a more accurate presentation of the net assets and results of operations of GEA Group Aktiengesellschaft. This resulted in interest income from the change in interest rates related to provisions in the amount of EUR 11.6 million (previous year: interest expense of EUR 12.7 million). Excluding this change in measurement, interest expenses would have totaled EUR 36.1 million.
54GEA Annual Report 2020
Report on Economic Position

The impairments on long-term financial assets contain write-downs on interests in companies totaling EUR 2.0 million (previous year: EUR 7.0 million) as well as write-downs on loans to affiliated companies in the amount of EUR 0.8 million (previous year: EUR 0.0 million).
Cash flow of GEA Group Aktiengesellschaft (HGB)(EUR million) 2020 2019
Cash flow from operating activities 473.6 283.5
Cash flow from investing activities –9.0 –24.5
Cash flow from financing activities –53.4 –153.4
Liquid funds 565.3 154.1
In the year under review, cash flow from operating activities amounts to EUR 473.6 million, EUR 190.1 million above the figure for the previous year. This increase was largely due to a EUR 354.8 million improvement in cash flow from affiliated companies under the cash pooling mechanism. This is offset by the EUR 174.6 million decline in net income for the fiscal year.
Cash outflows from investing activities were reduced from EUR 24.5 million in the previous year to EUR 9.0 million. Cash flow from investing activities for fiscal year 2020 exclusively comprised cash outflows for investments and cash inflows from divestments for intangible assets and property, plant and equipment (previous year: EUR 18.7 million).
The cash flow from the financing activities of the fiscal year included the previous year’s dividend payout of EUR 153.4 million (previous year: EUR 153.4 million) and cash inflows from a new bank loan of EUR 100 million (previous year: EUR 0.0 million).
GEA Group Aktiengesellschaft’s business development is subject to the same risks and opportunities as the GEA Group. Further information on this topic can be found in the chapter “Report on Risks and Opportunities”. Additionally, the relationships with subsidiaries may result in negative effects due to statutory and contractual contingent liabilities (in particular financing).
The income of the GEA Group Aktiengesellschaft is significantly dependent on the development of the investment income of its subsidiaries. Group income serves as the basis for net retained profits and the corresponding dividend payment. Hence, net retained profits (HGB) for the fiscal year are regarded as the most important key performance indicator for GEA Group Aktiengesellschaft. GEA Group Aktiengesellschaft predicted that net retained profits for fiscal year 2020 would be at or around the same level of the previous year, taking existing revenue reserves into account. With net retained profits of EUR 153.7 million, the forecast was reached. For fiscal year 2021, GEA Group Aktiengesellschaft expects net retained profits to be on par with the financial year just ended, taking existing revenue reserves into account.
55GEA Annual Report 2020
Report on Economic Position

Explanatory information in accordance with sections 289(4), 315(4) and 315a, first sentence of the HGB
Composition of the subscribed capital and restrictions on rightsAs of December 31, 2020, the subscribed capital of GEA Group Aktiengesellschaft was EUR 520,375,765.57 and was composed of 180,492,172 no-par value bearer shares. All the shares are ordinary shares. The rights and obligations arising from these shares are defined in the AktG (AktG – German Stock Corporation Act). This can result in restrictions affecting voting rights. For example, section 71b AktG states that GEA Group Aktiengesellschaft is not entitled to voting rights from its own shares (treasury stock).
The Executive Board is not aware of any contractual restrictions affecting voting rights. Contractual restrictions affecting the transfer of shares arise through the share-based payment program (Share Ownership Guidelines) of the current remuneration system, under which all members of the Executive Board were paid in the past fiscal year. The members of the Executive Board have pledged to acquire a certain amount of shares of the GEA Group Aktiengesellschaft and not to encumber them or sell them until the end of their terms on the Executive Board.
Interests in the share capital exceeding 10 percent of the voting rightsIn fiscal year 2018, Massachusetts Financial Services Company, Boston, Massachusetts, U.S., reported that its interests in GEA Group Aktiengesellschaft had exceeded 10 percent of the voting rights.
Provisions governing the appointment and dismissal of members of the Executive Board and amendments to the Articles of AssociationThe members of the Executive Board are appointed and dismissed by the Supervisory Board in accordance with sections 84 and 85 of the AktG in conjunction with section 31 of the Mitbestimmungsgesetz (MitbestG – German Codetermination Act).
Under Article 20(1) of GEA Group Aktiengesellschaft’s Articles of Association, amendments to the Articles of Association may – where legally permissible – be adopted by a simple majority of the share capital represented at the vote. Under Article 21 of the Articles of Association, the Supervisory Board may resolve amendments and additions to the Articles of Association that only affect their wording. In other respects, section 179 of the AktG applies to amendments to the Articles of Association.
Powers of the Executive Board to issue and repurchase sharesIn accordance with Article 4(3) of the Articles of Association, the Executive Board is authorized, with the approval of the Supervisory Board, to increase the share capital by up to EUR 77 million by issuing new no-par value shares against cash contributions until April 19, 2022 (Authorized Capital I) and, in accordance with Article 5(4) of said Articles, to define a starting date for profit rights in this case that differs from the date stipulated by law. The authorization may be exercised fully or in partial amounts, on one or several occasions.
Shareholders are generally entitled to subscribe to the new shares. The statutory subscription right may also be granted by the new shares being underwritten by one or more banks with the obligation of offering them to the shareholders for subscription (indirect subscription right). The Executive Board is authorized, with the approval of the Supervisory Board, to disapply shareholders’ preemptive rights (i) insofar as this is necessary to eliminate fractional amounts, and/or (ii) in order to grant the creditors of convertible or option bonds with option or conversion privileges or obligations issued by GEA Group Aktiengesellschaft or a subordinate group company of the company a right to subscribe to new shares to the extent to which they would be entitled after exercising the option or conversion rights or after fulfilling conversion obligations.
Under a resolution adopted by the Annual General Meeting dated April 19, 2018, in accordance with section 71(1) no. 8 AktG, GEA Group Aktiengesellschaft is authorized to purchase own shares up to a total of 10 percent of the total proportionate amount of share capital at the time the resolution was adopted. The authorization is valid until April 18, 2023. The shares may be purchased via the stock exchange or by means of a public purchase offer to all shareholders. The shares may subsequently be used for all purposes allowed by law. With the approval of the Supervisory Board, the shares may also (i) be sold in another manner than through the stock exchange or by means of a public offering addressed to all shareholders, provided that the issue price of the new shares is not significantly lower than the price for GEA Group Aktiengesellschaft shares of the same kind at the time of sale, (ii) be transferred to third parties for the purpose of business combinations or the acquisition of companies, parts of companies, or equity interests in companies or other assets, (iii) be used to service convertible or option bonds, (iv) be used to implement a scrip dividend or (v) be withdrawn. Further details on the resolutions on the share buyback adopted by the Annual General Meeting on April 19, 2018, are available in the invitation to the Annual General Meeting, which was published in the Federal Gazette on March 12, 2018.
56GEA Annual Report 2020
Report on Economic Position
Material agreements that take effect in the event of a change of control following a takeover bid The individual lenders of the syndicated credit lines amounting to EUR 850 million may refuse new drawdowns in the event of a change of control. The lenders may call in any amounts already drawn down and terminate the respective credit line giving 20 days’ notice.
In the event of a change of control and subject to at least 30 days’ notice, the lenders of the borrower’s note loans in the total amount of EUR 250 million are entitled to request early repayment of their loan receivable, including interest accrued up to the date of the early repayment.
With regard to the loan agreement with the European Investment Bank (EIB) amounting to EUR 250 million, of which EUR 150 million are currently drawn, the EIB is entitled to cancel the undisbursed part of the facility and call in the disbursed amount in the event of a change of control. Furthermore, the lender is entitled to request early repayment of the loan, including accrued interest. In this case, the borrower is obliged to repay the amount on the date specified by the Bank, which may not be earlier than 20 days after the repayment request.
Under a master loan agreement totaling EUR 250 million, which is primarily used to issue guarantees for subsidiaries, the lender has the right in the event of an imminent change of control to negotiate the continuation of the agreement under changed terms. If no agreement is reached, the loan agreements fall due with immediate effect. In this case, the lender must be released from its obligations under guarantees furnished within two months or, at the discretion of the borrower, the latter shall make a cash deposit in the amount of the outstanding obligations under the guarantees furnished and any credit drawdowns settled.
With regard to a cash management credit line in the amount of EUR 50 million, the lender is granted an extraordinary right of termination in the event of an imminent change of control if the contracting parties are unable to reach an agreement on continuation, possibly under changed terms, in a timely manner.
Compensation arrangements with members of the Executive Board or employeesUnder the current remuneration system that applies to all members of the Executive Board, there are no termination rights or other rights in the event of a change of control (change-of-control provision). Further details can be found under “Remuneration Report”.
Key attributes of the internal control and risk management system relating to the financial reporting processDetails can be found under “Report on Risks and Opportunities”, sections “Risk and opportunity management system” and “Internal control system”.
57GEA Annual Report 2020
Report on Economic Position
Overall Assessment of Business Development
GEA successfully navigated through the challenges of 2020. Despite the global pandemic, the company significantly exceeded the already demanding expectations for EBITDA before restructuring measures and ROCE. Moreover, GEA sustainably improved major financial performance indicators, such as net working capital, free cash flow and liquidity.
Order intake declined slightly by 4.6 percent to EUR 4,703 million. Farm Technologies was the only division to escape this pandemic-related impact, recording a 5.5 percent rise in order intake. Whereas GEA’s order intake in the first quarter still rose by 16.0 percent, declines were seen in all of the following quarters. However, the 7.9 percent decrease in the fourth quarter was already less pronounced than the declines of the preceding two quarters.
GEA’s revenue also slightly decreased by 5.0 percent (or -2.6 percent at constant exchange rates) to EUR 4,635 million, and was thus within the expected range. All five divisions were affected by this trend. As with order intake, the company’s revenue also increased by 3.5 percent in the first quarter, while the pandemic led to declines in the subsequent quarters. In 2020, the service business developed better than the rest of the group, declining 0.9 percent respectively registering a currency-adjusted increase of 1.9 percent.
EBITDA before restructuring measures rose by 11.1 percent to EUR 532 million. The further implementation of the efficiency measures had a positive impact. As a result, the EBITDA margin before restructuring measures increased significantly from 9.8 percent in the previous year to 11.5 percent in 2020. All five divisions contributed to the positive development of earnings and margins.
At EUR 97 million, profit for the period improved considerably compared with the prior-year loss of EUR 171 million on the back of the good operational development.
The company’s proven operational strength and high level of liquidity has prompted the Supervisory Board and Executive Board to propose that the Annual General Meeting approve the payout of an unchanged dividend of EUR 0.85 per share. The declared target range for the dividend payout of between 40 and 50 percent of profit for the period applies as before.
In summary, despite the negative impact of the pandemic, GEA performed very well in fiscal year 2020, particularly with regard to its earnings figures. Consequently, with an EBITDA margin of 11.5 percent before restructuring measures in the year under review, the company has already reached the lower end of the target range of 11.5 to 13.5 percent for 2022 announced at the Capital Markets Day in September 2019.
58GEA Annual Report 2020
Report on Economic Position

Corporate Governance Statement
In accordance with section 317 (2) sentence 6 of the Handelsgesetzbuch (HGB – German Commercial Code), the audit of the disclosures to be made in the corporate governance declaration in accordance with sections 289f (2) and 5, 315d of the HGB must be limited to the auditor checking whether such disclosures have been made.
Transparent, responsible corporate governance and control, geared towards long-term value enhancement, are given high priority by GEA Group Aktiengesellschaft. In doing so, the group aligns its actions with the generally accepted principles of corporate governance while implementing the suggestions and recommendations of the German Corporate Governance Code as amended on December 16, 2019 (published in the Federal Gazette on March 20, 2020) to the greatest possible extent.
Declaration of Conformity
Between the issuance of the last Declaration of Compliance on December 19, 2019, and December 31, 2019, GEA Group Aktiengesellschaft complied with the recommendations of the German Corporate Governance Code as amended on February 7, 2017 (“GCGC 2017”) and published by the Federal Ministry of Justice and Consumer Protection in the official section of the Federal Gazette, except for the following deviations:
Since January 1, 2019, GEA has applied the current remuneration system for the members of the Executive Board (“new remuneration system”). When the last Declaration of Compliance was issued on December 19, 2019, three of the then four acting Executive Board members were already compensated in accordance with the new remuneration system. However, the Executive Board service agreement of Martine Snels, who left GEA at the end of the 2019 fiscal year, was still based on the Executive Board remuneration system approved by the Annual General Meeting in April 2012 (“old remuneration system”), in relation to which the company was not in compliance with the following recommendations of the GCGC 2017 until and including December 31, 2019:
• Section 4.2.3 (2) sentence 3 GCGC 2017, according to which variable remuneration components generally have a multiple-year assessment basis that shall have essentially forward-looking characteristics.
The multi-year variable remuneration under the old remuneration system comprised two components that were weighted at 20 and/or 40 percent of total variable remuneration. As the assessment basis underlying the 40 percent component of multi-year variable remuneration covered the current as well as the two prior fiscal years (“multi-year component”), it did not qualify as forward-looking. As a consequence, taken as a whole, the assessment bases governing multi-year variable remuneration under the old remuneration system did not have essentially forward-looking characteristics.
• Section 4.2.3 (2) sentence 8 GCGC 2017 stipulates that subsequent amendments to the performance targets or comparison parameters shall be excluded.
In the first quarter of 2019, the Supervisory Board had set the financial performance targets for 2019 under the new remuneration system on the basis of the budget for this specific fiscal year. In the process, the Board had inadvertently omitted to equally align the financial performance indicators still applicable to Martine Snels under the multi-year component with the planning for fiscal year 2019; this omission was rectified by the Supervisory Board in December 2019 with retrospective effect for the 2019 fiscal year.
In the period between January 1, 2020, and March 19, 2020, GEA Group Aktiengesellschaft fully complied with the recommendations of the GCGC 2017.
With the exception of the deviations set out below, GEA Group Aktiengesellschaft is in compliance with the recommendations of the German Corporate Governance Code as amended on December 16, 2019 (“GCGC 2020”) – to the extent required – and has done so since the GCGC 2020 was published by the Ministry of Justice in the official section of the Federal Gazette on March 20, 2020, barring the following exceptions:
59GEA Annual Report 2020
Corporate Governance Statement

• Recommendation C.10 sentence 1 GCGC 2020, according to which the Chair of the Supervisory Board, the Chair of the Audit Committee, as well as the Chair of the committee that addresses Management Board remuneration, shall be independent from the company and the Management Board.
The Chairman of the Supervisory Board, Dr. Helmut Perlet, who also chairs the Presiding Committee that among other things deals with Executive Board remuneration, cannot be considered independent from the company in accordance with recommendation C.7 (2) GCGC 2020, as he has been a member of the Supervisory Board for more than twelve years.
• Recommendation D.1 GCGC 2020, according to which the Supervisory Board shall adopt its own rules of procedure and shall publish these on the company’s website.
The Rules of Procedure for the Supervisory Board have previously not been published on the website of the company.
For the future, GEA Group Aktiengesellschaft declares its intention to comply with the recommendations set forth in the GCGC 2020 – to the extent to which they are already to be taken into account – with the following exception until April 30, 2021, and to fully comply with said recommendations as of May 1, 2021:
• Until the expiry of the current term of office of the members of the Supervisory Board after the Annual General Meeting on April 30, 2021, GEA Group Aktiengesellschaft will continue to be non-compliant with recommendation C.10. sentence 1 GCGC 2020. At the Annual General Meeting on April 30, 2021, all seats held by shareholder representatives will be up for election. As the Chairman of the Supervisory Board, Dr. Helmut Perlet, will not be available for another term of office, GEA Group Aktiengesellschaft is expected to be compliant with recommendation C.10 sentence 1 GCGC 2020 as of May 1, 2021.
Düsseldorf, December 17, 2020
For the Supervisory Board For the Executive Board
Dr. Helmut Perlet Stefan Klebert Marcus A. Ketter
Code of Conduct
The Code of Conduct of GEA Group Aktiengesellschaft requires that the group’s business activities comply with all existing laws and high ethical standards. The Code of Conduct applies to all employees and bodies of GEA worldwide. It is supplemented by policies and guidelines on individual areas, in particular anti-corruption, anti-trust and competition law, money laundering and conflicts of interest. This Code of Conduct is supplemented by a Code of Conduct for Suppliers and Subcontractors that obliges these groups to comply with a set of key principles regarding their responsibility towards society, the environment, and the individuals involved in the production of goods and/or the rendering of services. In addition, the company and the European Works Council have jointly agreed to a Code of Corporate Responsibility. This code sets out the ethical, social and legal standards that are binding on all GEA employees. In respect of corporate responsibility and quality, health, safety and environment (“CR & QHSE”) matters, there is a globally applicable and uniform policy governing the areas of Quality, Health, Safety and Environment (“QHSE Policy”). The above documents are published on the website gea.com under Company/Corporate Governance. Further information can be found in the“Consolidated Non-financial Statement”.
Compliance
Compliance in terms of measures designed to ensure adherence to the law as well as internal corporate policies, and the group companies’ compliance therewith, are considered to be a key management and supervisory task at GEA. The compliance organization’s group-wide activities focus on the prevention of corruption and money-laundering, conflicts of interest, antitrust law as well as data protection. The Chief Compliance Officer coordinates and ensures the implementation of compliance measures, in particular in the aforementioned areas. In this capacity, he reports to both the Executive Board and the Audit Committee of the Supervisory Board. Moreover, the compliance organization is involved in processing all compliance incidents carrying the risk of criminal proceedings or a fine. The Chief Compliance Officer is assisted by the extended legal compliance organization and is in regular contact with the internal audit department. Central legal compliance activities are pooled and handled by the “Compliance & Principle Legal Matters” unit that forms part of the group’s corporate legal department. The divisions also support the compliance activities undertaken at operational level. A Compliance Executive is appointed for each division and a Compliance Manager is appointed for each operating entity. The divisions and entities are also advised and supported by divisional compliance officers. In addition, further functions for the purpose of counseling
60GEA Annual Report 2020
Corporate Governance Statement

and supporting the Chief Compliance Officer are involved, as required. GEA’s Compliance Management System was reviewed in accordance with the IDW PS 980 auditing standard by the auditing company KPMG with regard to the appropriateness and implementation of the company’s anti-corruption and anti-trust policies. The audit was completed without any objections being raised in January 2019.
Alongside the compliance organization described above, GEA has a globally operational export control organization. Key export control activities are pooled in the Tax, Customs & Foreign Trade department. Furthermore, each operating entity is assigned a local Export Control Manager. Finally, a Quality, Health, Safety & Environmental (QHSE) organization is in place to develop and implement group-wide policies, programs and procedures in this specific field.
For GEA, the topic of taxation (including tax compliance) is a key component of responsible corporate governance, through which organizations contribute to the economies of the countries where they operate. GEA follows a well-defined and transparent tax strategy, with profits taxed in the countries in which they arise, rather than transferring them to countries with lower tax rates or where they are not subject to taxation at all. This is specified in the current Group Tax Directive. It is not in GEA’s interest to establish structures that contravene this principle. When setting up its Tax Compliance Management System, GEA was guided by the seven fundamental components of Assurance Standard 980 of the Institute of Public Auditors in Germany (IDW) and the related practice notes published by the IDW. The group’s management decisions are not made based on tax rates or other tax issues.
The members of the compliance organization regularly discuss the latest developments as well as potential impacts or additions to GEA’s compliance program. Since December 1, 2014, GEA has been using a global Integrity System. This Integrity System allows GEA employees and independent third parties to report suspected compliance infringements or violations of GEA’s Codes of Conduct – the general principles of social responsibility – via an online system. To the extent permitted by law, individuals reporting a violation may remain anonymous. This anonymity is guaranteed by the technical set-up of the Integrity System. The compliance organization rigorously investigates all suspected cases, if necessary by involving group internal audit. Moreover, face-to-face and web-based trainings are regularly held for compliance-relevant group employees for covering current issues and regulations relative to the law, the Code of Conduct and GEA’s additional compliance policies and guidelines. GEA’s compliance program is rounded off by close cooperation between the compliance organization and the group’s internal audit department, compliance risk audits, as well as on-site talks between representatives of the compliance organization and local managers for evaluating best practices within the group. The Compliance Management System is
supplemented by various IT tools, such as for compliance approvals, compliance reports, compliance risk audits, or third-party audits.
Responsible risk management
Sustainable growth can only be achieved if both the opportunities and the risks associated with corporate activities are identified and adequately taken into account. For this reason, an effective control and risk management system represents one of the core elements of corporate governance at GEA. Further details can be found in the chapter “Report on Risks and Opportunities”.
Accounting and audit transparency
GEA Group Aktiengesellschaft is committed to transparent reporting. The company’s consolidated financial statements and half-yearly financial reports are prepared in accordance with the International Financial Reporting Standards (IFRS) as applicable in the European Union. The single entity financial statements of GEA Group Aktiengesellschaft, which are legally required and determine dividend payout, are governed by the Handelsgesetzbuch (HGB – German Commercial Code). The Supervisory Board engages the external auditor elected by the shareholders at the Annual General Meeting. The Audit Committee gives particular attention to the oversight of the accounting process, the effectiveness of the internal control, risk management and internal audit systems, the audit of the annual financial statements (in this context, notably the selection and independence of the auditor and the additional services provided by the auditor, the engagement of the auditor, the determination of key audit areas as well as the audit fee) as well as compliance. While also taking into account the EU audit reform, it ensures that the auditor’s work is not compromised by any conflicts of interest and that the auditor immediately reports any and all findings and events relevant to the Supervisory Board’s discharge of duties that have come to the attention of the auditor while performing the audit. Apart from the consolidated and annual financial statements, the Audit Committee also discusses the half-yearly financial reports and quarterly statements with the Executive Board.
61GEA Annual Report 2020
Corporate Governance Statement

Detailed reporting
GEA Group Aktiengesellschaft communicates openly, actively and extensively. It regularly and promptly informs shareholders, shareholders’ associations, analysts, and interested members of the public on equal terms about the company’s situation as well as any material changes to its business. In this respect, the company’s website constitutes an important means of communication. It contains the annual and half-yearly financial reports as well as quarterly statements, press releases and other notifications required under the EU Market Abuse Regulation (MAR) and the Wertpapierhandelsgesetz (WpHG – German Securities Trading Act), the financial calendar and other relevant information. Moreover, analyst meetings, press conferences and events for investors are hosted regularly. The presentations delivered on these occasions are also available on the company’s website gea.com under “Investors”.
Transactions and shareholdings held by members of governing bodies
In fiscal year 2020, under section 19 of the MAR, Executive Board and Supervisory Board members or persons closely associated with them are obliged to disclose reportable transactions in shares of GEA Group Aktiengesellschaft or related financial instruments if the transactions concluded in one calendar year reach or exceed the threshold of EUR 20,000. The transaction reported to the company in fiscal year 2020 was duly disclosed and published on the company’s website gea.com. The total number of shares in GEA Group Aktiengesellschaft held by all Executive Board and Supervisory Board members amounts to less than 1 percent of the shares issued by the company.
Corporate governance and control: Executive Board and Supervisory Board
GEA Group Aktiengesellschaft is subject to the German Stock Corporation Act and, therefore, has a two-tier board structure comprising the Executive Board and the Supervisory Board. The Executive Board constitutes the group’s management body. The Supervisory Board – which is composed of twelve members, half of whom are shareholder representatives, while the other half are employee representatives – appoints and advises the Executive Board while overseeing its work. The Executive Board and the Supervisory Board cooperate closely for the benefit of the company, their common goal being the sustainable increase in shareholder value.
Executive Board
The Executive Board holds overall responsibility for the management of the company in accordance with statutory requirements, the Articles of Association as well as the rules of procedure and the corporate policies that are in place. In line with the Rules of Procedure of the Executive Board, each Executive Board member has overall responsibility for and independently manages the area of responsibility assigned to him/her under the schedule of responsibilities, while keeping the entire Executive Board consistently informed of all essential business affairs. Decisions on matters of fundamental importance or particular magnitude must be taken by the entire Executive Board. Executive Board resolutions are adopted at regular meetings or, should no member of the Executive Board raise any objections, in writing, orally, by telephone, or by email. Each member of the Executive Board must immediately disclose conflicts of interests to the Supervisory Board and inform the other members of the Executive Board, accordingly.
The Executive Board reports to the Supervisory Board regularly, promptly and comprehensively on all issues relating to strategy, planning, business progress, risk exposure, the risk management system as well as compliance that are relevant to the company. Should important issues or business matters arise that may considerably impact the situation of the company, the Executive Board will notify the Chairman of the Supervisory Board without undue delay. The Articles of Association and the rules of procedure specify key transactions that require the Supervisory Board’s approval. Further information on the individual members of the Executive Board can be found in the chapter “GEA Executive Board” and “Corporate Bodies and their Mandates” under the section “Executive Board”.
62GEA Annual Report 2020
Corporate Governance Statement

Supervisory Board
The Supervisory Board advises the Executive Board on the management of the company and oversees its conduct of the company’s business. Between the Supervisory Board meetings, the Chairman of the Supervisory Board maintains regular contact with the Executive Board, in particular the CEO, with whom he discusses matters of strategy, planning, business progress, risk exposure, risk management and corporate compliance. The Supervisory Board usually holds six meetings per calendar year that are attended by the members of the Executive Board unless the Chairman of the Supervisory Board determines otherwise. The Supervisory Board also regularly meets without the Executive Board. As a rule, the Supervisory Board’s resolutions are adopted at these meetings. Unless the majority of the Supervisory Board members immediately object, the Chairman of the Supervisory Board may also determine that resolutions be adopted during a conference call or a video conference or outside of meetings by the members casting their votes in writing, text form or by telephone. Resolutions require a simple majority of the votes cast unless statutory law provides for a different majority. After the notice of the meeting has been given to all members, the Supervisory Board has a quorum when a minimum of half of its members vote on a resolution by attending in person, by telephone or video conference or have cast their votes in writing or text form pursuant to section 108 (3) Aktiengesetz (AktG – German Stock Corporation Act).
The Supervisory Board regularly evaluates the effectiveness of its activities and those of its committees. These evaluations are carried out both with the assistance of independent advisers and in the form of self-evaluations conducted by the Supervisory Board. In the past fiscal year, the Supervisory Board performed a self-evaluation of its own activities and those of its committees through detailed questionnaires and evaluation forms. The results and findings of this self-evaluation were discussed in depth at a Supervisory Board meeting.
Supervisory Board Committees
The work of the Supervisory Board is supported by committees. These are primarily the Presiding Committee, the Audit Committee and the Technology Committee. In addition, there is the statutory Mediation Committee as well as the Nomination Committee recommended by the German Corporate Governance Code.
The Audit Committee, the Technology Committee and the Mediation Committee each have four members, while the Presiding Committee is composed of six members; each of the above committees features equal representation of shareholder and employee representatives. The Nomination Committee consists of three members, solely comprising shareholder representatives in accordance with Recommendation D.5 of the German Corporate Governance Code.
The Presiding Committee and the Audit Committee each usually meet four or five times during the fiscal year. The Technology Committee usually meets twice a year. The Nomination Committee and the Mediation Committee only hold meetings as required.
Resolutions of the Presiding Committee, Audit Committee and Technology Committee are generally passed by a simple majority of the votes cast. If the vote is tied, the respective chairman/chairwoman receives a second vote in the event of an additional ballot on the same item.
The work of the Presiding Committee focuses on Executive Board matters including issues related to succession and remuneration, although decisions on the remuneration system for the Executive Board, the total remuneration awarded to the individual Executive Board members, as well as their appointment and dismissal are reserved for the full Supervisory Board. The Presiding Committee addresses corporate governance issues and certain transactions requiring approval. These include the approval of significant transactions between the company, on the one hand, and Supervisory or Executive Board members and their related parties, on the other. There were no such related party transactions in the past fiscal year. The Presiding Committee’s responsibilities also include addressing – together with the Executive Board – the company’s strategy, as well as its investments and financing. The members of the Presiding Committee are Dr. Helmut Perlet (Chairman), Ahmad M.A. Bastaki, Rainer Gröbel, Colin Hall, Michaela Hubert and Kurt-Jürgen Löw.
63GEA Annual Report 2020
Corporate Governance Statement
The Audit Committee, whose former and current Chair both have a sound knowledge of and experience in applying financial accounting standards as well as internal control systems, primarily focuses on overseeing the financial accounting process, the efficiency of the internal control and risk management systems, the internal audit process, compliance as well as the audit of the annual financial accounts. The members of the Audit Committee are Prof. Dr. Annette G. Köhler (since October 1, 2020, Chairwoman), Michael Kämpfert, Brigitte Krönchen and Dr. Helmut Perlet. Until September 30, 2020, Hartmut Eberlein was both a member and the Chairman of the Audit Committee.
Against the backdrop of GEA’s endeavors to develop respectively tap into new and innovative products, processes, markets and business models, the work of the Technology Committee focuses on the assessment of the group’s medium- to long-term technology strategy. This also includes digitalization on the basis of the company’s business strategy as well as advising the Executive Board and the management on the above topics. The members of the Technology Committee are Dr. Molly P. Zhang (Chairwoman), Michaela Hubert, Brigitte Krönchen and Jean E. Spence.
The Mediation Committee performs its duties as set out in sections 27, 31 Mitbestimmungsgesetz (MitbestG – German Co-determination Act). It has the following members: Dr. Helmut Perlet (Chairman), Dr. Molly P. Zhang, Eva-Maria Kerkemeier and Kurt-Jürgen Löw. The task of the Nomination Committee is to propose suitable candidates to the Supervisory Board based upon which the latter submits its nominations to the Annual General Meeting. The members of the Nomination Committee are Dr. Helmut Perlet (Chairman), Ahmad M.A. Bastaki and Jean E. Spence.
Further information on the composition of the Supervisory Board and its committees can be found in the chapter “Corporate Bodies and their Mandates” under the section “Supervisory Board” and on the company’s website at gea.com. In addition, the “Report of the Supervisory Board” gives further details on the activities performed by the Supervisory Board and its committees in fiscal year 2020. It also discloses individual attendance at meetings held by the Supervisory Board and its committees, as well as the duration of the individual Supervisory Board member’s mandates.
Compliance with minimum quotas pursuant to section 96 (2) of the AktG and stipulations to promote the participation of women in executive positions in accordance with section 76 (4) and section 111 (5) of the AktG
For many years, GEA has been encouraging diversity at group level. The diversity strategy is presented in GEA’s separate Sustainability Report. As part of its diversity strategy, GEA also pursues the aim of attracting more women to join the company while promoting female talent. The company aims to increase the representation of women on all management levels over the long-term. GEA will continue to support this process by means of strategic measures.
GEA is legally obliged to define targets in relation to the proportion of women represented on the Supervisory Board, the Executive Board and/or the Board of Directors as well as on the two management levels below, and to set target dates for achieving the respective quota of women. A statutory minimum quota of 30 percent has applied with regard to the underrepresented gender on the supervisory boards of listed and co-determined companies like GEA Group Aktiengesellschaft; which must be taken into account when filling vacant Supervisory Board positions. Following the Supervisory Board elections in 2016, the Supervisory Board initially had five female members. Since the departure of Hartmut Eberlein and the court appointment of Prof. Dr. Annette G. Köhler as a member of the Supervisory Board with effect from October 1, 2020, it now has six female members. As a result, the share of women represented on the Supervisory Board of GEA Group Aktiengesellschaft currently amounts to 50 percent.
At its meeting on June 22, 2017, the Supervisory Board of GEA Group Aktiengesellschaft set a new 20 percent target for the proportion of women represented on the Executive Board that will be applicable until December 31, 2021.
In June 2017, the Executive Board of GEA Group Aktiengesellschaft set target quotas for the two management levels below the Executive Board that are to be achieved by December 31, 2021, namely a 25 percent share of women on the first and a 30 percent proportion of women on the second management level.
64GEA Annual Report 2020
Corporate Governance Statement
Targets for the other GEA Group companies affected by this law were also set in due time in relation to the proportion of women represented on the respective Supervisory Board and/or the Board of Directors as well as the two uppermost management levels below the Board of Directors, just like the corresponding deadlines for timely target implementation.
GEA takes the corresponding measures (see separate GEA Sustainability Report) to ensure that the set targets are accomplished.
Diversity concepts governing the composition of the Executive Board and the Supervisory Board
Together with the Executive Board, the Supervisory Board – with the support of the Presiding Committee – engages in long-term Executive Board succession planning. The selection process for Executive Board positions is subject to a structured standard procedure. The Presiding Committee first develops a specific profile for an Executive Board position, taking into account the personal and technical qualification criteria relevant to the position as well as the requirements of the German Corporate Governance Code. The group’s top management are regularly assessed with regard to the extent to which they match the relevant job profile and their suitability to assume an Executive Board role. When seeking and selecting appropriate candidates to fill specific Executive Board positions based on these job profiles, the Presiding Committee generally also receives support from external advisers. Based on written candidate profiles, the Presiding Committee preselects candidates to be invited to interview. To enable all Supervisory Board members to obtain their own picture of potential new Executive Board members, as a final step the candidates shortlisted by the Presiding Committee are presented to the full Supervisory Board, which then decides on the appointment of the new Executive Board member. Apart from a balance between technical qualifications and personal skills, the Supervisory Board and its committees also take into account the criterion of diversity when appointing members to the Executive Board. As GEA is an international engineering group and supplier for the food processing industry and various other sectors, appointments to the Executive Board should specifically meet the following additional criteria: International composition, members of at least two different nationalities, with the entire body being multilingual, a 20 percent minimum proportion of women as well as an overall balanced age structure. In addition, at least half of all Executive Board members should have longstanding food industry experience and a minimum of two Executive Board members should have an engineering or scientific background. As a rule, the members of the Executive Board shall
not remain in service beyond the age of 62. However, since the selection of Executive Board members ultimately comes down to criteria such as professional and personal suitability, while also including other aspects such as candidate availability, the Supervisory Board reserves the right to not comply with the requirements of this diversity concept in individual cases. Due to the appointment of new Executive Board members, which began in 2018 and was completed at the beginning of fiscal year 2020, and the reduction of the Executive Board from five to three members that ensued, the diversity concept is not yet fully effective. In light of the current legislative process for the “Zweite Führungspositionen-Gesetz” (“Second Act on the Equal Participation of Women and Men in Leadership Positions in the Private and Public Sectors”), which introduces a mandatory gender quota for the Executive Boards of listed companies and companies subject to co-determination on the basis of parity, the new version of the diversity concept with regard to the composition of the Executive Board was postponed.
At its meeting held on December 15, 2017, the Supervisory Board revised the targets for its composition and added a competence profile. Accordingly, the Supervisory Board members shall collectively have the knowledge, skills and professional expertise required to properly perform their duties in consideration of the company-specific situation. This is why, aside from the integrity and commitment of its members, who must have sufficient time to exercise their respective mandate, the Supervisory Board also pays attention to a balanced profile of skills and expertise amongst its members, in particular sufficient industry and sector knowledge relevant to GEA Group Aktiengesellschaft, an adequate number of independent members, international experience, and diversity. With a view to the interests of the company, the decisive criterion for filling a position on the Board shall in all cases be the professional and individual suitability of the male or female candidate while taking into account the skills and expertise of the other members of the Supervisory Board.
The Supervisory Board seeks to ensure a board composition that takes the following elements into consideration: The Supervisory Board shall be diverse in terms of the origin, professional and cultural background as well as the age and gender of its members. At least one quarter of the members of the Supervisory Board shall have an international background that ideally covers various regions or cultural areas. Each gender shall account for a minimum of one-third of the members of the Supervisory Board. The Supervisory Board shall include what it deems to be an adequate number of independent members. For this reason and in consideration of the shareholder structure, the Supervisory Board seeks to ensure that a minimum of two-thirds of the shareholder representatives are independent in line with the definition given in Recommendation C.7 of the German Corporate Governance Code. At present, four of the six shareholder
65GEA Annual Report 2020
Corporate Governance Statement

representatives on the Supervisory Board are independent within the meaning of the German Corporate Governance Code. Supervisory Board Chairman Dr. Helmut Perlet, and Ahmad M.A. Bastaki are not independent, since they both have been members of the Supervisory Board for more than 12 years. Colin Hall, Prof. Dr. Annette G. Köhler, Jean. E. Spence and Dr. Molly P. Zhang are independent.
As a rule, a member’s uninterrupted service on the Supervisory Board shall not exceed three full terms of office and/or a period of 15 years. Generally, nominations shall only consider individuals who have not yet reached the age of 70 at the date of the Annual General Meeting resolving on the election of the proposed candidates. If it is foreseeable that individuals would be subject to permanent or repeated conflicts of interest in the event of their election to the Supervisory Board, such individuals shall not be considered as Supervisory Board candidates. Apart from that, the Rules of Procedure of the Supervisory Board provide for detailed rules and regulations governing the handling of conflicts of interest that may occur after a member is elected to the Board. According to these regulations, each Supervisory Board member has the obligation to disclose potential conflicts of interest to the Supervisory Board. Conflicts of interest of a material and non-temporary nature in relation to a Supervisory Board member shall result in the termination of his/her mandate.
The competence profile the Supervisory Board seeks to establish for the entire body may be summarized as follows: All members of the Supervisory Board are to be familiar with the sector in which the company operates. At least one Supervisory Board member must have expertise in the fields of financial accounting or auditing. Furthermore, the Chair of the Audit Committee shall also have specific knowledge and expertise in applying internal control procedures. The Supervisory Board shall comprise members with a commercial or business background, individuals from the engineering profession as well as members with experience in one or several of the company’s customer industries. A minimum of two Supervisory Board members shall have management experience in operational business. All members of the Supervisory Board shall be able to understand and assess the specific nature of the company’s business as well as resulting risks and opportunities. They shall be familiar with the basic principles of accounting and risk management.
In its current composition, the Supervisory Board meets the target composition criteria and lives up to the competence profile.
66GEA Annual Report 2020
Corporate Governance Statement

Remuneration Report
The Remuneration Report outlines the key principles applied in determining the total remuneration of the members of the Executive Board of GEA Group Aktiengesellschaft and sets out the structure as well as the level of remuneration for each individual Executive Board member. Furthermore, it specifies the underlying principles and the level of remuneration awarded to the members of the Supervisory Board. Details can be found in this chapter under “Remuneration of the Supervisory Board members”.
The Remuneration Report includes details of the remuneration of board members in accordance with the requirements stipulated in the German Commercial Code (GCGC) as well as the applicable German and international accounting standards.
General information on the remuneration awarded to the members of the Executive Board
Acting on the recommendation of the Presiding Committee, the Supervisory Board determines the total remuneration of the individual Executive Board members and resolves on the remuneration system applicable to the Executive Board. The Supervisory Board reviews the appropriateness of the remuneration at regular intervals. Criteria for determining the appropriateness of the remuneration include the responsibilities of the individual Executive Board members, their respective personal performance, the business situation, the success and the future prospects of the company, as well as the level of the remuneration compared with peer companies and the remuneration structure in place in other areas of the company.
The Supervisory Board implemented the current remuneration system on January 1, 2019. All members of the Executive Board were remunerated under this system in the reporting period. Details can be found under “Current remuneration system“. Until the end of fiscal year 2019, a number of individual members of the Executive Board were still remunerated in accordance with the previous remuneration system, which was implemented in fiscal year 2012. Details can be found in this chapter under “Previous remuneration system”.
Current remuneration system
In fiscal year 2018, the Supervisory Board comprehensively revised the Executive Board remuneration system that had been in place since the beginning of 2012 with the support of an independent external remuneration expert in order to incorporate new regulatory requirements and investor expectations in Executive Board remuneration policies. As a result, the current remuneration system, on which the remuneration of all incumbent Executive Board members is based, is strongly aligned with share price performance. Moreover, it strengthens the position of the Supervisory Board in the event of gross breaches of duty committed by Executive Board members through malus and clawback provisions.
The current remuneration system was approved by a majority of 93.85 percent of the shareholders at the Annual General Meeting on April 26, 2019. It is characterized by the following basic principles:
• Simpler and more comprehensible due to the reduced number of remuneration components and performance targets.
• Clear focus on shares by more strongly tying the payout of the multi-year variable remuneration to GEA’s long-term (share price) performance and by introducing additional share purchase and holding obligations (“share ownership guidelines”).
• Focus on performance by setting performance targets that are even more strongly geared towards financial and sustainable performance.
• Transparency by publishing the target ranges and performance target calibrations for the current fiscal year ex ante in the current Remuneration Report (see “Calibration of financial performance targets and modifier criteria in relation to the 2021 bonus”) for the performance targets applicable in the fiscal year 2021.
67GEA Annual Report 2020
Remuneration Report

• Sanctioning deliberate and gross breaches of duty committed by Executive Board members by means of malus and clawback provisions, giving the Supervisory Board – for the very first time – the possibility of reducing variable remuneration components for the fiscal year in which the respective breach occurred, potentially down to zero.
• Waver of contractual provisions in relation to change of control events and the granting of special bonus payments.
The current remuneration system was revised again in recent months, primarily to ensure its compliance with the German Corporate Governance Code as amended on December 16, 2019, which came into force on March 20, 2020, as well as the statutory amendments to implement the second EU Shareholders’ Rights Directive. The Supervisory Board will submit the amended remuneration system, which is to apply on a uniform basis to all members of the Executive Board from January 1, 2022, i.e. from the start of the second term of office of CEO Stefan Klebert, to the Annual General Meeting for fiscal year 2020 for approval.
Current remuneration system – structure and componentsThe total remuneration awarded to the members of the Executive Board under the current remuneration system comprises one fixed and two variable components (“direct remuneration”) as well as commitments under the company pension scheme. Moreover, the Executive Board members are granted fringe benefits.
Fixed remuneration and fringe benefitsThe fixed remuneration accounts for the major proportion of the non-performance-related remuneration of the Executive Board members and consists of a fixed annual salary that is disbursed in twelve equal monthly installments.
In the year under review, the contractually fixed annual salary awarded to Stefan Klebert amounted to EUR 1,200 thousand, Marcus A. Ketter was awarded EUR 680 thousand while Steffen Bersch and Johannes Giloth each received EUR 600 thousand. To help mitigate the economic impact of the Covid-19 pandemic, members of the Executive Board each waived 10 percent of their fixed salary during a six month period over the past fiscal year. As a result, the actual fixed annual salaries in the reporting period amounted to EUR 1,140 thousand for Stefan Klebert, EUR 646 thousand for Marcus A. Ketter and EUR 570 thousand for Johannes Giloth.
Steffen Bersch and Johannes Giloth were each awarded their fixed annual salaries for 2020 on a pro rata basis. Steffen Bersch left the group at the end of February 29, 2020, while Johannes Giloth took up his position on the Executive Board on January 20, 2020.
In addition, the Executive Board members receive fringe benefits. In the year under review, the latter mainly comprised the value of the use of a company car, accident insurance premiums, and – in individual cases – the reimbursement of costs incurred for travel, accommodation, relocation, subsistence, as well as tax advisory services and legal consultancy.
Pension benefitsAnother non-performance-related remuneration component under the current remuneration system is a company pension scheme based on a contribution-oriented defined benefit plan. For a detailed explanation of these pension commitments, please refer to the section on “Pension commitments”.
68GEA Annual Report 2020
Remuneration Report

Bonus (annual variable remuneration)
Performance targets
EBITDA before restructuring measuresROCE
Weighting
50 percent, respectively
Modifier
Multiplicative linkRange of 0.8 to 1.2
Payout
0 to 200 percent of the target value
The members of the Executive Board receive variable annual performance-related remuneration (bonus) the amount of which is subject to the achievement of two financial performance targets as well as a modifier that is to be determined by the Supervisory Board. Accounting for 40 percent of variable target remuneration and 24 percent of total target remuneration respectively, the bonus represents the variable remuneration component that carries less weight than the Performance Share Plan.
In this context, the key indicators weighted at 50 percent, respectively, are earnings before interest, taxes, depreciation and amortization (EBITDA) as well as return on capital employed (ROCE), each adjusted for restructuring measures. At the same time, the short-term performance targets of compensatory relevance are key financial performance indicators and, as such, integral components of the current management system. Please refer to the section “Fundamental information about the Group” under “Management System” for definitions of the individual components. Contrary to the definitions of the key financial performance indicators, each of the parameters used for remuneration purposes is also adjusted for the effects of transactions – namely acquisitions and divestments – that require the approval of the Supervisory Board or its committees. This adjustment is made once in the year in which a relevant transaction takes place, provided that the latter is already included in the budget for the following fiscal year. Otherwise, the effects of the corresponding transaction must also be adjusted in the key figures for the next fiscal year.
As a combination of earnings and return indicators, both key performance indicators support GEA’s corporate strategy, which is geared towards profitable growth. The respective targets are defined by the Supervisory Board at the start of each fiscal year. Subsequently, target achievement is measured on a straight-line basis within the 0 to 200 percent target range.
An additional modifier allows the Supervisory Board to look beyond financial target achievement, while also taking into account the individual achievements of the members of the Executive Board as well as the body’s collective performance. In this context, assessment is based on pre-defined criteria that may notably include the following aspects:
• Individual performance of the respective Executive Board member (e.g., important strategic accomplishments within his/her area of responsibility, individual contributions to major cross-departmental projects, relevant financial accomplishments in his/her area of responsibility, realization of key projects)
• Collective performance of the Executive Board (e.g., accomplishment of important strategic corporate goals including mergers and acquisitions, cooperation with the Supervisory Board, long-term strategic, technological or structural development of the company), as well as
• Stakeholder concerns and sustainability aspects (e.g., in the fields of occupational safety and health, compliance, conditions of production, energy and environment, customer satisfaction, concerns of the workforce, corporate culture)
The modifier ranges between 0.8 and 1.2 and may therefore result in an upward or downward adjustment of the bonus awarded to the members of the Executive Board (bonus-/malus system).
The overall degree of target achievement in relation to the bonus is calculated as the weighted sum of the EBITDA before restructuring measures and ROCE target achievement levels multiplied by the modifier. The resulting amount may be equivalent to 0 percent up to a maximum of 200 percent of the target amount (cap).
69GEA Annual Report 2020
Remuneration Report

The target bonus amounts to EUR 720 thousand for Stefan Klebert, EUR 408 thousand for Marcus A. Ketter, and EUR 360 thousand for Steffen Bersch and Johannes Giloth, respectively. This remuneration component was also granted to Steffen Bersch and Johannes Giloth on a pro rata basis since Steffen Bersch left and Johannes Giloth joined the Executive Board during the year on February 29, 2020 and January 20, 2020, respectively.
Bonus scheme – how it works
Target value
One-year performance period
Financial targets (0% – 200%)
50%
50%
EBITDA
ROCE
Payout in cash (cap at 200% of target value)
×
×
+
=
Individual performance
Collective performance of the
Executive Board
Stakeholder & sustainability
aspects
Modifier (0.8 – 1.2)
The limited modifier range severely restricts the Supervisory Board’s capability to use discretionary intervention for the purpose of impacting the bonus. The catalog of criteria governing the modifier ensures strong alignment with performance while providing transparency in the event of potential adjustments.
In the event of extraordinary termination for good cause by the company in accordance with section 626 (1) of the Bürgerliches Gesetzbuch (BGB – German Civil Code), the bonus is forfeit. In all other cases involving the departure of an Executive Board member during the planned duration of his/her term of office, the respective Board member is entitled to the prorated bonus earned up to the date of his/her departure.
Target achievement and modifier multiplier applicable to the 2020 bonus In fiscal year 2020, EBITDA before restructuring measures and adjusted for effects from acquisitions totaled EUR 534.7 million, which corresponds to a 165.7 percent target achievement level (previous year: 114.0 percent). ROCE in fiscal year 2020 (also adjusted for restructuring measures and effects from acquisitions) amounted to 17.3 percent (previous year: 10.6 percent), equivalent to a target achievement of 200 percent (previous year: 153.2 percent). Overall, this results in a target achievement level of 182.8 percent for the 2020 bonus (previous year: 133.6 percent).
For the purpose of the 2020 bonus, the Supervisory Board has set a modifier multiplier of 1.14 for Stefan Klebert (previous year: 1.18), 1.14 (previous year: 1.18) for Marcus A. Ketter and 1.14 for Johannes Giloth. In each case, these multipliers correspond to the average of the individual evaluations of the modifier criteria defined in advance for the members of the Executive Board by the Supervisory Board. The modifier applicable to the 2020 bonus was based on the following targets and assessment criteria:
Modifier targets and assessment criteria applicable to the 2020 bonus (range: 0.8-1.2) S. Klebert M. A. Ketter J. Giloth
Individual performance Succession planningDiscretionary assessment by the Supervisory Board taking into account, among other things, criteria for promoting diversity in management positions
•
Global production strategyDiscretionary assessment by the Supervisory Board •
Risk management systemDiscretionary assessment by the Supervisory Board taking into account, among other things, the status of implementation and performance against the current system and processes
•
Collective performance of the Executive Board
Stabilization of the CREATE organizationDiscretionary assessment by the Supervisory Board • • •
Stakeholders and sustainability aspects
Customer satisfaction Largely discretionary assessment by the Supervisory Board • • •
Employee satisfaction Assessment based on degree of improvement or deterioration, as the case may be
• • •
Different arrangements were agreed with Steffen Bersch given his departure on February 29, 2020. Details can be found in this chapter under “Agreements governing the departure of former Executive Board members”.
70GEA Annual Report 2020
Remuneration Report

Calibration of financial performance targets and modifier criteria in relation to the 2021 bonus*For the purpose of the 2021 bonus, the Supervisory Board has calibrated the following financial performance targets:
For the key performance indicator EBITDA before restructuring measures, 100 percent target achievement is given if the EBITDA before restructuring measures amounts to EUR 555 million in the fiscal year 2021. The target achievement corridor ranges from EUR 455 million, which would correspond to a target achievement of 0 percent, to EUR 655 million, which would correspond to a target achievement of 200 percent. Linear interpolation is performed between these values.
A target achievement of 100 percent should be given for the key performance indicator ROCE in the fiscal year 2021 if ROCE is 18.0 percent. Here, the target achievement corridor ranges from 13.0 percent (target achievement would correspond to 0 percent) to 23.0 percent (target achievement would correspond to 200 percent). Linear interpolation is performed between these values.
The Supervisory Board has defined the following modifier targets and assessment criteria for the 2021 bonus:
Modifier targets and assessment criteria applicable to the 2021 bonus (range: 0.8-1.2) S. Klebert M. A. Ketter J. Giloth
Individual performance Diversity concept Discretionary assessment by the Supervisory Board, taking into account certain parameters defined in advance by the Supervisory Board
•
Inventory management program Largely discretionary assessment by the Supervisory Board, taking into account certain parameters defined in advance by the Supervisory Board
•
Information security program Largely discretionary assessment by the Supervisory Board, taking into account certain parameters defined in advance by the Supervisory Board
•
Collective performance of the Executive Board
ESG target concept Largely discretionary assessment by the Supervisory Board, taking into account certain parameters defined in advance by the Supervisory Board
• • •
Stakeholders and sustainability aspects
Employee satisfaction Discretionary assessment by the Supervisory Board, taking into account certain parameters defined in advance by the Supervisory Board
• • •
Customer satisfaction Discretionary assessment by the Supervisory Board, taking into account certain parameters defined in advance by the Supervisory Board
• • •
*) This section is not part of the independent audit.
71GEA Annual Report 2020
Remuneration Report
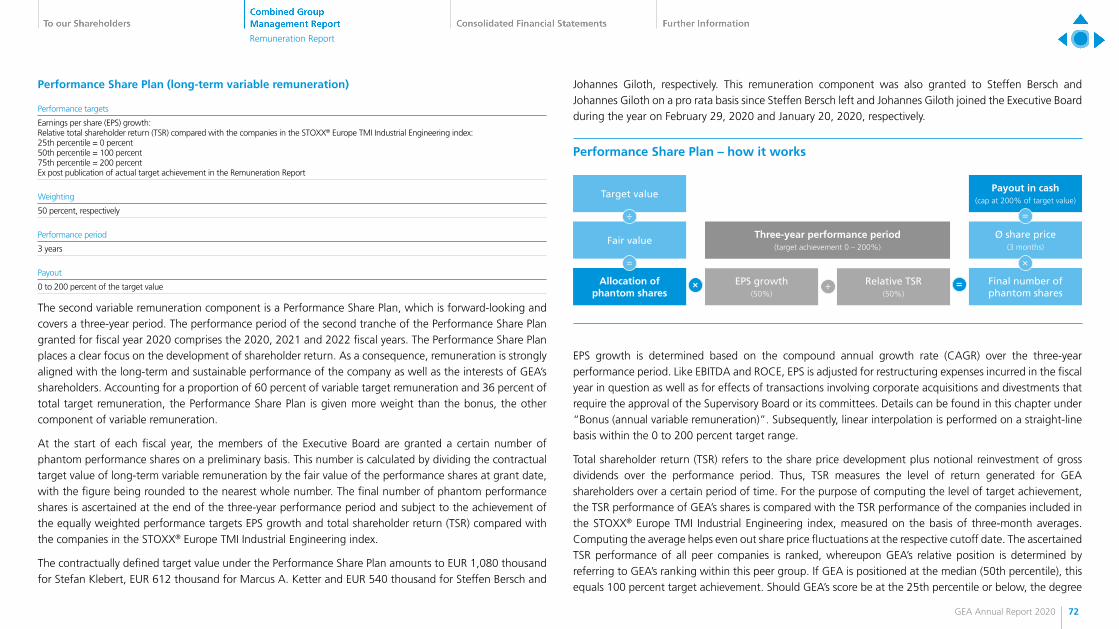
Performance Share Plan (long-term variable remuneration)
Performance targets
Earnings per share (EPS) growth:Relative total shareholder return (TSR) compared with the companies in the STOXX® Europe TMI Industrial Engineering index: 25th percentile = 0 percent50th percentile = 100 percent 75th percentile = 200 percent Ex post publication of actual target achievement in the Remuneration Report
Weighting
50 percent, respectively
Performance period
3 years
Payout
0 to 200 percent of the target value
The second variable remuneration component is a Performance Share Plan, which is forward-looking and covers a three-year period. The performance period of the second tranche of the Performance Share Plan granted for fiscal year 2020 comprises the 2020, 2021 and 2022 fiscal years. The Performance Share Plan places a clear focus on the development of shareholder return. As a consequence, remuneration is strongly aligned with the long-term and sustainable performance of the company as well as the interests of GEA’s shareholders. Accounting for a proportion of 60 percent of variable target remuneration and 36 percent of total target remuneration, the Performance Share Plan is given more weight than the bonus, the other component of variable remuneration.
At the start of each fiscal year, the members of the Executive Board are granted a certain number of phantom performance shares on a preliminary basis. This number is calculated by dividing the contractual target value of long-term variable remuneration by the fair value of the performance shares at grant date, with the figure being rounded to the nearest whole number. The final number of phantom performance shares is ascertained at the end of the three-year performance period and subject to the achievement of the equally weighted performance targets EPS growth and total shareholder return (TSR) compared with the companies in the STOXX® Europe TMI Industrial Engineering index.
The contractually defined target value under the Performance Share Plan amounts to EUR 1,080 thousand for Stefan Klebert, EUR 612 thousand for Marcus A. Ketter and EUR 540 thousand for Steffen Bersch and
Johannes Giloth, respectively. This remuneration component was also granted to Steffen Bersch and Johannes Giloth on a pro rata basis since Steffen Bersch left and Johannes Giloth joined the Executive Board during the year on February 29, 2020 and January 20, 2020, respectively.
Performance Share Plan – how it works
Target valuePayout in cash
(cap at 200% of target value)
Fair valueØ share price
(3 months)
Allocation of phantom shares
Final number of phantom shares
Three-year performance period (target achievement 0 – 200%)
EPS growth (50%)
×
÷
= ×
=
+ =Relative TSR (50%)
EPS growth is determined based on the compound annual growth rate (CAGR) over the three-year performance period. Like EBITDA and ROCE, EPS is adjusted for restructuring expenses incurred in the fiscal year in question as well as for effects of transactions involving corporate acquisitions and divestments that require the approval of the Supervisory Board or its committees. Details can be found in this chapter under “Bonus (annual variable remuneration)”. Subsequently, linear interpolation is performed on a straight-line basis within the 0 to 200 percent target range.
Total shareholder return (TSR) refers to the share price development plus notional reinvestment of gross dividends over the performance period. Thus, TSR measures the level of return generated for GEA shareholders over a certain period of time. For the purpose of computing the level of target achievement, the TSR performance of GEA’s shares is compared with the TSR performance of the companies included in the STOXX® Europe TMI Industrial Engineering index, measured on the basis of three-month averages. Computing the average helps even out share price fluctuations at the respective cutoff date. The ascertained TSR performance of all peer companies is ranked, whereupon GEA’s relative position is determined by referring to GEA’s ranking within this peer group. If GEA is positioned at the median (50th percentile), this equals 100 percent target achievement. Should GEA’s score be at the 25th percentile or below, the degree
72GEA Annual Report 2020
Remuneration Report

of target achievement is equivalent to 0 percent. If GEA scores at the 75th percentile or above, the degree of target achievement is 200 percent. The degree of target achievement in-between these percentile markers is measured by means of linear interpolation.
Target achievement curve relative Total Shareholder Return
0%
100%
200%
Target achievement
25%25th percentile
(1st quartile)
50%50th percentile
(median)
75%75th percentile
(3rd quartile)
Ranking
The final number of virtual performance shares is computed by multiplying the number of provisionally granted phantom performance shares by the overall degree of target achievement from EPS growth, taking into account capital measures during the performance period as well as relative TSR. The final payout is then determined by multiplying the final number of performance shares with the average share price over the three months preceding the end of the performance period, taking dividends into account. The amount paid out is limited to 200 percent of the target value.
To further enhance transparency, the final target achievement levels pertaining to EPS growth and relative TSR, as well as the target range applicable to EPS growth are published in the Remuneration Report following the end of the respective performance period. Hence, the relevant information on the tranche awarded for fiscal year 2020 under the Performance Share Plan will be provided in the company’s 2022 Annual Report.
No payment of the 2020 tranche granted under the Performance Share Plan has been made yet, since it is forward-looking and computed over a period of three years; payout will not be made until fiscal year 2023. Based on the knowledge and information available as of December 31, 2020, the currently outstanding tranche under the Performance Share Plan (2019 tranche and 2020 tranche) is expected to outperform their targets.
Granting and calibration of EPS growth under the 2021 tranche*As part of the third tranche of the Performance Share Plan granted for the current fiscal year (2021 tranche), the members of the Executive Board were each granted the following number of performance shares on the basis of a fair value per performance share of EUR 21.32 at the grant date of January 1, 2021:
Participants Tranche 2021 Contractual target value (in EUR) Number of performance shares granted
Stefan Klebert 1,080,000 50,664
Marcus A. Ketter 612,000 28,710
Johannes Giloth 540,000 25,332
Total 2,232,000 104,706
The 2021 tranche of the Performance Share Plan is based on the following calibration of the financial performance target EPS growth, as resolved by the Supervisory Board: A target achievement of 100 percent is awarded if the annualized EPS growth rate in the performance period, which covers the fiscal years 2021 – 2023, is 13.0 percent. The target achievement corridor for EPS growth ranges from a CAGR of 8.0 percent during the performance period, which would correspond to target achievement of 0 percent, to a CAGR of 18.0 percent for the period 2021 – 2023, which would correspond to target achievement of 200 percent. Linear interpolation is performed between these values.
*) This section is not part of the independent audit.
73GEA Annual Report 2020
Remuneration Report

Malus & clawbackUnder the current remuneration system, the Supervisory Board is given the possibility of reducing variable remuneration at its reasonable discretion if a member of the Executive Board has been found to have knowingly committed a gross violation of his or her statutory or contractual obligations or essential internal guidelines and policies. On the one hand, the target bonus and/or the number of performance shares allocated for the fiscal year in which said gross violation has taken place may be reduced to zero prior to the end of the performance period, if necessary (malus provisions). On the other hand, the amount already paid out for the respective fiscal year under the bonus and/or Performance Share Plan by the time the Supervisory Board resolves to reduce variable remuneration may be reclaimed, with the Executive Board member’s repayment obligation being restricted to the net amount paid out (clawback provisions). For instance, criteria governing a reduction in variable remuneration include the severity of the violation, its impact on the company as well as the degree of fault that lies with the respective member of the Executive Board.
Share ownership guidelinesUnder the current remuneration system, the members of the Executive Board are obliged to acquire GEA shares and hold them until the end of their period of service. The purpose of these share ownership guidelines (SOG) is to further strengthen GEA’s equity culture and incentivize Executive Board members to sustainably increase the company’s enterprise value for the benefit of the shareholders. In this way, the members of the Executive Board directly participate in the performance of the company. Furthermore, this scheme sends a clear signal to GEA’s employees, its shareholders and its other stakeholders, emphasizing the trust the Executive Board puts in GEA’s strategic orientation and sustainable success.
The CEO, Stefan Klebert, is obliged to hold shares in the amount of 150 percent of his fixed annual gross salary while Marcus A. Ketter and Johannes Giloth are required to hold stock totaling 100 percent of their respective fixed annual gross salary. Until the SOG target is fully met, 25 percent of the net amount paid out within the framework of variable remuneration (bonus and Performance Share Plan) must be invested by Executive Board members in shares each year until their respective stockholding obligation is fulfilled. The first acquisition of shares under the Share Ownership Guidelines was to be made in March 2020 concurrently with payment of the 2019 bonus. However, this was not carried out for reasons related to capital market regulations.
Remuneration structure and levelsSince the introduction of the current remuneration system in fiscal year 2019, direct target remuneration, i.e. the sum total of basic salary, target bonus and the target value of long-term variable remuneration, is based on the following amounts: CEO EUR 3.0 million p.a., CFO EUR 1.7 million p.a. and ordinary Executive Board members EUR 1.5 million p.a. The specification of the respective level of direct remuneration was based on a market comparison conducted at the end of 2017. The market comparison took into account the companies listed in the MDAX as well as an industry peer group made up of engineering companies (Airbus, Aurubis, BMW, Continental, Daimler, Dürr, Hella, Jungheinrich, KION, Krones, Leoni, MTU Aero Engines, Norma, Rheinmetall, Salzgitter, Schaeffler, Siemens, thyssenkrupp, Volkswagen). Following the recommendations of the GCGC, the Supervisory Board not only took into account a horizontal comparison, but also considered a vertical comparison juxtaposing Executive Board remuneration with the compensation awarded to the senior management and the general workforce.
74GEA Annual Report 2020
Remuneration Report

The following chart shows the direct target remuneration levels as well as the respective maximum direct remuneration awarded to the members of the Executive Board:
Target remuneration and maximum direct remuneration levels(in EUR thousands)
CEO CFO Ordinary Executive Board Member
Target Maximum
40% 25%
24%30%
1.6
36%
45%
1,200 1,200
7201,440
1,080
2,160
Target Maximum
40% 25%
24%30%
Cap: 200%
Cap: 200%
Cap: 200%
Cap: 200%Cap: 200%
Cap: 200%
1.6
36%
45%
680 680
408816
612
1,224
Target Maximum
40% 25%
24%30%
1.6
36%
45%
600 600
360720
540
1,080
Multi-year variable remuneration (Performance Share Plan) Annual variable remuneration (bonus) Base salary
3,000
4,800
1,5001,700
2,7202,400
The Supervisory Board regularly reviews whether the Executive Board remuneration is appropriate and in line with the market. The last time such a review was carried out was when the current remuneration system was revised in December 2020. The peer groups used for this purpose were the MDAX and an industry peer group consisting of the following engineering companies: Airbus, Aurubis, BMW, Continental, Daimler, Dürr, Hella, Jungheinrich, KION, Krones, Leoni, MTU Aero Engines, Norma, Rheinmetall, Salzgitter, Schaeffler, Siemens, thyssenkrupp, Volkswagen. In addition, the Supervisory Board again carried out a vertical comparison of the remuneration of the Executive Board.
Previous remuneration system
The previous remuneration system, most of which had already been replaced at the end of fiscal year 2018 and was fully replaced at the end of fiscal year 2019, was explained in detail in the annual report for fiscal year 2019 and in the annual reports for the preceding years. An overview of the components of the previous remuneration system are presented below, as they are still relevant for the outstanding tranches of the long-term share price component, and as they are reflected in the prior-year comparative figures presented in this remuneration report.
• Annual fixed remuneration, which was paid out monthly as a non-performance-related basic remuneration.
• Fringe benefits comparable to those granted under the current remuneration system. • Annual variable remuneration (bonus) whose level depends on the achievement of specific targets set
by the Supervisory Board, and which would correspond to the amount of annual fixed remuneration in the event of a target achievement level of 100 percent. These bonuses comprised three elements that included both a one-year and a multi-year basis for assessment:
• The amount of the individual bonus component was calculated on the basis of three to five individual annual targets, which were tied to the sustainability of corporate governance, as determined for the respective fiscal year by the Supervisory Board. This component had a weighting of 40 percent within variable remuneration bucket.
• A multi-year component, also weighted at 40 percent, for which the performance measurement included the last three fiscal years. The period of assessment covered the respective fiscal year just ended, for which the multi-year component was granted, as well as the two preceding fiscal years. The key performance indicators for the multi-year component were the cash flow driver margin (CFDM) and return on capital employed (ROCE), the target achievement levels of which were multiplied to determine the overall target achievement level.
• In the case of the long-term share price component included in the previous remuneration system – which had a weighting of 20 percent within the variable remuneration – the performance measurement was also carried out over a three-year assessment period, albeit on a forward-looking basis. The performance period covered the relevant fiscal year for which the long-term share price component was granted as well as the two subsequent fiscal years. With regard to the
75GEA Annual Report 2020
Remuneration Report

long-term share price component, performance was measured by comparing the performance of the GEA share price, adjusted for dividends, with the performance of the STOXX® Europe TMI Industrial Engineering (TMI IE) index over the three-year performance period. This comparison was computed on the basis of the respective arithmetic mean closing prices on the last 20 trading days preceding the start of the three-year performance period.
The following table summarizes the respective weightings and assessment periods applicable to the variable components under the previous remuneration system:
Variable remuneration component Target Weighting Cap* Overall cap*
Assessment period
2017 2018 2019 2020 2021
Individual component Individual targets 40% 200% 240% One year
Multi-year component Combination of cash flow driver margin and ROCE
40% 250% Backward-looking (3 years)
Long-term Share price component
Share price in relation to TMI IE
20% 300% Forward-looking (3 years)
*) As a percentage of the respective variable remuneration component (“cap”) and/or the target bonus (“overall cap”)
The 2018 tranche of the long-term share price component will be paid out in March 2021. The target achievement level computed for the 2018 tranche amounts to -5.1 percent. In the actual year under review, the 2017 tranche in the amount of EUR 15 thousand was paid out on the basis of a 2.3 percent target achievement level. As of December 31, 2020, the target achievement levels of the tranches under the long-term share price component that were still outstanding amounted to 86.4 percent (previous year: 88.2 percent) for the 2019 tranche (performance period 2019 to 2021) and -5.1 percent (previous year: 3.1 percent) for the 2018 tranche (performance period 2018 to 2020).
No further variable remuneration components under the former remuneration system will be outstanding following settlement of the 2019 tranche of the long-term share price component in spring 2022.
Pension commitments
Stefan Klebert, Marcus. A. Ketter and Johannes GilothAs the standard form of occupational pension, the current remuneration system provides for a contribution-oriented defined benefit pension plan. The pension commitment vests immediately and includes pension, surviving dependents’ as well as incapacity benefits. As part of their retirement benefits, the accrued capital is available to the Executive Board members from age 62 onwards. If an Executive Board member leaves the company due to incapacity to work, he/she is entitled to receive incapacity benefits. Should a member of the Executive Board pass away before reaching the age of 62, his/her surviving dependents, i.e., his/her surviving spouse or partner or the surviving children are entitled to surviving dependents’ benefits. The amount of disability and surviving dependents’ benefits is equivalent to the accrued pension capital. If a member of the Executive Board dies after the occurrence of a pension event, his/her surviving dependents are entitled to receive the residual capital.
For meeting its pension commitments, the company sets up a pension account for each Executive Board member and deposits the contractually agreed pension contributions into this account on a monthly basis. Monthly pension contributions are granted for each month during the term of the Executive Board service agreement. The monthly pension contributions made amount to EUR 33,333.00 (gross) for Stefan Klebert, EUR 25,000.00 (gross) for Marcus A. Ketter and EUR 16,666.67 (gross) for Johannes Giloth. In addition, the members of the Executive Board have the possibility of participating in a deferred compensation scheme up to a maximum amount of EUR 100 thousand per year.
The pension capital available upon retirement, and thus the amount of pension benefit, is calculated from the pension contributions paid into the pension account up to the time of retirement, including the performance of the pension account during the investment period. The company guarantees a nominal return of premium, i.e., at least the aggregate amount of the company-funded pension contributions and the deferred contributions are available at the time the pension capital falls due. The latter may be paid out as a lump sum or in up to 20 annual installments, with outstanding installments continuing to earn 1 percent interest per year.
76GEA Annual Report 2020
Remuneration Report

Pension commitments under this program were made to Stefan Klebert, Marcus A. Ketter and Johannes Giloth. The pension commitments to Steffen Bersch under the previous remuneration system will continue to apply and remain unchanged, although Steffen Bersch switched to the new remuneration system as of January 1, 2019.
Steffen Bersch The contractual pension benefits of Steffen Bersch amount to a maximum of EUR 200 thousand p.a. Under this arrangement, maximum pension benefits will be paid once his service agreement ends when or after he reaches the age of 62 or in the event of his permanent incapacity to work. As Steffen Bersch’s service agreement ended with his departure on February 29, 2020, and, thus, before one of the above conditions for payment of his pension was met, Steffen Bersch has vested rights to a pro rata annual pension in the amount of EUR 90,791.06 that becomes payable once he reaches the age of 62. His pro rata annual pension is composed of two elements: First, vested benefits in the amount of EUR 12,784.68 that do not result from deferred compensation and were earned while Steffen Bersch was working for companies of GEA Group prior to his appointment to the Executive Board. In addition, Steffen Bersch has earned vested pension benefits in the amount of EUR 78,006.38 during his four years and two months of service as an Executive Board member. In order to earn the maximum pro rata annual pension of EUR 200 thousand p.a., Steffen Bersch’s tenure on the Executive Board would have had to last 10 years. His regular pension will be adjusted annually in line with the consumer price index.
The company covers the employer’s contribution to the state pension scheme payable for Steffen Bersch’s voluntary enrollment in the scheme.
In addition, Steffen Bersch is entitled to vested benefits in the amount of EUR 23,428 p.a. from personal contributions made prior to his appointment to the Executive Board in connection with his participation in GEA’s executive pension scheme.
The surviving dependents’ benefits defined in Steffen Bersch’s service agreement essentially provide for a lifelong widow’s pension as well as an orphan’s pension. The widow’s pension provides for totals 60 percent of Steffen Bersch’s retirement pension. The orphan’s pension is a specific percentage of the retirement pension and its amount depends on the number of children and whether they are full or half orphans. In principle, entitlement to an orphan’s pension expires on reaching the legal age, but at the latest on reaching the age of 25 if the child in question is still in full-time education and/or in vocational or professional training. Collectively, the widow’s and orphan’s pensions may not exceed the level of the retirement pension.
Pension plan reinsurance and capitalization optionAs the contractual pension commitments made to the members of the Executive Board under the previous remuneration system were only partly protected against insolvency, namely in the amount of the sum covered by the Pensions-Sicherungs-Verein (PSV – Pension Protection Fund), the Supervisory Board decided in 2014 to take out pension plan reinsurance policies to secure the proportion of the pension commitments not covered by the PSV for the benefit of the individual Executive Board members. At the same time, the members of the Executive Board were granted a capitalization option. The level of the capitalization amount is equivalent to the pension liabilities ascertained by applying the basis of calculation used for the purpose of preparing the consolidated financial statements. This option to capitalize may be exercised upon retirement, but no earlier than age 62. It is possible to exercise this option in part or several times. Each exercise of the capitalization option entails a corresponding reduction in entitlements regarding the contractually guaranteed benefits for surviving dependents. There is no reinsurance for the members of the Executive Board who are remunerated in accordance with the current remuneration system.
77GEA Annual Report 2020
Remuneration Report
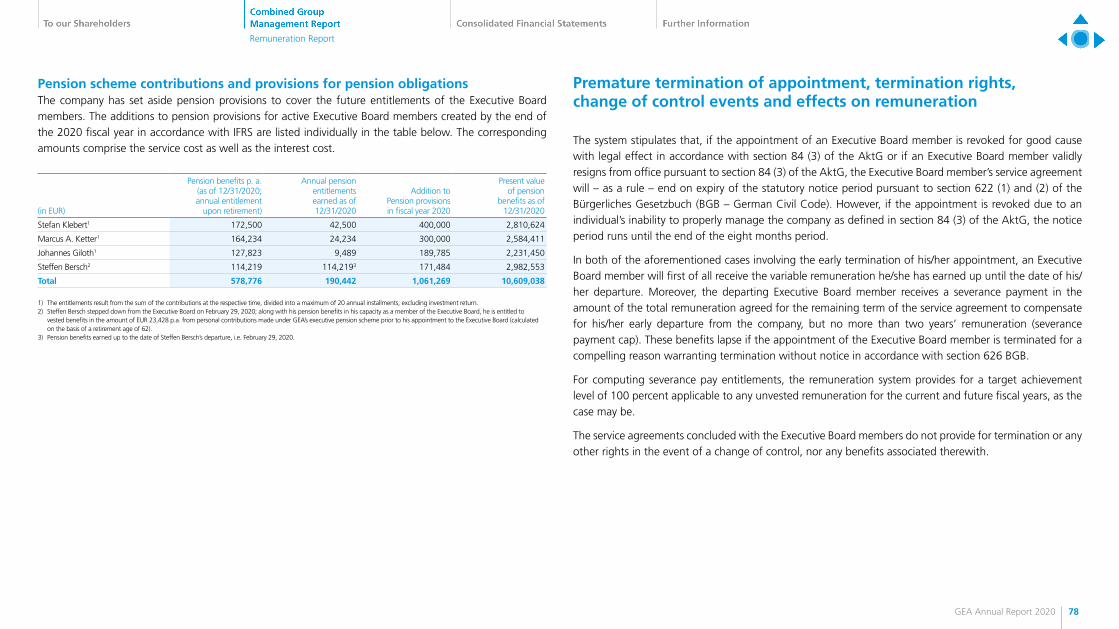
Pension scheme contributions and provisions for pension obligationsThe company has set aside pension provisions to cover the future entitlements of the Executive Board members. The additions to pension provisions for active Executive Board members created by the end of the 2020 fiscal year in accordance with IFRS are listed individually in the table below. The corresponding amounts comprise the service cost as well as the interest cost.
(in EUR)
Pension benefits p. a.(as of 12/31/2020; annual entitlement
upon retirement)
Annual pension entitlementsearned as of 12/31/2020
Addition to Pension provisions in fiscal year 2020
Present value of pension
benefits as of 12/31/2020
Stefan Klebert1 172,500 42,500 400,000 2,810,624
Marcus A. Ketter1 164,234 24,234 300,000 2,584,411
Johannes Giloth1 127,823 9,489 189,785 2,231,450
Steffen Bersch2 114,219 114,2193 171,484 2,982,553
Total 578,776 190,442 1,061,269 10,609,038
1) The entitlements result from the sum of the contributions at the respective time, divided into a maximum of 20 annual installments, excluding investment return. 2) Steffen Bersch stepped down from the Executive Board on February 29, 2020; along with his pension benefits in his capacity as a member of the Executive Board, he is entitled to vested benefits in the amount of EUR 23,428 p.a. from personal contributions made under GEA’s executive pension scheme prior to his appointment to the Executive Board (calculated on the basis of a retirement age of 62).3) Pension benefits earned up to the date of Steffen Bersch’s departure, i.e. February 29, 2020.
Premature termination of appointment, termination rights, change of control events and effects on remuneration
The system stipulates that, if the appointment of an Executive Board member is revoked for good cause with legal effect in accordance with section 84 (3) of the AktG or if an Executive Board member validly resigns from office pursuant to section 84 (3) of the AktG, the Executive Board member’s service agreement will – as a rule – end on expiry of the statutory notice period pursuant to section 622 (1) and (2) of the Bürgerliches Gesetzbuch (BGB – German Civil Code). However, if the appointment is revoked due to an individual’s inability to properly manage the company as defined in section 84 (3) of the AktG, the notice period runs until the end of the eight months period.
In both of the aforementioned cases involving the early termination of his/her appointment, an Executive Board member will first of all receive the variable remuneration he/she has earned up until the date of his/her departure. Moreover, the departing Executive Board member receives a severance payment in the amount of the total remuneration agreed for the remaining term of the service agreement to compensate for his/her early departure from the company, but no more than two years’ remuneration (severance payment cap). These benefits lapse if the appointment of the Executive Board member is terminated for a compelling reason warranting termination without notice in accordance with section 626 BGB.
For computing severance pay entitlements, the remuneration system provides for a target achievement level of 100 percent applicable to any unvested remuneration for the current and future fiscal years, as the case may be.
The service agreements concluded with the Executive Board members do not provide for termination or any other rights in the event of a change of control, nor any benefits associated therewith.
78GEA Annual Report 2020
Remuneration Report

Agreements governing the departure of former Executive Board members
Steffen BerschSteffen Bersch left GEA Group by mutual agreement at the end of February 29, 2020. Within the framework of a termination agreement, both, his appointment as member of the Executive Board of GEA Group Aktiengesellschaft and his service agreement were terminated at that date.
Until the date of his departure, Steffen Bersch continued to receive his fixed monthly salary as well as the employer’s contribution to the state pension scheme. His bonus for fiscal year 2019 and the long-term share price component for fiscal year 2017, which is still granted under the previous remuneration system, were calculated in accordance with the provisions of his service agreement and were paid out in March 2020. The long-term share price component for fiscal year 2018 will be disbursed in March 2021. The 2019 tranche awarded to Steffen Bersch under the Performance Share Plan will be computed on the basis of the provisions set forth in his service agreement and paid out in March 2022.
For fiscal year 2020, Steffen Bersch received a pro-rata bonus in the amount of EUR 60 thousand for the months of January and February that was uniformly computed on the basis of a 100 percent target achievement level. The pro-rata bonus fell due and was paid out upon his departure on February 29, 2020. Steffen Bersch was granted the 2020 tranche under the Performance Share Plan, which will be computed in accordance with the provisions set forth in his service agreement and disbursed pro rata temporis in March 2023.
In connection with his mutually agreed premature departure from the company, Steffen Bersch did not receive any severance pay or any other benefits of a compensatory nature.
Steffen Bersch’s pro rata annual pension upon retirement amounts to EUR 90,791.06. In addition, Steffen Bersch is entitled to vested benefits in the amount of EUR 23,428.00 from personal contributions made prior to his appointment to the Executive Board in connection with his participation in GEA’s executive pension scheme. Details can be found in this chapter under section “Pension commitments”. Steffen Bersch has declared that the pension plan reinsurance taken out to partially secure his claims or entitlements to pension benefits need no longer be continued to the extent that there is over-collateralization.
Remuneration of the members of the Executive Board
Total remuneration in 2020 and 2019In the past fiscal year, the total remuneration paid to the active Executive Board members of GEA Group Aktiengesellschaft amounted to EUR 7,812,468. This comprised both an amount of EUR 2,425,355 for fixed salaries and an amount of EUR 5,289,699 for variable remuneration. The amounts under the Performance Share Plan are based on the fair value of the entitlement at grant date (January 1, 2020) and amounted to EUR 1,080,000 for Stefan Klebert, EUR 612,000 for Marcus A. Ketter, EUR 511,890 for Johannes Giloth and EUR 87,288 for Steffen Bersch, i.e., a total of EUR 2,291,178 in the year under review. Since the 2020 tranche of the Performance Share Plan granted to Steffen Bersch and Johannes Giloth is payable on a pro rata basis due to the departure of Steffen Bersch on February 29, 2020 and the joining of Johannes Giloth on January 20, 2020, the fair value on the grant date for the calculation of the remuneration was reduced accordingly.
In fiscal year 2019, the total remuneration paid to the active Executive Board members amounted to EUR 8,851,636. This comprised both an amount of EUR 3,463,589 for fixed salaries and an amount of EUR 5,101,557 for variable remuneration. The amounts under the Performance Share Plan and the long-term share price component are based on the fair value of the entitlement at grant date (January 1, 2019) and amounted to EUR 1,080,000 for Stefan Klebert, EUR 378,937 for Marcus A. Ketter, EUR 540,000 for Steffen Bersch, and EUR 111,972 for Martine Snels, i.e., a total of EUR 2,110,909 in the year under review. Neither Jürg Oleas, Niels Erik Olsen nor Dr. Helmut Schmale, who each departed in the first and/or second quarter of 2019, were granted any performance shares and/or long-term share price components.
79GEA Annual Report 2020
Remuneration Report

The following table shows an individualized breakdown of fixed remuneration, variable components and other income:
(in EUR)Fixed
remuneration1 Variable componentsNon-cash
benefitsPension
subsidies Total
Bonus (current
remunera-tion system)
Performance Share Plan2
(current remunera-
tion system)
Individual component
(previous remuneration
system)
Multi-yearcomponent
(previous remunera-
tion system)
Long-term share price
component3 (previous
remuneration system)
Stefan Klebert 1,140,000 1,440,000 1,080,000 – – – 10,958 – 3,670,958 Previous year 1,200,000 1,132,661 1,080,000 – – – 18,328 – 3,430,989Marcus A. Ketter 646,000 816,000 612,000 – – – 19,516 – 2,093,516 Previous year 418,602 398,933 378,937 – – – 41,454 – 1,237,926Johannes Giloth4 539,355 682,521 511,89012 – – – 30,533 – 1,764,299 Previous year – – – - – – – – –Steffen Bersch5 100,000 60,00010 87,28813 – – – 2,959 1,246 251,493 Previous year 600,000 542,234 540,000 – – – 109,098 7,477 1,798,809Martine Snels6 – – – – – – 9,22414 – 9,224 Previous year 600,000 – – 277,920 46,080 111,972 34,725 – 1,070,697Niels Erik Olsen7 – – – – – – 22,97814 – 22,978 Previous year 212,253 225,00011 – – – – 50,278 – 487,531Jürg Oleas8 – – – – – – – – –Previous year 167,411 – – 142,29911 – – 5,779 – 315,489
Dr. Helmut Schmale9 – – – – – – – – –Previous year 265,323 – – 225,52111 – – 16,517 2,834 510,195
Total 2,425,355 2,998,521 2,291,178 – – – 96,168 1,246 7,812,468Previous year 3,463,589 2,298,828 1,998,937 645,740 46,080 111,972 276,179 10,311 8,851,636
1) To help mitigate the economic impact of the Covid-19 pandemic, Stefan Klebert, Marcus A. Ketter and Johannes Giloth each waived 10 percent of their fixed salary during a six month period over the 2020 fiscal year.2) No payment of the 2020 tranche granted under the Performance Share Plan was made in the reporting year, since it is computed over a three-year period from 2020 to 2022. The bonus attributable to the Performance Share Plan is based on the fair value of the entitlement at grant date (January 1, 2020).3) No payment of the 2019 long-term share price component was made in the reporting year, since it is computed over a three-year period from 2019 to 2021. The bonus attributable to the long-term share price component is based on the fair value of the entitlement at grant date (January 1, 2019).4) Johannes Giloth took up his position on the Executive Board on January 20, 2020. 5) Steffen Bersch stepped down from the Executive Board on February 29, 2020.6) Martine Snels stepped down from the Executive Board on December 31, 2019.7) Niels Erik Olsen stepped down from the Executive Board on March 31, 2019.8) Jürg Oleas stepped down from the Executive Board on February 17, 2019.9) Dr. Helmut Schmale stepped down from the Executive Board on May 17, 2019.10) For fiscal year 2020, Steffen Bersch received a pro rata bonus computed on the basis of a 100 percent target achievement for the period from January 1, 2020 until his departure on February 29, 2020.11) The amounts in each case represent the entitlement computed on the basis of a target achievement of 85 percent for Jürg Oleas and Dr. Helmut Schmale and 100 percent for Niels Erik Olsen for all bonus components for the period from January 1, 2019 until the respective date of departure.12) Due to Johannes Giloth joining on January 20, 2020 and the resulting reduction in the payment of the 2020 tranche under the Performance Share Plan, the fair value at grant date was reduced accordingly to EUR 23.79 (rounded) per performance share.13) Due to the departure of Steffen Bersch on February 29, 2020 and the resulting reduction in the payment of the 2020 tranche under the Performance Share Plan, the fair value at grant date was reduced accordingly to EUR 4.06 (rounded) per performance share.14) The non-cash benefits were granted for the periods in which Martine Snels and Niels Erik Olsen were still in active service.
Supplemental disclosures relating to share-based remuneration for the period 2018 to 2020During the fiscal years 2019 and 2020, the Executive Board was awarded share-based remuneration under the current remuneration system in the form of an annual tranche of the Performance Share Plan. Details of the existing entitlements of the members of the Executive Board under this remuneration component are shown in the table below.
Performance sharesPerformance shares granted at
vesting date (in number of shares)
Fair value (in EUR) as of
12/31/2020
Fair value (in EUR) as of
12/31/2019
Stefan Klebert 2019 tranche 2020 tranche
50,35843,028
1,837,1611,491,437
2,116,496 _
Marcus A. Ketter 2019 tranche 2020 tranche
17,66924,383
644,600845,164
742,610 –
Johannes Giloth 2019 tranche 2020 tranche
– 21,5141
–706,9002
– –
Steffen Bersch 2019 tranche 2020 tranche
25,17921,5143
918,580120.5414
1,058,248 –
Total Tranche 2019Total Tranche 2020
93,206110,439
3,400,3413,164,042
3,917,354–
1) Payout reduced pro rata temporis in March 2023 due to appointment in January 20, 2020.2) Based on a reduced fair value of EUR 32.86 per performance share (rounded) as of December 31, 2020.3) Payout reduced pro rata temporis in March 2023 due to departure on February 29, 2020.4) Based on a reduced fair value of EUR 5.60 per performance share (rounded) as of December 31, 2020.
80GEA Annual Report 2020
Remuneration Report
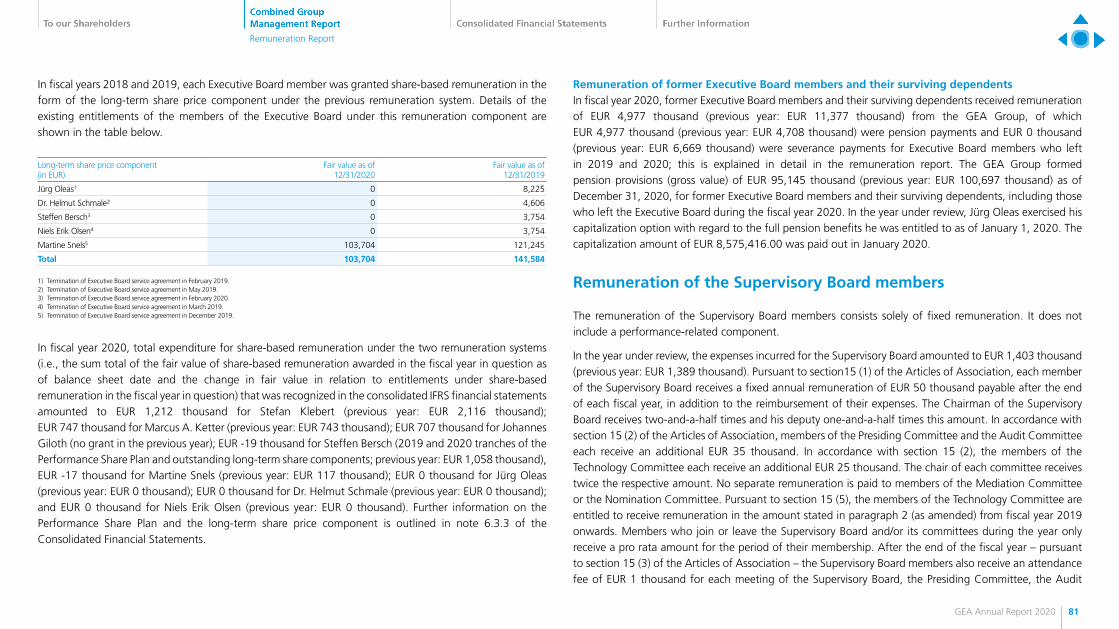
In fiscal years 2018 and 2019, each Executive Board member was granted share-based remuneration in the form of the long-term share price component under the previous remuneration system. Details of the existing entitlements of the members of the Executive Board under this remuneration component are shown in the table below.
Long-term share price component(in EUR)
Fair value as of12/31/2020
Fair value as of12/31/2019
Jürg Oleas1 0 8,225
Dr. Helmut Schmale² 0 4,606
Steffen Bersch3 0 3,754
Niels Erik Olsen4 0 3,754
Martine Snels5 103,704 121,245
Total 103,704 141,584
1) Termination of Executive Board service agreement in February 2019.2) Termination of Executive Board service agreement in May 2019.3) Termination of Executive Board service agreement in February 2020.4) Termination of Executive Board service agreement in March 2019.5) Termination of Executive Board service agreement in December 2019.
In fiscal year 2020, total expenditure for share-based remuneration under the two remuneration systems (i.e., the sum total of the fair value of share-based remuneration awarded in the fiscal year in question as of balance sheet date and the change in fair value in relation to entitlements under share-based remuneration in the fiscal year in question) that was recognized in the consolidated IFRS financial statements amounted to EUR 1,212 thousand for Stefan Klebert (previous year: EUR 2,116 thousand); EUR 747 thousand for Marcus A. Ketter (previous year: EUR 743 thousand); EUR 707 thousand for Johannes Giloth (no grant in the previous year); EUR -19 thousand for Steffen Bersch (2019 and 2020 tranches of the Performance Share Plan and outstanding long-term share components; previous year: EUR 1,058 thousand), EUR -17 thousand for Martine Snels (previous year: EUR 117 thousand); EUR 0 thousand for Jürg Oleas (previous year: EUR 0 thousand); EUR 0 thousand for Dr. Helmut Schmale (previous year: EUR 0 thousand); and EUR 0 thousand for Niels Erik Olsen (previous year: EUR 0 thousand). Further information on the Performance Share Plan and the long-term share price component is outlined in note 6.3.3 of the Consolidated Financial Statements.
Remuneration of former Executive Board members and their surviving dependentsIn fiscal year 2020, former Executive Board members and their surviving dependents received remuneration of EUR 4,977 thousand (previous year: EUR 11,377 thousand) from the GEA Group, of which EUR 4,977 thousand (previous year: EUR 4,708 thousand) were pension payments and EUR 0 thousand (previous year: EUR 6,669 thousand) were severance payments for Executive Board members who left in 2019 and 2020; this is explained in detail in the remuneration report. The GEA Group formed pension provisions (gross value) of EUR 95,145 thousand (previous year: EUR 100,697 thousand) as of December 31, 2020, for former Executive Board members and their surviving dependents, including those who left the Executive Board during the fiscal year 2020. In the year under review, Jürg Oleas exercised his capitalization option with regard to the full pension benefits he was entitled to as of January 1, 2020. The capitalization amount of EUR 8,575,416.00 was paid out in January 2020.
Remuneration of the Supervisory Board members
The remuneration of the Supervisory Board members consists solely of fixed remuneration. It does not include a performance-related component.
In the year under review, the expenses incurred for the Supervisory Board amounted to EUR 1,403 thousand (previous year: EUR 1,389 thousand). Pursuant to section15 (1) of the Articles of Association, each member of the Supervisory Board receives a fixed annual remuneration of EUR 50 thousand payable after the end of each fiscal year, in addition to the reimbursement of their expenses. The Chairman of the Supervisory Board receives two-and-a-half times and his deputy one-and-a-half times this amount. In accordance with section 15 (2) of the Articles of Association, members of the Presiding Committee and the Audit Committee each receive an additional EUR 35 thousand. In accordance with section 15 (2), the members of the Technology Committee each receive an additional EUR 25 thousand. The chair of each committee receives twice the respective amount. No separate remuneration is paid to members of the Mediation Committee or the Nomination Committee. Pursuant to section 15 (5), the members of the Technology Committee are entitled to receive remuneration in the amount stated in paragraph 2 (as amended) from fiscal year 2019 onwards. Members who join or leave the Supervisory Board and/or its committees during the year only receive a pro rata amount for the period of their membership. After the end of the fiscal year – pursuant to section 15 (3) of the Articles of Association – the Supervisory Board members also receive an attendance fee of EUR 1 thousand for each meeting of the Supervisory Board, the Presiding Committee, the Audit
81GEA Annual Report 2020
Remuneration Report

Committee or the Technology Committee they attend. In fiscal year 2020, the Supervisory Board held eight meetings, the Presiding Committee met four times, the Audit Committee convened on nine occasions and the Technology Committee met twice.
The following table shows the individual breakdown of the remuneration and its respective components awarded to members of the Supervisory Board and/or the Presiding Committee, the Audit Committee and the Technology Committee in 2020 compared with the previous year:
(in EUR)
Supervisory Board
remuneration
Presiding Committee
remunerationRemuneration
Audit Committee
Remuneration Technology Committee
Attendance fee Total
Dr. Perlet 125,000 70,000 35,000 – 21,000 251,000
Previous year 125,000 70,000 35,000 – 18,000 248,000
Löw* 75,000 35,000 – – 12,000 122,000
Previous year 75,000 35,000 – – 13,000 123,000
Bastaki 50,000 35,000 – – 12,000 97,000
Previous year 50,000 35,000 – – 12,000 97,000
Eberlein 37,432 – 52,404 – 15,000 104,836
Previous year 50,000 – 70,000 – 12,000 132,000
Gröbel* 50,000 35,000 – – 12,000 97,000
Previous year 50,000 35,000 – – 13,000 98,000
Hall 50,000 35,000 – – 11,000 96,000
Previous year 50,000 35,000 – – 12,000 97,000
Hubert* 50,000 35,000 – 25,000 11,000 121,000
Previous year 50,000 35,000 – 25,000 15,000 125,000
Kämpfert 50,000 – 35,000 – 16,000 101,000
Previous year 50,000 – 35,000 – 12,000 97,000
Kerkemeier* 50,000 – – – 8,000 58,000
Previous year 50,000 – – – 6,000 56,000
Prof. Dr. Köhler 12,568 – 16,257 – 2,000 30,825
Previous year – – – – – –
Krönchen* 50,000 – 35,000 25,000 19,000 129,000
Previous year 50,000 – 35,000 25,000 14,000 124,000
Spence 50,000 – – 25,000 10,000 85,000
Previous year 50,000 – – 25,000 8,000 83,000
Dr. Zhang 50,000 – – 50,000 10,000 110,000
Previous year 50,000 – – 50,000 9,000 109,000
Total 700,000 245,000 173,661 125,000 159,000 1,402,661
Previous year 700,000 245,000 175,000 125,000 144,000 1,389,000
*) The company and the external employee representatives remit their respective remuneration to the Hans Böckler Foundation in accordance with applicable guidelines.
82GEA Annual Report 2020
Remuneration Report

Non-financial Group Statement
Concerning non-financial reporting
Since fiscal year 2016, GEA has been identifying the topics relevant to understanding the company’s economic, environmental and social impact on an annual basis. Alongside its internal perspective, the company also takes into account the expectations and interests of its key stakeholders: investors, employees, customers, suppliers, civil society and regulators. GEA’s sustainability reporting for fiscal year 2020 again follows the international standards set by the Global Reporting Initiative (GRI). The full Sustainability Report for fiscal year 2020 is being published for the first time as a stand-alone report – in addition to this Annual Report – and has been prepared in accordance with the GRI standards: Core option.
In accordance with section 315b (3) sentence 1 of the HGB (Handelsgesetzbuch, German Commercial Code), this “Non-Financial Group Statement” forms part of this Management Report. For the purpose of determining which topics will be covered in the non-financial statement, GEA has taken into consideration the extent to which a specific topic is required for understanding GEA’s business progress, business results and the situation of the company (net assets, financial position and results of operations) pursuant to Section 315c in conjunction with 289c (3) of the HGB. Moreover, disclosures allowing people to gain an understanding of the impact of the company’s activities on non-financial matters must be provided. The following topics meet these requirements:
• Sustainable engineering • Occupational Health and Safety • Greenhouse gas emissions • Compliance, in particular anti-corruption • Protection of personal data • Human rights
In accordance with Section 315c (1) in conjunction with Section 289c (1) of the HGB, GEA’s business model is described in the corresponding section of the Group Management Report under “Fundamental Information about the Group.” This section also forms part of GEA’s non-financial group statement.
In accordance with Section 315c in conjunction with Section 289c (3) no. 3 and 4 of the HGB, GEA is required to report on all known material risks associated with its own business activities, business relations, as well as its products and services, where these are highly likely to have a severe adverse impact on non-financial aspects. No such risks have been ascertained.
At the request of GEA’s Supervisory Board, KPMG AG Wirtschaftsprüfungsgesellschaft reviewed GEA’s non-financial group statement for fiscal year 2020 and performed a limited assurance engagement according to Sections 315b and 315c in conjunction with Sections 289c to 289e of the German Commercial Code (HGB). This review was in line with the International Standard on Assurance Engagements (ISAE) 3000 (Revised): “Assurance Engagements other than Audits or Reviews of Historical Financial Information.”
The subjects covered by non-financial reporting are based on an analysis of the management systems and the data provided by the operational units and competent departments in the Global Corporate Center. The GRI Content Index and disclosures on GEA’s contribution to the UN SDGs (Sustainable Development Goals), the TCFD (Task Force on Climate-related Financial Disclosures) Index, and the SASB (Sustainable Accounting Standards Board) Index can be found in GEA’s separate Sustainability Report, which is available at the corporate website gea.com.
This non-financial group statement comprises the following sections:
• Sustainability management at GEA • Sustainable engineering • Occupational health and safety • Environment • Compliance, governance and supply chain
83GEA Annual Report 2020
Non-financial Group Statement

Materiality analysis 2020
Matters according to the EU CSR Directive
Allocation of relevant fields of action to specific
matters Relevant fields of action Non-financial statement
Environmental matters
• • Greenhouse gas emissions Greenhouse gas emissions
• • Water and effluents
• • Waste
• • • Responsible supply chain
• • Sustainable engineering Sustainable engineering
Employee-related matters
• • Employment
• • Occupational Health and Safety Occupational Health and Safety
• • Compliance including protection of personal data Protection of personal data
Diversity concept*
• • Diversity and Equal Opportunity
Social matters
• Procurement
Respect for human rights
• • • • Supplier Social Assessment Human rights
Anti-corruption and bribery matters
•Compliance, in particular combating corruption
Compliance, in particular combating corruption
• Environmental matters • Employee-related matters • Diversity concept • Social matters • Respect for human rights • Anti-corruption and bribery matters *) includes not only diversity in management but also diversity in the total workforce; for diversity concept, see also “Corporate Governance Statement”.
Sustainability management at GEA
By adopting the policy of “Sustainable Value Creation at GEA”, the Executive Board defined the group’s ambitions and targets in terms of sustainability, incorporating them into GEA’s values and creating a strategic vision that applies globally. It is available at the corporate website gea.com.
Basic principlesThe “GEA Code of Conduct” (see also section “Compliance, governance and supply chain”, subsection “Compliance Management”) outlines the values, principles and policies that guide GEA’s corporate conduct. This Code of Conduct reflects the company’s objective of ensuring group-wide compliance with standards while creating a work environment that rewards integrity, respect, and fair and responsible conduct. The Code of Conduct applies to all employees and bodies of GEA worldwide.
The Code of Corporate Responsibility encompasses both ethical and legal standards that are binding on all group employees worldwide. As a successful international engineering group with more than 18,000 employees and operating activities in more than 50 countries, GEA’s commitment to international fair trade is a crucial factor in achieving global economic growth. GEA fully recognizes the “Guidance on social responsibility” (ISO 26000) and aligns all its actions with the principles of social responsibility as well as the core subjects covered in the guidance.
The Code of Conduct for Suppliers and Subcontractors (see section ”Compliance, governance and Supply Chain”, subsection “Human rights in the supply chain”) outlines GEA’s principles and requirements that must be met by all suppliers of goods and services, their subcontractors, as well as the group entities of the suppliers and subcontractors with regard to their responsibility towards society, the environment and the individuals involved in the production of goods and/or the rendering of services.
84GEA Annual Report 2020
Non-financial Group Statement

OrganizationSince 2019, responsibility for sustainability in the organization lies with the Executive Board and is assigned to the Corporate Responsibility & Quality, Health, Safety & Environment (CR & QHSE) unit. The department reports directly to the Chief Operating Officer of GEA Group Aktiengesellschaft. Sustainability targets are an integral part of the remuneration system of the Executive Board of GEA Group Aktiengesellschaft, see chapter “Remuneration Report.”
The CR & QHSE department is structured as follows:
• The department is made up of the specialist areas Corporate Responsibility, Quality Management, Occupational Health & Safety, Environment & Energy, Certifications & Audits, Travel Security & Health, and QHSE Data Analyst & Projects
• The GEA divisions and some of the major business units within the divisions have their own QHSE organizations
• In addition, each of the GEA regions and the multi-purpose sites (production sites capable of manufacturing several product lines) have their own QHSE function
• A Corporate Responsibility Council – made up of the relevant departments of the Global Corporate Center as well as the CR & QHSE representatives – has been newly founded to ensure the exchange of information across business areas and establish overarching strategic goals and guidelines
• In the 2021 fiscal year, GEA will review and further optimize the organizational integration of its sustainability function in the context of streamlining its strategic focus
Integrated management approach to quality, health, safety at work and the environmentThe “Quality, Health, Safety & Environment (QHSE) Policy” was last revised and updated in August 2019. GEA thus committed itself to pursuing a clear policy in terms of quality, health, safety and the environment. It applies throughout the group and covers the following key points:
• Identification, analysis and effective management of opportunities and risks arising in connection with business operations
• Compliance with all legal and industry-specific requirements, applicable regulations and national standards
• Further development of safe, high-quality and environmentally friendly products and services to safeguard and continuously enhance customer satisfaction and the company’s market presence
• Further development of safe, efficient and environmentally friendly technologies, tools and methods • Creation and continuous development of a safe and healthy working environment for all
employees, business partners and third parties to prevent occupational accidents and diseases • Definition and active pursuit of measures designed to prevent accidents and appropriately manage
emergencies, incidents and their respective impact • Prevention of environmental accidents and pollution • Reduction in CO2 emissions, effluents and waste • Promotion of sustainable and responsible procurement, including avoiding the purchase of conflict
minerals
As an integrated management approach, the QHSE Policy covers all stages in the value creation chain: from the supply chain to internal business practices, including product manufacturing, product service life and the end of the product life cycle.
GEA communicates these corporate standards to all individuals acting for or on behalf of the company, actively involving them in the implementation of this policy. They are displayed at all sites and are available to the public on the corporate website gea.com. CR & QHSE management (see subsection “Organization”) provide regular reports on all of these matters to the Group Works Council and the European Works Council, where they coordinate with the employee representatives.
In addition, there are numerous policies covering specific areas, which are reported on under material topics.
85GEA Annual Report 2020
Non-financial Group Statement

Management system certificationAt GEA, quality management, environmental management, occupational health and safety, and energy management are based on international standards supplemented by GEA-specific standards and regulations, such as the GEA Safety Core Rules, GEA Environmental Core Rules and globally applicable process descriptions (see subsection “Integrated management approach to quality, health, safety at work and the environment” for information on the QHSE Policy). This framework policy, which was developed alongside QHSE experts at the divisional and country level, is implemented in all GEA entities with the support of the global QHSE organizations, independent of any certification. In total, GEA has 180 different ISO management system certificates.
Management system certification is mandatory for production sites. In 2016, GEA began clustering its sites with integrated management systems under the umbrella of a single GEA certificate. GEA Group Aktiengesellschaft, headquartered in Düsseldorf, is certified to ISO 9001:2015, ISO 14001:2015 and ISO 45001:2018 and thus leads the group in the number of certified sites. Certification under ISO 50001:2018 is performed at site level. Unrelated to certification, energy-efficiency measures, energy projects and measuring energy consumption are grouped and performed in cooperation with CR & QHSE. Energy audits under the Energiedienstleistungsgesetz (EDL-G – German Energy Services Act) were performed as planned and the measures identified in the audits implemented.
An external surveillance audit of the umbrella certificate – under ISO 9001, ISO 14001 and ISO 45001 – was performed in the year under review. In total, 18 sites were successfully audited on the basis of random sampling. Due to the rapid developments associated with Covid-19, many of the audits were performed remotely.
As planned, further GEA companies are being brought under the umbrella certificate. To achieve this, a certification plan for the production sites was agreed in cooperation with the divisions and business units. The aim is to cover all production sites with the three management systems ISO 9001, ISO 14001 and ISO 45001 by 2025.
In the year under review, GEA Food Solutions Bakel BV was certified under ISO 14001 and ISO 45001 for the first time, and GEA Westfalia Separator Mexicana S.A. was awarded ISO 9001 certification. In 2020, the certifications within the group were as follows:
Management system
Number of certificates
2020
Number of certificates
2019
Number of certificates
2018
DIN EN ISO 9001:2015 92 89 105
DIN EN ISO 14001:2015 39 38 30
DIN EN ISO 45001:2018 35 30 25
DIN EN ISO 50001:2011/ISO 50001:2018 14 16 17
Total number of certificates 180 173 177
ISO 9001 is the international standard that specifies requirements for a quality management system. Organizations use the standard to demonstrate the ability to consistently provide products and services that meet customer and regulatory requirements. The standard also helps organizations to continually improve their quality management system.
ISO 14001 is the international standard that specifies requirements for an effective environmental management system (EMS). It is part of the ISO 14000 family of standards on environmental management.
ISO 45001 specifies requirements for an occupational health and safety (OH&S) management system, and gives guidance for its use. It was published by the International Organization for Standardization in March 2018.
ISO 50001 specifies requirements for establishing an energy management system. The intended outcome is to allow an organization to continually improve its energy performance.
ESG ratingsThe term “ESG” encompasses criteria from the environmental, social and governance fields.
GEA regularly participates in the annual EcoVadis CSR performance monitoring scheme. According to EcoVadis, the procurement and CSR experts from more than 450 leading multinational corporations worldwide currently rely on the CSR ratings provided by this platform. The current EcoVadis CSR “Silver” rating, with 60 points awarded in 2019, remains valid until 2021.
In the year under review, GEA was awarded an A- (leadership) in the CDP (formerly the “Carbon Disclosure Project”) sustainability rankings. Its overall score puts GEA in the leading group at sector and regional level. “Leadership” level recognizes companies that stand out in areas such as the completeness and transparency of their reporting. GEA was evaluated by CDP in the “water security” category of its sustainability rankings for the first time in 2020, receiving the highest possible leadership level rating (A List) for its responsible water stewardship.
86GEA Annual Report 2020
Non-financial Group Statement

Sustainable engineering
“Engineering for a better world” embodies GEA’s core value proposition. Apart from responsibly shaping its own value creation processes, the company fosters sustainable business practices and contributes to the protection of the natural environment by offering its customers efficient products and process solutions. Reducing water and energy consumption, as well as greenhouse gas emissions, are issues frequently addressed by customers through ambitious targets, for example, achieving climate neutrality or reducing their ecological footprint. However, they not only expect GEA products to help them achieve their sustainability targets. Customers also expect that the cost of a product will allow for efficient production over the product’s entire lifespan.
The sustainability performance of GEA and its products is a major factor in the supplier selection process alongside quality and product security. To ensure the safety of its products, GEA has set up internal product safety committees within its divisions.
OrganizationSince the 2020 fiscal year, GEA’s new organizational structure has included a “Global Technology” unit, which is dedicated to GEA’s strategic focus on technology. Global Technology is headed by the new Chief Technology Officer (CTO), who reports directly to the Executive Board. The unit aims to ensure that GEA’s technology portfolio will continue to keep pace with market trends and customer requirements in the future. Global Technology is divided into four priority areas: innovation, engineering excellence, digitalization and intellectual property rights.
GEA uses product development and innovation – elements of its technology strategy – to navigate the complex range of issues covered by sustainable engineering.
Product development processA single detailed product development process applies across the entire group and is linked to the innovation process. Alongside product functionality and cost-effectiveness, GEA considers sustainability to be a key factor in product and process development, since decisions in the development phase have a lasting impact well beyond company boundaries and must therefore be able to withstand critical scrutiny with regard to sustainability. Consequently, GEA goes beyond product development from a functional perspective and instead takes a holistic approach to innovation. Ecological considerations such as water and energy consumption, waste streams, circular economy and avoiding the use of plastic are thus already taken into account in the specification and concept stage of the development process. In addition to resource efficiency, the fixed design criteria include user health and safety considerations across the entire product life cycle. Regional or industry-specific guidelines and standards, required approvals and test certificates are also taken into account in the process. In GEA’s development process, achievement of the target sustainability effects and their technical parameters is ensured through a system of key performance indicators based on milestones. This integrated development process also ensures that the product life cycle and its peripheral interactions – particularly transport and resource-efficient maintenance – are taken into account. Prior to market launch, prototype design and construction undergo validation. The product development process – as part of the innovation process – is supplemented by a “front-end” from the outset. The overall process is as follows:
Evaluation of customer trends and needs
Generation of product and application ideas
Product/project focus
Technology research
Product concept and project plan
Design development
Test and prototype setup
Preparation of commercial production
Review and go-to-market
FRONT-END FOUNDATION PHASE
PRODUCT DEVELOPMENT
GO-TO-MARKET
87GEA Annual Report 2020
Non-financial Group Statement

GEA innovation processGEA offers a wide range of components, systems and process equipment, whose resource efficiency, flexibility, quality and operating costs are continuously being improved. GEA has defined around 200 core technologies that offer tremendous potential for optimization, including in combination with other technologies.
GEA’s innovation management system comprises its innovation process, the “InnoVate” IT system for generating ideas and allowing them to mature, as well as defined roles and responsibilities for the further development of innovative ideas. The innovation management front-end, i.e. the systematic generation of ideas and feasibility checks, includes tools for problem solving and advancing the number and quality of the ideas put forward, the systematic analysis of market- and technology-driven trends and customer needs, as well as an ideas platform.
Key figures from the innovation processFor gauging the success of the resources allocated to the field of innovation across the entire company, GEA relies on key performance indicators at all stages of the innovation process. At the end of 2020, there were 337 (2019: 324) active ideas or projects in the “front-end” and “foundation” phase, with 148 (2019: 159) future product innovations in the “development” and “go-to-market” phase. Updated figures are provided to the company’s development managers and management boards on an ongoing basis.
Technology strategy and climate footprintGEA’s business decisions, as well as those of its customer industries, are guided by the United Nations Sustainable Development Goals (SDGs). Sustainable industrialization and supporting innovation and sustainable production are therefore essential prerequisites for technological development that meets future generations’ expectations with regard to environmental impact and the use of resources. In the food industry, in particular, sustainable production is becoming increasingly important for consumers. This is one of the reasons why GEA’s food industry customers follow their own strict sustainability strategies, which impacts the supply chain and thus affects GEA as well.
In devising its technology strategy, GEA’s definition of sustainable products and processes goes beyond simply meeting its industrial customers’ demands for cost-effectiveness, efficiency and sustainability. GEA also takes end consumers’ views into consideration – at least indirectly – when making decisions about technology. GEA aims to measure significant criteria such as water and energy consumption, waste streams, circular economy and avoiding the use of plastic through key performance indicators.
GEA uses a “trend radar” to evaluate the contribution made by technology trends or new technologies to its sustainable development goals and their significance for the (future) product portfolio. In addition, GEA reviews the ideas and products against the SDGs during the development process.
Climate change and the finite nature of resources offer considerable opportunities to GEA for the sale of efficient process engineering components and equipment. Due to the wide variety of components and processes and, in particular, the need to gather comprehensive operating data outside the company’s own sphere of influence, it is not possible to obtain concrete global evidence regarding the climate footprint of the entire product and service portfolio during its service life. GEA therefore continued to work on enhancing its climate reporting in 2020. Internal projects to quantify greenhouse gas emissions along the entire value chain (upstream/downstream) are currently underway. A sub-project has been set up to calculate and simulate the climate footprint of GEA products during their service life. The findings are expected in fiscal year 2021.
Sustainable products and projects 2020GEA’s primary objective is to provide solutions that offer outstanding product and process efficiency. “Engineering for a better world” involves minimizing energy use, the conservation of natural resources and a high degree of recyclability (for specific examples see “Fundamental Information about the Group”, section “Research and Development”, and the separate Sustainability Report 2020).
88GEA Annual Report 2020
Non-financial Group Statement

Occupational health and safety
A healthy and safe working environment is a recognized human right and is a requirement for one of the Sustainable Development Goals (“good health and well-being”). GEA gives top priority to occupational health and safety. Above and beyond legal requirements, GEA feels a sense of duty, where possible, to protect its own employees, individuals whose workplaces are controlled by GEA or who work on behalf of GEA, as well as the people working for customers and suppliers. GEA’s QHSE organization (see section “Sustainability management at GEA”) ensures that contracts with customers and suppliers/subcontractors align with the standards set by GEA and include relevant clauses on occupational health and safety as well as the related procedures. This is achieved through standard processes.
Management of the Covid-19 pandemicGEA began receiving information about the coronavirus situation in Wuhan, China, from the travel security services in early January 2020. It immediately provided all relevant details to those traveling to the Wuhan region as well as to local employees. The situation evolved very rapidly, first only in China, where GEA established a local crisis team to be able to respond quickly and appropriately to any changes and provide the best possible protection to GEA employees. Following numerous local measures and travel warnings for China, it became apparent from the rapid spread of the virus in northern Italy in February that Covid-19 had become a global pandemic.
With the support of the Executive Board, a global crisis team was quickly put in place and a task force established to assist local crisis teams at GEA sites through processes and procedures. Together with the specialist risk consultancy Control Risks, draft pandemic response plans were prepared and made available to the local crisis teams to ensure a uniform global approach. All GEA sites and country organizations put together local crisis teams in order to customize and implement their pandemic response plans accordingly.
In addition, a group-wide dashboard was set up to provide the global crisis team with an overview of all current developments at GEA. Information, such as up-to-date case numbers, project delays and supplies of hygiene products, can be checked on the dashboard at any time. This enables GEA’s global crisis team to provide an effective and targeted response to new developments.
Furthermore, during the second half of the year, the local crisis teams were not only tirelessly working on compliance with local laws and protection standards, but also – first and foremost – on protecting employees and ensuring that they have a safe working environment. This ultimately serves to protect the company as a whole. During the pandemic, GEA has also continually provided local support by donating protective masks, e.g. in Italy, Germany and Spain.
To ensure employee safety, canteens were closed at an early stage, including at GEA’s largest site in Oelde, which has around 1,900 employees. To assess the circumstances and safety measures in the event of the potential reopening of canteens, GEA commissioned software partner Dassault Systèmes to simulate the canteen operations in their entirety. A digital twin of the canteen mapped the air currents and the impact of the ventilation system on the transport of potentially contaminated aerosols. The results of the simulation help tailor the hygiene concept, for example by revising the design of the entry and exit, adjusting the seating arrangements and implementing safety measures in the kitchen area.
TargetsDerived from the QHSE Policy (see section “Sustainability management at GEA”, subsection “Integrated management approach to quality, health, safety at work and the environment”), the company again defined and set tangible targets in and for fiscal year 2020 and medium-term targets (up to 2025), with the respective target achievement levels assessed in comparison with the previous year’s results (see the corporate website gea.com), including:
• Lost Day Frequency Rate ≤ 5.6; by 2025: ≤ 5.0 • Lost Day Severity Rate ≤ 120; by 2025: ≤ 110 • Proactive Injury Rate (PAIR) ≥ 100; by 2025: ≥ 200
The long-term target still remains zero accidents. For more information on target achievement levels, see subsection “Management approach and key performance indicators” and the separate Sustainability Report.
89GEA Annual Report 2020
Non-financial Group Statement

Management approach and key performance indicatorsGEA pursues a clear zero-accident strategy. GEA regards accidents and health hazards affecting the workforce as well as the resulting absences, damage to the company’s image and potential penalties or indemnity payments as unacceptable. Its risk management concept applies to all GEA sites worldwide and includes the regular systematic identification and assessment of risks performed on the basis of established procedures; for instance, each GEA company is required to conduct a risk assessment. The respective health and safety experts in the companies advise management teams on the status of occupational health and safety, improvement measures, the occupational health and safety organization, accident statistics as well as the required personal protection equipment. Moreover, GEA also manages risk by means of certifying the sites to ISO 45001 (see overview and number of certifications, section “Sustainability management at GEA”, subsection “Management system certification”), setting clear QHSE Policy targets and continuously enhancing the regional QHSE organizations. At GEA sites, occupational health services are available both to employees and any external staff working there; the confidentiality of medical data is assured. Reviews take place via internal HSE audits, risk assessments and psychological risk assessments performed within the framework of the company’s health management scheme.
In order to be able to more specifically address the causes of accidents, the company also started capturing information on the body parts affected, main causes, nature of the injuries and other detailed information in 2019. This analysis helps the global QHSE team avoid and further reduce accidents.
For instance, employee training on occupational health and safety in Germany mainly takes place within the framework of the annual required UVV training courses. UVV stands for the accident prevention regulations (“Unfallverhütungsvorschriften”) issued by the German workers’ compensation boards (“Berufs genossenschaften”), which set forth the processes for safely operating and handling technical equipment and materials. These accident prevention regulations represent the obligations governing health and safety in the workplace that are binding on all companies and insured individuals. Available in 14 different languages, the “GEA Safety Core Rules” apply worldwide and represent the minimum standards for occupational health and safety. They are available in the GEA Learning Center in the form of online training courses and videos. In addition, there are briefings and checklists for specific hazardous activities or equipment, for instance the use of forklift trucks. Country-specific training courses in line with the respective regulations fall within the remit of the local managing directors or site managers.
The number of accidents declined significantly compared with the previous year (down 4.8 percent). With approximately the same number of hours worked, GEA’s 2020 Lost Day Frequency Rate went down to 5.39 (previous year: 5.63) accidents per million hours worked. In the year under review, a total of 219 accidents (previous year: 230) were reported, with 248 sites – i.e. 73 percent of the 340 GEA sites included in the survey – remaining without accidents that entail a period of absence (previous year: 76 percent). There was one accident at work that resulted in a death in 2020, in Singapore (previous year: none). The Lost Day Severity Rate declined to 115.32 days lost following accidents per million hours worked (previous year: 126.63). This means that accidents entailed shorter periods of absence overall. As outlined above, the company’s 2020 targets for health and safety at work (Lost Day Frequency Rate < 5.6, Lost Day Severity Rate < 120) were achieved. Fewer near misses were reported due to the coronavirus pandemic; accordingly, the target proactive injury rate of ≥ 100 was not achieved.
The company will continue to consistently implement its precautionary approach in the field of occupational health and safety: For the purpose of detecting potential risks and hazards early on and preventing accidents, GEA has recorded and analyzed near misses worldwide since 2017. In the same way as actual accidents, near misses at GEA are analyzed and there is a targeted follow-up process with defined responsibilities and a specific set of actions. This process helps to achieve the zero-accident target.
On occupational health and safety in the supply chain, see section “Compliance, governance and supply chain”, subsection “Quantifying impacts in the supply chain.”
90GEA Annual Report 2020
Non-financial Group Statement
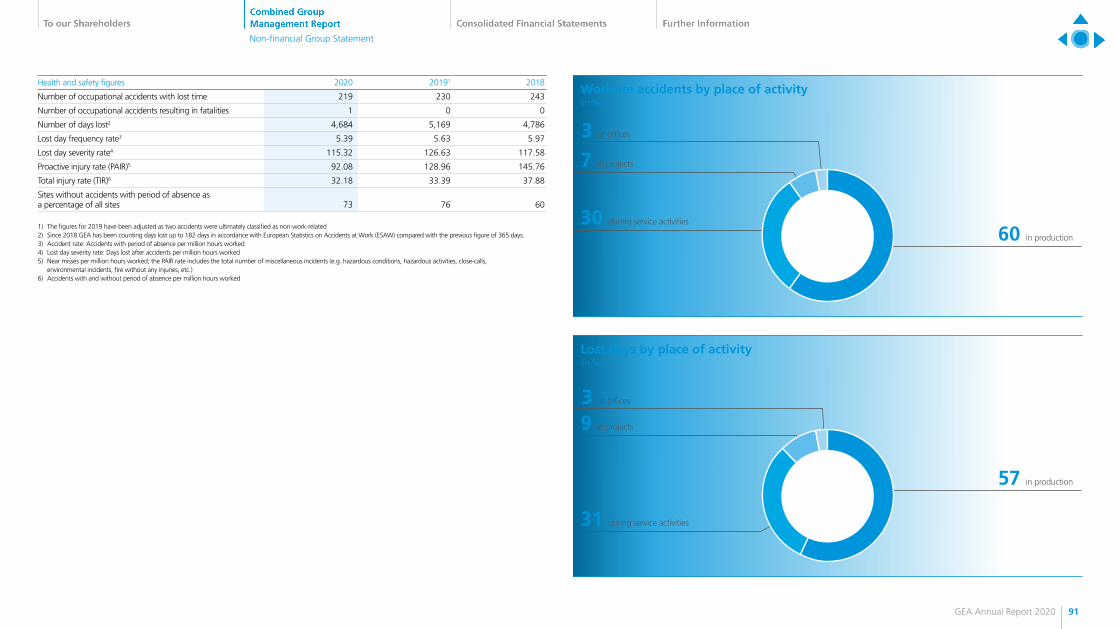
Health and safety figures 2020 20191 2018
Number of occupational accidents with lost time 219 230 243
Number of occupational accidents resulting in fatalities 1 0 0
Number of days lost2 4,684 5,169 4,786
Lost day frequency rate3 5.39 5.63 5.97
Lost day severity rate4 115.32 126.63 117.58
Proactive injury rate (PAIR)5 92.08 128.96 145.76
Total injury rate (TIR)6 32.18 33.39 37.88
Sites without accidents with period of absence as a percentage of all sites
73 76 60
1) The figures for 2019 have been adjusted as two accidents were ultimately classified as non-work-related2) Since 2018 GEA has been counting days lost up to 182 days in accordance with European Statistics on Accidents at Work (ESAW) compared with the previous figure of 365 days.3) Accident rate: Accidents with period of absence per million hours worked4) Lost day severity rate: Days lost after accidents per million hours worked5) Near misses per million hours worked; the PAIR rate includes the total number of miscellaneous incidents (e.g. hazardous conditions, hazardous activities, close-calls, environmental incidents, fire without any injuries, etc.)6) Accidents with and without period of absence per million hours worked
Worksite accidents by place of activity(in %)
3 at offices
60 in production
7 in projects
30 during service activities
Lost days by place of activity(in %)
3 at offices
57 in production
9 in projects
31 during service activities
91GEA Annual Report 2020
Non-financial Group Statement

Managing serious incidents, learning processSerious incidents such as fatal and severe accidents, fires and explosions as well as environmental and security incidents are reported to the competent employees within the organization by means of the “Serious Events Reporting System.” This also captures accidents sustained by individuals not employed by the company but whose work and/or workplace is nonetheless controlled by GEA. This allows GEA to respond as quickly as possible to such events, minimize their impact and promptly initiate investigations into the respective incidents. Afterwards, a dedicated lessons-learned process is launched; its findings are also used proactively to prevent risks, identify measures for improvement and communicate them to the organization. This reporting system also includes incidents connected to GEA products and plants. Such incidents are recorded and investigated regardless of whether the incident was caused by one of GEA’s products or plants. For this purpose, a group-wide reporting platform is in place to ensure that the established reporting channels are used.
92GEA Annual Report 2020
Non-financial Group Statement

Environment
Environmental managementGEA is vigilant about mitigating adverse environmental impacts when it comes to its own business activities (see section “Sustainability management at GEA”, subsection “Integrated management approach to quality, health, safety at work and the environment”). Derived from the QHSE Policy, the company again defined and set tangible targets in and for fiscal year 2020, medium-term targets (up to 2025) and long-term targets (up to 2050), with the respective target achievement levels assessed in comparison with the previous year’s results (see the corporate website gea.com), including:
• An annual target of reducing water consumption by 2.1 percent per EUR 1 million revenue compared to the previous year – i.e. by 13.8 percent by 2025 and 49.3 percent by 2050 (base year 2018)
• An annual target of reducing waste by 2.1 percent per EUR 1 million revenue compared to the previous year – i.e. by 13.8 percent by 2025 and 49.3 percent by 2050 (base year 2018)
• An annual target of reducing greenhouse gas emissions (Scope 1 and 2 (market-based)) by 2.1 percent compared with the previous year in line with revenue – i.e. by 19.1 percent by 2025 and 52.4 percent by 2050, compared with the base year 2015
For more information on target achievement see subsection “Greenhouse gas emissions”. On environmental responsibility in the supply chain, see section “Compliance, governance and supply chain”, subsection “Quantifying impacts in the supply chain.”
For this purpose, GEA has produced five simple environmental core rules – in 14 languages – that are explained in a practical manner and accompanied by implementation guidelines:
• Avoid unnecessary energy consumption • Avoid unnecessary water consumption • Minimize waste • Avoid or reduce emissions • Adequately and promptly respond to adverse environmental impacts
The sustainability figures are gathered and consolidated by the relevant sites (primarily service and production sites) using the globally available corporate sustainability software so that they can be monitored and reviewed on an ongoing basis. Preconfigured dashboards show the current status and make it easier to identify any discrepancies or irregularities. This enables those responsible at the local level to act quickly to implement any corrective measures required.
Greenhouse gas emissionsSince 2017, GEA has disclosed the relevant data for the respective year under review that is audited by KPMG in accordance with ISAE 3000. The data is available from the base year 2015. In addition, starting in 2018, GEA changed the way it presents CO2 equivalents across all three scopes to a regional level as required by the CDP. The data series comprises the years 2018 to 2020. In 2020, GEA measured the greenhouse gas emissions of its 83 largest sites, comprising production, service and administration.
As of fiscal year 2019, for countries in which energy supply companies can provide reliable fuel mix data, GEA has reported the market-based CO2 equivalents (under Scope 2), calculated based on this data. In the year under review, a market-based calculation was performed for 31 sites in seven countries (Belgium, Denmark, Germany, France, New Zealand, Austria and Spain).
Across the globe, the key figures for energy consumption are collected using a standardized system and reported as follows:
• Scope 1 – Direct Greenhouse Gas Emissions: GEA includes fuel emissions from fuel oils, various gases, diesel and gasoline
• Scope 2 – Indirect Greenhouse Gas Emissions: GEA reports emissions from electricity, heat, steam and cooling (site-related in accordance with IEA conversion factors and/or market-based)
• Scope 3 – Other Indirect Greenhouse Gas Emissions: Currently, this category only includes reporting on business travel; see also subsection “Outlook: Enhanced climate reporting”
• Intensity – Ratio of greenhouse gas emissions to GEA’s revenue
Further information on the method used for calculating greenhouse gas emissions in 2020 is outlined on the corporate website at gea.com under “Explanatory notes to environmental reporting”. Apart from market-based figures, the figures presented are in line with the conversion factors stated in the GHG Protocol/IEA Ver. 14 (11/2020) – IEA 2020.
93GEA Annual Report 2020
Non-financial Group Statement
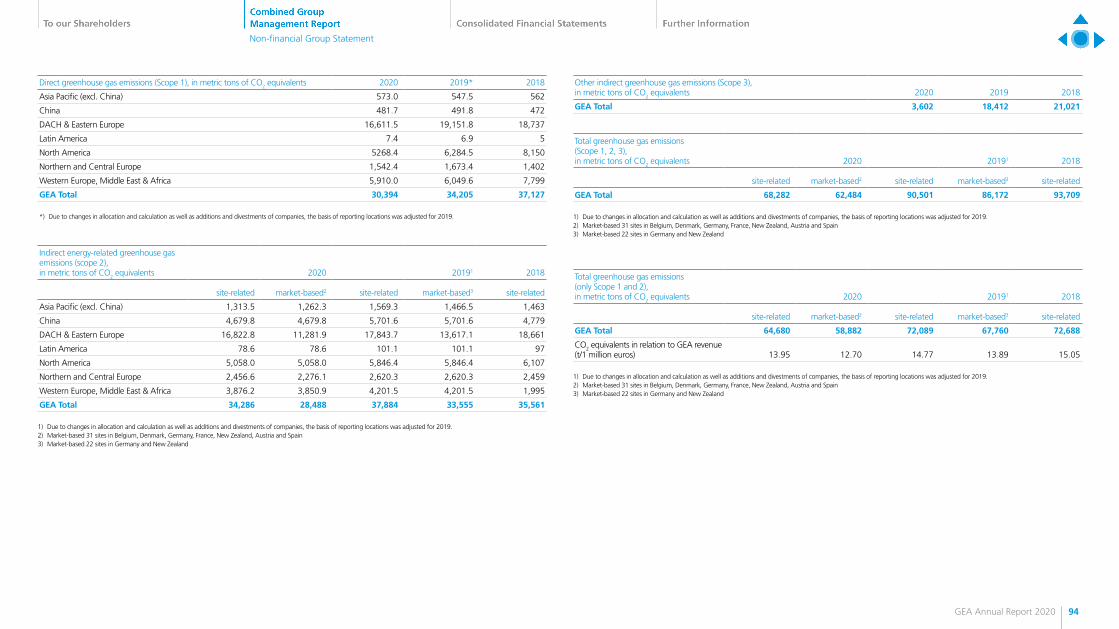
Direct greenhouse gas emissions (Scope 1), in metric tons of CO2 equivalents 2020 2019* 2018
Asia Pacific (excl. China) 573.0 547.5 562
China 481.7 491.8 472
DACH & Eastern Europe 16,611.5 19,151.8 18,737
Latin America 7.4 6.9 5
North America 5268.4 6,284.5 8,150
Northern and Central Europe 1,542.4 1,673.4 1,402
Western Europe, Middle East & Africa 5,910.0 6,049.6 7,799
GEA Total 30,394 34,205 37,127
*) Due to changes in allocation and calculation as well as additions and divestments of companies, the basis of reporting locations was adjusted for 2019.
Indirect energy-related greenhouse gas emissions (scope 2), in metric tons of CO2 equivalents 2020 20191 2018
site-related market-based2 site-related market-based3 site-related
Asia Pacific (excl. China) 1,313.5 1,262.3 1,569.3 1,466.5 1,463
China 4,679.8 4,679.8 5,701.6 5,701.6 4,779
DACH & Eastern Europe 16,822.8 11,281.9 17,843.7 13,617.1 18,661
Latin America 78.6 78.6 101.1 101.1 97
North America 5,058.0 5,058.0 5,846.4 5,846.4 6,107
Northern and Central Europe 2,456.6 2,276.1 2,620.3 2,620.3 2,459
Western Europe, Middle East & Africa 3,876.2 3,850.9 4,201.5 4,201.5 1,995
GEA Total 34,286 28,488 37,884 33,555 35,561
1) Due to changes in allocation and calculation as well as additions and divestments of companies, the basis of reporting locations was adjusted for 2019.2) Market-based 31 sites in Belgium, Denmark, Germany, France, New Zealand, Austria and Spain3) Market-based 22 sites in Germany and New Zealand
Other indirect greenhouse gas emissions (Scope 3), in metric tons of CO2 equivalents 2020 2019 2018
GEA Total 3,602 18,412 21,021
Total greenhouse gas emissions (Scope 1, 2, 3), in metric tons of CO2 equivalents 2020 20191 2018
site-related market-based2 site-related market-based3 site-related
GEA Total 68,282 62,484 90,501 86,172 93,709
1) Due to changes in allocation and calculation as well as additions and divestments of companies, the basis of reporting locations was adjusted for 2019.2) Market-based 31 sites in Belgium, Denmark, Germany, France, New Zealand, Austria and Spain3) Market-based 22 sites in Germany and New Zealand
Total greenhouse gas emissions (only Scope 1 and 2), in metric tons of CO2 equivalents 2020 20191 2018
site-related market-based2 site-related market-based3 site-related
GEA Total 64,680 58,882 72,089 67,760 72,688
CO2 equivalents in relation to GEA revenue (t/1 million euros) 13.95 12.70 14.77 13.89 15.05
1) Due to changes in allocation and calculation as well as additions and divestments of companies, the basis of reporting locations was adjusted for 2019.2) Market-based 31 sites in Belgium, Denmark, Germany, France, New Zealand, Austria and Spain3) Market-based 22 sites in Germany and New Zealand
94GEA Annual Report 2020
Non-financial Group Statement

Compared with 2019, greenhouse gas emissions from GEA’s business operations were lower, with revenue down slightly compared to the prior year. The Covid-19 situation and energy efficiency optimization initiatives at GEA’s sites had a positive impact and led to a reduction in emissions of CO2 equivalents across all scopes. Overall, in 2020, GEA was able to reduce its greenhouse gas emissions both in absolute terms and in relation to revenue. In the year under review, GEA therefore exceeded the target agreed with the Executive Board of reducing Scope 1 and 2 (market-based) CO2 emissions by 2.1 percent in relation to revenue: This decrease amounted to 8.5 percent when calculated on a market basis.
Compared to the base year 2015, the market-based decline was 29.3 percent - putting GEA ahead of its target for 2025 (19.1 percent reduction) today already.
In absolute terms, greenhouse gas emissions (scopes 1 and 2 market-based) decreased by 13.1 percent compared with the previous year.
CDP RatingAs in previous years, GEA again participated in the sustainability rankings of CDP (formerly the Carbon Disclosure Project) in 2020 and confirmed the prior year’s excellent result. CDP is an independent nonprofit organization, which currently represents more than 500 institutional investors. Each year, it gathers information on the specific greenhouse gas emissions of major listed companies and their strategies to combat climate change. The results are then made available to current and potential investors. As part of this survey, GEA regularly provides information on the organizational framework, global targets, policies and programs, the risks and opportunities relating to climate change, as well as the action it has taken in the field of climate protection; this information is also fully accessible to GEA’s customers. In the year under review, GEA was awarded an A- (leadership) in the CDP sustainability rankings. The confirmed overall score of A- puts GEA in the leading group at sector and regional level. “Leadership” level recognizes companies that stand out in areas such as the completeness and transparency of their reporting.
Outlook: Enhanced climate reportingGEA continued to work on enhancing its climate reporting in 2020, and internal projects to quantify greenhouse gas emissions along the entire value chain (upstream/downstream) are currently underway. For information about greenhouse gas emissions in the supply chain, see section “Compliance, governance and supply chain”, subsection “Quantifying impacts in the supply chain.” A project is underway to calculate the climate footprint of the logistics and service life of GEA products. The findings are expected in fiscal year 2021.
Detailed information on the subject of the environment can be found in the separate Sustainability Report.
95GEA Annual Report 2020
Non-financial Group Statement

Compliance, governance and supply chain
All stakeholder groups expect GEA to provide a safe working environment, effective and innovative products, appropriate shareholder value and safe investments, value generation both within and outside of the company, and social engagement.
Proper conduct is an essential part of this. Corporate governance represents a key factor in the effort to sustainably generate added value and permeates to every area of the group’s day-to-day activities.
Compliance managementCompliance represents a group-wide principle established to ensure adherence to the rule of law as well as internal corporate policies. All GEA employees are required to ensure that there are no compliance violations in their respective areas of responsibility. A detailed outline of GEA’s Compliance Management System can be found in the chapter “Corporate Governance Statement” and at the corporate website gea.com.
To avoid the serious consequences of potential compliance breaches, GEA manages these risks by means of a compliance management system designed for the purposes of analysis, information and clarification, control, process definition, and monitoring. This system was updated in the year under review. The appropriateness and implementation of the compliance management system for the subareas of anti-corruption and antitrust law was audited in accordance with IDW PS 980 as of the reporting date at December 31, 2018; it was certified on January 29, 2019. In addition, there is a certified reporting system (“Business Keeper Monitoring System”, BKMS). The management approach is verified via internal and external audits conducted by Group Internal Audit and/or external auditors.
Compliance handbookA Code of Conduct and related compliance policies consisting of the Integrity Policy, Third Party Policy and Competition Policy – together forming the Compliance Handbook – apply within the group. These policies govern anti-corruption and anti-money-laundering, conflicts of interest as well as antitrust and competition law at GEA. They are available to all employees worldwide in 18 different languages. Further details can be found in the chapter “Corporate Governance Statement”.
Preventive processesProcesses designed to prevent compliance violations play a major role in GEA’s compliance management system. For this reason, individuals in close contact with customers, such as sales agents, must undergo a strict risk vetting process for anti-corruption purposes prior to entering into a contract with GEA. Each sales agent contract requires prior verification and approval by the legal department. Numerous other matters, such as contracts carrying antitrust risks, invitations and gifts, conflicts of interest, or sponsorship and donations are subject to strict internal approval and reporting requirements. To meet these approval and reporting obligations, GEA has introduced various IT tools that make it possible to document the relevant issues in audit-compliant format.
In 2020, GEA installed a structured system to identify hypothetical compliance risks (Compliance Risk Assessment). Using this system, compliance risks are analyzed on a continuous basis and, where necessary, additional measures are introduced to mitigate the risks at the companies concerned.
Training and consultingGEA has identified more than 4,000 employees that are exposed to particular compliance risks. In the context of anti-corruption and antitrust law, this group includes all managers, all employees entrusted with sales or purchasing tasks as well as other employees vested with decision-making powers and in direct contact with customers or suppliers. These employees should receive face-to-face training in the fields of anti-corruption and antitrust law at least once every two years. Face-to-face training means that the person delivering the training and those receiving the training participate at the same time; this may be in the form of physical attendance at a lesson or through online media.
96GEA Annual Report 2020
Non-financial Group Statement
Compliance training was again carried out throughout the year under review:
• Compliance training courses comprise extensive group training in topics such as anti-corruption and anti-money-laundering, antitrust law as well as conflicts of interest. In 2020, the 2018/2019 training initiative was completed with 1,968 e-learning training units and 27 face-to-face training units
• As part of the 2020/2021 training initiative for compliance e-learning courses focusing on anti-corruption, antitrust, money laundering and data protection, anti-trust law, money laundering and data protection, 4,585 training units have already been completed
A Compliance Executive within each division is responsible for ensuring implementation of GEA’s compliance requirements. Compliance Managers are appointed for all legal entities whose units operate and manage their own business, i.e. generate revenue and/or have employees. These compliance regulators receive training on anti-corruption, anti-money-laundering and antitrust matters, as well as other subjects. They serve as points of contact for local compliance issues and assist the compliance department with its duties. Where necessary, the Compliance Executives and Compliance Managers are advised and supported by divisional Compliance Officers, who are part of to the global GEA Legal and Compliance Department.
AuditsAs part of its standard and special audits, Group Internal Audit also checks certain aspects of compliance. In the year under review, a total of 20 audits were performed at GEA entities worldwide. Due to the coronavirus pandemic, a number of the audits were carried out remotely or by expert third parties on site. Group Internal Audit is tasked with protecting corporate assets, verifying process efficiency and compliance, as well as checking the completeness of documentation. This also includes compliance audits in the fields of anti-corruption and export control. In the year under review, Internal Audit performed additional audits focusing on the risk management system at GEA Group.
Compliance with laws and regulations in the social and economic sphereIf employees breach compliance rules, they are penalized according to the degree of fault and severity of the violation. The sanctions imposed range from a reprimand to a warning letter to, ultimately, termination of employment. In particularly severe cases, GEA reserves the right to sue the person in question for damages and/or report the violation to the competent authority.
GEA expects all employees to report any signs of compliance violations. Managers must ensure that serious misconduct, particularly in the areas of corruption, competition law and data protection, is reported to Global Corporate Center Legal & Compliance.
In the 2020 fiscal year, no significant fines and non-monetary sanctions for non-compliance with laws and/or regulations in the social and economic area were imposed on GEA.
Integrity system and alternative reporting channelsGEA’s integrity (whistleblower) system is a tool designed to ensure compliance with the Code of Conduct. It is available to employees and third parties in nine different languages and makes it possible to submit IT-based reports of potential violations of laws and rules governing the prevention of corruption and the restriction of competition. Such reports may remain anonymous in countries where permitted by law. Only selected employees of the “Compliance and Principle Legal Matters” department and members of the Internal Audit team may access reports on corruption and competition restrictions. GEA’s Integrity System also allows for reports on potential human rights violations (category: violation of the principles of social responsibility under the Code of Corporate Responsibility) being filed (see subsection “Human rights/grievance mechanism”).
Employees and third parties may also use other channels to report alleged violations. For example, GEA receives reports submitted by email or letters addressed to the Executive Board, members of the compliance organization or the Head of Internal Audit. It is common practice and stipulated in a guideline that the recipient promptly pass on such reports to dedicated members of the compliance organization.
97GEA Annual Report 2020
Non-financial Group Statement
Tax complianceGEA recognizes that the subject of taxation is a key component of responsible corporate governance through which organizations contribute to the economies of the countries in which they operate. GEA follows a well-defined and transparent tax strategy, with profits taxed in the countries in which they arise; see chapter “Corporate Governance Statement”.
Protection of personal dataFor an innovative, global enterprise like GEA, information and its use are of significant importance in accomplishing corporate goals. GEA protects the privacy of every individual whose personal data it processes. This includes employees, customers, suppliers, other contracting partners as well as job applicants and applies to all GEA companies and specialist departments that handle personal data. Data privacy violations may entail considerable penalties and even result in fines and imprisonment in some countries. The EU General Data Protection Regulation (GDPR), which entered into force on May 25, 2018, specifies that such violations may be punished by fines of up to four percent of group revenue. In addition, violations could lead to exclusion from public contracts. Ultimately, privacy violations could damage GEA’s reputation over the long-term. GEA therefore requires adherence to data protection regulations and reserves the right to take action against anyone who fails to comply with data protection laws. Such actions may include, for example, disciplinary measures or claims for damages.
The company’s Data Protection Policy, which was introduced in 2019, sets forth guidelines and conduct recommendations for all employees with a view to avoiding data privacy incidents or violations. It forms part of GEA’s global compliance principles and is supplemented by classroom-based training for employees working in sensitive areas as well as e-learning for all employees with a user account. The corresponding data management system was also introduced in 2019. This system covers all organizational aspects, i.e. the roles, tasks and responsibilities related to the processing of personal data, regardless of the type of individuals affected (including employees, customers, suppliers, shareholders, etc.) or the technical means of processing such data. It also includes additional channels for reporting risks and violations; GEA already complies with the legally required short response times.
Compliance with data protection requirements and the applicable data protection laws is reviewed on a regular basis. These reviews are performed by the company’s data protection officers and other business units with audit rights, or by external auditors engaged for this purpose. Third-party suppliers are reviewed by means of self-declarations, audits and certifications. By December 31, 2020, more than 3,000 relationships with suppliers and subcontractors had been reviewed with regard to data protection compliance. 552 suppliers and subcontractors had their contracts amended to ensure compliance with the GDPR. During the period 2020/21, an independent auditor will review the appropriateness of the data protection management system in accordance with audit standard IDW PS 980. The review will cover processes, key performance indicators and target achievement.
GEA also has a Group Data Protection Officer who coordinates and supports data protection initiatives across the group as a whole. The Group Data Protection Officer also reports directly to the Executive Board.
98GEA Annual Report 2020
Non-financial Group Statement

Human rightsThe Federal Republic of Germany declared its support for the United Nations Guiding Principles on Business and Human Rights in 2013 and thus adopted the German National Action Plan on Business and Human Rights (NAP) in 2016. This entails an expectation that all companies take responsibility for human rights in their global supply and value chains. Since 2018, 50 percent of all companies with more than 500 employees have been annually audited to check their adherence to the specific requirement to implement duty of care with regard to human rights. The duty of care comprises the following elements:
Policy statement on the respect of
human rights
Procedures for identifying actual and
potential adverse impacts on human rights
Measures to avoid potential adverse impacts
and review of efficacyReporting
Grievance mechanism
Management approach/Policy statement on the respect of human rightsAs a first step, GEA implemented its Code of Corporate Responsibility (see section “Sustainability management at GEA”, subsection “Basic principles”) in 2019 as a globally binding set of group regulations in an increasingly complex business environment. This Code of Corporate Responsibility sets out GEA’s values in accordance with ISO 26000 and includes fundamental rules to be implemented. In this document, GEA undertakes to respect human rights, without compromise: “GEA respects universal human rights and supports its compliance with its regional impact and its business partners.” To further strengthen its stance on human rights, the Executive Board of GEA Group Aktiengesellschaft implemented guidelines on human rights in the year under review. These guidelines underpin GEA’s unwavering respect of human rights, as well as fair, sustainable and environmentally sound business practices. The requirements apply to GEA’s own employees as well as its conduct in respect of suppliers and subcontractors in the value chain. These guidelines are based on the International Bill of Human Rights, consisting of the Universal Declaration of Human Rights, the International Covenant on Civil and Political Rights and the International Covenant on Economic, Social and Cultural Rights, the International Labor Organization (ILO) Declaration on Fundamental Principles and Rights at Work, the principles of the United Nations Global Compact and the UN Guiding Principles on Business and Human Rights, and the OECD Guidelines for Multinational Enterprises. Furthermore, the group-wide compliance management system and GEA’s corporate values require all employees to apply the principles of fairness and respect at work in their conduct toward colleagues, business partners and members of the community. Human rights are thus an essential component of responsible corporate governance.
GEA opposes any kind of forced labor and prohibits child labor. With regard to child labor, the “Workday” human resource management system is regularly checked for employees under the age of 18. At the end of the year, 53 employees were younger than 18. In general, these were trainees in Germany. GEA has no employees under the age of 16. In addition, the Code of Corporate Responsibility acknowledges the right to a fair living wage/remuneration. GEA also opposes violence in any form.
99GEA Annual Report 2020
Non-financial Group Statement

The Code of Corporate Responsibility is provided to all group employees as a hard copy and/or made available electronically. All employees have the right to address or object to issues, problems or violations in connection with the agreed principles without fear of disadvantage or penalty. Employees and third parties may use the whistleblower system or – at their discretion – report to the signatories, namely the Executive Board, the Group Works Council and the European Works Council.
Online training on business ethics as well as responsible and nondiscriminatory behavior is available to all employees worldwide through GEA’s Learning Center.
Procedures for identifying actual and potential adverse impacts on human rightsTo ensure and monitor adherence to the Code of Corporate Responsibility and the compliance rules, GEA reorganized its risk analysis process in the year under review. Risk analysis is currently being integrated into the existing Compliance Risk Assessment system. This defines a standard process through which the number of GEA sites to be audited in detail (site audit) is determined annually. The aim is to conduct an in-depth audit of more than 30 sites each year. Sites not currently audited must present a corresponding status report on the subject of human rights every year. A tool is used to systematically conduct and evaluate the risk analysis; completeness is also verified. To actively counter the risk of human rights violations, GEA put together a training package on the subject of human rights and ethical principles in the year under review. This was made available as an online training program at the end of the year. Participation is mandatory for the specified group.
Measures to avoid potential adverse impacts and review of efficacyTo avoid any potential negative impact, GEA intends to implement measures derived from the findings of the site-based risk analysis both throughout the group and in its supply chain. In the future, a team made up of members from the Corporate Responsibility & QHSE and the Legal & Compliance departments will analyze the findings of the audits conducted and surveys received, and collate any risks identified. Together with those responsible at the respective sites, corresponding measures will then be devised to avoid the potential negative impact. Implementation will then be overseen by Corporate Responsibility & QHSE and reviewed during the next regular risk analysis. The process is defined internally, documented accordingly and will be conducted for the first time in 2021.
ReportingIn the future, the findings of the due diligence audit will be transparently reported in the Annual/Sustainability Report and at the corporate website gea.com as soon as the results of the enhanced 2021 risk analysis are available. Internally, the issue of human rights will be included in the Corporate Responsibility & QHSE department’s reporting and made available to employees on the intranet. Active communication with employees will also be ensured through the introduction of the new guidelines on human rights, the CR & QHSE organization, and internal communication channels.
Grievance mechanismSince 2014, GEA has offered its employees – and third parties – a secure portal for reporting violations in the form of the certified Business Keeper Monitoring System (BKMS) (see subsection “Compliance management”).
This integrity system includes selected reporting categories that represent a specific risk for the company, its employees and all other stakeholder groups. These categories include corruption, fraud and breach of trust, money laundering, as well as violations of antitrust and competition law, export control regulations, data protection and accounting regulations. Breaches of the Code of Social Responsibility are covered by a distinct reporting category, which also includes reports on potential human rights violations.
100GEA Annual Report 2020
Non-financial Group Statement

GEA’s integrity system is available worldwide 24/7 in nine different languages and may be accessed from any PC connected to the Internet. The information technology used by the external provider ensures whistleblower protection and confidentiality. Subject to their respective remits, only a very limited number of GEA employees from Compliance, Internal Audit and Human Resources have access to the reports submitted. All reports received are treated confidentially for the protection of both the whistleblower and the accused. Should the whistleblower prefer to submit their report anonymously, they may do so, provided that it is permitted to do so in their respective country.
The system ensures that all steps involved in processing and resolving the reported cases are properly documented. When an incident is reported using the integrity system, this report is assigned to the relevant department (e.g., HR), which investigates the relevant facts in order to arrive at a conclusion. If it proves impossible to ultimately clarify the circumstances without obtaining additional information that could compromise the whistleblower’s anonymity, the whistleblower is contacted by one of the above departments to find out whether they wish further investigation to proceed. The competent departments clarify specific individual incidents and consider whether enhanced communication or employee management, procedural changes, or the use of software could help avoid such cases in the future.
In the year under review, three reports that fall within the remit of Human Resources were entered in the BKMS. Issues including management conduct, communication style and employee interactions were addressed.
SMETA (Sedex Members’ Ethical Trade Audits)GEA works closely with selected customers to define the sites to undergo a SMETA audit. In the year under review, the Covid-19 pandemic caused delays and no new external SMETA audits were carried out at GEA sites beyond the six audits already available. SMETA, the Sedex Members’ Ethical Trade Audit, outlines an audit procedure based on best practice in the field of corporate social responsibility. It takes into account respect for human rights, health and safety, environmental sustainability, and business integrity. At the same time, SMETA defines a uniform reporting format to ensure that the information provided is meaningful and allows comparability. Each audit report is entered into the Sedex (Supplier Ethical Data Exchange) database. According to Sedex, this international platform has more than 60,000 members from 180 countries and 35 industries and seeks to support enterprises in the fields of supplier management and risk mitigation.
Human rights in the supply chainGEA expressly requires its business partners to apply the values and rules set out in the Code of Corporate Responsibility in all material respects. To ensure compliance with these rules along the entire value chain, GEA has adopted its own Code of Conduct for Suppliers and Subcontractors. GEA practices a zero-tolerance policy with regard to unethical business conduct, in particular bribery, corruption, money laundering, or child and forced labor. The supplier registration process requires that suppliers agree to comply with GEA’s dedicated Code of Conduct for Suppliers and Subcontractors, which was published and implemented in 2018. GEA’s Code of Conduct sets forth the principles and requirements that are to be met by all suppliers of goods and services, their subcontractors as well as the group entities of the suppliers and subcontractors with regard to their responsibility towards society, the environment and the individuals involved in the production of goods and the rendering of services. These obligations include the recognition of the ISO 26000 Guidance on Social Responsibility, compliance with international standards, respect for human rights – including the prohibition of child and forced labor as well as discrimination – fair wages and working hours, freedom of association, and occupational health and safety.
101GEA Annual Report 2020
Non-financial Group Statement
Furthermore, the Code of Conduct lays down obligations to engage in environmentally sound business practices, fair competition, respect data protection, protect intellectual property, and comply with foreign trade acts as well as the ban on corruption, bribery and money laundering. When GEA becomes aware of or suspects violations of the Code of Conduct – and notifies the relevant supplier accordingly – GEA expects the supplier to investigate and resolve any such noncompliance issues as quickly as possible and within an agreed time frame. If the supplier is unwilling to rectify such issues, GEA reserves the right to take legal steps, from claiming, pursuing and enforcing corrective measures to the full termination of the business relationship.
In the year under review, the company conducted a total of 269 supplier audits (previous year: 426); this decrease was attributable to the Covid-19 travel restrictions. Of these, 73 new suppliers were audited (previous year: 38). 127 suppliers were audited in relation to negative social/environmental impacts (previous year: 160). GEA performs these evaluations by means of supplier visits, audits and self-declarations, which are undertaken by the Category Management of the purchasing organizations, country organizations, the divisions and the CR & QHSE department.
All purchases (direct and indirect expenses) are covered by the Code of Conduct. Suppliers must accept the Code of Conduct in order to complete purchases that exceed the following threshold amounts specified in the Third Party Policy: EUR 2,500 for individual orders, EUR 10,000 for longer-term contracts. GEA approves a supplier when the Code of Conduct for Suppliers and Subcontractors is an integral part of a supplier agreement. It is the ongoing responsibility of the purchasing organization to inform all GEA companies and all purchasing managers in all regions and divisions of their responsibility for implementing the Code of Conduct for Suppliers and Subcontractors according to the specified process. Acceptance of the Code of Conduct by a supplier or subcontractor must be documented in all cases. If a supplier declines to accept to the Code of Conduct, the relevant supplier must promptly submit a written statement in which they detail and specify the basic principles/commitments to which they adhere. This statement requires the approval of the local GEA legal/compliance officer. GEA regularly reviews adherence to the Code of Conduct for Suppliers and Subcontractors as part of regular supplier audits.
Suppliers in countries carrying risks for human rightsThe risk analysis process designed to counter human rights risks (see subsection “Procedures for determining actual and potential negative impact on human rights”) also includes a procedure for suppliers and contractors.
Although GEA in general seeks to ensure full compliance with the Code of Conduct for Suppliers and Subcontractors, the human rights situation in some countries calls for special attention. Based on a multi-index approach, GEA currently rates 27 countries with existing purchasing volumes as critical. For this purpose, the company combines the assessments of four well-known indices:
• “Freedom in the World”, published by Freedom House, an American nongovernmental organization • “Index of Economic Freedom”, published by the Heritage Foundation and The Wall Street Journal • “Press Freedom Index”, published by Reporters Without Borders • “Democracy Index”, published by the Economist Intelligence Unit (EIU), a private company based in
the UK
In its assessment, GEA also takes into account the OECD membership of the countries with the lowest score in at least one of the four indices. In terms of value, GEA sources approximately nine percent of its total purchasing volume from human rights priority countries. All suppliers and subcontractors that account for this critical volume have accepted the Code of Conduct. Once this is achieved, regular audits with a special focus on compliance with human rights in these countries are planned.
Conflict mineralsUnder the Code of Conduct for Suppliers and Subcontractors, GEA Group Aktiengesellschaft and its subsidiaries undertake to only purchase components and materials from companies that share GEA’s values with regard to the respect of human rights, integrity and environmental responsibility. In addition, GEA has committed to the “OECD Due Diligence Guidance for Responsible Supply Chains of Minerals from Conflict-Affected and High-Risk Areas.” This guidance is designed to help prevent the use of minerals that directly or indirectly finance or support armed groups in conflict-affected or high-risk areas (“conflict minerals”). Conflict minerals include tin, tantalum, tungsten and gold (also referred to as 3TG), irrespective of where they are obtained, processed or sold. At the end of the fiscal year 2020, GEA implemented its own Conflict Minerals Policy, which applies to all suppliers and subcontractors.
102GEA Annual Report 2020
Non-financial Group Statement

GEA aims to provide complete transparency about the source of 3TG in its supply chains. GEA’s aim is for all of the 3TG in products supplied to GEA to be conflict-free. GEA is establishing continuous and company-wide due diligence and risk management processes to determine the source and origin of 3TG in its supply chain, in addition to how it is processed. GEA is working closely together with its suppliers and other relevant actors in the supply chain on this.
To be considered “conflict-free”, the 3TG in items supplied to GEA must be transported, mined and traded in a manner that does not violate any of the principles in Annex II to the OECD Due Diligence Guidance for Responsible Supply Chains of Minerals from Conflict-Affected and High-Risk Areas.
Any ethical concerns or violations of the guidelines can be reported via the GEA whistleblower portal (see subsection “Compliance management”).
Quantifying impacts in the supply chainIn 2020, GEA conducted its first analysis of the sustainability impacts along the group’s entire supply chain. The analysis also takes account of the greenhouse gas emissions, air pollution, water consumption and waste generated by GEA suppliers and upstream suppliers, as well as workdays lost due to occupational injury and illness.
From this analysis, GEA is able to identify the hotspots of selected sustainability risks in the supply chain and minimize or eliminate them in cooperation with the suppliers. The impacts indirectly attributable to GEA were calculated with the help of an established macroeconomic model (PwC ESCHER) based on GEA’s purchasing volumes broken down by purchasing sectors and regions. Fiscal year 2019 served as the reference period for the data collection.
The quantification of greenhouse gas emissions from the purchase and transport of commodities, services and capital goods reveals that they exceed the greenhouse gas emissions from the company’s own business activities (reference) by a factor greater than six. The majority of supply-chain emissions are generated by upstream suppliers. The upstream chain of the energy utilities that supply electricity to GEA is a significant issue in terms of emissions. Analysis of water consumption and waste generation along the value chain reveals a similar pattern of sustainability impacts. Again, the supply chain impacts identified exceed those of the company’s own business activities (reference). The most significant drivers of waste generation and water consumption along the supply chain are the extraction of fossil fuels for electricity generation as well as the manufacturing of machinery and accessories used in GEA’s production activities.
An analysis of workplace accidents resulting in a temporary inability to work as determined by the macro model showed similar levels of occurrence with suppliers compared to GEA’s own business activities (reference).
103GEA Annual Report 2020
Non-financial Group Statement
Report on Risks and Opportunities
Targets of risk and opportunity management
As an international company, GEA faces increasingly stringent regulatory requirements, higher stakeholder expectations, and a more volatile market environment, which is reflected in shorter innovation and production cycles with increased competitive intensity. This process is accompanied by ever more regulatory requirements, at both national and international level, from legislators and specialist corporate governance bodies, particularly regarding the quality of corporate governance and supervision, as well as financial market regulation.
In light of this development, the early identification, assessment, and management of opportunities and risks is an ongoing task for GEA and an integral part of the group’s various workflows. Furthermore, opportunities and risks that have been identified must be assessed, managed and monitored systematically and uniformly throughout the company.
The aim of GEA’s group-wide opportunity and risk management system is to identify and assess relevant opportunities and risks at an early stage and to take suitable measures to pursue opportunities and limit the impact of risks. For GEA, the group-wide opportunity and risk management system is an integral part of value-oriented corporate governance, contributing to the group’s long-term security and its successful evolution in the future. GEA defines opportunities as positive and risks as negative deviations from planned short-term operational and long-term strategic targets.
The key determinants for the assessment of opportunities and risks are the amount of the potential reward or loss and their probability of occurrence. The probability of occurrence refers to the estimated probability or statistically expected value for the occurrence of a certain event in a given period in the future. The expected value of the reward or loss is determined by multiplying these two figures. The result is calculated to provide both gross and net values.
The gross value describes the maximum reward/loss that results if, in the event of the occurrence of an opportunity/risk, control measures do not take effect because they either do not exist or do not function as planned.
The net value of an opportunity/risk describes the potential reward/loss that results if existing control measures take effect when an opportunity/risk occurs. It is calculated by subtracting (in case of risks) or adding (in case of opportunities) the control measures subject to assessment from/to the gross value, taking into account the costs for the respective control measures.
GEA’s medium-term planning is a key component in its approach to managing opportunities and risks. This process is used to prepare decisions on core technologies and markets, along with the corresponding allocation of resources. The objective is to ensure stability by diversification and by concentration on future markets. At the same time, developments that may jeopardize GEA’s continued existence should be identified at an early stage.
Opportunities and risks arising from significant operating decisions – for example by accepting certain orders or implementing capital expenditure projects – are assessed and hence actively managed by the relevant departments and decision-makers at all group levels and in all functional units in a decision-making process that takes materiality criteria into account.
By integrating opportunity and risk information into the implemented planning and management processes, GEA is able to identify potential opportunities and risks on an aggregated level at an early stage and increase planning certainty for future development.
By regularly and systematically analyzing and managing opportunities and risks, GEA not only complies with the regulatory requirements under the Aktiengesetz (AktG – German Stock Corporation Act), but also provides a comprehensive management tool within the group that focuses on maintaining and increasing enterprise value. The opportunity and risk management process is supported by an audit-compliant IT solution that forms the basis for management reporting at the various group levels.
Overall assessment of the risk position and changes compared with the previous year
The identified risks from operating activities and the potential negative impact on earnings did not increase to any significant degree compared with the previous year. However, the risks are offset by the opportunities brought about by the efficiency measures introduced by GEA in 2019 and 2020.
104GEA Annual Report 2020
Report on Risks and Opportunities

The structure of GEA with its regional and sectoral diversity continues to offer substantial protection against the clustering of individual risks into a single risk that could jeopardize the group’s continued existence as a going concern. Furthermore, GEA Group is not significantly dependent on individual business partners, whether suppliers or customers.
The sale of the GEA Heat Exchangers segment resulted in risks in the form of financial obligations towards the purchaser arising within discontinued operations.
Overall, no risks to the GEA Group or GEA Group Aktiengesellschaft were identified that, alone or in combination with other risks, could endanger the company’s continued existence as a going concern.
Risk and opportunity management system
At GEA, the divisions run the operating business and have global responsibility for revenue and profitability. These five divisions are each organized into up to six business units. The Global Corporate Center supports the divisions/business units with financial, legal, technical and other services. The global focus of the divisions and the Global Corporate Center is complemented by the country organizations and their companies, which provide the necessary market proximity and required organizational infrastructure.
The aim of GEA’s group-wide opportunity and risk management system is to identify the main opportunities and risks in these operating and central business areas at an early stage, analyze their main influencing factors, adequately assess their effects, identify actions to exploit opportunities and minimize risks, and communicate these to the responsible decision-makers.
The principles, framework, organization and responsibilities for GEA’s opportunity and risk management system are clearly defined and are based on the international COSO II model.
The main features consist of the following components:
Organization and responsibilities • The Supervisory Board oversees the Executive Board, i.e., it fundamentally monitors the functionality
and effectiveness of corporate governance requirements within the group. The Supervisory Board and the Audit Committee likewise monitor the effectiveness of the risk management system.
• The GEA Executive Board has overall responsibility for the organization and group-wide structure of the corresponding corporate governance system. Within the GEA Executive Board, the CFO is responsible for designing the opportunity and risk management system (in particular the opportunity and risk strategy/opportunity and risk policy/framework concept), in compliance with regulatory requirements.
• The central Group Finance unit, specifically the Financial Planning & Risk Management department, supports the CFO in developing a framework for group-wide opportunity and risk management, ensures the exchange of information within the GEA Group at the level of the operating and central business units, coordinates regular management reporting, and is responsible for the preparation, dissemination, and further development of uniform group-wide methods, tools, and procedures for identifying, assessing, managing, and reporting relevant opportunities and risks.
• The operating business units and group companies in addition to the process and project managers are responsible for the continuous identification, assessment and management of opportunities and risks, as well as for communicating these to the responsible parties.
• Internal Audit is responsible for regularly reviewing the risk management system instituted by the Executive Board in accordance with section 91 (2) of the AktG.
• In accordance with section 317 (4) of the Handelsgesetzbuch (HGB – German Commercial Code), the external auditor assesses whether the Executive Board has taken the measures required under section 91 (2) of the AktG to institute a monitoring system and whether the early warning system is fit for purpose.
105GEA Annual Report 2020
Report on Risks and Opportunities
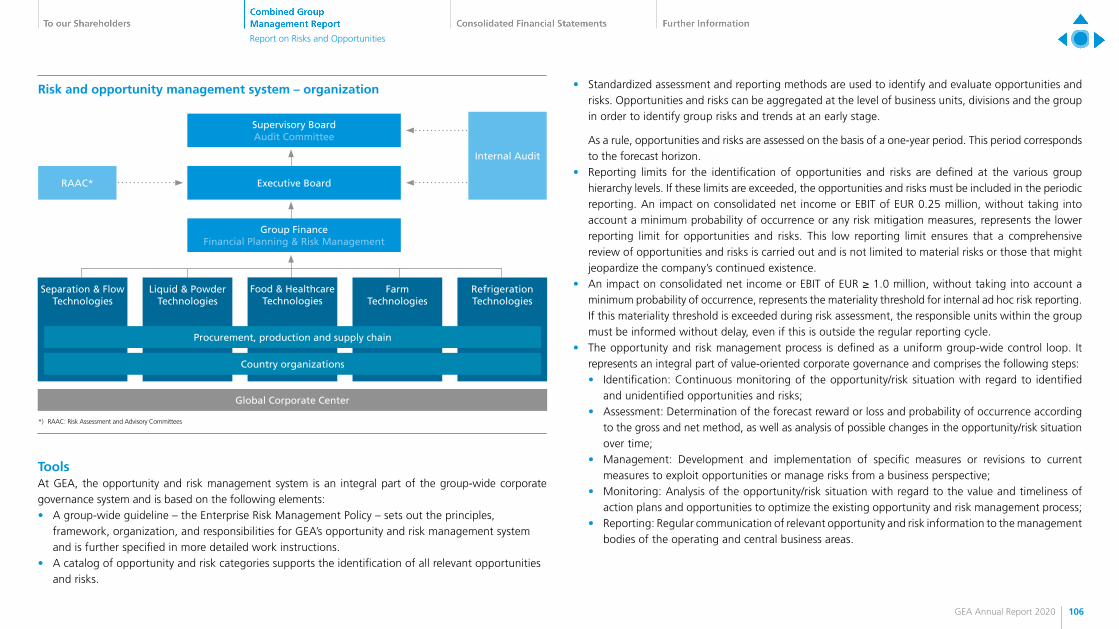
Separation & Flow Technologies
Global Corporate Center
Liquid & Powder Technologies
Food & Healthcare Technologies
Farm Technologies
Refrigeration Technologies
Procurement, production and supply chain
Country organizations
Supervisory Board Audit Committee
RAAC* Executive Board
Internal Audit
Risk and opportunity management system – organization
Group Finance Financial Planning & Risk Management
*) RAAC: Risk Assessment and Advisory Committees
Tools At GEA, the opportunity and risk management system is an integral part of the group-wide corporate governance system and is based on the following elements: • A group-wide guideline – the Enterprise Risk Management Policy – sets out the principles,
framework, organization, and responsibilities for GEA’s opportunity and risk management system and is further specified in more detailed work instructions.
• A catalog of opportunity and risk categories supports the identification of all relevant opportunities and risks.
• Standardized assessment and reporting methods are used to identify and evaluate opportunities and risks. Opportunities and risks can be aggregated at the level of business units, divisions and the group in order to identify group risks and trends at an early stage. As a rule, opportunities and risks are assessed on the basis of a one-year period. This period corresponds to the forecast horizon.
• Reporting limits for the identification of opportunities and risks are defined at the various group hierarchy levels. If these limits are exceeded, the opportunities and risks must be included in the periodic reporting. An impact on consolidated net income or EBIT of EUR 0.25 million, without taking into account a minimum probability of occurrence or any risk mitigation measures, represents the lower reporting limit for opportunities and risks. This low reporting limit ensures that a comprehensive review of opportunities and risks is carried out and is not limited to material risks or those that might jeopardize the company’s continued existence.
• An impact on consolidated net income or EBIT of EUR ≥ 1.0 million, without taking into account a minimum probability of occurrence, represents the materiality threshold for internal ad hoc risk reporting. If this materiality threshold is exceeded during risk assessment, the responsible units within the group must be informed without delay, even if this is outside the regular reporting cycle.
• The opportunity and risk management process is defined as a uniform group-wide control loop. It represents an integral part of value-oriented corporate governance and comprises the following steps: • Identification: Continuous monitoring of the opportunity/risk situation with regard to identified
and unidentified opportunities and risks; • Assessment: Determination of the forecast reward or loss and probability of occurrence according
to the gross and net method, as well as analysis of possible changes in the opportunity/risk situation over time;
• Management: Development and implementation of specific measures or revisions to current measures to exploit opportunities or manage risks from a business perspective;
• Monitoring: Analysis of the opportunity/risk situation with regard to the value and timeliness of action plans and opportunities to optimize the existing opportunity and risk management process;
• Reporting: Regular communication of relevant opportunity and risk information to the management bodies of the operating and central business areas.
106GEA Annual Report 2020
Report on Risks and Opportunities

Evaluation
Id
entifi
catio
n
Reporting
Monitoring Managem
ent
Risk and opportunity management system: Tools – Control loop
1. Identification:
Identification of all relevant opportunities and risks
Clustering opportunities and risks by category
Assignment according to the cause-effect chain
4. Monitoring:
Ongoing monitoring of established risks and opportunities and identification of new risks and opportunities
Analysis of the maturity of measures to exploit opportunities and minimize risks
The risk and opportunity management cycle is a continuous process
2. Evaluation:
Determining the amount of potential reward or loss and probability of occurrence
according to the gross and net method and analysis of possible changes in the
opportunity/risk situation over time
Quantification includes information on the cost of measures and provisions
3. Management:
Development and implementation of specific measures or revisions to current measures to
exploit opportunities and manage risks
• Risk Assessment and Advisory Committees (RAAC) have been set up to provide target-oriented information to the management bodies at the various levels of hierarchy within the group. These interdisciplinary committees serve to propagate the establishment of a sustainable opportunity and risk culture within the operating and central business units, as well as the harmonization and optimization of complete and timely periodic reporting. The group’s Executive Board is supported by a reporting system encompassing evaluated risk reports, consolidated financial projections, monthly consolidated financial statements, and regular meetings of the Global Executive Committee, which enable the various opportunities and risks to be fully identified and analyzed.
• The specific requirements of the group’s project business are addressed by “Risk Boards” at the operational business unit and group parent company level. Before a binding quotation is submitted or an agreement signed, the commercial and contractual terms of potential orders are examined in detail by specialists from various departments in order to avoid taking on uncontrollable risks.
• The opportunity and risk management system therefore already comes into play before risks arise, in the form of a critical examination of the opportunity and risk profile of quotations. No agreement may be signed if the opportunity and risk profile is unsuitable.
• The identification, analysis and evaluation of opportunities and risks, the definition of specific measures to exploit opportunities and mitigate risks, as well as their ongoing monitoring are supported by an audit-compliant web-based IT application.
• The financial effects have been allocated to four categories for all organizational units within the GEA group on the basis of their average earnings contribution (EBIT) over the past four years. The following key figures, which were used for the first time in the 2019 Annual Report, apply to the GEA Group.
107GEA Annual Report 2020
Report on Risks and Opportunities

Risk matrix Risk value Opportunity matrix
Major ≥ EUR 120
million
Significant EUR 70 – < 120
million
Moderate EUR 20 – < 70
million
Low EUR < 20
million
Unlikely ≤ 25%
Possible > 25% – ≤ 50%
Likely > 50% – ≤ 75%
Almost certain > 75%
Unlikely ≤ 25%
Possible > 25% – ≤ 50%
Likely > 50% – ≤ 75%
Almost certain > 75%
Risks and opportunities matrix (net basis)
Probability of occurrence
Adequate provisions have been recognized for all identifiable risks arising from the group’s operating activities provided that the recognition criteria for liabilities have been met.
The following section provides details of existing risks. The assessment is based on countermeasures implemented to minimize risk (net value) in the GEA Group’s risk and opportunity matrix. Risks that are not yet known or currently regarded as insignificant may also have an adverse effect on business activities.
Internal control systemGEA has an internal control (ICS) and risk management system for the group accounting process. It is based on a comprehensive system of guidelines, instructions, organizational and procedural rules, business processes (including the assignment of responsibilities and supervision) to ensure the traceable implementation of and compliance with legal requirements and internal rules, the elements of which are intended to prevent procedural and organizational risks in financial reporting as well as in the directly or indirectly related business processes.
Various monitoring measures both within and outside of the accounting process contribute to the implemented controls ensuring that the consolidated financial statements comply with the relevant regulations, despite the potential risks. GEA’s ICS for financial reporting encompasses all principles, measures and rules that ensure the proper approval and recording of business transactions for monthly, quarterly, and annual financial statements. The goal of the implemented ICS is to ensure reliable financial reporting, compliance with the relevant laws and standards, and the cost-effectiveness of business workflows. In addition to GEA Group Aktiengesellschaft, all group companies are integrated into the ICS.
In order to ensure that uniform procedures are established throughout the group, the following key principles of GEA’s ICS must be applied in all business functions: Clearly defined areas of responsibility, the separation of functions in all areas of activity, dual signature rules, compliance with guidelines, instructions, and procedural requirements (handbooks), the obligation to obtain comparable offers before awarding contracts above a defined size, protection of data from unauthorized access, and the provision of training sessions.
108GEA Annual Report 2020
Report on Risks and Opportunities

Key measures and rules that are relevant for financial reporting and are designed to ensure uniform accounting at all subsidiaries are: accounting and account allocation manuals, a uniform chart of accounts, consolidation and calculation manuals, the approval of entries using the dual control principle, and the fact that certain entries can only be made by selected persons. Guidelines and IT systems are updated on a continuous basis to reflect legal and business requirements. The Chief Information Security Officer (CISO) is responsible for ensuring the implementation of appropriate IT guidelines throughout the group based on regulatory and substantive requirements.
Compliance with the principles, measures, and rules set out in the ICS as described above is monitored systematically; this takes the form of regular reviews by GEA’s Internal Audit function, which reports directly to the Executive Board and regularly submits reports to the Audit Committee. The results enable the elimination of defects identified at the companies reviewed and the ongoing enhancement of the ICS within the group.
Overall, the ICS aims to ensure the early identification, assessment, and management of those risks and opportunities that could materially influence the company’s ability to achieve its strategic, operating, financial and compliance-related objectives.
Risks
Legal risksIndividual legal risks are not quantified in detail since disclosing the specific probability of occurrence could have a material effect on the group’s position in current litigation or other legal disputes.
Steuben Foods Inc.GEA Process Engineering, Inc. (“GPNA”) and GEA Procomac SpA (“Procomac”) are defendants in a lawsuit filed by Steuben Foods Inc. (“Steuben”) in the U.S. District Court of the Western District of New York. In its complaint, Steuben is alleging that GPNA and Procomac infringed its patents by selling eight bottling lines to customers in the United States; Steuben seeks unspecified damages. GPNA and Procomac intend to vigorously defend themselves and deny infringement of any valid and enforceable patent claims. They believe that the patents relied upon are not legally enforceable and have not been infringed.
Farm Technologies distributor for South Korea In an action brought before the District Court in Seoul, GEA Farm Technologies GmbH was sued by its former distributor in South Korea (Sesame W.S. Trading Corporation) and its owner Do Ki Yang for the alleged unlawful termination of a dealership agreement and payment of damages initially equivalent to around EUR 2.3 million, and equivalent to around EUR 28 million plus interest in the final instance.
However, the High Court in Seoul (court of appeal) found that the losses incurred by the distributor amounted to the equivalent of only around EUR 670 thousand plus interest. The dispute is currently being heard before the Seoul Supreme Court. GEA Farm Technologies GmbH expects that the Supreme Court will uphold the judgment of the court of appeal. Alongside this first action, the distributor then brought a second action relating to the same matter but for a different period, successively raising the claim for damages to EUR 19 million plus interest in the final instance. This second action is currently suspended.
GeneralFurther claims or official investigations have been or may be instituted against GEA companies as a result of earlier business disposals and operating activities.
Adequate accounting provisions have been recognized for all risks arising from both the legal disputes described above and other legal disputes being pursued by GEA in the course of its ordinary operating activities. However, the outcome of these proceedings cannot be predicted with any degree of certainty. It is therefore possible that the conclusion of the proceedings may result in income or expenses if the amounts that have been set aside for them are higher or lower than required.
109GEA Annual Report 2020
Report on Risks and Opportunities

Overview of all material risks to which GEA is exposed (not including legal risks)
Material risks Probability of occurrenceRisk value
(net)
Performance risks
Macroeconomic risk likely moderate
Coronavirus (Covid-19) possible moderate
Trade disputes between China, the U.S. and the EU unlikely low
Brexit possible low
Volatility in material prices unlikely low
Customers’ financing options for projects unlikely low
Margin risk for long-term contracts possible moderate
Innovation possible moderate
Digitization unlikely moderate
Finding and retaining committed and well-qualified staff possible moderate
IT infrastructure unlikely moderate
Information technology possible moderate
Acquisition, divestment, and integration risks
Acquisitions and divestments likely low
Sale of GEA Heat Exchangers segment in 2014 possible moderate
Environmental risk
Risks of environmental contamination and mining damage possible moderate
Financial risks
Currency, interest rate, credit, and liquidity risk unlikely low
Tax risks
Use of loss carryforwards unlikely major
Performance risks The performance risks presented below can take different forms. The elements of the GEA risk management system are designed to help identify emerging risks before they materialize, so that appropriate measures can be implemented on a case-by-case basis to avoid negative impacts on the group’s financial position and results of operations. As a rule, potential business performance risks are to be minimized by avoiding significant dependencies and ensuring a balanced mix of fixed and flexible capacities.
Macroeconomic trends are deemed to pose a risk to the company. If a downturn in the economy leads to a reduction in order intake and selling prices to a level below the previous fiscal year, this could have a negative impact on earnings due to capacity underutilization and capacity adjustment measures. GEA has a diverse product and customer structure that is geared to flexibility. This has a tendency to moderate the impact on total performance of any fluctuations in demand in sub-markets. However, products for the food, beverage and pharmaceutical industries remain the main focus of our business. Overall, the probability of occurrence for this risk is assessed as probable, but the financial impact is rated as moderate.
The coronavirus (Covid-19) may continue to impact macroeconomic trends. Although GEA’s early and consistent crisis management resulted in only a few production stoppages due to temporary site closures ordered by the authorities as well as a moderate decline in order intake and revenue, negative effects on GEA’s business activities over and above those already included in planning considerations are considered possible. The consequence would be an additional negative impact on earnings. The resulting financial implications are rated as moderate.
The ongoing trade discussions between China, the United States and the European Union affect the most important markets for European suppliers. GEA is affected by additional tariffs in relation to only a few product groups, which is why punitive tariffs have had little impact on mutual trade to date. Even if tariffs were expanded further – which is considered unlikely due to the partial trade agreement concluded between the China and the U.S. in early 2020 and Joe Biden taking office in early 2021 – the potential financial implications would be rather low.
110GEA Annual Report 2020
Report on Risks and Opportunities

New Chinese export control regulations came into effect on December 1, 2020, and may have a financial impact on GEA companies operating in the Chinese market and their employees. It is currently not possible to determine the extent of this risk as the sanctions list stands empty and a number of legal terms have yet to be clearly defined.
In the event of a global escalation of trade disputes, in which case GEA would be far less able to exploit its global production network and avoid higher duties, the financial impact would, however, be significantly greater. However, this is currently considered fairly unlikely due to the outcome of the 2020 presidential election in the United States and the signing of the Regional Comprehensive Economic Partnership (RCEP) free trade agreement at the end of 2020.
From an operational perspective, it is uncertain how UK customers will react after Brexit. It is particularly unclear just how much revenue volume could decline in the United Kingdom and how costs could increase for exporting goods to British customers. At present, the group’s business activities between the United Kingdom and the EU affected by Brexit, are of minor importance. GEA believes that the UK’s official withdrawal from the EU on January 31, 2020 may have a negative impact. However, GEA expects the financial impact to be low.
GEA utilizes a number of materials such as aluminum, copper, nickel, zinc and stainless steel – the latter notably in the manufacture of processed products. Purchase prices for these materials may fluctuate significantly depending on market conditions. Long-term supply agreements are entered into with selected suppliers in order to lock in the procurement prices used as the basis for costing orders. The risk of higher material prices developing is considered unlikely. Long-term supply agreements and the option of adjusting selling prices lead us to rate the potential financial impact here as low.
A significant proportion of GEA’s business consists of projects that depend on the financing options of its customers. A general decline in demand, shifts in currency parities, or a credit squeeze could make it more difficult to implement such projects. For the same reason, existing orders could be deferred or even canceled. The materialization of such risks on a global basis is considered unlikely. The financial impact of this risk is classified as low, particularly due to GEA’s diversified positioning.
Long-term orders for customer-specific projects are an important element of GEA’s business. Some of these contracts entail particular risks, as they involve assuming a significant portion of the risk associated with the project’s completion. The high percentage of innovative products in the GEA range can also harbor technological risk. This is particularly the case with the complex solutions, plant and equipment produced by the Liquid & Powder Technologies division – which, on account of its size and/or customized design, cannot always be tested in their entirety prior to roll out. In addition, they may provide for warranty obligations that remain in force for several years after the project’s acceptance. Technical problems, quality problems at subcontractors, and missed deadlines may lead to cost overruns. Therefore, an extensive risk management system is in place at the level of the group parent company and operating business units (divisions) to closely monitor order-related risks. This comes into play before binding quotations are submitted. Adequate provisions have been recognized for all foreseeable risks in this area. The materialization of such risks is considered possible. Particularly due to the multi-stage approval process necessary in advance of a binding quotation being submitted or an agreement signed, the financial effects of this risk are rated as moderate.
The enduring financial success of GEA as a technology group depends to a large extent on it being able to offer tailored customer solutions that provide outstanding product and process efficiency. For this reason, GEA needs to maintain and continually expand its innovative strength. Despite intensive R&D activity and concerted efforts on our part to develop existing technology, there is still a potential risk that, in some areas, new and existing competitors will bring products with better performance parameters to market maturity faster. This risk is rated as possible, with moderate financial implications for GEA.
111GEA Annual Report 2020
Report on Risks and Opportunities

Digitalization is an integral part of GEA’s innovation process for developing plant and processes that can be adapted flexibly to changing market conditions. In addition, the further digitalization of internal processes at GEA is necessary to enable fast, reliable information-gathering for the management of both production and administrative processes. In this area, GEA sees risks and opportunities for the optimization of internal processes. If these internal processes cannot be digitalized quickly or comprehensively enough, this may give rise to competitive disadvantages for GEA for a limited period. It is unlikely that this risk will materialize; the potential financial implications are estimated to be moderate.
Dedicated and qualified employees are a critical success factor for GEA. GEA has various staff policy measures in place to counter the risk that it will be unable to fill vacant positions adequately or that it will lose skilled employees. The measures aim to position GEA as an attractive employer and foster employees’ long-term loyalty to the group. Please refer to the separate Sustainability Report for more information. The probability that vacant positions will not be filled adequately and permanently is rated as possible, with moderate financial implications for the group.
GEA’s business processes are highly dependent on its IT infrastructure. Whether caused by internal or external circumstances, the failure or malfunction of critical systems can give rise to risks relating to confidentiality, availability, and integrity. Key business processes could be compromised as a result. Extensive infrastructure measures, such as the standardization and modernization of IT devices, cloud migration and the replacement of outdated network technology, have already been advanced in order to minimize operational risks. At the same time, this set the course for a long-term scalable platform for the digitalization of business processes. This risk is rated as unlikely, with moderate financial implications for GEA.
GEA protects the confidentiality, integrity and availability of the information and information assets of its business partners as well as its own by means of a global Information Security Management System (ISMS) based on the ISO/IEC 27001 standard. Nevertheless, the likelihood of security risks occurring cannot be completely ruled out due to the continuously changing potential threat situation. Potential financial impacts are moderate with the probability of this risk arising estimated as possible.
Acquisition, divestment, and integration risksAcquisitions and divestments entail risks related to the integration/transfer of employees, processes, technologies and products. It cannot be ruled out, therefore, that the aims of the measures in question will be not fully achieved or realized within the time frame envisaged.
Moreover, such transactions may give rise to substantial administrative and other expenses. Portfolio measures may also result in the need for additional financing and thus may impact negatively on financing requirements and the financing structure. These risks are countered by a structured integration concept and close supervision by internal experts, as well as specific training measures. Risks arising from acquisitions and divestments are rated as probable with little financial impact.
The sale of the GEA Heat Exchangers segment resulted in risks in the form of financial obligations towards the purchaser. These emanate mainly from risk sharing for a major project still in progress. Overall, the probability of this risk arising is estimated as possible, with moderate financial implications should it materialize.
Environmental riskSeveral of GEA’s properties entail risks relating to historic environmental contamination and mining damage, primarily as a result of earlier business activities. These risks are countered through appropriate measures and supervision by internal and external specialists. This could give rise to both risks and opportunities in relation to the financial position and results of operations. Their probability is regarded as possible and the financial impact as moderate.
Financial risks Because it operates worldwide, GEA is continuously exposed to financial risks in the course of ordinary activities. The material financial risks include currency, interest rate, credit, and liquidity risk. Financial risk management aims to reduce these risks through the appropriate use of derivatives and non-derivative hedging instruments. The Executive Board has implemented an effective set of guidelines with which to monitor and thus largely limit or hedge these financial risks throughout the group.
112GEA Annual Report 2020
Report on Risks and Opportunities

The objectives with regard to protecting assets, eliminating security shortfalls and enhancing efficiency when identifying and analyzing risks are clearly defined, as are the relevant organizational structures, powers and responsibilities. The guidelines are based on the principles of system security, separation of functions, transparency and immediate documentation.
As the financial risks are limited or hedged through appropriate countermeasures, the risks for GEA’s account are generally considered to be low in terms of financial impact and are unlikely to occur.
Currency risksThe international nature of GEA’s business activities entails not only cash flows denominated in euros but also in several other currencies, most notably in U.S. dollars. Hedging the resulting currency risk is a key element of risk management.
The group guideline requires all group companies to hedge foreign currency items as they arise in order to fix prices on the basis of hedging rates. Currency risks are hedged for recognized hedged items, unrecognized firm commitments, and highly probable transactions. The hedging periods are determined by the maturity of the hedged items and are usually up to 12 months, but in exceptional cases may exceed that period significantly. Despite the hedging requirement, changes in exchange rates may affect sales opportunities outside the eurozone.
Affiliated group companies are generally required to tender all outstanding exposures relating to transactions in goods and services, along with financing transactions, in major transaction currencies to GEA’s central Treasury & Corporate Finance unit. This unit is required to hedge significant positions by entering into matched-maturity derivative contracts with external banks. In addition, most intragroup borrowing arrangements in foreign currencies, managed via the central Treasury & Corporate Finance unit, are hedged directly to banks.
The hedging of financial transactions and transactions conducted by subsidiaries outside the eurozone is also coordinated with the central Treasury and Corporate Finance unit.
GEA companies are always exposed to foreign currency risk if their cash flows are denominated in a currency other than their own functional currency. As a general principle, foreign currency risks must be hedged using appropriate financial instruments. The fluctuations arising from the hedged item (underlying) and the hedging transaction thus largely balance each other out over their duration.
Interest rate risksBecause GEA operates worldwide, liquidity is raised and invested in the international money and capital markets in different currencies (but mainly in euros) and at different maturities. The resulting financial liabilities and investments are exposed to interest rate risk, which must be assessed and managed by central financial risk management. Derivative financial instruments may be used on a case-by-case basis to hedge interest rate risk and reduce the interest rate volatility of the hedged items. Only the central Treasury & Corporate Finance unit is permitted to enter into such interest rate hedges.
Credit riskThe credit risk or default risk is the risk of a commercial partner no longer being in a position to meet obligations arising from a financial instrument or contract asset, resulting in a financial loss. The group is exposed to default risk from both its operative business (especially in the case of trade receivables) and its financing operations (including bank deposits, foreign exchange transactions and other financial instruments).
The financial standing of potential customers is ascertained via an internal risk board procedure before orders are accepted. Active receivables management, including non-recourse factoring and credit insurance, is also performed. In the case of export transactions, confirmed and unconfirmed letters of credit are used alongside sureties, guarantees, and cover notes, including from export credit agencies such as Euler Hermes.
113GEA Annual Report 2020
Report on Risks and Opportunities

An addition to local monitoring by the subsidiary, GEA oversees the main credit risks at group management level so that any accumulation of risk can be better managed. Since trade receivables and contract assets are usually due from a large number of customers spanning different industries and regions, there is no concentration of risk.
The counterparty limit system for cash and cash equivalents used by GEA for financial risk management aims to continuously assess and manage counterparty default risk. A maximum risk limit has been defined for each counterparty, which in most cases is derived from the ratings from recognized credit rating agencies and credit default swaps. Appropriate action is taken if the individual limit is exceeded. These measures serve to avoid a concentration of risks.
Cash and cash equivalents are deposited with banks and financial institutions rated BB- through AA- by Standard and Poor’s (S&P) as of the reporting date. The maximum default risk is limited to the carrying amount of the financial instruments and the contract assets.
Liquidity riskGEA is exposed to liquidity risk in that it may be unable to meet payment obligations because it has insufficient cash funds at its disposal. The central Treasury & Corporate Finance unit is responsible for managing this risk. The funds are made available to the companies by group management. Cash flow from operating activities is the most important source of liquidity.
Cash pools have been established in 17 countries in order to optimize borrowing and the use of cash funds within GEA. To achieve this, the cash pools automatically balance the accounts of the participating group companies every day by crediting or debiting a target account at GEA Group Aktiengesellschaft. This prevents separate cash investments and borrowings by these companies to a large extent. Any additional liquidity requirements are generally borrowed by the GEA Group Aktiengesellschaft, which also invests surplus liquidity.
Tax risksGEA’s central tax department has issued guidelines to ensure that fiscal risks are identified and minimized at an early stage. These risks are examined and evaluated regularly and systematically.
The applicable national tax legislation may affect the use of loss carryforwards and thus the recoverability of the deferred taxes recognized in the consolidated financial statements and current taxation. Furthermore, future changes to the ownership structure could significantly reduce or even render impossible the use of German loss carryforwards (section 8c of the Körperschaftsteuergesetz (KStG – German Corporate Income Tax Act)). The ability to use U.S. loss carryforwards could also be restricted in the case of certain changes to the ownership structure of GEA Group Aktiengesellschaft under IRC section 382 (limitation on net operating loss carryforwards following an ownership change).
Moreover, in Germany and abroad, there is considerable uncertainty regarding future changes to and the application of tax legislation due to both the pressure to institute tax reforms and a discernible increase in scrutiny by the tax authorities.
The tax risks presented could have a major impact on GEA’s financial position and results of operations. The occurrence of further material negative effects is considered to be unlikely.
Opportunities
Overall assessment of opportunities and changes compared with the previous year GEA’s end markets continue to offer a variety of opportunities for positive business performance over the long-term. A key task of the opportunity and risk management system is to systematically evaluate both internal and external information in order to identify opportunities at an early stage and appropriately assess the potential they offer (see “Risk and opportunity management targets” in this chapter). With this in mind, GEA is working on a fixed raft of measures aimed at transforming opportunities into real economic successes.
Forecasting the group’s economic development is based on certain assumptions regarding the development of the performance parameters described below. If these parameters develop more positively than expected overall, this could have a corresponding impact on GEA’s financial position and results of operations.
114GEA Annual Report 2020
Report on Risks and Opportunities

Opportunities arising from the measures initiated in 2019 and 2020 In tackling the Covid-19 pandemic in the past fiscal year, GEA benefited from its early and consistent crisis management. GEA also continued to implement the efficiency enhancement measures that were adopted and launched in 2019 as planned. These mainly include the implemented downsizing measures by more than 800 full-time employees including temporary staff between June 30, 2019 and the end of 2020, as well as the optimization of procurement processes and the standardization of ERP systems across the group. In addition, GEA has implemented significant projects that are expected to further strengthen the capital market’s confidence in the company despite the crisis. For example, the optimization of the production network was announced and initiated, and the group’s strategic focus was sharpened through the sale of GEA Bock, GEA Farm Technologies Japy SAS and Royal De Boer Stalinrichtingen B.V.
GEA already factored the effects of these measures (except M&A activities) into its forecast for fiscal year 2021 and into the medium-term group objectives up to 2022, which were published on September 26, 2019. Nevertheless, measures such as faster, more efficient project implementation could give rise to opportunities that could benefit the entire group. GEA considers it unlikely that the opportunities arising from the 2019 and 2020 measures will exceed the planning assumptions and positively impact net assets, the financial position and results of operations.
Performance opportunitiesGEA is entering fiscal year 2021 with a solid order backlog. Once again, GEA is expecting growth in the emerging markets, notably in India. In order to exploit this market potential, the company intends to further solidify its position in these countries.
In the area of process technology for food and beverages, GEA is expecting the trend toward high-quality end products to continue, largely fueled by a burgeoning middle-class population. The expected rise in production and quality standards coupled with innovative process enhancements and new process developments are also set to nurture growth at GEA.
What is more, GEA expects that the trend toward fewer but larger dairy farms will increase the level of automation in such facilities. This should generate greater demand for automated milking systems. In the beverages industry, additional growth potential is expected to come from non-alcoholic, healthy beverages. This is especially the case in the Asia Pacific and North and Central Europe regions. In the pharmaceutical industry, GEA is counting on market growth first and foremost in the U.S. and China.
GEA is anticipating disproportionate growth in its service business compared with its new machinery business, and is thus looking to improve its market coverage in developed markets further. The establishment of a CSO (Chief Service Officer) in the management team of each division also serves to underscore the significance of the service business in GEA’s new divisional structure.
Adding a “service enabler” to the harmonized customer relationship management (CRM) system will enable GEA to provide its customers with even better service, while promoting group-wide transparency in sales and marketing processes. This more prominent positioning of the entire portfolio aims to promote greater growth and nurture customer loyalty. In turn, this will continue to strengthen and expand GEA’s competitiveness.
Information technology is an integral part of the value chain and supports the operational business units with standardized processes. GEA’s aim is to establish a uniform and integrated system landscape within the group and to ensure the integrity, confidentiality and availability of data and information as well as the trouble-free operation of its systems. GEA’s objective in investing in the worldwide expansion and modernization of its IT infrastructure is two-fold. On the one hand, GEA seeks to safeguard its IT operations and enhance its security. On the other hand, GEA seeks to enable opportunities for the digitalization of GEA products, services and business processes while expanding its business towards both new and existing customers.
A megatrend in all branches of industry, ongoing digitalization will make it possible to develop new products and business models, while the novel product ideas that result should give GEA a competitive edge and generate growth potential: GEA wants to deploy cloud-based “machine learning,” e.g. to fulfill the technical needs of its customers, in an effort to enhance efficiency and garner a competitive edge in its service business.
115GEA Annual Report 2020
Report on Risks and Opportunities

At the same time, InfoSec (information security) is an important prerequisite and opportunity for the digitalization of GEA products and internal processes, as well as for generating new customer orders. GEA’s current customers, new customers and business partners will all benefit from a robust ISMS and can be confident in both the protection of their data and uninterrupted service. GEA’s in-depth understanding of its customers’ production processes is a cornerstone of its success. In addition, end consumers’ rising expectations entail the implementation of higher quality standards in production processes. Increasing environmental awareness means we must meet more stringent standards on CO2 emissions and sustainability. This creates additional opportunities for GEA: Research and development activities that target environmentally friendly technologies, and production processes will enable us to develop and offer specialized solutions. For more details, please refer to the “Research and Development” section in “Fundamental Information about the Group”. For this reason, GEA intends to focus increasingly on developing holistic, energy-efficient process solutions. By doing so, GEA hopes to make more efficient use of raw materials and energy sources.
By further harmonizing its engineering platform, e.g. in the field of digital design, GEA hopes to engender even more efficient working practices when individual GEA sectors collaborate on in-house projects. Increasing standardization at GEA, e.g. with new solutions for standard components, also harbors considerable potential for implementing technical projects even more efficiently in the future.
All told, GEA considers it unlikely that the performance-related opportunities discussed will exceed the planning assumptions and positively impact net assets, the financial position, and results of operations.
116GEA Annual Report 2020
Report on Risks and Opportunities

Report on Expected Developments
GEA’s Report on Expected Developments takes into account relevant facts and events that were known at the date of preparation of these consolidated financial statements and that could influence the future development of its business.
Economic environment in 2021
As described in the “Report on economic position” in the section “Macroeconomic environment”, GEA, as a global industrial technology company, considers growth in global gross domestic product (GDP) and GDP forecasts made by the IMF to be key indicators for its own performance.
World Economic Outlook IMF (January 2021)
Outlook (percentage change)
2021 2020
Worldwide 5.5% –3.5%
Advanced economies 4.3% –4.9%
Emerging markets and developing economies 6.3% –2.4%
In its January update of the “World Economic Outlook”, the IMF expects the Covid-19 pandemic to result in a significant 3.5 percent contraction of global GDP in 2020, followed by strong growth of approximately 5.5 percent in 2021. A gradual recovery is expected over the course of the year due to the likelihood of lockdown restrictions, particularly early in the year, and the slow roll-out of the Covid-19 vaccine.
While the IMF projects growth of about 4.3 percent in the advanced economies in 2021, after a decline of approximately 4.9 percent in 2020, expectations for the emerging markets and developing countries are for an improvement of about 6.3 percent in 2021 after a slowdown of about 2.4 percent in 2020. Compared to the advanced economies, the smaller decline in 2020 and larger increase in 2021 for the emerging markets and developing countries is due in particular to China, which has so far recovered much faster from the Covid-19 impact than many other countries.
Among the developed countries, the U.S. economy is projected to contract by around 3.4 percent in 2020 before bouncing back by around 5.1 percent in 2021, while the Eurozone economy is expected to grow by around 4.2 percent in 2021 after contracting by around 7.2 percent in 2020.
The IMF has emphasized that economic growth forecasts for this year are subject to a great deal of uncertainty, as illustrated by the emergence of new mutated strains of Covid-19 in the United Kingdom and South Africa.
Furthermore, in 2021 the global economy is also expected to be affected by the U.S.-EU and U.S.-China trade disputes, in addition to ongoing geopolitical issues, such as the tension between the U.S. and Iran.
Economic environment for GEAFor the current 2021 fiscal year, GEA expects demand in its sales markets to improve further as a result of a global economic recovery, while global megatrends remain supportive. The continued growth of the world’s population and the global middle class is driving up the global demand for food. At the same time, quality demands on food products are also rising. In addition to an increased desire for food that is healthy, functional and safe, the demand for efficient production methods that also conserve valuable resources is on the rise.
In the medium to long term, the United Nations believe that the world’s population, which currently stands at around 7.8 billion, will continue to rise. Compared to 2007, the world’s population has already grown by around 1 billion people, and by 2 billion since 1995 (United Nations, World Population Prospects 2019). The United Nations expect the global population to grow further, albeit at a reduced pace, to between 8.4 and 8.7 billion in 2030, and to between 8.9 and 10.6 billion by 2050. With an estimated increase of between 1.2 and 2.6 billion until 2050, Asia and Africa will contribute almost exclusively to this growth.
117GEA Annual Report 2020
Report on Expected Developments

Moreover, the proportion of the world’s population considered at least middle class will continue to increase, with the bulk of this growth coming from the Asia-Pacific region. The size of the middle class in this region is expected to grow from around 2 billion people in 2020 to 3.5 billion people in 2030 (Brookings Institution, 2017). The middle class is expected to grow by a moderate amount in Africa and Central and South America, while the size of the middle class in Europe and North America is predicted to remain fairly stable.
As the global middle class grows, so will the number of people who can afford processed foods, beverages, and dairy products. This is similarly true for pharmaceutical products, which must meet the needs of an increasingly health-conscious population.
At the same time, demand for products and related resources is also on the rise, in line with the consistent global population growth. While our society already consumes more natural resources than the planet can provide and renew, significantly more food will need to be produced on more or less the same cultivation area in the future. For this reason, GEA assumes that today’s production processes and methods will need to become much more efficient and that innovative and sustainable production methods will be required to achieve this objective.
Growth in the customer industries Based on its own latest estimates, external reports, and analyses conducted by industry associations, the following trends are expected for GEA’s main customer industries:
Milk productionDespite the Covid-19 pandemic, global milk production continued to rise in 2020. The growth rate remained relatively constant and was slightly higher than the long-term average.
Increased feed costs could constitute a short-term challenge, particularly in the first half of 2021, which could lead to a reduction in milk production. However, global milk prices are expected to continue to rise over the rest of the year due to the economic recovery and a corresponding increase in demand . The latter should have a positive impact on milk production.
Over the medium to long term, the situation on the global dairy market is expected to remain stable. However, regional factors such as unfavorable weather conditions or political developments can lead to significant volatility at a regional and global level. This has a particularly significant impact on milk prices, which can in turn reduce the willingness of farmers to make investments in the short term.
Dairy ProcessingThe Covid-19 pandemic and respective restrictions have had relatively little impact on the demand for dairy products. Although, demand for dairy products from the restaurant sector fell dramatically, retail demand increased significantly. Demand was particularly high for products with a longer shelf life like UHT milk, butter and yoghurt, leading to corresponding production adjustments at dairies.
Looking ahead, the global consumption of dairy products will continue to rise as population and per-capita income figures increase and diets change. Demand for dairy products is expected to grow far more in emerging economies than in developed markets. North America and Western Europe will see a more moderate increase in the demand for dairy products due to per-capita consumption levels already being extremely high and growing demand for plant-based food.
As a result of these trends, dairies are focusing more on high-quality and functional dairy products such as yogurt and butter, cheese, baby food and related product innovations. As a consequence, a continued strong focus on small and mid-sized investments, especially for innovative production technologies, is expected.
FoodThe restrictions put in place to stop the spread of Covid-19 have triggered opposing trends in the food industry. On the one hand, restaurant closures and the cancellation of events caused a strong demand decline for food from certain sectors; on the other hand, retail demand has seen a significant increase. Especially demand for products with a longer shelf life like pasta, frozen food and ready-made meals went up considerably, while demand for processed meat products fell.
118GEA Annual Report 2020
Report on Expected Developments
The global consumption of packaged foods will continue to rise over the medium-term on the back of growing demand from the emerging economies resulting from larger populations and higher per- capita consumption.
Changing consumer preferences are also driving growth, particularly in the developed markets. Specifically, consumer awareness of healthier foods, the trend towards the latest innovative foods, and growing demand for alternative proteins will require food manufacturers to increase their expenditure on product innovations in order to compete in the market.
BeveragesDemand for alcoholic beverages fell, among other factors, due to the wide-scale cancellation of festivals and concerts in 2020. The recovery in demand is expected to be slow in 2021 due to the ongoing pandemic. Demand for non-alcoholic beverages, which was less affected by the pandemic, is expected to return to or exceed 2019 levels as early as this year, and grow at higher rates than pre-pandemic over the next few years.
Beverage consumption is expected to rise more in emerging economies than in developed markets, where only moderate growth is projected. Along with an expanding global middle-class population, particularly in emerging economies, the key drivers of growth are increasing demand for plant-based beverages and product innovations that place a greater emphasis on health and functionality, such as sports drinks and non-alcoholic beer. The consumption of innovative ready to drink (RTD) alcoholic beverages like hard seltzers is expected to rise significantly, albeit from a relatively low level.
PharmaThe Covid-19 pandemic has affected the pharmaceutical industry in a variety of ways. On the one hand, fewer people visited their doctor or went to the hospital, leading to a reduced demand for prescription medication. On the other hand, the industry has devoted an enormous amount of effort to developing medication and vaccines to combat Covid-19. In this respect, the so called biopharmaceutical sector is likely to benefit most from the development and production of vaccines.
Demand for medication is expected to grow as the global middle class expands and populations age, particularly in developed economies. Biological medical products, including vaccines, and drugs for rare diseases, will see above-average growth. The increase in the number of drugs in the development pipeline will lead to new medicinal products being patented, with generic versions being produced at a higher rate after these patents expire. Overall, capital expenditure in the pharmaceutical sector is expected to grow at a stable rate over the medium-term.
ChemicalThe Covid-19 pandemic had less of an effect on the chemical industry than industrial production overall. This was largely due to increased demand for precursors for hygiene products and packaging materials, as well as the construction and electronics industry. Despite the fact that companies will go ahead with a large amount of delayed capital expenditure towards property, plant and equipment and research and development in 2021, a return to pre-crisis levels will take some time, particularly in Europe.
In the medium-term, the rise in the world’s population, ongoing urbanization, and the reclassification of rural land are set to fuel demand for, above all, petrochemicals and specialty chemicals. Additional growth is expected to come from increasing demand for lithium-based products and renewable products such as biodegradable polymers. Capital expenditure is therefore forecast to increase further, particularly in Asia - which now accounts for around half of the chemical industry’s total worldwide revenue - and the Middle East.
119GEA Annual Report 2020
Report on Expected Developments

Business outlook
The outlook is based on the market projections and other assumptions described under “Economic environment in 2021”. Following a decline of around 3.5 percent in 2020, the global economy is expected to grow by roughly 5.5 percent in 2021. GEA anticipates a gradual improvement in the course of the year due to the slow roll-out of Covid-19 vaccinations.
Accordingly, the forecast presented below does not reflect a renewed sharp rise in infections or new virus mutations, which could lead to another lockdown (“3rd wave”) with an associated negative impact on global economic growth.
As of January 1, 2021, GEA made some minor adjustments to its divisional structure, so that individual companies whose activities related to two or more divisions, but were allocated to just one, are now broken down by their respective business activities. In so doing, GEA has created greater divisional precision and a clearer structure.
These modifications, which are smoothed out at group level, are presented in the column (pro-forma) 2020 in the following tables. The outlook for 2021 is made on this basis. By “organic”, GEA means changes that are adjusted for currency and portfolio effects.
With regard to the 2021 fiscal year, GEA is expecting:
Outlook* fiscal year 2021 Expectations for 2021 (pro-forma) 2020 2020
Revenue development (organic) 0 to 5%
(slightly rising) EUR 4,635 million EUR 4,635 million
EBITDA before restructuring measures (at constant exchange rates) EUR 530 – 580 million EUR 532 million EUR 532 million
ROCE (at constant exchange rates) 16.0 – 20.0% 17.1% 17.1%
*) For revenue, “slight” corresponds to a change of up to +/- 5%, while a change of more than +/- 5% is referred to as “significant”.
GEA is expecting the following trends to materialize for the individual divisions:
Revenue development (organic)* (in EUR million) Expectations for 2021 (pro-forma) 2020 2020
Separation & Flow Technologies slightly declining 1,182 1,192
Liquid & Powder Technologies slightly rising 1,532 1,666
Food & Healthcare Technologies slightly rising 961 895
Farm Technologies slightly rising 595 625
Refrigeration Technologies slightly declining 665 663
Consolidation – –299 –405
*) For revenue, “slight” corresponds to a change of up to +/- 5%, while a change of more than +/- 5% is referred to as “significant”.
120GEA Annual Report 2020
Report on Expected Developments
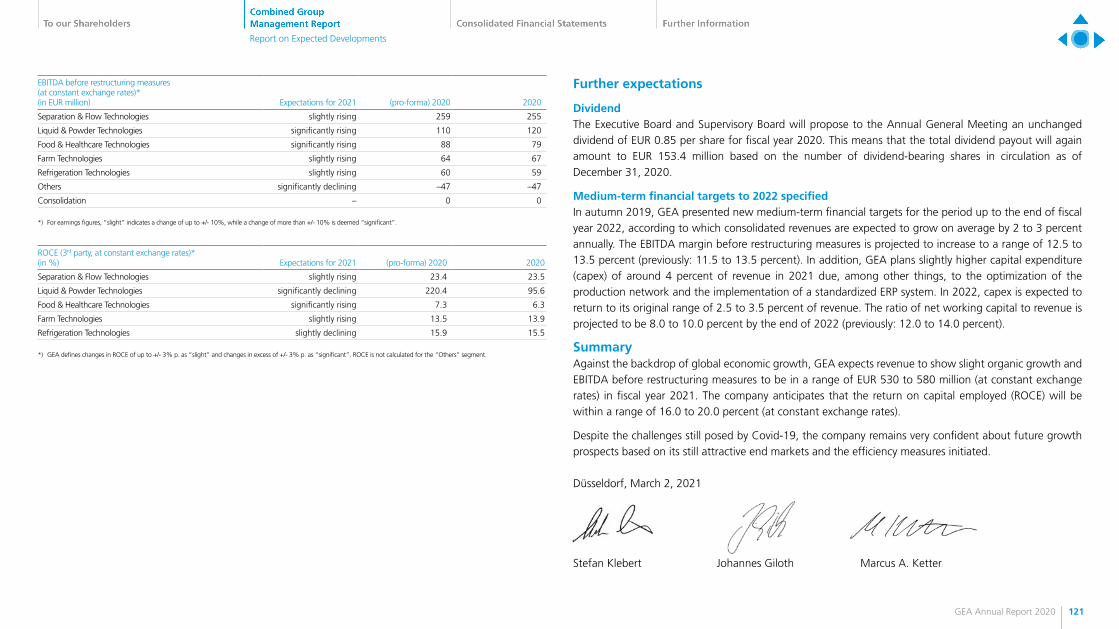
EBITDA before restructuring measures (at constant exchange rates)* (in EUR million) Expectations for 2021 (pro-forma) 2020 2020
Separation & Flow Technologies slightly rising 259 255
Liquid & Powder Technologies significantly rising 110 120
Food & Healthcare Technologies significantly rising 88 79
Farm Technologies slightly rising 64 67
Refrigeration Technologies slightly rising 60 59
Others significantly declining –47 –47
Consolidation – 0 0
*) For earnings figures, “slight” indicates a change of up to +/- 10%, while a change of more than +/- 10% is deemed “significant”.
ROCE (3rd party, at constant exchange rates)* (in %) Expectations for 2021 (pro-forma) 2020 2020
Separation & Flow Technologies slightly rising 23.4 23.5
Liquid & Powder Technologies significantly declining 220.4 95.6
Food & Healthcare Technologies significantly rising 7.3 6.3
Farm Technologies slightly rising 13.5 13.9
Refrigeration Technologies slightly declining 15.9 15.5
*) GEA defines changes in ROCE of up to +/- 3% p. as “slight” and changes in excess of +/- 3% p. as “significant”. ROCE is not calculated for the “Others” segment.
Further expectations
DividendThe Executive Board and Supervisory Board will propose to the Annual General Meeting an unchanged dividend of EUR 0.85 per share for fiscal year 2020. This means that the total dividend payout will again amount to EUR 153.4 million based on the number of dividend-bearing shares in circulation as of December 31, 2020.
Medium-term financial targets to 2022 specifiedIn autumn 2019, GEA presented new medium-term financial targets for the period up to the end of fiscal year 2022, according to which consolidated revenues are expected to grow on average by 2 to 3 percent annually. The EBITDA margin before restructuring measures is projected to increase to a range of 12.5 to 13.5 percent (previously: 11.5 to 13.5 percent). In addition, GEA plans slightly higher capital expenditure (capex) of around 4 percent of revenue in 2021 due, among other things, to the optimization of the production network and the implementation of a standardized ERP system. In 2022, capex is expected to return to its original range of 2.5 to 3.5 percent of revenue. The ratio of net working capital to revenue is projected to be 8.0 to 10.0 percent by the end of 2022 (previously: 12.0 to 14.0 percent).
SummaryAgainst the backdrop of global economic growth, GEA expects revenue to show slight organic growth and EBITDA before restructuring measures to be in a range of EUR 530 to 580 million (at constant exchange rates) in fiscal year 2021. The company anticipates that the return on capital employed (ROCE) will be within a range of 16.0 to 20.0 percent (at constant exchange rates).
Despite the challenges still posed by Covid-19, the company remains very confident about future growth prospects based on its still attractive end markets and the efficiency measures initiated.
Düsseldorf, March 2, 2021
Stefan Klebert Johannes Giloth Marcus A. Ketter
121GEA Annual Report 2020
Report on Expected Developments

122GEA Annual Report 2020
Consolidated Balance Sheet 123Consolidated Income Statement 124Consolidated Statement of Comprehensive Income 125Consolidated Cash Flow Statement 126Consolidated Statement of Changes in Equity 127Notes to the Consolidated Financial Statements 128 1. Reporting Principles 128 2. Accounting Policies, Estimates and Management Judgment 130
3. Risk Management and Financial Instruments 142 4. Divestments 152
5. Consolidated Balance Sheet Disclosures: Assets 153 6. Consolidated Balance Sheet Disclosures: Liabilities 162 7. Consolidated Income Statement Disclosures 176 8. Contingent Liabilities, other Financial Obligations, Contingent Assets and Litigation 186 9. Segment Reporting 187 10. Other Disclosures 192 11. Events after the End of the Reporting Period 195 12. Supplemental Disclosures in Accordance with Section 315e of the HGB 196
Consolidated Financial Statements

Consolidated Balance Sheetas of December 31, 2020
Assets(EUR thousand) Section 12/31/2020 12/31/2019
Property, plant and equipment* 5.1 627,791 720,725
Goodwill 5.2 1,502,073 1,512,181
Other intangible assets 5.3 381,845 429,322
Other non-current financial assets* 5.4 51,601 50,339
Other non-current assets* 5.5 2,599 2,518
Deferred taxes 7.7 333,830 351,555
Non-current assets 2,899,739 3,066,640
Inventories 5.6 623,813 741,200
Contract assets 7.1 348,335 413,038
Trade receivables 5.7 744,091 915,078
Income tax receivables 30,119 32,779
Other current financial assets* 5.4 60,624 82,838
Other current assets* 5.5 113,878 104,285
Cash and cash equivalents 5.8 821,852 354,559
Assets held for sale 5.9 44,455 158
Current assets 2,787,167 2,643,935
Total assets 5,686,906 5,710,575
*) The disclosure has been adjusted compared to the 2019 Annual Report
Equity and liabilities(EUR thousand) Section 12/31/2020 12/31/2019
Subscribed capital 520,376 520,376
Capital reserve 1,217,861 1,217,861
Retained earnings 177,152 265,176
Accumulated other comprehensive income 5,642 86,260
Equity attributable to shareholders of GEA Group AG 1,921,031 2,089,673
Non-controlling interests 418 421
Equity 6.1 1,921,449 2,090,094
Non-current provisions 6.2 132,762 124,656
Non-current employee benefit obligations 6.3 888,560 866,200
Non-current financial liabilities* 6.4 518,824 444,123
Non-current contract liabilities 7.1 86 272
Other non-current liablities* 6.6 875 1,290
Deferred taxes 7.7 98,573 104,282
Non-current liabilities 1,639,680 1,540,823
Current provisions 6.2 207,671 177,884
Current employee benefit obligations 6.3 220,308 235,214
Current financial liabilities* 6.4 193,809 189,533
Trade payables 6.5 666,794 741,956
Current contract liabilities 7.1 682,265 639,435
Income tax liabilities 43,852 34,005
Other current liabilities* 6.6 83,695 61,631
Liabilities held for sale 5.9 27,383 –
Current liabilities 2,125,777 2,079,658
Total equity and liabilities 5,686,906 5,710,575
*) The disclosure has been adjusted compared to the 2019 Annual Report
123GEA Annual Report 2020
Consolidated Balance Sheet

Consolidated Income Statement for the period January 1 – December 31, 2020
(EUR thousand) Section01/01/2020 -
12/31/202001/01/2019 -
12/31/2019
Revenue 7.1 4,635,054 4,879,702
Cost of sales 3,218,967 3,478,497
Gross profit 1,416,087 1,401,205
Selling expenses 546,620 615,324
Research and development expenses 98,268 90,733
General and administrative expenses 499,045 516,036
Other income 7.2 453,640 338,829
Other expenses 7.3 465,022 608,747
Net result from impairment and reversal of impairment on trade receivables and contract assets –37,706 –17,813
Other financial income* 7.5 3,497 3,025
Other financial expenses* 7.6 5,379 3,491
Earnings before interest and tax (EBIT) 221,184 –109,085
Interest income 7.5 4,562 15,333
Interest expense 7.6 28,638 31,770
Profit before tax from continuing operations 197,108 –125,522
Income taxes 7.7 89,108 61,032
thereof current taxes 72,300 82,332
thereof deferred taxes 16,808 –21,300
Profit after tax from continuing operations 108,000 –186,554
Profit or loss after tax from discontinued operations 7.8 –11,175 15,883
Profit for the period 96,825 –170,671
thereof attributable to shareholders of GEA Group AG 96,829 –170,575
thereof attributable to non-controlling interests –4 –96
*) The disclosure for the share of profit or loss of at-equity investments has been adjusted compared to the 2019 annual report
(EUR)01/01/2020 -
12/31/202001/01/2019 -
12/31/2019
Basic and diluted earnings per share from continuing operations 0.60 –1.03
Basic and diluted earnings per share from discontinued operations –0.06 0.09
Basic and diluted earnings per share 7.9 0.54 –0.95
Weighted average number of ordinary shares used to calculate basic and diluted earnings per share (million) 180.5 180.5
124GEA Annual Report 2020
Consolidated Income Statement

Consolidated Statement of Comprehensive Incomefor the period January 1 – December 31, 2020
(EUR thousand) Section01/01/2020 -
12/31/202001/01/2019 -
12/31/2019
Profit for the period 96,825 –170,671
Items, that will not be reclassified to profit or loss in the future:
Actuarial gains/losses on pension and other post-employment benefit obligations 6.3.1 –32,300 –58,523
thereof changes in actuarial gains and losses –42,267 –83,547
thereof tax effect 9,967 25,024
Items, that were reclassified to profit or loss or will be reclassified subsequently
Exchange differences on translating foreign operations –81,425 23,579
thereof changes in unrealized gains and losses –81,067 23,305
thereof realized gains and losses –358 274
Result from fair value measurement of financial instruments –8,379 687
thereof changes in unrealized gains and losses –11,464 982
thereof tax effect 3,085 –295
Reclassification in profit or loss from fair value measurement of financial instruments 8,379 –687
thereof net result from impairment and reversal of impairment on financial assets 11,464 –982
thereof tax effect –3,085 295
Result of cash flow hedges 101 –
thereof changes in unrealized gains and losses 3.4 145 –
thereof tax effect –44 –
Other comprehensive income –113,624 –34,944
Total comprehensive income –16,799 –205,615
thereof attributable to GEA Group AG shareholders –16,795 –205,519
thereof attributable to non-controlling interests –4 –96
125GEA Annual Report 2020
Consolidated Statement of Comprehensive Income

(EUR thousand) Section01/01/2020 -
12/31/202001/01/2019 -
12/31/2019
Profit for the period 96,825 –170,671
plus income taxes 89,108 61,032
minus profit or loss after tax from discontinued operations 11,175 –15,883
Profit before tax from continuing operations 197,108 –125,522
Net interest income 24,076 16,437
Earnings before interest and tax (EBIT) 221,184 –109,085
Depreciation, amortization, impairment losses, and reversal of impairment losses on non-current assets 257,150 483,458
Other non-cash income and expenses 41,861 30,070
Employee benefit obligations from defined benefit pension plans –46,522 –40,740
Change in provisions and other employee benefit obligations 41,397 119,163
Losses and disposal of non-current assets –337 –3,542
Change in inventories including unbilled construction contracts* 177,052 30,787
Change in trade receivables 106,086 19,537
Change in trade payables –41,571 8,730
Change in other operating assets and liabilities 21,323 14,222
Tax payments –59,780 –69,371
Cash flow from operating activities of continued operations 717,843 483,229
Cash flow from operating activities of discontinued operations –2,625 –5,230
Cash flow from operating activities 715,218 477,999
Proceeds from disposal of non-current assets 3,847 8,163
Payments to acquire property, plant and equipment, and intangible assets –97,584 –136,962
Payments from non-current financial assets –37 –4,471
Interest income 2,127 1,967
Dividend income 1,325 2,931
Payments from sale of subsidiaries and other businesses 4.2 –1,878 –12,630
Cash flow from investing activities of continued operations –92,200 –141,002
(EUR thousand) Section01/01/2020 -
12/31/202001/01/2019 -
12/31/2019
Cash flow from investing activities of discontinued operations 1,000 –6,600
Cash flow from investing activities –91,200 –147,602
Dividend payments –153,418 –153,418
Payments from lease liabilities –62,362 –63,483
Proceeds from finance loans 143,164 258,978
Repayments of finance loans –50,000 –253,100
Interest payments –15,968 –15,015
Cash flow from financing activities of continued operations –138,584 –226,038
Cash flow from financing activities of discontinued operations –55 –66
Cash flow from financing activities –138,639 –226,104
Effect of exchange rate changes on cash and cash equivalents –17,714 2,411
Change in unrestricted cash and cash equivalents 467,665 106,704
Unrestricted cash and cash equivalents at beginning of period 354,179 247,475
Unrestricted cash and cash equivalents at end of period 821,844 354,179
Restricted cash and cash equivalents 5.8 114 380
Cash and cash equivalents total 821,958 354,559
less cash and cash equivalents classified as held for sale –106 –
Cash and cash equivalents reported in the balance sheet 5.8 821,852 354,559
*) Including advanced payments received.
Consolidated Cash Flow Statementfor the period January 1 – December 31, 2020
126GEA Annual Report 2020
Consolidated Cash Flow Statement

Consolidated Statement of Changes in Equityas of December 31, 2020
Accumulated other comprehensive income
(EUR thousand) Subscribed capital Capital reserves Retained earningsTranslation of
foreign operations
Result from fair value measurement of
financial instrumentsResult of
cash flow hedges
Equity attributable to shareholders
of GEA Group AGNon-controlling
interests Total
Balance at Jan. 1, 2019(180,492,172 shares) 520,376 1,217,861 647,950 62,681 – – 2,448,868 568 2,449,436
Profit for the period – – –170,575 – – – –170,575 –96 –170,671
Other comprehensive income – – –58,523 23,579 – – –34,944 – –34,944
Total comprehensive income – – –229,098 23,579 – – –205,519 –96 –205,615
Dividend payment by GEA Group Aktiengesellschaft – – –153,418 – – – –153,418 – –153,418
Adjustment Hyperinflation* – – 1,890 – – – 1,890 – 1,890
Changes in combined Group – – –2,148 – – – –2,148 – –2,148
Change in non-controlling interests – – – – – – – –51 –51
Balance at Dec. 31, 2019(180,492,172 shares) 520,376 1,217,861 265,176 86,260 – – 2,089,673 421 2,090,094
Profit for the period – – 96,829 – – – 96,829 –4 96,825
Other comprehensive income – – –32,300 –81,425 – 101 –113,624 – –113,624
Total comprehensive income – – 64,529 –81,425 – 101 –16,795 –4 –16,799
Dividend payment by GEA Group Aktiengesellschaft – – –153,418 – – – –153,418 – –153,418
Adjustment Hyperinflation* – – 614 706 – – 1,320 – 1,320
Changes in combined Group – – 251 – – – 251 – 251
Change in non-controlling interests – – – – – – – 1 1
Balance at Dec. 31, 2020(180,492,172 shares) 520,376 1,217,861 177,152 5,541 – 101 1,921,031 418 1,921,449
*) Effect of accounting for Hyperinflation in Argentina.
127GEA Annual Report 2020
Consolidated Statement of Changes in Equity

Notes to the Consolidated Financial Statements
1. Reporting Principles
1.1 Basis of presentationThe accompanying consolidated financial statements include GEA Group Aktiengesellschaft, Peter-Müller-Strasse 12, 40468 Düsseldorf/Germany (entry HRB 65691 in the commercial register of the Local Court of Düsseldorf) and its subsidiaries, which together make up the GEA Group (“GEA” in short). GEA Group Aktiengesellschaft is a listed corporation. The consolidated financial statements were prepared in accordance with International Financial Reporting Standards (IFRS) and related Interpretations issued by the International Accounting Standards Board (IASB), as adopted by the EU in compliance with Regulation (EC) No. 1606/2002 of the European Parliament and of the Council on the application of international accounting standards. The disclosures pertaining to section 315e of the Handelsgesetzbuch (HGB – German Commercial Code) are contained in the Notes to the Consolidated Financial Statements.
The accompanying consolidated financial statements have been prepared in euros (EUR). Unless otherwise stated, all amounts, including the prior-year figures, are presented in thousands of euros (EUR thousand). All amounts have been rounded using standard rounding rules. Adding together individual amounts may therefore result in differences in the order of EUR 1 thousand in certain cases.
To improve the clarity of presentation, various items in the consolidated balance sheet and income statement have been aggregated and are explained accordingly in the notes. Assets and liabilities are classified as current and non-current items. The income statement is prepared using the cost of sales method.
The cash flow statement is prepared using the indirect method for cash flow from operating activities and the direct method for cash flow from investing and financing activities.
The Executive Board of GEA Group Aktiengesellschaft prepared these consolidated financial statements and released them for publication on March 2, 2021.
1.2 First-time adoption of financial reporting standardsThe financial reporting standards presented below were applied by GEA for the first time in the year under review:
Standard/InterpretationApplicable to fiscal years
beginning on or after
Conceptual framework
Amendments to references to the conceptual framework in IFRS standards(issued by the IASB in March 2018) January 1, 2020
IFRS 3Amendments to IFRS 3 “Business Combinations”(issued by the IASB in October 2018) January 1, 2020
IAS 1 and IAS 8
Amendments to IAS 1 “Presentation of Financial Statements” and to IAS 8 “Accounting Policies, Changes in Accounting Estimates and Errors” concerning the definition of materiality(issued by the IASB in October 2018) January 1, 2020
IFRS 16
Amendments to IFRS 16 “Leases” – Covid-19-Related Rent Concessions (issued by the IASB in May 2020)
June 1, 2020(retroactive application as of
January 1, 2020)
IFRS 9, IAS 39 and IFRS 7
Interest Rate Benchmark Reform – Phase 1 (amendments to IFRS 9, IAS 39 and IFRS 7)(issued by the IASB in September 2019) January 1, 2020
The initial application of these reporting standards had no significant impact on the consolidated financial statements.
128GEA Annual Report 2020
Notes to the Consolidated Financial Statements 1. Reporting Principles

1.3 Financial reporting standards not yet appliedThe financial reporting standards and interpretations as well as amendments to existing standards and interpretations presented below were issued but not yet mandatory to be applied to the preparation of the IFRS consolidated financial statements as of December 31, 2020.
Unless otherwise stated, the new standards and interpretations have been adopted into EU law. GEA will not be applying the new standards and interpretations prematurely.
Standard/InterpretationApplicable to fiscal years
beginning on or after
IFRS 10 and IAS 28
Amendments to IFRS 10 and IAS 28 - Sale or Contribution of Assets between an Investor and its Associate or Joint Venture(issued by the IASB in September 2014)
Initial application date postponed indefinitely by IASB
IAS 1Amendments to IAS 1 “Presentation of Financial Statements”(issued by the IASB in January 2020, July 2020 and February 2021)
January 1, 2023(subject to endorsement by the EU)
IFRS 3Amendments to IFRS 3 “Business Combinations”(issued by the IASB in May 2020)
January 1, 2022(subject to endorsement by the EU)
IAS 16
Amendments to IAS 16 “Property, Plant and Equipment” – Proceeds before Intended Use (issued by the IASB in May 2020)
January 1, 2022(subject to endorsement by the EU)
IAS 37
Amendments to IAS 37 “Provisions, Contingent Liabilities and Contingent Assets” – Onerous Contracts – Cost of Fulfilling a Contract (issued by the IASB in May 2020)
January 1, 2022(subject to endorsement by the EU)
IFRS 1, IFRS 9, IFRS 16 and IAS 41
Improvements to IFRSs 2018–2020 Cycle – amendments under the lASB’s annual improvements project (issued by the IASB in May 2020)
January 1, 2022(subject to endorsement by the EU)
IFRS 9, IAS 39, IFRS 7, IFRS 4 and IFRS 16
Interest Rate Benchmark Reform – Phase 2 (amendments to IFRS 9, IAS 39, IFRS 7, IFRS 4 and IFRS 16) (issued by the IASB in August 2020) January 1, 2021
IAS 8
Amendments to IAS 8 „Accounting policies, changes in accounting estimates and errors“ - Definition of Accounting Estimates(issued by the IASB in February 2021)
January 1, 2023(subject to endorsement by the EU)
GEA is currently examining the impact of the revised accounting standards on the consolidated financial statements. GEA does not currently expect any significant impact from their initial application.
129GEA Annual Report 2020
Notes to the Consolidated Financial Statements 1. Reporting Principles

2. Accounting Policies, Estimates and Management Judgment
Basis of consolidationGEA’s consolidated financial statements include all significant companies in which GEA Group Aktiengesellschaft directly or indirectly holds the majority of voting rights or otherwise directly or indirectly controls, for example based on contractual arrangements. Control exists when GEA is exposed, or has rights, to variable returns from involvement with the investee on the one hand, and has the ability to affect those returns through its power over the investee on the other.
Acquired subsidiaries are accounted for using the acquisition method. The consideration and contingent consideration transferred on acquisition as well as the identifiable net assets acquired are generally measured at fair value. Subsequent changes in fair value are recognized in profit or loss. This does not apply to adjustments to provisional figures made during the measurement period.
The difference between the consideration transferred and the interest acquired in the net assets measured at fair value is recognized as goodwill.
The consolidated group changed as follows in fiscal year 2020:
Number of companies 2020 2019
Consolidated group as of January 1 197 206
German companies (including GEA Group AG) 29 29
Foreign companies 168 177
Initial consolidation* 2 1
Merger –2 –2
Liquidation –4 –3
Sale –2 –3
Deconsolidation –3 –2
Consolidated group as of December 31 188 197
German companies (including GEA Group AG) 28 29
Foreign companies 160 168
*) Refers to the initial consolidation of GEA Internal Services GmbH and GEA Peruana SAC
A total of 47 subsidiaries (previous year: 44) were not consolidated since their effect on the group’s net assets, financial position, and results of operations is not material even when viewed in the aggregate. Their consolidated revenue amounts to 0.1 percent (previous year: 0.1 percent) of the group’s aggregate consolidated revenue, while their earnings account for 0.0 percent (previous year: -1.0 percent) of recognized earnings before tax of the complete group, and their equity accounts for 1.2 percent (previous year: 1.1 percent) of consolidated equity. The subsidiaries are measured at cost and recognized as other non-current financial assets, as their fair value cannot be determined with sufficient certainty.
A complete list of all subsidiaries, associates and joint ventures can be found in section 12.4.
130GEA Annual Report 2020
Notes to the Consolidated Financial Statements 2. Accounting Policies, Estimates and Management Judgment

Investments in associates and joint venturesAssociates are entities over which a group company can exercise significant influence, namely by participating in the investee’s financial and operating policy decisions. This generally relates to companies in which GEA directly or indirectly holds 20 to 50 percent of the voting rights.
Joint ventures are joint arrangements whereby the parties involved have joint control over the arrangement and rights to its net assets. Joint control exists when decisions about the relevant activities of the joint arrangement require the unanimous consent of GEA and the other parties that collectively control the arrangement.
Associates and joint ventures are accounted for using the equity method at the group’s share of adjusted equity. They are initially recognized at cost. Any goodwill arising on acquisition is included in the carrying amount of the investment.
GEA’s share in the earnings of equity-accounted investments in associates and joint ventures is recognized in the income statement within other financial income and other financial expenses. The share of changes not recognized in profit or loss is recognized in other comprehensive income.
Interests in associates and joint ventures are reported in the balance sheet under other non-current financial assets.
As of the reporting date, one investment in associates (previous year: one) and four investments in joint ventures (previous year: four) were accounted for using the equity method.
AcquisitionsGoodwill is reported in the balance sheet as a result of acquisitions. When an acquired company is initially consolidated, all its identifiable assets, liabilities, and contingent liabilities are recognized at their acquisition-date fair value. A basic problem is estimating these fair values. As a rule, land and buildings are measured on the basis of independent appraisals. If intangible assets are identified, their fair values are calculated using an appropriate measurement method. These measurements are made on the basis of assumptions by management with respect to the future value of the relevant assets and the discount rate. Obligations for contingent consideration are recognized on the basis of the current forecast.
Currency translationThe group companies prepare their annual financial statements on the basis of their respective functional currencies.
Foreign currency transactions entered into by companies included in the consolidated financial statements are translated into the functional currency at the exchange rate prevailing at the transaction date. Monetary assets and liabilities are translated at the applicable exchange rate at each reporting date. The exchange rate gains and losses resulting from these items are generally reported in the income statement under other income or expenses.
All financial statements of companies whose functional currencies differ from the reporting currency are translated into the reporting currency used in GEA’s consolidated financial statements. The assets and liabilities of the companies included in the consolidated financial statements are translated at the middle rates prevailing at the reporting date. The income statements of these companies are translated at the average rates for the period under review. If these average rates are not a reasonable approximation of the actual transaction rates, the income statements are translated at the relevant transaction rates. In the case of countries with high levels of inflation, currencies are always translated at the closing rate. Any translation differences are reported in equity under other comprehensive income and adjusted.
131GEA Annual Report 2020
Notes to the Consolidated Financial Statements 2. Accounting Policies, Estimates and Management Judgment

Property, plant and equipmentItems of property, plant and equipment are carried at cost less cumulative depreciation and impairment losses, plus reversals of impairment losses.
Items of property, plant and equipment are depreciated on a straight-line basis using the relevant residual values and the following useful lives:
Useful life in years
Buildings and parts of buildings 2 to 50
Technical equipment and machinery, other equipment 2 to 25
Operating and office equipment 2 to 40
Expenses for major regular maintenance are amortized over the remaining useful life of the asset concerned or over the period to the next maintenance date.
Please refer to the section “Impairment losses on property, plant and equipment, and intangible assets” for information on the impairment of property, plant and equipment.
LeasesGEA assesses at contract inception whether a contract is, or contains, a lease.
As lessee, GEA recognizes the cost of the right-of-use asset in the amount of the present value of the future lease payments plus directly attributable costs at the commencement date. The right-of-use asset is depreciated over the lease term (scheduled depreciation) and adjusted, where necessary, for impairment losses and any re-measurement of lease liabilities. If ownership passes to GEA at the end of the lease term, e.g., because the company has exercised a purchase option, the underlying asset is subject to scheduled depreciation over its useful life.
At the commencement date, a liability equal to the present value of future lease payments must be recognized for each lease agreement. Rather than separating leasing from non-leasing components, GEA accounts for each leasing component and all its associated non-leasing components as a single leasing component.
Essentially, as the lessee, GEA uses the incremental borrowing rate for discounting future lease payments, since the rate implicit in the lease cannot easily be determined. During the term of the lease, the lease liability is measured using the effective interest method.
GEA has concluded several leasing agreements, mainly in the real estate area, that include renewal and termination options. While some of its vehicle lease arrangements feature purchase options. Contractual terms of this kind offer GEA maximum operational flexibility. In assessing whether GEA is reasonably certain or not to exercise such options, GEA takes all facts and circumstances into consideration that are relevant in financial terms.
The lease liabilities are remeasured if there is a change in the assessment of purchase, renewal or termination options, or if adjustments to lease payments are made.
GEA intends to apply the relevant recognition exemption to leased assets of low value and to short-term leases (agreements of 12 months and less), which means that lease expenses will be recognized for such arrangements. GEA has decided against voluntarily applying IFRS 16 to its intangible assets.
The group discloses right-of-use assets within property, plant and equipment in the same balance sheet item as the underlying assets, in the same way as if they were owned by GEA. GEA is disclosing lease liabilities as part of its financial liabilities.
Material lease agreements are to be found primarily in the areas of real estate and vehicles. The average residual term of real-estate lease agreements is around two years, while for vehicle leases it is around two years.
132GEA Annual Report 2020
Notes to the Consolidated Financial Statements 2. Accounting Policies, Estimates and Management Judgment

Where GEA is the lessor, leases are classified either as finance or operating leases. Leases which essentially transfer all risks and rewards associated with ownership of the asset are classified as finance leases. A receivable is reported in the amount of the net investment under the lease. The interest income subsequently generated is recognized in profit or loss. All other lease transactions in which the group is the lessor are treated as operating leases. In this case, the asset leased for use remains on the balance sheet and is amortized. The lease payments are recognized as income using the straight-line method over the term of the lease.
Please refer to the section “Impairment losses on property, plant and equipment, and intangible assets” for information on the impairment of right-of-use assets.
Investment propertyProperty that is held to earn rentals or for capital appreciation is reported as investment property. In the case of property that is held partly to generate rental income and partly to produce or supply goods or services, or for administrative purposes, the entire property is classified as investment property if the own use proportion is insignificant. This is assumed to be the case if the proportion is below 10 percent.
Cost is depreciated using the straight-line method over a period of between 10 and 50 years. Please refer to the section “Impairment losses on property, plant and equipment, and intangible assets” for information on the impairment of investment property.
Investment property is reported in the balance sheet under property, plant and equipment.
GoodwillGoodwill arising from business combinations is recognized as an intangible asset.
Due to the change in management structure in fiscal year 2020, the goodwill attributable to the former Business Areas, Equipment and Solutions, was reallocated to the new Divisions based on relative values at the time of the restructuring on January 1, 2020.
Separation & Flow Technologies
Liquid & PowderTechnologies
Food & Healthcare Technologies
FarmTechnologies
RefrigerationTechnologies
Goodwill-carrying cash-generating units in
the GEA Group
Please refer to the section “Impairment losses on property, plant and equipment, and intangible assets” for information on the impairment of goodwill.
Other intangible assetsOther intangible assets include both internally generated and purchased assets. Internally generated intangible assets comprise capitalized development costs and internally developed software. In addition to contract-based rights, purchased intangible assets mainly contain technologies, brand names, and customer relationships. Technologies, brand names and customer relationships are usually acquired in connection with takeovers. Internally generated and purchased intangible assets are recognized at cost.
133GEA Annual Report 2020
Notes to the Consolidated Financial Statements 2. Accounting Policies, Estimates and Management Judgment

Intangible assets with finite useful lives are amortized on a straight-line basis using the following useful lives:
Useful life in years
Market-related intangible assets 2 to 20
Customer-related intangible assets 2 to 15
Contract-based intangible assets 2 to 20
Technology-based intangible assets 2 to 25
Internally generated intangible assets 2 to 10
Intangible assets with an indefinite useful life are also examined each year to determine whether the classification of the asset as indefinite-lived can be retained. Any change to a finite useful life is applied prospectively. Please refer to the section “Impairment losses on property, plant and equipment, and intangible assets” for information on the impairment of other intangible assets.
Impairment losses on property, plant and equipment, and intangible assetsThe carrying amounts of intangible assets, items of property, plant and equipment, and cash-generating units with goodwill are reviewed if they are likely to have been impaired by events or changes in circumstances. In addition, intangible assets with an indefinite useful life and cash-generating units with goodwill are tested for impairment at least once a year.
The impairment test compares the asset’s carrying amount against its recoverable amount (“impairment test”). The recoverable amount is defined as the higher of internal value in use and fair value less costs of disposal (net realizable value). Estimating the fair value less costs of disposal is only necessary if the value in use is lower than the carrying amount. If the carrying amount exceeds the recoverable amount, an impairment loss in the amount of the difference is recognized. In this case, the impairment loss is first deducted from the goodwill of the cash-generating unit with goodwill. Any amount exceeding goodwill is allocated proportionately to the carrying amounts of non-current non-financial assets. Fair value less costs of disposal is generally the benchmark for measuring the impairment of business units classified as “held for sale”.
The recognition and measurement of other intangible assets is based on management assumptions, since they are partially measured using the discounted cash flow method for the cash generating unit in whose balance sheet the asset is recognized.
Previously recognized impairment losses are reversed if the reasons for the impairment no longer apply, except in the case of goodwill. Impairment losses are reversed up to a maximum of the amortized historical cost.
Other financial assetsOther financial assets include other equity investments, other securities, financial receivables (except trade receivables) and derivative financial instruments.
Other financial assets are recognized as soon as GEA receives a cash payment or is entitled to receive cash flows. In the case of regular way purchases of non-derivative financial assets, the settlement date, i.e. the delivery date of the financial assets, is decisive. Assets are derecognized as soon as the right to receive cash payments or other financial assets expires as a result of payment, waiver, statutory limitation, offsetting, or any other factor, or the right is transferred to another person, with the risks passing in full to the purchaser. In the case of regular way sales of non-derivative financial assets, the settlement date is taken to be the date of derecognition, in line with the principle used for recognition.
Items are originally recognized at fair value or, in the case of financial assets not measured at fair value, including directly attributable transaction costs.
134GEA Annual Report 2020
Notes to the Consolidated Financial Statements 2. Accounting Policies, Estimates and Management Judgment
Other equity investments not held for sale are allocated to the “at fair value through other comprehensive income” (FVOCI) measurement category. In some cases, the acquisition costs can be an appropriate estimate of the fair value. This can be the case if there is not enough current information available to measure fair value, or if there is a wide range of potential measurements for the fair value and the acquisition costs correspond to the best estimate of the fair value within that range.
Securitized debt instruments and other financial assets are to be classified on the basis of the company’s business model for managing these assets and on the assets’ contractual cash flow characteristics, and measured at amortized cost or at fair value. Any fluctuation in value during fair-value measurement are recognized either through profit or loss or through other comprehensive income.
Financial assets measured at amortized cost are measured by applying the effective interest method in subsequent periods, and are to be tested for impairments. Gains and losses are recognized in profit or loss if the asset is derecognized, modified or impaired.
In the case of debt instruments measured at fair value through other comprehensive income, any interest income, re-measurements of currency translation gains/losses, and impairment losses/reversals of impairment losses are carried in the income statement and calculated in the same way as financial assets measured at amortized cost. The remaining changes in fair value are recognized in other comprehensive income. When the asset is derecognized, the accumulated gain or loss resulting from changes in fair value are reclassified to the income statement.
Derivative financial instruments are used exclusively for hedging purposes, in particular to hedge currency risk. They are always carried at fair value. If derivative financial instruments are not included in a designated hedging relationship, they are allocated to the “Measured at fair value through profit or loss” (FVTPL) category, and their fair value changes are recognized through profit or loss.
Other assetsOther assets are recognized at the settlement amount.
TaxesDeferred taxes are recognized for temporary differences between the carrying amounts in the respective national tax accounts and those in the IFRS financial statements that are included in the consolidated financial statements, as well as on consolidation transactions and tax loss carryforwards.
When assessing the recoverability of deferred tax assets, management judges the extent to which realization of the deferred tax assets is sufficiently likely. The question of whether the deferred tax assets can actually be realized depends on whether sufficient future taxable income can be generated against which the temporary differences or tax loss carryforwards can be offset. Management therefore analyzes the timing of the reversal of deferred tax liabilities and expected future taxable income. Management expects that deferred tax assets can be realized on the basis of expected future taxable income. Deferred tax assets decline if the estimate of planned taxable income decreases, if tax benefits available as a result of tax strategies are reduced, or if the amount or timing of future tax benefits is restricted by changes in the law (see section 7.7).
Deferred tax assets and liabilities are offset if there is a legally enforceable right to set off current tax assets against current tax liabilities and if the deferred taxes relate to income taxes levied by the same taxation authority.
Deferred tax liabilities are not recognized on taxable temporary differences arising from investments in subsidiaries, associates, or joint ventures as long as the company is able to control the timing of the reversal of temporary differences, and reversal is unlikely in the foreseeable future.
135GEA Annual Report 2020
Notes to the Consolidated Financial Statements 2. Accounting Policies, Estimates and Management Judgment

GEA operates in a large number of countries and is therefore subject to different tax jurisdictions. Calculating tax liabilities requires management to make various estimates. Management believes that it has made a reasonable estimate of tax uncertainties. However, no assurance can be given that the actual outcome of these uncertainties will correspond to the estimates made. Any deviations may have an impact on the level of tax liabilities or deferred taxes in the year of the decision.
InventoriesInventories are recognized at the lower of cost and net realizable value. Acquisition cost is calculated at average cost or using the first-in, first-out (FIFO) method. Production cost includes direct costs plus materials and production overheads, depreciation, and production-related administrative costs. Net realizable value is calculated as the estimated sale proceeds less costs incurred until completion and selling expenses. Previously recognized impairment losses must be reversed if the reasons for the impairment no longer apply. Impairment losses are reversed up to a maximum of the amortized historical cost.
Costs of obtaining customer-specific project contracts (which are to be capitalized under IFRS 15) are carried in inventories and subject to scheduled amortization over the contract term. In cases where the amortization period would amount to one year or less, the incremental costs of obtaining a contract are expensed immediately.
Trade receivablesTrade receivables include no interest component and are recognized in the balance sheet at their principal amount less appropriate impairments.
Trade receivables that are sold to financial services companies under factoring agreements are derecognized once substantially all the risks and rewards have been transferred to the financial services company.
The classification and measurement of trade receivables are subject to the same criteria used for the other financial assets. Due to existing factoring arrangements, certain trade receivables are classified as “measured at fair value through other comprehensive income” (FVOCI).
Individual trade receivables are tested for indications of impairment at each reporting date. The assessment of impairment risks is subject to uncertainty and is partly influenced by management judgment. Impairment losses are recognized in profit or loss. An impairment loss is recognized in the amount of the expected lifetime credit defaults. Further information on credit risks in connection with trade receivables can be found in section 3.
Cash and cash equivalentsCash and cash equivalents comprise cash, demand deposits, and financial assets that can be converted into cash at any time and that are subject to only slight fluctuations in value. Depending on the company’s business model for managing these financial assets and on the assets’ contractual cash flow characteristics, cash equivalents are recognized either at amortized cost or at fair value using the effective interest method. Any fluctuation in value during fair-value measurement are recognized either through profit or loss or through other comprehensive income.
Assets held for sale, liabilities held for sale, and discontinued operations A non-current asset or a disposal group is classified as “held for sale” when its carrying amount is to be recovered principally through a sale transaction rather than through continued use. These are reported separately in the balance sheet as “assets held for sale” or “liabilities held for sale”. On initial classification as “held for sale”, non-current assets or assets and liabilities of disposal groups are first measured in accordance with the applicable IFRS. They are then measured at the lower of their carrying amount and fair value less costs to sell. Disposal groups are measured in aggregate. These assets cease to be depreciated when they are classified as “held for sale”.
136GEA Annual Report 2020
Notes to the Consolidated Financial Statements 2. Accounting Policies, Estimates and Management Judgment

If a disposal group represents a separate major line of business or geographical area of operation, it qualifies as a discontinued operation whose income and cash flows are reported separately in the income statement and cash flow statement respectively. Prior-year figures are also adjusted accordingly. Revenue and expenditures from intra-group transactions are taken into account when presenting results from discontinued operations if they continue to be incurred after the disposal of a discontinued operation. As a general principle, the disclosures in the notes to the consolidated financial statements relate to the assets or liabilities recognized in the corresponding line items and to continuing operations. Where disclosures relate to GEA, including assets held for sale, as well as the associated liabilities, and discontinued operations, this is indicated either by a statement that the disclosures refer to the complete group, or by another comment.
Subscribed capitalOrdinary shares are classified as equity. In fiscal years when treasury shares are held, these are deducted from the equity attributable to the shareholders of GEA Group Aktiengesellschaft.
Obligations under pension plansObligations under pension plans relate to post-employment benefit obligations. Defined benefit obligations are calculated using the projected unit credit method. The present value of these obligations reflects expected future wage, salary and pension trends, since the entitlements achievable in the period up to the retirement age depend on these. The present value of the pension obligations is also based on further actuarial assumptions, namely the discount rate and mortality rates. Claims under supplementary healthcare benefit insurance are included in the actuarial measurement of assumptions made in respect of healthcare cost trends. The actuarial assumptions could differ significantly from actual future outcomes as a result of changes in market and economic conditions, and could therefore have a material effect on the level of the obligation and the related expenses. The pension obligations are measured on the basis of actuarial reports by independent actuaries.
In order to provide these pension benefits, the company in some cases holds financial assets in long-term funds outside GEA or has taken out qualifying insurance policies. To the extent that entitlements are funded by such external assets (plan assets), their fair value is offset against the present value of the defined benefit obligation. The resulting balance is reported under non-current employee benefit obligations or other non-current financial assets (net carrying amount). The discount rate used to measure the net carrying amount is calculated at the end of each year. This is the rate used to calculate the present value of future cash outflows expected to be required to settle the obligation. In order to calculate the discount rate, the group uses the interest rate on high-quality corporate bonds denominated in the same currency in which the benefits are paid and whose terms to maturity correspond to those of the pension obligations.
Other significant assumptions relating to pension obligations are partly based on market conditions (see section 6.3.1).
Actuarial gains and losses from the re-measurement of the net carrying amount are recognized in other comprehensive income in the year in which they arise and reported in retained earnings after adjustment for tax effects. This also applies to the recognition of the difference between the actual returns on plan assets and the returns calculated using the discount factor. Costs from unwinding the discount on the net carrying amount are recognized in interest expenses; income is recognized in interest income. Current and past service cost for the period as well as gains and losses from settlements are recognized in the relevant function costs.
Other employee benefit obligationsOther employee benefit obligations comprise other long-term benefits and all short-term benefits. Short-term employee benefit obligations are expected to be settled in full no more than 12 months after completion of the service rendered. They include wages, salaries, social insurance contributions, paid vacation, and profit-sharing arrangements. They are recognized as an expense at the same time as the remunerated work or service is discharged. Any expenditure in excess of the payments already made is reported as a deferred liability at the reporting date. Other long-term employee benefits, such as jubilee payments or partial retirement arrangements, are recognized at the actuarial present value of the obligation at the reporting date. Securities are pledged to the beneficiaries to protect vested partial retirement credits against the employer’s insolvency. The fair value of these securities is offset against the corresponding liability.
137GEA Annual Report 2020
Notes to the Consolidated Financial Statements 2. Accounting Policies, Estimates and Management Judgment

Also reported under other employee benefit obligations are liabilities in respect of severance payments and social plans resulting from, among other things, obligations in connection with restructuring provisions.
Restructuring provisionsRestructuring provisions are recognized as soon as the company has a constructive obligation to carry out restructuring measures, having given notice of the restructuring plan to the parties affected. In assessing whether the criteria for recognition have been met, the management must make certain assumptions as to whether the announcement has given rise to valid expectations among the parties affected that the company will carry out the restructuring, and whether major changes to the restructuring plan are anticipated.
In order to determine the amount of the restructuring provisions, management must, above all, estimate the amount of the expected severance payments. To this end, the management must make assumptions with regard to the wage structure and length of service of the employees affected by the cuts, as well as to the manner in which the downsizing program is to be implemented. Severance obligations recognized in this context are reported under the employee benefit obligations.
ProvisionsProvisions for uncertain liabilities are recognized when there is a legal or constructive obligation to a third party, a future outflow of resources is likely, and the expected settlement value can be estimated reliably. The present value of the settlement amount is recognized if the interest rate effect is material. Amounts are discounted at the market rates for the appropriate maturity and currency. Discount unwinding costs are reported in interest expense.
Changes in estimates of the probability of a present obligation, in the outflow of resources embodying economic benefits, and in the interest rate applicable could mean that items previously classified as contingent liabilities must be reported as provisions, or that the amount of provisions must be adjusted (see section 6.2). In the area of environmental protection and mining, in particular, the applicable interest rate has a significant impact on the amount of the provisions. In some cases, the duration of the expected obligations is far longer than the period for which interest rates with corresponding residual terms are available on the market. GEA therefore derives the interest rate to be applied for the appropriate term on the basis of reliable and most recently available historical market data over an extended period under review.
When establishing warranty provisions, the warranty expense at the time when the reserve is recognized is reported in cost of sales. In all other cases, provisions are recognized when the product is accepted. The provision is measured on the basis of both the warranty expense actually incurred in the past and on the evaluated overall risk inherent in the system or product. Provisions are also recognized if a claim is made under a warranty and a loss is likely. Recourse claims against suppliers are capitalized if their services are subject to a warranty and it is highly likely that the claim can be enforced.
Provisions for expected losses from onerous contracts are recognized if the unavoidable costs of meeting the obligations under the contract exceed the economic benefits expected to be received under it. The unavoidable costs also include the unavoidable overheads needed to meet the contractual obligations.
In some cases, GEA companies are parties to litigation. The outcome of these litigations could have a material effect on the group’s net assets, financial position, and results of operations. Management regularly analyzes current information on these legal disputes and recognizes provisions for probable obligations, including estimated legal costs. Both internal counsel and external lawyers are used for making this assessment. When deciding on the need to recognize provisions, management takes into account the probability of an unfavorable outcome and its ability to estimate the amount of the obligation with sufficient reliability. The filing of a suit or the formal assertion of a claim against a GEA company does not necessarily mean that a provision must be recognized for the related risk (see section 8.1).
138GEA Annual Report 2020
Notes to the Consolidated Financial Statements 2. Accounting Policies, Estimates and Management Judgment

Financial liabilitiesFinancial liabilities include borrower’s note loans, liabilities to banks, lease liabilities and other financial liabilities. Initial recognition is at fair value, less transaction costs incurred. They are subsequently measured at amortized cost using the effective interest method. Lease liabilities are initially measured at the present value of the future leasing payments. The financial liabilities also include derivative financial instruments measured at fair value.
Other liabilitiesOther liabilities that solely consist of non-financial liabilities are recognized at the settlement amount.
Contract assets and liabilitiesContract assets are recognized if the contract costs incurred and the gains recognized exceed the progress billings and advance payments received or due. Advance payments on orders and the gross amount due to customers for contract work are carried under “contract liabilities”. Advance payments on orders are stated at their principal amount. If the advance payments received or due exceed the capitalized costs and recognized gains, less the progress billings at the reporting date, they are reported as a liability under contract liabilities.
Trade payablesTrade payables also include liabilities for goods received or services rendered that have not yet been invoiced, as there is only slight uncertainty as to the amount of the liability. Trade payables are recognized at fair value. This corresponds to the settlement amount in the case of liabilities due within one year.
GEA participates in a Supply Chain Finance (SCF) program. Under this program, GEA’s suppliers can sell their receivables to a bank to receive earlier payment. The participating bank agrees to pay invoiced amounts owed by GEA to the participating suppliers and to receive payment from GEA at a later date. The aim of this program is to facilitate the efficient processing of payments.
This agreement does not result in any material changes to the liabilities that are subject to it, nor does it provide for a legal exemption. As a result of this program, these liabilities are not derecognized. From GEA’s perspective, the agreement does not significantly extend invoice payment terms beyond those that are customary in the market. GEA does not incur any additional interest charges on the payment of trade payables to the bank. Amounts related to suppliers that are subject to factoring are therefore
reported under trade payables, as the nature and purpose of such financial liabilities correspond to other trade payables.
Revenue recognition GEA reports revenue according to three revenue types, namely construction contracts, components business and services: • Revenues from construction contracts are recognized over time in accordance with IFRS 15 (“percentage-
of-completion method”), since the customer obtains control through their specifications over the duration of the contract and because GEA is entitled to reimbursement of the costs incurred so far, plus an appropriate margin, if the customer cancels a contract. The percentage of completion is determined using the cost-to-cost method, which is derived from the ratio of contract costs incurred to the total estimated contract costs as of the reporting date. Contract costs include direct costs plus materials and construction overheads, depreciation, production-related administrative costs, and such other costs that are specifically chargeable to the customer under the terms of the contract. Adjustments are made for variations in contract work, claims, and incentive payments insofar as these will probably result in revenue that is capable of being reliably estimated. Changes in estimates or differences between the estimated cost and the actual cost have a direct impact on recognized earnings from construction contracts. In addition, estimation limits must be observed. In line with this method, construction contracts are measured at the amount of the contract costs incurred as of the reporting date plus the profit attributable to the proportion of work completed. The costs incurred and the related profits are reported under contract assets, less progress billings and advance payments received or due. If, while a performance obligation is being satisfied, the contract costs incurred are not proportionate to the progress of the performance of said contract, revenues will be recognized only to the extent of the contract costs incurred (“zero-profit method”). A profit is only recognized when the contract costs incurred are matched by corresponding progress of the performance of the contract. Contract costs are recognized as an expense in the period in which they are incurred. If it is foreseeable that total contract costs will exceed contract revenue, the expected loss is expensed as an impending loss according to IAS 37.
139GEA Annual Report 2020
Notes to the Consolidated Financial Statements 2. Accounting Policies, Estimates and Management Judgment

• Revenue from the sale of components is recognized when such components are transferred to the customer and the contractual performance obligations are therefore met. Performance obligations are satisfied as the customer obtains control over the sold goods, i.e. when they can direct the use of and obtain essentially all of the remaining benefits from the goods.
• Revenue from services is recognized over the period in which the service is performed.
Revenue is measured at the fair value of the consideration received or to be received. Customer bonuses, discounts, or rebates reduce the amount of revenue recognized. Payments for differences in the overall contract, claims, and premiums are included in the contract revenue as variable components. The amount of such payments is calculated at contract inception using the “expected-value” method – if there are several different possible amounts – or the “most likely amount” method – if there are just two possible amounts. The effects of significant financing components can be ignored when determining the amount of revenue to be recognized if the vendor expects, at contract inception, that the period between the transfer of a promised good or service to the customer and the date of payment will be one year or less. Discretion must be applied when judging whether or not revenues are to be recognized “over time”, as well as with regard to the allocation of the transaction price to the performance obligation. Where stand-alone selling prices are not directly observable, these are estimated.
Share-based remunerationGEA provides share-based payment programs for the Executive Board and selected managers in the form of cash-settled plans, which are recognized as an expense over the vesting period. Entitlements under these plans are recognized at fair value as of the reporting date. Changes in the fair value of the provision for share-based payment programs are recognized as an interest expense or interest income (see section 6.3.3).
Research and developmentResearch expenditures are recognized immediately as an expense. Development expenses intended to significantly enhance a product or process are capitalized, provided that the recognition criteria of IAS 38 are satisfied. All other development expenditures are recognized immediately as expenses. Capitalized development expenditures for completed projects are reported at cost less cumulative amortization and impairment losses. Capitalized development costs for intangible assets not yet available for use are tested for impairment once a year.
Development costs that incur in connection with conctruction contracts are capitalized as contract costs.
Government grantsGovernment grants are recognized at fair value, provided the group meets the conditions necessary to receive the grant. Government grants covering expenses such as compensation for reduced hours are recognized over the period in which such costs are incurred. Government grants for capital expenditure are deducted from the acquisition cost of the respective asset.
140GEA Annual Report 2020
Notes to the Consolidated Financial Statements 2. Accounting Policies, Estimates and Management Judgment

Accounting in high-inflation economiesFinancial statements are adjusted on the basis of historical costs of acquisition and sales, whereby line items in the balance sheet that are not yet expressed in a monetary unit must be translated using a general price index. The same applies to income and expenses. Translation of monetary assets and liabilities is not required if they are subject by contractual arrangement to changes in price or are expressed as current values.
The following table shows material estimates and management judgment:
Significant estimates and judgments
Goodwill and other intangible assets*
• Valuation based on management assumptions using the discounted cash flow method • Determination of the discount rate based on capital market parameters • Determination of future cash flows
Taxes • Management’s assessment of the recoverability of deferred tax assets, taking into account the timing of the reversal of deferred tax liabilities and the expected future taxable income in the period under review
Restructuring Provisions • Management‘s assessment of whether there is a valid expectation that the restructuring will be implemented and whether there are significant changes to the restructuring plan
• Estimation of the amount of expected severance payments, taking into account management‘s assumptions regarding the salary structure, length of service of the employees affected by the reduction in force and the manner in which the reduction in force will be implemented
Provisions and contingent liabilities
• Consideration of the probability of an unfavorable outcome and the ability to estimate the amount of the obligation with sufficient reliability in management‘s decision on whether to recognize a provision
• Recognition of items previously classified as contingent liabilities as provisions or changes in the amount of provisions due to changes in the probability estimate of a present obligation and the economic outflow of resources
• Derivation of the interest rate to be applied on the basis of reliable and most recently available historical market data over an extended period of time for provisions where the duration of the expected obligation is far in excess of the period for which interest rates with corresponding residual terms can be read directly from the market
Obligations from pensions plans • Determination of the present value taking into account actuarial assumptions • Determination of the discount rate of the net balance sheet amount on the basis of the interest rate of industrial bonds with a high credit rating, which are denominated in the currency in which the benefits are also paid and whose maturities correspond to those of the pension obligations
Classification and measurement according to IFRS 5
• Consideration of all events and circumstances relevant to assessing the timing of classification of a non-current asset or disposal group as “held for sale”
• Measurement at the lower of carrying amount and fair value less costs to sell
Trade receivables* • Determination of impairment losses in the amount of the loan losses expected over the entire remaining term of maturity
Revenue recognition • Determination of the stage of completion from the ratio of contract costs incurred up to the reporting date to the total contract costs estimated at the reporting date („cost-to-cost“ method) when revenue is recognized over time
• Determination of revenues from variable components on the basis of the expected value method or of the most probable amount method
*) Affected by „Covid-19“ The effects on estimates and discretionary decisions are presented in the respective section.
141GEA Annual Report 2020
Notes to the Consolidated Financial Statements 2. Accounting Policies, Estimates and Management Judgment

3. Risk Management and Financial Instruments
3.1. Financial Risk ManagementBasic information concerning financial risk management is provided in the management report within the section entitled “Report on Risks and Opportunities” - subsection “Financial Risks.”
Credit riskImpairments on financial instruments measured at fair value through other comprehensive income amounted to EUR 18,939 thousand (previous year: EUR 7,281 thousand) as of the reporting date.
The maximum default risk is limited to the carrying amount of the financial instruments and the contract assets.
Additional information concerning credit risks in general is provided in the section entitled “Report on Risks and Opportunities - subsection “Financial Risks.”
Trade receivables and contract assetsGEA applies the “simplified approach” to trade receivables and contract assets, and recognizes lifetime expected credit losses as soon as the assets are recorded. In the context of this simplified approach, GEA determines expected credit losses broken down by risk categories, while taking historic loss rates into account. Assignment to a specific risk category is based on common credit risk characteristics. For GEA, these are the customer’s geographical location and the aging structure of the related assets. In order to take forward-looking information into account, historic loss rates were adjusted using scaling factors. These were based on predictions of the gross domestic product (GDP) of the corresponding regions. Considering the adjusted loss rates, the weighted average scaling factor is 1.3 as of December 31, 2020. as of December 31, 2019, it was 1.1.
Contract assets relate to work in progress that has not yet been invoiced. Essentially, they exhibit the same risk characteristics as trade receivables for the same types of contracts. GEA has thus concluded that the expected loss rates for trade receivables that are not overdue constitute a best estimate with which to represent the loss rates applicable to contract assets.
An individual impairment is made when one or more events have occurred that sustainably affect the debtor’s financial standing. These events include delays in payment, threat of insolvency, and concessions made by the debtor due to payment difficulties.
Trade receivables and contract assets are derecognized immediately when there is reasonable doubt as to their realizability. This is the case, for instance, if the debtor is found to be insolvent.
The table below shows the expected credit losses on trade receivables and contract assets not creditimpaired as of December 31, 2020:
(EUR thousand)Gross carrying
amountWeighted average
loss rate Range of loss rates Loss allowance
Not overdue 923,993 1.04% 0,20% - 4,40% 9,571
of which contract assets 351,709 0.96% 0,20% - 4,40% 3,374
of which trade receivables 572,284 1.08% 0,20% - 4,40% 6,197
Overdue (trade receivables) 140,802 5.58% 0,70% - 75,00% 7,863
of which overdue less than 181 130,223 3.45% 0,70% - 14,20% 4,494
of which overdue between 181 and 360 5,928 15.69% 3,90% - 36,90% 930
of which overdue between 361 and 720 2,965 39.60% 8,30% - 61,40% 1,174
of which overdue more than 720 1,686 75.00% 75,00% 1,265
Total 1,064,795 17,434
The table below shows the expected credit losses on trade receivables and contract assets not creditimpaired as of December 31, 2019:
(EUR thousand)Gross carrying
amountWeighted average
loss rate Range of loss rates Loss allowance
Not overdue 1,011,975 0.07% 0,02% - 0,16% 694
of which contract assets 407,928 0.03% 0,02% - 0,16% 130
of which trade receivables 604,047 0.09% 0,02% - 0,16% 564
Overdue (trade receivables) 257,289 0.27% 0,07% - 0,46% 692
Total 1,269,264 1,386
142GEA Annual Report 2020
Notes to the Consolidated Financial Statements 3. Risk Management and Financial Instruments

In the second half of fiscal year 2020, GEA adjusted the loss rates applied to trade receivables and contract assets that are not credit-impaired in the application of the simplified approach. This change of an accounting estimate is based on an adjustment of the relevant input parameters to derive the historical loss rates.
The change of an accounting estimate results in an increase in the impairments of EUR 9,046 thousand for the 2020 fiscal year when compared with the application of the previous input parameters.
The table below reconciles the impairments on trade receivables and contract assets as of January 1 with the impairments as of December 31:
2020 2019
Impairments as of January 1 75,246 66,424
Derecognition –18,600 –9,593
Expenses from remeasurement of impairments (Reversal) –5,865 –12,303
Income from remeasurement of impairments (Addition) 43,571 30,116
Exchange rate effects –4,803 361
Other changes –192 241
Impairments as of December 31 89,357 75,246
The other changes relate to effects from the change in the scope of consolidation as well as the reclassification of the associated assets as “assets held for sale.”
During the 2020 fiscal year, the change in the impairments was essentially related to trade receivables and contract assets, not creditimpaired. This was due to the change in accounting estimate as described above. At EUR 5,290 thousand, the largest increase in the impairments was attributable to the North America region. Further material increases of EUR 3,208 thousand were attributable to the DACH and Eastern Europe region and EUR 3,449 thousand to the Western Europe, Middle East and Africa region. In the remaining regions, impairments rose by EUR 2,164 thousand.
During the 2019 fiscal year, the change in the impairments was essentially related to credit-impaired trade receivables and contract assets. In the Asia Pacific region, impairment losses rose by EUR 5,545 thousand and in the remaining regions by EUR 3,277 thousand.
In fiscal year 2020, trade receivables with a contractual amount of EUR 240 thousand (previous year: EUR 274 thousand) were still subject to enforcement activity.
Any collateral for trade receivables or contract assets had no material effect on the scale of the impairments calculated.
Additional information concerning credit risks related to trade receivables and contract assets are provided in the section entitled “Report on Risks and Opportunities” - subsection “Financial Risks.”
Cash and cash equivalentsThe impairment on cash and cash equivalents was calculated on the basis of expected credit losses within a 12-month period. External ratings and short remaining maturities lead GEA to believe that the credit risk pertaining to its cash and cash equivalents is low. No significant impairments on cash and cash equivalents were identified in fiscal year 2020.
Additional information concerning credit risks in connection with cash and cash equivalents is provided in the section entitled “Report on Risks and Opportunities” - subsection “Financial Risks.”
Other financial assetsGEA calculates expected credit losses on its other financial assets according to risk categories, while taking published credit ratings and credit default swaps into account. Assignment to a specific risk category is based on the geographical location of the counterparty. As soon as the assets are recognized, the estimated impairment is calculated on the basis of expected losses within a 12-month period. GEA assumes that the credit risk has increased significantly if the credit risk deteriorates by two rating levels within a fiscal year. In that case, the expected credit losses over the entire remaining lifetime are recorded.
The procedures for impairments on an individual basis and the derecognition of other financial assets are comparable with those applied to trade receivables and contract assets.
So as to reduce the credit risk involved, derivative financial instruments are only entered into with reputable financial institutions.
143GEA Annual Report 2020
Notes to the Consolidated Financial Statements 3. Risk Management and Financial Instruments
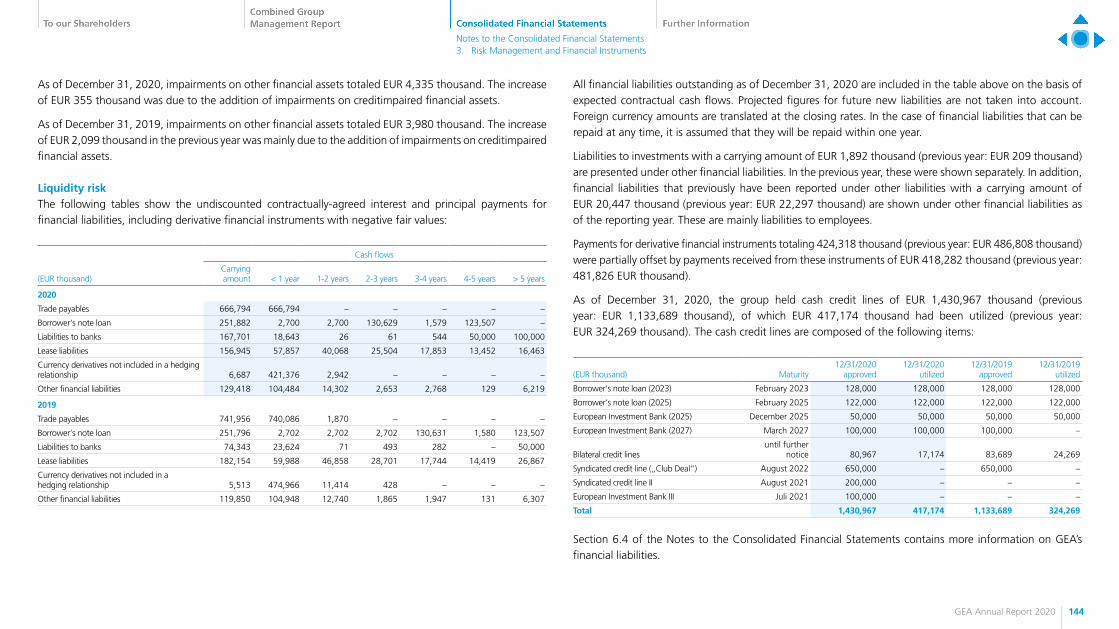
As of December 31, 2020, impairments on other financial assets totaled EUR 4,335 thousand. The increase of EUR 355 thousand was due to the addition of impairments on creditimpaired financial assets.
As of December 31, 2019, impairments on other financial assets totaled EUR 3,980 thousand. The increase of EUR 2,099 thousand in the previous year was mainly due to the addition of impairments on creditimpaired financial assets.
Liquidity riskThe following tables show the undiscounted contractually-agreed interest and principal payments for financial liabilities, including derivative financial instruments with negative fair values:
Cash flows
(EUR thousand)Carrying amount < 1 year 1-2 years 2-3 years 3-4 years 4-5 years > 5 years
2020
Trade payables 666,794 666,794 – – – – –
Borrower‘s note loan 251,882 2,700 2,700 130,629 1,579 123,507 –
Liabilities to banks 167,701 18,643 26 61 544 50,000 100,000
Lease liabilities 156,945 57,857 40,068 25,504 17,853 13,452 16,463
Currency derivatives not included in a hedging relationship 6,687 421,376 2,942 – – – –
Other financial liabilities 129,418 104,484 14,302 2,653 2,768 129 6,219
2019
Trade payables 741,956 740,086 1,870 – – – –
Borrower‘s note loan 251,796 2,702 2,702 2,702 130,631 1,580 123,507
Liabilities to banks 74,343 23,624 71 493 282 – 50,000
Lease liabilities 182,154 59,988 46,858 28,701 17,744 14,419 26,867
Currency derivatives not included in a hedging relationship 5,513 474,966 11,414 428 – – –
Other financial liabilities 119,850 104,948 12,740 1,865 1,947 131 6,307
All financial liabilities outstanding as of December 31, 2020 are included in the table above on the basis of expected contractual cash flows. Projected figures for future new liabilities are not taken into account. Foreign currency amounts are translated at the closing rates. In the case of financial liabilities that can be repaid at any time, it is assumed that they will be repaid within one year.
Liabilities to investments with a carrying amount of EUR 1,892 thousand (previous year: EUR 209 thousand) are presented under other financial liabilities. In the previous year, these were shown separately. In addition, financial liabilities that previously have been reported under other liabilities with a carrying amount of EUR 20,447 thousand (previous year: EUR 22,297 thousand) are shown under other financial liabilities as of the reporting year. These are mainly liabilities to employees.
Payments for derivative financial instruments totaling 424,318 thousand (previous year: EUR 486,808 thousand) were partially offset by payments received from these instruments of EUR 418,282 thousand (previous year: 481,826 EUR thousand).
As of December 31, 2020, the group held cash credit lines of EUR 1,430,967 thousand (previous year: EUR 1,133,689 thousand), of which EUR 417,174 thousand had been utilized (previous year: EUR 324,269 thousand). The cash credit lines are composed of the following items:
(EUR thousand) Maturity12/31/2020
approved12/31/2020
utilized12/31/2019
approved12/31/2019
utilized
Borrower‘s note loan (2023) February 2023 128,000 128,000 128,000 128,000
Borrower‘s note loan (2025) February 2025 122,000 122,000 122,000 122,000
European Investment Bank (2025) December 2025 50,000 50,000 50,000 50,000
European Investment Bank (2027) March 2027 100,000 100,000 100,000 –
Bilateral credit linesuntil further
notice 80,967 17,174 83,689 24,269
Syndicated credit line („Club Deal“) August 2022 650,000 – 650,000 –
Syndicated credit line II August 2021 200,000 – – –
European Investment Bank III Juli 2021 100,000 – – –
Total 1,430,967 417,174 1,133,689 324,269
Section 6.4 of the Notes to the Consolidated Financial Statements contains more information on GEA’s financial liabilities.
144GEA Annual Report 2020
Notes to the Consolidated Financial Statements 3. Risk Management and Financial Instruments

As of December 31, 2020, guarantee lines for the performance of contracts, advance payments, and warranty obligations of EUR 1,131,314 thousand were available to the group as a whole (previous year: EUR 1,316,415 thousand), EUR 421,072 thousand of which has been utilized (previous year: EUR 425,688 thousand). The guarantees are generally payable at first demand. As is generally the case for this type of order collateral and financing instrument, GEA Group Aktiengesellschaft drew on guarantees only in extremely rare cases in recent years.
As of December 31, 2020, EUR 0 thousand (previous year: EUR 4,731 thousand) of bank guarantees under GEA Group Aktiengesellschaft credit lines were granted to customers of the GEA Heat Exchangers Segment (HX), which was sold as of October 31, 2014, to collateralize the segment’s contractual obligations. The purchaser of the GEA HX segment has granted bank guarantees of EUR 0 thousand (previous year: EUR 1,523 thousand) in favor of GEA Group Aktiengesellschaft to cover the unlikely event of default.
In addition, GEA Group Aktiengesellschaft has issued group guarantees of EUR 41,111 thousand (previous year: EUR 41,215 thousand) to collateralize the GEA HX segment’s contractual obligations. To hedge the risk of claims being made under the guarantees, GEA Group Aktiengesellschaft has received bank guarantees from the purchaser of the GEA HX segment in the amount of EUR 12,347 thousand (previous year: EUR 12,292 thousand).
As of the year-end, EUR 0 thousand (previous year: EUR 0 thousand) of bank guarantees under GEA Group Aktiengesellschaft credit lines and EUR 88,162 thousand (previous year: EUR 96,300 thousand) of group guarantees were granted to Lurgi AG’s customers to collateralize that company’s contractual obligations in the unlikely event of default.
Additional information concerning liquidity risks is provided in the section entitled “Report on Risks and Opportunities - subsection ’Financial Risks.’
Foreign currency risks and foreign currency sensitivity analysisThe foreign currency risk presented in the sensitivity analysis results from the following transactions:
• From recognized foreign currency transactions: The translation of foreign currency receivables or liabilities at the closing rate has a direct effect on profit or loss.
• From currency derivatives: If the hedge has been implmented for economic reasons and is not included in a documented hedging relationship, a corresponding currency risk exposure will have a direct effect on earnings. If currency derivatives are included in documented hedging relationships as “cash-flow-hedges”, a corresponding currency risk exposure will have a direct effect on equity.
The currency pairs in which the major part of the foreign currency cash flows are settled are included as relevant risk variables in the foreign currency sensitivity analysis. The following table shows the sensitivity of a 10 percent increase or decrease in the euro from the perspective of the group:
(EUR thousand) 2020Base currency Foreign currency net risk exposure Profit/loss for the year Equity
+ 10% - 10% + 10% - 10%EUR USD –117,818 10,082 –12,324 557 –680EUR GBP 29,833 –2,711 3,313 – –EUR PLN –18,848 1,718 –2,100 – –EUR CNY 11,774 –920 1,125 131 –160EUR ZAR 11,619 –1,063 1,299 – –EUR NZD –11,250 1,028 –1,257 – –
(EUR thousand) 2019Base currency Foreign currency net risk exposure Profit/loss for the year Equity
+ 10% - 10% + 10% - 10%EUR USD –59,757 5,400 –6,600 – –EUR GBP 52,312 –4,763 5,822 – –EUR CNY 44,143 –3,998 4,887 – –EUR INR 16,497 –1,500 1,833 – –EUR CHF –16,248 1,479 –1,807 – –EUR HKD –14,765 1,371 –1,676 – –
145GEA Annual Report 2020
Notes to the Consolidated Financial Statements 3. Risk Management and Financial Instruments
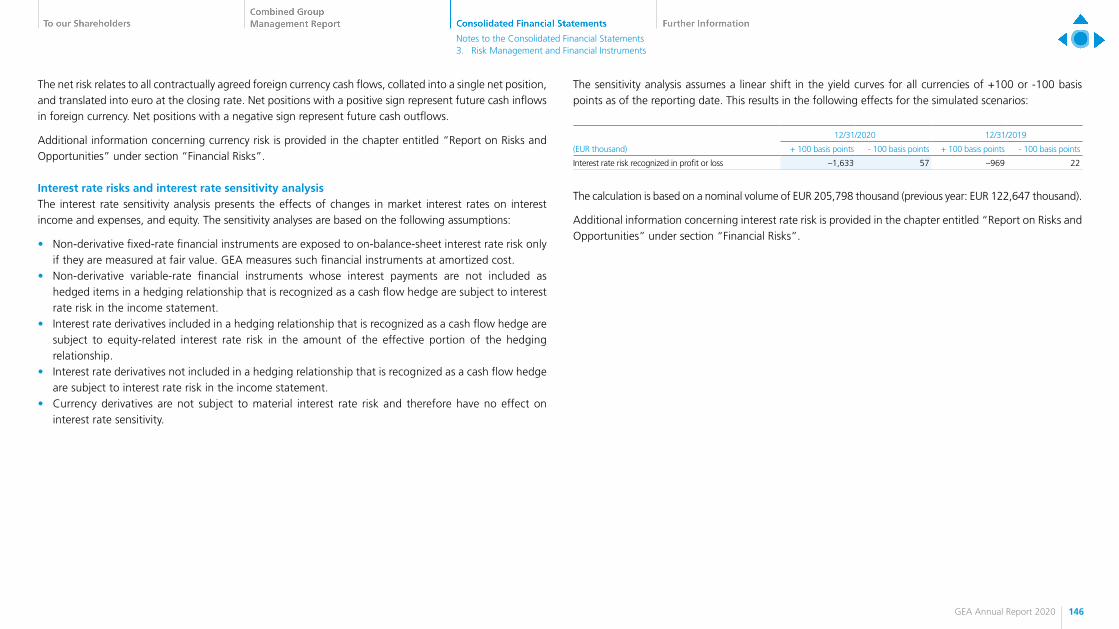
The net risk relates to all contractually agreed foreign currency cash flows, collated into a single net position, and translated into euro at the closing rate. Net positions with a positive sign represent future cash inflows in foreign currency. Net positions with a negative sign represent future cash outflows.
Additional information concerning currency risk is provided in the chapter entitled “Report on Risks and Opportunities” under section “Financial Risks”.
Interest rate risks and interest rate sensitivity analysisThe interest rate sensitivity analysis presents the effects of changes in market interest rates on interest income and expenses, and equity. The sensitivity analyses are based on the following assumptions:
• Non-derivative fixed-rate financial instruments are exposed to on-balance-sheet interest rate risk only if they are measured at fair value. GEA measures such financial instruments at amortized cost.
• Non-derivative variable-rate financial instruments whose interest payments are not included as hedged items in a hedging relationship that is recognized as a cash flow hedge are subject to interest rate risk in the income statement.
• Interest rate derivatives included in a hedging relationship that is recognized as a cash flow hedge are subject to equity-related interest rate risk in the amount of the effective portion of the hedging relationship.
• Interest rate derivatives not included in a hedging relationship that is recognized as a cash flow hedge are subject to interest rate risk in the income statement.
• Currency derivatives are not subject to material interest rate risk and therefore have no effect on interest rate sensitivity.
The sensitivity analysis assumes a linear shift in the yield curves for all currencies of +100 or -100 basis points as of the reporting date. This results in the following effects for the simulated scenarios:
12/31/2020 12/31/2019
(EUR thousand) + 100 basis points - 100 basis points + 100 basis points - 100 basis points
Interest rate risk recognized in profit or loss –1,633 57 –969 22
The calculation is based on a nominal volume of EUR 205,798 thousand (previous year: EUR 122,647 thousand).
Additional information concerning interest rate risk is provided in the chapter entitled “Report on Risks and Opportunities” under section “Financial Risks”.
146GEA Annual Report 2020
Notes to the Consolidated Financial Statements 3. Risk Management and Financial Instruments
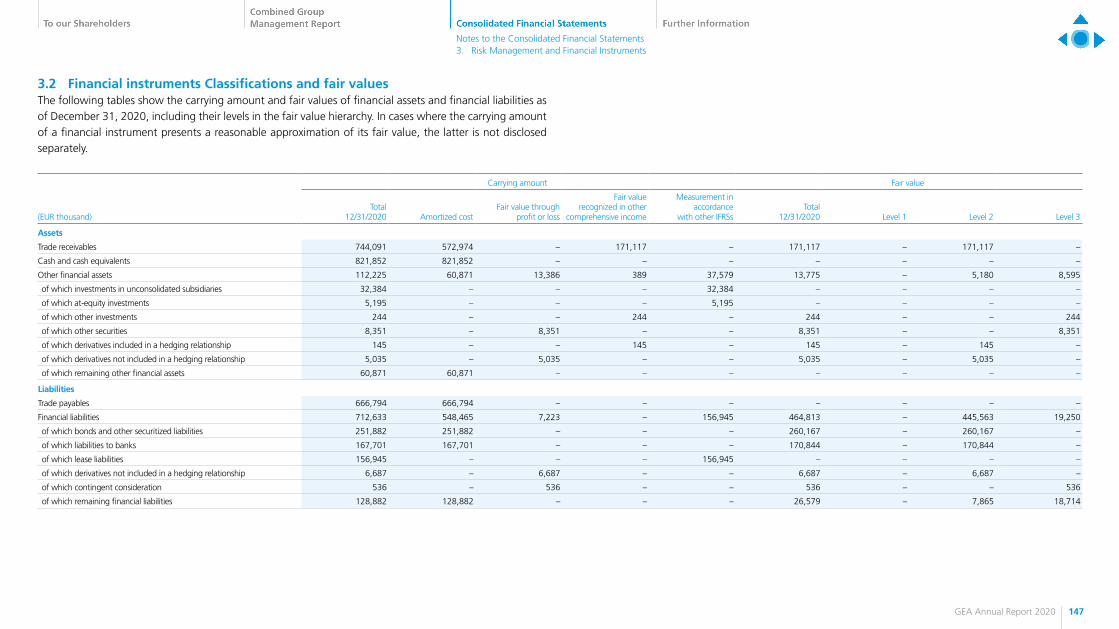
3.2 Financial instruments Classifications and fair valuesThe following tables show the carrying amount and fair values of financial assets and financial liabilities as of December 31, 2020, including their levels in the fair value hierarchy. In cases where the carrying amount of a financial instrument presents a reasonable approximation of its fair value, the latter is not disclosed separately.
Carrying amount Fair value
(EUR thousand)Total
12/31/2020 Amortized costFair value through
profit or loss
Fair value recognized in other
comprehensive income
Measurement in accordance
with other IFRSsTotal
12/31/2020 Level 1 Level 2 Level 3
Assets
Trade receivables 744,091 572,974 – 171,117 – 171,117 – 171,117 –
Cash and cash equivalents 821,852 821,852 – – – – – – –
Other financial assets 112,225 60,871 13,386 389 37,579 13,775 – 5,180 8,595
of which investments in unconsolidated subsidiaries 32,384 – – – 32,384 – – – –
of which at-equity investments 5,195 – – – 5,195 – – – –
of which other investments 244 – – 244 – 244 – – 244
of which other securities 8,351 – 8,351 – – 8,351 – – 8,351
of which derivatives included in a hedging relationship 145 – – 145 – 145 – 145 –
of which derivatives not included in a hedging relationship 5,035 – 5,035 – – 5,035 – 5,035 –
of which remaining other financial assets 60,871 60,871 – – – – – – –
Liabilities
Trade payables 666,794 666,794 – – – – – – –
Financial liabilities 712,633 548,465 7,223 – 156,945 464,813 – 445,563 19,250
of which bonds and other securitized liabilities 251,882 251,882 – – – 260,167 – 260,167 –
of which liabilities to banks 167,701 167,701 – – – 170,844 – 170,844 –
of which lease liabilities 156,945 – – – 156,945 – – – –
of which derivatives not included in a hedging relationship 6,687 – 6,687 – – 6,687 – 6,687 –
of which contingent consideration 536 – 536 – – 536 – – 536
of which remaining financial liabilities 128,882 128,882 – – – 26,579 – 7,865 18,714
147GEA Annual Report 2020
Notes to the Consolidated Financial Statements 3. Risk Management and Financial Instruments

Carrying amount Fair value
(EUR thousand)Total
12/31/2019 Amortized costFair value through
profit or loss
Fair value recognized in other
comprehensive income
Measurement in accordance
with other IFRSsTotal
12/31/2019 Level 1 Level 2 Level 3
Assets
Trade receivables 915,078 802,612 – 112,466 – 112,466 – 112,466 –
Cash and cash equivalents 354,559 354,559 – – – – – – –
Other financial assets 133,177 83,218 12,819 244 36,896 13,063 – 3,856 9,207
of which investments in unconsolidated subsidiaries 31,224 – – – 31,224 – – – –
of which at-equity investments 5,672 – – – 5,672 – – – –
of which other investments 244 – – 244 – 244 – – 244
of which other securities 8,963 – 8,963 – – 8,963 – – 8,963
of which derivatives included in a hedging relationship – – – – – – – – –
of which derivatives not included in a hedging relationship 3,856 – 3,856 – – 3,856 – 3,856 –
of which remaining other financial assets 83,218 83,218 – – – – – – –
Liabilities
Trade payables 741,956 741,956 – – – – – – –
Financial liabilities 633,656 445,555 5,947 – 182,154 374,494 – 353,472 21,022
of which bonds and other securitized liabilities 251,796 251,796 – – – 259,229 – 259,229 –
of which liabilities to banks 74,343 74,343 – – – 75,159 – 75,159 –
of which lease liabilities 182,154 – – – 182,154 – – – –
of which derivatives not included in a hedging relationship 5,513 – 5,513 – – 5,513 – 5,513 –
of which contingent consideration 434 – 434 – – 434 – – 434
of which remaining financial liabilities 119,416 119,416 – – – 34,159 – 13,571 20,588
GEA has adjusted the presentation of other financial assets and financial liabilities as of December 31, 2020. Further information on other financial assets can be found in Note 5.4 to the consolidated financial statements. Further information on financial liabilities can be found in Note 6.4 to the consolidated financial statements.
148GEA Annual Report 2020
Notes to the Consolidated Financial Statements 3. Risk Management and Financial Instruments
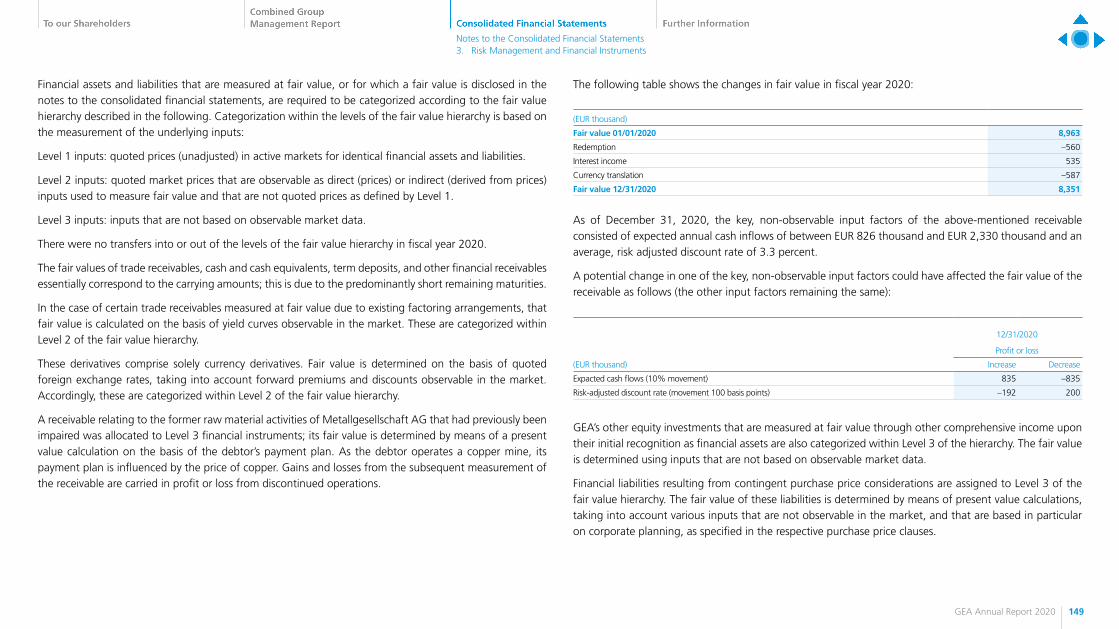
Financial assets and liabilities that are measured at fair value, or for which a fair value is disclosed in the notes to the consolidated financial statements, are required to be categorized according to the fair value hierarchy described in the following. Categorization within the levels of the fair value hierarchy is based on the measurement of the underlying inputs:
Level 1 inputs: quoted prices (unadjusted) in active markets for identical financial assets and liabilities.
Level 2 inputs: quoted market prices that are observable as direct (prices) or indirect (derived from prices) inputs used to measure fair value and that are not quoted prices as defined by Level 1.
Level 3 inputs: inputs that are not based on observable market data.
There were no transfers into or out of the levels of the fair value hierarchy in fiscal year 2020.
The fair values of trade receivables, cash and cash equivalents, term deposits, and other financial receivables essentially correspond to the carrying amounts; this is due to the predominantly short remaining maturities.
In the case of certain trade receivables measured at fair value due to existing factoring arrangements, that fair value is calculated on the basis of yield curves observable in the market. These are categorized within Level 2 of the fair value hierarchy.
These derivatives comprise solely currency derivatives. Fair value is determined on the basis of quoted foreign exchange rates, taking into account forward premiums and discounts observable in the market. Accordingly, these are categorized within Level 2 of the fair value hierarchy.
A receivable relating to the former raw material activities of Metallgesellschaft AG that had previously been impaired was allocated to Level 3 financial instruments; its fair value is determined by means of a present value calculation on the basis of the debtor’s payment plan. As the debtor operates a copper mine, its payment plan is influenced by the price of copper. Gains and losses from the subsequent measurement of the receivable are carried in profit or loss from discontinued operations.
The following table shows the changes in fair value in fiscal year 2020:
(EUR thousand)
Fair value 01/01/2020 8,963
Redemption –560
Interest income 535
Currency translation –587
Fair value 12/31/2020 8,351
As of December 31, 2020, the key, non-observable input factors of the above-mentioned receivable consisted of expected annual cash inflows of between EUR 826 thousand and EUR 2,330 thousand and an average, risk adjusted discount rate of 3.3 percent.
A potential change in one of the key, non-observable input factors could have affected the fair value of the receivable as follows (the other input factors remaining the same):
12/31/2020
Profit or loss
(EUR thousand) Increase Decrease
Expacted cash flows (10% movement) 835 –835
Risk-adjusted discount rate (movement 100 basis points) –192 200
GEA’s other equity investments that are measured at fair value through other comprehensive income upon their initial recognition as financial assets are also categorized within Level 3 of the hierarchy. The fair value is determined using inputs that are not based on observable market data.
Financial liabilities resulting from contingent purchase price considerations are assigned to Level 3 of the fair value hierarchy. The fair value of these liabilities is determined by means of present value calculations, taking into account various inputs that are not observable in the market, and that are based in particular on corporate planning, as specified in the respective purchase price clauses.
149GEA Annual Report 2020
Notes to the Consolidated Financial Statements 3. Risk Management and Financial Instruments

The fair value of borrower’s note loans and liabilities to banks is measured on the basis of the yield curve, taking into account credit spreads. They are therefore categorized within Level 2 of the fair value hierarchy. The interest deferred as of the reporting date is included in the fair values.
Included in other financial liabilities is a contractual obligation undertaken in the context of a company acquisition. The fair value of this debt instrument is determined based on the contractually fixed cash flows using, in contrast to the previous year, the so called “ultimate forward rate” published by the “European Insurance and Occupational Pensions Authority”. As in the previous year, the instrument was assigned to Level 2 of the fair value hierarchy.
Certain other financial liabilities resulting from the sale of the GEA HX segment are categorized within Level 3 of the fair value hierarchy, since their fair value is measured on the basis of the present value of future cash outflows expected on the basis of contractual obligations associated with the sale.
3.3 Financial instruments Income and expensesThe measurement effects from financial instruments have largely been recognized in profit or loss. The following table shows net income from financial instruments, broken down by the IFRS 9 measurement categories:
31.12.2020 31.12.2019
(EUR thousand) Net income
thereof interest income/ expense
thereof impair-ment losses/ reversals of impairment
losses Net income
thereof interest income/ expense
thereof impair-ment losses/ reversals of impairment
losses
Financial assets measured at amortized cost 22,729 2,418 –22,045 21,851 2,538 –14,954
Financial assets measured at fair value recognized in other comprehensive income –11,466 – –11,464 993 – 982
Equity instruments measured at fair value recognized in other comprehensive income 24 – – 17 – –
Financial assets/liabilities measured at fair value through profit or loss –16,731 – – 24,452 – –
Financial liabilities measured at amortized cost –51,338 –13,169 – –43,224 –10,903 –
Total –56,782 –10,751 –33,509 4,089 –8,365 –13,972
150GEA Annual Report 2020
Notes to the Consolidated Financial Statements 3. Risk Management and Financial Instruments

3.4 Derivative financial instruments and netting agreements
Derivative financial instrumentsThe following table presents the notional values and fair values of the derivative financial instruments as of the reporting date. The notional value in foreign currency is translated at the closing rate.
12/31/2020 12/31/2019
(EUR thousand) Notional value Fair value Notional value Fair value
Assets
Currency derivatives not included in a hedging relationship 292,324 5,035 424,452 3,856
Currency derivatives included in a cash flow hedge 7,613 145 – –
Total 299,937 5,180 424,452 3,856
Equity and liabilities
Currency derivatives not included in a hedging relationship 420,001 6,687 486,577 5,513
Currency derivatives included in a cash flow hedge – – – –
Total 420,001 6,687 486,577 5,513
Derivative financial instruments not included in a hedging relationshipDerivatives that are not held for sale and that are not included in recognized hedging relationships are reported here. This item therefore includes derivative financial instruments that are used to hedge currency risks as part of financial risk management, but for which compliance with the hedge accounting requirements of IFRS 9 is not documented (economic hedges). The change in fair value is recognized in profit or loss.
Derivative financial instruments included in a hedging relationshipAs of December 31, 2020, currency derivatives with a volume of EUR 7,631 thousand (previous year: EUR 0 thousand) are designated as cash flow hedges within the group. The related hedged items are future cash inflows denominated in foreign currency from sales transactions.
The cash flow hedging reserve and the cost of hedging reserve totaled EUR 145 thousand as of December 31, 2020 (previous year: EUR 0 thousand). During the 2020 fiscal year, changes in the fair value of hedging instruments amounting to EUR 145 thousand (previous year: EUR 0 thousand) were recognized in accumulated other comprehensive income.
During the current fiscal year, as was the case in the previous year, no amounts were reclassified to profit or loss from the cash flow hedging reserve and the cost of hedging reserve. The same applies to reclassifications to the cost of inventories.
As of December 31, 2020, no derivatives had been designated as fair value hedges. The same applies to the previous year.
Netting agreementsGEA Group Aktiengesellschaft has entered into netting agreements with banks under the German Master Agreement for Financial Derivatives Transactions. As a general rule, the amounts owed under such agreements by each counterparty from all outstanding transactions in the same currency on a single day are aggregated to a single net amount payable by one party to the other. In the event of a credit event, such as late payment, all outstanding transactions under the agreement will be terminated, the value on termination calculated, and a statement of account is prepared on a net basis.
The following table shows the financial assets and liabilities for which the group as a whole has entered into netting agreements:
(EUR thousand)
Gross amounts of financial assets/
liabilties
Net amounts of financial assets/
liabilties, presented in the balance sheet
Respective amounts not netted in the
balance sheet Net amounts
12/31/2020
Receivables from derivatives 4,857 4,857 3,155 1,702
Liabilities from derivatives 6,316 6,316 3,155 3,161
12/31/2019
Receivables from derivatives 3,734 3,734 3,470 264
Liabilities from derivatives 5,433 5,433 3,470 1,963
The receivables and liabilities shown are carried under other financial assets and financial liabilities respectively.
151GEA Annual Report 2020
Notes to the Consolidated Financial Statements 3. Risk Management and Financial Instruments
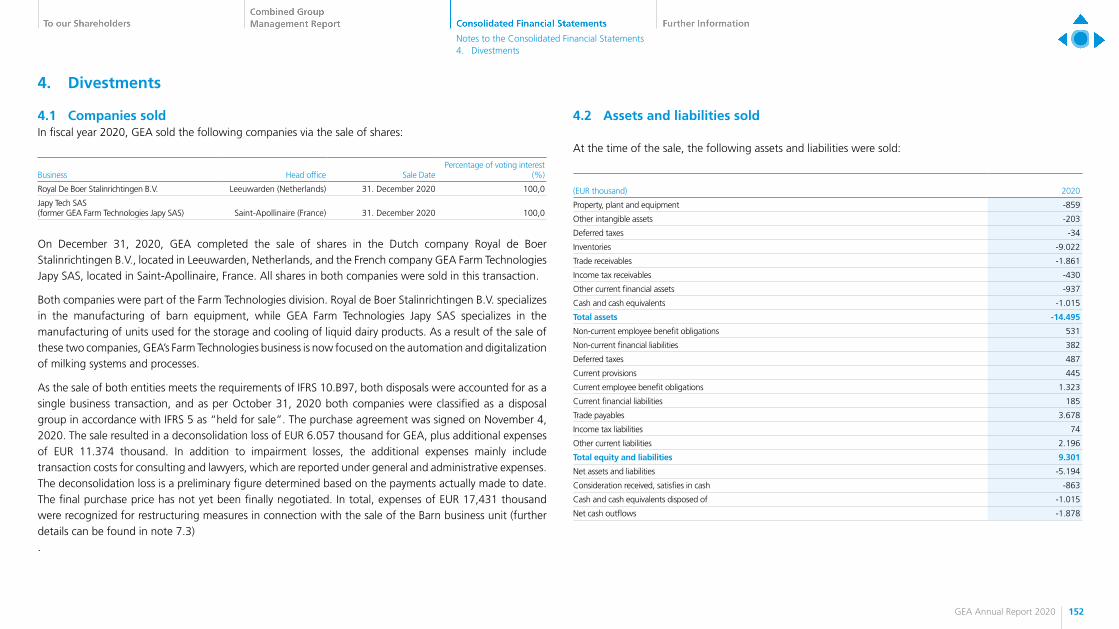
4. Divestments
4.1 Companies soldIn fiscal year 2020, GEA sold the following companies via the sale of shares:
Business Head office Sale DatePercentage of voting interest
(%)
Royal De Boer Stalinrichtingen B.V. Leeuwarden (Netherlands) 31. December 2020 100,0
Japy Tech SAS (former GEA Farm Technologies Japy SAS) Saint-Apollinaire (France) 31. December 2020 100,0
On December 31, 2020, GEA completed the sale of shares in the Dutch company Royal de Boer Stalinrichtingen B.V., located in Leeuwarden, Netherlands, and the French company GEA Farm Technologies Japy SAS, located in Saint-Apollinaire, France. All shares in both companies were sold in this transaction.
Both companies were part of the Farm Technologies division. Royal de Boer Stalinrichtingen B.V. specializes in the manufacturing of barn equipment, while GEA Farm Technologies Japy SAS specializes in the manufacturing of units used for the storage and cooling of liquid dairy products. As a result of the sale of these two companies, GEA’s Farm Technologies business is now focused on the automation and digitalization of milking systems and processes.
As the sale of both entities meets the requirements of IFRS 10.B97, both disposals were accounted for as a single business transaction, and as per October 31, 2020 both companies were classified as a disposal group in accordance with IFRS 5 as “held for sale”. The purchase agreement was signed on November 4, 2020. The sale resulted in a deconsolidation loss of EUR 6.057 thousand for GEA, plus additional expenses of EUR 11.374 thousand. In addition to impairment losses, the additional expenses mainly include transaction costs for consulting and lawyers, which are reported under general and administrative expenses. The deconsolidation loss is a preliminary figure determined based on the payments actually made to date. The final purchase price has not yet been finally negotiated. In total, expenses of EUR 17,431 thousand were recognized for restructuring measures in connection with the sale of the Barn business unit (further details can be found in note 7.3).
4.2 Assets and liabilities sold
At the time of the sale, the following assets and liabilities were sold:
(EUR thousand) 2020
Property, plant and equipment -859
Other intangible assets -203
Deferred taxes -34
Inventories -9.022
Trade receivables -1.861
Income tax receivables -430
Other current financial assets -937
Cash and cash equivalents -1.015
Total assets -14.495
Non-current employee benefit obligations 531
Non-current financial liabilities 382
Deferred taxes 487
Current provisions 445
Current employee benefit obligations 1.323
Current financial liabilities 185
Trade payables 3.678
Income tax liabilities 74
Other current liabilities 2.196
Total equity and liabilities 9.301
Net assets and liabilities -5.194
Consideration received, satisfies in cash -863
Cash and cash equivalents disposed of -1.015
Net cash outflows -1.878
152GEA Annual Report 2020
Notes to the Consolidated Financial Statements 4. Divestments
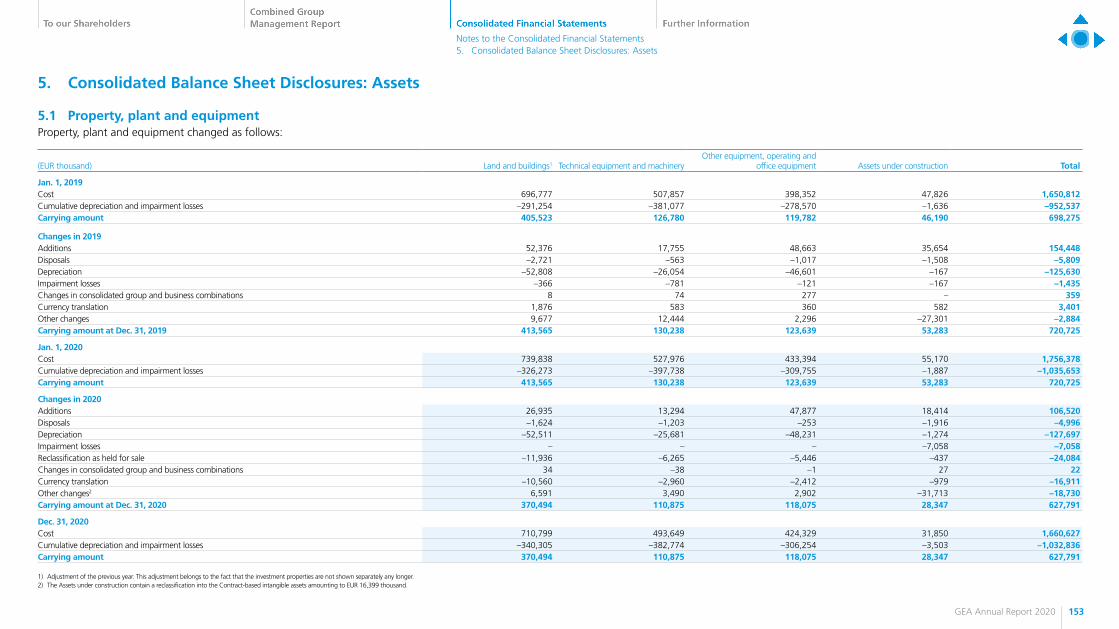
5. Consolidated Balance Sheet Disclosures: Assets
5.1 Property, plant and equipmentProperty, plant and equipment changed as follows:
(EUR thousand) Land and buildings1 Technical equipment and machineryOther equipment, operating and
office equipment Assets under construction Total
Jan. 1, 2019Cost 696,777 507,857 398,352 47,826 1,650,812Cumulative depreciation and impairment losses –291,254 –381,077 –278,570 –1,636 –952,537Carrying amount 405,523 126,780 119,782 46,190 698,275
Changes in 2019Additions 52,376 17,755 48,663 35,654 154,448Disposals –2,721 –563 –1,017 –1,508 –5,809Depreciation –52,808 –26,054 –46,601 –167 –125,630Impairment losses –366 –781 –121 –167 –1,435Changes in consolidated group and business combinations 8 74 277 – 359Currency translation 1,876 583 360 582 3,401Other changes 9,677 12,444 2,296 –27,301 –2,884Carrying amount at Dec. 31, 2019 413,565 130,238 123,639 53,283 720,725
Jan. 1, 2020Cost 739,838 527,976 433,394 55,170 1,756,378Cumulative depreciation and impairment losses –326,273 –397,738 –309,755 –1,887 –1,035,653Carrying amount 413,565 130,238 123,639 53,283 720,725
Changes in 2020Additions 26,935 13,294 47,877 18,414 106,520Disposals –1,624 –1,203 –253 –1,916 –4,996Depreciation –52,511 –25,681 –48,231 –1,274 –127,697Impairment losses – – – –7,058 –7,058Reclassification as held for sale –11,936 –6,265 –5,446 –437 –24,084Changes in consolidated group and business combinations 34 –38 –1 27 22Currency translation –10,560 –2,960 –2,412 –979 –16,911Other changes2 6,591 3,490 2,902 –31,713 –18,730Carrying amount at Dec. 31, 2020 370,494 110,875 118,075 28,347 627,791
Dec. 31, 2020Cost 710,799 493,649 424,329 31,850 1,660,627Cumulative depreciation and impairment losses –340,305 –382,774 –306,254 –3,503 –1,032,836Carrying amount 370,494 110,875 118,075 28,347 627,791
1) Adjustment of the previous year. This adjustment belongs to the fact that the investment properties are not shown separately any longer.2) The Assets under construction contain a reclassification into the Contract-based intangible assets amounting to EUR 16,399 thousand.
153GEA Annual Report 2020
Notes to the Consolidated Financial Statements 5. Consolidated Balance Sheet Disclosures: Assets

LeasingThe carrying amounts of the right-of-use assets, including changes during the reporting period, are shown below.
(EUR thousand)Land and buildings
Technical equipment
and machinery
Other equipment,
operating and office
equipment VehiclesComputer Hardware
Other IT Equipment Total
Jan. 1, 2020
Carrying amount 136,584 1,156 1,870 39,829 80 4,301 183,820
Changes in 2020
Additions 21,269 143 1,167 17,827 265 6,741 47,412
Disposals –1,530 – –3 –282 – – –1,815
Depreciation –37,332 –469 –1,214 –20,875 –98 –2,961 –62,949
Reclassification as held for sale –838 –44 –336 – – – –1,218
Changes in consolidated group and business combinations – – –4 –13 – – –17
Currency translation –5,503 –14 –64 –1,330 – – –6,911
Other changes 120 – 245 –377 – – –12
Carrying amount at Dec. 31, 2020 112,770 772 1,661 34,779 247 8,081 158,310
The following amounts were recognized in the income statement in the reporting period:
(EUR thousand)Jan. 01, 2020 - Dec. 31, 2020
Interest expenses for Lease Liabilities 4,086
Expense from short-term leases 2,917
Expense for small-ticket-leases 3,182
Expense from variable lease payments 2,836
The statement of cash flows includes the following amounts:
(EUR thousand)Jan. 01, 2020 - Dec. 31, 2020
Total Cash-Out for Lease contracts 75,383
The following table shows possible future lease payments, that are not included in the measurement of lease liabilities at the balance sheet date, in the event that • renewal options are exercised for which it is “not reasonably certain” that they will be exercised at
the time the financial statements are prepared. • termination options are not exercised for which it is “reasonably certain” that they will be exercised
at the time the financial statements are prepared.
(EUR thousand)
2021 2022 2023 2024 2025
Possible additional payments due to the utilization of extension options 1,695 2,471 4,905 4,521 6,202
Possible additional payments due to unused termination options* 2,224 1,925 1,236 1,166 896
*) In the case of indefinite term, automatically renewing contracts, if a termination option is not exercised, the term is assumed to be extended by one year.
For periods after December 31, 2025, additional lease payments totaling approximately EUR 32.1 million would be possible if all renewal options are exercised for which it is “not reasonably certain” that they will be exercised at the time the financial statements are prepared. The non-exercise of termination options that were deemed to be reasonably certain at the time the financial statements were prepared could result in additional lease payments of approximately EUR 2.6 million for this period.
Lease concessions granted in connection with Covid-19 that are not presented as lease modifications relate to leases of real estate and vehicles. The resulting effects are recognized as negative variable lease payments and amount to approximately EUR 305 thousand.
As a lessor GEA leases out real estate. The underlying lease agreements were classified as operating leases (Please refer to the disclosures in section Investment property).
154GEA Annual Report 2020
Notes to the Consolidated Financial Statements 5. Consolidated Balance Sheet Disclosures: Assets
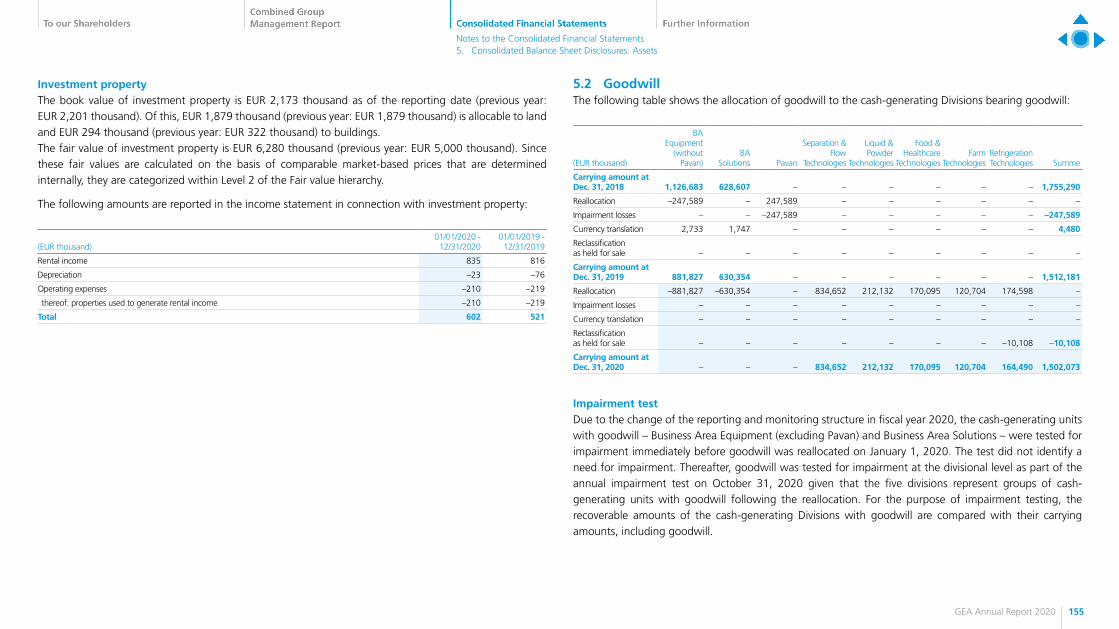
Investment propertyThe book value of investment property is EUR 2,173 thousand as of the reporting date (previous year: EUR 2,201 thousand). Of this, EUR 1,879 thousand (previous year: EUR 1,879 thousand) is allocable to land and EUR 294 thousand (previous year: EUR 322 thousand) to buildings.The fair value of investment property is EUR 6,280 thousand (previous year: EUR 5,000 thousand). Since these fair values are calculated on the basis of comparable market-based prices that are determined internally, they are categorized within Level 2 of the Fair value hierarchy.
The following amounts are reported in the income statement in connection with investment property:
(EUR thousand)01/01/2020 -
12/31/202001/01/2019 -
12/31/2019
Rental income 835 816
Depreciation –23 –76
Operating expenses –210 –219
thereof: properties used to generate rental income –210 –219
Total 602 521
5.2 GoodwillThe following table shows the allocation of goodwill to the cash-generating Divisions bearing goodwill:
(EUR thousand)
BA Equipment
(without Pavan)
BA Solutions Pavan
Separation & Flow
Technologies
Liquid & Powder
Technologies
Food & Healthcare
TechnologiesFarm
TechnologiesRefrigeration Technologies Summe
Carrying amount at Dec. 31, 2018 1,126,683 628,607 – – – – – – 1,755,290
Reallocation –247,589 – 247,589 – – – – – –
Impairment losses – – –247,589 – – – – – –247,589
Currency translation 2,733 1,747 – – – – – – 4,480
Reclassification as held for sale – – – – – – – – –
Carrying amount at Dec. 31, 2019 881,827 630,354 – – – – – – 1,512,181
Reallocation –881,827 –630,354 – 834,652 212,132 170,095 120,704 174,598 –
Impairment losses – – – – – – – – –
Currency translation – – – – – – – – –
Reclassification as held for sale – – – – – – – –10,108 –10,108
Carrying amount at Dec. 31, 2020 – – – 834,652 212,132 170,095 120,704 164,490 1,502,073
Impairment testDue to the change of the reporting and monitoring structure in fiscal year 2020, the cash-generating units with goodwill – Business Area Equipment (excluding Pavan) and Business Area Solutions – were tested for impairment immediately before goodwill was reallocated on January 1, 2020. The test did not identify a need for impairment. Thereafter, goodwill was tested for impairment at the divisional level as part of the annual impairment test on October 31, 2020 given that the five divisions represent groups of cash-generating units with goodwill following the reallocation. For the purpose of impairment testing, the recoverable amounts of the cash-generating Divisions with goodwill are compared with their carrying amounts, including goodwill.
155GEA Annual Report 2020
Notes to the Consolidated Financial Statements 5. Consolidated Balance Sheet Disclosures: Assets

The recoverable amount for these units is determined by calculating the value in use using the “discounted cash flow” method. The cash flows used are the after-tax operating cash flows from the consolidated medium-term planning prepared by the Executive Board. Besides the months November and December of the 2020 fiscal year, this covers the budget for 2021 and two further planning years. The corresponding planning values were extrapolated using a “bottom-up” approach. The Supervisory Board has taken note of the corresponding plans. Assumptions for the period beyond the planning horizon are based on the cash flows in the previous planning year, extrapolated using a uniform growth rate of 1.0 percent (previous year: 1.0 percent). The underlying growth rates do not exceed the average long-term growth rates for the markets in which GEA operates.
The planning assumes continued stable growth in the food and drink sales markets. The planning assumptions take into account, in particular, expectations regarding revenue trends and EBITDA before restructuring measures as well as future sales markets. In addition, growth forecasts for individual areas also factor in actual past growth rates. Future acquisitions are not included in the planning process. EBITDA before restructuring measures is expected to increase slightly to significantly over the planning period depending on the Division. Effects from the consequences of the corona pandemic (Covid-19) were also considered.
The total cost of capital assumed for discounting is based on a risk-free interest rate of -0.10 percent (previous year: 0.00 percent) and a market risk premium of 7.50 percent (previous year: 8.00 percent). In addition, beta factors derived from the respective peer group, a borrowing risk premium and capital structure were taken into account for each measurement object. Accordingly, specific tax rates, country risk premiums and inflation differentials are also applied to the cash-generating groups with goodwill.
Cash flows for the individual areas are discounted using the following discount rates:
10/31/2020 10/31/2019
(%)Discount rate
(after-tax)Discount rate
(pre-tax)Discount rate
(after-tax)Discount rate
(pre-tax)
Separation & Flow Technologies 8.44 11.29
Liquid & Powder Technologies 8.64 11.46
Food & Healthcare Technologies 7.73 10.41
Farm Technologies 7.77 10.31
Refrigeration Technologies 8.12 10.21
BA Equipment (without Pavan) 8.01 10.81
BA Solutions 7.29 9.21
Pavan 9.00 10.69
The goodwill impairment tests confirmed the recoverability value of the goodwill. Even if the above-mentioned parameters were to change, none of the cash-generating Divisions with goodwill need to be impaired. As such, GEA was able to confirm the recoverability of the goodwill even on the basis of the latest capital market parameters as of December 31, 2020.
156GEA Annual Report 2020
Notes to the Consolidated Financial Statements 5. Consolidated Balance Sheet Disclosures: Assets

5.3 Other intangible assetsThe carrying amount of intangible assets changed as follows:
(EUR thousand)Market-related
intangible assetsCustomer-related intangible assets
Contract-based intangible assets
Technology-based intangible assets
Internally generated intangible assets Total
Jan. 1, 2019Cost 128,691 299,897 124,500 166,760 286,902 1,006,750Cumulative amortization and impairment losses –22,026 –183,037 –99,920 –93,232 –125,863 –524,078Carrying amount 106,665 116,860 24,580 73,528 161,039 482,672
Changes in 2019Additions – – 6,086 5,567 39,294 50,947Disposals – – –13 –34 –208 –255Amortization –944 –21,315 –10,503 –10,710 –33,155 –76,627Impairment losses –8,304 –334 –20 –3,744 –19,630 –32,032Changes in consolidated group and business combinations – – – 6 – 6Currency translation 863 204 96 418 75 1,656Other changes – – 272 1,120 1,563 2,955Carrying amount at Dec. 31, 2019 98,280 95,415 20,498 66,151 148,978 429,322
Jan. 1, 2020Cost 120,729 288,080 128,857 168,724 321,092 1,027,482Cumulative amortization and impairment losses –22,449 –192,665 –108,359 –102,573 –172,114 –598,160Carrying amount 98,280 95,415 20,498 66,151 148,978 429,322
Changes in 2020Additions – – 11,417 3,576 30,789 45,782Disposals –24 – –22 –38 –207 –291Amortization –956 –19,983 –8,642 –8,848 –30,783 –69,212Impairment losses –4,638 –1,867 –728 –484 –21,129 –28,846Reclassification as held for sale –9,259 – – –474 –2,653 –12,386Changes in consolidated group and business combinations – – 120 6 – 126Currency translation –386 –137 –1,306 97 367 –1,365Other changes* – – 16,769 –1,011 2,957 18,715Carrying amount at Dec. 31, 2020 83,017 73,428 38,106 58,975 128,319 381,845
Dec. 31, 2020Cost 107,692 278,812 151,793 157,196 344,480 1,039,973Cumulative amortization and impairment losses –24,675 –205,384 –113,687 –98,221 –216,161 –658,128Carrying amount 83,017 73,428 38,106 58,975 128,319 381,845
*) The Contract-based intangible assets contain a reclassification from the Assets under construction amounting to EUR 16,399 thousand.
157GEA Annual Report 2020
Notes to the Consolidated Financial Statements 5. Consolidated Balance Sheet Disclosures: Assets

The additions to internally generated intangible assets are primarily attributable to the Divisions Farm Technologies and Food & Healthcare Technologies. In the Division Farm Technologies, costs relating to developments in automated milking and feeding, in particular, were capitalized. The additions to the Division Food & Healthcare Technologies are largely the result from developments in the field of thermoforming and slicers.
Contract-based intangible assets include assets under construction in connection with the “Global SAP” project in the amount of EUR 16,399 thousand reclassified from property, plant and equipment to intangible assets during the 2020 fiscal year.
In 2020, expenditure on research and development amounted to EUR 129,004 thousand (previous year: EUR 127,854 thousand). These figures include refunded expenses totaling EUR 13,974 thousand (previous year: EUR 16,794 thousand) that are recorded in the cost of sales. For more details, please refer to the “Research and Development” section in “Fundamental Information about the Group”.
The impairment on market-related intangible assets of EUR 4,638 thousand is fully attributable to brands with an indefinite useful life and is explained in more detail later on in this section.
The impairment on internally generated intangible assets resulted from write-downs on internally generated technologies and internally generated software. Amortization of intangible assets in the amount of EUR 69,212 thousand in fiscal year 2020 (previous year: EUR 76,627 thousand) is reported in cost of sales and, where this relates to discontinued operations, in profit or loss from discontinued operations.
An indefinite useful life is assumed for market-related intangible assets of EUR 73,376 thousand (previous year: EUR 87,646 thousand). These assets are company and product names of the acquired companies. These are established brands in their respective sectors and will continue to be used indefinitely after the company in question has been acquired, which is why there are no indications of a limited useful life. Accordingly, these brands are tested for impairment at least once a year.
For this purpose, as was the case in the previous year, the value in use is initially verified on the basis of the recoverable amount of the cash-generating unit to which the brand belongs. The acquired company represents the cash-generating unit for purposes of the brand impairment test. With regard to the key assumptions for determining the value in use, reference is made to the comments discussing goodwill impairment testing (see section 5.2).
The allocation of carrying amounts of acquired brands with indefinite useful lives and the discount rates for purposes of impairment testing are presented in the table below. Company or product names allocated to other brands each accounted for less than 10 percent of the total value of all intangible assets with indefinite useful lives.
10/31/2020 10/31/2019
Brand
Carrying amount
(EUR thousand)
Discount rate (after-tax) in %
Discount rate (before-tax)
in %
Carrying amount
(EUR thousand)
Discount rate (after-tax) in %
Discount rate (before-tax)
in %
Comas (Food & Healthcare Technologies) 15,598 9.32 12.93 15,598 8.44 11.11
Imaforni (Food & Healthcare Technologies) 11,350 9.32 12.93 11,350 8.44 11.11
Hilge (Separation & Flow Technologies) 10,035 7.89 11.27 10,035 7.58 10.83
Aseptomag (Separation & Flow Technologies) 9,047 6.15 7.79 9,004 6.27 8.00
Procomac (Liquid & Powder Technologies) 8,059 9.61 13.33 8,059 8.44 11.11
Other 19,287 5.31-9.61 6.81-13.33 33,600 6.08-8.45 7.79-11.74
Total 73,376 87,646
If the value in use of one cash-generating unit is less than its carrying amount, the brand is tested for impairment on the basis of its fair value less costs of disposal (Fair Value Hierarchy Level 3) using the relief from royalty method. Under this approach, the value of a brand is calculated on the basis of the future royalties that GEA would have to pay if it was required to license the brands from third parties. The brand-related revenue is multiplied by the estimated royalty rate. The brand-related revenue is derived from the medium-term planning prepared by the Executive Board and provided to the Supervisory Board for informational purposes. The royalty rate assumptions are derived from information already available and range between 0.0 percent and 1.0 percent (previous year: 0.2 percent to 1.0 percent) for the year under review. The savings calculated in this way are then discounted using a brand-specific after-tax discount rate.
The impairment test performed at the end of the year produced a write-down of other brands in the amount of EUR 4,638 thousand (previous year: EUR 2,862 thousand) which was primarily attributable to the one brand (EUR 4,238 thousand) that is assigned to the Division Food & Healthcare Technologies. This brand was fully impaired to a value of EUR 0 thousand, commensurate with its recoverable amount (fair value less costs of disposal).
158GEA Annual Report 2020
Notes to the Consolidated Financial Statements 5. Consolidated Balance Sheet Disclosures: Assets
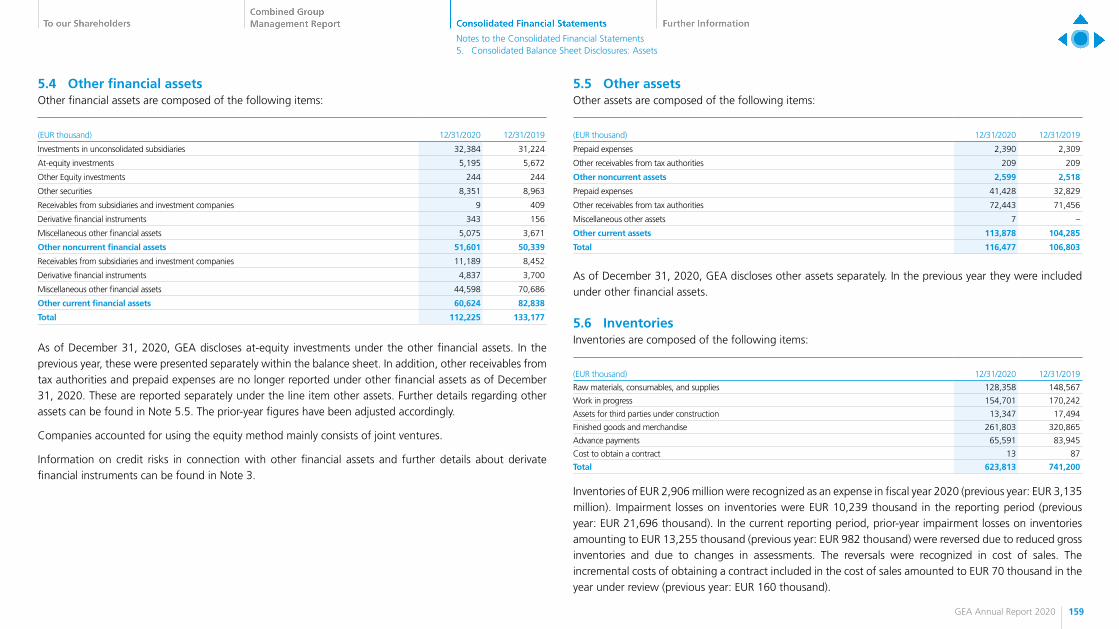
5.4 Other financial assetsOther financial assets are composed of the following items:
(EUR thousand) 12/31/2020 12/31/2019
Investments in unconsolidated subsidiaries 32,384 31,224
At-equity investments 5,195 5,672
Other Equity investments 244 244
Other securities 8,351 8,963
Receivables from subsidiaries and investment companies 9 409
Derivative financial instruments 343 156
Miscellaneous other financial assets 5,075 3,671
Other noncurrent financial assets 51,601 50,339
Receivables from subsidiaries and investment companies 11,189 8,452
Derivative financial instruments 4,837 3,700
Miscellaneous other financial assets 44,598 70,686
Other current financial assets 60,624 82,838
Total 112,225 133,177
As of December 31, 2020, GEA discloses at-equity investments under the other financial assets. In the previous year, these were presented separately within the balance sheet. In addition, other receivables from tax authorities and prepaid expenses are no longer reported under other financial assets as of December 31, 2020. These are reported separately under the line item other assets. Further details regarding other assets can be found in Note 5.5. The prior-year figures have been adjusted accordingly.
Companies accounted for using the equity method mainly consists of joint ventures.
Information on credit risks in connection with other financial assets and further details about derivate financial instruments can be found in Note 3.
5.5 Other assetsOther assets are composed of the following items:
(EUR thousand) 12/31/2020 12/31/2019
Prepaid expenses 2,390 2,309
Other receivables from tax authorities 209 209
Other noncurrent assets 2,599 2,518
Prepaid expenses 41,428 32,829
Other receivables from tax authorities 72,443 71,456
Miscellaneous other assets 7 –
Other current assets 113,878 104,285
Total 116,477 106,803
As of December 31, 2020, GEA discloses other assets separately. In the previous year they were included under other financial assets.
5.6 InventoriesInventories are composed of the following items:
(EUR thousand) 12/31/2020 12/31/2019
Raw materials, consumables, and supplies 128,358 148,567
Work in progress 154,701 170,242
Assets for third parties under construction 13,347 17,494
Finished goods and merchandise 261,803 320,865
Advance payments 65,591 83,945
Cost to obtain a contract 13 87
Total 623,813 741,200
Inventories of EUR 2,906 million were recognized as an expense in fiscal year 2020 (previous year: EUR 3,135 million). Impairment losses on inventories were EUR 10,239 thousand in the reporting period (previous year: EUR 21,696 thousand). In the current reporting period, prior-year impairment losses on inventories amounting to EUR 13,255 thousand (previous year: EUR 982 thousand) were reversed due to reduced gross inventories and due to changes in assessments. The reversals were recognized in cost of sales. The incremental costs of obtaining a contract included in the cost of sales amounted to EUR 70 thousand in the year under review (previous year: EUR 160 thousand).
159GEA Annual Report 2020
Notes to the Consolidated Financial Statements 5. Consolidated Balance Sheet Disclosures: Assets

5.7 Trade receivablesTrade receivables are composed of the following items:
(EUR thousand) 12/31/2020 12/31/2019
Trade receivables from third parties 725,508 898,782
Trade receivables from affiliated companies 18,583 16,296
Total 744,091 915,078
Trade receivables include receivables of EUR 3,370 thousand (previous year: EUR 13,790 thousand) that will not be realized until more than one year after the reporting date.
The total amount of impairment losses on trade receivables are EUR 80,744 thousand (previous year: EUR 70,006 thousand). Further details about impairment losses on trade receivables, can be found in the explanatory notes in Note 3.
5.8 Cash and cash equivalents Cash and cash equivalents were composed of the following items as of the reporting date:
(EUR thousand) 12/31/2020 12/31/2019
Unrestricted cash 821,738 354,179
Restricted Cash 114 380
Total 821,852 354,559
Cash and cash equivalents comprise cash funds and overnight deposits. Restricted cash mainly consists of bank deposits.
During the year, the standard market interest rate for short-term bank deposits in the eurozone was 0.0 percent (previous year: 0.0 percent). The average interest rate at the end of the year was -0.2 percent (previous year 0.0 percent).
5.9 Assets and liabilities held for saleAssets held for sale are reported at a carrying amount of EUR 44,455 thousand (previous year: EUR 158 thousand) as of December 31, 2020. These assets mainly relate to the sale of the Bock Group.
Sale of the Bock GroupGEA entered into a sale and purchase agreement with NORD Holding regarding the Bock Group on September 21, 2020. The Bock Group includes 100 percent of the shares in GEA Bock GmbH, located in Frickenhausen, Germany; GEA Bock Czech s.r.o., located in Stribro, Czech Republic; and GEA Refrigeration India Pvt. Ltd., located in Vadodara, India, all of which will be transferred as part of the sale. In addition, all assets and liabilities of GEA Refrigeration Technology (Suzhou) Co., Ltd., located in Suzhou, China, belonging to the Bock Group, will be transferred to the purchaser as an asset deal. The Bock Group is part of the Refrigeration Technologies division and manufactures compressors for stationary and transport-based refrigeration products. All related non-current assets of EUR 44,309 thousand and liabilities of EUR 27,383 thousand form a disposal group and have been classified as “held for sale”. Impairment losses of EUR 13,536 thousand (including allocated goodwill with an amount of EUR 10,108 thousand) were recognized in connection with the classification.
Cumulative expenses of EUR 8,096 thousand have been allocated to the disposal group in the other comprehensive income.
The closing of the sale took place on February 26, 2021.
160GEA Annual Report 2020
Notes to the Consolidated Financial Statements 5. Consolidated Balance Sheet Disclosures: Assets

The following assets and liabilities are reclassified as held for sale:
(EUR thousand) 12/31/2020
Property, plant and equipment 15,630
Goodwill –
Other non-current financial assets 10,267
Other non-current assets 56
Deferred taxes 207
Non-current assets 26,160
Inventories 15,762
Trade receivables 789
Income tax receivables 449
Other current financial assets 1,043
Cash and cash equivalents 106
Current assets 18,149
Total assets* 44,309
(EUR thousand) 12/31/2020
Non-current employee benefit obligations 18,513
Non-current financial liabilities 517
Non-current contract liabilities 27
Deferred taxes 17
Non-current liabilities 19,074
Current provisions 1,099
Current employee benefit obligations 1,623
Current financial liabilities 1,128
Trade payables 3,227
Current contract liabilities 243
Income tax liabilities 306
Other current liabilities 683
Current liabilities 8,309
Total liabilities* 27,383
*) Items do not include assets and liabilities to affiliated companies
161GEA Annual Report 2020
Notes to the Consolidated Financial Statements 5. Consolidated Balance Sheet Disclosures: Assets

6. Consolidated Balance Sheet Disclosures: Liabilities
6.1 Equity
Subscribed capitalThe subscribed capital of GEA Group Aktiengesellschaft as of December 31, 2020 was EUR 520,376 thousand (previous year: EUR 520,376 thousand). The shares are bearer shares and are divided into 180,492,172 (previous year: 180,492,172) no-par value shares. All the shares are fully paid up.
As in the previous year, the shares have a notional value (rounded) of EUR 2.88 each (previous year: EUR 2.88).
All shares convey the same rights. Shareholders are entitled to receive dividends as declared and are entitled to one vote per share at the Annual General Meeting. Treasury shares held by the company on the day of the Annual General Meeting do not carry voting rights and are not eligible for dividends.
Authorized capital
(EUR thousand)Annual General Meeting
resolution Expiring on Amount (EUR thousand)
Authorized Capital I April 20, 2017 April 19, 2022 77,000
Total 77,000
In the case of the Authorized Capital I and in accordance with Article 4(3) of the Articles of Association, the Executive Board is authorized, with the approval of the Supervisory Board, to increase the share capital by up to EUR 77 million by issuing new no-par value shares against cash contributions until April 19, 2022 (Authorized Capital I) and, in accordance with Article 5(4) of the Articles of Association, to define a starting date for profit rights in this case that differs from the date stipulated by law. The authorization may be exercised fully or in partial amounts, on one or several occasions. Shareholders are generally entitled to subscribe to the new shares. The statutory subscription right may also be granted by the new shares being underwritten by one or more banks with the obligation of offering them to the shareholders for subscription (indirect subscription right). The Executive Board is authorized, with the approval of the Supervisory Board, to disapply shareholders’ preemptive rights (i) insofar as this is necessary to eliminate fractional amounts, and/or (ii) in order to grant the creditors of convertible or option bonds with option or conversion privileges or obligations issued by GEA Group Aktiengesellschaft or a subordinate group company of the Company a right to subscribe to new shares to the extent to which they would be entitled after exercising the option
or conversion rights or after fulfilling conversion obligations. Furthermore, the Executive Board is authorized, with the approval of the Supervisory Board, to stipulate the further details of capital increases from Authorized Capital I and the terms and conditions of the share issue.
Contingent capital
(EUR thousand) 12/31/2020 12/31/2019
Bonds with warrants and convertible bonds according Annual General Meeting resolution 16. April 2015 51,904 51,904
Total 51,904 51,904
Under a resolution adopted by the Annual General Meeting on April 16, 2015, the share capital was contingently increased by up to EUR 51,903,633.82, comprising up to 19,200,000 bearer shares (Article 4(6) of the Articles of Association, Contingent Capital 2015). The contingent capital increase will only be implemented to the extent that the holders of conversion or option privileges from convertible bonds or option bonds, profit participation rights or profit participating bonds or a combination of these instruments issued against cash contributions by GEA Group Aktiengesellschaft or a subordinate group company of the Company on the basis of the authorization by the Annual General Meeting resolution dated April 16, 2015 exercise their conversion or option privileges, or, if they are obliged to convert or exercise options, satisfy their obligation to convert or exercise options, and if no cash settlement is granted or own shares or shares of another listed company are used in settlement. New shares will be issued at the conversion or option price to be determined in each case in accordance with the authorizing resolution referred to above. The new shares bear dividend rights from the beginning of the fiscal year in which they were created as a result of the exercising of conversion or option privileges or the fulfillment of conversion or option obligations. The Executive Board is authorized, with the approval of the Supervisory Board, to determine the further details of the implementation of the contingent capital increase.
As in the previous year, no bonds with warrants or convertible bonds were issued in fiscal year 2020.
162GEA Annual Report 2020
Notes to the Consolidated Financial Statements 6. Consolidated Balance Sheet Disclosures: Liabilities

Capital reservesCapital reserves primarily reflect the effects from the business combination of the former Metallgesellschaft Aktiengesellschaft and the former GEA AG as well as premiums from issuing shares of the former Metallgesellschaft AG.
Capital reserves were unchanged compared with the previous year at EUR 1,217,861 thousand.
Retained earningsThe changes in retained earnings and net retained profits are reported in the statement of changes in equity. Actuarial gains and losses on the measurement of non-current employee benefit obligations are included in retained earnings.
The distribution of profits is based on the annual financial statements of GEA Group Aktiengesellschaft prepared in accordance with the HGB.
Accumulated other comprehensive incomeChanges in equity outside profit or loss are reported in accumulated other comprehensive income if they do not relate to capital transactions with shareholders. Other comprehensive income comprises unrealized exchange rate gains or losses from the translation of the financial statements of foreign subsidiaries as well as the effective portion of the change in fair value of derivatives designated as cash flow hedges.
Noncontrolling interestsNoncontrolling interests in GEA companies amounted to EUR 418 thousand (previous year: EUR 421 thousand).
Capital managementGEA Group Aktiengesellschaft’s key financial objective is to sustainably increase its enterprise value in the interest of investors, employees, customers, and suppliers, while safeguarding and securing the group’s solvency at all times.
Improving profitability and, as a result, increasing the return on capital employed therefor takes priority in all business decisions. Our strict focus on contract margin quality is also derived from this. Equally, external growth through potential acquisitions is viewed from the perspective of this goal.
Capital management, in form of generating sufficient liquidity reserves, plays a crucial role in the pursuit of the enterprise goals. Not only does it ensure GEA’s long-term existence, it also creates the entrepreneurial flexibility needed to enhance and update current business activities and to take advantage of strategic opportunities. It is achieved by managing liquidity reserves and available credit lines on an ongoing basis using short- and medium- term forecasts of future liquidity trends and borrowing requirements.
The group’s financial management and encompasses liquidity management, group financing, and the management of interest rate and exchange rate risks. The central financial management operations within GEA Group Aktiengesellschaft are responsible for reducing financing costs as far as possible, optimizing interest rates for financial investments, minimizing counterparty credit risk, leveraging economies of scale, hedging interest rate and exchange rate risk exposures as effectively as possible, and ensuring that loan covenants are complied with. The goals of GEA’s financing strategy is not only to be able to meet its payments obligations whenever they fall due, but also to ensure that sufficient cash reserves are always available in form of credit lines, in addition to maintaining a strategic cash position. The centralized liquidity portfolio is managed mainly for capital preservation and risk reduction by diversifying the cash investments.
The capital structure is monitored regularly using various key financial indicators so as to optimize capital costs. Core indicators include the equity ratio and the net debt to equity ratio (gearing). Net debt for the complete group is calculated as follows:
(EUR thousand) 12/31/2020 12/31/2019
Liabilities to banks –167,701 –74,343
Borrower‘s note loan –251,882 –251,796
Cash and cash equivalents 821,852 354,559
Net liquidity (+)/Net debt (-) 402,269 28,420
Equity 1,921,449 2,090,094
Equity ratio 33.8% 36.6%
Gearing –20.9% –1.4%
Net liquidity rose by EUR 373,849 thousand in the course of the financial year, closing the year at EUR 402,269 thousand on December 31, 2020.
163GEA Annual Report 2020
Notes to the Consolidated Financial Statements 6. Consolidated Balance Sheet Disclosures: Liabilities

Two international rating agencies, Moody’s and Fitch, again rated GEA Group Aktiengesellschaft’s ability to meet its financial obligations. The rating GEA are as follows:
2020 2019
Agency Rating Outlook Rating Outlook
Moody‘s Baa2 negative Baa2 negative
Fitch BBB- stable BBB negative
GEA’s investment grade rating in the “BBB” range ensures that it has good financing opportunities both with banks and directly on the capital markets. The current ratings reflect GEA’s strong solvency and ensure access to the international financial markets.
6.2 ProvisionsThe following table shows the composition of and changes in provisions in 2020:
(EUR thousand)
Guaran-tees,
warranties
Financial guarantee contracts
Litigation risks
Follow-up costs
Environ-mental
protection, mining
Impending Losses
Other provisions Provisions
Balance at Jan. 1, 2020 68,381 2,623 11,474 45,868 83,822 9,072 81,300 302,540
thereof non-current 7,519 – 5,518 2,043 83,754 1,610 24,212 124,656
thereof current 60,862 2,623 5,956 43,825 68 7,462 57,088 177,884
Additions 33,639 – 8,007 34,615 13,383 1,249 59,388 150,281
Utilization –18,016 –209 –2,223 –23,292 –1,853 –6,428 –34,489 –86,510
Reversal –5,250 – –6,650 –6,564 –384 –586 –6,086 –25,520
Changes in consolidated group – – – – – – –114 –114
Compounding and change in interest rate – – – – 8,387 – 301 8,688
Exchange differences –2,225 –1 –437 –704 –4 –306 –2,218 –5,895
Reclassification in „held for sale“ –443 – –258 – – – –2,336 –3,037
Balance at Dec. 31, 2020 76,086 2,413 9,913 49,923 103,351 3,001 95,746 340,433
thereof non-current 9,165 – 1,701 1,031 101,151 31 19,683 132,762
thereof current 66,921 2,413 8,212 48,892 2,200 2,970 76,063 207,671
Provisions for guarantees and warrantiesProvisions for guarantees and warranties relate to warranty commitments for products and equipment. As is customary in the industry, the guarantees and warranties on which they are based are granted in connection with certain performance criteria relating to products or equipment (e.g., guaranteed output volume, quality of product manufactured). Warranties usually have a contractual term of between one and two years from the date on which the products or equipment are accepted. In addition to warranties explicitly agreed under contract, product liability rules apply in many sales countries and may also stipulate that the manufacturer is liable beyond the contractually defined term of the warranty. In some cases, recourse claims exist in the form of insurance refunds or subcontractor guarantees. The level of provisions is based on management’s best estimate.
GEA expects to settle most of the provisions for guarantees and warranties in the coming year.
Provisions for financial guarantee contractsProvisions for financial guarantee contracts comprise obligations under indemnification agreements as well as warranties and undertakings relating to the sale of business activities. The changes in these provisions in fiscal year 2020 are due to utilization.
Litigation risksProvisions are recognized for risks arising from expected or pending litigation against GEA companies if it is believed that there is likely to be an unfavorable outcome to the proceedings. Assessments by counsel for the Company or legal experts were used to determine the likelihood of such litigation. The probable obligations related to damages or sanctions have been recognized as provisions. The timing of cash outflows is based on the best estimates of legal experts.
Follow-up costsThis item comprises the cost of residual work that is incurred after a contract has already been invoiced and the profit from the contract has been recognized. The amount of the expected cost is stated. Payments are made almost in their entirety in the following year.
164GEA Annual Report 2020
Notes to the Consolidated Financial Statements 6. Consolidated Balance Sheet Disclosures: Liabilities

Environmental protection, miningThis item mainly comprises provisions for the clean-up of pit water from past mining activities and for the clean-up of other instances of groundwater contamination. Based on better insights that have emerged in fiscal year 2020, GEA has adjusted its expectations regarding future cash outflows for environmental protection and mining obligations. This is the main reason for the additions to the provisions of EUR 13,383 thousand, which had a negative impact of EUR 2,600 thousand on earnings before income taxes from continuing operations. The amount and duration of the company’s obligation to clean up pit and ground water has not been legally clarified yet. The obligations are expected to extend to well beyond 2050.
Provisions for impending lossesThis item mainly comprises impending losses resulting from customer contracts for which revenue is recognized over time pursuant to IFRS 15. As soon as an impending loss becomes known, its expected amount is reported immediately.
Other provisionsOther provisions comprise provisions for a range of individual items. As of December 31, 2020, other provisions included provisions for restructuring measures within the meaning of IAS 37 of EUR 1.7 million (previous year: EUR 4.1 million).
6.3 Employee benefit obligationsEmployee benefit obligations comprise the following items:
(EUR thousand) Section 12/31/2020 12/31/2019
Obligations under pension plans and supplementary healthcare benefits 842,346 837,295
thereof defined benefit pension plans 6.3.1 828,715 822,574
thereof obligations under supplementary healthcare benefits 6.3.1 13,499 14,578
thereof defined contribution pension plans 6.3.2 132 143
Other employee benefit obligations 2,475 2,380
Partial retirement 10,194 9,439
Jubilee benefits 10,565 10,414
Redundancy plan and severance payments 14,981 505
Other non-current obligations to employees 7,999 6,167
Non-current employee benefit obligations 888,560 866,200
Redundancy plan and severance payments 21,956 48,315
Outstanding vacation, flexitime/overtime credits 59,926 63,778
Bonuses 115,730 105,899
Other current obligations to employees 22,696 17,222
Current employee benefit obligations 220,308 235,214
Total employee benefit obligations 1,108,868 1,101,414
The decline in current employee benefit obligations was largely due to the implementation of restructuring measures within the meaning of IAS 37. The rise in non-current employee benefit obligations also relates directly to restructuring measures within the meaning of IAS 37. As of December 31, 2020, provisions amounting to EUR 32,640 thousand (previous year: EUR 44,283 thousand) had been established for severance payments in connection with these restructuring measures, of which EUR 17,743 thousand are reported as current employee benefit obligations (previous year: EUR 44,023 thousand).
165GEA Annual Report 2020
Notes to the Consolidated Financial Statements 6. Consolidated Balance Sheet Disclosures: Liabilities

6.3.1 Obligations under defined benefit plans and supplementary healthcare benefitsWherever possible, defined benefit pension obligations and obligations under supplementary healthcare benefits are disclosed below in the aggregate and explained together.
Furthermore, the information is presented including “assets and liabilities held for sale”. Where reconciliation to items in the financial statements is required, this is presented in a separate line, reclassified as “held for sale”.
All obligations were valued by actuaries as of December 31, 2020 and as of December 31, 2019.
Defined benefit plansGEA employees are offered various benefit options, mainly in the form of defined benefit and defined contribution plans.
Defined benefit plan obligations exist in Germany and, outside of Germany, mainly in the USA and the United Kingdom. In addition, other foreign companies have typical country-specific pension plans that are funded in part by plan assets. Benefits and investments correspond to the country-specific economic environment and requirements.
GEA views granting pension benefits as an opportunity to foster employee loyalty and engagement. It is therefore a standard feature of the remuneration concept and has an employee contribution component, where this is appropriate. In connection with this, GEA monitors developments on the human resources market and regularly checks that the benefits it grants are appropriate and in line with the market.
In GEA’s assessment, the pension obligations do not give rise to any risks over and above the normal risk level nor beyond the general risks specified.
Pension benefits in Germany In Germany, GEA grants old-age, disability, and survivors’ benefits to many of its employees. New employees are generally only granted benefits that are partly funded by employee contributions.
As part of the general benefits provided, all employees have the opportunity to voluntarily defer part of their compensation. Under this arrangement, an agreed amount of their salary plus an employer contribution of up to 100 percent of the deferred amount is converted into a pension benefit. A corresponding collective bargaining agreement was entered into in 2002 and revised in 2008. Under this agreement, post-retirement benefits are adjusted by 1 percent annually.
According to GEA’s new executive pension scheme, executives are granted benefits in the form of an asset-backed defined benefit plan. The plan assets are managed under a Contractual Trust Arrangement (CTA) and invested in mixed funds. The size of the employer’s contributions to the plan assets depends on the size of the fixed salaries of the beneficiaries. Beneficiaries can also contribute from their own income by means of deferred compensation. The beneficiaries are then entitled to the net earnings generated by the plan assets. There is also a notional premium guarantee.
In addition to the currently open benefit plans, there are a number of historical pension plans in the company. These plans are generally closed to new employees, but are maintained unchanged for employees who were members at the time the plan was closed. These include obligations under “Bochumer Verband” and “Essener Verband” as well as obligations established independently by their predecessors. Entitlements also exist from the earlier executive pension scheme, which has been closed to new members since the end of the fiscal year 2014. Post-retirement benefits from the earlier executive pension scheme are adjusted by 1 percent each year.
The pension obligations are partly funded by pension liability insurance policies.
166GEA Annual Report 2020
Notes to the Consolidated Financial Statements 6. Consolidated Balance Sheet Disclosures: Liabilities

Pension benefits outside Germany Pension benefits outside Germany mainly exist in the USA and the United Kingdom.
In the USA there are pension obligations from various pension plans that were closed in succession up to December 31, 2000. No further benefits are earned from a defined benefit plan for periods of service after the respective closure date. Old-age and survivors’ benefits accrued at the closure date of the respective plan were fixed on the basis of pensionable income at the closure date. Benefits may be paid out in the form of annuities or lump-sum payments. Existing pension obligations are partly funded by plan assets. The assets are held separately from the company in an external trust. The companies have appointed independent trustees in accordance with statutory provisions to manage the funding of obligations and the investment of assets according to the company’s specifications. Any funding deficit is established annually in accordance with legal requirements and spread over a fixed time period if required. The statutory basis for minimum funding was last amended in 2012 by the Moving Ahead for Progress in the 21st Century Act (MAP-21).
In the United Kingdom, there are pension obligations from two UK pension plans, one of which has been closed for a number of years and applies exclusively to former employees. The second plan is closed to new employees, but continues to provide old-age and survivors’ benefits to the currently active participants based on pensionable income in the year before the employment relationship ends; these benefits are funded by salary-dependent employee contributions to plan assets. The accrued entitlements and current benefits in the United Kingdom are adjusted in accordance with statutory requirements on the basis of inflation. Pension obligations from both plans are partly funded by plan assets. The companies appointed independent trustees in accordance with statutory provisions to manage the funding of obligations and the investment of assets according to the company’s specifications. Company pension plans are valued every three years in accordance with legal requirements, and any deficit is established. If the plan is underfunded, the trustee prepares a funding plan to regulate the funding of the deficit, taking account of the actuary’s recommendation and the type and circumstances of the respective plan.
Supplementary healthcare benefitsIn addition to occupational pension benefits, certain retired employees are granted health insurance subsidies. New entitlements to health insurance subsidies are no longer granted in Germany. There are now only a few employees with such benefits in active employment. Existing obligations from supplementary healthcare plans are not funded by plan assets. GEA does not see these benefits posing a particular risk due to the low level of the obligations.
Obligations under supplementary healthcare benefits relate mainly to Germany.
167GEA Annual Report 2020
Notes to the Consolidated Financial Statements 6. Consolidated Balance Sheet Disclosures: Liabilities

Provisions and funded statusThe changes in the present value of the defined benefit obligation, the plan assets, and the provisions were as follows:
12/31/2020 12/31/2019
(EUR thousand) Germany Other countries Germany Other countries
Present value of defined benefit obligation at beginning of fiscal year 815,790 153,943 744,852 149,517
Current service cost 14,604 2,881 11,865 2,550
Interest Cost from discounting unwinding on obligations 7,991 3,166 12,380 4,191
Employee contributions – 402 – 418
Remeasurement of present value of obligation 42,091 5,818 77,304 14,674
Actuarial gains/ losses from changes in demographic assumptions – –730 – –662
Actuarial gains/ losses resulting from changes in financial assumptions 39,899 8,815 77,531 15,071
Actuarial gains/ losses resulting from experience adjustments 2,192 –2,267 –227 265
Past service cost – 1,223 – –73
Gains and losses from settlements –930 – –28 –1,389
Payments without settlements –31,757 –10,116 –30,428 –9,338
Payments in respect of any settlements –8,621 – –155 –10,663
Transfer of assets 7,333 1,125 – –
Changes in combined group due to acquisitions – –1,228 – –
Other changes in combined group 44 – – 808
Currency translation – –8,361 – 3,248
Present value of defined benefit obligation at end of fiscal year 846,545 148,853 815,790 153,943
Fair value of plan assets at beginning of the fiscal year 42,423 91,754 36,053 93,479
Interest income on plan assets 439 2,009 644 2,614
Employer contributions 4,613 6,347 5,223 4,375
Employee contributions – 402 – 418
Remeasurement: return from plan assets in excess/ shortage of interest income 1,003 4,634 1,495 6,938
Payments without settlements –452 –7,923 –837 –7,787
Payments in respect of any settlements –6,556 – –155 –10,663
Transfer of assets 3,302 319 – –
Currency translation – –5,539 – 2,380
Fair value of plan assets at the end of fiscal year 44,772 92,003 42,423 91,754
Funded status/ Net carrying amount 801,773 56,850 773,367 62,189
Reclassification as held for sale –18,513 – – –
Net carrying amount 783,260 56,850 773,367 62,189
thereof net asset – 2,113 – 1,603
thereof net liability 783,260 58,963 773,367 63,792
Changes to the net carrying amount of the defined benefit obligations from defined benefit plans and supplementary healthcare benefits for fiscal years 2020 and 2019 are as follows:
12/31/2020 12/31/2019
(EUR thousand) Germany Other countries Germany Other countries
Net carrying amount at beginning of fiscal year 773,367 62,189 708,799 56,038
Changes through profit or loss 21,226 5,261 23,573 2,665
Current service cost 14,604 2,881 11,865 2,550
Past service cost – 1,223 – –73
Gains and losses on settlements –930 – –28 –1,389
Net interest on net defined benefit liability 7,552 1,157 11,736 1,577
Changes through OCI 41,088 1,184 75,809 7,736
Return from plan assets in excess interest income –1,003 –4,634 –1,495 –6,938
Actuarial gains/ losses from changes in demographic assumptions – –730 – –662
Actuarial gains/ losses resulting from changes in financial assumptions 39,899 8,815 77,531 15,071
Actuarial gains/ losses resulting from experience adjustments 2,192 –2,267 –227 265
Cash-effective changes –37,983 –8,540 –34,814 –5,926
Employer contributions –4,613 –6,347 –5,223 –4,375
Payments without settlements –31,305 –2,193 –29,591 –1,551
Payments in respect of any settlements –2,065 – – –
Other changes 4,075 –3,245 – 1,676
Transfer of assets 4,031 806 – –
Changes in combined group due to acquisitions – –1,228 – –
Other changes in combined group 44 – – 808
Currency translation – –2,823 – 868
Funded status/ Net carrying amount 801,773 56,850 773,367 62,189
Reclassification as held for sale –18,513 – – –
Net carrying amount 783,260 56,850 773,367 62,189
168GEA Annual Report 2020
Notes to the Consolidated Financial Statements 6. Consolidated Balance Sheet Disclosures: Liabilities

The following overview shows the net carrying amount broken down into plans with and without plan assets:
12/31/2020 12/31/2019
(EUR thousand) Germany Other countries Germany Other countries
Present value of funded obligations 241,580 129,176 204,063 131,990
Fair value of plan assets 44,772 92,003 42,423 91,754
Funded status/ Net carrying amount of funded obligations 196,808 37,173 161,640 40,236
Present value of unfunded obligations 604,965 19,677 611,727 21,953
Funded status/ Net carrying amount of unfunded obligations 604,965 19,677 611,727 21,953
Funded status/ Net carrying amount 801,773 56,850 773,367 62,189
Reclassification as held for sale –18,513 – – –
Net carrying amount 783,260 56,850 773,367 62,189
As in the previous year, no asset ceiling in accordance with IAS 19.64 (b) applies. In addition, there are no reimbursement claims within the meaning of IAS 19.116.
The following overview shows the present value of the defined benefit obligation broken down into active employees, former employees with terminated vested benefits, and benefit recipients:
12/31/2020 12/31/2019
(EUR thousand) Germany Other countries Germany Other countries
Active employees 287,878 61,631 273,825 65,219
Vested terminated employees 139,989 27,190 137,228 30,070
Pensioners 418,678 60,032 404,737 58,654
Total 846,545 148,853 815,790 153,943
Plan assets The plan assets used to cover the pension obligations were as follows at the respective reporting dates:
12/31/2020 12/31/2019
(Percent) Germany Other countries Germany Other countries
Quoted prices in active marktes 53.7 86.1 38.1 86.1
Equity instruments – 35.2 – 35.0
Debt instruments 53.7 45.5 38.1 44.9
Other – 5.4 – 6.2
No quoted prices in active marktes 46.3 13.9 61.9 13.9
Equity instruments – 1.1 – 1.1
Debt instruments – 0.6 – 0.8
Real estate – 0.1 – 0.1
Insurance 45.2 11.9 60.3 11.8
Other 1.1 0.2 1.6 0.1
Total 100.0 100.0 100.0 100.0
Particularly in Germany, GEA has decided to utilize the internal financing effect of the pension provisions and supplementary healthcare benefits and only to fund a relatively small proportion of the pension obligations using plan assets.
In the USA and the United Kingdom, a large proportion of the pension obligations is funded by plan assets in accordance with the legal framework. The above table shows how the plan assets have been invested. A proportion of both the German and foreign plan assets is managed by insurance companies in accordance with their specific investment guidelines. In Germany, this is one of the predominant forms for the investment of plan assets. A large portion of plan assets in Germany are also managed under a contractual trust arrangement (CTA) and are invested in mixed funds. Part of the plan assets of German pension plans is also managed by pension funds and an endowment fund, and is mainly invested in fixed-income securities and term deposits, with only a relatively small proportion invested in equities. The objective of these external investments is to ensure secure returns and preserve the value of the underlying assets in order to fund current and future pension benefits. There are currently no plans to change this investment strategy.
169GEA Annual Report 2020
Notes to the Consolidated Financial Statements 6. Consolidated Balance Sheet Disclosures: Liabilities

Assets invested in the capital markets are exposed to general capital market and investment risk. GEA continually monitors market trends and has developed appropriate investment policies that adequately balance risk and income expectations, while taking the respective statutory and regulatory frameworks into account.
In fiscal year 2021, EUR 4,700 thousand is expected to be added to the plan assets of German pension plans and EUR 5,572 thousand to plans outside Germany.
The actual return on plan assets in 2020 was EUR 8,085 thousand (previous year: EUR 11,691 thousand).
Actuarial assumptionsAs of the relevant reporting date, the following weighted actuarial assumptions were used to calculate the present value of the defined benefit obligations. These assumptions are used to calculate net pension expenses in the following year.
12/31/2020 12/31/2019
(Percent) Germany Other countries Germany Other countries
Discount factor 0.70 1.59 1.00 2.11
Inflation 1.70 1.09 1.70 1.19
derived: wage and salary growth rate 2.70 1.31 2.70 1.30
derived: pension growth rate 1.48 0.25 1.46 0.28
derived: growth rate in cost of health care benefits 3.45 6.61 3.45 6.92
The actuarial measurement factors for German plans are established by GEA in consultation with actuarial experts. The corresponding assumptions for plans outside Germany are determined taking into account country-specific conditions with the help of local experts in consultation with the global experts and GEA. The discount rate is established using a recognized method based on the return on high quality corporate bonds determined as of the reporting date, taking into account the currency and maturities of the underlying liabilities. For countries that do not have a liquid market in corporate bonds that are suitable for setting the discount rate, interest rates on government bonds are referred to instead to define the rate.
All other assumptions correspond to GEA’s long-term projections. The nominal rate of wage and salary increases is calculated based on expected inflation and a real growth rate. The rate of pension increases in Germany is also determined based on inflation, provided that the pension adjustments are determined in accordance with the rise in the cost of living. In addition, the financial position of the relevant company is
also taken into account. If a firm pension adjustment commitment has been made, this is taken into account accordingly. Outside of Germany, the pension adjustment is also generally determined on the basis of inflation. The growth rate assumed for the costs of supplementary healthcare benefits in Germany equates to forecast inflation plus a growth rate based on historical data. Based on this data, the growth rate is not expected to change in the future.
Klaus Heubeck’s 2018G mortality tables were used as a basis for measuring all German plans as of December 31, 2020. On this basis, the life expectancy of a 65-year-old pensioner as of the reporting date is 20.51 years for men and 23.96 years for women (previous year: 20.37 years/23.85 years). Country-specific measurement bases were used for pension liabilities outside Germany.
The procedure for determining the discount rate was refined in the reporting period: Due to a change at Bloomberg, the BCLASS system, rather than the Bloomberg Industry Classification System, is now used as the basis for determining the portfolio of high quality bonds relevant for setting the discount rates. This change in accounting estimate results in a refined bond selection, which led to a decline of approximately EUR 57,000 thousand in the defined benefit obligation as of December 31, 2020 and, accordingly, lower actuarial losses from pensions and other post-employment benefit obligations.
The sensitivities presented below apply to the discount rate and inflation, which have been identified as actuarial assumptions that have a significant influence on GEA’s benefit obligations. Since the wage and salary increase rate, the pension increase rate and the growth rate in the cost of supplementary health benefits are derived from inflation, sensitivity to inflation was used to measure the sensitivity of these assumptions together. The same calculation methods were used for sensitivities as for the recognized provisions. The ranges used to compute the sensitivities of the assumptions are based on the changes that are deemed possible until the next reporting date, given historical experience. The meaningfulness of historical experience for forecasts of future outcomes and neglecting to update a number of assumptions simultaneously may represent limitations of these methods.
170GEA Annual Report 2020
Notes to the Consolidated Financial Statements 6. Consolidated Balance Sheet Disclosures: Liabilities
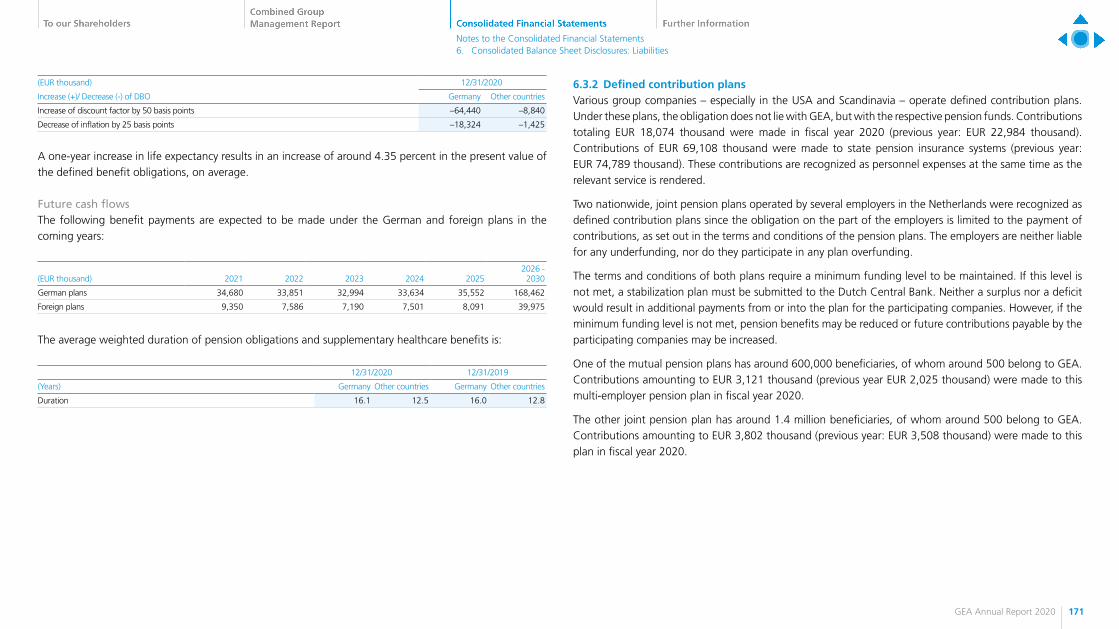
(EUR thousand) 12/31/2020
Increase (+)/ Decrease (-) of DBO Germany Other countries
Increase of discount factor by 50 basis points –64,440 –8,840
Decrease of inflation by 25 basis points –18,324 –1,425
A one-year increase in life expectancy results in an increase of around 4.35 percent in the present value of the defined benefit obligations, on average.
Future cash flowsThe following benefit payments are expected to be made under the German and foreign plans in the coming years:
(EUR thousand) 2021 2022 2023 2024 20252026 -
2030
German plans 34,680 33,851 32,994 33,634 35,552 168,462
Foreign plans 9,350 7,586 7,190 7,501 8,091 39,975
The average weighted duration of pension obligations and supplementary healthcare benefits is:
12/31/2020 12/31/2019
(Years) Germany Other countries Germany Other countries
Duration 16.1 12.5 16.0 12.8
6.3.2 Defined contribution plansVarious group companies – especially in the USA and Scandinavia – operate defined contribution plans. Under these plans, the obligation does not lie with GEA, but with the respective pension funds. Contributions totaling EUR 18,074 thousand were made in fiscal year 2020 (previous year: EUR 22,984 thousand). Contributions of EUR 69,108 thousand were made to state pension insurance systems (previous year: EUR 74,789 thousand). These contributions are recognized as personnel expenses at the same time as the relevant service is rendered.
Two nationwide, joint pension plans operated by several employers in the Netherlands were recognized as defined contribution plans since the obligation on the part of the employers is limited to the payment of contributions, as set out in the terms and conditions of the pension plans. The employers are neither liable for any underfunding, nor do they participate in any plan overfunding.
The terms and conditions of both plans require a minimum funding level to be maintained. If this level is not met, a stabilization plan must be submitted to the Dutch Central Bank. Neither a surplus nor a deficit would result in additional payments from or into the plan for the participating companies. However, if the minimum funding level is not met, pension benefits may be reduced or future contributions payable by the participating companies may be increased.
One of the mutual pension plans has around 600,000 beneficiaries, of whom around 500 belong to GEA. Contributions amounting to EUR 3,121 thousand (previous year EUR 2,025 thousand) were made to this multi-employer pension plan in fiscal year 2020.
The other joint pension plan has around 1.4 million beneficiaries, of whom around 500 belong to GEA. Contributions amounting to EUR 3,802 thousand (previous year: EUR 3,508 thousand) were made to this plan in fiscal year 2020.
171GEA Annual Report 2020
Notes to the Consolidated Financial Statements 6. Consolidated Balance Sheet Disclosures: Liabilities

6.3.3 Share-based payment Share-based payments in fiscal year 2020 for the group as a whole totaled EUR 2,864 thousand (previous year: EUR 4,034 thousand). The carrying amount of liabilities arising from share-based payment transactions in the group as a whole amounted to EUR 6,909 thousand as of December 31, 2020 (previous year: EUR 4,059 thousand).
Long-term share price componentThe long-term share price component was introduced as part of the revision of the variable remuneration system for Executive Board members in fiscal year 2012. The final tranche of the program was issued in fiscal year 2019. The payout from the long-term share price component is measured over a three-year performance period that includes the relevant fiscal year and the two subsequent years.
Performance is measured by comparing the performance of the GEA share price, adjusted for dividends, with the performance of the STOXX® Europe TMI Industrial Engineering (TMI IE) index over a three-year performance period. This comparison is computed on the basis of the respective arithmetic mean closing prices on the last 20 trading days preceding the start of the three-year performance period. 100 percent of the target is achieved if the performance of the arithmetic mean of the GEA share daily closing prices is equal to 100 percent of the corresponding TMI performance over the three-year performance period. In the event of outperformance greater than 100 percent, the amount paid out rises to a maximum of 300 percent of the target amount. If the increase in GEA’s share price over the three-year period is less than 100 percent of the growth in the TMI IE, the amount payable is reduced accordingly down to a performance level of 75 percent. The degree of target achievement increases or decreases by 4 percent for each percentage point greater than or less than a performance level of 100 percent. The total degree of target achievement and thus the payout level for the long-term share price component is limited to 300 percent of this target amount (cap).
Starting from a target amount of EUR 870 thousand (previous year: EUR 1,517 thousand), the fair value of claims arising from the long-term share price component amounted to EUR 104 thousand (previous year: EUR 142 thousand) as of the reporting date. There was a payment of EUR 15 thousand (previous year: EUR 141 thousand) in fiscal year 2020. These were the payments in connection with the 2017 tranche.
The fair value of the claims arising from the long-term share price component is determined using a Monte Carlo simulation. The following valuation assumptions are applied:
2020 2019
2019 tranche 2019 tranche 2018 tranche
Share price (arithmetic mean) (EUR) 27.10 25.39 29.22
STOXX TMI IE (arithmetic mean) (index points) 514.29 485.28 489.92
Risk-free interest (percent) –0.727 –0.626 –0.686
Volatility GEA share (percent) 42.55 35.96 35.96
Volatility STOXX TMI IE (percent) 27.22 18.97 18.97
Correlation between GEA share and STOXX TMI IE (percent) 73.60 52.55 52.55
The calculation of volatilities and correlation is based on historical market data. Risk-free interest rates were determined from German government bond yields.
Performance Share PlanWith effect from January 1, 2019, as part of its new remuneration system, GEA launched a tranche with the name “Performance Share Plan” for members of the Executive Board who had signed up for the plan. This is a cash-settled share-based payment plan whereby members of the Executive Board are granted a certain number of phantom shares on a preliminary basis.
The Performance Shares are paid out at the end of a three-year performance period. Under this program, the Total Shareholder Return (TSR) of GEA Group Aktiengesellschaft relative to the benchmark index (STOXX® Europe TMI Industrial Engineering), together with growth in EPS (Earnings per Share), adjusted for effects of restructuring measures and transactions, determine how many Performance Shares are ultimately rewarded.
The TSR performance of all peer companies is ranked, whereupon the relative position of GEA Group Aktiengesellschaft is determined by referring to its ranking within this peer group. Once the performance of GEA’s shares reaches the median in the TSR comparison, 100 percent of the Performance Shares are rewarded; if it reaches the lower quartile or below, target achievement is 0 percent. If GEA Group Aktiengesellschaft’s shares outperform the benchmark index companies, 200 percent of the Performance Shares are issued. Other performance figures are interpolated between these values.
172GEA Annual Report 2020
Notes to the Consolidated Financial Statements 6. Consolidated Balance Sheet Disclosures: Liabilities

The total amount paid out corresponds to the number of Performance Shares rewarded to a participant multiplied by the average share price over the last quarter of the three-year performance period.
Since the start of issuance, 93,206 Performance Shares have been granted on a preliminary basis for the 2019 tranche and 110,439 for the 2020 tranche. The number of shares will remain constant over the performance period until the final issuance of Performance Shares. In some cases, the payout for the Performance Shares awarded is reduced pro rata temporis (see the “Remuneration Report” section of the Management Report for further details).
Taking into account the fair value as of December 31, 2020 of EUR 6,564 thousand (previous year: EUR 3,917 thousand) for the 2019 and 2020 tranches, calculated using a Monte Carlo simulation, the group as a whole incurred an expense of EUR 2,647 thousand in fiscal year 2020.
Global Incentive PlanStarting January 1, 2020, a long-term remuneration program in the form of a cash-settled share-based payment plan called the “GEA Incentive Program” was launched for members of the Global Executive Committee, including the heads of the divisions and sales regions as well as the head of Human Resources. This program applies exclusively to the years 2020 to 2022.
Under the program, participants are awarded an allocation of Performance Share Units equal in value to a virtual initial award at the beginning of the performance period. To participate in the plan, managers must personally invest in shares of GEA Group Aktiengesellschaft. The number of ordinary GEA Group Aktiengesellschaft shares to be held over the three-year performance period is determined by dividing the required amount of personal investment by the average daily closing price of ordinary GEA Group Aktiengesellschaft shares in the first quarter of the relevant grant year.
The Performance Share Units are paid out once the three-year performance period has expired. The payment is calculated based on the virtual initial award multiplied by the performance factor, which is calculated as the ratio of the respective average daily closing price of ordinary GEA Group Aktiengesellschaft shares in the final quarter of the last calendar year of the respective performance period (“End Price”) and the first quarter of the first calendar year of the respective performance period (“Starting Price”). The amount of the payout is limited to 300 percent of the virtual initial award. Payment is only made if the share price at the end of the performance period is higher than the share price at the beginning.
The number of “Performance Share Units” at the grant date was 35,986.
The vesting period of the Global Incentive Program is the full three-year performance period. The fair value is determined by means of a Monte Carlo simulation. The fair value of the claims under the Global Incentive Program amounted to EUR 241 thousand as of December 31, 2020. The group as a whole incurred an expense of the same order in fiscal year 2020.
6.4 Financial liabilitiesFinancial liabilities as of December 31, 2020, were composed of the following items:
(EUR thousand) 12/31/2020 12/31/2019
Borrower‘s note loan 249,738 249,653
Liabilities to banks 150,601 50,719
Lease liabilities 100,765 123,266
Liabilities to subsidiaries and investment companies – 200
Liabilities from derivatives 28 137
Other financial liabilities 17,692 20,148
Noncurrent financial liabilities 518,824 444,123
Borrower‘s note loan 2,144 2,143
Liabilities to banks 17,100 23,624
Lease liabilities 56,180 58,888
Liabilities to subsidiaries and investment companies 30,833 31,204
Liabilities to employees and officers 20,092 20,397
Liabilities from derivatives 6,659 5,376
Other financial liabilities 60,801 47,901
Current financial liabilities 193,809 189,533
Total financial liabilities 712,633 633,656
As of December 31, 2019, GEA reported the Borrower’s note loan, liabilities to banks, lease liabilities, liabilities from derivatives und liabilities to investment companies under financial liabilities. Liabilities to employees, subsidiaries and investment companies, as well as certain other financial liabilities, were reported under other liabilities as of December 31, 2019.
173GEA Annual Report 2020
Notes to the Consolidated Financial Statements 6. Consolidated Balance Sheet Disclosures: Liabilities
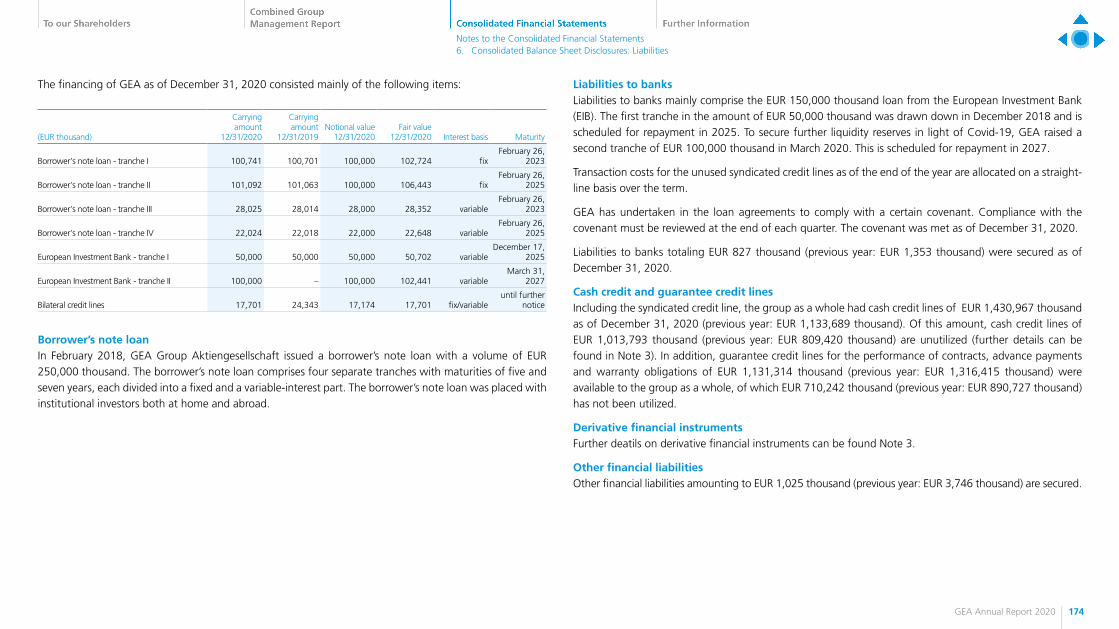
The financing of GEA as of December 31, 2020 consisted mainly of the following items:
(EUR thousand)
Carrying amount
12/31/2020
Carrying amount
12/31/2019Notional value
12/31/2020Fair value
12/31/2020 Interest basis Maturity
Borrower‘s note loan - tranche I 100,741 100,701 100,000 102,724 fixFebruary 26,
2023
Borrower‘s note loan - tranche II 101,092 101,063 100,000 106,443 fixFebruary 26,
2025
Borrower‘s note loan - tranche III 28,025 28,014 28,000 28,352 variableFebruary 26,
2023
Borrower‘s note loan - tranche IV 22,024 22,018 22,000 22,648 variableFebruary 26,
2025
European Investment Bank - tranche I 50,000 50,000 50,000 50,702 variableDecember 17,
2025
European Investment Bank - tranche II 100,000 – 100,000 102,441 variableMarch 31,
2027
Bilateral credit lines 17,701 24,343 17,174 17,701 fix/variableuntil further
notice
Borrower’s note loanIn February 2018, GEA Group Aktiengesellschaft issued a borrower’s note loan with a volume of EUR 250,000 thousand. The borrower’s note loan comprises four separate tranches with maturities of five and seven years, each divided into a fixed and a variable-interest part. The borrower’s note loan was placed with institutional investors both at home and abroad.
Liabilities to banksLiabilities to banks mainly comprise the EUR 150,000 thousand loan from the European Investment Bank (EIB). The first tranche in the amount of EUR 50,000 thousand was drawn down in December 2018 and is scheduled for repayment in 2025. To secure further liquidity reserves in light of Covid-19, GEA raised a second tranche of EUR 100,000 thousand in March 2020. This is scheduled for repayment in 2027.
Transaction costs for the unused syndicated credit lines as of the end of the year are allocated on a straight-line basis over the term.
GEA has undertaken in the loan agreements to comply with a certain covenant. Compliance with the covenant must be reviewed at the end of each quarter. The covenant was met as of December 31, 2020.
Liabilities to banks totaling EUR 827 thousand (previous year: EUR 1,353 thousand) were secured as of December 31, 2020.
Cash credit and guarantee credit linesIncluding the syndicated credit line, the group as a whole had cash credit lines of EUR 1,430,967 thousand as of December 31, 2020 (previous year: EUR 1,133,689 thousand). Of this amount, cash credit lines of EUR 1,013,793 thousand (previous year: EUR 809,420 thousand) are unutilized (further details can be found in Note 3). In addition, guarantee credit lines for the performance of contracts, advance payments and warranty obligations of EUR 1,131,314 thousand (previous year: EUR 1,316,415 thousand) were available to the group as a whole, of which EUR 710,242 thousand (previous year: EUR 890,727 thousand) has not been utilized.
Derivative financial instrumentsFurther deatils on derivative financial instruments can be found Note 3.
Other financial liabilitiesOther financial liabilities amounting to EUR 1,025 thousand (previous year: EUR 3,746 thousand) are secured.
174GEA Annual Report 2020
Notes to the Consolidated Financial Statements 6. Consolidated Balance Sheet Disclosures: Liabilities

6.5 Trade payablesTrade payables were as follows as of December 31, 2020:
(EUR thousand) 12/31/2020 12/31/2019
Trade payables to third parties 662,544 741,267
Trade payables to affiliated companies 4,250 689
Total 666,794 741,956
Trade payables of EUR 666,794 thousand (previous year: EUR 740,086 thousand) are due within one year. As of the balance sheet date, there were no trade payables with a remaining term of more than one year (previous year: EUR 1,870 thousand).
Trade payables in the amount of EUR 12,030 thousand (previous year: EUR 11,808 thousand) are secured.
6.6 Other liabilitiesOther liabilities as of December 31, 2020, comprised the following items:
(EUR thousand) 12/31/2020 12/31/2019
Other noncurrent liabilities 875 1,290
Other liabilities from tax 62,235 39,663
Liabilities relating to social security 15,748 17,854
Deferred income 5,712 4,114
Other current liabilities 83,695 61,631
Total other liabilities 84,570 62,921
As of December 31, 2020, GEA no longer discloses certain other financial liabilities under other liabilities. Further details on other financial liabilities can be found in section 6.4.
175GEA Annual Report 2020
Notes to the Consolidated Financial Statements 6. Consolidated Balance Sheet Disclosures: Liabilities
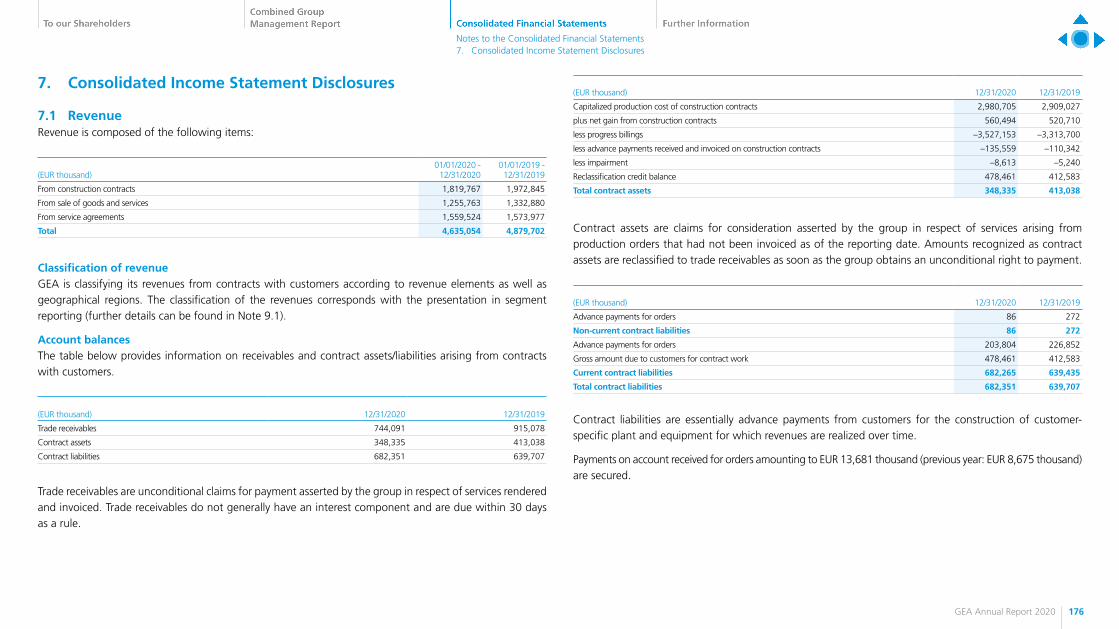
7. Consolidated Income Statement Disclosures
7.1 RevenueRevenue is composed of the following items:
(EUR thousand)01/01/2020 -
12/31/202001/01/2019 -
12/31/2019
From construction contracts 1,819,767 1,972,845
From sale of goods and services 1,255,763 1,332,880
From service agreements 1,559,524 1,573,977
Total 4,635,054 4,879,702
Classification of revenueGEA is classifying its revenues from contracts with customers according to revenue elements as well as geographical regions. The classification of the revenues corresponds with the presentation in segment reporting (further details can be found in Note 9.1).
Account balancesThe table below provides information on receivables and contract assets/liabilities arising from contracts with customers.
(EUR thousand) 12/31/2020 12/31/2019
Trade receivables 744,091 915,078
Contract assets 348,335 413,038
Contract liabilities 682,351 639,707
Trade receivables are unconditional claims for payment asserted by the group in respect of services rendered and invoiced. Trade receivables do not generally have an interest component and are due within 30 days as a rule.
(EUR thousand) 12/31/2020 12/31/2019
Capitalized production cost of construction contracts 2,980,705 2,909,027
plus net gain from construction contracts 560,494 520,710
less progress billings –3,527,153 –3,313,700
less advance payments received and invoiced on construction contracts –135,559 –110,342
less impairment –8,613 –5,240
Reclassification credit balance 478,461 412,583
Total contract assets 348,335 413,038
Contract assets are claims for consideration asserted by the group in respect of services arising from production orders that had not been invoiced as of the reporting date. Amounts recognized as contract assets are reclassified to trade receivables as soon as the group obtains an unconditional right to payment.
(EUR thousand) 12/31/2020 12/31/2019
Advance payments for orders 86 272
Non-current contract liabilities 86 272
Advance payments for orders 203,804 226,852
Gross amount due to customers for contract work 478,461 412,583
Current contract liabilities 682,265 639,435
Total contract liabilities 682,351 639,707
Contract liabilities are essentially advance payments from customers for the construction of customer-specific plant and equipment for which revenues are realized over time.
Payments on account received for orders amounting to EUR 13,681 thousand (previous year: EUR 8,675 thousand) are secured.
176GEA Annual Report 2020
Notes to the Consolidated Financial Statements 7. Consolidated Income Statement Disclosures
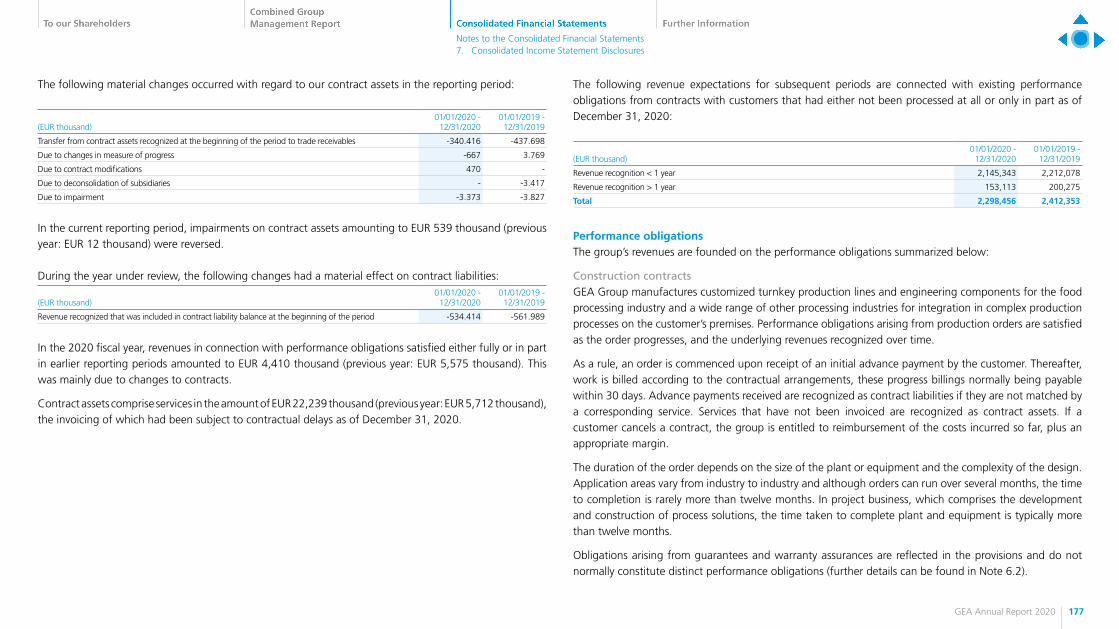
The following material changes occurred with regard to our contract assets in the reporting period:
(EUR thousand)01/01/2020 -
12/31/202001/01/2019 -
12/31/2019
Transfer from contract assets recognized at the beginning of the period to trade receivables -340.416 -437.698
Due to changes in measure of progress -667 3.769
Due to contract modifications 470 -
Due to deconsolidation of subsidiaries - -3.417
Due to impairment -3.373 -3.827
In the current reporting period, impairments on contract assets amounting to EUR 539 thousand (previous year: EUR 12 thousand) were reversed.
During the year under review, the following changes had a material effect on contract liabilities:
(EUR thousand)01/01/2020 -
12/31/202001/01/2019 -
12/31/2019
Revenue recognized that was included in contract liability balance at the beginning of the period -534.414 -561.989
In the 2020 fiscal year, revenues in connection with performance obligations satisfied either fully or in part in earlier reporting periods amounted to EUR 4,410 thousand (previous year: EUR 5,575 thousand). This was mainly due to changes to contracts.
Contract assets comprise services in the amount of EUR 22,239 thousand (previous year: EUR 5,712 thousand), the invoicing of which had been subject to contractual delays as of December 31, 2020.
The following revenue expectations for subsequent periods are connected with existing performance obligations from contracts with customers that had either not been processed at all or only in part as of December 31, 2020:
(EUR thousand)01/01/2020 -
12/31/202001/01/2019 -
12/31/2019
Revenue recognition < 1 year 2,145,343 2,212,078
Revenue recognition > 1 year 153,113 200,275
Total 2,298,456 2,412,353
Performance obligationsThe group’s revenues are founded on the performance obligations summarized below:
Construction contractsGEA Group manufactures customized turnkey production lines and engineering components for the food processing industry and a wide range of other processing industries for integration in complex production processes on the customer’s premises. Performance obligations arising from production orders are satisfied as the order progresses, and the underlying revenues recognized over time.
As a rule, an order is commenced upon receipt of an initial advance payment by the customer. Thereafter, work is billed according to the contractual arrangements, these progress billings normally being payable within 30 days. Advance payments received are recognized as contract liabilities if they are not matched by a corresponding service. Services that have not been invoiced are recognized as contract assets. If a customer cancels a contract, the group is entitled to reimbursement of the costs incurred so far, plus an appropriate margin.
The duration of the order depends on the size of the plant or equipment and the complexity of the design. Application areas vary from industry to industry and although orders can run over several months, the time to completion is rarely more than twelve months. In project business, which comprises the development and construction of process solutions, the time taken to complete plant and equipment is typically more than twelve months.
Obligations arising from guarantees and warranty assurances are reflected in the provisions and do not normally constitute distinct performance obligations (further details can be found in Note 6.2).
177GEA Annual Report 2020
Notes to the Consolidated Financial Statements 7. Consolidated Income Statement Disclosures

Components businessThe group’s components business comprises the sale of both standardized and modular equipment for a large number of process industries. Depending on the terms of delivery, customers normally gain control over the individual machines and components when they take delivery of and accept the items at the point of destination, or earlier if the goods are transferred to a shipping agent.
It is at this point that invoices are generated and revenues realized. The invoices are normally payable within 30 days. In the components business, discounts are granted that are deducted from the consideration payable.
Obligations arising from guarantees and warranty assurances are reflected in the provisions and do not normally constitute distinct performance obligations (further details can be found in Note 6.2).
ServicesThe group’s service portfolio comprises services spanning the entire life cycle of customer plant and equipment. Performance obligations such as assembly, commissioning, maintenance, and plant modernization are satisfied in line with the performance completed to date.
Work such as this is normally invoiced when the service is completed and has been accepted by the customer, with payment due within 30 days. In service business, discounts are granted that are deducted from the consideration payable.
Obligations arising from guarantees and warranty assurances are reflected in the provisions and do not normally constitute distinct performance obligations (further details can be found in Note 6.2).
7.2 Other incomeOther income is composed of the following items:
(EUR thousand)01/01/2020 -
12/31/202001/01/2019 -
12/31/2019
Exchange rate gains 341,846 239,516
Gains on the measurement of foreign currency derivatives 69,095 65,127
Rental and lease income 1,978 1,144
Income from disposal of non-current assets 1,528 4,879
Income from compensation payments and cost reimbursements 1,527 1,641
Miscellaneous other income 37,666 26,522
Total 453,640 338,829
7.3 Other expensesOther expenses are composed of the following items:
(EUR thousand)01/01/2020 -
12/31/202001/01/2019 -
12/31/2019
Exchange rate losses 324,598 248,463
Losses on the measurement of foreign currency derivatives 85,813 41,809
Goodwill impairment 10,108 247,589
Expenses on the disposal of consolidated subsidiaries 6,227 16,634
Losses on the disposal of non-current assets 1,191 1,337
Cost of money transfers and payment transactions 1,084 1,063
Miscellaneous other expenses* 36,001 51,852
Total 465,022 608,747
*) Include expenses for legal disputes.
The losses recognized in the reporting year from the disposal of consolidated companies concern Royal De Boer Stalinrichtingen B.V. and Japy Tech SAS (formerly GEA Farm Technologies Japy SAS) which were sold effective December 31, 2020. This gave rise to restructuring expenses totaling EUR 17,431 thousand (previous year: EUR 16,104 thousand) of which the major portion is included in cost of sales and EUR 6,227 thousand (previous year: EUR 16,634 thousand) are recognized as other expenses. This includes a deconsolidation loss of EUR 6,057 thousand (previous year: EUR 14,387 thousand). Goodwill impairment relates to the goodwill of the division Refrigeration Technologies that was allocated to the Bock Group.
178GEA Annual Report 2020
Notes to the Consolidated Financial Statements 7. Consolidated Income Statement Disclosures
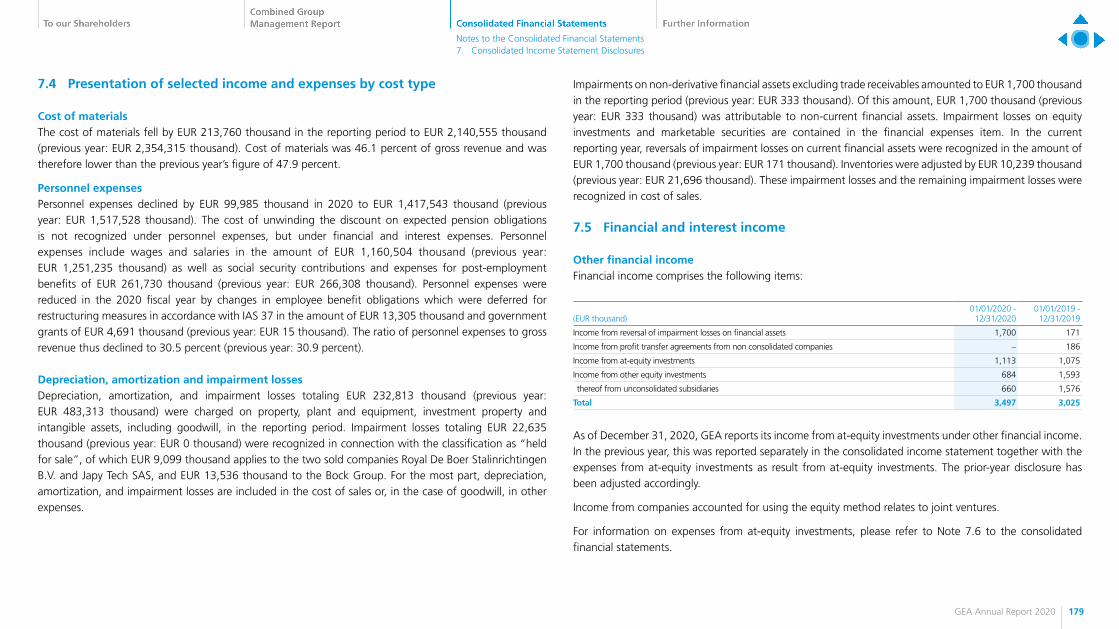
7.4 Presentation of selected income and expenses by cost type
Cost of materials The cost of materials fell by EUR 213,760 thousand in the reporting period to EUR 2,140,555 thousand (previous year: EUR 2,354,315 thousand). Cost of materials was 46.1 percent of gross revenue and was therefore lower than the previous year’s figure of 47.9 percent.
Personnel expenses Personnel expenses declined by EUR 99,985 thousand in 2020 to EUR 1,417,543 thousand (previous year: EUR 1,517,528 thousand). The cost of unwinding the discount on expected pension obligations is not recognized under personnel expenses, but under financial and interest expenses. Personnel expenses include wages and salaries in the amount of EUR 1,160,504 thousand (previous year: EUR 1,251,235 thousand) as well as social security contributions and expenses for post-employment benefits of EUR 261,730 thousand (previous year: EUR 266,308 thousand). Personnel expenses were reduced in the 2020 fiscal year by changes in employee benefit obligations which were deferred for restructuring measures in accordance with IAS 37 in the amount of EUR 13,305 thousand and government grants of EUR 4,691 thousand (previous year: EUR 15 thousand). The ratio of personnel expenses to gross revenue thus declined to 30.5 percent (previous year: 30.9 percent).
Depreciation, amortization and impairment losses Depreciation, amortization, and impairment losses totaling EUR 232,813 thousand (previous year: EUR 483,313 thousand) were charged on property, plant and equipment, investment property and intangible assets, including goodwill, in the reporting period. Impairment losses totaling EUR 22,635 thousand (previous year: EUR 0 thousand) were recognized in connection with the classification as “held for sale”, of which EUR 9,099 thousand applies to the two sold companies Royal De Boer Stalinrichtingen B.V. and Japy Tech SAS, and EUR 13,536 thousand to the Bock Group. For the most part, depreciation, amortization, and impairment losses are included in the cost of sales or, in the case of goodwill, in other expenses.
Impairments on non-derivative financial assets excluding trade receivables amounted to EUR 1,700 thousand in the reporting period (previous year: EUR 333 thousand). Of this amount, EUR 1,700 thousand (previous year: EUR 333 thousand) was attributable to non-current financial assets. Impairment losses on equity investments and marketable securities are contained in the financial expenses item. In the current reporting year, reversals of impairment losses on current financial assets were recognized in the amount of EUR 1,700 thousand (previous year: EUR 171 thousand). Inventories were adjusted by EUR 10,239 thousand (previous year: EUR 21,696 thousand). These impairment losses and the remaining impairment losses were recognized in cost of sales.
7.5 Financial and interest income
Other financial incomeFinancial income comprises the following items:
(EUR thousand)01/01/2020 -
12/31/202001/01/2019 -
12/31/2019
Income from reversal of impairment losses on financial assets 1,700 171
Income from profit transfer agreements from non consolidated companies – 186
Income from at-equity investments 1,113 1,075
Income from other equity investments 684 1,593
thereof from unconsolidated subsidiaries 660 1,576
Total 3,497 3,025
As of December 31, 2020, GEA reports its income from at-equity investments under other financial income. In the previous year, this was reported separately in the consolidated income statement together with the expenses from at-equity investments as result from at-equity investments. The prior-year disclosure has been adjusted accordingly.
Income from companies accounted for using the equity method relates to joint ventures.
For information on expenses from at-equity investments, please refer to Note 7.6 to the consolidated financial statements.
179GEA Annual Report 2020
Notes to the Consolidated Financial Statements 7. Consolidated Income Statement Disclosures
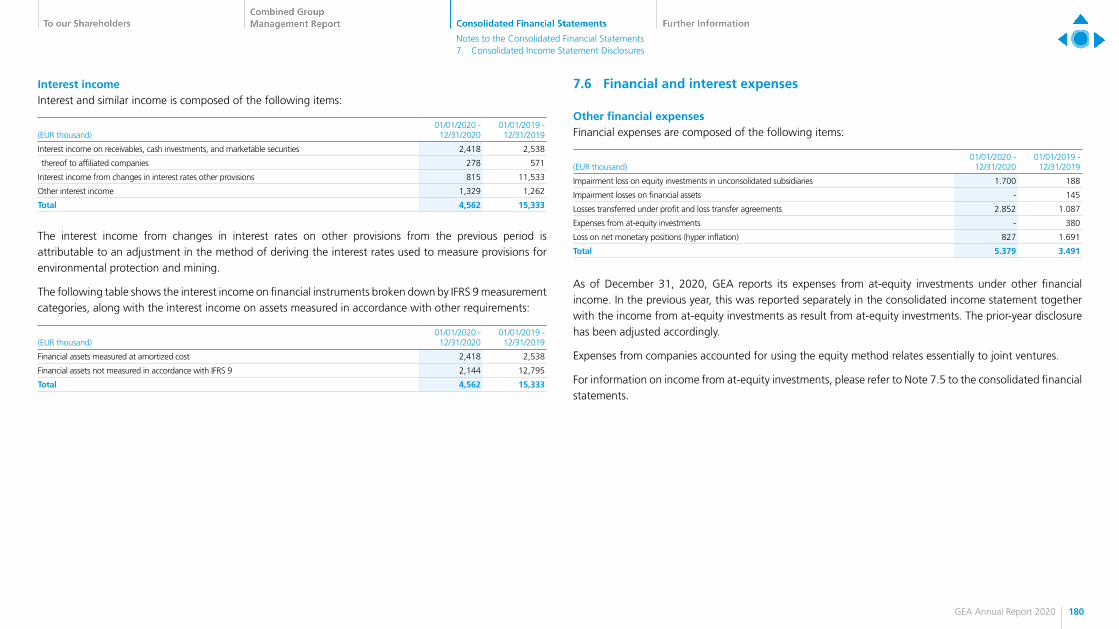
Interest incomeInterest and similar income is composed of the following items:
(EUR thousand)01/01/2020 -
12/31/202001/01/2019 -
12/31/2019
Interest income on receivables, cash investments, and marketable securities 2,418 2,538
thereof to affiliated companies 278 571
Interest income from changes in interest rates other provisions 815 11,533
Other interest income 1,329 1,262
Total 4,562 15,333
The interest income from changes in interest rates on other provisions from the previous period is attributable to an adjustment in the method of deriving the interest rates used to measure provisions for environmental protection and mining.
The following table shows the interest income on financial instruments broken down by IFRS 9 measurement categories, along with the interest income on assets measured in accordance with other requirements:
(EUR thousand)01/01/2020 -
12/31/202001/01/2019 -
12/31/2019
Financial assets measured at amortized cost 2,418 2,538
Financial assets not measured in accordance with IFRS 9 2,144 12,795
Total 4,562 15,333
7.6 Financial and interest expenses
Other financial expensesFinancial expenses are composed of the following items:
(EUR thousand)01/01/2020 -
12/31/202001/01/2019 -
12/31/2019
Impairment loss on equity investments in unconsolidated subsidiaries 1.700 188
Impairment losses on financial assets - 145
Losses transferred under profit and loss transfer agreements 2.852 1.087
Expenses from at-equity investments - 380
Loss on net monetary positions (hyper inflation) 827 1.691
Total 5.379 3.491
As of December 31, 2020, GEA reports its expenses from at-equity investments under other financial income. In the previous year, this was reported separately in the consolidated income statement together with the income from at-equity investments as result from at-equity investments. The prior-year disclosure has been adjusted accordingly.
Expenses from companies accounted for using the equity method relates essentially to joint ventures.
For information on income from at-equity investments, please refer to Note 7.5 to the consolidated financial statements.
180GEA Annual Report 2020
Notes to the Consolidated Financial Statements 7. Consolidated Income Statement Disclosures

Interest expensesInterest and similar expenses comprised the following items:
(EUR thousand)01/01/2020 -
12/31/202001/01/2019 -
12/31/2019
Interest expenses on liabilities to banks 5,138 5,850
Interest expenses on lease liability 4,086 4,997
Interest cost from discount unwinding on pension and medical care obligations 8,721 12,628
Interest cost from discount unwinding on discounted provisions and other employee benefit obligations 829 2,803
Interest cost from changes in interest rates on other provisions 1,163 –
Other interest expenses 8,701 5,492
thereof to affiliated companies 54 18
Total 28,638 31,770
The following table shows the interest expense on financial instruments broken down by IFRS 9 measurement categories, along with the interest expense on liabilities measured in accordance with other requirements:
(EUR thousand)01/01/2020 -
12/31/202001/01/2019 -
12/31/2019
Financial liabilities at amortized cost 13,169 10,903
Financial liabilities not measured in accordance with IFRS 9 15,469 20,867
Total 28,638 31,770
If a source of financing can be allocated to a specific investment, the actual borrowing costs are capitalized as part of the cost of the investment. Where no direct relationship can be established, the average interest rate for group borrowings in the current period is used as the capitalization rate due to GEA’s central financing function. This amounted to 1.3 percent in fiscal year 2020 (previous year: 1.2 percent). Interest income generated on advance payments and progress payments received reduces the cost of the asset. No material borrowing costs were capitalized in fiscal year 2020 or in the previous year.
In fiscal year 2020, expenses totaling EUR 1,084 thousand (previous year: EUR 1,063 thousand) were incurred for fees that were not included in the calculation of the effective interest rate.
Due to high inflation, business activity in Argentina is no longer accounted for on an historical cost basis, but adjusted for the effects of inflation. The consumer price index IPC (Índice de precios al consumidor) is used for this purpose. As of the reporting date, the applicable index value was 1,317.6 (January 1, 2020: 967.8). In the previous year, the applicable index value was 967.8 as of the reporting date (January 1, 2019: 629.1).
181GEA Annual Report 2020
Notes to the Consolidated Financial Statements 7. Consolidated Income Statement Disclosures
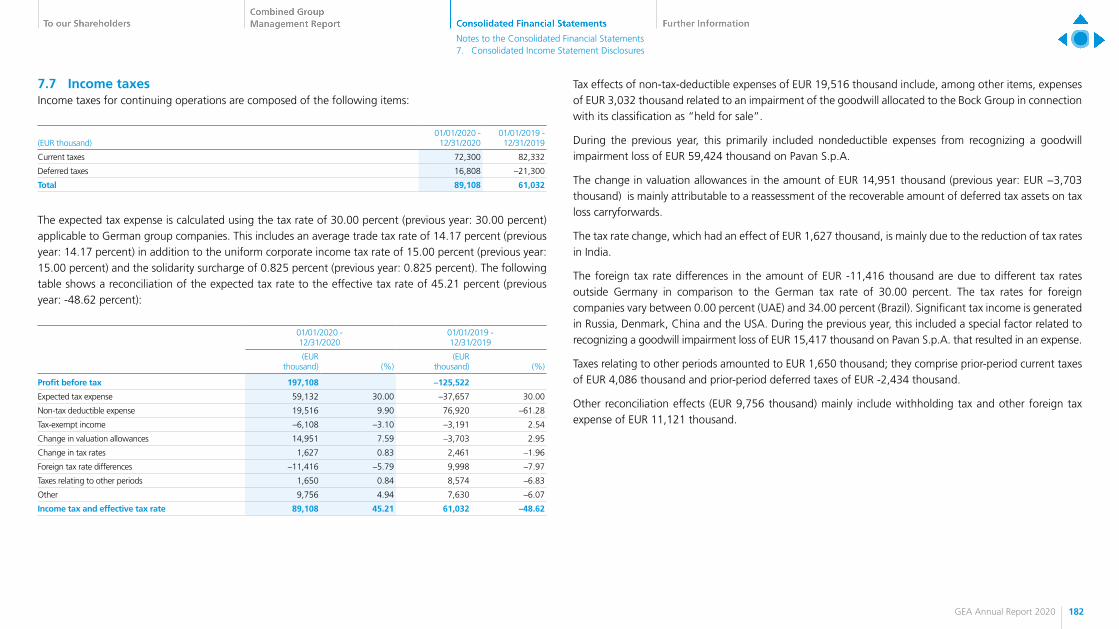
7.7 Income taxesIncome taxes for continuing operations are composed of the following items:
(EUR thousand)01/01/2020 -
12/31/202001/01/2019 -
12/31/2019
Current taxes 72,300 82,332
Deferred taxes 16,808 –21,300
Total 89,108 61,032
The expected tax expense is calculated using the tax rate of 30.00 percent (previous year: 30.00 percent) applicable to German group companies. This includes an average trade tax rate of 14.17 percent (previous year: 14.17 percent) in addition to the uniform corporate income tax rate of 15.00 percent (previous year: 15.00 percent) and the solidarity surcharge of 0.825 percent (previous year: 0.825 percent). The following table shows a reconciliation of the expected tax rate to the effective tax rate of 45.21 percent (previous year: -48.62 percent):
01/01/2020 -12/31/2020
01/01/2019 -12/31/2019
(EUR thousand) (%)
(EUR thousand) (%)
Profit before tax 197,108 –125,522
Expected tax expense 59,132 30.00 –37,657 30.00
Non-tax deductible expense 19,516 9.90 76,920 –61.28
Tax-exempt income –6,108 –3.10 –3,191 2.54
Change in valuation allowances 14,951 7.59 –3,703 2.95
Change in tax rates 1,627 0.83 2,461 –1.96
Foreign tax rate differences –11,416 –5.79 9,998 –7.97
Taxes relating to other periods 1,650 0.84 8,574 –6.83
Other 9,756 4.94 7,630 –6.07
Income tax and effective tax rate 89,108 45.21 61,032 –48.62
Tax effects of non-tax-deductible expenses of EUR 19,516 thousand include, among other items, expenses of EUR 3,032 thousand related to an impairment of the goodwill allocated to the Bock Group in connection with its classification as “held for sale”.
During the previous year, this primarily included nondeductible expenses from recognizing a goodwill impairment loss of EUR 59,424 thousand on Pavan S.p.A.
The change in valuation allowances in the amount of EUR 14,951 thousand (previous year: EUR −3,703 thousand) is mainly attributable to a reassessment of the recoverable amount of deferred tax assets on tax loss carryforwards.
The tax rate change, which had an effect of EUR 1,627 thousand, is mainly due to the reduction of tax rates in India.
The foreign tax rate differences in the amount of EUR -11,416 thousand are due to different tax rates outside Germany in comparison to the German tax rate of 30.00 percent. The tax rates for foreign companies vary between 0.00 percent (UAE) and 34.00 percent (Brazil). Significant tax income is generated in Russia, Denmark, China and the USA. During the previous year, this included a special factor related to recognizing a goodwill impairment loss of EUR 15,417 thousand on Pavan S.p.A. that resulted in an expense.
Taxes relating to other periods amounted to EUR 1,650 thousand; they comprise prior-period current taxes of EUR 4,086 thousand and prior-period deferred taxes of EUR -2,434 thousand.
Other reconciliation effects (EUR 9,756 thousand) mainly include withholding tax and other foreign tax expense of EUR 11,121 thousand.
182GEA Annual Report 2020
Notes to the Consolidated Financial Statements 7. Consolidated Income Statement Disclosures

Deferred taxes as of December 31, 2020 changed as follows:
01/01/2020 NetEffects recognized in
profit and lossEffects recognized
in OCI Other* 12/31/2020 Net Deferred tax assetsDeferred tax
liabilities
(EUR thousand)
Property, plant and equipment –56,965 8,066 – 1,416 –47,483 4,982 52,465
Goodwill –28,551 –1,614 – 1,576 –28,589 3,443 32,032
Other intangible assets –85,604 5,043 – 3,209 –77,352 133 77,485
Other non-current financial assets –2,849 –477 – – –3,326 477 3,803
Other non-current assets –65 12 – – –53 – 53
Non-current assets –174,034 11,030 – 6,201 –156,803 9,035 165,838
Inventories 117,893 39,306 – –1,851 155,348 159,765 4,417
Trade receivables and contract assets –70,191 –607 – –1,312 –72,110 30,127 102,237
Other current assets 2,722 –722 44 185 2,229 14,840 12,611
Other current financial assets 79 311 – 55 445 518 73
Cash and cash equivalents 577 1,062 – – 1,639 1,646 7
Current assets 51,080 39,350 44 –2,923 87,551 206,896 119,345
Total assets –122,954 50,380 44 3,278 –69,252 215,931 285,183
Non-current provisions 19,017 –463 – 4,101 22,655 22,953 298
Non-current employee benefit obligations 129,278 –164 9,967 –4,216 134,865 134,976 111
Non-current financial liabilities 21,645 –3,249 – –570 17,826 20,470 2,644
Other non-current liabilities and contract liabilities –1,295 303 – –24 –1,016 285 1,301
Non-current liabilities 168,645 –3,573 9,967 –709 174,330 178,684 4,354
Current provisions 5,835 –6,549 – –942 –1,656 29,970 31,626
Current employee benefit obligations 15,794 –37 – –756 15,001 15,080 79
Current financial liabilities 10,045 747 – –150 10,642 13,427 2,785
Trade payables 25,331 28,668 – –1,003 52,996 83,586 30,590
Other current liabilities and contract liabilities –48,767 –62,047 – 219 –110,595 14,518 125,113
Current liabilities 8,238 –39,218 – –2,632 –33,612 156,581 190,193
Total equity and liabilities 176,883 –42,791 9,967 –3,341 140,718 335,265 194,547
Valuation allowances on temporary differences –2,732 –25 – 642 –2,115 –2,115 –
Total deferred taxes on temporary differences 51,197 7,564 10,011 579 69,351 549,081 479,730
Tax loss carryforwards after valuation allowance 196,077 –24,372 – –5,799 165,906 165,906 –
Offsetting of deferred taxes – – – – – –381,157 –381,157
Total recognized deferred taxes 247,274 –16,808 10,011 –5,220 235,257 333,830 98,573
*) Change in deferred taxes relating to IFRS 5, Currency Translation and Deconsolidation
183GEA Annual Report 2020
Notes to the Consolidated Financial Statements 7. Consolidated Income Statement Disclosures

Deferred tax liabilities of EUR 1,880 thousand (previous year: EUR 1,328 thousand) were recognized as of December 31, 2020, for expected dividend payments from subsidiaries. In this context, as of December 31, 2020, deferred tax liabilities of EUR 3,355 thousand (previous year: EUR 1,786 thousand) were recognized for withholding taxes likely to be incurred.
As of December 31, 2020, no deferred taxes were recognized for taxable temporary differences arising from investments in subsidiaries in the amount of EUR 124,086 thousand (previous year: EUR 321,213 thousand) since the company is able to control their reversal and no reversals will be made in the foreseeable future.
Deferred tax assets include the amount of EUR 132,058 thousand recognized for companies in the tax group of GEA Group Aktiengesellschaft. Of this amount, EUR 58,000 thousand relates to the capitalization of deferred taxes on tax loss carryforwards. Furthermore, deferred tax assets of EUR 4,455 thousand were recognized at a Japanese subsidiary, of which EUR 2,022 thousand relates to the capitalization of deferred taxes on tax loss carryforwards. In both cases, despite the tax losses generated in fiscal year 2020, which in Germany are mainly due to material costs in connection with GEA’s strategic realignment, GEA assumes positive business development in the future, so that the tax assets recognized as of December 31, 2020 are realizable using estimated future taxable income.
As of December 31, 2020, GEA recognized deferred tax assets in the amount of EUR 165,906 thousand (previous year: EUR 196,077 thousand) on tax loss carryforwards:
(EUR thousand) 12/31/2020 12/31/2019
Deferred tax assets on domestic tax loss carryforwards
Corporate income tax 52,000 67,000
Trade tax 45,000 57,000
Deferred tax assets on foreign tax loss carryforwards 68,906 72,077
Total 165,906 196,077
The total amount of the deferred tax assets on tax loss carryforwards largely relates to Germany and the U.S.
Deferred tax assets were fully impaired for corporate income tax loss carryforwards of EUR 1,199,423 thousand (previous year: EUR 1,245,966 thousand), trade tax loss carryforwards of EUR 985,505 thousand (previous year: EUR 876,558 thousand), and loss carryforwards in connection with U.S. state taxes of EUR 1,930,680 thousand (previous year: EUR 1,872,370 thousand) as their utilization is not sufficiently certain.
Furthermore, deferred tax assets are not recognized in Germany for corporate income tax loss carryforwards (EUR 86,364 thousand; previous year: EUR 86,364 thousand) and trade tax loss carryforwards (EUR 33,656 thousand; previous year: EUR 33,656 thousand) prior to fiscal unity. Overseas, deferred tax assets are not recognized for income tax loss carryforwards of EUR 13,244 thousand (previous year: EUR 20,460 thousand).
The tax loss carryforwards of the German companies can be carried forward for an indefinite period. Foreign tax loss carryforwards can generally only be utilized for a limited period. The significant tax loss carryforwards of the foreign companies are expected to expire in 2029.
7.8 Income on discontinued operationsDiscontinued operations comprise in particular the remaining risks from the 2014 sale of GEA Heat Exchangers and of the plant engineering activities in previous years, especially Lurgi and Lentjes, and the continued process of winding-up past discontinued operations, including individual legal disputes arising from them.
Earnings from discontinued operations for the fiscal year amounted to EUR 2.9 million (previous year: EUR 19.2 million) as well as expenses of EUR 20.2 million (previous year: EUR 4.8 million). The pre-tax profit from discontinued operations thus amounted to EUR -17.3 million (previous year: EUR 14.3 million). The reason is essentially better knowledge that emerged in fiscal year 2020, based on which GEA adjusted its expectations with regard to future cash outflows for obligations from environmental protection and mining.
Overall, profit after tax from these discontinued operations of EUR -11.2 million (previous year: EUR 15.9 million) had an impact on consolidated profit. This profit will be allocated in full to the shareholders of GEA Group Aktiengesellschaft. Tax income attributable to discontinued operations amounted to EUR 6.1 million (previous year: EUR 1.5 million).
184GEA Annual Report 2020
Notes to the Consolidated Financial Statements 7. Consolidated Income Statement Disclosures

7.9 Earnings per shareEarnings per share are calculated as follows:
(EUR thousand)01/01/2020 -
12/31/202001/01/2019 -
12/31/2019
Profit for the period attributable to shareholders of GEA Group Aktiengesellschaft 96,829 –170,575
thereof from continuing operations 108,004 –186,458
thereof from discontinued operations –11,175 15,883
Weighted average number of shares outstanding (thousand) 180,492 180,492
Basic and diluted earnings per share (EUR)
from profit for the period 0.54 –0.95
thereof attributable to continuing operations 0.60 –1.03
thereof attributable to discontinued operations –0.06 0.09
7.10 Appropriation of net profitGEA Group Aktiengesellschaft reported net income for the fiscal year of EUR 109,942 thousand in accordance with the HGB (previous year: EUR 284,481 thousand). In addition, an amount of EUR 43,000 thousand was withdrawn from other retained earnings (previous year: allocation EUR 131,000 thousand). Including profit brought forward of EUR 815 thousand (previous year: EUR 752 thousand), the net retained profits amounted to EUR 153,757 thousand (previous year EUR 154,233 thousand).
The Executive Board and Supervisory Board will propose to the Annual General Meeting that the net retained profits be appropriated as follows:
Appropriation (EUR thousand) 2020 2019
Dividend payment to shareholders 153,418 153,418
Profit carried forward 339 815
Total 153,757 154,233
The dividend payment corresponds to the payment of a dividend of EUR 0.85 per share for a total of 180,492,172 shares (previous year: 180,492,172 shares). The dividend will be paid from the contribution account for tax purposes (section 27 of the Körperschaftsteuergesetz (KStG - German Corporate Income Tax Act)) and therefore without deduction of investment income tax and the solidarity surcharge. In the case of shareholders in Germany, the dividend is not subject to current taxation in the year of payment. The opinion of the German tax authorities (see also the Federal Ministry of Finance (BMF) circular dated 1/18/2016, para. 92) is that the payment of dividends from the contribution account for tax purposes constitutes a repayment of shareholder contributions, which results in a retrospective reduction in the cost of the shares. This can lead to the imposition of higher capital gains taxes if the shares are sold at a later date.
185GEA Annual Report 2020
Notes to the Consolidated Financial Statements 7. Consolidated Income Statement Disclosures

8. Contingent Liabilities, other Financial Obligations, Contingent Assets and Litigation
8.1 Contingent LiabilitiesGEA has issued or instructed the issue of both bank and group guarantees in favor of customers or lenders. The obligations presented in the following table relate to contingent liabilities for which the primary debtor is not a consolidated company of the group as a whole.
Bank guarantees Group guarantees
(EUR thousand) 2020 2019 2020 2019
Guarantees for prepayments 3,005 3,134 – –
Warranties 6 11 340 775
Performance guarantees 3,647 7,008 128,321 136,423
Other declarations of liability 11 1,088 6,581 14,233
Total 6,669 11,241 135,242 151,431
thereof attributable to GEA Heat Exchangers – 4,731 41,111 41,215
thereof attributable to Lurgi – – 88,162 96,300
Most of the group guarantees are attributable to the GEA Heat Exchangers segment which was sold on October 31, 2014, as well as to the operating activities of Lurgi which were disposed of in previous years Further details can be found in note 3.
The other guarantees relate mainly to customers of unconsolidated companies and to banks. The beneficiaries are entitled to asset claims under the guarantees if the primary debtor fails to meet its contractual obligations, for example, in the case of late or defective delivery, noncompliance with warranted performance parameters, or failure to repay loans in accordance with the contractual requirements.
The guarantees include contingent liabilities of EUR 5,945 thousand resulting from joint ventures (previous year: EUR 6,466 thousand); there is no further liability above and beyond this.
All guarantees issued by or on the instructions of GEA Group Aktiengesellschaft are issued on behalf of and with recourse against the relevant primary debtor.
In addition to the liability risks resulting from bank and group guarantees, there are risks in particular from court, arbitration, or out-of-court disputes that could result in cash outflows. For further details please refer to the section entitled “Legal risks” in the management report.
8.2 Other financial obligationsThe other financial obligations of the group as of December 31, 2020, are composed of purchase commitments amount to EUR 125,616 thousand (previous year: EUR 159,541 thousand). EUR 114,531 thousand (previous year: EUR 151,585 thousand) of the purchase commitments, are attributable to inventories.
The group has entered into various lease agreements which have not commenced as per 31 December 2020. The future lease payments for these non-terminable leases amount to EUR 230 thousand for the next year, EUR 1,733 thousand for years two to five and EUR 2,199 thousand for the period thereafter.
186GEA Annual Report 2020
Notes to the Consolidated Financial Statements 8. Contingent Liabilities, other Financial Obligations, Contingent Assets and Litigation

9. Segment Reporting
9.1 Operating segmentsAs previously outlined in the 2019 Annual Report, GEA’s new group structure came into effect on January 1, 2020. As part of this new structure, the group is divided into five divisions with up to six business units each that are aligned on the basis of similar technologies.
The group’s operating segments were redefined during the reporting period to correspond to the new group structure. The breakdown into segments is consistent with internal management and reporting to the Executive Board and Supervisory Board. The previous year’s figures have been adjusted to reflect the updated reporting structure.
GEA’s business activities are divided into five divisions:
Segment Activities
Separation & Flow TechnologiesManufacture of process-related components and machinery, notably separators, decanters, homogenizers, valves and pumps.
Liquid & Powder Technologies
Process solutions for the dairy, beverage, food, chemical and other industries; the portfolio includes liquid processing and filling, concentration, purification, drying, powder handling and packaging, as well as systems for emission control.
Food & Healthcare Technologies
Solutions for food processing and the pharmaceutical industry, for example preparing, marinating and further processing of meat, poultry, seafood and vegan products; pasta and confectionery production; baking, slicing, packaging, and frozen food processing; and granulators and tablet presses for the pharmaceutical industry.
Farm Technologies
Integrated customer solutions for efficient and profitable milk production and livestock farming, e.g. automatic milking and feeding systems, conventional milking solutions, manure handling and digital herd management tools.
Refrigeration TechnologiesSustainable energy solutions in the field of industrial refrigeration and heating for a wide array of industries including food, beverage, dairy, and oil and gas.
A Global Corporate Center continues to bundle all supporting management and administrative functions and performs the management functions for the entire group. The functions bundled in the Global Corporate Center do not constitute independent operating segments. The operating expenses of the Global Corporate Center are allocated, where possible, to the divisions.
Activities that are not part of core business are not disclosed in the data of the divisions. This includes investment property held for sale and liabilities related to discontinued operations.
187GEA Annual Report 2020
Notes to the Consolidated Financial Statements 9. Segment Reporting

(EUR million)Separation & Flow
TechnologiesLiquid & Powder
TechnologiesFood & Healthcare
Technologies Farm TechnologiesRefrigeration Technologies Total segments Others Consolidation GEA
01/01/2020 - 12/31/2020
Order backlog1 373.7 1,177.4 481.5 150.7 235.8 2,419.2 – –120.7 2,298.5
Order intake1 1,211.6 1,665.3 854.2 677.0 625.3 5,033.4 – –330.3 4,703.0
External revenue 1,031.9 1,577.1 772.4 619.1 634.5 4,635.1 – – 4,635.1
Intersegment revenue 160.2 88.5 122.7 5.7 28.3 405.4 – –405.4 –
Total revenue 1,192.1 1,665.7 895.1 624.8 662.8 5,040.5 – –405.4 4,635.1
EBITDA before restructuring measures 255.3 120.2 79.0 66.9 58.8 580.2 –47.3 –0.4 532.5
as % of revenue 21.4 7.2 8.8 10.7 8.9 11.5 – – 11.5
EBITDA 241.1 124.1 74.3 61.7 60.0 561.3 –82.6 –0.4 478.3
EBIT before restructuring measures 210.9 80.4 27.6 39.6 38.5 397.1 –65.5 –0.2 331.4
as % of revenue 17.7 4.8 3.1 6.3 5.8 7.9 – – 7.1
EBIT 193.6 77.4 12.3 12.7 26.2 322.2 –100.7 –0.2 221.2
as % of revenue 16.2 4.6 1.4 2.0 4.0 6.4 – – 4.8
ROCE in %2 23.0 173.8 6.3 14.3 18.4 – – – 17.1
Profit or loss from discontinued operations – – – – – – –11.2 0.0 –11.2
Capital employed 846.6 –55.3 373.3 250.4 179.5 1,594.5 57.5 –9.9 1,642.0
Net working capital (reporting date)3 269.8 –104.4 69.5 115.6 47.6 398.0 –22.9 –8.3 366.8
Additions in property, plant, and equipment, intangible assets, and goodwill 36.7 23.4 29.0 20.0 10.9 120.1 23.4 – 143.4
Depreciation and amortization 45.8 39.3 51.4 27.4 19.8 183.7 13.3 –0.1 196.9
Impairment losses4 1.7 7.5 10.6 21.7 14.0 55.4 4.8 – 60.2
188GEA Annual Report 2020
Notes to the Consolidated Financial Statements 9. Segment Reporting
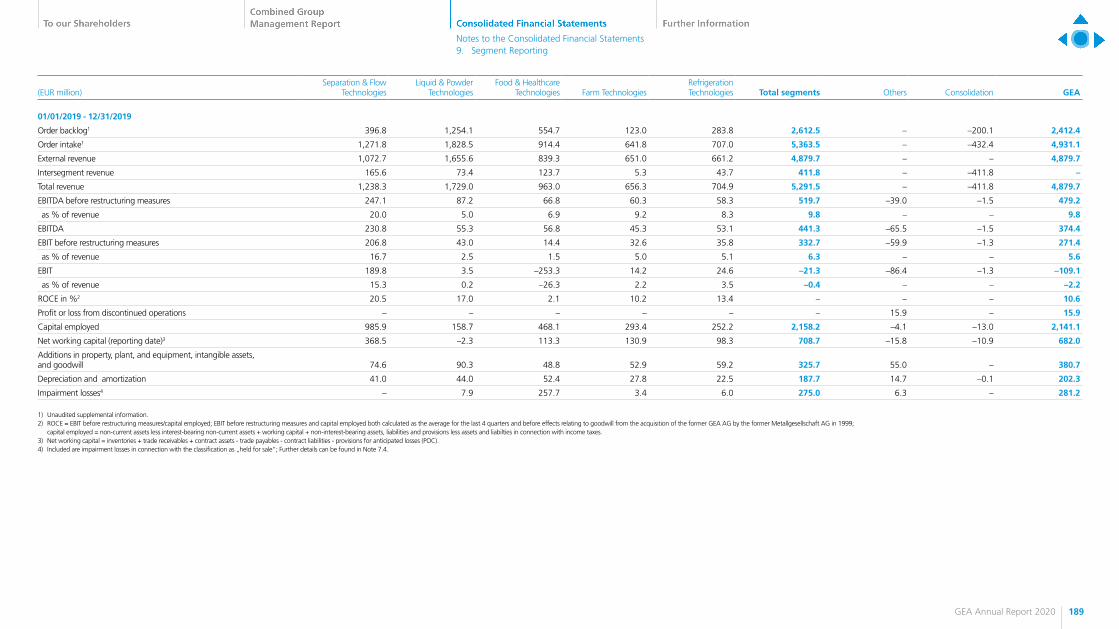
(EUR million)Separation & Flow
TechnologiesLiquid & Powder
TechnologiesFood & Healthcare
Technologies Farm TechnologiesRefrigeration Technologies Total segments Others Consolidation GEA
01/01/2019 - 12/31/2019
Order backlog1 396.8 1,254.1 554.7 123.0 283.8 2,612.5 – –200.1 2,412.4
Order intake1 1,271.8 1,828.5 914.4 641.8 707.0 5,363.5 – –432.4 4,931.1
External revenue 1,072.7 1,655.6 839.3 651.0 661.2 4,879.7 – – 4,879.7
Intersegment revenue 165.6 73.4 123.7 5.3 43.7 411.8 – –411.8 –
Total revenue 1,238.3 1,729.0 963.0 656.3 704.9 5,291.5 – –411.8 4,879.7
EBITDA before restructuring measures 247.1 87.2 66.8 60.3 58.3 519.7 –39.0 –1.5 479.2
as % of revenue 20.0 5.0 6.9 9.2 8.3 9.8 – – 9.8
EBITDA 230.8 55.3 56.8 45.3 53.1 441.3 –65.5 –1.5 374.4
EBIT before restructuring measures 206.8 43.0 14.4 32.6 35.8 332.7 –59.9 –1.3 271.4
as % of revenue 16.7 2.5 1.5 5.0 5.1 6.3 – – 5.6
EBIT 189.8 3.5 –253.3 14.2 24.6 –21.3 –86.4 –1.3 –109.1
as % of revenue 15.3 0.2 –26.3 2.2 3.5 –0.4 – – –2.2
ROCE in %2 20.5 17.0 2.1 10.2 13.4 – – – 10.6
Profit or loss from discontinued operations – – – – – – 15.9 – 15.9
Capital employed 985.9 158.7 468.1 293.4 252.2 2,158.2 –4.1 –13.0 2,141.1
Net working capital (reporting date)3 368.5 –2.3 113.3 130.9 98.3 708.7 –15.8 –10.9 682.0
Additions in property, plant, and equipment, intangible assets, and goodwill 74.6 90.3 48.8 52.9 59.2 325.7 55.0 – 380.7
Depreciation and amortization 41.0 44.0 52.4 27.8 22.5 187.7 14.7 –0.1 202.3
Impairment losses4 – 7.9 257.7 3.4 6.0 275.0 6.3 – 281.2
1) Unaudited supplemental information.2) ROCE = EBIT before restructuring measures/capital employed; EBIT before restructuring measures and capital employed both calculated as the average for the last 4 quarters and before effects relating to goodwill from the acquisition of the former GEA AG by the former Metallgesellschaft AG in 1999; capital employed = non-current assets less interest-bearing non-current assets + working capital + non-interest-bearing assets, liabilities and provisions less assets and liabilties in connection with income taxes.3) Net working capital = inventories + trade receivables + contract assets - trade payables - contract liabilities - provisions for anticipated losses (POC).4) Included are impairment losses in connection with the classification as „held for sale“; Further details can be found in Note 7.4.
189GEA Annual Report 2020
Notes to the Consolidated Financial Statements 9. Segment Reporting

The tables set out above have been revised retrospectively to reflect management reporting.
Consolidation primarily comprises the elimination of investments in subsidiaries, intragroup receivables, liabilities, revenue, and income and expenses. Intersegment revenue is calculated using standard market prices.
The reconciliation of GEA’s EBIT to earnings before income taxes from continuing operations is shown in the following table:
Reconciliation EBIT GEA to profit before tax from continuing operations(EUR million) 2020 2019
EBIT GEA 221.2 –109.1
Interest income 4.6 15.3
Interest expenses –28.6 –31.8
Profit before tax from continuing operations 197.1 –125.5
Further details on the development of interest income and interest expense can be found in Note 7.5 and 7.6.
In the presentation of segment disclosures by geographic region, revenue is allocated by the destination of the goods or place of performance of the services or by customer domicile.
(EUR million)
Separation & Flow
Technologies
Liquid & Powder
Technologies
Food & Healthcare
TechnologiesFarm
TechnologiesRefrigeration Technologies Consolidation GEA
01/01/2020 - 12/31/2020
Revenue by revenue element
From construction contracts 119.4 1,171.4 408.5 – 256.9 –136.4 1,819.8
From sale of goods and services 567.1 117.7 247.9 339.3 166.1 –182.3 1,255.8
From service agreements 505.6 376.5 238.7 285.5 239.8 –86.7 1,559.5
Total 1,192.1 1,665.7 895.1 624.8 662.8 –405.4 4,635.1
(EUR million)
Separation & Flow
Technologies
Liquid & Powder
Technologies
Food & Healthcare
TechnologiesFarm
TechnologiesRefrigeration Technologies Consolidation GEA
01/01/2019 - 12/31/2019
Revenue by revenue element
From construction contracts 131.5 1,207.6 499.3 1.5 281.5 –148.7 1,972.8
From sale of goods and services 596.5 137.8 227.4 369.7 172.8 –171.3 1,332.9
From service agreements 510.3 383.6 236.3 285.1 250.6 –91.8 1,574.0
Total 1,238.3 1,729.0 963.0 656.3 704.9 –411.8 4,879.7
External revenue(EUR million) 2020 2019
Changein %
Asia Pacific 1,058.2 1,126.1 –6.0
DACH & Eastern Europe 1,022.1 999.7 2.2
thereof Germany 424.5 424.6 –0.0
Latin America 304.6 365.3 –16.6
North America 864.7 890.0 –2.8
North- and Central Europe 604.3 684.4 –11.7
Western Europe, Middle East & Africa 781.1 814.2 –4.1
GEA 4,635.1 4,879.7 –5.0
In the reporting period, revenue of EUR 730.1 million (previous year: EUR 768.3 million) was attributable to the U.S and EUR 457.8 million (previous year: EUR 439.9 million) was attributable to the People’s Republic of China. There are no relationships with individual customers whose revenue can be considered material in comparison to total group revenue.
Since fiscal year 2019, GEA’s management has used absolute earnings before interest, taxes, depreciation, and amortization (EBITDA) before restructuring measures as a key performance indicator for management purposes in addition to revenue. When calculating EBITDA before restructuring measures, adjustments are made for effects on earnings attributable to restructuring measures whose content, scope, and definition are described by the Chairman of the Executive Board, presented to the Chairman of the Supervisory Board, and jointly agreed to. Only measures exceeding EUR 2 million shall be taken into account. If, in addition, the relevant transaction is subject to approval in accordance with the Rules of Procedure of the Board of Management, it must also be approved by the Supervisory Board.
190GEA Annual Report 2020
Notes to the Consolidated Financial Statements 9. Segment Reporting

In accordance with the above definition, EUR 110.2 million (previous year: EUR 380.5 million) were adjusted as restructuring expenses in the 2020 financial year, of which EUR 54.2 million (previous year: EUR 104.9 million) were attributable to EBITDA. Of these restructuring expenses, EUR 49.2 million are cash-effective, thereof EUR 38.2 million in the reporting year. The term restructuring expense in this context includes expenses that are directly related to the restructuring measures (e.g., severance payments) and therefore also qualify as restructuring expenses under IAS 37. In addition, the restructuring measures defined by the Executive Board also include impairment losses on assets as well as other expenses indirectly caused by the restructuring measures.
The restructuring expenses incurred in fiscal year 2020 can be allocated to the segments as follows:
(EUR million)
Separation & Flow
Technologies
Liquid & Powder
Technologies
Food & Healthcare
TechnologiesFarm
TechnologiesRefrigeration Technologies Others GEA
Restructuring according to IAS 37 10.1 –6.2 2.5 –3.8 –0.6 1.9 3.9
Impairments and reversals of impairments 1.4 7.1 11.3 21.4 12.6 – 53.7
Gains and losses from the disposal of selected parts of operations – – – 6.1 – – 6.1
Others 5.8 2.2 1.5 3.3 0.3 33.4 46.5
Total 17.3 3.1 15.3 27.0 12.3 35.3 110.2
The EUR 33.4 million included in Other mainly relates to expenses incurred in connection with the strategic reorganization of GEA.
9.2 Disclosures by geographic regionNon-current assets (property, plant and equipment, investment property and intangible assets excluding goodwill) are allocated according to their respective locations. The figures quoted relate to the group as a whole.
(EUR millions) Asia Pacific
DACH & EasternEurope
thereof Germany
LatinAmerica
NorthAmerica
North- andCentralEurope
Western Europe,
Middle East & Africa Total
01/01/2020 - 12/31/2020
Non-current assets 98.9 462.2 414.8 5.5 57.3 148.4 237.5 1,009.6
01/01/2019 - 12/31/2019
Non-current assets* 117.1 509.8 454.2 5.9 73.0 186.6 257.7 1,150.0
*) Previous year’s figures have been adjusted. Goodwill has been excluded.
The carrying amounts of non-current assets in the Netherlands amounted to EUR 73.2 million (previous year: EUR 96.8 million) as of the reporting date, and in Italy to EUR 213.9 million (previous year: EUR 226.7 million). These are the two countries with the largest amount of non-current assets.
191GEA Annual Report 2020
Notes to the Consolidated Financial Statements 9. Segment Reporting

10. Other Disclosures
10.1 Cash flow disclosuresCash flow from investing activities of discontinued operations comprises cash flows in connection with operations sold in previous years.
The financial liabilities, the inflows and outflows of which appear in the cash flow statement under cash flow from financing activities, changed as follows in fiscal year 2020:
(EUR thousand)Balance at 1/1/2020
Cash flow from finan-
cing activities
Changes in consolidated
groupExchange rate
differencesChanges in
fair value Other
changesBalance at
12/31/2020
Bonds and debentures issued 249,653 – – – – 85 249,738
Finance loans 50,919 99,888 – 6 – –212 150,601
Liabilities from finance leases 123,266 – 192 1,806 – –24,499 100,765
Noncurrent financial liabilities 423,838 99,888 192 1,812 – –24,626 501,104
Bonds and debentures issued 2,143 – – – – 1 2,144
Finance loans 23,633 –6,725 – 60 – 2,024 18,992
Liabilities from finance leases 58,888 –62,362 386 4,487 – 54,781 56,180
Current financial liabilities 84,664 –69,087 386 4,547 – 56,806 77,316
Interest rate swap and forward ex-change contracts used for hedging - liabilities – – – – – – –
Total 508,502 30,801 578 6,359 – 32,180 578,420
(EUR thousand)Balance at 1/1/2019
Cash flow from finan-
cing activities
Changes in consolidated
groupExchange rate
differencesChanges in
fair value Other
changesBalance at
12/31/2019
Bonds and debentures issued 249,569 – – – – 84 249,653
Finance loans 51,294 –362 – –13 – – 50,919
Liabilities from finance leases 4,160 – –1,022 661 – 119,467 123,266
Noncurrent financial liabilities 305,023 –362 –1,022 648 – 119,551 423,838
Bonds and debentures issued 2,143 – – – – – 2,143
Finance loans 17,523 6,240 –359 350 – –121 23,633
Liabilities from finance leases 2,235 –63,483 –290 192 – 120,234 58,888
Current financial liabilities 21,901 –57,243 –649 542 – 120,113 84,664
Interest rate swap and forward ex-change contracts used for hedging - liabilities – – – – – – –
Total 326,924 –57,605 –1,671 1,190 – 239,664 508,502
The table does not include financial liabilities of EUR 134,213 thousand (previous year: EUR 125,154 thousand), as the resulting cash flows are not allocated to cash flow from financing activities.
The financial liabilities referred to are liabilities to affiliated companies amount to EUR 28,941 thousand (previous year: EUR 31,195 thousand), liabilities to employees amount to EUR 20,092 thousand (previous year: EUR 20,397 thousand), liabilities from derivatives amount to EUR 6,687 thousand (previous year: EUR 5,513 thousand), and other financial liabilities amount to EUR 78,493 thousand (previous year: EUR 68,049 thousand).
Explanations regarding the adjustment of the presentation of financial liabilities compared to the previous year can be found in Note 6.4 to the consolidated financial statements.
192GEA Annual Report 2020
Notes to the Consolidated Financial Statements 10. Other Disclosures

10.2 Government grants Government grants related to income amounting to EUR 10,374 thousand were received in fiscal year 2020 (previous year: EUR 1,168 thousand). Grants related to assets of EUR 150 thousand (previous year EUR 243 thousand) were deducted from the carrying amounts of the assets concerned. In fiscal year 2020, expenses of EUR 82 thousand (previous year: EUR 290 thousand) were incurred for the potential repayment of grants received.
During 2020, GEA received government grants in some countries outside Germany in connection with claiming of short-time working benefits and the associated social security contributions. A receivable from the relevant employment agency or government is recognized when reimbursement for payments of short-time working benefits is reasonably certain. Subsidies of EUR 2,455 thousand (previous year: EUR 0 thousand) were granted for short-time allowances paid to employees. These had no impact on profit and loss. Reimbursements of social security contributions in connection with the utilization of short-time allowances amounted to EUR 3,224 thousand (previous year: EUR 0 thousand) and were recognized as a reduction in personnel expenses.
10.3 Related party disclosures
10.3.1 Related party transactionsTransactions between GEA Group Aktiengesellschaft and its consolidated subsidiaries were eliminated in the course of consolidation. Revenue and expenses from transactions between continuing and discontinued operations were not eliminated if they will continue to be incurred following the disposal of the discontinued operation.
Transactions with unconsolidated subsidiaries and joint ventures mainly relate to regular deliveries of goods and services. Income and expenses from transactions between the group as a whole and these companies are composed of the following items:
(EUR thousand) Revenue Other income Other expenses
01/01/2020 - 12/31/2020
Unconsolidated subsidiaries 29,538 1,155 6,874
Joint ventures 17,216 – –
Total 46,754 1,155 6,874
01/01/2019 - 12/31/2019
Unconsolidated subsidiaries 33,116 1,457 11,978
Joint ventures 11,089 – –
Total 44,205 1,457 11,978
Related party transactions resulted in the following outstanding items in the group as a whole as of December 31, 2020:
(EUR thousand) Trade receivables Trade payables Other receivables Other liabilities
12/31/2020
Unconsolidated subsidiaries 9,221 1,382 8,906 30,256
Joint ventures 3,974 20 1 –
Total 13,195 1,402 8,907 30,256
thereof current 13,099 1,402 8,898 30,256
12/31/2019
Unconsolidated subsidiaries 13,890 689 8,861 31,404
Joint ventures 2,378 – – –
Total 16,268 689 8,861 31,404
thereof current 16,268 689 8,452 31,204
In the reporting year, impairment losses on other receivables from unconsolidated subsidiaries of EUR 355 thousand (previous year: EUR 2.646 thousand) were recognized.
The outstanding amounts will be settled by bank transfer and are unsecured.
193GEA Annual Report 2020
Notes to the Consolidated Financial Statements 10. Other Disclosures

10.3.2 Remuneration of the Executive Board and the Supervisory BoardThe Executive Board and Supervisory Board of GEA Group Aktiengesellschaft received total remuneration of EUR 10,567 thousand in fiscal year 2020 (previous year: EUR 18,436 thousand). This amount comprised the following elements:
(EUR thousand) 2020 2019
Short-term employee benefits 6,892 8,880
Post-employment benefits 1,028 1,717
Termination benefits – 3,805
Share-based payments 2,647 4,034
Total 10,567 18,436
Former Executive Board members and their surviving dependents received remuneration from GEA amounting to EUR 4,977 thousand (previous year: EUR 11,377 thousand). Of this, EUR 4,977 thousand (previous year: EUR 4,708 thousand) was attributable to pension payments and EUR 0 thousand (previous year: EUR 6,669 thousand) to severance payments for members of the Executive Board who left the company during the fiscal year. In the reporting period, a former Executive Board member also exercised his capitalization option with regard to the full pension benefits he was entitled to as of January 1, 2020. The capitalization amount of EUR 8,575 thousand was paid out in January 2020. Pension provisions in accordance with IFRS were recognized for former Executive Board members and their surviving dependents in the amount of EUR 95,145 thousand (previous year: EUR 100,697 thousand). EUR 2,983 thousand of this amount (previous year: EUR 17,033 thousand) is attributable to members of the Executive Board who left the company during the fiscal year.
During the year under review, the expenses incurred for the Supervisory Board amounted to EUR 1,403 thousand (previous year: EUR 1,389 thousand).
Other information on the remuneration of the Executive Board and the Supervisory Board can be found in the remuneration report.
There were no other transactions by members of the Executive Board or Supervisory Board or their related parties in either the reporting or the comparative period.
194GEA Annual Report 2020
Notes to the Consolidated Financial Statements 10. Other Disclosures

11. Events after the End of the Reporting Period
As of January 1, 2021, GEA made some minor adjustments to its divisional structure, so that individual companies whose activities related to two or more divisions, but were allocated to just one, will be broken down by their respective business activities from 2021 onward. In so doing, GEA has created greater divisional separation and a clearer structure.
These management optimization-related adjustments affect the composition of the groups of cash-generating units with goodwill such that goodwill has been partially reallocated. Impairment tests performed on the five cash-generating units with goodwill immediately prior to reorganization on January 1, 2021 did not identify any need for impairment goodwill.
The disposal of selected lines within the Refrigeration Technologies Division announced on the capital markets day during September 2019 led to the sale of compressor manufacturer GEA Bock on September 21, 2020. Closing the transaction on February 26, 2021 will result in the deconsolidation of three group companies currently part of the GEA Group Aktiengesellschaft and the disposal of assets and liabilities associated with Bock. Based on the preliminary purchase price, the loss on disposal amounts to around EUR 8,900 thousand. The final purchase price is still being negotiated.
195GEA Annual Report 2020
Notes to the Consolidated Financial Statements 11. Events after the End of the Reporting Period
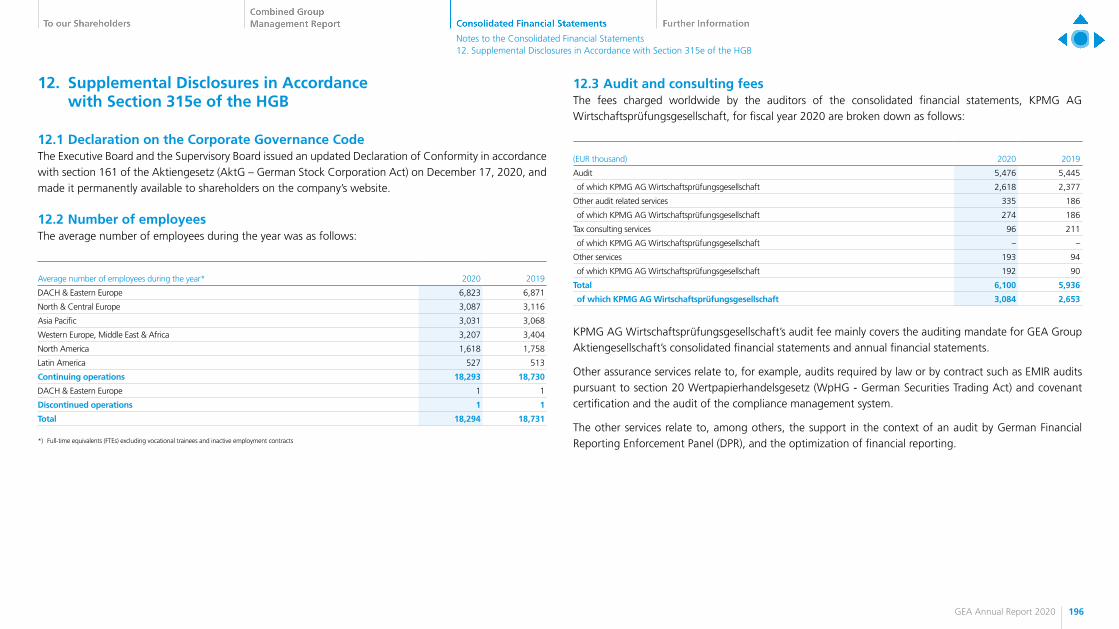
12. Supplemental Disclosures in Accordance with Section 315e of the HGB
12.1 Declaration on the Corporate Governance CodeThe Executive Board and the Supervisory Board issued an updated Declaration of Conformity in accordance with section 161 of the Aktiengesetz (AktG – German Stock Corporation Act) on December 17, 2020, and made it permanently available to shareholders on the company’s website.
12.2 Number of employeesThe average number of employees during the year was as follows:
Average number of employees during the year* 2020 2019
DACH & Eastern Europe 6,823 6,871
North & Central Europe 3,087 3,116
Asia Pacific 3,031 3,068
Western Europe, Middle East & Africa 3,207 3,404
North America 1,618 1,758
Latin America 527 513
Continuing operations 18,293 18,730
DACH & Eastern Europe 1 1
Discontinued operations 1 1
Total 18,294 18,731
*) Full-time equivalents (FTEs) excluding vocational trainees and inactive employment contracts
12.3 Audit and consulting feesThe fees charged worldwide by the auditors of the consolidated financial statements, KPMG AG Wirtschaftsprüfungsgesellschaft, for fiscal year 2020 are broken down as follows:
(EUR thousand) 2020 2019
Audit 5,476 5,445
of which KPMG AG Wirtschaftsprüfungsgesellschaft 2,618 2,377
Other audit related services 335 186
of which KPMG AG Wirtschaftsprüfungsgesellschaft 274 186
Tax consulting services 96 211
of which KPMG AG Wirtschaftsprüfungsgesellschaft – –
Other services 193 94
of which KPMG AG Wirtschaftsprüfungsgesellschaft 192 90
Total 6,100 5,936
of which KPMG AG Wirtschaftsprüfungsgesellschaft 3,084 2,653
KPMG AG Wirtschaftsprüfungsgesellschaft’s audit fee mainly covers the auditing mandate for GEA Group Aktiengesellschaft’s consolidated financial statements and annual financial statements.
Other assurance services relate to, for example, audits required by law or by contract such as EMIR audits pursuant to section 20 Wertpapierhandelsgesetz (WpHG - German Securities Trading Act) and covenant certification and the audit of the compliance management system.
The other services relate to, among others, the support in the context of an audit by German Financial Reporting Enforcement Panel (DPR), and the optimization of financial reporting.
196GEA Annual Report 2020
Notes to the Consolidated Financial Statements 12. Supplemental Disclosures in Accordance with Section 315e of the HGB
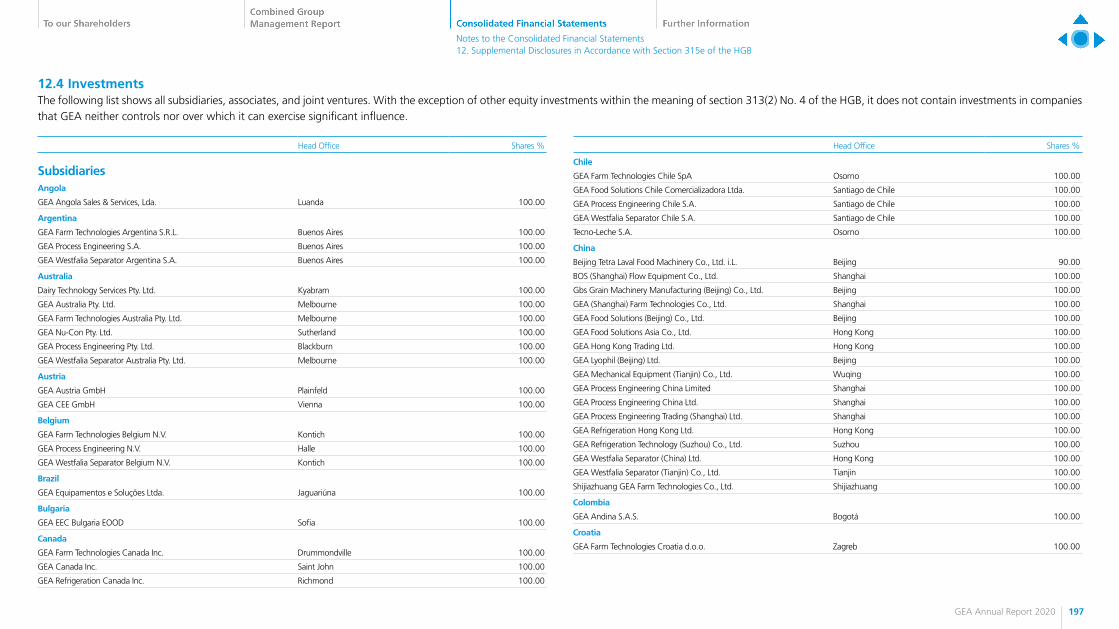
12.4 InvestmentsThe following list shows all subsidiaries, associates, and joint ventures. With the exception of other equity investments within the meaning of section 313(2) No. 4 of the HGB, it does not contain investments in companies that GEA neither controls nor over which it can exercise significant influence.
Head Office Shares %
SubsidiariesAngola
GEA Angola Sales & Services, Lda. Luanda 100.00
Argentina
GEA Farm Technologies Argentina S.R.L. Buenos Aires 100.00
GEA Process Engineering S.A. Buenos Aires 100.00
GEA Westfalia Separator Argentina S.A. Buenos Aires 100.00
Australia
Dairy Technology Services Pty. Ltd. Kyabram 100.00
GEA Australia Pty. Ltd. Melbourne 100.00
GEA Farm Technologies Australia Pty. Ltd. Melbourne 100.00
GEA Nu-Con Pty. Ltd. Sutherland 100.00
GEA Process Engineering Pty. Ltd. Blackburn 100.00
GEA Westfalia Separator Australia Pty. Ltd. Melbourne 100.00
Austria
GEA Austria GmbH Plainfeld 100.00
GEA CEE GmbH Vienna 100.00
Belgium
GEA Farm Technologies Belgium N.V. Kontich 100.00
GEA Process Engineering N.V. Halle 100.00
GEA Westfalia Separator Belgium N.V. Kontich 100.00
Brazil
GEA Equipamentos e Soluções Ltda. Jaguariúna 100.00
Bulgaria
GEA EEC Bulgaria EOOD Sofia 100.00
Canada
GEA Farm Technologies Canada Inc. Drummondville 100.00
GEA Canada Inc. Saint John 100.00
GEA Refrigeration Canada Inc. Richmond 100.00
Head Office Shares %
Chile
GEA Farm Technologies Chile SpA Osorno 100.00
GEA Food Solutions Chile Comercializadora Ltda. Santiago de Chile 100.00
GEA Process Engineering Chile S.A. Santiago de Chile 100.00
GEA Westfalia Separator Chile S.A. Santiago de Chile 100.00
Tecno-Leche S.A. Osorno 100.00
China
Beijing Tetra Laval Food Machinery Co., Ltd. i.L. Beijing 90.00
BOS (Shanghai) Flow Equipment Co., Ltd. Shanghai 100.00
Gbs Grain Machinery Manufacturing (Beijing) Co., Ltd. Beijing 100.00
GEA (Shanghai) Farm Technologies Co., Ltd. Shanghai 100.00
GEA Food Solutions (Beijing) Co., Ltd. Beijing 100.00
GEA Food Solutions Asia Co., Ltd. Hong Kong 100.00
GEA Hong Kong Trading Ltd. Hong Kong 100.00
GEA Lyophil (Beijing) Ltd. Beijing 100.00
GEA Mechanical Equipment (Tianjin) Co., Ltd. Wuqing 100.00
GEA Process Engineering China Limited Shanghai 100.00
GEA Process Engineering China Ltd. Shanghai 100.00
GEA Process Engineering Trading (Shanghai) Ltd. Shanghai 100.00
GEA Refrigeration Hong Kong Ltd. Hong Kong 100.00
GEA Refrigeration Technology (Suzhou) Co., Ltd. Suzhou 100.00
GEA Westfalia Separator (China) Ltd. Hong Kong 100.00
GEA Westfalia Separator (Tianjin) Co., Ltd. Tianjin 100.00
Shijiazhuang GEA Farm Technologies Co., Ltd. Shijiazhuang 100.00
Colombia
GEA Andina S.A.S. Bogotá 100.00
Croatia
GEA Farm Technologies Croatia d.o.o. Zagreb 100.00
197GEA Annual Report 2020
Notes to the Consolidated Financial Statements 12. Supplemental Disclosures in Accordance with Section 315e of the HGB

Head Office Shares %
Czech Republic
GEA Bock Czech s.r.o. Stribro 100.00
GEA Czech Republic s.r.o. Prague 100.00
GEA Westfalia Separator CZ s.r.o. Prague 100.00
Denmark
GEA Farm Technologies Mullerup A/S Ullerslev 100.00
GEA Food Solutions Denmark A/S Slagelse 100.00
GEA Food Solutions International A/S Slagelse 100.00
GEA Food Solutions Nordic A/S Slagelse 100.00
GEA Process Engineering A/S Soeborg 100.00
GEA Refrigeration Components (Nordic) A/S Skanderborg 100.00
GEA Scan-Vibro A/S Svendborg 100.00
GEA Westfalia Separator DK A/S Skanderborg 100.00
Finland
GEA Finland Oy Helsinki 100.00
France
GEA Farm Technologies France SAS Château-Thierry 100.00
GEA Food Solutions France SAS Beaucouzé 100.00
GEA Group Holding France SAS Montigny le Bretonneux 100.00
GEA Process Engineering SAS Saint-Quentin en Yvelines Cedex 100.00
GEA Refrigeration France SAS Les Sorinières 100.00
GEA Tuchenhagen France Hoenheim 100.00
GEA Westfalia Separator France Château-Thierry 100.00
Germany
„SEMENOWSKY VAL“ Immobilien-Verwaltungs-GmbH i.L. Düsseldorf 100.00
Brückenbau Plauen GmbH Frankfurt/Main 100.00
GEA AWP GmbH* Prenzlau 100.00
GEA Beteiligungsgesellschaft I mbH Düsseldorf 100.00
GEA Beteiligungsgesellschaft III mbH Düsseldorf 100.00
GEA Bischoff GmbH* Essen 100.00
GEA Bock GmbH Frickenhausen 100.00
GEA Brewery Systems GmbH* Kitzingen 100.00
GEA Diessel GmbH* Hildesheim 100.00
GEA Erste Kapitalbeteiligungen GmbH & Co. KG* Düsseldorf 100.00
Head Office Shares %
GEA Farm Technologies GmbH* Bönen 100.00
GEA Food Solutions Germany GmbH* Biedenkopf-Wallau 100.00
GEA Germany GmbH* Oelde 100.00
GEA Group Holding GmbH* Düsseldorf 100.00
GEA Internal Services GmbH* Düsseldorf 100.00
GEA Lyophil GmbH* Hürth 100.00
GEA Mechanical Equipment GmbH* Oelde 100.00
GEA Messo GmbH* Duisburg 100.00
GEA Real Estate GmbH* Frankfurt/Main 100.00
GEA Refrigeration Germany GmbH* Berlin 100.00
GEA Refrigeration Technologies GmbH* Berlin 100.00
GEA Segment Management Holding GmbH Düsseldorf 100.00
GEA TDS GmbH* Sarstedt 100.00
GEA Tuchenhagen GmbH* Büchen 100.00
GEA Verwaltungs AG Düsseldorf 100.00
GEA Westfalia Separator Group GmbH* Oelde 100.00
GEA Wiegand GmbH* Ettlingen 100.00
Kupferbergbau Stadtberge zu Niedermarsberg GmbH i.L. Lennestadt 100.00
LL Plant Engineering AG* Lennestadt 100.00
mg Altersversorgung GmbH* Düsseldorf 100.00
mg capital gmbh* Düsseldorf 100.00
MG Stahlhandel GmbH Düsseldorf 100.00
Paul Pollrich GmbH* Düsseldorf 100.00
Ruhr-Zink GmbH Frankfurt/Main 100.00
Sachtleben Bergbau Verwaltungsgesellschaft mit beschränkter Haftung Lennestadt 100.00
Trennschmelz Altersversorgung GmbH Düsseldorf 100.00
Twiste Copper GmbH Lennestadt 100.00
VDM-Hilfe GmbH Frankfurt/Main 100.00
Great Britain
Breconcherry Ltd. Bromyard 100.00
Dixie-Union (UK) Ltd. Milton Keynes 100.00
GEA Barr-Rosin Ltd. Maidenhead 100.00
GEA Eurotek Ltd. London 100.00
GEA Farm Technologies (UK) Ltd. Warminster 100.00
GEA Food Solutions UK & Ireland Ltd. Milton Keynes 100.00
198GEA Annual Report 2020
Notes to the Consolidated Financial Statements 12. Supplemental Disclosures in Accordance with Section 315e of the HGB

Head Office Shares %
GEA Grenco Ltd. Sittingbourne 100.00
GEA Group Holdings (UK) Ltd. Eastleigh 100.00
GEA Mechanical Equipment UK Ltd. Milton Keynes 100.00
GEA Pharma Systems Ltd. Eastleigh 100.00
GEA Process Engineering Ltd. Warrington 100.00
GEA Refrigeration Components (UK) Ltd. Ross-on-Wye 100.00
GEA Refrigeration UK Ltd. London 100.00
Milfos UK Ltd. Halesowen 100.00
Wolfking Ltd. Milton Keynes 100.00
Greece
GEA Westfalia Separator Hellas A.E. Athens 100.00
Hungary
GEA Process Engineering CEE Kft. Budaörs 100.00
Iceland
GEA Iceland ehf. Kòpavogur 100.00
India
GEA Process Engineering (India) Pvt. Ltd. Vadodara 100.00
GEA Refrigeration India Pvt. Ltd. Vadodara 100.00
GEA Westfalia Separator India Pvt. Ltd. Vadodara 100.00
LL Plant Engineering (India) Pvt. Ltd. Mumbai Maharashtra 100.00
Indonesia
GEA Westfalia Separator Indonesia, PT Jakarta 100.00
PT. GEA Refrigeration Indonesia Jakarta 100.00
Ireland
GEA Farm Technologies (Ireland) Ltd. Ballincollig 100.00
GEA Ireland Ltd. Kildare 100.00
GEA Process Technologies Ireland Ltd. Kildare 100.00
GEA Refrigeration Ireland Ltd. Cavan 100.00
GEA Westfalia Separator Ireland Ltd. Ballincollig 100.00
Italy
CMT Costruzioni Meccaniche e Tecnologia S.p.A Peveragno 100.00
GEA COMAS S.p.A. Torrebelvicino 100.00
GEA Food Solutions Italy S.r.l. Osio Sopra 100.00
GEA Imaforni S.p.A Colognola ai Colli 100.00
Head Office Shares %
GEA Mechanical Equipment Italia S.p.A. Parma 100.00
GEA Process Engineering S.p.A. Osio Sopra 100.00
GEA Procomac S.p.A. Sala Baganza 100.00
GEA Refrigeration Italy S.p.A. Castel Maggiore 100.00
Golfetto Sangati S.r.l. Galliera Veneta 100.00
Pavan S.p.A. Galliera Veneta 100.00
Pelacci S.R.L. i.L. Sala Baganza 67.00
Veneta Alimenti Innovativi S.r.l. Pieve D’Alpago 100.00
Japan
GEA Japan Ltd. Tokyo 100.00
Lithuania
GEA Baltics UAB Vilnius 100.00
Malaysia
GEA Refrigeration Malaysia Sdn. Bhd. Petaling Jaya 100.00
GEA Westfalia Separator (Malaysia) Sdn. Bhd. Shah Alam 100.00
Mexico
Convenience Food Systems S.A. de C.V. Mexico City 100.00
GEA Power Cooling de Mexico S. de R.L. de C.V. Mexico City 100.00
GEA Process Engineering S.A. de C.V. Mexico City 100.00
GEA Westfalia Separator Mexicana S.A. de C.V. Cuernavaca 100.00
Netherlands
BOS Homogenisers B.V. Hilversum 100.00
GEA Dutch Holding B.V. s-Hertogenbosch 100.00
GEA Farm Technologies Nederland B.V. Leeuwarden 100.00
GEA Food Solutions B.V. Bakel 100.00
GEA Food Solutions Bakel B.V. Bakel 100.00
GEA Food Solutions International B.V. Bakel 100.00
GEA Food Solutions Weert B.V. Weert 100.00
GEA Niro PT B.V. s-Hertogenbosch 100.00
GEA Process Engineering Nederland B.V. Deventer 100.00
GEA Refrigeration Netherlands N.V. s-Hertogenbosch 100.00
GEA Westfalia Separator Nederland B.V. Cuijk 100.00
GEA Westfalia Separator Nederland Service B.V. Cuijk 100.00
KET Marine International B.V. Zevenbergen 100.00
199GEA Annual Report 2020
Notes to the Consolidated Financial Statements 12. Supplemental Disclosures in Accordance with Section 315e of the HGB
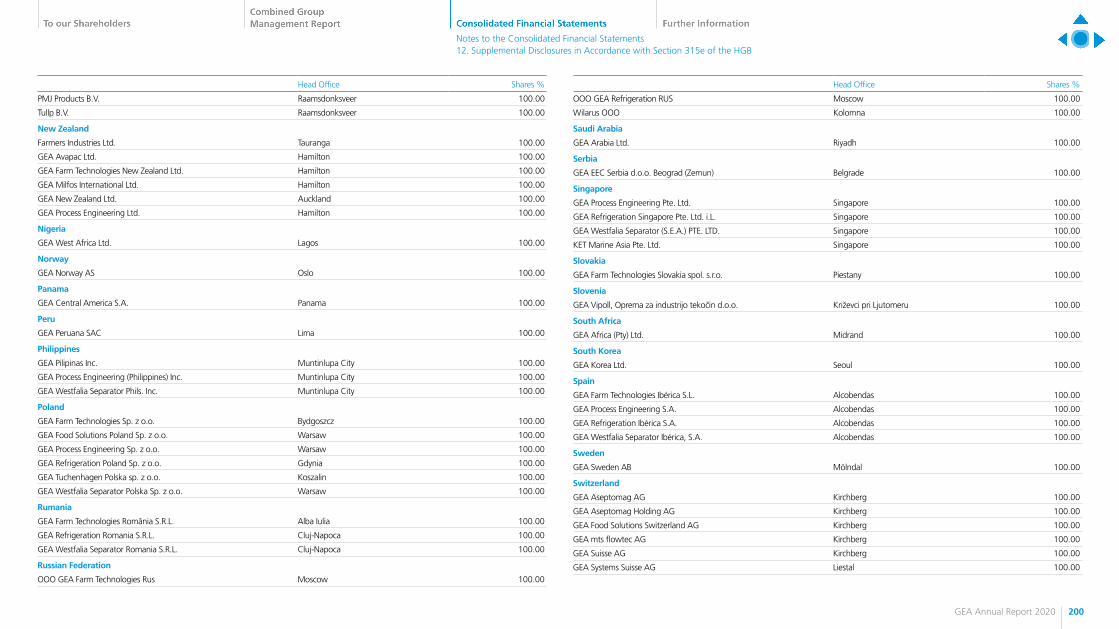
Head Office Shares %
PMJ Products B.V. Raamsdonksveer 100.00
Tullp B.V. Raamsdonksveer 100.00
New Zealand
Farmers Industries Ltd. Tauranga 100.00
GEA Avapac Ltd. Hamilton 100.00
GEA Farm Technologies New Zealand Ltd. Hamilton 100.00
GEA Milfos International Ltd. Hamilton 100.00
GEA New Zealand Ltd. Auckland 100.00
GEA Process Engineering Ltd. Hamilton 100.00
Nigeria
GEA West Africa Ltd. Lagos 100.00
Norway
GEA Norway AS Oslo 100.00
Panama
GEA Central America S.A. Panama 100.00
Peru
GEA Peruana SAC Lima 100.00
Philippines
GEA Pilipinas Inc. Muntinlupa City 100.00
GEA Process Engineering (Philippines) Inc. Muntinlupa City 100.00
GEA Westfalia Separator Phils. Inc. Muntinlupa City 100.00
Poland
GEA Farm Technologies Sp. z o.o. Bydgoszcz 100.00
GEA Food Solutions Poland Sp. z o.o. Warsaw 100.00
GEA Process Engineering Sp. z o.o. Warsaw 100.00
GEA Refrigeration Poland Sp. z o.o. Gdynia 100.00
GEA Tuchenhagen Polska sp. z o.o. Koszalin 100.00
GEA Westfalia Separator Polska Sp. z o.o. Warsaw 100.00
Rumania
GEA Farm Technologies România S.R.L. Alba Iulia 100.00
GEA Refrigeration Romania S.R.L. Cluj-Napoca 100.00
GEA Westfalia Separator Romania S.R.L. Cluj-Napoca 100.00
Russian Federation
OOO GEA Farm Technologies Rus Moscow 100.00
Head Office Shares %
OOO GEA Refrigeration RUS Moscow 100.00
Wilarus OOO Kolomna 100.00
Saudi Arabia
GEA Arabia Ltd. Riyadh 100.00
Serbia
GEA EEC Serbia d.o.o. Beograd (Zemun) Belgrade 100.00
Singapore
GEA Process Engineering Pte. Ltd. Singapore 100.00
GEA Refrigeration Singapore Pte. Ltd. i.L. Singapore 100.00
GEA Westfalia Separator (S.E.A.) PTE. LTD. Singapore 100.00
KET Marine Asia Pte. Ltd. Singapore 100.00
Slovakia
GEA Farm Technologies Slovakia spol. s.r.o. Piestany 100.00
Slovenia
GEA Vipoll, Oprema za industrijo tekočin d.o.o. Križevci pri Ljutomeru 100.00
South Africa
GEA Africa (Pty) Ltd. Midrand 100.00
South Korea
GEA Korea Ltd. Seoul 100.00
Spain
GEA Farm Technologies Ibérica S.L. Alcobendas 100.00
GEA Process Engineering S.A. Alcobendas 100.00
GEA Refrigeration Ibérica S.A. Alcobendas 100.00
GEA Westfalia Separator Ibérica, S.A. Alcobendas 100.00
Sweden
GEA Sweden AB Mölndal 100.00
Switzerland
GEA Aseptomag AG Kirchberg 100.00
GEA Aseptomag Holding AG Kirchberg 100.00
GEA Food Solutions Switzerland AG Kirchberg 100.00
GEA mts flowtec AG Kirchberg 100.00
GEA Suisse AG Kirchberg 100.00
GEA Systems Suisse AG Liestal 100.00
200GEA Annual Report 2020
Notes to the Consolidated Financial Statements 12. Supplemental Disclosures in Accordance with Section 315e of the HGB

Head Office Shares %
Taiwan
GEA Process Engineering Taiwan Ltd. Taipeh 100.00
Thailand
CFS Asia Ltd. i.L. Bangkok 99.9998
GEA (Thailand) Co., Ltd. Bangkok 99.9994
GEA Process Engineering (Thailand) Co., Ltd. Bangkok 100.00
Turkey
GEA Farm Technologies Tarim Ekip.Mak.Kim. Tek.Dan.San.Tic.Ltd.Sti. i.L. Izmir 100.00
GEA PROCESS MÜHENDISLIK MAKINE INSAAT TAAHÜT ITHALAT IHRACAT DANIS. SAN. VE TIC. LTD. STI. Izmir 100.00
GEA Westfalia Separator Sanayi ve Ticaret Ltd. Sti. Izmir 100.00
Ukraine
DE GEA Westfalia Separator Ukraine Kiev 100.00
GEA Food Solutions Ukraine LLC i.L. Kiev 100.00
GEA Grasso TOV Kiev 100.00
TOV GEA Ukraine Bila Zerkva 100.00
United Arab Emirates
GEA Middle East FZE Dubai 100.00
PPME Middle East FZE i.L. Dubai 100.00
Uruguay
Balterin S.A. Montevideo 100.00
Crismil S.A. Montevideo 100.00
USA
GEA Farm Technologies, Inc. Naperville 100.00
GEA Food Solutions North America, Inc. Frisco 100.00
GEA Mechanical Equipment US, Inc. Northvale 100.00
GEA North America, Inc. Wilmington 100.00
GEA Systems North America LLC Columbia 100.00
Niro Sterner, Inc. Columbia 100.00
Pavan U.S.A., Inc. Emigsville 100.00
Vietnam
GEA Vietnam Co., Ltd. Ho Chi Minh City 100.00
Head Office Shares %
Accociated CompaniesArgentina
IMAI S.A. Buenos Aires 20.00
Joint VenturesGermany
Merton Wohnprojekt GmbH Frankfurt/Main 50.00
Japan
GEA ORION Farm Technologies Co., Ltd. Nagano 49.00
United Arab Emirates
GRADE Grasso Adearest Ltd. Dubai 50.00
GRADE Refrigeration LLC Sharjah 49.00
Other equity investments under section 313(2) no. 4 of the HGBBrazil
EPSA Empresa Paulista de Servicos Ambientais S.A. Sao Paulo 47.50
Germany
Bauverein Oelde GmbH Oelde 35.50
India
Indo Technofrigo Ltd. i.L. Rajkot 49.00
*) In accordance with section 264 (3) and 264b of the HGB the consolidated subsidiaries are exempted from the duty to comply with the supplementary accounting, auditing and publication requirements applicable to corporations and certain partnerships.
Düsseldorf, March 2, 2021
The Executive Board
Stefan Klebert Johannes Giloth Marcus A. Ketter
201GEA Annual Report 2020
Notes to the Consolidated Financial Statements 12. Supplemental Disclosures in Accordance with Section 315e of the HGB

202GEA Annual Report 2020
Independent Auditor‘s Report 203Limited Assurance Report of the Independent Auditor regarding the Non-financial Group Statement 212Responsibility Statement 214
Corporate Bodies and their Mandates 215Key Figures by Quarter 218Financial Calendar/Imprint 219
Further Information

Independent Auditor’s Report
To GEA Group Aktiengesellschaft
Report on the Audit of the Consolidated Financial Statements and of the Combined Group Management Report
OpinionsWe have audited the consolidated financial statements of GEA Group Aktiengesellschaft, Düsseldorf, and its subsidiaries (the Group), which comprise the consolidated balance sheet as of December 31, 2020, the consolidated income statement, the consolidated statement of comprehensive income, the consolidated statement of changes in equity and the consolidated cash flow statement for the financial year from January 1 to December 31, 2020, and notes to the consolidated financial statements, including a summary of significant accounting policies. In addition, we have audited the combined group management report of GEA Group Aktiengesellschaft, Düsseldorf, for the financial year from January 1 to December 31, 2020. In accordance with German legal requirements, we have not audited the content of those components of the combined group management report specified in the “Other Information” section of our auditor’s report.
In our opinion, on the basis of the knowledge obtained in the audit, • the accompanying consolidated financial statements comply, in all material respects, with the IFRSs
as adopted by the EU, and the additional requirements of German commercial law pursuant to Section 315e (1) HGB [Handelsgesetzbuch: German Commercial Code] and, in compliance with these requirements, give a true and fair view of the assets, liabilities, and financial position of the Group as of December 31, 2020, and of its financial performance for the financial year from January 1 to December 31, 2020, and
• the accompanying combined group management report as a whole provides an appropriate view of the Group’s position. In all material respects, this combined group management report is consistent with the consolidated financial statements, complies with German legal requirements and appropriately presents the opportunities and risks of future development. Our opinion on the management report does not cover the content of those components of the combined group management report specified in the “Other Information” section of the auditor’s report.
Pursuant to Section 322 (3) sentence 1 HGB, we declare that our audit has not led to any reservations relating to the legal compliance of the consolidated financial statements and of the combined group management report.
203GEA Annual Report 2020
Independent Auditor‘s Report

Basis for the OpinionsWe conducted our audit of the consolidated financial statements and of the combined group management report in accordance with Section 317 HGB and the EU Audit Regulation No. 537/2014 (referred to subsequently as “EU Audit Regulation”) and in compliance with German Generally Accepted Standards for Financial Statement Audits promulgated by the Institut der Wirtschaftsprüfer [Institute of Public Auditors in Germany] (IDW). Our responsibilities under those requirements and principles are further described in the “Auditor’s Responsibilities for the Audit of the Consolidated Financial Statements and of the Combined Group Management Report” section of our auditor’s report. We are independent of the group entities in accordance with the requirements of European law and German commercial and professional law, and we have fulfilled our other German professional responsibilities in accordance with these requirements. In addition, in accordance with Article 10 (2) point (f) of the EU Audit Regulation, we declare that we have not provided non-audit services prohibited under Article 5 (1) of the EU Audit Regulation. We believe that the evidence we have obtained is sufficient and appropriate to provide a basis for our opinions on the consolidated financial statements and on the combined group management report.
Key Audit Matters in the Audit of the Consolidated Financial StatementsKey audit matters are those matters that, in our professional judgment, were of most significance in our audit of the consolidated financial statements for the financial year from January 1 to December 31, 2020. These matters were addressed in the context of our audit of the consolidated financial statements as a whole, and in forming our opinion thereon, we do not provide a separate opinion on these matters.
Testing the goodwill of the Farm Technologies (FT) and Food & Healthcare Solutions (FHT) Divisions for impairment
Please refer to note 2 in the notes to the consolidated financial statements for information on the accounting policies applied and the assumptions used. Disclosures on the value of goodwill can be found under note 5.2.
THE FINANCIAL STATEMENT RISKGoodwill totaled EUR 1,502.1 million as of December 31, 2020, of which EUR 170 million was attributable to the FHT segment and EUR 121 million to the FT segment. Overall, at 26% of the total assets, goodwill represents a significant amount of the assets.
Goodwill is tested for impairment annually on business segment level (on division level at GEA). Should there be any intra-year indications of impairment, goodwill is then also tested ad hoc for impairment during the year. For this purpose, the carrying amount is compared to the recoverable amount of the segments. If the carrying amount exceeds the recoverable amount, this indicates a requirement for impairment. The recoverable amount is the higher of fair value less costs to sell and value in use of the segments. Due to the low difference – considered possible as of the date of risk assessment – between the carrying amount and recoverable amount for the FT and FHT segments, the following reporting is restricted to the goodwill impairment of specifically these segments. The effective date for the impairment test is October 31, 2020. Based on the impairment tests conducted, the Company did not identify any need to recognize impairment losses.
The Company modified its internal control system as of January 1, 2020. In previous years management was most recently structured into two business areas as well as the Pavan Group. Since January 1, 2020, management is structured according to the five following divisions: Separation & Flow Technologies (SFT), Liquid & Powder Technologies (LPT), Food & Healthcare Technologies (FHT), Farm Technologies (FT) and Refrigeration Technologies (RT). These changes require reallocation according to relative values of the divisions that were previously tested on the level of the business areas. Prior to reallocating goodwill to the divisions, the most recent impairment test was performed in the old allocation structure as of December 31, 2019.
Testing goodwill allocated to the divisions for impairment is complex and based on a range of assumptions that require judgment. These include the expected business and earnings performance of the FHT and FT divisions for the next three years, the assumed long-term growth rates and the discount rate used.
204GEA Annual Report 2020
Independent Auditor‘s Report

There is the risk for the consolidated financial statements that impairment existing as at the reporting date was not identified. There is also the risk that the related disclosures in the notes are not appropriate or incomplete.
OUR AUDIT APPROACHWe obtained a detailed understanding of the business planning process during our audit. GEA has implemented controls to ensure business planning’s appropriateness. We assessed the design, establishment and effectiveness of selected controls. With the involvement of our valuation experts, we assessed both the new allocation of goodwill to the divisions as well as appropriateness of the Company’s key assumptions and calculation methods for testing the goodwill of the FHT and FT divisions for impairment. To this end, we discussed and validated with those responsible for planning the expected development of business and earnings as well as the assumed long-term growth rates. We also reconciled this information with other internally available forecasts and the budget prepared by the Executive Board and approved by the Supervisory Board. In addition, we assessed the consistency of assumptions with external market assessments.
We also confirmed the accuracy of the Company’s previous forecasts by comparing the budgets of previous financial years with actual results and by analyzing deviations. We compared the assumptions and data underlying the capital costs, in particular the risk-free rate, the market risk premium, country risk premium and the beta factor – in each case for the FHT and FT CGUs, which contain goodwill – with our own estimates and publicly available data.
To ensure the computational accuracy of the measurement method used, we verified the Company’s calculations. Furthermore, we verified that between the effective date for impairment testing and the reporting date there were no indications of a need to recognize impairment losses.
Finally, we evaluated whether the disclosures in the notes on impairment of goodwill are complete and appropriate.
OUR OBSERVATIONSThe reallocation of goodwill to the divisions is appropriate. The calculation method used for impairment testing of goodwill is appropriate and in line with the accounting policies to be applied. The Company’s assumptions and data used for measurement are appropriate.
The corresponding disclosures in the notes are complete and appropriate.
Recognition of revenue from construction contracts
Please refer to the explanatory notes under note 2 for the accounting policies applied. Disclosures on revenue from construction contracts and construction contracts with credit and debit balances vis-à-vis customers can be found under note 7.1 in the notes to the consolidated financial statements.
THE FINANCIAL STATEMENT RISKIn financial year 2020, revenue in the amount of EUR 1,819.8 million was generated from construction contracts. As of the December 31, 2020 reporting date, the gross amount due from customers for contract work (contract assets) was EUR 348.3 million and the gross amount due to customers for contract work (contract liabilities) was EUR 682.4 million.
Contract revenue and results of construction contracts, which are to be recognized over time according to IFRS 15.35, are recognized in accordance with the percentage of completion method pursuant to IFRS 15.B18 by reference to the stage of completion. The stage of completion is determined as the proportion that contract costs incurred for work performed to date bear to the estimated total contract costs (cost to cost method). When it is probable that total contract costs will exceed total contract revenue, this loss is to be recognized as a provision for onerous contracts according to the rules set forth under IAS 37.
Determining the revenue from construction contracts that can be recognized is complex and requires estimates, especially with regard to the total contract cost to be estimated for establishing the stage of completion. The risk for the consolidated financial statements of GEA Group Aktiengesellschaft is that the revenue and realized results of construction contracts are inaccurately allocated to financial years or that onerous construction contracts are not recognized in time.
205GEA Annual Report 2020
Independent Auditor‘s Report

OUR AUDIT APPROACHWe assessed the procedure for estimating contract costs, the method for determining stage of completion as well as the design and establishment of controls to ensure proper planning of the entire contract costs.
We performed the following audit procedures for construction contracts specifically selected on the basis of risk (list not exhaustive): • interviewing GEA staff involved in the project, including on estimates of the overall contract costs,
risks involved and status of the projects • reconciling the actual cost allocated to the contracts with internal cost schedules and external documents • critical review of assumptions used for estimates of total contract costs, also by analyzing project
progress to date and any deviations from the budget • assessment of the computational accuracy of the stage of completion determined as well as any
losses anticipated and also the proper accounting treatment of construction contracts and possible provisions for onerous contracts under IAS 37.
OUR OBSERVATIONSGEA’s accounting treatment of construction contracts and the corresponding provisions for onerous contracts is appropriate. The assumptions underlying the accounting for construction orders are appropriate overall.
Impairment of trade receivables
Please refer to the explanatory notes under note 2 for the accounting policies applied. Disclosures on trade receivables can be found under note 5.7 in the notes to the consolidated financial statements.
THE FINANCIAL STATEMENT RISKTrade receivables from third parties in the amount of EUR 725.5 million were reported in the consolidated financial statements of GEA Group Aktiengesellschaft as of December 31, 2020. Trade receivables from third parties that are past due but not impaired amounted to EUR 146.4 million as of December 31, 2020, of which EUR 3.8 million was overdue for more than 360 days.
The recoverability of trade receivables is assessed on an individual basis according to individual debtors and on a collective basis according to debtors of the same type.
If past due receivables, financial and economic difficulties at the customer or actual and expected defaults on payment have occurred, the assessment of expected credit losses is carried out on the basis of the individual debtor. For the assessment of expected credit losses from individual debtors all credit risk-relevant information is evaluated on an individual basis, resulting in a corresponding impairment loss being recognized. If the receivable is no longer expected to be collectible in its entirety, the receivables and impairment losses are derecognized.
Both prior experience with this portfolio and foreseeable future developments are taken into account in the collective assessment of expected credit losses for portfolios of risks of the same type. In the reporting period, GEA adjusted the collective assessment of expected credit losses. The adjustment is recognized prospectively within the meaning of IAS 8.36 and led to a EUR 9.0 million increase in impairment losses in the reporting period.
The assessment of the similar type of debtors, the interpretation of indicators on future development and estimates of the default amount for individual debtors require judgment and are subject to a series of assumptions regarding customer solvency.
The risk for the consolidated financial statements is that the impairment of trade receivables from third parties is recognized too late or not in the amount necessary. Furthermore, there is the risk that the adjustment to the collective assessment of expected credit losses is not appropriate and, thus, impairment losses are not reported in an accurate amount. There is also the risk that the disclosures on the adjusted procedure are not complete and appropriate.
206GEA Annual Report 2020
Independent Auditor‘s Report

OUR AUDIT APPROACHWe evaluated the process for monitoring past due trade receivables as well as the adequacy of implemented controls to ensure proper recognition of impairment losses. To this end, we verified for example that controls are in place enabling group entities to regularly identify and continuously monitor past due receivables.
We critically reviewed the impairment of a selection of past due trade receivables selected on the basis of risk and volume. For this purpose, we analyzed the development of past due receivables and impairment losses over the course of the year, compared them to historical experience with the debtors concerned, queried the responsible GEA staff regarding impairment and assessed internal as well as external documentation, such as correspondence between the Company and customers.
We evaluated the adjustments made to the collective assessment of expected credit losses in terms of factual and computational accuracy and for their consistency with IFRS 9. Moreover, we assessed whether the change in estimation was implemented properly and that the related disclosures in the notes are complete and appropriate in this regard.
OUR OBSERVATIONSThe assumptions and estimates to assess the impairment of trade receivables are appropriate overall. The adjusted procedure for the collective assessment of expected credit losses is appropriate and was properly implemented. The disclosures in the notes are complete and accurate in this regard.
Other InformationManagement and/or the Supervisory Board are/is responsible for the other information. The other information comprises: • the Group’s non-financial statement, • the corporate governance statement and • information extraneous to the combined group management report and marked as unaudited.
The other information also includes the remaining parts of the annual report.
The other information does not include the consolidated financial statements, the combined group management report information audited for content and our auditor’s report thereon.
Our opinions on the consolidated financial statements and on the combined group management report do not cover the other information, and consequently we do not express an opinion or any other form of assurance conclusion thereon.
In connection with our audit, our responsibility is to read the other information and, in so doing, to consider whether the other information • is materially inconsistent with the consolidated financial statements, with the group management
report information audited for content or our knowledge obtained in the audit, or • otherwise appears to be materially misstated.
In accordance with our engagement letter, we conducted a separate assurance engagement of the non-financial statement. Please refer to our assurance report dated March 2, 2021, for information on the nature, scope and findings of this assurance engagement.
207GEA Annual Report 2020
Independent Auditor‘s Report

Responsibilities of Management and the Supervisory Board for the Consolidated Financial Statements and the Combined Group Management ReportManagement is responsible for the preparation of consolidated financial statements that comply, in all material respects, with IFRSs as adopted by the EU and the additional requirements of German commercial law pursuant to Section 315e (1) HGB and that the consolidated financial statements, in compliance with these requirements, give a true and fair view of the Group’s assets, liabilities, financial position and financial performance. In addition, management is responsible for such internal control as they have determined necessary to enable the preparation of consolidated financial statements that are free from material misstatement, whether due to fraud or error.
In preparing the consolidated financial statements, management is responsible for assessing the Group’s ability to continue as a going concern. They also have the responsibility for disclosing, as applicable, matters related to going concern. In addition, they are responsible for financial reporting based on the going concern basis of accounting unless there is an intention to liquidate the Group or to cease operations, or there is no realistic alternative but to do so.
Furthermore, management is responsible for the preparation of the combined group management report that, as a whole, provides an appropriate view of the Group’s position and is, in all material respects, consistent with the consolidated financial statements, complies with German legal requirements, and appropriately presents the opportunities and risks of future development. In addition, management is responsible for such arrangements and measures (systems) as they have considered necessary to enable the preparation of a combined group management report that is in accordance with the applicable German legal requirements, and to be able to provide sufficient appropriate evidence for the assertions in the combined group management report.
The Supervisory Board is responsible for overseeing the Group’s financial reporting process for the preparation of the consolidated financial statements and of the combined group management report.
Auditor’s Responsibilities for the Audit of the Consolidated Financial Statements and of the Combined Group Management ReportOur objectives are to obtain reasonable assurance about whether the consolidated financial statements as a whole are free from material misstatement, whether due to fraud or error, and whether the combined group management report as a whole provides an appropriate view of the Group’s position and, in all material respects, is consistent with the consolidated financial statements and the knowledge obtained in the audit, complies with the German legal requirements and appropriately presents the opportunities and risks of future development, as well as to issue an auditor’s report that includes our opinions on the consolidated financial statements and on the combined group management report.
Reasonable assurance is a high level of assurance, but is not a guarantee that an audit conducted in accordance with Section 317 HGB and the EU Audit Regulation and in compliance with German Generally Accepted Standards for Financial Statement Audits promulgated by the Institut der Wirtschaftsprüfer (IDW) will always detect a material misstatement. Misstatements can arise from fraud or error and are considered material if, individually or in the aggregate, they could reasonably be expected to influence the economic decisions of users taken on the basis of these consolidated financial statements and this combined group management report.
We exercise professional judgment and maintain professional skepticism throughout the audit. We also: • Identify and assess the risks of material misstatement of the consolidated financial statements and of
the combined group management report, whether due to fraud or error, design and perform audit procedures responsive to those risks, and obtain audit evidence that is sufficient and appropriate to provide a basis for our opinions. The risk of not detecting a material misstatement resulting from fraud is higher than for one resulting from error, as fraud may involve collusion, forgery, intentional omissions, misrepresentations, or the override of internal controls.
• Obtain an understanding of internal control relevant to the audit of the consolidated financial statements and of arrangements and measures (systems) relevant to the audit of the combined group management report in order to design audit procedures that are appropriate in the circumstances, but not for the purpose of expressing an opinion on the effectiveness of these systems.
208GEA Annual Report 2020
Independent Auditor‘s Report

• Evaluate the appropriateness of accounting policies used by management and the reasonableness of estimates made by management and related disclosures.
• Conclude on the appropriateness of management’s use of the going concern basis of accounting and, based on the audit evidence obtained, whether a material uncertainty exists related to events or conditions that may cast significant doubt on the Group’s ability to continue as a going concern. If we conclude that a material uncertainty exists, we are required to draw attention in the auditor’s report to the related disclosures in the consolidated financial statements and in the combined group management report or, if such disclosures are inadequate, to modify our respective opinions. Our conclusions are based on the audit evidence obtained up to the date of our auditor’s report. However, future events or conditions may cause the Group to cease to be able to continue as a going concern.
• Evaluate the overall presentation, structure and content of the consolidated financial statements, including the disclosures, and whether the consolidated financial statements present the underlying transactions and events in a manner that the consolidated financial statements give a true and fair view of the assets, liabilities, financial position and financial performance of the Group in compliance with IFRSs as adopted by the EU and the additional requirements of German commercial law pursuant to Section 315e (1) HGB.
• Obtain sufficient appropriate audit evidence regarding the financial information of the entities or business activities within the Group to express opinions on the consolidated financial statements and on the combined group management report. We are responsible for the direction, supervision and performance of the group audit. We remain solely responsible for our opinions.
• Evaluate the consistency of the combined group management report with the consolidated financial statements, its conformity with [German] law, and the view of the Group’s position it provides.
• Perform audit procedures on the prospective information presented by management in the combined group management report. On the basis of sufficient appropriate audit evidence we evaluate, in particular, the significant assumptions used by management as a basis for the prospective information, and evaluate the proper derivation of the prospective information from these assumptions. We do not express a separate opinion on the prospective information and on the assumptions used as a basis. There is a substantial unavoidable risk that future events will differ materially from the prospective information.
We communicate with those charged with governance regarding, among other matters, the planned scope and timing of the audit and significant audit findings, including any significant deficiencies in internal control that we identify during our audit.
We also provide those charged with governance with a statement that we have complied with the relevant independence requirements, and communicate with them all relationships and other matters that may reasonably be thought to bear on our independence, and where applicable, the related safeguards.
From the matters communicated with those charged with governance, we determine those matters that were of most significance in the audit of the consolidated financial statements of the current period and are therefore the key audit matters. We describe these matters in our auditor’s report unless law or regulation precludes public disclosure about the matter.
Other Legal and Regulatory Requirements
Assurance Report in accordance with Section 317 (3b) HGB on the Electronic Reproduction of the Consolidated Financial Statements and the Combined Group Management Report Prepared for Publication PurposesWe have performed an assurance engagement in accordance with Section 317 (3b) HGB to obtain reasonable assurance about whether the electronic reproduction of the consolidated financial statements and the combined group management report (hereinafter the “ESEF documents”) contained in the file that can be downloaded by the issuer from the electronic client portal with access protection, „GEA_AG_KA+KLB_ESEF-2020-12-31.zip“ (SHA256-Hashvalue: c4a83c24445b17165dfab6b055d1efaa9649ce98c01 b259f210bf71d9672766e) and prepared for publication purposes complies in all material respects with the requirements of Section 328 (1) HGB for the electronic reporting format (“ESEF format”). In accordance with German legal requirements, this assurance engagement only extends to the conversion of the information contained in the consolidated financial statements and the combined group management report into the ESEF format and therefore relates neither to the information contained in this reproduction nor any other information contained in the above-mentioned electronic file.
209GEA Annual Report 2020
Independent Auditor‘s Report

In our opinion, the reproduction of the consolidated financial statements and the combined group management report contained in the above-mentioned electronic file and prepared for publication purposes complies in all material respects with the requirements of Section 328 (1) HGB for the electronic reporting format. We do not express any opinion on the information contained in this reproduction nor on any other information contained in the above-mentioned file beyond this reasonable assurance conclusion and our audit opinion on the accompanying consolidated financial statements and the accompanying combined group management report for the financial year from January 1, to December 31, 2020, contained in the “Report on the Audit of the Consolidated Financial Statements and of the Combined Group Management Report” above.
We conducted our assessment of the reproduction of the consolidated financial statements and the combined group management report contained in the above-mentioned electronic file in accordance with Section 317 (3b) HGB and the Exposure Draft of the IDW Assurance Standard: Assurance in accordance with Section 317 (3b) HGB on the Electronic Reproduction of Financial Statements and Management Reports Prepared for Publication Purposes (ED IDW AsS 410) and the International Standard on Assurance Engagements 3000 (Revised). Accordingly, our responsibilities are further described below. Our audit firm has applied the IDW Standard on Quality Management 1: Requirements for Quality Management in Audit Firms (IDW QS 1).
The Company’s management is responsible for the preparation of the ESEF documents including the electronic reproduction of the consolidated financial statements and the group management report in accordance with Section 328 (1) sentence 4 item 1 HGB and for the tagging of the consolidated financial statements in accordance with Section 328 (1) sentence 4 item 2 HGB.
In addition, the Company’s management is responsible for the internal controls they consider necessary to enable the preparation of ESEF documents that are free from material non-compliance with the requirements of Section 328 (1) HGB for the electronic reporting format, whether due to fraud or error.
The Company’s management is also responsible for the submission of the ESEF documents together with the auditor’s report and the attached audited consolidated financial statements and audited combined group management report as well as other documents to be published to the operator of the German Federal Gazette [Bundesanzeiger].
The Supervisory Board is responsible for overseeing the preparation of the ESEF documents as part of the financial reporting process.
Our objective is to obtain reasonable assurance about whether the ESEF documents are free from material non-compliance with the requirements of Section 328 (1) HGB, whether due to fraud or error. We exercise professional judgment and maintain professional skepticism throughout the assurance engagement. We also: • Identify and assess the risks of material non-compliance with the requirements of Section 328 (1)
HGB, whether due to fraud or error, design and perform assurance procedures responsive to those risks, and obtain assurance evidence that is sufficient and appropriate to provide a basis for our assurance conclusion.
• Obtain an understanding of internal control relevant to the assessment of the ESEF documents in order to design assurance procedures that are appropriate in the circumstances, but not for the purpose of expressing a conclusion on the effectiveness of these controls.
• Evaluate the technical validity of the ESEF documents, i.e. whether the file containing the ESEF documents meets the requirements of Commission Delegated Regulation (EU) 2019/815 on the technical specification for this electronic file.
• Evaluate whether the ESEF documents enable an XHTML reproduction with content equivalent to the audited consolidated financial statements and the audited combined group management report.
• Evaluate whether tagging the ESEF documents with Inline XBRL technology (iXBRL) provides an appropriate and complete machine-readable XBRL copy of the XHTML reproduction.
210GEA Annual Report 2020
Independent Auditor‘s Report

Further Information pursuant to Article 10 of the EU Audit RegulationWe were elected as group auditor at the Annual General Meeting on November 26, 2020. We were engaged by the Supervisory Board on November 30, 2020. We have been the group auditor of GEA Group Aktiengesellschaft, Düsseldorf, without interruption since financial year 2011.
We declare that the opinions expressed in this auditor’s report are consistent with the additional report to the Audit Committee pursuant to Article 11 of the EU Audit Regulation (long-form audit report).
German Public Auditor Responsible for the EngagementThe German Public Auditor responsible for the engagement is Michael Jessen. Düsseldorf, March 2, 2021
KPMG AGWirtschaftsprüfungsgesellschaft[Original German version signed by:]
[signature] Lurweg [signature] JessenWirtschaftsprüfer Wirtschaftsprüfer[German Public Auditor] [German Public Auditor]
211GEA Annual Report 2020
Independent Auditor‘s Report
Limited Assurance Report of the Independent Auditor regarding the Non-financial Group Statement1
To the Supervisory Board of GEA Group Aktiengesellschaft
We have performed a limited assurance engagement on the non-financial group statement of GEA Group Aktiengesellschaft (further “GEA” or the “Company”) according to Sections 315b and 315c of the German Commercial Code (HGB) in conjunction with Sections 289c to 289e HGB (further: “report”) for the period from January 1 to December 31, 2020.
Management’s Responsibility
The legal representatives of the Company are responsible for the preparation of the report in accordance with Sections 315b and 315c HGB in conjunction with Sections 289c to 289e HGB.
This responsibility of the legal representatives includes the selection and application of appropriate methods to prepare the report and the use of assumptions and estimates for individual disclosures which are reasonable under the given circumstances. Furthermore, the legal representatives are responsible for the internal controls they deem necessary for the preparation of the report that is free of – intended or unintended – material misstatements.
1) Our engagement applied to the German version of the non-financial group statement for the period from January 1 to December 31, 2020. This text is a translation of the limited assurance report of the independent auditor issued in German language, whereas the German text is authoritative.
Practitioner’s Responsibility
It is our responsibility to express a conclusion on the report based on our work performed within a limited assurance engagement.
We conducted our work in the form of a limited assurance engagement in accordance with the International Standard on Assurance En¬gagements (ISAE) 3000 (Revised): “Assurance Engagements other than Audits or Reviews of Historical Financial Information”, published by IAASB. Accordingly, we have to plan and perform the assurance engagement in such a way that we obtain limited assurance as to whether any matters have come to our attention that cause us to believe that the report of the Company for the period from January 1 to December 31, 2020 has not been prepared, in all material respects, in accordance with Sections 315b and 315c HGB in conjunction with Sections 289c to 289e HGB. We do not, however, issue a separate conclusion for each disclosure.
As the assurance procedures performed in a limited assurance engagement are less comprehensive than in a reasonable assurance engagement, the level of assurance obtained is substantially lower. The choice of assurance procedures is subject to the auditor’s own judgment.
212GEA Annual Report 2020
Limited Assurance Report of the Independent Auditor regarding the Non-financial Group Statement

Within the scope of our engagement we performed, amongst others, the following procedures: • Inquiries of group-level personnel who are responsible for the materiality analysis in order to understand
the processes for determining material topics and respective reporting boundaries for GEA • A risk analysis, including media research, to identify relevant information on GEA’s sustainability
performance in the reporting period • Evaluation of the design and the implementation of systems and processes for the collection,
processing and monitoring of disclosures, including data consolidation, on environmental, employee and social matters, respect for human rights, and anti-corruption and bribery matters
• Inquiries of group-level personnel who are responsible for determining disclosures on concepts, due diligence processes, results and risks, performing internal control functions and consolidating disclosures
• Inspection of selected internal and external documents • Analytical procedures for the evaluation of data and of the trends of quantitative disclosures as
reported at group level by all sites • Evaluation of local data collection, validation and reporting processes as well as the reliability of
reported data based on a sample of the sites in Bönen (Germany) and Sala Baganza (Italy) • Assessment of the overall presentation of the disclosures
In our opinion, we obtained sufficient and appropriate evidence for reaching a conclusion for the assurance engagement.
Independence and Quality Assurance on the Part of the Auditing Firm
In performing this engagement, we applied the legal provisions and professional pronouncements regarding independence and quality assurance, in particular the Professional Code for German Public Auditors and Chartered Accountants (in Germany) and the quality assurance standard of the German Institute of Public Auditors (Institut der Wirtschaftsprüfer, IDW) regarding quality assurance requirements in audit practice (IDW QS 1).
Conclusion
Based on the procedures performed and the evidence obtained, nothing has come to our attention that causes us to believe that the report of GEA Group Aktiengesellschaft, Düsseldorf, for the period from January 1 to December 31, 2020 has not been prepared, in all material respects, in accordance with Sections 315b and 315c HGB in conjunction with Sections 289c to 289e HGB.
Restriction of Use/General Engagement Terms
This limited assurance report is issued for purposes of the Supervisory Board of GEA Group Aktiengesellschaft, Düsseldorf, only. We assume no responsibility with regard to any third parties.
Our assignment for the Supervisory Board of GEA Group Aktiengesellschaft, Düsseldorf, and professional liability as descriped above was governed by the General Engagement Terms for Wirtschaftsprüfer and Wirtschaftsprüfungsgesellschaften (Allgemeine Auftragsbedingungen für Wirtschaftsprüfer und Wirt schafts- prüfungsgesellschaften) in the version dated January 1, 2017 (Appendix 2). By reading and using the information contained in this assurance report, each recipient confirms notice of the provisions contained therein including the limitation of our liability as stipulated in No. 9 and accepts the validity of the General Engagement Terms with respect to us.
Munich, March 2, 2021
KPMG AGWirtschaftsprüfungsgesellschaft [Original German version signed by:]
Hell ppa. Ehrenberger
213GEA Annual Report 2020
Limited Assurance Report of the Independent Auditor regarding the Non-financial Group Statement

Responsibility Statement
To the best of our knowledge, and in accordance with the applicable reporting principles, the consolidated financial statements give a true and fair view of the assets, liabilities, financial position, and profit or loss of the group, and the management report of the group, which has been combined with the management report of the company, includes a fair review of the development and performance of the business and the position of the group, together with a description of the principal opportunities and risks associated with the expected development of the group.
Düsseldorf, March 2, 2021
Stefan Klebert Johannes Giloth Marcus A. Ketter
214GEA Annual Report 2020
Responsibility Statement

Corporate Bodies and their Mandates
Executive Board
Stefan Klebert, Düsseldorf/Germany, CEO – Chairman of the Executive Board a) • GEA Farm Technologies GmbH, Bönen/Germany, Chairman of the Supervisory Board (since January 30, 2020) • GEA Westfalia Separator Group GmbH, Oelde/Germany, Chairman of the Supervisory Board (since February 27, 2020)b) • Hoberg & Driesch GmbH, Düsseldorf/Germany, Member of the Shareholders’ Committee • Hoberg & Driesch GmbH & Co. KG Röhrengroßhandel/Hoberg/Germany and Driesch Beteiligungs GmbH, Düsseldorf/Germany, Member of the Advisory Boards • Chiron Group SE, Tuttlingen/Germany, Member of the Board of Directors • Chiron-Werke GmbH & Co. KG (until November 27, 2020)/Chiron-Werke
Beteiligungsgesellschaft mbH (until December 11, 2020), Tuttlingen/Germany, Member of the Advisory Boards
Steffen Bersch, Munster/Germany, Member of the Executive Board (until February 29, 2020)a) • Thyssen’sche Handelsgesellschaft m.b.H., Mülheim/Germany, Member of the Supervisory Board
Johannes Giloth, Neubiberg/Germany, Member of the Executive Board and COO (since January 20, 2020)
Marcus A. Ketter, Düsseldorf/Germany, CFO – Chief Financial Officer
Supervisory Board
Dr. Helmut Perlet, Munich/Germany, Chairman of the Supervisory Board of GEA Group Aktiengesellschaft
Kurt-Jürgen Löw, Ebernhahn/Germany, Chairman of the Supervisory Board, Chairman of the Works Council of GEA Group Aktiengesellschaft (until November 9, 2020)a) • GEA Westfalia Separator Group GmbH, Oelde/Germany, Deputy Chairman of
the Supervisory Board
Ahmad M. A. Bastaki, Safat/Kuwait, Executive Director, Planning and Senior Management of Kuwait Investment Authority
Hartmut Eberlein, Gehrden/Germany, Chairman of the Audit Committee of GEA Group Aktiengesellschaft (until September 30, 2020)
Prof. Dr. Annette G. Köhler, Düsseldorf/Germany (since October 1, 2020) Chairwoman of the Audit Committee of GEA Group Aktiengesellschaft University Professor and Holder of the Chair of Accounting, Auditing and Controlling at the University of Duisburg-Essen a) • DMG Mori AG, Bielefeld/Germany, member of the Supervisory Board and Chairwoman
of the Finance and Audit Committee • HVB UniCredit Bank AG, Munich/Germany, Member of the Supervisory Board,
the Audit Committee and the Nomination Committeeb) • DKSH Holding AG, Zurich/Switzerland, Member of the Board of Directors and Chairwoman
of the Audit Committee
a) Membership of statutory German supervisory boardsb) Membership of comparable German or foreign supervisory bodies of business entities
215GEA Annual Report 2020
Corporate Bodies and their Mandates
Rainer Gröbel, Sulzbach/Ts., Managing Director of ACADEMY of LABOUR gGmbH, Frankfurt am Main/Germanya) • Schunk GmbH, Heuchelheim/Germany, Chairman of the Supervisory Board
Colin Hall, London/UK, Head of Investments of Groupe Bruxelles Lambert, Belgium, and Vice-Chairman of the Board of Directors of Sienna Capital S.a.r.l.b) • Imerys S.A., France, Member of the Board of Directors • Ergon Capital Partners S.A., Belgium, Member of the Board of Directors
• Ergon Capital Partners II SA., Belgium, Member of the Board of Directors • LafargeHolcim, Switzerland, Member of the Board of Directors • Marnix French ParentCo (Webhelp group), Member of the Supervisory Board • Avanti Acquisition Corp., Cayman Islands, Member of the Board of Directors
(since July 24, 2020) • Globality Inc., California/USA, Member of the Board of Directors (since January 7, 2021)
Michaela Hubert, Prichsenstadt/Germany, Chairman of the General Works Council of GEA Brewery Systems GmbH
Michael Kämpfert, Düsseldorf/Germany, Vice President Business HR of GEA Group Aktiengesellschaft
Eva-Maria Kerkemeier, Herne/Germany, Member of the Supervisory Board of GEA Group AG
Brigitte Krönchen, Oelde/Germany, Deputy Chairwoman of the Group Works Council of GEA Group Aktiengesellschafta) • GEA Farm Technologies GmbH, Bönen/Germany, Deputy Chairwoman of the Supervisory Board
Jean E. Spence, Marco Island/FL/USA, Management Consultant, President, JES Consulting LLCb) • TreeHouse Foods, Inc., Oak Brook/IL/USA, Member of the Board of Directors • Agri-Food Tech Fund of Praesidium Private Investments, Praesidium SGR S.p.A, Milan, Italy, Member of the Advisory Board (since February 1, 2021)
Dr. Molly P. Zhang, Aurora/CO/USA b) • Cooper Standard Holdings Inc., Novi/MI/USA, Member of the Board of Directors
(until May, 21 2020) • XG Sciences, Inc., Lansing/MI/USA, Member of the Board of Directors (until December 31, 2020) • Enerkem, Montreal/Canada, Member of the Board of Directors and Adviser • Gates Industrial Corporation Plc, Denver, Colorado, USA, Member of the Board of Directors
(since July 1, 2020)
a) Membership of statutory German supervisory boardsb) Membership of comparable German or foreign supervisory bodies of business entities
216GEA Annual Report 2020
Corporate Bodies and their Mandates

Supervisory Board Committees of GEA Group Aktiengesellschaft(As of December 31, 2019)
Mediation Committee in accordance with section 27(3) of the Mitbestimmungsgesetz (MitbestG – German Co-determination Act)Dr. Helmut Perlet, ChairmanDr. Molly P. Zhang Eva-Maria KerkemeierKurt-Jürgen Löw
Presiding CommitteeDr. Helmut Perlet, ChairmanAhmad M. A. BastakiRainer GröbelColin Hall Michaela HubertKurt-Jürgen Löw
Audit CommitteeProf. Dr. Annette G. Köhler, Chairwoman (financial expert within the meaning of section 100(5) of the Aktiengesetz (AktG – German Stock Corporation Act))Michael KämpfertBrigitte KrönchenDr. Helmut Perlet
Technology Committee Dr. Molly P Zhang, ChairwomanMichaela Hubert Brigitte KrönchenJean E. Spence
Nomination CommitteeDr. Helmut Perlet, ChairmanAhmad M. A. BastakiJean E. Spence
217GEA Annual Report 2020
Corporate Bodies and their Mandates
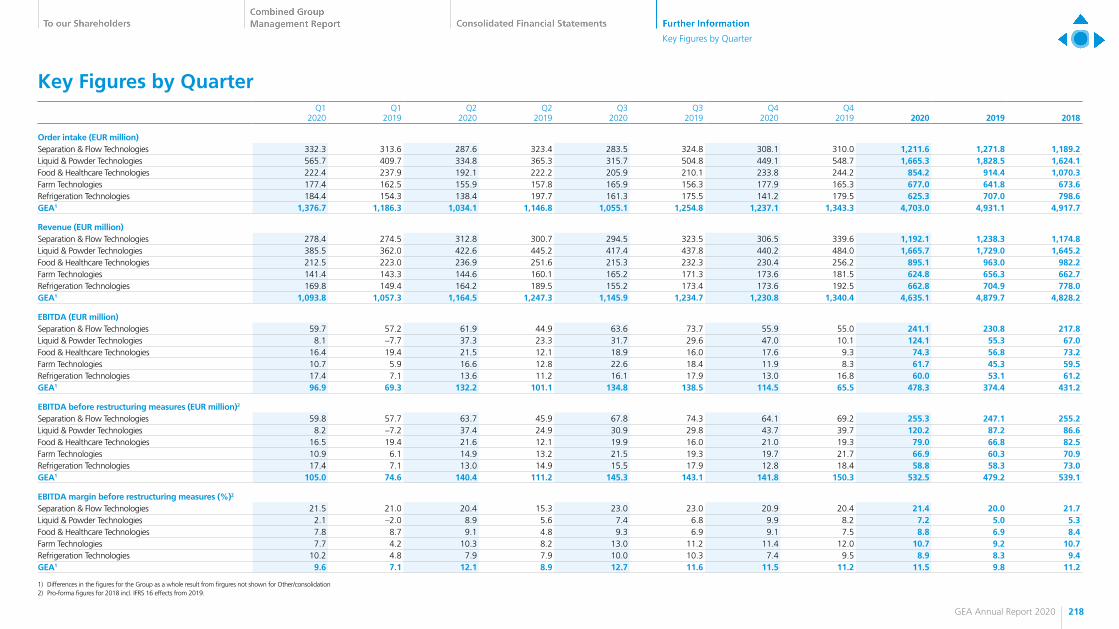
Key Figures by QuarterQ1
2020Q1
2019Q2
2020Q2
2019Q3
2020Q3
2019Q4
2020Q4
2019 2020 2019 2018
Order intake (EUR million)Separation & Flow Technologies 332.3 313.6 287.6 323.4 283.5 324.8 308.1 310.0 1,211.6 1,271.8 1,189.2Liquid & Powder Technologies 565.7 409.7 334.8 365.3 315.7 504.8 449.1 548.7 1,665.3 1,828.5 1,624.1Food & Healthcare Technologies 222.4 237.9 192.1 222.2 205.9 210.1 233.8 244.2 854.2 914.4 1,070.3Farm Technologies 177.4 162.5 155.9 157.8 165.9 156.3 177.9 165.3 677.0 641.8 673.6Refrigeration Technologies 184.4 154.3 138.4 197.7 161.3 175.5 141.2 179.5 625.3 707.0 798.6GEA1 1,376.7 1,186.3 1,034.1 1,146.8 1,055.1 1,254.8 1,237.1 1,343.3 4,703.0 4,931.1 4,917.7
Revenue (EUR million)Separation & Flow Technologies 278.4 274.5 312.8 300.7 294.5 323.5 306.5 339.6 1,192.1 1,238.3 1,174.8Liquid & Powder Technologies 385.5 362.0 422.6 445.2 417.4 437.8 440.2 484.0 1,665.7 1,729.0 1,645.2Food & Healthcare Technologies 212.5 223.0 236.9 251.6 215.3 232.3 230.4 256.2 895.1 963.0 982.2Farm Technologies 141.4 143.3 144.6 160.1 165.2 171.3 173.6 181.5 624.8 656.3 662.7Refrigeration Technologies 169.8 149.4 164.2 189.5 155.2 173.4 173.6 192.5 662.8 704.9 778.0GEA1 1,093.8 1,057.3 1,164.5 1,247.3 1,145.9 1,234.7 1,230.8 1,340.4 4,635.1 4,879.7 4,828.2
EBITDA (EUR million)Separation & Flow Technologies 59.7 57.2 61.9 44.9 63.6 73.7 55.9 55.0 241.1 230.8 217.8Liquid & Powder Technologies 8.1 –7.7 37.3 23.3 31.7 29.6 47.0 10.1 124.1 55.3 67.0Food & Healthcare Technologies 16.4 19.4 21.5 12.1 18.9 16.0 17.6 9.3 74.3 56.8 73.2Farm Technologies 10.7 5.9 16.6 12.8 22.6 18.4 11.9 8.3 61.7 45.3 59.5Refrigeration Technologies 17.4 7.1 13.6 11.2 16.1 17.9 13.0 16.8 60.0 53.1 61.2GEA1 96.9 69.3 132.2 101.1 134.8 138.5 114.5 65.5 478.3 374.4 431.2
EBITDA before restructuring measures (EUR million)2
Separation & Flow Technologies 59.8 57.7 63.7 45.9 67.8 74.3 64.1 69.2 255.3 247.1 255.2Liquid & Powder Technologies 8.2 –7.2 37.4 24.9 30.9 29.8 43.7 39.7 120.2 87.2 86.6Food & Healthcare Technologies 16.5 19.4 21.6 12.1 19.9 16.0 21.0 19.3 79.0 66.8 82.5Farm Technologies 10.9 6.1 14.9 13.2 21.5 19.3 19.7 21.7 66.9 60.3 70.9Refrigeration Technologies 17.4 7.1 13.0 14.9 15.5 17.9 12.8 18.4 58.8 58.3 73.0GEA1 105.0 74.6 140.4 111.2 145.3 143.1 141.8 150.3 532.5 479.2 539.1
EBITDA margin before restructuring measures (%)2
Separation & Flow Technologies 21.5 21.0 20.4 15.3 23.0 23.0 20.9 20.4 21.4 20.0 21.7Liquid & Powder Technologies 2.1 –2.0 8.9 5.6 7.4 6.8 9.9 8.2 7.2 5.0 5.3Food & Healthcare Technologies 7.8 8.7 9.1 4.8 9.3 6.9 9.1 7.5 8.8 6.9 8.4Farm Technologies 7.7 4.2 10.3 8.2 13.0 11.2 11.4 12.0 10.7 9.2 10.7Refrigeration Technologies 10.2 4.8 7.9 7.9 10.0 10.3 7.4 9.5 8.9 8.3 9.4GEA1 9.6 7.1 12.1 8.9 12.7 11.6 11.5 11.2 11.5 9.8 11.2
1) Differences in the figures for the Group as a whole result from firgures not shown for Other/consolidation2) Pro-forma figures for 2018 incl. IFRS 16 effects from 2019.
218GEA Annual Report 2020
Key Figures by Quarter
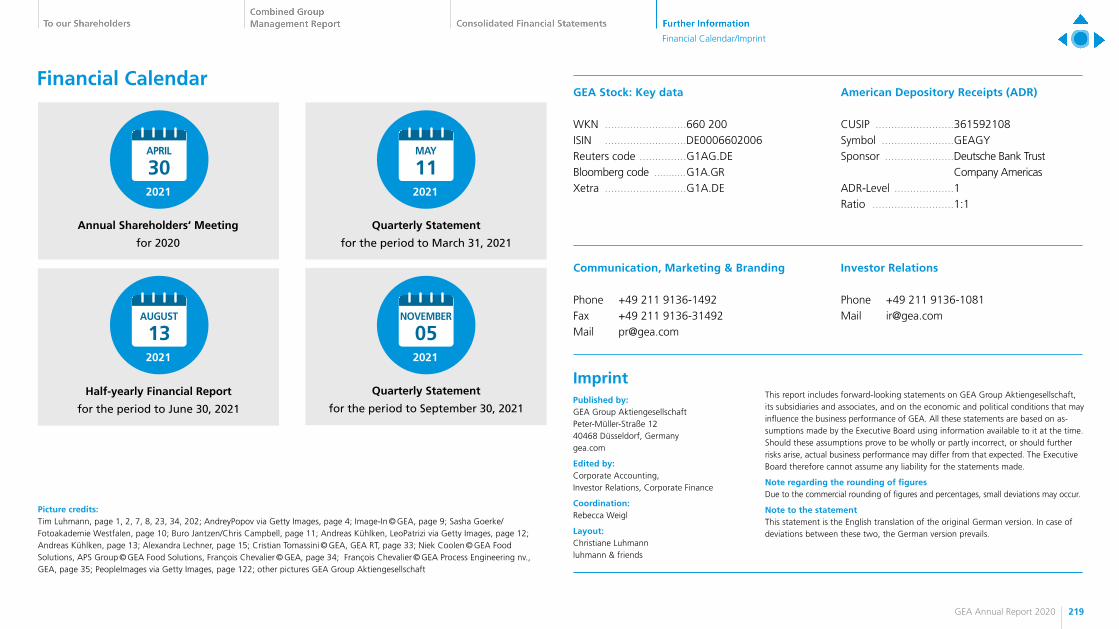
Financial CalendarAmerican Depository Receipts (ADR)
CUSIP .........................361592108Symbol .......................GEAGYSponsor ......................Deutsche Bank Trust
Company AmericasADR-Level ...................1Ratio ..........................1:1
Investor Relations
Phone +49 211 9136-1081Mail [email protected]
GEA Stock: Key data
WKN ..........................660 200ISIN ..........................DE0006602006Reuters code ...............G1AG.DEBloomberg code ...........G1A.GRXetra ..........................G1A.DE
Communication, Marketing & Branding
Phone +49 211 9136-1492Fax +49 211 9136-31492Mail [email protected]
ImprintPublished by:GEA Group AktiengesellschaftPeter-Müller-Straße 1240468 Düsseldorf, Germanygea.com
Edited by:Corporate Accounting, Investor Relations, Corporate Finance
Coordination:Rebecca Weigl
Layout:Christiane Luhmannluhmann & friends
This report includes forward-looking statements on GEA Group Aktien gesellschaft, its subsidiaries and associates, and on the economic and political conditions that may influence the business performance of GEA. All these statements are based on as-sumptions made by the Executive Board using information available to it at the time. Should these assumptions prove to be wholly or partly incorrect, or should further risks arise, actual business performance may differ from that expected. The Executive Board therefore cannot assume any liability for the statements made.
Note regarding the rounding of figuresDue to the commercial rounding of figures and percentages, small deviations may occur.
Note to the statementThis statement is the English translation of the original German version. In case of deviations between these two, the German version prevails.
Quarterly Statement
for the period to March 31, 2021
Quarterly Statement
for the period to September 30, 2021
Annual Shareholders‘ Meeting
for 2020
Half-yearly Financial Report
for the period to June 30, 2021
2021
APRIL
30
2021
AUGUST
132021
NOVEMBER
05
2021
MAY
11
Picture credits:Tim Luhmann, page 1, 2, 7, 8, 23, 34, 202; AndreyPopov via Getty Images, page 4; Image-In © GEA, page 9; Sasha Goerke/ Fotoakademie Westfalen, page 10; Buro Jantzen/Chris Campbell, page 11; Andreas Kühlken, LeoPatrizi via Getty Images, page 12; Andreas Kühlken, page 13; Alexandra Lechner, page 15; Cristian Tomassini © GEA, GEA RT, page 33; Niek Coolen © GEA Food Solutions, APS Group © GEA Food Solutions, François Chevalier © GEA, page 34; François Chevalier © GEA Process Engineering nv., GEA, page 35; PeopleImages via Getty Images, page 122; other pictures GEA Group Aktiengesellschaft
219GEA Annual Report 2020
Financial Calendar/Imprint

„Engineering for a better world“ is the driving and energizing principle connecting GEA’s workforce. As one of the largest systems suppliers, GEA makes an important contribution to a sustainable future with its solutions and services, particularly in the food, beverage and pharmaceutical sectors. Across the globe, GEA’s plants, processes and components contribute significantly to the reduction of CO2 emissions, plastic use as well as food waste in production.
GEA is listed on the German MDAX and the STOXX® Europe 600 Index and also included in the DAX 50 ESG and MSCI Global Sustainability indexes.
We live our values.Excellence • Passion • Integrity • Responsibility • GEA-versity
GEA Group AktiengesellschaftPeter-Müller-Straße 1240468 Düsseldorf, GermanyTel.: +49 211 9136-0
GEA
/GB/
EN/0
040
gea.com