Annual Report 2019 - Universal Robina Corporation
222
Annual Report 2019 Firm Foundation, Empowering Vision Download Report
-
Upload
khangminh22 -
Category
Documents
-
view
3 -
download
0
Transcript of Annual Report 2019 - Universal Robina Corporation

Annual Report 2019
Firm Foundation, Empowering Vision
Download Report
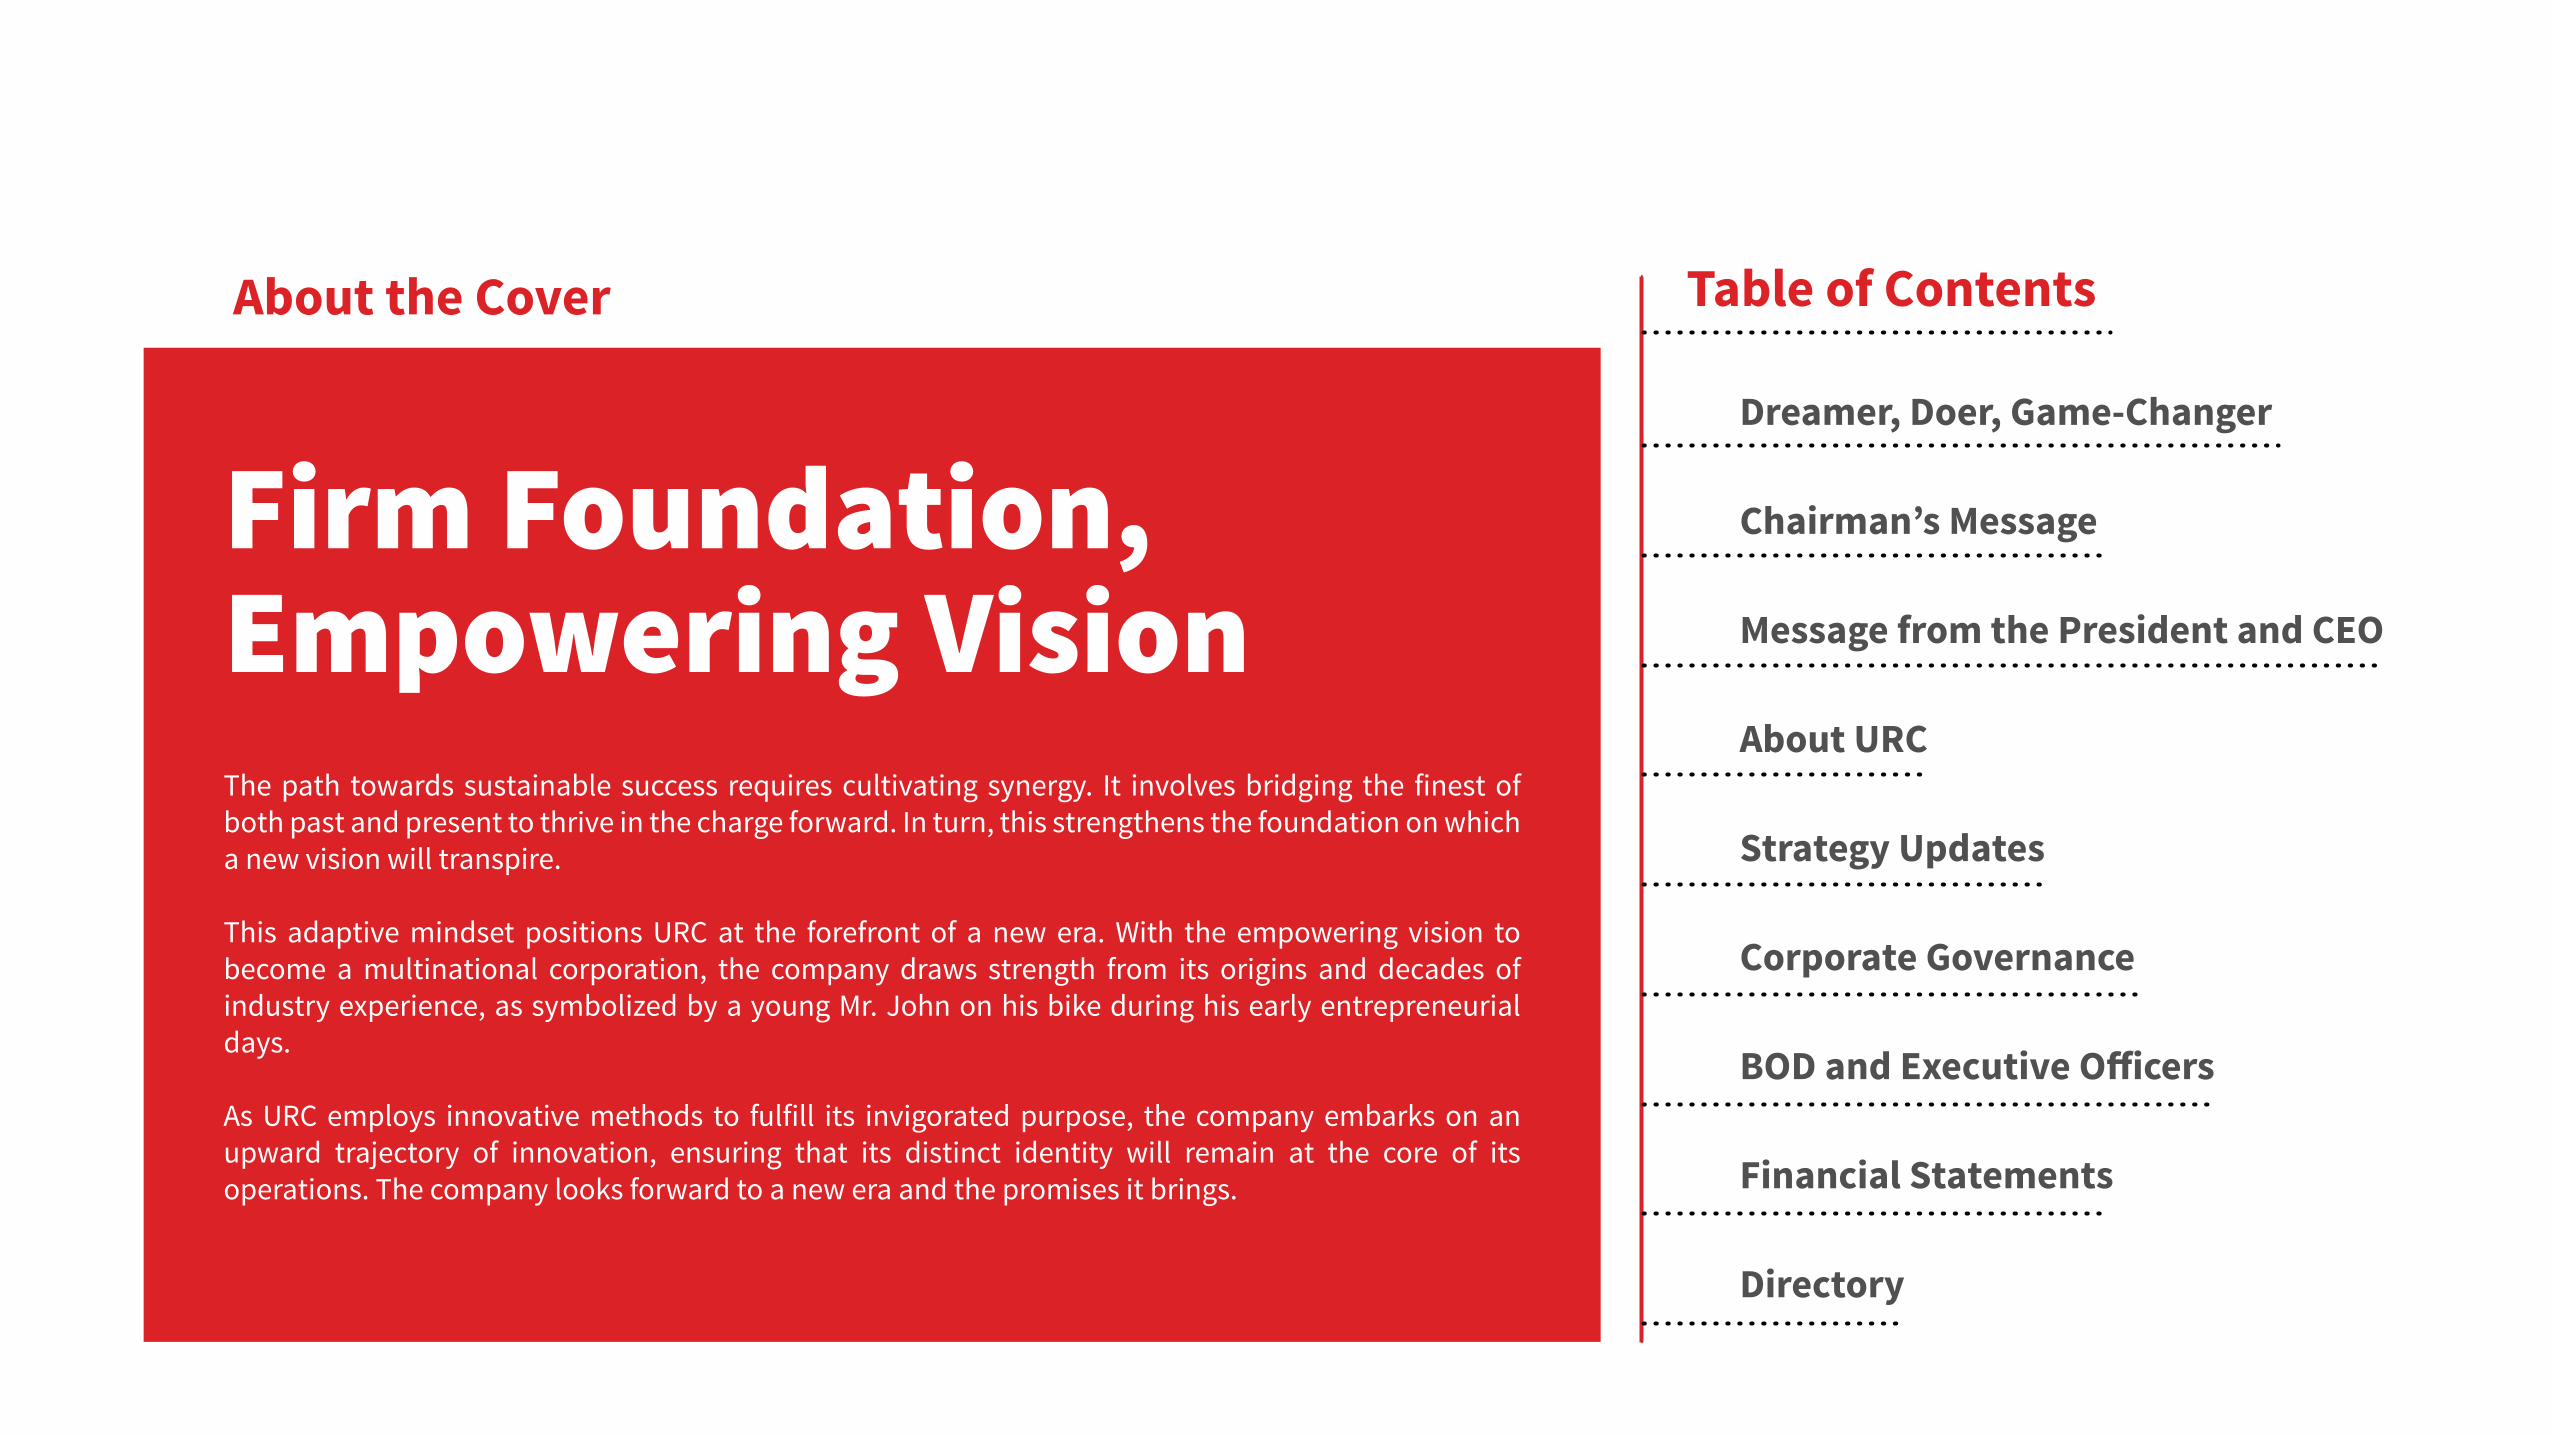
About the Cover
Firm Foundation, Empowering VisionThe path towards sustainable success requires cultivating synergy. It involves bridging the finest of both past and present to thrive in the charge forward. In turn, this strengthens the foundation on which a new vision will transpire.
This adaptive mindset positions URC at the forefront of a new era. With the empowering vision to become a multinational corporation, the company draws strength from its origins and decades of industry experience, as symbolized by a young Mr. John on his bike during his early entrepreneurial days.
As URC employs innovative methods to fulfill its invigorated purpose, the company embarks on an upward trajectory of innovation, ensuring that its distinct identity will remain at the core of its operations. The company looks forward to a new era and the promises it brings.
Dreamer, Doer, Game-Changer
Chairman’s Message
Message from the President and CEO
About URC
Strategy Updates
Corporate Governance
BOD and Executive O�icers
Financial Statements
Directory
Table of Contents

“Why buy and sell other people’s products when
we can produce our own?”JOHN L. GOKONGWEI, JR. (1926 – 2019) Dreamer, Doer,
Game-Changer
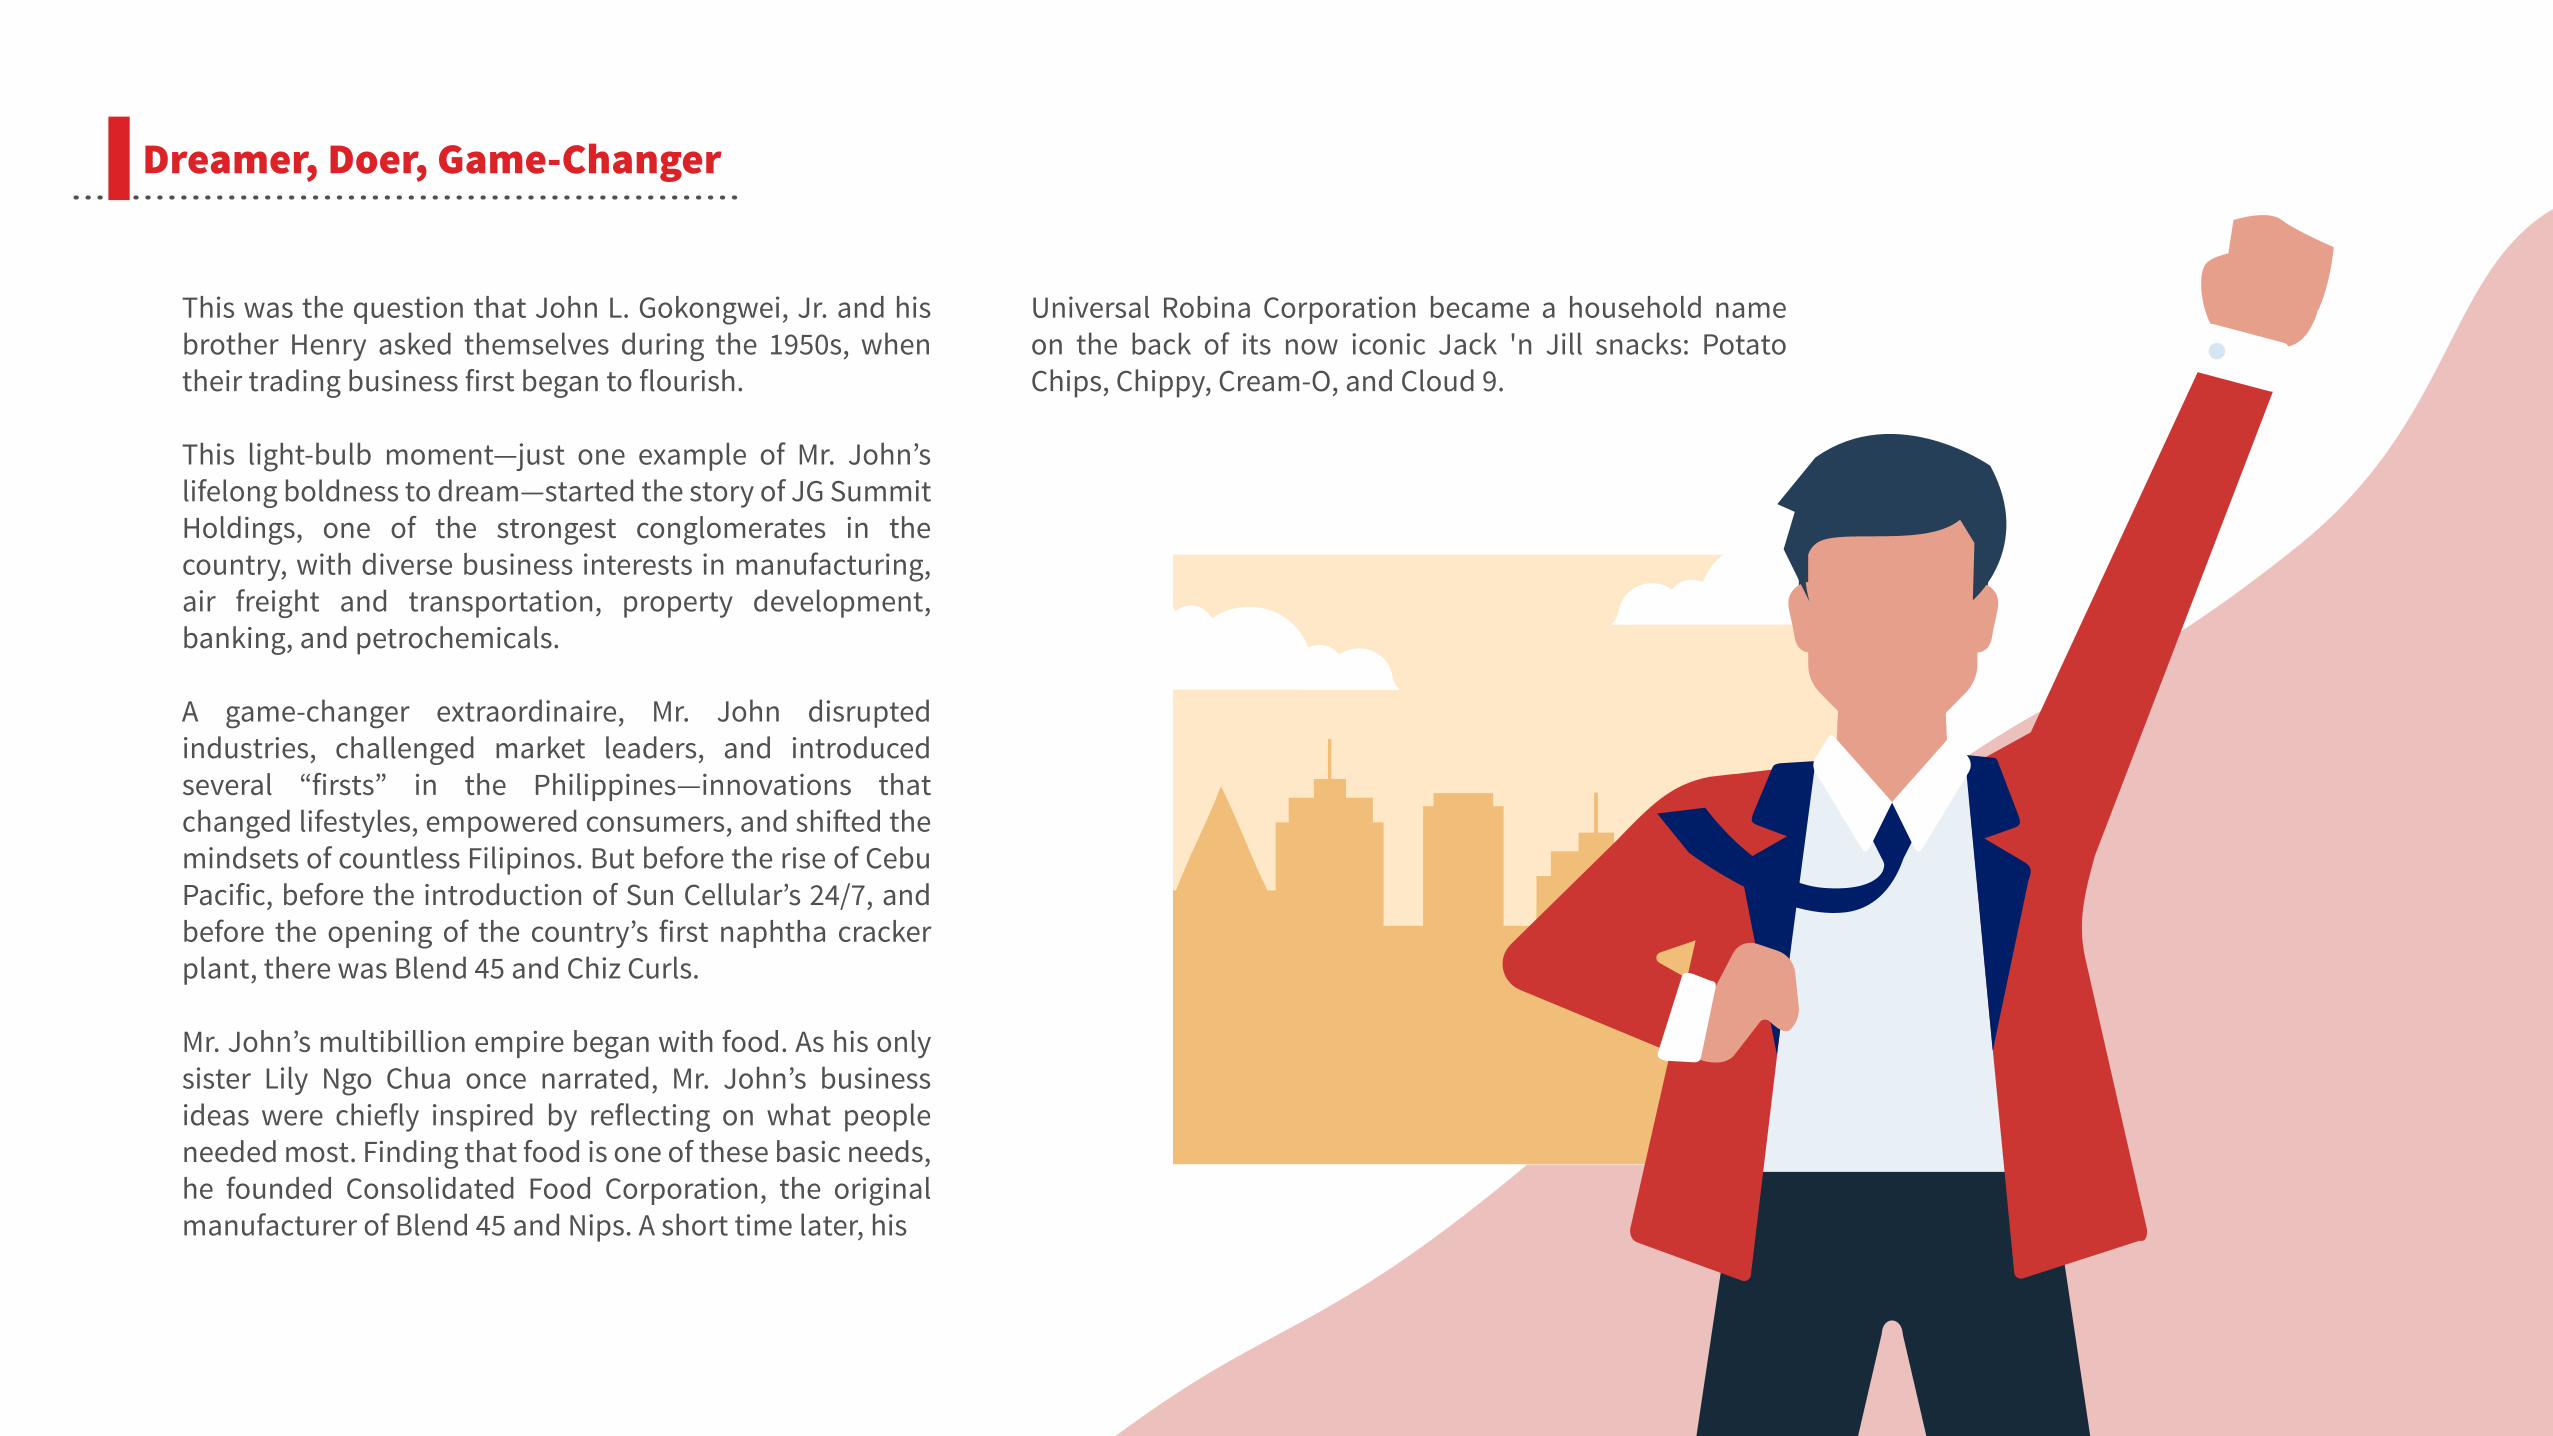
This was the question that John L. Gokongwei, Jr. and his brother Henry asked themselves during the 1950s, when their trading business first began to flourish.
This light-bulb moment—just one example of Mr. John’s lifelong boldness to dream—started the story of JG Summit Holdings, one of the strongest conglomerates in the country, with diverse business interests in manufacturing, air freight and transportation, property development, banking, and petrochemicals.
A game-changer extraordinaire, Mr. John disrupted industries, challenged market leaders, and introduced several “firsts” in the Philippines—innovations that changed lifestyles, empowered consumers, and shi�ed the mindsets of countless Filipinos. But before the rise of Cebu Pacific, before the introduction of Sun Cellular’s 24/7, and before the opening of the country’s first naphtha cracker plant, there was Blend 45 and Chiz Curls.
Mr. John’s multibillion empire began with food. As his only sister Lily Ngo Chua once narrated, Mr. John’s business ideas were chiefly inspired by reflecting on what people needed most. Finding that food is one of these basic needs, he founded Consolidated Food Corporation, the original manufacturer of Blend 45 and Nips. A short time later, his
Universal Robina Corporation became a household name on the back of its now iconic Jack 'n Jill snacks: Potato Chips, Chippy, Cream-O, and Cloud 9.
Dreamer, Doer, Game-Changer

When Times Got Tough,He Got Tougher
Hard work, discipline, integrity, planning for the long term, building a business that will be around for many generations—these are values that Mr. John espoused and taught by example.
Although he was born to a wealthy family that owned a chain of movie theaters in Cebu, Mr. John’s life of privilege vanished in an instant when his 34-year-old father suddenly died of typhoid fever. John Jr. was only 13 years old at the time.
As World War II broke out, Mr. John’s first business venture at age 15 was to peddle wares via bicycle at Cebu’s Tabuan market. For 10 hours, starting at 4 in the
“Tragedies and losses should not leave one scarred. Instead they should be seen as situations where one can discover the best in himself.” – John L. Gokongwei, Jr.
morning, he sold soap, thread, and candles on a small wooden table and made 20 to 40 pesos a day. In 1943, at age 17, Mr. John began trading goods between Cebu and Manila via Lucena. Despite the grueling trip over water on a batel (small boat), then by land on a truck, he kept pushing on. Sensing another opportunity as World War II ended, Mr. John opened Amasia Trading, which imported onions, flour, used clothing, old newspapers, and
magazines from the United States. With his now legendary business acumen, Mr. John was soon able to expand to Manila and Davao—a remarkable feat considering he was still only 21. But while the trading business was good, he wasn’t one to rest on his laurels. Ever the entrepreneur, he was always on the lookout for the next big thing, a trait that he’d carry for the rest of his life.
Dreamer, Doer, Game-Changer
Fighting the Big Boys
“If I can compete with people so much older than me, if I can support my whole family at 15, I can do anything!”– John L. Gokongwei, Jr.
At 31, he ventured into cornstarch manufacturing. To Mr. John, cornstarch was the ideal product for an emerging economy because of its many uses in manufacturing. With a 500,000-peso clean loan granted by Albino Sycip, then chairman and president of China Bank, Mr. John and his siblings put up Universal Corn Products (UCP). For its first important product, the company introduced Panda Corn Syrup in 1956, which was endorsed by culinary expert Nora Daza.
In doing this, Mr. John went against Ludo and Luym, then the biggest cornstarch manufacturer and richest group in Cebu. The launch of Panda led to a price war, with Ludo and Luym dropping their prices with the intent of putting Panda out of business. A�er the smoke cleared, UCP emerged stronger than ever. In 1961, Mr. John saw another opportunity. He figured that while cornstarch was doing very well, it was still a
commodity which big companies could access elsewhere. To stay ahead of the game, he realized that he had to produce and market his own branded consumer products the way multinationals did. In fact, Mr. John wanted to be the first local multinational corporation. Thus with his brothers, Mr. John put up Consolidated Food Corporation (CFC), zeroing in on co�ee as their first branded product. Of course, not everything he touched turned to gold. From time to time, Mr. John endured the bitter taste of failure too. In the 1970s, his attempt to gain a board seat on another big conglomerate was controversially rejected. Among his companies, CFC’s once-popular Presto Ice Cream eventually folded and so did the formerly booming Litton Mills textile business. Nevertheless, his boldness to dream was matched by his ability to rise up from failure. He always said, “To be successful, you have to be willing to try out many ideas. Some of them will succeed, some won’t. Do five or ten things and one of them will work.”
Dreamer, Doer, Game-Changer
Riskier Games
As the 1960s rolled around, Mr. John felt it was time to take part in the riskier games of the multinational corporations. Mr. John hired a formidable team of locals and expatriates to help him and his siblings work towards their goal—to make CFC as good as any multinational company.
In 1963, he launched Blend 45, serving as its first brand manager. Marketed as the “poor man’s co�ee,” Blend 45 became the largest-selling co�ee brand in the market at the time, beating Nescafe and Café Puro. Susan Roces and Boots Anson-Roa, then among the most popular celebrities of the day, were the faces of the brand.
“In that decade, not many business opportunities were available due to the political and economic environment. Many Filipinos were already sending their money out of the country. As a Filipino I felt that our money must be invested here.” – John L. Gokongwei, Jr.
A�er the success of Blend 45, Mr. John and his siblings diversified into other food products including candy and wafers. CFC’s portfolio included brands that would eventually become household names, thanks to Mr. John’s vision and marketing savvy. In 1975, CFC co-founded the Philippine Basketball Association, Asia’s first play-for-pay league. Playing under brands like Presto, Great Taste and Tivoli, the CFC franchise won six championships in 17 years.
Mr. John’s other beloved food company, Universal Robina Corporation (URC) was o�icially born in 1966 and pioneered the snack-food industry with favorites that have stood the test of time. To this day,Chiz Curls, Nips, Nova, Jack ‘n Jill Pretzels, Presto and many more are staples in Pinoys’ hearts and households.
In the 1970s, URC expanded into the hogs business through Robina Farms. A decade later, in the 1980s, it forayed into sugar milling through URSUMCO and SONEDCO.
During this era, Mr. John also set up a small factory in Hong Kong to produce Jack ‘n Jill Potato Chips, one of the first steps towards his grand multinational dreams. Today URC is considered the first Philippine multinational with direct operations in 13 countries, while its products are exported to 50 countries around the globe. Its overseas business generates US $814 Million in annual sales.
Dreamer, Doer, Game-Changer
Big John’s Greatest Hits
A�er greatly influencing the Pinoy’s snacking habits, Mr. John continued to blaze the trail in the new millennium—this time, in the ready-to-drink (RTD) beverage segment.
Mr. John was traveling through Asia when he came upon a very interesting product in China: brewed tea, in ready-to-drink bottles. He visited supermarkets, convenience stores, and factories throughout the country and everywhere he went, he saw the ever-present tea. Though this was widely available throughout China and Japan, he had never seen this product in the Philippines. Intrigued, he gave the URC management team its marching orders in May of 2004—URC would get 2 PET
“If we want to be philosophical, we can say that with a world-class brand, we create pride for our nation. If we want to be practical, we can say that with brands that succeed in the world, we create more jobs for more people, right here.”– John L. Gokongwei, Jr.
production lines to launch a green tea product within six months.
At that time, URC was already a leader in snack foods but its only background in beverage was instant co�ee. Moreover, it would be entering the playground of the huge multinationals. Mr. John decided to play anyway.
Initially, the situation looked grim. But again, relying on the same business acumen and foresight he has always relied on, Mr. John sensed an opportunity. The winds were changing, and throughout his travels he noticed that wellness was becoming a worldwide trend. He believed that even in the Philippines, people would start focusing on improving their health. When C2 was launched in October 2004, URC sold 100,000 bottles in the first month. Three years later, consumers were buying 30 million bottles monthly. C2 became the runaway market leader, single-handedly driving the growth of the RTD Tea market.
Thanks to Mr. John’s constant innovation, entrepreneurial zeal, and strong desire to please the customer, URC rose to become one of the largest branded consumer food and beverage companies in the Philippines, with a significant and growing presence in the ASEAN and Oceania markets. Now the cornerstone of the Gokongwei Group of Companies, URC now has a market capitalization of Php 319.6 billion or US $6.3 billion and has built many strong brands over the years—Piattos, Great Taste, Magic Crackers—all of which are likewise gaining popularity in the ASEAN region.
Dreamer, Doer, Game-Changer
Dream Big
John L. Gokongwei, Jr. was a trailblazer who changed the rules of the game in most of the industries he entered. He was a visionary businessman who built a multi-billion, proudly Filipino conglomerate and gave jobs to almost 80,000 people. He was a risk-taker, always backed by the courage of his convictions and always doing what people said could not be done. He was a philanthropist who donated half his shares in JG Summit Holdings, Inc. to help educate tomorrow’s leaders. Most of all, he was a dreamer, who was passionate about making life better for Filipinos.
Mr. John’s extraordinary life’s lessons, powerful legacy, and pioneering spirit will continue to resonate strongly in URC and guide it as it hurdles the challenges of the future and continues to soar beyond the great heights that its founder envisioned.
“A�er the war, in 1946 I saw the big companies like Ayala and San Miguel were already very, very big. I said, ‘how do I reach that height?’ So I tried. And then . . . I think we’ve hit that height.” – John L. Gokongwei, Jr.
Throughout his life, Mr. John was driven by his desire to improve the lives of the Filipino people. Apart from his philanthropy, which began in earnest at the age of 31 when he donated to his alma mater, he achieved this by giving Filipino consumers alternatives to the status quo. He provided more choices, greater availability from north to south, and, more o�en than not, at competitive prices.
His boldness to dream and innovate will permeate every aspect of URC’s business in the years ahead, as it seeks to fulfill the needs and wants of the modern-day consumer here and abroad. Through e�ective stewardship, the company will continue producing brands that millions of Filipinos have grown to love while creating exciting new ones. URC will create products of the highest quality that will set the trend, resonate with the public, and lead URC’s further expansion into new territories. As URC moves forward, Mr. John’s integrity—his conviction to do the right thing, even when no one is looking—will be a shining beacon for every employee. In this age when sustainability and corporate social responsibility have become all-important buzzwords, when the embrace of a people and planet friendly culture are part and parcel of a company’s measurable success, Mr. John’s values, purpose, and long-term ambition will continue to light the way.
Thank you, Mr. John.
Dreamer, Doer, Game-Changer

Chairman’sMessage
Annual Report 2019
Chairman’s Message
2019 marked an important pivot year for URC, with a return to strong topline and profit growth a�er some years of di�icult challenges. The step-back we did in 2018, with changes in URC’s Leadership line-up and a strategy refresh, is starting to bear fruit. I firmly believe that we have now set a strong base that will anchor a multi-year transformation, in line with our vision to make URC a leading food & beverage sustainable enterprise from the Philippines.
A continued focus on executing the new set of sound strategies will be critical in what we expect to be an ever-increasing level of competitive intensity, now exacerbated by more uncertainty brought upon us by the latest pandemic crisis. This environment requires us to step up our customer-centricity and operational excellence. I am pleased to see very good progress across
URC in building a sharper focus on the consumer to underpin our innovation process, leading to more compelling brand initiatives. Alongside this increased consumer focus, we are also making major strides in transforming our product supply chain and becoming more preferred partners of choice amongst our customers and suppliers. The integrated delivery of all these strategic focus areas achieved double-digit growth in our two largest businesses in the Philippines – the successful restage of Great Taste Co�ee, and the capacity expansion supporting market share gains in Jack n’ Jill Snacks. In 2019, the resurgence of our Philippine Branded Consumer Foods business, the margin and profit improvements in International, and the continued strong growth of Agro-Industrial & Commodities, provide ample evidence of what sound strategies, executed with excellence, can deliver.
“ I firmly believe that we have now set a strong base that will anchor a multi-year transformation, in line with our vision to make URC a leading food & beverage sustainable enterprise from the Philippines. ”
I want to express our deepest gratitude for your continued trust and support. Rest assured, as we work through this crisis and continue our transformation journey, we remain focused on serving our consumers and delivering long term value creation to you, our shareholders.
Maraming Salamat Po.
Lance Y. GokongweiCHAIRMAN
“ Looking ahead, I am excited to see URC’s transformation plans bring more consumer-driven choices come to life; and deliver more shared success to all stakeholders. ”
“ My role as chairman is to provide the URC Leadership Team advice, guidance and full support to drive URC's strategic agenda in the company’s transformation journey. I’m pleased with the management interaction cadence we have developed within URC. ”
Looking ahead, I am excited to see URC’s transformation plans bring more consumer-driven choices come to life; and deliver more shared success to all stakeholders. However, I recognize the unprecedented external threat that has emerged this year – COVID 19. I acknowledge that this crisis has the potential to a�ect the momentum of our long-term plans. In the immediate short term, we have implemented our business continuity plans anchored on three areas -- ensuring the health and safety of our employees, maximizing our operations & supply chain even under quarantine conditions, and helping the communities where we live and operate. The situation continues to evolve; and we are preparing for various crisis scenarios, including the recovery phase post-crisis. With URC’s strong balance sheet and cash position, and the resiliency of the organization, we are confident to overcome the short term challenges. And in the long run, URC is well positioned to serve any shi�s in consumer trends and continue to create value for shareholders.
My role as chairman is to provide the URC Leadership Team advice, guidance and full support to drive URC's strategic agenda in the company’s transformation journey. I’m pleased with the management interaction cadence we have developed within URC. I have several opportunities to engage in key strategic reviews of the business and the organization. And yet, the URC Leadership Team have the degrees of freedom to make decisions and operate with speed and agility. We continue to be locally focused and relevant, but regionally aligned in our ways of working so we harness
Chairman’s Message
the collective strength of our capabilities. The entire board is confident that we have a strong and capable leadership team in URC. We have a cohesive One URC leadership team aligned to making structural systemic improvements, while keeping the founders’ mentality intact. This combination gives us the confidence to stay on track towards our long term objectives and goals… whatever challenges that lie ahead.
Last year also marked an important milestone in URC’s sustainable enterprise journey to embed and integrate critical ESG (Environment, Social & Governance) initiatives into the business. Building a “People & Planet Friendly Culture” is our #1 How-to-Win strategy. A�er an intense period of baselining and enterprise-wide engagement in 2018/19, we formally communicated our 2030 targets in key materiality areas of Natural Resources, People and Product, aligned to the UN Sustainable Development Goals. We believe that this is the right direction to be one step ahead in managing risks across our value chain and stakeholders. One example is the progress made in Year 1 in water-use-ratio and energy-use-ratio. The initial reductions made in these areas have been very encouraging and contributed to the LEAN Manufacturing Excellence cost savings program.

Message fromthe Presidentand CEO
Annual Report 2019
Message from the President and CEO | Introduction
To our valued Shareholders, I write this year’s URC annual report letter to you with bittersweet feelings. 2019 marked the end of an era, and at the same time the beginning of a pivotal transformation phase for the company. In November of last year, we sadly lost our beloved founder, Mr. John Gokongwei, Jr. and his wife Elizabeth. In their memory, this annual report will feature elements of how they inspired us and gave us the foundations upon which we continue to build our growth story. Last year, we also saw the beginnings of results delivered from a strategic reboot kicked o� in 2018. I am pleased that, in 2019, we achieved strong year-on-year Sales growth of +5% and Operating Income growth of +12%, a�er three years of profit decline. Importantly, we laid the seeds for sustainable future growth, harvested the first fruits of our labor, and braced ourselves for the exciting journey still to come.
2019 was an important pivot year, and this set a solid base for our glide path back to sustainable growth and profitability. The strategic foundations we built in 2018 enabled URC to focus our execution in 2019. We identified three areas where immediate fixes were needed: (1) turning around the Philippine Co�ee business, (2) improving our Sales & Distribution capabilities, and (3) addressing our Product Supply Chain responsiveness and reliability. The progress we made in these areas underpin the strong 2019 results; and are covered in the balance of this report.
These three immediate priorities became the cornerstones of our Where-To-Play and How-To-Win strategies, in our objective to transform URC into a leading sustainable enterprise. Beyond
Co�ee, we made choices on protecting and growing our core; finding more adjacencies to expand our portfolio; and strengthening our innovation process management across all categories. Beyond Sales & Distribution, we are transforming our customer and supplier relationships to make URC the preferred partner of choice in our industry. Beyond Supply Chain responsiveness, we are embarking on an ambitious multi-year transformation to capture lean e�iciency savings and build a more resilient and cost-e�ective supply network. And holding all these together is an organizational strategy of building a People and Planet Friendly Culture that permeates our leadership development; positive people experiences; sustainability, quality and safety programs; productivity, simplification and digital acceleration. We have made fast considerable progress in all these strategic areas; and we share some examples of these in this annual report.
This strategic framework provides us a robust set of actions that delivered results last year; and is continuing to deliver results now. Through intensifying competitive challenges … through this pandemic crisis … through thick and thin, fire and brimstone … this strategic framework provides us the guideposts in our quest to transform URC from a successful founder-led company to a leading sustainable enterprise in the Food & Beverage sector for generations to come.
“ 2019 was an important pivot year and this sets a solid base in our glide path back to sustainable growth and profitability. ”

We are pleased to announce that we posted solid operating results improvement for the full year 2019. Net sales grew +5% to Php 134.2 billion. Our progress in the Philippines drove overall growth in sales as the benefits from our transformation programs started to manifest in our results.
Operating income had a strong recovery versus last year with double-digit growth of 12%, amounting to Php 15.0 billion, with margins improving by +72 basis points. Net Income amounted to Php 10.1 billion, an increase of 7% versus the same period last year, driven by the growth in operating income o�set by finance cost, other expenses, and adverse foreign exchange impacts.
“ Our progress in the Philippines drove overall growth in sales as the benefits from our transformation programs started to manifest in our results. ”
STRONG BALANCE SHEET
URC’s financial position remains strong with ending cash balance of Php 20.5 billion and gearing ratio at a comfortable 0.45 level. Net debt of Php 22.0 billion is mainly attributable to the remaining debt associated with the Oceania acquisitions.
DIVISIONAL PERFORMANCE
Branded Consumer Foods (BCF) sales, which is composed of domestic and international branded consumer foods, excluding packaging division, grew by 4% versus last year, amounting to Php 104.6 billion.
BCF Philippines' top-line growth has recovered to a healthy 8% growth in 2019 from a flattish performance in the last two years, amounting to Php 62.4B. The good results were driven by the successful turn-around of Great Taste co�ee, acceleration of Jack n’ Jill snacks and Noodles, recovery of C2 ready-to-drink tea, and contributions from joint venture businesses with better execution of our crucial transformation programs in distribution and supply chain.
Net Income
PHP 10.1 billion+7% vs last year
Operating Income
PHP 15.0 billion+12% vs last year
Net Sales
PHP 134.2 billion+5% vs last year
2019 BUSINESS REVIEW: URC OPERATING INCOME UP 12%
Message from the President and CEO | 2019 Business Review
STRONG BALANCE SHEET
URC’s financial position remains strong with ending cash balance of Php 20.5 billion and gearing ratio at a comfortable 0.45 level. Net debt of Php 22.0 billion is mainly attributable to the remaining debt associated with the Oceania acquisitions.
DIVISIONAL PERFORMANCE
Branded Consumer Foods (BCF) sales, which is composed of domestic and international branded consumer foods, excluding packaging division, grew by 4% versus last year, amounting to Php 104.6 billion.
BCF Philippines' top-line growth has recovered to a healthy 8% growth in 2019 from a flattish performance in the last two years, amounting to Php 62.4B. The good results were driven by the successful turn-around of Great Taste co�ee, acceleration of Jack n’ Jill snacks and Noodles, recovery of C2 ready-to-drink tea, and contributions from joint venture businesses with better execution of our crucial transformation programs in distribution and supply chain.
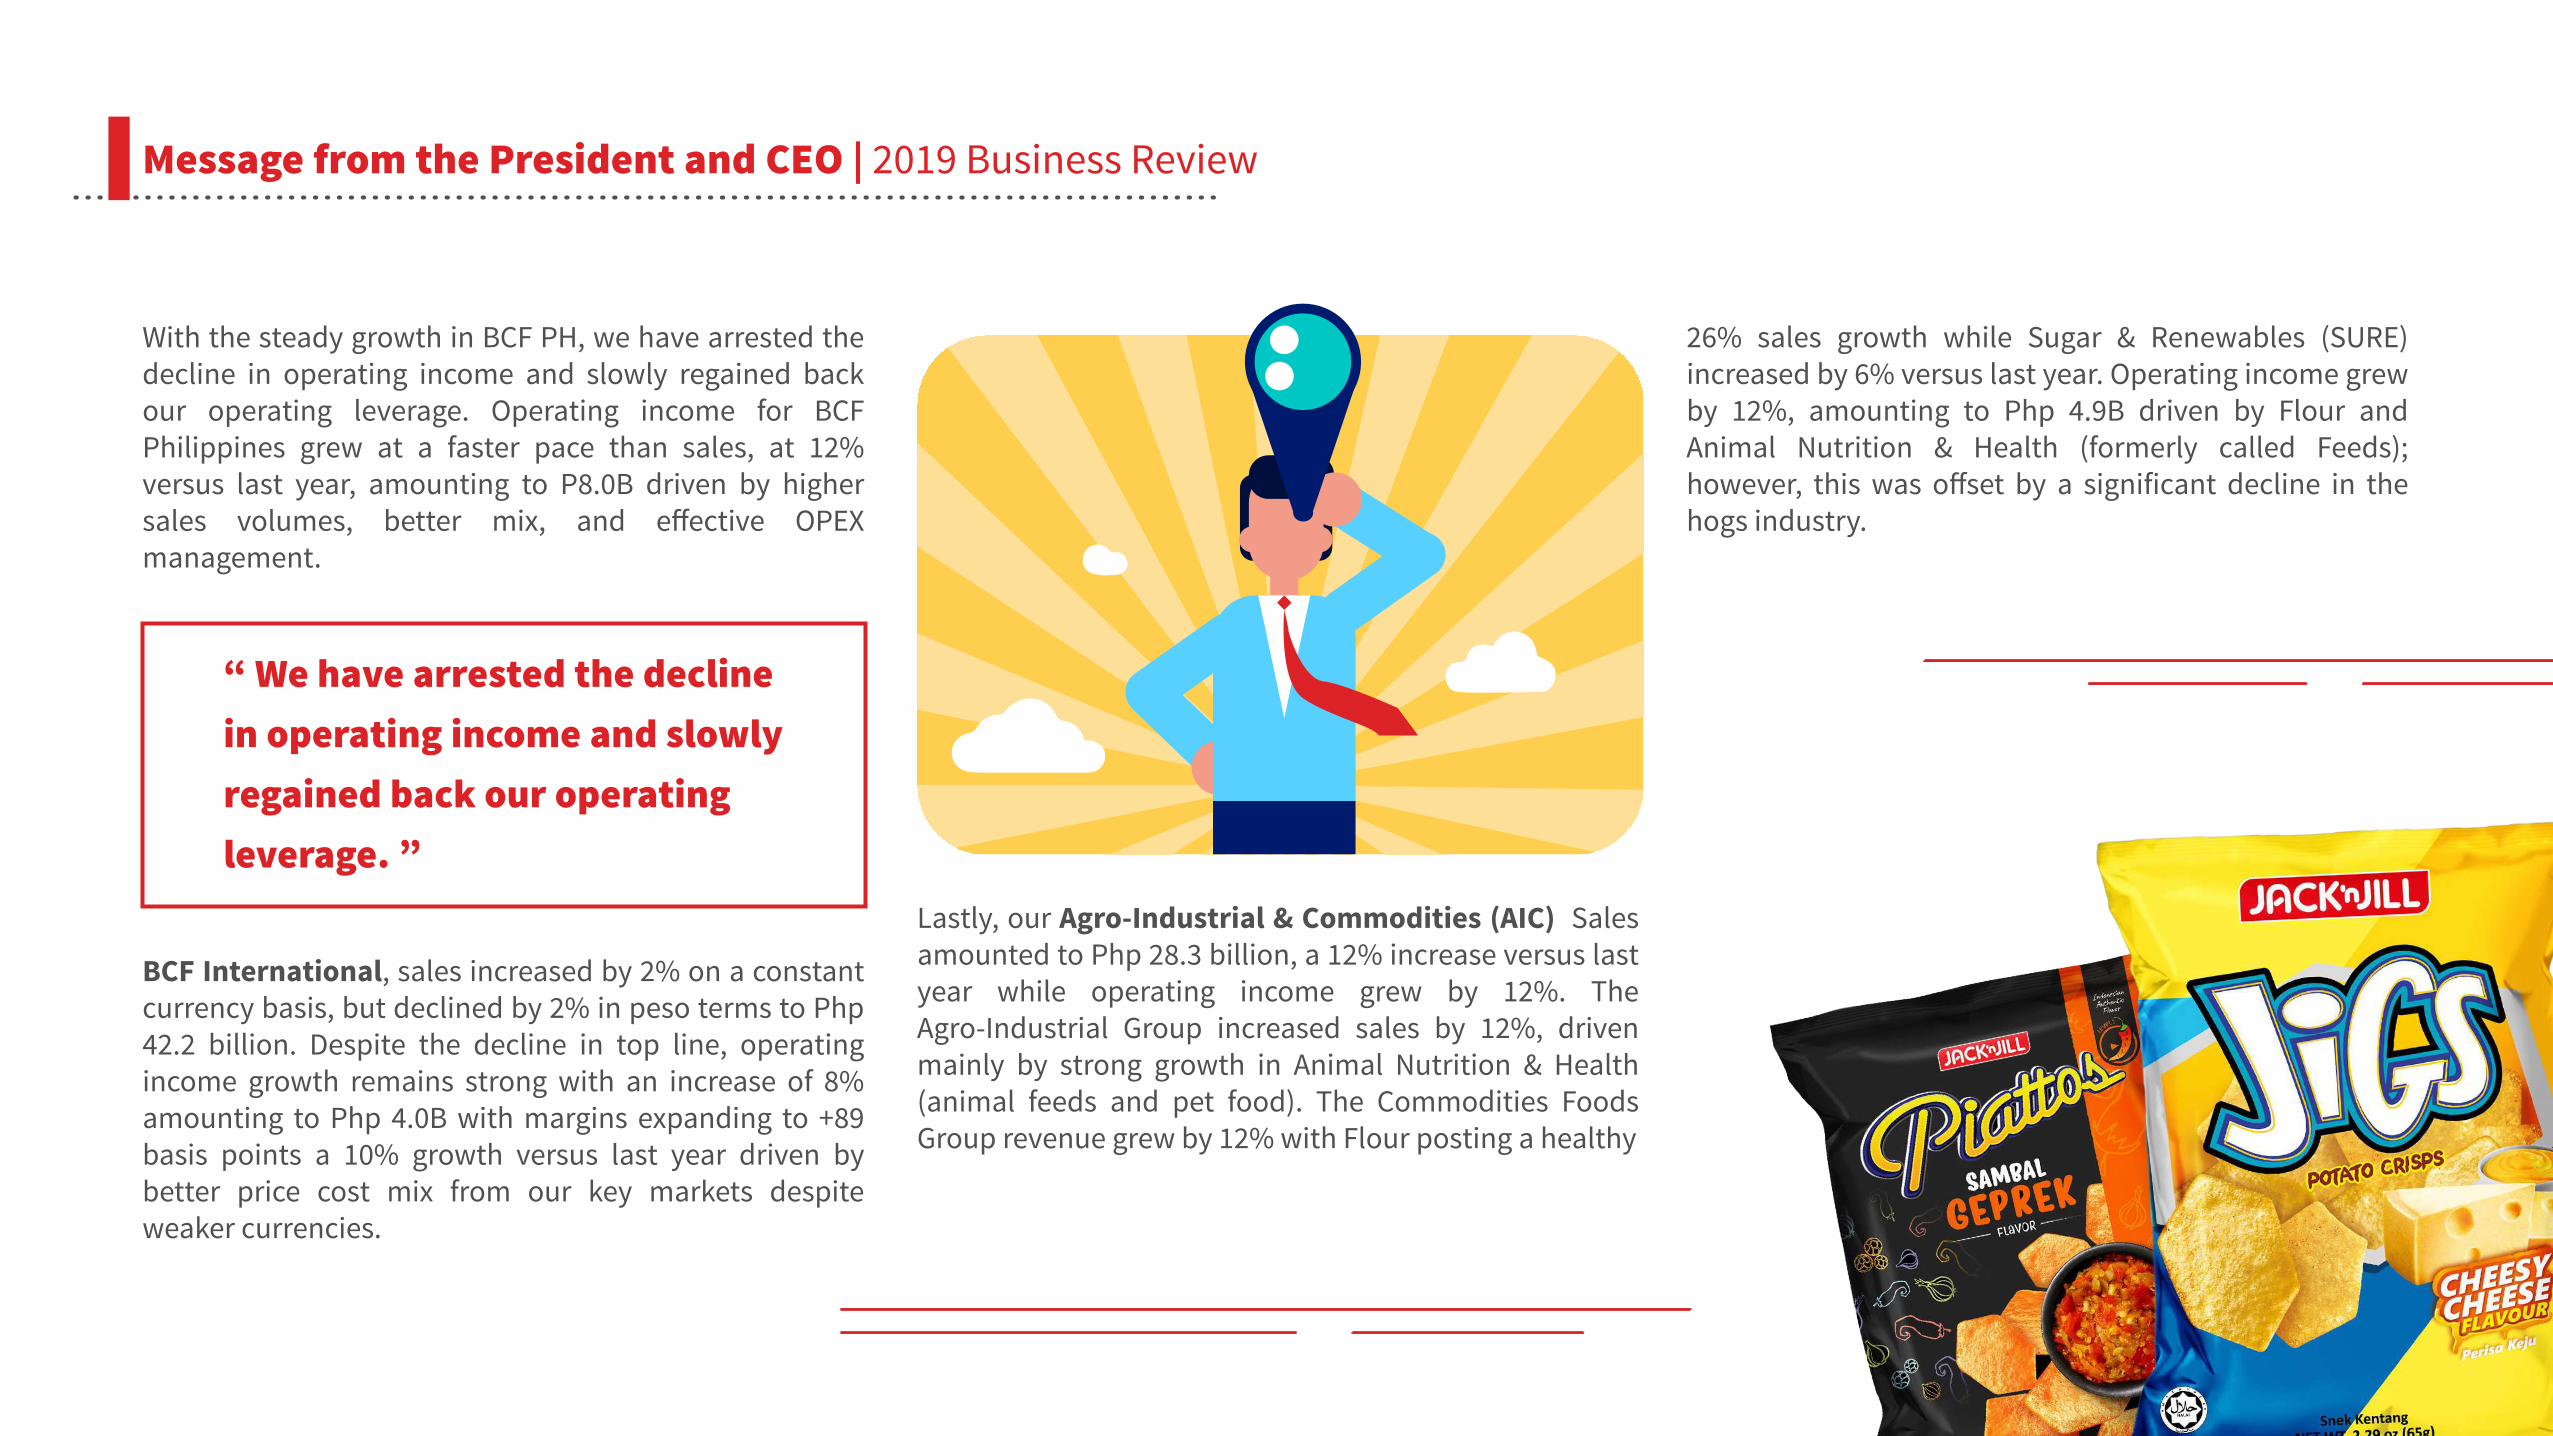
With the steady growth in BCF PH, we have arrested the decline in operating income and slowly regained back our operating leverage. Operating income for BCF Philippines grew at a faster pace than sales, at 12% versus last year, amounting to P8.0B driven by higher sales volumes, better mix, and e�ective OPEX management.
Lastly, our Agro-Industrial & Commodities (AIC) Sales amounted to Php 28.3 billion, a 12% increase versus last year while operating income grew by 12%. The Agro-Industrial Group increased sales by 12%, driven mainly by strong growth in Animal Nutrition & Health (animal feeds and pet food). The Commodities Foods Group revenue grew by 12% with Flour posting a healthy
BCF International, sales increased by 2% on a constant currency basis, but declined by 2% in peso terms to Php 42.2 billion. Despite the decline in top line, operating income growth remains strong with an increase of 8% amounting to Php 4.0B with margins expanding to +89 basis points a 10% growth versus last year driven by better price cost mix from our key markets despite weaker currencies.
“ We have arrested the decline in operating income and slowly regained back our operating leverage. ”
26% sales growth while Sugar & Renewables (SURE) increased by 6% versus last year. Operating income grew by 12%, amounting to Php 4.9B driven by Flour and Animal Nutrition & Health (formerly called Feeds); however, this was o�set by a significant decline in the hogs industry.
Message from the President and CEO | 2019 Business Review

Message from the President and CEO | Financial Highlights
Income Statement 2019
Growth5%
134.2
Net Sales
Growth8%
40.3
Gross Profit
Growth12%
15.0
Core Operating Income
Growth7%
10.1Net Income
150B
100B
50B
10B

Message from the President and CEO | Financial Highlights
Balance Sheet 2019
Growth11%
Growth13%
168.7
Total Assets
73.5
Total Liabilities
Per Share 2019
Growth8%
Growth6%
Growth7%
4.43Earnings
40.81
Book Value
Stockholder’sEquity
Amounts in billion Peso except per share data
Core Operating Income includes revaluation of biological assets
95.2
175B
125B
75B
25B
50
25
5

Sales
EBIT*
*EBIT includes revaluation of biological assetsbut excludes corporate expenses
Philippines
International
Agro-industrialand commodities
Philippines
International
Agro-industrialand commodities
48 %
31% 21%
47%
24%
29%
Cash Position
Cash and Financial Debt
13.5
39.9
21.0
43.0
CY 2018 CY 2019
Cash as ofDec 2018
Cash as ofDec 2019
Cash + Financial Assets at FVPL + AFS Financial Debt
EBITDA CAPEX Dividends WorkingCapital and
Others
13.0
22.3 9.07.2 1.4 20.5
Message from the President and CEO | Financial Highlights

Other Updates Intersnack Transaction
At the end of 2019, we completed the transaction of taking Intersnack Group GmbH as a 40% minority partner in our Australia/New Zealand business. URC retains management control and 60% majority shareholding. We received USD142 Million in cash, plus the contribution of Intersnack’s Yarra Valley business in Oceania. There is a “gain on sale” of this minority position which is reflected as a balance sheet equity increase. Going forward, this business unit will be named Unisnack Oceania. We look forward to working with Intersnack and leverage their considerable expertise in sourcing, supply chain operations and commercial management.
Message from the President and CEO | Other Updates
• Supply Network Design (SND) Consolidations – Last year we completed detailed SND studies to determine the optimal configuration of our plant facilities. These studies indicated the opportunity to improve long term cost e�iciencies, while supporting future business expansion, by consolidating some of our excess high cost factories. This will entail closures, asset write o�s and redundancies in the Philippines and Australia over the next 2-3 years, resulting in production cost e�iciency benefits therea�er.
• Portfolio Adjustment / Downsizing of Farms – Over the past year and a half, we have engaged all business units in strengthening our core categories and identifying more new categories to develop. As part of this strategic assessment, we have determined that the Agro-Industrial Group (AIG) will be best served by focusing on the profitable and growing Animal Nutrition & Health business and continue to move up the value-added chain in the meat business. The latter means developing our new packaged meat o�erings and downsizing in the highly volatile and di�icult bio-security livestock farm facilities. We will still participate in the hog farms segment for vertical integration resiliency; but we no longer need as much hog farms and breeder stocks as we have today. This downsizing will progress over the coming year, resulting in reduced losses and volatility from the farm business.
Restructuring Reserves
We have included in our 2019 financials, non-cash restructuring reserve charges of Php 830 Million before tax and Php 581 Million a�er tax. The nature of these Restructuring Reserves relates to strategic decisions taken in 2019 involving multi-year restructuring programs that will be executed over the next 2-3 years. The strategic decisions are a result of choices in specific Where-To-Play (portfolio streamlining) and How-To-Win (product supply chain transformation) areas of our strategic framework:
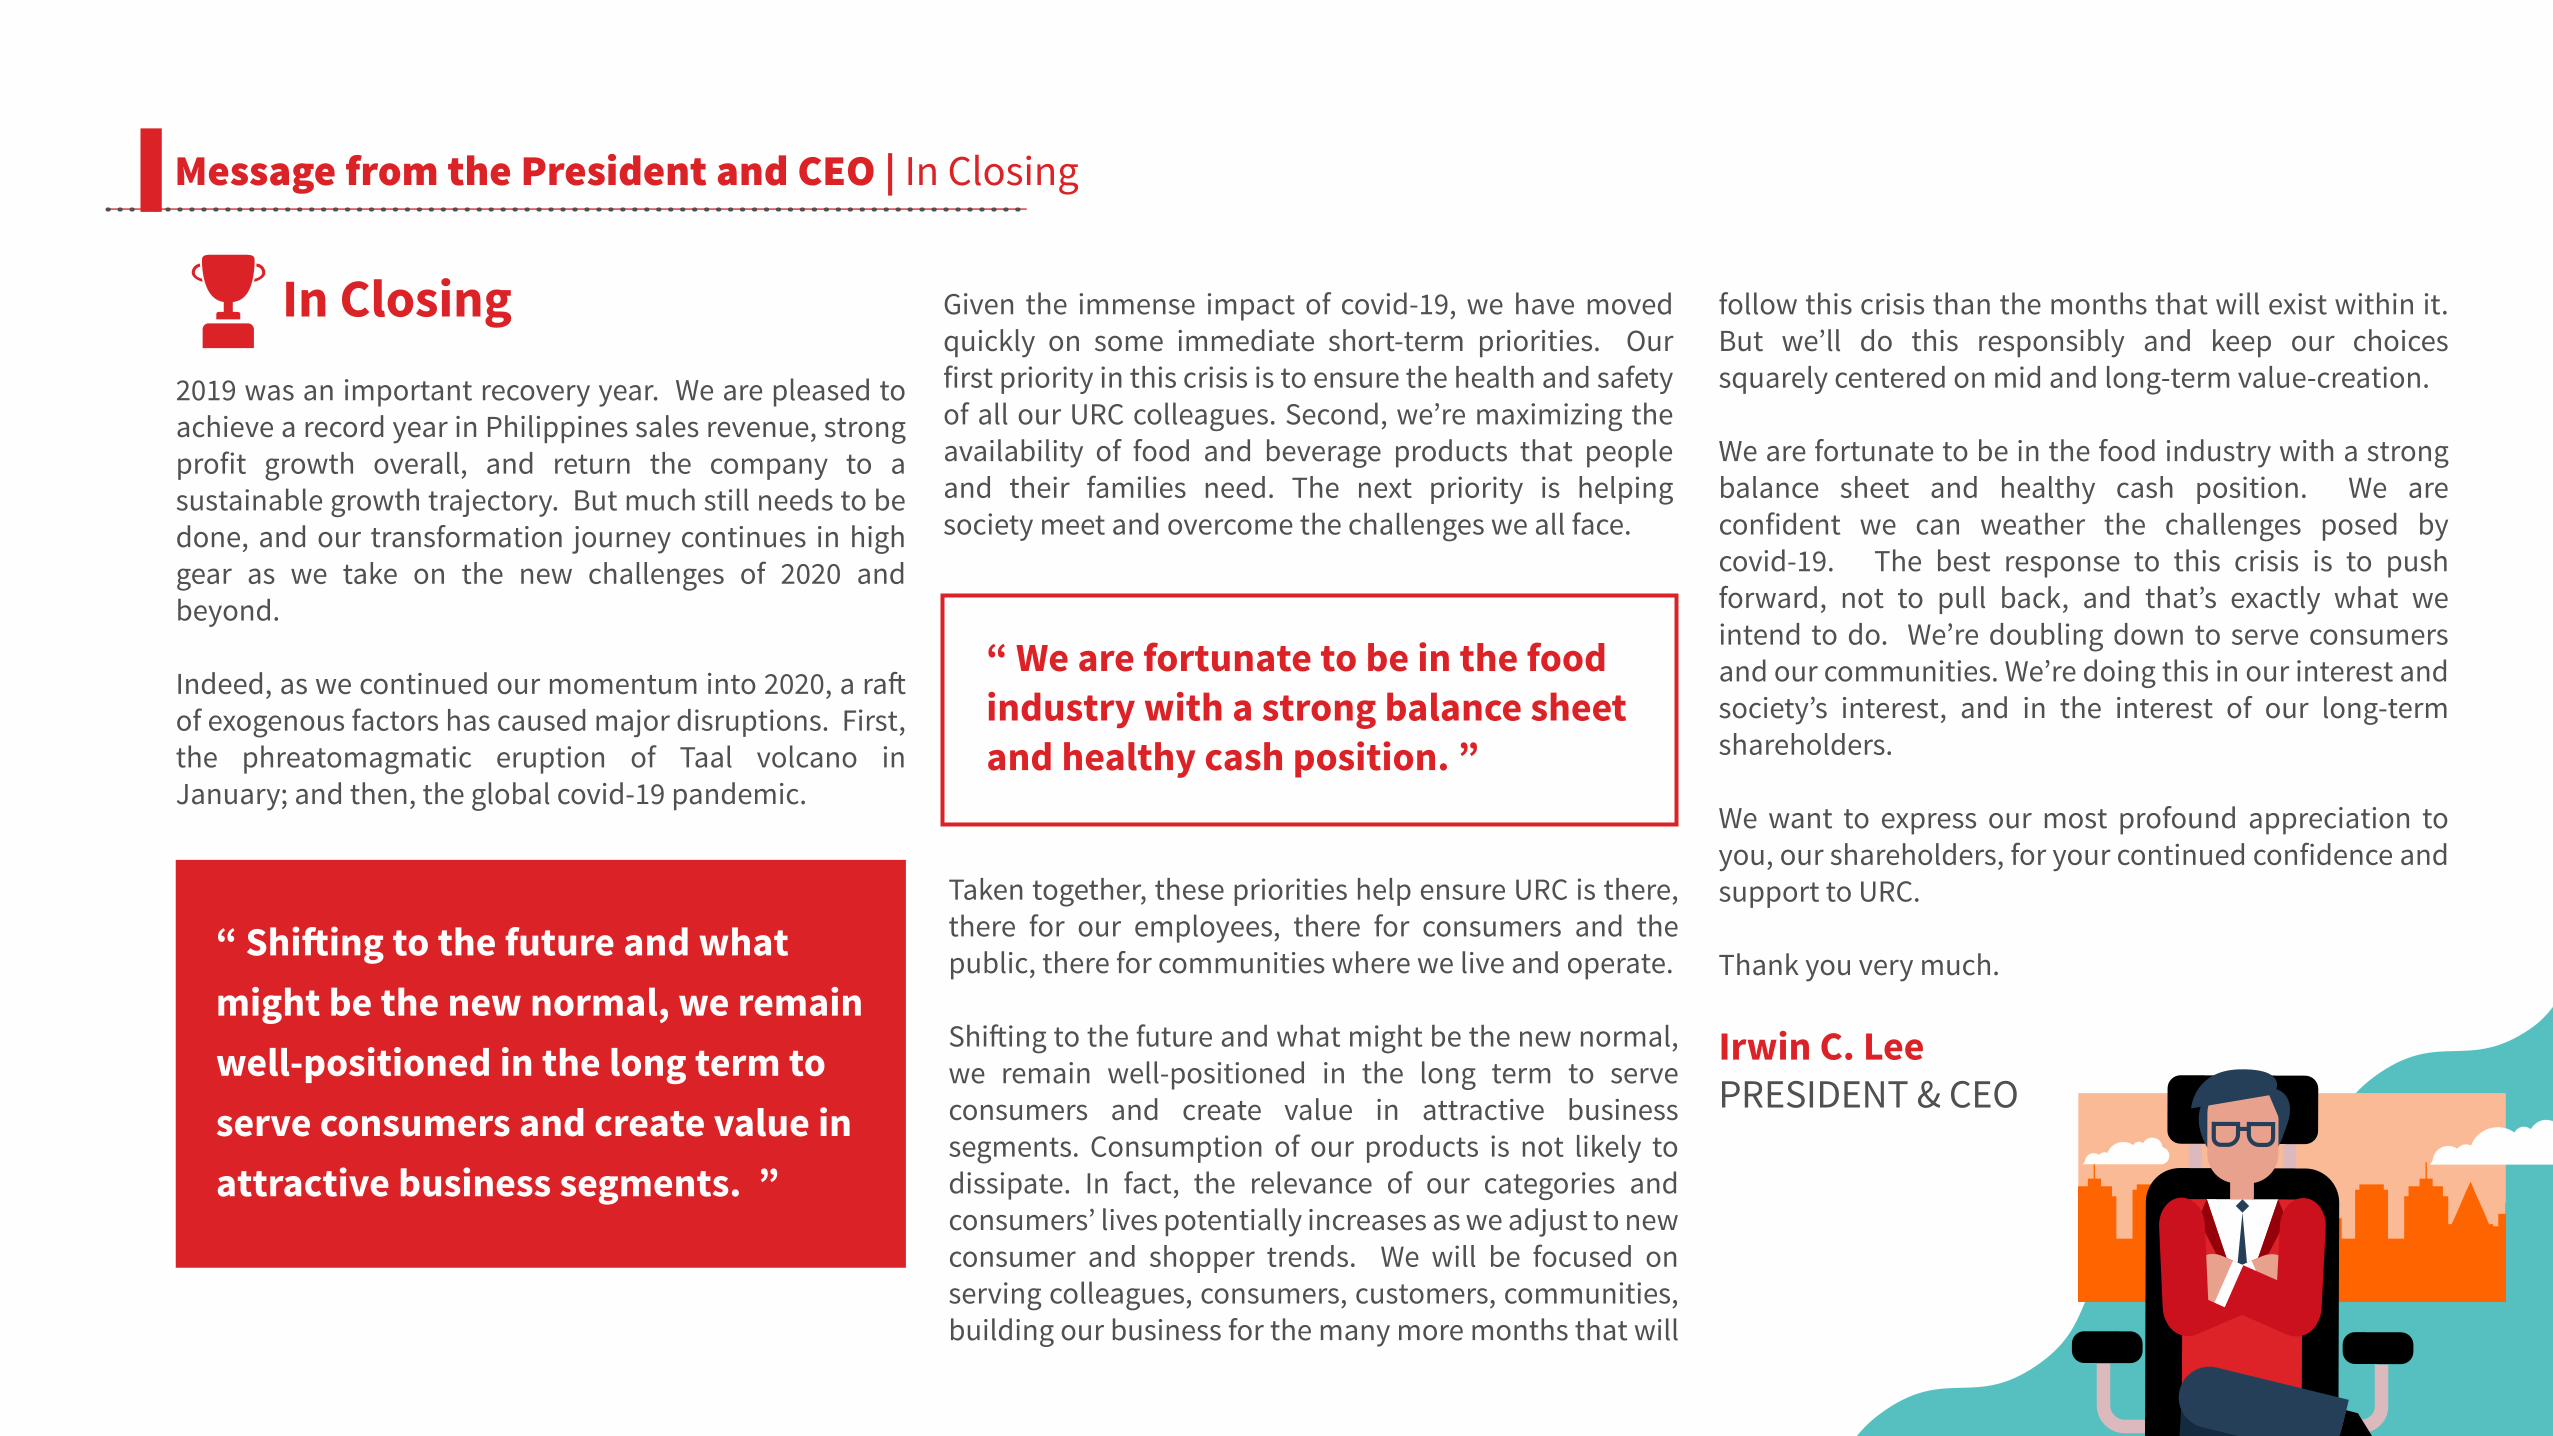
“ Shi�ing to the future and what might be the new normal, we remain well-positioned in the long term to serve consumers and create value in attractive business segments. ”
2019 was an important recovery year. We are pleased to achieve a record year in Philippines sales revenue, strong profit growth overall, and return the company to a sustainable growth trajectory. But much still needs to be done, and our transformation journey continues in high gear as we take on the new challenges of 2020 and beyond.
Indeed, as we continued our momentum into 2020, a ra� of exogenous factors has caused major disruptions. First, the phreatomagmatic eruption of Taal volcano in January; and then, the global covid-19 pandemic.
In Closing Given the immense impact of covid-19, we have moved quickly on some immediate short-term priorities. Our first priority in this crisis is to ensure the health and safety of all our URC colleagues. Second, we’re maximizing the availability of food and beverage products that people and their families need. The next priority is helping society meet and overcome the challenges we all face.
“ We are fortunate to be in the food industry with a strong balance sheet and healthy cash position. ”
Taken together, these priorities help ensure URC is there, there for our employees, there for consumers and the public, there for communities where we live and operate.
Shi�ing to the future and what might be the new normal, we remain well-positioned in the long term to serve consumers and create value in attractive business segments. Consumption of our products is not likely to dissipate. In fact, the relevance of our categories and consumers’ lives potentially increases as we adjust to new consumer and shopper trends. We will be focused on serving colleagues, consumers, customers, communities, building our business for the many more months that will
Message from the President and CEO | In Closing
follow this crisis than the months that will exist within it. But we’ll do this responsibly and keep our choices squarely centered on mid and long-term value-creation.
We are fortunate to be in the food industry with a strong balance sheet and healthy cash position. We are confident we can weather the challenges posed by covid-19. The best response to this crisis is to push forward, not to pull back, and that’s exactly what we intend to do. We’re doubling down to serve consumers and our communities. We’re doing this in our interest and society’s interest, and in the interest of our long-term shareholders.
We want to express our most profound appreciation to you, our shareholders, for your continued confidence and support to URC.
Thank you very much.
Irwin C. LeePRESIDENT & CEO

Annual Report 2019
About URC
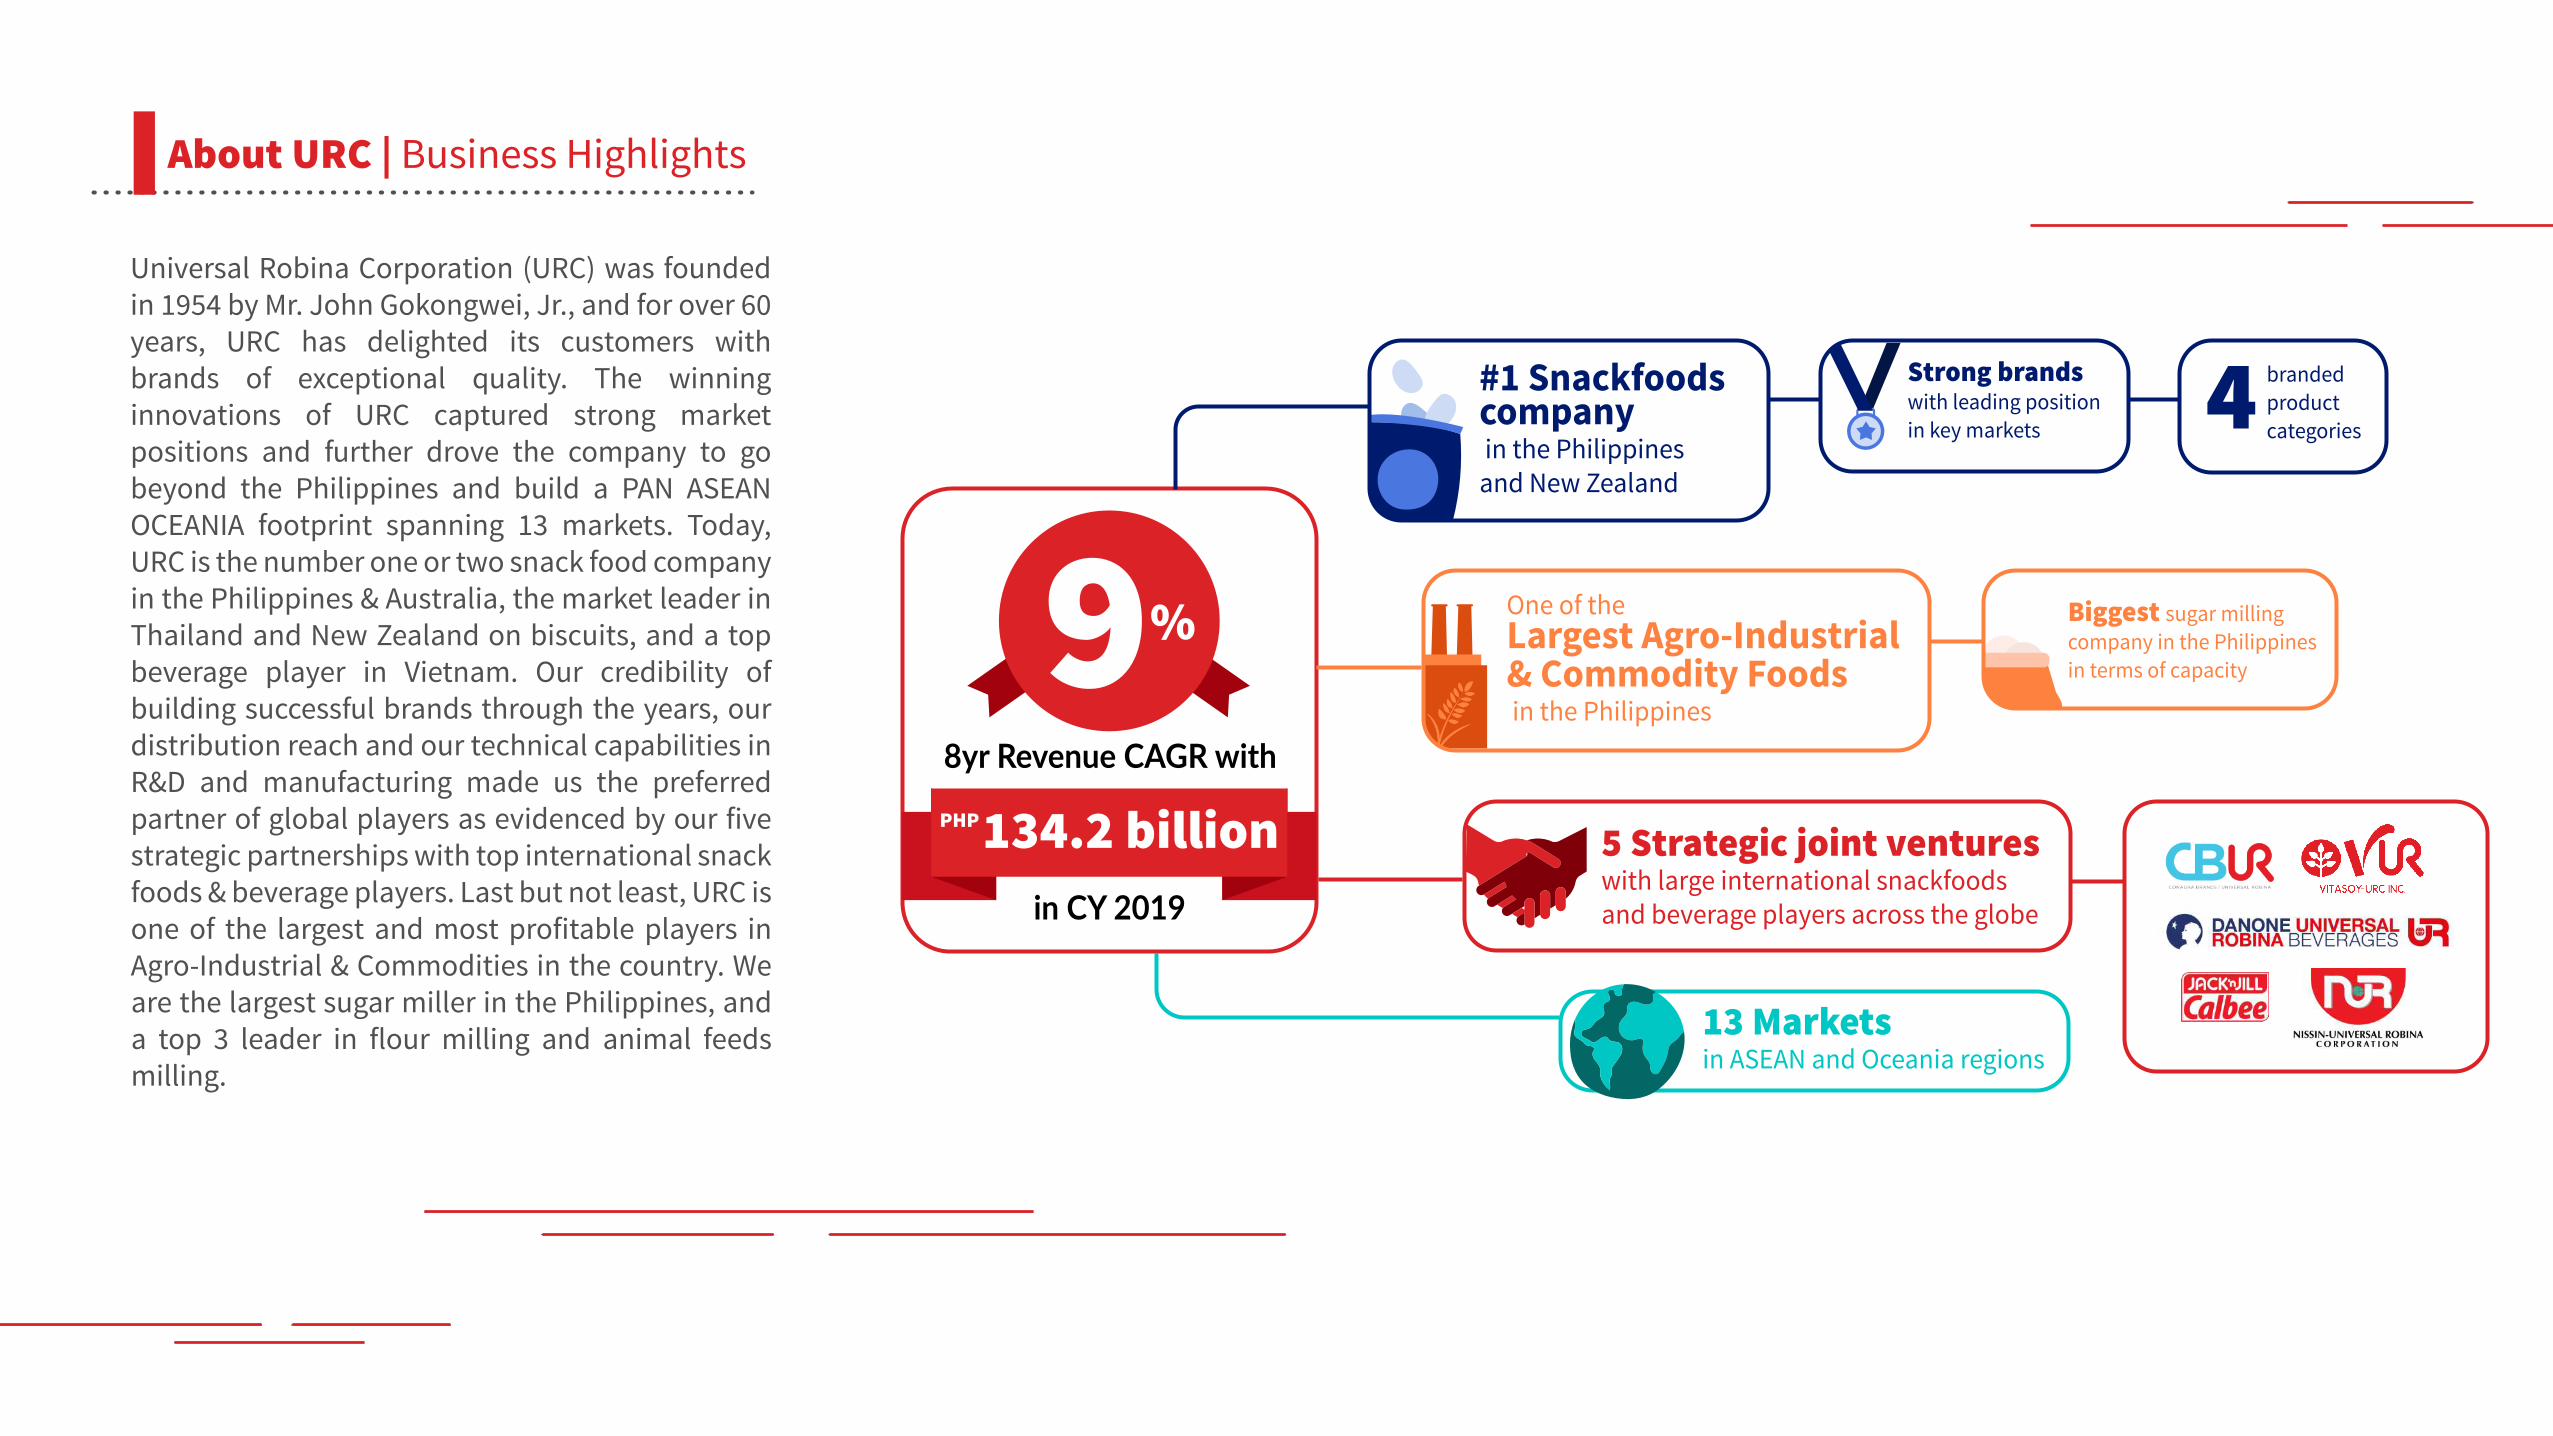
Universal Robina Corporation (URC) was founded in 1954 by Mr. John Gokongwei, Jr., and for over 60 years, URC has delighted its customers with brands of exceptional quality. The winning innovations of URC captured strong market positions and further drove the company to go beyond the Philippines and build a PAN ASEAN OCEANIA footprint spanning 13 markets. Today, URC is the number one or two snack food company in the Philippines & Australia, the market leader in Thailand and New Zealand on biscuits, and a top beverage player in Vietnam. Our credibility of building successful brands through the years, our distribution reach and our technical capabilities in R&D and manufacturing made us the preferred partner of global players as evidenced by our five strategic partnerships with top international snack foods & beverage players. Last but not least, URC is one of the largest and most profitable players in Agro-Industrial & Commodities in the country. We are the largest sugar miller in the Philippines, and a top 3 leader in flour milling and animal feeds milling.
About URC | Business Highlights
#1 Snackfoods company in the Philippinesand New Zealand
Strong brands with leading position in key markets
branded productcategories
5 Strategic joint ventures with large international snackfoods and beverage players across the globe
13 Marketsin ASEAN and Oceania regions
One of the Largest Agro-Industrial& Commodity Foods in the Philippines
Biggest sugar milling company in the Philippinesin terms of capacity9%
134.2 billionPHP
8yr Revenue CAGR with
in CY 2019

PASSION TO WIN
INTEGRITY
DYNAMISM
COURAGE
Our VisionDelighting consumers with brands of exceptional quality and value, making lives a fun experience.
Our AmbitionTo be the Leading Food & Beverage Sustainable Enterprise from the Philippines
Core Values
We build organizational capability by being entrepreneurial and proactive, driven by a sense of urgency and purpose. We continuously challenge ourselves to deliver world-class brands and consistently rally our people to strive for excellence.
We are guided by transparency, ethics and fairness. We build the business with honor and are committed to good governance. Our processes and products meet the highest standards. We are credible in our dealings with both internal and external stakeholders.
We cultivate a culture of innovation and productive working relationships. We continuously find ways to improve organizational and people capabilities to meet constantly changing consumer needs.
We seize opportunities in building long-term, sustainable businesses. We make tough people and business decisions to ensure competitive advantage.
About URC | Vision, Ambition, Values

Branded Consumer Foods (BCF)This is the largest business segment of URC with a range of strong household brands that are loved by consumers in the snacking, beverage and noodles categories. We participate in 4 branded super categories that continue to grow across our markets in the ASEAN and Oceania regions.
Co�eesCreamerChocolate
Noodles
Snack Foods
Ready-to-Drink
Beverages Powdered
Beverages
Water
CupNoodles
Pouch Snac
ks
Cand
ies
Chocolat
es
Biscuits
Cakes
WrappedSnacks
Tea
Juice
Soy
Chocolate
Creamer
Coffee
RTD
Choc
olat
e
About URC | Brand Architecture

Agro-Industrial & Commodities (AIC)This segment is composed of Agro-industrial Group, Sugar and Renewables Group, and Flour and Pasta Division. As a vertically integrated business, AIC supports the branded consumer foods business through its end product such as sugar and flour. Ag
ro-In
dust
rial G
roup
Flour and Pasta
Sugar and Renewables
Animal N
utrition and Health
Agro-Industrialand Commodities
Bread Pasta
Liquid CO2
Power Export
Flour
Bioethanol
MolassesRefin
ed Su
gar
Raw
Sug
ar
• Table Eggs• Hog Meat - Live Hogs - Carcass - Warm and chilled - Meat Cuts - Processed Meats
Robi
na F
arm
s
About URC | Brand Architecture
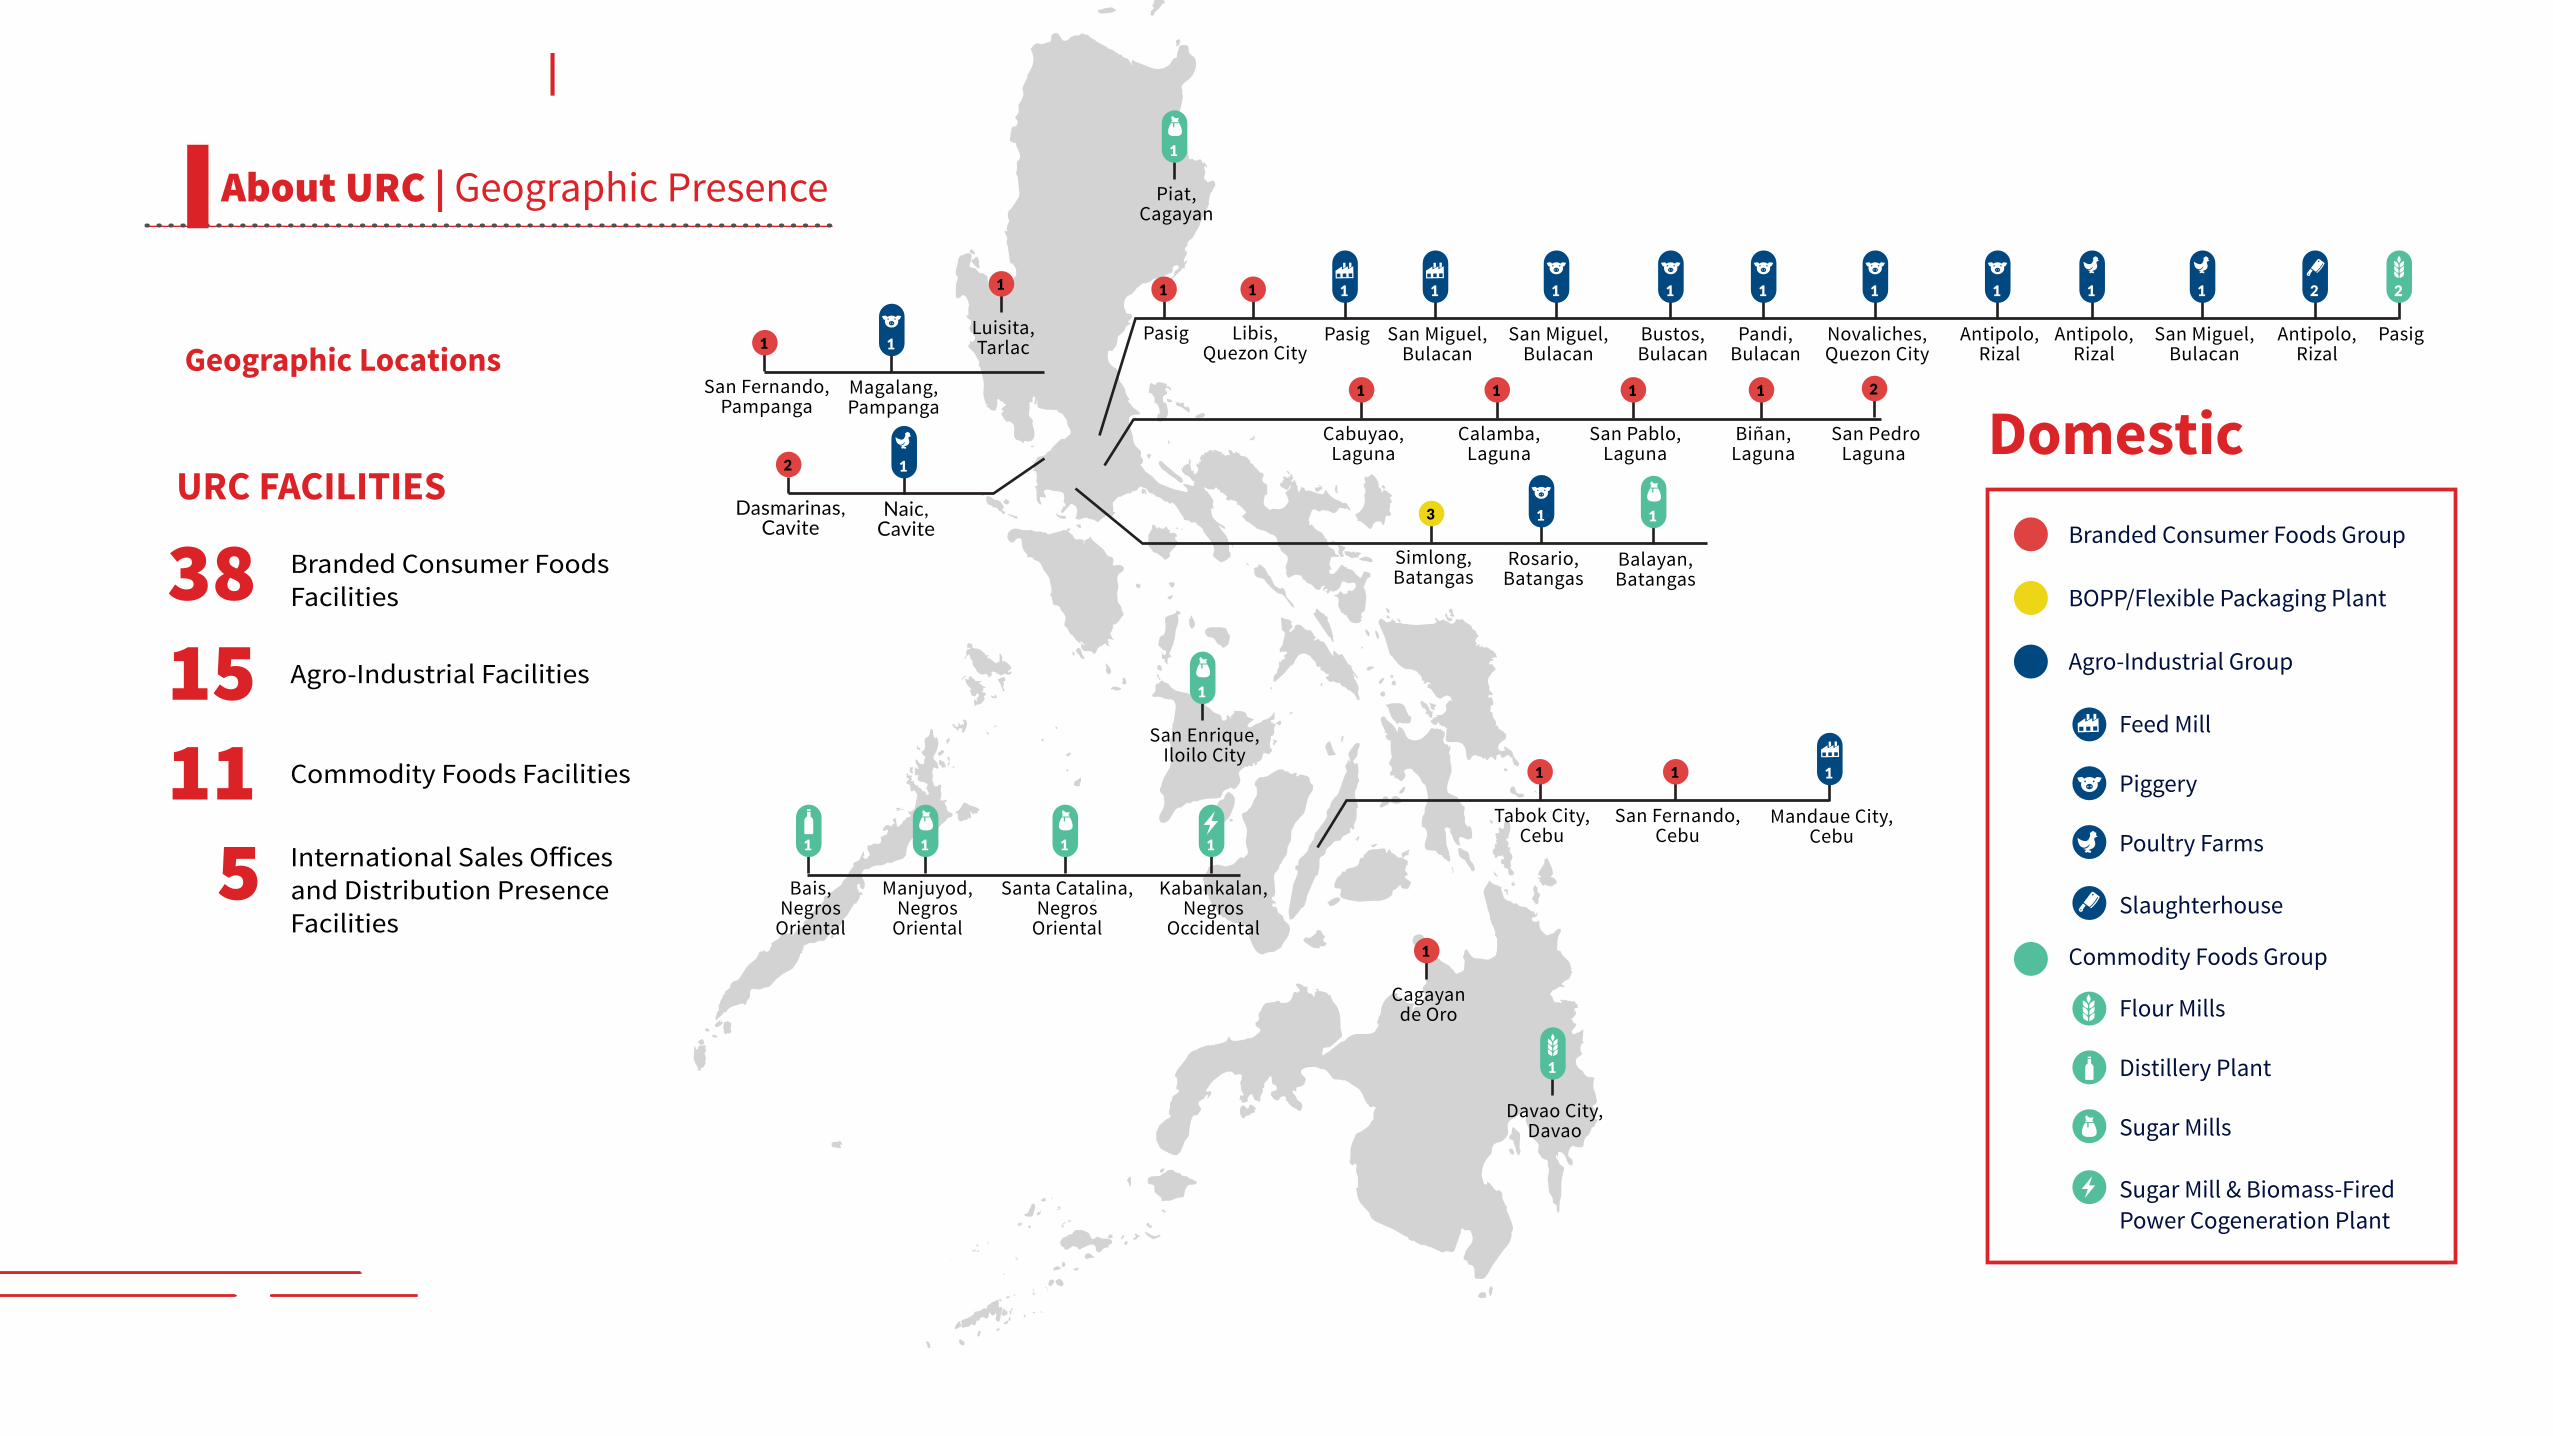
URC FACILITIES
38 Branded Consumer Foods Facilities
15 Agro-Industrial Facilities
11 Commodity Foods Facilities
5 and Distribution Presence Facilities
DomesticBranded Consumer Foods Group
BOPP/Flexible Packaging Plant
Agro-Industrial Group
Feed Mill
Commodity Foods Group
Piggery
Poultry Farms
Slaughterhouse
Flour Mills
Distillery Plant
Sugar Mills
Sugar Mill & Biomass-FiredPower Cogeneration Plant
|
1
Pasig
1
Cabuyao,Laguna
1
Calamba,Laguna
1
San Pablo,Laguna
1 2
Biñan,Laguna
San PedroLaguna
1
Libis,Quezon City
1
Luisita,Tarlac
1
Tabok City,Cebu
1
San Fernando,Cebu
1
Cagayande Oro
1
San Fernando,Pampanga
2
Dasmarinas,Cavite
3
Simlong,Batangas
1
Mandaue City,Cebu
1
Pasig
2
Pasig
1
San Miguel,Bulacan
1
San Miguel,Bulacan
1
Bustos,Bulacan
1
Pandi,Bulacan
1
Novaliches,Quezon City
1
Antipolo,Rizal
1
Antipolo,Rizal
2
Antipolo,Rizal
1
San Miguel,Bulacan
1
Rosario,Batangas
1
Magalang,Pampanga
1
Naic,Cavite
1
Davao City,Davao
1
Bais,Negros
Oriental
1
Balayan,Batangas
1
Piat,Cagayan
1
Santa Catalina,Negros
Oriental
1
Kabankalan,Negros
Occidental
1
San Enrique,Iloilo City
1
Manjuyod,Negros
Oriental
Geographic Locations
About URC | Geographic Presence

InternationalBranded Consumer Foods Group
Exclusive Distribution Presence
| 2
China
1
Hong Kong2
Laos
1
Cambodia
2
Australia
2
New Zealand
2
Indonesia
1
Myanmar
6
Thailand 4
Vietnam
1Malaysia
Geographic Locations
About URC | Geographic Presence
1
Singapore
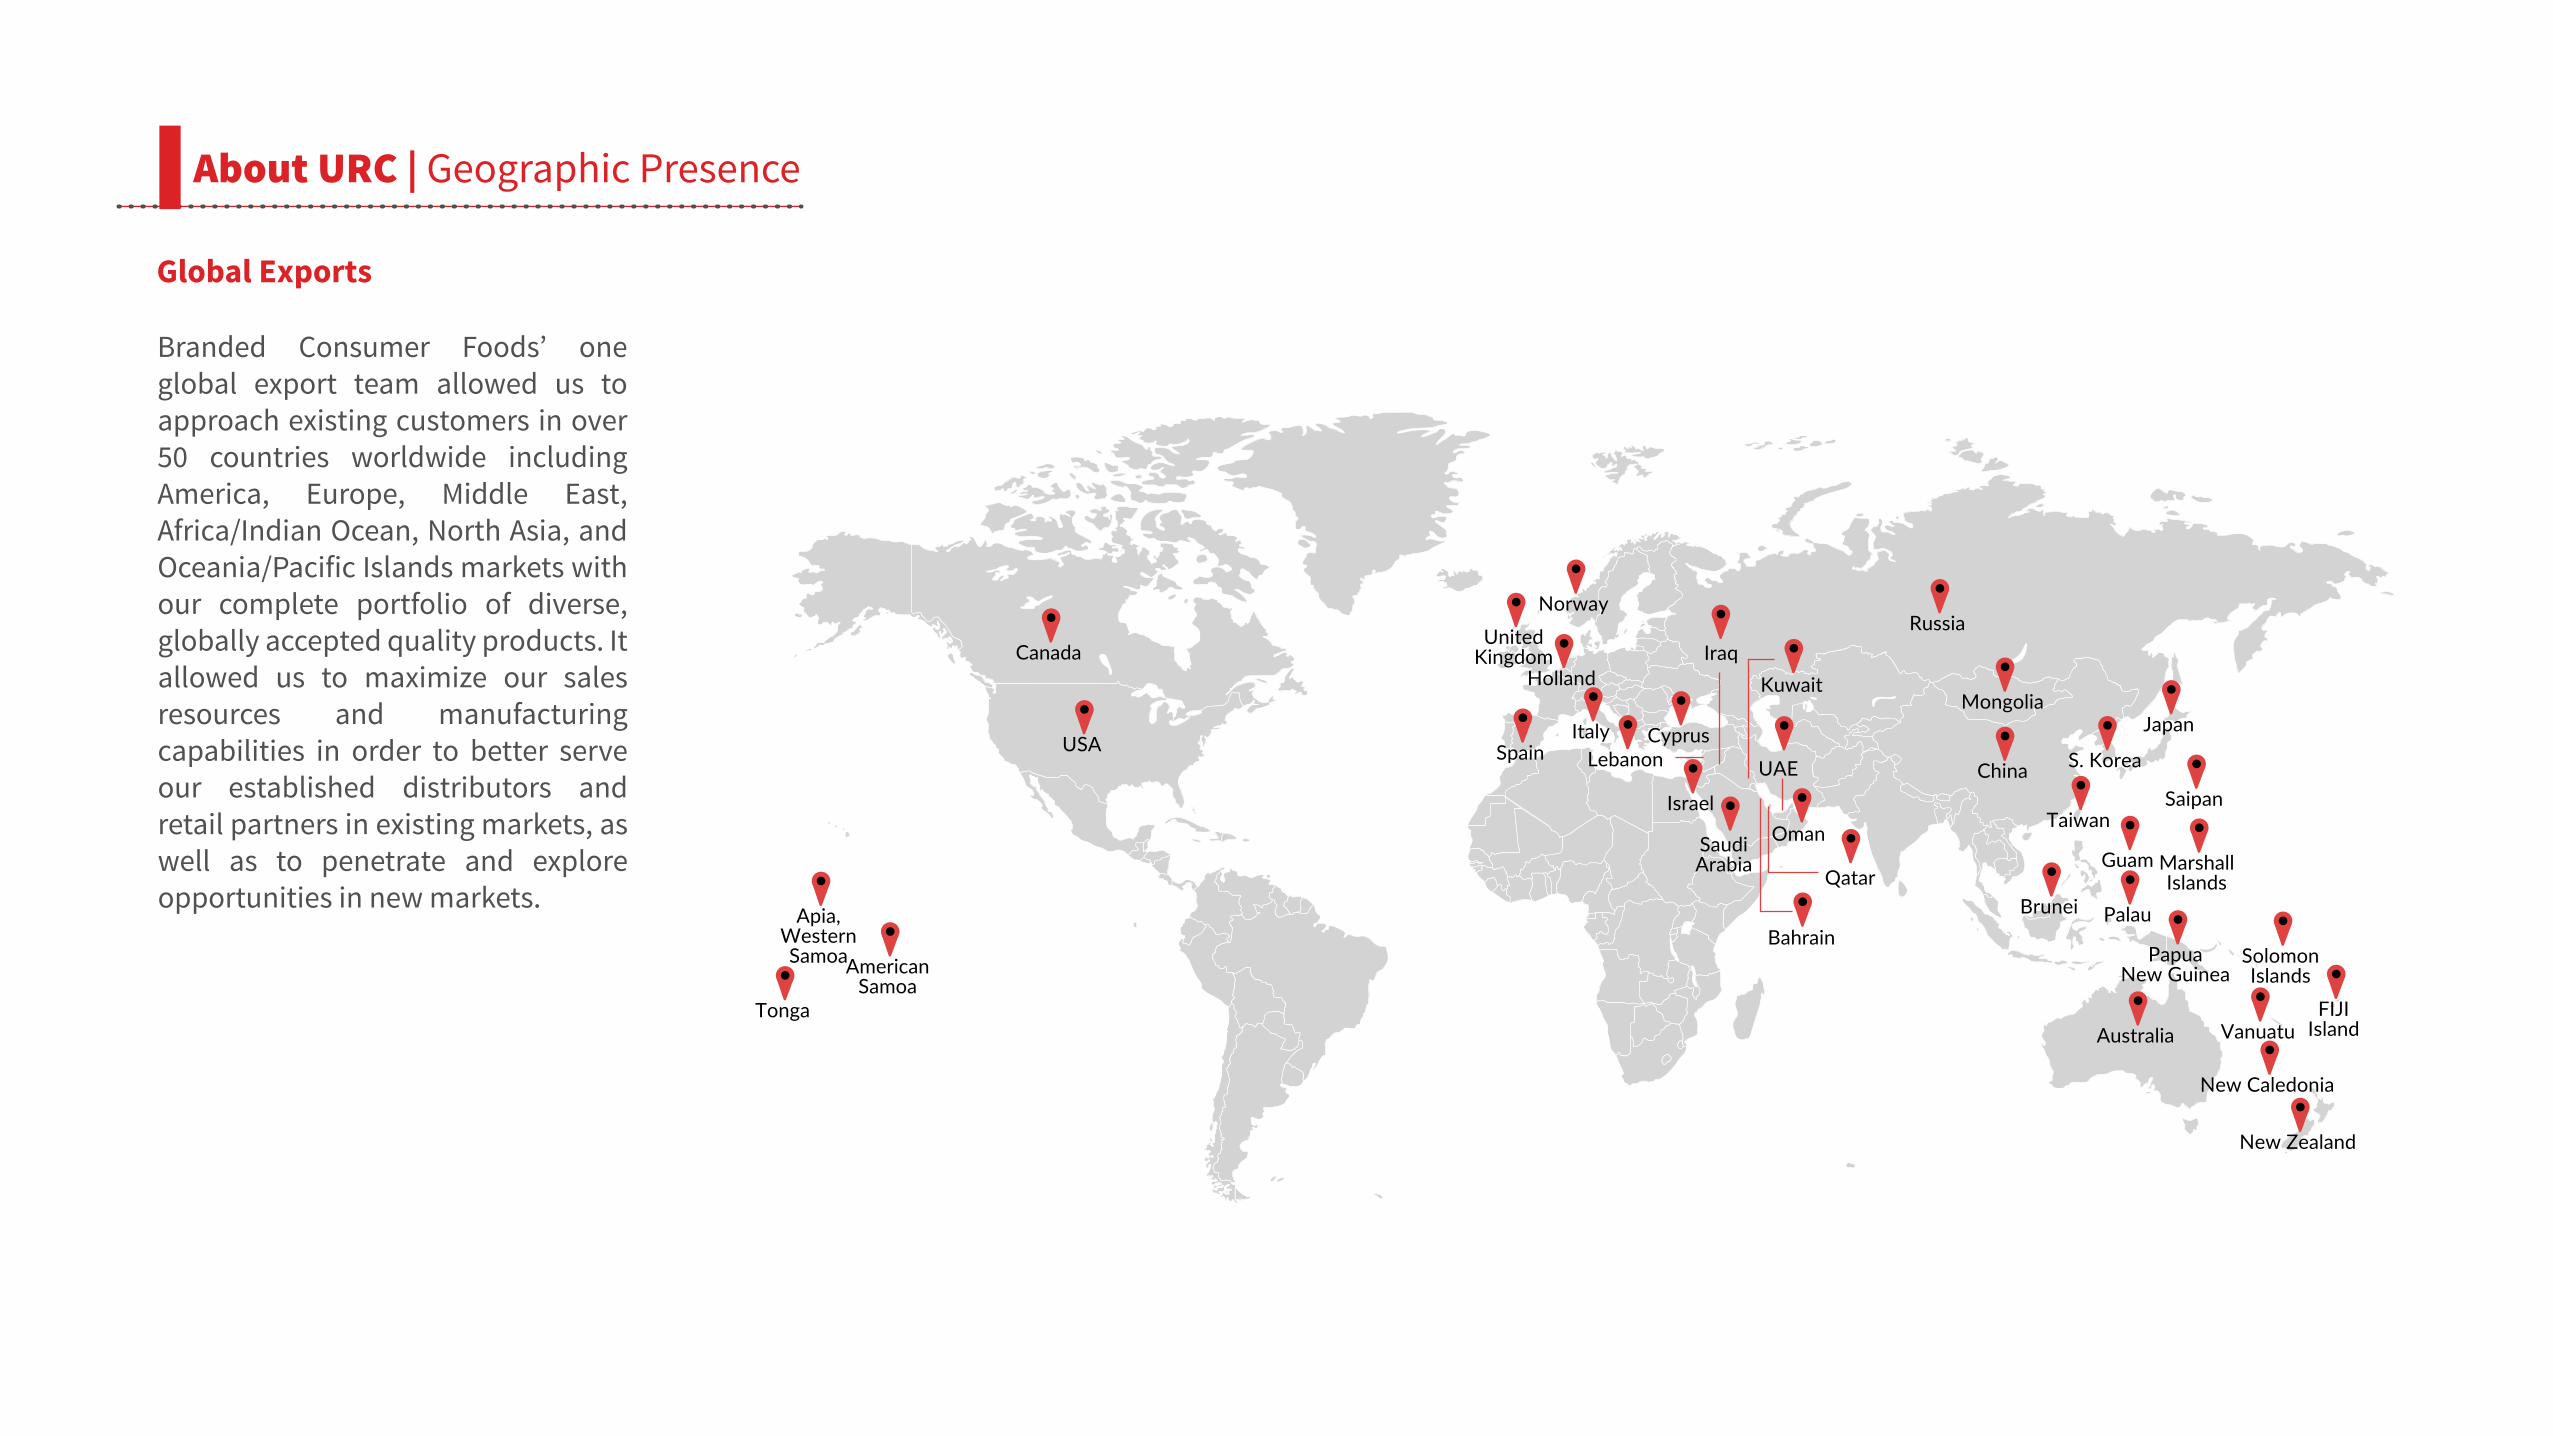
Global Exports
Branded Consumer Foods’ one global export team allowed us to approach existing customers in over 50 countries worldwide including America, Europe, Middle East, Africa/Indian Ocean, North Asia, and Oceania/Pacific Islands markets with our complete portfolio of diverse, globally accepted quality products. It allowed us to maximize our sales resources and manufacturing capabilities in order to better serve our established distributors and retail partners in existing markets, as well as to penetrate and explore opportunities in new markets.
UAE
Oman
Qatar
Bahrain
SaudiArabia
KuwaitIraq
Israel
LebanonCyprusItaly
Spain
Holland
UnitedKingdom
NorwayRussia
Mongolia
China S. Korea
Japan
Taiwan
Brunei
Guam
Palau
Saipan
MarshallIslands
PapuaNew Guinea
SolomonIslands
FIJIIslandVanuatu
New Caledonia
New Zealand
Australia
USA
AmericanSamoa
Apia,WesternSamoa
Tonga
Canada
About URC | Geographic Presence

Annual Report 2019
StrategyUpdates

Strategy Updates
People & PlanetFriendly Culture
Product Supply ChainTransform
ationPro
duct
s & B
rand
sPe
ople
Lov
e
Partner of Choice
General Trade: Route-To-Market
Strategy
Natural Resources
Leveraging our Legacy
Modern Trade Key Accounts: Joint Business
Planning
Grow the Core
Expand for More
LEAN Manufacturing
Excellence
Better Sales & Operations
Planning
Supply Network Design (SND)
Our People Our Products
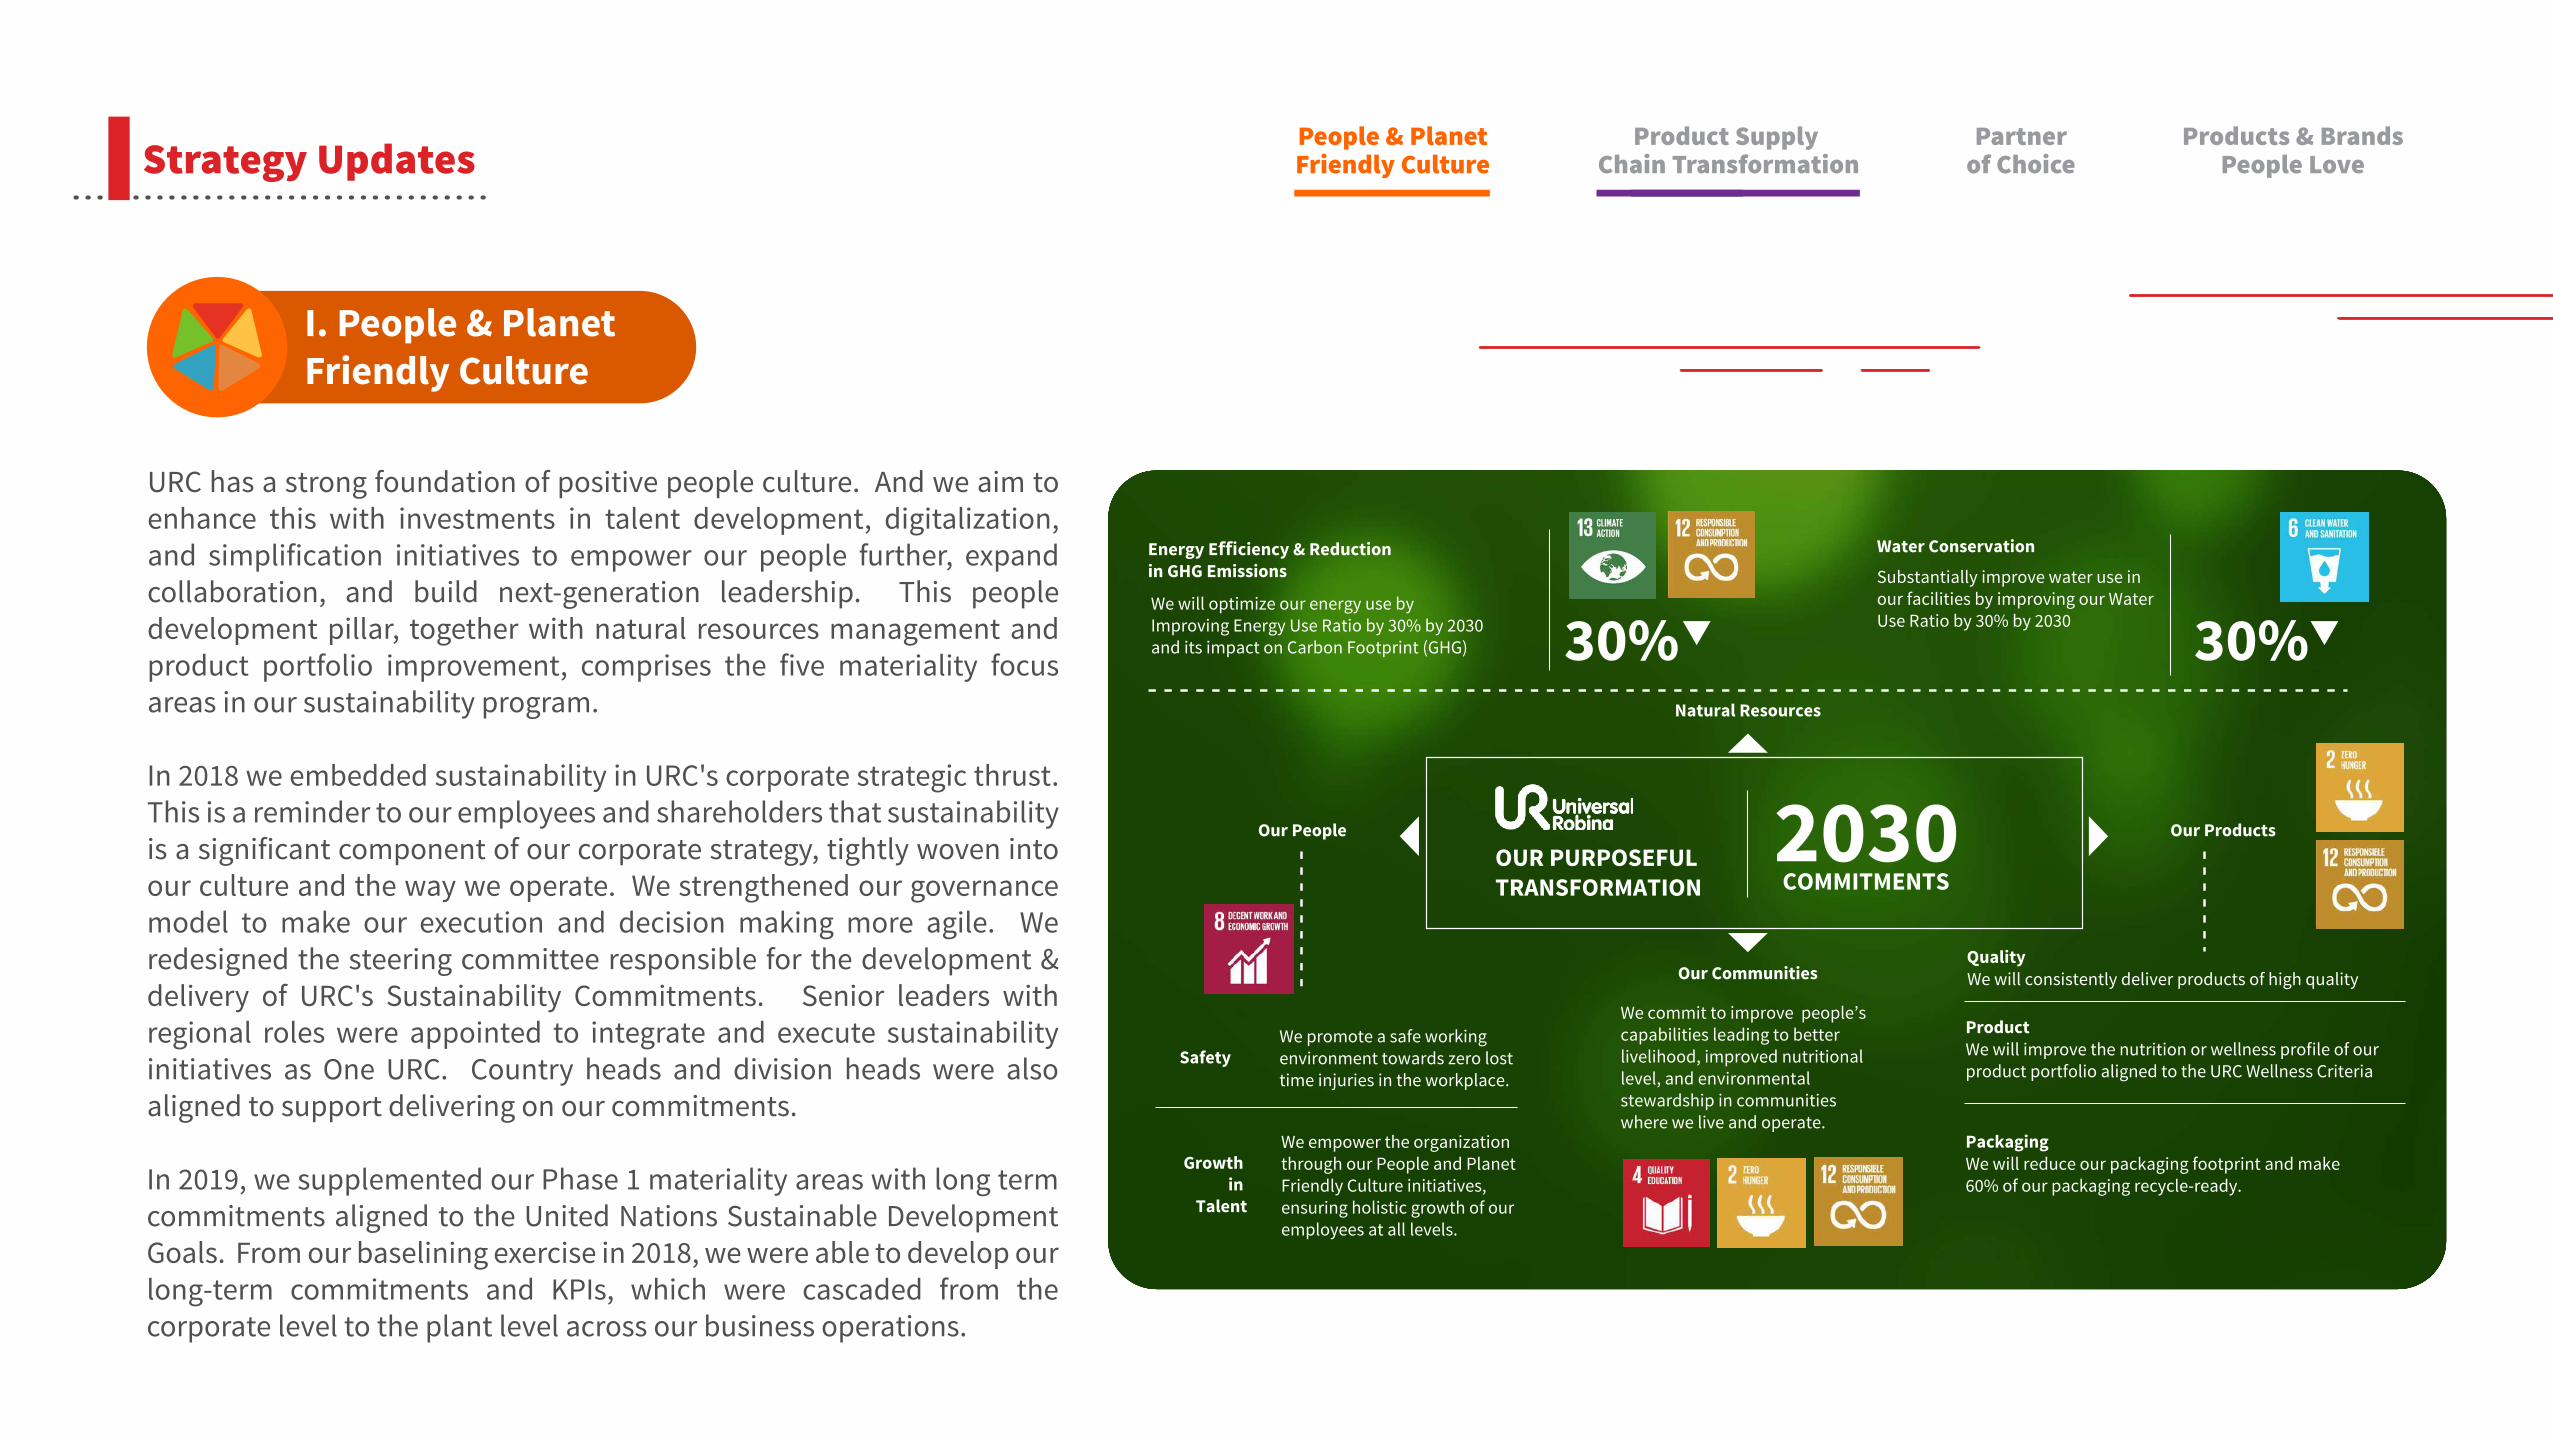
URC has a strong foundation of positive people culture. And we aim to enhance this with investments in talent development, digitalization, and simplification initiatives to empower our people further, expand collaboration, and build next-generation leadership. This people development pillar, together with natural resources management and product portfolio improvement, comprises the five materiality focus areas in our sustainability program.
In 2018 we embedded sustainability in URC's corporate strategic thrust. This is a reminder to our employees and shareholders that sustainability is a significant component of our corporate strategy, tightly woven into our culture and the way we operate. We strengthened our governance model to make our execution and decision making more agile. We redesigned the steering committee responsible for the development & delivery of URC's Sustainability Commitments. Senior leaders with regional roles were appointed to integrate and execute sustainability initiatives as One URC. Country heads and division heads were also aligned to support delivering on our commitments.
In 2019, we supplemented our Phase 1 materiality areas with long term commitments aligned to the United Nations Sustainable Development Goals. From our baselining exercise in 2018, we were able to develop our long-term commitments and KPIs, which were cascaded from the corporate level to the plant level across our business operations.
I. People & Planet Friendly Culture
Product Supply Chain Transformation
Partnerof Choice
Products & BrandsPeople Love
People & PlanetFriendly Culture
Natural Resources
Our People Our Products
SafetyWe promote a safe working environment towards zero lost time injuries in the workplace.
Growth in
Talent
We empower the organization through our People and Planet Friendly Culture initiatives, ensuring holistic growth of our employees at all levels.
We will optimize our energy use by Improving Energy Use Ratio by 30% by 2030 and its impact on Carbon Footprint (GHG)
Energy Efficiency & Reduction in GHG Emissions
30% 30%
Water Conservation
Substantially improve water use in our facilities by improving our Water Use Ratio by 30% by 2030
OUR PURPOSEFULTRANSFORMATION COMMITMENTS
2030Our Communities
We commit to improve people’s capabilities leading to better livelihood, improved nutritional level, and environmental stewardship in communities where we live and operate.
QualityWe will consistently deliver products of high quality
ProductWe will improve the nutrition or wellness profile of our product portfolio aligned to the URC Wellness Criteria
PackagingWe will reduce our packaging footprint and make 60% of our packaging recycle-ready.
Strategy Updates

We also started our LIVE SUSTAINABILITY. LIVE URC campaign to cascade our sustainability strategy across our operations in that eventually led to organic execution across our businesses. This led to the following progress in Natural Resources, People, and Products materiality areas, along with its impact towards the United Nations Sustainable Development Goals.
PARMS (Philippine Alliance for Recycling and Material Sustainability)
Live Sustainability. Live URCOur Execution Phase
Live Sustainability is our commitment to making life better by integrating Sustainability in
everything we do. This is a platform to drive sustainable growth, champion innovation, promote mutual stake holders’ success and
nurture environmental stewardship
Upli� Lives
Engaging our Communities
EducationPeople
VIP: Volunteer & make an impact program
FlourishPilipinas
Kabalikat Programs
Iskolar ni Juan
Live Up
Our Products
Live Right
Love Our Products
Natural Resources
Live Clean
Save The Planet
SAGANASustansiyaProgram
SustainablePotatoProgram
Culture of Safety PET RecyclingFacility
Convert this plastic waste into usable fuel, thereby making non-biodegradable material finally, truly recyclable.
1. URC Circular Economy Initiative2. Waste analysis & Characterization assessment
-
Strategy UpdatesProduct Supply
Chain TransformationPartner
of ChoiceProducts & Brands
People LovePeople & PlanetFriendly Culture
Natural Resources
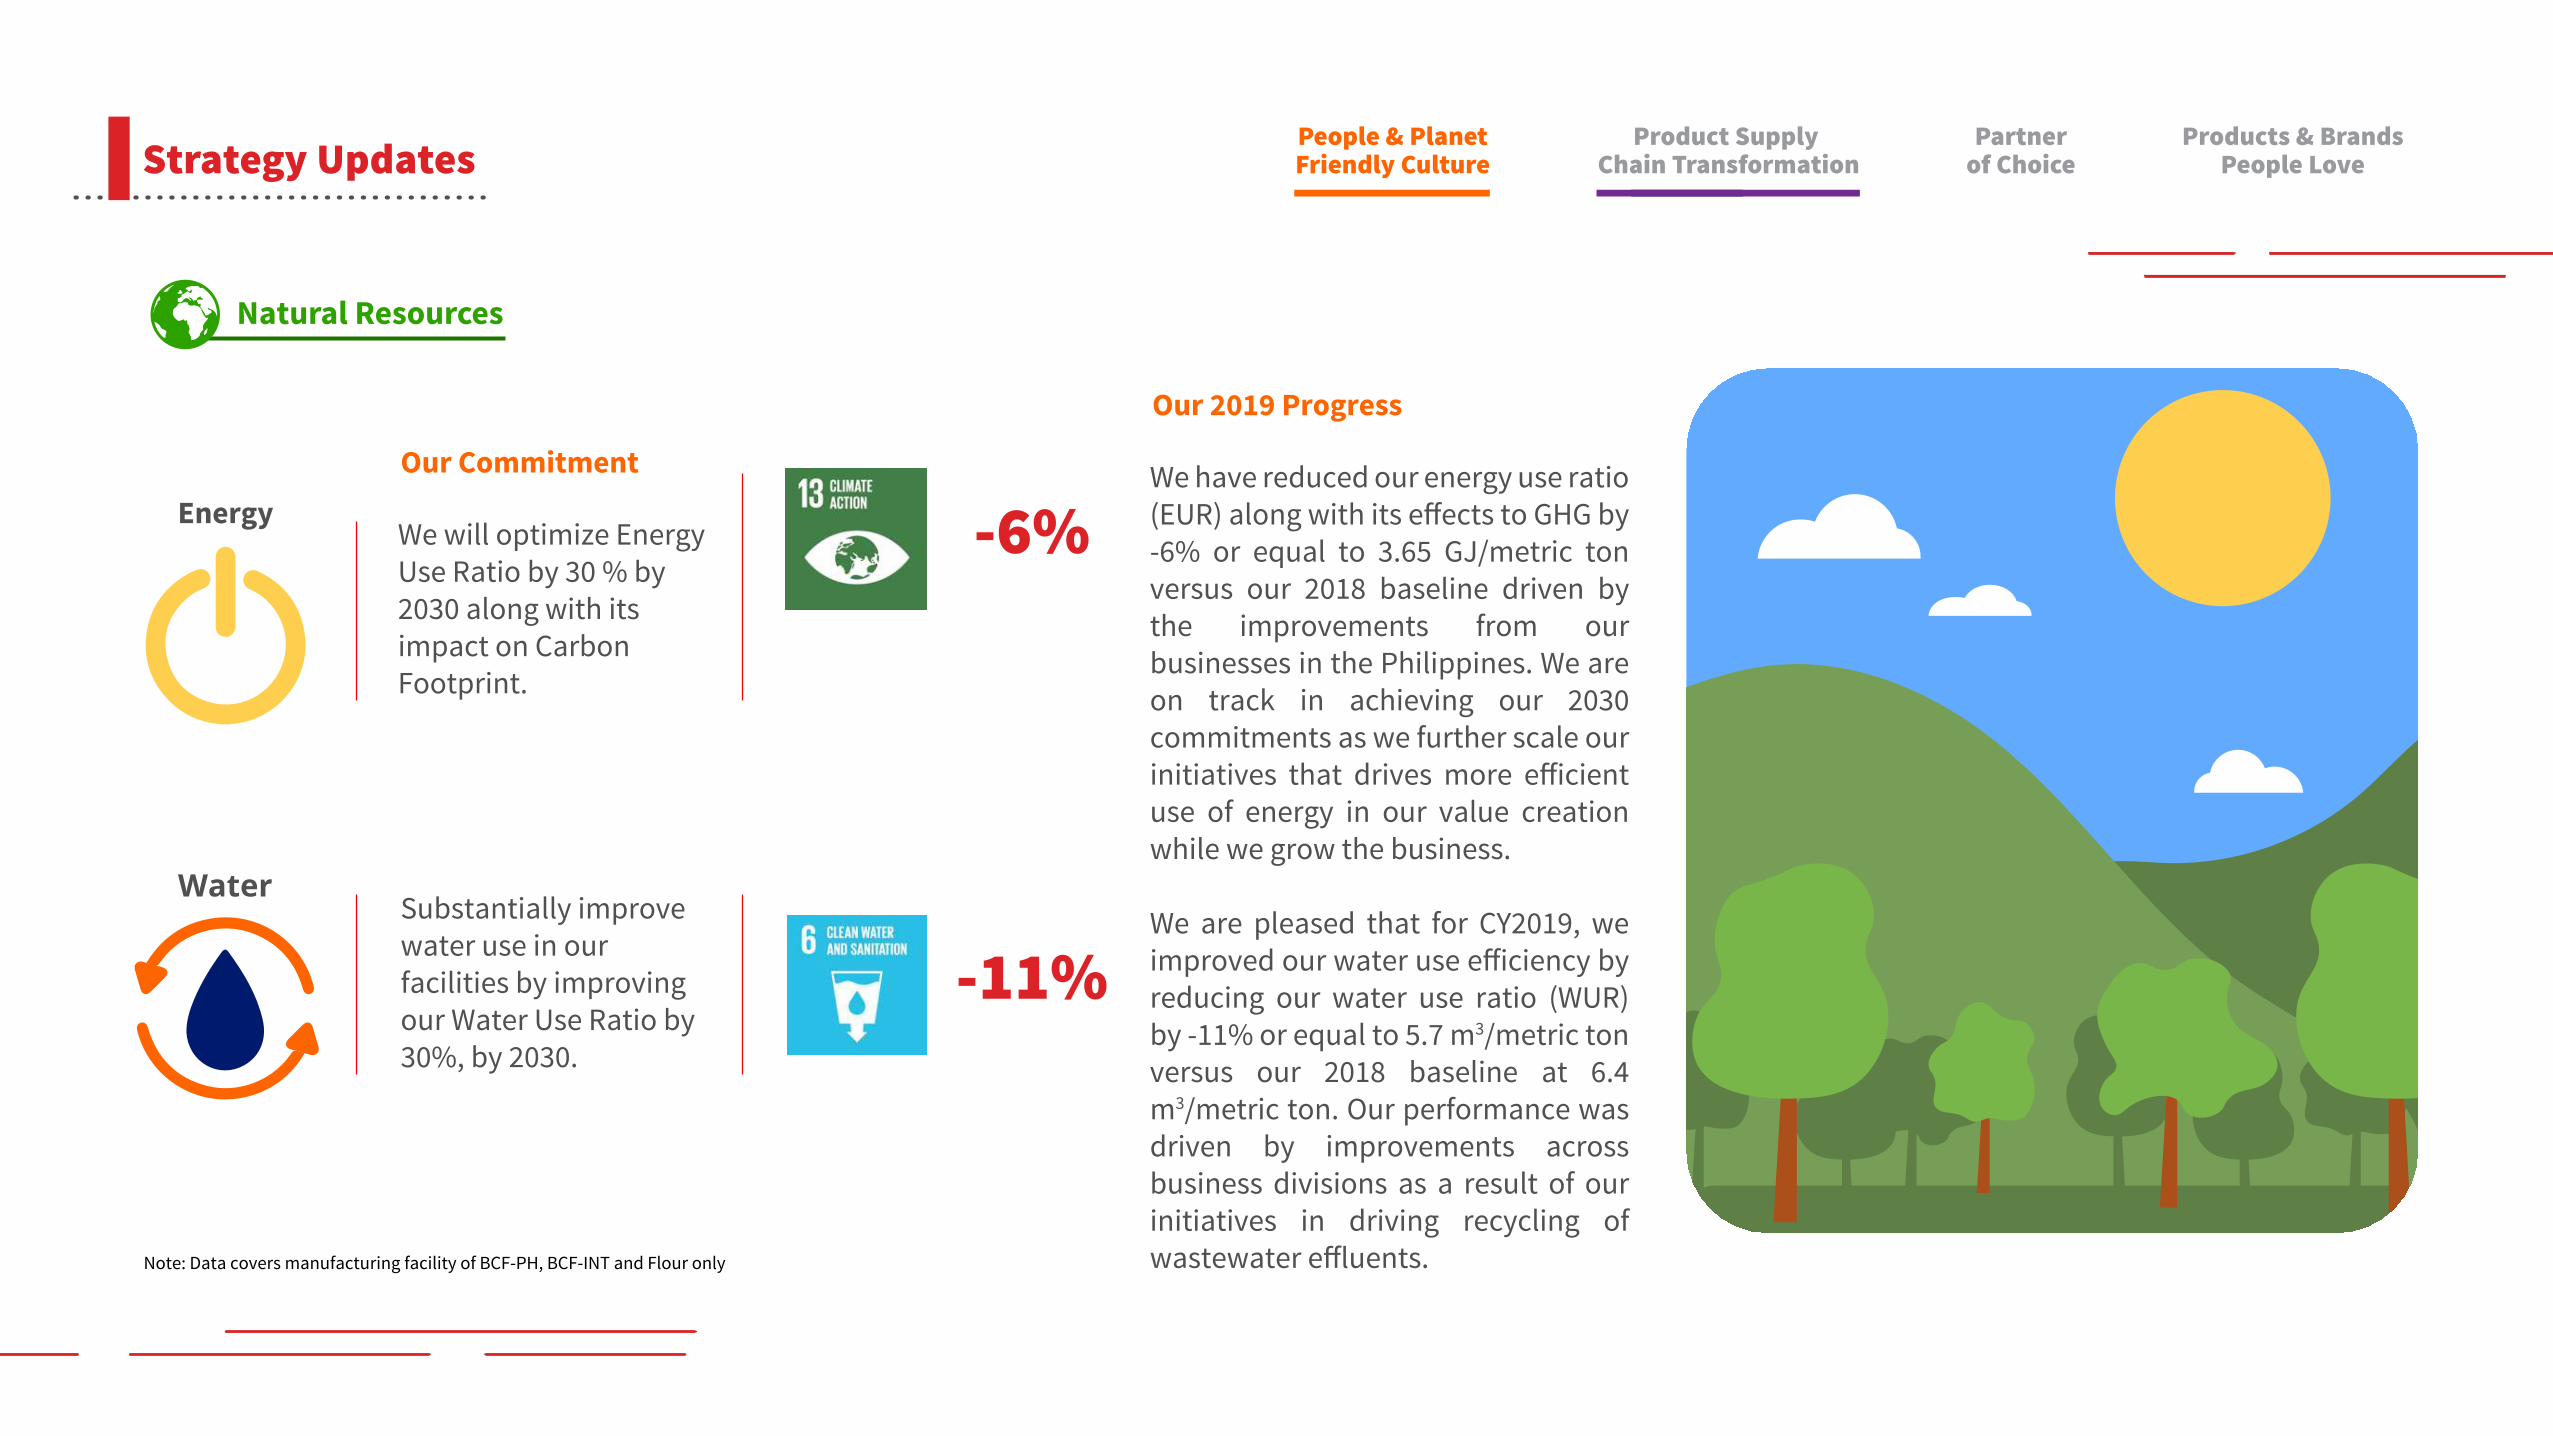
Our 2019 Progress
We have reduced our energy use ratio (EUR) along with its e�ects to GHG by -6% or equal to 3.65 GJ/metric ton versus our 2018 baseline driven by the improvements from our businesses in the Philippines. We are on track in achieving our 2030 commitments as we further scale our initiatives that drives more e�icient use of energy in our value creation while we grow the business.
We are pleased that for CY2019, we improved our water use e�iciency by reducing our water use ratio (WUR) by -11% or equal to 5.7 m3/metric ton versus our 2018 baseline at 6.4 m3/metric ton. Our performance was driven by improvements across business divisions as a result of our initiatives in driving recycling of wastewater e�luents.
EnergyOur Commitment
We will optimize Energy Use Ratio by 30 % by 2030 along with its impact on Carbon Footprint.
Substantially improve water use in our facilities by improving our Water Use Ratio by 30%, by 2030.
Water
-6%
-11%
Note: Data covers manufacturing facility of BCF-PH, BCF-INT and Flour only
Strategy UpdatesProduct Supply
Chain TransformationPartner
of ChoiceProducts & Brands
People LovePeople & PlanetFriendly Culture
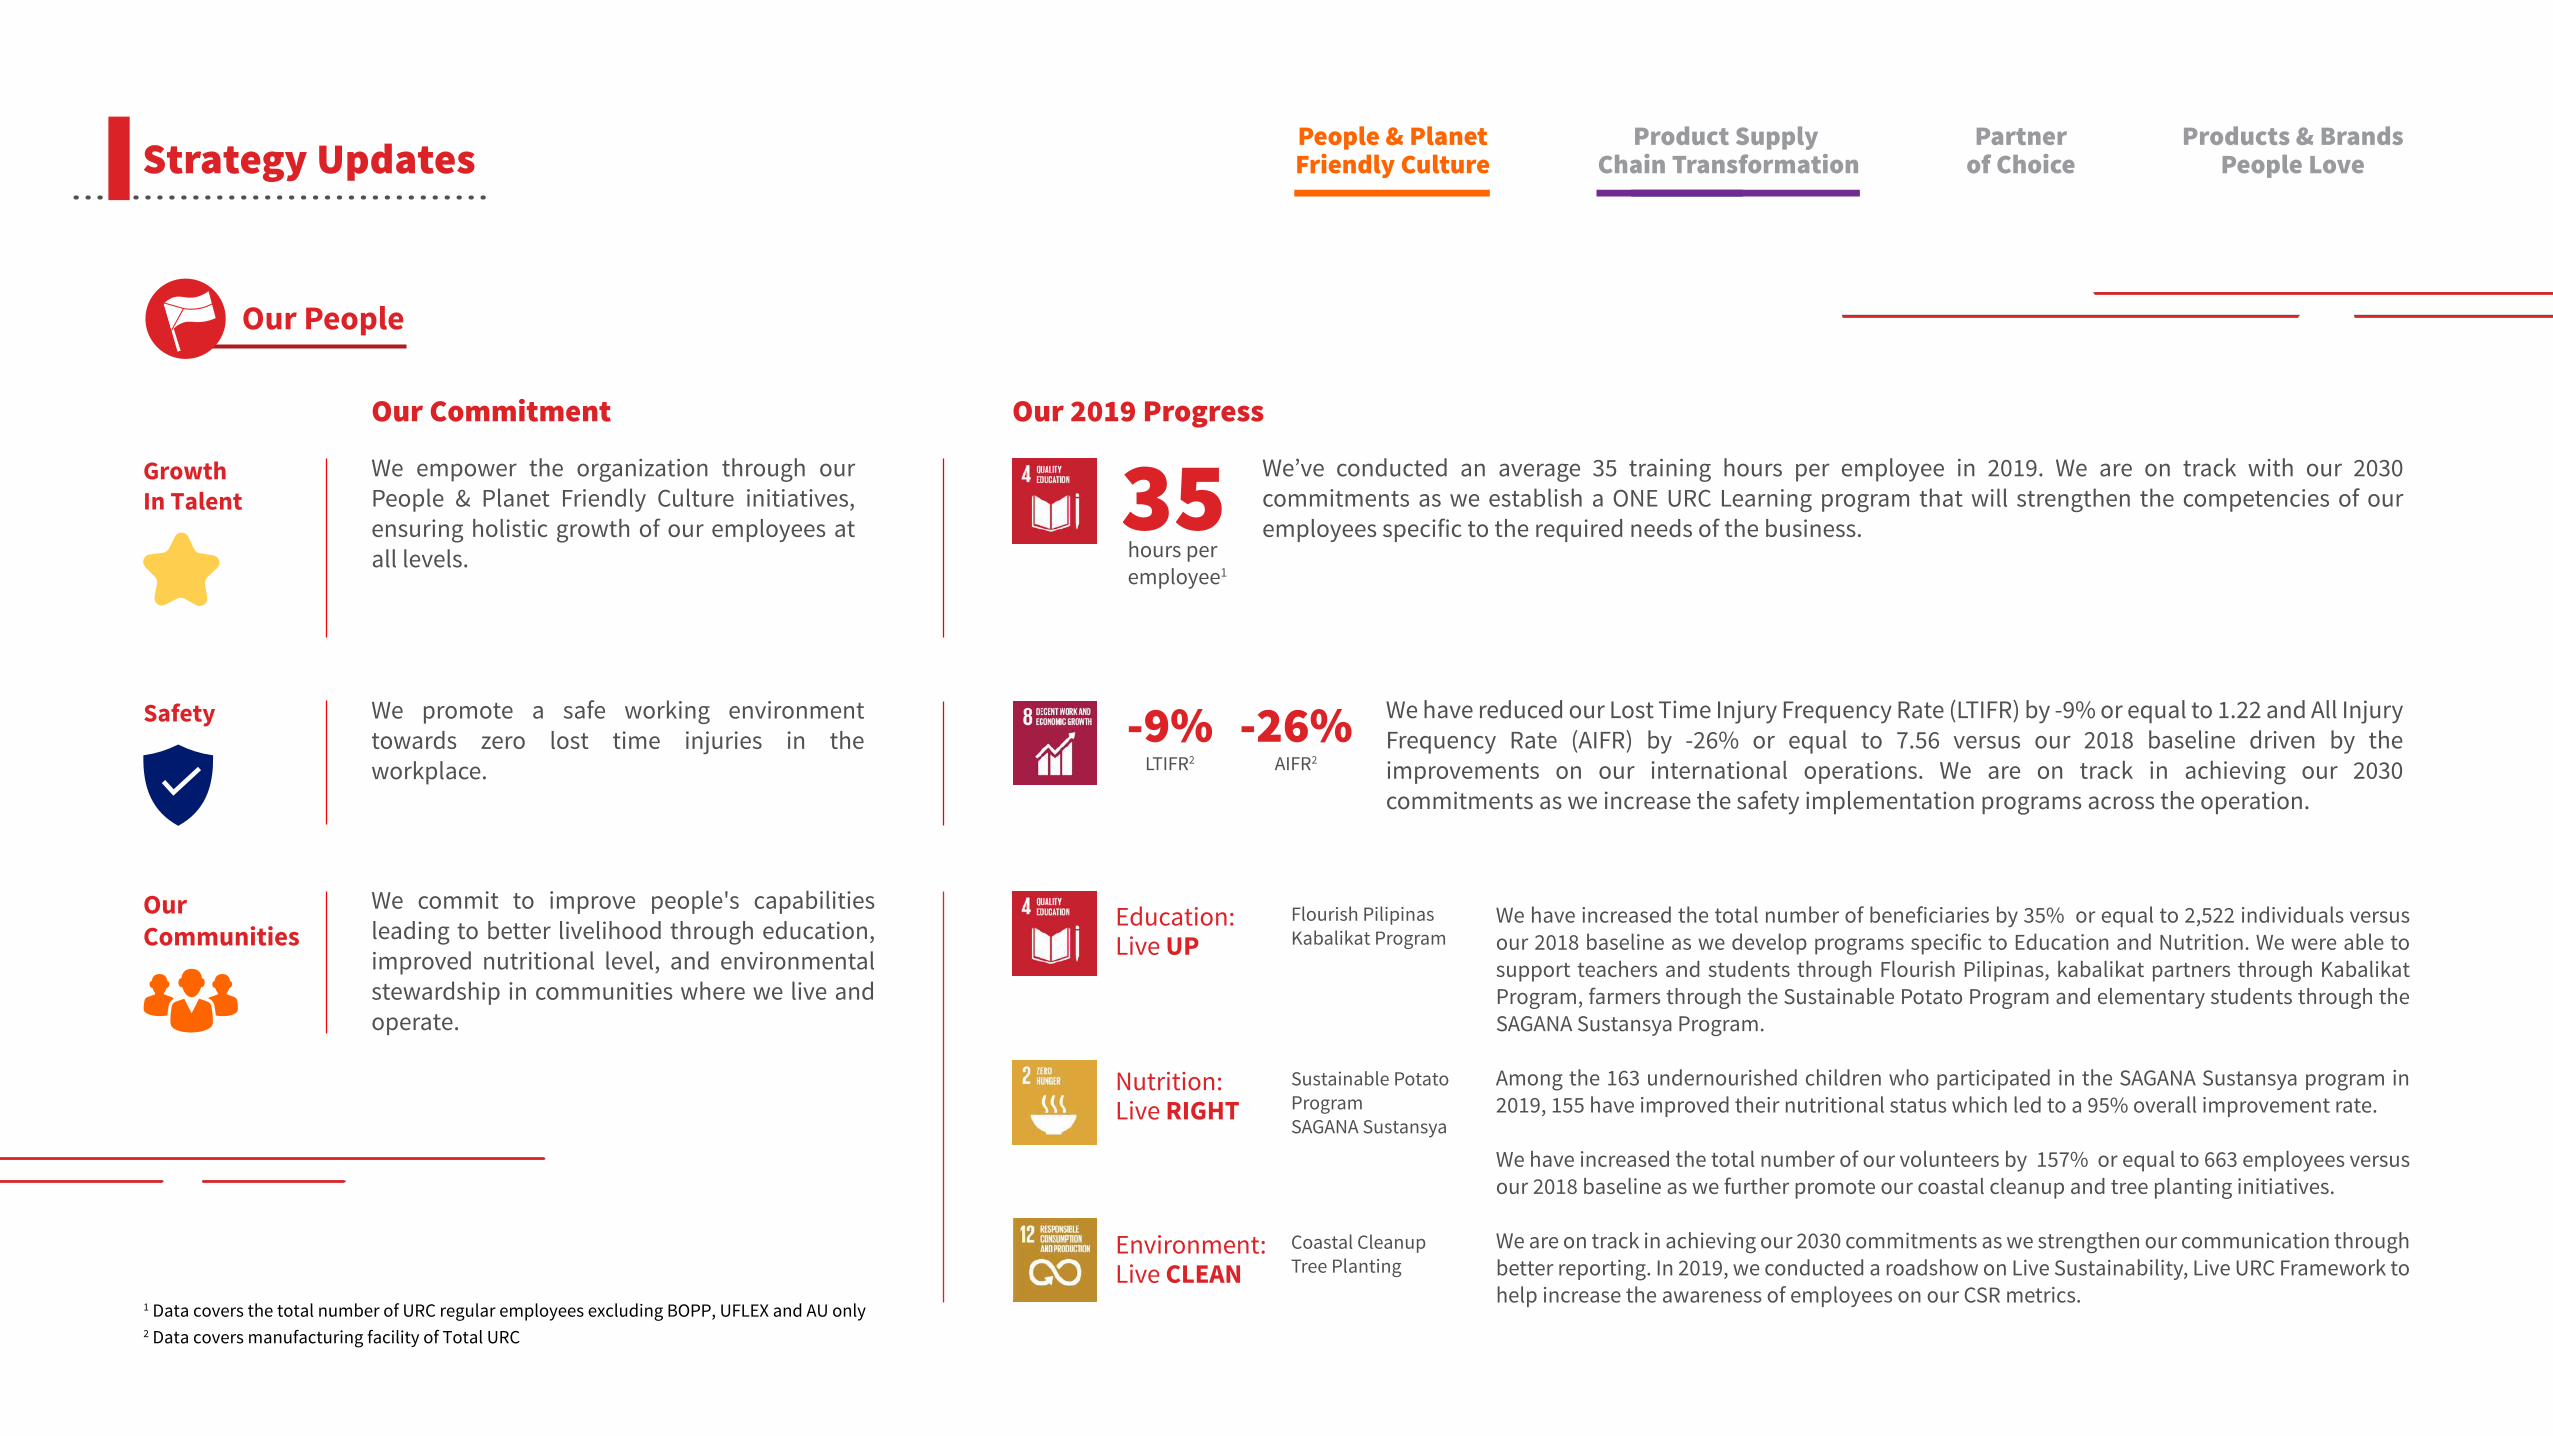
Our People
2 Data covers manufacturing facility of Total URC
1 Data covers the total number of URC regular employees excluding BOPP, UFLEX and AU only
Our Commitment
GrowthIn Talent
We empower the organization through our People & Planet Friendly Culture initiatives, ensuring holistic growth of our employees at all levels.
We commit to improve people's capabilities leading to better livelihood through education, improved nutritional level, and environmental stewardship in communities where we live and operate.
Our Communities
We have increased the total number of beneficiaries by 35% or equal to 2,522 individuals versus our 2018 baseline as we develop programs specific to Education and Nutrition. We were able to support teachers and students through Flourish Pilipinas, kabalikat partners through Kabalikat Program, farmers through the Sustainable Potato Program and elementary students through the SAGANA Sustansya Program.
Among the 163 undernourished children who participated in the SAGANA Sustansya program in 2019, 155 have improved their nutritional status which led to a 95% overall improvement rate.
We have increased the total number of our volunteers by 157% or equal to 663 employees versus our 2018 baseline as we further promote our coastal cleanup and tree planting initiatives.
We are on track in achieving our 2030 commitments as we strengthen our communication through better reporting. In 2019, we conducted a roadshow on Live Sustainability, Live URC Framework to help increase the awareness of employees on our CSR metrics.
Our 2019 Progress
Education:Live UP
Flourish PilipinasKabalikat Program
Coastal CleanupTree Planting
Sustainable Potato Program SAGANA Sustansya
Environment:Live CLEAN
Nutrition:Live RIGHT
We’ve conducted an average 35 training hours per employee in 2019. We are on track with our 2030 commitments as we establish a ONE URC Learning program that will strengthen the competencies of our employees specific to the required needs of the business.
hours per employee1
35
We promote a safe working environment towards zero lost time injuries in the workplace.
Safety We have reduced our Lost Time Injury Frequency Rate (LTIFR) by -9% or equal to 1.22 and All Injury Frequency Rate (AIFR) by -26% or equal to 7.56 versus our 2018 baseline driven by the improvements on our international operations. We are on track in achieving our 2030 commitments as we increase the safety implementation programs across the operation.
LTIFR2
-9%AIFR2
-26%
Strategy UpdatesProduct Supply
Chain TransformationPartner
of ChoiceProducts & Brands
People LovePeople & PlanetFriendly Culture
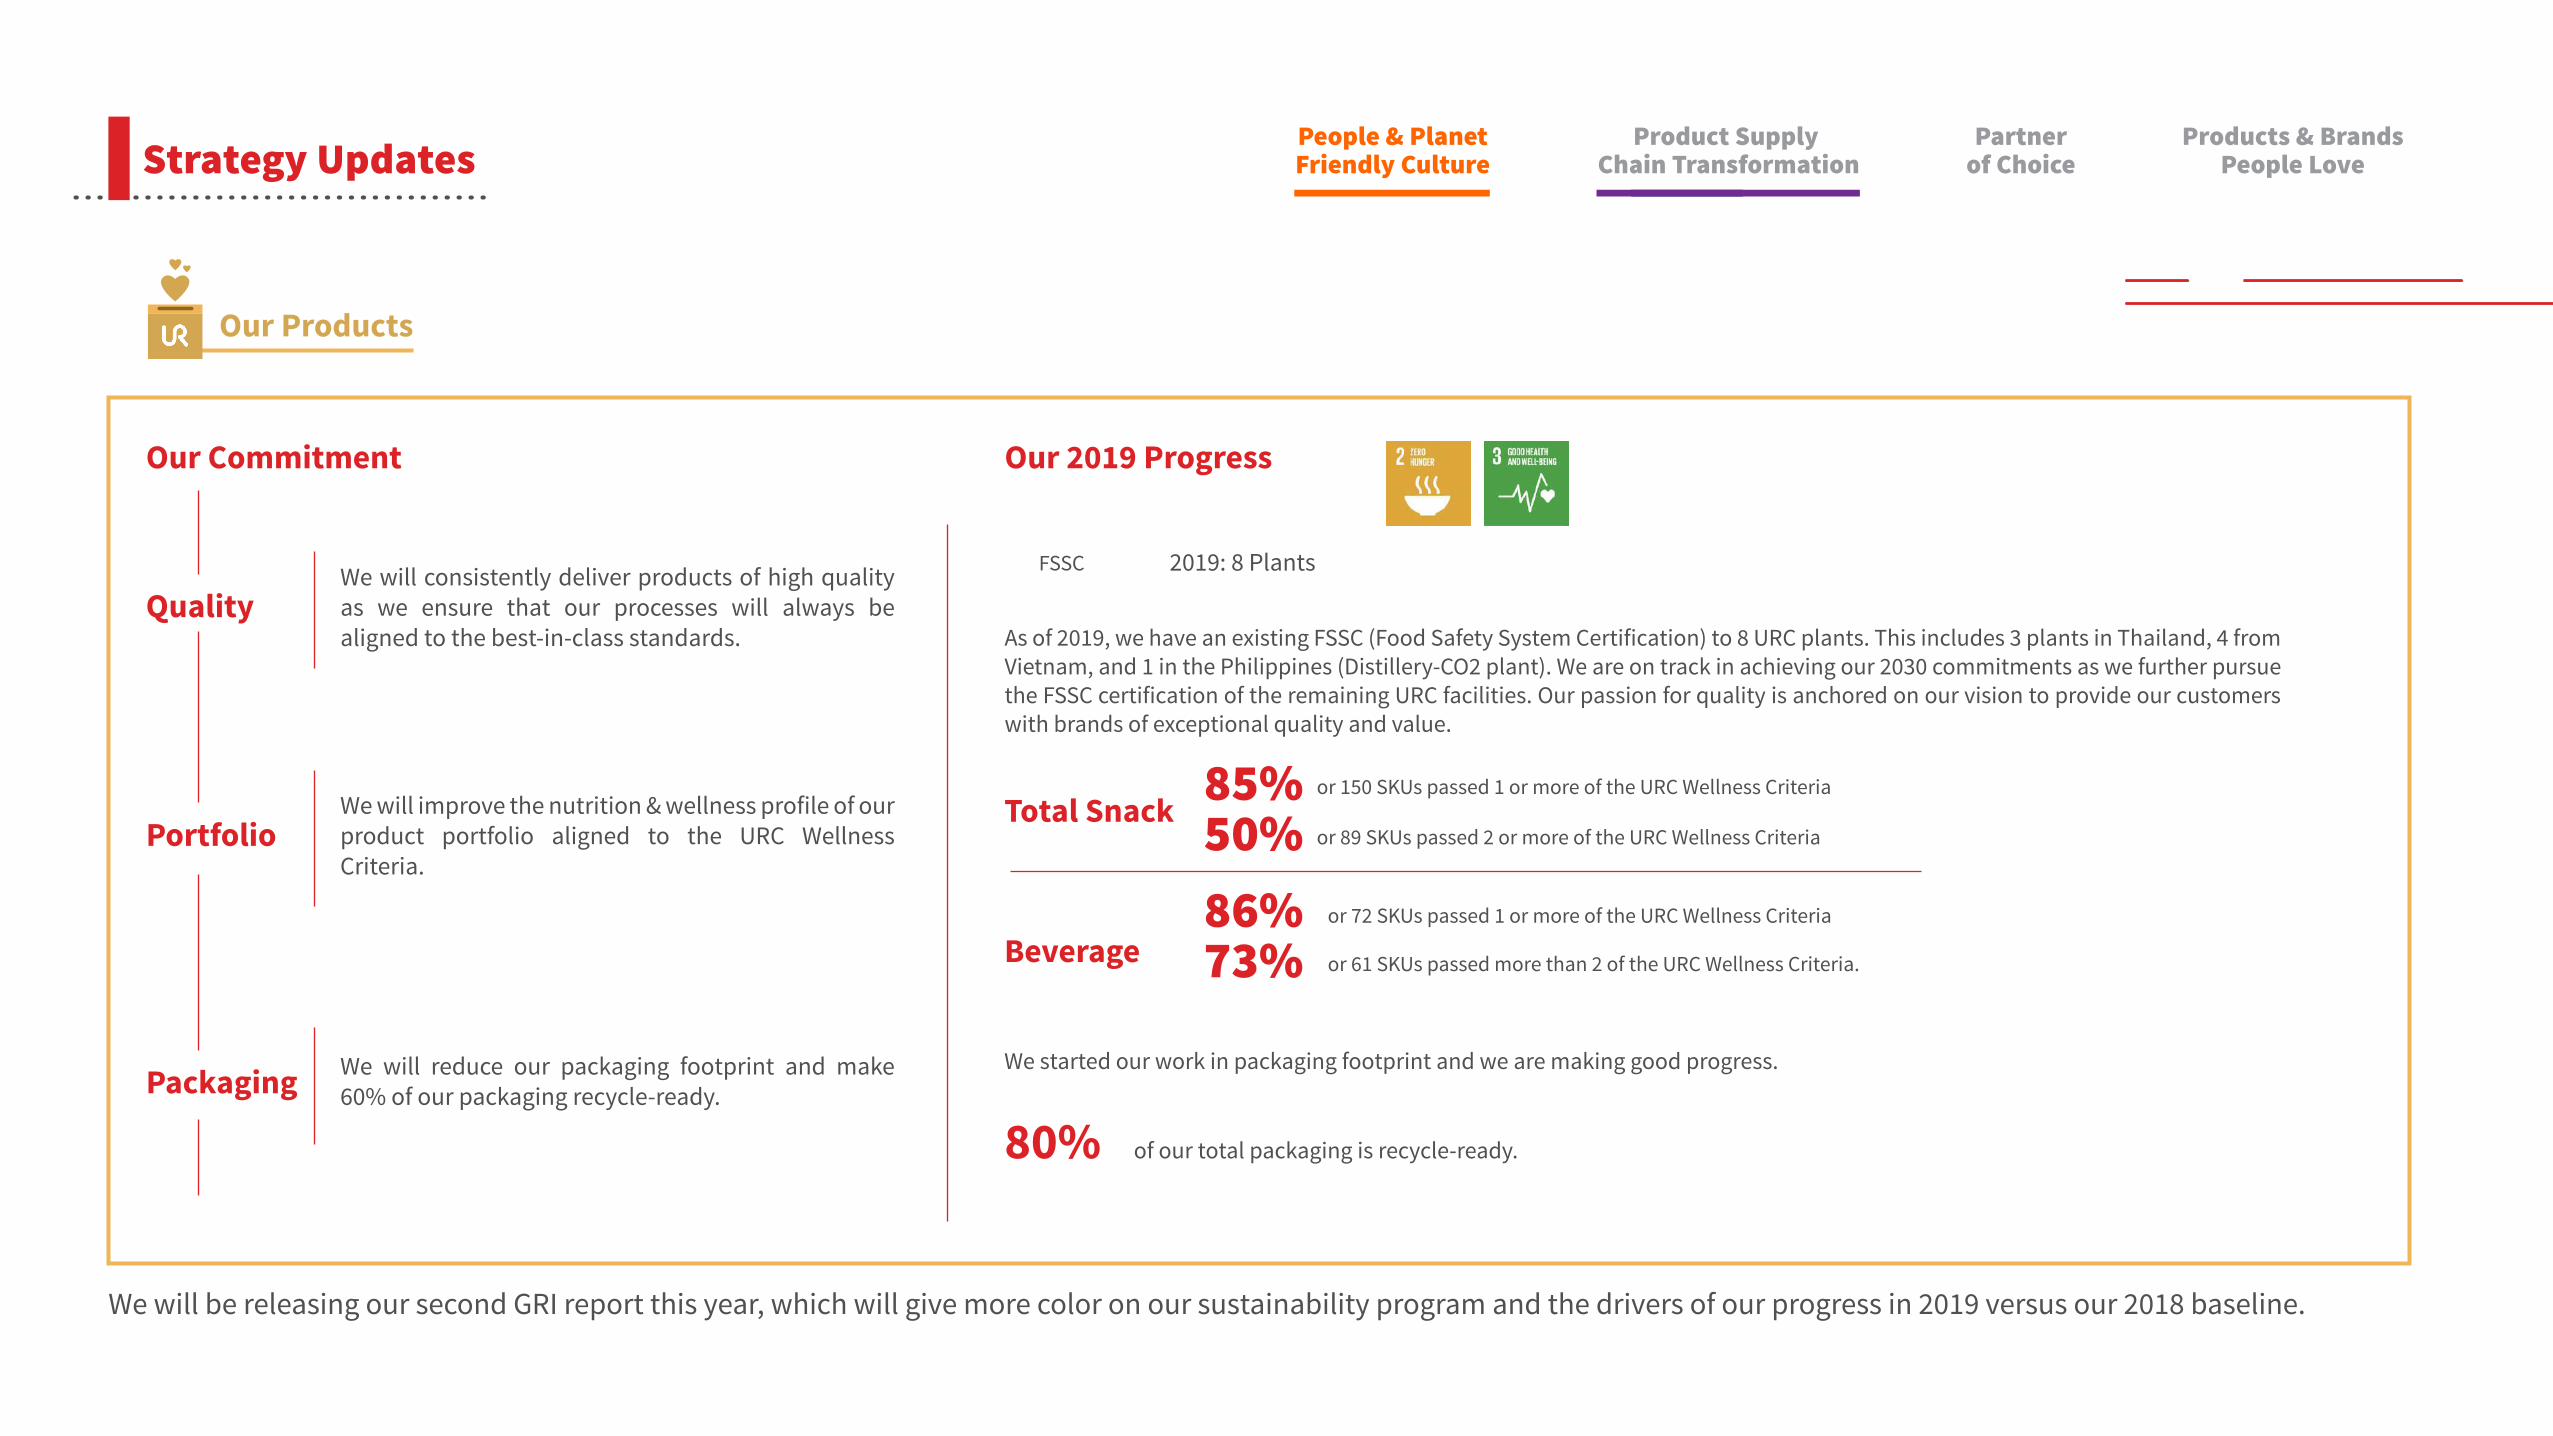
As of 2019, we have an existing FSSC (Food Safety System Certification) to 8 URC plants. This includes 3 plants in Thailand, 4 from Vietnam, and 1 in the Philippines (Distillery-CO2 plant). We are on track in achieving our 2030 commitments as we further pursue the FSSC certification of the remaining URC facilities. Our passion for quality is anchored on our vision to provide our customers with brands of exceptional quality and value.
We started our work in packaging footprint and we are making good progress.
80% of our total packaging is recycle-ready.
Our 2019 Progress
Total Snack
FSSC 2019: 8 Plants
or 150 SKUs passed 1 or more of the URC Wellness Criteria85%or 89 SKUs passed 2 or more of the URC Wellness Criteria50%
Beverageor 72 SKUs passed 1 or more of the URC Wellness Criteria86%or 61 SKUs passed more than 2 of the URC Wellness Criteria. 73%
We will consistently deliver products of high quality as we ensure that our processes will always be aligned to the best-in-class standards.
We will improve the nutrition & wellness profile of our product portfolio aligned to the URC Wellness Criteria.
We will reduce our packaging footprint and make 60% of our packaging recycle-ready.
Our Commitment
Quality
Portfolio
Packaging
We will be releasing our second GRI report this year, which will give more color on our sustainability program and the drivers of our progress in 2019 versus our 2018 baseline.
Our Products
Strategy UpdatesProduct Supply
Chain TransformationPartner
of ChoiceProducts & Brands
People LovePeople & PlanetFriendly Culture
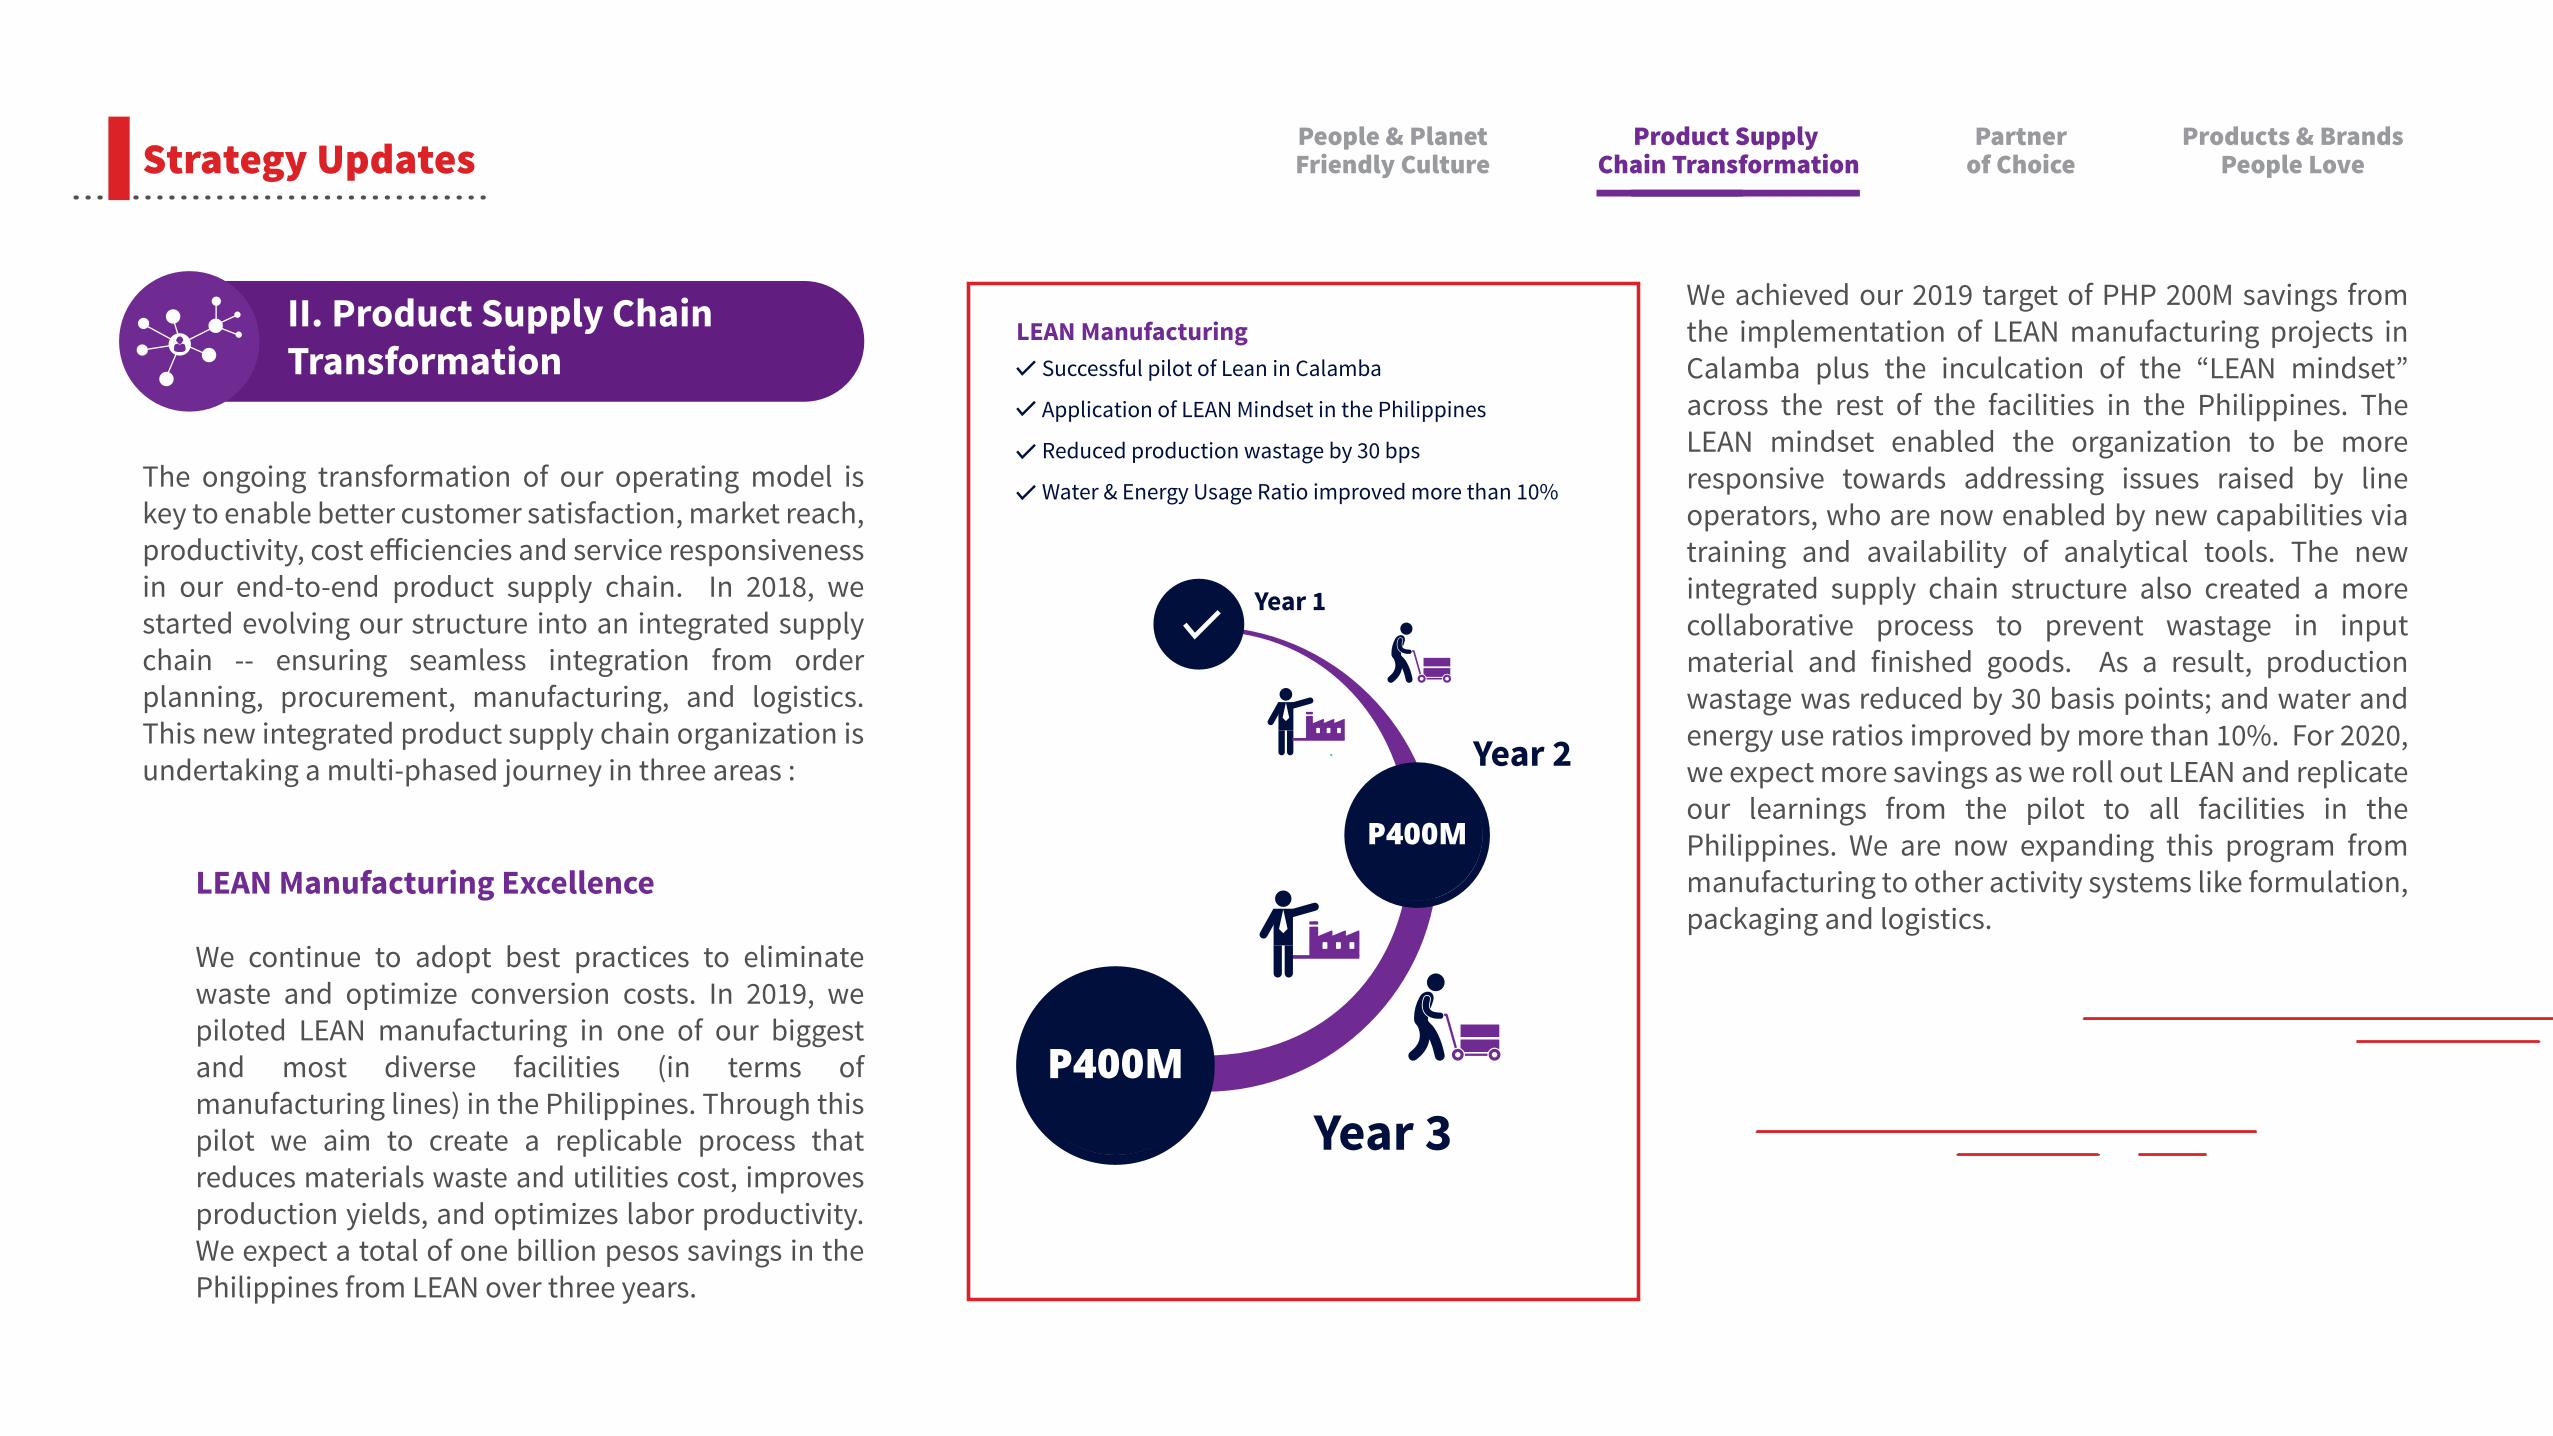
The ongoing transformation of our operating model is key to enable better customer satisfaction, market reach, productivity, cost e�iciencies and service responsiveness in our end-to-end product supply chain. In 2018, we started evolving our structure into an integrated supply chain -- ensuring seamless integration from order planning, procurement, manufacturing, and logistics. This new integrated product supply chain organization is undertaking a multi-phased journey in three areas :
LEAN Manufacturing Excellence
We continue to adopt best practices to eliminate waste and optimize conversion costs. In 2019, we piloted LEAN manufacturing in one of our biggest and most diverse facilities (in terms of manufacturing lines) in the Philippines. Through this pilot we aim to create a replicable process that reduces materials waste and utilities cost, improves production yields, and optimizes labor productivity. We expect a total of one billion pesos savings in the Philippines from LEAN over three years.
LEAN ManufacturingSuccessful pilot of Lean in Calamba
Application of LEAN Mindset in the Philippines
Reduced production wastage by 30 bps
Water & Energy Usage Ratio improved more than 10%
P400M
P400M
Year 1
Year 2
Year 3
We achieved our 2019 target of PHP 200M savings from the implementation of LEAN manufacturing projects in Calamba plus the inculcation of the “LEAN mindset” across the rest of the facilities in the Philippines. The LEAN mindset enabled the organization to be more responsive towards addressing issues raised by line operators, who are now enabled by new capabilities via training and availability of analytical tools. The new integrated supply chain structure also created a more collaborative process to prevent wastage in input material and finished goods. As a result, production wastage was reduced by 30 basis points; and water and energy use ratios improved by more than 10%. For 2020, we expect more savings as we roll out LEAN and replicate our learnings from the pilot to all facilities in the Philippines. We are now expanding this program from manufacturing to other activity systems like formulation, packaging and logistics.
II. Product Supply Chain Transformation
Strategy UpdatesProduct Supply
Chain TransformationPartner
of ChoiceProducts & Brands
People LovePeople & PlanetFriendly Culture
Better Sales & Operations Planning
Prior to the establishment of our integrated supply chain structure, URC’s complexities over time led to siloed operations and discrepancies in operations planning information management. Demand forecasting, materials and production planning, transport and logistics were fragmented and di�icult to coordinate. This resulted to inaccuracies in customer order fulfillment and low enterprise order fill rate.
In 2019 we transformed our sales and operations planning governance. Collaboration and process discipline were significantly improved, and forecast coordination across the value chain were aligned. As a result, we significantly improved the timely fulfillment of customer orders and freshness of our products in the market. Our enterprise order fill rate reached as high as 90%+ in the most complex business units, and well over 95% in the simpler SKU line up operations.
Product Supply Chain Transformation
Partnerof Choice
Products & BrandsPeople Love
People & PlanetFriendly CultureStrategy Updates
Product Supply Chain Transformation
Partnerof Choice
Products & BrandsPeople Love
People & PlanetFriendly Culture
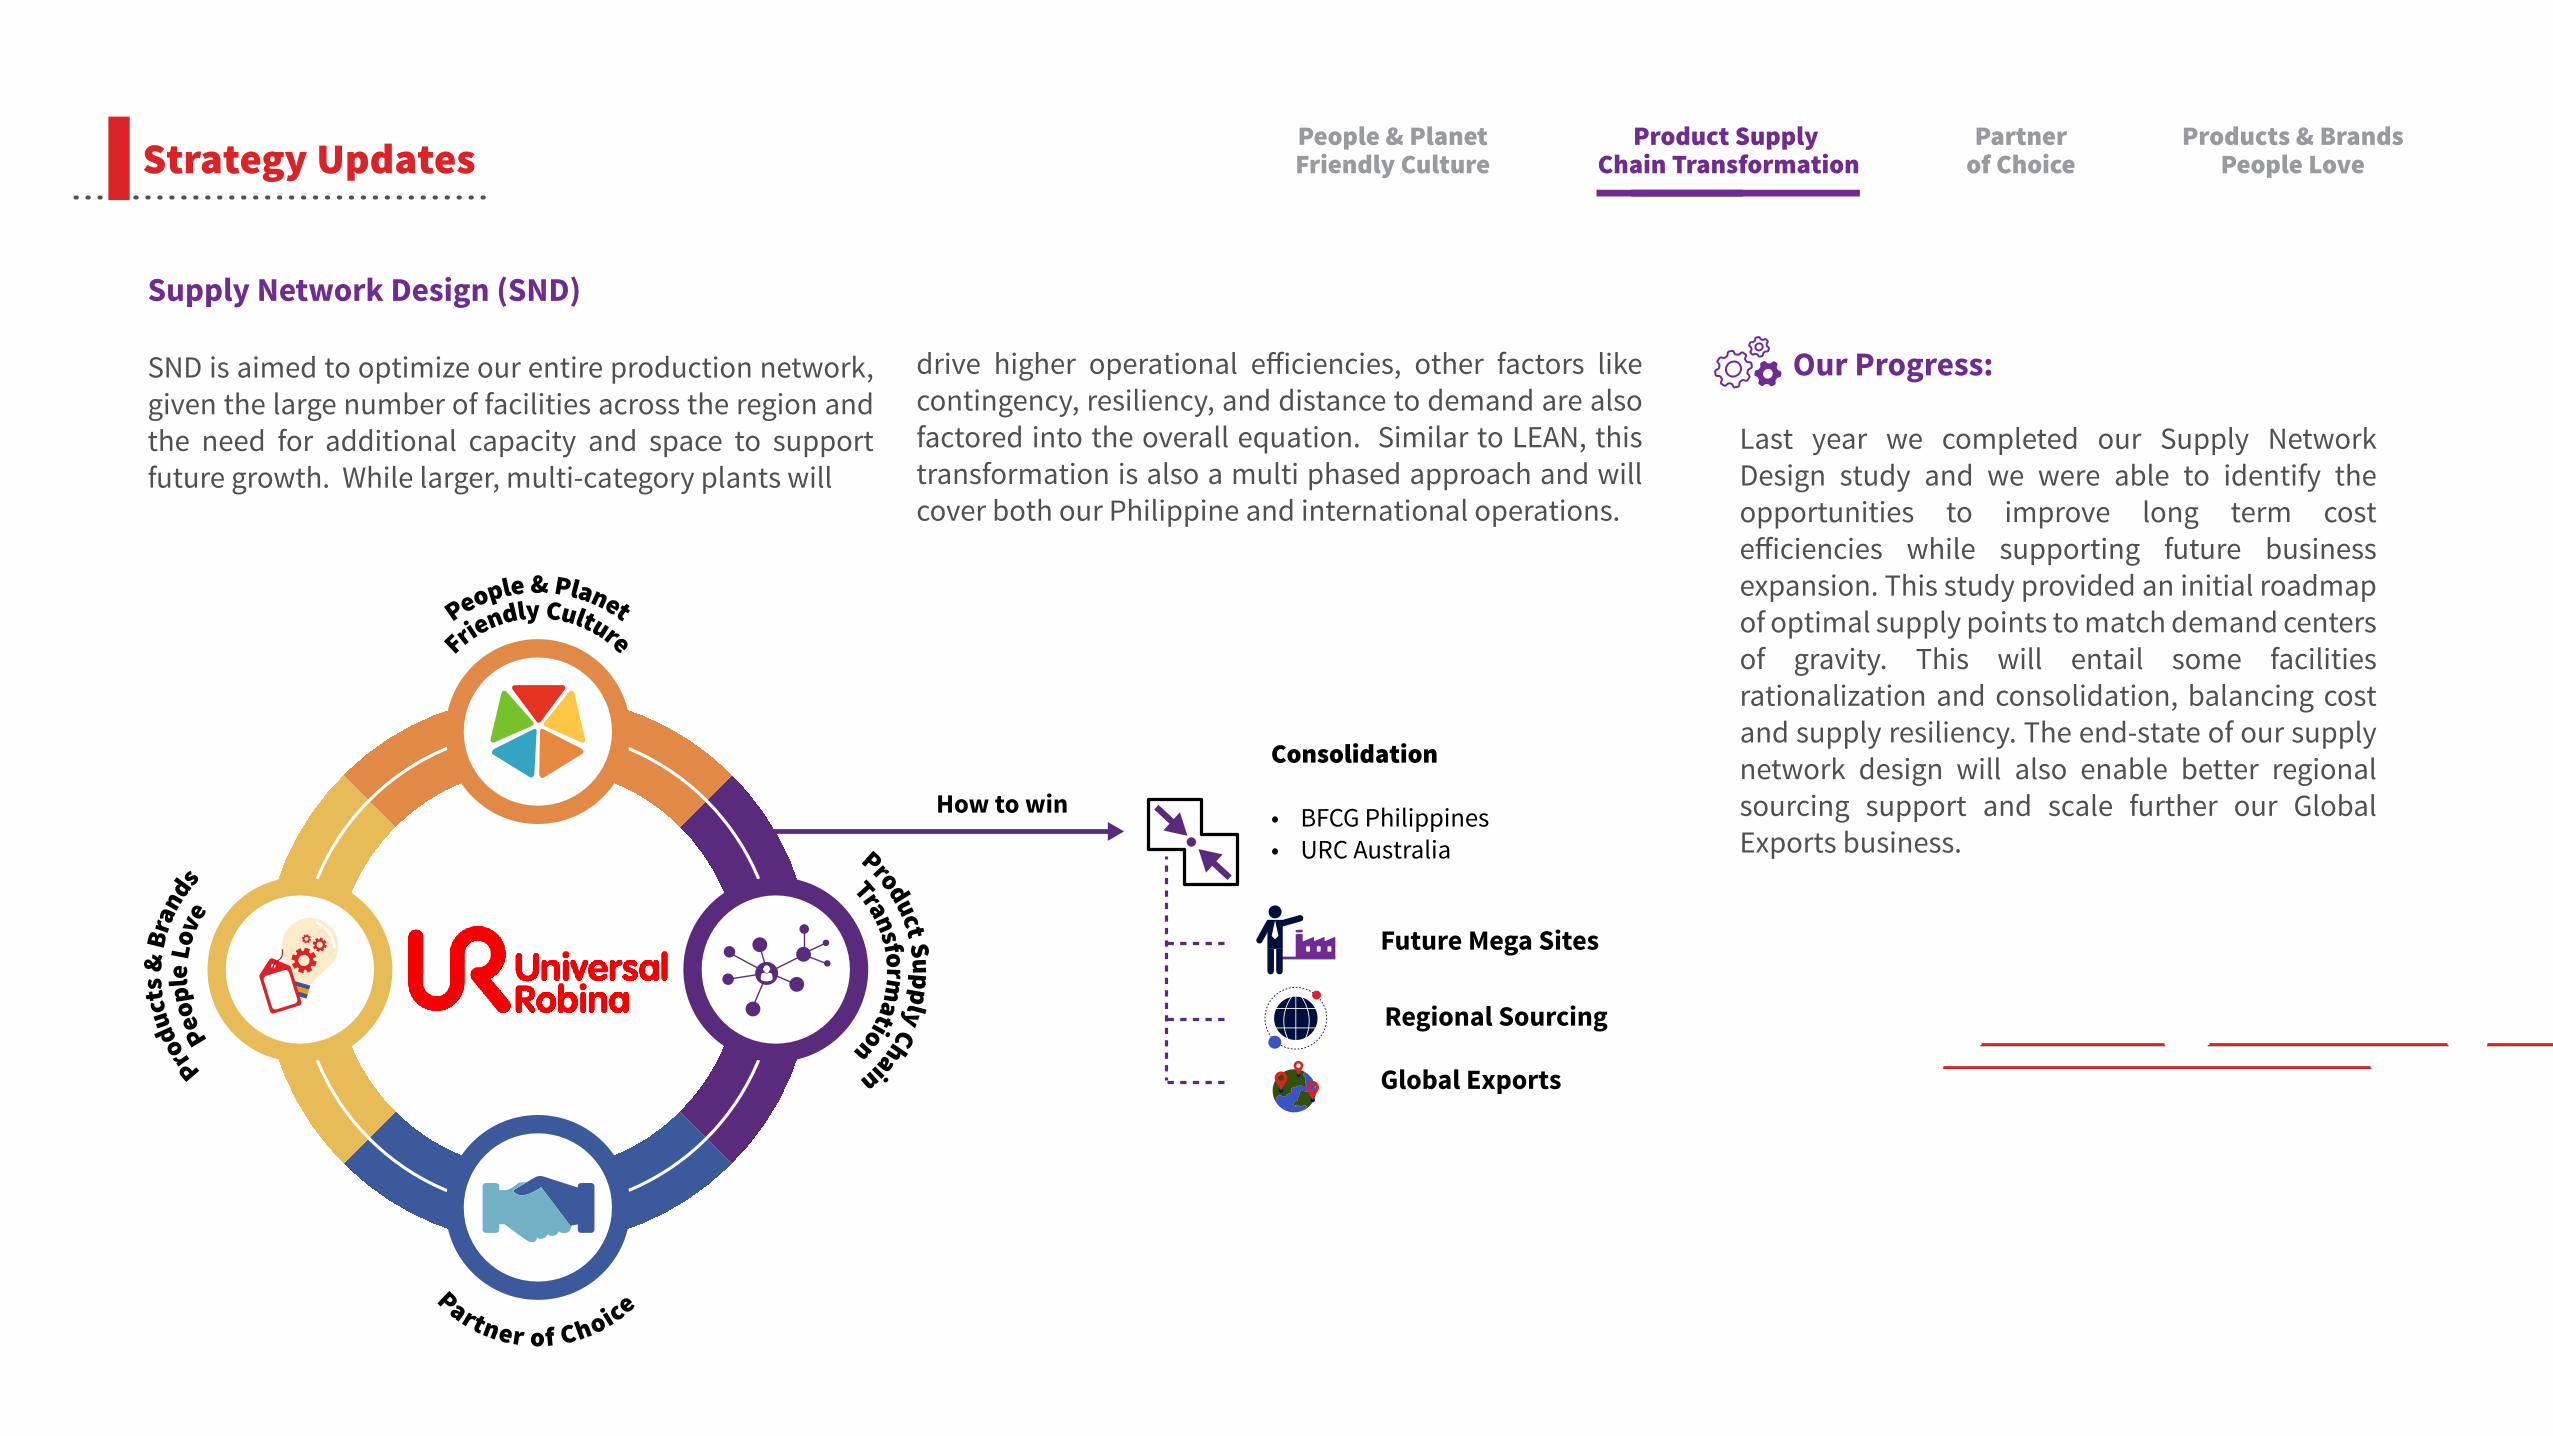
Supply Network Design (SND)
SND is aimed to optimize our entire production network, given the large number of facilities across the region and the need for additional capacity and space to support future growth. While larger, multi-category plants will
drive higher operational e�iciencies, other factors like contingency, resiliency, and distance to demand are also factored into the overall equation. Similar to LEAN, this transformation is also a multi phased approach and will cover both our Philippine and international operations.
Our Progress:
Last year we completed our Supply Network Design study and we were able to identify the opportunities to improve long term cost e�iciencies while supporting future business expansion. This study provided an initial roadmap of optimal supply points to match demand centers of gravity. This will entail some facilities rationalization and consolidation, balancing cost and supply resiliency. The end-state of our supply network design will also enable better regional sourcing support and scale further our Global Exports business.
Strategy Updates
People & PlanetFriendly Culture
Product Supply Chain
Transformation
Produ
cts &
Bra
nds
Peop
le L
ove
Partner of Choice
How to win
Future Mega Sites
Consolidation
• BFCG Philippines• URC Australia
Regional Sourcing
Global Exports

Our decades of experience enabled us to gain capabilities in serving the evolving retail landscape. Our customer engagement along with the wide product o�erings and price points made us one of the biggest suppliers of top retailers today. As we grow the business, we continue to reinvest in capabilities that will drive scale and e�iciency in our distribution and account management, as well as supplier base development. We aim to be a strong partner of choice today and the coming years by further raising our collaboration with long term customers and suppliers.
General Trade: Route-To-Market Strategy
Our Route to market strategy focuses on increasing our direct distribution (coverage), better productivity & sales quality (lines sold) driven by consistent perfect store presence like excellent merchandising and quality of product lineup in stores. We piloted a major reinvention of coverage expansion in the Philippines. This has exceeded our initial targets and has contributed significantly to the growth of BCF Philippines.
Modern Trade Key Accounts: Joint Business Planning
As trade dynamics continue to shi� to modern retailers, we made significant investments to step change our engagement with the top modern key accounts across territories. We have re engaged our key customers and drove strategic partnerships through joint business planning. We are reaping the benefit of aggressive growth rates in our key customers as we plan and execute better shopper plans with them. With our continuous customer engagement, we started to be recognized as a preferred supplier by our key customer partners.
As part of this route to market reinvention, we are also building new capabilities. The implementation of Sales Force Automation has been instrumental in driving our vision of leapfrogging our distributor capabilities through digitization. This allowed our distributors to cover more stores in the most e�icient manner. In addition to handheld devices, we also utilized geotagging in both current and prospective outlets to e�ectively monitor our salesman productivity in terms of daily routes as well as monthly acquisition of new direct accounts.
Product Supply Chain Transformation
Products & BrandsPeople Love
People & PlanetFriendly Culture
Partnerof ChoiceStrategy Updates
III. Partner of Choice

In 2018 we established Innovation Process Management (IPM), our platform in our Brand and Products People Love Strategy, that will accelerate our ability to launch new brands. Our direction towards IPM is to strengthen our insighting processes to drive new product development and renovations of existing brands without compromising entrepreneurial speed and agility. IPM also served as a cornerstone of our "Where-to-Play" strategy in which we classified as Grow the Core and Expand for More. Our plans towards Grow the Core ensures that our core products remain competitive by revisiting our proposition while Expand for More focuses on adjacencies in our existing categories, emerging trends, and new sources of growth. In 2019, our IPM delivered the following:
IV. Products & Brands People Love
Relaunch of Great Taste White: The relaunch of Great Taste White was considered one of the most critical priorities in 2019. We restaged our original Great Taste White with the better formulation and new packaging along with two new flavors, White Caramel and White Crema. With the relaunch of GT White, we o�er the broadest range in the white co�ee format in the market, giving consumers more choices on how to enjoy their white co�ee mix.
Piatto's and V-Cut Party Packs: We started expanding our mainstream snacking portfolio at both ends of our price points. We launched a Piattos and V-Cut in Supersized pack that is priced higher at 55 pesos, which can li� our average selling prices while we launched Mr. Chips at P3.00 to participate in the 1-5 pesos price point.
When it comes to new flavors, we also launched Chicharon ni Mang Juan, in Classic Chicharon flavor as we continue to re-excite our consumers and further build our extruded snacks category. Internationally, in Thailand, we continue to push new flavors that Thai consumers love as we launched Roller Coaster Spicy Shrimp flavor while in Oceania, we launched the limited edition Thins Himalayan Pink Salt.
In biscuits, we've expanded the Dewberry and Cream-O line with Chocoberry and Choco-O Plus.
Product Supply Chain Transformation
People & PlanetFriendly Culture
Partnerof Choice
Products & BrandsPeople LoveStrategy Updates

Product Supply Chain Transformation
People & PlanetFriendly Culture
Partnerof Choice
Products & BrandsPeople LoveStrategy Updates
In Q4, we relaunched Cloud 9, and we leveraged on the key strength of the brand as we translated it into a new look and campaign.
We started building our wellness portfolio to serve consumers who are actively looking for better-for-you snacking options. In Q1, we launched Nice & Natural snack bars in the Philippines, Indonesia, and Natural Chip Co. Veggie Rings in Australia.
In Beverages, we launched C2 Plus Fiber in Green Apple and Pineapple flavors, a functional adjacency of our C2 brand that promotes better digestion.
In snacks, we’ve launched a classic crunch version of Nova as our response to a new snacking trend. Nova Classic Crunch has only 90mg per serving of sodium approximately.
*Versus our regular flavors (ex. Nova Barbecue)
In our Noodles Category, we continue to strengthen our Nissin Cup Noodles brand by launching a Cheesy Seafood Flavor in Q4 to give consumers a new and exciting experience with their beloved Nissin Seafood Flavor.
-89%Less sodium*

Another play in wellness is the recent launch of Vitasoy Milky in 1 liter Tetra, which is aimed to target the bigger mainstream dairy segment in the Philippines as it delivers the creamy and milky taste without the beany taste of soy milk.
New Snacking Trends
In Oceania, we have launched snacking crackers such as Natural Cracker Co and Kettle Flat Bread Crackers in Australia, and in New Zealand, we launched both Snax Crunches and Huntley & Palmers Lavosh Crisps.
Building adjacencies in beverage
We've relaunched our water brand, Refresh in Q2, as we make a plan to be more deliberate in participating in the water category, which is one of the fastest-growing RTD beverage segments. Apart from expanding our Better For You platform, we relaunched Refresh as a brand with a purpose (100% recycle-able) with a new packaging design. In Vietnam, our latest launches, which are the Black Tea and Milk Tea, drove growth in the 1H as consumers look for new beverage experiences beyond fruit-based tea. Our 2019 campaign was successful, and the black tea/milk tea line significantly contributed to C2's total sales by double digits in 2019. Lastly, with our JV in the Philippines with Danone, we continue to drive B'lue, especially in channels like convenience stores by launching B'lue Cactus Tangerine flavor.
Product Supply Chain Transformation
People & PlanetFriendly Culture
Partnerof Choice
Products & BrandsPeople LoveStrategy Updates

Building our Value Added Portfolio in AIC:
We started this transformation when we launched packaged meat products, which is the next phase in our value-added chain under Robina Farms brand on top of our meat cuts. These products cater to households looking for more choices in high quality processed meat such as Tocino, Honeycured Bacon, and Skinless Longganisa. We continue to di�erentiate in terms of quality, which adheres to Robina farms' highest standards, ensuring that it is family-safe, free from Antibiotic Residue and Hormones from our homegrown hogs and a product of our AAA certified abattoir.
Our Animal Nutrition & Health Business (ANH) has been nurturing new growth streams, such as dog feeds, food, and pet care essentials. Our dog meal brand, TopBreed, was formulated to satisfy the nutritional needs of dogs for good health, general well-being, and optimum performance. TopBreed continues to expand its market by entering the modern trade channel. Today, TopBreed is the number #1 dog food in the Philippines in terms of volume, and we continue to nurture this category of ANH.
Besides dog meals, we expanded into dog essentials through ShamPooch Dog Bath Essential and TopB+ Multivitamins. ShamPooch was formulated from natural ingredients to provide top care for dogs by gently washing out dirt while keeping the dog’s coat smooth, and shiny, and ensuring a long-lasting fresh scent. It comes in 1Liter, 300ml, and 15ml packages to suit di�erent needs of Petcare owners. TopB+ Multivitamins is a daily nutritional supplement for Dogs of all ages containing all essential multivitamins, Lysine, and Zinc. It enhances growth, boosts brain function, and strengthens immunity. It comes in 60ml and 120 ml bottles.
Product Supply Chain Transformation
People & PlanetFriendly Culture
Partnerof Choice
Products & BrandsPeople LoveStrategy Updates

CorporateGovernance
Annual Report 2019

Universal Robina Corporation (“The Company”) acknowledges that good corporate governance is essential to build an environment of trust, transparency and accountability necessary for fostering long-term performance, financial stability, business integrity and sustainability of the company for the protection of the interests of shareholders and other stakeholders.
Corporate governance is the framework of rules, systems and processes of the corporation that governs the performance by the Board of Directors and Management of their respective duties and responsibilities to the stakeholders. The Revised Corporate Governance Manual was adopted to institutionalize corporate governance principles as a guide for the daily conduct of business.
The Company continuously strives to strengthen and improve its corporate governance practices by adopting best practices that includes building a competent board, aligning strategies with goals, managing risk e�ectively, adhering to high standards of ethics and integrity, and promoting accountability by defining roles and responsibilities.
The Company believes that sound and e�ective corporate practices are fundamental to the smooth, e�ective and transparent operation of the company, its ability to attract investment and enhance shareholder
Corporate Governance
“ The Company believes that sound and e�ective corporate practices are fundamental to the smooth, e�ective and transparent operation of the company, its ability to attract investment and enhance shareholder value. ”
value. This includes the Company’s commitment to ensure fair and equitable treatment of all shareholders, including the minority, and the protection of their rights that include:
Right to vote on all matters that require their consent or approval
Right to information
Right to inspect corporate books and records
Right to dividends
Appraisal right

Corporate Governance
The Company is transparent and fair in the conduct of the annual and special Shareholders’ meetings. To foster active shareholder participation, the Board sends the Notice of Annual and Special Shareholders’ Meeting with su�icient and relevant information at least fi�een (15) business days before the meeting, compliant with the Securities Regulation Code. The Shareholders are encouraged to personally attend such meetings and those who are unable to attend are apprised ahead of time of their right to appoint a proxy. Subject to the requirements of law, rules and regulations and the By-Laws, the exercise of that right shall not be unduly restricted and any doubt Ilabout the validity of a proxy shall be resolved in the favor of the shareholder.
Guided by the principles of fairness, accountability and transparency to the shareholding public, the Company ensures that the result of the votes taken during the most recent Annual or Special Shareholders’ Meeting are made available the next working day. In addition, the Minutes of the Annual and Special Shareholders’ Meeting may be accessed through the Company Website within five (5) business days from the end of the meeting.

Duty to Other StakeholdersThe Company recognizes and places importance on the interdependence between business and society, and promotes a mutually beneficial relationship that encourages the Company’s sustainable growth, while contributing to the advancement of the society where it operates. The Company employs value chain processes that take into consideration Economic, Environmental and Social Governance (EESG) issues and concerns
Employees
The Board also establishes policies, programs and procedures that encourage employees to actively participate in the realization of the Company’s goals and its governance including but not limited to:
● Health, safety and welfare;● Training and development; and● Reward and compensation.
1. Performance-enhancing mechanisms for employee participation
The Company abides by the standards and policies set by the Department of Labor and Employment. Likewise, the Company has Security and Safety Manuals that are implemented, reviewed and regularly updated to ensure the security, safety, health, and welfare of the employees in the workplace.
The Company continuously provides learning and development opportunities for its employees through
the John Gokongwei Institute for Leadership and Enterprise Development (JG-ILED), the leadership platform for systematic and sustained development programs across the conglomerate. Its mission is to enable a high performing organization that will facilitate the learning process and develop the intellectual and personal growth of all employees through targeted and customized trainings and development programs.
Corporate Governance
Customers’ Welfare
The Company adopts customer relations policies and procedures to protect customer’s welfare. This includes providing and making available the customer relations contact information who is empowered to address and attend to customer questions and concerns.
Supplier/Contractor Selection
The Company follows the Supplier Accreditation Policy to ensure that the Company’s suppliers and contractors are qualified to meet its commitments. Apart
from the accreditation process, suppliers and contractors also undergo orientation on Company policies and ethical practices.

2. Anti-corruption programs and procedures
The Company is committed to promoting transparency and fairness to all stakeholders. The Board sets the tone and makes a stand against corrupt practices by adopting anti-corruption policies and programs. Some of the Company’s Anti-Corruption programs are embodied in the Code of Business Conduct and Ethics, Conflict of Interest, O�enses Subject to Disciplinary Action (OSDA), among others. The same are disseminated to all employees across the Company through trainings to embed them in the Company’s culture. New employees are oriented regarding policies and procedures related to Business Conduct and Ethics and similar policies. All employees are given periodic reminders. Further, all concerned employees of the Conglomerate are required to comply with the Self-Disclosure Activity on Conflict of Interest and Declaration of Gi�s Received on an annual basis.
The Company also has an established suitable framework for whistleblowing and ensure its enforcement to allow employees and other stakeholders to freely communicate their concerns about illegal or unethical practices, without fear of retaliation and to have direct access to an independent member of the Board or a unit created to handle whistleblowing concerns.
Conflict of InterestThe Company’s Code of Business Conduct and Conflict of Interest Policy require employees to make a conscious e�ort to avoid conflict of interest situations; that his judgment and discretion are not influenced by considerations of personal gain or benefit. A conflict of interest may also occur because of the actions, employment, or investments of an immediate family member of an employee.
The Company’s employees who recommend, endorse, or approve the procurement or sale of goods and services should make a conscious e�ort to avoid any conflict of interest situation in transactions they are involved in.
Conduct of Business and Fair Dealings
The Company ensures that all transactions comply with relevant laws and regulations. Any deficiencies are immediately rectified.
Compliance with Laws and Regulations
The Company discourages the acceptance of gi�s. However, gi�s like advertising novelties may be given or accepted during the Christmas season. There is no restriction in the value of the gi� that may be accepted. However, accepted gi� with estimated value over Php2,000.00 must be disclosed to the Conflicts of Interest Committee.
Receipt of Gi�s from Third Parties
Corporate Governance
“ The Board sets the tone and makes a stand against corrupt practices by adopting anti-corruption policies and programs. ”
The anti-corruption programs and procedures of the Company are summarized below:
The Company has policies that ensure proper and authorized disclosure of confidential information. Disclosures to the public can only be done a�er the disclosure to SEC and PSE by the Company’s authorized o�icers.
Respect for Trade Secrets/Use of Non-public Information
Employees are required to safeguard Company resources and assets with honesty and integrity. Employees must ensure that these assets are e�iciently, e�ectively, and responsibly utilized.
Use of Company Funds, Assets and Information
Corporate Governance Highlights
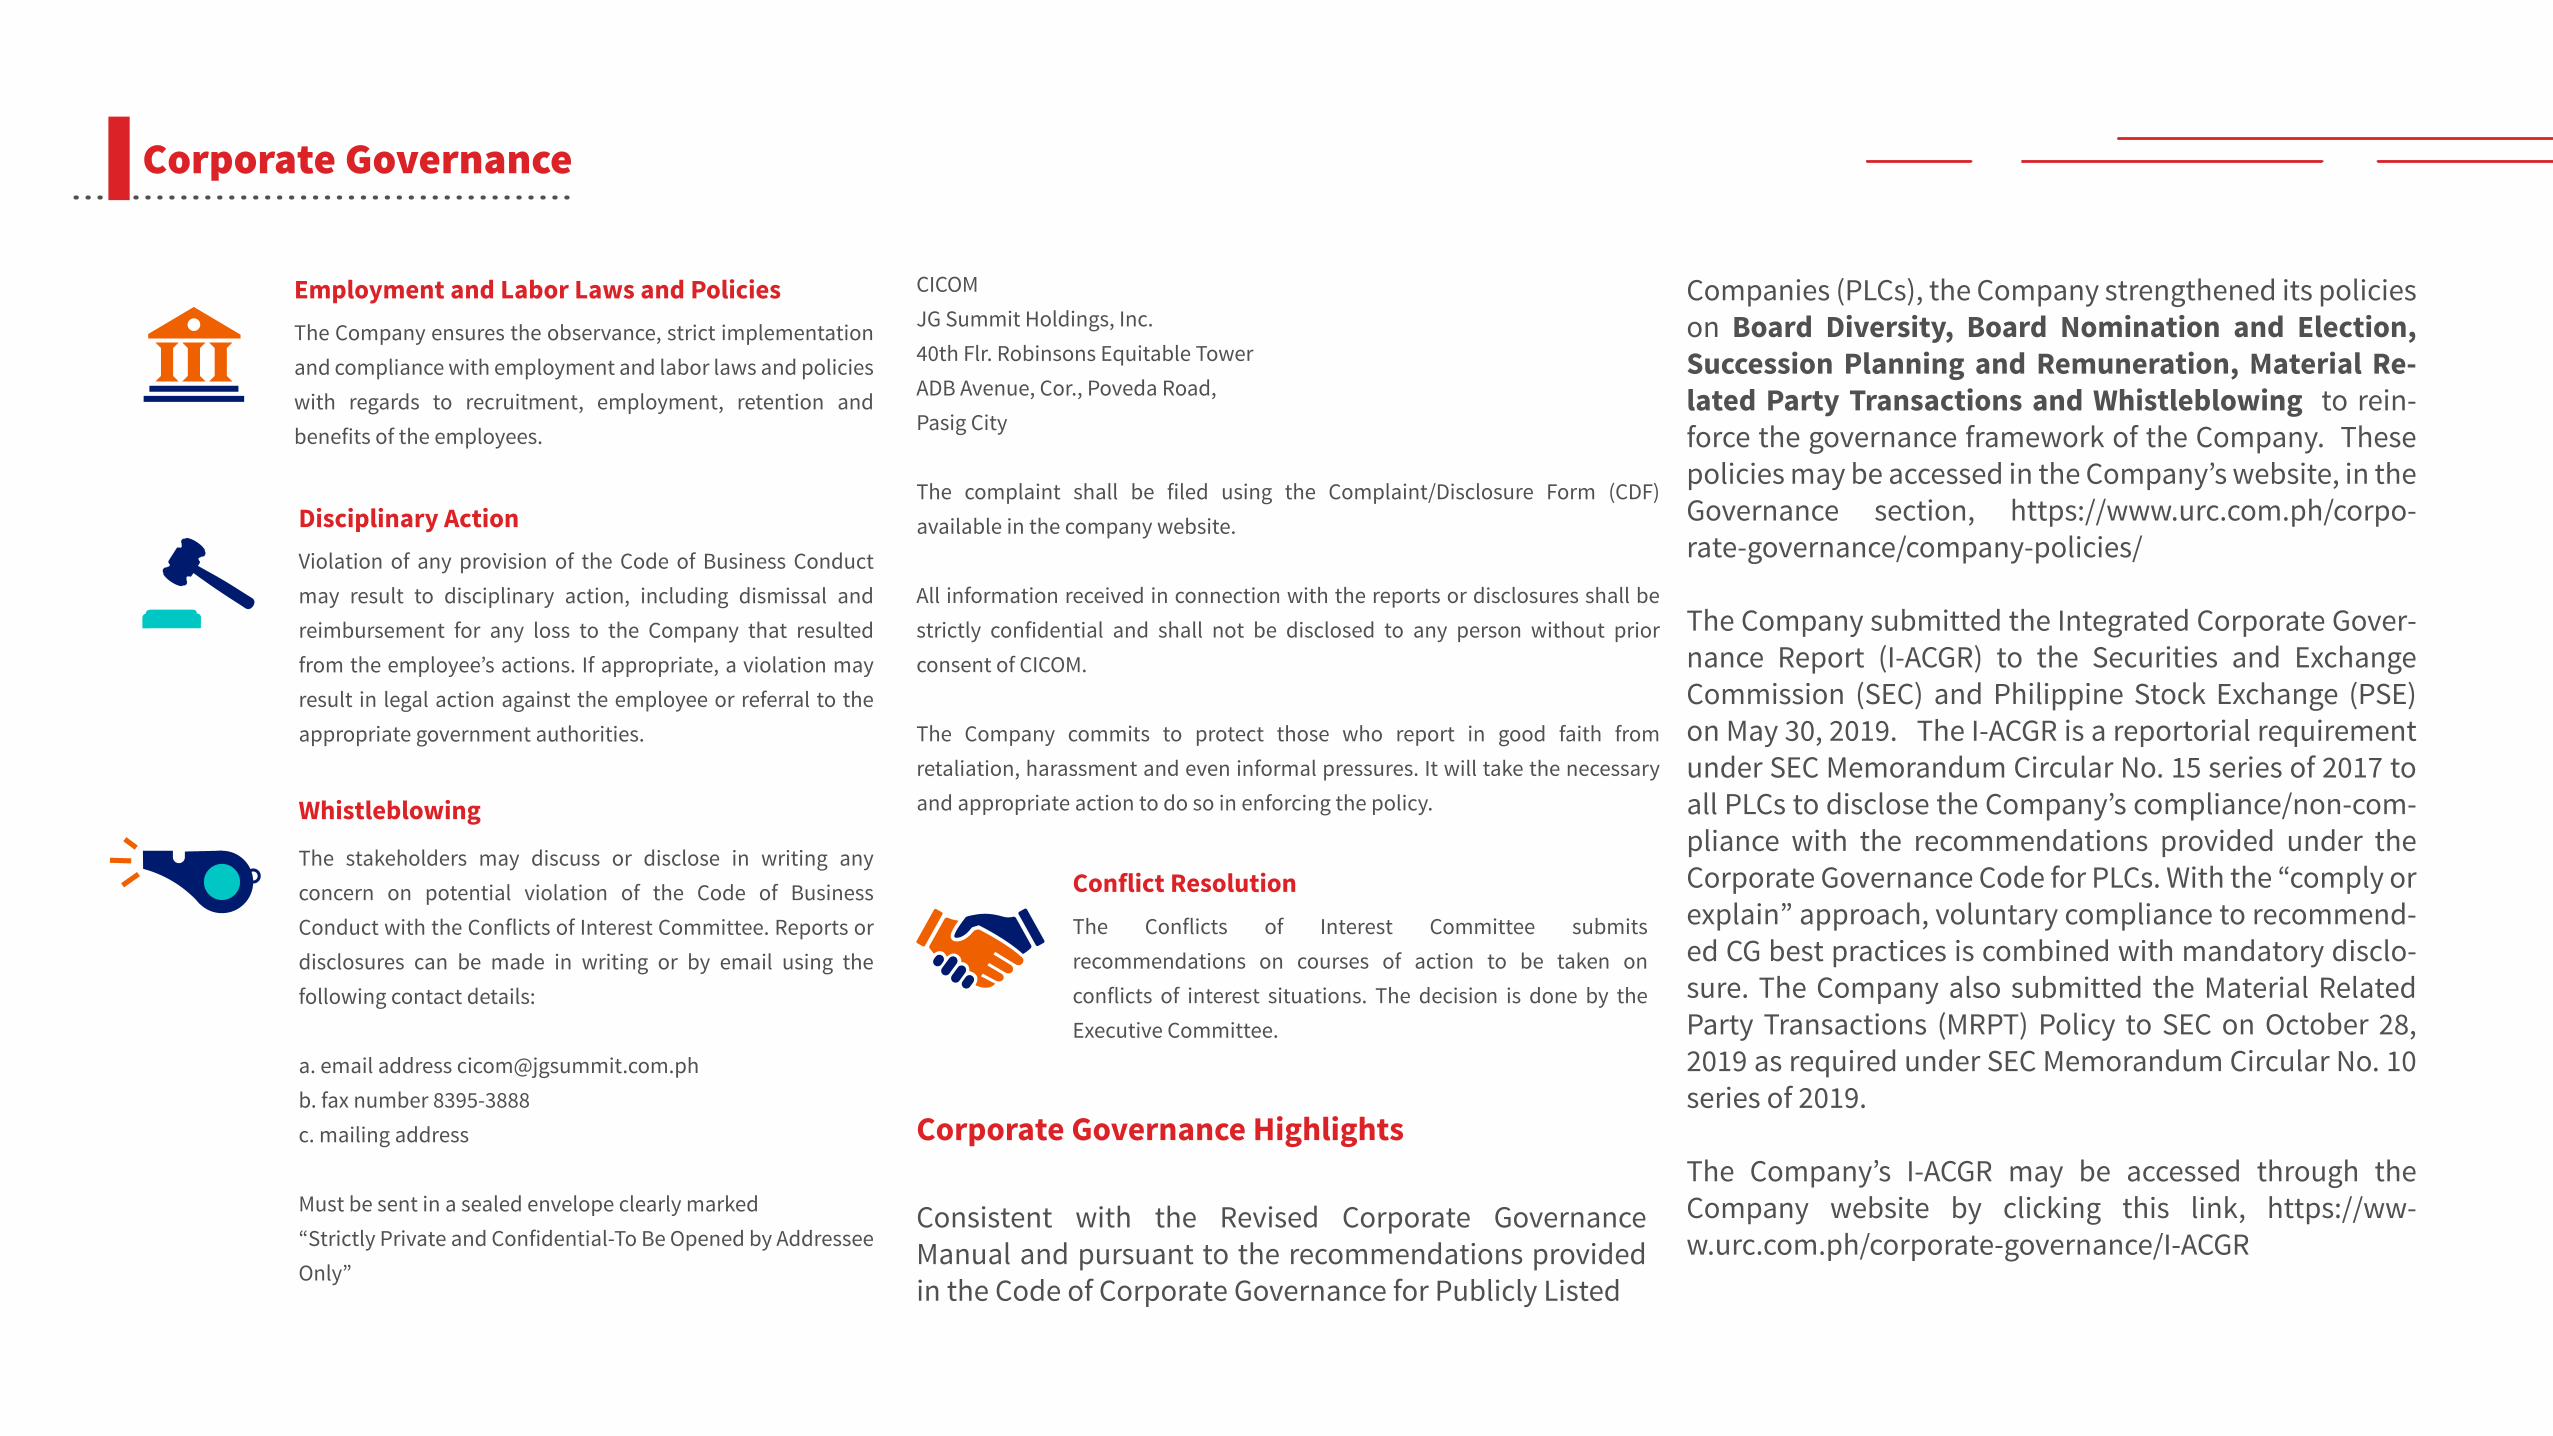
Consistent with the Revised Corporate Governance Manual and pursuant to the recommendations provided in the Code of Corporate Governance for Publicly Listed
Companies (PLCs), the Company strengthened its policies on Board Diversity, Board Nomination and Election, Succession Planning and Remuneration, Material Re-lated Party Transactions and Whistleblowing to rein-force the governance framework of the Company. These policies may be accessed in the Company’s website, in the Governance section, https://www.urc.com.ph/corpo-rate-governance/company-policies/
The Company submitted the Integrated Corporate Gover-nance Report (I-ACGR) to the Securities and Exchange Commission (SEC) and Philippine Stock Exchange (PSE) on May 30, 2019. The I-ACGR is a reportorial requirement under SEC Memorandum Circular No. 15 series of 2017 to all PLCs to disclose the Company’s compliance/non-com-pliance with the recommendations provided under the Corporate Governance Code for PLCs. With the “comply or explain” approach, voluntary compliance to recommend-ed CG best practices is combined with mandatory disclo-sure. The Company also submitted the Material Related Party Transactions (MRPT) Policy to SEC on October 28, 2019 as required under SEC Memorandum Circular No. 10 series of 2019.
The Company’s I-ACGR may be accessed through the Company website by clicking this link, https://ww-w.urc.com.ph/corporate-governance/I-ACGR
Violation of any provision of the Code of Business Conduct may result to disciplinary action, including dismissal and reimbursement for any loss to the Company that resulted from the employee’s actions. If appropriate, a violation may result in legal action against the employee or referral to the appropriate government authorities.
Disciplinary Action
The Company ensures the observance, strict implementation and compliance with employment and labor laws and policies with regards to recruitment, employment, retention and benefits of the employees.
Employment and Labor Laws and Policies
Corporate Governance
The Conflicts of Interest Committee submits recommendations on courses of action to be taken on conflicts of interest situations. The decision is done by the Executive Committee.
Conflict ResolutionThe stakeholders may discuss or disclose in writing any concern on potential violation of the Code of Business Conduct with the Conflicts of Interest Committee. Reports or disclosures can be made in writing or by email using the following contact details:
a. email address [email protected] b. fax number 8395-3888 c. mailing address
Must be sent in a sealed envelope clearly marked“Strictly Private and Confidential-To Be Opened by Addressee Only”
Whistleblowing
CICOMJG Summit Holdings, Inc.40th Flr. Robinsons Equitable TowerADB Avenue, Cor., Poveda Road,Pasig City
The complaint shall be filed using the Complaint/Disclosure Form (CDF) available in the company website.
All information received in connection with the reports or disclosures shall be strictly confidential and shall not be disclosed to any person without prior consent of CICOM.
The Company commits to protect those who report in good faith from retaliation, harassment and even informal pressures. It will take the necessary and appropriate action to do so in enforcing the policy.

The Board of DirectorsThe Board of Directors (“The Board”) is primarily responsible for the governance of the Company and provides an independent check on management. It has the duty to foster the long-term success of the Company and to ensure that the Company’s competitiveness and profitability will be sustained in a manner consistent with its corporate objectives for the best interest of the company and its stakeholders.
The Board formulates the Company’s vision, mission, strategic objectives, policies and procedures that guide its activities, including the means to e�ectively monitor Management’s performance. It provides direction and approval in relation to matters concerning the Company’s business strategies, policies and plans, while the day-to-day business operations are delegated to the Executive Committee.
The Board exercises care, skill and judgment and observes good faith and loyalty in the conduct and management of the business and a�airs of the Company. It ensures that all its actions are within the scope of power and authority as prescribed in the Articles of Incorporation, By-Laws, and existing laws, rules and regulations. To uphold high standard for the Company, its
Shareholders and other Stakeholders, the Board conducts itself with honesty and integrity in the performance of its duties and responsibilities.
Board Duties and Responsibilities
The Company’s Corporate Governance Manual specifies the roles, duties and responsibilities of the Board of Directors in compliance with relevant laws, rules and regulations. In adherence to the principles of corporate governance, the Board is tasked to perform the following:
General Responsibilities
It is the Board’s responsibility to foster the long-term success of the Corporation, and to sustain its competitiveness and profitability in a manner consistent with its corporate objectives and in the best interest of the Corporation, its Shareholders and Stakeholders, as a whole.
Duties and Functions
To ensure high standard for the Corporation, its Shareholders and other Stakeholders, the Board shall conduct itself with honesty and integrity in the performance of, among others, the following duties and responsibilities:
● Act on a fully informed basis, in good faith, with due diligence and care, and in the best interest of the Company and all Stakeholders;
● Oversee the development of and approve the Company’s business objectives and strategy, and monitor their implementation, in order to sustain the Company’s long-term viability and strength. The Board shall review and guide corporate strategy, major plans of action, risk management policies and procedures, annual budgets and business plans; set performance objectives; monitor implementation and corporate performance; and oversee major capital expenditures, acquisitions and divestitures;
Corporate Governance
“ The Board exercises care, skill and judgment and observes good faith and loyalty in the conduct and management of the business and a�airs of the Company. ”
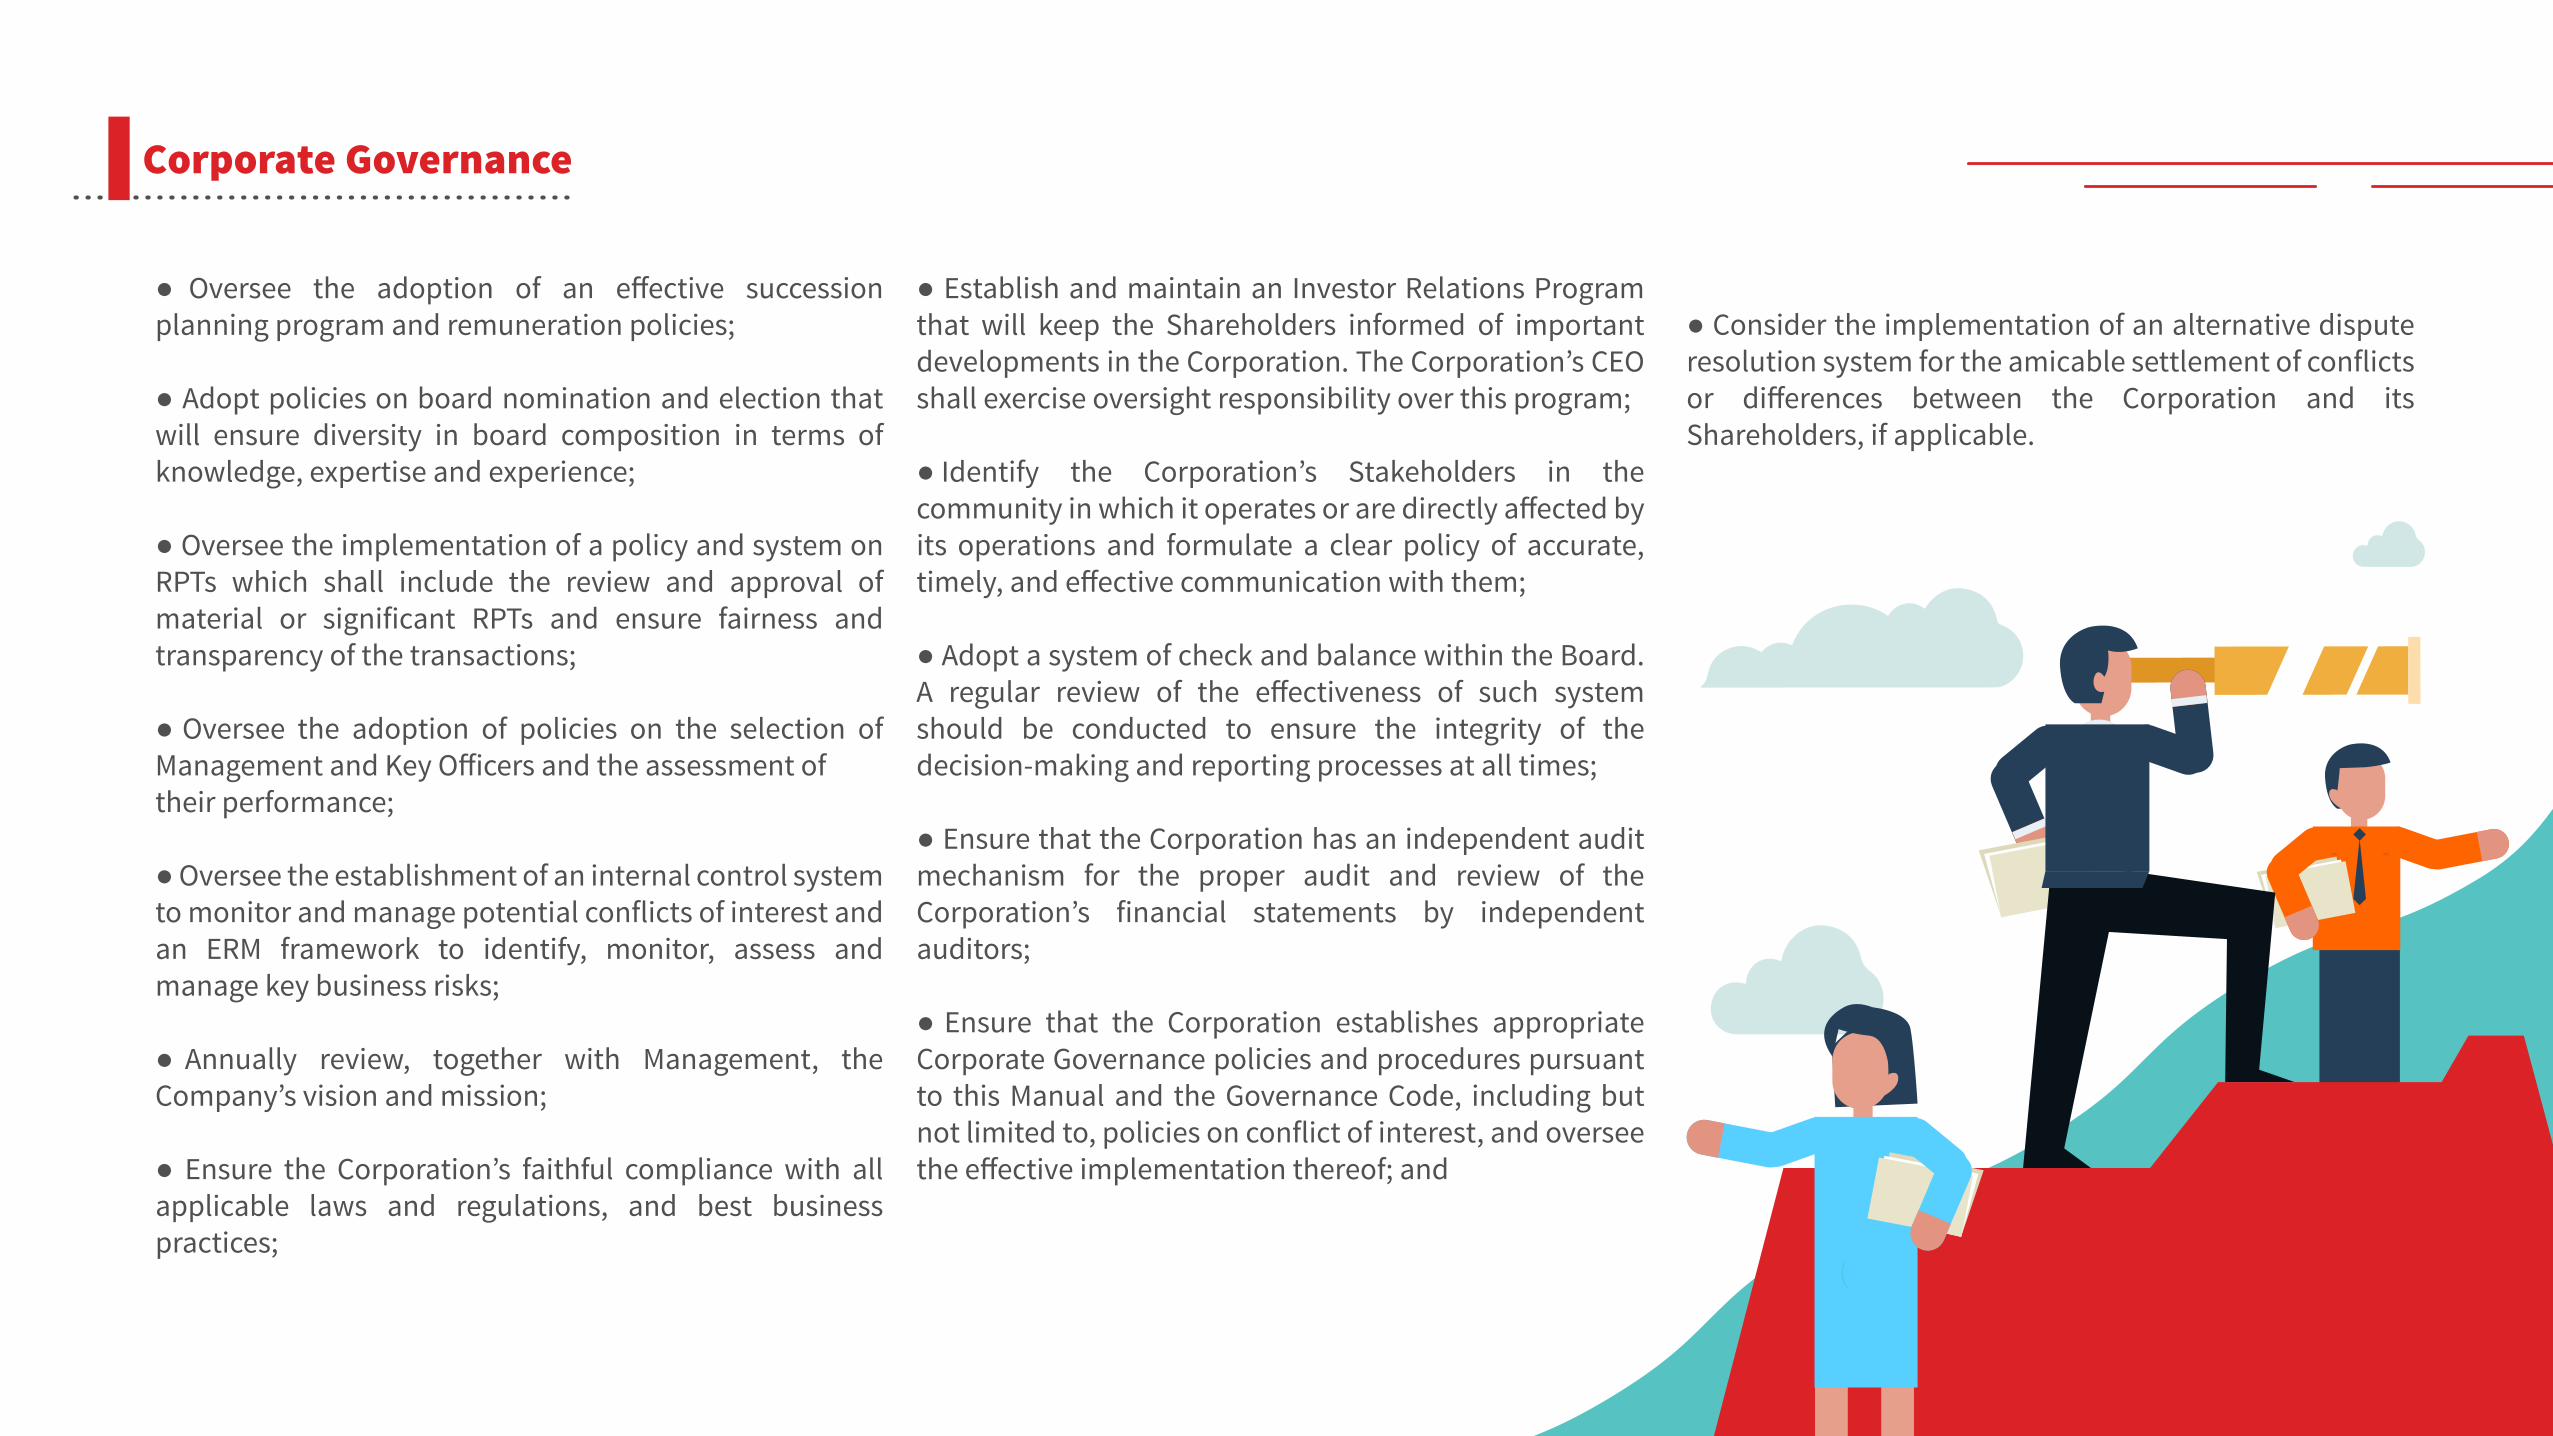
Corporate Governance
● Oversee the adoption of an e�ective succession planning program and remuneration policies;
● Adopt policies on board nomination and election that will ensure diversity in board composition in terms of knowledge, expertise and experience;
● Oversee the implementation of a policy and system on RPTs which shall include the review and approval of material or significant RPTs and ensure fairness and transparency of the transactions;
● Oversee the adoption of policies on the selection of Management and Key O�icers and the assessment of their performance;
● Oversee the establishment of an internal control system to monitor and manage potential conflicts of interest and an ERM framework to identify, monitor, assess and manage key business risks;
● Annually review, together with Management, the Company’s vision and mission;
● Ensure the Corporation’s faithful compliance with all applicable laws and regulations, and best business practices;
● Establish and maintain an Investor Relations Program that will keep the Shareholders informed of important developments in the Corporation. The Corporation’s CEO shall exercise oversight responsibility over this program;
● Identify the Corporation’s Stakeholders in the community in which it operates or are directly a�ected by its operations and formulate a clear policy of accurate, timely, and e�ective communication with them;
● Adopt a system of check and balance within the Board. A regular review of the e�ectiveness of such system should be conducted to ensure the integrity of the decision-making and reporting processes at all times;
● Ensure that the Corporation has an independent audit mechanism for the proper audit and review of the Corporation’s financial statements by independent auditors;
● Ensure that the Corporation establishes appropriate Corporate Governance policies and procedures pursuant to this Manual and the Governance Code, including but not limited to, policies on conflict of interest, and oversee the e�ective implementation thereof; and
● Consider the implementation of an alternative dispute resolution system for the amicable settlement of conflicts or di�erences between the Corporation and its Shareholders, if applicable.
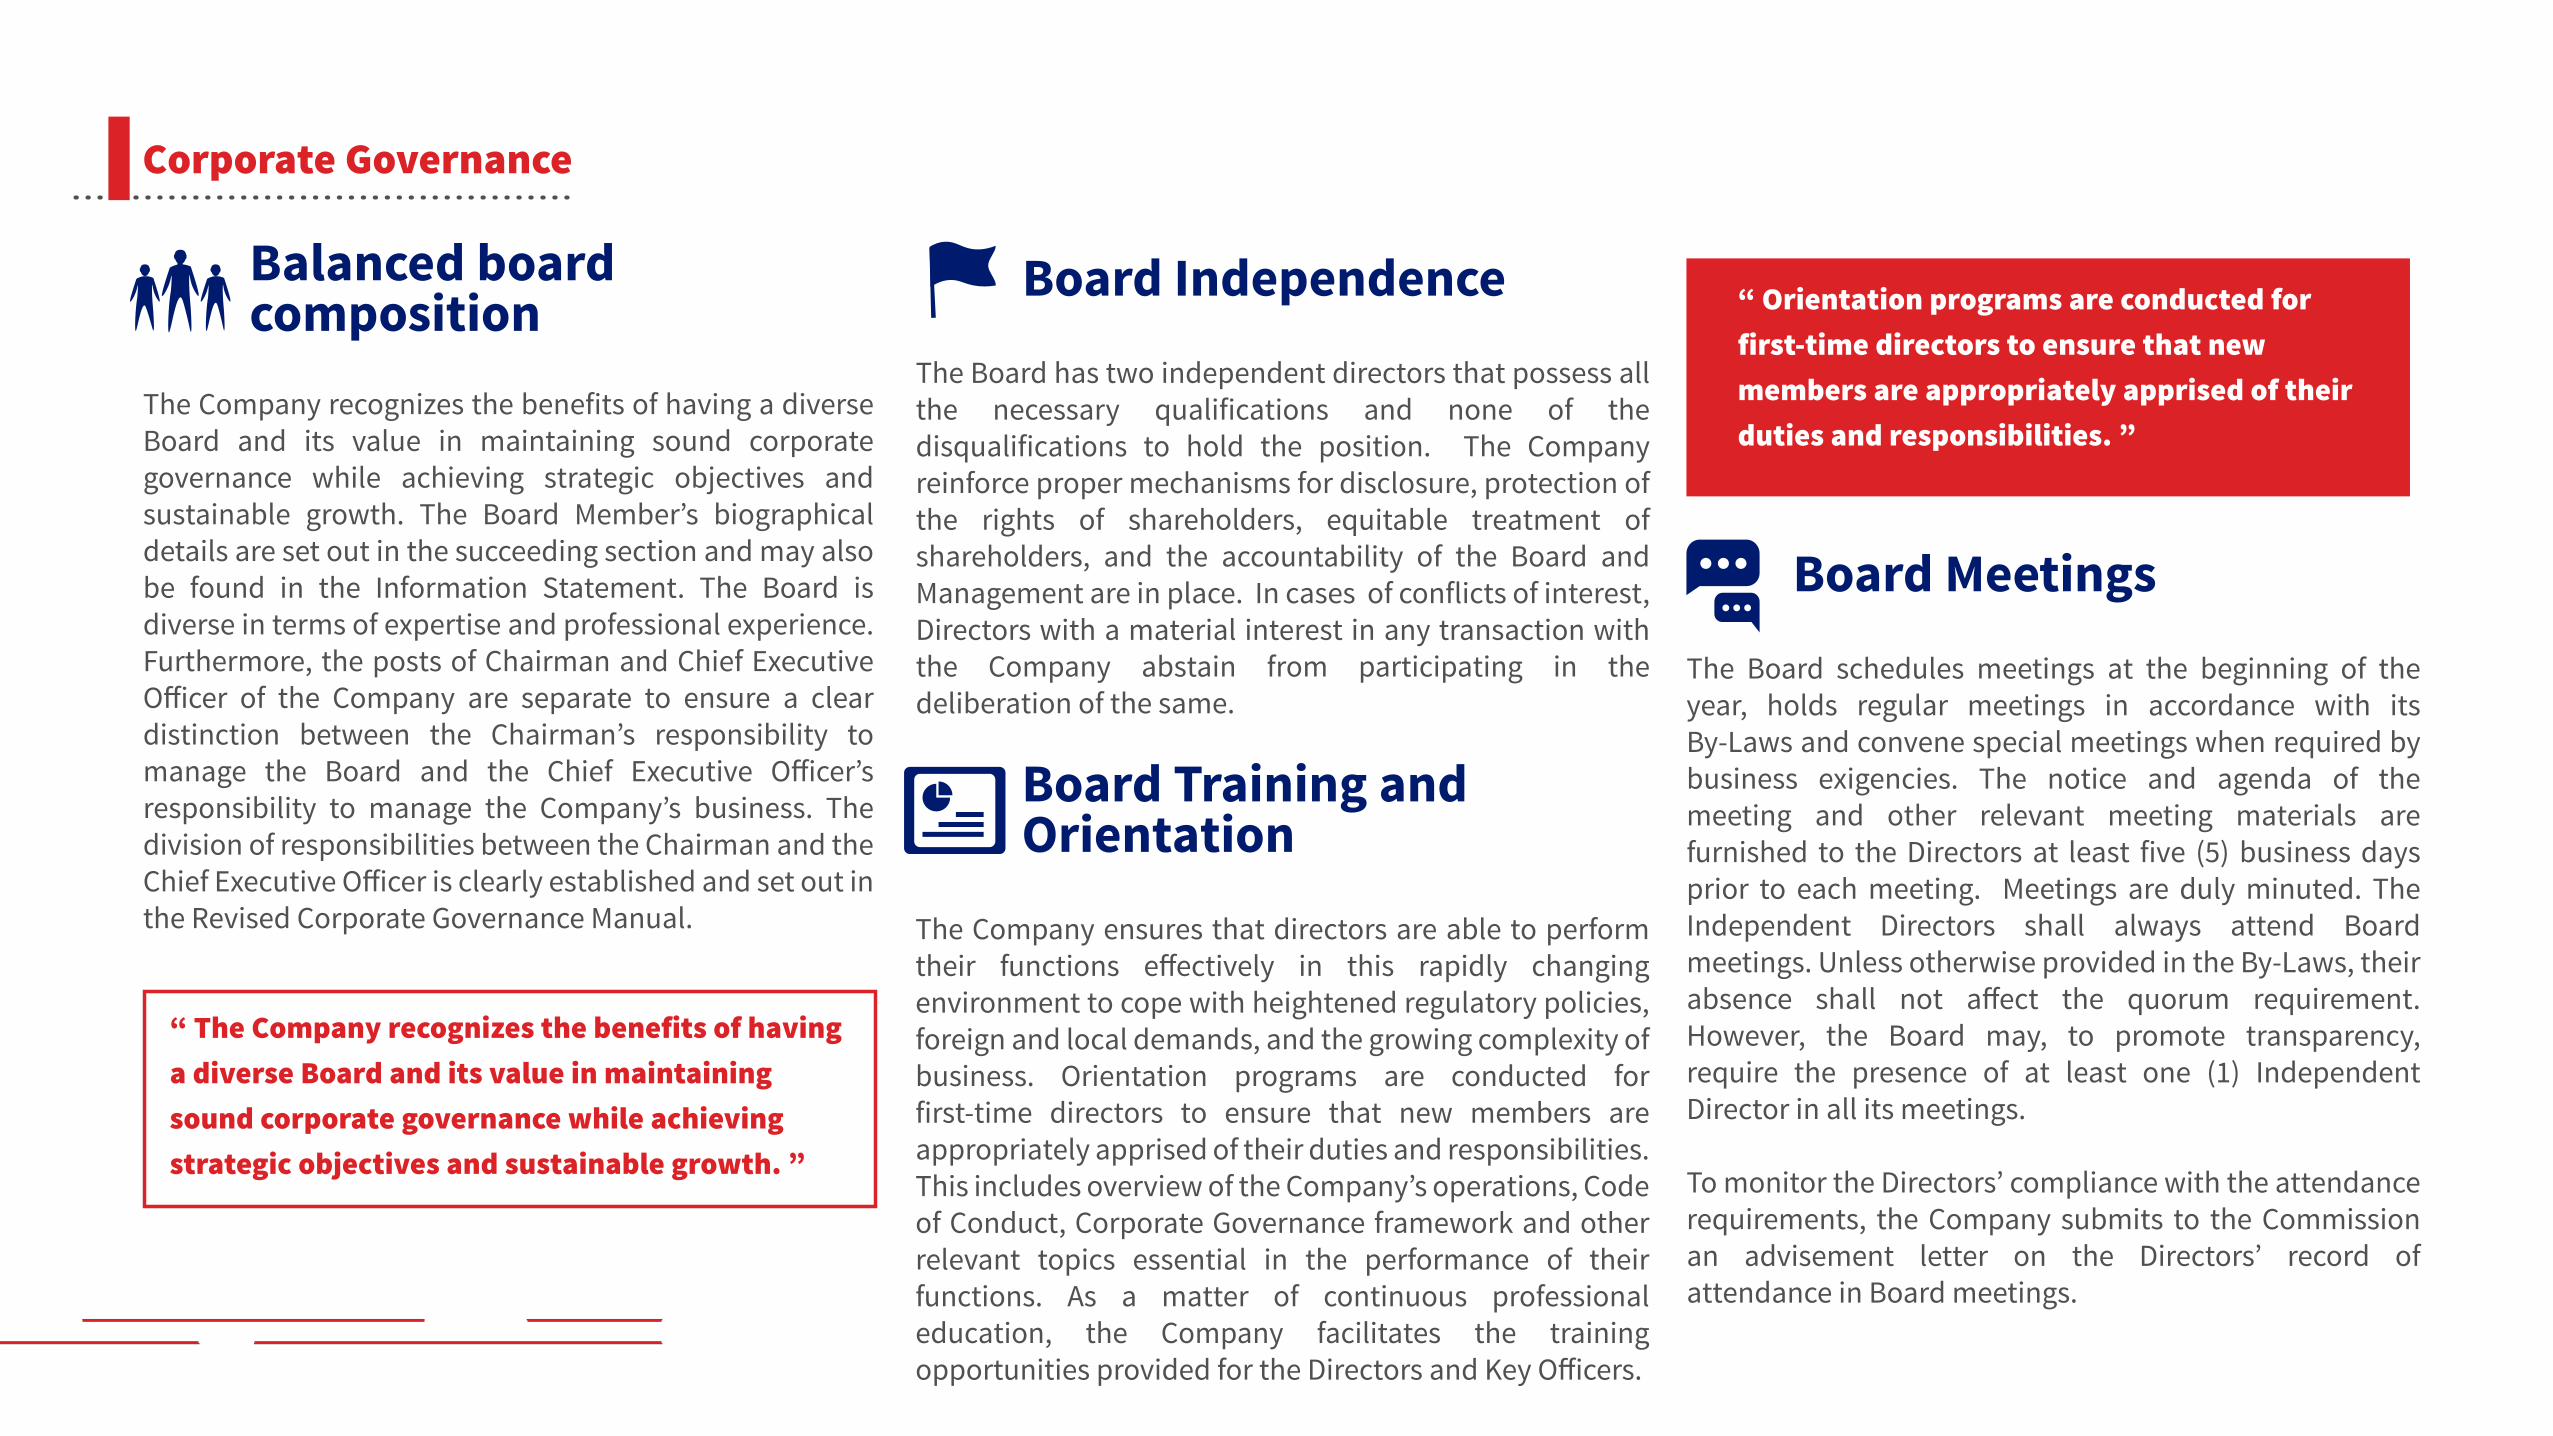
Board Training and Orientation
The Company ensures that directors are able to perform their functions e�ectively in this rapidly changing environment to cope with heightened regulatory policies, foreign and local demands, and the growing complexity of business. Orientation programs are conducted for first-time directors to ensure that new members are appropriately apprised of their duties and responsibilities. This includes overview of the Company’s operations, Code of Conduct, Corporate Governance framework and other relevant topics essential in the performance of their functions. As a matter of continuous professional education, the Company facilitates the training opportunities provided for the Directors and Key O�icers.
Board MeetingsThe Board schedules meetings at the beginning of the year, holds regular meetings in accordance with its By-Laws and convene special meetings when required by business exigencies. The notice and agenda of the meeting and other relevant meeting materials are furnished to the Directors at least five (5) business days prior to each meeting. Meetings are duly minuted. The Independent Directors shall always attend Board meetings. Unless otherwise provided in the By-Laws, their absence shall not a�ect the quorum requirement. However, the Board may, to promote transparency, require the presence of at least one (1) Independent Director in all its meetings.
To monitor the Directors’ compliance with the attendance requirements, the Company submits to the Commission an advisement letter on the Directors’ record of attendance in Board meetings.
Board IndependenceThe Board has two independent directors that possess all the necessary qualifications and none of the disqualifications to hold the position. The Company reinforce proper mechanisms for disclosure, protection of the rights of shareholders, equitable treatment of shareholders, and the accountability of the Board and Management are in place. In cases of conflicts of interest, Directors with a material interest in any transaction with the Company abstain from participating in the deliberation of the same.
Balanced board composition “ Orientation programs are conducted for
first-time directors to ensure that new members are appropriately apprised of their duties and responsibilities. ”
The Company recognizes the benefits of having a diverse Board and its value in maintaining sound corporate governance while achieving strategic objectives and sustainable growth. The Board Member’s biographical details are set out in the succeeding section and may also be found in the Information Statement. The Board is diverse in terms of expertise and professional experience. Furthermore, the posts of Chairman and Chief Executive O�icer of the Company are separate to ensure a clear distinction between the Chairman’s responsibility to manage the Board and the Chief Executive O�icer’s responsibility to manage the Company’s business. The division of responsibilities between the Chairman and the Chief Executive O�icer is clearly established and set out in the Revised Corporate Governance Manual.
Corporate Governance
“ The Company recognizes the benefits of having a diverse Board and its value in maintaining sound corporate governance while achieving strategic objectives and sustainable growth. ”
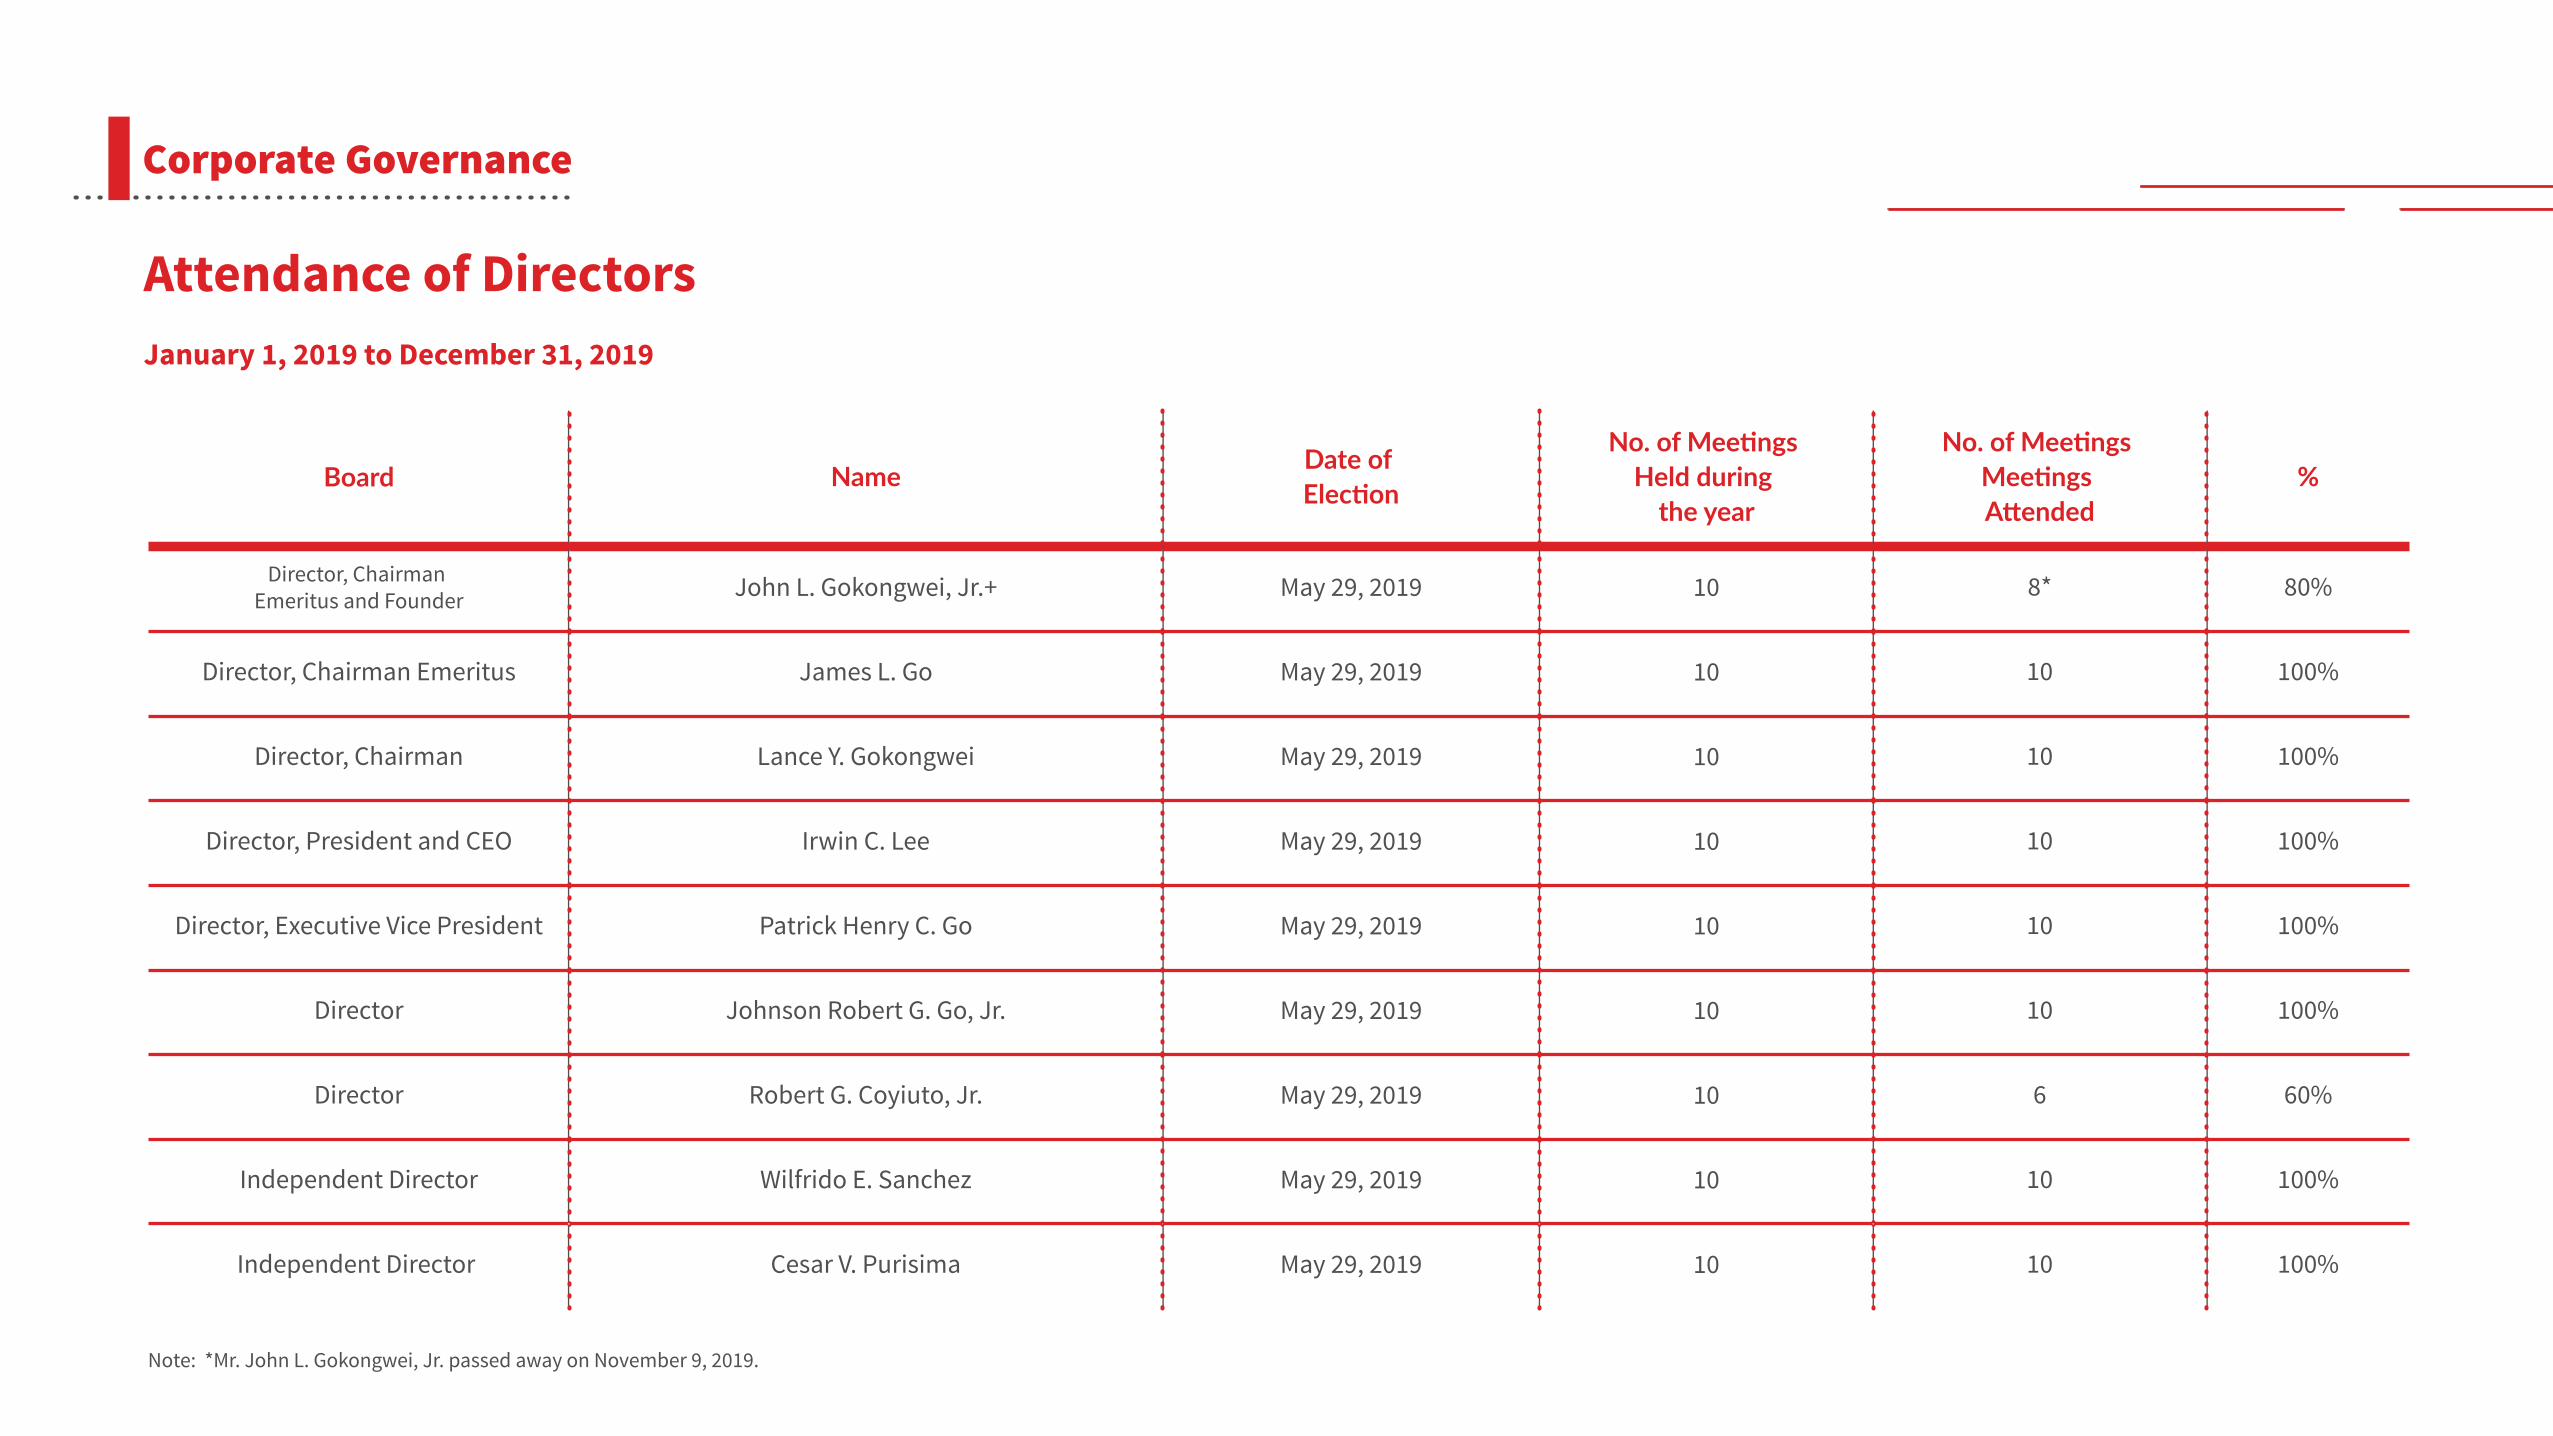
Attendance of DirectorsJanuary 1, 2019 to December 31, 2019
Note: *Mr. John L. Gokongwei, Jr. passed away on November 9, 2019.
Board
Director, Chairman Emeritus and Founder John L. Gokongwei, Jr.+ May 29, 2019 10
10
10
10
10
10
10
10
10
May 29, 2019
May 29, 2019
May 29, 2019
May 29, 2019
May 29, 2019
May 29, 2019
May 29, 2019
May 29, 2019
James L. Go
Lance Y. Gokongwei
Irwin C. Lee
Patrick Henry C. Go
Johnson Robert G. Go, Jr.
Robert G. Coyiuto, Jr.
Wilfrido E. Sanchez
Cesar V. Purisima
Director, Chairman Emeritus
Director, Chairman
Director, President and CEO
Director, Executive Vice President
Director
Director
Independent Director
Independent Director
Name %Date of Election
No. of Meetings Held during
the year
No. of Meetings Meetings Attended
8* 80%
100%
100%
100%
100%
100%
100%
60%
100%
10
10
10
10
10
10
6
10
Corporate Governance
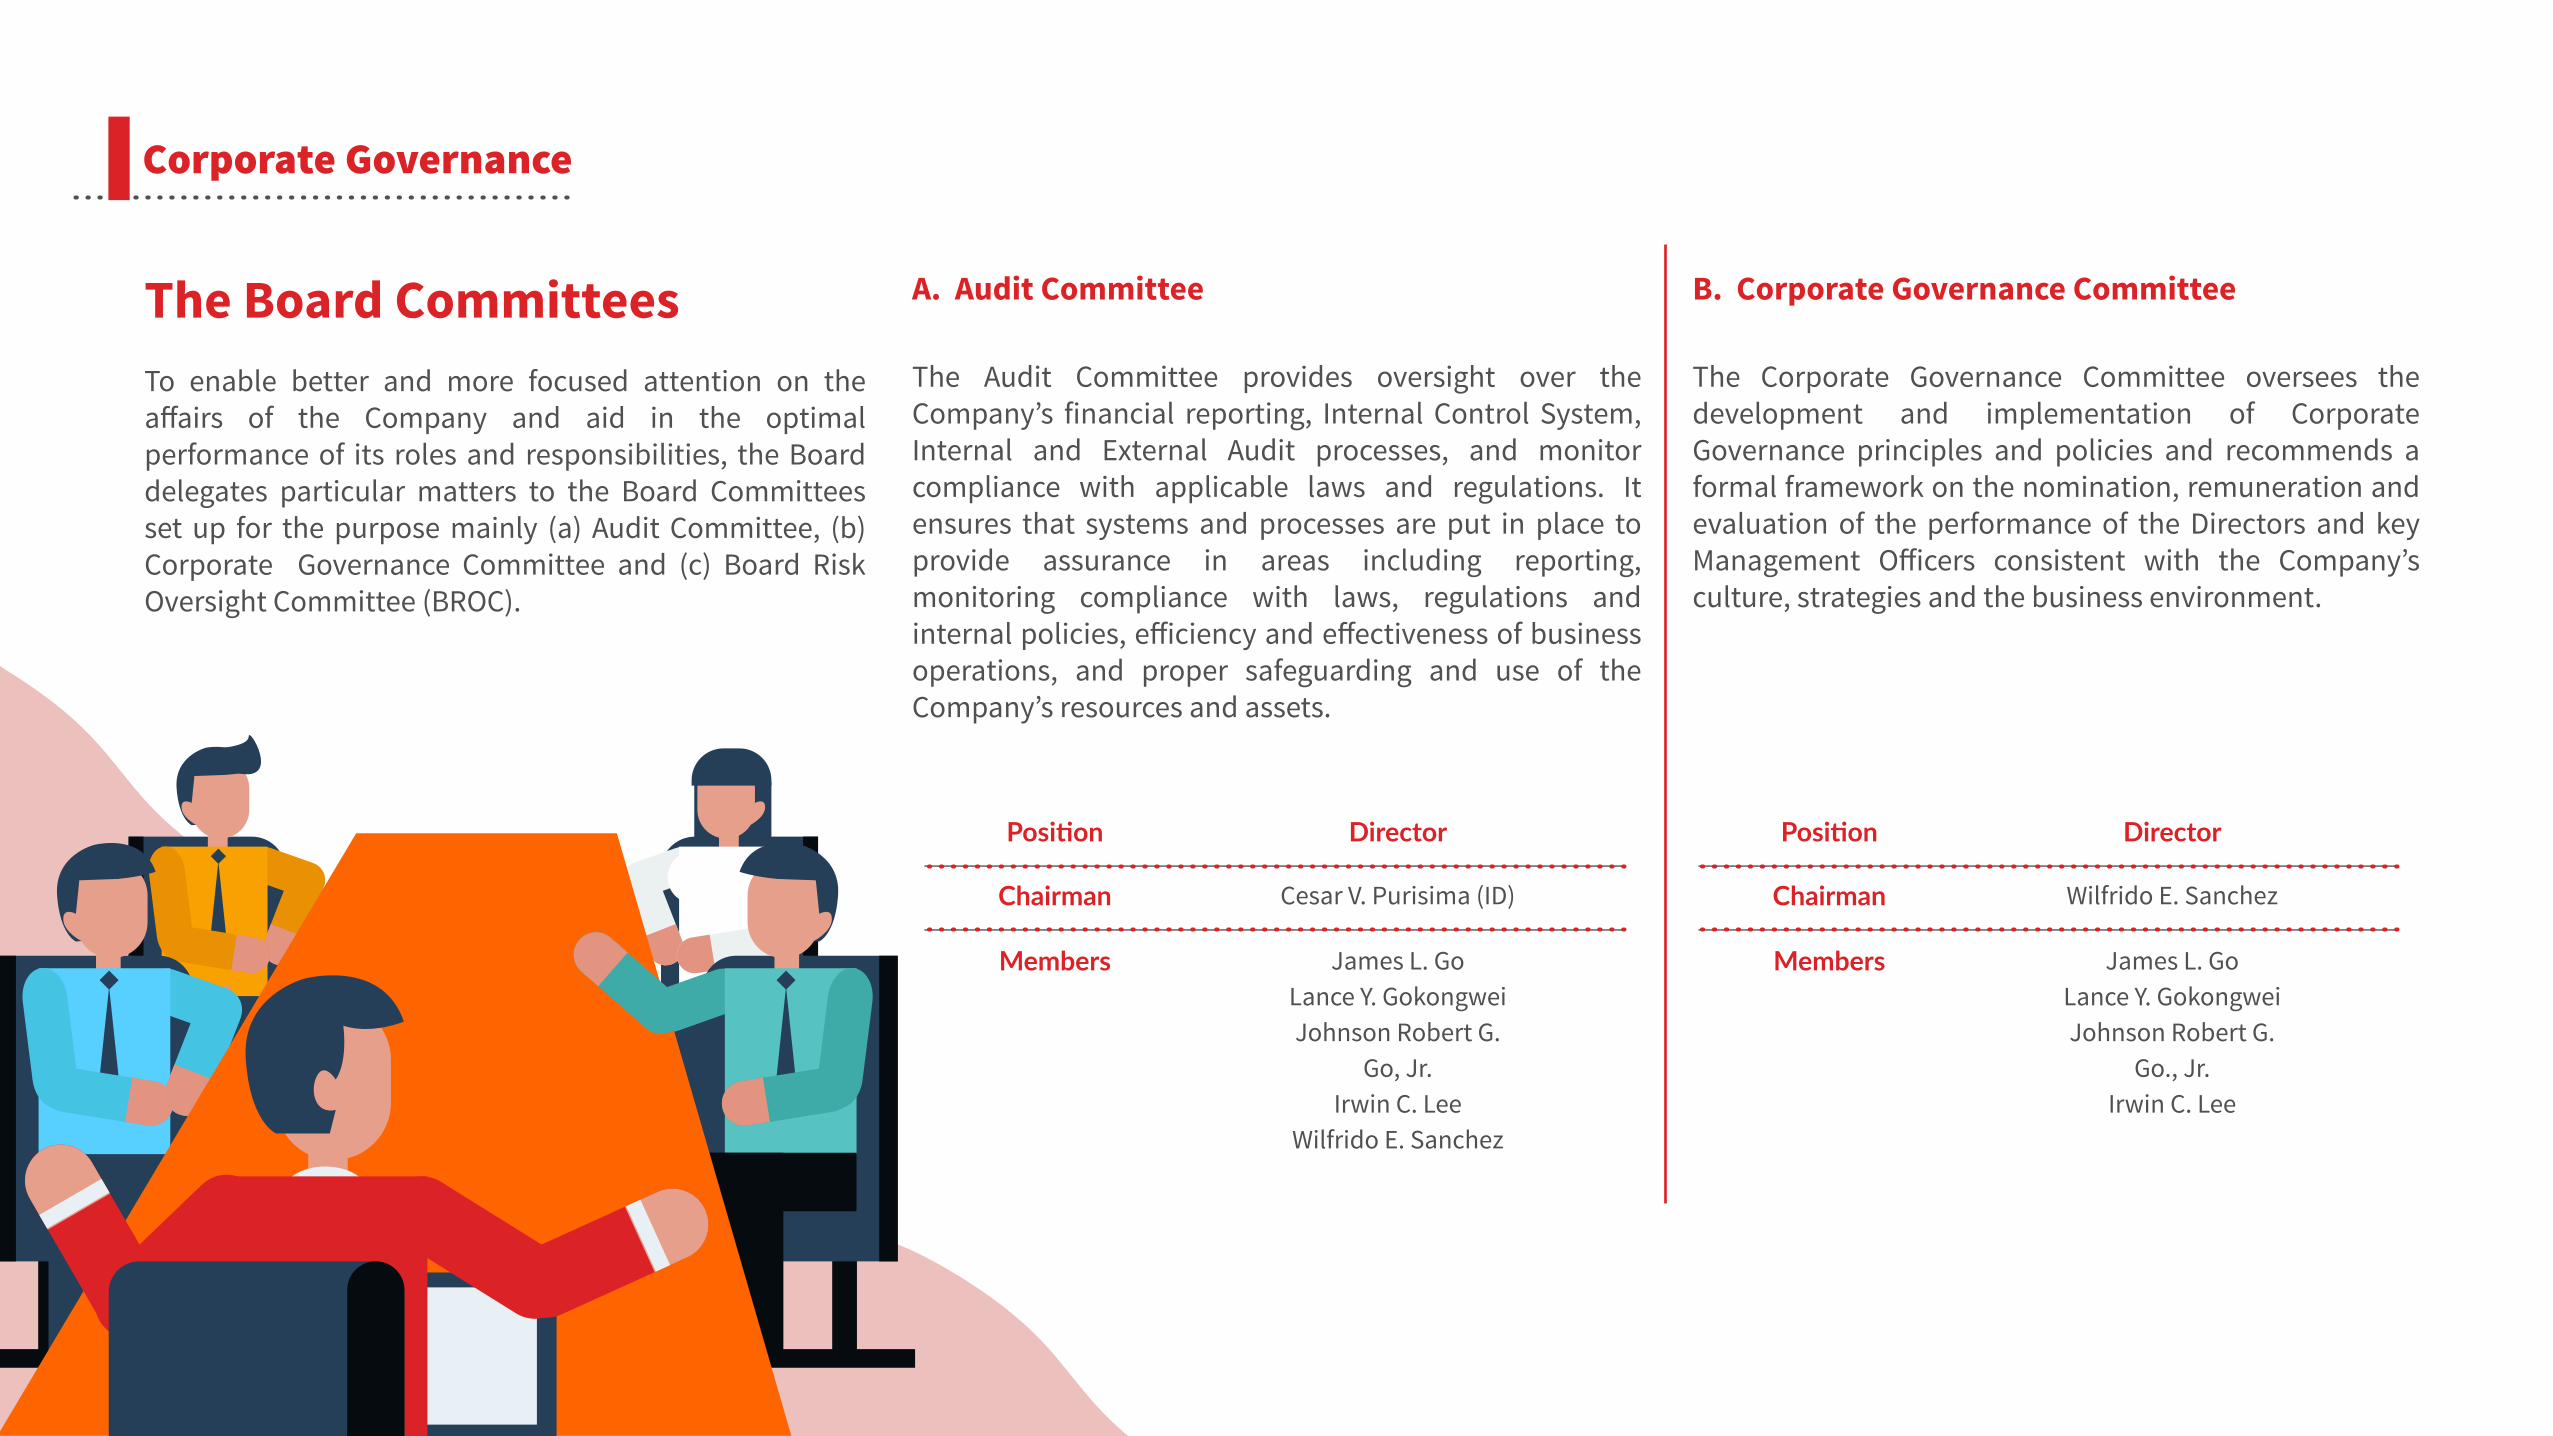
The Board CommitteesTo enable better and more focused attention on the a�airs of the Company and aid in the optimal performance of its roles and responsibilities, the Board delegates particular matters to the Board Committees set up for the purpose mainly (a) Audit Committee, (b) Corporate Governance Committee and (c) Board Risk Oversight Committee (BROC).
A. Audit Committee
The Audit Committee provides oversight over the Company’s financial reporting, Internal Control System, Internal and External Audit processes, and monitor compliance with applicable laws and regulations. It ensures that systems and processes are put in place to provide assurance in areas including reporting, monitoring compliance with laws, regulations and internal policies, e�iciency and e�ectiveness of business operations, and proper safeguarding and use of the Company’s resources and assets.
Position
Chairman
Members
Director
Cesar V. Purisima (ID)
James L. GoLance Y. GokongweiJohnson Robert G.
Go, Jr.Irwin C. Lee
Wilfrido E. Sanchez
Position
Chairman
Members
Director
Wilfrido E. Sanchez
James L. GoLance Y. GokongweiJohnson Robert G.
Go., Jr.Irwin C. Lee
Corporate Governance
B. Corporate Governance Committee
The Corporate Governance Committee oversees the development and implementation of Corporate Governance principles and policies and recommends a formal framework on the nomination, remuneration and evaluation of the performance of the Directors and key Management O�icers consistent with the Company’s culture, strategies and the business environment.
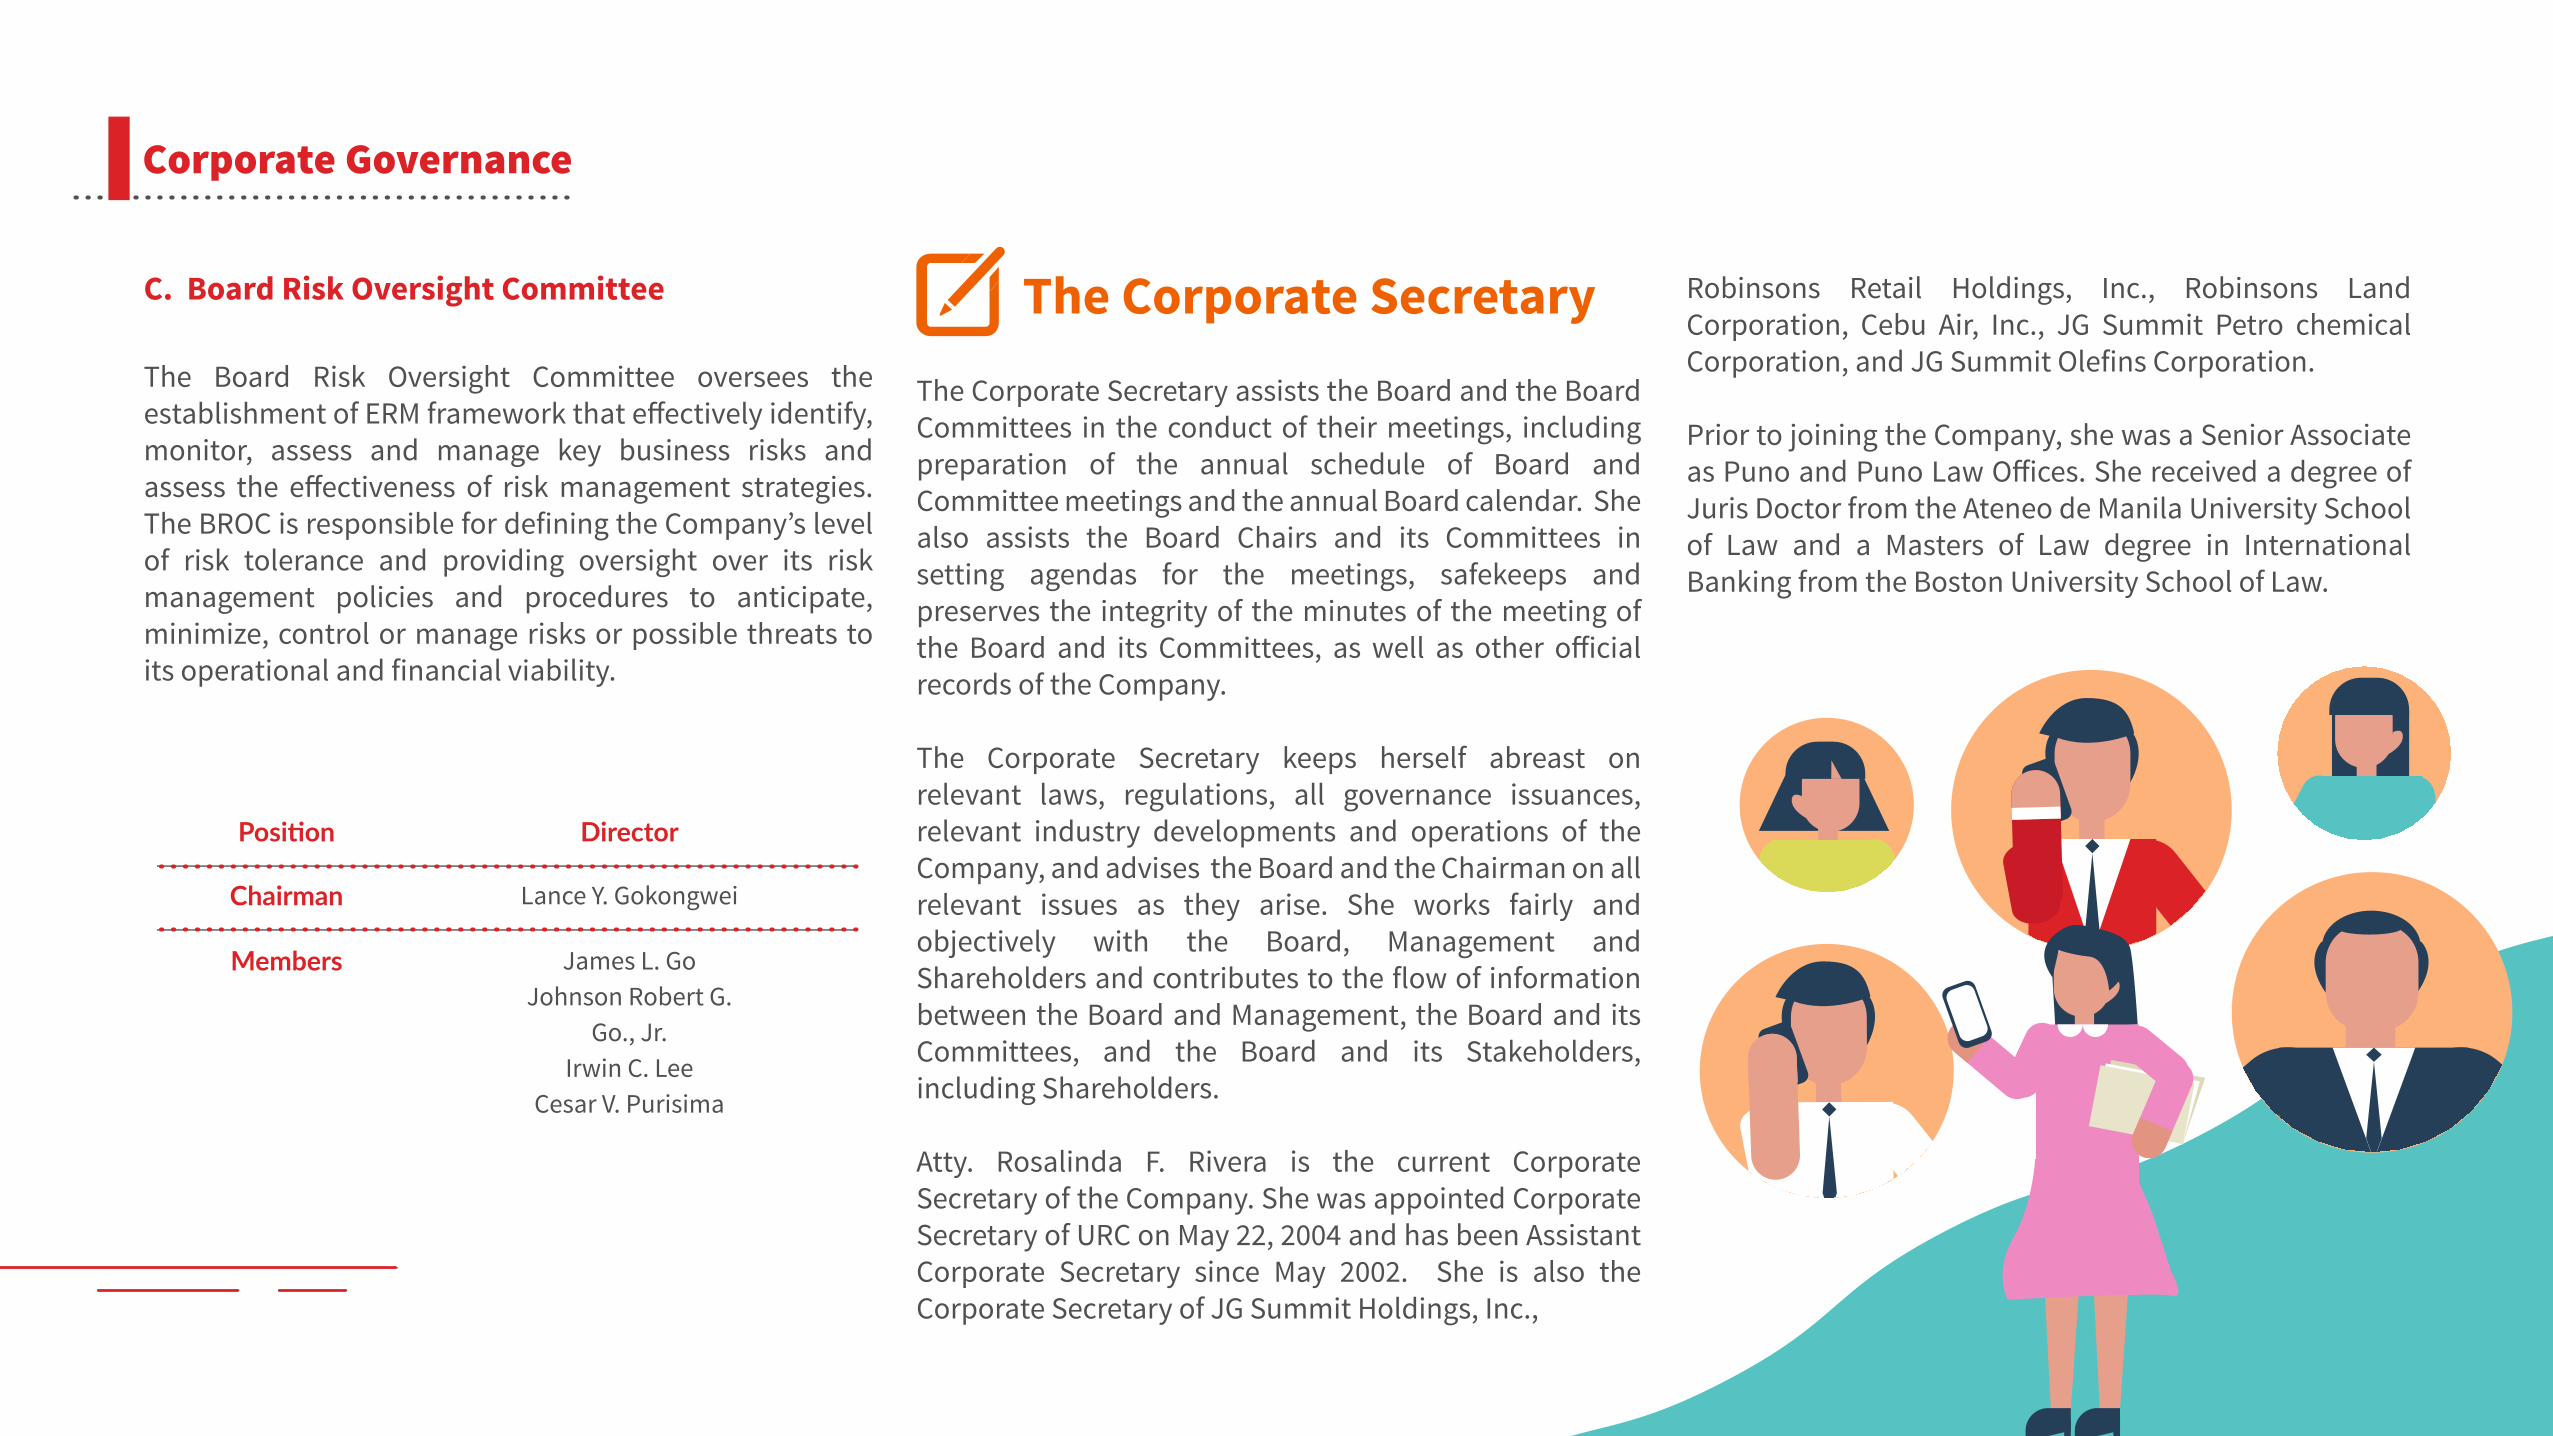
C. Board Risk Oversight Committee
The Board Risk Oversight Committee oversees the establishment of ERM framework that e�ectively identify, monitor, assess and manage key business risks and assess the e�ectiveness of risk management strategies. The BROC is responsible for defining the Company’s level of risk tolerance and providing oversight over its risk management policies and procedures to anticipate, minimize, control or manage risks or possible threats to its operational and financial viability.
Position
Chairman
Members
Director
Lance Y. Gokongwei
James L. Go Johnson Robert G.
Go., Jr.Irwin C. Lee
Cesar V. Purisima
The Corporate SecretaryThe Corporate Secretary assists the Board and the Board Committees in the conduct of their meetings, including preparation of the annual schedule of Board and Committee meetings and the annual Board calendar. She also assists the Board Chairs and its Committees in setting agendas for the meetings, safekeeps and preserves the integrity of the minutes of the meeting of the Board and its Committees, as well as other o�icial records of the Company.
The Corporate Secretary keeps herself abreast on relevant laws, regulations, all governance issuances, relevant industry developments and operations of the Company, and advises the Board and the Chairman on all relevant issues as they arise. She works fairly and objectively with the Board, Management and Shareholders and contributes to the flow of information between the Board and Management, the Board and its Committees, and the Board and its Stakeholders, including Shareholders.
Atty. Rosalinda F. Rivera is the current Corporate Secretary of the Company. She was appointed Corporate Secretary of URC on May 22, 2004 and has been Assistant Corporate Secretary since May 2002. She is also the Corporate Secretary of JG Summit Holdings, Inc.,
Robinsons Retail Holdings, Inc., Robinsons Land Corporation, Cebu Air, Inc., JG Summit Petro chemical Corporation, and JG Summit Olefins Corporation.
Prior to joining the Company, she was a Senior Associate as Puno and Puno Law O�ices. She received a degree of Juris Doctor from the Ateneo de Manila University School of Law and a Masters of Law degree in International Banking from the Boston University School of Law.
Corporate Governance

insert photo or vector
Corporate Governance
The Compliance O�icerThe Compliance O�icer monitors, reviews, evaluates and ensures the compliance by the Company; its O�icers and Directors with the provisions and requirements of the Corporate Governance Manual and the relevant laws, the Corporate Governance Code, rules and regulations and all governance issuances of regulatory agencies. She also ensures the integrity and accuracy of all documentary submissions to the regulators; identifies possible areas of compliance issues and works towards the resolution of the same. She assists the Board and the Corporate Governance Committee in the performance of their governance functions, including their duties to oversee the formulation or review and implementation of the Corporate Governance structure and policies of the Company.
Arlene S. Denzon is the current Compliance O�icer and Vice President of the Corporate Governance and Management Systems (CGMS) of JGSHI. She also serves as the Compliance O�icer of Robinsons Land Corporation and JG Summit Holdings, Inc. Prior to rejoining JGSHI in February 2013, she was the Senior Vice President and Chief Risk O�icer (SVP and CRO) in charge of the Enterprise-wide Risk Management Group of Digitel Mobile Philippines, Inc. (DMPI, more popularly known as Sun Cellular) until December, 2012. Ms. Denzon started her
career in the Gokongwei Group in 1991 and performed various roles including Accounting Manager of JGSHI until 1997, Assistant Vice President - Special Assistant to the Chairman until 2001, Vice President – Treasurer and Acting Chief Financial O�icer of URC International until 2003 before she was seconded to DMPI in 2004. Prior to JGSHI, Ms. Denzon had three years working experience as external auditor in Sycip, Gorres, Velayo & Co.
She is a Certified Public Accountant Board top-notcher and obtained her Bachelor of Accountancy degree, Magna Cum Laude, from the Polytechnic University of the Philippines.

Enterprise Risk Management
Through a sound Enterprise Risk Management (ERM) framework, the Company e�ectively identifies, monitors, assesses and manages key business risks. The framework guides the Board in identifying units/business lines and enterprise level risk exposures, as well as the e�ectiveness of risk management strategies.
The ERM framework revolves around the following eight interrelated risk management approaches:
“ The Company implemented systems and processes to facilitate proper risk identification, monitoring and control, which are key to e�ective corporate governance ”
Enterprise Risk Management, Accountability And AuditThe Company recognizes the increasing importance of sound risk management practices to drive business growth and sustainability. The Company implemented systems and processes to facilitate proper risk identification, monitoring and control, which are key to e�ective corporate governance. Timely and accurate management and financial reporting systems, internal controls, and audits are also employed to protect and maximize stakeholders’ value.
The Board oversees Management’s adoption and implementation of a sound risk management framework for identifying, monitoring and managing key risk areas. The BOD reviews Management reports with due diligence to enable the company to anticipate, minimize, control and manage risks or possible threats to its operational and financial viability.
1. Internal Environmental Scanning
It involves the review of the overall prevailing risk profile of the Business Unit (BU) to determine how risks are viewed and addressed by the management. This is presented during the strategic planning, annual budgeting and mid-year performance reviews of the BU.
3. Event Identification
It identifies both internal and external events a�ecting the Group’s set targets, distinguishing between risks and opportunities.
2. Objective Setting
The Company’s BOD mandates Management to set the overall annual targets through strategic planning activ-ities, in order to ensure that management has a process in place to set objectives that are aligned with the Company’s goals.
4. Risk Assessment
The identified risks are analyzed relative to the proba-bility and severity of potential loss that serves as basis for determining how the risks will be managed. The risks are further assessed as to which risks are controllable and uncontrollable, risks that require management’s action or monitoring, and risks that may materially weaken the Company’s earnings and capital.
5. Risk Response
The Company’s BOD, through the oversight role of the Internal Control Group ensures action plan is executed to mitigate risks, either to avoid, self-insure, reduce, transfer or share risk.
6. Control Activities
Policies and procedures are established and approved by the Company’s BOD and implemented to ensure that the risk responses are e�ectively carried out enterprise-wide.
Corporate Governance

The Risk Assessment Tool documents the following activities:
Through a sound Enterprise Risk Management (ERM) framework, the Company e�ectively identifies, monitors,
assesses and manages key business risks. The framework guides the Board in identifying units/business lines and enterprise level risk exposures, as well as the e�ectiveness of risk management strategies.
1. Risk Identification
Is the critical step of the risk management process. The objective of risk identification is the early identification of events that may have negative impact on the Company’s ability to achieve its goals and objectives.
1.1. Risk Indicator – is a potential event or action that may prevent the continuity of operation or business
1.2. Risk Driver – is an event or action that triggers the risk to materialize
1.3. Value Creation Opportunities – is the positive benefit of addressing or managing the risk
2. Identification of Existing Control Measures
Activities, actions or measures already in place to control, prevent or manage the risk.
3. Risk Rating/Score
Is the quantification of the likelihood and impact to the Company if the risk materializes. The rating has two (2) components:
3.1. Probability – the likelihood of occurrence of risk
3.2. Severity – the magnitude of the consequence of risk
4. Risk Management Strategy
Is the structured and coherent approach to managing the identified risk.
5. Risk Mitigation Action Plan
Is the overall approach to reduce the risk impact severity and/or probability of occurrence.
Results of the Risk Assessment Process is summarized in a Dashboard that highlights the risks that require urgent actions and mitigation plan. The dashboard helps Management to monitor, manage and decide a risk strategy and needed action plan.
7. Information and Communication
Relevant risk management information is identified, captured and communicated in form and substance that enable all personnel to perform their risk management roles.
8. Monitoring
The Internal Control Group of the respective Company and BUs and Corporate Internal Audit constantly monitor the management of risks through audit reviews, compliance checks, revalidation of risk strategies and performance reviews.
Risk Assessment Tool To help Business Units in the Risk Assessment Process, the Risk Assessment Tool, which is a database driven web application, was developed for departments and units to facilitate the assessment, monitoring and management of risks.
Corporate Governance

Corporate Governance
Internal ControlsAdequate and Timely Information To enable the Directors to properly fulfill their duties and responsibilities, Management provides the Directors with complete, adequate, and timely information about the matters to be taken up in their meetings. Information may include the background or explanation on matters brought before the Board, disclosures, budgets, forecasts, and internal financial documents. If the information provided by Management is not su�icient, further inquiries may be made by a Director to enable him to properly perform his duties and responsibilities. The Directors have independent access to Management and to the Corporate Secretary.
The Directors, either individually or as a Board, and in the performance of their duties and responsibilities, may seek access to independent professional advice within the guidelines set by the Board.
With the leadership of the Company’s Chief Financial O�icer (CFO), internal control is embedded in the operations of the company and in each BU thus increasing their accountability and ownership in the execution of the BU’s internal control framework. To accomplish the established goals and objectives, BUs implement robust and e�icient process controls to ensure:
Reliability and integrity of information
Compliance with policies, procedures, laws and regulations
Economic and efficient use of resources
Check and balance and proper segregation of duties
Identification and remediation control weaknesses
Proper safeguarding of company resources and protection of company assets through early detection and prevention of fraud
Corporate Governance
Accountability and Audit The Board ensures that its Shareholders are provided with a balanced and comprehensible assessment of the Company’s performance, position and prospects on a quarterly basis. Interim and other reports that could adversely a�ect its business are also made available in the Company website including its submissions and disclosures to the SEC and Philippine Stock Exchange (PSE). Management formulates the rules and procedures on financial reporting and internal control for presentation to the Audit Committee in accordance with the following guidelines:
1. The extent of its responsibility in the preparation of the financial statements of the Company, with the corresponding delineation of the responsibilities that pertain to the External Auditor, should be clearly defined;
2. An e�ective system of internal control that will ensure the integrity of the financial reports and protection of the assets of the Company for the benefit of all Shareholders and other Stakeholders;
3. On the basis of the approved Internal Audit Plan, Internal Audit examinations should cover, at the minimum, the evaluation of the adequacy and
e�ectiveness of controls that cover the Company’s governance, operations and information systems, including the reliability and integrity of financial and operation information, e�ectiveness and e�iciency of operations, protection of assets, and compliance with contracts, laws, rules, and regulations;
4. The Company consistently complies with the financial reporting requirements of the SEC;
5. The External Auditor shall be rotated or changed every five (5) years or earlier, or the signing partner of the External Auditing firm assigned to the Company, should be changed with the same frequency. The Corporate IA Head should submit to the Audit Committee and Management an annual report on the Internal Audit department’s activities, responsibilities, and performance relative to the Internal Audit Plan as approved by the Audit and Risk Committee. The annual report should include significant risk exposures, control issues, and such other matters as may be needed or requested by the Board and Management. The Internal Audit Head should certify that he conducts his activities in accordance with the International Standards on the Professional Practice of Internal Auditing. If he does not, the Internal Audit Head shall disclose to the Board and Management the reasons why he has not fully complied with the said documents; and
6. The Board, a�er consultations with the Audit Committee shall recommend to the Shareholders an External Auditor duly accredited by the SEC who shall undertake an independent audit of the Company, and shall provide an objective assurance on the matter by which the financial statements shall be prepared and presented to the Shareholders.

Corporate Governance
Internal Audit The Corporate Internal Audit is focused on delivering its mandate of determining whether the governance, risk management and control processes, as designed and represented by management, are adequate and functioning in a manner that provides reasonable level of confidence that:
1. Employees’ actions are compliant with policies, standards, procedures, and applicable laws and regulations;
2. Quality and continuous improvement are fostered in the control processes;
3. Programs, plans, and objectives are achieved;
4. Resources are acquired economically, used e�iciently, and protected adequately;
5. Significant financial, managerial, and operating information is accurate, reliable, and timely;
6. Significant key risks are appropriately identified and managed; and
7. Significant legislative or regulatory issues impacting the Company are recognized and properly addressed.
Opportunities for improving management control, profitability and the Company’s reputation may be identified during audits.
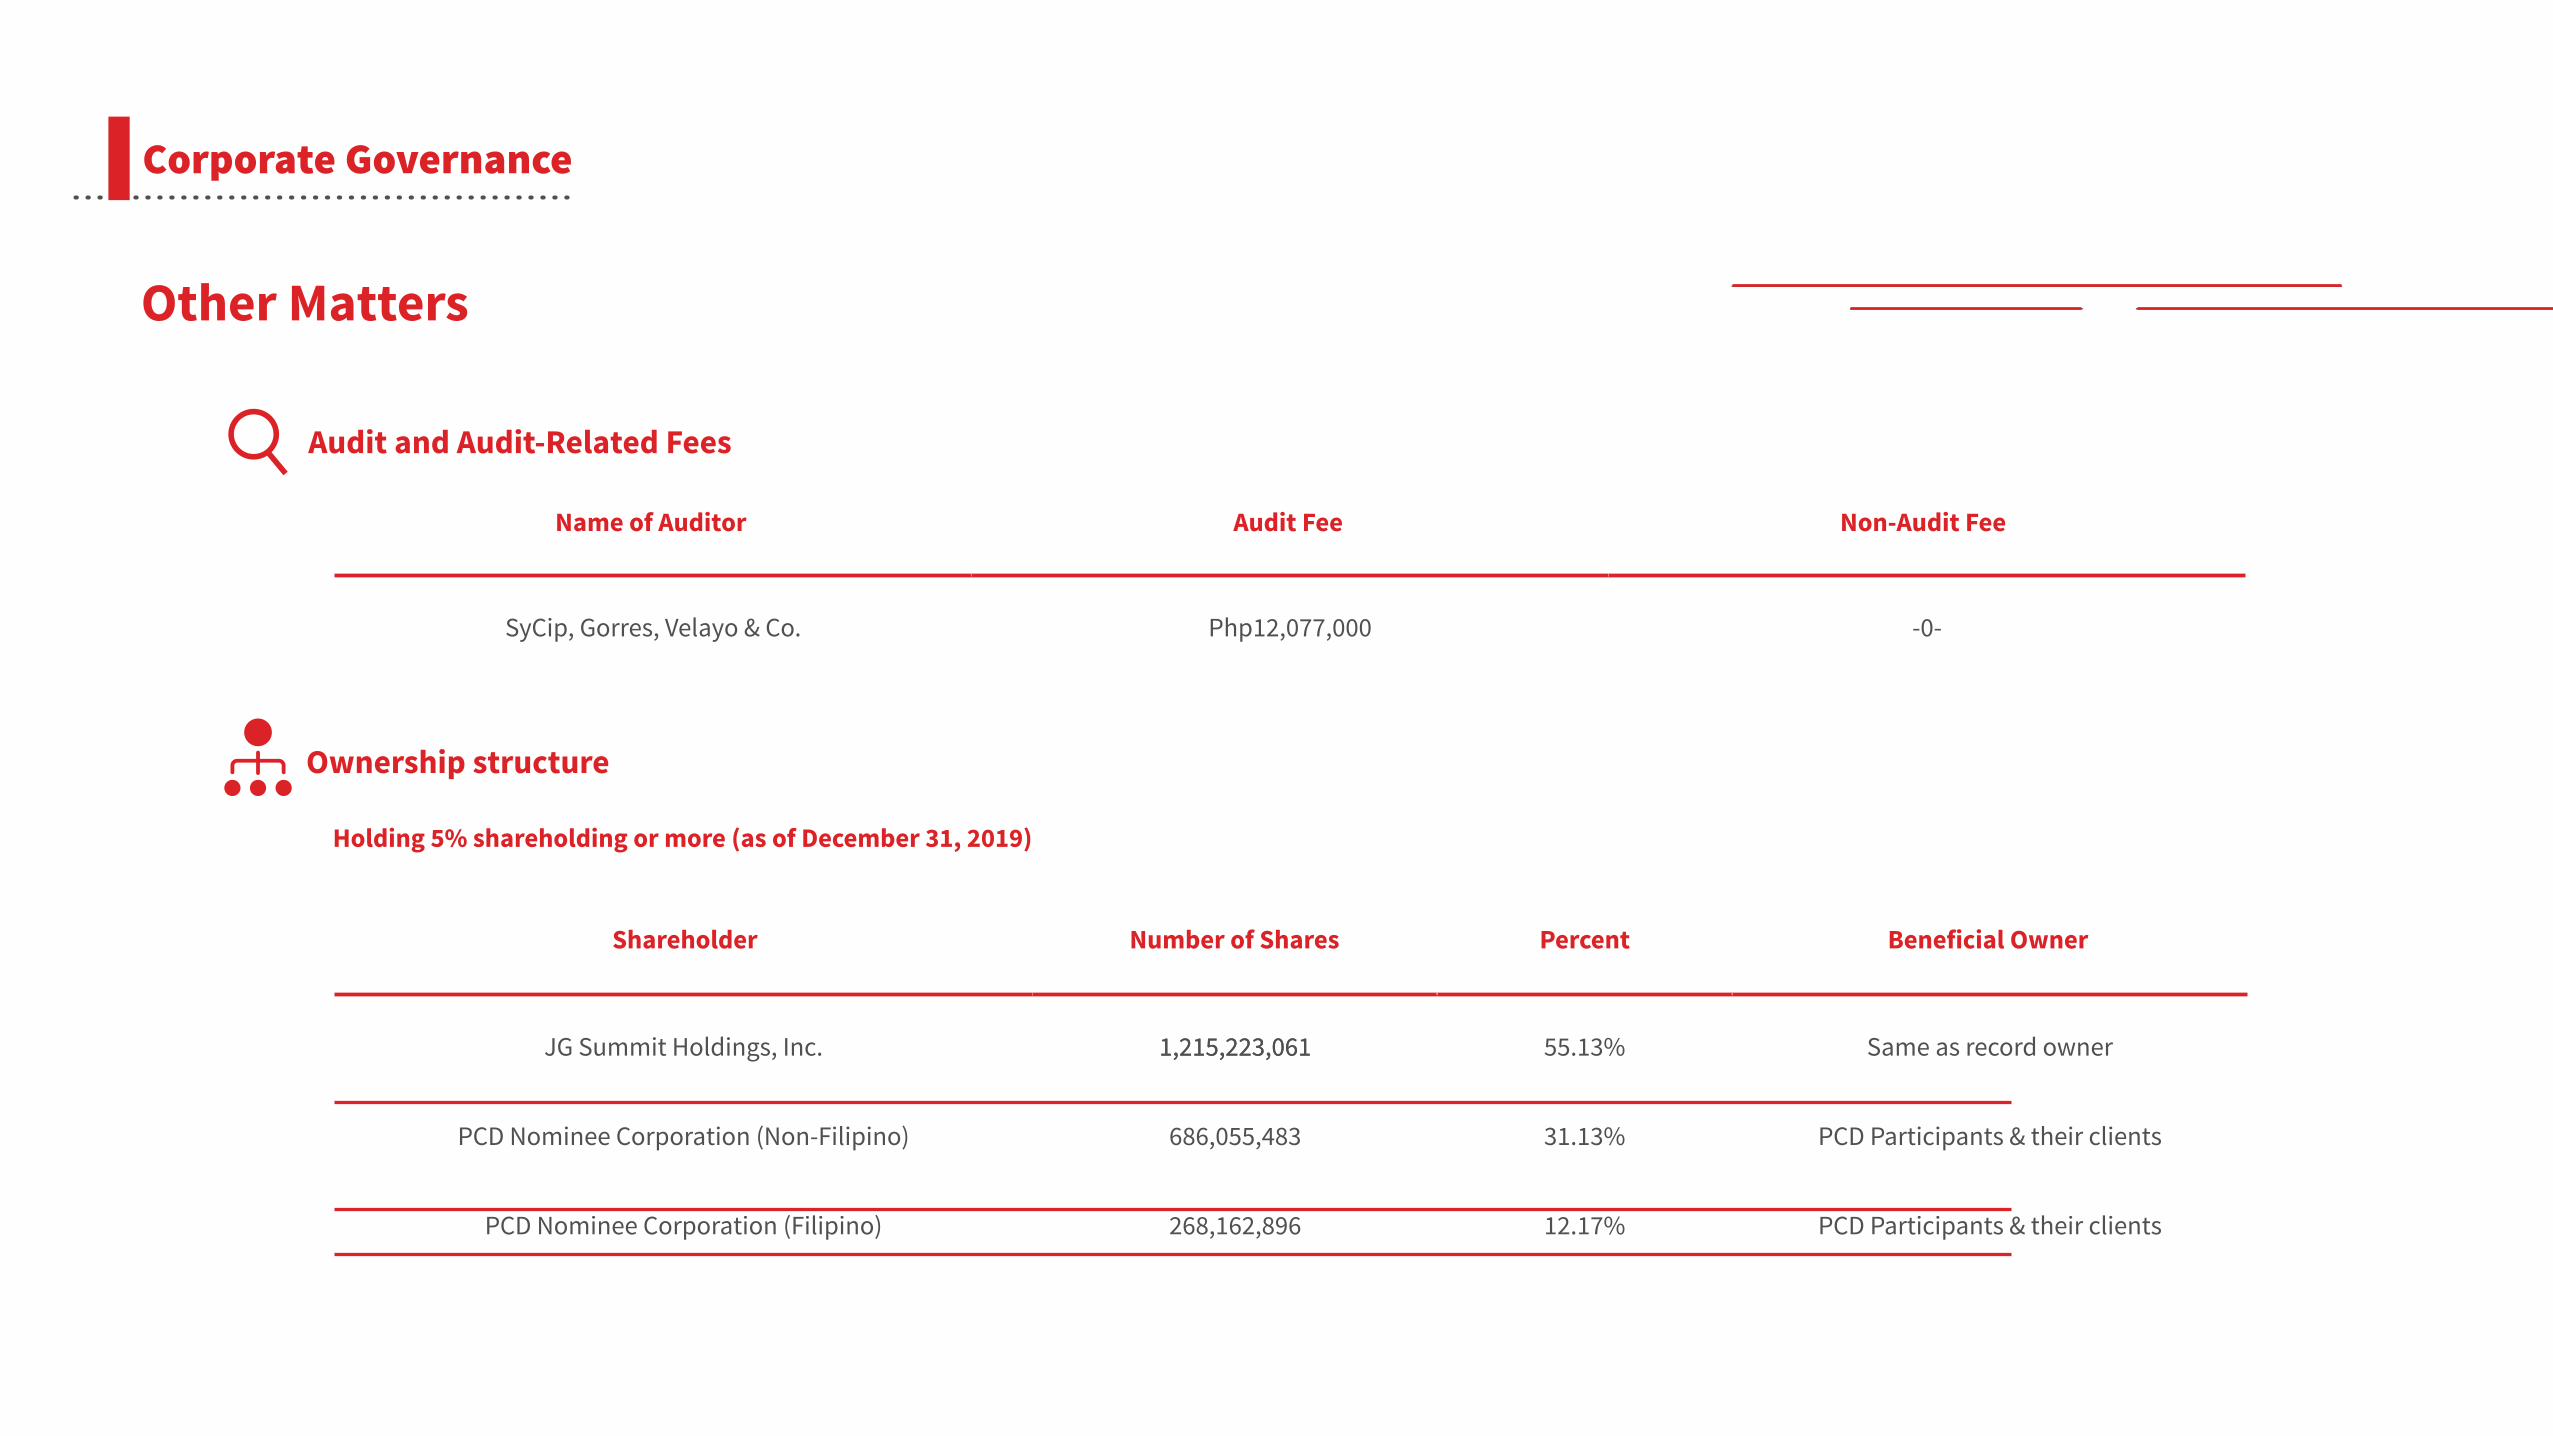
Corporate Governance
Other Matters
Audit and Audit-Related Fees
Name of Auditor
SyCip, Gorres, Velayo & Co. Php12,077,000 -0-
Audit Fee Non-Audit Fee
Ownership structure
Holding 5% shareholding or more (as of December 31, 2019)
Shareholder Number of Shares Percent Beneficial Owner
JG Summit Holdings, Inc. 1,215,223,0611,215,223,061 55.13% Same as record owner
PCD Participants & their clients
PCD Participants & their clients
31.13%
12.17%
686,055,483
268,162,896
PCD Nominee Corporation (Non-Filipino)
PCD Nominee Corporation (Filipino)
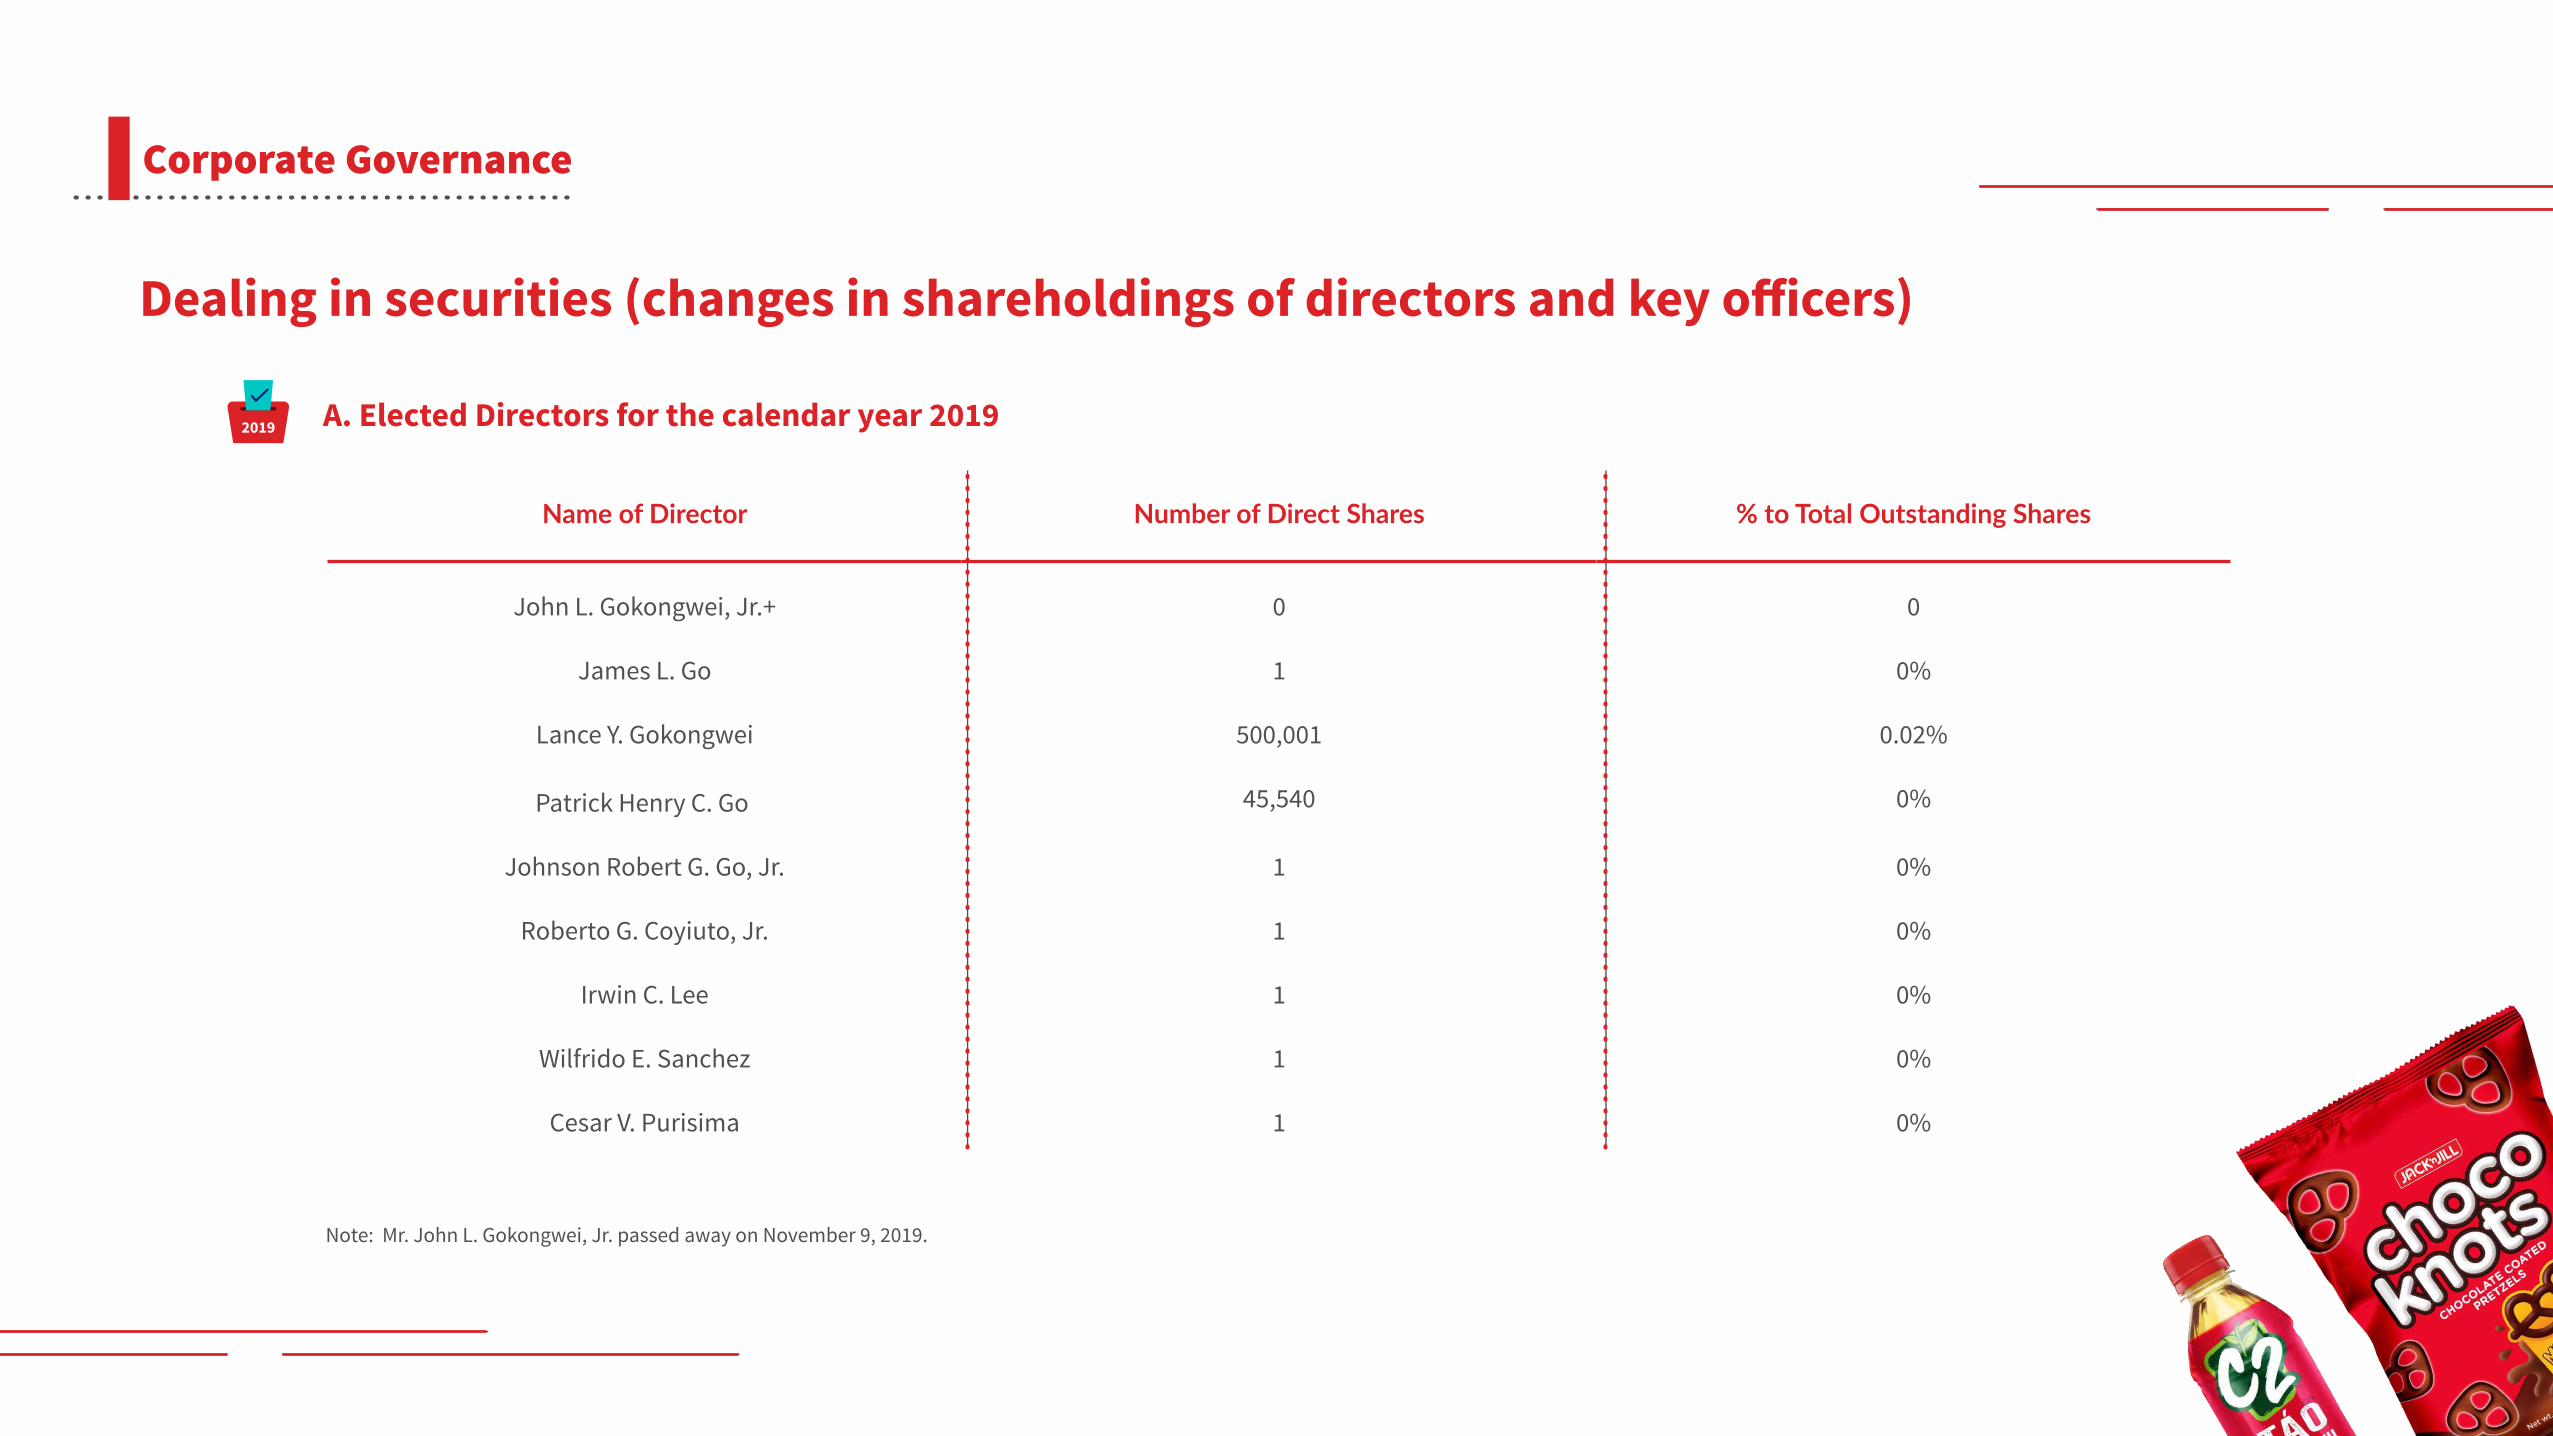
Corporate Governance
Note: Mr. John L. Gokongwei, Jr. passed away on November 9, 2019.
Name of Director
James L. Go 1 0%
Lance Y. Gokongwei 500,001 0.02%
45,540 0%Patrick Henry C. Go
Johnson Robert G. Go, Jr. 1 0%
Roberto G. Coyiuto, Jr. 1 0%
Irwin C. Lee 1 0%
Wilfrido E. Sanchez 1 0%
Cesar V. Purisima 1 0%
John L. Gokongwei, Jr.+ 0 0
Number of Direct Shares % to Total Outstanding Shares
Dealing in securities (changes in shareholdings of directors and key o�icers)
A. Elected Directors for the calendar year 2019

Name of O�icer Position/ Designation Number of Direct Shares
% to Total Outstanding Shares
Cornelio S. Mapa, Jr. Executive Vice President, Corporate Strategy 0 0%
0 0%Bach Johann M. Sebastian Senior Vice President, Digital Strategic and Investments Group
0%0Senior Vice PresidentDavid J. Lim, Jr.
0%0Francisco M. Del Mundo Senior Vice President and Chief Financial O�icer
0%25,000Michael P. Liwanag Senior Vice President, Investor Relations
0%Alan D. Surposa Senior Vice President and Chief Procurement O�icer 20,000
0%Chona R. Ferrer First Vice President 0
Marcia Y. Gokongwei Vice President 578,795 0.03%
0%Vice President 45,540Vincent Henry C. Go
0%Vice President 40,000Ellison Dean C. Lee
0%Vice President 40,000Renato P. Cabati
0%Vice President 8,855Anne Patricia C. Go
0%Vice President 0Socorro ML. Banting
0%Charles Bernard A. Tañega Treasurer 0
0%Rosalinda F. Rivera Corporate Secretary 0
0%Arlene S. Denzon Compliance O�icer 0
0%Anna Milagros D. David Chief Marketing O�icer 49,630
0%Vice PresidentTeofilo B. Eugenio, Jr. 0
B. Elected O�icers for the calendar year 2019
Corporate Governance
2019

Corporate Governance
b) Special Cash Dividend of One Peso and Sixty Five Centavos (P1.65) per share and paid on July 25, 2019
a) Regular Cash Dividend of One Peso and Fi�y Centavos (P1.50) per share and paid on March 28, 2019 and
Company Website The Company updates the public with operating and financial results through timely disclosures filed with SEC and PSE. These are available on the company’s website: www.urc.com.ph
DividendsThe Board of Directors of Universal Robina Corporation ("URC") approved on February 28, 2019 the declaration of the following cash dividends from the unrestricted retained earnings of URC as of December 31, 2018:

BOD andExecutiveOfficers
Annual Report 2019

BOD and Executive O�icers
Board of Directors
Lance Y. GokongweiChairman
Irwin C. LeePresident & Chief Executive O�icer
Johnson Robert G. Go, Jr.Director
James L. GoChairman Emeritus
Patrick Henry C. GoDirector
Robert G. Coyiuto, Jr.Director
Wilfrido E. SanchezIndependent Director
Cesar V. PurisimaIndependent Director
Advisory Board
Pascual S. GuerzonAdvisory Board

Corporate O�icers
Irwin C. LeePresident and Chief Executive O�icer
Anna Milagros D. DavidChief Marketing O�icer
Francisco M. del MundoChief Financial O�icer
Ma. Celia H. Fernandez-EstavilloChief Legal Counsel
David J. Lim Jr.Senior Vice President,Quality, Engineering, Sustainability & Technical Services
Michael P. LiwanagSenior Vice President andInvestor Relations O�icer
Carlos G. SantosChief Information O�icer
Elisa O. AbalajonVice President, Human Resources
Adriano M. Diaz de RiveraVice President, Supply Chain Planning & Logistics
Anne Patricia C. GoVice President, Marketing Services
Krishna Mohan SuriVice President,Global Innovation, Research & Development
Rebecca YapVice President, Procurement
Socorro ML. BantingVice President
Rosalinda F. RiveraCorporate Secretary
Arlene S. DenzonCompliance O�icer
Charles Bernard A. TañegaCorporate Treasurer
BOD and Executive O�icers

Executive Management Team
Paul A. MusgraveCEO, URC Oceania
Francis Emmanuel B. PunoSenior Vice President and Regional Director, URC Indonesia, Malaysia and Singapore
Laurent LevanSenior Vice President and Regional Director, URC Indochina
Jean Pierre S. GamboaGeneral Manager, China and Frontier Markets
Premchai NavarasuchitrGeneral Manager, Thailand
Taufiqurrahman Basthami STGeneral Manager, Indonesia
Keerati ChuplangGeneral Manager, Myanmar
Marcia Y. GokongweiCo-Managing Director, Operations,URC BCFG
Anna Milagros D. DavidCo-Managing Director, URC BCFG PH Brands & Categories
Renato P. CabatiManaging Director, Sugar & Renewables (SURE)
Vincent Henry C. GoManaging Director, Agro-Industrial Group (AIG) and Food Services
Ellison Dean C. LeeManaging Director, Flour and Breads
Brian M. GoVice President Global Export & Frontier Markets
Teofilo B. Eugenio, Jr.Vice President & General Manager, Nissin URC and Pasta
Oscar VillamoraVice President, Customer Development,Southeast Asia (SEA)
David RoosGeneral Manager, Danone URC
Maria Sarah P. AlbertGeneral Manager, Vitasoy URC
Ramon C. AgustinesGeneral Manager, Packaging
BOD and Executive O�icers

Annual Report 2019
Directory
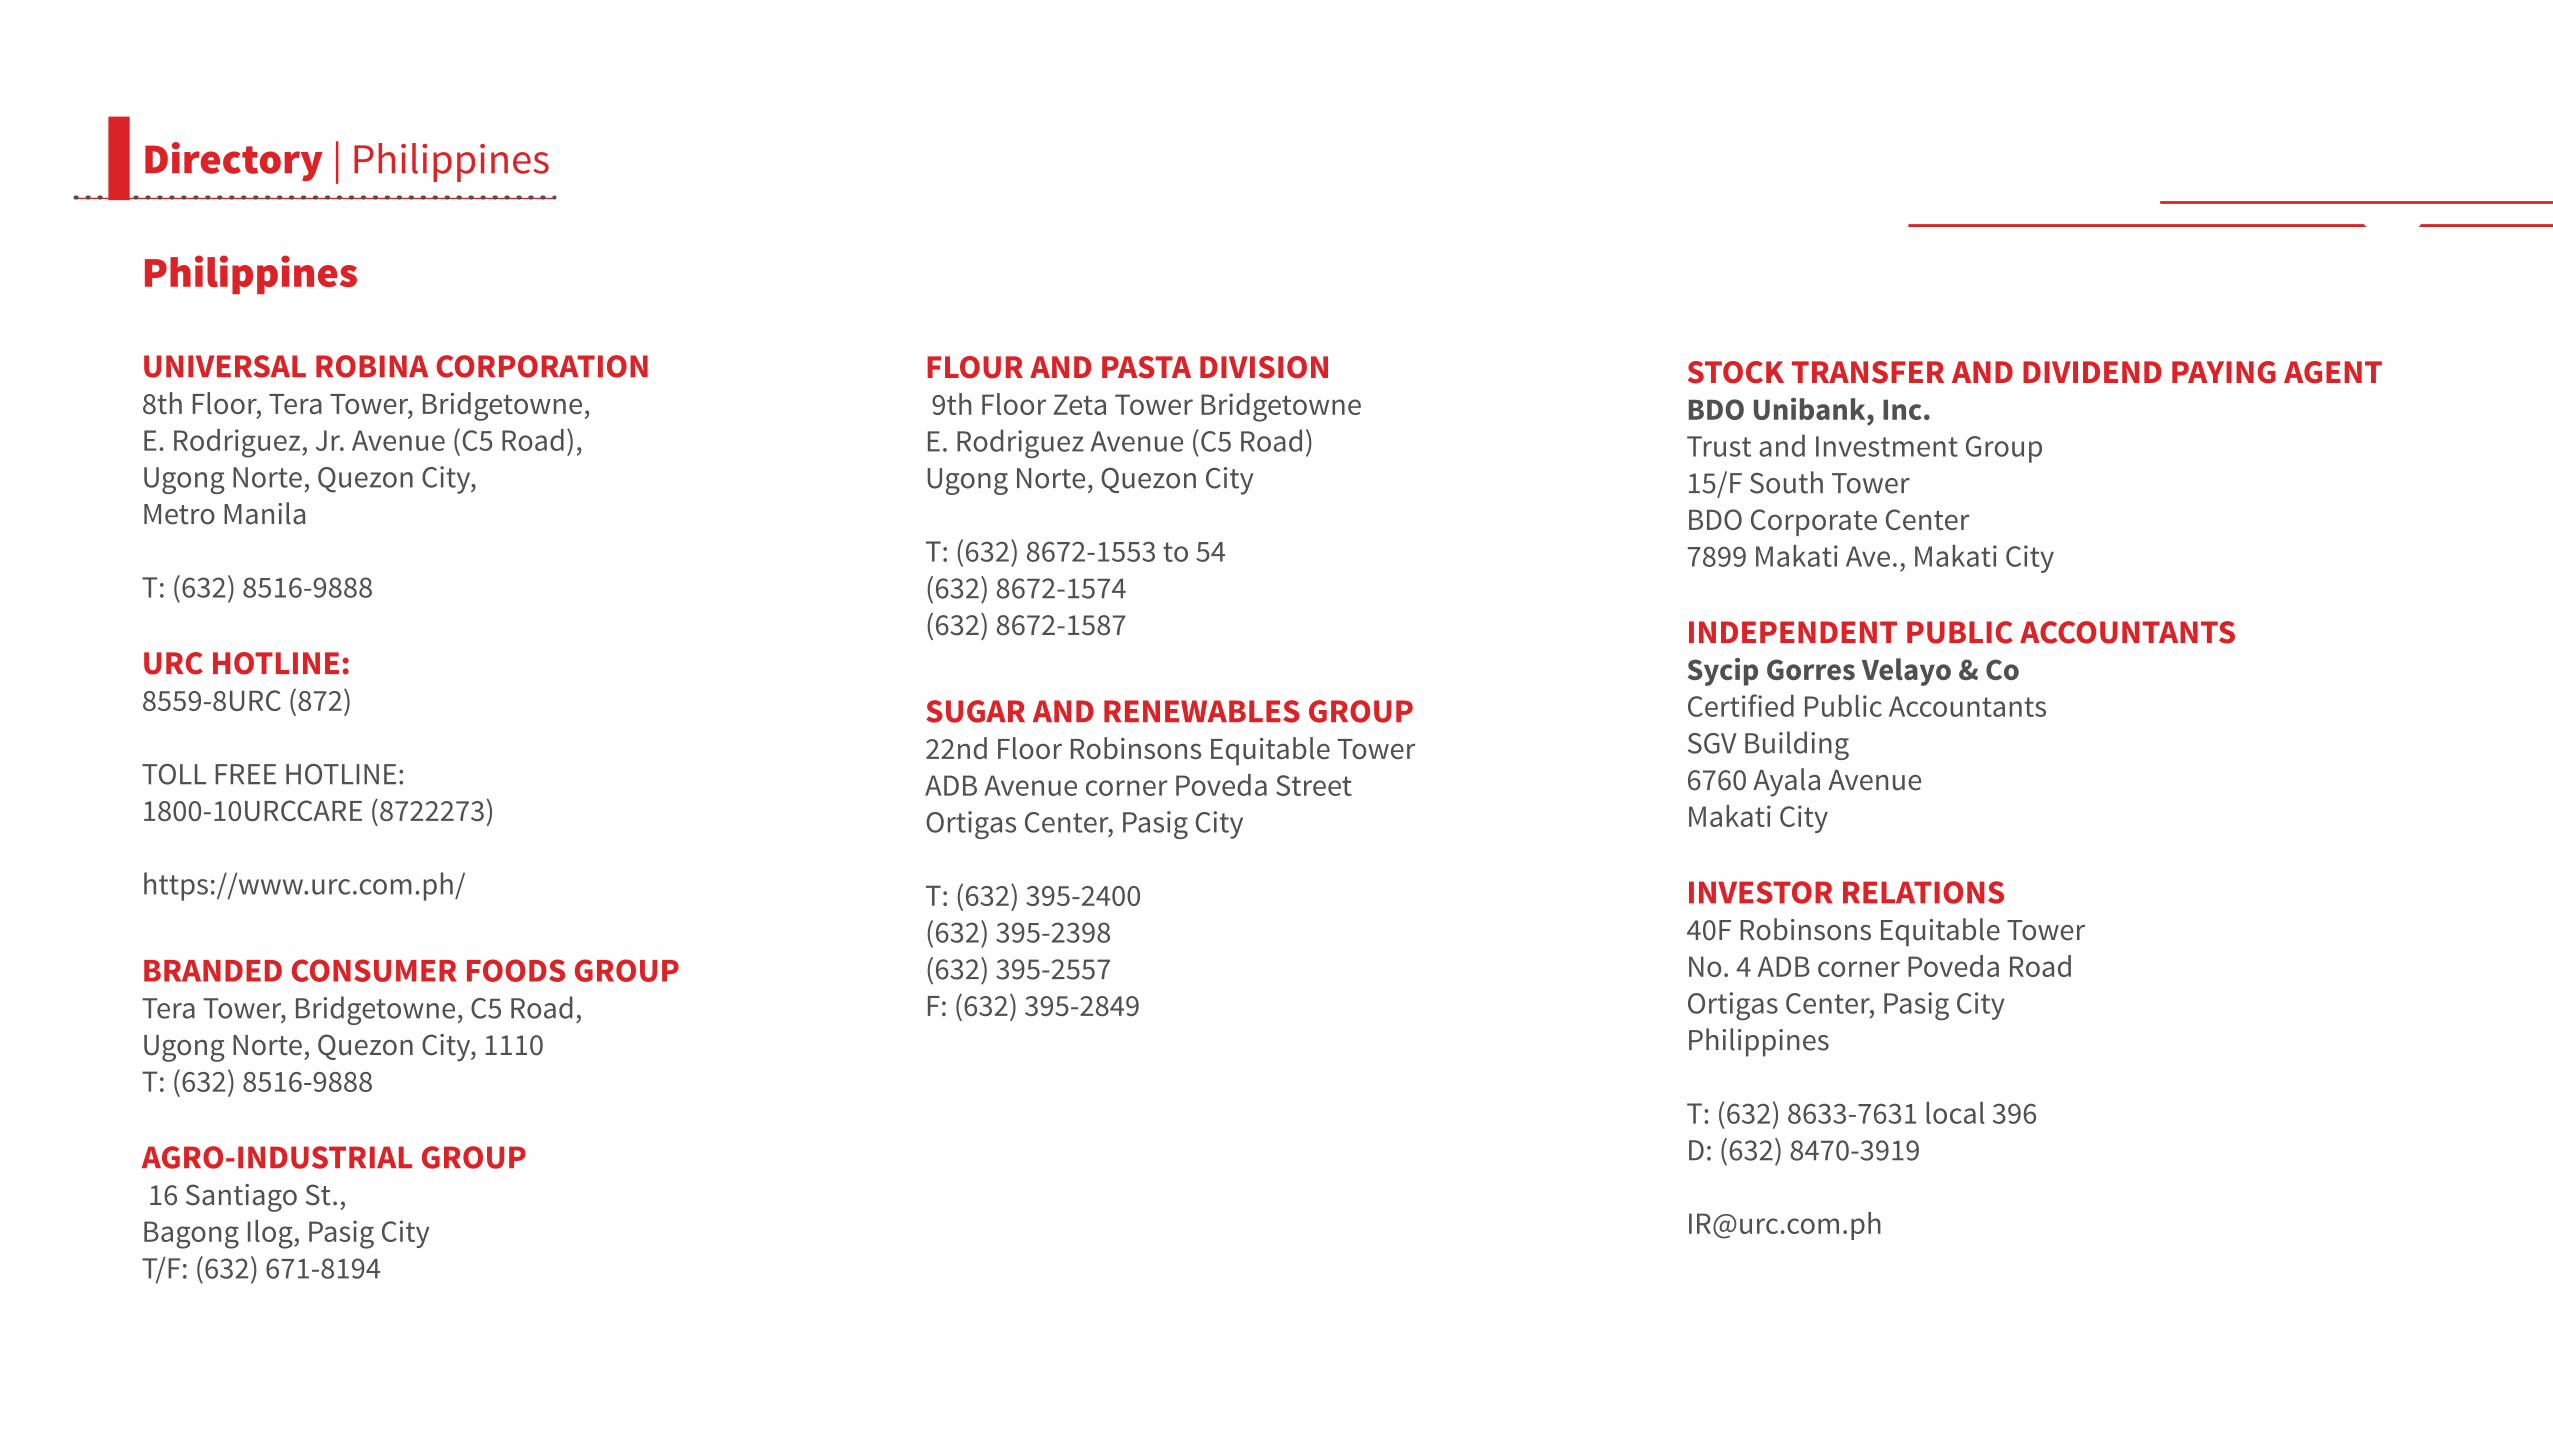
Philippines
UNIVERSAL ROBINA CORPORATION8th Floor, Tera Tower, Bridgetowne,E. Rodriguez, Jr. Avenue (C5 Road),Ugong Norte, Quezon City,Metro Manila
T: (632) 8516-9888
URC HOTLINE: 8559-8URC (872)
TOLL FREE HOTLINE:1800-10URCCARE (8722273)
https://www.urc.com.ph/
BRANDED CONSUMER FOODS GROUPTera Tower, Bridgetowne, C5 Road,Ugong Norte, Quezon City, 1110T: (632) 8516-9888
AGRO-INDUSTRIAL GROUP 16 Santiago St.,Bagong Ilog, Pasig CityT/F: (632) 671-8194
FLOUR AND PASTA DIVISION 9th Floor Zeta Tower BridgetowneE. Rodriguez Avenue (C5 Road)Ugong Norte, Quezon City
T: (632) 8672-1553 to 54(632) 8672-1574(632) 8672-1587
SUGAR AND RENEWABLES GROUP22nd Floor Robinsons Equitable TowerADB Avenue corner Poveda StreetOrtigas Center, Pasig City
T: (632) 395-2400(632) 395-2398(632) 395-2557F: (632) 395-2849
STOCK TRANSFER AND DIVIDEND PAYING AGENTBDO Unibank, Inc.Trust and Investment Group15/F South TowerBDO Corporate Center7899 Makati Ave., Makati City
INDEPENDENT PUBLIC ACCOUNTANTSSycip Gorres Velayo & CoCertified Public AccountantsSGV Building6760 Ayala AvenueMakati City
INVESTOR RELATIONS40F Robinsons Equitable TowerNo. 4 ADB corner Poveda RoadOrtigas Center, Pasig CityPhilippines
T: (632) 8633-7631 local 396D: (632) 8470-3919
Directory | Philippines

MALAYSIA - JBURC Snack Foods (Malaysia)Sdn Bhd-Head O�ice/FactoryPLO 370 Jalan Perak Tiga,Kawasan Perindustrian, Pasir Gudang,81700 Pasir Gudang,Johor Bahru, Malaysia
T: 607-2598000
MYANMARURC Myanmar Co., LtdPlot No.B-6 and B-7,Mingaladon Industrial Park,Mingaladon Township, Yangon Region,The Republic of the Union of Myanmar
T: (+95)-1 – 639102-5
Directory | International
International
CHINAURC-China Commercial Co., Ltd.Unit H, 20th floor, Kaikai Building,No. 888 Wanhangdu Road, Jing-an District 200042, Shanghai, People’s Republic of China
T: +86 21 52901367
HONG KONGURC Hong Kong Co. Ltd.Units C&D, 18/F, Montery Plaza,15 Chong Yip Street, Kwun Tong,Kowloon, Hong Kong
T: +852 2717-1478
INDONESIAPT URC Indonesia Head O�ice/ FactoryJl. Sulawesi Blok M-27MM2100 Industrial Town,Cikarang Barat, Bekasi 17530Indonesia
T: 6221-899 82585F: 6221-8998 1625
PT URC Indonesia Marketing & Sales O�iceMenara Hijau, Floor. 6,Jl MT Haryono Kav. 33,Jakarta 12770 Indonesia
T: 6221-7919 2009F: 6221-798 5875
MALAYSIA - KLURC Snack Foods (Malaysia)Sdn Bhd-Marketing & Sales O�iceNo.1 Jalan Jurunilai U1/20,Seksyen U1 HicomGlenmarie Industrial Park40150 Shah Alam, Selangor Darul Ehsan
T: 603-55695855603-55694561 to 63
F: 603-55691775603-55695993

Directory | International
International
OCEANIAGri�in’s Food CompanyBuilding C, Level 2, Millennium Centre,600 Great South Road, EllersliePO Box 9129, Newmarket 1149Auckland, New Zealand
Snack Brands AustraliaBuilding E, Level 3, 24-32Lexington Drive, Bella Vista,New South Wales 2153Australia
T: (+61)-2-88870888F: (+61)-2-88870800
THAILANDURC (Thailand) Co., Ltd. Head O�ice44,46 Thanon Rat Phatthana,Khwaeng Rat Phatthana,Khet Saphan Sung, Krung Thep Maha NakhonBangkok, 10240 Thailand
T: 662-5174800F: 662-5171416
URC (Thailand) Co., LtdThailand FactorySamutsakorn Industrial Estate,1/123, Moo 2, Sub-District Thasai,Samutsakorn 74000
T: 6634-490031 to 3T: 6634-490034
VIETNAMURC Viet Nam Co. Ltd.Head O�ice/ FactoryNo. 42, VSIP Tu Do Boulevard,Vietnam Singapore Industrial Park,An Phu Ward, Thuan An City,Binh Duong Province, Vietnam
T: 84-274-3767010F: 84-274-3767025
URC Viet Nam Co. Ltd.Ho Chi Minh City O�ice9th Floor, CT Plaza, No.60ATruong Son Street, Ward 2,Tan Binh District,Ho Chi Minh City, Vietnam
T: 84-28-62969676F: 84-28-62969675
SINGAPOREURC Foods (Singapore) Pte Ltd.168 Tagore Lane, Singapore 787574T: 65-65520314F: 65-65520127
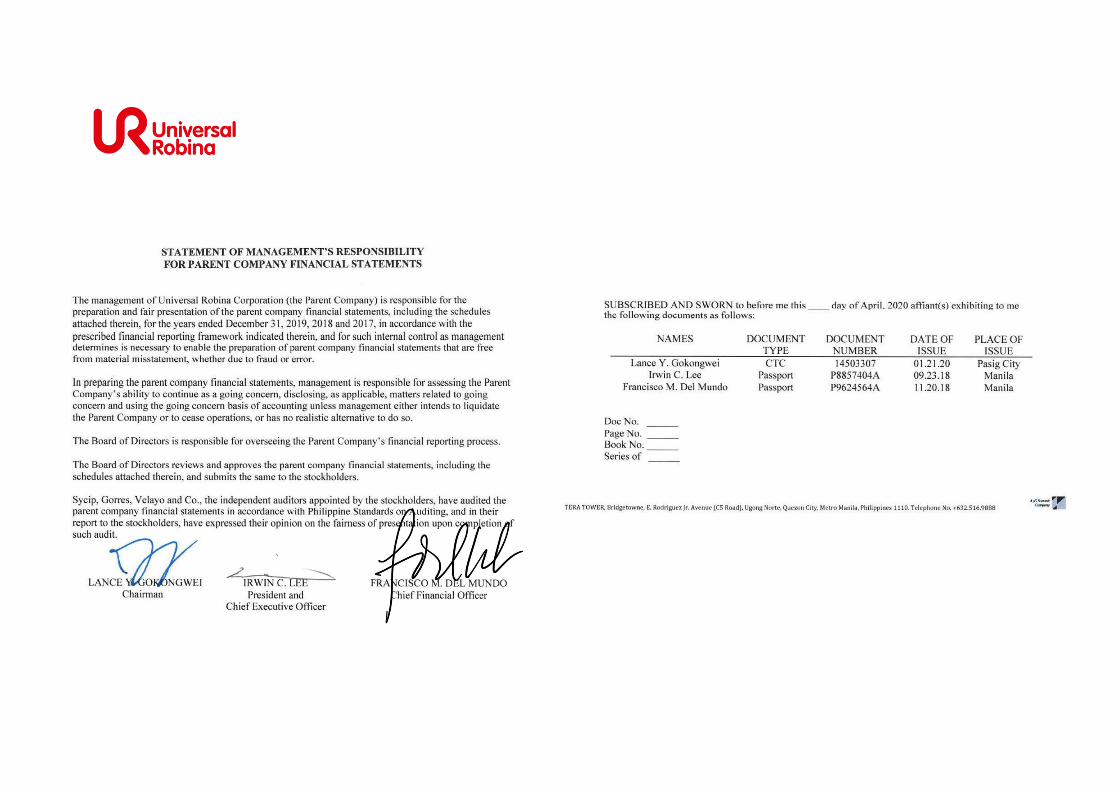
INDEPENDENT AUDITOR’S REPORT The Stockholders and the Board of Directors Universal Robina Corporation 8th Floor, Tera Tower, Bridgetowne E. Rodriguez, Jr. Avenue (C5 Road) Ugong Norte, Quezon City, Metro Manila Opinion We have audited the consolidated financial statements of Universal Robina Corporation and its subsidiaries (the Group), which comprise the consolidated statements of financial position as at December 31, 2019 and 2018, and the consolidated statements of income, consolidated statements of comprehensive income, consolidated statements of changes in equity and consolidated statements of cash flows for each of the three years in the period ended December 31, 2019 and the notes to the consolidated financial statements, including a summary of significant accounting policies. In our opinion, the accompanying consolidated financial statements present fairly, in all material respects, the consolidated financial position of the Group as at December 31, 2019 and 2018, and its consolidated financial performance and its consolidated cash flows for each of the three years in the period ended December 31, 2019 in accordance with Philippine Financial Reporting Standards (PFRSs). Basis for Opinion We conducted our audits in accordance with Philippine Standards on Auditing (PSAs). Our responsibilities under those standards are further described in the Auditor’s Responsibilities for the Audit of the Consolidated Financial Statements section of our report. We are independent of the Group in accordance with the Code of Ethics for Professional Accountants in the Philippines (Code of Ethics) together with the ethical requirements that are relevant to our audit of the consolidated financial statements in the Philippines, and we have fulfilled our other ethical responsibilities in accordance with these requirements and the Code of Ethics. We believe that the audit evidence we have obtained is sufficient and appropriate to provide a basis for our opinion.

- 2 -
Key Audit Matters A key audit matter is one that, in our professional judgment, was of most significance in our audit of the consolidated financial statements of the current period. The matter below was addressed in the context of our audit of the consolidated financial statements as a whole, and in forming our opinion thereon, and we do not provide a separate opinion on this matter. The description of how our audit addressed the matter is provided in that context. We have fulfilled the responsibilities described in the Auditor’s Responsibilities for the Audit of the Consolidated Financial Statements section of our report, including in relation to these matters. Accordingly, our audit included the performance of procedures designed to respond to our assessment of the risks of material misstatement of the consolidated financial statements. The results of our audit procedures, including the procedures performed to address the matters below, provide the basis for our audit opinion on the accompanying consolidated financial statements. Recoverability of Goodwill and Intangible Assets As of December 31, 2019, the Group’s goodwill attributable to the acquisition of Consolidated Snacks, Pty. Ltd., Griffin’s Food Limited and other acquired entities amounted to P=31.2 billion. The Group’s intangible assets with indefinite useful lives pertaining to trademarks and product formulation amounted to P=9.4 billion and P=0.4 billion, respectively. These items are significant to the consolidated financial statements. Under PFRS, the Group is required to test annually the amount of goodwill and intangible assets with indefinite useful lives for impairment. Accordingly, management has performed an impairment test on its goodwill and other intangible assets with indefinite useful lives. In addition, management’s assessment process requires significant judgment and is based on assumptions, specifically revenue growth rate, discount rate and the terminal growth rate. The Group’s disclosures about goodwill and intangible assets are included in Notes 3 and 15 to the consolidated financial statements. Audit response We reviewed the value in use and fair value less costs to sell calculations (FVLCTS) prepared by management. We involved our internal specialists in evaluating the methodologies and the assumptions used. These assumptions include revenue growth rate, discount rate and the terminal growth rate. We compared the key assumptions used, such as revenue growth and terminal growth rates against the historical performance of the cash generating unit (CGU), industry/market outlook and other relevant external data. We also assessed the reasonableness of the discount rate used by comparing these against entities with similar risk profiles and market information. For FVLCTS calculations, we evaluated the reasonableness of the valuation by comparison with recent comparative market transactions. We also reviewed the Group’s disclosures about those assumptions to which the outcome of the impairment test is most sensitive, specifically those that have the most significant effect on the determination of the recoverable amount of goodwill and intangible assets with indefinite useful lives.
- 3 -
Adoption of PFRS 16, Leases Effective January 1, 2019, the Group adopted the new lease standard, PFRS 16, Leases, under the modified retrospective approach. This new standard resulted to significant changes in the Group’s lease recognition policies, procedures and controls. The Group’s adoption of PFRS 16 is significant to our audit because the amounts that were recognized as a result of the adoption significantly affect the consolidated financial statements. In addition, the implementation of PFRS 16 involves application of significant management judgement and estimation in the following areas: (1) whether the contract contains a lease; (2) determining the lease term, including evaluating whether the Group has the ability to exercise options to extend the lease; (3) determining the incremental borrowing rates; and (4) selection and application of accounting policy elections and practical expedients available under the modified retrospective approach. The Group recognized an increase in right-of-use (ROU) assets and lease liabilities both amounting to P=3.2 billion as of January 1, 2019. In addition, the Group recognized amortization expense and interest expense of P=673.8 million and P=188.4 million, respectively, for the year ended December 31, 2019. The disclosures related to the adoption of PFRS 16 are included in Note 36 to the consolidated financial statements. Audit response We obtained an understanding of the Group’s implementation process for PFRS 16. This included the determination of the population of the lease contracts covered by PFRS 16, the selection of the transition approach and the election of available practical expedients. This also included the calculation of the financial impact of transition and gathering of information used in this calculation. We selected sample lease agreements (i.e., lease agreements existing prior to the adoption of PFRS 16 and new lease agreements in 2019) from the lease contract database and identified their contractual terms and conditions. We traced these selected contracts to the lease calculation prepared by management, which covers the calculation of financial impact of PFRS 16, including the transition adjustments. We tested the underlying lease data used (e.g., lease payments, lease term) by agreeing the terms of the selected contracts with the lease calculation. For selected lease contracts with renewal options, we reviewed management’s assessment of whether it is reasonably certain that the Group will exercise the option to renew. We tested the parameters used in the determination of the incremental borrowing rate by reference to market data. We test computed the lease calculation prepared by management, including the transition adjustments.

- 4 -
We reviewed the disclosures related to leases, including the transition adjustments, based on the requirements of PFRS 16 and PAS 8, Accounting Policies, Changes in Accounting Estimates and Errors. Sugar Revenue Recognition Effective January 1, 2019, the Group adopted the new revenue recognition guidance for sugar millers under Philippine Interpretations Committee (PIC) Questions and Answers (Q&A) No. 2019-03. This PIC Q&A addresses industry issues on the application of PFRS 15, Revenue from Contracts with Customers, by sugar millers. The adoption of PIC Q&A 2019-03 resulted in significant changes in the Group’s revenue recognition policies, procedures and controls. The adoption is significant to our audit because this involves application of significant management judgment and estimation in: (1) identifying output sharing and cane purchase agreements; (2) determining whether criteria for recognizing revenue on output sharing arrangements are met; (3) determining whether there are other promises in the contract that are separate performance obligations; and (4) determining the timing of the satisfaction of each performance obligation. Refer to Notes 2 and 3 of the consolidated financial statements for the disclosure in relation to the adoption of revenue recognition guidance for sugar millers. Audit response We obtained an understanding of the Group’s process in implementing the new revenue recognition guidance. We reviewed the Group’s adoption papers and accounting policies prepared by management, including revenue stream identification and scoping, and contract analysis. We also confirmed our understanding of the Group’s milling and purchase arrangements with its customers. We reviewed whether the accounting policies appropriately apply the five-step model and recognition and measurement requirements of PFRS 15 to these milling arrangements. In addition, we checked whether management has identified and estimated all components of the transaction price (variable consideration and consideration payable to a customer) and applied the constraint on variable consideration. We evaluated management’s assumptions (historical trend of purchases from planters, sugar prices) by comparing the historical experience of the Group with the assumptions used in its estimates as it relates to the transaction price. We also reviewed the application of the accounting policy in relation to the adoption of the new standard, as well as the related disclosures.
- 5 -
Accounting for Intersnack Group GmbH (Intersnack)’s Investment in Uni Snack Holding Company Ltd. (UHC) On December 23, 2019, the Group sold 40% of its consolidated businesses in Australia and New Zealand to Intersnack through the issuance by UHC of shares of stock representing 40% of its issued capital, giving rise to P=5.0 billion in non-controlling interest; this was in exchange for P=7.2 billion of cash and 100% ownership interest in Yarra Valley Snack Foods Pty Ltd (Yarra Valley). As part of the transaction, Intersnack also has the option to purchase up to an additional 9% interest in UHC. These transactions were accounted for as a single equity transaction without the Group losing control over UHC. These transactions are significant to our audit as the amounts involved are material to the consolidated financial statements. In addition, accounting for these transactions required significant management judgments and estimates, which include the assessment of retention of control, accounting for the purchase option and the determination of the fair values of assets and liabilities assumed as part of consideration. Refer to Notes 3, 9 and 22 to the consolidated financial statements for details on the transactions. Audit response We obtained and reviewed the relevant contracts and agreements related to the transactions. We evaluated management’s judgments on the group retaining control over UHC, and whether the purchase option gives Intersnack present access to the corresponding economic returns from UHC. We reviewed the identification of the underlying assets and liabilities of Yarra Valley and the provisional fair values determined based on our understanding of the acquired entity’s business and management’s explanations on the rationale for the transaction. We reviewed the calculation of non-controlling interest and equity reserve arising from the transaction. We involved our internal specialists in reviewing the valuation methodology and evaluating the inputs used in determining the fair value of the purchase option. We also reviewed management’s judgments on the classification and measurement of the purchase option. We reviewed the presentation and disclosures of this transaction in the consolidated financial statements. Other Information Management is responsible for the other information. The other information comprises the SEC Form 17-A for the year ended December 31, 2019 (but does not include the consolidated financial statements and our auditor’s report thereon), which we obtained prior to the date of this auditor’s report, and the SEC Form 20-IS (Definitive Information Statement) and Annual Report for the year ended December 31, 2019, which are expected to be made available to us after that date. Our opinion on the consolidated financial statements does not cover the other information and we do not and will not express any form of assurance conclusion thereon. In connection with our audits of the consolidated financial statements, our responsibility is to read the other information identified above and, in doing so, consider whether the other information is materially inconsistent with the consolidated financial statements or our knowledge obtained in the audits, or otherwise appears to be materially misstated.
- 6 -
If, based on the work we have performed on the other information that we obtained prior to the date of this auditor’s report, we conclude that there is a material misstatement of this other information, we are required to report that fact. We have nothing to report in this regard. Responsibilities of Management and Those Charged with Governance for the Consolidated Financial Statements Management is responsible for the preparation and fair presentation of the consolidated financial statements in accordance with PFRSs, and for such internal control as management determines is necessary to enable the preparation of consolidated financial statements that are free from material misstatement, whether due to fraud or error. In preparing the consolidated financial statements, management is responsible for assessing the Group’s ability to continue as a going concern, disclosing, as applicable, matters related to going concern and using the going concern basis of accounting unless management either intends to liquidate the Group or to cease operations, or has no realistic alternative but to do so. Those charged with governance are responsible for overseeing the Group’s financial reporting process. Auditor’s Responsibilities for the Audit of the Consolidated Financial Statements Our objectives are to obtain reasonable assurance about whether the consolidated financial statements as a whole are free from material misstatement, whether due to fraud or error, and to issue an auditor’s report that includes our opinion. Reasonable assurance is a high level of assurance, but is not a guarantee that an audit conducted in accordance with PSAs will always detect a material misstatement when it exists. Misstatements can arise from fraud or error and are considered material if, individually or in the aggregate, they could reasonably be expected to influence the economic decisions of users taken on the basis of these consolidated financial statements. As part of an audit in accordance with PSAs, we exercise professional judgment and maintain professional skepticism throughout the audit. We also:
Identify and assess the risks of material misstatement of the consolidated financial statements, whether due to fraud or error, design and perform audit procedures responsive to those risks, and obtain audit evidence that is sufficient and appropriate to provide a basis for our opinion. The risk of not detecting a material misstatement resulting from fraud is higher than for one resulting from error, as fraud may involve collusion, forgery, intentional omissions, misrepresentations, or the override of internal control.
- 7 -
Obtain an understanding of internal control relevant to the audit in order to design audit procedures that are appropriate in the circumstances, but not for the purpose of expressing an opinion on the effectiveness of the Group’s internal control.
Evaluate the appropriateness of accounting policies used and the reasonableness of accounting estimates and related disclosures made by management. Conclude on the appropriateness of management’s use of the going concern basis of accounting and, based on the audit evidence obtained, whether a material uncertainty exists related to events or conditions that may cast significant doubt on the Group’s ability to continue as a going concern. If we conclude that a material uncertainty exists, we are required to draw attention in our auditor’s report to the related disclosures in the consolidated financial statements or, if such disclosures are inadequate, to modify our opinion. Our conclusions are based on the audit evidence obtained up to the date of our auditor’s report. However, future events or conditions may cause the Group to cease to continue as a going concern.
Evaluate the overall presentation, structure and content of the consolidated financial statements, including the disclosures, and whether the consolidated financial statements represent the underlying transactions and events in a manner that achieves fair presentation.
Obtain sufficient appropriate audit evidence regarding the financial information of the entities or business activities within the Group to express an opinion on the consolidated financial statements. We are responsible for the direction, supervision and performance of the audit. We remain solely responsible for our audit opinion.
We communicate with those charged with governance regarding, among other matters, the planned scope and timing of the audit and significant audit findings, including any significant deficiencies in internal control that we identify during our audit. We also provide those charged with governance with a statement that we have complied with relevant ethical requirements regarding independence, and to communicate with them all relationships and other matters that may reasonably be thought to bear on our independence, and where applicable, related safeguards. From the matters communicated with those charged with governance, we determine those matters that were of most significance in the audit of the consolidated financial statements of the current period and are therefore the key audit matters. We describe these matters in our auditor’s report unless law or regulation precludes public disclosure about the matter or when, in extremely rare circumstances, we determine that a matter should not be communicated in our report because the adverse consequences of doing so would reasonably be expected to outweigh the public interest benefits of such communication.

- 8 -
The engagement partner on the audit resulting in this independent auditor’s report is Miguel U. Ballelos, Jr. SYCIP GORRES VELAYO & CO. Miguel U. Ballelos, Jr. Partner CPA Certificate No. 109950 SEC Accreditation No. 1566-AR-1 (Group A), April 3, 2019, valid until April 2, 2022 Tax Identification No. 241-031-088 BIR Accreditation No. 08-001998-114-2019, January 28, 2019, valid until January 27, 2022 PTR No. 8125210, January 7, 2020, Makati City April 3, 2020

UNIVERSAL ROBINA CORPORATION AND SUBSIDIARIES CONSOLIDATED STATEMENTS OF FINANCIAL POSITION December 31 2019 2018
ASSETS
Current Assets Cash and cash equivalents (Note 7) P=20,484,260,858 P=13,023,101,912 Financial assets at fair value through profit or loss (Note 8) 414,899,618 420,153,416 Receivables (Note 10) 15,998,957,924 14,405,323,971 Inventories (Note 11) 24,374,509,971 22,085,770,041 Biological assets (Note 14) 733,435,525 741,719,637 Other current assets (Note 12) 2,838,568,366 3,733,665,505 64,844,632,262 54,409,734,482
Noncurrent Assets Property, plant and equipment (Note 13) 54,626,409,715 51,950,316,266 Right-of-use assets (Note 36) 3,613,579,513 − Biological assets (Note 14) 224,128,072 366,184,414 Goodwill (Note 15) 31,194,495,817 31,194,495,817 Intangible assets (Note 15) 11,673,128,525 11,730,260,354 Investments in joint ventures (Note 16) 421,625,100 520,917,509 Deferred tax assets (Note 32) 620,165,818 195,485,985 Other noncurrent assets (Note 17) 1,434,825,051 1,568,318,583 103,808,357,611 97,525,978,928
TOTAL ASSETS P=168,652,989,873 P=151,935,713,410 (Forward)

- 2 - December 31 2019 2018
LIABILITIES AND EQUITY
Current Liabilities Accounts payable and other accrued liabilities (Note 19) P=21,297,748,872 P=22,766,759,527 Short-term debts (Notes 18 and 22) 3,848,485,273 2,461,385,106 Trust receipts payable (Notes 11 and 22) 8,747,355,847 6,019,613,469 Income tax payable 535,595,909 720,742,396 Lease liabilities - current portion (Note 36) 504,164,127 − 34,933,350,028 31,968,500,498
Noncurrent Liabilities Long-term debts (Notes 20 and 22) 30,386,077,608 31,457,123,882 Deferred tax liabilities (Note 32) 3,880,163,558 4,228,752,279 Lease liabilities - net of current portion (Note 36) 3,216,854,082 − Other noncurrent liabilities (Notes 16 and 21) 1,052,042,403 287,857,481 38,535,137,651 35,973,733,642 73,468,487,679 67,942,234,140
Equity Equity attributable to equity holders of the parent Paid-up capital (Note 22) P=23,422,134,732 P=23,422,134,732 Retained earnings (Note 22) 66,644,456,817 63,789,482,388 Other comprehensive income (Note 23) 3,229,388,251 2,334,566,528 Equity reserve (Note 22) (2,665,824,256) (5,075,466,405) Treasury shares (Note 22) (679,489,868) (679,489,868) 89,950,665,676 83,791,227,375 Equity attributable to non-controlling interest (Note 22) 5,233,836,518 202,251,895 95,184,502,194 83,993,479,270
TOTAL LIABILITIES AND EQUITY P=168,652,989,873 P=151,935,713,410 See accompanying Notes to Consolidated Financial Statements.
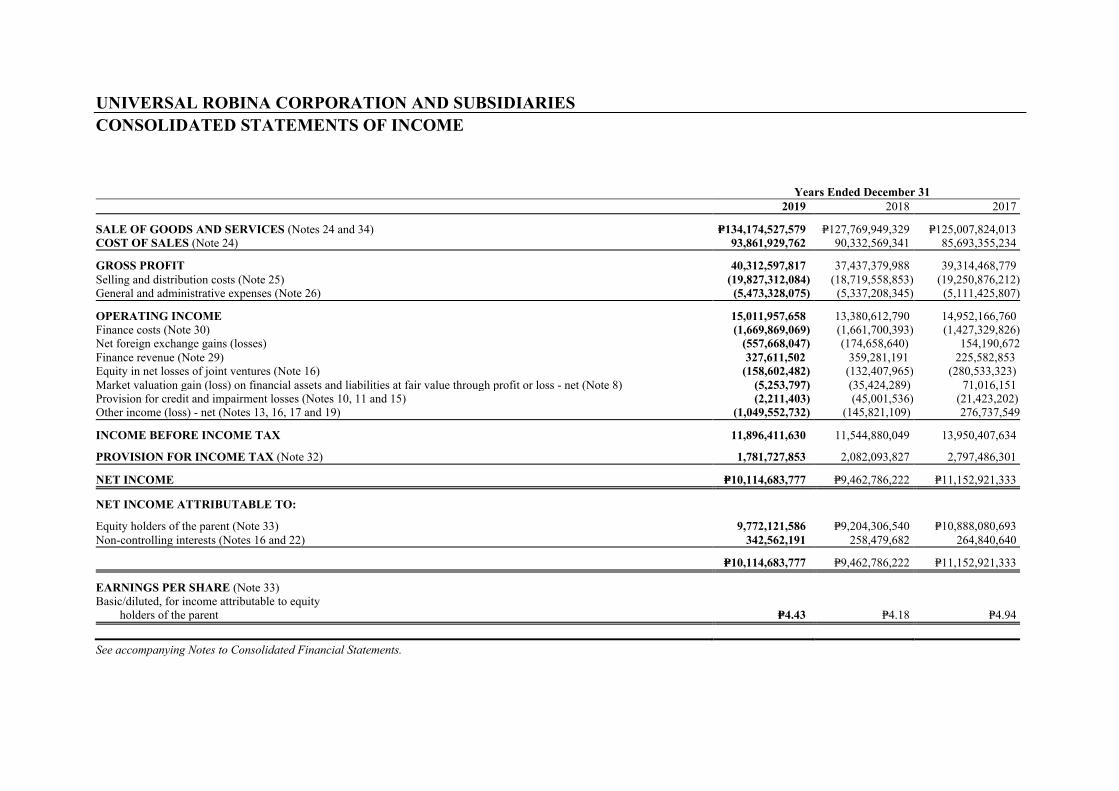
UNIVERSAL ROBINA CORPORATION AND SUBSIDIARIES CONSOLIDATED STATEMENTS OF INCOME Years Ended December 31 2019 2018 2017
SALE OF GOODS AND SERVICES (Notes 24 and 34) P=134,174,527,579 P=127,769,949,329 P=125,007,824,013 COST OF SALES (Note 24) 93,861,929,762 90,332,569,341 85,693,355,234
GROSS PROFIT 40,312,597,817 37,437,379,988 39,314,468,779 Selling and distribution costs (Note 25) (19,827,312,084) (18,719,558,853) (19,250,876,212) General and administrative expenses (Note 26) (5,473,328,075) (5,337,208,345) (5,111,425,807)
OPERATING INCOME 15,011,957,658 13,380,612,790 14,952,166,760 Finance costs (Note 30) (1,669,869,069) (1,661,700,393) (1,427,329,826) Net foreign exchange gains (losses) (557,668,047) (174,658,640) 154,190,672 Finance revenue (Note 29) 327,611,502 359,281,191 225,582,853 Equity in net losses of joint ventures (Note 16) (158,602,482) (132,407,965) (280,533,323) Market valuation gain (loss) on financial assets and liabilities at fair value through profit or loss - net (Note 8) (5,253,797) (35,424,289) 71,016,151 Provision for credit and impairment losses (Notes 10, 11 and 15) (2,211,403) (45,001,536) (21,423,202) Other income (loss) - net (Notes 13, 16, 17 and 19) (1,049,552,732) (145,821,109) 276,737,549
INCOME BEFORE INCOME TAX 11,896,411,630 11,544,880,049 13,950,407,634
PROVISION FOR INCOME TAX (Note 32) 1,781,727,853 2,082,093,827 2,797,486,301
NET INCOME P=10,114,683,777 P=9,462,786,222 P=11,152,921,333
NET INCOME ATTRIBUTABLE TO:
Equity holders of the parent (Note 33) 9,772,121,586 P=9,204,306,540 P=10,888,080,693 Non-controlling interests (Notes 16 and 22) 342,562,191 258,479,682 264,840,640
P=10,114,683,777 P=9,462,786,222 P=11,152,921,333
EARNINGS PER SHARE (Note 33) Basic/diluted, for income attributable to equity
holders of the parent P=4.43 P=4.18 P=4.94 See accompanying Notes to Consolidated Financial Statements.

UNIVERSAL ROBINA CORPORATION AND SUBSIDIARIES CONSOLIDATED STATEMENTS OF COMPREHENSIVE INCOME Years Ended December 31 2019 2018 2017
NET INCOME P=10,114,683,777 P=9,462,786,222 P=11,152,921,333
OTHER COMPREHENSIVE INCOME (LOSS) Items to be reclassified to profit or loss in subsequent periods, net of tax: Cumulative translation adjustments (Note 23) 1,197,749,346 1,630,309,574 (1,392,324,892) Unrealized loss on cash flow hedge (Notes 9 and 23) (4,600,119) (3,336,554) (11,359,659)
Unrealized gain on available-for-sale financial assets (Notes 17 and 23) − − 2,950,000 1,193,149,227 1,626,973,020 (1,400,734,551) Item not to be reclassified to profit or loss in subsequent periods: Remeasurement gains on defined benefit plans (Notes 23 and 31) (471,116,684) 300,219,467 39,544,208 Income tax effect 141,335,005 (90,065,840) (11,863,262)
Unrealized gain on financial assets at fair value through other comprehensive income (Notes 17 and 23) 25,990,000 4,320,000 − (303,791,679) 214,473,627 27,680,946
OTHER COMPREHENSIVE INCOME (LOSS) 889,357,548 1,841,446,647 (1,373,053,605)
TOTAL COMPREHENSIVE INCOME P=11,004,041,325 P=11,304,232,869 P=9,779,867,728
TOTAL COMPREHENSIVE INCOME ATTRIBUTABLE TO: Equity holders of the parent P=10,666,943,309 P=11,046,721,446 P=9,512,498,099 Non-controlling interests 337,098,016 257,511,423 267,369,629 P=11,004,041,325 P=11,304,232,869 P=9,779,867,728 See accompanying Notes to Consolidated Financial Statements.
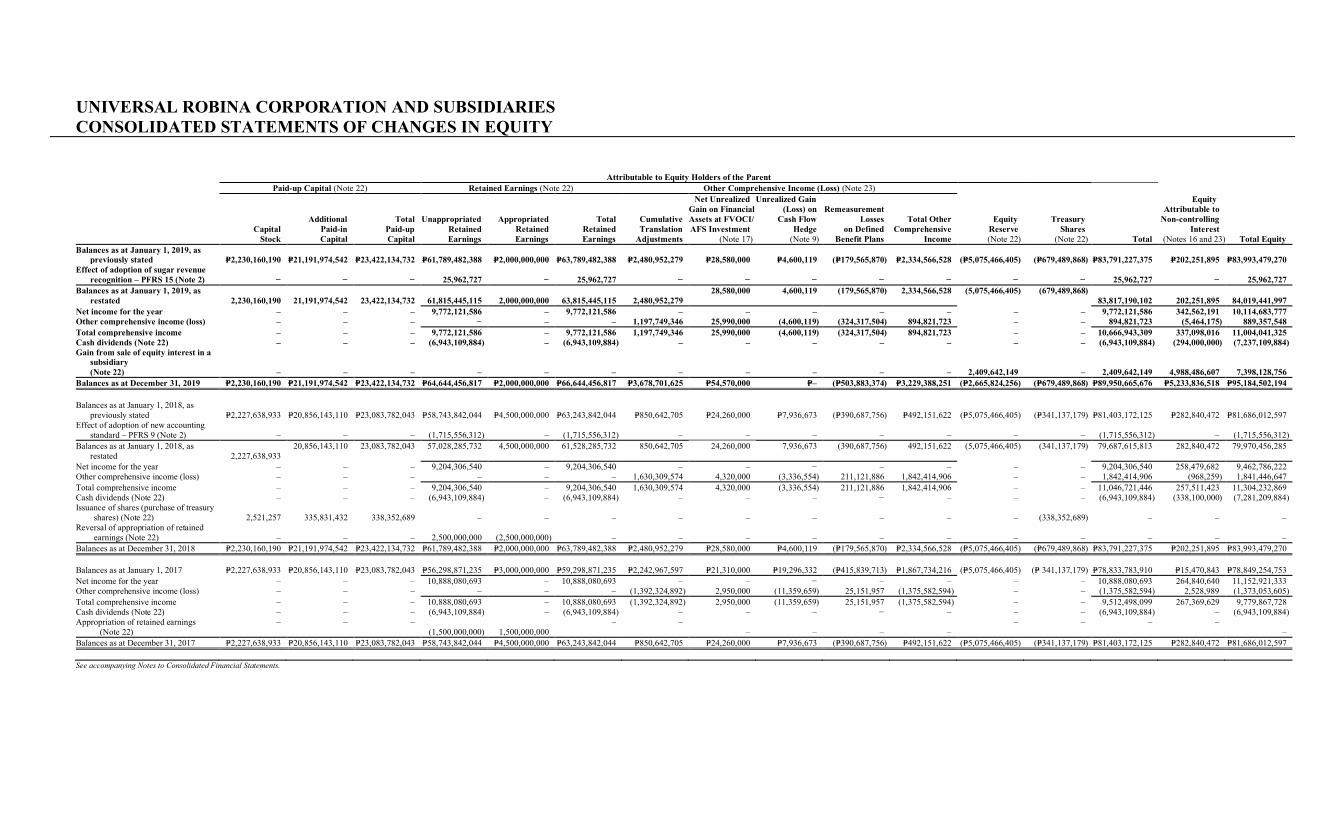
*SGVFSM000750*
UNIVERSAL ROBINA CORPORATION AND SUBSIDIARIES CONSOLIDATED STATEMENTS OF CHANGES IN EQUITY
Attributable to Equity Holders of the Parent Paid-up Capital (Note 22) Retained Earnings (Note 22) Other Comprehensive Income (Loss) (Note 23)
Capital
Stock
Additional Paid-in Capital
Total Paid-up Capital
Unappropriated Retained Earnings
Appropriated Retained Earnings
Total Retained Earnings
Cumulative Translation
Adjustments
Net Unrealized Gain on Financial Assets at FVOCI/ AFS Investment
(Note 17)
Unrealized Gain (Loss) on
Cash Flow Hedge
(Note 9)
Remeasurement Losses
on Defined Benefit Plans
Total Other Comprehensive
Income
Equity Reserve (Note 22)
Treasury Shares
(Note 22) Total
Equity Attributable to
Non-controlling Interest
(Notes 16 and 23) Total Equity Balances as at January 1, 2019, as
previously stated P=2,230,160,190 P=21,191,974,542 P=23,422,134,732 P=61,789,482,388 P=2,000,000,000 P=63,789,482,388 P=2,480,952,279 P=28,580,000 P=4,600,119 (P=179,565,870) P=2,334,566,528 (P=5,075,466,405) (P=679,489,868) P=83,791,227,375 P=202,251,895 P=83,993,479,270 Effect of adoption of sugar revenue
recognition – PFRS 15 (Note 2) − − − 25,962,727 − 25,962,727 − − − − − − − 25,962,727 − 25,962,727 Balances as at January 1, 2019, as
restated 2,230,160,190 21,191,974,542 23,422,134,732 61,815,445,115 2,000,000,000 63,815,445,115 2,480,952,279 28,580,000 4,600,119 (179,565,870) 2,334,566,528 (5,075,466,405) (679,489,868)
83,817,190,102 202,251,895 84,019,441,997 Net income for the year – – – 9,772,121,586 – 9,772,121,586 – – – – – – – 9,772,121,586 342,562,191 10,114,683,777 Other comprehensive income (loss) – – – − – – 1,197,749,346 25,990,000 (4,600,119) (324,317,504) 894,821,723 – – 894,821,723 (5,464,175) 889,357,548 Total comprehensive income – – – 9,772,121,586 – 9,772,121,586 1,197,749,346 25,990,000 (4,600,119) (324,317,504) 894,821,723 – – 10,666,943,309 337,098,016 11,004,041,325 Cash dividends (Note 22) – – – (6,943,109,884) – (6,943,109,884) – – – – – – – (6,943,109,884) (294,000,000) (7,237,109,884) Gain from sale of equity interest in a
subsidiary (Note 22) – – – – – – – – – – – 2,409,642,149 – 2,409,642,149 4,988,486,607 7,398,128,756 Balances as at December 31, 2019 P=2,230,160,190 P=21,191,974,542 P=23,422,134,732 P=64,644,456,817 P=2,000,000,000 P=66,644,456,817 P=3,678,701,625 P=54,570,000 P=– (P=503,883,374) P=3,229,388,251 (P=2,665,824,256) (P=679,489,868) P=89,950,665,676 P=5,233,836,518 P=95,184,502,194 Balances as at January 1, 2018, as
previously stated P=2,227,638,933 P=20,856,143,110 P=23,083,782,043 P=58,743,842,044 P=4,500,000,000 P=63,243,842,044 P=850,642,705 P=24,260,000 P=7,936,673 (P=390,687,756) P=492,151,622 (P=5,075,466,405) (P=341,137,179) P=81,403,172,125 P=282,840,472 P=81,686,012,597 Effect of adoption of new accounting
standard – PFRS 9 (Note 2) – – – (1,715,556,312) – (1,715,556,312) – – – – – – – (1,715,556,312) – (1,715,556,312) Balances as at January 1, 2018, as
restated 2,227,638,933 20,856,143,110 23,083,782,043 57,028,285,732 4,500,000,000 61,528,285,732 850,642,705 24,260,000 7,936,673 (390,687,756) 492,151,622 (5,075,466,405) (341,137,179) 79,687,615,813 282,840,472 79,970,456,285
Net income for the year – – – 9,204,306,540 – 9,204,306,540 – – − – – – – 9,204,306,540 258,479,682 9,462,786,222 Other comprehensive income (loss) – – – – – – 1,630,309,574 4,320,000 (3,336,554) 211,121,886 1,842,414,906 – – 1,842,414,906 (968,259) 1,841,446,647 Total comprehensive income – – – 9,204,306,540 – 9,204,306,540 1,630,309,574 4,320,000 (3,336,554) 211,121,886 1,842,414,906 – – 11,046,721,446 257,511,423 11,304,232,869 Cash dividends (Note 22) – – – (6,943,109,884) – (6,943,109,884) – – – − – – – (6,943,109,884) (338,100,000) (7,281,209,884) Issuance of shares (purchase of treasury
shares) (Note 22) 2,521,257 335,831,432 338,352,689 – – – – – – – – – (338,352,689) – – – Reversal of appropriation of retained
earnings (Note 22) – – – 2,500,000,000 (2,500,000,000) – – – – – – – – – – – Balances as at December 31, 2018 P=2,230,160,190 P=21,191,974,542 P=23,422,134,732 P=61,789,482,388 P=2,000,000,000 P=63,789,482,388 P=2,480,952,279 P=28,580,000 P=4,600,119 (P=179,565,870) P=2,334,566,528 (P=5,075,466,405) (P=679,489,868) P=83,791,227,375 P=202,251,895 P=83,993,479,270 Balances as at January 1, 2017 P=2,227,638,933 P=20,856,143,110 P=23,083,782,043 P=56,298,871,235 P=3,000,000,000 P=59,298,871,235 P=2,242,967,597 P=21,310,000 P=19,296,332 (P=415,839,713) P=1,867,734,216 (P=5,075,466,405) (P= 341,137,179) P=78,833,783,910 P=15,470,843 P=78,849,254,753 Net income for the year – – – 10,888,080,693 – 10,888,080,693 – – − – – – – 10,888,080,693 264,840,640 11,152,921,333 Other comprehensive income (loss) – – – – – – (1,392,324,892) 2,950,000 (11,359,659) 25,151,957 (1,375,582,594) – – (1,375,582,594) 2,528,989 (1,373,053,605) Total comprehensive income – – – 10,888,080,693 – 10,888,080,693 (1,392,324,892) 2,950,000 (11,359,659) 25,151,957 (1,375,582,594) – – 9,512,498,099 267,369,629 9,779,867,728 Cash dividends (Note 22) – – – (6,943,109,884) – (6,943,109,884) – – – − – – – (6,943,109,884) – (6,943,109,884) Appropriation of retained earnings
(Note 22) – – –
(1,500,000,000) 1,500,000,000 – –
– – – – – – – –
– Balances as at December 31, 2017 P=2,227,638,933 P=20,856,143,110 P=23,083,782,043 P=58,743,842,044 P=4,500,000,000 P=63,243,842,044 P=850,642,705 P=24,260,000 P=7,936,673 (P=390,687,756) P=492,151,622 (P=5,075,466,405) (P=341,137,179) P=81,403,172,125 P=282,840,472 P=81,686,012,597 See accompanying Notes to Consolidated Financial Statements.
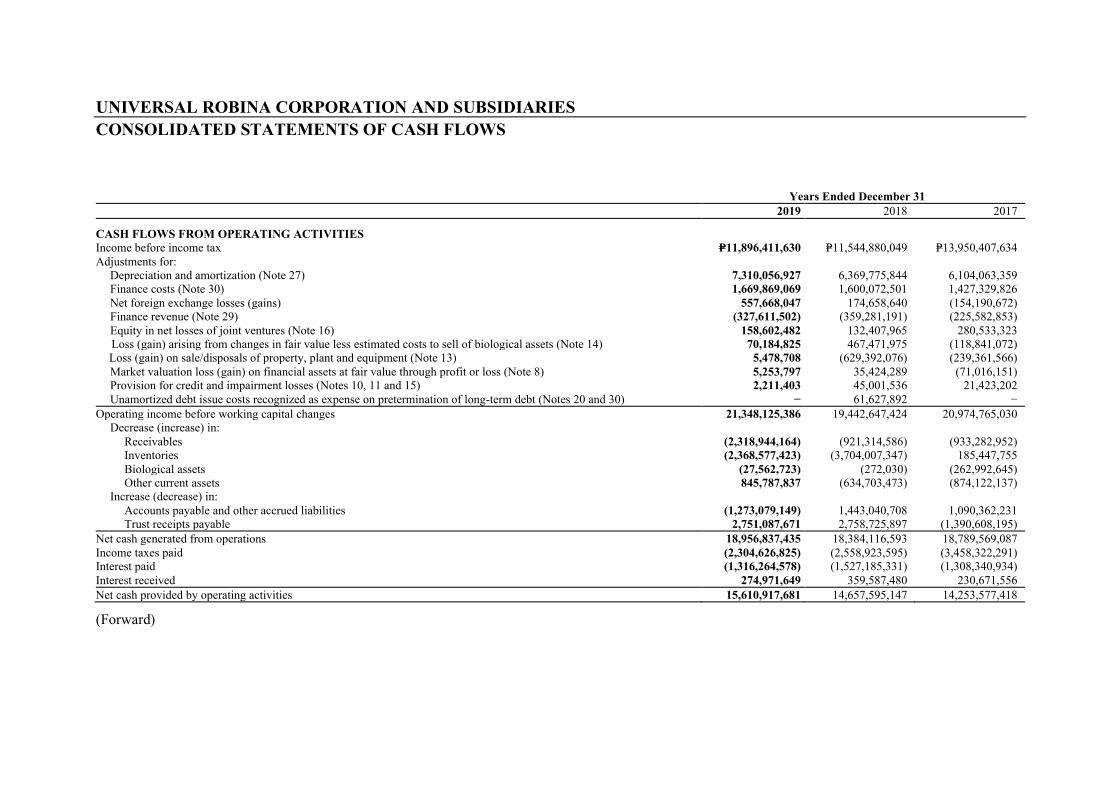
*SGVFSM000750*
UNIVERSAL ROBINA CORPORATION AND SUBSIDIARIES CONSOLIDATED STATEMENTS OF CASH FLOWS Years Ended December 31 2019 2018 2017
CASH FLOWS FROM OPERATING ACTIVITIES Income before income tax P=11,896,411,630 P=11,544,880,049 P=13,950,407,634 Adjustments for: Depreciation and amortization (Note 27) 7,310,056,927 6,369,775,844 6,104,063,359 Finance costs (Note 30) 1,669,869,069 1,600,072,501 1,427,329,826 Net foreign exchange losses (gains) 557,668,047 174,658,640 (154,190,672) Finance revenue (Note 29) (327,611,502) (359,281,191) (225,582,853) Equity in net losses of joint ventures (Note 16) 158,602,482 132,407,965 280,533,323
Loss (gain) arising from changes in fair value less estimated costs to sell of biological assets (Note 14) 70,184,825 467,471,975 (118,841,072) Loss (gain) on sale/disposals of property, plant and equipment (Note 13) 5,478,708 (629,392,076) (239,361,566)
Market valuation loss (gain) on financial assets at fair value through profit or loss (Note 8) 5,253,797 35,424,289 (71,016,151) Provision for credit and impairment losses (Notes 10, 11 and 15) 2,211,403 45,001,536 21,423,202 Unamortized debt issue costs recognized as expense on pretermination of long-term debt (Notes 20 and 30) − 61,627,892 − Operating income before working capital changes 21,348,125,386 19,442,647,424 20,974,765,030 Decrease (increase) in: Receivables (2,318,944,164) (921,314,586) (933,282,952) Inventories (2,368,577,423) (3,704,007,347) 185,447,755 Biological assets (27,562,723) (272,030) (262,992,645) Other current assets 845,787,837 (634,703,473) (874,122,137) Increase (decrease) in: Accounts payable and other accrued liabilities (1,273,079,149) 1,443,040,708 1,090,362,231 Trust receipts payable 2,751,087,671 2,758,725,897 (1,390,608,195) Net cash generated from operations 18,956,837,435 18,384,116,593 18,789,569,087 Income taxes paid (2,304,626,825) (2,558,923,595) (3,458,322,291) Interest paid (1,316,264,578) (1,527,185,331) (1,308,340,934) Interest received 274,971,649 359,587,480 230,671,556 Net cash provided by operating activities 15,610,917,681 14,657,595,147 14,253,577,418
(Forward)
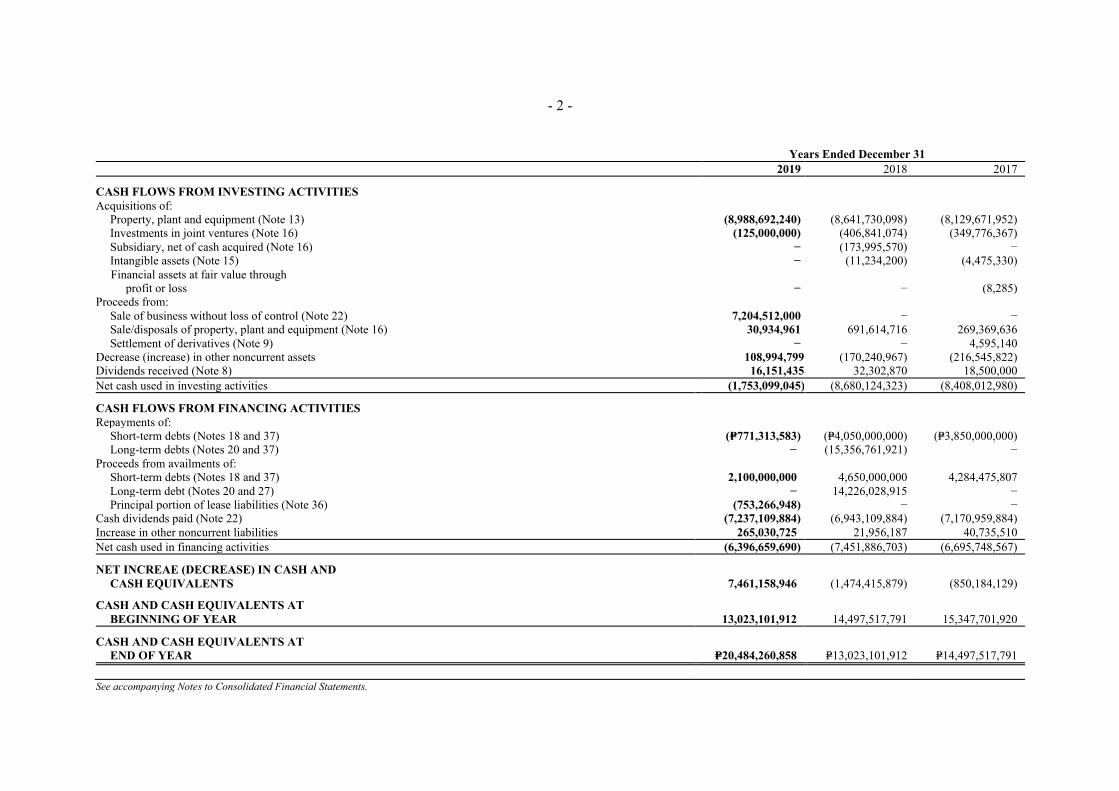
*SGVFSM000750*
- 2 -
Years Ended December 31 2019 2018 2017
CASH FLOWS FROM INVESTING ACTIVITIES Acquisitions of:
Property, plant and equipment (Note 13) (8,988,692,240) (8,641,730,098) (8,129,671,952) Investments in joint ventures (Note 16) (125,000,000) (406,841,074) (349,776,367) Subsidiary, net of cash acquired (Note 16) − (173,995,570) − Intangible assets (Note 15) − (11,234,200) (4,475,330)
Financial assets at fair value through profit or loss − − (8,285)
Proceeds from: Sale of business without loss of control (Note 22) 7,204,512,000 − − Sale/disposals of property, plant and equipment (Note 16) 30,934,961 691,614,716 269,369,636 Settlement of derivatives (Note 9) − − 4,595,140
Decrease (increase) in other noncurrent assets 108,994,799 (170,240,967) (216,545,822) Dividends received (Note 8) 16,151,435 32,302,870 18,500,000 Net cash used in investing activities (1,753,099,045) (8,680,124,323) (8,408,012,980)
CASH FLOWS FROM FINANCING ACTIVITIES Repayments of:
Short-term debts (Notes 18 and 37) (P=771,313,583) (P=4,050,000,000) (P=3,850,000,000) Long-term debts (Notes 20 and 37) − (15,356,761,921) − Proceeds from availments of:
Short-term debts (Notes 18 and 37) 2,100,000,000 4,650,000,000 4,284,475,807 Long-term debt (Notes 20 and 27) − 14,226,028,915 − Principal portion of lease liabilities (Note 36) (753,266,948) − −
Cash dividends paid (Note 22) (7,237,109,884) (6,943,109,884) (7,170,959,884) Increase in other noncurrent liabilities 265,030,725 21,956,187 40,735,510 Net cash used in financing activities (6,396,659,690) (7,451,886,703) (6,695,748,567)
NET INCREAE (DECREASE) IN CASH AND CASH EQUIVALENTS 7,461,158,946 (1,474,415,879) (850,184,129)
CASH AND CASH EQUIVALENTS AT BEGINNING OF YEAR 13,023,101,912 14,497,517,791 15,347,701,920
CASH AND CASH EQUIVALENTS AT END OF YEAR P=20,484,260,858 P=13,023,101,912 P=14,497,517,791
See accompanying Notes to Consolidated Financial Statements.
*SGVFSM000750*
UNIVERSAL ROBINA CORPORATION AND SUBSIDIARIES NOTES TO CONSOLIDATED FINANCIAL STATEMENTS
1. Corporate Information
Universal Robina Corporation (hereinafter referred to as “the Parent Company” or “URC”) was incorporated on September 28, 1954, domiciled in theRepublic of the Philippines, and is listed in the Philippine Stock Exchange. On October 28, 2002, the Parent Company’s corporate life was extended foranother 50 years or until September 28, 2054. The registered office address of the Parent Company is at 8th Floor Tera Tower, Bridgetowne, E.Rodriguez, Jr. Avenue (C5 Road), Ugong Norte, Quezon City, Metro Manila.
The Parent Company is a majority owned subsidiary of JG Summit Holdings, Inc. (“the Ultimate Parent Company” or “JGSHI”).
The Parent Company and its subsidiaries (hereinafter referred to as “the Group”) is one of the largest branded food products companies in the Philippinesand has a strong presence in ASEAN markets. The Group is involved in a wide range of food-related businesses which are organized into three (3)business segments: (a) the branded consumer food segment which manufactures and distributes a diverse mix of salty snacks, chocolates, candies,biscuits, packed cakes, beverages, instant noodles and pasta; (b) the agro-industrial segment which engages in hog and poultry farming, production anddistribution of animal health products and manufacture and distribution of animal feeds, glucose and soya bean products; and (c) the commodity foodsegment which engages in sugar milling and refining, flour milling and pasta manufacturing and renewable energy development. The Parent Companyalso engages in the manufacture of bi-axially oriented polypropylene (BOPP) films for packaging companies and flexible packaging materials to catervarious URC branded products. The Parent Company’s packaging business is included in the branded consumer food segment.
The operations of certain subsidiaries are registered with the Board of Investments (BOI) as preferred pioneer and nonpioneer activities. Under the termsof the registrations and subject to certain requirements, the Parent Company and certain subsidiaries are entitled to certain fiscal and non-fiscal incentives,including among others, an income tax holiday (ITH) for a period of three (3) years to seven (7) years from respective start dates of commercialoperations (see Note 35).
The Group is also subject to certain regulations with respect to, among others, product composition, packaging, labeling, advertising and safety.
The principal activities of the Group are further described in Note 6.

- 2 -
*SGVFSM000750*
2. Summary of Significant Accounting Policies
Basis of PreparationThe accompanying consolidated financial statements of the Group have been prepared on a historical cost basis, except for financial assets at fair valuethrough profit or loss (FVTPL), financial assets at fair value through other comprehensive income (FVOCI) and derivative financial instruments that havebeen measured at fair value, inventories that have been measured at lower of cost and net realizable value (NRV) and biological assets and agriculturalproduce that have been measured at fair value less estimated costs to sell.
The consolidated financial statements of the Group are presented in Philippine Peso. The functional and presentation currency of the Parent Companyand its Philippine subsidiaries is the Philippine Peso. All values are rounded to the nearest peso except when otherwise stated.
The functional currencies of the Group’s consolidated foreign subsidiaries follow:
Country of Functional Subsidiaries Incorporation Currency
URC Asean Brands Co. Ltd. (UABCL) British Virgin Islands US Dollar - Hong Kong China Foods Co. Ltd. (HCFCL) - do - - do - URC International Co. Ltd. (URCICL) - do - - do - URC Oceania Co. Ltd. (URC Oceania) - do - - do - Shanghai Peggy Foods Co., Ltd. (Shanghai Peggy) China Chinese Renminbi URC China Commercial Co. Ltd. (URCCCL) - do - - do - Xiamen Tongan Pacific Food Co., Ltd. - do - - do - Guangzhou Peggy Foods Co., Ltd. - do - - do - Shantou SEZ Shanfu Foods Co., Ltd. - do - - do - Jiangsu Acesfood Industrial Co., Ltd. - do - - do - Shantou Peggy Co. Ltd. - do - - do - URC Hong Kong Company Limited Hong Kong Hong Kong Dollar PT URC Indonesia Indonesia Indonesian Rupiah URC Snack Foods (Malaysia) Sdn. Bhd. (URC Malaysia) Malaysia Malaysian Ringgit Ricellent Sdn. Bhd. - do - - do -
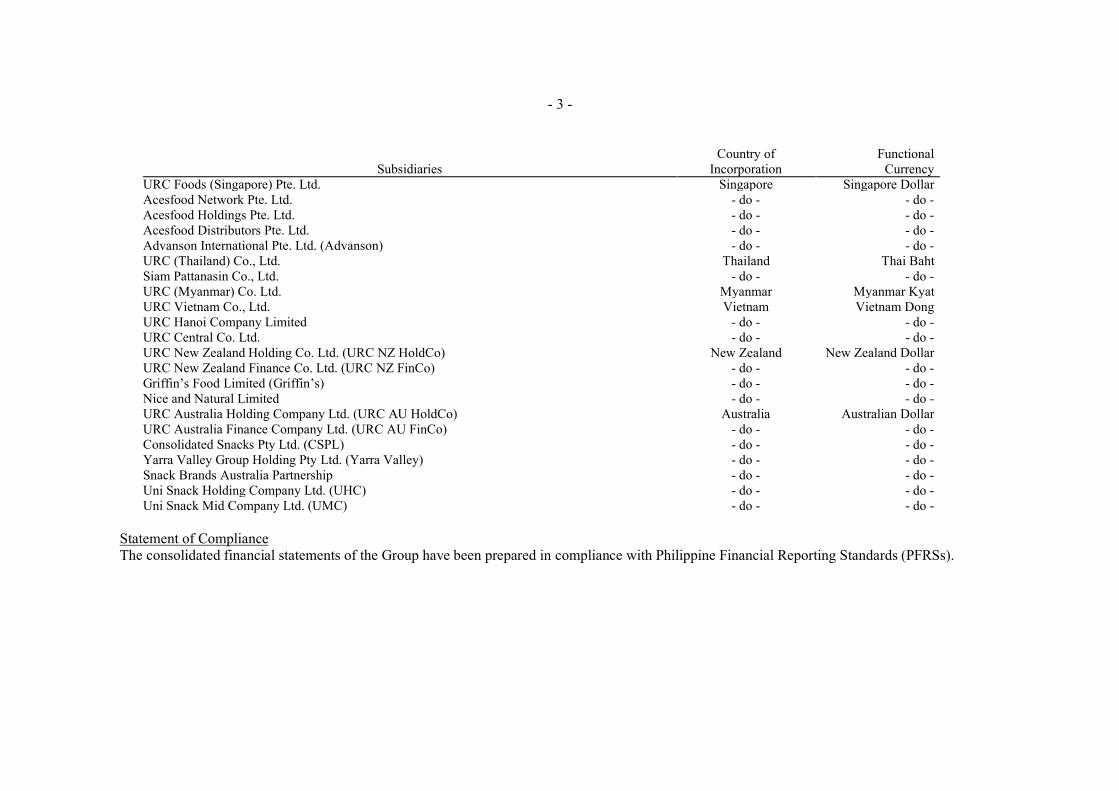
- 3 -
*SGVFSM000750*
Country of Functional Subsidiaries Incorporation Currency
URC Foods (Singapore) Pte. Ltd. Singapore Singapore Dollar Acesfood Network Pte. Ltd. - do - - do - Acesfood Holdings Pte. Ltd. - do - - do - Acesfood Distributors Pte. Ltd. - do - - do - Advanson International Pte. Ltd. (Advanson) - do - - do - URC (Thailand) Co., Ltd. Thailand Thai Baht Siam Pattanasin Co., Ltd. - do - - do - URC (Myanmar) Co. Ltd. Myanmar Myanmar Kyat URC Vietnam Co., Ltd. Vietnam Vietnam Dong URC Hanoi Company Limited - do - - do - URC Central Co. Ltd. - do - - do - URC New Zealand Holding Co. Ltd. (URC NZ HoldCo) New Zealand New Zealand Dollar URC New Zealand Finance Co. Ltd. (URC NZ FinCo) - do - - do - Griffin’s Food Limited (Griffin’s) - do - - do - Nice and Natural Limited - do - - do - URC Australia Holding Company Ltd. (URC AU HoldCo) Australia Australian Dollar URC Australia Finance Company Ltd. (URC AU FinCo) - do - - do - Consolidated Snacks Pty Ltd. (CSPL) - do - - do - Yarra Valley Group Holding Pty Ltd. (Yarra Valley) - do - - do - Snack Brands Australia Partnership - do - - do - Uni Snack Holding Company Ltd. (UHC) - do - - do - Uni Snack Mid Company Ltd. (UMC) - do - - do -
Statement of Compliance The consolidated financial statements of the Group have been prepared in compliance with Philippine Financial Reporting Standards (PFRSs).

- 4 -
*SGVFSM000750*
Basis of Consolidation The consolidated financial statements include the financial statements of the Parent Company and the following wholly and majority owned direct subsidiaries as of December 31, 2019 and 2018.
Place of Effective Percentages of Ownership Subsidiaries Incorporation
CFC Corporation Philippines 100.00 Bio-Resource Power Generation Corporation and a Subsidiary (BRPGC) - do - 100.00 URC Snack Ventures Inc. (USVI)* - do - 100.00 URC Beverage Ventures Inc. (UBVI)** - do - 100.00 Nissin – URC (NURC) - do - 51.00 CFC Clubhouse Property, Inc. (CCPI) - do - − URC Philippines, Ltd. (URCPL) British Virgin Islands 100.00 URCICL and Subsidiaries*** - do - 100.00 Universal Robina (Cayman), Ltd. (URCL) Cayman Islands 100.00 URCCCL China 100.00 * Formerly Calbee - URC, Inc. (CURCI)** Forrmely Hunt - URC (HURC)***Subsidiaries are located in Thailand, Singapore, Malaysia, Vietnam, Indonesia, China, Hong Kong, Myanmar, New Zealand and Australia.
Change in Ownership Structure of URC AU HoldCo and URC NZ HoldCo (a subsidiary of URCICL) In July 2019, Intersnack, a European enterprise engaged in the savory snacks market with extensive product portfolio, agreed to buy 40% of Oceania (SBA and Griffin’s New Zealand).
On December 23, 2019, the Australian Foreign Investment Review Board (FIRB) approved the transaction. Following the approval, the transaction was completed on December 23, 2019 (see Note 22).
In 2019, UHC and UMC were incorporated under URCICL.
Acquisition of USVI In September 2018, the Parent Company entered into a share purchase agreement with its joint venture partner, Calbee, Inc., to purchase the latter’s 50% equity interest in Calbee-URC, Inc. (CURCI). As a result of the sale, CURCI became a wholly-owned subsidiary of URC (see Note 16).
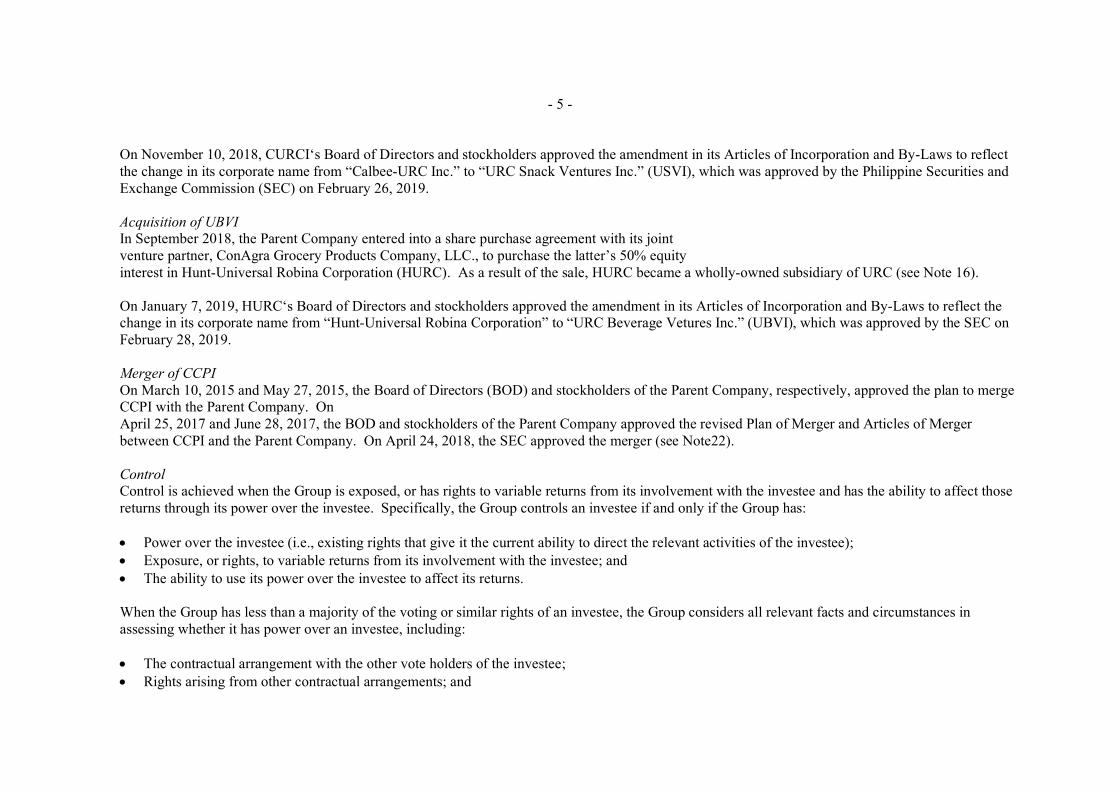
- 5 -
*SGVFSM000750*
On November 10, 2018, CURCI‘s Board of Directors and stockholders approved the amendment in its Articles of Incorporation and By-Laws to reflect the change in its corporate name from “Calbee-URC Inc.” to “URC Snack Ventures Inc.” (USVI), which was approved by the Philippine Securities and Exchange Commission (SEC) on February 26, 2019.
Acquisition of UBVI In September 2018, the Parent Company entered into a share purchase agreement with its joint venture partner, ConAgra Grocery Products Company, LLC., to purchase the latter’s 50% equity interest in Hunt-Universal Robina Corporation (HURC). As a result of the sale, HURC became a wholly-owned subsidiary of URC (see Note 16).
On January 7, 2019, HURC‘s Board of Directors and stockholders approved the amendment in its Articles of Incorporation and By-Laws to reflect the change in its corporate name from “Hunt-Universal Robina Corporation” to “URC Beverage Vetures Inc.” (UBVI), which was approved by the SEC on February 28, 2019.
Merger of CCPI On March 10, 2015 and May 27, 2015, the Board of Directors (BOD) and stockholders of the Parent Company, respectively, approved the plan to merge CCPI with the Parent Company. On April 25, 2017 and June 28, 2017, the BOD and stockholders of the Parent Company approved the revised Plan of Merger and Articles of Merger between CCPI and the Parent Company. On April 24, 2018, the SEC approved the merger (see Note22).
Control Control is achieved when the Group is exposed, or has rights to variable returns from its involvement with the investee and has the ability to affect those returns through its power over the investee. Specifically, the Group controls an investee if and only if the Group has:
Power over the investee (i.e., existing rights that give it the current ability to direct the relevant activities of the investee); Exposure, or rights, to variable returns from its involvement with the investee; and The ability to use its power over the investee to affect its returns.
When the Group has less than a majority of the voting or similar rights of an investee, the Group considers all relevant facts and circumstances in assessing whether it has power over an investee, including:
The contractual arrangement with the other vote holders of the investee; Rights arising from other contractual arrangements; and

- 6 -
*SGVFSM000750*
The Group’s voting rights and potential voting rights.The Group re-assesses whether or not it controls an investee if facts and circumstances indicate that there are changes to one or more of the three elementsof control. Consolidation of a subsidiary begins when the Parent Company obtains control over the subsidiary and ceases when the Parent Company losescontrol of the subsidiary. Assets, liabilities, income and expenses of a subsidiary acquired or disposed of during the year are included in the consolidatedstatement of comprehensive income from the date the Parent Company gains control until the date it ceases to control the subsidiary.
Profit or loss and each component of other comprehensive income (OCI) are attributed to the equity holders of the Parent of the Group and to the non-controlling interests, even if this results in the non-controlling interest having deficit balance. When necessary, adjustments are made to the financial statements of subsidiaries to bring the accounting policies used in line with those used by the Group.
All intragroup transactions, balances, income and expenses are eliminated in the consolidation. Non-controlling interests in the net assets of consolidated subsidiaries are identified separately from the Group’s equity therein. The interest of non-controlling shareholders may be initially measured at fair value or at the non-controlling interest’s proportionate share of the acquiree’s identifiable net assets. The choice of measurement basis is made on an acquisition-by-acquisition basis. Subsequent to acquisition, non-controlling interests consist of the amount attributed to such interests at initial recognition and the non-controlling interest’s share of changes in equity since the date of the combination.
Changes in the Group’s ownership interest in subsidiary that do not result in a loss of control are accounted for as equity transactions. Any difference between the amount by which the non-controlling interests are adjusted and the fair value of the consideration paid or received is recognized directly in equity and attributed to the equity holders of the Parent Company.
If the Group loses control over a subsidiary, it:
derecognizes the assets (including goodwill) and liabilities of the subsidiary; derecognizes the carrying amount of any non-controlling interest; derecognizes the related other comprehensive income recorded in equity and recycles the same to profit or loss or retained earnings; recognizes the fair value of the consideration received; recognizes the fair value of any investment retained; recognizes any surplus or deficit in the consolidated statement of income; and reclassifies the Parent Company’s share of components previously recognized in other comprehensive income to profit or loss or retained earnings, as
appropriate, as would be required if the Group had directly disposed of the related assets or liabilities.
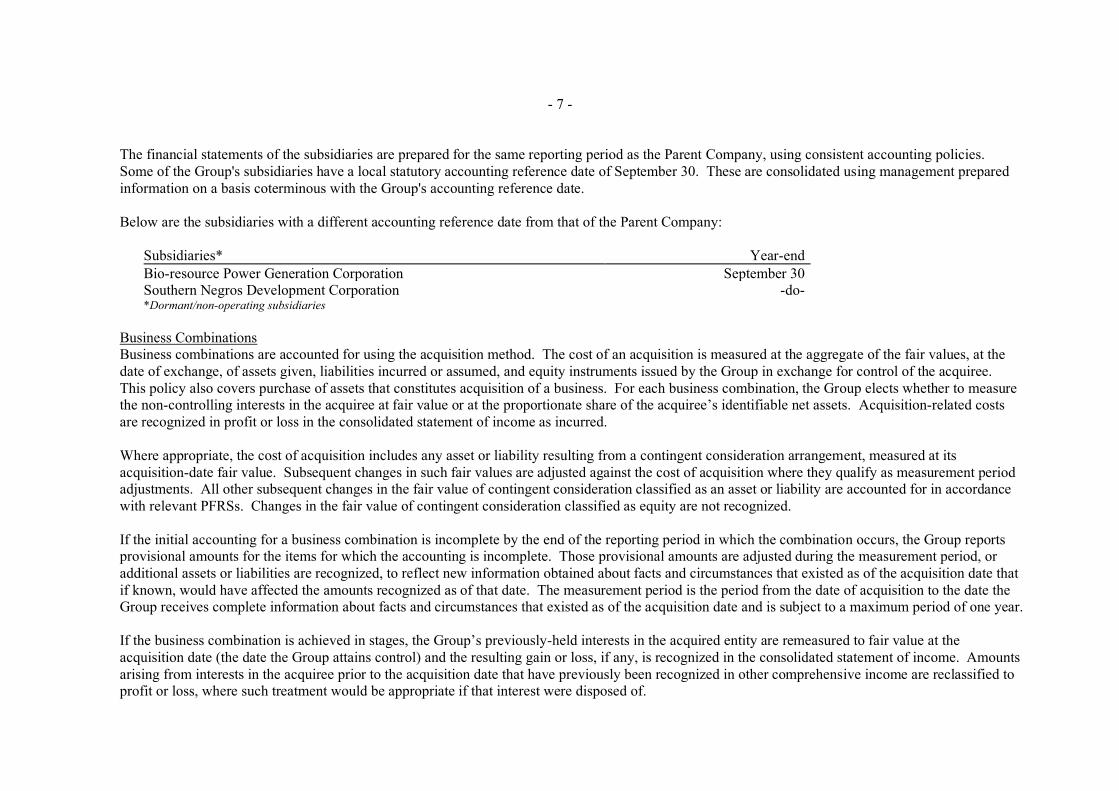
- 7 -
*SGVFSM000750*
The financial statements of the subsidiaries are prepared for the same reporting period as the Parent Company, using consistent accounting policies. Some of the Group's subsidiaries have a local statutory accounting reference date of September 30. These are consolidated using management prepared information on a basis coterminous with the Group's accounting reference date.
Below are the subsidiaries with a different accounting reference date from that of the Parent Company:
Subsidiaries* Year-end Bio-resource Power Generation Corporation September 30 Southern Negros Development Corporation -do-*Dormant/non-operating subsidiaries
Business Combinations Business combinations are accounted for using the acquisition method. The cost of an acquisition is measured at the aggregate of the fair values, at the date of exchange, of assets given, liabilities incurred or assumed, and equity instruments issued by the Group in exchange for control of the acquiree. This policy also covers purchase of assets that constitutes acquisition of a business. For each business combination, the Group elects whether to measure the non-controlling interests in the acquiree at fair value or at the proportionate share of the acquiree’s identifiable net assets. Acquisition-related costs are recognized in profit or loss in the consolidated statement of income as incurred.
Where appropriate, the cost of acquisition includes any asset or liability resulting from a contingent consideration arrangement, measured at its acquisition-date fair value. Subsequent changes in such fair values are adjusted against the cost of acquisition where they qualify as measurement period adjustments. All other subsequent changes in the fair value of contingent consideration classified as an asset or liability are accounted for in accordance with relevant PFRSs. Changes in the fair value of contingent consideration classified as equity are not recognized.
If the initial accounting for a business combination is incomplete by the end of the reporting period in which the combination occurs, the Group reports provisional amounts for the items for which the accounting is incomplete. Those provisional amounts are adjusted during the measurement period, or additional assets or liabilities are recognized, to reflect new information obtained about facts and circumstances that existed as of the acquisition date that if known, would have affected the amounts recognized as of that date. The measurement period is the period from the date of acquisition to the date the Group receives complete information about facts and circumstances that existed as of the acquisition date and is subject to a maximum period of one year.
If the business combination is achieved in stages, the Group’s previously-held interests in the acquired entity are remeasured to fair value at the acquisition date (the date the Group attains control) and the resulting gain or loss, if any, is recognized in the consolidated statement of income. Amounts arising from interests in the acquiree prior to the acquisition date that have previously been recognized in other comprehensive income are reclassified to profit or loss, where such treatment would be appropriate if that interest were disposed of.

- 8 -
*SGVFSM000750*
Combinations of Entities Under Common Control Where there are business combinations involving entities that are ultimately controlled by the same ultimate parent (i.e., Controlling Shareholders) before and after the business combination and that the control is not transitory (“business combinations under common control”), the Group accounts for such business combinations in accordance with the guidance provided by the Philippine Interpretations Committee Q&A No. 2011-02, PFRS 3.2 - Common Control Business Combinations. The purchase method of accounting is used, if the transaction was deemed to have substance from the perspective of the reporting entity. In determining whether the business combination has substance, factors such as the underlying purpose of the business combination and the involvement of parties other than the combining entities such as the non-controlling interest, shall be considered. In cases where the transaction has no commercial substance, the business combination is accounted for using the pooling of interest method.
In applying the pooling-of-interests method, the Group follows the Philippine Interpretations Committee Q&A No. 2012-01, PFRS 3.2 - Application of the Pooling of Interest Method for Business Combinations of Entities under Common Control in Consolidated Financial Statements, which provides the following guidance: The assets and liabilities of the combining entities are reflected in the consolidated financial statements at their carrying amounts. No adjustments are
made to reflect fair values, or recognize any new assets or liabilities, at the date of the combination. The only adjustments that are made are those adjustments to harmonize accounting policies.
No new goodwill is recognized as a result of the combination. The only goodwill that is recognized is any existing goodwill relating to either of the combining entities. Any difference between the consideration paid or transferred and the equity acquired is reflected within equity as other equity reserve, i.e., either contribution or distribution of equity.
The consolidated statement of income reflects the results of the combining entities for the full year, irrespective of when the combination took place.
Goodwill Goodwill arising on the acquisition of a subsidiary is recognized as an asset at the date the control is acquired (the acquisition date). Goodwill is measured as the excess of the sum of the consideration transferred, the amount of any non-controlling interest in the acquiree and the fair value of the acquirer’s previously-held interest, if any, in the entity over the net fair value of the identifiable net assets recognized. If after reassessment, the Group’s interest in the net fair value of the acquiree’s identifiable net assets exceeds the sum of consideration transferred, the amount of any non-controlling interest in the acquiree and the fair value of the acquirer’s previously-held equity interest, if any, the excess is recognized immediately in the consolidated statement of income as a gain on bargain purchase. After initial recognition, goodwill is measured at cost less accumulated impairment losses. Goodwill is not amortized, but is reviewed for impairment at least annually. Any impairment loss is recognized immediately in profit or loss and is not subsequently reversed.

- 9 -
*SGVFSM000750*
On disposal of a subsidiary, the attributable amount of goodwill is included in the determination of the profit or loss on disposal.
Changes in Accounting Policies and Disclosures The accounting policies adopted are consistent with those of the previous financial years, except that the Group has adopted the following PFRSs and Philippine Accounting Standards (PAS) and Philippine Interpretations beginning January 1, 2019. The adoption of the new and amended standards and interpretations did not have any impact on the consolidated financial statements of the Group unless otherwise indicated.
PFRS 16, LeasesIn 2019, the Group adopted PFRS 16, Leases which sets out the principles for the recognition, measurement, presentation and disclosure of leases andrequires lessees to account for all leases under a single on-balance sheet model similar to the accounting for finance leases under PAS 17, Leases.The standard includes two recognition exemptions for lessees ‒ leases of “low-value” assets and short term leases (i.e., leases with a term of 12months or less). At the commencement date, a lessee will recognize a liability to make lease payments (i.e., lease liability) and an asset representingthe right to use the underlying asset during the lease term (i.e., right-of-use or ROU asset). Lessees are required to separately recognize the interestexpense on the lease liability and the depreciation expense on the ROU asset. Upon occurrence of certain events (e.g., a change in the lease term, achange in the future lease payments resulting from a change in an index or rate used to determine those payments), lessees are required to remeasurethe lease liability and recognize the remeasurement as an adjustment to the ROU asset. Lessor accounting under PFRS 16 is substantially unchangedin comparison to the accounting under PAS 17 and related interpretations.
Lessor accounting under PFRS 16 is substantially unchanged from today’s accounting under PAS 17. Lessors will continue to classify all leasesusing the same classification principle as in PAS 17 and distinguish between two types of leases: operating and finance leases. PFRS 16 did not havean impact for leases where the Group is the lessor.
In the adoption of PFRS 16, the Group has chosen to apply the modified retrospective approach with the cumulative effect of initially applying thestandard recognized at the date of initial application, January 1, 2019. Therefore, the comparative information was not restated and continues to bereported under PAS 17 and related interpretations.
In using the modified retrospective approach, the Group has availed of the following practical expedients provided under the standard:
PFRS 16 was not applied to leases for which the lease term is within 12 months from the date of initial application; The Group has relied on its assessment of whether leases are onerous immediately before the date of initial application; Initial direct costs have been excluded from the measurement of ROU assets at the date of initial application.
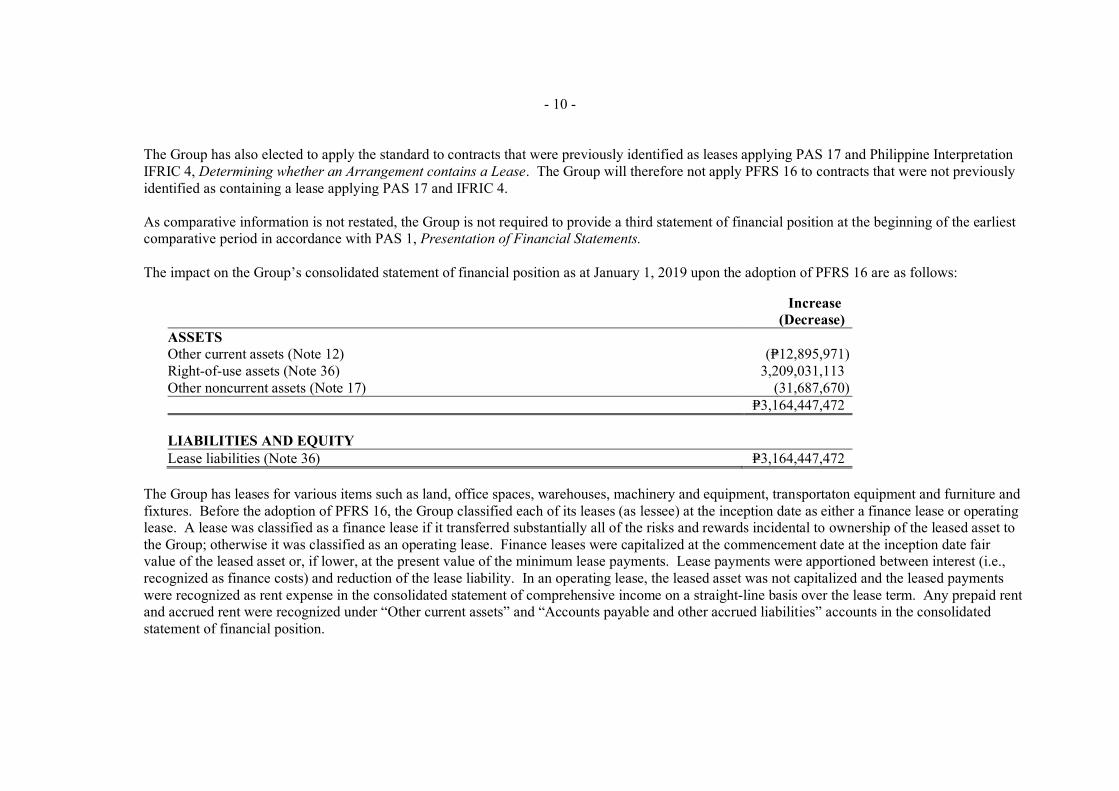
- 10 -
*SGVFSM000750*
The Group has also elected to apply the standard to contracts that were previously identified as leases applying PAS 17 and Philippine Interpretation IFRIC 4, Determining whether an Arrangement contains a Lease. The Group will therefore not apply PFRS 16 to contracts that were not previously identified as containing a lease applying PAS 17 and IFRIC 4.
As comparative information is not restated, the Group is not required to provide a third statement of financial position at the beginning of the earliest comparative period in accordance with PAS 1, Presentation of Financial Statements.
The impact on the Group’s consolidated statement of financial position as at January 1, 2019 upon the adoption of PFRS 16 are as follows:
Increase (Decrease)
ASSETS Other current assets (Note 12) (P=12,895,971) Right-of-use assets (Note 36) 3,209,031,113 Other noncurrent assets (Note 17) (31,687,670)
P=3,164,447,472
LIABILITIES AND EQUITY Lease liabilities (Note 36) P=3,164,447,472
The Group has leases for various items such as land, office spaces, warehouses, machinery and equipment, transportaton equipment and furniture and fixtures. Before the adoption of PFRS 16, the Group classified each of its leases (as lessee) at the inception date as either a finance lease or operating lease. A lease was classified as a finance lease if it transferred substantially all of the risks and rewards incidental to ownership of the leased asset to the Group; otherwise it was classified as an operating lease. Finance leases were capitalized at the commencement date at the inception date fair value of the leased asset or, if lower, at the present value of the minimum lease payments. Lease payments were apportioned between interest (i.e., recognized as finance costs) and reduction of the lease liability. In an operating lease, the leased asset was not capitalized and the leased payments were recognized as rent expense in the consolidated statement of comprehensive income on a straight-line basis over the lease term. Any prepaid rent and accrued rent were recognized under “Other current assets” and “Accounts payable and other accrued liabilities” accounts in the consolidated statement of financial position.

- 11 -
*SGVFSM000750*
Upon adoption of PFRS 16, the Group applied a single recognition and measurement approach for all leases (as lessee), except for short-term leases and leases of low-valued assets. The standard provides specific transition requirements and practical expedients, which have been applied by the Group.
Leases previously classified as operating leases The Group recognized ROU assets and lease liabilities for those leases previously classified as operating leases, except for short-term leases and leases of low-value assets. The ROU assets for most leases were recognized based on the carrying amount as if the standard has always been applied since the commencement date but discounted using the incremental borrowing rate at the date of initial application. In some leases, the ROU assets were recognized based on the amount equal to the lease liabilities adjusted for any previously recognized prepaid rent or accrued rent. Lease liabilities were recognized based on the present value of the remaining lease payments discounted using the lessee’s incremental borrowing rate at the date of initial application.
Asset retirement obligation on operating leases Before the adoption of PFRS 16, costs of asset retirement obligation on operating leases were capitalized as part of “Property, plant and equipment” account. Upon adoption of PFRS 16, these costs are presented within “ROU assets” account in the consolidated statement of financial position. There is no change in the measurement as it is accounted for under PAS 37, Provisions, Contingent Liabilities and Contingent Assets both before and upon adoption of PFRS 16.
Based on the foregoing, the Group recognized ROU assets and lease liabilities of P=3.2 billion and P=3.2 billion, respectively as at January 1, 2019, and P=3.6 billion and P=3.7 billion, respectively as at December 31, 2019.

- 12 -
*SGVFSM000750*
The lease liabilities as at January 1, 2019 can be reconciled to the opening lease commitments as at December 31, 2018 as follows:
Operating lease commitments as at December 31, 2018 P=2,579,576,860 Weighted average incremental borrowing rate at January 1, 2019 4.00% - 7.96% Discounted operating lease commitments at January 1, 2019 2,073,343,820 Less: Commitments relating to short term leases (86,822,379) Add: Payments in optional extension periods not recognized at December 31, 2018 1,177,926,031 Lease liabilities as at January 1, 2019 P=3,164,447,472 Operating lease commitments as at December 31, 2018 P=2,579,576,860 Weighted average incremental borrowing rate at January 1, 2019 4.00% - 7.96% Discounted operating lease commitments at January 1, 2019 2,073,343,820 Less:Commitments relating to short term leases (86,822,379) Add: Payments in optional extension periods not recognized at December 31, 2018 1,177,926,031 Lease liabilities as at January 1, 2019 P=3,164,447,472
PFRS 15, Revenue from Contracts with CustomersWith the effectivity of PFRS 15 on January 1, 2018, the Financial Reporting Standards Council (FRSC), Philippine Interpretations Committee (PIC)issued PIC Q&A 2019-3, Revenue Recognition Guidance for Sugar Millers, to assist the companies operating in the sugar industry in the adoption ofPFRS 15. The interpretation states that a miller recognize revenue arising from its sugar milling operation under either output sharing agreement(OSA) or cane purchase agreement (CPA), and that providing free-period storage constitutes a separate performance obligation in the case of OSA.
In response to concerns raised by the sugar industry on the implementation and adoption of the PIC Q&A, the SEC issued MC No. 6 on April 4,2019, deferring the application of the following provisions of the above-mentioned PIC Q&As for a period of one (1) year.
The Group availed of the deferral of adoption of the above specific provisions. effectiveJanuary 1, 2019, the Group adopted PIC Q&A No. 2019-3 using modified retrospective approach. Under this approach, the standard can be appliedeither to all contracts at the date of initial application or only to contracts that are not completed as of this date. The Group elected to apply thestandard to all contracts that are not completed as at December 31, 2018. The Group assessed that the impact of the adoption on the January 1, 2018financial statements is not significant to the consolidated financial statements taken as a whole. Accordingly, no adjustments were made in theJanuary 1, 2018 opening balance.. As of December 31, 2019, the Group now is in full compliance with PFRS 15 with its sugar business adopting thesaid standard, both under OSA and CPA.
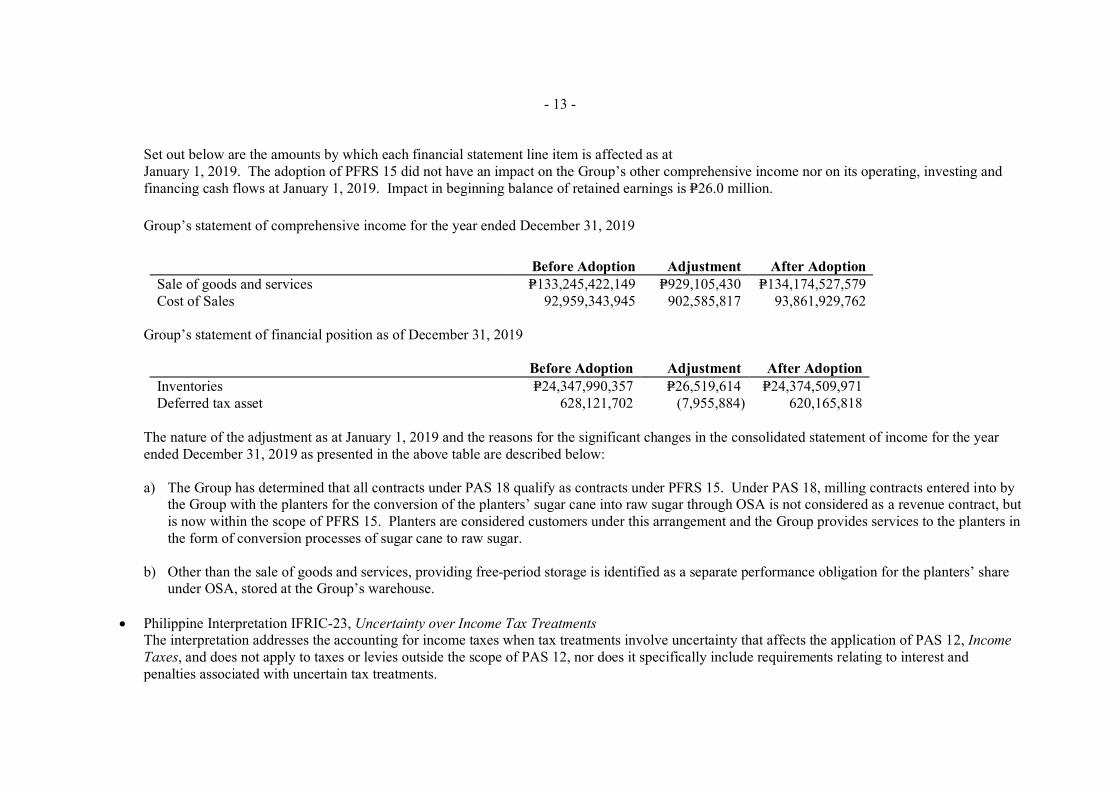
- 13 -
*SGVFSM000750*
Set out below are the amounts by which each financial statement line item is affected as at January 1, 2019. The adoption of PFRS 15 did not have an impact on the Group’s other comprehensive income nor on its operating, investing and financing cash flows at January 1, 2019. Impact in beginning balance of retained earnings is P=26.0 million.
Group’s statement of comprehensive income for the year ended December 31, 2019
Before Adoption Adjustment After Adoption Sale of goods and services P=133,245,422,149 P=929,105,430 P=134,174,527,579 Cost of Sales 92,959,343,945 902,585,817 93,861,929,762
Group’s statement of financial position as of December 31, 2019
Before Adoption Adjustment After Adoption Inventories P=24,347,990,357 P=26,519,614 P=24,374,509,971 Deferred tax asset 628,121,702 (7,955,884) 620,165,818
The nature of the adjustment as at January 1, 2019 and the reasons for the significant changes in the consolidated statement of income for the year ended December 31, 2019 as presented in the above table are described below:
a) The Group has determined that all contracts under PAS 18 qualify as contracts under PFRS 15. Under PAS 18, milling contracts entered into bythe Group with the planters for the conversion of the planters’ sugar cane into raw sugar through OSA is not considered as a revenue contract, butis now within the scope of PFRS 15. Planters are considered customers under this arrangement and the Group provides services to the planters inthe form of conversion processes of sugar cane to raw sugar.
b) Other than the sale of goods and services, providing free-period storage is identified as a separate performance obligation for the planters’ shareunder OSA, stored at the Group’s warehouse.
Philippine Interpretation IFRIC-23, Uncertainty over Income Tax TreatmentsThe interpretation addresses the accounting for income taxes when tax treatments involve uncertainty that affects the application of PAS 12, IncomeTaxes, and does not apply to taxes or levies outside the scope of PAS 12, nor does it specifically include requirements relating to interest andpenalties associated with uncertain tax treatments.
- 14 -
*SGVFSM000750*
The interpretation specifically addresses the following:
Whether an entity considers uncertain tax treatments separately The assumptions an entity makes about the examination of tax treatments by taxation authorities How an entity determines taxable profit (tax loss), tax bases, unused tax losses, unused tax credits and tax rates How an entity considers changes in facts and circumstances
The Group is required to determine whether to consider each uncertain tax treatment separately or together with one or more other uncertain tax treatments and use the approach that better predicts the resolution of the uncertainty. The Group shall assume that the taxation authority will examine amounts that it has a right to examine and have full knowledge of all related information when making those examinations. If the Group concludes that it is not probable that the taxation authority will accept an uncertain tax treatment, it shall reflect the effect of the uncertainty for each uncertain tax treatment using the method the entity expects to better predict the resolution of the uncertainty.
Based on the Group’s assessment, it has no material uncertain tax treatments. Accordingly, the adoption of this Interpretation has no significant impact on the consolidated financial statements.
Amendments to PFRS 9, Prepayment Features with Negative CompensationUnder PFRS 9, a debt instrument can be measured at amortized cost or at fair value through other comprehensive income, provided that thecontractual cash flows are ‘solely payments of principal and interest on the principal amount outstanding’ (the SPPI criterion) and the instrument isheld within the appropriate business model for that classification. The amendments to PFRS 9 clarify that a financial asset passes the SPPI criterionregardless of the event or circumstance that causes the early termination of the contract and irrespective of which party pays or receives reasonablecompensation for the early termination of the contract.
These amendments had no impact on the consolidated financial statements of the Group.
Amendments to PAS 19, Employee Benefits, Plan Amendment, Curtailment or SettlementThe amendments to PAS 19 address the accounting when a plan amendment, curtailment or settlement occurs during a reporting period. Theamendments specify that when a plan amendment, curtailment or settlement occurs during the annual reporting period, an entity is required to:
Determine current service cost for the remainder of the period after the plan amendment, curtailment or settlement, using the actuarialassumptions used to remeasure the net defined benefit liability (asset) reflecting the benefits offered under the plan and the plan assets after thatevent
- 15 -
*SGVFSM000750*
Determine net interest for the remainder of the period after the plan amendment, curtailment or settlement using: the net defined benefit liability(asset) reflecting the benefits offered under the plan and the plan assets after that event; and the discount rate used to remeasure that net definedbenefit liability (asset).
The amendments also clarify that an entity first determines any past service cost, or a gain or loss on settlement, without considering the effect of the asset ceiling. This amount is recognized in profit or loss. The Group then determines the effect of the asset ceiling after the plan amendment, curtailment or settlement. Any change in that effect, excluding amounts included in the net interest, is recognized in other comprehensive income.
The Group has amended the benefits of its retirement plan during the year and accordingly, applied this amendment. The application of this amendment did not have significant impact on the Group’s consolidated financial statements.
Amendments to PAS 28, Long-term Interests in Associates and Joint VenturesThe amendments clarify that an entity applies PFRS 9 to long-term interests in an associate or joint venture to which the equity method is not appliedbut that, in substance, form part of the net investment in the associate or joint venture (long-term interests). This clarification is relevant because itimplies that the expected credit loss model in PFRS 9 applies to such long-term interests.
The amendments also clarified that, in applying PFRS 9, an entity does not take account of any losses of the associate or joint venture, or anyimpairment losses on the net investment, recognized as adjustments to the net investment in the associate or joint venture that arise from applyingPAS 28, Investments in Associates and Joint Ventures.
These amendments had no impact on the consolidated financial statements of the Group.
Annual Improvements to PFRSs 2015-2017 Cycle Amendments to PFRS 3, Business Combinations, and PFRS 11, Joint Arrangements, Previously Held Interest in a Joint Operation
The amendments clarify that, when an entity obtains control of a business that is a joint operation, it applies the requirements for a businesscombination achieved in stages, including remeasuring previously held interests in the assets and liabilities of the joint operation at fair value. Indoing so, the acquirer remeasures its entire previously held interest in the joint operation.

- 16 -
*SGVFSM000750*
A party that participates in, but does not have joint control of, a joint operation might obtain joint control of the joint operation in which the activity of the joint operation constitutes a business as defined in PFRS 3. The amendments clarify that the previously held interests in that joint operation are not remeasured.
An entity applies those amendments to business combinations for which the acquisition date is on or after the beginning of the first annual reporting period beginning on or after January 1, 2019 and to transactions in which it obtains joint control on or after the beginning of the first annual reporting period beginning on or after January 1, 2019, with early application permitted. These amendments had no impact on the consolidated financial statements of the Group as there is no transaction where joint control is obtained.
Amendments to PAS 12, Income Tax Consequences of Payments on Financial Instruments Classified as EquityThe amendments clarify that the income tax consequences of dividends are linked more directly to past transactions or events that generateddistributable profits than to distributions to owners. Therefore, an entity recognizes the income tax consequences of dividends in profit or loss,other comprehensive income or equity according to where the entity originally recognized those past transactions or events.
An entity applies those amendments for annual reporting periods beginning on or after January 1, 2019, with early application is permitted.These amendments had no impact on the consolidated financial statements of the Group because dividends declared by the Group do not give riseto tax obligations under the current tax laws.
Amendments to PAS 23, Borrowing Costs, Borrowing Costs Eligible for CapitalizationThe amendments clarify that an entity treats as part of general borrowings any borrowing originally made to develop a qualifying asset whensubstantially all of the activities necessary to prepare that asset for its intended use or sale are complete.
An entity applies those amendments to borrowing costs incurred on or after the beginning of the annual reporting period in which the entity firstapplies those amendments. An entity applies those amendments for annual reporting periods beginning on or after January 1, 2019, with earlyapplication permitted.
Since the Group’s current practice is in line with these amendments, they had no impact on the consolidated financial statements of the Group.
Significant Accounting Policies
Current versus Noncurrent Classification The Group presents assets and liabilities in the consolidated statement of financial position based on current or noncurrent classification.
- 17 -
*SGVFSM000750*
An asset is current when it is:
Expected to be realized or intended to be sold or consumed in normal operating cycle; Held primarily for the purpose of trading; Expected to be realized within twelve months after the reporting period; or Cash or cash equivalents, unless restricted from being exchanged or used to settle a liability for at least twelve months after the reporting period.
All other assets are classified as noncurrent.
A liability is current when:
It is expected to be settled in normal operating cycle; It is held primarily for the purpose of trading; It is due to be settled within twelve months after the reporting period; or There is no unconditional right to defer the settlement of the liability for at least twelve months after the reporting period.
All other liabilities are classified as noncurrent.
Deferred tax assets and liabilities are classified as noncurrent assets and liabilities.
Fair Value Measurement The Group measures certain financial instruments and nonfinancial assets at fair value at each reporting date. Fair values of financial instruments measured at amortized cost and investment properties carried at cost are disclosed in Note 5.
Fair value is the price that would be received to sell an asset or paid to transfer a liability in an orderly transaction between market participants at the measurement date. The fair value measurement is based on the presumption that the transaction to sell the asset or transfer the liability takes place either:
In the principal market for the asset or liability, or In the absence of a principal market, in the most advantageous market for the asset or liability

- 18 -
*SGVFSM000750*
The principal or the most advantageous market must be accessible to the Group.
The fair value of an asset or a liability is measured using the assumptions that market participants would use when pricing the asset or liability, assuming that market participants act in their economic best interest.
A fair value measurement of a non-financial asset takes into account a market participant’s ability to generate economic benefits by using the asset in its highest and best use or by selling it to another market participant that would use the asset in its highest and best use.
The Group uses valuation techniques that are appropriate in the circumstances and for which sufficient data are available to measure fair value, maximizing the use of relevant observable inputs and minimizing the use of unobservable inputs.
All assets and liabilities for which fair value is measured or disclosed in the financial statements are categorized within the fair value hierarchy, described as follows, based on the lowest level input that is significant to the fair value measurement as a whole:
Level 1 - Quoted (unadjusted) market prices in active markets for identical assets or liabilities Level 2 - Valuation techniques for which the lowest level input that is significant to the fair value measurement is directly or indirectly
observable Level 3 - Valuation techniques for which the lowest level input that is significant to the fair value measurement is unobservable
For assets and liabilities that are recognized in the financial statements on a recurring basis, the Group determines whether transfers have occurred between levels in the hierarchy by re-assessing categorization (based on the lowest level input that is significant to the fair value measurement as a whole) at the end of each reporting date.
Cash and Cash Equivalents Cash includes cash on hand and in banks. Cash equivalents are short-term, highly liquid investments that are readily convertible to known amounts of cash with original maturities of three months or less from dates of placement, and that are subject to insignificant risk of changes in value.
Financial Instruments A financial instrument is any contract that gives rise to a financial asset of one entity and a financial liability or equity instrument of another entity.
a) Financial assetsInitial recognition and measurementFinancial assets are classified at fair value at initial recognition and subsequently measured at amortized cost, FVOCI, and FVTPL.
- 19 -
*SGVFSM000750*
The classification of financial assets at initial recognition depends on the financial asset’s contractual cash flow characteristics and the Group’s business model for managing them. With the exception of trade receivables that do not contain a significant financing component or for which the Group has applied the practical expedient, the Group initially measures a financial asset at its fair value plus, in the case of a financial asset not at FVTPL, transaction costs. Trade receivables that do not contain a significant financing component or for which the Group has applied the practical expedient are measured at the transaction price determined under PFRS 15.
In order for a financial asset to be classified and measured at amortized cost or FVOCI, it needs to give rise to cash flows that are ‘solely payments of principal and interest (SPPI)’ on the principal amount outstanding. This assessment is referred to as the SPPI test and is performed at an instrument level.
The Group’s business model for managing financial assets refers to how it manages its financial assets in order to generate cash flows. The business model determines whether cash flows will result from collecting contractual cash flows, selling the financial assets, or both.
Purchases or sales of financial assets that require delivery of assets within a time frame established by regulation or convention in the market place (regular way trades) are recognized on the trade date, i.e., the date that the Group commits to purchase or sell the asset.
Subsequent measurement For purposes of subsequent measurement, financial assets are classified in four categories:
Financial assets at amortized cost (debt instruments) Financial assets at FVOCI with recycling of cumulative gains and losses (debt instruments) Financial assets designated at FVOCI with no recycling of cumulative gains and losses upon derecognition (equity instruments) Financial assets at FVTPL
The financial assets of the Group as of December 31, 2019 and 2018 consist of financial assets at amortized cost, financial assets designated at FVOCI with no recycling of cumulative gains and losses upon derecognition (equity instruments), derivative assets at FVOCI and financial assets at FVTPL (equity instruments).
Financial assets at amortized cost (debt instruments) The Group measures financial assets at amortized cost if both of the following conditions are met: The financial asset is held within a business model with the objective to hold financial assets in order to collect contractual cash flows; and The contractual terms of the financial asset give rise on specified dates to cash flows that are solely payments of principal and interest on the principal
amount outstanding.

- 20 -
*SGVFSM000750*
Financial assets at amortized cost are subsequently measured using the effective interest (EIR) method and are subject to impairment. Gains and losses are recognized in profit or loss when the asset is derecognized, modified or impaired.
The Group’s financial assets at amortized cost include cash and cash equivalents and receivables.
Financial assets designated at FVOCI (equity instruments) Upon initial recognition, the Group can elect to classify irrevocably its equity investments as equity instruments designated at FVOCI when they meet the definition of equity under PAS 32, Financial Instruments: Presentation, and are not held for trading. The classification is determined on an instrument-by-instrument basis.
Gains and losses on these financial assets are never recycled to profit or loss. Dividends are recognized as other income in the consolidated statements of income when the right of payment has been established, except when the Group benefits from such proceeds as a recovery of part of the cost of the financial asset, in which case, such gains are recorded in OCI. Equity instruments designated at FVOCI are not subject to impairment assessment.
The Group elected to classify irrevocably its investments in club shares under this category.
Financial assets at FVTPL (equity instruments) Financial assets at FVTPL include financial assets held for trading, financial assets designated upon initial recognition at FVTPL, or financial assets mandatorily required to be measured at fair value. Financial assets are classified as held for trading if they are acquired for the purpose of selling or repurchasing in the near term. Derivatives, including separated embedded derivatives, are also classified as held for trading unless they are designated as effective hedging instruments. Financial assets with cash flows that are not solely payments of principal and interest are classified and measured at FVTPL, irrespective of the business model. Notwithstanding the criteria for debt instruments to be classified at amortized cost or at FVOCI, as described above, debt instruments may be designated at FVTPL on initial recognition if doing so eliminates, or significantly reduces, an accounting mismatch.
Financial assets at FVTPL are carried in the consolidated statements of financial position at fair value with net changes in fair value recognized in the consolidated statements of income.
This category includes equity instruments held for trading and currency options.
A derivative embedded in a hybrid contract, with a financial liability or non-financial host, is separated from the host and accounted for as a separate derivative if: the economic characteristics and risks are not closely related to the host; a separate instrument with the same terms as the embedded derivative would meet the definition of a derivative; and the hybrid contract is not measured at fair value through profit or loss. Embedded derivatives are
- 21 -
*SGVFSM000750*
measured at fair value with changes in fair value recognized in profit or loss. Reassessment only occurs if there is either a change in the terms of the contract that significantly modifies the cash flows that would otherwise be required or a reclassification of a financial asset out of the fair value through profit or loss category.
Derecognition A financial asset (or, where applicable, a part of a financial asset or part of a group of similar financial assets) is primarily derecognized (i.e., removed from the Group’s consolidated statement of financial position) when:
The rights to receive cash flows from the asset have expired, or The Group has transferred its rights to receive cash flows from the asset or has assumed an obligation to pay the received cash flows in full without
material delay to a third party under a ‘pass-through’ arrangement; and either (a) the Group has transferred substantially all the risks and rewards ofthe asset, or (b) the Group has neither transferred nor retained substantially all the risks and rewards of the asset, but has transferred control of theasset.
When the Group has transferred its rights to receive cash flows from an asset or has entered into a pass-through arrangement, it evaluates if, and to what extent, it has retained the risks and rewards of ownership. When it has neither transferred nor retained substantially all of the risks and rewards of the asset, nor transferred control of the asset, the Group continues to recognize the transferred asset to the extent of its continuing involvement. In that case, the Group also recognizes an associated liability. The transferred asset and the associated liability are measured on a basis that reflects the rights and obligations that the Group has retained.
Continuing involvement that takes the form of a guarantee over the transferred asset is measured at the lower of the original carrying amount of the asset and the maximum amount of consideration that the Group could be required to repay.
Impairment of financial assets The Group recognizes an allowance for expected credit loss (ECL) for all debt instruments not held at FVTPL. ECL represents credit losses that reflect an unbiased and probability-weighted amount which is determined by evaluating a range of possible outcomes, the time value of money and reasonable and supportable information about past events, current conditions and forecasts of future economic conditions. The ECL allowance is based on the credit losses expected to arise over the life of the asset (the lifetime ECL), unless there has been no significant increase in credit risk since origination, in which case, the allowance is based on the 12-month ECL. The 12-month ECL is the portion of lifetime ECL that results from default events on a financial instrument that are possible within the 12 months after the reporting date. Lifetime ECL are credit losses that results from all possible default events over the expected life of a financial instrument.
- 22 -
*SGVFSM000750*
For trade receivables, installment contracts receivable and contract assets, the Group applies a simplified approach in calculating ECLs. Therefore, the Group does not track changes in credit risk, but instead recognizes a loss allowance based on lifetime ECLs at each reporting date. The Group has established a provision matrix that is based on historical credit loss experience, adjusted for forward-looking factors specific to the debtors and the economic environment.
For other financial assets such nontrade receivable, loans receivable, due from related parties and other receivables, ECLs are recognized in two stages. For credit exposures for which there has not been a significant increase in credit risk since initial recognition, ECLs are provided for credit losses that result from default events that are possible within the next 12-months (a 12-month ECL). For those credit exposures for which there has been a significant increase in credit risk (SICR) since initial recognition, a loss allowance is required for credit losses expected over the remaining life of the exposure, irrespective of the timing of the default (a lifetime ECL).
For cash and cash equivalents and short-term investments, the Group applies the low credit risk simplification. The probability of default and loss given defaults are publicly available and are considered to be low credit risk investments. It is the Group’s policy to measure ECLs on such instruments on a 12-month basis. However, when there has been a significant increase in credit risk since origination, the allowance will be based on the lifetime ECL.The Group uses the ratings from reputable credit rating agencies to determine whether the debt instrument has SICR and to estimate ECLs.
The Group considers a debt investment security to have low credit risk when its credit risk rating is equivalent to the globally understood definition of ‘investment grade’.
The key inputs in the model include the Group’s definition of default and historical data of three years for the origination, maturity date and default date. The Group considers trade receivables and contract assets in default when contractual payment are 90 days past due, except for certain circumstances when the reason for being past due is due to reconciliation with customers of payment records which are administrative in nature which may extend the definition of default. However, in certain cases, the Group may also consider a financial asset to be in default when internal or external information indicates that the Group is unlikely to receive the outstanding contractual amounts in full before taking into account any credit enhancements held by the Group.
Determining the stage for impairment At each reporting date, the Group assesses whether there has been a SICR for financial assets since initial recognition by comparing the risk of default occurring over the expected life between the reporting date and the date of initial recognition. The Group considers reasonable and supportable information that is relevant and available without undue cost or effort for this purpose. This includes quantitative and qualitative information and forward-looking analysis.
- 23 -
*SGVFSM000750*
An exposure will migrate through the ECL stages as asset quality deteriorates. If, in a subsequent period, asset quality improves and also reverses any previously assessed SICR since origination, then the loss allowance measurement reverts from lifetime ECL to 12-months ECL.
Staging assesment PFRS 9 establishes a three-stage approach for impairment of financial assets, based on whether there has been a significant deterioration in the credit risk of a financial asset. These three stages then determine the amount of impairment to be recognized.
• Stage 1 is comprised of all non-impaired financial instruments which have not experienced a significant increase in credit risk since initialrecognition. Entities are required to recognize 12-month ECL for stage 1 financial instruments. In assessing whether credit risk has increasedsignificantly, entities are required to compare the risk of a default occurring on the financial instrument as at the reporting date, with the risk of adefault occurring on the financial instrument as at the date of initial recognition.
• Stage 2 is comprised of all non-impaired financial instruments which have experienced a significant increase in credit risk since initial recognition.Entities are required to recognize lifetime ECL for stage 2 financial instruments. In subsequent reporting periods, if the credit risk of the financialinstrument improves such that there is no longer a significant increase in credit risk since initial recognition, then entities shall revert to recognizing12-month ECL.
• Financial instruments are classified as stage 3 when there is objective evidence of impairment as a result of one or more loss events that have occurredafter initial recognition with a negative impact on the estimated future cash flows of a financial instrument or a portfolio of financial instruments. TheECL model requires that lifetime ECL be recognized for impaired financial instruments, which is similar to the requirements under PAS 39 forimpaired financial instruments.
b) Financial liabilitiesInitial recognition and measurementFinancial liabilities are classified, at initial recognition, as financial liabilities at FVTPL, loans and borrowings, payables, or as derivatives designated ashedging instruments in an effective hedge, as appropriate.
All financial liabilities are recognized initially at fair value and, in the case of loans and borrowings and payables, net of directly attributable transaction costs.

- 24 -
*SGVFSM000750*
Subsequent measurement The measurement of financial liabilities depends on their classification, as described below:
Financial liabilities at FVTPL Financial liabilities at FVTPL include financial liabilities held for trading and financial liabilities designated upon initial recognition as at FVTPL.
Financial liabilities are classified as held for trading if they are incurred for the purpose of repurchasing in the near term. This category also includes derivative financial instruments entered into by the Group that are not designated as hedging instruments in hedge relationships as defined by PFRS 9. Separated embedded derivatives are also classified as held for trading unless they are designated as effective hedging instruments.
Gains or losses on liabilities held for trading are recognized in the consolidated statements of income.
Financial liabilities designated upon initial recognition at FVTPL are designated at the initial date of recognition, and only if the criteria in PFRS 9 are satisfied.
The Group does not have financial liabilities at FVTPL as of December 31, 2019.
Other financial liabilities This category pertains to financial liabilities that are not held for trading or not designated as at FVTPL upon the inception of the liability. These include liabilities arising from operations and borrowings.
After initial measurement, other financial liabilities are measured at amortized cost using the EIR method. Amortized cost is calculated by taking into account any discount or premium on the acquisition and fees or costs that are an integral part of the EIR. Gains and losses are recognized in profit or loss when other financial liabilities are derecognized, as well as through the EIR amortization process.
This category applies to the Group’s accounts payable and accrued expenses (excluding advances from customers, advances from third parties, statutory and taxes payables), short-term debt and trust receipts payable and long-term debt.
- 25 -
*SGVFSM000750*
Derecognition A financial liability is derecognized when the obligation under the liability is discharged or cancelled or expires. When an existing financial liability is replaced by another from the same lender on substantially different terms, or the terms of an existing liability are substantially modified, such an exchange or modification is treated as the derecognition of the original liability and the recognition of a new liability. The difference in the respective carrying amounts is recognized in profit or loss.
c) Offsetting of financial instrumentsFinancial assets and financial liabilities are offset and the net amount is reported in the consolidated statements of financial position if there is a currentlyenforceable legal right to offset the recognized amounts and there is an intention to settle on a net basis, to realize the assets and settle the liabilitiessimultaneously.
Inventories Inventories, including goods-in-process, are recorded at cost and subsequently valued at the lower of cost and NRV. NRV is the estimated selling price in the ordinary course of business, less estimated costs of completion and the estimated costs necessary to make the sale. NRV for materials, spare parts and other supplies represents the related replacement costs.
When the inventories are sold, the carrying amounts of those inventories are recognized under ‘Cost of sales’ in the consolidated statement of income in the period when the related revenue is recognized.
Costs incurred in bringing each product to its present location and conditions are accounted for as follows:
Finished goods, goods-in-process, raw materials, containers and packaging materials, and spare parts and supplies Cost is determined using the weighted average method. Finished goods and goods-in-process include direct materials and labor, and a proportion of manufacturing overhead costs based on actual goods processed and produced, but excluding borrowing costs.
Materials in-transit Cost is determined using the specific identification basis.

- 26 -
*SGVFSM000750*
Biological Assets The biological assets of the Group are divided into two major categories with sub-categories as follows:
Swine livestock - Breeders (livestock bearer)- Sucklings (breeders’ offspring)- Weanlings (comes from sucklings intended to be breeders or to be sold as fatteners)- Fatteners/finishers (comes from weanlings unfit to become breeders; intended for the production of meat)
Poultry livestock - Breeders (livestock bearer)- Chicks (breeders’ offspring intended to be sold as breeders)
Biological assets are measured on initial recognition and at each reporting date at its fair value less estimated costs to sell. The fair values are determined based on current market prices of livestock of similar age, breed and genetic merit. Costs to sell include commissions to brokers and dealers, nonrefundable transfer taxes and duties. Costs to sell exclude transport and other costs necessary to get the biological assets to the market.
Agricultural produce is the harvested product of the Group’s biological assets. A harvest occurs when agricultural produce is either detached from the bearer biological asset or when a biological asset’s life processes cease. A gain or loss arising on initial recognition of agricultural produce at fair value less estimated costs to sell is recognized in the consolidated statement of income in the period in which it arises. The agricultural produce in swine livestock is the suckling that transforms into weanling then into fatteners/finishers and meats, while the agricultural produce in poultry livestock is the hatched chick and table eggs.
A gain or loss on initial recognition of a biological asset at fair value less estimated costs to sell and from a change in fair value less estimated costs to sell of a biological asset are included in the consolidated statement of income in the period in which it arises.
Property, Plant and Equipment Property, plant and equipment, except land, are carried at cost less accumulated depreciation and amortization and impairment losses, if any.
The initial cost of an item of property, plant and equipment comprises its purchase price and any cost attributable in bringing the asset to its intended location and working condition. Cost also includes:
(a) interest and other financing charges on borrowed funds used to finance the acquisition of property, plant and equipment to the extent incurred duringthe period of installation and construction; and

- 27 -
*SGVFSM000750*
(b) asset retirement obligation relating to property, plant and equipment installed/constructed on leased properties, if any, for the corresponding liability.Land is stated at cost less any impairment in value.
Subsequent costs are capitalized as part of the ‘Property, plant and equipment’ in the consolidated statement of financial position, only when it is probable that future economic benefits associated with the item will flow to the Group and the cost of the item can be measured reliably. Cost of repairs and maintenance are expensed when incurred.
Foreign exchange differentials arising from foreign currency borrowings used for the acquisition of property, plant and equipment are capitalized to the extent that these are regarded as adjustments to interest costs.
Depreciation and amortization of property, plant and equipment commence once the property, plant and equipment are available for use and are computed using the straight-line method over the estimated useful life (EUL) of the assets regardless of utilization.
The EUL of property, plant and equipment of the Group follow:
Years Land improvements 5 to 10 Buildings and improvements 10 to 30 Machinery and equipment 10 Transportation equipment 5 Furniture, fixtures and equipment 5
Leasehold improvements are amortized over the shorter of their EUL or the corresponding lease terms. The residual values, useful lives and methods of depreciation and amortization of property, plant and equipment are reviewed periodically and adjusted, if appropriate, at each reporting date to ensure that the method and period of depreciation and amortization are consistent with the expected pattern of economic benefits from items of property, plant and equipment. Any change in the expected residual values, useful lives and methods of depreciation are adjusted prospectively from the time the change was determined necessary.
Construction-in-progress and equipment in transit are stated at cost. This includes the cost of construction and other direct costs. Borrowing costs that are directly attributable to the construction of property, plant and equipment are capitalized during the construction period. Construction in-progress and equipment in transit are not depreciated until such time as the relevant assets are completed and put into operational use.
- 28 -
*SGVFSM000750*
Construction in-progress and equipment in transit are transferred to the related ‘Property, plant and equipment’ in the consolidated statement of financial position when the construction or installation and related activities necessary to prepare the property, plant and equipment for their intended use are completed, and the property, plant and equipment are ready for service.
Major spare parts and stand-by equipment items that the Group expects to use over more than one period and can be used only in connection with an item of property, plant and equipment are accounted for as property, plant and equipment. Depreciation and amortization on these major spare parts and stand-by equipment commence once these have become available for use (i.e., when it is in the location and condition necessary for it to be capable of operating in the manner intended by the Group).
An item of property, plant and equipment is derecognized upon disposal or when no future economic benefits are expected to arise from the continued use of the asset. Any gain or loss arising on derecognition of the property, plant and equipment (calculated as the difference between the net disposal proceeds and the carrying amount of the item) is included in the consolidated statement of income, in the period the item is derecognized.
Fully depreciated property, plant and equipment are retained in the accounts until these are no longer in use.
Investment Properties Investment properties consist of properties that are held to earn rentals or for capital appreciation or both, and those which are not occupied by entities in the Group. Investment properties, except for land, are carried at cost less accumulated depreciation and any impairment loss, if any. Land is carried at cost less any impairment loss, if any. The carrying amount includes the cost of replacing part of an existing investment property at the time that cost is incurred if the recognition criteria are met, and excludes the cost of day-to-day servicing of an investment property.
Investment properties are measured initially at cost, including transaction costs. Transaction costs represent nonrefundable taxes such as capital gains tax and documentary stamp tax that are for the account of the Group. An investment property acquired through an exchange transaction is measured at fair value of the asset acquired unless the fair value of such an asset cannot be measured, in which case, the investment property acquired is measured at the carrying amount of asset given up.
The Group’s investment properties consist solely of buildings and building improvements and are depreciated using the straight-line method over their EUL ranging from 10 to 30 years (see Note 17).
The depreciation and amortization method and useful life are reviewed periodically to ensure that the method and period of depreciation and amortization are consistent with the expected pattern of economic useful benefits from items of investment properties.
- 29 -
*SGVFSM000750*
Investment properties are derecognized when either they have been disposed of or when they are permanently withdrawn from use and no future economic benefit is expected from their disposal. Any gains or losses on the retirement or disposal of investment properties are recognized in the consolidated statement of income in the year of retirement or disposal.
Transfers are made to investment property when, and only when, there is a change in use, evidenced by the end of owner occupation, commencement of an operating lease to another party or by the end of construction or development. Transfers are made from investment property when, and only when, there is a change in use, evidenced by commencement of owner occupation or commencement of development with a view to sale.
For a transfer from investment property to owner-occupied property or inventories, the cost of property for subsequent accounting is its carrying amount at the date of change in use. If the property occupied by the Group as an owner-occupied property becomes an investment property, the Group accounts for such property in accordance with the policy stated under Property, plant and equipment account up to the date of change in use.
Goodwill Goodwill represents the excess of the cost of the acquisition over the fair value of identifiable net assets of the investee at the date of acquisition which is not identifiable to specific assets.
Goodwill acquired in a business combination from the acquisition date is allocated to each of the Group’s cash-generating units, or groups of cash-generating units that are expected to benefit from the synergies of the combination, irrespective of whether other assets or liabilities of the Group are assigned to those units or groups of units.
Each unit or group of units to which the goodwill is allocated:
represents the lowest level within the Group at which the goodwill is monitored for internal management purposes; and is not larger than a segment based on the Group’s operating segments as determined in accordance with PFRS 8, Operating Segments.
Following initial recognition, goodwill is measured at cost, less any accumulated impairment losses, if any. Goodwill is reviewed for impairment annually or more frequently, if events or changes in circumstances indicate that the carrying value may be impaired (see further discussion under Impairment of nonfinancial assets).
Where goodwill forms part of a cash-generating unit and part of the operation within that unit is disposed of, the goodwill associated with the operation disposed of is included in the carrying amount of the operation when determining the gain or loss on disposal of the operation. Goodwill disposed of in this circumstance is measured based on the relative values of the operation disposed of and the portion of the cash-generating unit retained.
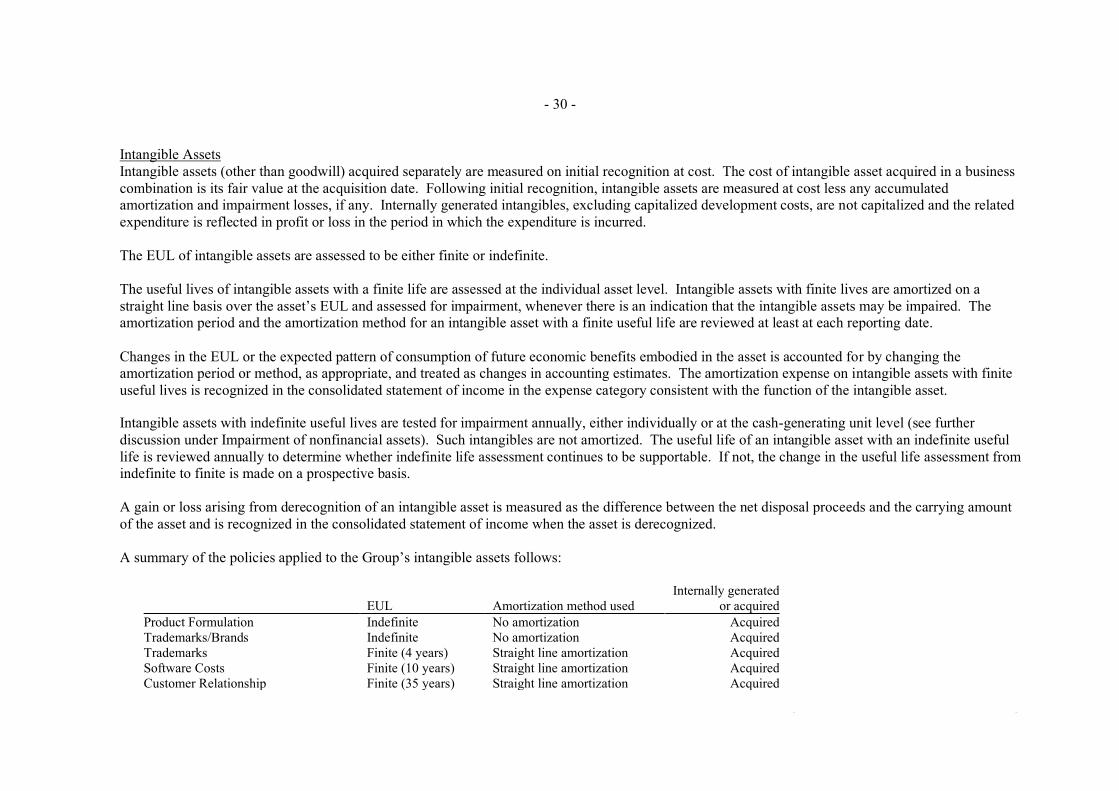
- 30 -
*SGVFSM000750*
Intangible Assets Intangible assets (other than goodwill) acquired separately are measured on initial recognition at cost. The cost of intangible asset acquired in a business combination is its fair value at the acquisition date. Following initial recognition, intangible assets are measured at cost less any accumulated amortization and impairment losses, if any. Internally generated intangibles, excluding capitalized development costs, are not capitalized and the related expenditure is reflected in profit or loss in the period in which the expenditure is incurred.
The EUL of intangible assets are assessed to be either finite or indefinite.
The useful lives of intangible assets with a finite life are assessed at the individual asset level. Intangible assets with finite lives are amortized on a straight line basis over the asset’s EUL and assessed for impairment, whenever there is an indication that the intangible assets may be impaired. The amortization period and the amortization method for an intangible asset with a finite useful life are reviewed at least at each reporting date.
Changes in the EUL or the expected pattern of consumption of future economic benefits embodied in the asset is accounted for by changing the amortization period or method, as appropriate, and treated as changes in accounting estimates. The amortization expense on intangible assets with finite useful lives is recognized in the consolidated statement of income in the expense category consistent with the function of the intangible asset.
Intangible assets with indefinite useful lives are tested for impairment annually, either individually or at the cash-generating unit level (see further discussion under Impairment of nonfinancial assets). Such intangibles are not amortized. The useful life of an intangible asset with an indefinite useful life is reviewed annually to determine whether indefinite life assessment continues to be supportable. If not, the change in the useful life assessment from indefinite to finite is made on a prospective basis.
A gain or loss arising from derecognition of an intangible asset is measured as the difference between the net disposal proceeds and the carrying amount of the asset and is recognized in the consolidated statement of income when the asset is derecognized.
A summary of the policies applied to the Group’s intangible assets follows:
EUL Amortization method used Internally generated
or acquired Product Formulation Indefinite No amortization Acquired Trademarks/Brands Indefinite No amortization Acquired Trademarks Finite (4 years) Straight line amortization Acquired Software Costs Finite (10 years) Straight line amortization Acquired Customer Relationship Finite (35 years) Straight line amortization Acquired

- 31 -
*SGVFSM000750*
Investment in Joint Ventures The Group has interests in joint ventures. A joint venture is a contractual arrangement whereby two or more parties who have joint control over the arrangement have rights to the net assets of the arrangements.
The Group’s investment in joint venture is accounted for using the equity method of accounting. Under the equity method, the investment in a joint venture is carried in the consolidated statement of financial position at cost plus post-acquisition changes in the Group’s share in the net assets of the joint venture. The consolidated statement of income reflects the Group’s share in the results of operations of the joint venture. Where there has been a change recognized directly in the investees’ equity, the Group recognizes its share of any changes and discloses this, when applicable, in the other comprehensive income in the consolidated statement of changes in equity. Profits and losses arising from transactions between the Group and the joint ventures are eliminated to the extent of the interest in the joint ventures.
The Group discontinues applying the equity method when its investments in investee companies are reduced to zero. Accordingly, additional losses are not recognized unless the Group has guaranteed certain obligations of the associates or joint venture. When the investees subsequently report net income, the Group will resume applying the equity method but only after its equity in the net income equals the equity in net losses of associates and joint venture not recognized during the period the equity method was suspended.
The investee company’s accounting policies conform to those used by the Group for like transactions and events in similar circumstances.
Impairment of Nonfinancial Assets This accounting policy applies primarily to the Group’s property, plant and equipment (see Note 13), right-of-use assets (Note 36), investment properties (see Note 17), investment in joint ventures (see Note 16), goodwill and intangible assets (see Note 15).
Except for goodwill and intangible assets with indefinite useful lives which are tested for impairment annually, the Group assesses at each reporting date whether there is an indication that its nonfinancial assets may be impaired. When an indicator of impairment exists or when an annual impairment testing for an asset is required, the Group makes a formal estimate of recoverable amount. Recoverable amount is the higher of an asset’s (or cash-generating unit’s) fair value less costs to sell and its value in use and is determined for an individual asset, unless the asset does not generate cash inflows that are largely independent of those from other assets or groups of assets, in which case the recoverable amount is assessed as part of the cash-generating unit to which it belongs. Where the carrying amount of an asset (or cash generating unit) exceeds its recoverable amount, the asset (or cash-generating unit) is considered impaired and is written-down to its recoverable amount.

- 32 -
*SGVFSM000750*
In assessing value in use, the estimated future cash flows are discounted to their present value using a pre-tax discount rate that reflects current market assessments of the time value of money and the risks specific to the asset (or cash-generating unit).
Impairment losses are recognized under ‘Provision for credit and impairment losses’ in the consolidated statement of income.
The following criteria are also applied in assessing impairment of specific assets:
Property, plant and equipment, right-of-use assets, investment properties, intangible assets with definite useful lives For property, plant and equipment, investment properties, intangible assets with definite useful lives, an assessment is made at each reporting date as to whether there is any indication that previously recognized impairment losses may no longer exist or may have decreased. If such indication exists, the recoverable amount is estimated. A previously recognized impairment loss is reversed only if there has been a change in the estimates used to determine the asset’s recoverable amount since the last impairment loss was recognized. If that is the case, the carrying amount of the asset is increased to its recoverable amount. That increased amount cannot exceed the carrying amount that would have been determined, net of depreciation and amortization, had no impairment loss been recognized for the asset in prior years. Such reversal is recognized in the consolidated statement of income. After such a reversal, the depreciation and amortization expense are adjusted in future years to allocate the asset’s revised carrying amount, less any residual value, on a systematic basis over its remaining useful life.
Goodwill Goodwill is reviewed for impairment, annually or more frequently, if events or changes in circumstances indicate that the carrying value may be impaired.
Impairment is determined by assessing the recoverable amount of the cash-generating unit (or group of cash-generating units) to which the goodwill relates. Where the recoverable amount of the cash-generating unit (or group of cash-generating units) is less than the carrying amount to which goodwill has been allocated, an impairment loss is recognized. Where goodwill forms part of a cash-generating unit (or group of cash-generating units) and part of the operations within that unit is disposed of, the goodwill associated with the operation disposed of is included in the carrying amount of the operation when determining the gain or loss on disposal of the operation. Goodwill disposed of in this circumstance is measured on the basis of the relative fair values of the operation disposed of and the portion of the cash-generating unit retained.
Impairment losses relating to goodwill cannot be reversed in future periods.
Intangible assets with indefinite useful lives Intangible assets with indefinite useful lives are tested for impairment annually as of reporting date either individually or at the cash-generating unit level, as appropriate.
- 33 -
*SGVFSM000750*
Investments in joint ventures After application of the equity method, the Group determines whether it is necessary to recognize additional impairment losses on the Group’s investments in joint ventures. If this is the case, the Group calculates the amount of impairment as being the difference between the fair value of the joint ventures and the acquisition cost and recognizes the amount under ‘Provision for credit and impairment losses’ in the consolidated statement of income.
Revenue Recognition Revenue from contracts with customers is recognized when control of the goods or services are transferred to the customer at an amount that reflects the consideration to which the Group expects to be entitled in exchange for those goods or services. The Group has concluded that it is the principal in its revenue arrangements because it controls the goods or services before transferring them to the customer.
Sale of goods and services Revenue from sale of goods and services is recognized at the point in time when control of the asset is transferred to the customer, generally on delivery of the goods and services. The Group considers whether there are other promises in the contract that are separate performance obligations to which a portion of the transaction price needs to be allocated. In determining the transaction price for the sale of goods and services, the Group considers the effects of variable consideration, the existence of significant financing components, noncash consideration, and consideration payable to the customer, if any.
Sale of sugar Sale of raw sugar is recognized upon (a) endorsement and transfer of quedans for quedan-based sales and (b) shipment or delivery and acceptance by the customers for physical sugar sales. Sale of refined sugar and alcohol is recognized upon shipment of delivery and acceptance by the customers. Sale of molasses warehouse receipts, which represents ownership title over the molasses inventories.
Rendering of tolling services Revenue derived from tolling activities is recognized as revenue at the point in time when the related services have been rendered.
Revenue outside the scope of PFRS 15: Dividend income Dividend income is recognized when the shareholder’s right to receive the payment is established.
Interest income Interest income is recognized as it accrues using the EIR method under which interest income is recognized at the rate that exactly discounts estimated future cash receipts through the expected life of the financial instrument to the net carrying amount of the financial asset.
- 34 -
*SGVFSM000750*
Provisions Provisions are recognized when: (a) the Group has a present obligation (legal or constructive) as a result of a past event; (b) it is probable (i.e., more likely than not) that an outflow of resources embodying economic benefits will be required to settle the obligation; and (c) a reliable estimate can be made of the amount of the obligation. Provisions are reviewed at each reporting date and adjusted to reflect the current best estimate. If the effect of the time value of money is material, provisions are determined by discounting the expected future cash flows at a pre-tax rate that reflects current market assessment of the time value of money and, where appropriate, the risks specific to the liability. Where discounting is used, the increase in the provision due to the passage of time is recognized as interest expense under ‘Finance cost’ in the consolidated statement of income. Where the Group expects a provision to be reimbursed, the reimbursement is recognized as a separate asset but only when the reimbursement is probable.
Contingencies Contingent liabilities are not recognized in the consolidated financial statements but disclosed in the notes to the consolidated financial statements unless the possibility of an outflow of resources embodying economic benefits is remote.
Contingent assets are not recognized in the consolidated financial statements but disclosed in the notes to the consolidated financial statements when an inflow of economic benefits is probable.
Pension Costs The net defined benefit liability or asset is the aggregate of the present value of the defined benefit obligation at the end of the reporting period reduced by the fair value of plan assets, if any, adjusted for any effect of limiting a net defined benefit asset to the asset ceiling. The asset ceiling is the present value of any economic benefits available in the form of refunds from the plan or reductions in future contributions to the plan.
The cost of providing benefits under the defined benefit plans is actuarially determined using the projected unit credit method.
Defined benefit costs comprise the following:
Current service cost Net interest on the net defined benefit liability or asset Remeasurements of net defined benefit liability or asset
Service costs which include current service costs, past service costs and gains or losses on non-routine settlements are recognized as expense in profit or loss.

- 35 -
*SGVFSM000750*
Past service costs are recognized in profit or loss on the earlier of:
The date of the plan amendment or curtailment, and The date that the Group recognizes related restructuring costs.
Net interest on the net defined benefit liability or asset is the change during the period in the net defined benefit liability or asset that arises from the passage of time which is determined by applying the discount rate based on government bonds to the net defined benefit liability or asset.
Net interest on the net defined benefit liability or asset is recognized as expense or income in the consolidated statement of income.
Remeasurements comprising actuarial gains and losses, return on plan assets and any change in the effect of the asset ceiling (excluding net interest on defined benefit liability) are recognized immediately in other comprehensive income in the period in which they arise. Remeasurements are not reclassified to consolidated statement of income in subsequent periods.
Plan assets are assets that are held by a long-term employee benefit fund or qualifying insurance policies. Plan assets are not available to the creditors of the Group, nor can they be paid directly to the Group. Fair value of plan assets is based on market price information. When no market price is available, the fair value of plan assets is estimated by discounting expected future cash flows using a discount rate that reflects both the risk associated with the plan assets and the maturity or expected disposal date of those assets (or, if they have no maturity, the expected period until the settlement of the related obligations). If the fair value of the plan assets is higher than the present value of the defined benefit obligation, the measurement of the resulting defined benefit asset is limited to the present value of economic benefits available in the form of refunds from the plan or reductions in future contributions to the plan.
The Group’s right to be reimbursed of some or all of the expenditure required to settle a defined benefit obligation is recognized as a separate asset at fair value when and only when reimbursement is virtually certain.
Termination benefit Termination benefits are employee benefits provided in exchange for the termination of an employee’s employment as a result of either an entity’s decision to terminate an employee’s employment before the normal retirement date or an employee’s decision to accept an offer of benefits in exchange for the termination of employment.
- 36 -
*SGVFSM000750*
A liability and expense for a termination benefit is recognized at the earlier of when the entity can no longer withdraw the offer of those benefits and when the entity recognizes related restructuring costs. Initial recognition and subsequent changes to termination benefits are measured in accordance with the nature of the employee benefit, as either post-employment benefits, short-term employee benefits, or other long-term employee benefits.
Employee leave entitlement Employee entitlements to annual leave are recognized as a liability when they are accrued to the employees. The undiscounted liability for leave expected to be settled wholly before twelve months after the end of the annual reporting period is recognized for services rendered by employees up to the end of the reporting period.
Income Taxes Current tax Current tax assets and liabilities for the current and prior periods are measured at the amount expected to be recovered from or paid to the taxation authorities.
The tax rates and tax laws used to compute the amount are those that are enacted or substantively enacted at the reporting date.
Deferred tax Deferred tax is provided using the balance sheet liability method on all temporary differences, with certain exceptions, at the reporting date between the tax bases of assets and liabilities and their carrying amounts for financial reporting purposes.
Deferred tax liabilities are recognized for all taxable temporary differences, except:
When the deferred tax liability arises from the initial recognition of goodwill or an asset or liability in a transaction that is not a business combinationand, at the time of the transaction, affects neither the accounting profit nor taxable profit or loss; and
In respect of taxable temporary differences associated with investments in subsidiaries, associates and interests in joint ventures, where the timing ofthe reversal of the temporary differences can be controlled and it is probable that the temporary differences will not reverse in the foreseeable future.

- 37 -
*SGVFSM000750*
Deferred tax assets are recognized for all deductible temporary differences, carryforward benefits of unused tax credits from unused minimum corporate income tax (MCIT) over the regular corporate income tax (RCIT) and unused net operating loss carryover (NOLCO), to the extent that it is probable that future taxable income will be available against which the deductible temporary differences, and the carryforward benefits of unused tax credits from excess MCIT and unused NOLCO can be utilized, except:
Where the deferred tax asset relating to the deductible temporary difference arises from the initial recognition of an asset or liability in a transactionthat is not a business combination and, at the time of the transaction, affects neither the accounting profit nor future taxable profit or loss; and
In respect of deductible temporary differences associated with investments in subsidiaries, associates and interests in joint ventures, deferred taxassets are recognized only to the extent that it is probable that the temporary differences will reverse in the foreseeable future and future taxable profitwill be available against which the temporary differences can be utilized.
The carrying amounts of deferred tax assets are reviewed at each reporting date and reduced to the extent that it is no longer probable that sufficient taxable income will be available to allow all or part of the deferred tax assets to be utilized. Unrecognized deferred tax assets are reassessed at each reporting date, and are recognized to the extent that it has become probable that future taxable income will allow the deferred tax assets to be recognized.
Deferred tax relating to items recognized outside profit or loss is recognized outside profit or loss in the consolidated statement of comprehensive income. Deferred tax items are recognized in correlation to the underlying transaction either in other comprehensive income or directly in equity.
Deferred tax assets and liabilities are measured at the tax rate that is expected to apply to the period when the asset is realized or the liability is settled, based on tax rates (and tax laws) that have been enacted or substantively enacted as of the reporting date.
Deferred tax assets and deferred tax liabilities are offset if a legally enforceable right exists to set off current tax assets against current tax liabilities and the deferred taxes relate to the same taxable entity and the same taxation authority.
Value-added Tax (VAT) Revenues, expenses, and assets are recognized net of the amount of VAT, if applicable.
When VAT from sale of goods and/or services (output VAT) exceeds VAT passed on from purchases of goods or services (input VAT), the excess is recognized as payable in the consolidated statement of financial position. When VAT passed on from purchases of goods or services (input VAT) exceeds VAT from sale of goods and/or services (output VAT), the excess is recognized as an asset in the consolidated statement financial position to the extent of the recoverable amount.

- 38 -
*SGVFSM000750*
The net amount of VAT recoverable from, or payable to, the taxation authority is included as part of “Other current assets” or “Accounts payable and other accrued liabilities” in the consolidated statement of financial position.
Borrowing Costs Interest and other finance costs incurred during the construction period on borrowings used to finance property development are capitalized to the appropriate asset accounts. Capitalization of borrowing costs commences when the activities to prepare the asset are in progress, and expenditures and borrowing costs are being incurred. The capitalization of these borrowing costs ceases when substantially all the activities necessary to prepare the asset for sale or its intended use are complete. If the carrying amount of the asset exceeds its recoverable amount, an impairment loss is recorded. Capitalized borrowing cost is based on the applicable weighted average borrowing rate. Borrowing costs which do not qualify for capitalization are expensed as incurred.
Interest expense on loans is recognized using the EIR method over the term of the loans.
Leases – Group as a Lessee (Upon adoption of PFRS 16 beginning January 1, 2019) The Group assesses whether a contract is, or contains a lease, at the inception of a contract. This assessment involves the exercise of judgment about whether it depends on a specified asset, whether the Group obtains substantially all the economic benefits from the use of the asset and whether the Group has the right to direct the use of the asset. The Group recognizes a ROU asset and a corresponding lease liability with respect to all lease agreements in which it is the lessee, except for short-term leases and leases of low-value assets.
Right-of-use assets The Group recognizes ROU assets at the commencement date of the lease (i.e., the date the underlying asset is available for use). ROU assets are measured at cost, less any accumulated depreciation and impairment losses, and adjusted for any remeasurement of lease liabilities. The cost of ROU assets includes the amount of lease liabilities recognized, initial direct costs incurred, lease payments made at or before the commencement date less any lease incentives received, and any estimated costs to be incurred in dismantling and removing the underlying asset, restoring the site on which it is located or restoring the underlying asset to the condition required by the terms and conditions of the lease, unless those costs are incurred to produce inventories. Unless the Group is reasonably certain to obtain ownership of the leased asset at the end of the lease term, the recognized ROU assets are depreciated on a straight-line basis over the shorter of its estimated useful life and the lease term. ROU assets, which are presented under ‘Noncurrent Assets’ in the statement of financial position, are subject to impairment.
- 39 -
*SGVFSM000750*
The depreciation period for each class of ROU assets follow:
Period Land and land improvements 10 years Buildings and improvements 2-20 years Machinery and equipment 2 years Transporation equipment 2 years Furniture and fixture 2 years
Lease liabilities At the commencement date of the lease, the Group recognizes lease liabilities measured at the present value of lease payments to be made over the lease term. The lease payments include fixed payments (including in-substance fixed payments) less any lease incentives receivable, variable lease payments that depend on an index or a rate, and amounts expected to be paid under residual value guarantees. The lease payments also include the exercise price of a purchase option reasonably certain to be exercised by the Group and payments of penalties for terminating a lease, if the lease term reflected the Group exercising the option to terminate. The variable lease payments that do not depend on an index or a rate are recognized as expense in the period on which the event or condition that triggers the payment occurs.
In calculating the present value of lease payments, the Group uses the incremental borrowing rate at the commencement date if the interest rate implicit to the lease is not readily determinable. After the commencement date, the amount of lease liabilities is increased to reflect the accretion of interest and reduced for the lease payments made. In addition, the carrying amount of lease liabilities is remeasured if there is a modification, a change in the lease term, a change in the in-substance fixed lease payments or a change in the assessment to purchase the underlying asset.
Short-term leases The Group applies the short-term lease recognition exemption to its short-term leases of 12 months or less from the commencement date and do not contain a purchase option. Lease payments on short-term leases are recognized as expense on a straight-line basis over the lease term.
Leases (Prior to adoption of PFRS 16) The determination of whether an arrangement is, or contains a lease, is based on the substance of the arrangement at inception date, and requires an assessment of whether the fulfillment of the arrangement is dependent on the use of a specific asset or assets and the arrangement conveys a right to use the asset or assets, even if that right is not explicitly specified in an arrangement.
- 40 -
*SGVFSM000750*
A reassessment is made after inception of the lease only if one of the following applies:
a) there is a change in contractual terms, other than a renewal or extension of the arrangement;b) a renewal option is exercised or an extension granted, unless that term of the renewal or extension was initially included in the lease term;c) there is a change in the determination of whether fulfillment is dependent on a specified asset; ord) there is a substantial change to the asset.
Where a reassessment is made, lease accounting shall commence or cease from the date when the change in circumstances gave rise to the reassessment for scenarios a, c or d above, and at the date of renewal or extension period for scenario b.
Group as a lessee A lease is classified at the inception date as finance lease or an operating lease.
Finance leases, which transfer to the Group substantially all the risks and benefits incidental to ownership of the leased item, are capitalized at the commencement of the lease at the fair value of the leased property or, if lower, at the present value of the minimum lease payments. Lease payments are apportioned between finance charges and reduction of the lease liability so as to achieve a constant rate of interest on the remaining balance of the liability. Finance charges are recognized in ‘Finance costs’ in the consolidated statement of income.
A leased asset is depreciated over the EUL of the asset. However, if there is no reasonable certainty that the Group will obtain ownership by the end of the lease term, the asset is depreciated over the shorter of the EUL of the asset and the lease term.
Leases where the lessor retains substantially all the risks and benefits of ownership of the asset are classified as operating leases. Operating lease payments are recognized as an expense in the consolidated statement of income on a straight-line basis over the lease term.
Group as a lessor Leases where the Group does not transfer substantially all the risks and benefits of ownership of the assets are classified as operating leases. Initial direct costs incurred in negotiating operating leases are added to the carrying amount of the leased asset and recognized over the lease term on the same basis as the rental income. Contingent rents are recognized as revenue in the period in which they are earned.
Rent income Rent income arising on investment properties is accounted for on a straight-line basis over the lease term on ongoing leases.

- 41 -
*SGVFSM000750*
Cost and Expenses Cost and expenses are decreases in economic benefits during the accounting period in the form of outflows or decrease of assets or incurrence of liabilities that result in decreases in equity, other than those relating to distributions to equity participants. Cost and expenses are recognized when incurred.
Foreign Currency Translation/Transactions The functional and presentation currency of the Parent Company and its Philippine subsidiaries is the Philippine Peso. Each entity in the Group determines its own functional currency and items included in the consolidated financial statements of each entity are measured using that functional currency.
Transactions and balances Transactions in foreign currencies are initially recorded in the functional currency rate prevailing at the date of the transaction. Monetary assets and liabilities denominated in foreign currencies are retranslated at the functional currency rate of exchange prevailing at the reporting date. All differences are taken to the consolidated statement of income. Tax charges and credits attributable to exchange differences on those borrowings are also dealt with in statement of income. Nonmonetary items that are measured in terms of historical cost in a foreign currency are translated using the exchange rate as at the date of initial transaction. Nonmonetary items measured at fair value in a foreign currency are translated using the exchange rates at the date when the fair value was determined.
Group companies As of reporting date, the assets and liabilities of the subsidiaries are translated into the presentation currency of the Group at the rate of exchange prevailing at reporting date and their respective statements of income are translated at the weighted average exchange rates for the year. The exchange differences arising on the translation are taken directly to a separate component of equity as ‘Cumulative translation adjustments’ under ‘Other comprehensive income’. On disposal of a foreign entity, the deferred cumulative amount recognized in equity relating to that particular foreign operation shall be recognized in the consolidated statement of income.
The Group has determined that the cumulative translation adjustments will not be realized in the forseeable future. Therefore, the Group does not recognize deferred tax liabilities on its cumulative translation adjustments.
Common Stock Capital stocks are classified as equity and are recorded at par. Proceeds in excess of par value are recorded as ‘Additional paid-in capital’ in the consolidated statement of changes in equity.
Incremental costs directly attributable to the issue of new shares or options are shown in equity as a deduction, net of tax, from the proceeds.
- 42 -
*SGVFSM000750*
Retained Earnings Retained earnings represent the cumulative balance of periodic net income (loss), dividend distributions, prior period adjustments and effect of changes in accounting policy and capital adjustments.
Other Comprehensive Income Other comprehensive income comprises items of income and expenses (including items previously presented under the consolidated statements of changes in equity) that are not recognized in the consolidated statement of income for the year in accordance with PFRSs.
Treasury Shares Treasury shares are recorded at cost and are presented as a deduction from equity. Any consideration paid or received in connection with treasury shares are recognized directly in equity.
When the shares are retired, the capital stock account is reduced by its par value. The excess of cost over par value upon retirement is debited to the following accounts in the order given: (a) additional paid-in capital to the extent of the specific or average additional paid-in capital when the shares were issued, and (b) retained earnings. When shares are sold, the treasury share account is credited and reduced by the weighted average cost of the shares sold. The excess of any consideration over the cost is credited to additional paid-in capital.
Transaction costs incurred such as registration and other regulatory fees, amounts paid to legal, accounting and other professional advisers, printing costs and stamp duties (net of any related income tax benefit) in relation to issuing or acquiring the treasury shares are accounted for as reduction from equity, which is disclosed separately.
No gain or loss is recognized in the consolidated statement of income on the purchase, sale, issue or cancellation of the Group’s own equity instruments.
Dividends on Common Stocks Dividends on common shares are recognized as a liability and deducted from equity when approved by BOD of the Parent Company in the case of cash dividends, and the BOD and shareholders of the Parent Company in the case of stock dividends.
Earnings Per Share (EPS) Basic EPS is computed by dividing consolidated net income attributable to equity holders of the Parent Company (consolidated net income less dividends on preferred shares) by the weighted average number of common stocks issued and outstanding during the year, adjusted for any subsequent stock dividends declared.

- 43 -
*SGVFSM000750*
Diluted EPS amounts are calculated by dividing the consolidated net income attributable to equity holders of the Parent Company by the weighted average number of ordinary shares outstanding during the year plus the weighted average number of ordinary shares that would be issued on the conversion of all the dilutive potential ordinary shares into ordinary shares.
Segment Reporting The Group’s operating businesses are organized and managed separately according to the nature of the products and services provided, with each segment representing a strategic business unit that offers different products and serves different markets. Financial information on business segments is presented in Note 6 to the consolidated financial statements.
Events after Reporting Date Any post year-end event up to the date of approval of the BOD of the consolidated financial statements that provides additional information about the Group’s position at reporting date (adjusting event) is reflected in the consolidated financial statements. Any post year-end event that is not an adjusting event is disclosed in the notes to the consolidated financial statements, when material.
Standards Issued but not yet Effective Pronouncements issued but not yet effective are listed below. Unless otherwise indicated, the Group does not expect that the future adoption of the said pronouncements will have a significant impact on its consolidated financial statements. The Group intends to adopt the following pronouncements when they become effective.
Effective beginning on or after January 1, 2020 Amendments to PFRS 3, Definition of a Business
The amendments to PFRS 3 clarify the minimum requirements to be a business, remove the assessment of a market participant’s ability to replacemissing elements, and narrow the definition of outputs. The amendments also add guidance to assess whether an acquired process is substantive andadd illustrative examples. An optional fair value concentration test is introduced which permits a simplified assessment of whether an acquired set ofactivities and assets is not a business.
An entity applies those amendments prospectively for annual reporting periods beginning on or after January 1, 2020, with earlier applicationpermitted.
These amendments will apply on future business combinations of the Group.
- 44 -
*SGVFSM000750*
Amendments to PAS 1, Presentation of Financial Statements, and PAS 8, Accounting Policies, Changes in Accounting Estimates and Errors,Definition of MaterialThe amendments refine the definition of material in PAS 1 and align the definitions used across PFRSs and other pronouncements. They are intendedto improve the understanding of the existing requirements rather than to significantly impact an entity’s materiality judgements.
An entity applies those amendments prospectively for annual reporting periods beginning on or after January 1, 2020, with earlier applicationpermitted.
Effective beginning on or after January 1, 2021 PFRS 17, Insurance Contracts
PFRS 17 is a comprehensive new accounting standard for insurance contracts covering recognition and measurement, presentation and disclosure.Once effective, PFRS 17 will replace PFRS 4, Insurance Contracts. This new standard on insurance contracts applies to all types of insurancecontracts (i.e., life, non-life, direct insurance and re-insurance), regardless of the type of entities that issue them, as well as to certain guarantees andfinancial instruments with discretionary participation features. A few scope exceptions will apply.
The overall objective of PFRS 17 is to provide an accounting model for insurance contracts that is more useful and consistent for insurers. In contrastto the requirements in PFRS 4, which are largely based on grandfathering previous local accounting policies, PFRS 17 provides a comprehensivemodel for insurance contracts, covering all relevant accounting aspects. The core of PFRS 17 is the general model, supplemented by:
A specific adaptation for contracts with direct participation features (the variable fee approach) A simplified approach (the premium allocation approach) mainly for short-duration contracts
PFRS 17 is effective for reporting periods beginning on or after January 1, 2021, with comparative figures required. Early application is permitted.
Deferred effectivity Amendments to PFRS 10, Consolidated Financial Statements, and PAS 28, Sale or Contribution of Assets between an Investor and its Associate or
Joint VentureThe amendments address the conflict between PFRS 10 and PAS 28 in dealing with the loss of control of a subsidiary that is sold or contributed to anassociate or joint venture. The amendments clarify that a full gain or loss is recognized when a transfer to an associate or joint venture involves abusiness as defined in PFRS 3. Any gain or loss resulting from the sale or contribution of assets that does not constitute a business, however, isrecognized only to the extent of unrelated investors’ interests in the associate or joint venture.
- 45 -
*SGVFSM000750*
On January 13, 2016, the Financial Reporting Standards Council deferred the original effective date of January 1, 2016 of the said amendments until the International Accounting Standards Board (IASB) completes its broader review of the research project on equity accounting that may result in the simplification of accounting for such transactions and of other aspects of accounting for associates and joint ventures.
3. Significant Accounting Judgments and Estimates
The preparation of the consolidated financial statements in compliance with PFRSs requires the Group to make estimates and assumptions that affect thereported amounts of assets, liabilities, income and expenses and disclosure of contingent assets and contingent liabilities. Future events may occur whichwill cause the assumptions used in arriving at the estimates to change. The effects of any change in estimates are reflected in the consolidated financialstatements as they become reasonably determinable.
Judgments and estimates are continually evaluated and are based on historical experience and other factors, including expectations of future events thatare believed to be reasonable under the circumstances.
JudgmentsIn the process of applying the Group’s accounting policies, management has made the following judgments, apart from those involving estimations,which have the most significant effect on the amounts recognized in the consolidated financial statements:
a. Revenue recognition on sale of goods and servicesRevenue recognition under PFRS 15 involves the application of significant judgment and estimation in the: (a) identification of the contract for saleof goods that would meet the requirements of PFRS 15; (b) assessment of performance obligation and the probability that the entity will collect theconsideration from the buyer; (c) determining method to estimate variable consideration and assessing the constraint; and (d) recognition of revenueas the Group satisfies the performance obligation.
i. Existence of a contractThe Group enters into a contract with customer through an approved purchase order which constitutes a valid contract as specific details such asthe quantity, price, contract terms and their respective obligations are clearly identified. In the case of sales to key accounts and distributors, thecombined approved purchase order and trading terms agreement/exclusive distributorship agreement constitute a valid contract. In addition, partof the assessment process of the Group before revenue recognition is to assess the probability that the Group will collect the consideration towhich it will be entitled in exchange for the goods sold that will be transferred to the customer.
- 46 -
*SGVFSM000750*
ii. Identifying performance obligationThe Group identifies performance obligations by considering whether the promised goods or services in the contract are distinct goods orservices. A good or service is distinct when the customer can benefit from the good or service on its own or together with other resources that arereadily available to the customer and the Group’s promise to transfer the good or service to the customer is separately identifiable from the otherpromises in the contract.
Based on management assessment, other than the sale of goods and services, no other performance obligations were identified except in the caseof milling revenue.
iii. Recognition of revenue as the Group satisfies the performance obligationThe Group recognizes its revenue for all revenue streams at a point in time, when the goods are sold and delivered and when services are alreadyrendered.
iv. Recognition of milling revenue under output sharing agreement and cane purchase agreementThe Group applies both output sharing agreement and cane purchare agreement in relation to milling operation. Under output sharing agreement,milling revenue is recognized based on the fair value of the millshare at average raw sugar selling price on the month with sugar production afterconsidering in-purchase, which represents cane purchase agreement. Under cane purchase agreement, the Group purchases raw sugar from thetraders and/or planters. The in-purchase rate is derived by determining the total raw sugar purchases and the total planters’ share. Rawproduction costs are allocated systematically based on the output sharing and cane purchase agreement rates.
b. ContingenciesThe Group is currently involved in various legal proceedings. The estimate of the probable costs for the resolution of these claims has beendeveloped in consultation with outside counsel handling the defense in these matters and is based upon an analysis of potential results. The Groupcurrently does not believe these proceedings will have a material effect on the Group’s consolidated financial position. It is possible, however, thatfuture results of operations could be materially affected by changes in the estimates or in the effectiveness of the strategies relating to theseproceedings.
c. Determining whether it is reasonably certain that a renewal and termination option will be exercised - The Group as a lesseeThe Group determines the lease term as the non-cancellable term of the lease, together with any periods covered by an option to renew the lease if itis reasonably certain to be exercised, or any periods covered by an option to terminate the lease, if it is reasonably certain not to be exercised.
- 47 -
*SGVFSM000750*
The Group has several lease contracts that include renewal and termination options. The Group applies judgment in evaluating whether it is reasonably certain to exercise the option to renew or terminate the lease. That is, it considers all relevant factors that create an economic incentive for it to exercise the renewal or termination. After the commencement date, the Group reassesses the lease term if there is a significant event or change in circumstances that is within its control and affects its ability to exercise (or not to exercise) the option to renew or terminate (e.g., a change in business strategy).
The Group included the renewal period as part of the lease term for leases, together with any periods covered by an option to renew the lease if it is reasonably certain to be exercised, or any periods covered by an option to terminate the lease, if it is reasonably certain not to be exercised. The Group did not include the option to renew nor the option to terminate the lease in the lease term as the Group assessed that it is not reasonably certain that these options will be exercised.
d. Assessment of retention of controlThe Group determined that it has retained control over UHC, following the sale of 40% of its ownership interest in UHC to Intersnack. The Groupconsidered the impact of the terms and conditions of the shareholders' agreement and other related agreements, and assessed that it still has controlover UHC. URC retained control because it still has:
(i) power over UHC through URC's representation in UHC's BOD;(ii) exposure or rights to variable returns from its involvement with UHC; and(iii) the ability to use its power to direct UHC's decision-making over its operations (i.e., the ability to direct the relevant activities of UHC), in order
to affect its returns from UHC.
e. Accounting for the purchase optionThe Group issued a purchase option as part of its transaction to sell 40% of its ownership interest in UHC to Intersnack. Based on its assessment ofthe terms of the instrument reflected in the shareholders’ agreement, the option should be accounted for as a derivative liability under PFRS 9,Financial Instruments. The Group considered the following:
(i) The option holder has no present access to the returns associated with the shares subject to the call option; and(ii) The option will not be settled with the payment by the option holder of a fixed amount of cash because of certain contractual terms of the option.

- 48 -
*SGVFSM000750*
Estimates The key assumptions concerning the future and other sources of estimation uncertainty at the financial position date that have a significant risk of causing a material adjustment to the carrying amounts of assets and liabilities within the next financial year are discussed below.
a. Assessment for ECL on trade receivablesThe Group, applying the simplified approach in the computation of ECL, initially uses a provision matrix based on historical default rates for tradereceivables. The provision matrix specifies provision rates depending on the number of days that a trade receivable is past due. The Group also usesappropriate groupings if its historical credit loss experience show significantly different loss patterns for different customer segments. The Group thenadjusts the historical credit loss experience with forward-looking information on the basis of current observable data affecting each customer segmentto reflect the effects of current and forecasted economic conditions.
The Group adjusts historical default rates to forward-looking default rate by determining the closely related economic factor affecting each customersegment. The Group regularly reviews the methodology and assumptions used for estimating ECL to reduce any differences between estimates andactual credit loss experience.
The determination of the relationship between historical default rates and forecasted economic conditions is a significant accounting estimate.Accordingly, the provision for ECL on trade receivables is sensitive to changes in assumptions about forecasted economic conditions.
The Group has assessed that the ECL on trade receivables is not material because substantial amount of receivables are normally collected within oneyear. The carrying amount of trade receivables is P=13.6 billion and P=12.1 billion as at December 31, 2019 and 2018, respectively(see Note 10).
b. Assessment for ECL on Other Financial Assets at Amortized CostThe Group determines the allowance for ECL using general approach based on the probability-weighted estimate of the present value of all cashshortfalls over the expected life of financial assets at amortized cost. ECL is provided for credit losses that result from possible default events withinthe next 12-months unless there has been a significant increase in credit risk since initial recognition in which case ECL is provided based on lifetimeECL.
When determining if there has been a significant increase in credit risk, the Group considers reasonable and supportable information that is availablewithout undue cost or effort and that is relevant for the particular financial instrument being assessed such as, but not limited to, the following factors:
Actual or expected external and internal credit rating downgrade; Existing or forecasted adverse changes in business, financial or economic conditions; and,

- 49 -
*SGVFSM000750*
Actual or expected significant adverse changes in the operating results of the borrower.
The Group also considers financial assets that are more than 90 days past due to be the latest point at which lifetime ECL should be recognized unless it can demonstrate that this does not represent a significant risk in credit risk such as when non-payment was an administrative oversight rather than resulting from financial difficulty of the borrower.
The Group has assessed that the ECL on other financial assets at amortized cost is not material because the transactions with respect to these financial assets were entered into by the Group only with reputable banks and companies with good credit standing and relatively low risk of defaults. Accordingly, no provision for ECL on other financial assets at amortized cost was recognized in 2019 and 2018.
c. Determination of fair values less estimated costs to sell of biological assetsThe fair values of biological assets are determined based on current market prices of livestock of similar age, breed and genetic merit. Costs to sellinclude commissions to brokers and dealers, nonrefundable transfer taxes and duties. Costs to sell exclude transport and other costs necessary to getthe biological assets to the market. The fair values are reviewed and updated if expectations differ from previous estimates due to changes brought byboth physical change and price changes in the market. It is possible that future results of operations could be materially affected by changes in theseestimates brought about by the changes in factors mentioned.
As of December 31, 2019 and 2018, the Group’s biological assets carried at fair values less estimated costs to sell amounted to P=1.0 billion andP=1.1 billion, respectively (see Note 14). For the years ended December 31, 2019, 2018 and 2017, the Group recognized changes in the fair value lesscosts to sell of biological assets amounting to P=70.2 million loss, P=467.5 million loss and P=118.8 million gain, respectively (see Note 14). Changes infair value of biological assets are recognized in the consolidated statement of income.
d. Impairment of goodwill and intangible assets with indefinite useful livesThe Group performed its annual impairment test on its goodwill and other intangible assets with indefinite useful lives as of reporting date. Therecoverable amounts of the intangible assets were determined based on value in use calculations using cash flow projections from financial budgetsapproved by management covering a five-year period. The pre-tax discount rates applied to cash flow projections range from 8.30% to 10.50% and7.80% to 10.80% for the years ended December 31, 2019 and 2018, respectively. The following assumptions were also used in computing value inuse:
Growth rate estimates - growth rates include revenue growth and terminal growth rates that are based on experiences and strategies developed for thevarious subsidiaries. The prospect for the industry was also considered in estimating the growth rates.

- 50 -
*SGVFSM000750*
Discount rates - discount rates were estimated based on the industry weighted average cost of capital, which includes the cost of equity and debt after considering the gearing ratio. Value-in-use is most sensitive to changes in discount rate and growth rate.
As of December 31, 2019 and 2018, the balance of the Group’s goodwill and intangible assets with indefinite useful lives, net of accumulated depreciation, amortization and impairment loss follow:
2019 2018 Goodwill (Note 15) P=31,194,495,817 P=31,194,495,817 Intangible assets (Note 15) 11,673,128,525 11,730,260,354
e. Assessment of impairment of nonfinancial assetsThe Group assesses the impairment of its nonfinancial assets (i.e., property, plant and equipment, right-of-use assets, investment properties,investment in joint venture and intangible assets with finite useful lives) whenever events or changes in circumstances indicate that the carryingamount of an asset may not be recoverable.
The factors that the Group considers important which could trigger an impairment review include the following:
Market interest rates or other market rates of return on investments have increased during the period, and those increases are likely to affect thediscount rate used in calculating the asset’s value in use and decrease the asset’s recoverable amount materially;
Significant underperformance relative to expected historical or projected future operating results; Significant changes in the manner of use of the acquired assets or the strategy for overall business; and Significant negative industry or economic trends.
The Group determines an impairment loss whenever the carrying amount of an asset exceeds its recoverable amount, which is the higher of its fair value less costs to sell and its value in use. The fair value less costs to sell calculation is based on available data from binding sales transactions in an arm’s length transaction of similar assets or observable market prices less incremental costs for disposing of the asset. The value in use calculation is based on a discounted cash flow model. The cash flows are derived from the budget for the next five years and do not include restructuring activities that the Group is not yet committed to or significant future investments that will enhance the asset base of the cash-generating unit being tested. The recoverable amount is most sensitive to the discount rate used for the discounted cash flow model as well as the expected future cash inflows and the growth rate used for extrapolation purposes.
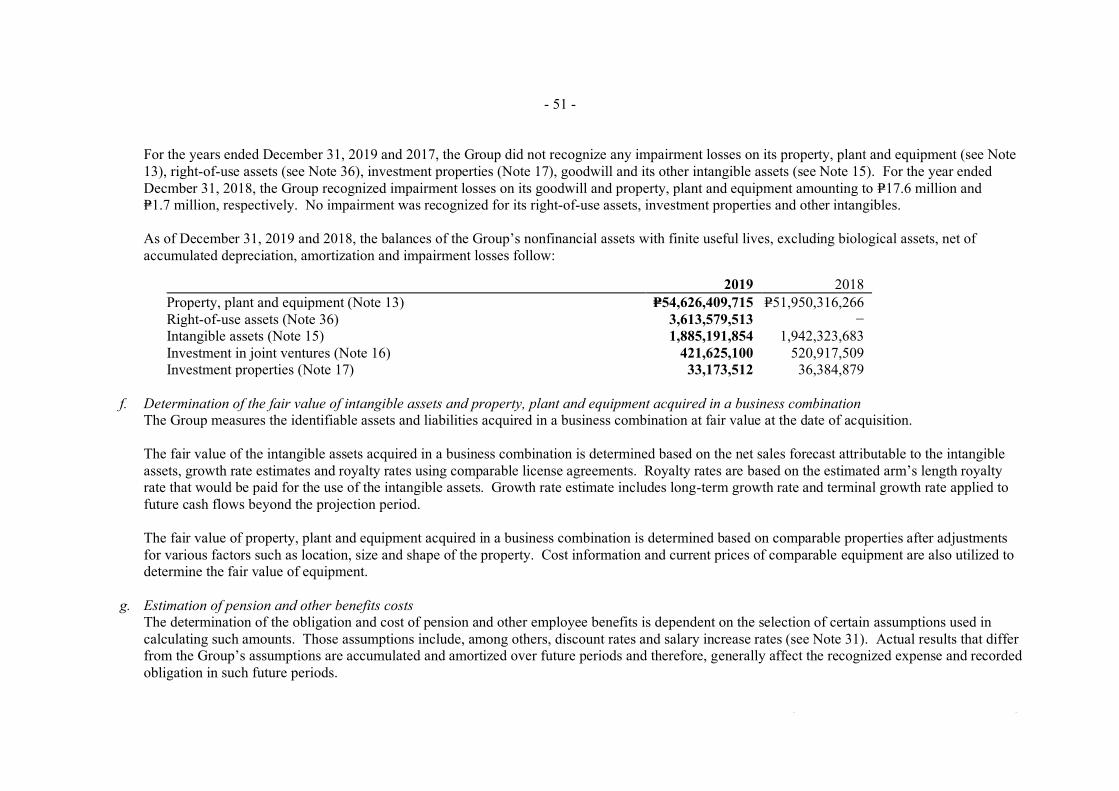
- 51 -
*SGVFSM000750*
For the years ended December 31, 2019 and 2017, the Group did not recognize any impairment losses on its property, plant and equipment (see Note 13), right-of-use assets (see Note 36), investment properties (Note 17), goodwill and its other intangible assets (see Note 15). For the year ended Decmber 31, 2018, the Group recognized impairment losses on its goodwill and property, plant and equipment amounting to P=17.6 million and P=1.7 million, respectively. No impairment was recognized for its right-of-use assets, investment properties and other intangibles.
As of December 31, 2019 and 2018, the balances of the Group’s nonfinancial assets with finite useful lives, excluding biological assets, net of accumulated depreciation, amortization and impairment losses follow:
2019 2018 Property, plant and equipment (Note 13) P=54,626,409,715 P=51,950,316,266 Right-of-use assets (Note 36) 3,613,579,513 − Intangible assets (Note 15) 1,885,191,854 1,942,323,683 Investment in joint ventures (Note 16) 421,625,100 520,917,509 Investment properties (Note 17) 33,173,512 36,384,879
f. Determination of the fair value of intangible assets and property, plant and equipment acquired in a business combinationThe Group measures the identifiable assets and liabilities acquired in a business combination at fair value at the date of acquisition.
The fair value of the intangible assets acquired in a business combination is determined based on the net sales forecast attributable to the intangibleassets, growth rate estimates and royalty rates using comparable license agreements. Royalty rates are based on the estimated arm’s length royaltyrate that would be paid for the use of the intangible assets. Growth rate estimate includes long-term growth rate and terminal growth rate applied tofuture cash flows beyond the projection period.
The fair value of property, plant and equipment acquired in a business combination is determined based on comparable properties after adjustmentsfor various factors such as location, size and shape of the property. Cost information and current prices of comparable equipment are also utilized todetermine the fair value of equipment.
g. Estimation of pension and other benefits costsThe determination of the obligation and cost of pension and other employee benefits is dependent on the selection of certain assumptions used incalculating such amounts. Those assumptions include, among others, discount rates and salary increase rates (see Note 31). Actual results that differfrom the Group’s assumptions are accumulated and amortized over future periods and therefore, generally affect the recognized expense and recordedobligation in such future periods.
- 52 -
*SGVFSM000750*
The present value of the defined benefit obligation is determined by discounting the estimated future cash outflows using interest rates of Philippine government bonds with terms consistent with the expected employee benefit payout as of reporting date.
The mortality rate is based on publicly available mortality tables for the specific country and is modified accordingly with estimates of mortality improvements. Future salary increases and pension increases are based on expected future inflation rates for the specific country.
As of December 31, 2019 and 2018, the balance of the Group’s present value of defined benefit obligations and other benefits is shown in Note 31 to the consolidated financial statements.
h. Recognition of deferred income tax assetsThe Group reviews the carrying amounts of its deferred income taxes at each reporting date and reduces the deferred tax assets to the extent that it isno longer probable that sufficient taxable income will be available to allow all or part of the deferred tax assets to be utilized. However, there is noassurance that the Group will generate sufficient taxable income to allow all or part of the deferred tax assets to be utilized.
As of December 31, 2019 and 2018, the Group recognized net deferred tax assets amounting toP=620.2 million and P=195.5 million, respectively (see Note 32), as the Group believes sufficient taxable income will allow these deferred tax assets tobe utilized.
Net deferred tax liabilities amounted to P=3.9 billion and P=4.2 billion as of December 31, 2019 and 2018, respectively (see Note 32).
As of December 31, 2019 and 2018, the Group has certain subsidiaries which are under ITH. As such, no deferred tax assets were set up on certaingross deductible temporary differences that are expected to reverse or expire within the ITH period (see Note 35).
The recognized and unrecognized deferred tax assets for the Group are disclosed in Note 32.
i. Valuation of ROU assets and lease liabilitiesThe application of PFRS 16 requires the Group to make judgments that affect the valuation of the lease liabilities and the valuation of ROU assets.These include determining the lease term and determining the interest rate to be used for discounting future cash flows.
Lease term. The lease term determined by the Group comprises non-cancellable period of lease contracts, together with any periods covered by anoption to extend the lease if it is reasonably certain to be exercised, or any periods covered by an option to terminate the lease, if it is reasonablycertain not to be exercised. For lease contracts with indefinite term, the Group estimates the length of the contract to be equal to the economic usefullife of noncurrent assets located in the leased property and physically connected with it or determines the length of the contract to be equal to the
- 53 -
*SGVFSM000750*
average or typical market contract term of particular type of lease. The same economic useful life is applied to determine the depreciation rate of ROU assets.
Discount rate. The Company cannot readily determine the interest rate implicit in the lease, therefore it uses its IBR to measure lease liabilities. The IBR is determined using the rate of interest rate swap applicable for currency of the lease contract and for similar tenor, corrected by the average credit spread of entities with rating similar to the Group’s rating, observed in the period when the lease contract commences or is modified.
g. Determination of fair values of assets acquired and liabilities assumed in a business combinationThe net assets acquired and liabilities assumed in the acquisition of Yarra Valley are measured at their acquisition-date fair values. These weredetermined through a purchase price allocation for which the Group will engage the services of a third-party valuer. This valuation has not yet beenfinalized as of reporting date, and provisional amounts were used to account for the acquisition. See Note 2 for the accounting policy on provisionalaccounting.
As of December 31, 2019, the fair value of net assets acquired and liabilities asumed as part of the acquisition of Yarra Valley amounting toP=513.8 million. No provisional goodwill has been recognized as the Group has to finalize the information with respect to the fair values ofidentifiable assets and liabilities arising from the business combination. See Note 22 for details on this acquisition. Any changes in these acquisition-date fair values that are known within the measurement period will be recorded retrospectively, in accordance with PFRSs.
4. Financial Risk Management Objectives and Policies
The Group’s principal financial instruments, other than derivative financial instruments, comprise cash and cash equivalents, financial assets at FVTPL,financial assets at FVOCI/AFS financial assets, and interest-bearing loans and other borrowings. The main purpose of these financial instruments is tofinance the Group’s operations and related capital expenditures. The Group has various other financial assets and financial liabilities, such as tradereceivables and payables which arise directly from its operations. One of the Group’s subsidiaries is a counterparty to derivative contracts. Thesederivatives are entered into as a means of reducing or managing their respective foreign exchange and interest rate exposures.
The BOD of the Parent Company and its subsidiaries review and approve policies for managing each of these risks and they are summarized below,together with the related risk management structure.
- 54 -
*SGVFSM000750*
Risk Management Structure The Group’s risk management structure is closely aligned with that of the Ultimate Parent Company. The BOD of the Parent Company and the respective BODs of each subsidiary are ultimately responsible for the oversight of the Group’s risk management processes that involve identifying, measuring, analyzing, monitoring and controlling risks.
The risk management framework encompasses environmental scanning, the identification and assessment of business risks, development of risk management strategies, design and implementation of risk management capabilities and appropriate responses, monitoring risks and risk management performance, and identification of areas and opportunities for improvement in the risk management process.
The BOD has created the board-level Audit Committee (AC) to spearhead the managing and monitoring of risks. AC The AC shall assist the Group’s BOD in its fiduciary responsibility for the over-all effectiveness of risk management systems, and both the internal and external audit functions of the Group. Furthermore, it is also the AC’s purpose to lead in the general evaluation and to provide assistance in the continuous improvements of risk management, control and governance processes.
The AC also aims to ensure that:
a. financial reports comply with established internal policies and procedures, pertinent accounting and auditing standards and other regulatoryrequirements;
b. risks are properly identified, evaluated and managed, specifically in the areas of managing credit, market, liquidity, operational, legal and other risks,and crisis management;
c. audit activities of internal and external auditors are done based on plan and deviations are explained through the performance of direct interfacefunctions with the internal and external auditors; and
d. the Group’s BOD is properly assisted in the development of policies that would enhance the risk management and control systems.
Enterprise Risk Management Group (ERMG) The ERMG was created to be primarily responsible for the execution of the enterprise risk management framework. The ERMG’s main concerns include:
a. recommending risk policies, strategies, principles, framework and limits;b. managing fundamental risk issues and monitoring of relevant risk decisions;c. providing support to management in implementing the risk policies and strategies; andd. developing a risk awareness program.

- 55 -
*SGVFSM000750*
Corporate Governance Compliance Officer Compliance with the principles of good corporate governance is also one of the primary objectives of the BOD. To assist the BOD in achieving this purpose, the BOD has designated a Compliance Officer who shall be responsible for monitoring the actual compliance with the provisions and requirements of the Corporate Governance Manual and other requirements on good corporate governance, identifying and monitoring control compliance risks, determining violations and recommending penalties on such infringements for further review and approval of the BOD, among others.
Day-to-day risk management functions At the business unit or company level, the day-to-day risk management functions are handled by four (4) different groups, namely:
a. Risk-taking personnel. This group includes line personnel who initiate and are directly accountable for all risks taken.b. Risk control and compliance. This group includes middle management personnel who perform the day-to-day compliance check to approved risk
policies and risk mitigation decisions.c. Support. This group includes back office personnel who support the line personnel.d. Risk management. This group pertains to the business unit’s Management Committee which makes risk mitigating decisions within the enterprise-
wide risk management framework.
Enterprise Resource Management (ERM) Framework The Parent Company’s BOD is also responsible for establishing and maintaining a sound risk management framework and is accountable for risks taken by the Parent Company. The Parent Company’s BOD also shares the responsibility with the ERMG in promoting the risk awareness program enterprise-wide.
The ERM framework revolves around the following eight interrelated risk management approaches:
a. Internal Environmental Scanning. It involves the review of the overall prevailing risk profile of the business unit to determine how risks are viewedand addressed by management. This is presented during the strategic planning, annual budgeting and mid-year performance reviews of the Group.
b. Objective Setting. The Group’s BOD mandates the business unit’s management to set the overall annual targets through strategic planning activities,in order to ensure that management has a process in place to set objectives which are aligned with the Group’s goals.
c. Event Identification. It identifies both internal and external events affecting the Group’s set targets, distinguishing between risks and opportunities.d. Risk Assessment. The identified risks are analyzed relative to the probability and severity of potential loss which serves as a basis for determining
how the risks should be managed. The risks are further assessed as to which risks are controllable and uncontrollable, risks that requiremanagement’s attention, and risks which may materially weaken the Group’s earnings and capital.
e. Risk Response. The Group’s BOD, through the oversight role of the ERMG, approves the business unit’s responses to mitigate risks, either to avoid,self-insure, reduce, transfer or share risk.
- 56 -
*SGVFSM000750*
f. Control Activities. Policies and procedures are established and approved by the Group’s BOD and implemented to ensure that the risk responses areeffectively carried out enterprise-wide.
g. Information and Communication. Relevant risk management information are identified, captured and communicated in form and substance thatenable all personnel to perform their risk management roles.
h. Monitoring. The ERMG, Internal Audit Group, Compliance Office and Business Assessment Team constantly monitor the management of risksthrough risk limits, audit reviews, compliance checks, revalidation of risk strategies and performance reviews.
Risk management support groups The Group’s BOD created the following departments within the Group to support the risk management activities of the Parent Company and the other business units:
a. Corporate Security and Safety Board (CSSB). Under the supervision of ERMG, the CSSB administers enterprise-wide policies affecting physicalsecurity of assets exposed to various forms of risks.
b. Corporate Supplier Accreditation Team (CORPSAT). Under the supervision of ERMG, the CORPSAT administers enterprise-wide procurementpolicies to ensure availability of supplies and services of high quality and standards to all business units.
c. Corporate Management Services (CMS). The CMS is responsible for the formulation of enterprise-wide policies and procedures.d. Corporate Planning (CORPLAN). The CORPLAN is responsible for the administration of strategic planning, budgeting and performance review
processes of business units.e. Corporate Insurance Department (CID). The CID is responsible for the administration of the insurance program of business units concerning
property, public liability, businessinterruption, money and fidelity, and employer compensation insurances, as well as, in the procurement of performance bonds.
Risk Management Policies The main risks arising from the use of financial instruments are credit risk, liquidity risk and market risks such as foreign currency risk, equity price risk and interest rate risk. The Group’s policies for managing the aforementioned risks are summarized below.
Credit risk Credit risk is the risk that one party to a financial instrument will fail to discharge an obligation and cause the other party to incur a financial loss. The Group trades only with recognized and creditworthy third parties. It is the Group’s policy that all customers who wish to trade on credit terms are subject to credit verification procedures. The Credit Management Division (CMD) of the Group continuously provides credit notification and implements various credit actions, depending on assessed risks, to minimize credit exposure. Receivable balances of trade customers are being monitored on a regular basis and appropriate credit treatments are executed for overdue accounts. Likewise, other receivable balances are also being monitored and subjected to appropriate actions to manage credit risk.

- 57 -
*SGVFSM000750*
With respect to credit risk arising from the other financial assets of the Group, which comprise cash and cash equivalents, financial assets at FVTPL, financial assets at FVOCI/AFS financial assets and certain derivative financial instruments, the Group’s exposure to credit risk arises from default of the counterparty with a maximum exposure equal to the carrying amount of these instruments.
a. Credit risk exposure
With respect to credit risk arising from financial assets of the Group, which comprise cash and cash equivalents, receivables, financial assets atFVTPL and financial assets at FVOC, the Group’s maximum exposure to credit risk is equal to its carrying amount as of December 31, 2019 and2018, except for the Group’s trade receivables as of as of December 31, 2019 and 2018 with carrying value of P=13.6 billion and P=12.1 billion,respectively, and collateral with fair value amounting to P=2.9 billion and P=2.8 billion as of December 31, 2019 and 2018, respectively, resulting to netexposure of P=10.7 billion and P=9.3 billion, respectively.
The collateral securities related to the Group’s trade receivables consist of standby letters of credit. The Group holds no other collateral or guaranteethat would reduce the maximum exposure to credit risk.
b. Risk concentrations of the maximum exposure to credit risk
Concentrations arise when a number of counterparties are engaged in similar business activities or activities in the same geographic region or havesimilar economic features that would cause their ability to meet contractual obligations to be similarly affected by changes in economic, political orother conditions. Concentrations indicate the relative sensitivity of the Group’s performance to developments affecting a particular industry orgeographical location. Such credit risk concentrations, if not properly managed, may cause significant losses that could threaten the Group's financialstrength and undermine public confidence.
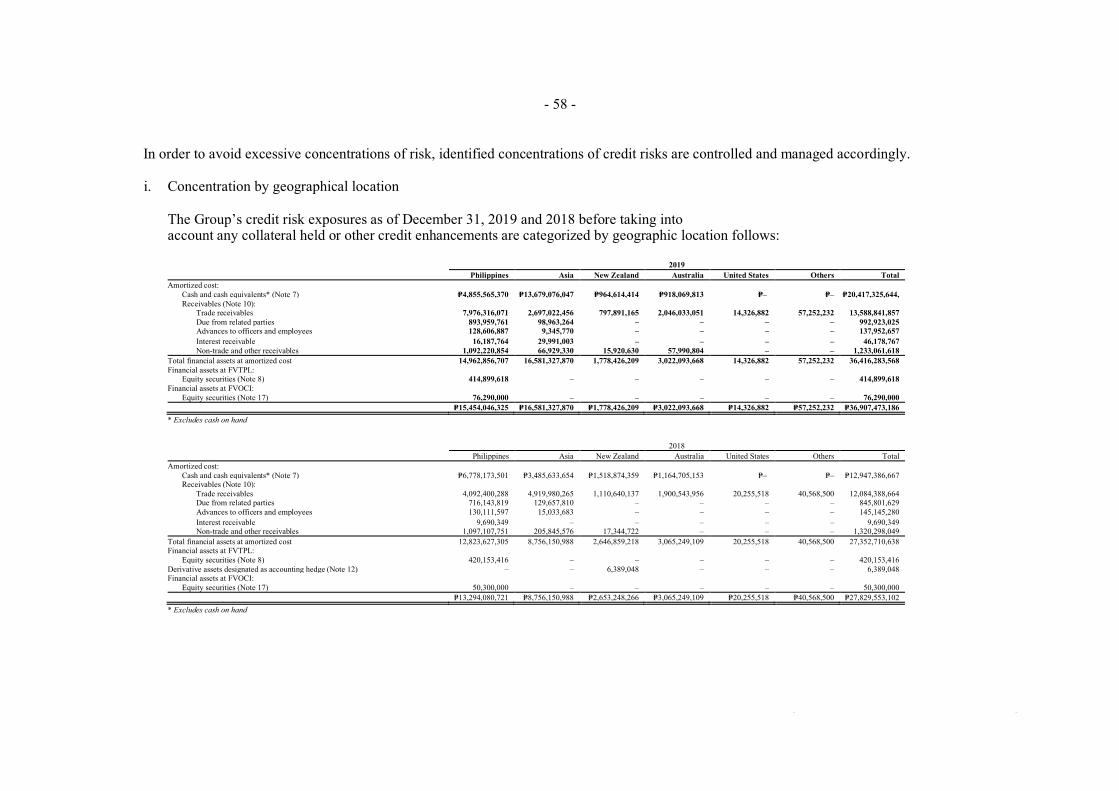
- 58 -
*SGVFSM000750*
In order to avoid excessive concentrations of risk, identified concentrations of credit risks are controlled and managed accordingly.
i. Concentration by geographical location
The Group’s credit risk exposures as of December 31, 2019 and 2018 before taking intoaccount any collateral held or other credit enhancements are categorized by geographic location follows:
2019 Philippines Asia New Zealand Australia United States Others Total
Amortized cost: Cash and cash equivalents* (Note 7) P=4,855,565,370 P=13,679,076,047 P=964,614,414 P=918,069,813 P=– P=– P=20,417,325,644, Receivables (Note 10):
Trade receivables 7,976,316,071 2,697,022,456 797,891,165 2,046,033,051 14,326,882 57,252,232 13,588,841,857 Due from related parties 893,959,761 98,963,264 – – – – 992,923,025 Advances to officers and employees 128,606,887 9,345,770 – – – – 137,952,657 Interest receivable 16,187,764 29,991,003 – – – – 46,178,767 Non-trade and other receivables 1,092,220,854 66,929,330 15,920,630 57,990,804 – – 1,233,061,618
Total financial assets at amortized cost 14,962,856,707 16,581,327,870 1,778,426,209 3,022,093,668 14,326,882 57,252,232 36,416,283,568 Financial assets at FVTPL: Equity securities (Note 8) 414,899,618 – – – – – 414,899,618 Financial assets at FVOCI:
Equity securities (Note 17) 76,290,000 – – – – – 76,290,000 P=15,454,046,325 P=16,581,327,870 P=1,778,426,209 P=3,022,093,668 P=14,326,882 P=57,252,232 P=36,907,473,186
* Excludes cash on hand
2018 Philippines Asia New Zealand Australia United States Others Total
Amortized cost: Cash and cash equivalents* (Note 7) P=6,778,173,501 P=3,485,633,654 P=1,518,874,359 P=1,164,705,153 P=– P=– P=12,947,386,667 Receivables (Note 10):
Trade receivables 4,092,400,288 4,919,980,265 1,110,640,137 1,900,543,956 20,255,518 40,568,500 12,084,388,664 Due from related parties 716,143,819 129,657,810 – – – – 845,801,629 Advances to officers and employees 130,111,597 15,033,683 – – – – 145,145,280 Interest receivable 9,690,349 – – – – – 9,690,349 Non-trade and other receivables 1,097,107,751 205,845,576 17,344,722 – – – 1,320,298,049
Total financial assets at amortized cost 12,823,627,305 8,756,150,988 2,646,859,218 3,065,249,109 20,255,518 40,568,500 27,352,710,638 Financial assets at FVTPL: Equity securities (Note 8) 420,153,416 – – – – – 420,153,416 Derivative assets designated as accounting hedge (Note 12) – – 6,389,048 – – – 6,389,048 Financial assets at FVOCI:
Equity securities (Note 17) 50,300,000 – – – – – 50,300,000 P=13,294,080,721 P=8,756,150,988 P=2,653,248,266 P=3,065,249,109 P=20,255,518 P=40,568,500 P=27,829,553,102
* Excludes cash on hand

- 59 -
*SGVFSM000750*
ii. Concentration by industry
The tables below show the industry sector analysis of the Group’s financial assets as of December 31, 2019 and 2018 before taking into accountany collateral held or other credit enhancements.
2019
Manufacturing Financial
Intermediaries Petrochemicals Tele-
Communication Others* Total Amortized cost:
Cash and cash equivalents** (Note 7) P=– P=20,417,325,644 P=– P=– P=– P=20,417,325,644 Receivables (Note 10):
Trade receivables 13,040,437,910 – 6,631,851 – 541,772,096 13,588,841,857 Due from related parties 108,163,925 33,539,220 – – 851,219,880 992,923,025 Advances to officers and employees 114,038,433 – – – 23,914,224 137,952,657 Interest receivable – 46,178,767 – – – 46,178,767 Non-trade and other receivables 898,069,310 41,685,016 58,003,442 6,249,876 229,053,974 1,233,061,618
Total financial assets at amortized cost 14,160,709,578 20,538,728,647 64,635,293 6,249,876 1,645,960,174 36,416,283,568 Financial assets at FVTPL: Equity securities (Note 8) – – – – 414,899,618 414,899,618 Financial assets at FVOCI:
Equity securities (Note 17) – – – – 76,290,000 76,290,000 P=14,160,709,578 P=20,538,728,647 P=64,635,293 P=6,249,876 P=2,137,149,792 P=36,907,473,186
*Includes real estate, agriculture, automotive, mining and electrical industries.**Excludes cash on hand
2018
Manufacturing Financial
Intermediaries Petrochemicals Tele-
Communication Others* Total Amortized cost:
Cash and cash equivalents** (Note 7) P=– P=12,947,386,667 P=– P=– P=– P=12,947,386,667 Receivables (Note 10):
Trade receivables 11,791,998,739 – 316,057 – 292,073,868 12,084,388,664 Due from related parties 44,910,646 28,646,754 – – 772,244,229 845,801,629 Advances to officers and employees 125,797,555 – – – 19,347,725 145,145,280 Interest receivable – 9,690,349 – – – 9,690,349 Non-trade and other receivables 1,068,474,296 21,576,156 7,884,799 19,046,448 203,316,350 1,320,298,049
Total financial assets at amortized cost 13,031,181,236 13,007,299,926 8,200,856 19,046,448 1,286,982,172 27,352,710,638 Financial assets at FVTPL: Equity securities (Note 8) – – – – 420,153,416 420,153,416 Derivative assets designated as accounting hedge (Note 12) 6,389,048 – – – – 6,389,048 Financial assets at FVOCI:
Equity securities (Note 17) – – – – 50,300,000 50,300,000 P=13,037,570,284 P=13,007,299,926 P=8,200,856 P=19,046,448 P=1,757,435,588 P=27,829,553,102
*Includes real estate, agriculture, automotive, mining and electrical industries.**Excludes cash on hand
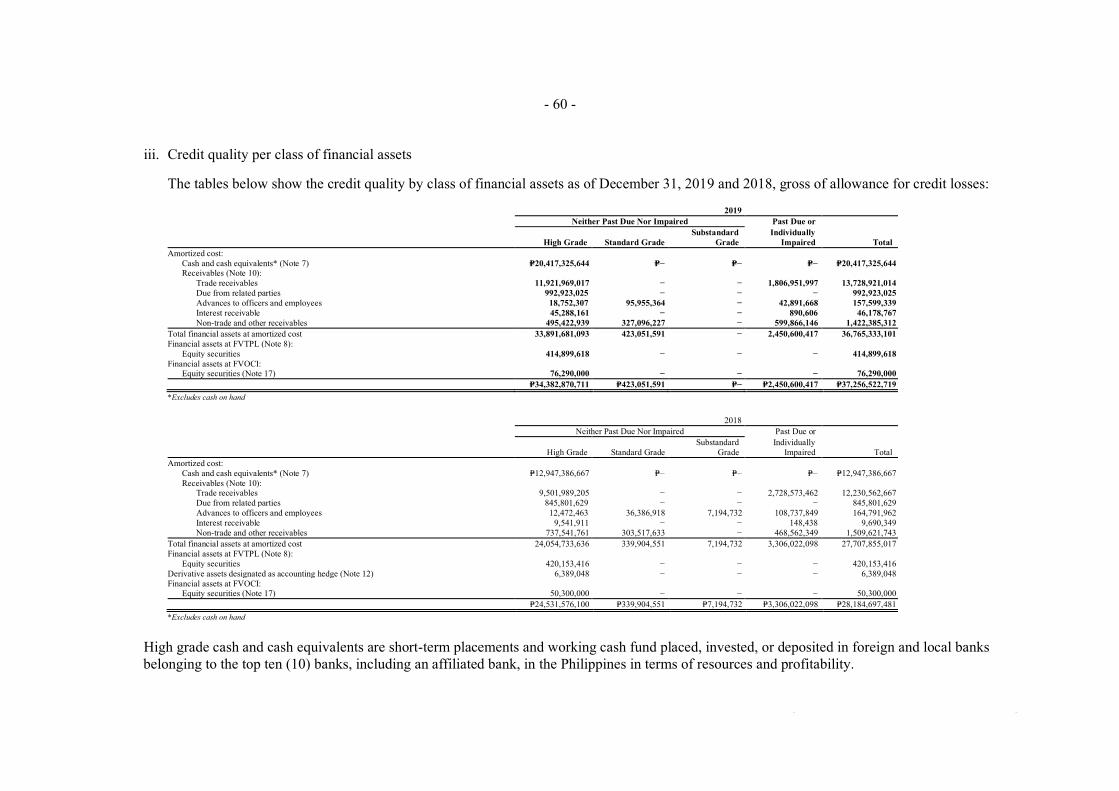
- 60 -
*SGVFSM000750*
iii. Credit quality per class of financial assets
The tables below show the credit quality by class of financial assets as of December 31, 2019 and 2018, gross of allowance for credit losses:
2019 Neither Past Due Nor Impaired Past Due or
High Grade Standard Grade Substandard
Grade Individually
Impaired Total Amortized cost:
Cash and cash equivalents* (Note 7) P=20,417,325,644 P=− P=− P=− P=20,417,325,644 Receivables (Note 10):
Trade receivables 11,921,969,017 − − 1,806,951,997 13,728,921,014 Due from related parties 992,923,025 − − − 992,923,025 Advances to officers and employees 18,752,307 95,955,364 − 42,891,668 157,599,339 Interest receivable 45,288,161 − − 890,606 46,178,767 Non-trade and other receivables 495,422,939 327,096,227 − 599,866,146 1,422,385,312
Total financial assets at amortized cost 33,891,681,093 423,051,591 − 2,450,600,417 36,765,333,101 Financial assets at FVTPL (Note 8): Equity securities 414,899,618 − − − 414,899,618 Financial assets at FVOCI:
Equity securities (Note 17) 76,290,000 − − − 76,290,000 P=34,382,870,711 P=423,051,591 P=− P=2,450,600,417 P=37,256,522,719
*Excludes cash on hand
2018 Neither Past Due Nor Impaired Past Due or
High Grade Standard Grade Substandard
Grade Individually
Impaired Total Amortized cost:
Cash and cash equivalents* (Note 7) P=12,947,386,667 P=− P=− P=− P=12,947,386,667 Receivables (Note 10):
Trade receivables 9,501,989,205 − − 2,728,573,462 12,230,562,667 Due from related parties 845,801,629 − − − 845,801,629 Advances to officers and employees 12,472,463 36,386,918 7,194,732 108,737,849 164,791,962 Interest receivable 9,541,911 − − 148,438 9,690,349 Non-trade and other receivables 737,541,761 303,517,633 − 468,562,349 1,509,621,743
Total financial assets at amortized cost 24,054,733,636 339,904,551 7,194,732 3,306,022,098 27,707,855,017 Financial assets at FVTPL (Note 8): Equity securities 420,153,416 − − − 420,153,416 Derivative assets designated as accounting hedge (Note 12) 6,389,048 − − − 6,389,048 Financial assets at FVOCI:
Equity securities (Note 17) 50,300,000 − − − 50,300,000 P=24,531,576,100 P=339,904,551 P=7,194,732 P=3,306,022,098 P=28,184,697,481
*Excludes cash on hand
High grade cash and cash equivalents are short-term placements and working cash fund placed, invested, or deposited in foreign and local banks belonging to the top ten (10) banks, including an affiliated bank, in the Philippines in terms of resources and profitability.

- 61 -
*SGVFSM000750*
Other high grade accounts are accounts considered to be high value. The counterparties have a very remote likelihood of default and have consistently exhibited good paying habits.
Standard grade accounts are active accounts with minimal to regular instances of payment default, due to ordinary/common collection issues. These accounts are typically not impaired as the counterparties generally respond to credit actions and update their payments accordingly.
Substandard grade accounts are accounts which have probability of impairment based on historical trend. These accounts show propensity to default in payment despite regular follow-up actions and extended payment terms.
iv. Credit risk under general approach and simplied approach
2019 General Approach
Stage 1 Stage 2 Stage 3 Simplified Approach Amortized cost:
Cash and cash equivalents* (Note 7) P=20,417,325,644 P=− P=− P=− Receivables (Note 10):
Trade receivables − − − 13,728,921,014 Due from related parties 992,923,025 − − − Advances to officers and employees 137,952,657 − 19,646,682 − Interest receivable 46,178,767 − − − Non-trade and other receivables 822,519,166 410,542,452 189,323,694 −
Total financial assets at amortized cost 22,416,899,259 410,542,452 208,970,376 13,728,921,014 Financial assets at FVTPL (Note 8):
Equity securities 414,899,618 − − − Financial assets at FVOCI:
Equity securities (Note 17) 76,290,000 − − − P=22,908,088,877 P=410,542,452 P=208,970,376 P=13,728,921,014
*Excludes cash on hand

- 62 -
*SGVFSM000750*
2018 General Approach
Stage 1 Stage 2 Stage 3 Simplified Approach Amortized cost:
Cash and cash equivalents* (Note 7) P=12,947,386,667 P=− P=− P=− Receivables (Note 10):
Trade receivables − − − 12,230,562,667 Due from related parties 845,801,629 − − 0 Advances to officers and employees 145,145,280 − 19,646,682 − Interest receivable 9,690,349 − − − Non-trade and other receivables 1,041,059,394 279,238,655 189,323,694 −
Total financial assets at amortized cost 14,989,083,319 279,238,655 208,970,376 12,230,562,667 Financial assets at FVTPL (Note 8):
Equity securities 420,153,416 − − − Derivative assets designated as accounting hedge (Note 12) 6,389,048 − − − Financial assets at FVOCI:
Equity securities (Note 17) 50,300,000 − − − P=15,465,925,783 P=279,238,655 P=208,970,376 P=12,230,562,667
*Excludes cash on hand
v. Aging analysis
An aging analysis of the Group’s past due or individually impaired receivables as ofDecember 31, 2019 and 2018 are as follows:
2019 Past Due But Not Impaired Impaired
Less than 30 to 60 60 to 90 Over 90 Financial 30 Days Days Days Days Assets Total
Trade receivables P=1,367,303,271 P=174,080,784 P=10,999,967 P=114,488,818 P=140,079,157 P=1,806,951,997 Advances to officers and employees 1,855,835 2,216,849 1,545,750 17,626,552 19,646,682 42,891,668 Nontrade and other receivables 43,354,114 38,265,148 78,479,509 251,334,287 189,323,694 600,756,752 Balances at end of year P=1,412,513,220 P=214,562,781 P=91,025,226 P=383,449,657 P=349,049,533 P=2,450,600,417
2018 Past Due But Not Impaired Impaired
Less than 30 to 60 60 to 90 Over 90 Financial 30 Days Days Days Days Assets Total
Trade receivables P=1,696,079,869 P=204,326,180 P=116,597,861 P=565,395,549 P=146,174,003 P=2,728,573,462 Advances to officers and employees 3,788,295 130,182 1,659,548 83,513,142 19,646,682 108,737,849 Nontrade and other receivables 231,517,066 6,950,793 2,038,714 38,880,520 189,323,694 468,710,787 Balances at end of year P=1,931,385,230 P=211,407,155 P=120,296,123 P=687,789,211 P=355,144,379 P=3,306,022,098
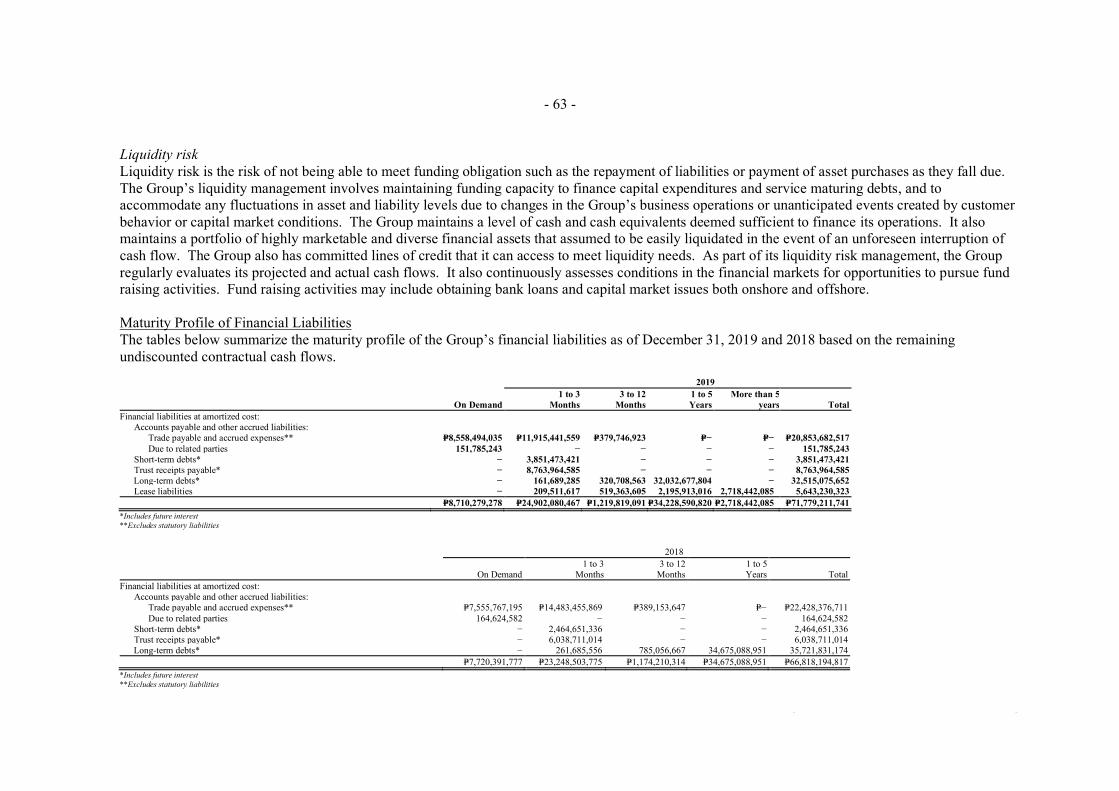
- 63 -
*SGVFSM000750*
Liquidity risk Liquidity risk is the risk of not being able to meet funding obligation such as the repayment of liabilities or payment of asset purchases as they fall due. The Group’s liquidity management involves maintaining funding capacity to finance capital expenditures and service maturing debts, and to accommodate any fluctuations in asset and liability levels due to changes in the Group’s business operations or unanticipated events created by customer behavior or capital market conditions. The Group maintains a level of cash and cash equivalents deemed sufficient to finance its operations. It also maintains a portfolio of highly marketable and diverse financial assets that assumed to be easily liquidated in the event of an unforeseen interruption of cash flow. The Group also has committed lines of credit that it can access to meet liquidity needs. As part of its liquidity risk management, the Group regularly evaluates its projected and actual cash flows. It also continuously assesses conditions in the financial markets for opportunities to pursue fund raising activities. Fund raising activities may include obtaining bank loans and capital market issues both onshore and offshore.
Maturity Profile of Financial Liabilities The tables below summarize the maturity profile of the Group’s financial liabilities as of December 31, 2019 and 2018 based on the remaining undiscounted contractual cash flows.
2019
On Demand 1 to 3
Months 3 to 12
Months 1 to 5 Years
More than 5 years Total
Financial liabilities at amortized cost: Accounts payable and other accrued liabilities:
Trade payable and accrued expenses** P=8,558,494,035 P=11,915,441,559 P=379,746,923 P=− P=− P=20,853,682,517 Due to related parties 151,785,243 − − − − 151,785,243 Short-term debts* − 3,851,473,421 − − − 3,851,473,421 Trust receipts payable* − 8,763,964,585 − − − 8,763,964,585
Long-term debts* − 161,689,285 320,708,563 32,032,677,804 − 32,515,075,652Lease liabilities − 209,511,617 519,363,605 2,195,913,016 2,718,442,085 5,643,230,323
P=8,710,279,278 P=24,902,080,467 P=1,219,819,091 P=34,228,590,820 P=2,718,442,085 P=71,779,211,741 *Includes future interest **Excludes statutory liabilities
2018
On Demand 1 to 3
Months 3 to 12
Months 1 to 5 Years Total
Financial liabilities at amortized cost: Accounts payable and other accrued liabilities:
Trade payable and accrued expenses** P=7,555,767,195 P=14,483,455,869 P=389,153,647 P=− P=22,428,376,711 Due to related parties 164,624,582 − − − 164,624,582 Short-term debts* − 2,464,651,336 − − 2,464,651,336 Trust receipts payable* − 6,038,711,014 − − 6,038,711,014
Long-term debts* − 261,685,556 785,056,667 34,675,088,951 35,721,831,174 P=7,720,391,777 P=23,248,503,775 P=1,174,210,314 P=34,675,088,951 P=66,818,194,817
*Includes future interest **Excludes statutory liabilities
- 64 -
Market risk Market risk is the risk of loss to future earnings, to fair value or future cash flows of a financial instrument as a result of changes in its price, in turn caused by changes in interest rates, foreign currency exchange rates, equity prices and other market factors.
Foreign currency risk Foreign currency risk arises on financial instruments that are denominated in a foreign currency other than the functional currency in which they are measured.
The Group has transactional currency exposures. Such exposures arise from sales and purchases in currencies other than the entities’ functional currency. For the years ended December 31, 2019, 2018 and 2017, approximately 31.4%, 33.8%, and 34.3% of the Group’s total sales, respectively, are denominated in currencies other than the functional currency. In addition, 4.4% and 3.0% of the Group’s debt is denominated in US Dollars as of December 31, 2019 and 2018, respectively.
The Group estimates a reasonably possible change of +5.00 in the US Dollar to Philippine Peso exchange rate would have an impact of approximately P=27.5 million and =P81.4million on income before income tax for the years ended December 31, 2019 and 2018, respectively. An equal change in the opposite direction would have decreased income before income tax by the same amount.
The impact of the range of reasonably possible changes in the exchange rates of the other currencies against the Philippine Peso on the Group’s income before income tax as of December 31, 2019 and 2018 are deemed immaterial.
The exchange rates used to restate the US dollar-denominated financial assets and liabilities were =P50.64 to US$1.00 and P=52.58 to US$1.00 as of December 31, 2019 and 2018, respectively.
Equity price risk Equity price risk is the risk that the fair values of equities will change as a result of changes in the levels of equity indices and the value of individual stocks.
The table below shows the effect on equity as a result of a change in the fair value of equity instruments held as financial assets at FVTPL investments due to reasonably possible changes in equity indices:
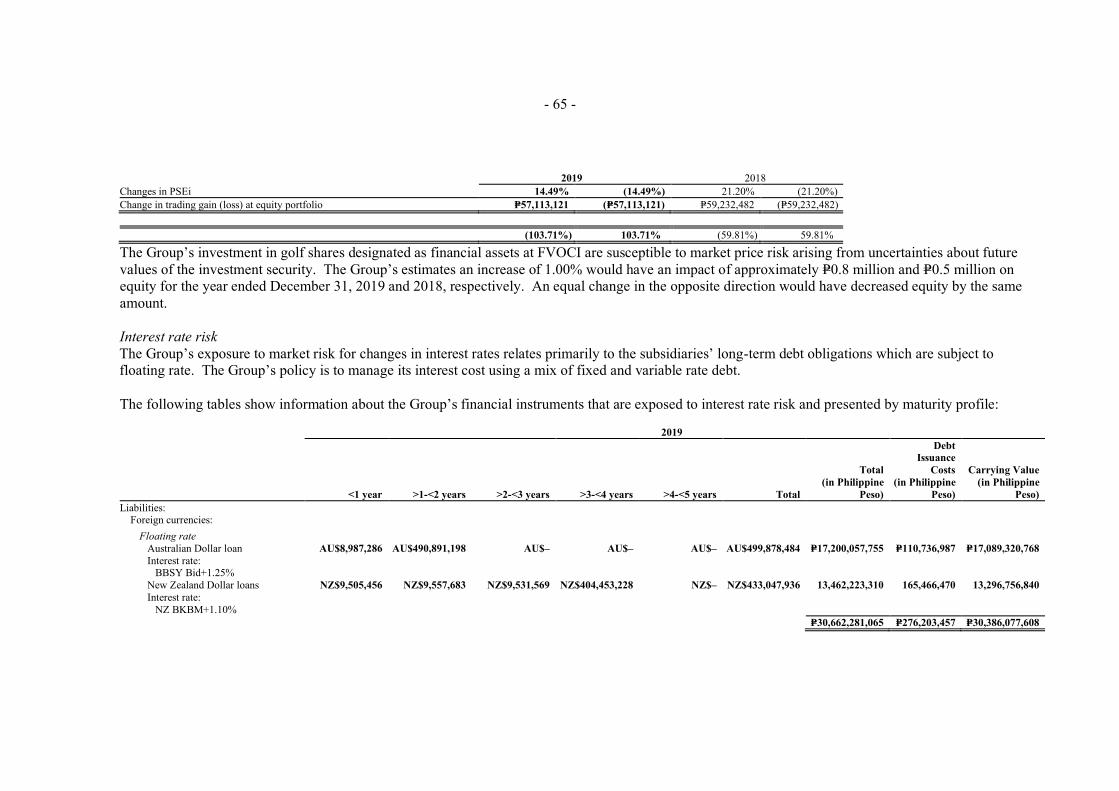
- 65 -
*SGVFSM000750*
As a percentage of the Parent Company’s trading gain for the year (103.71%) 103.71% (59.81%) 59.81%
The Group’s investment in golf shares designated as financial assets at FVOCI are susceptible to market price risk arising from uncertainties about future values of the investment security. The Group’s estimates an increase of 1.00% would have an impact of approximately P=0.8 million and P=0.5 million on equity for the year ended December 31, 2019 and 2018, respectively. An equal change in the opposite direction would have decreased equity by the same amount.
Interest rate risk The Group’s exposure to market risk for changes in interest rates relates primarily to the subsidiaries’ long-term debt obligations which are subject to floating rate. The Group’s policy is to manage its interest cost using a mix of fixed and variable rate debt.
The following tables show information about the Group’s financial instruments that are exposed to interest rate risk and presented by maturity profile:
2019
<1 year >1-<2 years >2-<3 years >3-<4 years >4-<5 years Total
Total (in Philippine
Peso)
Debt Issuance
Costs (in Philippine
Peso)
Carrying Value (in Philippine
Peso) Liabilities:
Foreign currencies: Floating rate Australian Dollar loan AU$8,987,286 AU$490,891,198 AU$– AU$– AU$– AU$499,878,484 P=17,200,057,755 P=110,736,987 P=17,089,320,768 Interest rate: BBSY Bid+1.25% New Zealand Dollar loans NZ$9,505,456 NZ$9,557,683 NZ$9,531,569 NZ$404,453,228 NZ$– NZ$433,047,936 13,462,223,310 165,466,470 13,296,756,840 Interest rate: NZ BKBM+1.10%
P=30,662,281,065 P=276,203,457 P=30,386,077,608
2019 2018 Changes in PSEi 14.49% (14.49%) 21.20% (21.20%) Change in trading gain (loss) at equity portfolio P=57,113,121 (P=57,113,121) P=59,232,482 (P=59,232,482)

- 66 -
*SGVFSM000750*
2018
<1 year >1-<2 years >2-<3 years >3-<4 years >4-<5 years Total
Total (in Philippine
Peso)
Debt Issuance Costs (in Philippine
Peso)
Carrying Value (in Philippine
Peso) Liabilities:
Foreign currencies: Floating rate Australian Dollar loan AU$13,625,723 AU$13,700,180 AU$494,387,449 AU$– AU$– AU$521,713,352 P=17,922,355,336 P=179,697,514 P=17,742,657,822 Interest rate: BBSY Bid+1.25% New Zealand Dollar loans NZ$12,753,563 NZ$12,580,750 NZ$12,649,875 NZ$12,615,313 NZ$407,511,625 NZ$458,111,126 13,924,974,927 210,508,867 13,714,466,060 Interest rate: NZ BKBM+1.10%
P=31,847,330,263 P=390,206,381 P=31,457,123,882
The following table demonstrates the sensitivity to a reasonably possible change in interest rates on the long-term debts. With all other variables held constant, the Group’s income before tax is affected through the impact on floating rate borrowings, as follows:
Change in basis points Effect on income
before tax 2019 +100 (P=299,653,411)
-100 299,653,411 2018 +100 (P=320,970,394)
-100 320,970,394
5. Fair Value Measurement
The following methods and assumptions were used to estimate the fair value of each asset and liability for which it is practicable to estimate such value:
Cash and cash equivalents, receivables (except amounts due from and due to related parties), accounts payable and other accrued liabilities, short-termdebts and trust receipts payable.Carrying amounts approximate their fair values due to the relatively short-term maturities of these instruments.

- 67 -
*SGVFSM000750*
Amounts due from and due to related parties Carrying amounts of due from and due to related parties which are payable and due on demand approximate their fair values.
Financial assets at FVTPL, derivatives and financial assets at FVOCI Fair values of quoted equity securities are based on quoted prices published in markets.
Biological assets Biological assets are measured at their fair values less costs to sell. The fair values of Level 2 biological assets are determined based on current market prices of livestock of similar age, breed and genetic merit while Level 3 are determined based on adjusted commercial farmgate prices. Costs to sell include commissions to brokers and dealers, nonrefundable transfer taxes and duties. Costs to sell exclude transport and other costs necessary to get the biological assets to the market.
The Group has determined that the highest and best use of the sucklings and weanlings is finishers while for other biological assets is their current use.
Investment properties Fair value of investment properties is based on market data (or direct sales comparison) approach. This approach relies on the comparison of recent sale transactions or offerings of similar properties which have occurred and/or offered with close proximity to the subject property.
The fair values of the Group’s investment properties have been determined by appraisers in 2017, including independent external appraisers, on the basis of the recent sales of similar properties in the same areas as the investment properties and taking into account the economic conditions prevailing at the time of the valuations are made.
The Group has determined that the highest and best use of the property used for the land and building is its current use.
Long-term debts The fair value of long-term debts are based on the discounted value of future cash flows (interests and principal) using market rates plus a certain spread.

- 68 -
*SGVFSM000750*
Fair Value Measurement Hierarchy for Assets and Liabilities
December 31, 2019 Carrying Value Level 1 Level 2 Level 3 Total Fair value
Assets measured at fair value Financial assets Financial assets at FVTPL (Note 8):
Quoted equity securities P=414,899,618 P=414,899,618 P=− P=− P=414,899,618 Financial assets at FVOCI
Quoted equity securities (Note 17) 76,290,000 − 76,290,000 − 76,290,000 Deposits (Note 17) 612,546,621 − − 612,546,621 612,546,621
P=1,103,736,239 P=414,899,618 P=76,290,000 P=612,546,621 P=1,103,736,239 Non-financial assets Biological assets (Note 14) P=957,563,597 P=− P=59,841,764 P=897,721,833 P=957,563,597 Assets for which fair values are disclosed Investment properties (Note 17) P=33,173,512 P=− P=− P=324,572,000 P=324,572,000 Liabilities for which fair values are disclosed Long-term debts (Note 20) P=30,386,077,608 P=− P=− P=30,556,330,251 P=30,556,330,251
December 31, 2018 Carrying Value Level 1 Level 2 Level 3 Total Fair value
Assets measured at fair value Financial assets Financial assets at FVTPL (Note 8):
Quoted equity securities P=420,153,416 P=420,153,416 P=− P=− P=420,153,416 Derivative assets designated as accounting hedge (Note 12) 6,389,048 6,389,048 − − 6,389,048 Financial assets at FVOCI
Quoted equity securities (Note 17) 50,300,000 − 50,300,000 − 50,300,000 Deposits (Note 17) 766,539,097 − − 766,539,097 766,539,097
P=1,243,381,561 P=426,542,464 P=50,300,000 P=766,539,097 P=1,243,381,561 Non-financial assets Biological assets (Note 14) P=1,107,904,051 P=− P=137,522,046 P=970,382,005 P=1,107,904,051 Assets for which fair values are disclosed Investment properties (Note 17) P=36,384,879 P=− P=− P=324,572,000 P=324,572,000 Liabilities for which fair values are disclosed Long-term debts (Note 20) P=31,457,123,882 P=− P=− P=31,585,901,825 P=31,585,901,825
For the years ended December 31, 2019 and 2018, there were no transfers between Level 1 and Level 2 fair value measurements. Non-financial assets determined under Level 3 include investment properties and biological assets. No transfers between any level of the fair value hierarchy took place in the equivalent comparative period.
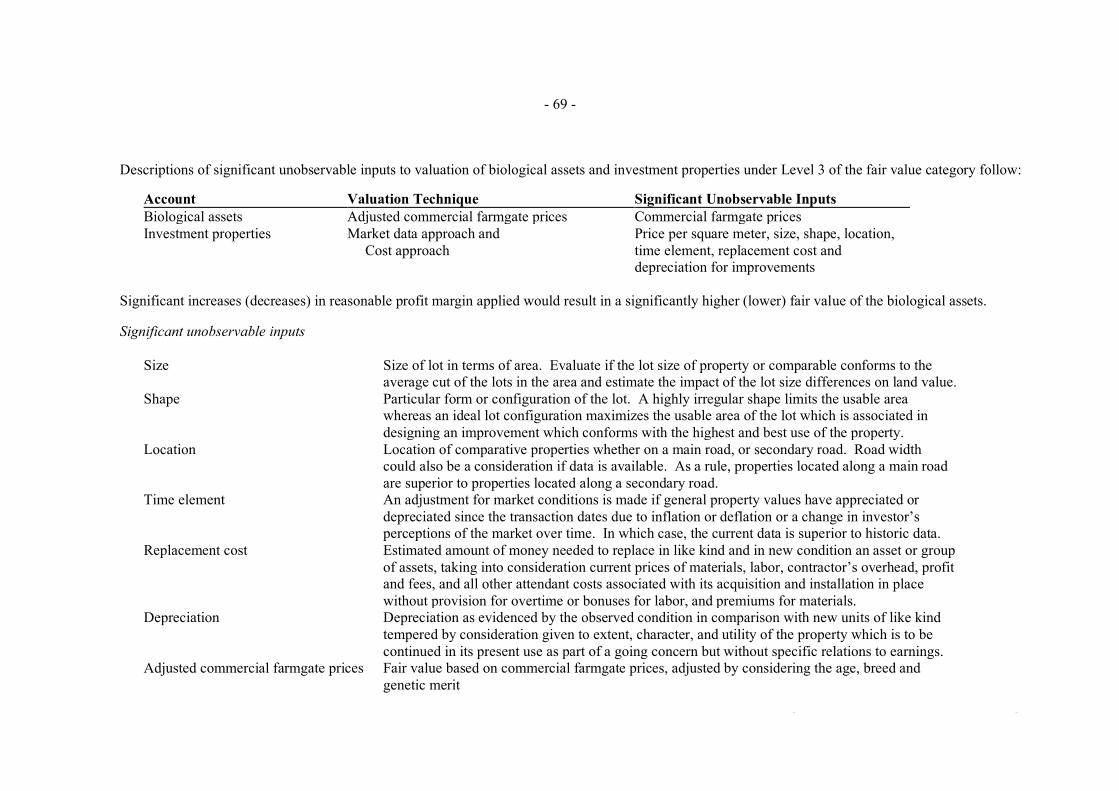
- 69 -
*SGVFSM000750*
Descriptions of significant unobservable inputs to valuation of biological assets and investment properties under Level 3 of the fair value category follow:
Account Valuation Technique Significant Unobservable Inputs Biological assets Adjusted commercial farmgate prices Commercial farmgate prices Investment properties Market data approach and
Cost approach Price per square meter, size, shape, location, time element, replacement cost and depreciation for improvements
Significant increases (decreases) in reasonable profit margin applied would result in a significantly higher (lower) fair value of the biological assets.
Significant unobservable inputs
Size Size of lot in terms of area. Evaluate if the lot size of property or comparable conforms to the average cut of the lots in the area and estimate the impact of the lot size differences on land value.
Shape Particular form or configuration of the lot. A highly irregular shape limits the usable area whereas an ideal lot configuration maximizes the usable area of the lot which is associated in designing an improvement which conforms with the highest and best use of the property.
Location Location of comparative properties whether on a main road, or secondary road. Road width could also be a consideration if data is available. As a rule, properties located along a main road are superior to properties located along a secondary road.
Time element An adjustment for market conditions is made if general property values have appreciated or depreciated since the transaction dates due to inflation or deflation or a change in investor’s perceptions of the market over time. In which case, the current data is superior to historic data.
Replacement cost Estimated amount of money needed to replace in like kind and in new condition an asset or group of assets, taking into consideration current prices of materials, labor, contractor’s overhead, profit and fees, and all other attendant costs associated with its acquisition and installation in place without provision for overtime or bonuses for labor, and premiums for materials.
Depreciation Depreciation as evidenced by the observed condition in comparison with new units of like kind tempered by consideration given to extent, character, and utility of the property which is to be continued in its present use as part of a going concern but without specific relations to earnings.
Adjusted commercial farmgate prices Fair value based on commercial farmgate prices, adjusted by considering the age, breed and genetic merit
- 70 -
*SGVFSM000750*
6. Business Segment Information
The Group’s operating segments are organized and managed separately according to the nature of the products and services provided, with each segmentrepresenting a strategic business unit that offers different products and serves different markets. The Group has four (4) reportable operating segments asfollows:
The branded consumer food products segment manufactures and distributes a diverse mix of salty snacks, chocolates, candies, biscuits, bakeryproducts, beverages, instant noodles and pasta. This segment also includes the packaging division, which manufactures BOPP films primarily used inpackaging; and its subsidiary, which manufactures flexible packaging materials for the packaging requirements of various branded food products. Itsrevenues are in their peak during the opening of classes in June and Christmas season.
The agro-industrial products segment engages in hog and poultry farming, manufacturing and distribution of animal feeds, glucose and soya products,and production and distribution of animal health products. Its peak season is during summer and before Christmas season.
The commodity food products segment engages in sugar milling and refining, and flour milling and pasta manufacturing and renewable energy. Thepeak season for sugar is during its crop season, which normally starts in November and ends in April while flour and pasta’s peak season is beforeand during the Christmas season.
The corporate business segment engages in bonds and securities investment and fund sourcing activities.
No operating segments have been aggregated to form the above reportable operating business segments.
Management monitors the operating results of business segments separately for the purpose of making decisions about resource allocation and performance assessment. The measure presented to manage segment performance is the segment operating income (loss). Segment operating income (loss) is based on the same accounting policies as consolidated operating income (loss) except that intersegment revenues are eliminated only at the consolidation level. Group financing (including finance costs and revenues), market valuation gain and loss, foreign exchange gains or losses, other revenues and expenses and income taxes are managed on a group basis and are not allocated to operating segments. Transfer prices between operating segments are on an arm’s length basis in a manner similar to transactions with third parties.
The following tables present the financial information of each of the operating segments in accordance with PFRSs except for Earnings before interest, income taxes and depreciation/amortization (EBITDA) and Earnings before interest and income taxes (EBIT) as of and for the years ended December 31, 2019, 2018 and 2017.

- 71 -
*SGVFSM000750*
The Group’s business segment information follows (amounts in thousands):
As of and for the year ended December 31, 2019 Branded
Consumer Food Agro-Industrial Commodity
Food Corporate
Business Eliminations Total Sale of Goods and Services Third party P=105,886,280 P=13,138,215 P=15,150,033 P=– P=– P=134,174,528 Inter-segment 19,469,025 12,000 7,976,445 – (27,457,470) –
P=125,355,305 P=13,150,215 P=23,126,478 P=– (P=27,457,470) P=134,174,528 Result Earnings before interest, income taxes and depreciation/amortization (EBITDA) P=17,562,549 P=1,309,580 P=5,074,282 (P=1,624,396) P=– P=22,322,015 Depreciation and amortization (Note 27) (5,539,825) (422,106) (1,100,122) (248,004) – (7,310,057)Earnings before interest and income tax (EBIT) P=12,022,724 P=887,474 P=3,974,160 (P=1,872,400) P=– 15,011,958 Finance revenue (Note 29) P=203,803 P=162 P=1,205 P=122,442 P=– 327,612 Finance costs (Note 30) (P=1,207,899) (P=150,716) (P=231,814) (P=79,440) P=– (1,669,869) Equity in net loss of joint ventures (Note 16) P=– P=– P=– (P=158,602) P=– (158,602) Market valuation gain on financial assets and liabilities at FVTPL
(Note 8) P=– P=– P=– (P=5,254) P=– (5,254) Provision for credit and impairment losses (Notes 10, 11 and 15) (P=2,211) P=– P=– P=– P=– (2,211) Other expenses* (1,607,222) Income before income tax 11,896,412 Provision for income tax (Note 32) (1,781,728) Net income P=10,114,684 Other Information Total assets P=133,181,540 P=7,903,695 P=22,903,714 P=4,664,041 P=– P=168,652,990 Total liabilities P=58,847,775 P=4,498,489 P=6,626,024 P=3,496,200 P=– P=73,468,488 Capital expenditures P=6,538,448 P=699,550 P=1,713,010 P=37,684 P=– P=8,988,692 Non-cash expenses other than depreciation and amortization:
Credit and impairment losses on: Receivables (Note 10) (P=2,208) P=– P=– P=– P=– (P=2,208) Inventories (Note 11) (3) – – – – (3)
(P=2,211) P=– P=– P=– P=– (P=2,211) * Include net foreign exchange losses and other revenues (expenses).

- 72 -
*SGVFSM000750*
As of and for the year ended December 31, 2018 Branded
Consumer Food Agro-Industrial Commodity
Food Corporate Business Eliminations Total
Sale of Goods and Services Third party P=102,537,877 P=11,693,453 P=13,538,619 P=– P=– P=127,769,949 Inter-segment 17,266,362 63,901 5,353,541 – (22,683,804) –
P=119,804,239 P=11,757,354 P=18,892,160 P=– (P=22,683,804) P=127,769,949 Result Earnings before interest, income taxes and depreciation/amortization (EBITDA) P=15,674,743 P=1,237,539 P=4,487,433 (P=1,649,326) P=– P=19,750,389 Depreciation and amortization (Note 27) (4,756,491) (419,526) (948,368) (245,391) – (6,369,776)Earnings before interest and income tax (EBIT) P=10,918,252 P=818,013 P=3,539,065 (P=1,894,717) P=– 13,380,613 Finance revenue (Note 29) P=208,796 P=102 P=23,931 P=126,452 P=– 359,281 Finance costs (Note 30) (P=1,419,134) (P=66,536) (P=84,784) (P=91,246) P=– (1,661,700) Equity in net loss of joint ventures (Note 16) P=– P=– P=– (P=132,408) P=– (132,408) Market valuation gain on financial assets and liabilities at FVTPL (Note
8) P=– P=– P=– (P=35,424) P=– (35,424) Provision for credit and impairment losses (Notes 10, 11 and 15) (P=45,002) P=– P=– P=– P=– (45,002) Other expenses* (320,480) Income before income tax 11,544,880 Provision for income tax (Note 32) (2,082,094) Net income P=9,462,786 Other Information Total assets P=117,089,788 P=7,846,913 P=21,713,667 P=5,285,345 P=– P=151,935,713 Total liabilities P=56,251,419 P=4,598,732 P=5,882,522 P=1,209,561 P=– P=67,942,234 Capital expenditures P=5,468,991 P=696,640 P=2,191,679 P=284,420 P=– P=8,641,730 Non-cash expenses other than depreciation and amortization:
Credit and impairment losses on: Receivables (Note 10) (P=17,774) P=– P=– P=– P=– (P=17,774) Property, plant and equipment (1,700) – – – – (1,700) Goodwill (Note 15) (17,580) – – – – (17,580) Inventories (Note 11) (7,948) – – – – (7,948)
(P=45,002) P=– P=– P=– P=– (P=45,002) * Include net foreign exchange losses and other revenues (expenses).

- 73 -
*SGVFSM000750*
As of and for the year ended December 31, 2017 Branded
Consumer Food Agro-Industrial Commodity
Food Corporate Business Eliminations Total
Sale of Goods and Services Third party P=103,095,968 P=10,110,653 P=11,801,203 P=− P=− P=125,007,824 Inter-segment 15,303,639 122,304 6,189,868 − (21,615,811) −
P=118,399,607 P=10,232,957 P=17,991,071 P=− (P=21,615,811) P=125,007,824 Result Earnings before interest, income taxes and depreciation/amortization (EBITDA) P=16,608,493 P=2,178,990 P=3,930,971 (P=1,662,224) P=− P=21,056,230 Depreciation and amortization (Note 27) (4,480,403) (398,721) (1,014,338) (210,601) − (6,104,063)Earnings before interest and income tax (EBIT) P=12,128,090 P=1,780,269 P=2,916,633 (P=1,872,825) P=− 14,952,167 Finance revenue (Note 29) P=108,162 P=179 P=11,469 P=105,773 P=− 225,583 Finance costs (Note 30) (P=1,298,675) (P=44,056) (P=51,249) (P=33,350) P=− (1,427,330) Equity in net loss of joint ventures (Note 16) P=− P=− P=− (P=280,533) P=− (280,533) Market valuation gain on financial assets and liabilities at FVPL (Note
8) P=− P=− P=− P=71,016 P=− 71,016 Provision for credit and impairment losses (Note 11) (P=21,423) P=− P=− P=− P=− (21,423) Other expenses* 430,927 Income before income tax 13,950,407 Provision for income tax (Note 32) (2,797,486) Net income P=11,152,921 Other Information Total assets P=112,007,686 P=6,558,891 P=18,536,399 P=10,537,823 P=− P=147,640,799 Total liabilities P=57,021,889 P=3,225,428 P=4,420,186 P=1,287,284 P=− P=65,954,787 Capital expenditures P=4,436,763 P=761,141 P=2,630,024 P=301,744 P=− P=8,129,672 Non-cash expenses other than depreciation and amortization:
Credit and impairment losses on: Receivables (P=18,553) P=− P=− P=− P=− (P=18,553) Inventories (Note 11) (2,870) − − − − (2,870)
(P=21,423) P=− P=− P=− P=− (P=21,423) * Include net foreign exchange losses and other revenues (expenses).
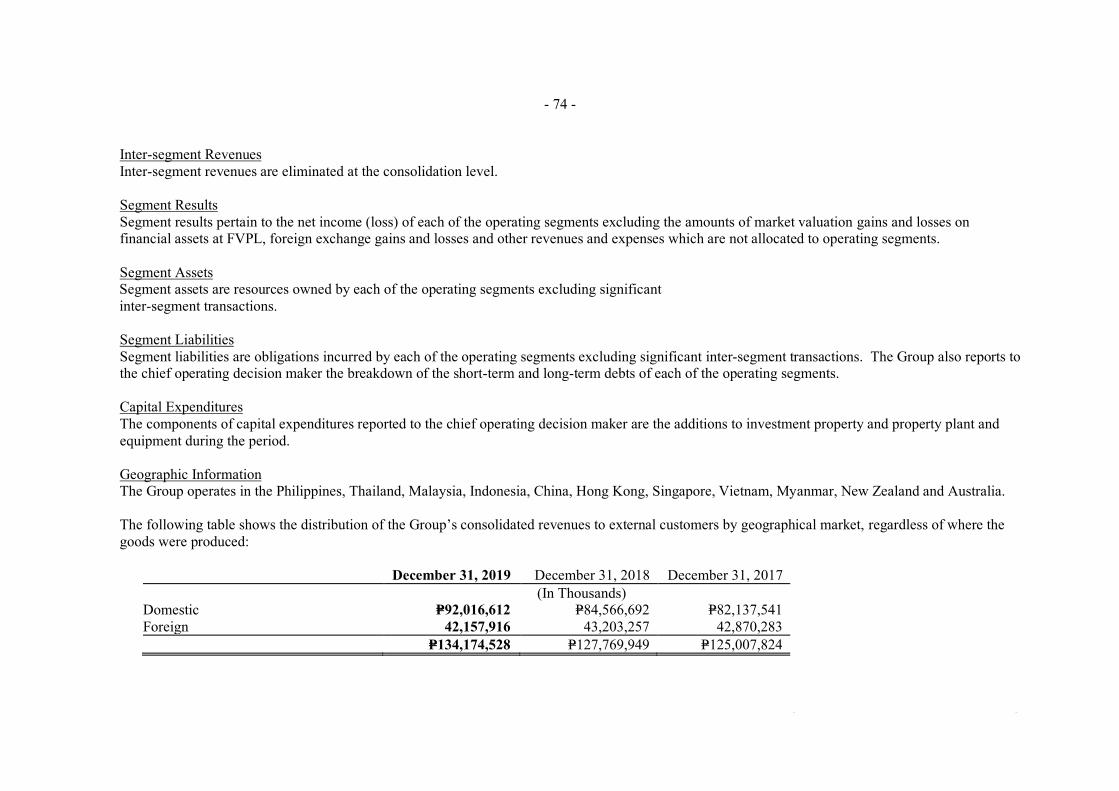
- 74 -
*SGVFSM000750*
Inter-segment Revenues Inter-segment revenues are eliminated at the consolidation level.
Segment Results Segment results pertain to the net income (loss) of each of the operating segments excluding the amounts of market valuation gains and losses on financial assets at FVPL, foreign exchange gains and losses and other revenues and expenses which are not allocated to operating segments.
Segment Assets Segment assets are resources owned by each of the operating segments excluding significant inter-segment transactions.
Segment Liabilities Segment liabilities are obligations incurred by each of the operating segments excluding significant inter-segment transactions. The Group also reports to the chief operating decision maker the breakdown of the short-term and long-term debts of each of the operating segments.
Capital Expenditures The components of capital expenditures reported to the chief operating decision maker are the additions to investment property and property plant and equipment during the period.
Geographic Information The Group operates in the Philippines, Thailand, Malaysia, Indonesia, China, Hong Kong, Singapore, Vietnam, Myanmar, New Zealand and Australia.
The following table shows the distribution of the Group’s consolidated revenues to external customers by geographical market, regardless of where the goods were produced:
December 31, 2019 December 31, 2018 December 31, 2017 (In Thousands)
Domestic P=92,016,612 P=84,566,692 P=82,137,541 Foreign 42,157,916 43,203,257 42,870,283
P=134,174,528 P=127,769,949 P=125,007,824
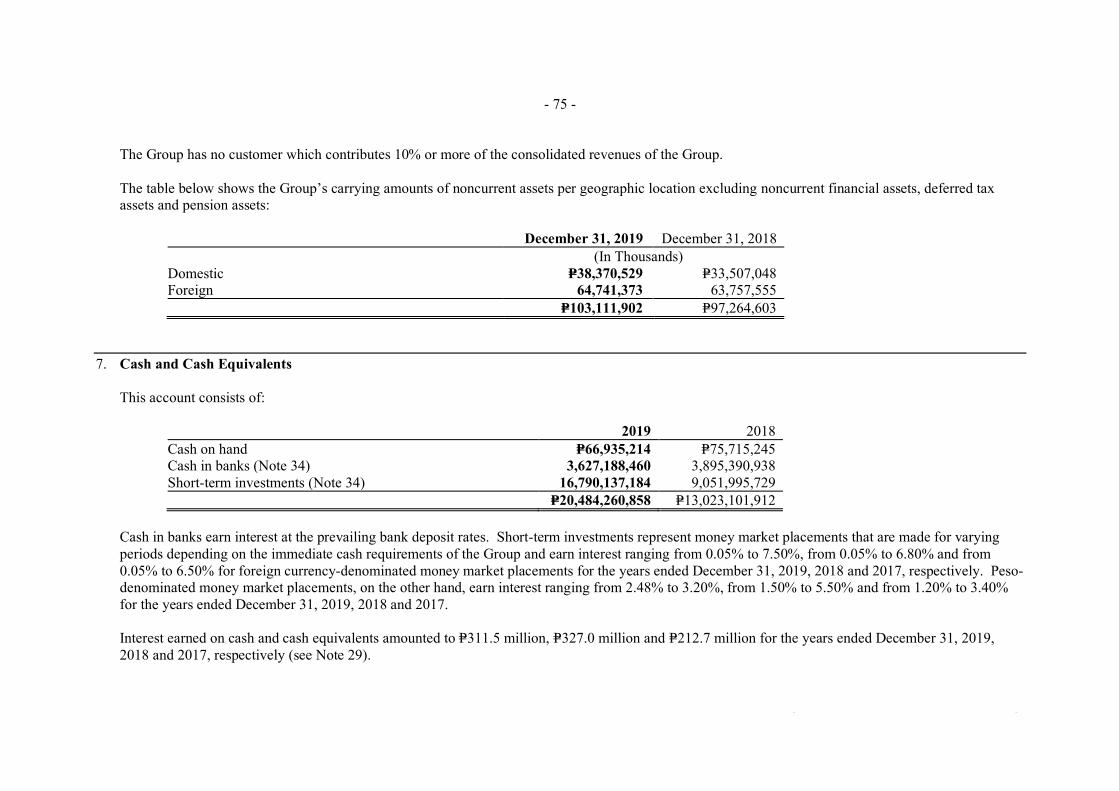
- 75 -
*SGVFSM000750*
The Group has no customer which contributes 10% or more of the consolidated revenues of the Group.
The table below shows the Group’s carrying amounts of noncurrent assets per geographic location excluding noncurrent financial assets, deferred tax assets and pension assets:
December 31, 2019 December 31, 2018 (In Thousands)
Domestic P=38,370,529 P=33,507,048 Foreign 64,741,373 63,757,555
P=103,111,902 P=97,264,603
7. Cash and Cash Equivalents
This account consists of:
2019 2018 Cash on hand P=66,935,214 P=75,715,245 Cash in banks (Note 34) 3,627,188,460 3,895,390,938 Short-term investments (Note 34) 16,790,137,184 9,051,995,729
P=20,484,260,858 P=13,023,101,912
Cash in banks earn interest at the prevailing bank deposit rates. Short-term investments represent money market placements that are made for varying periods depending on the immediate cash requirements of the Group and earn interest ranging from 0.05% to 7.50%, from 0.05% to 6.80% and from 0.05% to 6.50% for foreign currency-denominated money market placements for the years ended December 31, 2019, 2018 and 2017, respectively. Peso-denominated money market placements, on the other hand, earn interest ranging from 2.48% to 3.20%, from 1.50% to 5.50% and from 1.20% to 3.40% for the years ended December 31, 2019, 2018 and 2017.
Interest earned on cash and cash equivalents amounted to P=311.5 million, P=327.0 million and P=212.7 million for the years ended December 31, 2019, 2018 and 2017, respectively (see Note 29).
- 76 -
*SGVFSM000750*
8. Financial Assets at Fair Value Through Profit or Loss
This account consists of investments held-for-trading amounting to P=414.9 million and P=420.2 million as of December 31, 2019 and 2018, respectively.Investments held-for-trading consist of quoted equity securities issued by certain domestic entities.
Market valuation on financial instruments at fair value though profit and loss amounted to P=5.3 million loss, P=35.4 million loss and P=71.0 million gain forthe years ended December 31, 2019, 2018 and 2017, respectively.
The Group received dividends from its quoted equity securities amounting to P=16.2 million, P=32.3 million and P=12.9 million for the years endedDecember 31, 2019, 2018 and 2017, respectively (see Note 29).
9. Derivative Financial Instruments
Derivatives designated as accounting hedge
Currency OptionAs part of its asset and liability management, the Group uses derivatives, particularly currency option, as cash flow hedges in order to reduce its exposureto market risks.
The Group entered into currency options with a total notional amount of NZ$28.2 million and initial fair value of P=7.5 million. The Group recognizedunrealized loss (presented under ‘Other comprehensive income’) amounting to P=4.6 million, P=3.3 million and P=11.4 million for the years ended December31, 2019, 2018 and 2017. The Group made a settlement of P=4.6 million in 2019 for the related derivatives.
The Group’s currency options have nil value and a positive fair value of P=6.4 million as ofDecember 31, 2019 and 2018, respectively (see Note 12).
Call OptionAs part of change in ownership of URC Oceania Group, Intersnack was also given an option to acquire an additional 9% equity share in UHC. The calloption has a fair value of P=305.8 million as of December 31, 2019 recorded under ‘Accounts Payable and Other Accrued Liabilities’ (see Note 19).
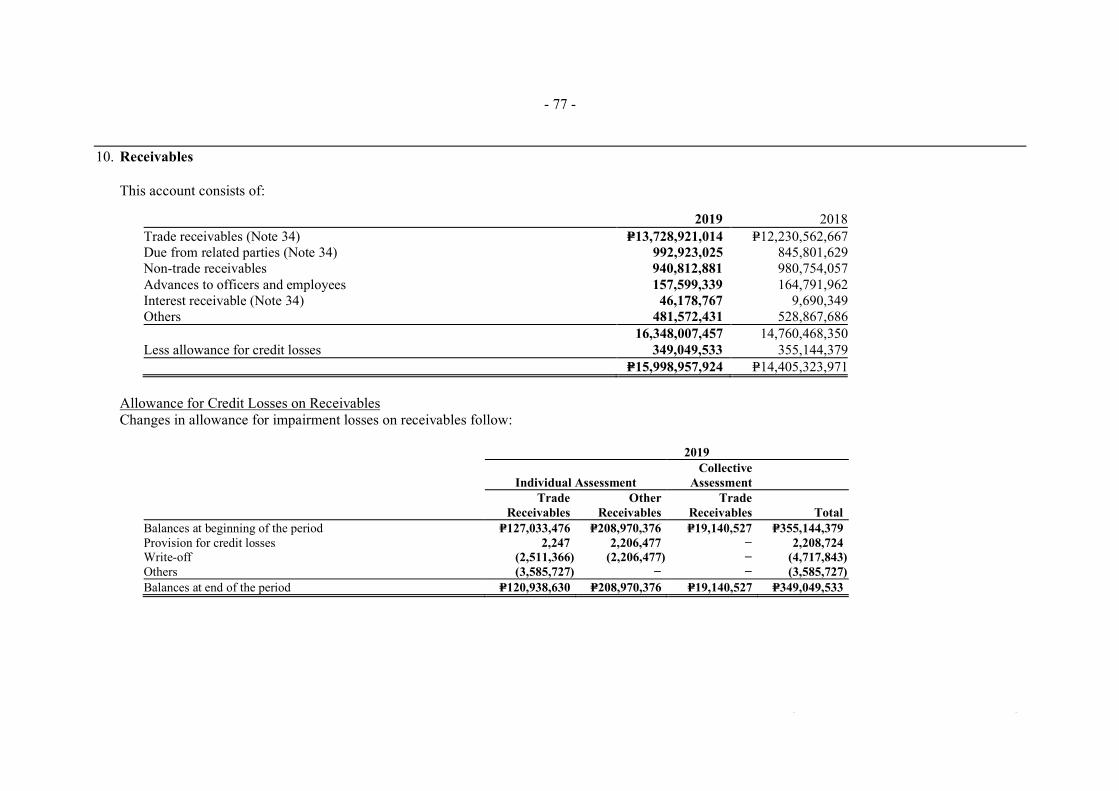
- 77 -
*SGVFSM000750*
10. Receivables
This account consists of:
2019 2018 Trade receivables (Note 34) P=13,728,921,014 P=12,230,562,667 Due from related parties (Note 34) 992,923,025 845,801,629 Non-trade receivables 940,812,881 980,754,057 Advances to officers and employees 157,599,339 164,791,962 Interest receivable (Note 34) 46,178,767 9,690,349 Others 481,572,431 528,867,686
16,348,007,457 14,760,468,350 Less allowance for credit losses 349,049,533 355,144,379
P=15,998,957,924 P=14,405,323,971
Allowance for Credit Losses on Receivables Changes in allowance for impairment losses on receivables follow:
2019
Individual Assessment Collective
Assessment Trade
Receivables Other
Receivables Trade
Receivables Total Balances at beginning of the period P=127,033,476 P=208,970,376 P=19,140,527 P=355,144,379 Provision for credit losses 2,247 2,206,477 − 2,208,724Write-off (2,511,366) (2,206,477) − (4,717,843) Others (3,585,727) − − (3,585,727) Balances at end of the period P=120,938,630 P=208,970,376 P=19,140,527 P=349,049,533
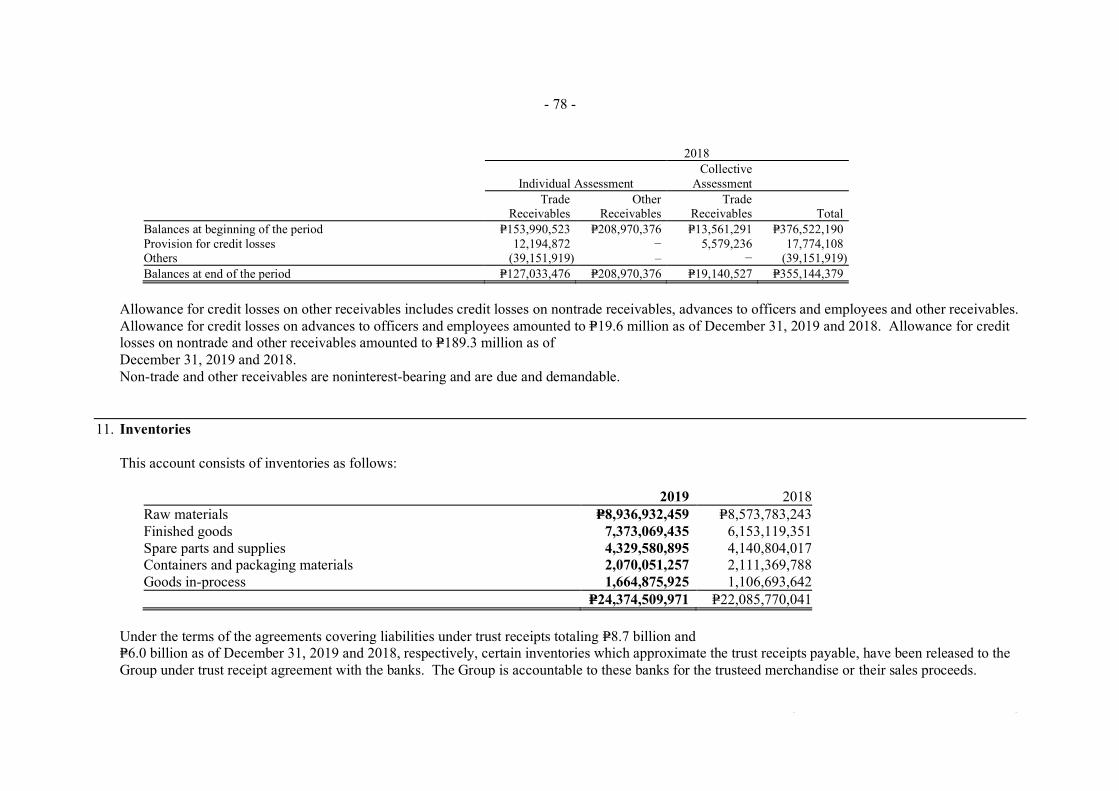
- 78 -
*SGVFSM000750*
2018
Individual Assessment Collective
Assessment Trade
Receivables Other
Receivables Trade
Receivables Total Balances at beginning of the period P=153,990,523 P=208,970,376 P=13,561,291 P=376,522,190 Provision for credit losses 12,194,872 − 5,579,236 17,774,108 Others (39,151,919) – − (39,151,919) Balances at end of the period P=127,033,476 P=208,970,376 P=19,140,527 P=355,144,379
Allowance for credit losses on other receivables includes credit losses on nontrade receivables, advances to officers and employees and other receivables. Allowance for credit losses on advances to officers and employees amounted to P=19.6 million as of December 31, 2019 and 2018. Allowance for credit losses on nontrade and other receivables amounted to P=189.3 million as of December 31, 2019 and 2018. Non-trade and other receivables are noninterest-bearing and are due and demandable.
11. Inventories
This account consists of inventories as follows:
2019 2018 Raw materials P=8,936,932,459 P=8,573,783,243 Finished goods 7,373,069,435 6,153,119,351 Spare parts and supplies 4,329,580,895 4,140,804,017 Containers and packaging materials 2,070,051,257 2,111,369,788 Goods in-process 1,664,875,925 1,106,693,642
P=24,374,509,971 P=22,085,770,041
Under the terms of the agreements covering liabilities under trust receipts totaling P=8.7 billion and P=6.0 billion as of December 31, 2019 and 2018, respectively, certain inventories which approximate the trust receipts payable, have been released to the Group under trust receipt agreement with the banks. The Group is accountable to these banks for the trusteed merchandise or their sales proceeds.
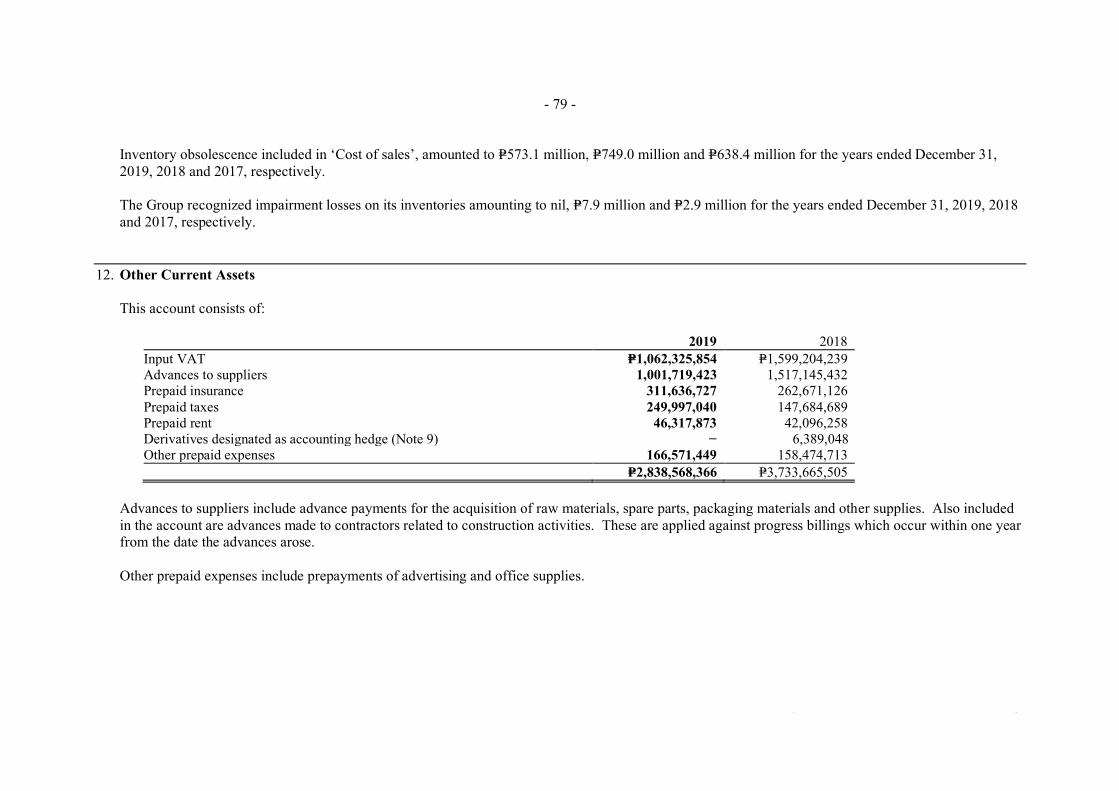
- 79 -
*SGVFSM000750*
Inventory obsolescence included in ‘Cost of sales’, amounted to P=573.1 million, P=749.0 million and P=638.4 million for the years ended December 31, 2019, 2018 and 2017, respectively.
The Group recognized impairment losses on its inventories amounting to nil, P=7.9 million and P=2.9 million for the years ended December 31, 2019, 2018 and 2017, respectively.
12. Other Current Assets
This account consists of:
2019 2018 Input VAT P=1,062,325,854 P=1,599,204,239 Advances to suppliers 1,001,719,423 1,517,145,432 Prepaid insurance 311,636,727 262,671,126 Prepaid taxes 249,997,040 147,684,689 Prepaid rent 46,317,873 42,096,258 Derivatives designated as accounting hedge (Note 9) − 6,389,048Other prepaid expenses 166,571,449 158,474,713
P=2,838,568,366 P=3,733,665,505
Advances to suppliers include advance payments for the acquisition of raw materials, spare parts, packaging materials and other supplies. Also included in the account are advances made to contractors related to construction activities. These are applied against progress billings which occur within one year from the date the advances arose.
Other prepaid expenses include prepayments of advertising and office supplies.

- 80 -
*SGVFSM000750*
13. Property, Plant and Equipment
The rollforward of this account follows:
As of and for the year ended December 31, 2019
Land Land
Improvements Buildings and
Improvements Machinery and
Equipment Sub-total Cost Balance at beginning of year P=3,748,093,521 P=2,020,928,072 P=18,308,946,671 P=73,187,178,560 P=97,265,146,824 Additions − 390,606,942 1,557,247,813 5,278,482,315 7,226,337,070 Additions from acquisition of subsidiaries (Note 16) − − 29,148,248 659,837,348 688,985,596 Disposals, reclassifications and other adjustments (Note 19) 24,589,917 (14,218,768) (33,763,383) (1,389,732,153) (1,413,124,387) Balance at end of year 3,772,683,438 2,397,316,246 19,861,579,349 77,735,766,070 103,767,345,103 Accumulated Depreciation and Amortization Balance at beginning of year − 754,568,956 8,378,044,362 50,905,095,518 60,037,708,836 Depreciation and amortization (Note 27) − 75,299,276 895,172,593 4,742,600,865 5,713,072,734 Additions from acquisition of subsidiaries (Note 16) − − 14,747,981 248,628,009 263,375,990 Disposals, reclassifications and other adjustments (Note 19) − (5,527,427) 234,955,532 (1,404,667,027) (1,175,238,922) Balance at end of year − 824,340,805 9,522,920,468 54,491,657,365 64,838,918,638 Net Book Value P=3,772,683,438 P=1,572,975,441 P=10,338,658,881 P=23,244,108,705 P=38,928,426,465
As of and for the year ended December 31, 2019
Transportation Equipment
Furniture, Fixtures and Equipment
Construction In-progress
Equipment In-transit Total
Cost Balance at beginning of year P=2,645,015,231 P=5,303,718,980 P=7,832,623,483 P=4,870,159,025 P=117,916,663,543 Additions 152,383,808 413,113,549 1,037,578,357 159,279,456 8,988,692,240 Additions from acquisition of subsidiaries (Note 16) 1,471,310 15,849,306 − − 706,306,212 Disposals, reclassifications and other adjustments (Note 19) (30,210,347) 59,959,258 246,937,907 (15,302,133) (1,151,739,702) Balance at end of the year 2,768,660,002 5,792,641,093 9,117,139,747 5,014,136,348 126,459,922,293 Accumulated Depreciation and Amortization Balance at beginning of year 2,061,485,901 3,867,152,540 − − 65,966,347,277 Depreciation and amortization (Note 27) 211,583,960 515,746,153 − − 6,440,402,847 Additions from acquisition of subsidiaries (Note 16) 1,471,310 12,694,555 − − 277,541,855 Disposals, reclassifications and other adjustments (Note 19) 5,623,083 318,836,438 − − (850,779,401) Balance at end of year 2,280,164,254 4,714,429,686 − − 71,833,512,578 Net Book Value P=488,495,748 P=1,078,211,407 P=9,117,139,747 P=5,014,136,348 P=54,626,409,715
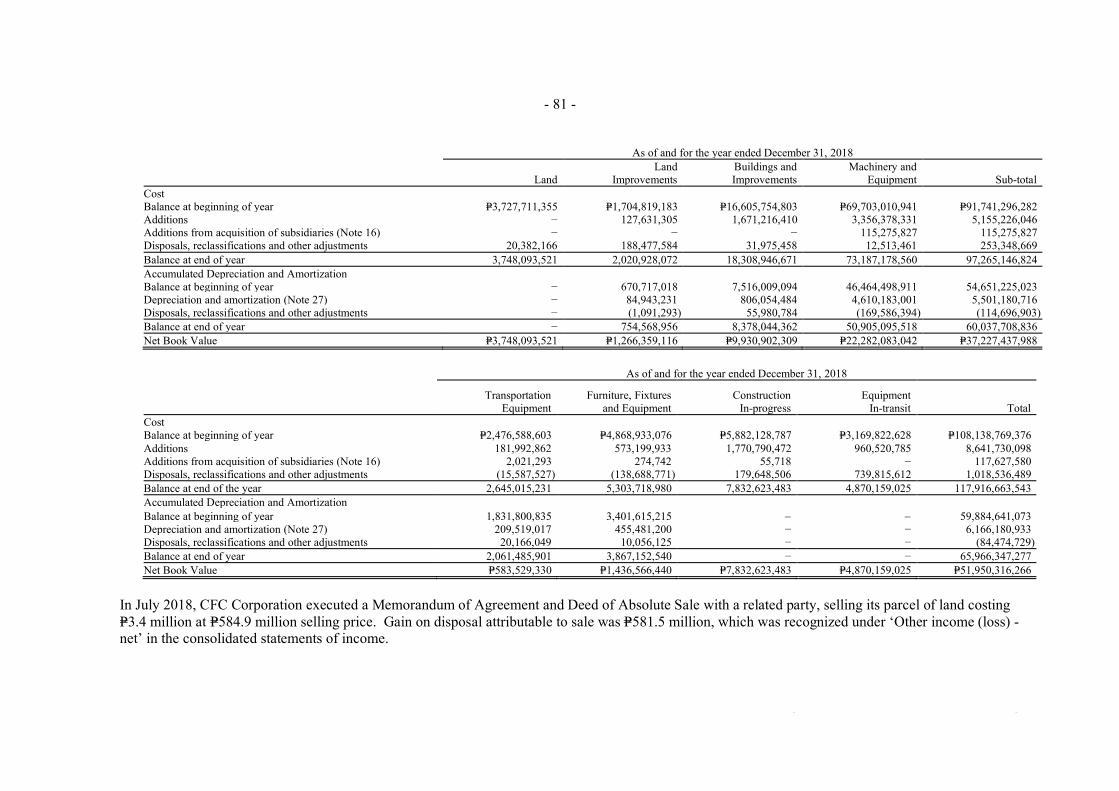
- 81 -
*SGVFSM000750*
As of and for the year ended December 31, 2018
Land Land
Improvements Buildings and Improvements
Machinery and Equipment Sub-total
Cost Balance at beginning of year P=3,727,711,355 P=1,704,819,183 P=16,605,754,803 P=69,703,010,941 P=91,741,296,282 Additions − 127,631,305 1,671,216,410 3,356,378,331 5,155,226,046 Additions from acquisition of subsidiaries (Note 16) − − − 115,275,827 115,275,827 Disposals, reclassifications and other adjustments 20,382,166 188,477,584 31,975,458 12,513,461 253,348,669 Balance at end of year 3,748,093,521 2,020,928,072 18,308,946,671 73,187,178,560 97,265,146,824 Accumulated Depreciation and Amortization Balance at beginning of year − 670,717,018 7,516,009,094 46,464,498,911 54,651,225,023 Depreciation and amortization (Note 27) − 84,943,231 806,054,484 4,610,183,001 5,501,180,716 Disposals, reclassifications and other adjustments − (1,091,293) 55,980,784 (169,586,394) (114,696,903) Balance at end of year − 754,568,956 8,378,044,362 50,905,095,518 60,037,708,836 Net Book Value P=3,748,093,521 P=1,266,359,116 P=9,930,902,309 P=22,282,083,042 P=37,227,437,988
As of and for the year ended December 31, 2018
Transportation Equipment
Furniture, Fixtures and Equipment
Construction In-progress
Equipment In-transit Total
Cost Balance at beginning of year P=2,476,588,603 P=4,868,933,076 P=5,882,128,787 P=3,169,822,628 P=108,138,769,376 Additions 181,992,862 573,199,933 1,770,790,472 960,520,785 8,641,730,098 Additions from acquisition of subsidiaries (Note 16) 2,021,293 274,742 55,718 − 117,627,580 Disposals, reclassifications and other adjustments (15,587,527) (138,688,771) 179,648,506 739,815,612 1,018,536,489 Balance at end of the year 2,645,015,231 5,303,718,980 7,832,623,483 4,870,159,025 117,916,663,543 Accumulated Depreciation and Amortization Balance at beginning of year 1,831,800,835 3,401,615,215 59,884,641,073 Depreciation and amortization (Note 27) 209,519,017 455,481,200 − − 6,166,180,933 Disposals, reclassifications and other adjustments 20,166,049 10,056,125 − − (84,474,729) Balance at end of year 2,061,485,901 3,867,152,540 − − 65,966,347,277 Net Book Value P=583,529,330 P=1,436,566,440 P=7,832,623,483 P=4,870,159,025 P=51,950,316,266
In July 2018, CFC Corporation executed a Memorandum of Agreement and Deed of Absolute Sale with a related party, selling its parcel of land costing P=3.4 million at P=584.9 million selling price. Gain on disposal attributable to sale was P=581.5 million, which was recognized under ‘Other income (loss) - net’ in the consolidated statements of income.
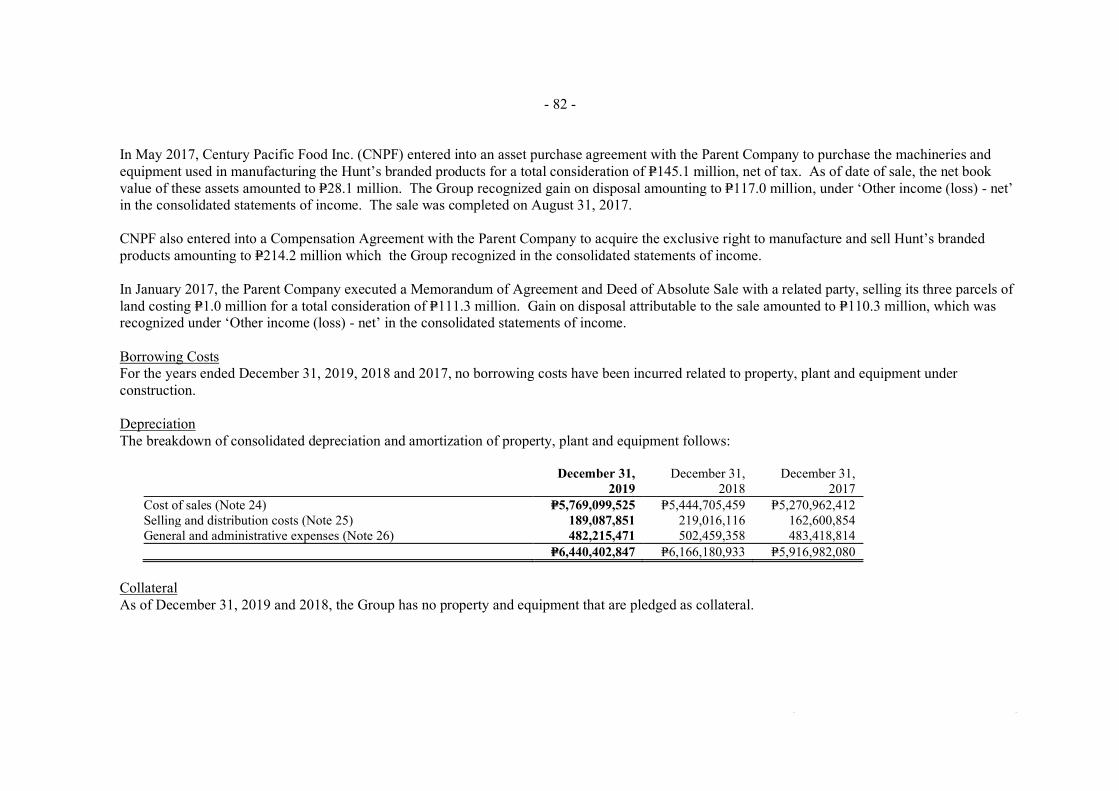
- 82 -
*SGVFSM000750*
In May 2017, Century Pacific Food Inc. (CNPF) entered into an asset purchase agreement with the Parent Company to purchase the machineries and equipment used in manufacturing the Hunt’s branded products for a total consideration of P=145.1 million, net of tax. As of date of sale, the net book value of these assets amounted to P=28.1 million. The Group recognized gain on disposal amounting to P=117.0 million, under ‘Other income (loss) - net’ in the consolidated statements of income. The sale was completed on August 31, 2017.
CNPF also entered into a Compensation Agreement with the Parent Company to acquire the exclusive right to manufacture and sell Hunt’s branded products amounting to P=214.2 million which the Group recognized in the consolidated statements of income.
In January 2017, the Parent Company executed a Memorandum of Agreement and Deed of Absolute Sale with a related party, selling its three parcels of land costing P=1.0 million for a total consideration of P=111.3 million. Gain on disposal attributable to the sale amounted to P=110.3 million, which was recognized under ‘Other income (loss) - net’ in the consolidated statements of income.
Borrowing Costs For the years ended December 31, 2019, 2018 and 2017, no borrowing costs have been incurred related to property, plant and equipment under construction.
Depreciation The breakdown of consolidated depreciation and amortization of property, plant and equipment follows:
December 31, 2019
December 31, 2018
December 31, 2017
Cost of sales (Note 24) P=5,769,099,525 P=5,444,705,459 P=5,270,962,412 Selling and distribution costs (Note 25) 189,087,851 219,016,116 162,600,854 General and administrative expenses (Note 26) 482,215,471 502,459,358 483,418,814
P=6,440,402,847 P=6,166,180,933 P=5,916,982,080
Collateral As of December 31, 2019 and 2018, the Group has no property and equipment that are pledged as collateral.

- 83 -
*SGVFSM000750*
14. Biological Assets
Total biological assets shown in the consolidated statements of financial position follow:
2019 2018 Current portion P=733,435,525 P=741,719,637 Noncurrent portion 224,128,072 366,184,414
P=957,563,597 P=1,107,904,051
These biological assets consist of:
2019 2018 Swine livestock
Commercial P=711,301,722 P=709,045,374 Breeder 136,695,328 278,316,362 Poultry livestock
Commercial 22,133,803 32,674,263 Breeder 87,432,744 87,868,052
P=957,563,597 P=1,107,904,051
The rollforward analysis of this account follows:
2019 2018 Balances at beginning of year P=1,107,904,051 P=1,678,576,389 Additions 3,641,918,030 3,200,666,651 Disposals (3,483,083,335) (3,303,867,014) Write-down (238,990,324) − Loss arising from changes in fair value less estimated costs to sell (70,184,825) (467,471,975) Balances at end of year P=957,563,597 P=1,107,904,051

- 84 -
*SGVFSM000750*
The Group has 209,640 and 232,724 heads of swine livestock and 529,971 and 731,177 heads of poultry livestock as of December 31, 2019 and 2018, respectively.
15. Goodwill and Intangible Assets
The movements of goodwill follow:
2019 2018 Cost Balances at beginning and end of year P=31,460,215,108 P=31,460,215,108 Accumulated impairment losses Balances at beginning of year 265,719,291 248,139,704 Additional impairment during the year − 17,579,587Balances at end of year 265,719,291 265,719,291 Net book value at end of year P=31,194,495,817 P=31,194,495,817
As of December 31, 2019 and 2018, the Group’s goodwill pertains to the following: \
Acquisition of CSPL in September 2016 P=16,492,854,332 Acquisition of NZSFHL in November 2014 13,913,396,261 The excess of the acquisition cost over the fair values of the net assets acquired by UABCL in 2000 775,835,598 Acquisition of Balayan Sugar Mill in February 2016 12,409,626
P=31,194,495,817

- 85 -
*SGVFSM000750*
The composition and movements of intangible assets follow:
As of and for the year ended December 31, 2019 Trademarks/
Brands Product
Formulation Software
Costs Customer
Relationship Total Cost Balances at beginning of period P=9,564,461,252 P=425,000,000 P=91,177,370 P=2,201,281,173 P=12,281,919,795 Additions − − − − − Disposal/others − − (26,482,619) − (26,482,619)
9,564,461,252 425,000,000 64,694,751 2,201,281,173 12,255,437,176 Accumulated Amortization and Impairment Losses Balances at beginning of period 201,524,581 − 78,247,580 271,887,280 551,659,441 Amortization during the period (Note 27) − − 11,593,520 73,357,370 84,950,890 Disposal/others − − (45,171,696) (9,129,984) (54,301,680)
201,524,581 – 44,669,404 336,114,666 582,308,651 Net Book Value at End of Period P=9,362,936,671 P=425,000,000 P=20,025,347 P=1,865,166,507 P=11,673,128,525
As of and for the year ended December 31, 2018 Trademarks/
Brands Product
Formulation Software
Costs Customer
Relationship Total Cost Balances at beginning of period P=9,564,461,252 P=425,000,000 P=79,955,581 P=2,201,281,173 P=12,270,698,006 Additions − − 11,234,200 − 11,234,200 Disposal/others − − (12,411) − (12,411)
9,564,461,252 425,000,000 91,177,370 2,201,281,173 12,281,919,795 Accumulated Amortization and Impairment Losses Balances at beginning of period 201,524,581 − 60,900,396 198,236,997 460,661,974 Amortization during the period (Note 27) – – 17,973,401 78,862,555 96,835,956 Disposal/others − − (626,217) (5,212,272) (5,838,489)
201,524,581 – 78,247,580 271,887,280 551,659,441 Net Book Value at End of Period P=9,362,936,671 P=425,000,000 P=12,929,790 P=1,929,393,893 P=11,730,260,354
Trademarks and product formulation were acquired from General Milling Corporation in 2008.
Total intangible assets acquired from the acquisition of CSPL and NZSFHL in 2016 and 2014 were composed of brands of P=9.3 billion, customer relationships of P=2.2 billion and software costs of P=56.3 million.
- 86 -
*SGVFSM000750*
The Group performed its annual impairment test on its goodwill and other intangible assets with indefinite useful lives as of December 31, 2019 and 2018. The recoverable amounts of goodwill and other intangible assets were determined based on value in use calculations for goodwill allocated to UABCL and the Balayan Sugar Mill, and fair value less costs to sell (FVLCTS) for goodwill allocated to CSPL and NZSFHL.
Value in use calculations used cash flow projections from financial budgets approved by management covering a five-year period. The pre-tax discount rates applied to cash flow projections range from 8.30% to 10.50% and 7.80% to 10.80% for the years ended December 31, 2019 and 2018, respectively. The following assumptions were also used in computing value in use:
Growth rate estimates - growth rates include revenue growth and terminal growth rates that are based on experiences and strategies developed for the various subsidiaries. The prospect for the industry was also considered in estimating the growth rates. Growth rates used in computing the projected future cash flows ranged from 2.00% to 6.90% and 2.0% to 12.1% as of December 31, 2019 and 2018, respectively.
Discount rates - discount rates were estimated based on the industry weighted average cost of capital, which includes the cost of equity and debt after considering the gearing ratio.
FVLCTS of CSPL and NZSFHL were based on enterprise values that were derived from EBITDA multiples. These enterprise values served as basis for the transaction price in the sale of 40% ownership interest in the Oceania business (Note 22). This fair value measurement is categorized as a Level 2 fair value measurement, since it is observable from the recent transaction.
Management believes that no reasonably possible changes in any of the above key assumptions would cause the carrying values of goodwill and intangible assets arising from the Group’s acquisitions to materially exceed their recoverable amounts.
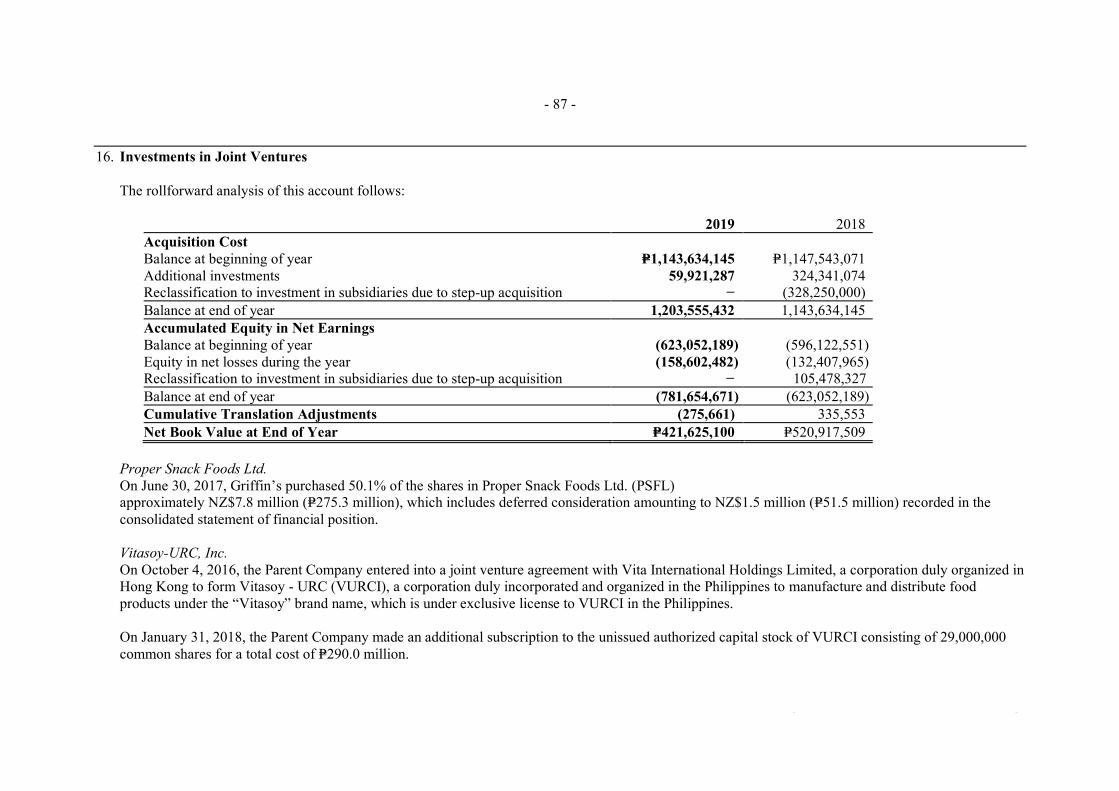
- 87 -
*SGVFSM000750*
16. Investments in Joint Ventures
The rollforward analysis of this account follows:
2019 2018 Acquisition Cost Balance at beginning of year P=1,143,634,145 P=1,147,543,071 Additional investments 59,921,287 324,341,074 Reclassification to investment in subsidiaries due to step-up acquisition − (328,250,000)Balance at end of year 1,203,555,432 1,143,634,145 Accumulated Equity in Net Earnings Balance at beginning of year (623,052,189) (596,122,551) Equity in net losses during the year (158,602,482) (132,407,965) Reclassification to investment in subsidiaries due to step-up acquisition − 105,478,327Balance at end of year (781,654,671) (623,052,189) Cumulative Translation Adjustments (275,661) 335,553 Net Book Value at End of Year P=421,625,100 P=520,917,509
Proper Snack Foods Ltd. On June 30, 2017, Griffin’s purchased 50.1% of the shares in Proper Snack Foods Ltd. (PSFL) approximately NZ$7.8 million (P=275.3 million), which includes deferred consideration amounting to NZ$1.5 million (P=51.5 million) recorded in the consolidated statement of financial position.
Vitasoy-URC, Inc. On October 4, 2016, the Parent Company entered into a joint venture agreement with Vita International Holdings Limited, a corporation duly organized in Hong Kong to form Vitasoy - URC (VURCI), a corporation duly incorporated and organized in the Philippines to manufacture and distribute food products under the “Vitasoy” brand name, which is under exclusive license to VURCI in the Philippines.
On January 31, 2018, the Parent Company made an additional subscription to the unissued authorized capital stock of VURCI consisting of 29,000,000 common shares for a total cost of P=290.0 million.
- 88 -
*SGVFSM000750*
Danone Universal Robina Beverages, Inc. On May 23, 2014, the Parent Company entered into a joint venture agreement with Danone Asia Holdings Pte. Ltd., a corporation duly organized in the Republic of Singapore to form Danone Universal Robina Beverages, Inc. (DURBI), a corporation duly incorporated and organized in the Philippines to manufacture and distribute food products under the “B’lue” brand name, which is under exclusive license to DURBI in the Philippines.
In 2019, the Parent Company made additional subscriptions to the unissued authorized capital stock of DURBI consisting of 10,000,000 common shares for a total cost of P=125.0 million. The capital infusion was not presented as additional investment but was applied to the 2017 excess of the share in net loss over the investment.
In 2018, the Parent Company made additional subscriptions to the unissued authorized capital stock of DURBI consisting of 5,000,000 common shares for a total cost of P=82.5 million. The capital infusion was not presented as additional investment but was applied to the 2017 excess of the share in net loss over the investment.
Equity in net losses in the 2017 consolidated statement of income amounting to P=280.5 million includes the excess of the share in net loss over the investment in DURBI amounting to P=147.6 million presented in ‘Other noncurrent liabilities’ as of December 31, 2018.
URC Snacks Ventures Inc. On January 17, 2014, the Parent Company entered into a joint venture agreement with Calbee, Inc., a corporation duly organized in Japan to form Calbee-URC, Inc. (CURCI), a corporation duly incorporated and organized in the Philippines to manufacture and distribute food products under the “Calbee Jack ‘n Jill” brand name, which is under exclusive license to CURCI in the Philippines.
On February 26, 2019, the SEC approved the amendment of CURCI’s Articles of Incorporation for the change in its corporate name from Calbee-URC, Inc. to URC Snack Ventures, Inc. (USVI).
In September 2018, the Parent Company entered into a share purchase agreement with its joint venture partner, Calbee, Inc., to sell the latter’s 50% equity interest in CURCI for a total consideration of P=171.0 million, which approximates the fair values of identifiable net assets acquired. The purchase of the additional 50% shares will allow the Parent Company to have full control of CURCI, consistent with its agenda of driving an aligned and scalable snacking category growth. As a result of the sale, CURCI became a wholly-owned subsidiary of the Parent Company.
Calbee-URC Malaysia On August 23, 2017, URC Malaysia entered into a joint venture agreement with Calbee, Inc., a corporation duly organized in Japan to form Calbee-URC Malaysia Sdn Bhd (CURM), a corporation registered with the Companies Commission of Malaysia organized to manufacture savoury snack products. Total consideration amounted to MYR2.7 million (P=34.3 million).
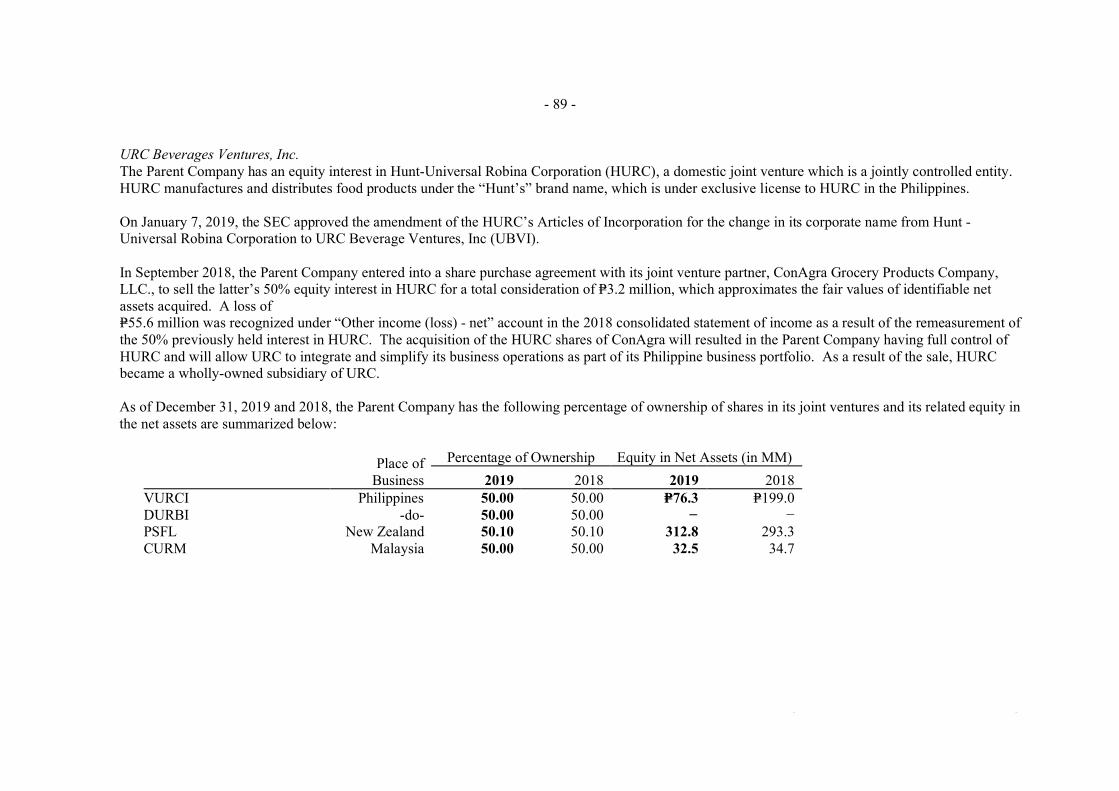
- 89 -
*SGVFSM000750*
URC Beverages Ventures, Inc. The Parent Company has an equity interest in Hunt-Universal Robina Corporation (HURC), a domestic joint venture which is a jointly controlled entity. HURC manufactures and distributes food products under the “Hunt’s” brand name, which is under exclusive license to HURC in the Philippines.
On January 7, 2019, the SEC approved the amendment of the HURC’s Articles of Incorporation for the change in its corporate name from Hunt - Universal Robina Corporation to URC Beverage Ventures, Inc (UBVI).
In September 2018, the Parent Company entered into a share purchase agreement with its joint venture partner, ConAgra Grocery Products Company, LLC., to sell the latter’s 50% equity interest in HURC for a total consideration of P=3.2 million, which approximates the fair values of identifiable net assets acquired. A loss of P=55.6 million was recognized under “Other income (loss) - net” account in the 2018 consolidated statement of income as a result of the remeasurement of the 50% previously held interest in HURC. The acquisition of the HURC shares of ConAgra will resulted in the Parent Company having full control of HURC and will allow URC to integrate and simplify its business operations as part of its Philippine business portfolio. As a result of the sale, HURC became a wholly-owned subsidiary of URC.
As of December 31, 2019 and 2018, the Parent Company has the following percentage of ownership of shares in its joint ventures and its related equity in the net assets are summarized below:
Place of Business
Percentage of Ownership Equity in Net Assets (in MM) 2019 2018 2019 2018
VURCI Philippines 50.00 50.00 P=76.3 P=199.0 DURBI -do- 50.00 50.00 − − PSFL New Zealand 50.10 50.10 312.8 293.3 CURM Malaysia 50.00 50.00 32.5 34.7
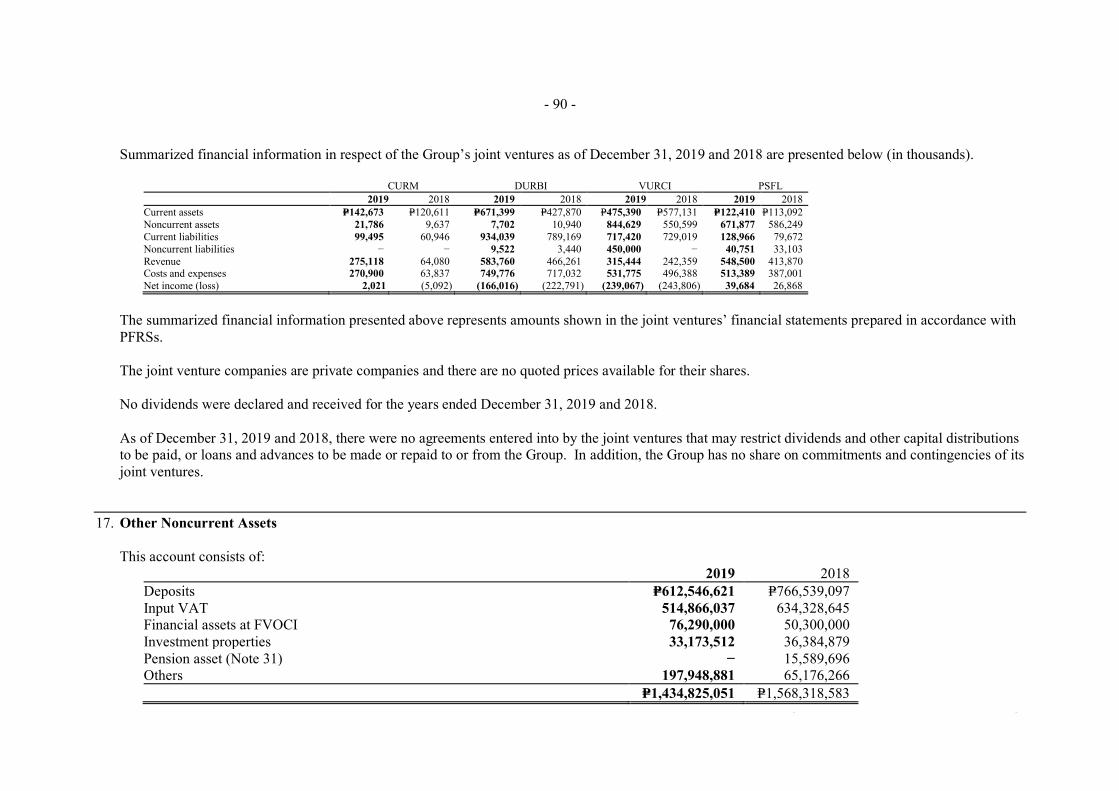
- 90 -
*SGVFSM000750*
Summarized financial information in respect of the Group’s joint ventures as of December 31, 2019 and 2018 are presented below (in thousands).
CURM DURBI VURCI PSFL 2019 2018 2019 2018 2019 2018 2019 2018
Current assets P=142,673 P=120,611 P=671,399 P=427,870 P=475,390 P=577,131 P=122,410 P=113,092 Noncurrent assets 21,786 9,637 7,702 10,940 844,629 550,599 671,877 586,249 Current liabilities 99,495 60,946 934,039 789,169 717,420 729,019 128,966 79,672 Noncurrent liabilities − − 9,522 3,440 450,000 − 40,751 33,103Revenue 275,118 64,080 583,760 466,261 315,444 242,359 548,500 413,870 Costs and expenses 270,900 63,837 749,776 717,032 531,775 496,388 513,389 387,001 Net income (loss) 2,021 (5,092) (166,016) (222,791) (239,067) (243,806) 39,684 26,868
The summarized financial information presented above represents amounts shown in the joint ventures’ financial statements prepared in accordance with PFRSs.
The joint venture companies are private companies and there are no quoted prices available for their shares.
No dividends were declared and received for the years ended December 31, 2019 and 2018.
As of December 31, 2019 and 2018, there were no agreements entered into by the joint ventures that may restrict dividends and other capital distributions to be paid, or loans and advances to be made or repaid to or from the Group. In addition, the Group has no share on commitments and contingencies of its joint ventures.
17. Other Noncurrent Assets
This account consists of:2019 2018
Deposits P=612,546,621 P=766,539,097 Input VAT 514,866,037 634,328,645 Financial assets at FVOCI 76,290,000 50,300,000 Investment properties 33,173,512 36,384,879 Pension asset (Note 31) − 15,589,696Others 197,948,881 65,176,266
P=1,434,825,051 P=1,568,318,583

- 91 -
*SGVFSM000750*
Deposits The Group’s deposits pertain to the installation of power and water meters, returnable containers and security deposits for operating leases of plants, warehouses and office buildings.
Input VAT Input tax pertains to VAT from purchases and/or importations of various parts, supplies, equipment, machineries and or capital goods, which will be claimed as credit against output tax liabilities in a manner prescribed by pertinent revenue regulations.
Financial Assets at FVOCI As of December 31, 2019 and 2018, financial assets at FVOCI consists of equity securities with the following movement:
2019 2018 Balance at beginning of period P=50,300,000 P=45,980,000 Changes in fair value during the period 25,990,000 4,320,000 Balance at end of period P=76,290,000 P=50,300,000
Fair value changes of financial assets at FVOCI are presented as components of ‘Other comprehensive income’ in Equity (see Note 23).

- 92 -
*SGVFSM000750*
Investment Properties The rollforward analysis of investment properties follows:
2019 2018 Cost Balance at beginning of period P=94,554,666 P=107,947,364 Reclassification to property, plant and equipment − (13,392,698)Balance at end of period 94,554,666 94,554,666 Accumulated depreciation Balance at beginning of period 58,169,787 62,659,225 Depreciation (Notes 26 and 27) 3,211,367 3,286,562 Reclassification to property, plant and equipment − (7,776,000)Balance at end of period 61,381,154 58,169,787 Net book value at end of period P=33,173,512 P=36,384,879
The investment properties consist of buildings and building improvements which are leased out to related and third parties (see Notes 34 and 36).
Total rental income earned from investment properties (included under ‘Other income (loss) - net’ in the consolidated statements of income) amounted to P=112.4 million, P=61.2 million and P=57.9 million for years ended December 31, 2019, 2018 and 2017, respectively.
Direct operating expenses (included under ‘General and administrative expenses’ in the consolidated statements of income) arising from investment properties amounted to P=0.8 million for the years ended December 31, 2019, 2018 and 2017.
Collateral As of December 31, 2019 and 2018, the Group has no investment properties that are pledged as collateral.
Others Others include noncurrent portion of advances to suppliers and deferred charges
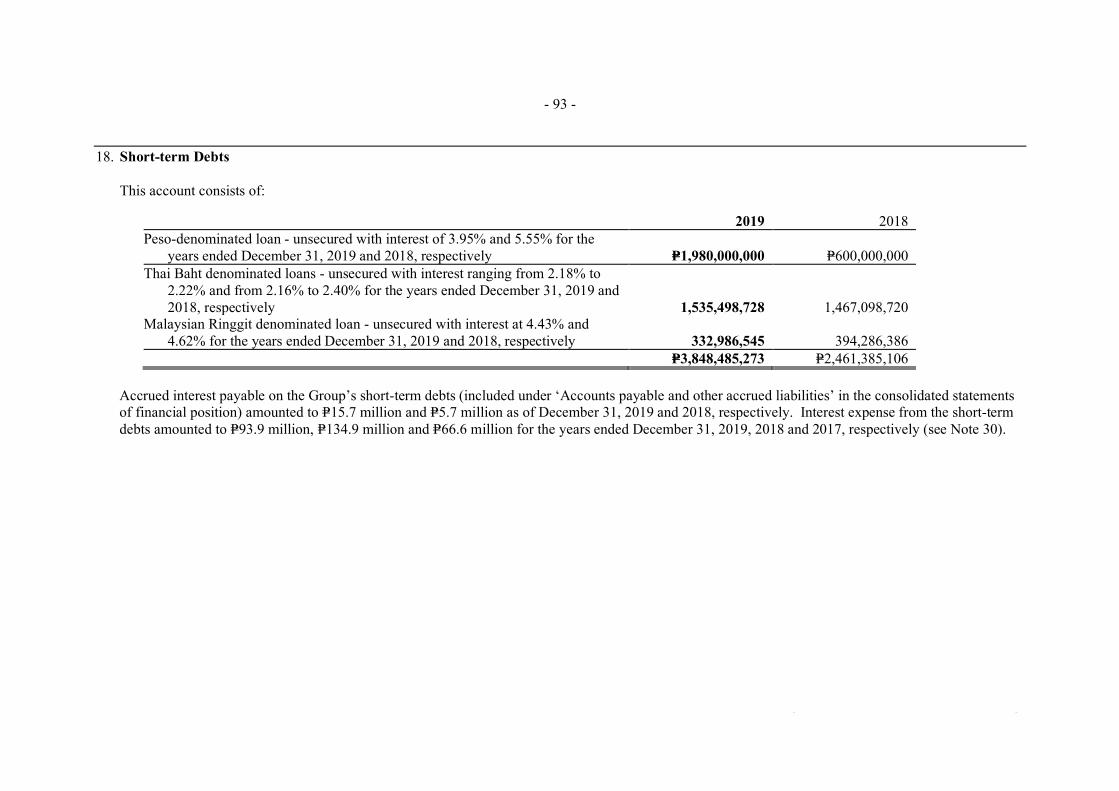
- 93 -
*SGVFSM000750*
18. Short-term Debts
This account consists of:
2019 2018 Peso-denominated loan - unsecured with interest of 3.95% and 5.55% for the
years ended December 31, 2019 and 2018, respectively P=1,980,000,000 P=600,000,000 Thai Baht denominated loans - unsecured with interest ranging from 2.18% to
2.22% and from 2.16% to 2.40% for the years ended December 31, 2019 and 2018, respectively 1,535,498,728 1,467,098,720
Malaysian Ringgit denominated loan - unsecured with interest at 4.43% and 4.62% for the years ended December 31, 2019 and 2018, respectively 332,986,545 394,286,386
P=3,848,485,273 P=2,461,385,106
Accrued interest payable on the Group’s short-term debts (included under ‘Accounts payable and other accrued liabilities’ in the consolidated statements of financial position) amounted to P=15.7 million and P=5.7 million as of December 31, 2019 and 2018, respectively. Interest expense from the short-term debts amounted to P=93.9 million, P=134.9 million and P=66.6 million for the years ended December 31, 2019, 2018 and 2017, respectively (see Note 30).

- 94 -
*SGVFSM000750*
19. Accounts Payable and Other Accrued Liabilities
This account consists of:
2019 2018 Trade payables (Note 34) P=13,461,966,827 P=13,531,720,134 Accrued expenses 6,284,949,047 7,159,227,021 Customers’ deposits 373,750,960 496,197,812 Derivative liabilities (Note 9) 305,835,400 − Advances from stockholders (Note 34) 192,691,243 247,216,898 VAT payable 167,096,180 758,822,733 Due to related parties (Note 34) 151,785,243 164,624,582 Withholding taxes payable 148,494,243 236,709,093 Others 211,179,729 172,241,254
P=21,297,748,872 P=22,766,759,527
Trade payables are noninterest-bearing and are normally settled on 30-60 day terms. Trade payables arise from purchases of inventories which include raw materials and indirect materials (i.e., packaging materials) and supplies, for use in manufacturing and other operations.
The accrued expenses account consists of:
2019 2018 Advertising and promotions P=3,289,303,049 P=3,988,888,494 Personnel costs 1,005,262,168 998,589,089 Contracted services 464,476,698 278,581,376 Utilities 302,097,687 335,649,820 Freight and handling costs 270,631,087 341,656,474 Rent 97,735,880 252,144,351 Professional and legal fees 46,067,820 121,959,369 Others 809,374,658 841,758,048
P=6,284,949,047 P=7,159,227,021

*SGVFSM000750*
- 95 -
Customers’ deposits represent downpayments for the sale of goods or performance of services which will be applied against accounts receivables upon delivery of goods or rendering of services.
Accrued professional and legal fees include fees or services rendered by third party consultants for the review of the Group's brand portfolio in 2019 and 2018. The related expense recognized under 'Other income (expense) - net' in the 2019 and 2018 consolidated statement of income amounted to P=161.3 million and =P341.5 million, respectively.
Others include accruals for taxes and licenses, interest expense, restructuring provision and other benefits. In 2019, the Group recorded a restructuring provision related to downsizing of farm operations and consolidation of plant operations. The key objectives of the restructuring are: (a) to focus on the profitable and growing animal nutrition and health business, (b) maximize the value-added chain concentrating on the processed meat business and (c) to improve long-term cost efficiencies for both farm and plant operations. The restructuring provision consists of write-down of biological assets (Note 14), property, plant and equipment (Note 13) and accrual of employee redundancy costs amounting P=239.0 million, P=453.7 million and =P137.1 million, respectively. The related expense is recognized under “Other income (expense) - net” in the consolidated statement of income.
20. Long-term Debts
This account consists of:
2019 2018
Principal
Unamortized debt issuance
cost Net Principal
Unamortized debt issuance
cost Net URC AU FinCo Loan P=17,200,057,755 P=110,736,987 P=17,089,320,768 P=17,922,355,336 P=179,697,514 P=17,742,657,822 URC NZ FinCo Loan 13,462,223,310 165,466,470 13,296,756,840 13,924,974,927 210,508,867 13,714,466,060
P=30,662,281,065 P=276,203,457 P=30,386,077,608 P=31,847,330,263 P=390,206,381 P=31,457,123,882
URC AU FinCo Loan due 2021 On September 30, 2016, URC AU FinCo entered into a syndicated term loan facility agreement guaranteed by the Parent Company payable in five years, amounting to AU$484.2 million (P=17.9 billion), with various banks for payment of acquisition costs and to refinance certain indebtedness of an acquired company, CSPL. The loan obtained bears a market interest rate plus a certain spread, payable quarterly, maturing on September 30, 2021.

*SGVFSM000750*
- 96 -
URC NZ FinCo NZ$395 Million Term Loan due 2023 On October 22, 2018, URC NZ FinCo entered into a term loan facility agreement guaranteed by the Parent Company payable in five years, amounting to NZ$395.0 million (=P14.4 billion), with various banks for payment of the NZ$420 million term loan due in 2019. The loan obtained bears a market interest rate plus a certain spread, payable quarterly, and maturing on October 22, 2023.
URC NZ FinCo NZ$420 Million Term Loan due 2019 On November 13, 2014, URC NZ FinCo entered into a term loan facility agreement guaranteed by the Parent Company payable in five years, amounting to NZ$420.0 million (P=12.6 billion), with various banks for payment of acquisition costs and to refinance certain indebtedness of an acquired company, NZSFHL. The loan obtained bears a market interest rate plus a certain spread, payable quarterly, and maturing on November 13, 2019.
In October 2018, URC NZ FinCo prepaid its 5-year term loan under Clause 7.1 of the underlying Facility Agreement at face value plus accrued interest. Total payment amounted to NZ$423.8 million (approximately P=15.5 billion), which includes accrued interest. The prepayment resulted in the recognition of the unamortized debt issue costs of US$1.7 million (approximately P=61.6 million) as expense presented under ‘Finance costs’ which represents the difference between the settlement amount and the carrying value of the loan at the time of settlement (see Note 30).
These long-term loans have no collateral but are all guaranteed by the Parent Company.
For each of these loans, the Group is required to maintain consolidated debt to equity ratio of not greater than 2.5 to 1.0. The Group has complied with all of its debt covenants as of December 31, 2019 and 2018.
21. Other Noncurrent Liabilities
This account consists of:
2019 2018 Net pension liability (Note 31) P=761,383,080 P=21,967,651 Miscellaneous (Note 16) 290,659,323 265,889,830
P=1,052,042,403 P=287,857,481
Miscellaneous includes asset retirement obligation and other noncurrent liabilities.

*SGVFSM000750*
- 97 -
Asset retirement obligation arises from obligations to restore the leased manufacturing sites, warehouses and offices of CSPL at the end of the respective lease terms. These provisions are calculated as the present value of the estimated expenditures required to remove any leasehold improvements. These costs are currently capitalized as part of the cost of the plant and equipment and are amortized over the shorter of the lease term and the useful life of assets.
As of December 31, 2019 and 2018, the carrying value of asset retirement obligation amounted to P=90.9 million and =P91.3 million, respectively. The amortization of this asset retirement obligation (included under ‘Finance costs’ in the consolidated statement of income) amounted to P=3.3 million, P=3.5 million and =P3.4 million for the years ended December 31, 2019, 2018 and 2017, respectively (see Note 30).
22. Equity
The details of the Parent Company’s common stock as of December 31, 2019 and 2018 follow:
2019 2018 Authorized shares 2,998,000,000 2,998,000,000 Par value per share P=1.00 P=1.00 Issued shares:
Balance at beginning of year 2,230,160,190 2,227,638,933 Issuance during the year − 2,521,257Balance at end of year 2,230,160,190 2,230,160,190
Outstanding shares 2,204,161,868 2,204,161,868
The paid-up capital of the Parent Company consists of the following as of December 31, 2019 and 2018:
Common stock P=2,230,160,190 Additional paid-in capital 21,191,974,542 Total paid-up capital P=23,422,134,732
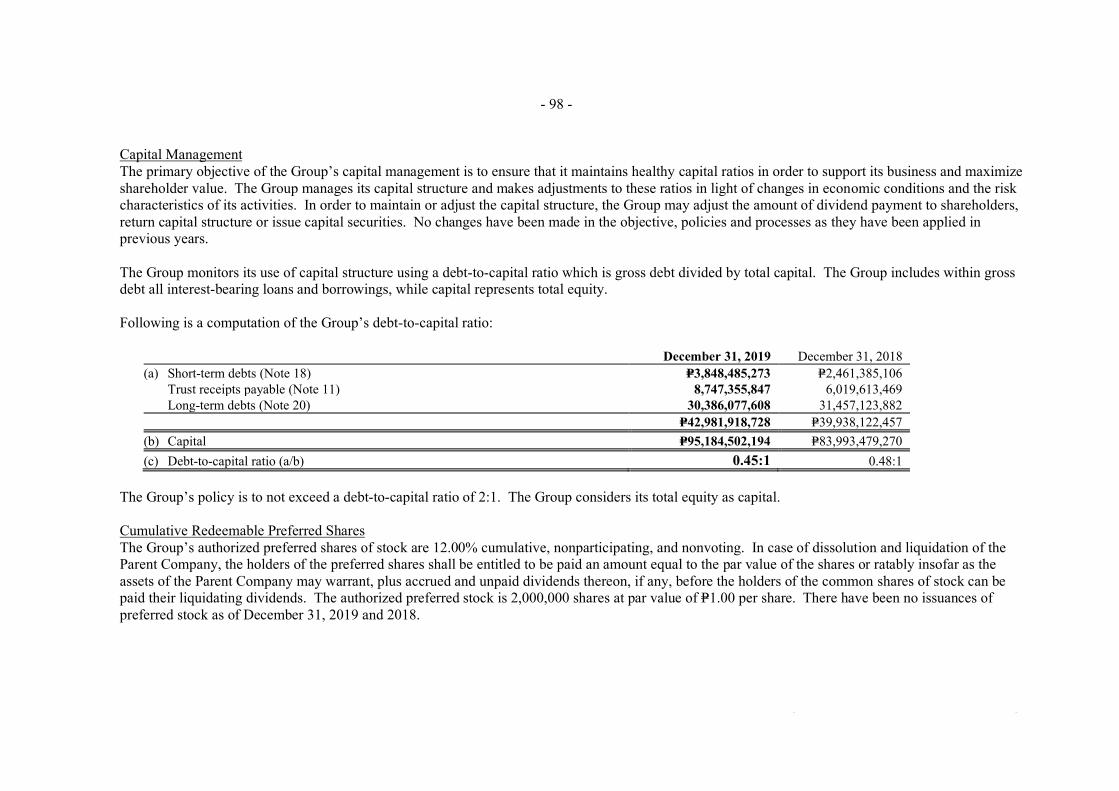
- 98 -
*SGVFSM000750*
Capital Management The primary objective of the Group’s capital management is to ensure that it maintains healthy capital ratios in order to support its business and maximize shareholder value. The Group manages its capital structure and makes adjustments to these ratios in light of changes in economic conditions and the risk characteristics of its activities. In order to maintain or adjust the capital structure, the Group may adjust the amount of dividend payment to shareholders, return capital structure or issue capital securities. No changes have been made in the objective, policies and processes as they have been applied in previous years.
The Group monitors its use of capital structure using a debt-to-capital ratio which is gross debt divided by total capital. The Group includes within gross debt all interest-bearing loans and borrowings, while capital represents total equity.
Following is a computation of the Group’s debt-to-capital ratio:
December 31, 2019 December 31, 2018 (a) Short-term debts (Note 18) P=3,848,485,273 P=2,461,385,106
Trust receipts payable (Note 11) 8,747,355,847 6,019,613,469 Long-term debts (Note 20) 30,386,077,608 31,457,123,882
P=42,981,918,728 P=39,938,122,457 (b) Capital P=95,184,502,194 P=83,993,479,270 (c) Debt-to-capital ratio (a/b) 0.45:1 0.48:1
The Group’s policy is to not exceed a debt-to-capital ratio of 2:1. The Group considers its total equity as capital.
Cumulative Redeemable Preferred Shares The Group’s authorized preferred shares of stock are 12.00% cumulative, nonparticipating, and nonvoting. In case of dissolution and liquidation of the Parent Company, the holders of the preferred shares shall be entitled to be paid an amount equal to the par value of the shares or ratably insofar as the assets of the Parent Company may warrant, plus accrued and unpaid dividends thereon, if any, before the holders of the common shares of stock can be paid their liquidating dividends. The authorized preferred stock is 2,000,000 shares at par value of P=1.00 per share. There have been no issuances of preferred stock as of December 31, 2019 and 2018.
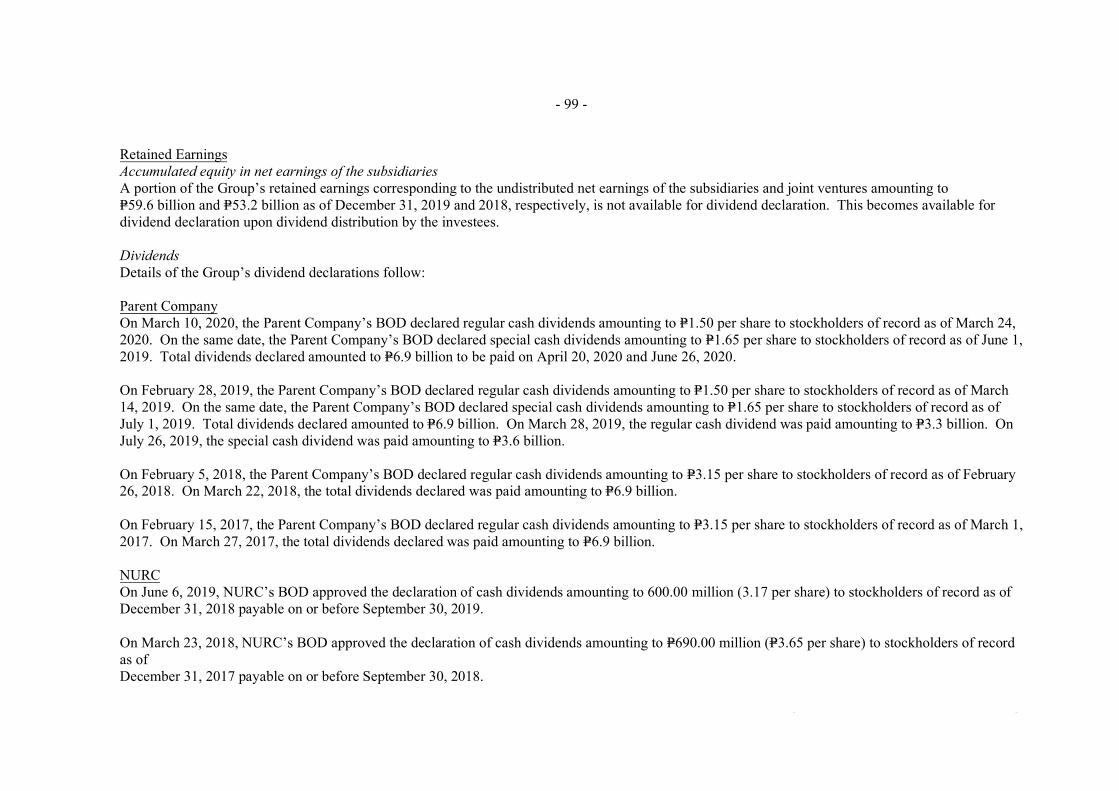
*SGVFSM000750*
- 99 -
Retained Earnings Accumulated equity in net earnings of the subsidiaries A portion of the Group’s retained earnings corresponding to the undistributed net earnings of the subsidiaries and joint ventures amounting to P=59.6 billion and =P53.2 billion as of December 31, 2019 and 2018, respectively, is not available for dividend declaration. This becomes available for dividend declaration upon dividend distribution by the investees.
Dividends Details of the Group’s dividend declarations follow:
Parent Company On March 10, 2020, the Parent Company’s BOD declared regular cash dividends amounting to P=1.50 per share to stockholders of record as of March 24, 2020. On the same date, the Parent Company’s BOD declared special cash dividends amounting to P=1.65 per share to stockholders of record as of June 1, 2019. Total dividends declared amounted to P=6.9 billion to be paid on April 20, 2020 and June 26, 2020.
On February 28, 2019, the Parent Company’s BOD declared regular cash dividends amounting to P=1.50 per share to stockholders of record as of March 14, 2019. On the same date, the Parent Company’s BOD declared special cash dividends amounting to P=1.65 per share to stockholders of record as of July 1, 2019. Total dividends declared amounted to =P6.9 billion. On March 28, 2019, the regular cash dividend was paid amounting to =P3.3 billion. On July 26, 2019, the special cash dividend was paid amounting to =P3.6 billion.
On February 5, 2018, the Parent Company’s BOD declared regular cash dividends amounting to P=3.15 per share to stockholders of record as of February 26, 2018. On March 22, 2018, the total dividends declared was paid amounting to =P6.9 billion.
On February 15, 2017, the Parent Company’s BOD declared regular cash dividends amounting to P=3.15 per share to stockholders of record as of March 1, 2017. On March 27, 2017, the total dividends declared was paid amounting to =P6.9 billion.
NURC On June 6, 2019, NURC’s BOD approved the declaration of cash dividends amounting to 600.00 million (3.17 per share) to stockholders of record as of December 31, 2018 payable on or before September 30, 2019.
On March 23, 2018, NURC’s BOD approved the declaration of cash dividends amounting to P=690.00 million (=P3.65 per share) to stockholders of record as of December 31, 2017 payable on or before September 30, 2018.
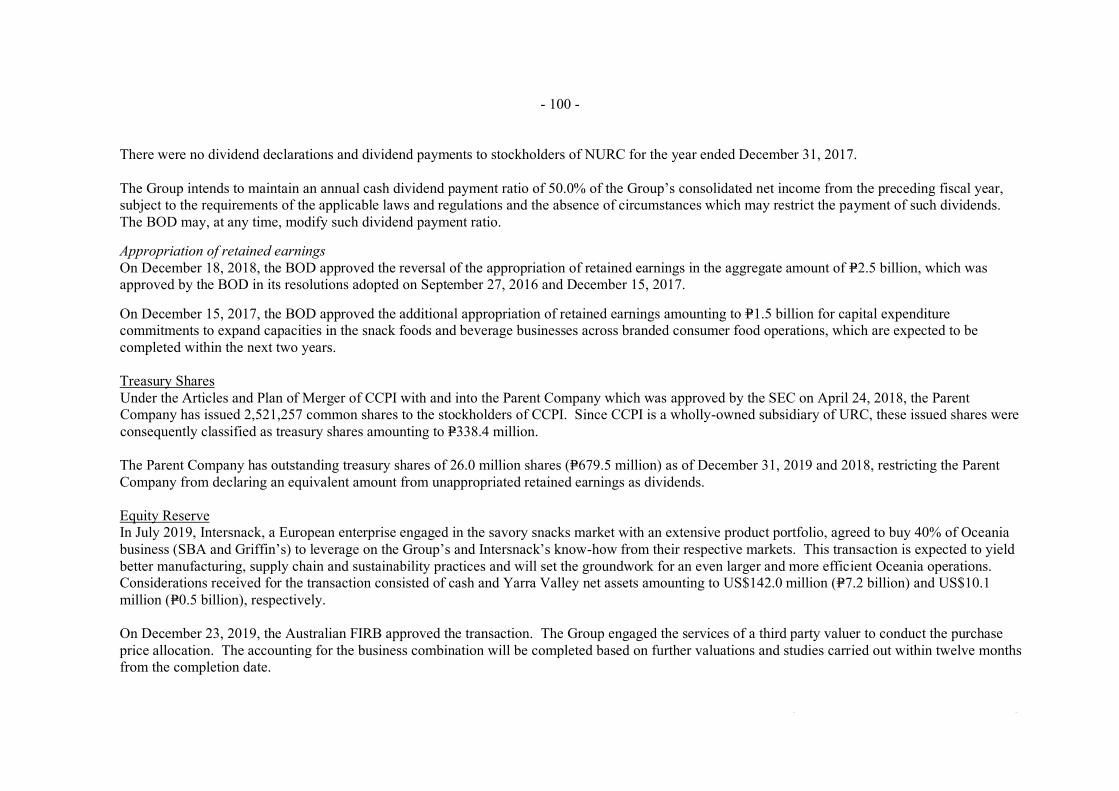
- 100 -
*SGVFSM000750*
There were no dividend declarations and dividend payments to stockholders of NURC for the year ended December 31, 2017.
The Group intends to maintain an annual cash dividend payment ratio of 50.0% of the Group’s consolidated net income from the preceding fiscal year, subject to the requirements of the applicable laws and regulations and the absence of circumstances which may restrict the payment of such dividends. The BOD may, at any time, modify such dividend payment ratio.
Appropriation of retained earnings On December 18, 2018, the BOD approved the reversal of the appropriation of retained earnings in the aggregate amount of P=2.5 billion, which was approved by the BOD in its resolutions adopted on September 27, 2016 and December 15, 2017.
On December 15, 2017, the BOD approved the additional appropriation of retained earnings amounting to P=1.5 billion for capital expenditure commitments to expand capacities in the snack foods and beverage businesses across branded consumer food operations, which are expected to be completed within the next two years.
Treasury Shares Under the Articles and Plan of Merger of CCPI with and into the Parent Company which was approved by the SEC on April 24, 2018, the Parent Company has issued 2,521,257 common shares to the stockholders of CCPI. Since CCPI is a wholly-owned subsidiary of URC, these issued shares were consequently classified as treasury shares amounting to P=338.4 million.
The Parent Company has outstanding treasury shares of 26.0 million shares (P=679.5 million) as of December 31, 2019 and 2018, restricting the Parent Company from declaring an equivalent amount from unappropriated retained earnings as dividends.
Equity Reserve In July 2019, Intersnack, a European enterprise engaged in the savory snacks market with an extensive product portfolio, agreed to buy 40% of Oceania business (SBA and Griffin’s) to leverage on the Group’s and Intersnack’s know-how from their respective markets. This transaction is expected to yield better manufacturing, supply chain and sustainability practices and will set the groundwork for an even larger and more efficient Oceania operations. Considerations received for the transaction consisted of cash and Yarra Valley net assets amounting to US$142.0 million (P=7.2 billion) and US$10.1 million (P=0.5 billion), respectively.
On December 23, 2019, the Australian FIRB approved the transaction. The Group engaged the services of a third party valuer to conduct the purchase price allocation. The accounting for the business combination will be completed based on further valuations and studies carried out within twelve months from the completion date.
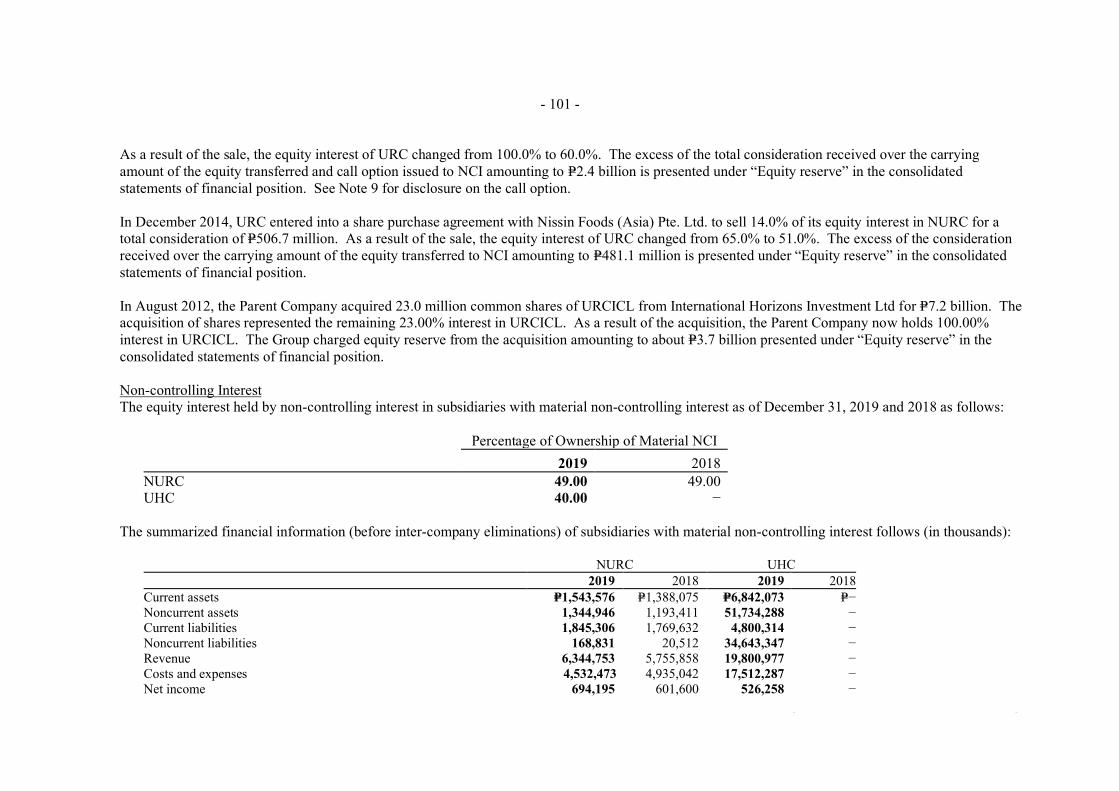
- 101 -
*SGVFSM000750*
As a result of the sale, the equity interest of URC changed from 100.0% to 60.0%. The excess of the total consideration received over the carrying amount of the equity transferred and call option issued to NCI amounting to P=2.4 billion is presented under “Equity reserve” in the consolidated statements of financial position. See Note 9 for disclosure on the call option.
In December 2014, URC entered into a share purchase agreement with Nissin Foods (Asia) Pte. Ltd. to sell 14.0% of its equity interest in NURC for a total consideration of P=506.7 million. As a result of the sale, the equity interest of URC changed from 65.0% to 51.0%. The excess of the consideration received over the carrying amount of the equity transferred to NCI amounting to P=481.1 million is presented under “Equity reserve” in the consolidated statements of financial position.
In August 2012, the Parent Company acquired 23.0 million common shares of URCICL from International Horizons Investment Ltd for P=7.2 billion. The acquisition of shares represented the remaining 23.00% interest in URCICL. As a result of the acquisition, the Parent Company now holds 100.00% interest in URCICL. The Group charged equity reserve from the acquisition amounting to about P=3.7 billion presented under “Equity reserve” in the consolidated statements of financial position.
Non-controlling Interest The equity interest held by non-controlling interest in subsidiaries with material non-controlling interest as of December 31, 2019 and 2018 as follows:
Percentage of Ownership of Material NCI 2019 2018
NURC 49.00 49.00 UHC 40.00 −
The summarized financial information (before inter-company eliminations) of subsidiaries with material non-controlling interest follows (in thousands):
NURC UHC 2019 2018 2019 2018
Current assets P=1,543,576 P=1,388,075 P=6,842,073 P=− Noncurrent assets 1,344,946 1,193,411 51,734,288 − Current liabilities 1,845,306 1,769,632 4,800,314 − Noncurrent liabilities 168,831 20,512 34,643,347 − Revenue 6,344,753 5,755,858 19,800,977 − Costs and expenses 4,532,473 4,935,042 17,512,287 − Net income 694,195 601,600 526,258 −

- 102 -
*SGVFSM000750*
The accumulated non-controlling interest of material non-controlling interest as follows:
2019 2018 UHC P=4,988,486,607 P=− NURC 439,948,802 388,216,510
The accumulated non-controlling interest as of December 31, 2019 and 2018 amounted to P=5.2 billion and P=202.3 million, respectively.
The profit allocated to non-controlling interest for the years ended December 31, 2019, 2018 and 2017, amounted to P=343.0 million, P=258.5 million and P=264.8 million, respectively.
Record of Registration of Securities with SEC Summarized below is the Parent Company’s track record of registration of securities under the Securities Registration Code:
Authorized Issued and No. of shares Par Offer number of outstanding
Date of offering Type of offering offered value price shares shares
February 17, 1994 Registration of authorized capital stock – P=1.00 P=– 1,998,000,000
common shares – 2,000,000
preferred shares
February 23, 1994 Initial public offering Subscribed and fully paid common 929,890,908 1.00 1.00 – 929,890,908 shares New common shares 309,963,636 1.00 21.06 – 309,963,636
July 21, 1995 20.00% stock dividend 247,970,907 – – – 247,970,907
(Forward)
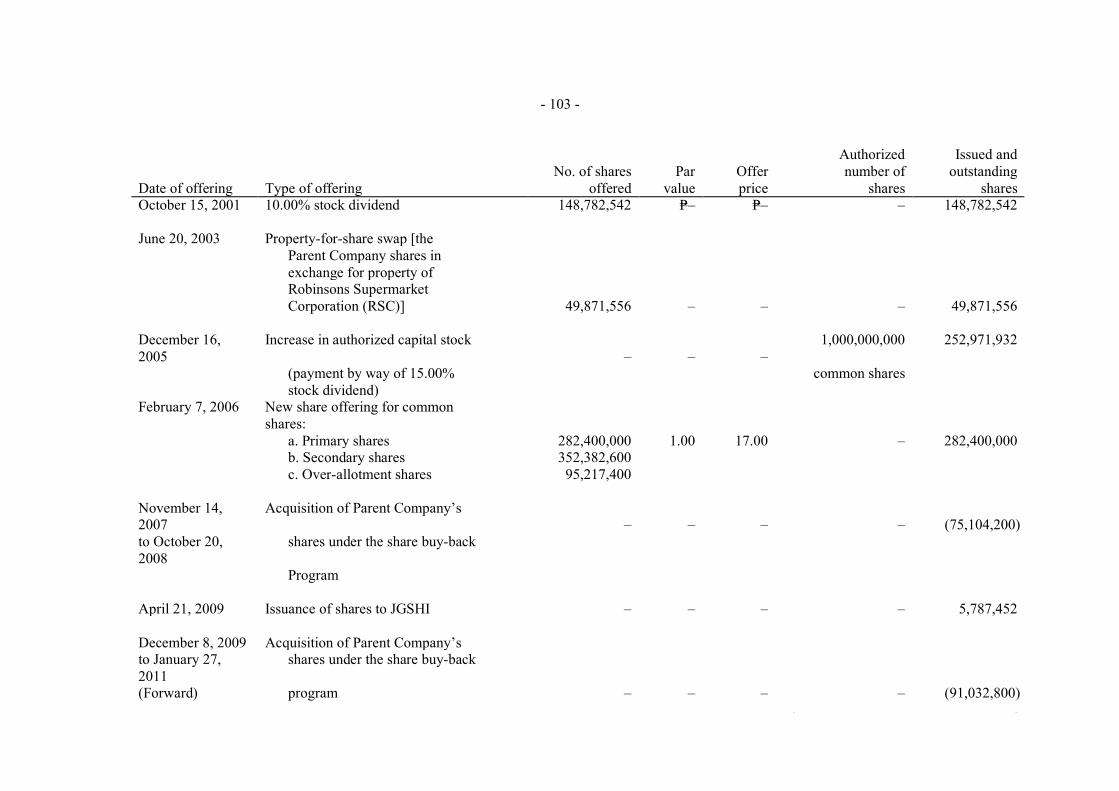
- 103 -
*SGVFSM000750*
Authorized Issued and No. of shares Par Offer number of outstanding
Date of offering Type of offering offered value price shares shares October 15, 2001 10.00% stock dividend 148,782,542 P=– P=– – 148,782,542
June 20, 2003 Property-for-share swap [the Parent Company shares in exchange for property of Robinsons Supermarket Corporation (RSC)] 49,871,556 – – – 49,871,556
December 16, 2005
Increase in authorized capital stock – – –
1,000,000,000 252,971,932
(payment by way of 15.00% common shares stock dividend)
February 7, 2006 New share offering for common shares:
a. Primary shares 282,400,000 1.00 17.00 – 282,400,000b. Secondary shares 352,382,600 c. Over-allotment shares 95,217,400
November 14, 2007
Acquisition of Parent Company’s – – – – (75,104,200)
to October 20, 2008
shares under the share buy-back
Program
April 21, 2009 Issuance of shares to JGSHI – – – – 5,787,452
December 8, 2009 Acquisition of Parent Company’s to January 27, 2011
shares under the share buy-back
(Forward) program – – – – (91,032,800)
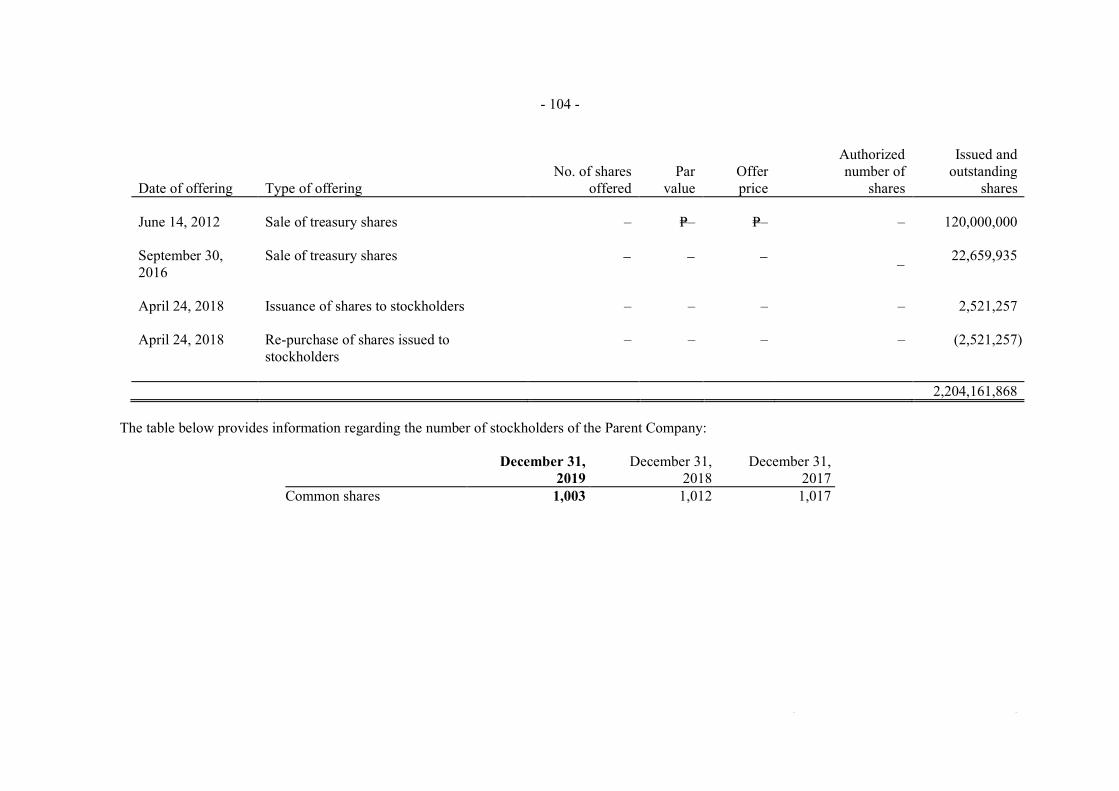
- 104 -
*SGVFSM000750*
Authorized Issued and No. of shares Par Offer number of outstanding
Date of offering Type of offering offered value price shares shares
June 14, 2012 Sale of treasury shares – P=– P=– – 120,000,000
September 30, 2016
Sale of treasury shares 22,659,935
April 24, 2018 Issuance of shares to stockholders – – – – 2,521,257
April 24, 2018 Re-purchase of shares issued to stockholders
– – – – (2,521,257)
2,204,161,868
The table below provides information regarding the number of stockholders of the Parent Company:
December 31, 2019
December 31, 2018
December 31, 2017
Common shares 1,003 1,012 1,017

- 105 -
*SGVFSM000750*
23. Components of Other Comprehensive Income
The breakdown and movement of other comprehensive income attributable to equity holders of the Parent Company follows:
December 31, 2019 December 31, 2018 December 31, 2017 Items to be reclassified to profit or loss in subsequent periods, net of tax:
Cumulative translation adjustments P=3,678,701,625 P=2,480,952,279 P=850,642,705 Net unrealized gain on AFS financial assets
Balance at beginning of period − 24,260,000 21,310,000 Reclassification due to PFRS 9 − (24,260,000) − Change in fair value during the period (Note 17) − − 2,950,000 Balance at end of period − − 24,260,000
Net unrealized gain (loss) on cash flow hedges: Balance at beginning of period 4,600,119 7,936,673 19,296,332 Change in fair value during the period (Note 9) (4,600,119) (3,336,554) (11,359,659) Balance at end of period − 4,600,119 7,936,673
3,678,701,625 2,485,552,398 882,839,378 Item not to be reclassified to profit or loss in subsequent periods:
Net unrealized gain on financial assets at FVOCI Balance at beginning of period 28,580,000 − − Reclassification due to PFRS 9 − 24,260,000 − Change in fair value during the period (Note 17) 25,990,000 4,320,000 − Balance at end of period 54,570,000 28,580,000 −
Remeasurement losses on defined benefit plans, gross of tax: Balance at beginning of period (256,522,672) (558,125,366) (594,056,733) Remeasurement gains on defined benefit plans during the period (Note 31) (463,310,720) 301,602,694 35,931,367 Balance at end of period (719,833,392) (256,522,672) (558,125,366) Income tax effect 215,950,018 76,956,802 167,437,610 Balance at end of period (503,883,374) (179,565,870) (390,687,756)
(449,313,374) (150,985,870) (390,687,756) P=3,229,388,251 P=2,334,566,528 P=492,151,622
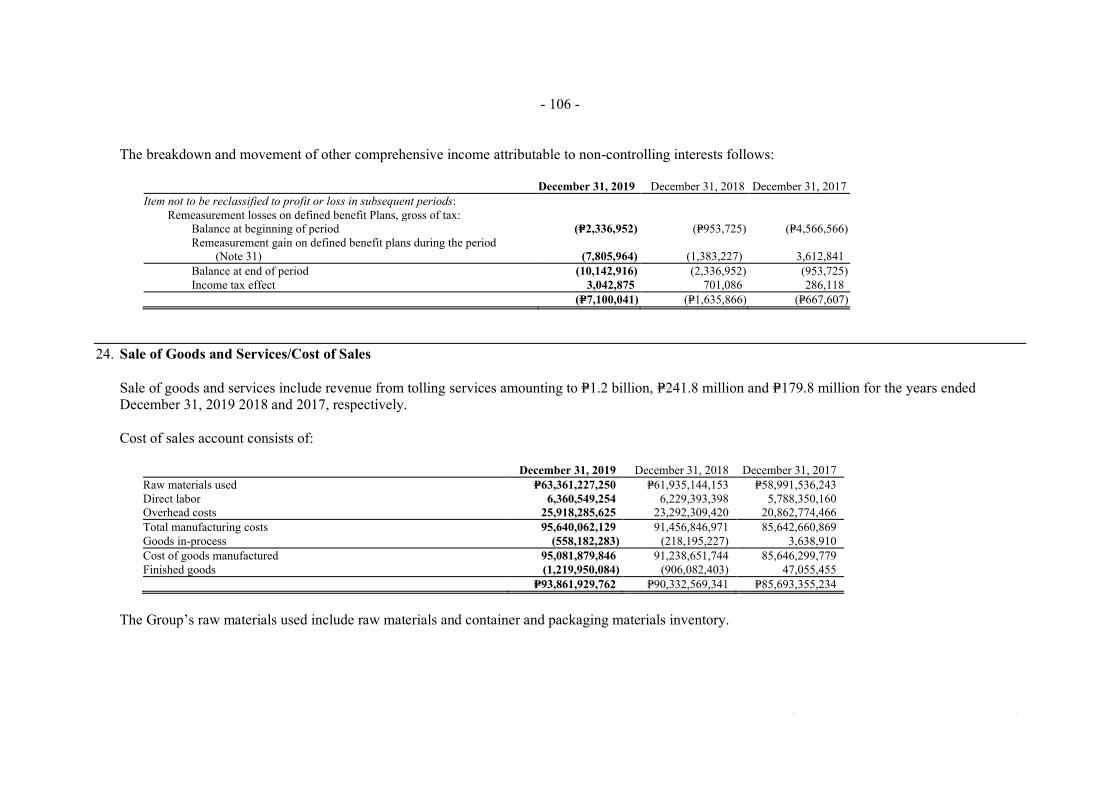
- 106 -
*SGVFSM000750*
The breakdown and movement of other comprehensive income attributable to non-controlling interests follows:
December 31, 2019 December 31, 2018 December 31, 2017 Item not to be reclassified to profit or loss in subsequent periods:
Remeasurement losses on defined benefit Plans, gross of tax: Balance at beginning of period (P=2,336,952) (P=953,725) (P=4,566,566) Remeasurement gain on defined benefit plans during the period
(Note 31) (7,805,964) (1,383,227) 3,612,841 Balance at end of period (10,142,916) (2,336,952) (953,725) Income tax effect 3,042,875 701,086 286,118
(P=7,100,041) (P=1,635,866) (P=667,607)
24. Sale of Goods and Services/Cost of Sales
Sale of goods and services include revenue from tolling services amounting to P=1.2 billion, P=241.8 million and P=179.8 million for the years endedDecember 31, 2019 2018 and 2017, respectively.
Cost of sales account consists of:
December 31, 2019 December 31, 2018 December 31, 2017 Raw materials used P=63,361,227,250 P=61,935,144,153 P=58,991,536,243 Direct labor 6,360,549,254 6,229,393,398 5,788,350,160 Overhead costs 25,918,285,625 23,292,309,420 20,862,774,466 Total manufacturing costs 95,640,062,129 91,456,846,971 85,642,660,869 Goods in-process (558,182,283) (218,195,227) 3,638,910 Cost of goods manufactured 95,081,879,846 91,238,651,744 85,646,299,779 Finished goods (1,219,950,084) (906,082,403) 47,055,455
P=93,861,929,762 P=90,332,569,341 P=85,693,355,234
The Group’s raw materials used include raw materials and container and packaging materials inventory.

- 107 -
*SGVFSM000750*
Overhead costs are broken down as follows:
December 31, 2019 December 31, 2018 December 31, 2017 Utilities P=8,373,558,035 P=7,898,234,689 P=7,576,345,534 Depreciation and amortization (Note 27) 6,302,960,643 5,548,177,852 5,377,003,923 Personnel expenses (Note 28) 3,582,738,030 3,344,085,895 3,112,919,756 Repairs and maintenance 3,407,462,606 2,943,488,316 2,548,246,214 Security and other contracted services 781,742,318 722,503,684 649,866,606 Rental expense 205,284,893 523,104,472 513,373,944 Insurance 200,592,711 192,985,628 198,832,730 Handling and delivery charges 238,260,011 176,880,414 185,825,028 Research and development 86,888,100 86,766,264 82,323,639 Others 2,738,798,278 1,856,082,206 618,037,092
P=25,918,285,625 P=23,292,309,420 P=20,862,774,466
Others include excise taxes amounting to P=1.4 billion, P=1.2 billion and nil for the years ended December 31, 2019, 2018 and 2017, respectively.
25. Selling and Distribution Costs
This account consists of:
December 31, 2019 December 31, 2018 December 31, 2017 Freight and other selling expenses P=8,744,768,724 P=8,640,063,341 P=8,836,677,237 Advertising and promotions 8,007,416,008 7,105,834,748 7,602,693,478 Personnel expenses (Note 28) 2,417,165,856 2,475,786,677 2,333,202,923 Depreciation and amortization (Note 27) 319,222,942 219,016,116 239,982,836 Repairs and maintenance 124,619,270 131,244,077 96,269,637 Others 214,119,284 147,613,894 142,050,101
P=19,827,312,084 P=18,719,558,853 P=19,250,876,212

- 108 -
*SGVFSM000750*
26. General and Administrative Expenses
This account consists of:
December 31, 2019 December 31, 2018 December 31, 2017 Personnel expenses (Note 28) P=2,834,313,060 P=2,882,430,173 P=2,946,018,579 Depreciation and amortization (Note 27) 687,873,342 602,581,876 487,076,600 Security and contracted services 372,219,881 285,204,116 263,010,037 Taxes, licenses and fees 241,262,338 256,080,911 245,171,407 Repairs and maintenance 229,681,422 243,392,263 142,522,762 Rental expense (Note 36) 229,404,741 236,787,812 214,483,196 Professional and legal fees 228,281,772 217,085,528 201,415,585 Travel and transportation 154,739,024 150,412,629 160,850,872 Communication 124,345,022 122,195,855 140,911,147 Utilities 42,529,228 60,836,183 57,251,993 Stationery and office supplies 24,320,840 30,784,674 29,591,597 Donations and contributions 6,210,131 29,603,765 7,233,729 Others 298,147,274 219,812,560 215,888,303
P=5,473,328,075 P=5,337,208,345 P=5,111,425,807
Other include insurance, memberships, bank charges, and representation and entertainment related to general and administrative functions.
27. Depreciation and Amortization
The breakdown of consolidated depreciation and amortization follows:
December 31, 2019 December 31, 2018 December 31, 2017 Cost of sales (Notes 13, 24 and 36) P=6,302,960,643 P=5,548,177,852 P=5,377,003,923 Selling and distribution costs (Notes 13, 25 and 36) 319,222,942 219,016,116 239,982,836 General and administrative expenses (Notes 13, 15, 17, 26 and 36) 687,873,342 602,581,876 487,076,600
P=7,310,056,927 P=6,369,775,844 P=6,104,063,359
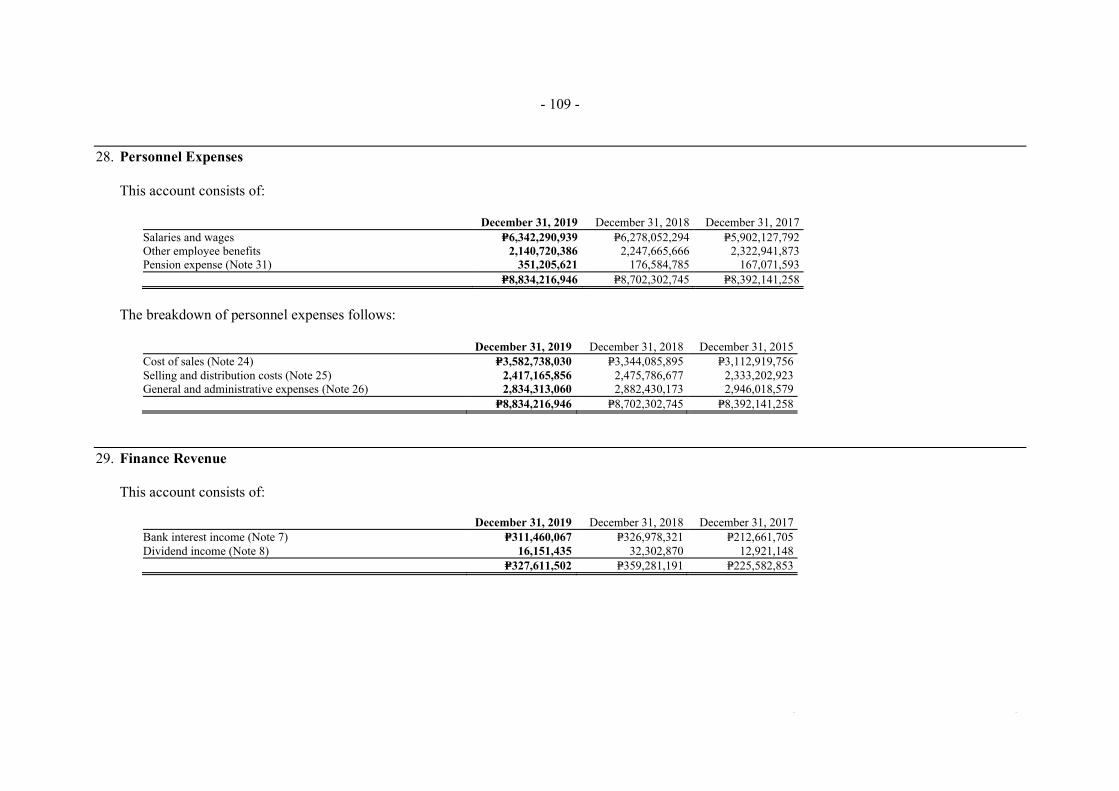
- 109 -
*SGVFSM000750*
28. Personnel Expenses
This account consists of:
December 31, 2019 December 31, 2018 December 31, 2017 Salaries and wages P=6,342,290,939 P=6,278,052,294 P=5,902,127,792 Other employee benefits 2,140,720,386 2,247,665,666 2,322,941,873 Pension expense (Note 31) 351,205,621 176,584,785 167,071,593
P=8,834,216,946 P=8,702,302,745 P=8,392,141,258
The breakdown of personnel expenses follows:
December 31, 2019 December 31, 2018 December 31, 2015 Cost of sales (Note 24) P=3,582,738,030 P=3,344,085,895 P=3,112,919,756 Selling and distribution costs (Note 25) 2,417,165,856 2,475,786,677 2,333,202,923 General and administrative expenses (Note 26) 2,834,313,060 2,882,430,173 2,946,018,579
P=8,834,216,946 P=8,702,302,745 P=8,392,141,258
29. Finance Revenue
This account consists of:
December 31, 2019 December 31, 2018 December 31, 2017 Bank interest income (Note 7) P=311,460,067 P=326,978,321 P=212,661,705 Dividend income (Note 8) 16,151,435 32,302,870 12,921,148
P=327,611,502 P=359,281,191 P=225,582,853

- 110 -
*SGVFSM000750*
30. Finance Costs
This account consists of finance costs arising from:
December 31, 2019 December 31, 2018 December 31, 2017 Long-term debts (Note 20) P=866,375,210 P=1,354,936,980 P=1,239,928,198 Interest expense on liabilities (Note 36) 188,347,893 − − Short-term debts (Note 18) 93,925,041 134,922,658 66,560,687 Net interest on net pension liability (Note 31) 26,381,202 8,751,555 9,068,871 Others (Notes 20 and 21) 494,839,723 163,089,200 111,772,070
P=1,669,869,069 P=1,661,700,393 P=1,427,329,826
Others include unamortized debt issue costs recognized as expense on pretermination of NZD loan, interest incurred on liabilities under trust receipts, amortization of asset retirement obligation and other financing charges.
31. Pension Costs
The Group has a funded, noncontributory defined benefit retirement plan covering all its employees. The pension funds are being administered andmanaged through JG Summit Multi-Employer Retirement Plan, with Robinsons Bank Corporation (RBC) as Trustee. The plan provides for retirement,separation, disability and death benefits to its members. The Group, however, reserves the right to discontinue, suspend or change the rates and amountsof its contributions at any time on account of business necessity or adverse economic conditions. The retirement plan has an Executive RetirementCommittee that is mandated to approve the plan, trust agreement, investment plan, including any amendments or modifications thereto, and otheractivities of the Plan. Certain members of the BOD of the Ultimate Parent Company are represented in the Executive Retirement Committee. RBCmanages the funds based on the mandate as defined in the trust agreement.
Under the existing regulatory framework, Republic Act (RA) 7641, the Philippine Retirement Pay Law, requires a provision for retirement pay toqualified private sector employees in the absence of any retirement plan in the entity, provided however that the employee’s retirement benefits under anycollective bargaining and other agreements shall not be less than those provided under law. The law does not require minimum funding of the plan. TheParent Company and all of its subsidiaries meet the minimum retirement benefit under RA 7641.

- 111 -
*SGVFSM000750*
Net pension asset (liability) included in the consolidated statements of financial position follow:
2019 2018 Pension asset (Note 17) P=− P=15,589,696 Pension liability (Note 21) (761,383,080) (21,967,651)
(P=761,383,080) (P=6,377,955)

- 112 -
*SGVFSM000750*
Changes in net defined benefit liability of funded funds of the Group are as follows:
2019 Net benefit cost in consolidated statements of income Remeasurements in other comprehensive income
January 1, 2019
Current service cost
(Note 28)
Past service cost
(Note 28) Finance cost
(Note 30) Subtotal Benefits paid
Return on plan assets (excluding
amount included in net interest
cost)
Actuarial changes
arising from changes in experience
adjustments
Actuarial changes
arising from demographic assumptions
Actuarial changes
arising from changes in
financial assumptions Subtotal Contributions
December 31, 2019
Present value of defined benefit obligation P=2,060,607,006 P=203,574,299 P=121,250,120 P=143,286,707 P=468,111,126 (P=152,251,708) P=− P=48,574,536 (P=18,574,799) P=492,589,653 P=522,589,390 P=− P=2,899,055,814
Fair value of plan assets (2,054,229,051) − − (116,905,505) (116,905,505) 152,251,708 (51,472,706) − − − (51,472,706) (67,317,180) (2,137,672,734) P=6,377,955 P=203,574,299 P=121,250,120 P=26,381,202 P=351,205,621 P=− (P=51,472,706) P=48,574,536 (P=18,574,799) P=492,589,653 P=471,116,684 (P=67,317,180) P=761,383,080
2018 Net benefit cost in consolidated statements of income Remeasurements in other comprehensive income
January 1, 2018
Current service cost
(Note 28) Finance cost
(Note 30) Subtotal Benefits paid
Return on plan assets (excluding
amount included in net interest
cost)
Actuarial changes
arising from changes in experience
adjustments
Actuarial changes
arising from demographic assumptions
Actuarial changes
arising from changes in
financial assumptions Subtotal Contributions
Asset and Liabilities Acquired
December 31, 2018
Present value of defined benefit obligation P=2,250,032,759 P=176,584,785 P=121,634,967 P=298,219,752 (P=145,747,035) P=− (P=62,574,266) P=466,322 (P=283,129,138) (P=345,237,082) (P=213,268) P=3,551,880 P=2,060,607,006
Fair value of plan assets (2,079,224,934) – (112,883,412) (112,883,412) 145,747,035 45,017,615 – – – 45,017,615 (51,363,797) (1,521,558) (2,054,229,051) P=170,807,825 P=176,584,785 P=8,751,555 P=185,336,340 P=− P=45,017,615 (P=62,574,266) P=466,322 (P=283,129,138) (P=300,219,467) (P=51,577,065) P=2,030,322 P=6,377,955
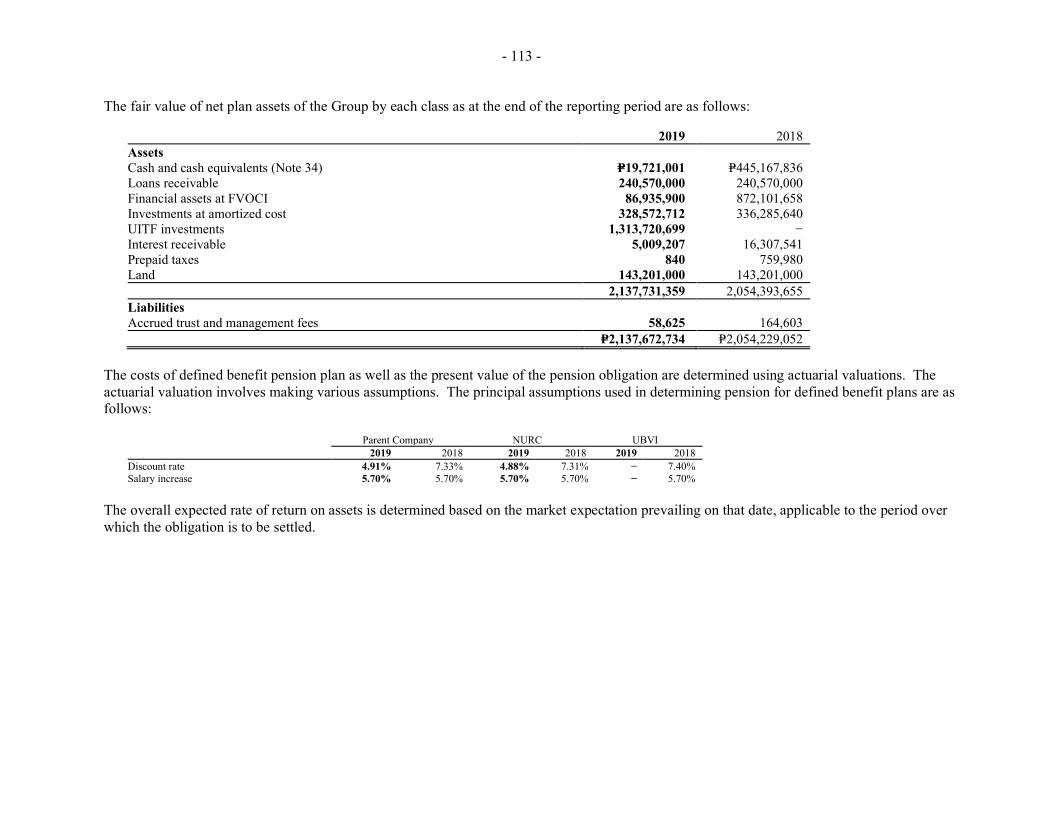
- 113 -
*SGVFSM000750*
The fair value of net plan assets of the Group by each class as at the end of the reporting period are as follows:
2019 2018 Assets Cash and cash equivalents (Note 34) P=19,721,001 P=445,167,836 Loans receivable 240,570,000 240,570,000 Financial assets at FVOCI 86,935,900 872,101,658 Investments at amortized cost 328,572,712 336,285,640 UITF investments 1,313,720,699 − Interest receivable 5,009,207 16,307,541 Prepaid taxes 840 759,980 Land 143,201,000 143,201,000
2,137,731,359 2,054,393,655 Liabilities Accrued trust and management fees 58,625 164,603
P=2,137,672,734 P=2,054,229,052
The costs of defined benefit pension plan as well as the present value of the pension obligation are determined using actuarial valuations. The actuarial valuation involves making various assumptions. The principal assumptions used in determining pension for defined benefit plans are as follows:
Parent Company NURC UBVI 2019 2018 2019 2018 2019 2018
Discount rate 4.91% 7.33% 4.88% 7.31% − 7.40%Salary increase 5.70% 5.70% 5.70% 5.70% − 5.70%
The overall expected rate of return on assets is determined based on the market expectation prevailing on that date, applicable to the period over which the obligation is to be settled.
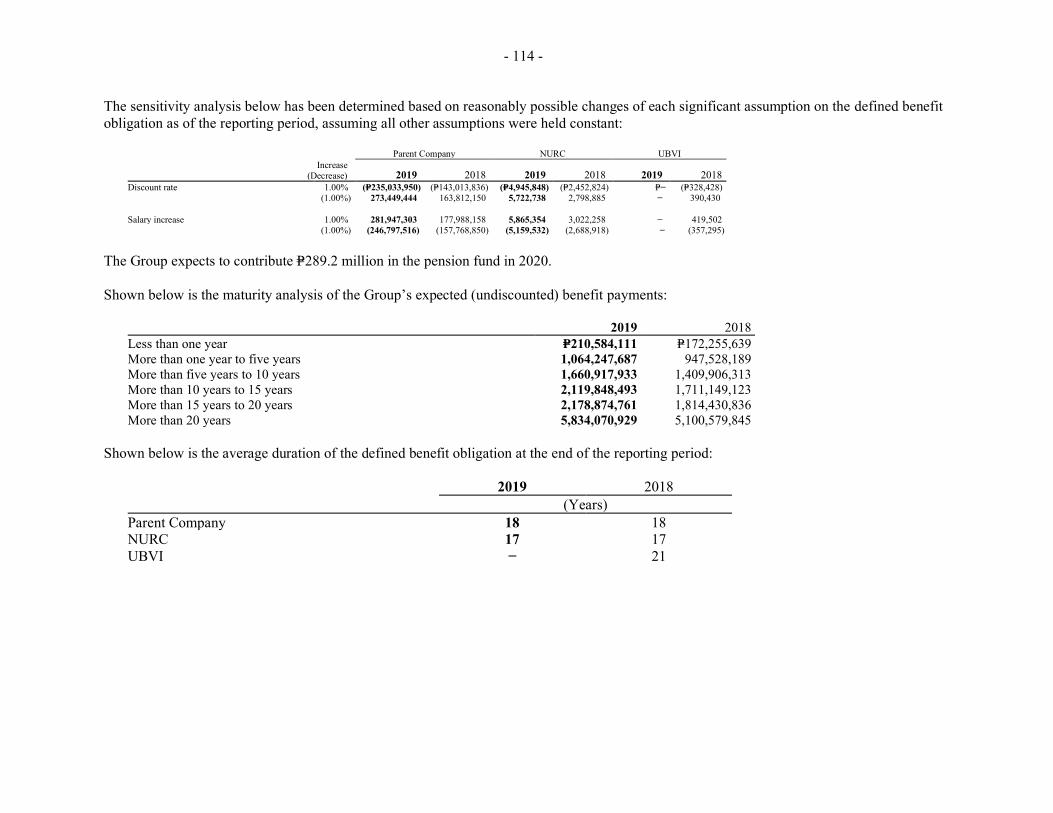
*SGVFSM000750*
- 114 -
The sensitivity analysis below has been determined based on reasonably possible changes of each significant assumption on the defined benefit obligation as of the reporting period, assuming all other assumptions were held constant:
Parent Company NURC UBVI Increase
(Decrease) 2019 2018 2019 2018 2019 2018 Discount rate 1.00% (P=235,033,950) (P=143,013,836) (P=4,945,848) (P=2,452,824) P=− (P=328,428)
(1.00%) 273,449,444 163,812,150 5,722,738 2,798,885 − 390,430
Salary increase 1.00% 281,947,303 177,988,158 5,865,354 3,022,258 − 419,502(1.00%) (246,797,516) (157,768,850) (5,159,532) (2,688,918) − (357,295)
The Group expects to contribute P=289.2 million in the pension fund in 2020.
Shown below is the maturity analysis of the Group’s expected (undiscounted) benefit payments:
2019 2018 Less than one year P=210,584,111 P=172,255,639 More than one year to five years 1,064,247,687 947,528,189 More than five years to 10 years 1,660,917,933 1,409,906,313 More than 10 years to 15 years 2,119,848,493 1,711,149,123 More than 15 years to 20 years 2,178,874,761 1,814,430,836 More than 20 years 5,834,070,929 5,100,579,845
Shown below is the average duration of the defined benefit obligation at the end of the reporting period:
2019 2018 (Years)
Parent Company 18 18 NURC 17 17 UBVI − 21
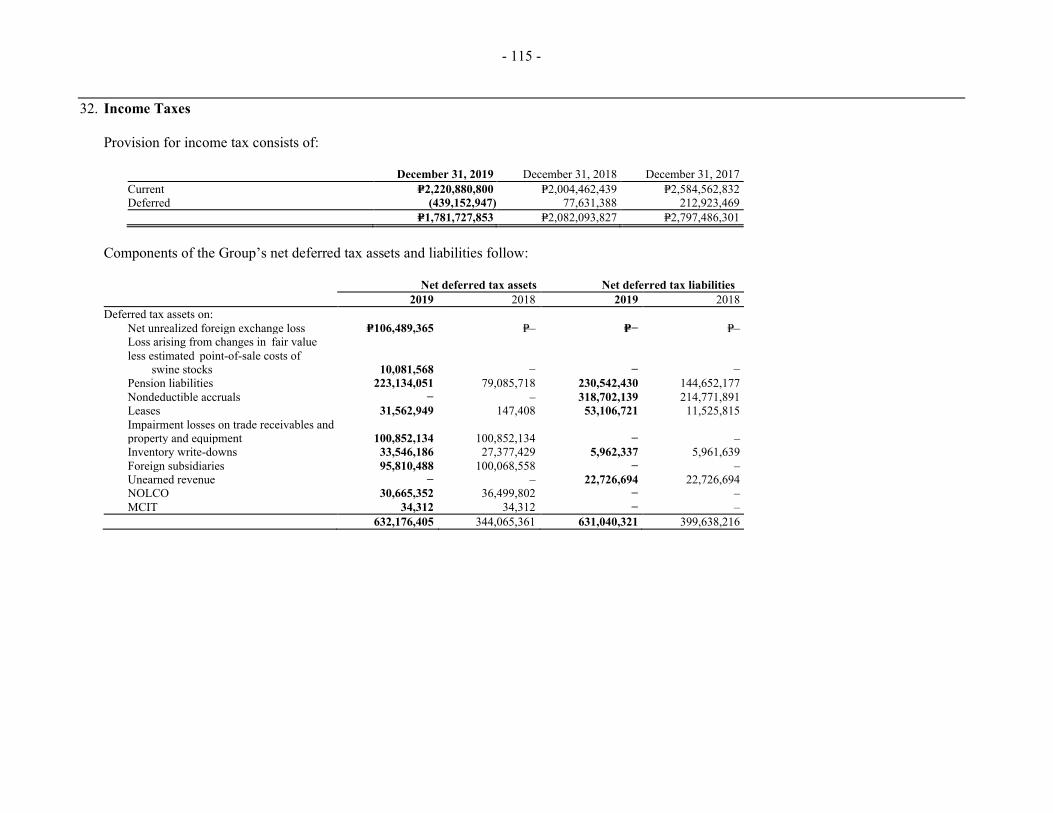
- 115 -
*SGVFSM000750*
32. Income Taxes
Provision for income tax consists of:
December 31, 2019 December 31, 2018 December 31, 2017 Current P=2,220,880,800 P=2,004,462,439 P=2,584,562,832 Deferred (439,152,947) 77,631,388 212,923,469
P=1,781,727,853 P=2,082,093,827 P=2,797,486,301
Components of the Group’s net deferred tax assets and liabilities follow:
Net deferred tax assets Net deferred tax liabilities 2019 2018 2019 2018
Deferred tax assets on: Net unrealized foreign exchange loss P=106,489,365 P=– P=− P=– Loss arising from changes in fair value less estimated point-of-sale costs of
swine stocks 10,081,568 − − − Pension liabilities 223,134,051 79,085,718 230,542,430 144,652,177 Nondeductible accruals − – 318,702,139 214,771,891 Leases 31,562,949 147,408 53,106,721 11,525,815 Impairment losses on trade receivables and property and equipment 100,852,134 100,852,134 − –Inventory write-downs 33,546,186 27,377,429 5,962,337 5,961,639Foreign subsidiaries 95,810,488 100,068,558 − –Unearned revenue − – 22,726,694 22,726,694NOLCO 30,665,352 36,499,802 − –MCIT 34,312 34,312 − –
632,176,405 344,065,361 631,040,321 399,638,216
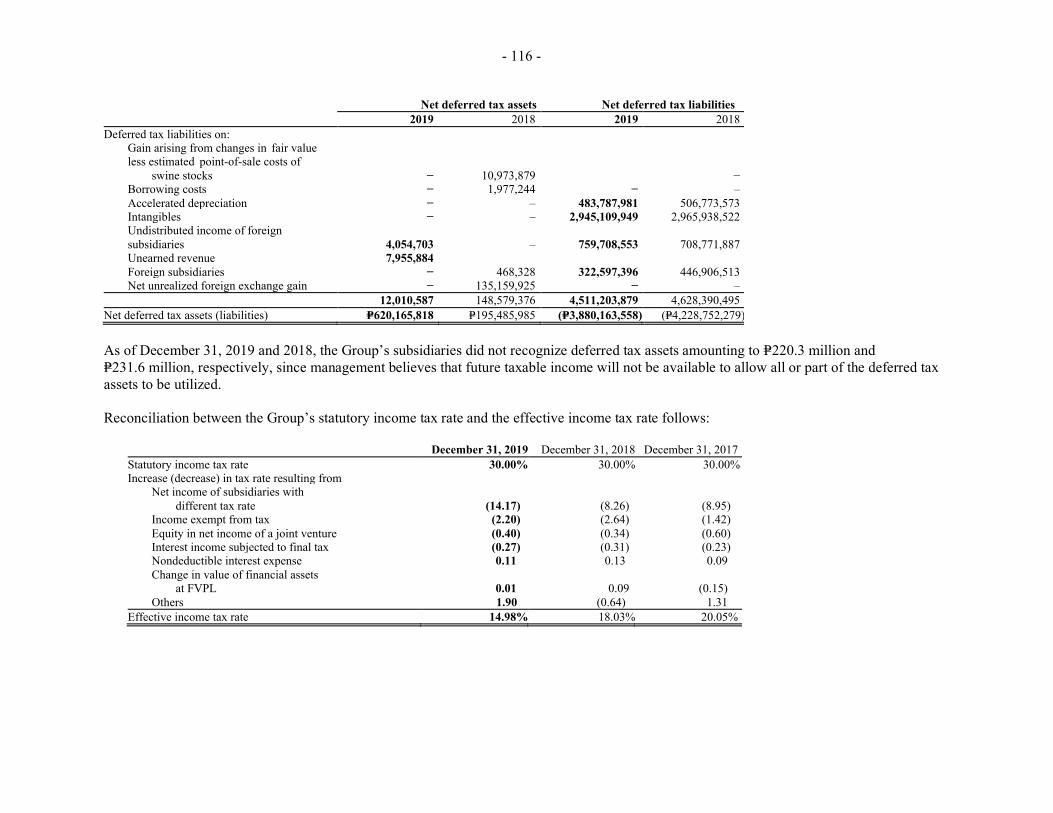
- 116 -
*SGVFSM000750*
Net deferred tax assets Net deferred tax liabilities 2019 2018 2019 2018
Deferred tax liabilities on: Gain arising from changes in fair value less estimated point-of-sale costs of
swine stocks − 10,973,879 − Borrowing costs − 1,977,244 − –Accelerated depreciation − – 483,787,981 506,773,573Intangibles − – 2,945,109,949 2,965,938,522 Undistributed income of foreign subsidiaries 4,054,703 – 759,708,553 708,771,887 Unearned revenue 7,955,884 Foreign subsidiaries − 468,328 322,597,396 446,906,513 Net unrealized foreign exchange gain − 135,159,925 − –
12,010,587 148,579,376 4,511,203,879 4,628,390,495 Net deferred tax assets (liabilities) P=620,165,818 P=195,485,985 (P=3,880,163,558) (P=4,228,752,279)
As of December 31, 2019 and 2018, the Group’s subsidiaries did not recognize deferred tax assets amounting to P=220.3 million and P=231.6 million, respectively, since management believes that future taxable income will not be available to allow all or part of the deferred tax assets to be utilized.
Reconciliation between the Group’s statutory income tax rate and the effective income tax rate follows:
December 31, 2019 December 31, 2018 December 31, 2017 Statutory income tax rate 30.00% 30.00% 30.00% Increase (decrease) in tax rate resulting from
Net income of subsidiaries with different tax rate (14.17) (8.26) (8.95)
Income exempt from tax (2.20) (2.64) (1.42) Equity in net income of a joint venture (0.40) (0.34) (0.60) Interest income subjected to final tax (0.27) (0.31) (0.23) Nondeductible interest expense 0.11 0.13 0.09 Change in value of financial assets
at FVPL 0.01 0.09 (0.15) Others 1.90 (0.64) 1.31
Effective income tax rate 14.98% 18.03% 20.05%

*SGVFSM000750*
- 117 -
Under Philippine tax laws, the Group is subject to income taxes, as well as other taxes (presented as ‘Taxes and licenses’ in the consolidated statements of income). Other taxes paid consist principally of documentary stamp taxes, real estate taxes and municipal taxes.
Income taxes include the minimum corporate income tax (MCIT), regular corporate income tax (RCIT), final tax paid at the rate of 20.0% for peso deposits and 7.5% for foreign currency deposits on gross interest income from bank deposits and short-term investments.
Current tax regulations provide that the RCIT rate shall be 30.0% and interest allowed as a deductible expense is reduced by 33.0% of interest income subjected to final tax beginning January 1, 2009.
Current tax regulations also provide for rules on the imposition of a 2.0% MCIT on the gross income as of the end of the taxable year beginning on the fourth taxable year immediately following the taxable year in which the Group commenced its business operations. Any excess MCIT over the RCIT can be carried forward on an annual basis and credited against the RCIT for the three immediately succeeding taxable years. In addition, NOLCO is allowed as a deduction from taxable income in the next three years from the date of inception.
Current tax regulations further provides that an OSD equivalent to 40.0% of gross income may be claimed as an alternative deduction in computing for the RCIT. For the years ended December 31, 2019, 2018 and 2017, the Group did not claim the OSD in lieu of the itemized deductions.
Entertainment, Amusement and Recreation (EAR) Expenses Current tax regulations define expenses to be classified as EAR expenses and set a limit for the amount that is deductible for tax purposes. EAR expenses are limited to 0.5% of net sales for sellers of goods or properties or 1.0% of net revenue for sellers of services. For sellers of both goods or properties and services, an apportionment formula is used in determining the ceiling on such expenses. The Group recognized EAR expenses (included under ‘General and administrative expenses’ in the consolidated statements of income) amounting to =P76.2 million, =P57.5 million and P=61.9 million for the years ended December 31, 2019, 2018 and 2017, respectively.
MCIT An MCIT of 2.0% on modified gross income is computed and compared with the RCIT. Any excess of the MCIT over RCIT is deferred and can be used as a tax credit against future income tax liability for the next three years.
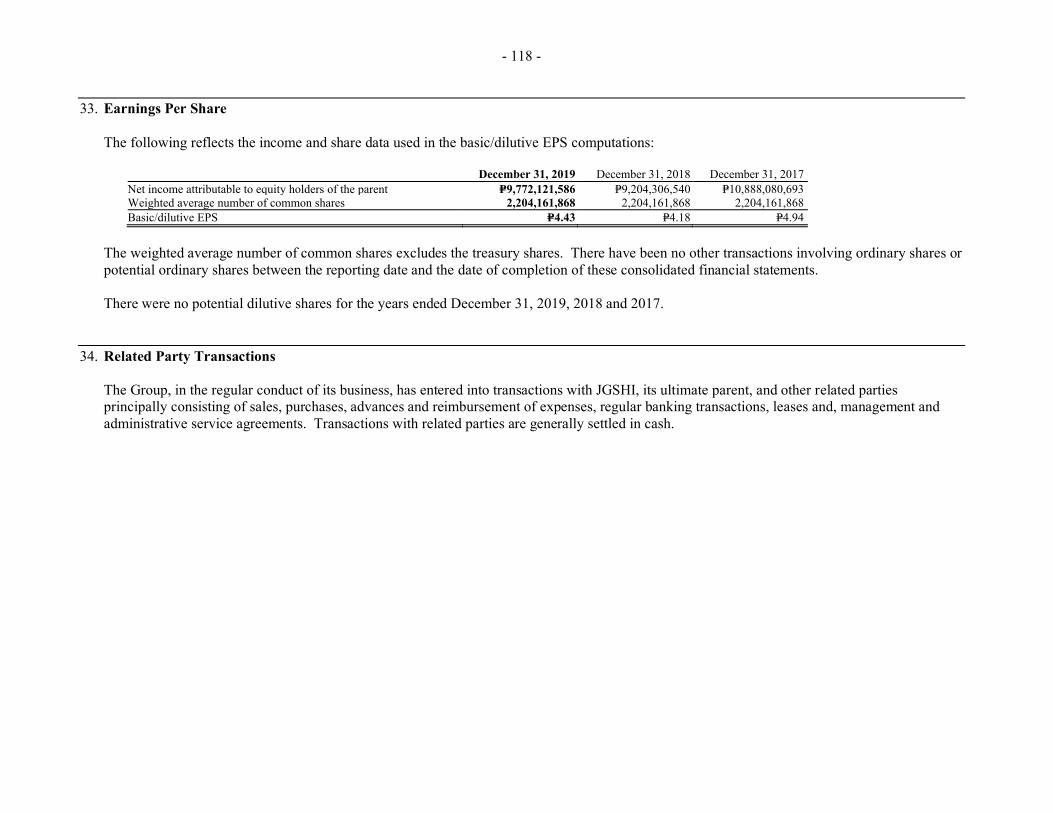
- 118 -
*SGVFSM000750*
33. Earnings Per Share
The following reflects the income and share data used in the basic/dilutive EPS computations:
December 31, 2019 December 31, 2018 December 31, 2017 Net income attributable to equity holders of the parent P=9,772,121,586 P=9,204,306,540 P=10,888,080,693 Weighted average number of common shares 2,204,161,868 2,204,161,868 2,204,161,868 Basic/dilutive EPS P=4.43 P=4.18 P=4.94
The weighted average number of common shares excludes the treasury shares. There have been no other transactions involving ordinary shares or potential ordinary shares between the reporting date and the date of completion of these consolidated financial statements.
There were no potential dilutive shares for the years ended December 31, 2019, 2018 and 2017.
34. Related Party Transactions
The Group, in the regular conduct of its business, has entered into transactions with JGSHI, its ultimate parent, and other related partiesprincipally consisting of sales, purchases, advances and reimbursement of expenses, regular banking transactions, leases and, management andadministrative service agreements. Transactions with related parties are generally settled in cash.

- 119 -
*SGVFSM000750*
Intercompany transactions with subsidiaries are eliminated in the accompanying consolidated financial statements. Details of related party transactions are as follows:
December 31, 2019
Related Party Category/Transaction Amount/ Volume
Cash and Cash Equivalents
(Note 7)
Trade Receivable
(Payable) - net (Notes 10
and 19)
Non-trade Receivable
(Payable) - net (Notes 10
and 19) Terms Conditions Ultimate Parent Company Advances P=− P=− P=− P=524,540,551 On demand;
non-interest bearing Unsecured;
no impairment Rental expense 202,207,091 − − −
Entity under common control Due from related parties Advances − − − 468,382,475 On demand;
non-interest bearing Unsecured;
no impairment Sales 1,269,262,009 − 215,065,891 − On demand;
non-interest bearing Unsecured;
no impairment Rental income 44,028,240 − − − Engineering services 9,557,254 − − − Contracted services 125,798,697 − − −
Due to related parties − − − (151,785,243) On demand Unsecured
Cash and cash equivalents Cash in bank 99,590,571 435,189,020 − − Interest-bearing at prevailing market rate;
due and demandable
Unsecured; no impairment
Money market placements (770,399,025) 1,445,603,986 − − Interest-bearing at prevailing market rate;
due from 7 to 71 days; with interest ranging from
1.5% to 2.8%
Unsecured; no impairment
Interest income 31,228,303 − 717,908 − Due from 7 to 71 days Unsecured; no impairment
Subsidiaries − Due from related parties Sales 890,027,531 − 40,210,396 − On demand; Unsecured;
Rental income 22,558,622 − − − non-interest bearing no impairment −
Due to related parties Purchases 6,756,740,989 − (97,294,910) − On demand Unsecured −
Joint Venture Purchases 1,034,585,102 − (64,894,000) − 1 to 30 days; Unsecured Sales 15,118,364 − 12,828,560 − non-interest bearing Rental income 1,427,517 − − −

- 120 -
*SGVFSM000750*
December 31, 2018
Related Party Category/Transaction Amount/ Volume
Cash and Cash Equivalents
(Note 7)
Trade Receivable
(Payable) - net (Notes 10
and 19)
Non-trade Receivable
(Payable) - net (Notes 10
and 19) Terms Conditions Ultimate Parent Company Advances P=− P=− P=− P=298,465,468 On demand;
non-interest bearing Unsecured;
no impairment Rental expense 191,681,600 − − −
Entity under common control Due from related parties Advances − − − 547,336,161 On demand;
non-interest bearing Unsecured;
no impairment Sales 1,120,358,698 − 103,086,078 −
On demand; non-interest bearing
Unsecured; no impairment
Rental income 37,327,677 − − − Engineering services 12,918,430 − − − Contracted services 116,083,484 − − −
Due to related parties − − − (164,624,582) On demand Unsecured
Cash and cash equivalents Cash in bank 145,020,946 335,598,449 − − Interest-bearing at prevailing market rate;
due and demandable
Unsecured; no impairment
Money market placements (1,832,041,774) 2,216,003,012 − − Interest-bearing at prevailing market rate;
due from 7 to 90 days; with interest ranging from
1.5% to 5.5%
Unsecured; no impairment
Interest income 75,013,989 − 3,616,138 − Due from 7 to 90 days Unsecured; no impairment
Subsidiaries − Due from related parties Sales 819,324,713 − 124,600,418 − On demand; Unsecured;
Rental income 20,934,624 − − − non-interest bearing no impairment −
Due to related parties Purchases 5,927,521,672 − (583,395,154) − On demand Unsecured −
Joint Venture Purchases 1,045,752,811 − (82,456,142) − 1 to 30 days; Unsecured Sales 47,496,986 − 7,316,815 − non-interest bearingRental income 917,280 − − −

- 121 -
*SGVFSM000750*
December 31, 2017
Related Party Category/Transaction Amount/ Volume
Cash and Cash Equivalents
(Note 7)
Trade Receivable
(Payable) - net (Notes 10
and 19)
Non-trade Receivable
(Payable) - net (Notes 10
and 19) Terms Conditions Ultimate Parent Company Advances P=− P=− P=− P=439,409,131 On demand;
non-interest bearing Unsecured;
no impairment Rental expense 177,081,208 − − −
Entity under common control Due from related parties Advances − − − 956,830,499 On demand;
non-interest bearing Unsecured;
no impairment Sales 995,485,756 − 77,348,339 − On demand;
non-interest bearing Unsecured;
no impairment Rental income 37,966,278 − − − Engineering services 17,420,461 − − − Contracted services 103,675,870 − − −
Due to related parties − − (106,452,798) On demand Unsecured
Cash and cash equivalents Cash in bank (205,215,801) 190,577,503 − − Interest-bearing at prevailing market rate;
due and demandable
Unsecured; no impairment
Money market placements 1,512,724,554 4,048,044,786 − − Interest-bearing at prevailing market rate;
due from 2 to 40 days; with interest ranging from
1.2% to 3.4%
Unsecured; no impairment
Interest income 30,148,933 3,401,689 Due from 2 to 40 days Unsecured; no impairment
Subsidiaries Due from related parties Sales 630,964,853 − 30,023,194 − On demand; Unsecured;
Rental income 17,126,605 − − − non-interest bearing no impairment
Due to related parties Purchases 5,102,874,725 − (339,334,405) − On demand Unsecured
Joint Venture Purchases 1,384,805,724 − (69,986,122) − 1 to 30 days; Unsecured Sales 158,109,871 − 187,398,912 − non-interest bearing

*SGVFSM000750*
- 122 -
The Group maintains savings and current accounts and time deposits with an entity under common control which is a local commercial bank. Cash and cash equivalents earn interest at the prevailing bank deposit rates.
As of December 31, 2019 and 2018, the Group has advances from stockholders amounting to =P192.7 million and P=247.2 million, respectively (see Note 19). These advances are non-interest bearing and payable on demand.
Transactions with the retirement plan The Parent Company entered into an agreement to lease the land of the retirement plan for a period of one (1) year, renewable annually. Rentals incurred amounted to =P25.3 million for the years ended December 31, 2019 and 2018. Terms are unsecured, noninterest-bearing and payable on demand.
Included in the Group’s retirement plan assets are special savings deposits with RBC. As of December 31, 2019 and 2018, special savings deposit with RBC amounting to P=19.5 million and =P445.2 million bears annual interest rates ranging from 0.3% to 3.0% and from 1.5% to 5.8%, respectively.
Compensation of Key Management Personnel The compensation of the Group’s key management personnel by benefit type follows:
December 31, 2019 December 31, 2018 December 31, 2017
Short-term employee benefits P=332,029,853 P=291,597,774 P=256,914,335 Post-employment benefits 123,379,622 81,989,490 70,445,960
P=455,409,475 P=373,587,264 P=327,360,295
There are no agreements between the Group and any of its directors and key officers providing for benefits upon termination of employment, except for such benefits to which they may be entitled under the Group’s pension plans.
Approval Requirements and Limits on the Amount and Extent of Related Party Transactions Material related party transactions (MRPT) refers to any related party transaction/s, either individually, or in aggregate over a twelve (12)-month period with the same related party, amounting to ten percent (10%) or higher of the Group’s total consolidated assets based on its latest audited financial statements.

- 123 -
*SGVFSM000750*
All individual MRPT’s shall be approved by at least two-thirds (2/3) vote of the BOD, with at least a majority of the Independent Directors voting to approve the MRPT. In case that a majority of the Independent Directors’ vote is not secured, the MRPT may be ratified by the vote of the stockholders representing at least two-thirds (2/3) of the outstanding capital stock.
Aggregate RPT transactions within a 12-month period that meets or breaches the materiality threshold shall require the same BOD approval mentioned above.
35. Registration with the BOI
Certain operations of the Parent Company are registered with the BOI as preferred pioneer and nonpioneer activities. As registered enterprises,these entities are subject to some requirements and are entitled to certain tax and non-tax incentives which are considered in the computation ofthe provision for income tax.
Sugar Millsite - TolongOn January 14, 2015, Sugar Millsite - Tolong was registered with the BOI as an expanding producer of raw sugar.
Under the terms of the registration and subject to certain requirements, Parent Company is entitled to the following fiscal and non-fiscalincentives: (a) ITH for a period of three (3) years from February 2015 (as an expanding producer raw sugar) or actual start of commercialoperations, whichever is earlier but in case earlier than the date of registration; (b) importation of capital equipment, spare parts and accessories atzero (0) duty from the date of effectivity of Executive Order (EO) No. 70 and its implementing rules and regulations for a period of five (5) yearsreckoned from the date its registration or until the expiration of EO No. 70 whichever is earlier; (c) additional deduction from taxable income offifty percent (50%) of the wages corresponding to the increment in number of direct labor for skilled and unskilled workers in the year ofavailment as against the previous year, if the project meets the prescribed ratio of capital equipment to the number of workers set by the Board.This may be availed of for the first five (5) years from date of registration but not simultaneously with ITH; (d) importation of consignedequipment for a period of ten (10) years from the date of registration, subject to posting of re-export bond; (e) tax credit equivalent to nationalinternal revenue taxes and duties paid on raw materials and supplies and semi-manufactured products used in producing its export product andforming part thereof for a period of ten (10) years from start of commercial operations; (f) exemption from wharfage dues, and any export tax,duty, impost and fee for a period of ten (10) years from the date of registration; (g) employment of foreign nationals;(h) simplifications of customs procedures for the importation of equipment, spare parts, raw materials and supplies.
The ITH entitlement has ended last February 14, 2018.
Sugar Millsite - Sonedco On June 29, 2018, Sugar Millsite - Sonedco was registered with the BOI as an expanding producer of refined sugar and its by-product (molasses).

*SGVFSM000750*
- 124 -
Under the terms of the registration and subject to certain requirements, Parent Company is entitled to the following fiscal and non-fiscal incentives: (a) ITH for a period of three (3) years from September 2018 (as an expanding producer of refined sugar and its by-product) or actual start of commercial operation, whichever is earlier but availment shall in no case be earlier than the date of registration; (b) importation of capital equipment, spare parts and accessories at zero (0) duty under EO No. 22 and its implementing rules; (c) exemption from taxes and duties on imported spare parts and consumable supplies for export producers with Customs Bonded Manufacturing Warehouse (CBMW) exporting at least seventy percent (70%) of production; (d) additional deduction for labor expense for a period of five (5) years from registration an amount equivalent to fifty percent (50%) of the wages corresponding to the increment in number of direct labor for skilled and unskilled workers in the year of availment as against the previous year, if the project meets the prescribed ratio of capital equipment to the number of workers set by the Board. This may be availed of for the first five (5) years from the date of registration but not simultaneously with ITH; (e) importation of consigned equipment for a period of ten (10) years from date of registration, subject to posting of re-export bond; (f) employment of foreign nationals; (g) simplification of customs procedures for the importation of equipment, spare parts, raw materials and supplies; (h) exemption from wharfage dues, and export tax duty, impost and fee for a period of ten (10) years from the data of registration; (i) access to CBMW subject to the BOC rules and regulations, and additional deduction from taxable income equivalent to 100% of expenses incurred in the development of necessary and major infrastructure facilities.
The said expansion started commercial operation on November 27, 2018.
Sugar Millsite - Balayan On September 8, 2017, Sugar Millsite - Balayan was registered with the BOI as an expanding producer of raw sugar and its by-product (molasses).
Under the terms of the registration and subject to certain requirements, Parent Company is entitled to the following fiscal and non-fiscal incentives: (a) ITH for a period of three (3) years from November 2018 (as an expanding producer of raw sugar and its by-product) or actual start of commercial operation, whichever is earlier but in no case be earlier than the data of registration; (b) importation of capital equipment, spare parts and accessories at zero (0) duty under EO No. 22 and its implementing rules. Only equipment directly needed and exclusively use in its operation shall be entitled to capital equipment incentives; (c) additional deduction from taxable income of fifty percent (50%) of the wages corresponding to the increment in number of direct labor for skilled and unskilled workers in the year of availment as against the previous year, if the project meets the prescribed ratio of capital equipment to the number of workers set by the Board. This may be availed of for the first five (5) years from the date of registration but not simultaneously with ITH; (d) importation of consigned equipment for a period of ten (10) years from date of registration, subject to posting of re-export bond; (e) employment of foreign nationals; and (f) simplification of customs procedures for the importation of equipment, spare parts, raw materials and supplies. The said expansion will start commercial operation early of 2019. Cogeneration On September 26, 2014, Cogeneration was registered with the BOI as a Renewable Energy (RE) developer of Bagasse-fired power plant.
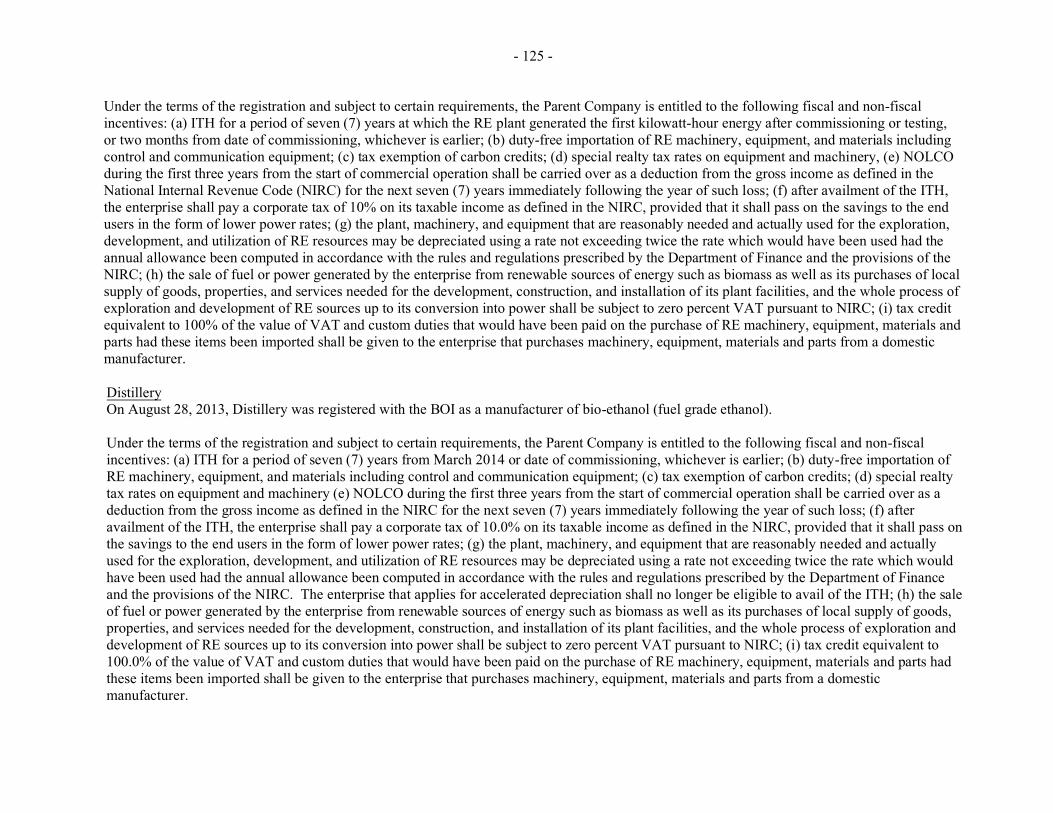
*SGVFSM000750*
- 125 -
Under the terms of the registration and subject to certain requirements, the Parent Company is entitled to the following fiscal and non-fiscal incentives: (a) ITH for a period of seven (7) years at which the RE plant generated the first kilowatt-hour energy after commissioning or testing, or two months from date of commissioning, whichever is earlier; (b) duty-free importation of RE machinery, equipment, and materials including control and communication equipment; (c) tax exemption of carbon credits; (d) special realty tax rates on equipment and machinery, (e) NOLCO during the first three years from the start of commercial operation shall be carried over as a deduction from the gross income as defined in the National Internal Revenue Code (NIRC) for the next seven (7) years immediately following the year of such loss; (f) after availment of the ITH, the enterprise shall pay a corporate tax of 10% on its taxable income as defined in the NIRC, provided that it shall pass on the savings to the end users in the form of lower power rates; (g) the plant, machinery, and equipment that are reasonably needed and actually used for the exploration, development, and utilization of RE resources may be depreciated using a rate not exceeding twice the rate which would have been used had the annual allowance been computed in accordance with the rules and regulations prescribed by the Department of Finance and the provisions of the NIRC; (h) the sale of fuel or power generated by the enterprise from renewable sources of energy such as biomass as well as its purchases of local supply of goods, properties, and services needed for the development, construction, and installation of its plant facilities, and the whole process of exploration and development of RE sources up to its conversion into power shall be subject to zero percent VAT pursuant to NIRC; (i) tax credit equivalent to 100% of the value of VAT and custom duties that would have been paid on the purchase of RE machinery, equipment, materials and parts had these items been imported shall be given to the enterprise that purchases machinery, equipment, materials and parts from a domestic manufacturer.
Distillery On August 28, 2013, Distillery was registered with the BOI as a manufacturer of bio-ethanol (fuel grade ethanol).
Under the terms of the registration and subject to certain requirements, the Parent Company is entitled to the following fiscal and non-fiscal incentives: (a) ITH for a period of seven (7) years from March 2014 or date of commissioning, whichever is earlier; (b) duty-free importation of RE machinery, equipment, and materials including control and communication equipment; (c) tax exemption of carbon credits; (d) special realty tax rates on equipment and machinery (e) NOLCO during the first three years from the start of commercial operation shall be carried over as a deduction from the gross income as defined in the NIRC for the next seven (7) years immediately following the year of such loss; (f) after availment of the ITH, the enterprise shall pay a corporate tax of 10.0% on its taxable income as defined in the NIRC, provided that it shall pass on the savings to the end users in the form of lower power rates; (g) the plant, machinery, and equipment that are reasonably needed and actually used for the exploration, development, and utilization of RE resources may be depreciated using a rate not exceeding twice the rate which would have been used had the annual allowance been computed in accordance with the rules and regulations prescribed by the Department of Finance and the provisions of the NIRC. The enterprise that applies for accelerated depreciation shall no longer be eligible to avail of the ITH; (h) the sale of fuel or power generated by the enterprise from renewable sources of energy such as biomass as well as its purchases of local supply of goods, properties, and services needed for the development, construction, and installation of its plant facilities, and the whole process of exploration and development of RE sources up to its conversion into power shall be subject to zero percent VAT pursuant to NIRC; (i) tax credit equivalent to 100.0% of the value of VAT and custom duties that would have been paid on the purchase of RE machinery, equipment, materials and parts had these items been imported shall be given to the enterprise that purchases machinery, equipment, materials and parts from a domestic manufacturer.

- 126 -
*SGVFSM000750*
Robina Farms (RF) - Poultry
Expanding producer of table eggs On July 23, 2018, RF - Poultry was registered as an expanding producer of table eggs for the new commercial layer houses, with a non-pioneer status.
RF - Poultry is eligible to the grant of the following incentives: (a) ITH for three (3) years from July 2018 or actual start of commercial operations, whichever is earlier, but shall not be earlier than the date of registration. Income qualified for ITH shall be limited to the income directly attributable to the eligible revenue generated from registered project; (b) exemption from taxes and duties on imported spare parts and consumable supplies with CBMW exporting at least seventy percent (70%) of production; (c) additional deduction for a period of five (5) years from registration an amount equivalent to fifty percent (50%) of wages corresponding to the increment in number of direct labor for skilled and unskilled workers in the year of availment as against the previous year; (d) importation of consigned equipment for a period of ten (10) years from date of registration subject to posting of re-export bond; (e) employment of foreign nationals; (f) simplification of customs procedures for the importation of equipment, spare parts, raw materials and supplies; (g) exemption from wharfage dues, and any export tax, duty, impost and fee for a period of ten years from date of registration; (h) access to CBMW subject to customs rules and regulations; and (i) additional deduction from taxable income equivalent to 100% of expenses incurred in the development of necessary and major infrastructure facilities.
Expanding producer of parent stock day-old chicks and producer of table eggs and its by-products On January 30, 2008, RF - Poultry was registered with the BOI as an expanding producer of parent stock day-old chicks. On June 4 of the same year, it was registered as a new producer of table eggs and its by-products. Both activities are on a nonpioneer status.
Under the terms of the registration and subject to certain requirements, RF - Poultry is entitled to the following fiscal and non-fiscal incentives: (a) ITH for a period of three (3) years from October 2008 (as an expanding producer of parent stock day-old chicks) and for a period of four (4)years from October 2009 (as a new producer of table eggs and its by-products); (b) additional deduction from taxable income on wages subject tocertain terms and conditions; (c) employment of foreign nationals; (d) tax credit equivalent to the national internal revenue taxes and duties paidon raw materials and supplies and semi-manufactured products used in producing its export product and forming part thereof for a period of ten(10) years from start of commercial operations; (e) simplification of customs procedures for the importation of equipment, spare parts, rawmaterials and supplies; (f) access to CBMW subject to Custom rules and regulations, provided firm exports at least 70.0% of production output;(g) exemption from wharfage dues, any export tax, duty, impost and fees for a period of ten (10) years from date of registration; (h) importationof consigned equipment for a period of ten (10) years from the date of registration, subject to the posting of re-export bond; (i) exemption fromtaxes and duties on imported spare parts and consumable supplies for export producers with CBMW exporting at least 70.0% of production; (j)tax and duty exemption on the imported breeding stocks and genetic materials within ten (10) years from the date of registration; and (k) taxcredit on tax and duty portion of domestic breeding stocks and genetic materials within ten (10) years from the date of registration.
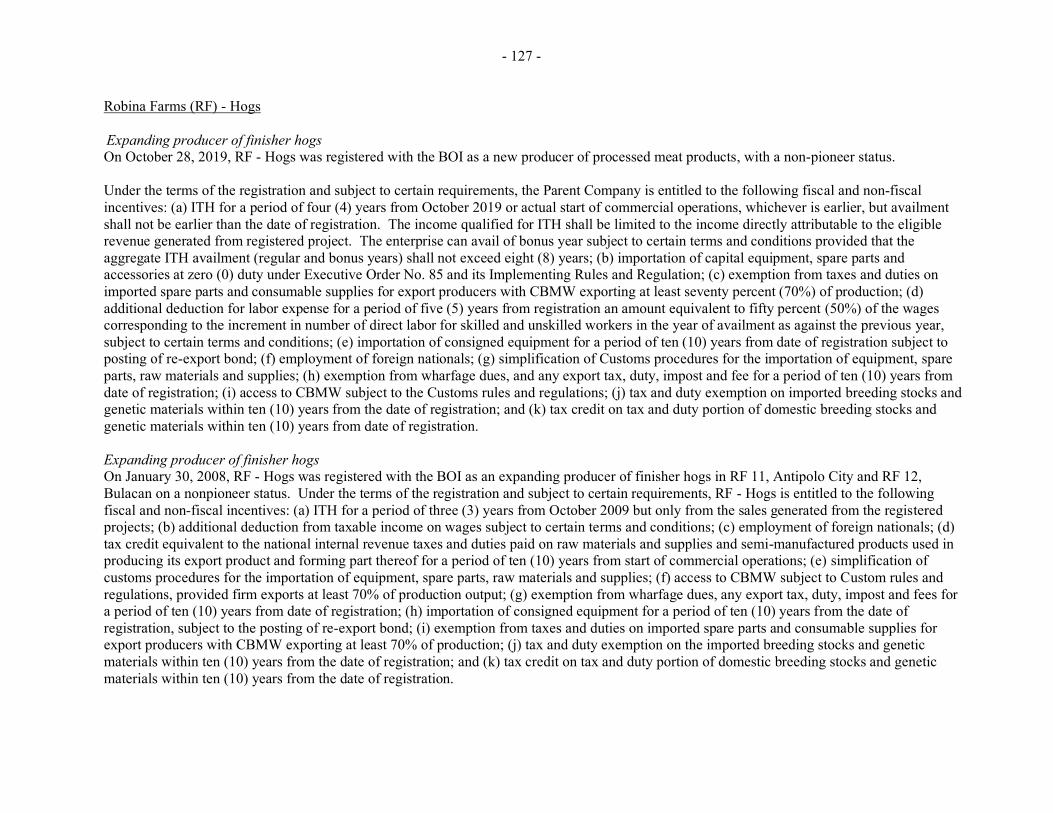
- 127 -
*SGVFSM000750*
Robina Farms (RF) - Hogs
Expanding producer of finisher hogs On October 28, 2019, RF - Hogs was registered with the BOI as a new producer of processed meat products, with a non-pioneer status.
Under the terms of the registration and subject to certain requirements, the Parent Company is entitled to the following fiscal and non-fiscal incentives: (a) ITH for a period of four (4) years from October 2019 or actual start of commercial operations, whichever is earlier, but availment shall not be earlier than the date of registration. The income qualified for ITH shall be limited to the income directly attributable to the eligible revenue generated from registered project. The enterprise can avail of bonus year subject to certain terms and conditions provided that the aggregate ITH availment (regular and bonus years) shall not exceed eight (8) years; (b) importation of capital equipment, spare parts and accessories at zero (0) duty under Executive Order No. 85 and its Implementing Rules and Regulation; (c) exemption from taxes and duties on imported spare parts and consumable supplies for export producers with CBMW exporting at least seventy percent (70%) of production; (d) additional deduction for labor expense for a period of five (5) years from registration an amount equivalent to fifty percent (50%) of the wages corresponding to the increment in number of direct labor for skilled and unskilled workers in the year of availment as against the previous year, subject to certain terms and conditions; (e) importation of consigned equipment for a period of ten (10) years from date of registration subject to posting of re-export bond; (f) employment of foreign nationals; (g) simplification of Customs procedures for the importation of equipment, spare parts, raw materials and supplies; (h) exemption from wharfage dues, and any export tax, duty, impost and fee for a period of ten (10) years from date of registration; (i) access to CBMW subject to the Customs rules and regulations; (j) tax and duty exemption on imported breeding stocks and genetic materials within ten (10) years from the date of registration; and (k) tax credit on tax and duty portion of domestic breeding stocks and genetic materials within ten (10) years from date of registration.
Expanding producer of finisher hogs On January 30, 2008, RF - Hogs was registered with the BOI as an expanding producer of finisher hogs in RF 11, Antipolo City and RF 12, Bulacan on a nonpioneer status. Under the terms of the registration and subject to certain requirements, RF - Hogs is entitled to the following fiscal and non-fiscal incentives: (a) ITH for a period of three (3) years from October 2009 but only from the sales generated from the registered projects; (b) additional deduction from taxable income on wages subject to certain terms and conditions; (c) employment of foreign nationals; (d) tax credit equivalent to the national internal revenue taxes and duties paid on raw materials and supplies and semi-manufactured products used in producing its export product and forming part thereof for a period of ten (10) years from start of commercial operations; (e) simplification of customs procedures for the importation of equipment, spare parts, raw materials and supplies; (f) access to CBMW subject to Custom rules and regulations, provided firm exports at least 70% of production output; (g) exemption from wharfage dues, any export tax, duty, impost and fees for a period of ten (10) years from date of registration; (h) importation of consigned equipment for a period of ten (10) years from the date of registration, subject to the posting of re-export bond; (i) exemption from taxes and duties on imported spare parts and consumable supplies for export producers with CBMW exporting at least 70% of production; (j) tax and duty exemption on the imported breeding stocks and genetic materials within ten (10) years from the date of registration; and (k) tax credit on tax and duty portion of domestic breeding stocks and genetic materials within ten (10) years from the date of registration.
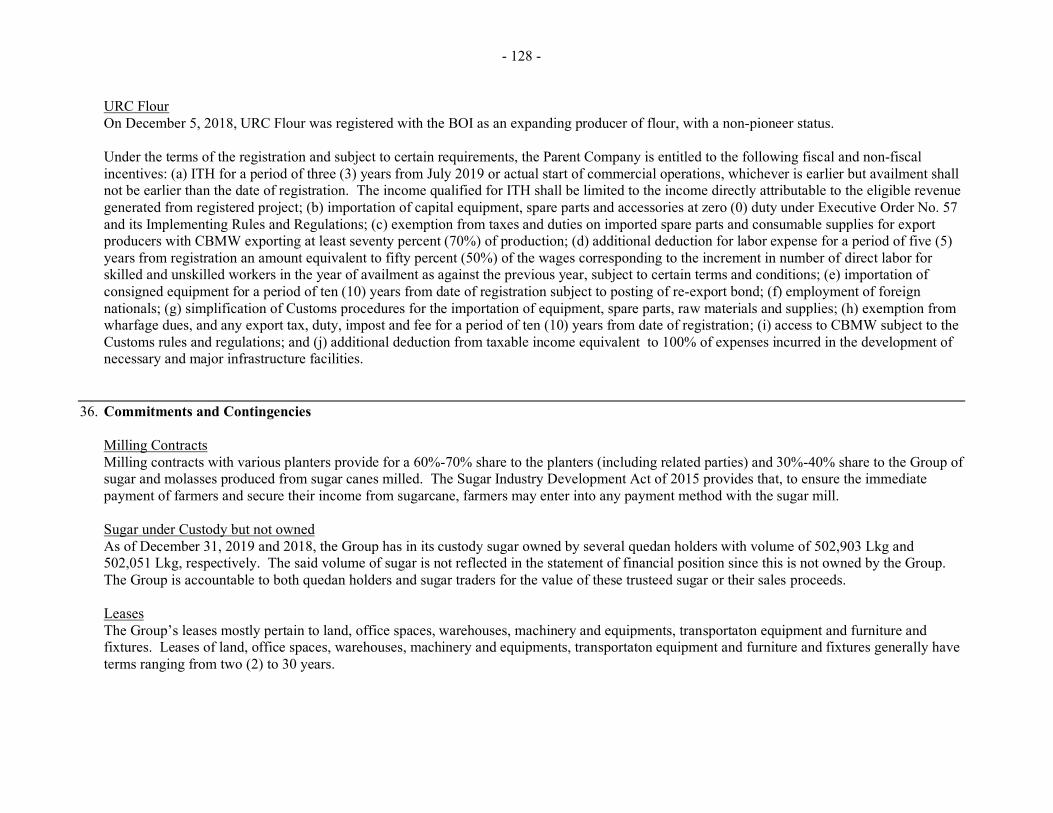
- 128 -
*SGVFSM000750*
URC Flour On December 5, 2018, URC Flour was registered with the BOI as an expanding producer of flour, with a non-pioneer status.
Under the terms of the registration and subject to certain requirements, the Parent Company is entitled to the following fiscal and non-fiscal incentives: (a) ITH for a period of three (3) years from July 2019 or actual start of commercial operations, whichever is earlier but availment shall not be earlier than the date of registration. The income qualified for ITH shall be limited to the income directly attributable to the eligible revenue generated from registered project; (b) importation of capital equipment, spare parts and accessories at zero (0) duty under Executive Order No. 57 and its Implementing Rules and Regulations; (c) exemption from taxes and duties on imported spare parts and consumable supplies for export producers with CBMW exporting at least seventy percent (70%) of production; (d) additional deduction for labor expense for a period of five (5) years from registration an amount equivalent to fifty percent (50%) of the wages corresponding to the increment in number of direct labor for skilled and unskilled workers in the year of availment as against the previous year, subject to certain terms and conditions; (e) importation of consigned equipment for a period of ten (10) years from date of registration subject to posting of re-export bond; (f) employment of foreign nationals; (g) simplification of Customs procedures for the importation of equipment, spare parts, raw materials and supplies; (h) exemption from wharfage dues, and any export tax, duty, impost and fee for a period of ten (10) years from date of registration; (i) access to CBMW subject to the Customs rules and regulations; and (j) additional deduction from taxable income equivalent to 100% of expenses incurred in the development of necessary and major infrastructure facilities.
36. Commitments and Contingencies
Milling ContractsMilling contracts with various planters provide for a 60%-70% share to the planters (including related parties) and 30%-40% share to the Group ofsugar and molasses produced from sugar canes milled. The Sugar Industry Development Act of 2015 provides that, to ensure the immediatepayment of farmers and secure their income from sugarcane, farmers may enter into any payment method with the sugar mill.
Sugar under Custody but not ownedAs of December 31, 2019 and 2018, the Group has in its custody sugar owned by several quedan holders with volume of 502,903 Lkg and502,051 Lkg, respectively. The said volume of sugar is not reflected in the statement of financial position since this is not owned by the Group.The Group is accountable to both quedan holders and sugar traders for the value of these trusteed sugar or their sales proceeds.
LeasesThe Group’s leases mostly pertain to land, office spaces, warehouses, machinery and equipments, transportaton equipment and furniture andfixtures. Leases of land, office spaces, warehouses, machinery and equipments, transportaton equipment and furniture and fixtures generally haveterms ranging from two (2) to 30 years.
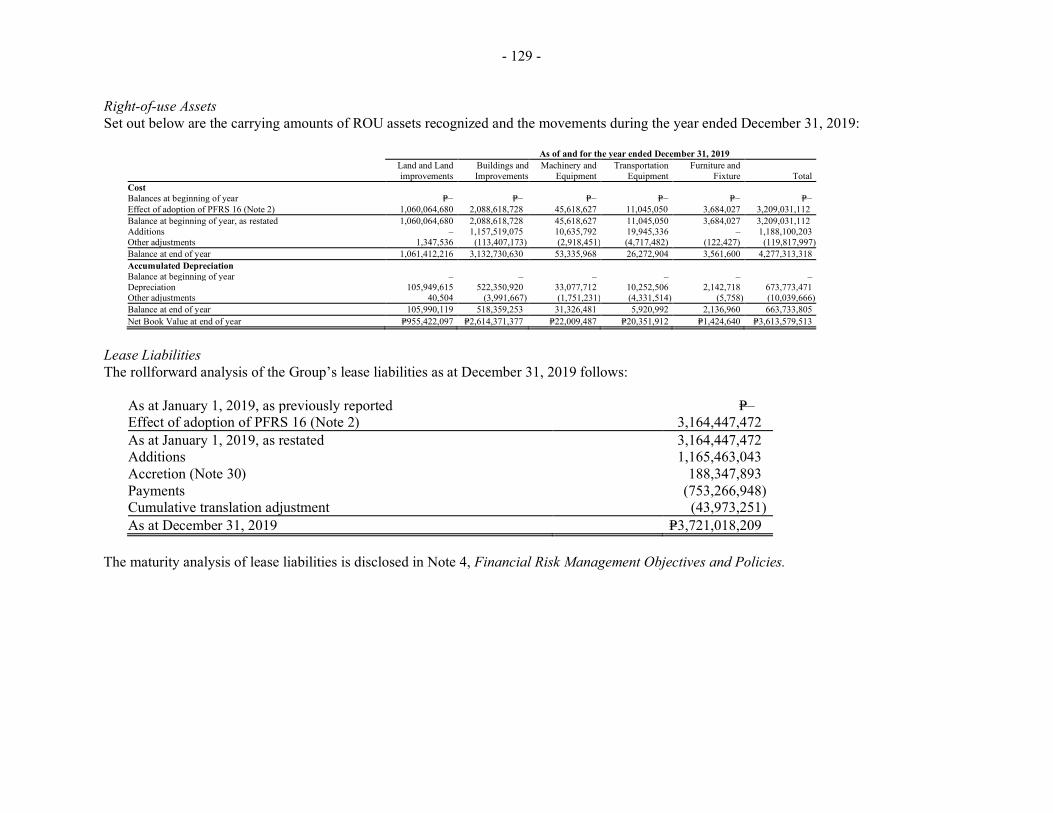
- 129 -
*SGVFSM000750*
Right-of-use Assets Set out below are the carrying amounts of ROU assets recognized and the movements during the year ended December 31, 2019:
As of and for the year ended December 31, 2019 Land and Land improvements
Buildings and Improvements
Machinery and Equipment
Transportation Equipment
Furniture and Fixture Total
Cost Balances at beginning of year P=− P=− P=− P=− P=− P=− Effect of adoption of PFRS 16 (Note 2) 1,060,064,680 2,088,618,728 45,618,627 11,045,050 3,684,027 3,209,031,112 Balance at beginning of year, as restated 1,060,064,680 2,088,618,728 45,618,627 11,045,050 3,684,027 3,209,031,112 Additions – 1,157,519,075 10,635,792 19,945,336 – 1,188,100,203Other adjustments 1,347,536 (113,407,173) (2,918,451) (4,717,482) (122,427) (119,817,997)Balance at end of year 1,061,412,216 3,132,730,630 53,335,968 26,272,904 3,561,600 4,277,313,318 Accumulated Depreciation Balance at beginning of year – – – – – – Depreciation 105,949,615 522,350,920 33,077,712 10,252,506 2,142,718 673,773,471 Other adjustments 40,504 (3,991,667) (1,751,231) (4,331,514) (5,758) (10,039,666) Balance at end of year 105,990,119 518,359,253 31,326,481 5,920,992 2,136,960 663,733,805 Net Book Value at end of year P=955,422,097 P=2,614,371,377 P=22,009,487 P=20,351,912 P=1,424,640 P=3,613,579,513
Lease Liabilities The rollforward analysis of the Group’s lease liabilities as at December 31, 2019 follows:
As at January 1, 2019, as previously reported P=– Effect of adoption of PFRS 16 (Note 2) 3,164,447,472 As at January 1, 2019, as restated 3,164,447,472 Additions 1,165,463,043 Accretion (Note 30) 188,347,893 Payments (753,266,948) Cumulative translation adjustment (43,973,251) As at December 31, 2019 P=3,721,018,209
The maturity analysis of lease liabilities is disclosed in Note 4, Financial Risk Management Objectives and Policies.

- 130 -
*SGVFSM000750*
Summarized below are the amounts recognized in the 2019 consolidated statement of comprehensive income in relation to the Group’s leases:
Cost of Sales and Services Cost of services - depreciation of ROU assets P=255,075,037 Rent expense - short term leases 205,284,893
460,359,930 Operating Expenses Selling and distribution costs
Depreciation of ROU assets P=301,202,808 Rent expense - short term leases 452,763,162
General and administrative expenses Depreciation of ROU assets 117,495,626 Rent expense - short term leases 229,404,741
1,100,866,337 Other Income (Losses) Finance cost and other charges - accretion of lease liabilities P=188,347,893 Rent income 117,385,869
Operating Lease Commitments - Group as a Lessor The Group has entered into (1) one-year renewable, noncancellable leases with various related parties covering certain land and buildings where office spaces are located. Future minimum rentals receivable under noncancellable operating leases amounted to =P72.5 million =P73.3 million and P=63.7 million for the years ended December 31, 2019, 2018 and 2017, respectively.
Operating Lease Commitments - Group as a Lessee (Prior to adoption of PFRS 16) The Group leases land where certain of its facilities are located. The operating lease agreements are for periods ranging from one to twenty years from the date of the contracts and are renewable under certain terms and conditions. The Group’s rentals incurred on these leases (included under ‘Selling and distribution costs’ and ‘General and administrative expenses’ in the consolidated statements of income) amounted to =P682.2 million, P=937.6 million and P=976.1 million for the years ended December 31, 2019, 2018 and 2017, respectively.
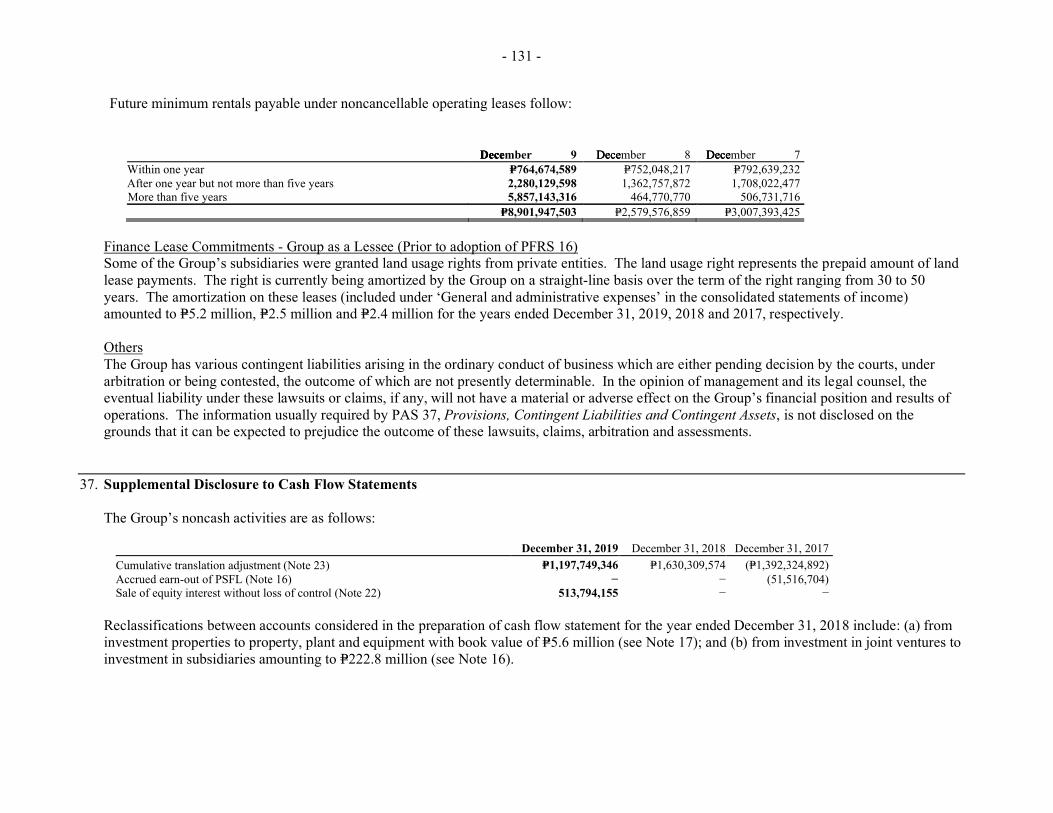
- 131 -
*SGVFSM000750*
P=8,901,947,503 P=2,579,576,859 P=3,007,393,425
Finance Lease Commitments - Group as a Lessee (Prior to adoption of PFRS 16) Some of the Group’s subsidiaries were granted land usage rights from private entities. The land usage right represents the prepaid amount of land lease payments. The right is currently being amortized by the Group on a straight-line basis over the term of the right ranging from 30 to 50 years. The amortization on these leases (included under ‘General and administrative expenses’ in the consolidated statements of income) amounted to P=5.2 million, P=2.5 million and P=2.4 million for the years ended December 31, 2019, 2018 and 2017, respectively.
Others The Group has various contingent liabilities arising in the ordinary conduct of business which are either pending decision by the courts, under arbitration or being contested, the outcome of which are not presently determinable. In the opinion of management and its legal counsel, the eventual liability under these lawsuits or claims, if any, will not have a material or adverse effect on the Group’s financial position and results of operations. The information usually required by PAS 37, Provisions, Contingent Liabilities and Contingent Assets, is not disclosed on the grounds that it can be expected to prejudice the outcome of these lawsuits, claims, arbitration and assessments.
37. Supplemental Disclosure to Cash Flow Statements
The Group’s noncash activities are as follows:
December 31, 2019 December 31, 2018 December 31, 2017 Cumulative translation adjustment (Note 23) P=1,197,749,346 P=1,630,309,574 (P=1,392,324,892) Accrued earn-out of PSFL (Note 16) − − (51,516,704) Sale of equity interest without loss of control (Note 22) 513,794,155 − −
Reclassifications between accounts considered in the preparation of cash flow statement for the year ended December 31, 2018 include: (a) from investment properties to property, plant and equipment with book value of P=5.6 million (see Note 17); and (b) from investment in joint ventures to investment in subsidiaries amounting to =P222.8 million (see Note 16).
DecemberDeceDece 9 DecemberDeceDece 8 eceDDecemberDece 7 =P764,674,589 P=752,048,217 P=792,639,232 2,280,129,598 1,362,757,872 1,708,022,477
Within one year After one year but not more than five years More than five years 5,857,143,316 464,770,770 506,731,716
Future minimum rentals payable under noncancellable operating leases follow:

- 132 -
*SGVFSM000750*
December 31, 2019 P=3,848,485,273 P=30,386,077,608 P=34,234,562,881
38. Approval for the Release of the Financial Statements
The accompanying consolidated financial statements of the Group were authorized for issue by the AC and the BOD on April 3, 2020.
39. Events after the Reporting Date
In a move to contain the COVID-19 outbreak, on March 13, 2020, the Office of the President of the Philippines issued a Memorandum directiveto impose stringent social distancing measures in the National Capital Region effective March 15, 2020. On March 16, 2020, PresidentialProclamation No. 929 was issued, declaring a State of Calamity throughout the Philippines for a period of six (6) months and imposed anenhanced community quarantine throughout the island of Luzon until April 12, 2020, unless earlier lifted or extended. These measures havecaused disruptions to businesses and economic activities, and its impact on businesses continue to evolve. The Group remains vigilant on thepotential impact of the outbreak on its supply chain and on consumer demand. Given the fluidity of the situation, the Group has yet to fullyascertain the risk and impact of the COVID-19 pandemic. The Group’s selling operations remain open and it currently has sufficient inventorythat enables it to operate its business at normal levels across the different geographic locations where it has facilities, in both domestic andinternational markets.
The Group considers the events surrounding the outbreak as non-adjusting subsequent events, which do not impact its financial position andperformance as of and for the year ended December 31, 2019. However, the outbreak could have a material impact on its 2020 financial resultsand even periods thereafter. Considering the evolving nature of this outbreak, the Group cannot determine at this time the impact to its financialposition, performance and cash flows. The Group will continue to monitor the situation. The Group continues to abide by and comply with allthe rules and regulations issued by the government in relation to the COVID-19 pandemic. To mitigate the impact of COVID-19 on itsoperations, the Group has implemented a robust business continuity plan and has started to execute programs to ensure the safety and well-beingof its employees such as flexible schedules, proper and frequent sanitation of plant premises, temperature screenings and work from homearrangements.
Short-term debts Long-term debts Total liabilities from
financing activities P=2,461,385,106 P=31,457,123,882 P=33,918,508,988
2,100,000,000 −(771,313,583) −
58,413,750 (1,171,744,302)
January 1, 2019 Cash flows from availment Cash flows from settlement Foreign exchange movement/CTA Others − 100,698,028
2,100,000,000(771,313,583)
(1,113,330,552)100,698,028
The table below provides for the changes in liabilities arising from financing activities: