ANNUAL REPORT 2019 - New World Development
289
(Stock Code: 0017) ANNUAL REPORT 2019
-
Upload
khangminh22 -
Category
Documents
-
view
1 -
download
0
Transcript of ANNUAL REPORT 2019 - New World Development
30/F, New World Tower, 18 Queen’s Road Central, Hong KongTel: (852) 2523 1056 Fax: (852) 2810 4673www.nwd.com.hk
New World Development Company Limited takes every practicable measure to conserve resources and minimise waste.
(Stock Code: 0017)
ANNUAL REPORT 2019
diecut
CO
NTEM
PORA
RY
HERITA
GE
CRA
FTSMA
NSH
IP
BESPOK
E
IMA
GIN
ATIO
N
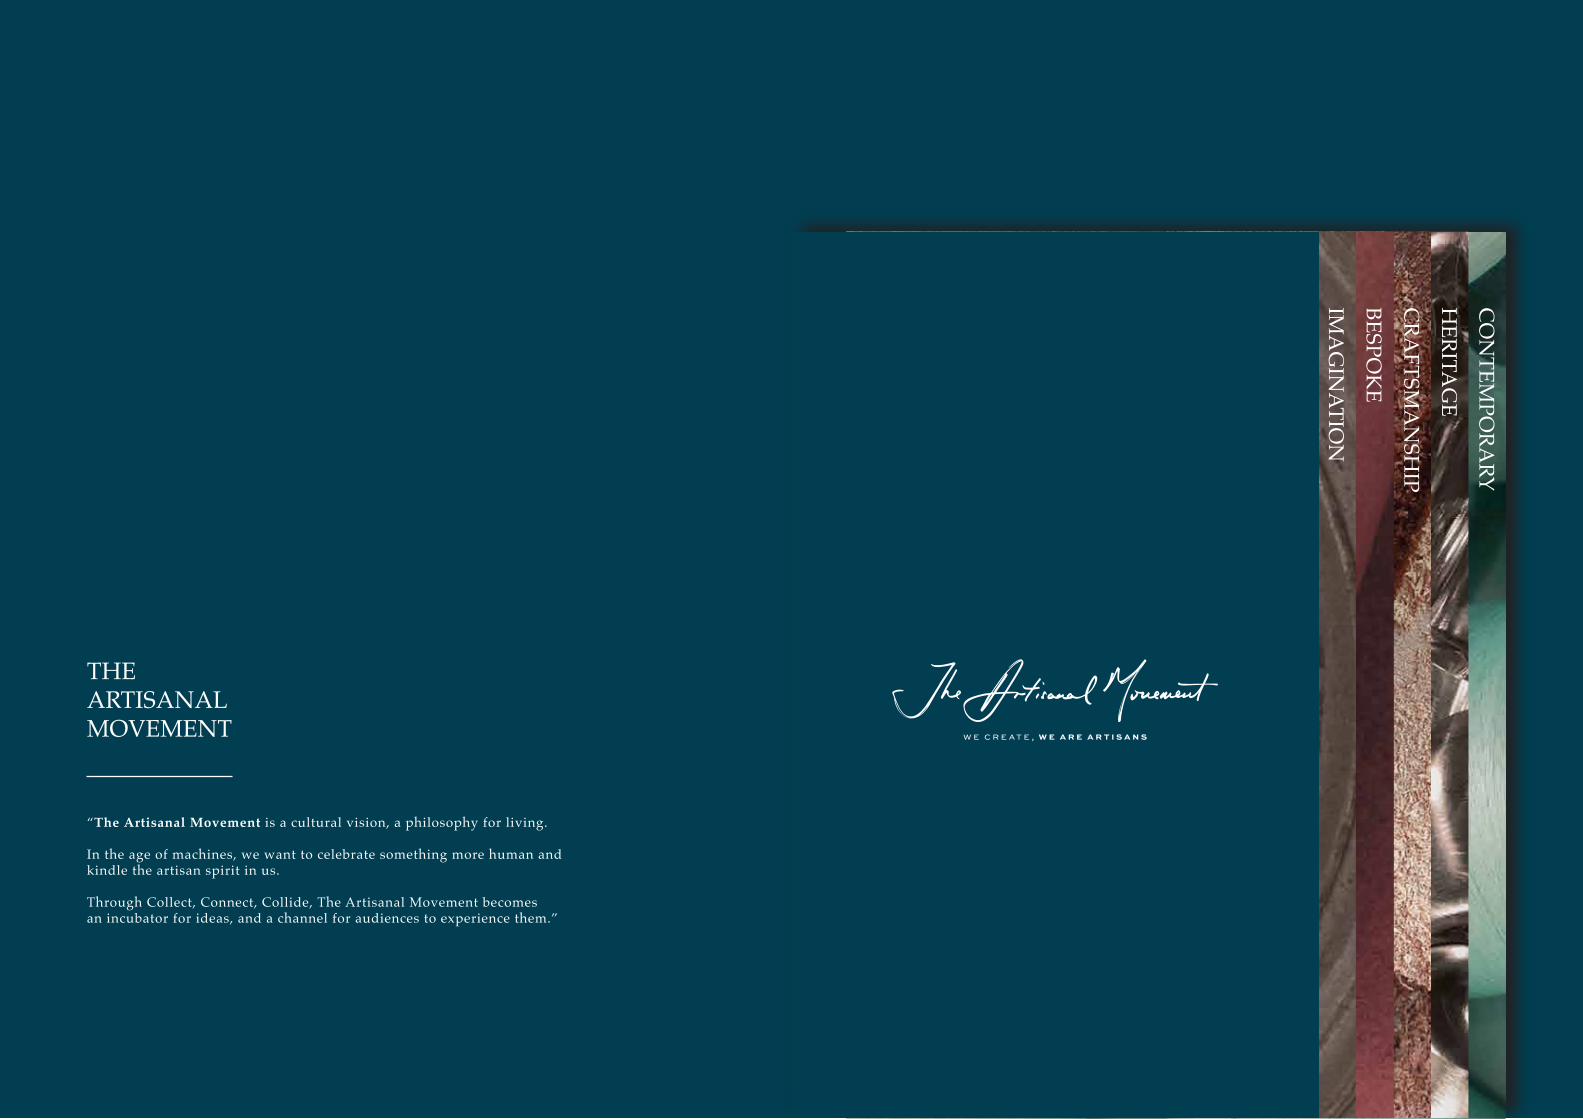
THE ARTISANAL MOVEMENT
『The Artisanal Movement 是一種生活信念,承載著我們對於文化的希冀。
當時代越趨電子化,人文的細膩、情感與溫度更顯珍貴。
透過Collect.Connect.Collide,我們孵化世界各地的美好想法,讓大家在感受之間,喚醒一直都在的匠心。』
“The Artisanal Movement is a cultural vision, a philosophy for living.
In the age of machines, we want to celebrate something more human and kindle the artisan spirit in us.
Through Collect, Connect, Collide, The Artisanal Movement becomes an incubator for ideas, and a channel for audiences to experience them.”
THE ARTISANAL MOVEMENT

IMA
GIN
ATIO
N
Aspiration. Boundless. Cultivation.

VICTORIADOCKSIDE
Aspiration. Boundless. Cultivation.

BESPOK
E
Encounter. Indulgence. Peculiar.

K11 ATELIER
Encounter. Indulgence. Peculiar.

CRA
FTSMA
NSH
IP
Artistry. Creation. Humanised.

ROSEWOOD HONG KONG
Artistry. Creation. Humanised.

HERITA
GE
Aesthetics. Culture. Legacy.

K11 ARTUS
Aesthetics. Culture. Legacy.

CO
NTEM
PORA
RY
Innovation. Provocative. Visionary.

K11 MUSEA
Innovation. Provocative. Visionary.
Contents
DisclaimerThe photographs, images, drawings or sketches shown in this annual report represent an artist’s impression of the development concerned only. They are not drawn to scale and/or may have been edited and processed with computerised imaging techniques. Prospective purchasers should make reference to the sales brochure for details of the development. The vendor also advises prospective purchasers to conduct an on-site visit for a better understanding of the development site, its surrounding environment and the public facilities nearby.
All parties engaged in the production of this annual report have made their best efforts to ensure the highest accuracy of all information, photographs, images, drawings or sketches herein contained as to the printing of this annual report and to minimise the existence of clerical errors. Readers are invited to make enquires to sales personnel or consult relevant professionals for verification of doubts or particulars of specific items.
If there is any inconsistency or conflict between the English and the Chinese versions, the English version shall prevail.
2 Corporate Structure
3 Financial Highlights
4 Chairman’s Statement
6 Executive Vice-chairman’s Report
24 Major Property Projects in Hong Kong
26 Major Property Projects in Mainland China
28 Directors’ Profile
37 Senior Management Profile
38 Corporate Sustainability
66 Corporate Governance Report
82 Investor Relations
84 Corporate Information
85 Report of the Directors
109 Management Discussion and Analysis
118 Independent Auditor’s Report
124 Consolidated Income Statement
125 Consolidated Statement of Comprehensive Income
126 Consolidated Statement of Financial Position
128 Consolidated Statement of Changes in Equity
130 Consolidated Statement of Cash Flows
132 Notes to the Financial Statements
240 Five-year Financial Summary
242 Risk Factors
261 Principal Projects Summary
276 Glossary of Terms
New
Wor
ld D
evel
opm
ent
Com
pany
Lim
ited
Ann
ual R
epor
t 20
19
2
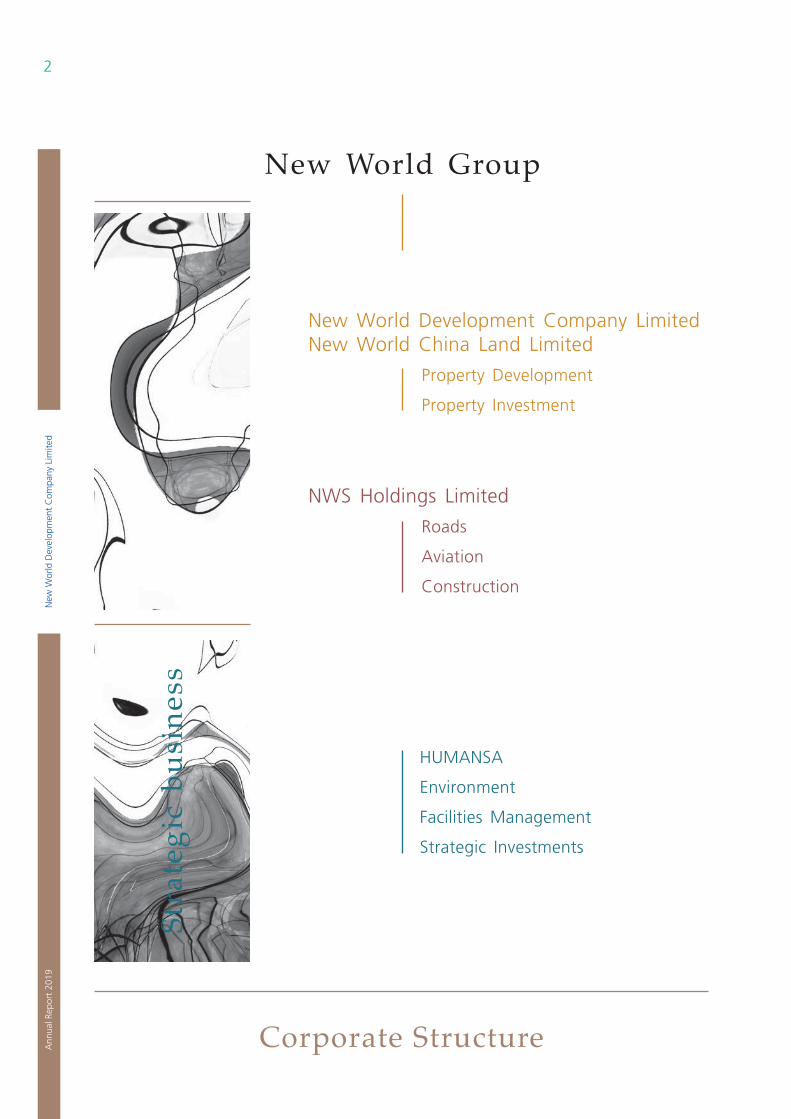
Corporate Structure
HUMANSA
Environment
Facilities Management
Strategic Investments
New World GroupC
ore
busi
ness
Stra
tegi
c bu
sine
ss
New World Development Company Limited New World China Land Limited
Property Development
Property Investment
NWS Holdings Limited
Roads
Aviation
Construction
3
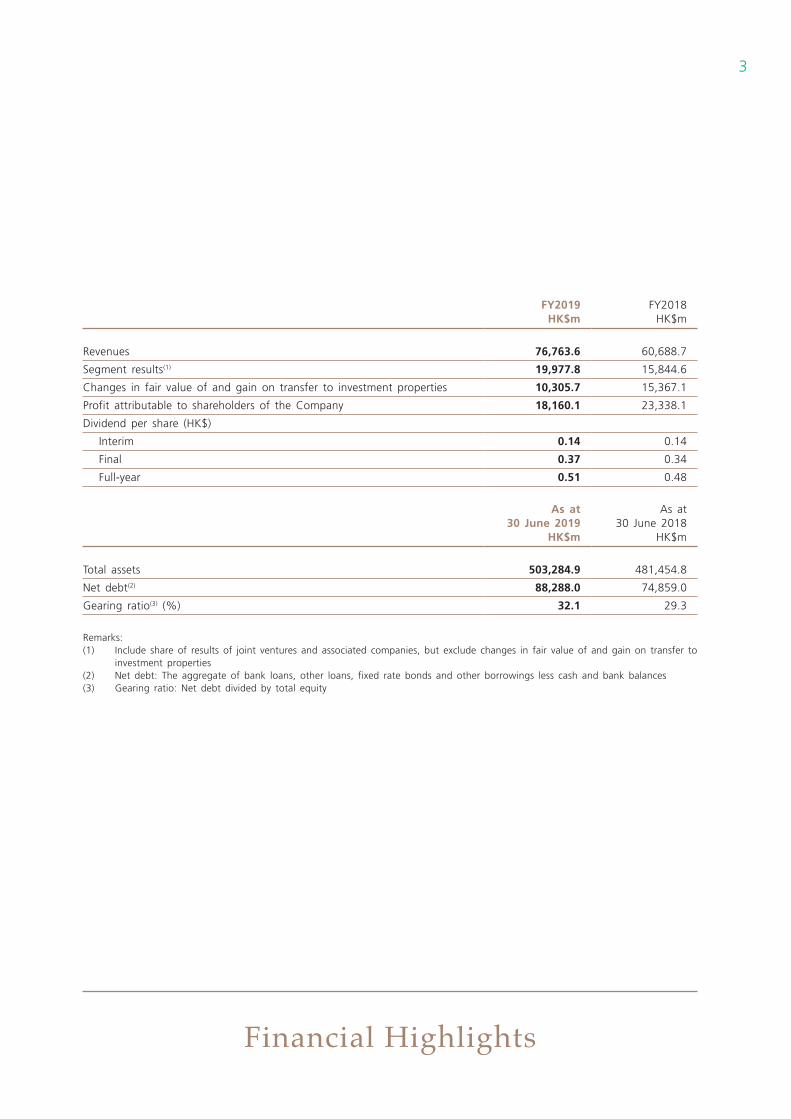
Financial Highlights
FY2019 FY2018HK$m HK$m
Revenues 76,763.6 60,688.7
Segment results(1) 19,977.8 15,844.6
Changes in fair value of and gain on transfer to investment properties 10,305.7 15,367.1
Profit attributable to shareholders of the Company 18,160.1 23,338.1
Dividend per share (HK$)
Interim 0.14 0.14
Final 0.37 0.34
Full-year 0.51 0.48
As at 30 June 2019
As at 30 June 2018
HK$m HK$m
Total assets 503,284.9 481,454.8
Net debt(2) 88,288.0 74,859.0
Gearing ratio(3) (%) 32.1 29.3
Remarks:(1) Include share of results of joint ventures and associated companies, but exclude changes in fair value of and gain on transfer to
investment properties(2) Net debt: The aggregate of bank loans, other loans, fixed rate bonds and other borrowings less cash and bank balances(3) Gearing ratio: Net debt divided by total equity
New
Wor
ld D
evel
opm
ent
Com
pany
Lim
ited
Ann
ual R
epor
t 20
19
4
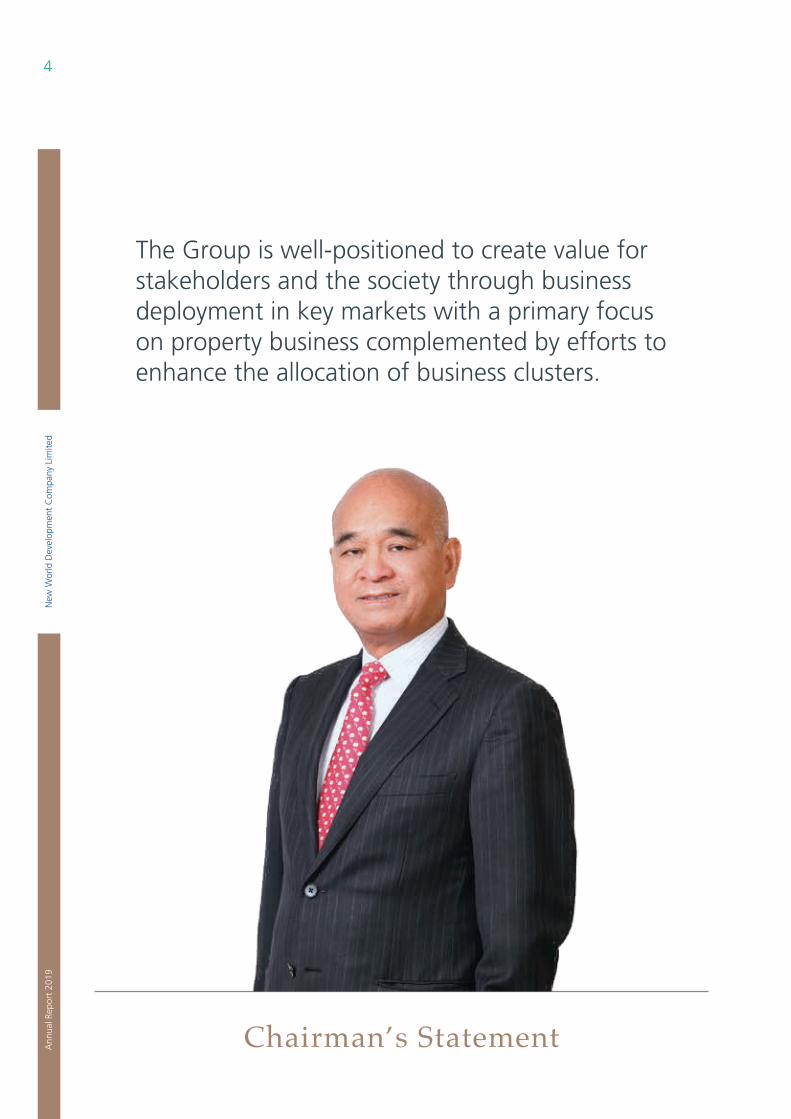
Chairman’s Statement
The Group is well-positioned to create value for stakeholders and the society through business deployment in key markets with a primary focus on property business complemented by efforts to enhance the allocation of business clusters.
5Chairman’s Statement
TO OUR SHAREHOLDERS
Fickle international politics looks perplexing at times. Uncertainties and contingencies give rise to downside pressure, rocking the foundations for some sectors and putting entrepreneurs to daunting tests, as it all comes down to whether they have the perseverance, judgement, acumen, awareness and broad-mindedness to ride the tide and succeed against all odds.
A corporate should be constantly engaged in proactive thinking, looking not just for short-term solutions but, more importantly, also for comprehensive, versatile strategies based on its core corporate values and facilitated through judicious observation, vision for the long-term and utmost prudence. Given our formidable strengths built over the years and the benefit of our innovative thinking, there is no doubt that together we can overcome the present challenges and turn crises into opportunities.
With solid foundations in Greater China, New World Group seeks to grow with the society and actively support the development of our country and Hong Kong. As we prepare to celebrate our 50th anniversary in 2020, let us cherish all successes, great and small, that we have achieved over the years and pledge for ongoing development and exploration of new frontiers on the back of our proven track records.
The driving force behind the ever-forward venture of New World Group is underpinned by a humble approach and persistence in a human-centric mindset. Through vigorous efforts in the innovation of its products and services, the Group is dedicated to contribute to the building of a sustainable culture of living compatible with the nature of our communities.
The Belt and Road Initiative and the development of the Guangdong-Hong Kong-Macao Greater Bay Area advocated by our country will present Hong Kong and the city clusters with enormous opportunities for development. We have full confidence in the economic prospects of our country and Hong Kong. The Group is well-positioned to create value for stakeholders and the society through business deployment in key markets with a primary focus on property business complemented by efforts to enhance the allocation of business clusters.
Dr. Cheng Kar-Shun, HenryChairmanHong Kong, 25 September 2019
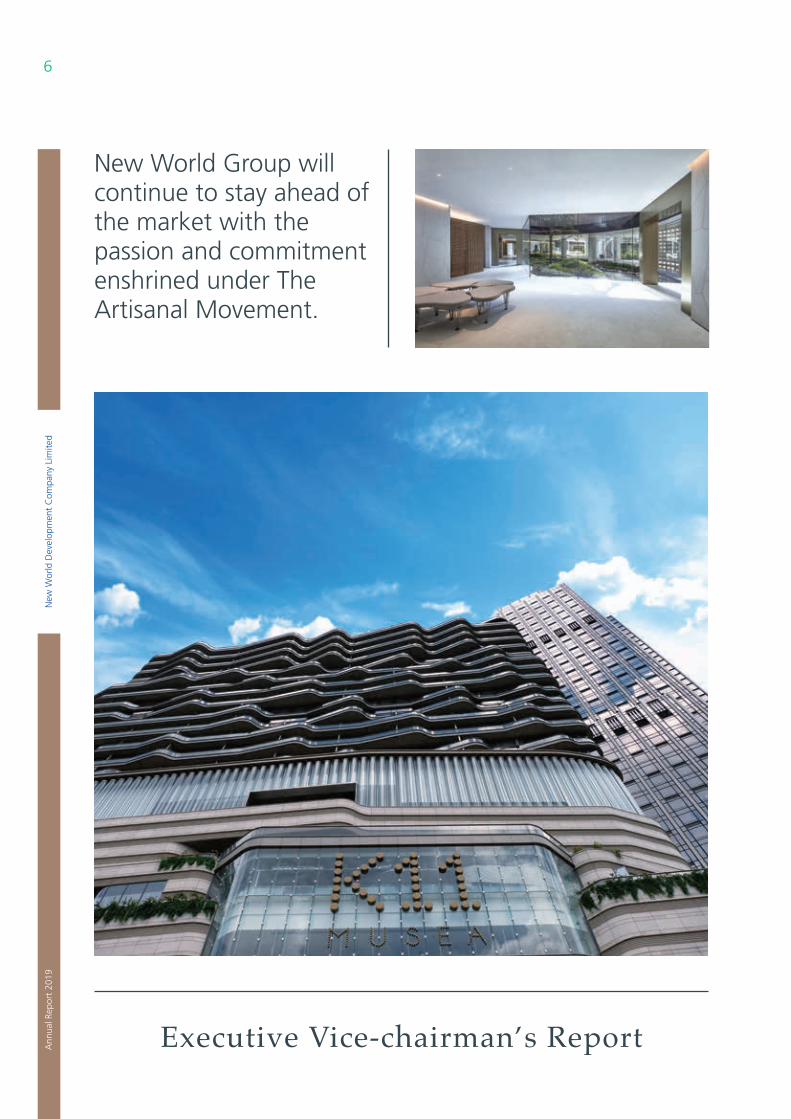
Executive Vice-chairman’s Report
New World Group will continue to stay ahead of the market with the passion and commitment enshrined under The Artisanal Movement.
New
Wor
ld D
evel
opm
ent
Com
pany
Lim
ited
Ann
ual R
epor
t 20
19
6
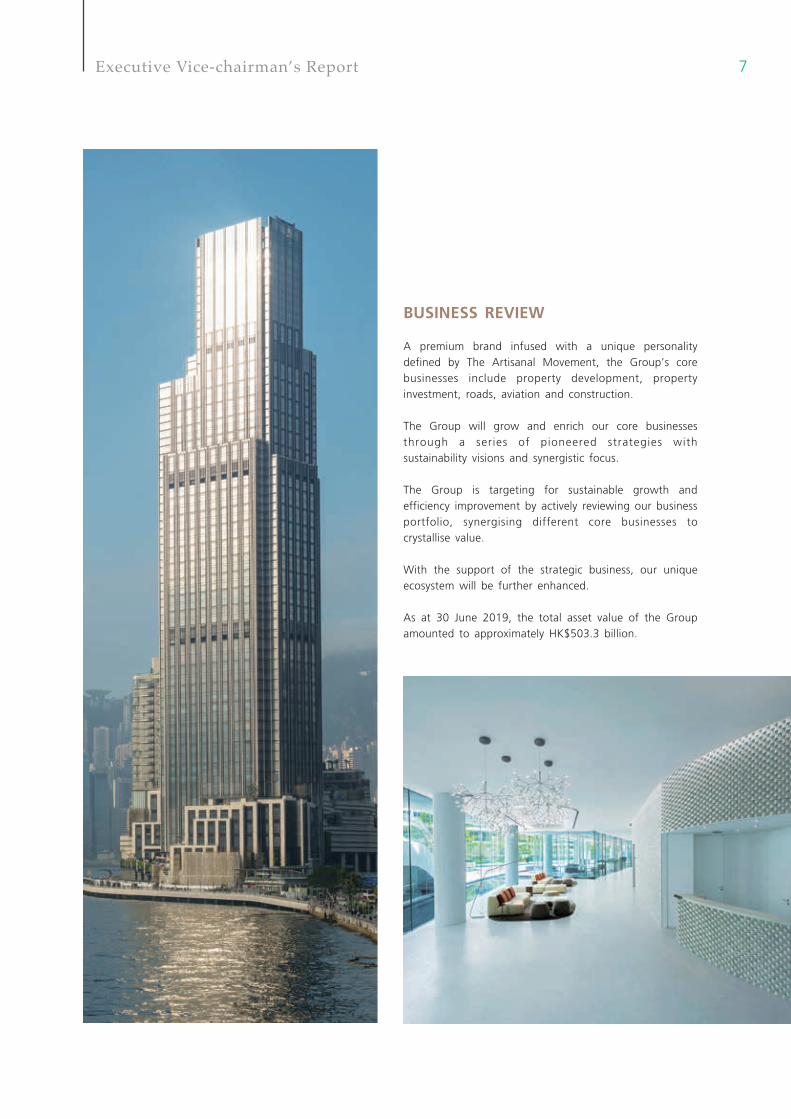
BUSINESS REVIEW
A premium brand infused with a unique personality defined by The Artisanal Movement, the Group’s core businesses include property development, property investment, roads, aviation and construction.
The Group will grow and enrich our core businesses through a series of pioneered strategies with sustainability visions and synergistic focus.
The Group is targeting for sustainable growth and efficiency improvement by actively reviewing our business portfolio, synergising different core businesses to crystallise value.
With the support of the strategic business, our unique ecosystem will be further enhanced.
As at 30 June 2019, the total asset value of the Group amounted to approximately HK$503.3 billion.
7Executive Vice-chairman’s Report
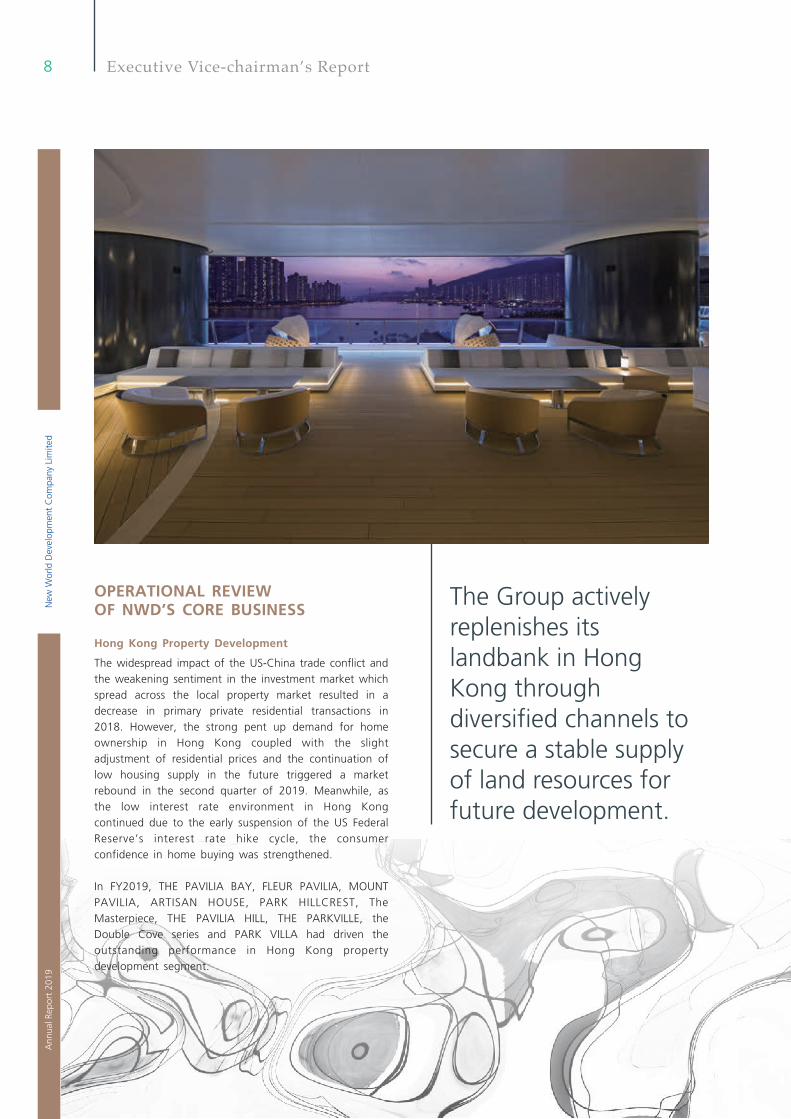
The Group actively replenishes its landbank in Hong Kong through diversified channels to secure a stable supply of land resources for future development.
OPERATIONAL REVIEW OF NWD’S CORE BUSINESS
Hong Kong Property Development
The widespread impact of the US-China trade conflict and the weakening sentiment in the investment market which spread across the local property market resulted in a decrease in primary private residential transactions in 2018. However, the strong pent up demand for home ownership in Hong Kong coupled with the slight adjustment of residential prices and the continuation of low housing supply in the future triggered a market rebound in the second quarter of 2019. Meanwhile, as the low interest rate environment in Hong Kong continued due to the early suspension of the US Federal Reserve’s interest rate hike cycle, the consumer confidence in home buying was strengthened.
In FY2019, THE PAVILIA BAY, FLEUR PAVILIA, MOUNT PAVILIA, ARTISAN HOUSE, PARK HILLCREST, The Masterpiece, THE PAVILIA HILL, THE PARKVILLE, the Double Cove series and PARK VILLA had driven the outstanding performance in Hong Kong property development segment.
New
Wor
ld D
evel
opm
ent
Com
pany
Lim
ited
Ann
ual R
epor
t 20
19
8 Executive Vice-chairman’s Report
The Group has been disposing of non-core assets according to its established strategies focusing on core business to optimise its assets and business portfolio.
During the year under review, the Group’s attributable contracted sales in Hong Kong amounted to HK$10.5 billion, outperforming the HK$10 billion sales target. The attributable contracted sales were mainly contributed by residential projects including ARTISAN GARDEN, MOUNT PAVILIA, FLEUR PAVILIA, TIMBER HOUSE, ATRIUM HOUSE, The Masterpiece, Reach Summit, as well as two non-core industrial projects with an area of 160,000 sq ft in aggregate together with a commercial property on Hong Kong Island.
In the first half of 2019, the Group launched three new residential projects, namely ARTISAN GARDEN, TIMBER HOUSE and ATRIUM HOUSE, offering 847 units in total. Among them, ARTISAN GARDEN and TIMBER HOUSE were sold out quickly, ATRIUM HOUSE was well received by the market and nearly 70% of the units had been sold. According to the completion schedule of the Group, sales revenues of the three projects aforementioned will be recorded in FY2021 and FY2022 respectively.
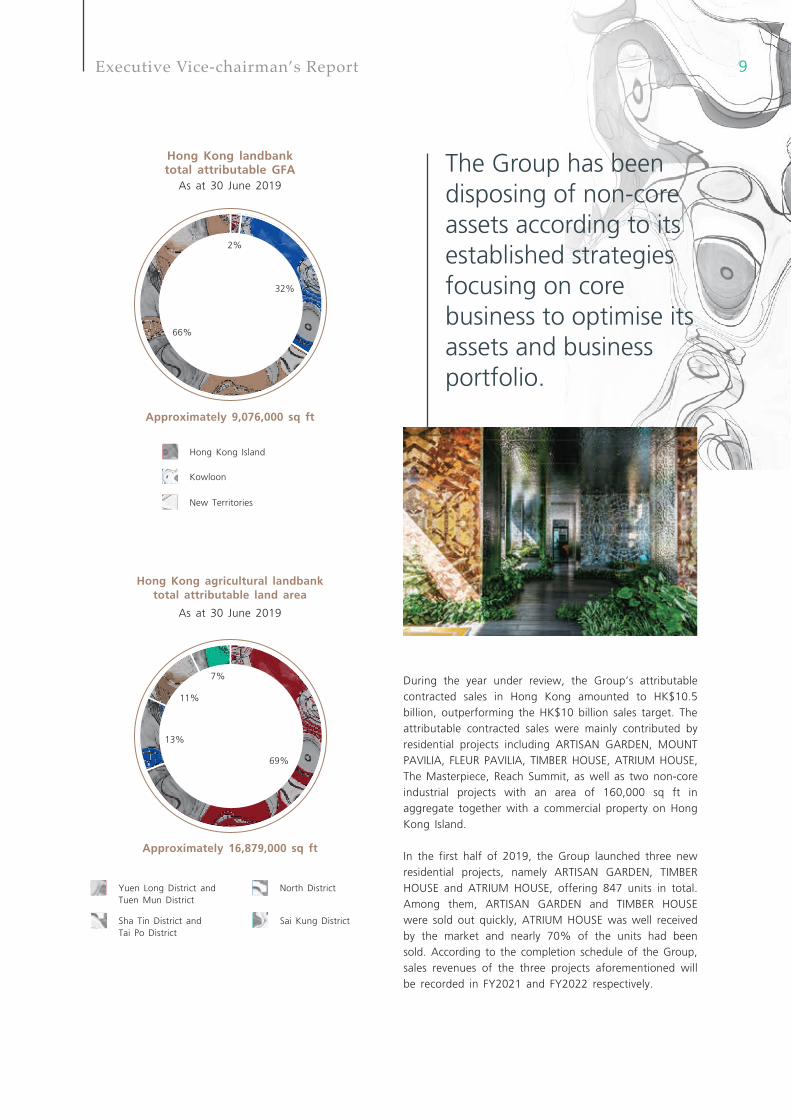
Hong Kong landbank total attributable GFA
32%
66%
2%
As at 30 June 2019
Hong Kong Island
New Territories
Approximately 9,076,000 sq ft
Kowloon
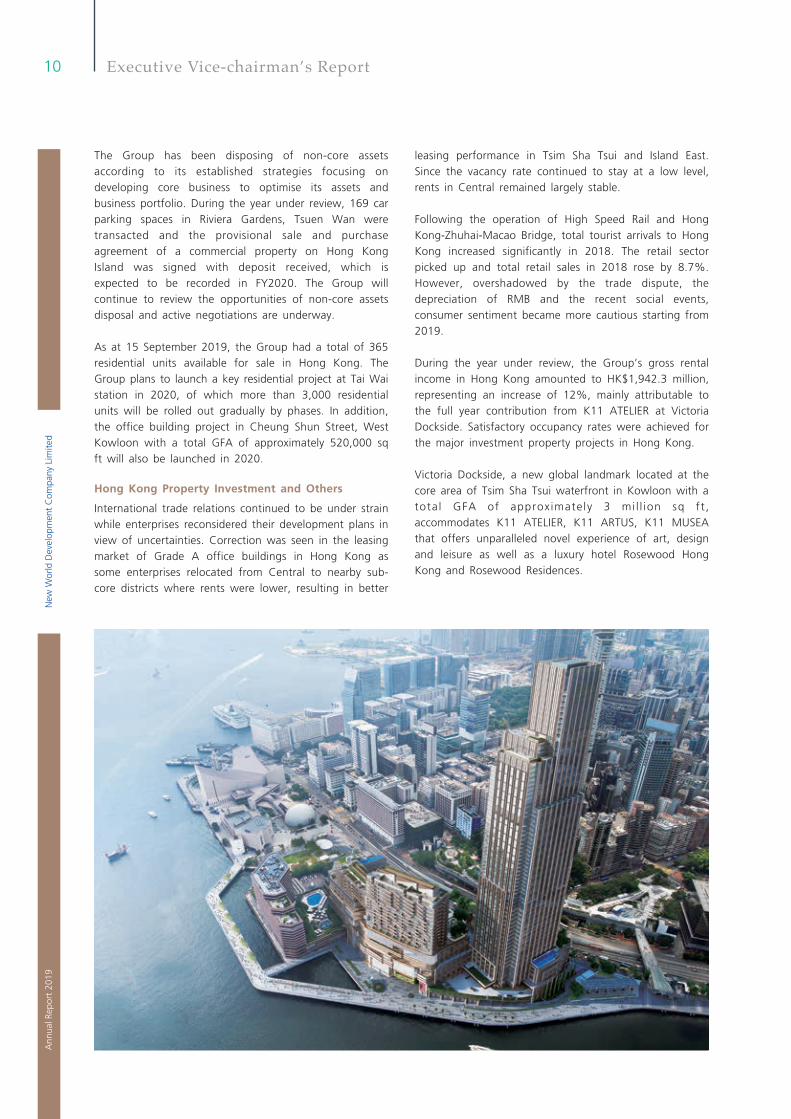
Yuen Long District and Tuen Mun District
North District
Sai Kung District
Hong Kong agricultural landbank total attributable land area
As at 30 June 2019
Approximately 16,879,000 sq ft
69%
13%
11%
7%
Sha Tin District and Tai Po District
9Executive Vice-chairman’s Report
The Group has been disposing of non-core assets according to its established strategies focusing on developing core business to optimise its assets and business portfolio. During the year under review, 169 car parking spaces in Riviera Gardens, Tsuen Wan were transacted and the provisional sale and purchase agreement of a commercial property on Hong Kong Island was signed with deposit received, which is expected to be recorded in FY2020. The Group will continue to review the opportunities of non-core assets disposal and active negotiations are underway.
As at 15 September 2019, the Group had a total of 365 residential units available for sale in Hong Kong. The Group plans to launch a key residential project at Tai Wai station in 2020, of which more than 3,000 residential units will be rolled out gradually by phases. In addition, the office building project in Cheung Shun Street, West Kowloon with a total GFA of approximately 520,000 sq ft will also be launched in 2020.
Hong Kong Property Investment and Others
International trade relations continued to be under strain while enterprises reconsidered their development plans in view of uncertainties. Correction was seen in the leasing market of Grade A office buildings in Hong Kong as some enterprises relocated from Central to nearby sub-core districts where rents were lower, resulting in better
leasing performance in Tsim Sha Tsui and Island East. Since the vacancy rate continued to stay at a low level, rents in Central remained largely stable.
Following the operation of High Speed Rail and Hong Kong-Zhuhai-Macao Bridge, total tourist arrivals to Hong Kong increased significantly in 2018. The retail sector picked up and total retail sales in 2018 rose by 8.7%. However, overshadowed by the trade dispute, the depreciation of RMB and the recent social events, consumer sentiment became more cautious starting from 2019.
During the year under review, the Group’s gross rental income in Hong Kong amounted to HK$1,942.3 million, representing an increase of 12%, mainly attributable to the full year contribution from K11 ATELIER at Victoria Dockside. Satisfactory occupancy rates were achieved for the major investment property projects in Hong Kong.
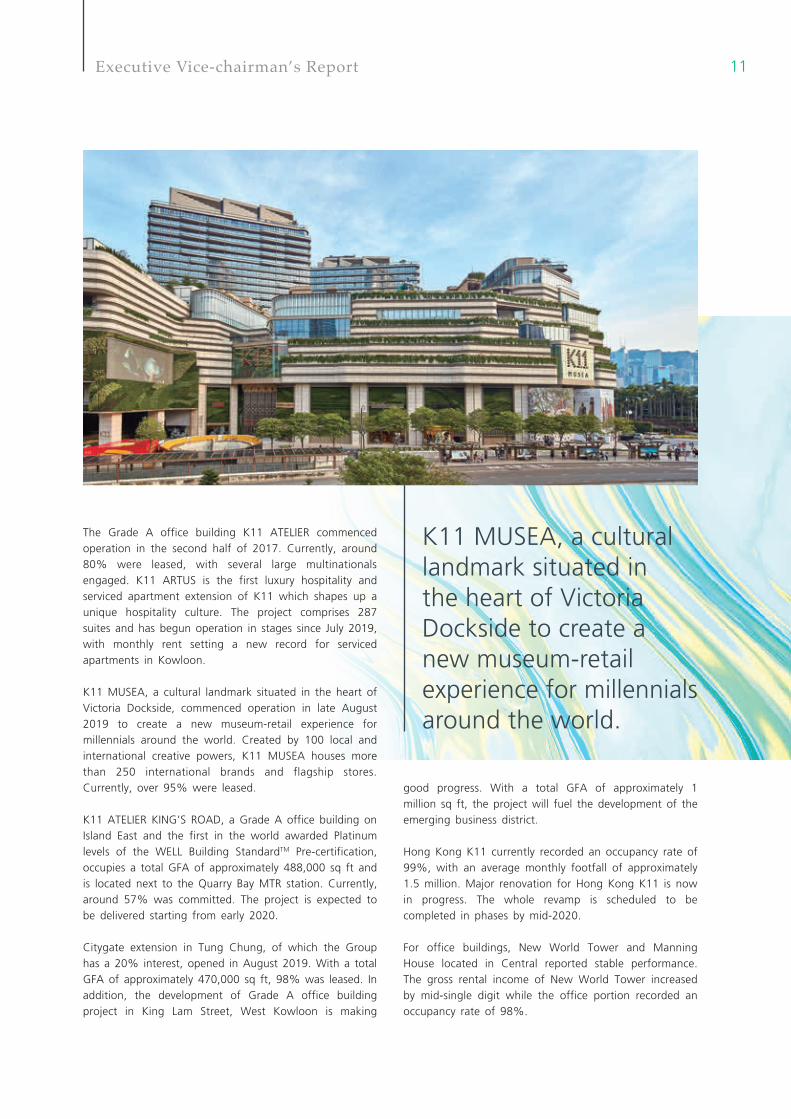
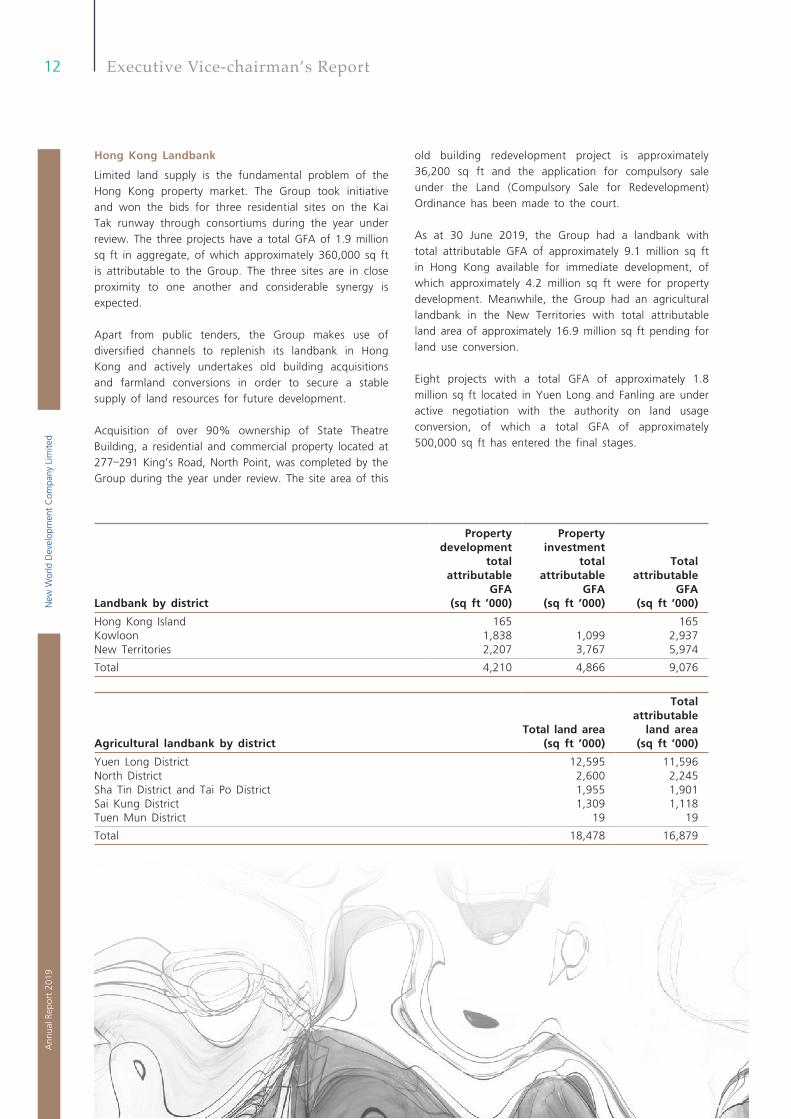
Victoria Dockside, a new global landmark located at the core area of Tsim Sha Tsui waterfront in Kowloon with a tota l GFA of approximately 3 mi l l ion sq ft , accommodates K11 ATELIER, K11 ARTUS, K11 MUSEA that offers unparalleled novel experience of art, design and leisure as well as a luxury hotel Rosewood Hong Kong and Rosewood Residences.
New
Wor
ld D
evel
opm
ent
Com
pany
Lim
ited
Ann
ual R
epor
t 20
19
10 Executive Vice-chairman’s Report
The Grade A office building K11 ATELIER commenced operation in the second half of 2017. Currently, around 80% were leased, with several large multinationals engaged. K11 ARTUS is the first luxury hospitality and serviced apartment extension of K11 which shapes up a unique hospitality culture. The project comprises 287 suites and has begun operation in stages since July 2019, with monthly rent setting a new record for serviced apartments in Kowloon.
K11 MUSEA, a cultural landmark situated in the heart of Victoria Dockside, commenced operation in late August 2019 to create a new museum-retail experience for millennials around the world. Created by 100 local and international creative powers, K11 MUSEA houses more than 250 international brands and flagship stores. Currently, over 95% were leased.
K11 ATELIER KING’S ROAD, a Grade A office building on Island East and the first in the world awarded Platinum levels of the WELL Building StandardTM Pre-certification, occupies a total GFA of approximately 488,000 sq ft and is located next to the Quarry Bay MTR station. Currently, around 57% was committed. The project is expected to be delivered starting from early 2020.
Citygate extension in Tung Chung, of which the Group has a 20% interest, opened in August 2019. With a total GFA of approximately 470,000 sq ft, 98% was leased. In addition, the development of Grade A office building project in King Lam Street, West Kowloon is making
good progress. With a total GFA of approximately 1 million sq ft, the project will fuel the development of the emerging business district.
Hong Kong K11 currently recorded an occupancy rate of 99%, with an average monthly footfall of approximately 1.5 million. Major renovation for Hong Kong K11 is now in progress. The whole revamp is scheduled to be completed in phases by mid-2020.
For office buildings, New World Tower and Manning House located in Central reported stable performance. The gross rental income of New World Tower increased by mid-single digit while the office portion recorded an occupancy rate of 98%.
K11 MUSEA, a cultural landmark situated in the heart of Victoria Dockside to create a new museum-retail experience for millennials around the world.
11Executive Vice-chairman’s Report
Hong Kong Landbank
Limited land supply is the fundamental problem of the Hong Kong property market. The Group took initiative and won the bids for three residential sites on the Kai Tak runway through consortiums during the year under review. The three projects have a total GFA of 1.9 million sq ft in aggregate, of which approximately 360,000 sq ft is attributable to the Group. The three sites are in close proximity to one another and considerable synergy is expected.
Apart from public tenders, the Group makes use of diversified channels to replenish its landbank in Hong Kong and actively undertakes old building acquisitions and farmland conversions in order to secure a stable supply of land resources for future development.
Acquisition of over 90% ownership of State Theatre Building, a residential and commercial property located at 277–291 King’s Road, North Point, was completed by the Group during the year under review. The site area of this
old building redevelopment project is approximately 36,200 sq ft and the application for compulsory sale under the Land (Compulsory Sale for Redevelopment) Ordinance has been made to the court.
As at 30 June 2019, the Group had a landbank with total attributable GFA of approximately 9.1 million sq ft in Hong Kong available for immediate development, of which approximately 4.2 million sq ft were for property development. Meanwhile, the Group had an agricultural landbank in the New Territories with total attributable land area of approximately 16.9 million sq ft pending for land use conversion.
Eight projects with a total GFA of approximately 1.8 million sq ft located in Yuen Long and Fanling are under active negotiation with the authority on land usage conversion, of which a total GFA of approximately 500,000 sq ft has entered the final stages.
Property development
total attributable
GFA
Property investment
total attributable
GFA
Total attributable
GFALandbank by district (sq ft ’000) (sq ft ’000) (sq ft ’000)
Hong Kong Island 165 165Kowloon 1,838 1,099 2,937New Territories 2,207 3,767 5,974
Total 4,210 4,866 9,076
Total land area
Total attributable
land areaAgricultural landbank by district (sq ft ’000) (sq ft ’000)
Yuen Long District 12,595 11,596North District 2,600 2,245Sha Tin District and Tai Po District 1,955 1,901Sai Kung District 1,309 1,118Tuen Mun District 19 19
Total 18,478 16,879
New
Wor
ld D
evel
opm
ent
Com
pany
Lim
ited
Ann
ual R
epor
t 20
19
12 Executive Vice-chairman’s Report
The contract for the design, construction and operation of Kai Tak Sports Park was awarded to Kai Tak Sports Park Limited, a subsidiary owned by NWD and NWS Holdings Limited (“NWSH”), in December 2018 for a period of 25 years. The Hong Kong Government will be responsible for all construction costs. Construction work of the sports park commenced in the second quarter of 2019 and is expected to be completed in 2023. Upon completion, it will become a new landmark in Hong Kong and the Greater Bay Area (“GBA”).
Mainland China Property Development
Establishing and enhancing a long-standing mechanism for the stable and healthy development of the property market, adhering to the goals of stabilising land prices, house prices and expectations, implementing city-specific policies and category-based guidance, as well as solidifying the primary responsibil it ies of local governments will continue to be the main themes of the property market development in Mainland China.
A number of provinces and cities adjusted their policies according to their respective demand and supply and market exuberance. In particular, the residential prices of first- and second-tier cities became rational again after several rounds of control measures as some of the pent up home-purchasing demand was alleviated. The population influx as a result of urbanisation as well as the preferential treatment to talents and relaxation of settlement policies in certain cities also provided a continuous driving force for the development of the property market.
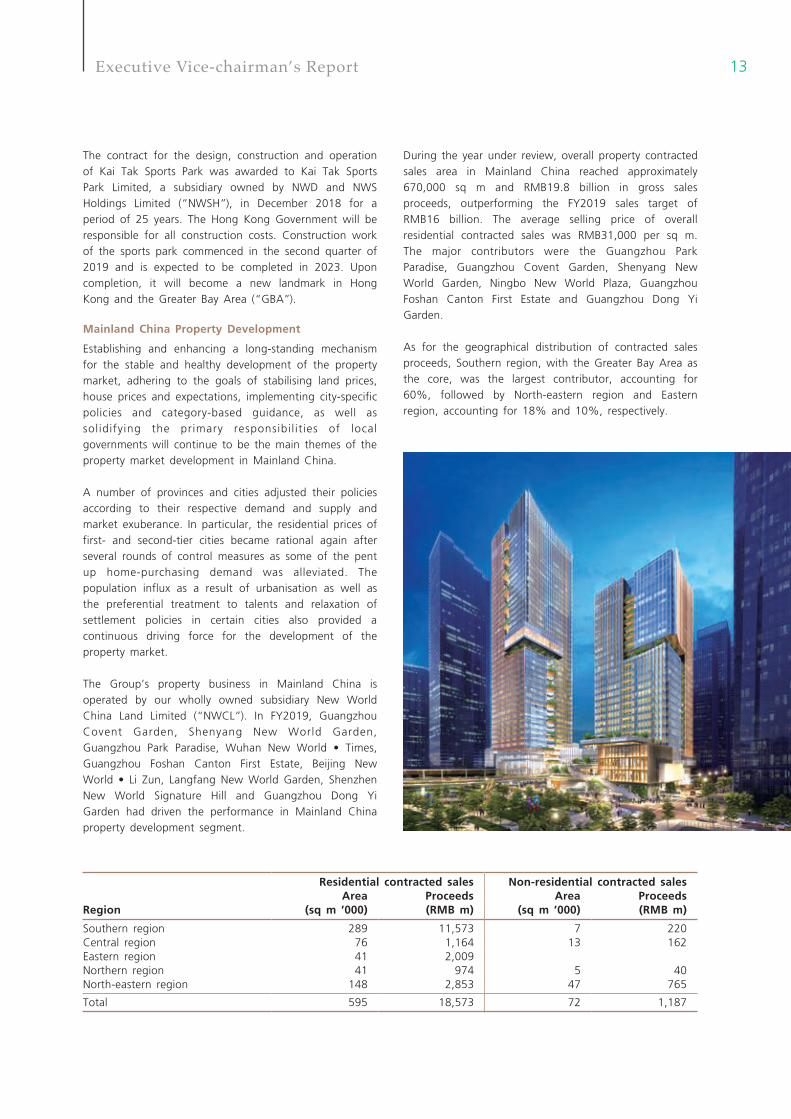
The Group’s property business in Mainland China is operated by our wholly owned subsidiary New World China Land Limited (“NWCL”). In FY2019, Guangzhou Covent Garden, Shenyang New World Garden, Guangzhou Park Paradise, Wuhan New World • Times, Guangzhou Foshan Canton First Estate, Beijing New World • Li Zun, Langfang New World Garden, Shenzhen New World Signature Hill and Guangzhou Dong Yi Garden had driven the performance in Mainland China property development segment.
During the year under review, overall property contracted sales area in Mainland China reached approximately 670,000 sq m and RMB19.8 billion in gross sales proceeds, outperforming the FY2019 sales target of RMB16 billion. The average selling price of overall residential contracted sales was RMB31,000 per sq m. The major contributors were the Guangzhou Park Paradise, Guangzhou Covent Garden, Shenyang New World Garden, Ningbo New World Plaza, Guangzhou Foshan Canton First Estate and Guangzhou Dong Yi Garden.
As for the geographical distribution of contracted sales proceeds, Southern region, with the Greater Bay Area as the core, was the largest contributor, accounting for 60%, followed by North-eastern region and Eastern region, accounting for 18% and 10%, respectively.
Residential contracted sales Non-residential contracted salesArea Proceeds Area Proceeds
Region (sq m ’000) (RMB m) (sq m ’000) (RMB m)
Southern region 289 11,573 7 220Central region 76 1,164 13 162Eastern region 41 2,009Northern region 41 974 5 40North-eastern region 148 2,853 47 765
Total 595 18,573 72 1,187
13Executive Vice-chairman’s Report
FY2019 project completion in Mainland China — Property development
Project
Total GFA (sq m) Residential Commercial Office
Total
(excluding
carpark)
Total
(including
carpark)
Guangzhou Dong Yi Garden Phase 5 24,456 24,456 24,456
Guangzhou Park Paradise District 3 Phase 1
(A1-A7) 136,671 136,671 136,671
Guangzhou Foshan Canton First Estate CF20
Phase 2 34,751 34,751 45,371
Guangzhou Foshan Canton First Estate CF27A/29 942 942 40,263
Yiyang New World Scenic Heights Phase 1D 14,321 14,321 14,321
Yiyang New World Scenic Heights Phase 1E 20,771 1,139 21,910 21,910
Langfang New World Garden District 2 50,441 7,267 57,708 57,708
Langfang New World Centre District A 34,218
Shenyang New World Commercial Centre Phase 2 25,700 50,971 76,671 76,671
Shenyang New World Garden Phase 2D2 170,077 170,077 170,077
Shenyang New World Garden Phase 2E 42,430 42,430 42,430
Anshan New World Garden Phase 1B1 66,729 13,502 80,231 80,231
Total 560,647 48,550 50,971 660,168 744,327
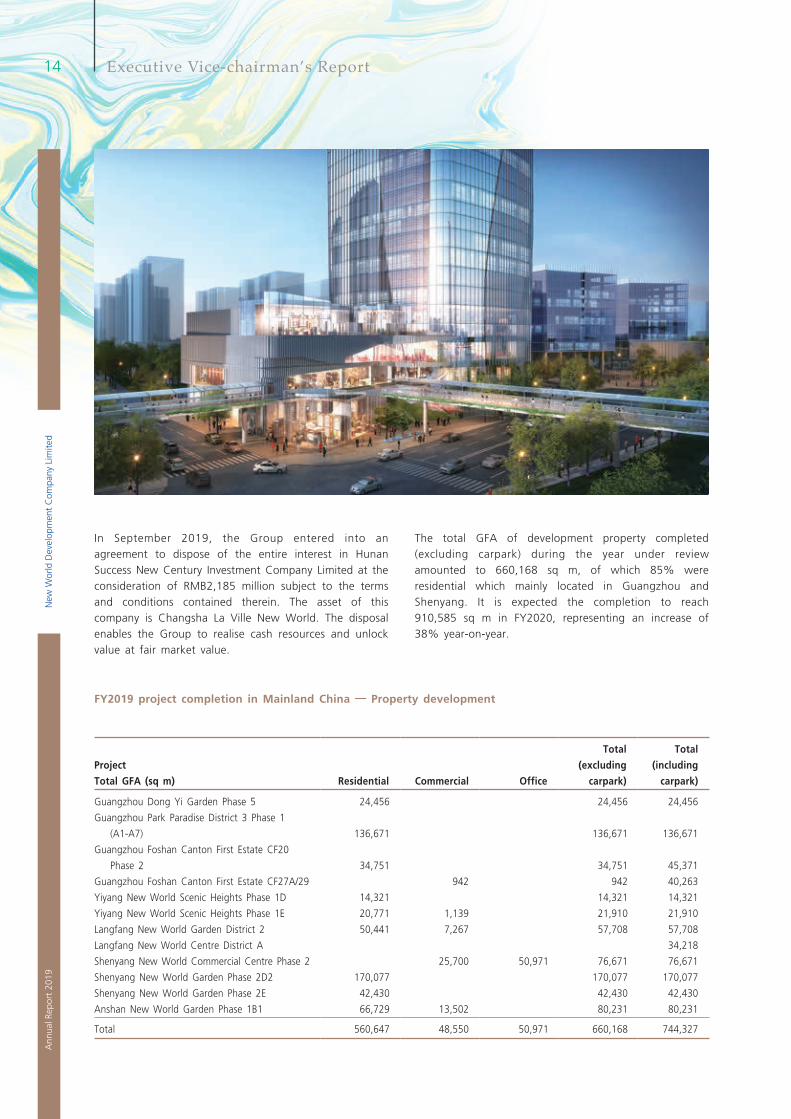
The total GFA of development property completed (excluding carpark) during the year under review amounted to 660,168 sq m, of which 85% were residential which mainly located in Guangzhou and Shenyang. It is expected the completion to reach 910,585 sq m in FY2020, representing an increase of 38% year-on-year.
In September 2019, the Group entered into an agreement to dispose of the entire interest in Hunan Success New Century Investment Company Limited at the consideration of RMB2,185 million subject to the terms and conditions contained therein. The asset of this company is Changsha La Ville New World. The disposal enables the Group to realise cash resources and unlock value at fair market value.
New
Wor
ld D
evel
opm
ent
Com
pany
Lim
ited
Ann
ual R
epor
t 20
19
14 Executive Vice-chairman’s Report
FY2019 project completion in Mainland China — Property investment, hotel and others
Project Total GFA (sq m) Commercial Hotel Others
Total (excluding
carpark)
Total (including
carpark)
Guangzhou New World • NEW PARK 90,726 90,726 90,726Guangzhou Park Paradise District 3
Phase 1 95,435Guangzhou Dong Yi Garden Phase 5 2,947Guangzhou Foshan Canton First Estate
CF21* 3,375 3,375 3,375KHOS Langfang 46,421 46,421 46,421Shenyang New World Garden 2D2 7,671 7,671 94,612Shenyang New World Commercial
Centre Phase 2 19,354Anshan New World Garden Phase 1B1 18,828
Total 98,397 46,421 3,375 148,193 371,698
* Kindergarten
FY2020 estimated project completion in Mainland China — Property development
Project Total GFA (sq m) Residential Commercial Office
Total (excluding
carpark)
Total (including
carpark)
Guangzhou Foshan Canton First Estate CF30 21,325 21,325 21,325
Guangzhou Foshan Canton First Estate CF31 44,020 44,020 44,020
Guangzhou Foshan Canton First Estate CF27B 30,210 30,210 30,210
Guangzhou Foshan Canton First Estate CF35 2,720 2,720 3,434
Wuhan New World • Times Site B 37,522 37,522 96,220Changsha La Ville New World Phase 4A 81,499 1,284 82,783 109,645Ningbo New World Plaza land No.7–10 137,652 25,973 163,625 269,790Ningbo New World Plaza land No.11 9,702 57,055 66,757 90,010Ningbo New World Plaza land No.12 8,085 12,331 20,416 52,900Beijing New View Commercial Centre 9,063 12,231 21,294 25,367Shenyang New World Centre SA1–3 287,085 287,085 287,085Shenyang New World Garden Phase 2E 55,235 55,235 55,235Anshan New World Garden Phase 1B2 59,685 8,611 68,296 85,623Anshan New World • The Grandiose
Phase 1B 9,297 9,297 9,297
Total 479,165 349,803 81,617 910,585 1,180,161
15Executive Vice-chairman’s Report
FY2020 estimated project completion in Mainland China — Property investment, hotel and others
Project Total GFA (sq m) Commercial Office Hotel
Total (excluding
carpark)
Total (including
carpark)
Guangzhou Park Paradise District 5 Land No.1 22,763 22,763 35,365
KHOS Guangzhou 6,787 53,594 60,381 80,672Guangzhou Park Paradise District 5 Land
No.2 2,596 2,596 4,974Wuhan New World Centre Phase 3 32,294 56,320 88,614 145,333Shenyang New World Garden Phase 2E 40,878KHOS Shenyang 69,751 69,751 69,751pentahotel Shenyang 29,924 29,924 29,924
Total 64,440 56,320 153,269 274,029 406,897
Mainland China Property Investment and Others
The consumption patterns in Mainland China are gradually changing as the new generation of youth becomes the major consumers. Diversification of consumption patterns is evidenced by the shift from basic consumption in the past to consumption upgrade and experience-based consumption as well as the extension of offline consumption scenarios to online ones. Meanwhile, cross-sector marketing is being promoted to complete the whole consumption experience.
During the year under review, the Group recorded a gross rental income of HK$1,727.1 million in Mainland China with an increase of 26%. The growth was mainly due to the fact that the Group has optimised its internal structure that enhanced both operations and cost management, together with the new projects such as Wuhan Guanggu K11 starting to contribute. Major projects recorded satisfactory occupancy rate.
During the year under review, the commercial project of New World • NEW PARK in Guangzhou commenced operation in December 2018. In addition, Shanghai Hong Kong New World Tower which houses Shanghai K11, the first art mall in Mainland China, recorded satisfactory occupancy rate.
Meanwhile, Wuhan K11 Art Mall is scheduled to open in FY2020. It will further increase the rental contribution from Mainland China.
Mainland China Landbank
Following the projects acquired in Shenzhen Qianhai, Shenzhen Prince Bay and Guangzhou Zengcheng, the Group moved another step forward to enhance the portfolio in the Greater Bay Area during the year under review.
In November 2018, NWCL successfully acquired 65% equity interest of a subsidiary of Guangzhou Metro Group, which owned a land parcel at Panyu Hanxi Changlong in Guangzhou, to jointly develop the land. With a total GFA of more than 300,000 sq m, the project will be developed into an urban complex for commercial, office and residential use.
In addition, NWCL actively engaged in old city redevelopment. During the year under review, according to the announcements of the voting results of the cooperation agreements of the Shiweitang Street Shancun Joint Economic Cooperation Association in Liwan District, Guangzhou and the Changgang Street Lianxing Nanjicun Nanji Joint Economic Cooperation Association in Haizhu District, Guangzhou, NWCL has become the intended cooperative enterprise for the redevelopment of the two old villages.
New
Wor
ld D
evel
opm
ent
Com
pany
Lim
ited
Ann
ual R
epor
t 20
19
16 Executive Vice-chairman’s Report
The Shancun old village redevelopment project is primely located in the business district of Baietan in Guangzhou, adjacent to four subway lines and the mature living cluster of NWCL’s Guangzhou Covent Garden. It is set to be another new key focus of the Group in Guangzhou. Construction of Ruyifang Tunnel, a cross-river passage in the business district of Baietan that connects Inner Ring Road and Baietan in Liwan District, has commenced and is expected to be completed in 2022. The function of Baietan as transport hub in western Guangzhou will then be strengthened, creating huge potential for the project.
The Nanjicun old village redevelopment project in Haizhu District is located in Guangzhi New Town. It is separated from Guanggang New Town, which is next to the business district of Baietan in Liwan District, by Zhujiang River. In addition to the riverside scenery, Guangzhi, Guanggang and its neighbouring Guangchuan area on the coasts of Zhujiang River are one of the important cluster of the Guangzhou redevelopment projects. Taking advantage of the Zhujiang-Xijiang Economic Belt, it is set to be the development hub of western Guangzhou in the future.
To optimise project coverage in key cities other than the Greater Bay Area, the Group acquired the remaining 51% interest of Ningbo New World, a commercial and residential complex project, for RMB4 billion in July 2019. The project is located at Sanjiangkou, the central business district of Ningbo, and is planned to be developed into K11 Art Mall, Rosewood Hotel, Ningbo Tower, office buildings, high-end residences, business and leisure avenues and K11 Art Park.
In July 2019, the Group successfully obtained a land parcel for commercial and residential use in Wangjiang New Town, Shangcheng District, Hangzhou through a public tender offer at approximately RMB9.79 billion. With a total GFA of approximately 454,000 sq m, the project will strengthen the strategic layout of the Group in key cities in the Yangtze River Delta. Hangzhou is one of the core cities in the national strategy of integrated regional planning of the Yangtze River Delta. Wangjiang New Town is the newly developed core area positioned as an intelligence industrial park in Shangcheng District, Hangzhou. The land is adjacent to Wujiang Road station of Hangzhou Metro Line 1, Chengzhan Station of the planned Line 7 and Hangzhou Railway Station, hence an important transport hub.
In September 2019, NWCL obtained the Tagang Village project in Yongning Street, Zengcheng District, Guangzhou with the reserve price of RMB3.4 billion. The project is a second-class residential land with a total GFA of over 320,000 sq m, of which, around 70,000 sq m of resettlement property will be repurchased by the government at cost. The project is located in the Zengcheng Economic and Technological Development Zone and the Guangzhou-Shenzhen Science and Technology Innovation Corridor. In addition, various industries are clustering in that area and hence there is enormous potential for future development.
In the meantime, NWCL and Dawanggang Society, which is under Tagang Village, reached a cooperation agreement in September 2019 to participate in the old village redevelopment.
Newly acquired project Total GFA (sq m) Residential Commercial Office Others
Total (excluding
carpark)
Hangzhou Wangjiang New Town project 150,627 165,860 110,699 26,700 453,886Guangzhou Zengcheng Tagang Village
project 289,410 34,741 324,151
17Executive Vice-chairman’s Report
As at 30 June 2019, the Group had a landbank (excluding carpark) with a total GFA of approximately 6.5 million sq m available for immediate development in Mainland China, of which approximately 3.9 million sq m was for residential use.
Of which, core property development projects were primarily located in Guangzhou, Foshan, Shenzhen, Wuhan, Ningbo, Beijing and Shenyang, constituting a landbank (excluding carpark) with a total GFA of approximately 5.3 million sq m, of which 51% was located in the Greater Bay Area and 2.9 million sq m was for residential use.
Region (sq m ’000)
Total GFA (excluding
carpark)Residential
total GFA
Southern region 2,668 1,629Central region 1,140 674Eastern region 489 138Northern region 610 254North-eastern region 1,576 1,214
Total 6,483 3,909
Of which, core projects 5,277 2,869
KEY PROJECTS IN THE GREATER BAY AREA
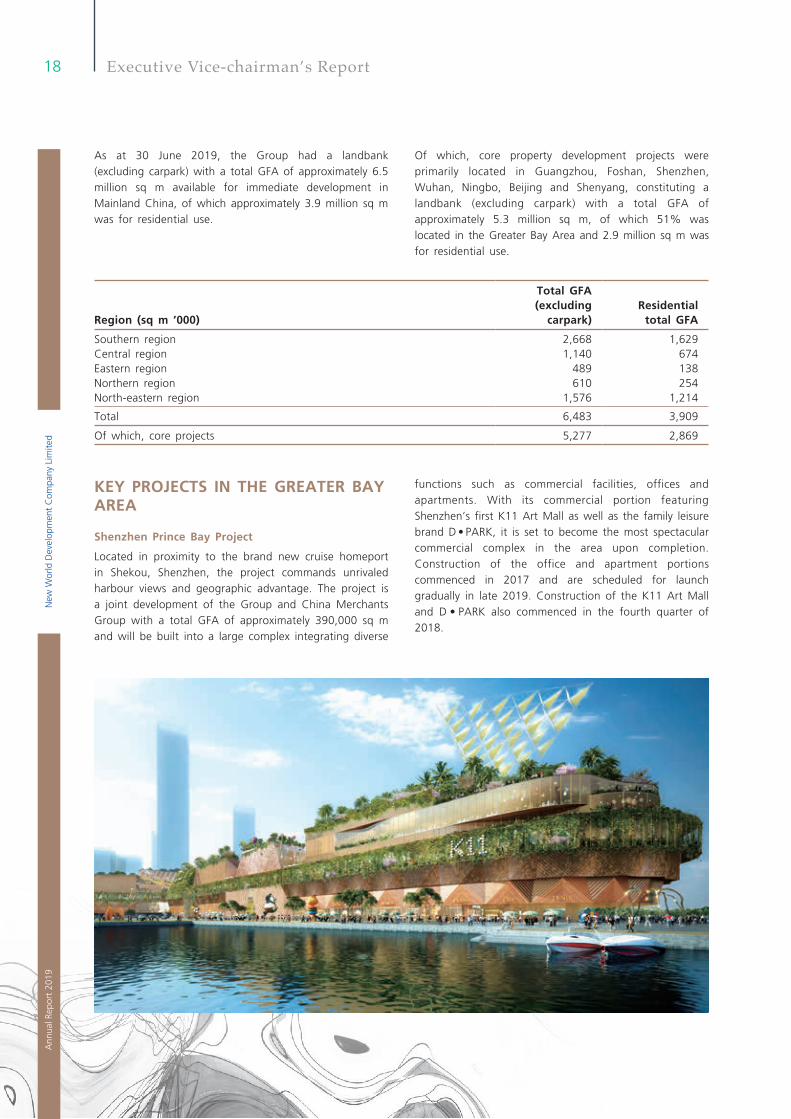
Shenzhen Prince Bay Project
Located in proximity to the brand new cruise homeport in Shekou, Shenzhen, the project commands unrivaled harbour views and geographic advantage. The project is a joint development of the Group and China Merchants Group with a total GFA of approximately 390,000 sq m and will be built into a large complex integrating diverse
functions such as commercial facilities, offices and apartments. With its commercial portion featuring Shenzhen’s first K11 Art Mall as well as the family leisure brand D • PARK, it is set to become the most spectacular commercial complex in the area upon completion. Construction of the office and apartment portions commenced in 2017 and are scheduled for launch gradually in late 2019. Construction of the K11 Art Mall and D • PARK also commenced in the fourth quarter of 2018.
New
Wor
ld D
evel
opm
ent
Com
pany
Lim
ited
Ann
ual R
epor
t 20
19
18 Executive Vice-chairman’s Report
The landbank of core property development projects in Mainland China has a total GFA of approximately 5.3 million sq m, of which 51% was located in the GBA. NWCL will actively engage in old city redevelopment.
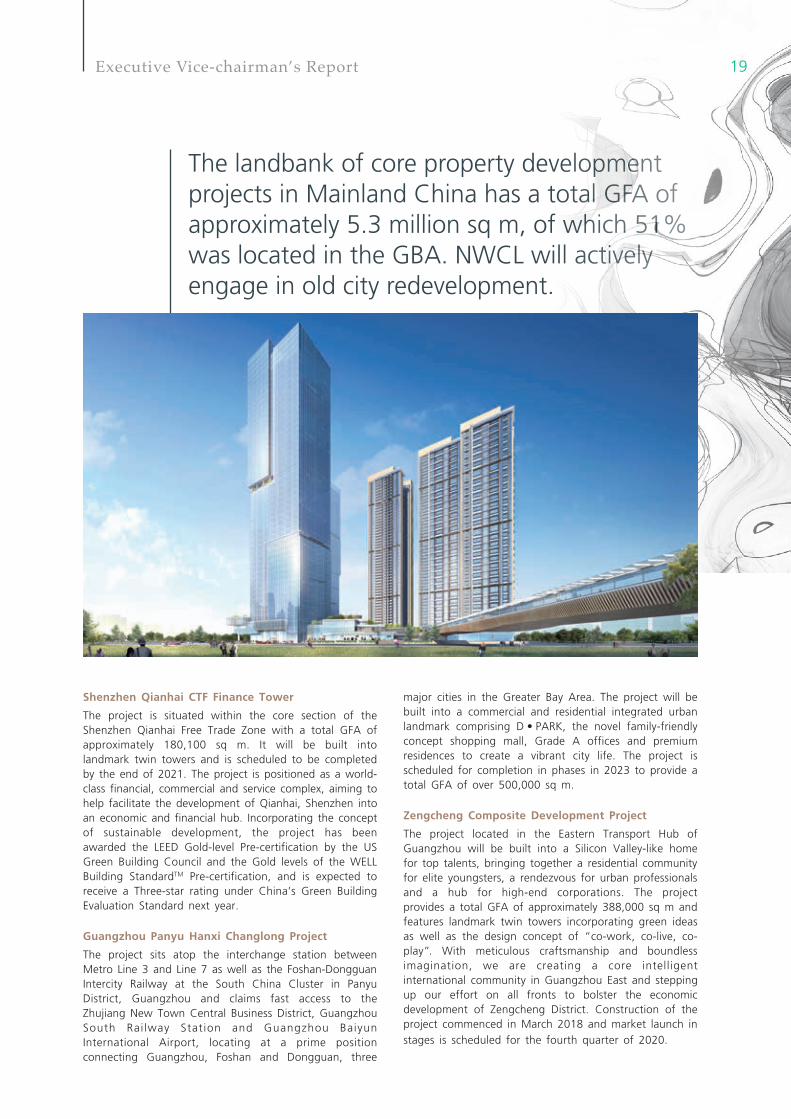
Shenzhen Qianhai CTF Finance Tower
The project is situated within the core section of the Shenzhen Qianhai Free Trade Zone with a total GFA of approximately 180,100 sq m. It will be built into landmark twin towers and is scheduled to be completed by the end of 2021. The project is positioned as a world-class financial, commercial and service complex, aiming to help facilitate the development of Qianhai, Shenzhen into an economic and financial hub. Incorporating the concept of sustainable development, the project has been awarded the LEED Gold-level Pre-certification by the US Green Building Council and the Gold levels of the WELL Building StandardTM Pre-certification, and is expected to receive a Three-star rating under China’s Green Building Evaluation Standard next year.
Guangzhou Panyu Hanxi Changlong Project
The project sits atop the interchange station between Metro Line 3 and Line 7 as well as the Foshan-Dongguan Intercity Railway at the South China Cluster in Panyu District, Guangzhou and claims fast access to the Zhujiang New Town Central Business District, Guangzhou South Rai lway Station and Guangzhou Baiyun International Airport, locating at a prime position connecting Guangzhou, Foshan and Dongguan, three
major cities in the Greater Bay Area. The project will be built into a commercial and residential integrated urban landmark comprising D • PARK, the novel family-friendly concept shopping mall, Grade A offices and premium residences to create a vibrant city life. The project is scheduled for completion in phases in 2023 to provide a total GFA of over 500,000 sq m.
Zengcheng Composite Development Project
The project located in the Eastern Transport Hub of Guangzhou will be built into a Silicon Valley-like home for top talents, bringing together a residential community for elite youngsters, a rendezvous for urban professionals and a hub for high-end corporations. The project provides a total GFA of approximately 388,000 sq m and features landmark twin towers incorporating green ideas as well as the design concept of “co-work, co-live, co-play”. With meticulous craftsmanship and boundless imagination, we are creating a core intelligent international community in Guangzhou East and stepping up our effort on all fronts to bolster the economic development of Zengcheng District. Construction of the project commenced in March 2018 and market launch in stages is scheduled for the fourth quarter of 2020.
19Executive Vice-chairman’s Report
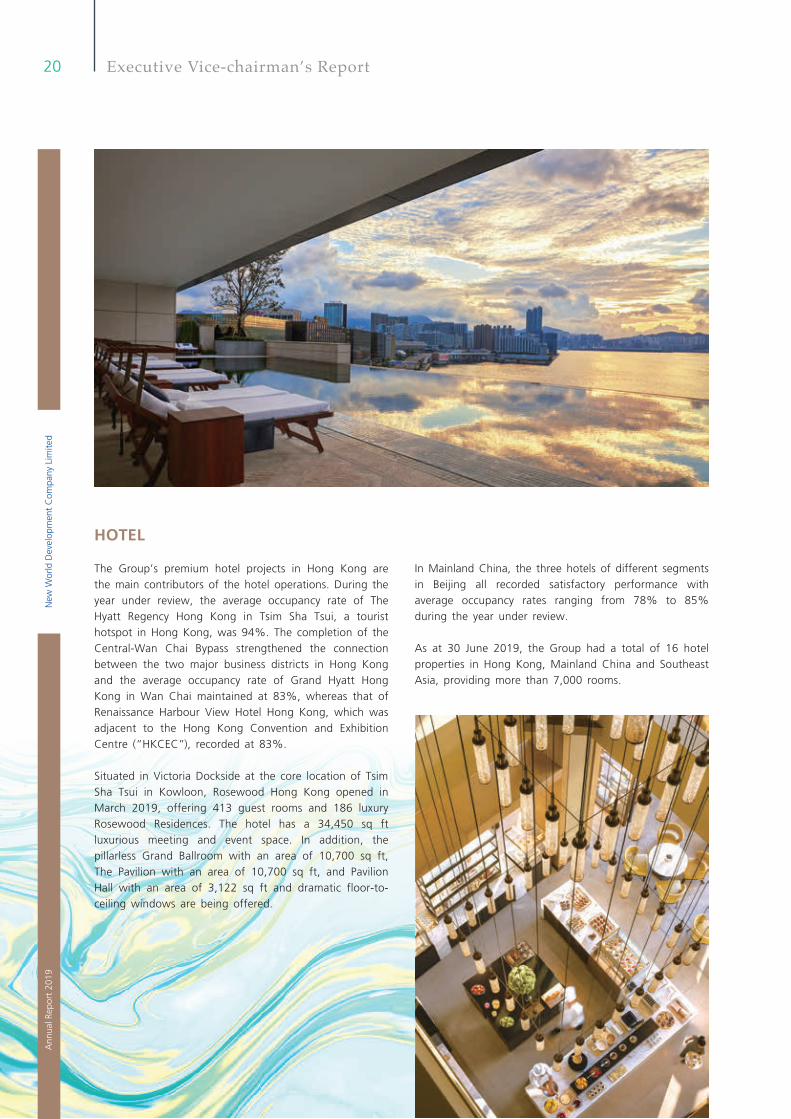
HOTEL
The Group’s premium hotel projects in Hong Kong are the main contributors of the hotel operations. During the year under review, the average occupancy rate of The Hyatt Regency Hong Kong in Tsim Sha Tsui, a tourist hotspot in Hong Kong, was 94%. The completion of the Central-Wan Chai Bypass strengthened the connection between the two major business districts in Hong Kong and the average occupancy rate of Grand Hyatt Hong Kong in Wan Chai maintained at 83%, whereas that of Renaissance Harbour View Hotel Hong Kong, which was adjacent to the Hong Kong Convention and Exhibition Centre (“HKCEC”), recorded at 83%.
Situated in Victoria Dockside at the core location of Tsim Sha Tsui in Kowloon, Rosewood Hong Kong opened in March 2019, offering 413 guest rooms and 186 luxury Rosewood Residences. The hotel has a 34,450 sq ft luxurious meeting and event space. In addition, the pillarless Grand Ballroom with an area of 10,700 sq ft, The Pavilion with an area of 10,700 sq ft, and Pavilion Hall with an area of 3,122 sq ft and dramatic floor-to-ceiling windows are being offered.
In Mainland China, the three hotels of different segments in Beijing all recorded satisfactory performance with average occupancy rates ranging from 78% to 85% during the year under review.
As at 30 June 2019, the Group had a total of 16 hotel properties in Hong Kong, Mainland China and Southeast Asia, providing more than 7,000 rooms.
New
Wor
ld D
evel
opm
ent
Com
pany
Lim
ited
Ann
ual R
epor
t 20
19
20 Executive Vice-chairman’s Report
NWS HOLDINGS LIMITED
In FY2019, NWSH has made significant progress in its various business segments, namely, the acquisition of Hunan Sui-Yue Expressway, the acquisition of Sky Aviation Leasing International Limited (“Sky Aviation”), the winning of the contract for the design, construction and operation of the Kai Tak Sports Park together with NWD and the acquisition of FTLife Insurance, with completion subject to relevant regulatory approval.
NWSH has also streamlined the business portfolio and focused further on the core businesses by disposing of some non-core assets including Urban Parking (Beijing) Limited, minority interests in two port projects in Tianjin, and further reduced the stakes in one of NWSH’s financial assets in Beijing Capital International Airport Company Limited (“BCIA”).
OPERATIONAL REVIEW OF NWSH’S CORE BUSINESS
As affected by the fluctuation of RMB during FY2019, the contribution of the roads business decreased by 7%. Excluding the exchange rate effect, the contribution would have increased by 4% which is in line with overall growth in toll income.
NWSH’s four anchor expressways which contributed more than 80% to the roads business, namely Hangzhou Ring Road, Tangjin Expressway (Tianjin North Section), Guangzhou City Northern Ring Road and Beijing-Zhuhai Expressway (Guangzhou-Zhuhai Section), continued to register steady traffic growth with the highest growth rate at 14%. Traffic flow of seven expressways in the Greater Bay Area grew in FY2019 by up to 21%.
Following the acquisition of Hubei Suiyuenan Expressway in January 2018, NWSH continued to strengthen its presence in Hunan and Hubei provinces during FY2019, 40% interest of Hunan Sui-Yue Expressway was acquired. This 24.08 km long dual 3-lane expressway served around 30,000 vehicles per day and provided immediate contribution to NWSH.
The aviation business mainly includes NWSH’s commercial aircraft leasing business, namely Goshawk Aviation Limited (“Goshawk”), and its investment in BCIA. The decrease in contribution of the aviation business was mainly due to the reclassification of investment in BCIA from an associated company to a financial asset in FY2018, and the non-cash mark-to-market loss on
interest rate swap contracts recognised by Goshawk as a result of falling swap rates during FY2019 as well as the one-off acquisition expenses relating to Sky Aviation.
NWSH’s commercial aircraft leasing business expanded rapidly in FY2019. With the milestone acquisition of Sky Aviation by Goshawk in September 2018, Goshawk’s lease income has grown significantly in FY2019. Subsequently through the inaugural issuance of Asset-Back Securities (“ABS”) in June 2019, Goshawk raised a total of US$643.6 million. The successful issuance of the ABS not only allowed Goshawk to broaden its fund raising channel to fuel its future growth, but also further validated Goshawk’s presence in the market and its management’s capability as a full platform service provider and long-term asset manager, thereby setting new foothold in the aircraft management business with an additional channel of income.
Together with the orders of 40 narrow-body aircraft directly ordered from aircraft manufacturers with delivery scheduled between 2023 and 2025, Goshawk’s owned, managed and committed fleet reached 223 aircraft as at 30 June 2019.
Goshawk’s innovative and tailored aircraft leasing solutions spans across 60 airline customers in 33 countries. With one of the youngest fleets in the industry, Goshawk’s 154 aircraft on book commands an average age of 3.9 years and has one of the longest average remaining lease term with 6.8 years, demonstrating its strength in growing its business while maintaining discipline.
As at 30 June 2019, the combined market value of Goshawk’s owned, managed and committed fleet amounted to approximately US$11.3 billion, propelling it to become a top 10 aircraft lessor globally in terms of fleet value.
Enthused by the strong and steady growth in residential, commercial property market and the government and institutional related projects, the contributions from the construction business increased notably by 14% in FY2019.
As at 30 June 2019, the gross value of contracts on hand for the construction business was approximately HK$55.6 billion and the remaining works to be completed amounted to approximately HK$41.6 billion.
The construction management services of Kai Tak Sports Park will be provided by Hip Hing Engineering Company Limited, which will add further stability in the revenue stream as well as cash flow for NWSH’s construction business.
21Executive Vice-chairman’s Report
Robust execution of property sales, forward-looking operation strategies for investment properties, targeted project coverage and competitive development models provide the ideal driving forces for the Group’s development, which will also increase recurring cash flow considerably for the consolidation of business foundation.
We are preparing to launch a series of key projects. A residential project with more than 3,000 units at Tai Wai station in Hong Kong and the Shenzhen Prince Bay project with a saleable area of approximately 110,000 sq m will be launched in phases, which will further strengthen the contributions from property sales.
The Group will continue to review its business, closely monitor market development and optimise its asset portfolio to enhance its efficiency. In FY2019, NWD and NWSH disposed of several non-core assets and non-core businesses at a total consideration of approximately HK$2,300 million and HK$1,300 million, respectively. In September 2019, NWCL entered into an agreement to dispose of the entire interest in Hunan Success New Century Investment Company L imited at the consideration of RMB2,185 million. In the meantime, NWSH had disposed of all the remaining shareholdings in BCIA at the consideration of HK$778 million. The work of non-core asset and business disposal will be continued to crystallise value.
OUTLOOK
The erratic global economy poses considerable risks and challenges. In view of potential uncertainties, being prudent and vigilant, seeking changes amid stability, and turning crisis into opportunity have become the primary strategies to balance risks.
The GDP of Hong Kong slightly increased by 0.5% in the second quarter of 2019, however the downward pressure on the Hong Kong economy is expected to aggravate in the third quarter of 2019. The US-China trade dispute, the uncertainty of Brexit, geopolitical tensions, weak economic and trade activities and recent social events inflamed negative sentiment on the economy.
At present, China’s economic development faces new risks and challenges. It is expected that the Central Government will adhere to the underlying principle of seeking progress while maintaining stability by working on growth stabilisation, reform promotion, structural adjustment, livelihood improvement, risk prevention and stability maintenance to promote sustained and healthy economic development.
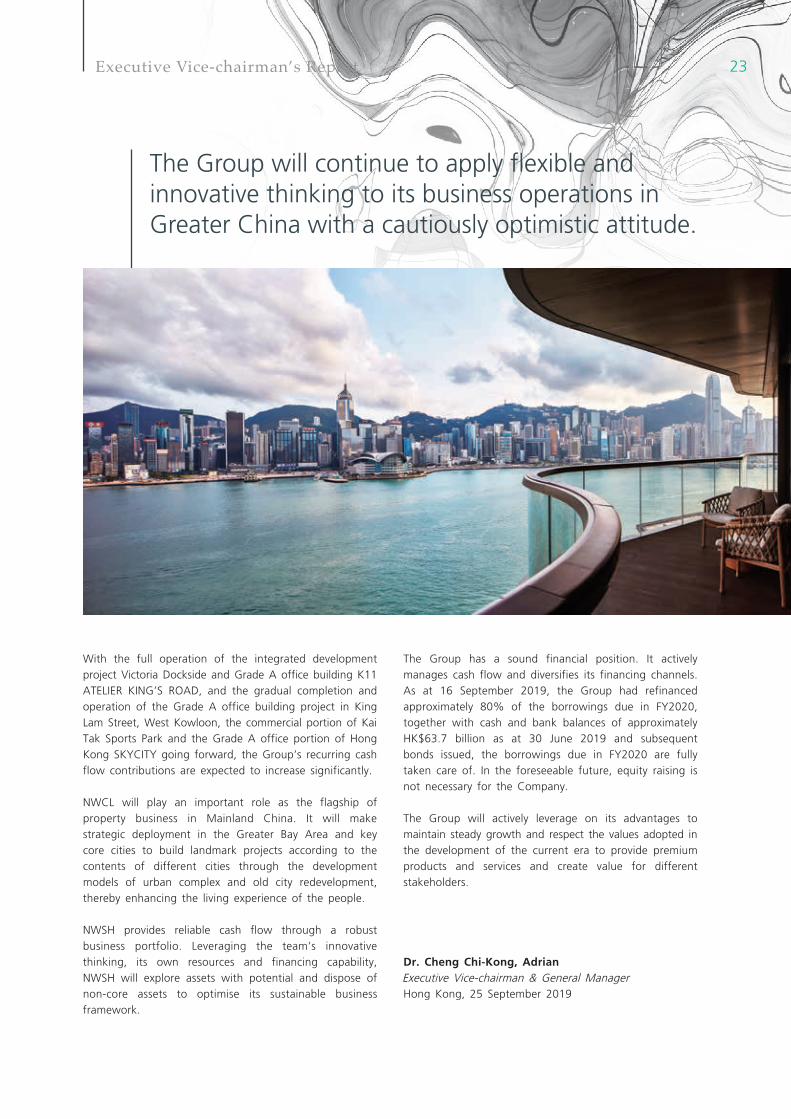
Numerous uncertainties may bring a certain degree of volatility in economic performance. However, the Group will continue to apply flexible and innovative thinking to its business operations in Greater China with a cautiously optimistic attitude.
New
Wor
ld D
evel
opm
ent
Com
pany
Lim
ited
Ann
ual R
epor
t 20
19
22 Executive Vice-chairman’s Report
With the full operation of the integrated development project Victoria Dockside and Grade A office building K11 ATELIER KING’S ROAD, and the gradual completion and operation of the Grade A office building project in King Lam Street, West Kowloon, the commercial portion of Kai Tak Sports Park and the Grade A office portion of Hong Kong SKYCITY going forward, the Group’s recurring cash flow contributions are expected to increase significantly.
NWCL will play an important role as the flagship of property business in Mainland China. It will make strategic deployment in the Greater Bay Area and key core cities to build landmark projects according to the contents of different cities through the development models of urban complex and old city redevelopment, thereby enhancing the living experience of the people.
NWSH provides reliable cash flow through a robust business portfolio. Leveraging the team’s innovative thinking, its own resources and financing capability, NWSH will explore assets with potential and dispose of non-core assets to optimise its sustainable business framework.
The Group has a sound financial position. It actively manages cash flow and diversifies its financing channels. As at 16 September 2019, the Group had refinanced approximately 80% of the borrowings due in FY2020, together with cash and bank balances of approximately HK$63.7 billion as at 30 June 2019 and subsequent bonds issued, the borrowings due in FY2020 are fully taken care of. In the foreseeable future, equity raising is not necessary for the Company.
The Group will actively leverage on its advantages to maintain steady growth and respect the values adopted in the development of the current era to provide premium products and services and create value for different stakeholders.
Dr. Cheng Chi-Kong, Adrian Executive Vice-chairman & General ManagerHong Kong, 25 September 2019
The Group will continue to apply flexible and innovative thinking to its business operations in Greater China with a cautiously optimistic attitude.
23Executive Vice-chairman’s Report
Kowloon
New Territories
Hong Kong Island
Lantau Island
4
3 4
8
121716
1314
15
11
9
67
5
18
2
10
1 2 31
27
18
22
16
26
23
19
24
21
11
17
14 12
1520
25
13
5 6
8
9
7
10
New
Wor
ld D
evel
opm
ent
Com
pany
Lim
ited
Ann
ual R
epor
t 20
19
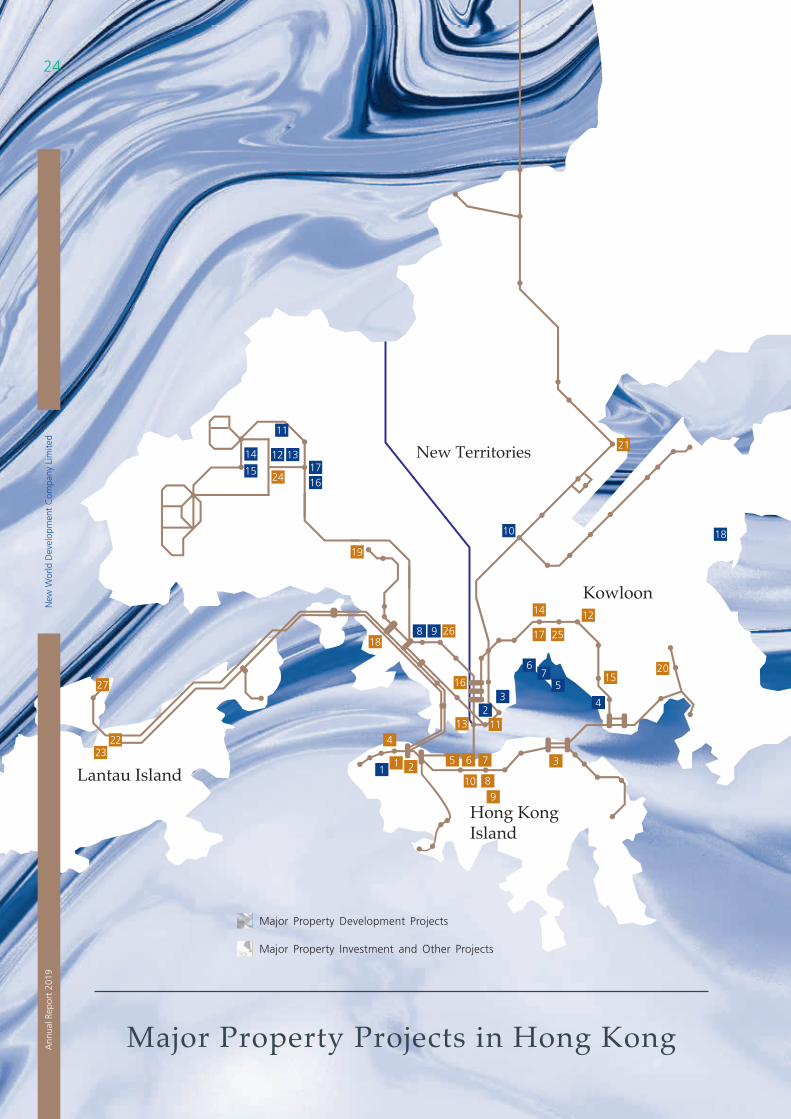
Major Property Projects in Hong Kong
Major Property Development Projects
Major Property Investment and Other Projects
24
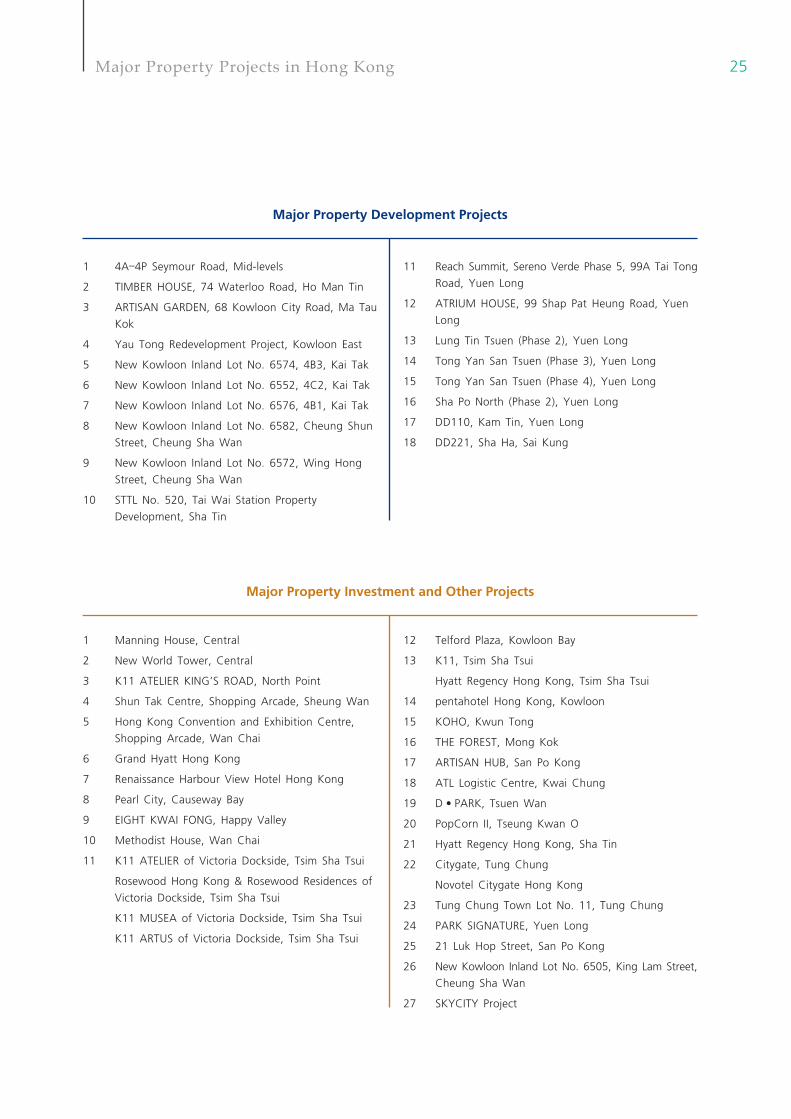
25Major Property Projects in Hong Kong
1 Manning House, Central
2 New World Tower, Central
3 K11 ATELIER KING’S ROAD, North Point
4 Shun Tak Centre, Shopping Arcade, Sheung Wan
5 Hong Kong Convention and Exhibition Centre,
Shopping Arcade, Wan Chai
6 Grand Hyatt Hong Kong
7 Renaissance Harbour View Hotel Hong Kong
8 Pearl City, Causeway Bay
9 EIGHT KWAI FONG, Happy Valley
10 Methodist House, Wan Chai
11 K11 ATELIER of Victoria Dockside, Tsim Sha Tsui
Rosewood Hong Kong & Rosewood Residences of
Victoria Dockside, Tsim Sha Tsui
K11 MUSEA of Victoria Dockside, Tsim Sha Tsui
K11 ARTUS of Victoria Dockside, Tsim Sha Tsui
12 Telford Plaza, Kowloon Bay
13 K11, Tsim Sha Tsui
Hyatt Regency Hong Kong, Tsim Sha Tsui
14 pentahotel Hong Kong, Kowloon
15 KOHO, Kwun Tong
16 THE FOREST, Mong Kok
17 ARTISAN HUB, San Po Kong
18 ATL Logistic Centre, Kwai Chung
19 D • PARK, Tsuen Wan
20 PopCorn II, Tseung Kwan O
21 Hyatt Regency Hong Kong, Sha Tin
22 Citygate, Tung Chung
Novotel Citygate Hong Kong
23 Tung Chung Town Lot No. 11, Tung Chung
24 PARK SIGNATURE, Yuen Long
25 21 Luk Hop Street, San Po Kong
26 New Kowloon Inland Lot No. 6505, King Lam Street,
Cheung Sha Wan
27 SKYCITY Project
1 4A–4P Seymour Road, Mid-levels
2 TIMBER HOUSE, 74 Waterloo Road, Ho Man Tin
3 ARTISAN GARDEN, 68 Kowloon City Road, Ma Tau
Kok
4 Yau Tong Redevelopment Project, Kowloon East
5 New Kowloon Inland Lot No. 6574, 4B3, Kai Tak
6 New Kowloon Inland Lot No. 6552, 4C2, Kai Tak
7 New Kowloon Inland Lot No. 6576, 4B1, Kai Tak
8 New Kowloon Inland Lot No. 6582, Cheung Shun
Street, Cheung Sha Wan
9 New Kowloon Inland Lot No. 6572, Wing Hong
Street, Cheung Sha Wan
10 STTL No. 520, Tai Wai Station Property
Development, Sha Tin
11 Reach Summit, Sereno Verde Phase 5, 99A Tai Tong
Road, Yuen Long
12 ATRIUM HOUSE, 99 Shap Pat Heung Road, Yuen
Long
13 Lung Tin Tsuen (Phase 2), Yuen Long
14 Tong Yan San Tsuen (Phase 3), Yuen Long
15 Tong Yan San Tsuen (Phase 4), Yuen Long
16 Sha Po North (Phase 2), Yuen Long
17 DD110, Kam Tin, Yuen Long
18 DD221, Sha Ha, Sai Kung
Major Property Development Projects
Major Property Investment and Other Projects
18 19
20 21
15
16
17
139
1112
1
5
2 3
6 7
8
4
10
14
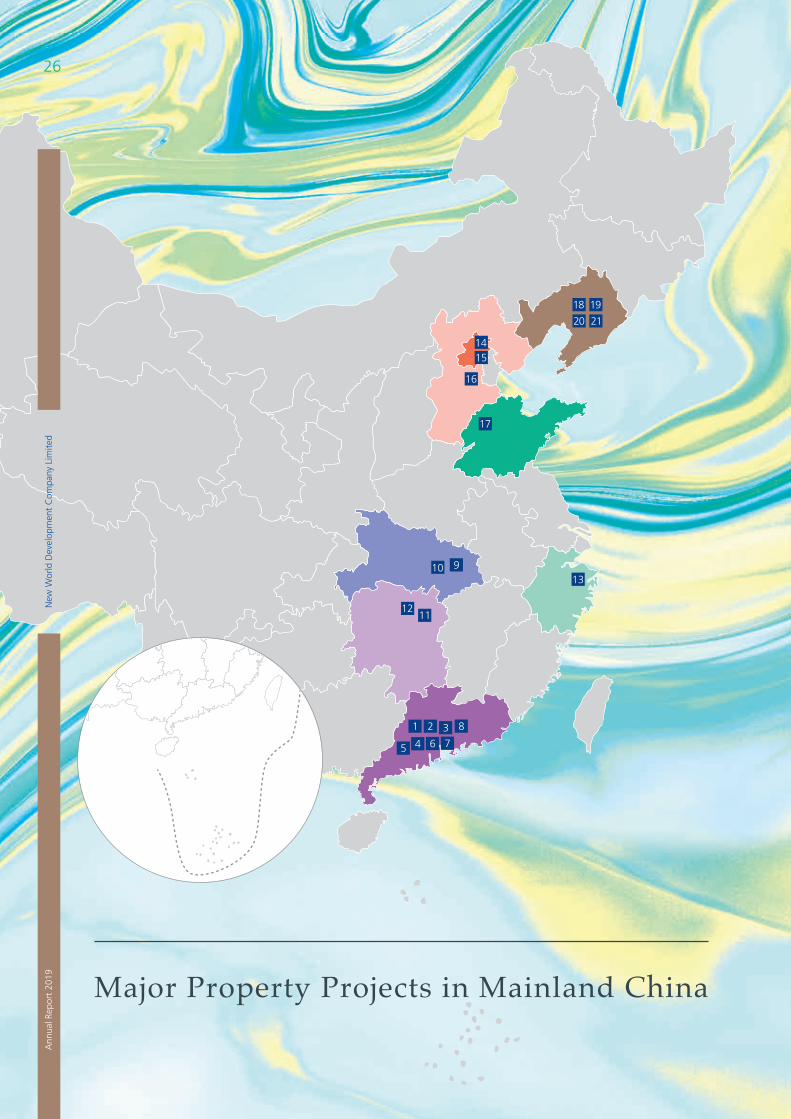
Major Property Projects in Mainland China
New
Wor
ld D
evel
opm
ent
Com
pany
Lim
ited
Ann
ual R
epor
t 20
19
26
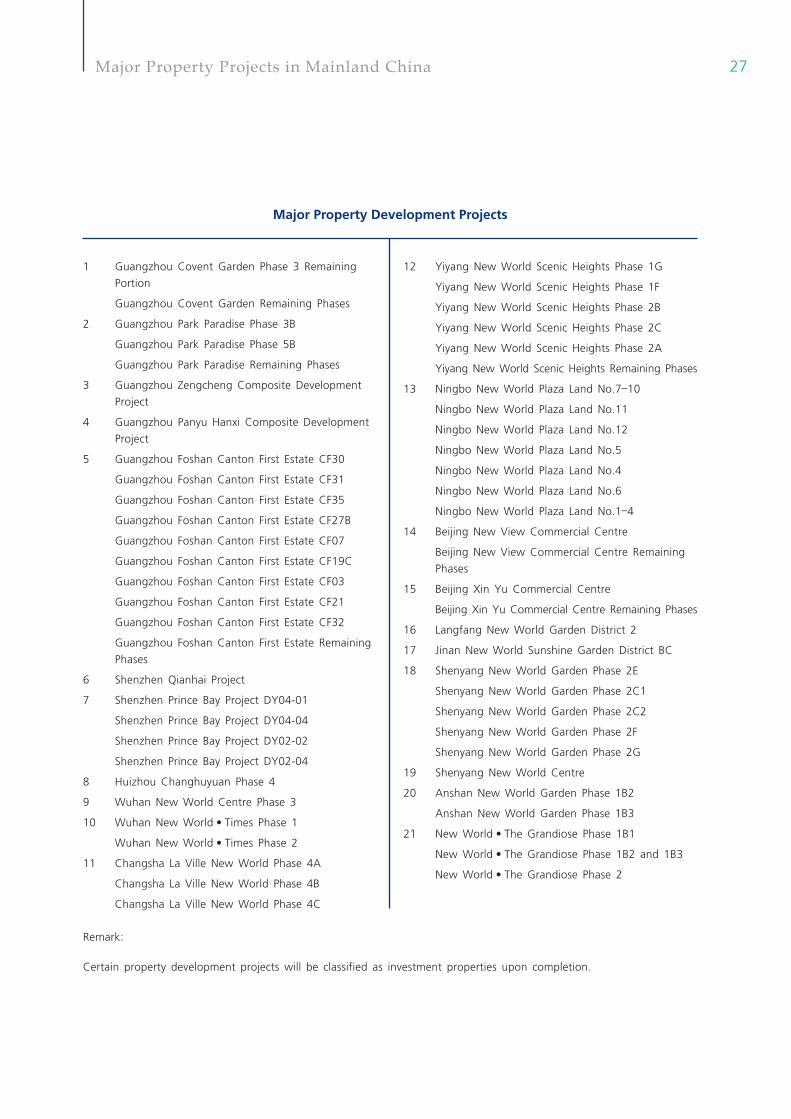
27Major Property Projects in Mainland China
1 Guangzhou Covent Garden Phase 3 Remaining
Portion
Guangzhou Covent Garden Remaining Phases
2 Guangzhou Park Paradise Phase 3B
Guangzhou Park Paradise Phase 5B
Guangzhou Park Paradise Remaining Phases
3 Guangzhou Zengcheng Composite Development
Project
4 Guangzhou Panyu Hanxi Composite Development
Project
5 Guangzhou Foshan Canton First Estate CF30
Guangzhou Foshan Canton First Estate CF31
Guangzhou Foshan Canton First Estate CF35
Guangzhou Foshan Canton First Estate CF27B
Guangzhou Foshan Canton First Estate CF07
Guangzhou Foshan Canton First Estate CF19C
Guangzhou Foshan Canton First Estate CF03
Guangzhou Foshan Canton First Estate CF21
Guangzhou Foshan Canton First Estate CF32
Guangzhou Foshan Canton First Estate Remaining
Phases
6 Shenzhen Qianhai Project
7 Shenzhen Prince Bay Project DY04-01
Shenzhen Prince Bay Project DY04-04
Shenzhen Prince Bay Project DY02-02
Shenzhen Prince Bay Project DY02-04
8 Huizhou Changhuyuan Phase 4
9 Wuhan New World Centre Phase 3
10 Wuhan New World • Times Phase 1
Wuhan New World • Times Phase 2
11 Changsha La Ville New World Phase 4A
Changsha La Ville New World Phase 4B
Changsha La Ville New World Phase 4C
12 Yiyang New World Scenic Heights Phase 1G
Yiyang New World Scenic Heights Phase 1F
Yiyang New World Scenic Heights Phase 2B
Yiyang New World Scenic Heights Phase 2C
Yiyang New World Scenic Heights Phase 2A
Yiyang New World Scenic Heights Remaining Phases
13 Ningbo New World Plaza Land No.7–10
Ningbo New World Plaza Land No.11
Ningbo New World Plaza Land No.12
Ningbo New World Plaza Land No.5
Ningbo New World Plaza Land No.4
Ningbo New World Plaza Land No.6
Ningbo New World Plaza Land No.1–4
14 Beijing New View Commercial Centre
Beijing New View Commercial Centre Remaining
Phases
15 Beijing Xin Yu Commercial Centre
Beijing Xin Yu Commercial Centre Remaining Phases
16 Langfang New World Garden District 2
17 Jinan New World Sunshine Garden District BC
18 Shenyang New World Garden Phase 2E
Shenyang New World Garden Phase 2C1
Shenyang New World Garden Phase 2C2
Shenyang New World Garden Phase 2F
Shenyang New World Garden Phase 2G
19 Shenyang New World Centre
20 Anshan New World Garden Phase 1B2
Anshan New World Garden Phase 1B3
21 New World • The Grandiose Phase 1B1
New World • The Grandiose Phase 1B2 and 1B3
New World • The Grandiose Phase 2
Major Property Development Projects
Remark:
Certain property development projects will be classified as investment properties upon completion.
New
Wor
ld D
evel
opm
ent
Com
pany
Lim
ited
28A
nnua
l Rep
ort
2019
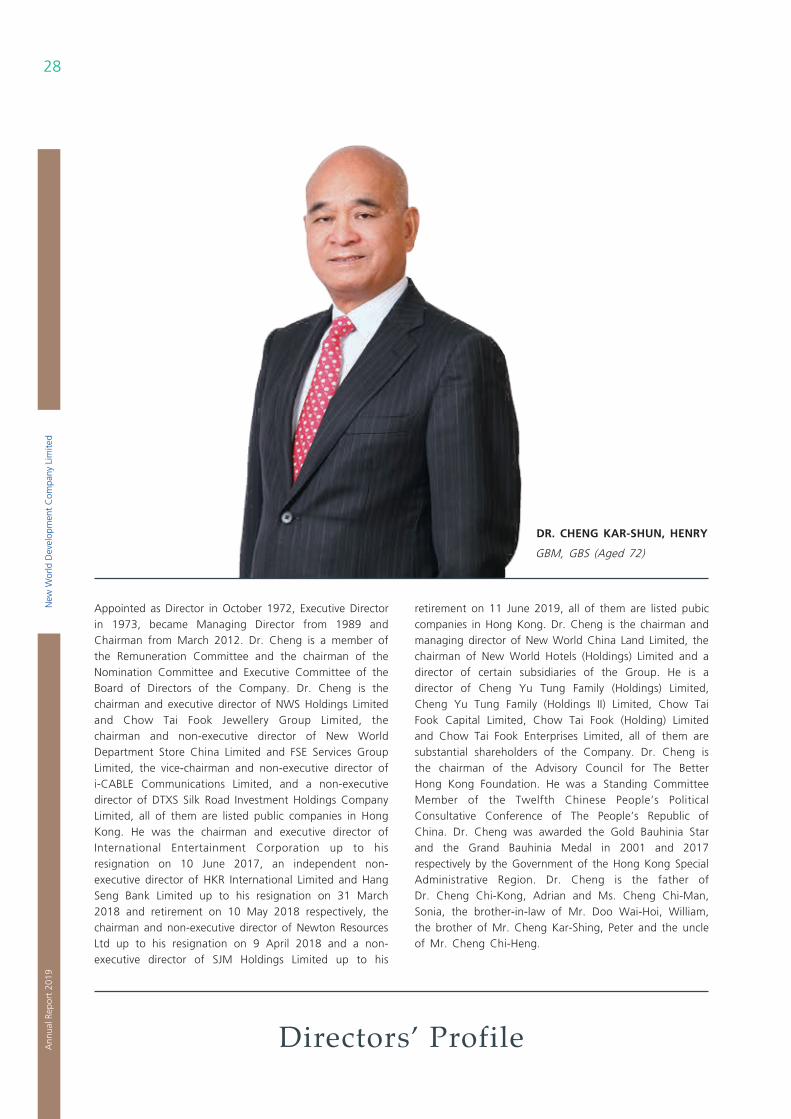
Directors’ Profile
Appointed as Director in October 1972, Executive Director in 1973, became Managing Director from 1989 and Chairman from March 2012. Dr. Cheng is a member of the Remuneration Committee and the chairman of the Nomination Committee and Executive Committee of the Board of Directors of the Company. Dr. Cheng is the chairman and executive director of NWS Holdings Limited and Chow Tai Fook Jewellery Group Limited, the chairman and non-executive director of New World Department Store China Limited and FSE Services Group Limited, the vice-chairman and non-executive director of i-CABLE Communications Limited, and a non-executive director of DTXS Silk Road Investment Holdings Company Limited, all of them are listed public companies in Hong Kong. He was the chairman and executive director of International Entertainment Corporation up to his resignation on 10 June 2017, an independent non-executive director of HKR International Limited and Hang Seng Bank Limited up to his resignation on 31 March 2018 and retirement on 10 May 2018 respectively, the chairman and non-executive director of Newton Resources Ltd up to his resignation on 9 April 2018 and a non-executive director of SJM Holdings Limited up to his
retirement on 11 June 2019, all of them are listed pubic companies in Hong Kong. Dr. Cheng is the chairman and managing director of New World China Land Limited, the chairman of New World Hotels (Holdings) Limited and a director of certain subsidiaries of the Group. He is a director of Cheng Yu Tung Family (Holdings) Limited, Cheng Yu Tung Family (Holdings II) Limited, Chow Tai Fook Capital Limited, Chow Tai Fook (Holding) Limited and Chow Tai Fook Enterprises Limited, all of them are substantial shareholders of the Company. Dr. Cheng is the chairman of the Advisory Council for The Better Hong Kong Foundation. He was a Standing Committee Member of the Twelfth Chinese People’s Political Consultative Conference of The People’s Republic of China. Dr. Cheng was awarded the Gold Bauhinia Star and the Grand Bauhinia Medal in 2001 and 2017 respectively by the Government of the Hong Kong Special Administrative Region. Dr. Cheng is the father of Dr. Cheng Chi-Kong, Adrian and Ms. Cheng Chi-Man, Sonia, the brother-in-law of Mr. Doo Wai-Hoi, William, the brother of Mr. Cheng Kar-Shing, Peter and the uncle of Mr. Cheng Chi-Heng.
DR. CHENG KAR-SHUN, HENRY
GBM, GBS (Aged 72)
29Directors’ Profile
MR. DOO WAI-HOI, WILLIAM
JP (Aged 75)
DR. CHENG CHI-KONG, ADRIAN
JP (Aged 39)
Appointed as the Vice-chairman and Non-executive Director in July 2013. Mr. Doo is also a non-executive director of Lifestyle International Holdings Limited and an independent non-executive director of Shanghai Industrial Urban Development Group Limited, both being listed public companies in Hong Kong. Mr. Doo was an independent non-executive director of The Bank of East Asia, Limited, a listed public company in Hong Kong, up to his resignation on 18 February 2017. Mr. Doo is also a director of certain subsidiaries of the Group. He is the chairman and director of Fungseng Prosperity Holdings Limited. Mr. Doo is a Justice of the Peace appointed by the Government of the Hong Kong Special Administrative Region. He is also the Honorary Consul General of the Kingdom of Morocco in Hong Kong and Macau, and a Governor of the Canadian Chamber of Commerce in Hong Kong. He was further promoted to the Officier de l’Ordre National de la Légion d’Honneur by the Republic of France in 2019. Mr. Doo is the brother-in-law of Dr. Cheng Kar-Shun, Henry and Mr. Cheng Kar-Shing, Peter, and the uncle of Dr. Cheng Chi-Kong, Adrian, Ms. Cheng Chi-Man, Sonia and Mr. Cheng Chi-Heng.
Appointed as an Executive Director in March 2007, became Executive Director and Joint General Manager from March 2012, re-designated as Executive Vice-chairman and Joint General Manager from April 2015 and re-designated as Executive Vice-chairman and General Manager from March 2017. Dr. Adrian Cheng is a member of the Executive Committee and the chairman of the Sustainability Committee of the Board of Directors of the Company. Dr. Cheng is an executive director of New World Department Store China Limited and Chow Tai Fook Jewellery Group Limited, and a non-executive director of Giordano International Limited and New Century Healthcare Holding Co. Limited, all being listed public companies in Hong Kong. He was an executive director of International Entertainment Corporation, a non-executive vice chairman of Modern Media Holdings Limited and a non-executive director of i-CABLE Communications Limited, all being listed public companies in Hong Kong, up to his resignation on 10 June 2017, 26 August 2017 and 2 July 2019 respectively. He is a director of Chow Tai Fook (Holding) Limited and Chow Tai Fook Enterprises Limited, both are substantial shareholders of the Company. Dr. Cheng is also the chairman of New World Group Charity Foundation Limited, an executive director of New World China Land Limited and a director of certain subsidiaries of the Group.
Dr. Cheng oversees the strategic direction for the Company’s property development and investment activities. He has launched New World’s The Artisanal Movement since January 2015, and is currently overseeing the Company’s large-scale developments including Victoria Dockside and Skycity. In 2008, Dr. Cheng launched the K11 brand, a museum-retail complex that is at the nexus of art and commerce and has since extended K11’s reach across retail, hospitality, offices and non-profit art education through K11 Art Foundation. He also directs early-stage funding to start-ups and technology-driven platforms.
He is the vice-chairman of All-China Youth Federation, a member of the Tianjin Municipal Committee of The Chinese People’s Political Consultative Conference, the chairman of China Young Leaders Foundation and the honorary chairman of K11 Art Foundation. He was acknowledged by Fortune as one of “40 Under 40” global business stars and a “Young Global Leader” by the World Economic Forum in 2012. In 2016, he was appointed as the Justice of Peace by the Government of the Hong Kong Special Administrative Region and was made an Officier in the Ordre des Arts et des Lettres by the French Government in 2017. Dr. Cheng holds a Bachelor of Arts Degree (cum laude) from Harvard University, and was conferred the Honorary Doctorate of Humanities by the Savannah College of Art and Design in 2014. Dr. Cheng worked in a major international bank prior to joining the Group in September 2006 and has substantial experience in corporate finance. He is the son of Dr. Cheng Kar-Shun, Henry, the brother of Ms. Cheng Chi-Man, Sonia, the nephew of Mr. Doo Wai-Hoi, William and Mr. Cheng Kar-Shing, Peter, and the cousin of Mr. Cheng Chi-Heng.
New
Wor
ld D
evel
opm
ent
Com
pany
Lim
ited
30A
nnua
l Rep
ort
2019
Directors’ Profile
Appointed as a Director in November 1985. Mr. Yeung is a member of the Audit Committee and the Remuneration Committee of the Board of Directors of the Company. He is also an independent non-executive director of Miramar Hotel and Investment Company, Limited, a listed public company in Hong Kong.
MR. YEUNG PING-LEUNG, HOWARD
(Aged 62)
MR. CHA MOU-SING, PAYSON
JP (Aged 77)
Appointed as a Director in April 1989. Mr. Cha is a member of the Audit Committee, the Remuneration Committee and the Sustainability Committee of the Board of Directors of the Company. Mr. Cha is also the chairman of HKR International Limited, the non-executive chairman of Hanison Construction Holdings Limited and Million Hope Industries Holdings Limited, all of them are listed public companies in Hong Kong. Mr. Cha was an independent non-executive director of Munsun Capital Group Limited (formerly known as China Precious Metal Resources Holdings Co., Ltd.), a listed public company in Hong Kong, up to his resignation on 23 December 2016. He is also an independent non-executive director of Eagle Asset Management (CP) Limited — Manager of Champion Real Estate Investment Trust which is listed on The Stock Exchange of Hong Kong Limited, the chairman of Mingly Corporation and an independent non-executive director of Hong Kong International Theme Parks Limited.
31Directors’ Profile
MR. CHENG KAR-SHING, PETER
(Aged 67)
Appointed as a Director in October 1994. Mr. Cheng is also an independent non-executive director of King Fook Holdings Limited, a listed public company in Hong Kong. He is a director of Cheng Yu Tung Family (Holdings) Limited, Cheng Yu Tung Family (Holdings II) Limited, Chow Tai Fook Capital Limited, Chow Tai Fook (Holding) Limited and Chow Tai Fook Enterprises Limited, all of them are substantial shareholders of the Company. Mr. Cheng is an executive director of New World China Land Limited, a director of New World Hotels (Holdings) Limited, NWS Service Management Limited and certain subsidiaries of the Group. Mr. Cheng is committed to community services and is serving as the chairman of Chow Tai Fook Charity Foundation, the chairman of Chow Tai Fook Medical Foundation Limited, the chairman of Antonia Welfare Fund Limited, the vice-chairman of Hong Kong Economic Exchange and a director of Green Council. He is the University Assembly member of University of Macau. He is a Fellow of The Hong Kong Institution of Engineers, Hong Kong Institute of Arbitrators, Hong Kong Construction Arbitration Centre and The Chartered Institute of Arbitrators. He is a CEDR Accredited Mediator and on the lists of the Mediators of Hong Kong Mediation Accreditation Association Limited, Hong Kong International Arbitration Centre, Hong Kong Mediation Centre and Financial Dispute Resolution Centre. He is on the Panel of Arbitrators of South China International Economic and Trade Arbitration Commission/Shenzhen Court of International Arbitration and an Arbitrator of Huizhou Arbitration Commission as well as a Member of Society of Construction Law Hong Kong. Mr. Cheng is the brother of Dr. Cheng Kar-Shun, Henry, the brother-in-law of Mr. Doo Wai-Hoi, William, the father of Mr. Cheng Chi-Heng, and the uncle of Dr. Cheng Chi-Kong, Adrian and Ms. Cheng Chi-Man, Sonia.
MR. CHA MOU-ZING, VICTOR
(Alternate Director to Mr. Cha Mou-Sing, Payson)
(Aged 69)
Appointed as an Alternate Director in September 2000. Mr. Cha is the deputy chairman and managing director of HKR International Limited, a listed public company in Hong Kong. He was an independent non-executive director of SOHO China Limited, a listed public company in Hong Kong, up to his resignation on 17 August 2018. He has extensive experience in the textile manufacturing and real estate businesses.
New
Wor
ld D
evel
opm
ent
Com
pany
Lim
ited
32A
nnua
l Rep
ort
2019
Directors’ Profile
MR. HO HAU-HAY, HAMILTON
(Aged 68)
Appointed as a Non-executive Director in August 2004 and was re-designated as Independent Non-executive Director in November 2007. Mr. Ho was an Alternate Director of the Company from 7 January 2004 to 29 August 2004. Mr. Ho is the chairman of the Remuneration Committee and a member of the Audit Committee of the Board of Directors of the Company. He is also an independent non-executive director of King Fook Holdings Limited (a listed public company in Hong Kong), and an executive director of Honorway Investments Limited and Tak Hung (Holding) Company Limited.
MR. LEE LUEN-WAI, JOHN
BBS, JP (Aged 70)
Appointed as an Independent Non-executive Director in August 2004. Mr. Lee is the chairman of the Audit Committee, and a member of the Remuneration Committee and the Nomination Committee of the Board of Directors of the Company. Mr. Lee is the managing director and chief executive officer of Lippo Limited, an executive director and the chief executive officer of Lippo China Resources Limited and Hongkong Chinese Limited, as well as an independent non-executive director of UMP Healthcare Holdings Limited, all being listed public companies in Hong Kong. Mr. Lee was a non-executive non-independent chairman of Healthway Medical Corporation Limited, a company listed on the sponsor-supervised listing platform of the Singapore Exchange Securities Trading Limited, up until his retirement on 26 April 2019. Mr. Lee is a Fellow of The Institute of Chartered Accountants in England and Wales, the Association of Chartered Certified Accountants and the Hong Kong Institute of Certified Public Accountants. He was a partner of Price Waterhouse (now PricewaterhouseCoopers) in Hong Kong and has extensive experience in corporate finance and capital markets. Mr. Lee is an Honorary Fellow of the City University of Hong Kong and a Justice of Peace in Hong Kong. He serves as a member on a number of Public Boards and Committees including the Chairman of the Investment Committee of the Hospital Authority Provident Fund Scheme, a member of the Public Service Commission and the Chairman of the Hospital Governing Committee of Hong Kong Children’s Hospital.
33Directors’ Profile
MR. LIANG CHEUNG-BIU, THOMAS
(Aged 72)
Appointed as a Non-executive Director in August 2004 and was re-designated as Independent Non-executive Director in March 2012. Mr. Liang is a member of the Audit Committee and the Nomination Committee of the Board of Directors of the Company. Mr. Liang is an independent non-executive director of Miramar Hotel and Investment Company, Limited (a listed public company in Hong Kong) and the group chief executive of Wideland Investors Limited. Mr. Liang is a member of the Council of The Chinese University of Hong Kong, a member of the Court of the Hong Kong Baptist University and a member of the Board of Governors, The Hang Seng University of Hong Kong. He has extensive experience in financial management, corporate finance, banking, real estate development and equity investment.
MS. KI MAN-FUNG, LEONIE
GBS, SBS, JP (Aged 72)
Appointed as a Non-executive Director in December 2008 and was re-designated as Executive Director in March 2012 and re-designated as Non-executive Director in June 2018. Ms. Ki has been the managing director of New World China Enterprises Projects Limited (a subsidiary of the Company) since 1997 and is also a director of certain subsidiaries of the Group. Ms. Ki is an independent non-executive director of Sa Sa International Holdings Limited, a listed public company in Hong Kong. She was an independent non-executive director of Clear Media Limited (a listed public company in Hong Kong) up to her retirement on 7 September 2019. Ms. Ki is also a director of Chow Tai Fook Charity Foundation. Ms. Ki has more than 30 years’ experience in integrated communication and marketing services. She was the founder, partner and chairman/chief executive officer of Grey Hong Kong Advertising Limited and Grey China Advertising Limited. Ms. Ki is committed to the community and public services. She was the first chief executive of The Better Hong Kong Foundation. She is currently a director of PMQ Management Company Limited, founder and honorable president of Wu Zhi Qiao Charitable Foundation, a member of the Asian Advisory Board of Cheng Yu Tung Management Institute, Richard Ivey School of Business (University of Western Ontario, Canada), a member of the Advisory Board of the EMBA Programme of The Chinese University of Hong Kong, the honorary consultant for the School of Hip Hop of Youth Outreach and a member of Hong Kong Institute of Construction Management Board. Ms. Ki is a recipient of Honorary University Fellowship from The Open University of Hong Kong and The University of Hong Kong. She has been awarded the honour of Beta Gamma Sigma by the Faculty of Business Administration of The Chinese University of Hong Kong, and Justice of the Peace, the Silver Bauhinia Star and the Gold Bauhinia Star by the Government of the Hong Kong Special Administrative Region. She was a National Committee Member of the 12th Chinese People’s Political Consultative Conference (CPPCC) of The People’s Republic of China and a member of the 10th, 11th and 12th CPPCC of Yunnan Provincial Committee.
New
Wor
ld D
evel
opm
ent
Com
pany
Lim
ited
34A
nnua
l Rep
ort
2019
Directors’ Profile
MR. CHENG CHI-HENG
(Aged 41)
Appointed as an Executive Director in June 2010. Mr. Cheng is a member of the Executive Committee of the Board of Directors of the Company. He also acts as director of certain subsidiaries of the Group. Mr. Cheng is an executive director of Chow Tai Fook Jewellery Group Limited, a listed public company in Hong Kong. Mr. Cheng is a director of Chow Tai Fook (Holding) Limited and Chow Tai Fook Enterprises Limited, both are substantial shareholders of the Company. Mr. Cheng worked in Yu Ming Investment Management Limited from 1999 to 2000 as a corporate finance executive. He obtained his Bachelor of Arts Degree majoring in Economics from the University of Western Ontario, Canada in 1999. He is the son of Mr. Cheng Kar-Shing, Peter, the nephew of Dr. Cheng Kar-Shun, Henry and Mr. Doo Wai-Hoi, William, and the cousin of Dr. Cheng Chi-Kong, Adrian and Ms. Cheng Chi-Man, Sonia.
MS. CHENG CHI-MAN, SONIA
(Aged 38)
Appointed as an Executive Director in March 2012. Ms. Cheng is a member of the Executive Committee of the Board of Directors of the Company. She currently oversees the hotel division and the project management division of the Group. She is an executive director of New World China Land Limited and a director of certain subsidiaries of the Group. Ms. Cheng is a non-executive director of Chow Tai Fook Jewellery Group Limited, a listed public company in Hong Kong. Before joining the Group in 2008, Ms. Cheng worked in a major international investment bank and a global US private equity firm specialising in real estate investments. Ms. Cheng holds a Bachelor of Arts Degree with a concentration in Applied Mathematics from Harvard University in the U.S.A. Ms. Cheng is the chief executive officer of Rosewood Hotel Group, chairman of the advisory committee of the School of Hotel and Tourism Management at The Chinese University of Hong Kong and member of the advisory committee of the School of Hotel & Tourism Management Industry at The Hong Kong Polytechnic University. She is a member of the Y. Elites Association, the Young Presidents’ Organization and the Hong Kong United Youth Association, and a non-official member of the Family Council and the Advisory Committee on Gifted Education. Ms. Cheng is the daughter of Dr. Cheng Kar-Shun, Henry, the sister of Dr. Cheng Chi-Kong, Adrian, the niece of Mr. Doo Wai-Hoi, William and Mr. Cheng Kar-Shing, Peter, and the cousin of Mr. Cheng Chi-Heng.
35Directors’ Profile
MR. AU TAK-CHEONG
(Aged 67)
Appointed as an Executive Director in July 2013. Mr. Au is a member of the Executive Committee of the Board of Directors of the Company. Mr. Au joined the Company in 1975. He is currently the Head of the Finance and Accounts and senior management of the Company and is responsible for overseeing compliance of policy and procedures in relation to accounting matters of the Group. Mr. Au possesses over 40 years of experience in finance and accounting and treasury. He is also a non-executive director of New World Department Store China Limited, a listed public company in Hong Kong, and a director of certain subsidiaries of the Group.
MR. SITT NAM-HOI
(Aged 65)
Appointed as an Executive Director in June 2018. Mr. Sitt is a member of the Executive Committee and the Sustainability Committee of the Board of Directors of the Company. Mr. Sitt joined the Group and was appointed as Head of Projects (Hong Kong) of the Company in February 2011. He is currently the senior director of the Project Management Department of the Company, director and chief design officer of New World China Land Limited and director of certain subsidiaries of the Group. Before joining the Company, he was the project director of a listed public company in Hong Kong which he worked for over 25 years. Before that, Mr. Sitt had been working in Buildings Department of the Government of the Hong Kong Special Administrative Region. Mr. Sitt obtained his Bachelor of Architecture and Bachelor of Arts in Architectural Studies from the University of Hong Kong. He is a Registered Architect, an Authorised Person and is responsible for overseeing all project management matters for all property development projects of the Group in Hong Kong. He has extensive project management experience and participated in various significant projects in Hong Kong and mainland China.
New
Wor
ld D
evel
opm
ent
Com
pany
Lim
ited
36A
nnua
l Rep
ort
2019
Directors’ Profile
MR. SO CHUNG-KEUNG, ALFRED
(Aged 70)
Appointed as an Executive Director in June 2018. Mr. So is a member of the Executive Committee of the Board of Directors of the Company. Mr. So joined the Group as the chief executive officer of New World China Land Limited in January 2016. He is currently the director and chief executive officer of New World China Land Limited and a director of certain subsidiaries of the Group. Prior to joining the Group, Mr. So worked with a listed company in Hong Kong for over 30 years, he was a member of its executive committee, and also served as executive director and non-executive director of its subsidiaries. Mr. So was also appointed as adviser to a mainland China property developer listed in Hong Kong. Mr. So holds a Master of Science degree in Mathematics from the University of Toronto. He has extensive experience in the business world as a veteran property development professional, having played pivotal roles in launching a host of significant projects in both Hong Kong and mainland China.
MR. IP YUK-KEUNG
(Aged 67)
Appointed as an Independent Non-executive Director in June 2018. Mr. Ip is a member of the Audit Committee, the Nomination Committee and the Sustainability Committee of the Board of Directors of the Company. Mr. Ip is an independent non-executive director of TOM Group Limited, Power Assets Holdings Limited and Lifestyle International Holdings Limited, all being listed public companies in Hong Kong. He is also a non-executive director of Eagle Asset Management (CP) Limited, as manager of Champion Real Estate Investment Trust (a listed real estate investment trust). He was the executive director and chief executive officer of LHIL Manager Limited which is the trustee-manager of Langham Hospitality Investments (a listed fixed single investment trust) and Langham Hospitality Investments Limited until his resignation on 1 April 2019. In addition, he was an independent non-executive director of AEON Credit Service (Asia) Company Limited (a listed public company in Hong Kong), Shenzhen Investment Holdings Bay Area Development Company Limited (formerly known as Hopewell Highway Infrastructure Limited, a listed public company in Hong Kong) and Hopewell Holdings Limited (a listed public company in Hong Kong until its delisting on 3 May 2019) up to his resignation in September 2016, May 2018 and May 2019 respectively. Mr. Ip is an international banking and real estate executive with 33 years of experience at Citigroup, First National Bank of Chicago, Wells Fargo and Merrill Lynch in Hong Kong, Asia and the United States. His areas of expertise are in real estate, corporate banking, risk management, transaction banking and wealth management. Mr. Ip is an Honorary Professor of Business of Lingnan University, a Professor of Practice (International Banking and Real Estate) at The Hong Kong Polytechnic University, an Adjunct Professor of City University of Hong Kong, The Hong Kong University of Science and Technology, The Hang Seng University of Hong Kong and the School of Hotel and Tourism Management at The Chinese University of Hong Kong, an Adjunct Distinguished Professor in Practice of University of Macau, a Council Member of The Hong Kong University of Science and Technology, Honorary Advisor of School of Humanities and Social Science at The Hong Kong University of Science and Technology, a trustee of the Board of Trustees at Washington University in St. Louis, and a Vice Chairman of the Board of Governors of World Green Organization Limited. He is a member of the Committee on Certification for Principalship under the Education Bureau of the Government of the Hong Kong Special Administrative Region. Mr. Ip holds a Bachelor of Science degree at Washington University in St. Louis (summa cum laude) and Master of Science degrees at Cornell University and Carnegie-Mellon University. He is an Honorary Fellow of Vocational Training Council.
37
Senior Management Profile
MR. WONG MAN-HOI
BSc(Eng)(Hon), LLB(Hon)
(Aged 60)
MS. LO PUI-YING
(Aged 69)
Note: The above members of the senior management are senior functional directors of the Company. Various businesses and corporate functions of the Group are under the responsibility of other heads of business units and functional departments.
Appointed as the Company Secretary of the Company in January 2011. Mr. Wong joined the Company in November 2000 and has headed the Legal Department (now Legal and Company Secretarial Department) since November 2001. Mr. Wong is a member of the Law Society of Hong Kong and has been a qualified solicitor in Hong Kong since 1994. Before joining the Company, Mr. Wong worked as a solicitor specialising in real estate practice. Mr. Wong obtained his Bachelor of Science (Engineering) Degree from the University of Hong Kong in 1981, Bachelor of Laws Degree from the University of London in 1990 and passed the Solicitors’ Final Examination of the Law Society of England and Wales in 1992.
Ms. Lo is currently the Owners’ Representative-Hotel Division of the Company. Ms. Lo has been in the hotel industry since 1969 and held various positions in the Hyatt Regency and Excelsior hotels before joining the Group in 1978. Ms. Lo acted as the financial controller of the New World Hotel in Kowloon for three years before joining New World Harbour View Hotel (later renamed Renaissance Harbour View Hotel) in 1988 as Director of Finance. She also held a group controller position for New World Hotels International Limited (a former hotel management company of the Company) until 1997 when the position ceased to exist. Ms. Lo joined Foreign Holiday Philippines, Inc. and Marina Square Properties, Inc. in 2003 and 2005, respectively, as group financial controller, treasurer and co-leader of the pre-opening and operation team for a hotel and casino property investment in the Philippines. She rejoined the Company in 2007. Ms. Lo has previously been certified as a Certified Hotel Administrator (CHA) in the American Hotel and Motel Association (AHMA) from November 1990 to October 2000. She has also previously acted as a Fellow and Founder Member of the Hotel Controllers & Accountants Association (Hong Kong) founded in 1991. She has served respectively a member of Management Committee and Executive Committee of The Federation of Hong Kong Hotel Owners in 2012 and 2014 till now.
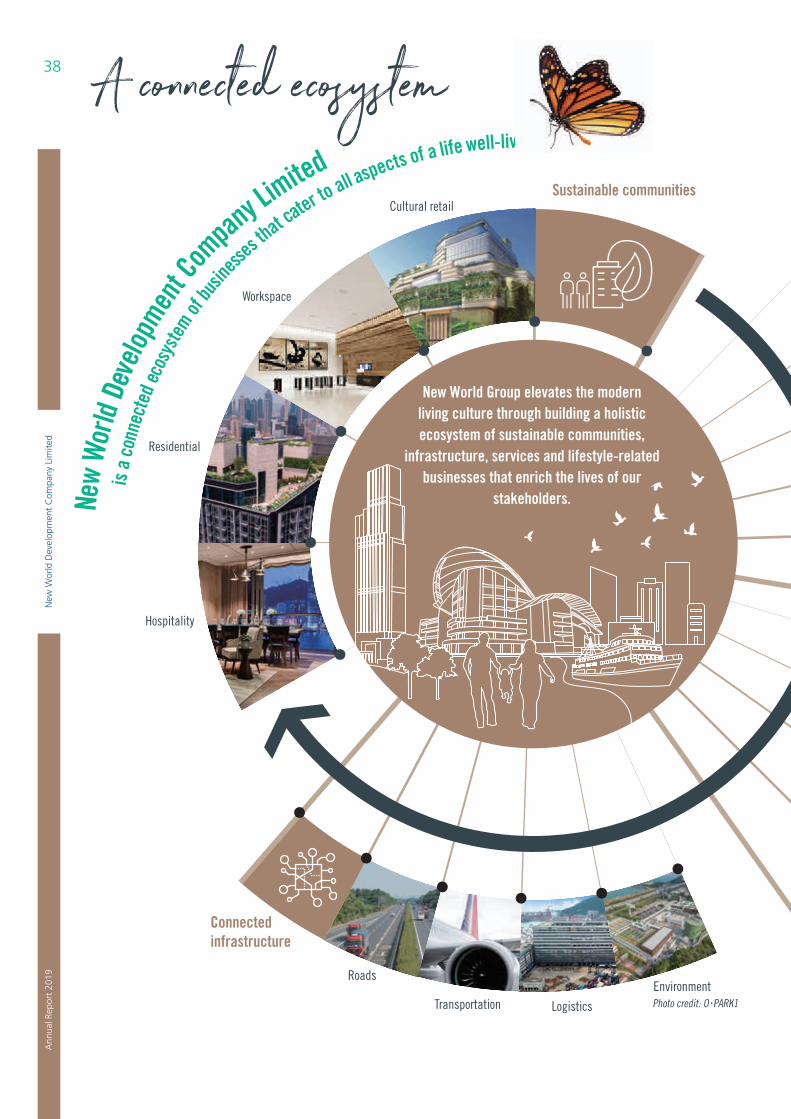
Connected infrastructure
Roads
Transportation Logistics
EnvironmentPhoto credit: O .PARK1
Sustainable communitiesCultural retail
Workspace
Residential
Hospitality
New World Group elevates the modern living culture through building a holistic ecosystem of sustainable communities,
infrastructure, services and lifestyle-related businesses that enrich the lives of our
stakeholders.
is a
conn
ecte
d eco
syste
m of bu
siness
es that ca
ter to all aspects of a life well-lived.
New
Wor
ld De
velop
ment C
ompan
y Limited
New
Wor
ld D
evel
opm
ent
Com
pany
Lim
ited
38A
nnua
l Rep
ort
2019
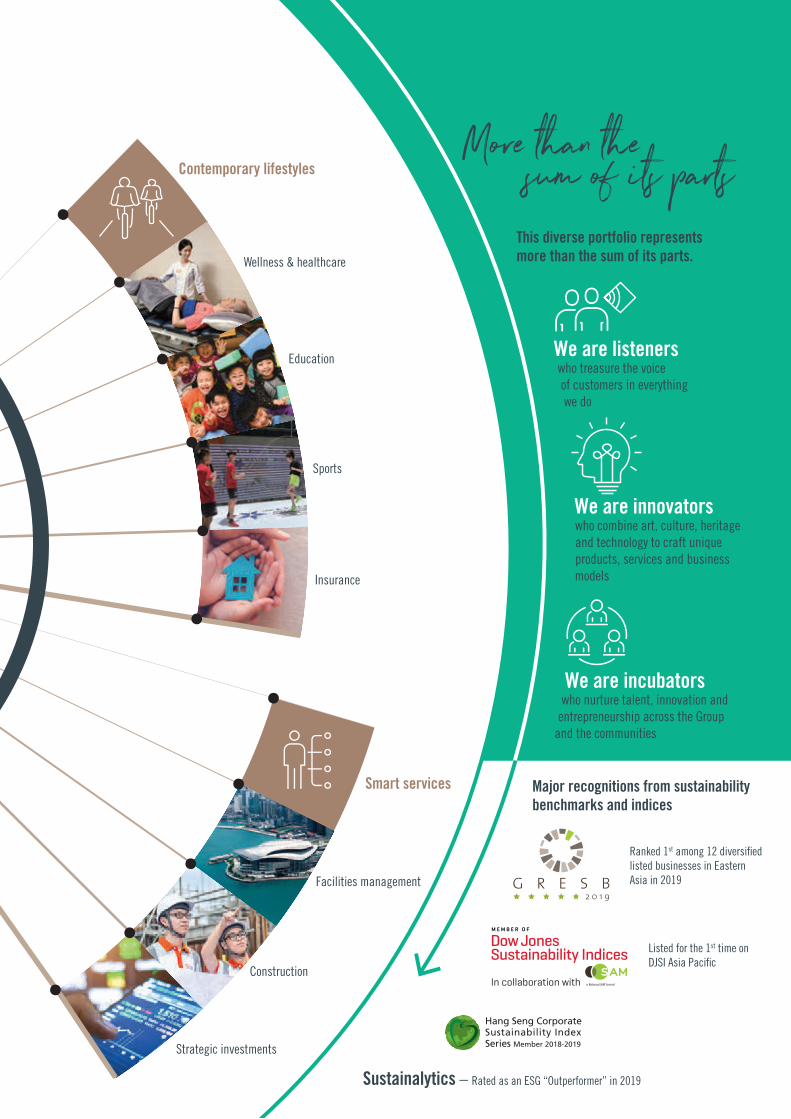
Contemporary lifestyles
Education
Sports
Insurance
Wellness & healthcare
Smart services
Strategic investments
Construction
Facilities management
We are listeners who treasure the voice of customers in everything we do
We are innovators who combine art, culture, heritage and technology to craft unique products, services and business models
We are incubatorswho nurture talent, innovation and
entrepreneurship across the Group and the communities
Major recognitions from sustainability benchmarks and indices
This diverse portfolio represents more than the sum of its parts.
Listed for the 1st time on DJSI Asia Pacific
Sustainalytics – Rated as an ESG “Outperformer” in 2019
Ranked 1st among 12 diversified listed businesses in Eastern Asia in 2019
39
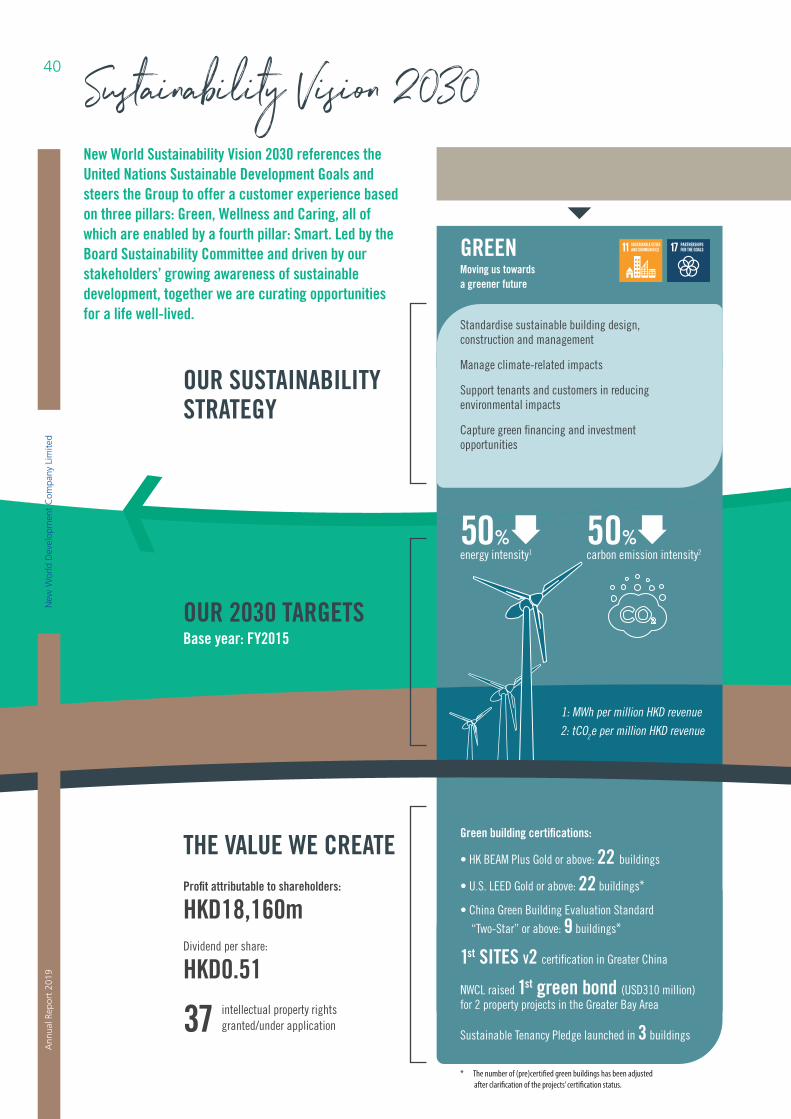
New World Sustainability Vision 2030 references the United Nations Sustainable Development Goals and steers the Group to offer a customer experience based on three pillars: Green, Wellness and Caring, all of which are enabled by a fourth pillar: Smart. Led by the Board Sustainability Committee and driven by our stakeholders’ growing awareness of sustainable development, together we are curating opportunitiesfor a life well-lived.
OUR SUSTAINABILITY STRATEGY
OUR 2030 TARGETSBase year: FY2015
GREENMoving us towards a greener future
1: MWh per million HKD revenue 2: tCO2e per million HKD revenue
Standardise sustainable building design, construction and management
Manage climate-related impacts
Support tenants and customers in reducing environmental impacts
Capture green financing and investment opportunities
Profit attributable to shareholders:
HKD18,160mDividend per share:
HKD0.51
37 intellectual property rights granted/under application
Green building certifications:
• HK BEAM Plus Gold or above: 22 buildings
• U.S. LEED Gold or above: 22 buildings* • China Green Building Evaluation Standard
“Two-Star” or above: 9 buildings*
1st SITES V2 certification in Greater China
NWCL raised 1st green bond (USD310 million) for 2 property projects in the Greater Bay Area
Sustainable Tenancy Pledge launched in 3 buildings
50% energy intensity1
50% carbon emission intensity2
THE VALUE WE CREATE
* The number of (pre)certified green buildings has been adjusted after clarification of the projects’ certification status.
New
Wor
ld D
evel
opm
ent
Com
pany
Lim
ited
40A
nnua
l Rep
ort
2019
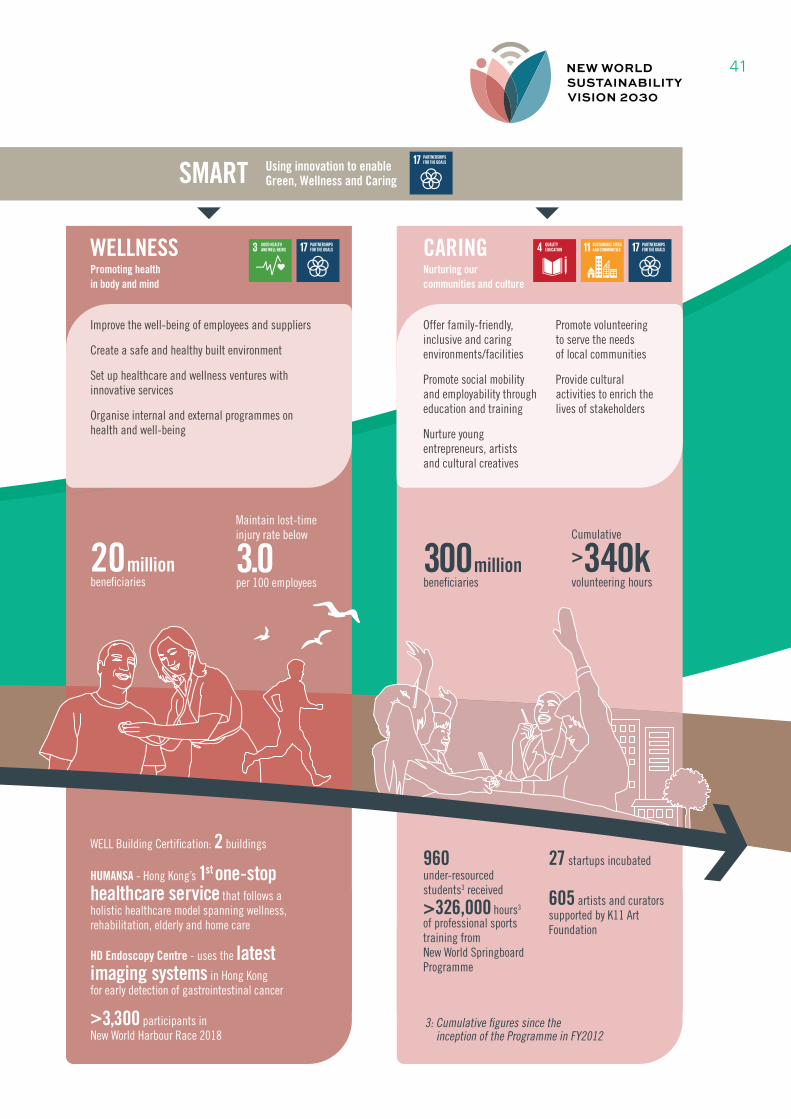
Using innovation to enable Green, Wellness and CaringSMART
WELLNESSPromoting health in body and mind
CARINGNurturing our communities and culture
20 million beneficiaries
300 million beneficiaries
Cumulative
>340k volunteering hours
Maintain lost-time injury rate below
3.0per 100 employees
Improve the well-being of employees and suppliers
Create a safe and healthy built environment
Set up healthcare and wellness ventures with innovative services
Organise internal and external programmes on health and well-being
Offer family-friendly, inclusive and caring environments/facilities
Promote social mobility and employability through education and training
Nurture young entrepreneurs, artists and cultural creatives
Promote volunteering to serve the needs of local communities
Provide cultural activities to enrich the lives of stakeholders
960 under-resourced students3 received
>326,000 hours3 of professional sports training from New World Springboard Programme
27 startups incubated
605 artists and curators supported by K11 Art Foundation
WELL Building Certification: 2 buildings
HUMANSA - Hong Kong’s 1st one-stop healthcare service that follows a holistic healthcare model spanning wellness, rehabilitation, elderly and home care
HD Endoscopy Centre - uses the latest imaging systems in Hong Kong for early detection of gastrointestinal cancer
>3,300 participants in New World Harbour Race 2018
3: Cumulative figures since the inception of the Programme in FY2012
41
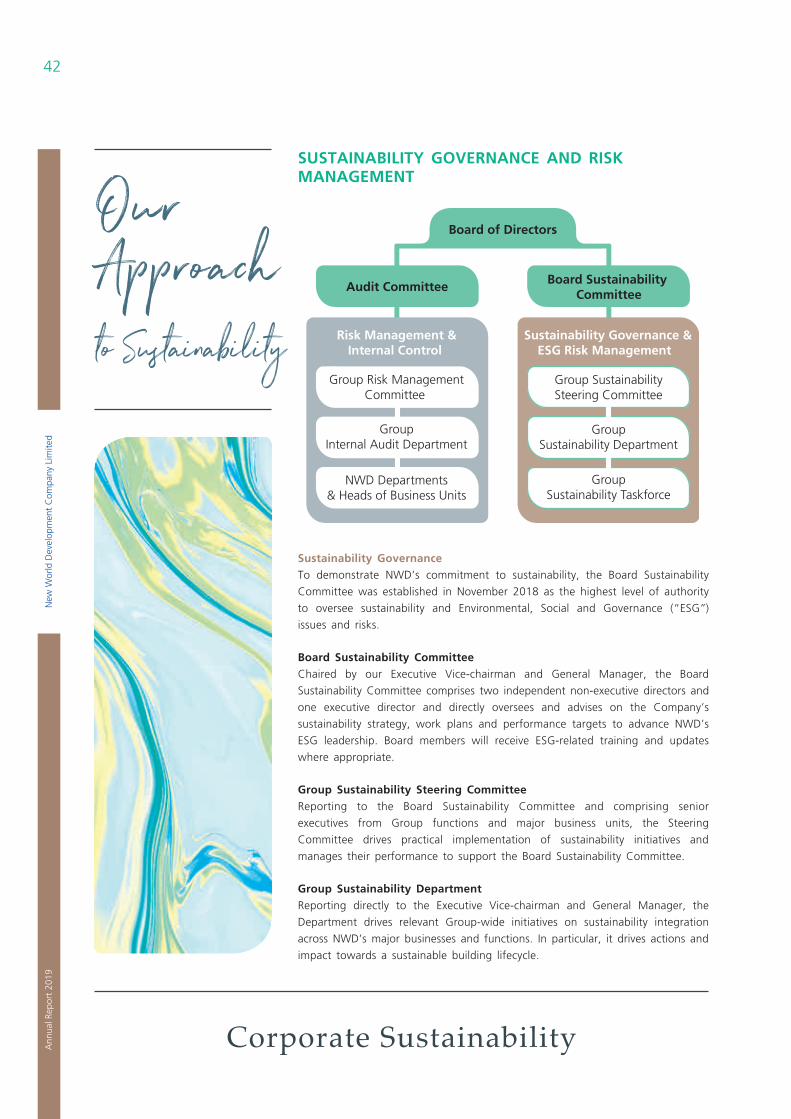
New
Wor
ld D
evel
opm
ent
Com
pany
Lim
ited
42A
nnua
l Rep
ort
2019
Corporate Sustainability
SUSTAINABILITY GOVERNANCE AND RISK MANAGEMENT
Board of Directors
Audit Committee
Group Risk ManagementCommittee
GroupInternal Audit Department
NWD Departments& Heads of Business Units
Board Sustainability Committee
Group SustainabilitySteering Committee
Risk Management &Internal Control
Sustainability Governance &ESG Risk Management
GroupSustainability Department
GroupSustainability Taskforce
Sustainability GovernanceTo demonstrate NWD’s commitment to sustainability, the Board Sustainability
Committee was established in November 2018 as the highest level of authority
to oversee sustainability and Environmental, Social and Governance (“ESG”)
issues and risks.
Board Sustainability CommitteeChaired by our Executive Vice-chairman and General Manager, the Board
Sustainability Committee comprises two independent non-executive directors and
one executive director and directly oversees and advises on the Company’s
sustainability strategy, work plans and performance targets to advance NWD’s
ESG leadership. Board members will receive ESG-related training and updates
where appropriate.
Group Sustainability Steering CommitteeReporting to the Board Sustainability Committee and comprising senior
executives from Group functions and major business units, the Steering
Committee drives practical implementation of sustainability initiatives and
manages their performance to support the Board Sustainability Committee.
Group Sustainability DepartmentReporting directly to the Executive Vice-chairman and General Manager, the
Department drives relevant Group-wide initiatives on sustainability integration
across NWD’s major businesses and functions. In particular, it drives actions and
impact towards a sustainable building lifecycle.
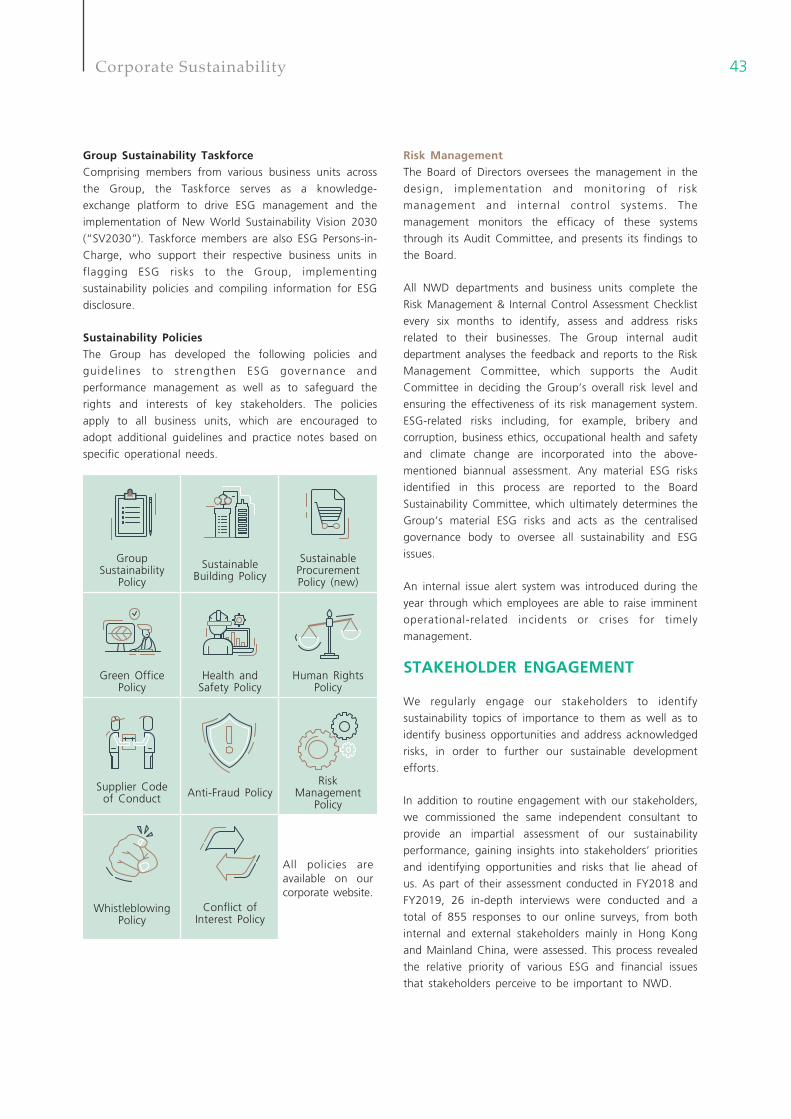
43Corporate Sustainability
Group Sustainability TaskforceComprising members from various business units across
the Group, the Taskforce serves as a knowledge-
exchange platform to drive ESG management and the
implementation of New World Sustainability Vision 2030
(“SV2030”). Taskforce members are also ESG Persons-in-
Charge, who support their respective business units in
flagging ESG risks to the Group, implementing
sustainability policies and compiling information for ESG
disclosure.
Sustainability PoliciesThe Group has developed the following policies and
guidel ines to strengthen ESG governance and
performance management as well as to safeguard the
rights and interests of key stakeholders. The policies
apply to all business units, which are encouraged to
adopt additional guidelines and practice notes based on
specific operational needs.
Group Sustainability
Policy
Sustainable Building Policy
Sustainable Procurement Policy (new)
Green Office Policy
Health andSafety Policy
Human Rights Policy
Supplier Codeof Conduct Anti-Fraud Policy
RiskManagement
Policy
All policies are available on our corporate website.
Whistleblowing Policy
Conflict of Interest Policy
Risk ManagementThe Board of Directors oversees the management in the
design, implementation and monitoring of risk
management and internal control systems. The
management monitors the efficacy of these systems
through its Audit Committee, and presents its findings to
the Board.
All NWD departments and business units complete the
Risk Management & Internal Control Assessment Checklist
every six months to identify, assess and address risks
related to their businesses. The Group internal audit
department analyses the feedback and reports to the Risk
Management Committee, which supports the Audit
Committee in deciding the Group’s overall risk level and
ensuring the effectiveness of its risk management system.
ESG-related risks including, for example, bribery and
corruption, business ethics, occupational health and safety
and climate change are incorporated into the above-
mentioned biannual assessment. Any material ESG risks
identified in this process are reported to the Board
Sustainability Committee, which ultimately determines the
Group’s material ESG risks and acts as the centralised
governance body to oversee all sustainability and ESG
issues.
An internal issue alert system was introduced during the
year through which employees are able to raise imminent
operational-related incidents or crises for timely
management.
STAKEHOLDER ENGAGEMENT
We regularly engage our stakeholders to identify
sustainability topics of importance to them as well as to
identify business opportunities and address acknowledged
risks, in order to further our sustainable development
efforts.
In addition to routine engagement with our stakeholders,
we commissioned the same independent consultant to
provide an impartial assessment of our sustainability
performance, gaining insights into stakeholders’ priorities
and identifying opportunities and risks that lie ahead of
us. As part of their assessment conducted in FY2018 and
FY2019, 26 in-depth interviews were conducted and a
total of 855 responses to our online surveys, from both
internal and external stakeholders mainly in Hong Kong
and Mainland China, were assessed. This process revealed
the relative priority of various ESG and financial issues
that stakeholders perceive to be important to NWD.
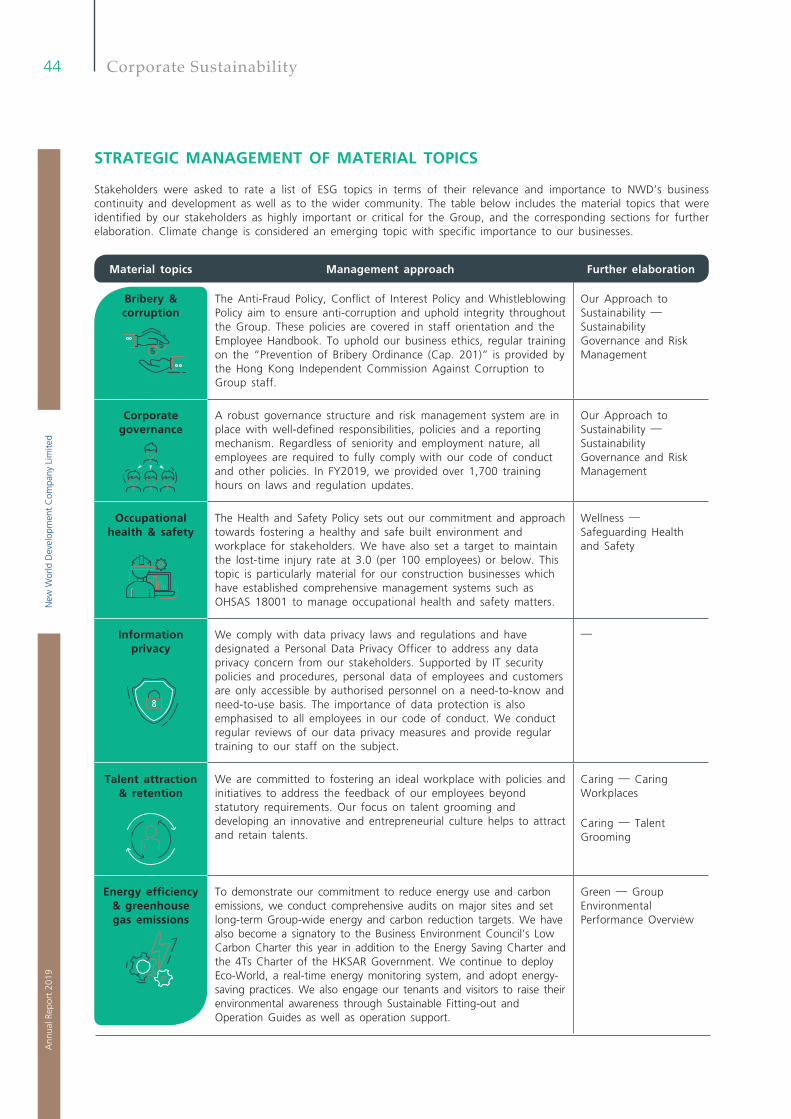
New
Wor
ld D
evel
opm
ent
Com
pany
Lim
ited
44A
nnua
l Rep
ort
2019
Corporate Sustainability
STRATEGIC MANAGEMENT OF MATERIAL TOPICS
Stakeholders were asked to rate a list of ESG topics in terms of their relevance and importance to NWD’s business continuity and development as well as to the wider community. The table below includes the material topics that were identified by our stakeholders as highly important or critical for the Group, and the corresponding sections for further elaboration. Climate change is considered an emerging topic with specific importance to our businesses.
Material topics Management approach Further elaboration
Bribery &corruption
$$
The Anti-Fraud Policy, Conflict of Interest Policy and Whistleblowing Policy aim to ensure anti-corruption and uphold integrity throughout the Group. These policies are covered in staff orientation and the Employee Handbook. To uphold our business ethics, regular training on the “Prevention of Bribery Ordinance (Cap. 201)” is provided by the Hong Kong Independent Commission Against Corruption to Group staff.
Our Approach to Sustainability — Sustainability Governance and Risk Management
Corporate governance
A robust governance structure and risk management system are in place with well-defined responsibilities, policies and a reporting mechanism. Regardless of seniority and employment nature, all employees are required to fully comply with our code of conduct and other policies. In FY2019, we provided over 1,700 training hours on laws and regulation updates.
Our Approach to Sustainability — Sustainability Governance and Risk Management
Occupational health & safety
The Health and Safety Policy sets out our commitment and approach towards fostering a healthy and safe built environment and workplace for stakeholders. We have also set a target to maintain the lost-time injury rate at 3.0 (per 100 employees) or below. This topic is particularly material for our construction businesses which have established comprehensive management systems such as OHSAS 18001 to manage occupational health and safety matters.
Wellness — Safeguarding Health and Safety
Informationprivacy
We comply with data privacy laws and regulations and have designated a Personal Data Privacy Officer to address any data privacy concern from our stakeholders. Supported by IT security policies and procedures, personal data of employees and customers are only accessible by authorised personnel on a need-to-know and need-to-use basis. The importance of data protection is also emphasised to all employees in our code of conduct. We conduct regular reviews of our data privacy measures and provide regular training to our staff on the subject.
—
Talent attraction & retention
We are committed to fostering an ideal workplace with policies and initiatives to address the feedback of our employees beyond statutory requirements. Our focus on talent grooming and developing an innovative and entrepreneurial culture helps to attract and retain talents.
Caring — Caring Workplaces
Caring — Talent Grooming
Energy efficiency & greenhouse gas emissions
To demonstrate our commitment to reduce energy use and carbon emissions, we conduct comprehensive audits on major sites and set long-term Group-wide energy and carbon reduction targets. We have also become a signatory to the Business Environment Council’s Low Carbon Charter this year in addition to the Energy Saving Charter and the 4Ts Charter of the HKSAR Government. We continue to deploy Eco-World, a real-time energy monitoring system, and adopt energy-saving practices. We also engage our tenants and visitors to raise their environmental awareness through Sustainable Fitting-out and Operation Guides as well as operation support.
Green — Group Environmental Performance Overview
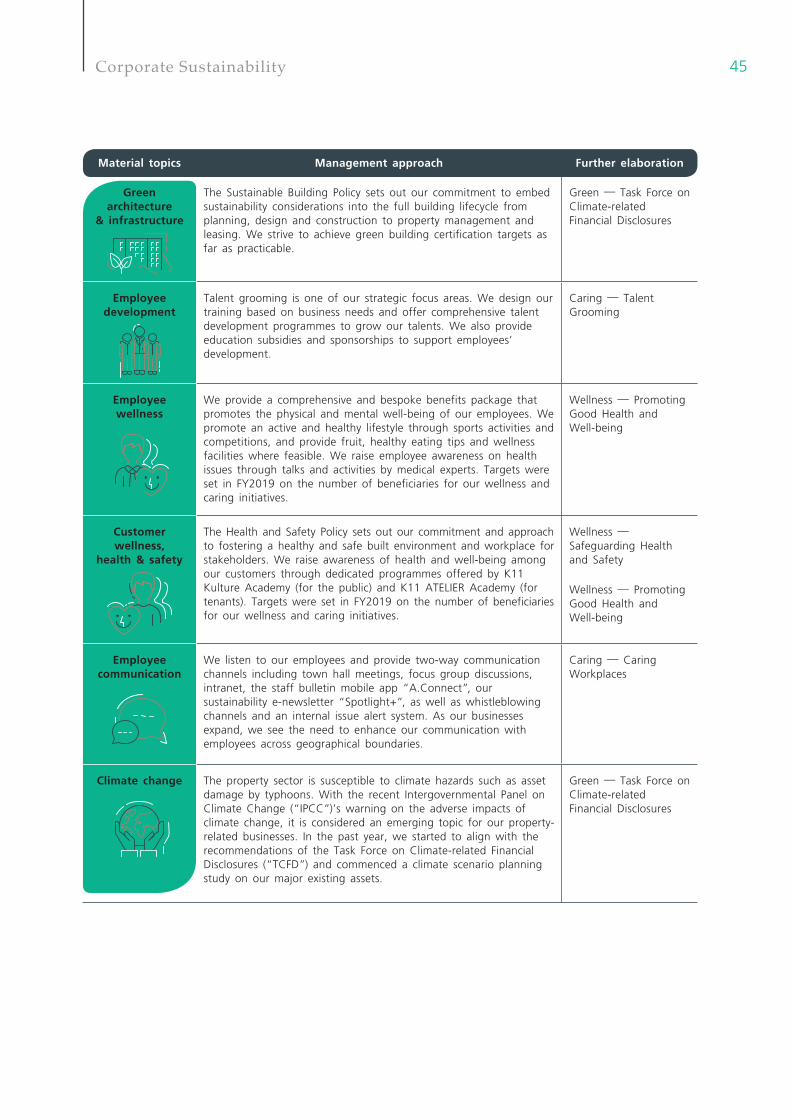
45Corporate Sustainability
Material topics Management approach Further elaboration
Green architecture
& infrastructure
The Sustainable Building Policy sets out our commitment to embed sustainability considerations into the full building lifecycle from planning, design and construction to property management and leasing. We strive to achieve green building certification targets as far as practicable.
Green — Task Force on Climate-related Financial Disclosures
Employee development
Talent grooming is one of our strategic focus areas. We design our training based on business needs and offer comprehensive talent development programmes to grow our talents. We also provide education subsidies and sponsorships to support employees’ development.
Caring — Talent Grooming
Employee wellness
We provide a comprehensive and bespoke benefits package that promotes the physical and mental well-being of our employees. We promote an active and healthy lifestyle through sports activities and competitions, and provide fruit, healthy eating tips and wellness facilities where feasible. We raise employee awareness on health issues through talks and activities by medical experts. Targets were set in FY2019 on the number of beneficiaries for our wellness and caring initiatives.
Wellness — Promoting Good Health and Well-being
Customer wellness,
health & safety
The Health and Safety Policy sets out our commitment and approach to fostering a healthy and safe built environment and workplace for stakeholders. We raise awareness of health and well-being among our customers through dedicated programmes offered by K11 Kulture Academy (for the public) and K11 ATELIER Academy (for tenants). Targets were set in FY2019 on the number of beneficiaries for our wellness and caring initiatives.
Wellness — Safeguarding Health and Safety
Wellness — Promoting Good Health and Well-being
Employee communication
We listen to our employees and provide two-way communication channels including town hall meetings, focus group discussions, intranet, the staff bulletin mobile app “A.Connect”, our sustainability e-newsletter “Spotlight+”, as well as whistleblowing channels and an internal issue alert system. As our businesses expand, we see the need to enhance our communication with employees across geographical boundaries.
Caring — Caring Workplaces
Climate change The property sector is susceptible to climate hazards such as asset damage by typhoons. With the recent Intergovernmental Panel on Climate Change (“IPCC”)’s warning on the adverse impacts of climate change, it is considered an emerging topic for our property-related businesses. In the past year, we started to align with the recommendations of the Task Force on Climate-related Financial Disclosures (“TCFD”) and commenced a climate scenario planning study on our major existing assets.
Green — Task Force on Climate-related Financial Disclosures
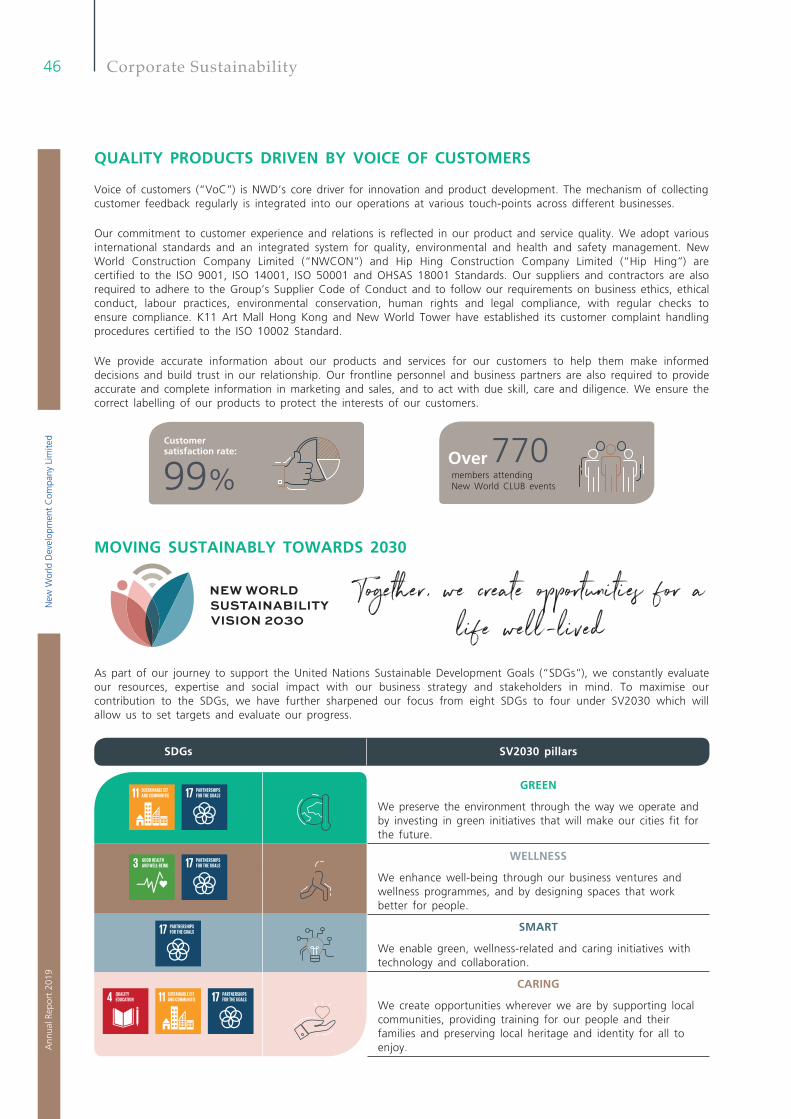
New
Wor
ld D
evel
opm
ent
Com
pany
Lim
ited
46A
nnua
l Rep
ort
2019
Corporate Sustainability
QUALITY PRODUCTS DRIVEN BY VOICE OF CUSTOMERS
Voice of customers (“VoC”) is NWD’s core driver for innovation and product development. The mechanism of collecting customer feedback regularly is integrated into our operations at various touch-points across different businesses.
Our commitment to customer experience and relations is reflected in our product and service quality. We adopt various international standards and an integrated system for quality, environmental and health and safety management. New World Construction Company Limited (“NWCON”) and Hip Hing Construction Company Limited (“Hip Hing”) are certified to the ISO 9001, ISO 14001, ISO 50001 and OHSAS 18001 Standards. Our suppliers and contractors are also required to adhere to the Group’s Supplier Code of Conduct and to follow our requirements on business ethics, ethical conduct, labour practices, environmental conservation, human rights and legal compliance, with regular checks to ensure compliance. K11 Art Mall Hong Kong and New World Tower have established its customer complaint handling procedures certified to the ISO 10002 Standard.
We provide accurate information about our products and services for our customers to help them make informed decisions and build trust in our relationship. Our frontline personnel and business partners are also required to provide accurate and complete information in marketing and sales, and to act with due skill, care and diligence. We ensure the correct labelling of our products to protect the interests of our customers.
As part of our journey to support the United Nations Sustainable Development Goals (“SDGs”), we constantly evaluate our resources, expertise and social impact with our business strategy and stakeholders in mind. To maximise our contribution to the SDGs, we have further sharpened our focus from eight SDGs to four under SV2030 which will allow us to set targets and evaluate our progress.
SDGs SV2030 pillars
GREEN
We preserve the environment through the way we operate and by investing in green initiatives that will make our cities fit for the future.
WELLNESS
We enhance well-being through our business ventures and wellness programmes, and by designing spaces that work better for people.
SMART
We enable green, wellness-related and caring initiatives with technology and collaboration.
CARING
We create opportunities wherever we are by supporting local communities, providing training for our people and their families and preserving local heritage and identity for all to enjoy.
Customersatisfaction rate:
99%Over 770members attending New World CLUB events
MOVING SUSTAINABLY TOWARDS 2030
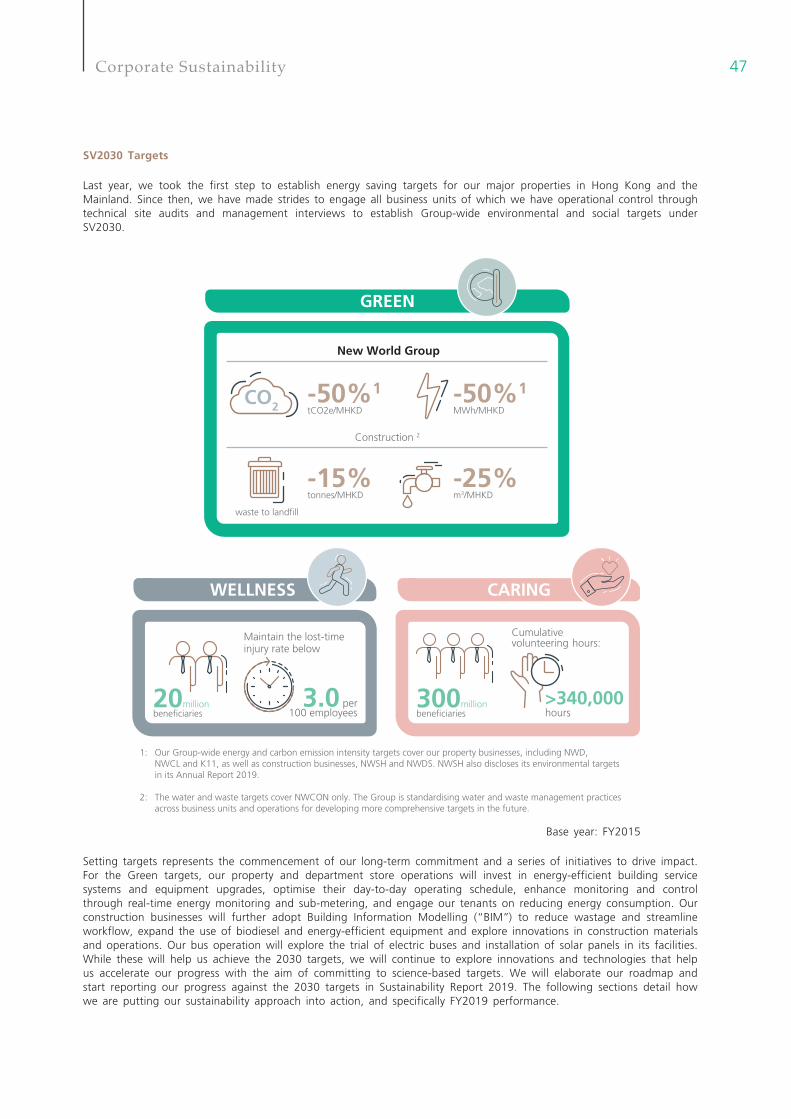
47Corporate Sustainability
SV2030 Targets
Last year, we took the first step to establish energy saving targets for our major properties in Hong Kong and the Mainland. Since then, we have made strides to engage all business units of which we have operational control through technical site audits and management interviews to establish Group-wide environmental and social targets under SV2030.
Base year: FY2015
New World Group
-50%1tCO2e/MHKD
-15%tonnes/MHKD
waste to landfill
CO2-50%1MWh/MHKD
-25%m3/MHKD
GREEN
WELLNESS
20millionbeneficiaries 100 employees
CARING
300millionbeneficiaries
>340,000hours
Cumulative volunteering hours:
3.0 per
Maintain the lost-timeinjury rate below
Construction 2
1: Our Group-wide energy and carbon emission intensity targets cover our property businesses, including NWD, NWCL and K11, as well as construction businesses, NWSH and NWDS. NWSH also discloses its environmental targets in its Annual Report 2019.
2: The water and waste targets cover NWCON only. The Group is standardising water and waste management practices across business units and operations for developing more comprehensive targets in the future.
Setting targets represents the commencement of our long-term commitment and a series of initiatives to drive impact. For the Green targets, our property and department store operations will invest in energy-efficient building service systems and equipment upgrades, optimise their day-to-day operating schedule, enhance monitoring and control through real-time energy monitoring and sub-metering, and engage our tenants on reducing energy consumption. Our construction businesses will further adopt Building Information Modelling (“BIM”) to reduce wastage and streamline workflow, expand the use of biodiesel and energy-efficient equipment and explore innovations in construction materials and operations. Our bus operation will explore the trial of electric buses and installation of solar panels in its facilities. While these will help us achieve the 2030 targets, we will continue to explore innovations and technologies that help us accelerate our progress with the aim of committing to science-based targets. We will elaborate our roadmap and start reporting our progress against the 2030 targets in Sustainability Report 2019. The following sections detail how we are putting our sustainability approach into action, and specifically FY2019 performance.
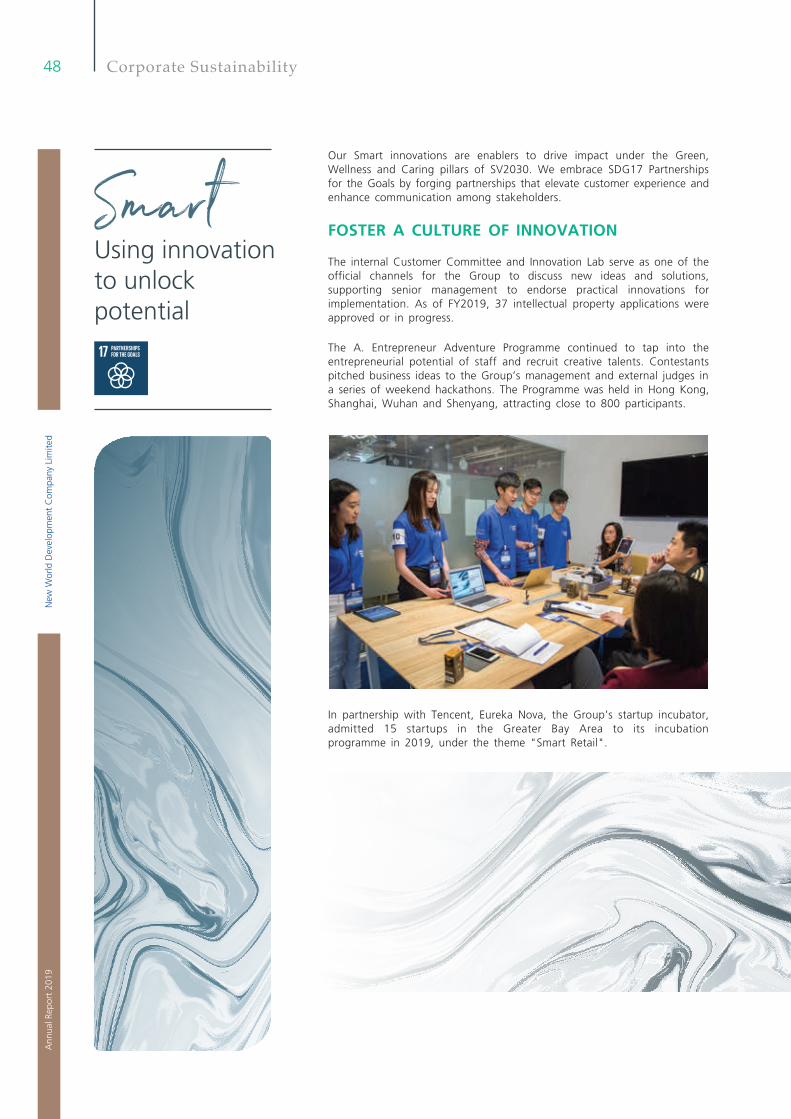
New
Wor
ld D
evel
opm
ent
Com
pany
Lim
ited
48A
nnua
l Rep
ort
2019
Using innovation to unlock potential
Corporate Sustainability
Our Smart innovations are enablers to drive impact under the Green, Wellness and Caring pillars of SV2030. We embrace SDG17 Partnerships for the Goals by forging partnerships that elevate customer experience and enhance communication among stakeholders.
FOSTER A CULTURE OF INNOVATION
The internal Customer Committee and Innovation Lab serve as one of the official channels for the Group to discuss new ideas and solutions, supporting senior management to endorse practical innovations for implementation. As of FY2019, 37 intellectual property applications were approved or in progress.
The A. Entrepreneur Adventure Programme continued to tap into the entrepreneurial potential of staff and recruit creative talents. Contestants pitched business ideas to the Group’s management and external judges in a series of weekend hackathons. The Programme was held in Hong Kong, Shanghai, Wuhan and Shenyang, attracting close to 800 participants.
In partnership with Tencent, Eureka Nova, the Group’s startup incubator, admitted 15 startups in the Greater Bay Area to its incubation programme in 2019, under the theme "Smart Retail".
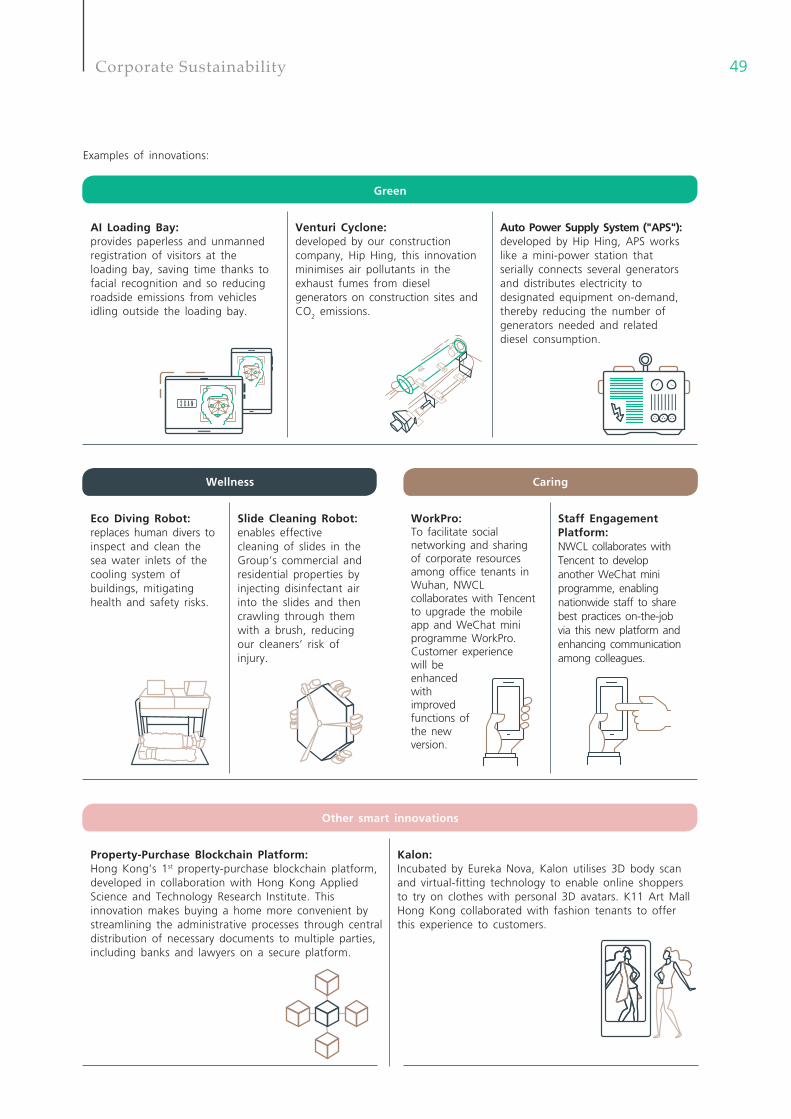
49Corporate Sustainability
Examples of innovations:
Green
AI Loading Bay: provides paperless and unmanned registration of visitors at the loading bay, saving time thanks to facial recognition and so reducing roadside emissions from vehicles idling outside the loading bay.
Venturi Cyclone: developed by our construction company, Hip Hing, this innovation minimises air pollutants in the exhaust fumes from diesel generators on construction sites and CO2 emissions.
Auto Power Supply System ("APS"): developed by Hip Hing, APS works like a mini-power station that serially connects several generators and distributes electricity to designated equipment on-demand, thereby reducing the number of generators needed and related diesel consumption.
Wellness Caring
Eco Diving Robot: replaces human divers to inspect and clean the sea water inlets of the cooling system of buildings, mitigating health and safety risks.
Slide Cleaning Robot: enables effective cleaning of slides in the Group’s commercial and residential properties by injecting disinfectant air into the slides and then crawling through them with a brush, reducing our cleaners’ risk of injury.
WorkPro: To facilitate social networking and sharing of corporate resources among office tenants in Wuhan, NWCL collaborates with Tencent to upgrade the mobile app and WeChat mini programme WorkPro. Customer experience will be enhanced with improved functions of the new version.
Staff Engagement Platform:NWCL collaborates with Tencent to develop another WeChat mini programme, enabling nationwide staff to share best practices on-the-job via this new platform and enhancing communication among colleagues.
Other smart innovations
Property-Purchase Blockchain Platform:Hong Kong’s 1st property-purchase blockchain platform, developed in collaboration with Hong Kong Applied Science and Technology Research Institute. This innovation makes buying a home more convenient by streamlining the administrative processes through central distribution of necessary documents to multiple parties, including banks and lawyers on a secure platform.
Kalon:Incubated by Eureka Nova, Kalon utilises 3D body scan and virtual-fitting technology to enable online shoppers to try on clothes with personal 3D avatars. K11 Art Mall Hong Kong collaborated with fashion tenants to offer this experience to customers.
New
Wor
ld D
evel
opm
ent
Com
pany
Lim
ited
50A
nnua
l Rep
ort
2019
Moving us towards a greener future
Corporate Sustainability
Guided by SDG 11 Sustainable Cities and Communities, the Group strives to
reduce its adverse environmental impact, achieve operational resource efficiency
and mitigate and adapt to climate change impacts. We enhance the
connectivity of the city by providing safe and sustainable transport systems. In
line with SDG 17 Partnerships for the Goals, we collaborate with stakeholders,
such as tenants and industry organisations, to advance our efforts. Here are the
key components of our strategy for the Green pillar of SV2030:
Strategy Addressed in this Section
Standardise sustainable building design, construction and management
TCFD
Manage climate-related impacts TCFD & Group Environmental Performance Overview
Support tenants and customers in reducing environmental impacts
Engaging Our Tenants and Residents
Capture green financing and investment opportunities
Green Finance
TASK FORCE ON CLIMATE-RELATED FINANCIAL DISCLOSURES ("TCFD")
In FY2018, the Group made its first attempt
to disclose its climate change strategy,
covering Board governance of relevant
issues, as well as adaptation and mitigation measures to address climate risks.
This year, we brought our disclosure in line with the recommendations of TCFD.
These areas of disclosure, “Governance”, “Risk Management” and “Metrics &
Targets”, apply to all business units. “Strategy” primarily focuses on the risks
and opportunities related to our property businesses, including NWD, NWCL and
K11, and describes how we manage building-related energy and carbon
performance. Other business units such as NWSH and NWDS will determine the
materiality of climate change and strategy required specific to their operations.
51Corporate Sustainability
New World Group’s approach Addressed in this Section
Governance
Board oversight of climate-related risks and opportunities
• The Board Sustainability Committee convenes at least twice a year as per the terms of reference and oversees ESG risks and opportunities, covering climate-related issues. The organisational structure and processes by which the Committee is informed about climate-related issues are specified in Our Approach to Sustainability.
Our Approach to Sustainability — Sustainability Governance and Risk Management
• The Board Sustainability Committee considers climate-related issues when reviewing and guiding strategy under SV2030. The Committee endorsed the Group-wide sustainability targets. To monitor implementation and performance, business units were required to develop roadmaps with specific measures and investments required. The target progress will be reported to the Committee on a regular basis.
Our Approach to Sustainability — Moving Sustainably Towards 2030
The role of the Group Sustainability Steering Committee
• The Board Sustainability Committee is supported by the Group Sustainability Steering Committee, which oversees the Group Sustainability Department to assess and manage building-related climate issues on a day-to-day basis in collaboration with key departments such as Project Management and Property Management.
Strategy
Risks and opportunities identified over the short, medium and long term
• Physical risks: The Group acknowledges climate-related physical risks to building assets posed by rising temperatures, more extreme weather events, such as severe typhoons, sea-level rise and flooding in the short (0–3 years) and medium (4–10 years) term. Intensification of such risks is expected in the long term (11 years and beyond). These risks may destabilise the supply of construction raw materials and cause delays to construction works. The Group’s assets may be damaged and building operations disrupted, resulting in reduced access, higher maintenance costs and increased insurance premiums. Climate change may also adversely impact our employees in terms of health and commuting and cause displacements in communities where we operate.
• Transition risks: The Group recognises and keeps abreast of transition risks, such as increasingly stringent regulations to limit carbon emissions that may increase the operational costs of buildings in the medium-to-long term. We also keep in view international best practices in operational efficiency and the latest developments in carbon trading and environmental taxes in Mainland China, for reference in planning or implementing internal carbon pricing in the future.
• Opportunities: Climate change presents the Group with opportunities to develop climate-resilient buildings and upgrade existing buildings to withstand climate impacts.
New
Wor
ld D
evel
opm
ent
Com
pany
Lim
ited
52A
nnua
l Rep
ort
2019
Corporate Sustainability
New World Group’s approach Addressed in this Section
Strategy
• Internal awareness building: More training on how to identify and manage climate-related risks will be provided by the “New World Sustainability Academy” for key internal departments, such as Project Management and Property Management.
• Sustainable new building design and construction: A Group-level Sustainable Building Policy guides NWD, NWCL and K11 to consider climate-related impacts in the building lifecycle and obtain BEAM Plus or LEED Gold or above green building certifications for new buildings where possible. We have developed internal sustainable building design guidelines for Hong Kong and Mainland China to cover specifications related to climate change adaptation. BIM is deployed to enhance the efficiency of project management and reduce energy consumption and waste. The Sustainable Procurement Policy also guides our operations to integrate climate change considerations into procurement decisions. For example, local and regional construction materials with a lower carbon footprint are preferred. Our construction operations also keep track of the availability of raw construction materials in light of climate change. Extreme weather events would also be taken into account for the scheduling of construction works.
• Existing building energy efficiency: We improve the energy efficiency of our existing buildings through real-time energy monitoring, regular energy audits, as well as by adopting energy-saving practices and conducting retro-commissioning. Where practicable, we will also obtain green certification for existing buildings.
• Climate scenario planning study: The Greater Bay Area is located in the coastal area of southeast China and is more susceptible to climate hazards such as typhoons and flooding. The Board approved the commencement of a climate scenario planning study to assess physical climate risks for major properties in the Greater Bay Area. Two scenarios have been studied:
o A medium scenario with about 2.5˚C of global surface warming in 2100, corresponding to the IPCC Representative Concentration Pathway (“RCP”) 6.0 scenario
o An extreme scenario with over 4˚C of global surface warming in 2100, corresponding to the IPCC RCP 8.5 scenario
Under these scenarios, asset-level risk exposure to flooding, extreme wind, water stress and heat stress is being assessed. Recommendations on resilience enhancement measures will then be studied. Insights gained from this analysis will also inform the design and planning of future buildings.
• Further mitigation and adaptation measures: We implement prudent water management in our projects. “Sponge city” features are adopted to lower project flood risks. In MOUNT PAVILIA, one of our residential properties in Hong Kong, greywater is treated onsite and provides 100% irrigation water. The use of renewable energy is also considered where appropriate. For example, the rooftop of K11 ATELIER Victoria Dockside has one of the largest façade-integrated solar photovoltaic systems (capacity: 113 kW) in Hong Kong.
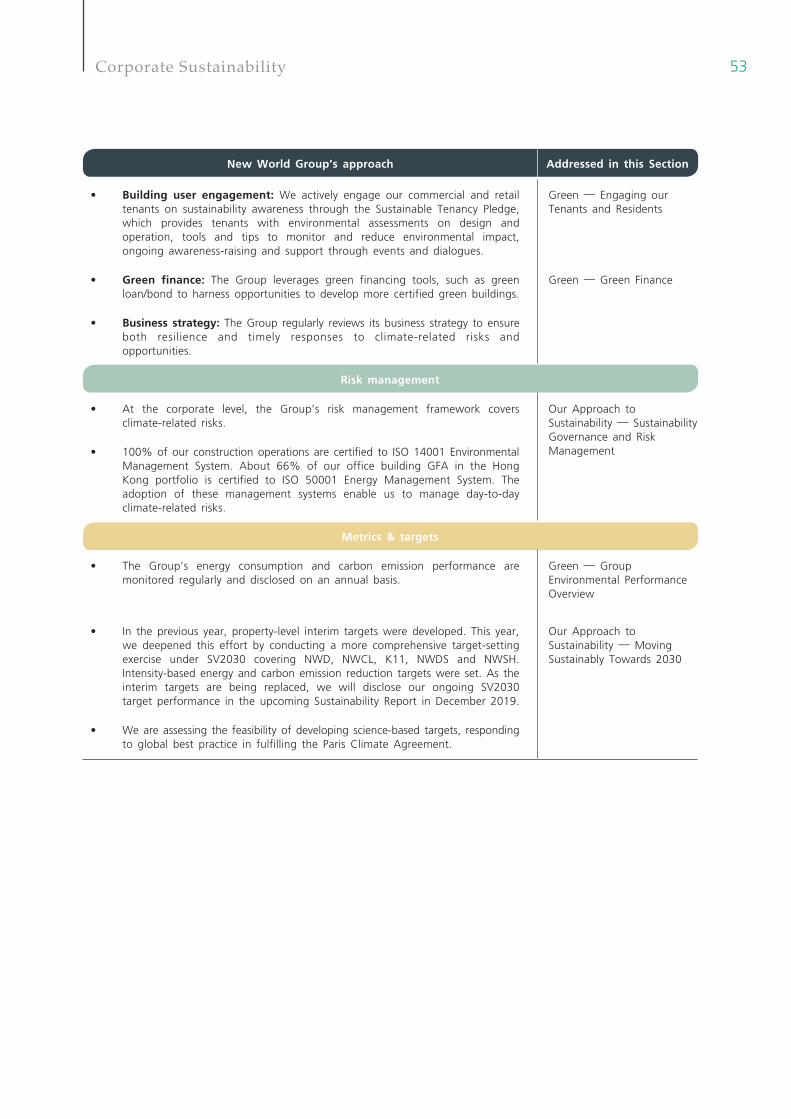
53Corporate Sustainability
New World Group’s approach Addressed in this Section
• Building user engagement: We actively engage our commercial and retail tenants on sustainability awareness through the Sustainable Tenancy Pledge, which provides tenants with environmental assessments on design and operation, tools and tips to monitor and reduce environmental impact, ongoing awareness-raising and support through events and dialogues.
Green — Engaging our Tenants and Residents
• Green finance: The Group leverages green financing tools, such as green loan/bond to harness opportunities to develop more certified green buildings.
Green — Green Finance
• Business strategy: The Group regularly reviews its business strategy to ensure both resilience and timely responses to climate-related risks and opportunities.
Risk management
• At the corporate level, the Group’s risk management framework covers climate-related risks.
Our Approach to Sustainability — Sustainability Governance and Risk Management• 100% of our construction operations are certified to ISO 14001 Environmental
Management System. About 66% of our office building GFA in the Hong Kong portfolio is certified to ISO 50001 Energy Management System. The adoption of these management systems enable us to manage day-to-day climate-related risks.
Metrics & targets
• The Group’s energy consumption and carbon emission performance are monitored regularly and disclosed on an annual basis.
Green — Group Environmental Performance Overview
• In the previous year, property-level interim targets were developed. This year, we deepened this effort by conducting a more comprehensive target-setting exercise under SV2030 covering NWD, NWCL, K11, NWDS and NWSH. Intensity-based energy and carbon emission reduction targets were set. As the interim targets are being replaced, we will disclose our ongoing SV2030 target performance in the upcoming Sustainability Report in December 2019.
Our Approach to Sustainability — Moving Sustainably Towards 2030
• We are assessing the feasibility of developing science-based targets, responding to global best practice in fulfilling the Paris Climate Agreement.
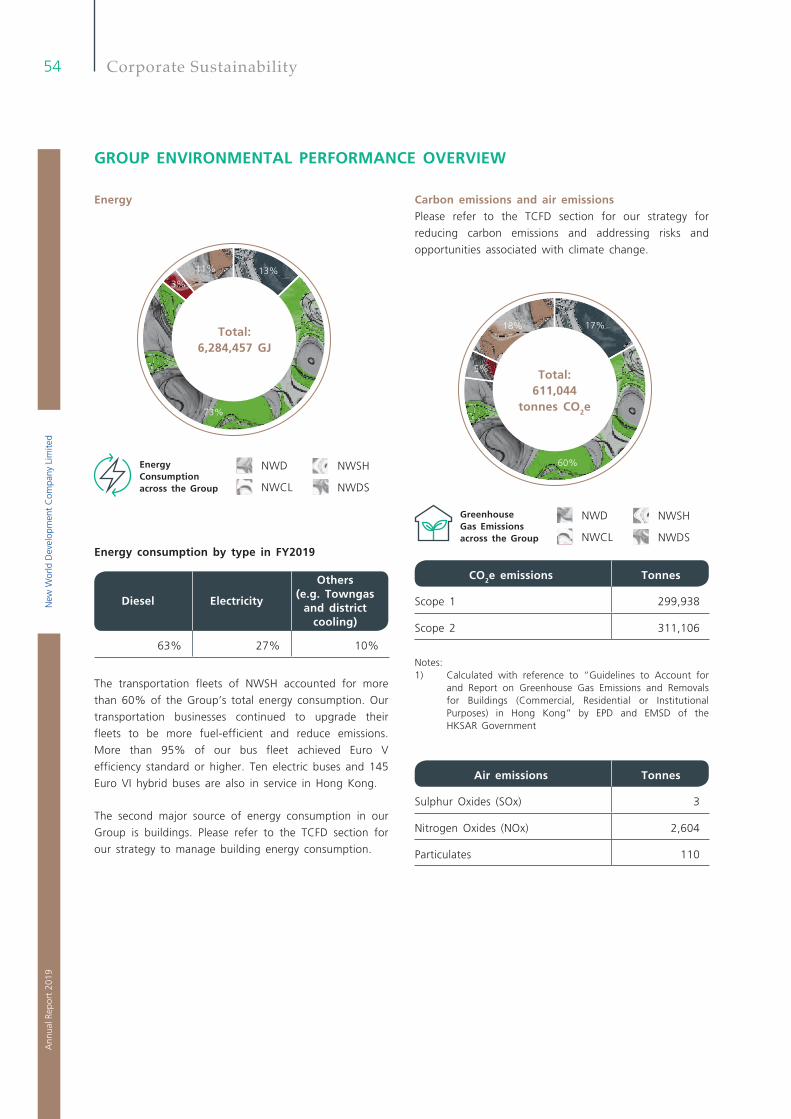
New
Wor
ld D
evel
opm
ent
Com
pany
Lim
ited
54A
nnua
l Rep
ort
2019
Corporate Sustainability
Energy
13%11%
3%
73%
Total:6,284,457 GJ
Energy Consumption across the Group
NWD NWSH
NWCL NWDS
Energy consumption by type in FY2019
Diesel Electricity
Others (e.g. Towngas
and district cooling)
63% 27% 10%
The transportation fleets of NWSH accounted for more
than 60% of the Group’s total energy consumption. Our
transportation businesses continued to upgrade their
fleets to be more fuel-efficient and reduce emissions.
More than 95% of our bus fleet achieved Euro V
efficiency standard or higher. Ten electric buses and 145
Euro VI hybrid buses are also in service in Hong Kong.
The second major source of energy consumption in our
Group is buildings. Please refer to the TCFD section for
our strategy to manage building energy consumption.
Carbon emissions and air emissionsPlease refer to the TCFD section for our strategy for
reducing carbon emissions and addressing risks and
opportunities associated with climate change.
17%18%
5%
60%
Total:611,044
tonnes CO2e
Greenhouse Gas Emissions across the Group
NWD NWSH
NWCL NWDS
CO2e emissions Tonnes
Scope 1 299,938
Scope 2 311,106
Notes:1) Calculated with reference to “Guidelines to Account for
and Report on Greenhouse Gas Emissions and Removals for Buildings (Commercial, Residential or Institutional Purposes) in Hong Kong” by EPD and EMSD of the HKSAR Government
Air emissions Tonnes
Sulphur Oxides (SOx) 3
Nitrogen Oxides (NOx) 2,604
Particulates 110
GROUP ENVIRONMENTAL PERFORMANCE OVERVIEW
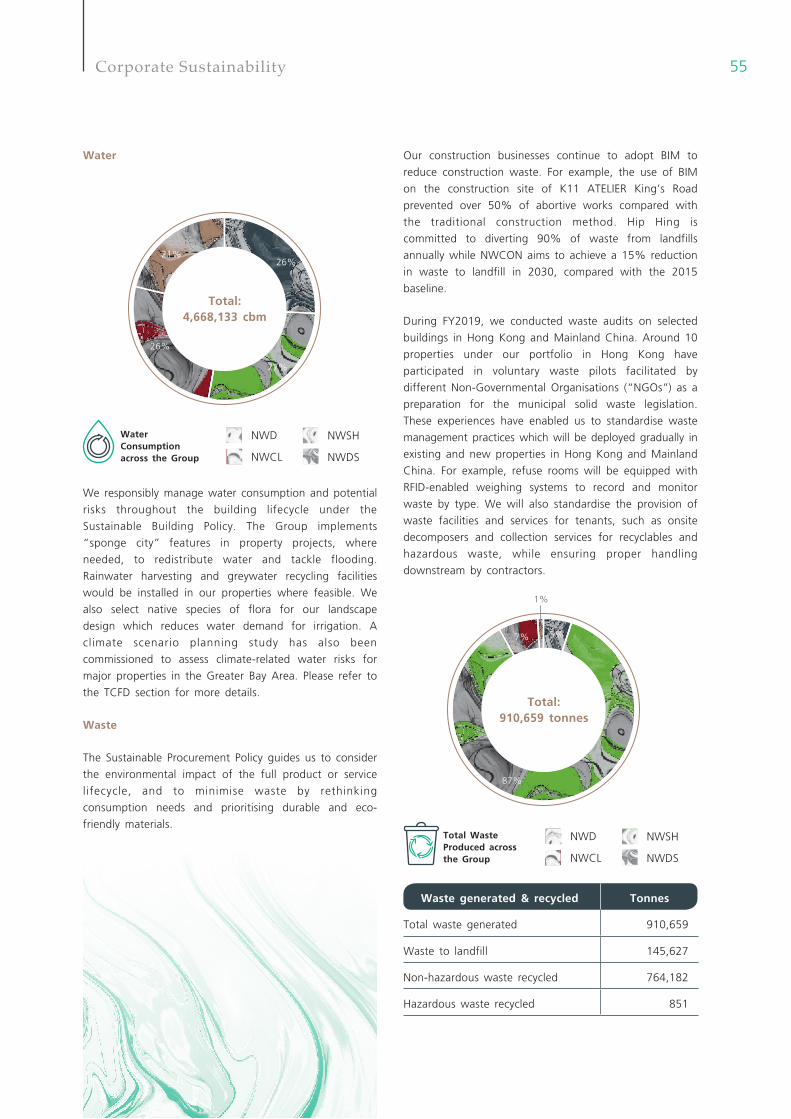
55Corporate Sustainability
Water
26%
27%
26%
21%
Total:4,668,133 cbm
Water Consumption across the Group
NWD NWSH
NWCL NWDS
We responsibly manage water consumption and potential
risks throughout the building lifecycle under the
Sustainable Building Policy. The Group implements
“sponge city” features in property projects, where
needed, to redistribute water and tackle flooding.
Rainwater harvesting and greywater recycling facilities
would be installed in our properties where feasible. We
also select native species of flora for our landscape
design which reduces water demand for irrigation. A
climate scenario planning study has also been
commissioned to assess climate-related water risks for
major properties in the Greater Bay Area. Please refer to
the TCFD section for more details.
Waste
The Sustainable Procurement Policy guides us to consider
the environmental impact of the full product or service
lifecycle, and to minimise waste by rethinking
consumption needs and prioritising durable and eco-
friendly materials.
Our construction businesses continue to adopt BIM to
reduce construction waste. For example, the use of BIM
on the construction site of K11 ATELIER King’s Road
prevented over 50% of abortive works compared with
the traditional construction method. Hip Hing is
committed to diverting 90% of waste from landfills
annually while NWCON aims to achieve a 15% reduction
in waste to landfill in 2030, compared with the 2015
baseline.
During FY2019, we conducted waste audits on selected
buildings in Hong Kong and Mainland China. Around 10
properties under our portfolio in Hong Kong have
participated in voluntary waste pilots facilitated by
different Non-Governmental Organisations (“NGOs”) as a
preparation for the municipal solid waste legislation.
These experiences have enabled us to standardise waste
management practices which will be deployed gradually in
existing and new properties in Hong Kong and Mainland
China. For example, refuse rooms will be equipped with
RFID-enabled weighing systems to record and monitor
waste by type. We will also standardise the provision of
waste facilities and services for tenants, such as onsite
decomposers and collection services for recyclables and
hazardous waste, while ensuring proper handling
downstream by contractors.
1%
5%
87%
7%
Total:910,659 tonnes
Total Waste Produced across the Group
NWD NWSH
NWCL NWDS
Waste generated & recycled Tonnes
Total waste generated 910,659
Waste to landfill 145,627
Non-hazardous waste recycled 764,182
Hazardous waste recycled 851
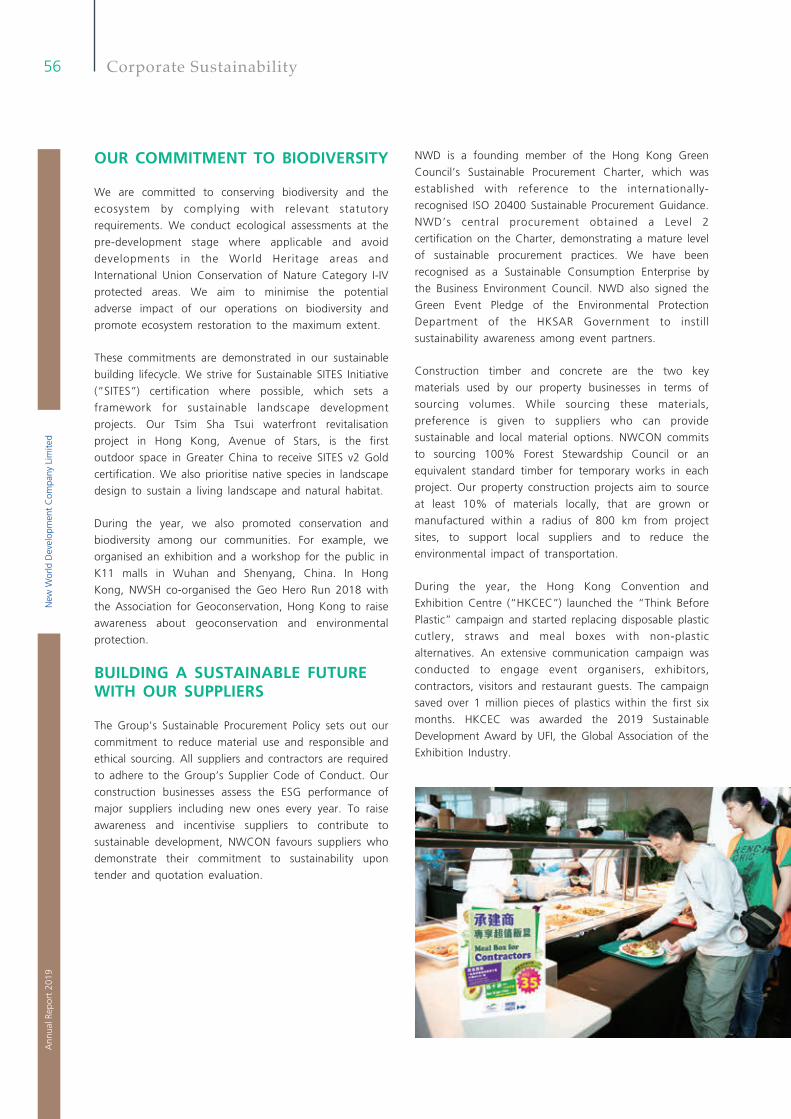
New
Wor
ld D
evel
opm
ent
Com
pany
Lim
ited
56A
nnua
l Rep
ort
2019
Corporate Sustainability
OUR COMMITMENT TO BIODIVERSITY
We are committed to conserving biodiversity and the
ecosystem by complying with relevant statutory
requirements. We conduct ecological assessments at the
pre-development stage where applicable and avoid
developments in the World Heritage areas and
International Union Conservation of Nature Category I-IV
protected areas. We aim to minimise the potential
adverse impact of our operations on biodiversity and
promote ecosystem restoration to the maximum extent.
These commitments are demonstrated in our sustainable
building lifecycle. We strive for Sustainable SITES Initiative
(“SITES”) certification where possible, which sets a
framework for sustainable landscape development
projects. Our Tsim Sha Tsui waterfront revitalisation
project in Hong Kong, Avenue of Stars, is the first
outdoor space in Greater China to receive SITES v2 Gold
certification. We also prioritise native species in landscape
design to sustain a living landscape and natural habitat.
During the year, we also promoted conservation and
biodiversity among our communities. For example, we
organised an exhibition and a workshop for the public in
K11 malls in Wuhan and Shenyang, China. In Hong
Kong, NWSH co-organised the Geo Hero Run 2018 with
the Association for Geoconservation, Hong Kong to raise
awareness about geoconservation and environmental
protection.
BUILDING A SUSTAINABLE FUTURE WITH OUR SUPPLIERS
The Group's Sustainable Procurement Policy sets out our
commitment to reduce material use and responsible and
ethical sourcing. All suppliers and contractors are required
to adhere to the Group’s Supplier Code of Conduct. Our
construction businesses assess the ESG performance of
major suppliers including new ones every year. To raise
awareness and incentivise suppliers to contribute to
sustainable development, NWCON favours suppliers who
demonstrate their commitment to sustainability upon
tender and quotation evaluation.
NWD is a founding member of the Hong Kong Green
Council’s Sustainable Procurement Charter, which was
established with reference to the internationally-
recognised ISO 20400 Sustainable Procurement Guidance.
NWD’s central procurement obtained a Level 2
certification on the Charter, demonstrating a mature level
of sustainable procurement practices. We have been
recognised as a Sustainable Consumption Enterprise by
the Business Environment Council. NWD also signed the
Green Event Pledge of the Environmental Protection
Department of the HKSAR Government to instill
sustainability awareness among event partners.
Construction timber and concrete are the two key
materials used by our property businesses in terms of
sourcing volumes. While sourcing these materials,
preference is given to suppliers who can provide
sustainable and local material options. NWCON commits
to sourcing 100% Forest Stewardship Council or an
equivalent standard timber for temporary works in each
project. Our property construction projects aim to source
at least 10% of materials locally, that are grown or
manufactured within a radius of 800 km from project
sites, to support local suppliers and to reduce the
environmental impact of transportation.
During the year, the Hong Kong Convention and
Exhibition Centre (“HKCEC”) launched the “Think Before
Plastic” campaign and started replacing disposable plastic
cutlery, straws and meal boxes with non-plastic
alternatives. An extensive communication campaign was
conducted to engage event organisers, exhibitors,
contractors, visitors and restaurant guests. The campaign
saved over 1 million pieces of plastics within the first six
months. HKCEC was awarded the 2019 Sustainable
Development Award by UFI, the Global Association of the
Exhibition Industry.
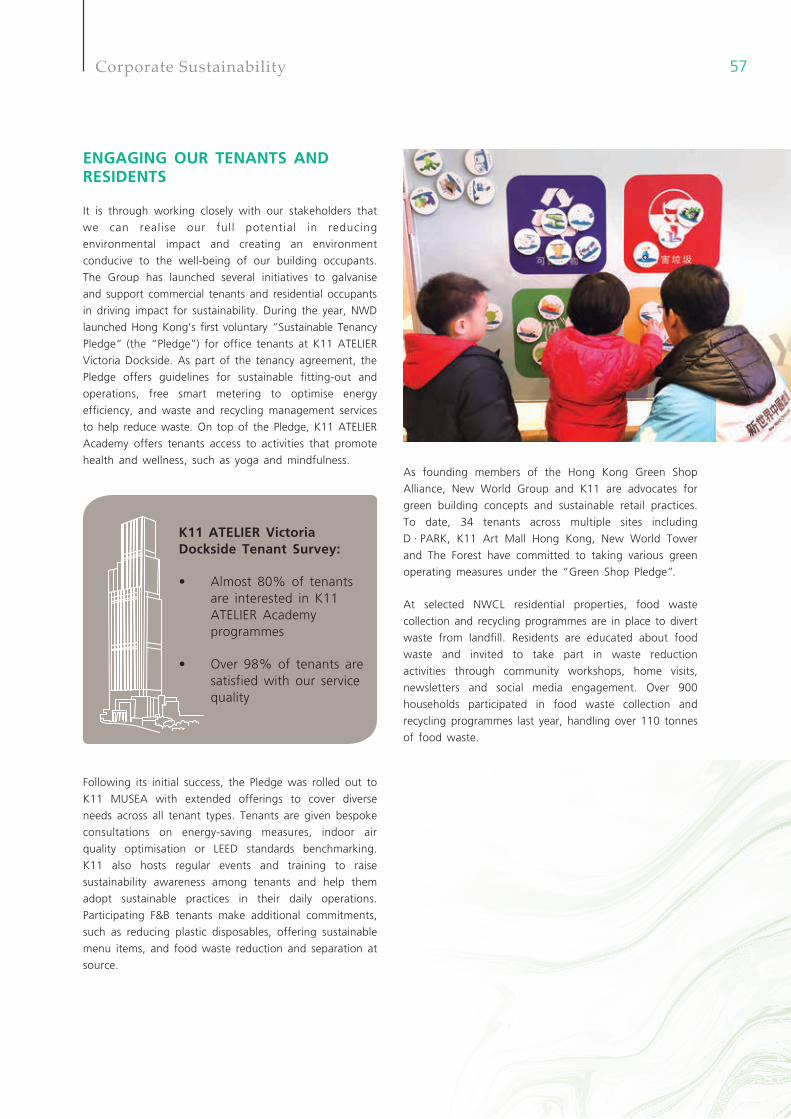
57Corporate Sustainability
ENGAGING OUR TENANTS AND RESIDENTS
It is through working closely with our stakeholders that
we can realise our full potential in reducing
environmental impact and creating an environment
conducive to the well-being of our building occupants.
The Group has launched several initiatives to galvanise
and support commercial tenants and residential occupants
in driving impact for sustainability. During the year, NWD
launched Hong Kong’s first voluntary “Sustainable Tenancy
Pledge” (the “Pledge”) for office tenants at K11 ATELIER
Victoria Dockside. As part of the tenancy agreement, the
Pledge offers guidelines for sustainable fitting-out and
operations, free smart metering to optimise energy
efficiency, and waste and recycling management services
to help reduce waste. On top of the Pledge, K11 ATELIER
Academy offers tenants access to activities that promote
health and wellness, such as yoga and mindfulness.
Following its initial success, the Pledge was rolled out to
K11 MUSEA with extended offerings to cover diverse
needs across all tenant types. Tenants are given bespoke
consultations on energy-saving measures, indoor air
quality optimisation or LEED standards benchmarking.
K11 also hosts regular events and training to raise
sustainability awareness among tenants and help them
adopt sustainable practices in their daily operations.
Participating F&B tenants make additional commitments,
such as reducing plastic disposables, offering sustainable
menu items, and food waste reduction and separation at
source.
K11 ATELIER Victoria Dockside Tenant Survey:
• Almost 80% of tenants are interested in K11 ATELIER Academy programmes
• Over 98% of tenants are satisfied with our service quality
As founding members of the Hong Kong Green Shop
Alliance, New World Group and K11 are advocates for
green building concepts and sustainable retail practices.
To date, 34 tenants across multiple sites including
D · PARK, K11 Art Mall Hong Kong, New World Tower
and The Forest have committed to taking various green
operating measures under the “Green Shop Pledge”.
At selected NWCL residential properties, food waste
collection and recycling programmes are in place to divert
waste from landfill. Residents are educated about food
waste and invited to take part in waste reduction
activities through community workshops, home visits,
newsletters and social media engagement. Over 900
households participated in food waste collection and
recycling programmes last year, handling over 110 tonnes
of food waste.
New
Wor
ld D
evel
opm
ent
Com
pany
Lim
ited
58A
nnua
l Rep
ort
2019
Corporate Sustainability
GREEN FINANCE
The “New World Development Green Finance
Framework” (“the Framework”) was established in March
2018 to enable the funding of sustainable building
design and operational enhancements through green
bonds or green loans. The Framework, which applies to
projects by NWD, NWCL and K11 in Hong Kong and
Mainland China, was developed based on the Green
Bond Principles 2018 and Green Loan Principles 2018 and
reviewed by Sustainalytics, an independent ESG research
and rating provider.
The eligibility criteria were developed with reference to
the aforesaid Principles. A Green Finance Review Panel is
in place to propose eligible projects for endorsement by
senior management. Please refer to the full Framework at
http://www.nwd.com.hk/sustainability/en/group.html#green.
We are a founding member of the Hong Kong Green
Finance Association, demonstrating our support of the
HKSAR Government’s efforts to establish Hong Kong as
the regional green finance hub.
Transactions under the Framework
Green Loan
Category: Green Buildings
Project: K11 ATELIER King’s Road1
Location: Hong Kong
GFA: 487,500 sq. ft.
Nature: Office
Certification: – HK BEAM Plus (Provisional Platinum) obtained in September 2016
– U.S. LEED (Platinum Pre-certification) obtained in December 2016
– WELL (Platinum Pre-certification) obtained in October 2017
Term loan facility:
HKD3.6 billion
Drawdown amount:
HKD1.1 billion
1: Refer to “King’s Road Commercial Re-development Project” in FY2018, which has completed shortly after FY2019
Green BondThe “New World China First Green Bond” (ISIN Code:
XS1915712233) was issued on 5 December 2018 under
NWCL's USD 2 billion medium-term note programme.
This USD 310 million green bond carries a coupon rate
of 4.75% and a 5-year maturity due 2023. The proceeds
from the green bond are used to finance the following
two green projects in the Greater Bay Area, both due for
completion by the end of 2021. The “New World China
First Green Bond” had received the “Green Finance
Certificate (Pre-issuance)” from Hong Kong Quality
Assurance Agency and the “Best Green Bond — Real
Estate (Asia-Pacific region)” award by The Asset, an
international financial magazine.
Category ProjectsAllocation of
proceeds
Green
Buildings
New World
Zengcheng
Comprehensive
Development
Project2
USD206.4
million67%
Green
Buildings
Qianhai CTF
Finance Tower2
USD101.7
million33%
Total allocated proceedsUSD308.1
million100%
Total net proceeds3USD308.1
million100%
2: The project names are subject to finalisation before official opening
3: Total net proceeds received is USD308.1 million out of the USD310 million green bond
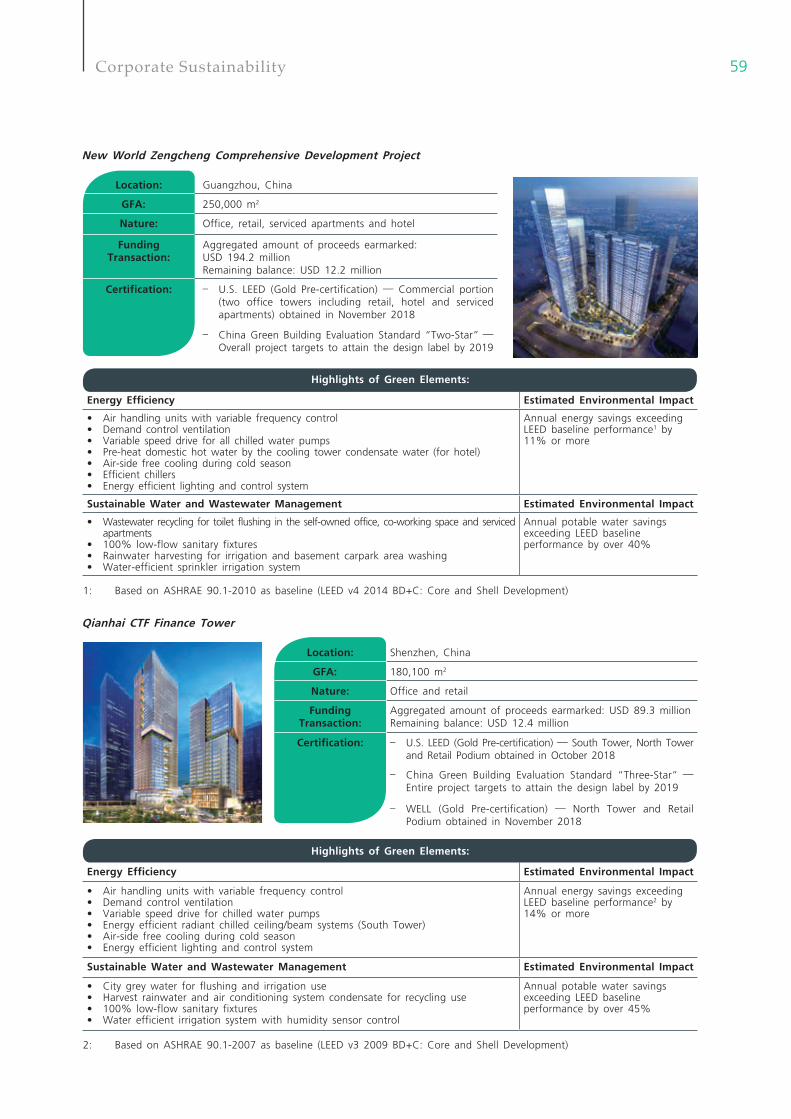
59Corporate Sustainability
New World Zengcheng Comprehensive Development Project
Location: Guangzhou, China
GFA: 250,000 m2
Nature: Office, retail, serviced apartments and hotel
Funding Transaction:
Aggregated amount of proceeds earmarked: USD 194.2 millionRemaining balance: USD 12.2 million
Certification: – U.S. LEED (Gold Pre-certification) — Commercial portion (two office towers including retail, hotel and serviced apartments) obtained in November 2018
– China Green Building Evaluation Standard “Two-Star” — Overall project targets to attain the design label by 2019
Highlights of Green Elements:
Energy Efficiency Estimated Environmental Impact
• Air handling units with variable frequency control• Demand control ventilation• Variable speed drive for all chilled water pumps• Pre-heat domestic hot water by the cooling tower condensate water (for hotel)• Air-side free cooling during cold season• Efficient chillers• Energy efficient lighting and control system
Annual energy savings exceeding LEED baseline performance1 by 11% or more
Sustainable Water and Wastewater Management Estimated Environmental Impact
• Wastewater recycling for toilet flushing in the self-owned office, co-working space and serviced apartments
• 100% low-flow sanitary fixtures• Rainwater harvesting for irrigation and basement carpark area washing• Water-efficient sprinkler irrigation system
Annual potable water savings exceeding LEED baseline performance by over 40%
1: Based on ASHRAE 90.1-2010 as baseline (LEED v4 2014 BD+C: Core and Shell Development)
Qianhai CTF Finance Tower
Location: Shenzhen, China
GFA: 180,100 m2
Nature: Office and retail
Funding Transaction:
Aggregated amount of proceeds earmarked: USD 89.3 millionRemaining balance: USD 12.4 million
Certification: – U.S. LEED (Gold Pre-certification) — South Tower, North Tower and Retail Podium obtained in October 2018
– China Green Building Evaluation Standard “Three-Star” — Entire project targets to attain the design label by 2019
– WELL (Gold Pre-certification) — North Tower and Retail Podium obtained in November 2018
Highlights of Green Elements:
Energy Efficiency Estimated Environmental Impact
• Air handling units with variable frequency control• Demand control ventilation• Variable speed drive for chilled water pumps• Energy efficient radiant chilled ceiling/beam systems (South Tower)• Air-side free cooling during cold season• Energy efficient lighting and control system
Annual energy savings exceeding LEED baseline performance2 by 14% or more
Sustainable Water and Wastewater Management Estimated Environmental Impact
• City grey water for flushing and irrigation use• Harvest rainwater and air conditioning system condensate for recycling use• 100% low-flow sanitary fixtures• Water efficient irrigation system with humidity sensor control
Annual potable water savings exceeding LEED baseline performance by over 45%
2: Based on ASHRAE 90.1-2007 as baseline (LEED v3 2009 BD+C: Core and Shell Development)
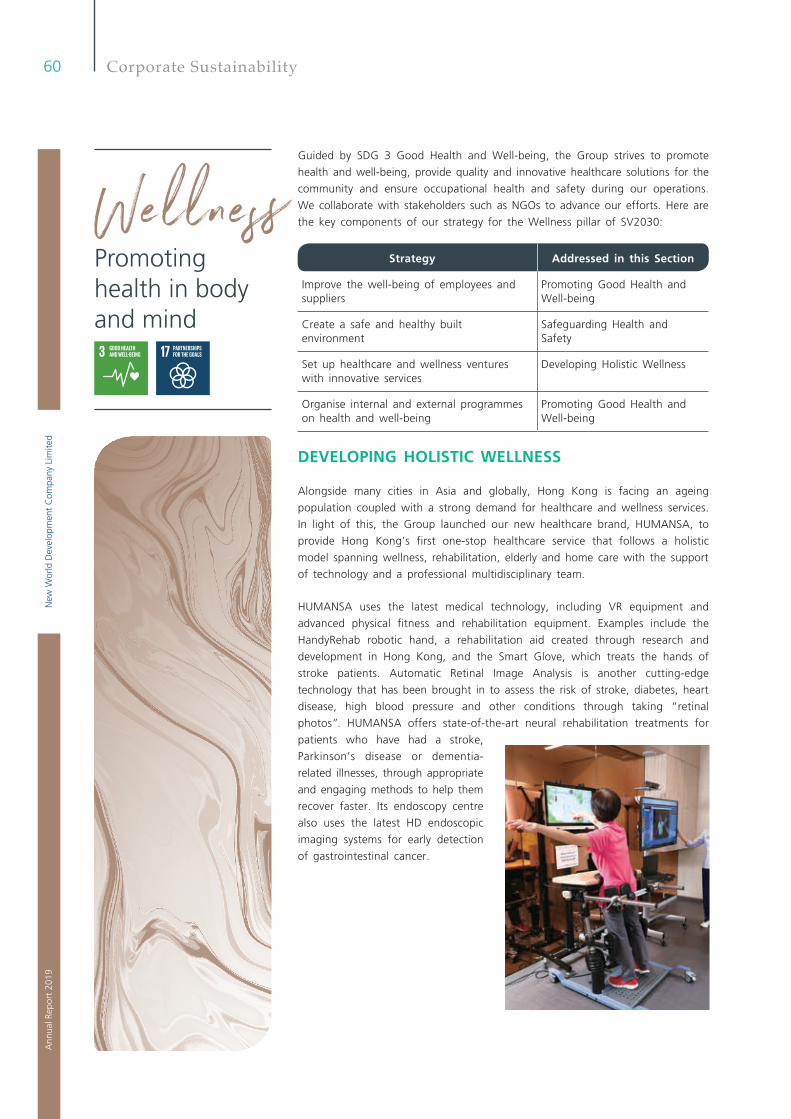
New
Wor
ld D
evel
opm
ent
Com
pany
Lim
ited
60A
nnua
l Rep
ort
2019
Promoting health in body and mind
Corporate Sustainability
Guided by SDG 3 Good Health and Well-being, the Group strives to promote
health and well-being, provide quality and innovative healthcare solutions for the
community and ensure occupational health and safety during our operations.
We collaborate with stakeholders such as NGOs to advance our efforts. Here are
the key components of our strategy for the Wellness pillar of SV2030:
Strategy Addressed in this Section
Improve the well-being of employees and suppliers
Promoting Good Health and Well-being
Create a safe and healthy built environment
Safeguarding Health and Safety
Set up healthcare and wellness ventures with innovative services
Developing Holistic Wellness
Organise internal and external programmes on health and well-being
Promoting Good Health and Well-being
DEVELOPING HOLISTIC WELLNESS
Alongside many cities in Asia and globally, Hong Kong is facing an ageing
population coupled with a strong demand for healthcare and wellness services.
In light of this, the Group launched our new healthcare brand, HUMANSA, to
provide Hong Kong’s first one-stop healthcare service that follows a holistic
model spanning wellness, rehabilitation, elderly and home care with the support
of technology and a professional multidisciplinary team.
HUMANSA uses the latest medical technology, including VR equipment and
advanced physical fitness and rehabilitation equipment. Examples include the
HandyRehab robotic hand, a rehabilitation aid created through research and
development in Hong Kong, and the Smart Glove, which treats the hands of
stroke patients. Automatic Retinal Image Analysis is another cutting-edge
technology that has been brought in to assess the risk of stroke, diabetes, heart
disease, high blood pressure and other conditions through taking “retinal
photos”. HUMANSA offers state-of-the-art neural rehabilitation treatments for
patients who have had a stroke,
Parkinson’s disease or dementia-
related illnesses, through appropriate
and engaging methods to help them
recover faster. Its endoscopy centre
also uses the latest HD endoscopic
imaging systems for early detection
of gastrointestinal cancer.
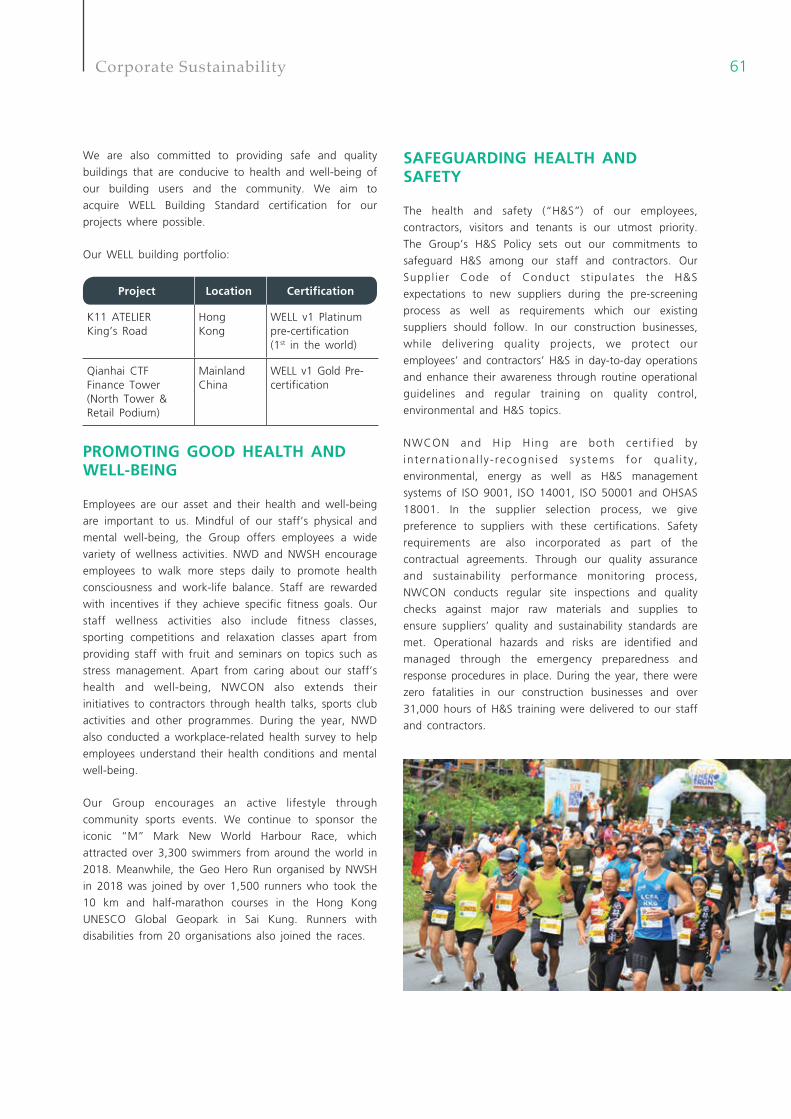
61Corporate Sustainability
We are also committed to providing safe and quality
buildings that are conducive to health and well-being of
our building users and the community. We aim to
acquire WELL Building Standard certification for our
projects where possible.
Our WELL building portfolio:
Project Location Certification
K11 ATELIER King’s Road
Hong Kong
WELL v1 Platinum pre-certification (1st in the world)
Qianhai CTF Finance Tower (North Tower & Retail Podium)
Mainland China
WELL v1 Gold Pre-certification
PROMOTING GOOD HEALTH AND WELL-BEING
Employees are our asset and their health and well-being
are important to us. Mindful of our staff’s physical and
mental well-being, the Group offers employees a wide
variety of wellness activities. NWD and NWSH encourage
employees to walk more steps daily to promote health
consciousness and work-life balance. Staff are rewarded
with incentives if they achieve specific fitness goals. Our
staff wellness activities also include fitness classes,
sporting competitions and relaxation classes apart from
providing staff with fruit and seminars on topics such as
stress management. Apart from caring about our staff’s
health and well-being, NWCON also extends their
initiatives to contractors through health talks, sports club
activities and other programmes. During the year, NWD
also conducted a workplace-related health survey to help
employees understand their health conditions and mental
well-being.
Our Group encourages an active lifestyle through
community sports events. We continue to sponsor the
iconic “M” Mark New World Harbour Race, which
attracted over 3,300 swimmers from around the world in
2018. Meanwhile, the Geo Hero Run organised by NWSH
in 2018 was joined by over 1,500 runners who took the
10 km and half-marathon courses in the Hong Kong
UNESCO Global Geopark in Sai Kung. Runners with
disabilities from 20 organisations also joined the races.
SAFEGUARDING HEALTH AND SAFETY
The health and safety (“H&S”) of our employees,
contractors, visitors and tenants is our utmost priority.
The Group’s H&S Policy sets out our commitments to
safeguard H&S among our staff and contractors. Our
Supplier Code of Conduct stipulates the H&S
expectations to new suppliers during the pre-screening
process as well as requirements which our existing
suppliers should follow. In our construction businesses,
while delivering quality projects, we protect our
employees’ and contractors’ H&S in day-to-day operations
and enhance their awareness through routine operational
guidelines and regular training on quality control,
environmental and H&S topics.
NWCON and Hip Hing are both cert i f ied by
internat ional ly - recognised systems for qual i ty ,
environmental, energy as well as H&S management
systems of ISO 9001, ISO 14001, ISO 50001 and OHSAS
18001. In the supplier selection process, we give
preference to suppliers with these certifications. Safety
requirements are also incorporated as part of the
contractual agreements. Through our quality assurance
and sustainability performance monitoring process,
NWCON conducts regular site inspections and quality
checks against major raw materials and supplies to
ensure suppliers’ quality and sustainability standards are
met. Operational hazards and risks are identified and
managed through the emergency preparedness and
response procedures in place. During the year, there were
zero fatalities in our construction businesses and over
31,000 hours of H&S training were delivered to our staff
and contractors.
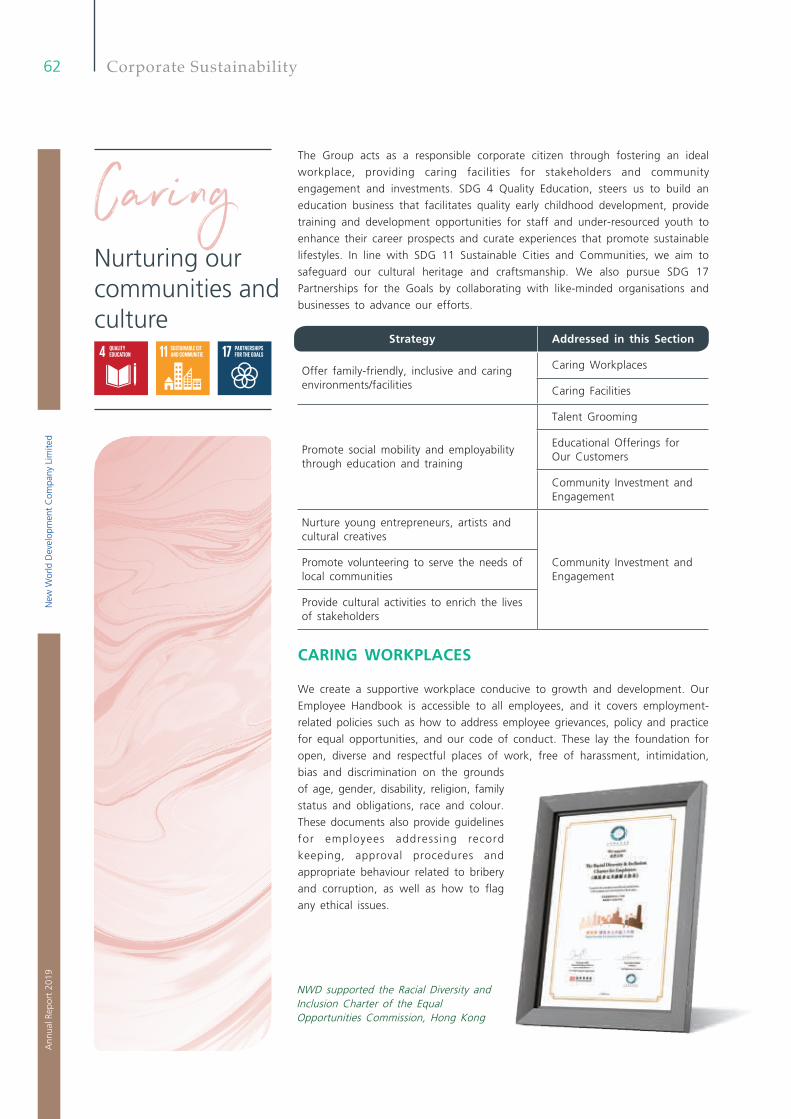
New
Wor
ld D
evel
opm
ent
Com
pany
Lim
ited
62A
nnua
l Rep
ort
2019
Nurturing our communities and culture
Corporate Sustainability
NWD supported the Racial Diversity and Inclusion Charter of the Equal Opportunities Commission, Hong Kong
The Group acts as a responsible corporate citizen through fostering an ideal
workplace, providing caring facilities for stakeholders and community
engagement and investments. SDG 4 Quality Education, steers us to build an
education business that facilitates quality early childhood development, provide
training and development opportunities for staff and under-resourced youth to
enhance their career prospects and curate experiences that promote sustainable
lifestyles. In line with SDG 11 Sustainable Cities and Communities, we aim to
safeguard our cultural heritage and craftsmanship. We also pursue SDG 17
Partnerships for the Goals by collaborating with like-minded organisations and
businesses to advance our efforts.
Strategy Addressed in this Section
Offer family-friendly, inclusive and caring environments/facilities
Caring Workplaces
Caring Facilities
Promote social mobility and employability through education and training
Talent Grooming
Educational Offerings for Our Customers
Community Investment and Engagement
Nurture young entrepreneurs, artists and cultural creatives
Community Investment and Engagement
Promote volunteering to serve the needs of local communities
Provide cultural activities to enrich the lives of stakeholders
CARING WORKPLACES
We create a supportive workplace conducive to growth and development. Our
Employee Handbook is accessible to all employees, and it covers employment-
related policies such as how to address employee grievances, policy and practice
for equal opportunities, and our code of conduct. These lay the foundation for
open, diverse and respectful places of work, free of harassment, intimidation,
bias and discrimination on the grounds
of age, gender, disability, religion, family
status and obligations, race and colour.
These documents also provide guidelines
for employees addressing record
keeping, approval procedures and
appropriate behaviour related to bribery
and corruption, as well as how to flag
any ethical issues.
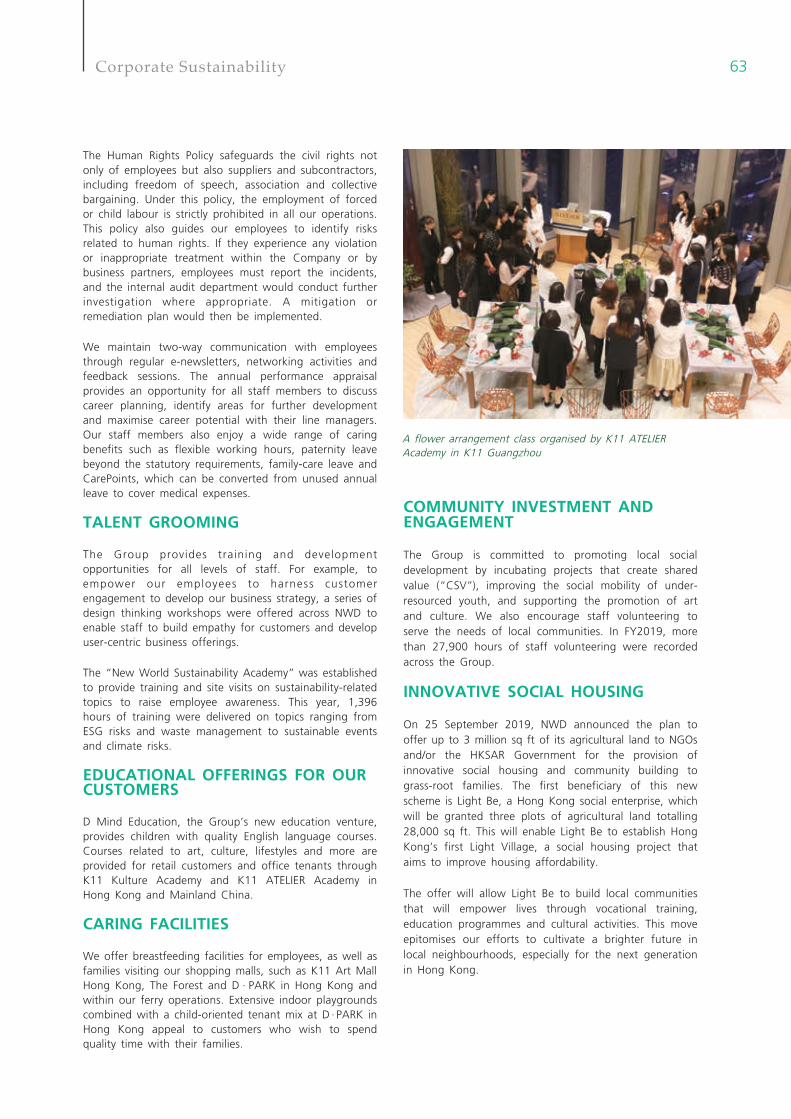
63Corporate Sustainability
The Human Rights Policy safeguards the civil rights not only of employees but also suppliers and subcontractors, including freedom of speech, association and collective bargaining. Under this policy, the employment of forced or child labour is strictly prohibited in all our operations. This policy also guides our employees to identify risks related to human rights. If they experience any violation or inappropriate treatment within the Company or by business partners, employees must report the incidents, and the internal audit department would conduct further investigation where appropriate. A mitigation or remediation plan would then be implemented.
We maintain two-way communication with employees through regular e-newsletters, networking activities and feedback sessions. The annual performance appraisal provides an opportunity for all staff members to discuss career planning, identify areas for further development and maximise career potential with their line managers. Our staff members also enjoy a wide range of caring benefits such as flexible working hours, paternity leave beyond the statutory requirements, family-care leave and CarePoints, which can be converted from unused annual leave to cover medical expenses.
TALENT GROOMING
The Group provides training and development opportunities for all levels of staff. For example, to empower our employees to harness customer engagement to develop our business strategy, a series of design thinking workshops were offered across NWD to enable staff to build empathy for customers and develop user-centric business offerings.
The “New World Sustainability Academy” was established to provide training and site visits on sustainability-related topics to raise employee awareness. This year, 1,396 hours of training were delivered on topics ranging from ESG risks and waste management to sustainable events and climate risks.
EDUCATIONAL OFFERINGS FOR OUR CUSTOMERS
D Mind Education, the Group’s new education venture, provides children with quality English language courses. Courses related to art, culture, lifestyles and more are provided for retail customers and office tenants through K11 Kulture Academy and K11 ATELIER Academy in Hong Kong and Mainland China.
CARING FACILITIES
We offer breastfeeding facilities for employees, as well as families visiting our shopping malls, such as K11 Art Mall Hong Kong, The Forest and D · PARK in Hong Kong and within our ferry operations. Extensive indoor playgrounds combined with a child-oriented tenant mix at D · PARK in Hong Kong appeal to customers who wish to spend quality time with their families.
COMMUNITY INVESTMENT AND ENGAGEMENT
The Group is committed to promoting local social development by incubating projects that create shared value (“CSV”), improving the social mobility of under-resourced youth, and supporting the promotion of art and culture. We also encourage staff volunteering to serve the needs of local communities. In FY2019, more than 27,900 hours of staff volunteering were recorded across the Group.
INNOVATIVE SOCIAL HOUSING
On 25 September 2019, NWD announced the plan to offer up to 3 million sq ft of its agricultural land to NGOs and/or the HKSAR Government for the provision of innovative social housing and community building to grass-root families. The first beneficiary of this new scheme is Light Be, a Hong Kong social enterprise, which will be granted three plots of agricultural land totalling 28,000 sq ft. This will enable Light Be to establish Hong Kong’s first Light Village, a social housing project that aims to improve housing affordability.
The offer will allow Light Be to build local communities that will empower lives through vocational training, education programmes and cultural activities. This move epitomises our efforts to cultivate a brighter future in local neighbourhoods, especially for the next generation in Hong Kong.
A flower arrangement class organised by K11 ATELIER Academy in K11 Guangzhou
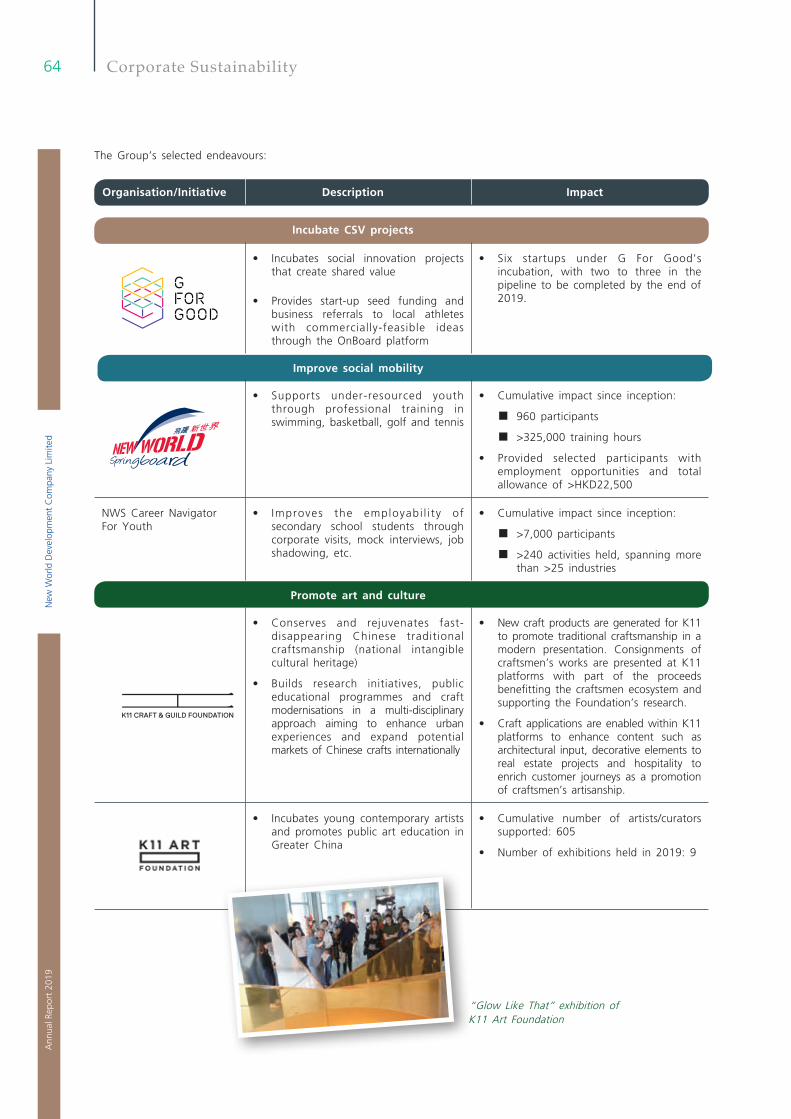
New
Wor
ld D
evel
opm
ent
Com
pany
Lim
ited
64A
nnua
l Rep
ort
2019
Corporate Sustainability
The Group’s selected endeavours:
Organisation/Initiative Description Impact
Incubate CSV projects
• Incubates social innovation projects that create shared value
• Provides start-up seed funding and business referrals to local athletes with commercially-feasible ideas through the OnBoard platform
• Six startups under G For Good's incubation, with two to three in the pipeline to be completed by the end of 2019.
Improve social mobility
• Supports under-resourced youth through professional training in swimming, basketball, golf and tennis
• Cumulative impact since inception:
■ 960 participants
■ >325,000 training hours
• Provided selected participants with employment opportunities and total allowance of >HKD22,500
NWS Career Navigator For Youth
• Improves the employabi l i ty of secondary school students through corporate visits, mock interviews, job shadowing, etc.
• Cumulative impact since inception:
■ >7,000 participants
■ >240 activities held, spanning more than >25 industries
Promote art and culture
• Conserves and rejuvenates fast-disappearing Chinese traditional craftsmanship (national intangible cultural heritage)
• Builds research initiatives, public educational programmes and craft modernisations in a multi-disciplinary approach aiming to enhance urban experiences and expand potential markets of Chinese crafts internationally
• New craft products are generated for K11 to promote traditional craftsmanship in a modern presentation. Consignments of craftsmen’s works are presented at K11 platforms with part of the proceeds benefitting the craftsmen ecosystem and supporting the Foundation’s research.
• Craft applications are enabled within K11 platforms to enhance content such as architectural input, decorative elements to real estate projects and hospitality to enrich customer journeys as a promotion of craftsmen’s artisanship.
• Incubates young contemporary artists and promotes public art education in Greater China
• Cumulative number of artists/curators supported: 605
• Number of exhibitions held in 2019: 9
“Glow Like That” exhibition of K11 Art Foundation
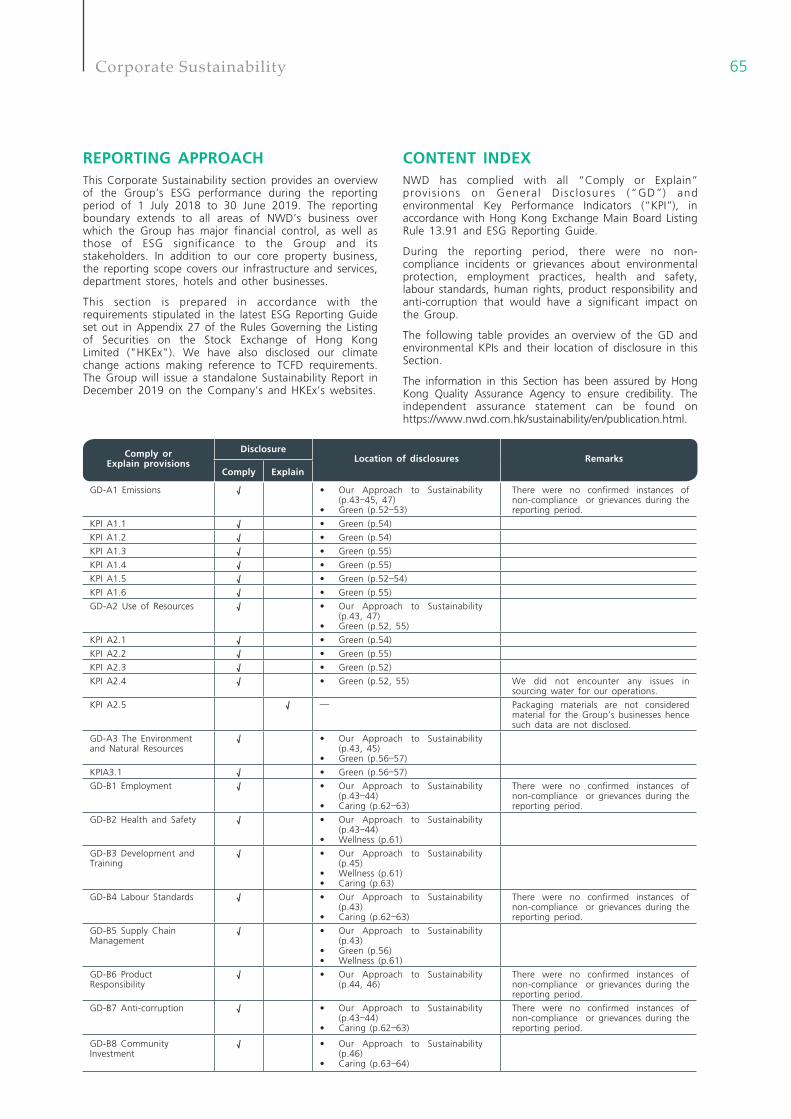
65Corporate Sustainability
Comply or Explain provisions
DisclosureLocation of disclosures Remarks
Comply Explain
GD-A1 Emissions √ • Our Approach to Sustainability (p.43–45, 47)
• Green (p.52–53)
There were no confirmed instances of non-compliance or grievances during the reporting period.
KPI A1.1 √ • Green (p.54)
KPI A1.2 √ • Green (p.54)
KPI A1.3 √ • Green (p.55)
KPI A1.4 √ • Green (p.55)
KPI A1.5 √ • Green (p.52–54)
KPI A1.6 √ • Green (p.55)
GD-A2 Use of Resources √ • Our Approach to Sustainability (p.43, 47)
• Green (p.52, 55)
KPI A2.1 √ • Green (p.54)
KPI A2.2 √ • Green (p.55)
KPI A2.3 √ • Green (p.52)
KPI A2.4 √ • Green (p.52, 55) We did not encounter any issues in sourcing water for our operations.
KPI A2.5 √ — Packaging materials are not considered material for the Group’s businesses hence such data are not disclosed.
GD-A3 The Environment and Natural Resources
√ • Our Approach to Sustainability (p.43, 45)
• Green (p.56–57)
KPIA3.1 √ • Green (p.56–57)
GD-B1 Employment √ • Our Approach to Sustainability (p.43–44)
• Caring (p.62–63)
There were no confirmed instances of non-compliance or grievances during the reporting period.
GD-B2 Health and Safety √ • Our Approach to Sustainability (p.43–44)
• Wellness (p.61)
GD-B3 Development and Training
√ • Our Approach to Sustainability (p.45)
• Wellness (p.61)• Caring (p.63)
GD-B4 Labour Standards √ • Our Approach to Sustainability (p.43)
• Caring (p.62–63)
There were no confirmed instances of non-compliance or grievances during the reporting period.
GD-B5 Supply Chain Management
√ • Our Approach to Sustainability (p.43)
• Green (p.56)• Wellness (p.61)
GD-B6 Product Responsibility
√ • Our Approach to Sustainability (p.44, 46)
There were no confirmed instances of non-compliance or grievances during the reporting period.
GD-B7 Anti-corruption √ • Our Approach to Sustainability (p.43–44)
• Caring (p.62–63)
There were no confirmed instances of non-compliance or grievances during the reporting period.
GD-B8 Community Investment
√ • Our Approach to Sustainability (p.46)
• Caring (p.63–64)
REPORTING APPROACHThis Corporate Sustainability section provides an overview of the Group’s ESG performance during the reporting period of 1 July 2018 to 30 June 2019. The reporting boundary extends to all areas of NWD’s business over which the Group has major financial control, as well as those of ESG significance to the Group and its stakeholders. In addition to our core property business, the reporting scope covers our infrastructure and services, department stores, hotels and other businesses.
This section is prepared in accordance with the requirements stipulated in the latest ESG Reporting Guide set out in Appendix 27 of the Rules Governing the Listing of Securities on the Stock Exchange of Hong Kong Limited ("HKEx"). We have also disclosed our climate change actions making reference to TCFD requirements. The Group will issue a standalone Sustainability Report in December 2019 on the Company’s and HKEx’s websites.
CONTENT INDEXNWD has complied with all “Comply or Explain” provis ions on General Disclosures (“GD”) and environmental Key Performance Indicators (“KPI”), in accordance with Hong Kong Exchange Main Board Listing Rule 13.91 and ESG Reporting Guide.
During the reporting period, there were no non-compliance incidents or grievances about environmental protection, employment practices, health and safety, labour standards, human rights, product responsibility and anti-corruption that would have a significant impact on the Group.
The following table provides an overview of the GD and environmental KPIs and their location of disclosure in this Section.
The information in this Section has been assured by Hong Kong Quality Assurance Agency to ensure credibility. The independent assurance statement can be found on https://www.nwd.com.hk/sustainability/en/publication.html.
New
Wor
ld D
evel
opm
ent
Com
pany
Lim
ited
66A
nnua
l Rep
ort
2019
Corporate Governance Report
All along, the Company is committed to maintain a high standard of corporate governance practices to safeguard the interests of its shareholders and enhance the performance of the Group. From time to time, the board of Directors (the “Board”) reviews and improves its corporate governance practices in order to ensure that the Group is under the leadership of an effective board so as to optimise return for its shareholders.
CORPORATE GOVERNANCE CODE
Throughout the year ended 30 June 2019, the Company has complied with all the applicable code provisions of the Corporate Governance Code (the “CG Code”) as set out in Appendix 14 of the Listing Rules, with the exception of code provision A.6.4.
Code provision A.6.4 is in relation to guidelines for securities dealings by relevant employees. As required under code provision A.6.4, the Board should establish for its relevant employees written guidelines on no less exacting terms than the Model Code for Securities Transactions by Directors of Listed Issuers (the “Model Code”) as set out in Appendix 10 of the Listing Rules in respect of their dealings in the securities of the Company. Instead of following the Model Code strictly, the Board has established its own guidelines which are not on no less exacting terms than the Model Code. Such deviation from the CG Code is considered necessary, mainly because of the huge size of employees of the Group which is over 45,000 and the Group’s diversified businesses. For these reasons, to follow the exact guidelines of the Model Code will cause immense administrative burden to the Company in processing written notifications from the relevant employees when they deal in the securities of the Company, which can be avoided under the Company’s own guidelines.
DIRECTORS’ SECURITIES TRANSACTIONS
The Company has adopted the Model Code as its own code of conduct for securities transactions by its Directors.
Specific enquiries have been made with all Directors who confirmed that they had complied with the required standard set out in the Model Code during the year ended 30 June 2019.
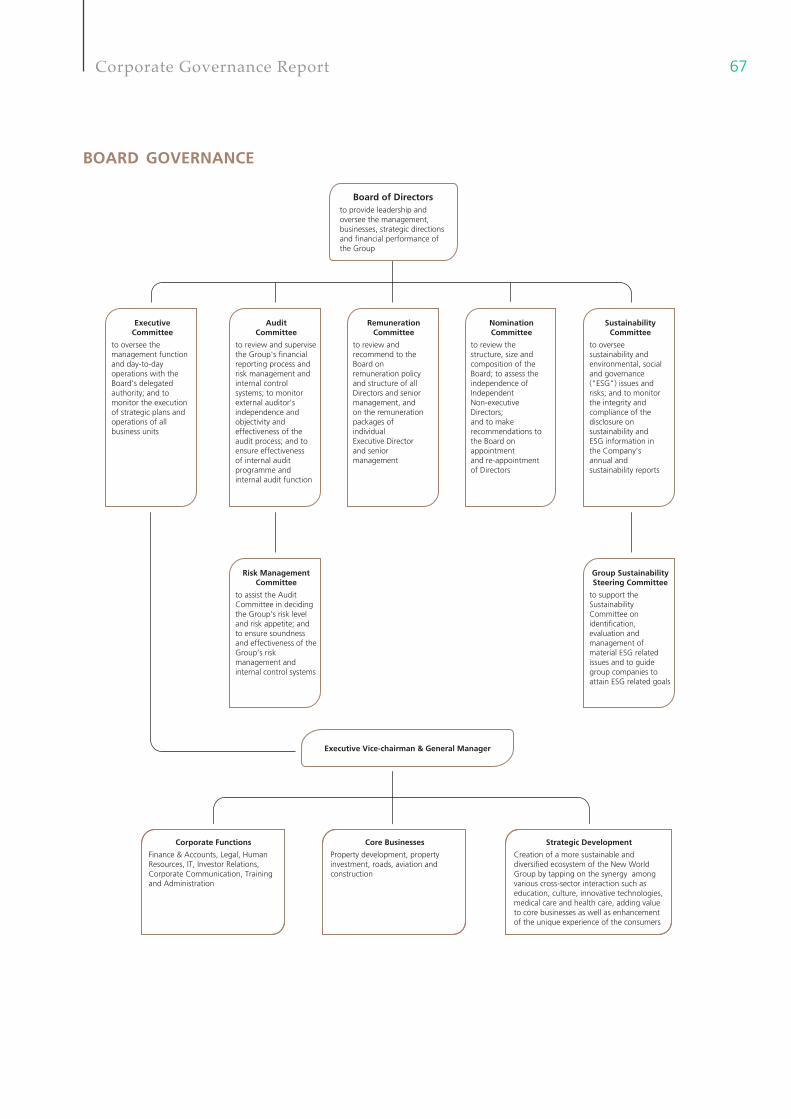
67Corporate Governance Report
BOARD GOVERNANCE
Executive Vice-chairman & General Manager
Board of Directorsto provide leadership and oversee the management, businesses, strategic directions and financial performance of the Group
Corporate Functions
Finance & Accounts, Legal, Human Resources, IT, Investor Relations, Corporate Communication, Training and Administration
Core Businesses
Property development, property investment, roads, aviation and construction
Strategic Development
Creation of a more sustainable and diversified ecosystem of the New World Group by tapping on the synergy among various cross-sector interaction such as education, culture, innovative technologies, medical care and health care, adding value to core businesses as well as enhancement of the unique experience of the consumers
Executive Committee
to oversee the management function and day-to-day operations with theBoard's delegated authority; and to monitor the execution of strategic plans and operations of all business units
Audit Committee
to review and supervise the Group's financial reporting process and risk management and internal control systems; to monitorexternal auditor’s independence and objectivity and effectiveness of the audit process; and to ensure effectivenessof internal audit programme and internal audit function
Risk Management Committee
to assist the Audit Committee in deciding the Group’s risk level and risk appetite; and to ensure soundness and effectiveness of the Group’s risk management and internal control systems
Group Sustainability Steering Committee
to support the Sustainability Committee on identification, evaluation and management of material ESG related issues and to guide group companies to attain ESG related goals
RemunerationCommittee
to review andrecommend to theBoard onremuneration policyand structure of allDirectors and seniormanagement, and on the remunerationpackages of individualExecutive Directorand seniormanagement
NominationCommittee
to review thestructure, size andcomposition of theBoard; to assess theindependence ofIndependentNon-executiveDirectors;and to makerecommendations tothe Board onappointmentand re-appointmentof Directors
SustainabilityCommittee
to overseesustainability andenvironmental, socialand governance("ESG") issues andrisks; and to monitorthe integrity andcompliance of thedisclosure onsustainability and ESG information in the Company's annual and sustainability reports
New
Wor
ld D
evel
opm
ent
Com
pany
Lim
ited
68A
nnua
l Rep
ort
2019
Corporate Governance Report
BOARD OF DIRECTORS
CompositionCurrently, the Board comprises a total of 16 Directors, being seven Executive Directors, three Non-executive Directors and six Independent Non-executive Directors. The number of Independent Non-executive Directors represents more than one-third of the Board as required by Rule 3.10A of the Listing Rules. The biographies of the Directors are set out from pages 28 to 36 of this annual report.
All Directors have entered into formal letters of appointment with the Company, each for a term of three years, subject to retirement by rotation in accordance with the articles of association of the Company (the “Articles of Association”).
Article 103(A) of the Articles of Association provides that at each annual general meeting, one-third of the Directors for the time being (or if their number is not a multiple of three, the number nearest to but not less than one-third) shall retire from office by rotation, provided that every Director (including those appointed for a specific term) shall be subject to retirement by rotation at least once every three years. Also, pursuant to Article 94 of the Articles of Association, any Director appointed to fill a casual vacancy or as an addition to the Board is subject to re-election at the next following general meeting or next following annual general meeting of the Company respectively.
To ensure that Directors have spent sufficient time on the affairs of the Company, all Directors have annually disclosed to the Company the level of time involved in performing the duties of his/her position held in the Company and other public companies or organisations or other major appointments.
Chairman, Executive Vice-chairman & General Manager and Other Executive DirectorsDr. Cheng Kar-Shun, Henry, the Chairman, has led the Board and ensured that the Board works effectively and that all important issues are discussed in a timely manner. Dr. Cheng Chi-Kong, Adrian, the Executive Vice-chairman & General Manager, oversees the Company’s day-to-day businesses and the implementation of major strategies and policies of the Company. Each of the other Executive Directors takes up different responsibilities according to their own expertise. The responsibilities of the Chairman, the Executive Vice-chairman & General Manager and the other Executive Directors are clearly set out in their respective letters of appointment. The positions of the Chairman and the Executive Vice-chairman & General Manager are held by separate individuals so as to maintain an effective segregation of duties.
Non-executive DirectorsNon-executive Directors (including the Independent Non-executive Directors) serve the relevant function of bringing independent judgement on the development, performance and risk management of the Company. They have the same duties of care and skill and fiduciary duties as the Executive Directors.
Independence of Independent Non-executive DirectorsThe Company has received annual confirmation of independence from all Independent Non-executive Directors in accordance with Rule 3.13 of the Listing Rules. The Board is of the view that all Independent Non-executive Directors are independent in accordance with the Listing Rules.
During the year, Independent Non-executive Directors met quarterly with members of senior management and representatives from major business units, which provided a good opportunity for Independent Non-executive Directors to better understand the businesses of the Group and to discuss a wide range of issues concerning the Group.
Role of the BoardThe Board oversees the management, businesses, strategic directions and financial performance of the Group. It is collectively responsible for the management and operation of the Company. The Board is the ultimate decision making body of the Company except for matters requiring the approval of the shareholders in accordance with the Articles of Association, the Listing Rules or other applicable laws and regulations.
Day-to-day businesses of the Company are delegated to the management team which works under the leadership and supervision of the Executive Vice-chairman & General Manager and the Executive Committee of the Board as discussed in sections below.
69Corporate Governance Report
Corporate Governance FunctionsThe Board is responsible for performing the corporate governance duties of the Company including:
(a) to develop and review the Company’s policies and practices on corporate governance;
(b) to review and monitor the training and continuous professional development of the Directors and senior management;
(c) to review and monitor the Company’s policies and practices in compliance with legal and regulatory requirements;
(d) to develop, review and monitor the code of conduct and compliance manual (if any) applicable to employees and the Directors; and
(e) to review the Company’s compliance with Appendix 14 of the Listing Rules (Corporate Governance Code and Corporate Governance Report).
The Group complied with all major aspects of laws and regulations that are significant to its business operations. There were no threatened or concluded cases of material nature in connection with legal compliance during the year.
Board MeetingsRegular Board meetings are held at least four times a year with at least 14 days’ notices and additional meetings with reasonable notices are held as and when the Board considers appropriate. The Company Secretary assists the Chairman in preparing agenda for each meeting. Draft agenda for each Board meeting is circulated to all Directors to enable them to include other matters into the agenda. Agenda accompanying board papers are sent to all Directors at least three days before each regular Board meeting. Board decisions are voted upon at the Board meetings. The Company Secretary records all matters considered by the Board, decisions reached and any concerns raised or dissenting views expressed by the Directors. Minutes of meetings are kept by the Company Secretary with copies circulated to all Directors for information and records.
Directors’ TrainingEach newly appointed Director is provided with the necessary induction and information to ensure that he/she has a proper understanding of the Company’s operations and businesses as well as his/her responsibilities under the relevant statues, laws, rules and regulations. From time to time, the Company Secretary also provides the Directors with updates on latest development and changes in the Listing Rules and other relevant legal and regulatory requirements.
The Executive Vice-chairman and General Manager reports Group business activities including operations review, segment performance, strategies and new initiatives at regular Board meetings. In addition, all Directors are provided with monthly updates on major business segments performance and year-to-date financials. All these give the Board a balanced and understandable assessment of the Group’s performance, position and prospects and enable the Board as a whole and each Director to discharge their duties.
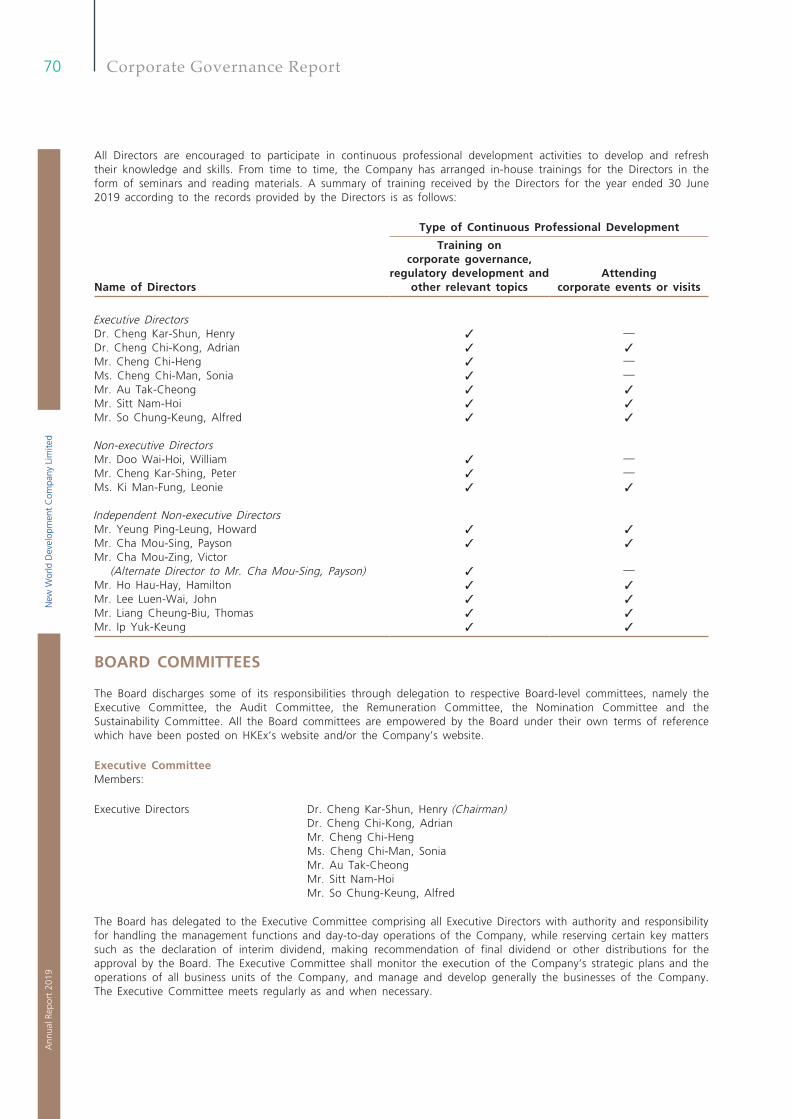
New
Wor
ld D
evel
opm
ent
Com
pany
Lim
ited
70A
nnua
l Rep
ort
2019
Corporate Governance Report
All Directors are encouraged to participate in continuous professional development activities to develop and refresh their knowledge and skills. From time to time, the Company has arranged in-house trainings for the Directors in the form of seminars and reading materials. A summary of training received by the Directors for the year ended 30 June 2019 according to the records provided by the Directors is as follows:
Type of Continuous Professional Development
Name of Directors
Training on corporate governance,
regulatory development and other relevant topics
Attending corporate events or visits
Executive DirectorsDr. Cheng Kar-Shun, Henry ✓ —Dr. Cheng Chi-Kong, Adrian ✓ ✓
Mr. Cheng Chi-Heng ✓ —Ms. Cheng Chi-Man, Sonia ✓ —Mr. Au Tak-Cheong ✓ ✓
Mr. Sitt Nam-Hoi ✓ ✓
Mr. So Chung-Keung, Alfred ✓ ✓
Non-executive DirectorsMr. Doo Wai-Hoi, William ✓ —Mr. Cheng Kar-Shing, Peter ✓ —Ms. Ki Man-Fung, Leonie ✓ ✓
Independent Non-executive DirectorsMr. Yeung Ping-Leung, Howard ✓ ✓
Mr. Cha Mou-Sing, Payson ✓ ✓
Mr. Cha Mou-Zing, Victor (Alternate Director to Mr. Cha Mou-Sing, Payson) ✓ —
Mr. Ho Hau-Hay, Hamilton ✓ ✓
Mr. Lee Luen-Wai, John ✓ ✓
Mr. Liang Cheung-Biu, Thomas ✓ ✓
Mr. Ip Yuk-Keung ✓ ✓
BOARD COMMITTEES
The Board discharges some of its responsibilities through delegation to respective Board-level committees, namely the Executive Committee, the Audit Committee, the Remuneration Committee, the Nomination Committee and the Sustainability Committee. All the Board committees are empowered by the Board under their own terms of reference which have been posted on HKEx’s website and/or the Company’s website.
Executive CommitteeMembers:
Executive Directors Dr. Cheng Kar-Shun, Henry (Chairman)Dr. Cheng Chi-Kong, AdrianMr. Cheng Chi-HengMs. Cheng Chi-Man, SoniaMr. Au Tak-CheongMr. Sitt Nam-HoiMr. So Chung-Keung, Alfred
The Board has delegated to the Executive Committee comprising all Executive Directors with authority and responsibility for handling the management functions and day-to-day operations of the Company, while reserving certain key matters such as the declaration of interim dividend, making recommendation of final dividend or other distributions for the approval by the Board. The Executive Committee shall monitor the execution of the Company’s strategic plans and the operations of all business units of the Company, and manage and develop generally the businesses of the Company. The Executive Committee meets regularly as and when necessary.
71Corporate Governance Report
Audit CommitteeMembers:
Independent Non-executive Directors Mr. Lee Luen-Wai, John (Chairman)Mr. Yeung Ping-Leung, HowardMr. Cha Mou-Sing, PaysonMr. Ho Hau-Hay, HamiltonMr. Liang Cheung-Biu, ThomasMr. Ip Yuk-Keung
The Audit Committee is responsible for reviewing the Group’s financial controls, and its risk management and internal control systems. The Audit Committee is empowered to review and monitor the external auditor’s independence and objectivity and the effectiveness of the audit process in accordance with applicable standards. It also reviews the internal audit programme and ensures the internal audit function is adequately resourced and effective.
During the year, the Audit Committee met twice and reviewed the audited financial statements of the Company for the year ended 30 June 2018 and the unaudited interim financial statements of the Company for the six months ended 31 December 2018 with recommendations to the Board for approval, reviewed reports on risk management and internal control systems of the Group, and discussed with the management and the external auditors of the accounting policies and practices which may affect the Group and the financial reporting matters. Furthermore, the Audit Committee reviewed the framework and policy of risk management, the system of internal control and the financial statements for the year ended 30 June 2019 of the Company with recommendation to the Board for approval.
Remuneration CommitteeMembers:
Independent Non-executive Directors Mr. Ho Hau-Hay, Hamilton (Chairman)Mr. Yeung Ping-Leung, HowardMr. Cha Mou-Sing, PaysonMr. Lee Luen-Wai, John
Executive Director Dr. Cheng Kar-Shun, Henry
The Remuneration Committee is responsible for making recommendations to the Board on the Company’s policy and structure on the remuneration of all Directors and senior management of the Company and on the establishment of a formal and transparent procedure for developing remuneration policy for the Company for approval by the Board. It shall also make recommendations to the Board on the remuneration packages of individual Executive Director and senior management.
The remuneration of individual Executive Director and senior management is determined with reference to his/her duties and responsibilities with the Company, the Company’s performance as well as remuneration benchmarks in the industry and the prevailing market condition. The Company’s Human Resources Department provides materials on relevant remuneration data, remuneration benchmarks, market analysis and proposals to the Remuneration Committee for consideration. The remuneration package is performance-based and linked to the Company’s profitability, aimed to be competitive to attract and retain talented employees.
During the year, the Remuneration Committee met once and reviewed the remuneration policy of the Company, including that for the Directors and senior management of the Company. The remuneration for the Executive Directors comprises basic salary, pensions and discretionary bonus. Share options have been granted to all Directors and senior management to subscribe for shares in the Company under the Company’s share option scheme. In addition, a Director has been granted options under share option scheme of a listed subsidiary of the Group to subscribe for shares in that listed subsidiary. Details of the remuneration paid to the Directors and members of senior management for the financial year ended 30 June 2019 are disclosed in the notes to the financial statements.
New
Wor
ld D
evel
opm
ent
Com
pany
Lim
ited
72A
nnua
l Rep
ort
2019
Corporate Governance Report
Nomination CommitteeMembers:
Executive Director Dr. Cheng Kar-Shun, Henry (Chairman)
Independent Non-executive Directors Mr. Lee Luen-Wai, JohnMr. Liang Cheung-Biu, ThomasMr. Ip Yuk-Keung
The Nomination Committee is responsible for reviewing the structure, size and composition of the Board, assessing the independence of Independent Non-executive Directors taking into account the independence requirements set out in Rule 3.13 of the Listing Rules, and making recommendations to the Board on appointment and re-appointment of Directors.
The Nomination Committee met twice during the year. To comply with the new requirement under the Listing Rules, the Nomination Committee formalised the Company’s existing approach and procedures and recommended the nomination policy to the Board for adoption. It also reviewed the structure, size and composition of the Board and considered that the Board consists of a diverse mix of members and has provided a good balance of skills and experience appropriate to the business needs of the Group. For the retiring Directors standing for re-election at 2019 annual general meeting of the Company, the Nomination Committee reviewed their biographical details against relevant requirements under the Listing Rules and the nomination criteria set out in the Company’s Nomination Policy and considered they have the required character, integrity and professional knowledge and experience to continue fulfilling their role and contributing to the Company and the diversity of the Board.
The Board adopted a Nomination Policy in November 2018 which sets out the criteria and procedures to be adopted when considering candidates to be appointed as Directors and re-appointment of existing Directors. In the case of identifying candidate(s) to be appointed as Director, the Nomination Committee shall hold a meeting to consider the candidate(s) identified or selected pursuant to the nomination criteria and make recommendation to the Board if appropriate. The Board shall deliberate and decide on the appointment based upon the recommendation of the Nomination Committee. In the case of re-appointment of existing Director, the Nomination Committee shall review the overall contribution and service of the retiring Director to the Company and determine whether the retiring Director continues to meet the nomination criteria set out in the Nomination Policy, and if appropriate, recommend the retiring Director to the Board for consideration and recommendation to shareholders for the proposed re-election of Director at a general meeting. The factors considered in assessing the suitability of a proposed candidate for appointment as Director or re-appointment of existing Director are as follows:
• Contribution to the Board with due regard to the Board’s diversity policy;
• Reputation for integrity;
• Commitment to devote sufficient time to discharge duties as a Board member;
• Potential conflicts of interest with the Company; and
• Satisfaction of independence requirements of the Listing Rules in the case of a candidate for Independent Non-executive Director.
The Board adopted a Board Diversity Policy (the “Policy”) in August 2013 which sets out the approach by the Company to achieve diversity on the Board. Under the Policy, the Company recognises and embraces the benefits of having a diverse Board and sees increasing diversity at Board level as an essential element in maintaining its competitive advantage and supporting its sustainable development. In determining an optimum composition of the Board, the Company will consider all aspects of diversity and will also take into account factors based on its own business model and specific needs from time to time. Board members’ appointment will be based on meritocracy and candidates will be considered against objective criteria, having due regard for the benefits of diversity on the Board. Selection of candidates will be based on a range of diversity perspectives, including but not limited to gender, age, skills, regional and industry experience and expertise, cultural and educational background, and professional experience. The ultimate decision will be based on merit and contribution that the selected candidates will bring to the Board.
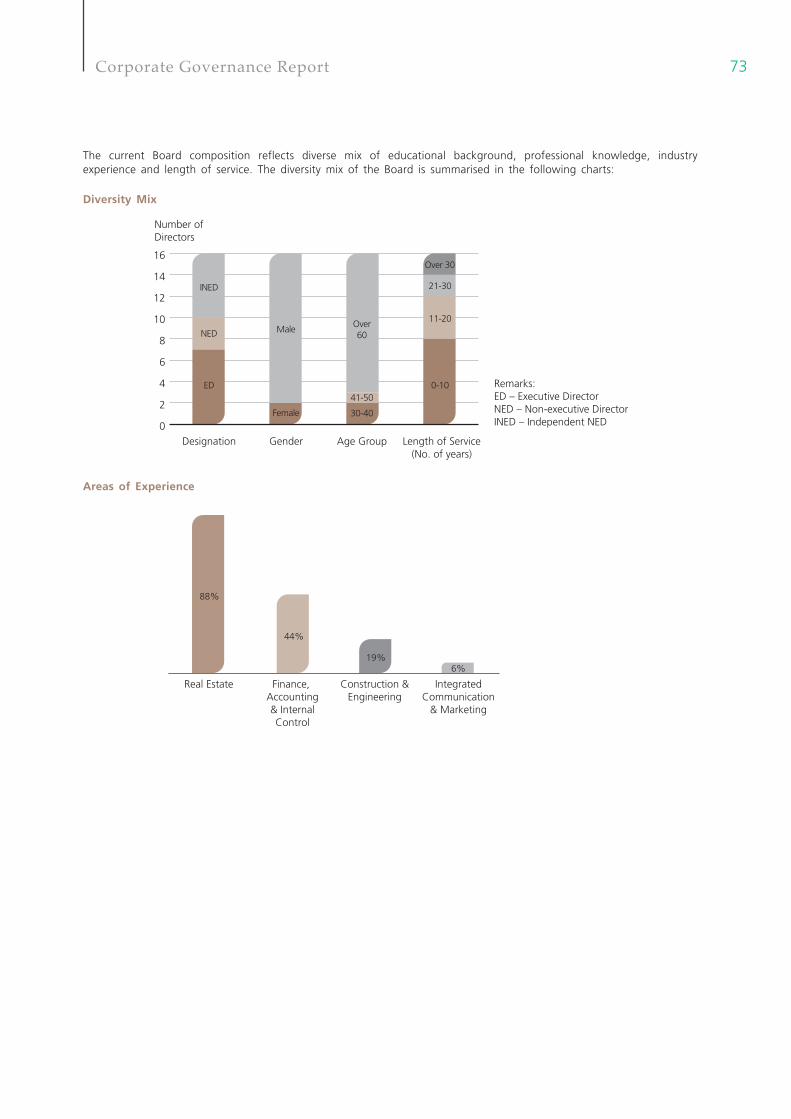
73Corporate Governance Report
The current Board composition reflects diverse mix of educational background, professional knowledge, industry experience and length of service. The diversity mix of the Board is summarised in the following charts:
Diversity Mix
0
2
4
6
8
10
12
14
16
Number of Directors
Designation Gender Age Group Length of Service(No. of years)
Male
Female
Over 60
30-40
41-500-10
11-20
21-30
Over 30
Remarks:ED – Executive DirectorNED – Non-executive DirectorINED – Independent NED
INED
NED
ED
Areas of Experience
Real Estate
88%
44%
19%6%
Finance, Accounting& InternalControl
Construction &Engineering
IntegratedCommunication
& Marketing
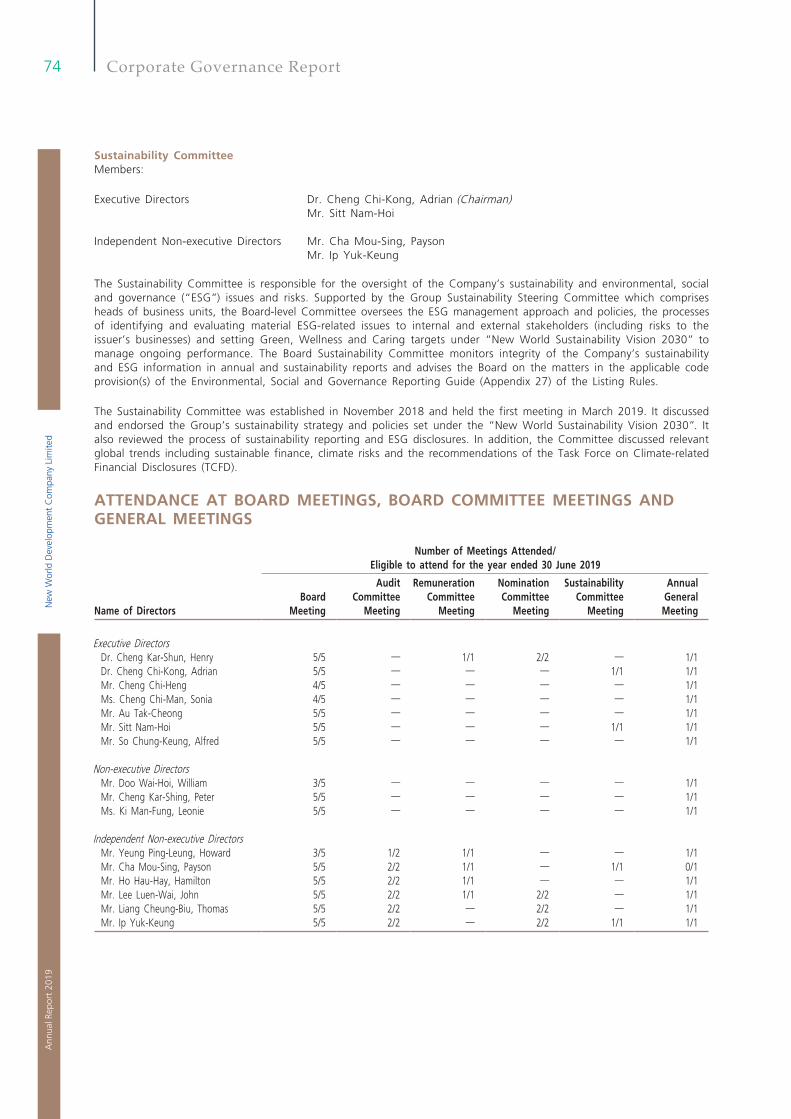
New
Wor
ld D
evel
opm
ent
Com
pany
Lim
ited
74A
nnua
l Rep
ort
2019
Corporate Governance Report
Sustainability CommitteeMembers:
Executive Directors Dr. Cheng Chi-Kong, Adrian (Chairman)Mr. Sitt Nam-Hoi
Independent Non-executive Directors Mr. Cha Mou-Sing, PaysonMr. Ip Yuk-Keung
The Sustainability Committee is responsible for the oversight of the Company’s sustainability and environmental, social and governance (“ESG”) issues and risks. Supported by the Group Sustainability Steering Committee which comprises heads of business units, the Board-level Committee oversees the ESG management approach and policies, the processes of identifying and evaluating material ESG-related issues to internal and external stakeholders (including risks to the issuer’s businesses) and setting Green, Wellness and Caring targets under “New World Sustainability Vision 2030” to manage ongoing performance. The Board Sustainability Committee monitors integrity of the Company’s sustainability and ESG information in annual and sustainability reports and advises the Board on the matters in the applicable code provision(s) of the Environmental, Social and Governance Reporting Guide (Appendix 27) of the Listing Rules.
The Sustainability Committee was established in November 2018 and held the first meeting in March 2019. It discussed and endorsed the Group’s sustainability strategy and policies set under the “New World Sustainability Vision 2030”. It also reviewed the process of sustainability reporting and ESG disclosures. In addition, the Committee discussed relevant global trends including sustainable finance, climate risks and the recommendations of the Task Force on Climate-related Financial Disclosures (TCFD).
ATTENDANCE AT BOARD MEETINGS, BOARD COMMITTEE MEETINGS AND GENERAL MEETINGS
Number of Meetings Attended/ Eligible to attend for the year ended 30 June 2019
Name of DirectorsBoard
Meeting
Audit Committee
Meeting
Remuneration Committee
Meeting
Nomination Committee
Meeting
Sustainability Committee
Meeting
Annual General Meeting
Executive DirectorsDr. Cheng Kar-Shun, Henry 5/5 — 1/1 2/2 — 1/1Dr. Cheng Chi-Kong, Adrian 5/5 — — — 1/1 1/1Mr. Cheng Chi-Heng 4/5 — — — — 1/1Ms. Cheng Chi-Man, Sonia 4/5 — — — — 1/1Mr. Au Tak-Cheong 5/5 — — — — 1/1Mr. Sitt Nam-Hoi 5/5 — — — 1/1 1/1Mr. So Chung-Keung, Alfred 5/5 — — — — 1/1
Non-executive DirectorsMr. Doo Wai-Hoi, William 3/5 — — — — 1/1Mr. Cheng Kar-Shing, Peter 5/5 — — — — 1/1Ms. Ki Man-Fung, Leonie 5/5 — — — — 1/1
Independent Non-executive DirectorsMr. Yeung Ping-Leung, Howard 3/5 1/2 1/1 — — 1/1Mr. Cha Mou-Sing, Payson 5/5 2/2 1/1 — 1/1 0/1Mr. Ho Hau-Hay, Hamilton 5/5 2/2 1/1 — — 1/1Mr. Lee Luen-Wai, John 5/5 2/2 1/1 2/2 — 1/1Mr. Liang Cheung-Biu, Thomas 5/5 2/2 — 2/2 — 1/1Mr. Ip Yuk-Keung 5/5 2/2 — 2/2 1/1 1/1
75Corporate Governance Report
AUDITORS’ REMUNERATION
During the year ended 30 June 2019, the total fee paid/payable in respect of audit and non-audit services provided by the Group’s external auditors is set out below:
Fee paid/payable for the year ended 30 June
2019 2018Type of services HK$m HK$m
Audit services 63.8 64.1Non-audit services 32.0 8.8
Total 95.8 72.9
Non-audit services comprise primarily tax advisory, circular works related to capital market transactions, due diligence and transaction advisory related to various acquisition activities (including FTLife Insurance Company Limited), services on system enhancement, as well as other related services.
DIRECTORS’ RESPONSIBILITY FOR THE FINANCIAL STATEMENTS
The Board, supported by the finance and accounts department, is responsible for the preparation of the financial statements of the Company and the Group. The Board has prepared the financial statements in accordance with the Hong Kong Financial Reporting Standards issued by the Hong Kong Institute of Certified Public Accountants. Appropriate accounting policies have also been used and applied consistently except the adoption of revised standards, amendments to standards and interpretation. The Directors have not been aware of any material uncertainties relating to events or conditions which may cast significant doubt upon the Group’s ability to continue as a going concern.
The statement by the auditor of the Company and the Group regarding its reporting responsibilities on the financial statements of the Company and the Group is set out in the Independent Auditor’s Report in this annual report.
New
Wor
ld D
evel
opm
ent
Com
pany
Lim
ited
76A
nnua
l Rep
ort
2019
Corporate Governance Report
RISK MANAGEMENT AND INTERNAL CONTROL
Governance, Risk and ControlRobust and effective management of risks is an essential and integral part of corporate governance. The management of the Group proactively manages the risks by establishing an effective risk management framework, setting the appropriate risk appetite and maintaining an optimal risk level.
The Board has the overall responsibility for evaluating and determining the nature and extent of the risks it is willing to take in achieving the Group’s strategic objectives, and ensuring that the Group establishes and maintains appropriate and effective risk management and internal control systems. The Audit Committee is delegated with the authority from the Board to oversee the Group’s management in the design, implementation and monitoring of the risk management and internal control systems. It also advises the Board on the Group’s risk-related matters.
Sound and effective risk management and internal control systems have been established and maintained for safeguarding assets against unauthorised use or disposition, ensuring the maintenance of proper accounting records for the provision of reliable financial information for internal use or for publication, and ensuring compliance of applicable laws, rules and regulations. It should be acknowledged that such systems are designed to manage rather than eliminate the risk of failure to achieve business objectives, and can only provide reasonable and not absolute assurance against material misstatement or loss.
The Risk Management Committee assists the Audit Committee in discharging its corporate governance responsibilities for risk management. It is responsible for ensuring that the risk management system is adequate and effective and that the risk management framework is implemented consistently throughout the Group. It also monitors the Group’s overall risk profiles by reviewing the key risks relating to individual business units and the key risks that are enterprise-wide, and ensures alignment with the approved risk appetite.
An internal audit department has been established to conduct internal audit of the Company and its subsidiaries, joint ventures and associated companies. The internal audit department performs risk-based audits to review the effectiveness of the Group’s material internal controls so as to provide assurance that all key risks are identified and managed, and to ensure that the risk management and internal control measures are carried out appropriately and functioning as intended. Major audit findings and recommendations are reported to the Audit Committee, which in turn reports to the Board. The implementation of the agreed actions in response to the identified audit issues are tracked and followed up regularly, and the status is reported to the Audit Committee.
The Audit Committee receives the report from the internal audit department and takes such report into consideration when it makes recommendation to the Board for approval of the half-yearly or annual results of the Group.
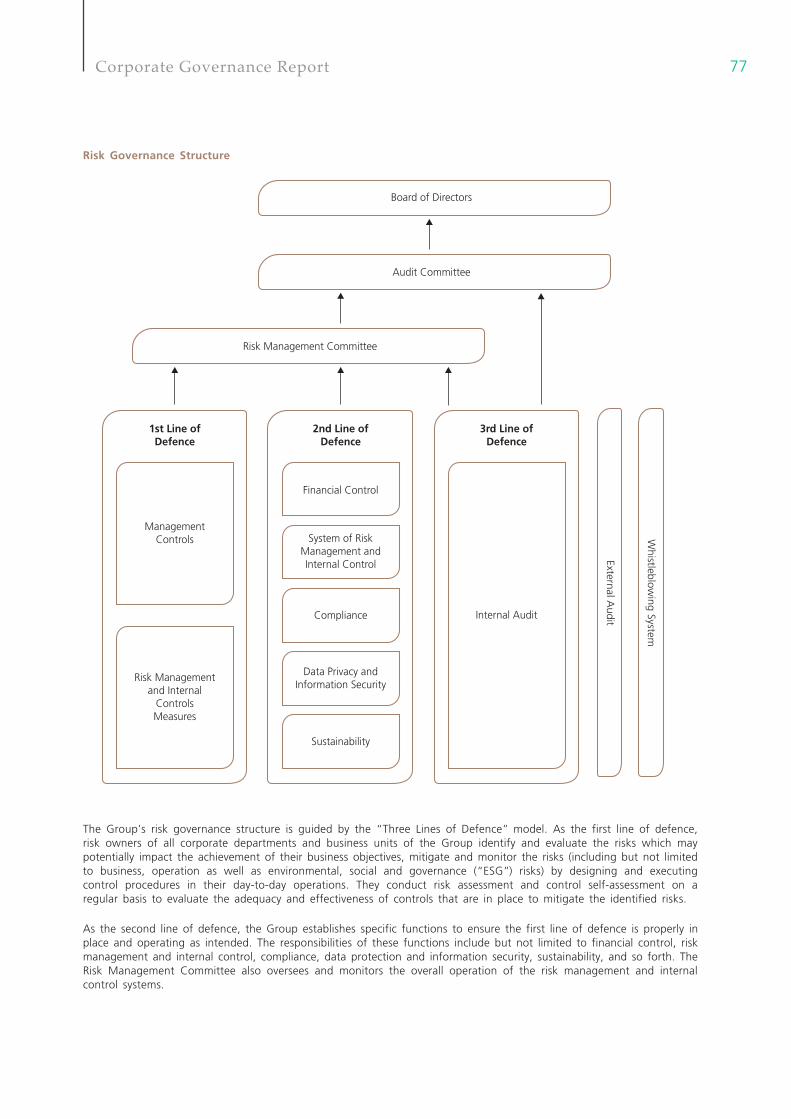
77Corporate Governance Report
Risk Governance Structure
Audit Committee
Board of Directors
Risk Management Committee
1st Line ofDefence
ManagementControls
Risk Managementand Internal
ControlsMeasures
2nd Line ofDefence
Financial Control
System of RiskManagement andInternal Control
Compliance
Data Privacy andInformation Security
Sustainability
3rd Line ofDefence
Internal Audit
External Audit
Whistleblow
ing System
The Group’s risk governance structure is guided by the “Three Lines of Defence” model. As the first line of defence, risk owners of all corporate departments and business units of the Group identify and evaluate the risks which may potentially impact the achievement of their business objectives, mitigate and monitor the risks (including but not limited to business, operation as well as environmental, social and governance (“ESG”) risks) by designing and executing control procedures in their day-to-day operations. They conduct risk assessment and control self-assessment on a regular basis to evaluate the adequacy and effectiveness of controls that are in place to mitigate the identified risks.
As the second line of defence, the Group establishes specific functions to ensure the first line of defence is properly in place and operating as intended. The responsibilities of these functions include but not limited to financial control, risk management and internal control, compliance, data protection and information security, sustainability, and so forth. The Risk Management Committee also oversees and monitors the overall operation of the risk management and internal control systems.
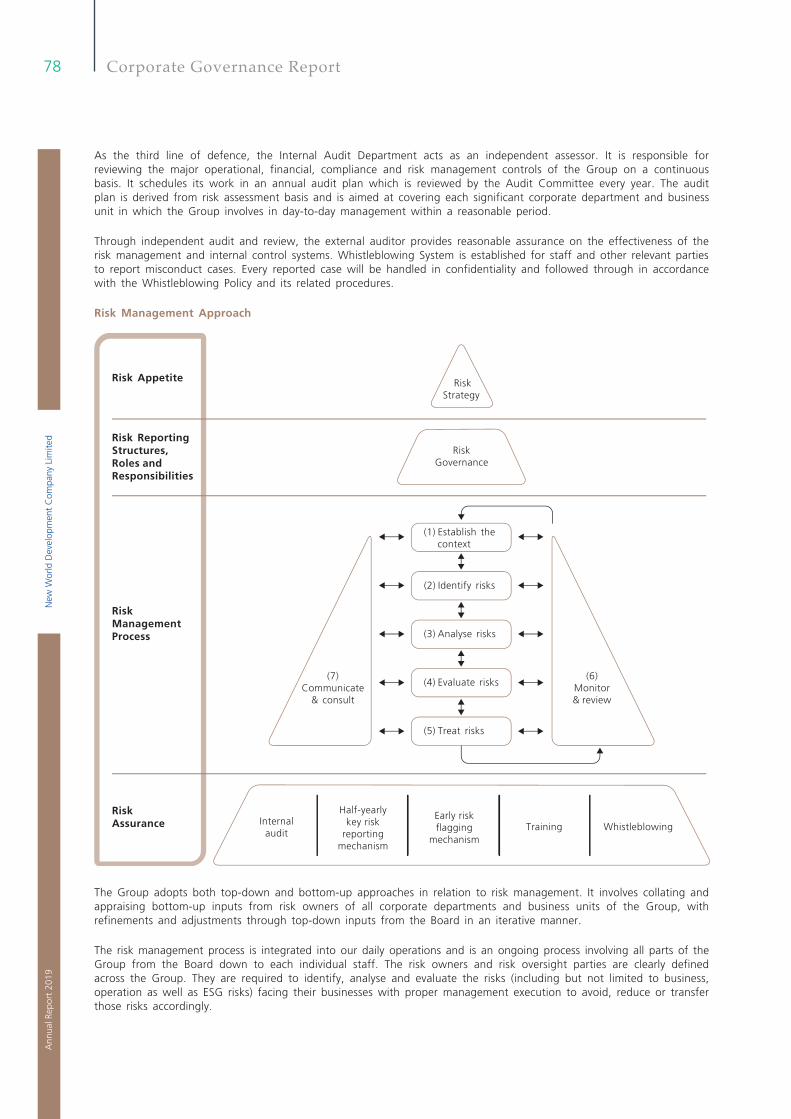
New
Wor
ld D
evel
opm
ent
Com
pany
Lim
ited
78A
nnua
l Rep
ort
2019
Corporate Governance Report
As the third line of defence, the Internal Audit Department acts as an independent assessor. It is responsible for reviewing the major operational, financial, compliance and risk management controls of the Group on a continuous basis. It schedules its work in an annual audit plan which is reviewed by the Audit Committee every year. The audit plan is derived from risk assessment basis and is aimed at covering each significant corporate department and business unit in which the Group involves in day-to-day management within a reasonable period.
Through independent audit and review, the external auditor provides reasonable assurance on the effectiveness of the risk management and internal control systems. Whistleblowing System is established for staff and other relevant parties to report misconduct cases. Every reported case will be handled in confidentiality and followed through in accordance with the Whistleblowing Policy and its related procedures.
Risk Management Approach
Risk Appetite RiskStrategy
RiskGovernance
(1) Establish the context
(2) Identify risks
(3) Analyse risks
(4) Evaluate risks
(5) Treat risks
(7)Communicate
& consult
(6)Monitor& review
Early riskflagging
mechanism
Half-yearlykey risk
reportingmechanism
Internalaudit
Training Whistleblowing
RiskAssurance
Risk Reporting Structures, Roles and Responsibilities
Risk Management Process
The Group adopts both top-down and bottom-up approaches in relation to risk management. It involves collating and appraising bottom-up inputs from risk owners of all corporate departments and business units of the Group, with refinements and adjustments through top-down inputs from the Board in an iterative manner.
The risk management process is integrated into our daily operations and is an ongoing process involving all parts of the Group from the Board down to each individual staff. The risk owners and risk oversight parties are clearly defined across the Group. They are required to identify, analyse and evaluate the risks (including but not limited to business, operation as well as ESG risks) facing their businesses with proper management execution to avoid, reduce or transfer those risks accordingly.
79Corporate Governance Report
“Risk Management Policy” is established for enhancing the effective implementation of the risk management and internal control exercises within the Group. To ensure that all major risks are properly identified, evaluated and monitored for achieving a sound and effective risk management system, risk owners across the Group are required to report the risk review exercises to the Internal Audit Department by submitting the “Risk Management and Internal Control Assessment Checklist” (“Checklist”) half-yearly. They need to report the effectiveness of the risk management and internal control systems and set out details of the key risks including the risk description, change of risk level, current risk level and the corresponding key risk control or mitigation action in the “Key Risks Reporting Table”.
Besides, an early risk flagging mechanism is established which enables the Group to proactively identify and assess emerging risks and broad areas of changes, emanating from both internal and external factors (including but not limited to business, operation as well as ESG risks), and act on them in a timely manner. Risk owners have to flag and report immediately to the corresponding risk oversight parties when a potential risk is perceived and significant impact is expected in any business areas.
After consolidation with a holistic review of the Group, Internal Audit Department submits a written report on the effectiveness of the Group’s risk management and internal control systems to the Risk Management Committee and the Audit Committee for review on a half-yearly basis. The Board, through the Risk Management Committee and the Audit Committee, has put in place effective risk management and internal control systems which will enable the Group to respond appropriately to significant business, operational, financial, compliance, ESG related and other risks in achieving its objectives. The Group strives to continually improve its risk management framework in order to keep pace with the dynamic business environment. The Board, therefore, considers that the risk management and internal control systems of the Group are effective and adequate.
COMPANY SECRETARY
The Company Secretary is a full time employee of the Company and has day-to-day knowledge of the Company’s affairs. The Company Secretary reports to the Chairman and is responsible for advising the Board on governance matters. For the year under review, the Company Secretary has confirmed that he has taken no less than 15 hours of relevant professional training. The biography of the Company Secretary is set out on page 37 of this annual report.
CONSTITUTIONAL DOCUMENTS
No change has been made to the Company’s Articles of Association during the year.
ENVIRONMENTAL, SOCIAL AND GOVERNANCE
The Group will issue a standalone Sustainability Report (“SR”) in December 2019 on the Company’s website (http://www.nwd.com.hk/sustainability/en/publication.html) and the Stock Exchange’s website. The SR will be prepared in accordance with the Core option of the Global Reporting Initiative (GRI) Sustainability Reporting Standards, as well as the Environmental, Social and Governance Reporting Guide issued by the Stock Exchange, which will provide an overview of the Group’s efforts and performance in pursuing corporate sustainability. Please refer to the “Corporate Sustainability” section in this annual report for a summary of the SR.
New
Wor
ld D
evel
opm
ent
Com
pany
Lim
ited
80A
nnua
l Rep
ort
2019
Corporate Governance Report
SHAREHOLDERS’ RIGHTS
Convening Extraordinary General Meeting (“EGM”) and Putting Forward Proposals at General MeetingsShareholders representing at least 5% of the total voting rights of all the shareholders of the Company having a right to vote at general meetings can deposit a written request to convene an EGM at the registered office of the Company for the attention of the Company Secretary. Such requisition, signed by the shareholders concerned, must state the general nature of the business to be dealt with at the meeting and may include the text of a resolution that may properly be moved and is intended to be moved at the meeting. If the Directors do not within 21 days from the date of the deposit of a request (after being verified to be valid) proceed to convene an EGM on a day not more than 28 days after the date on which the notice convening the EGM is given, the shareholders concerned, or any of them representing more than one-half of the total voting rights of all of them, may themselves convene an EGM, but any EGM so convened shall not be held after the expiration of three months after the date on which the Directors become subject to the requirement to call a meeting.
To put forward proposals at general meeting, a request in writing must be made by:
(i) shareholders representing at least 2.5% of the total voting rights of all shareholders of the Company having the right to vote at general meeting; or
(ii) at least 50 shareholders of the Company having the right to vote at the meeting,
to the Company to give to shareholders notice of any resolution which may properly be moved and is intended to be moved at an annual general meeting, or to circulate to shareholders any statement of not more than 1,000 words with respect to the matter referred to in any proposed resolution or the business to be dealt with at any general meeting.
The written request must be signed by all the shareholders concerned in one or more documents in like form and deposited at the registered office of the Company for the attention of the Company Secretary not less than six weeks before the meeting in the case of a requisition requiring notice of a resolution at annual general meeting, and not less than seven days before the meeting in the case of requiring circulation of statement. Upon the request verified to be valid, the Company will give notice of the resolution or circulate the statement.
If a shareholder of the Company intends to propose a person other than a Director of the Company for election as a Director of the Company at any general meeting, the shareholder concerned shall lodge with the registered office of the Company for the attention of the Company Secretary (i) a written notice of his intention to propose that person for election as a Director; and (ii) a written notice by that person of his/her willingness to be elected as a Director together with the necessary information within the period commencing no earlier than the day after the dispatch of the notice of the general meeting and ending no later than seven days prior to the date of such general meeting.
Detailed procedures can be found in the following documents which are available on the Company’s website:
• “Procedures for Shareholders to convene Extraordinary General Meetings and putting forward proposals at General Meetings”; and
• “Procedures for Shareholders to propose a person for election as a Director”.
Enquiries to the BoardEnquiries may be put to the Board through the Company’s Investor Relations Department at 30/F., New World Tower, 16–18 Queen’s Road Central, Hong Kong (email: [email protected]).
81Corporate Governance Report
DIVIDEND POLICY
The Board adopted a Dividend Policy in November 2018 which sets out the guidelines for the Board to determine the frequency of dividend payment and target dividend payout ratio for a financial year. The Company would distribute to its shareholders funds surplus to the operating needs of the Company and its subsidiaries twice for each financial year as determined by the Board, subject to its shareholders’ approval, where applicable. In general, it is the policy of the Company to maintain a balance between meeting shareholders’ expectations and prudent capital management with a sustainable dividend policy. The following factors will be taking into account for determining the Company’s target dividend payout ratio:
• Any restrictions under the Hong Kong Companies Ordinance;
• Any banking or other funding covenants by which the Company is bound from time to time;
• The capital expenditure and operating requirements of the Group; and
• The external economic and market situation.
COMMUNICATION WITH SHAREHOLDERS
The Board and management maintain a continuing dialogue with the Company’s shareholders and investors through various channels including the Company’s annual general meeting. The Chairman, other members of the Board and the external auditor attend the annual general meeting to meet the shareholders. The Directors will answer questions raised by the shareholders on the performance of the Group. The Company holds press conferences and analysts briefings at least twice a year following the release of interim and full year results announcements at which the Executive Directors and management of the Company are available to answer questions and listen feedbacks regarding the performance of the Group. Our corporate website which contains corporate information, interim and annual reports, announcements and circulars issued by the Group as well as the recent developments of the Group enables the Company’s shareholders to have timely and updated information of the Group. Shareholders can refer to the “Shareholders’ Communication Policy” posted on the Company’s website for more details.
EMPHASISE INVESTOR RELATIONS
To ensure that the investors have a comprehensive and thorough understanding of the Group with the establishment of timely and effective two-way communications, the management and investor relations team of the Group participates in different international investment conferences and arranges local and overseas non-deal roadshows on a regular basis to elaborate the Group’s business development and market movement to investors in different locations. We also show our key projects in both Mainland China and Hong Kong to the investor communities via various kinds of project experience tours and reverse roadshows. For details, please refer to the “Investor Relations” section of this annual report.
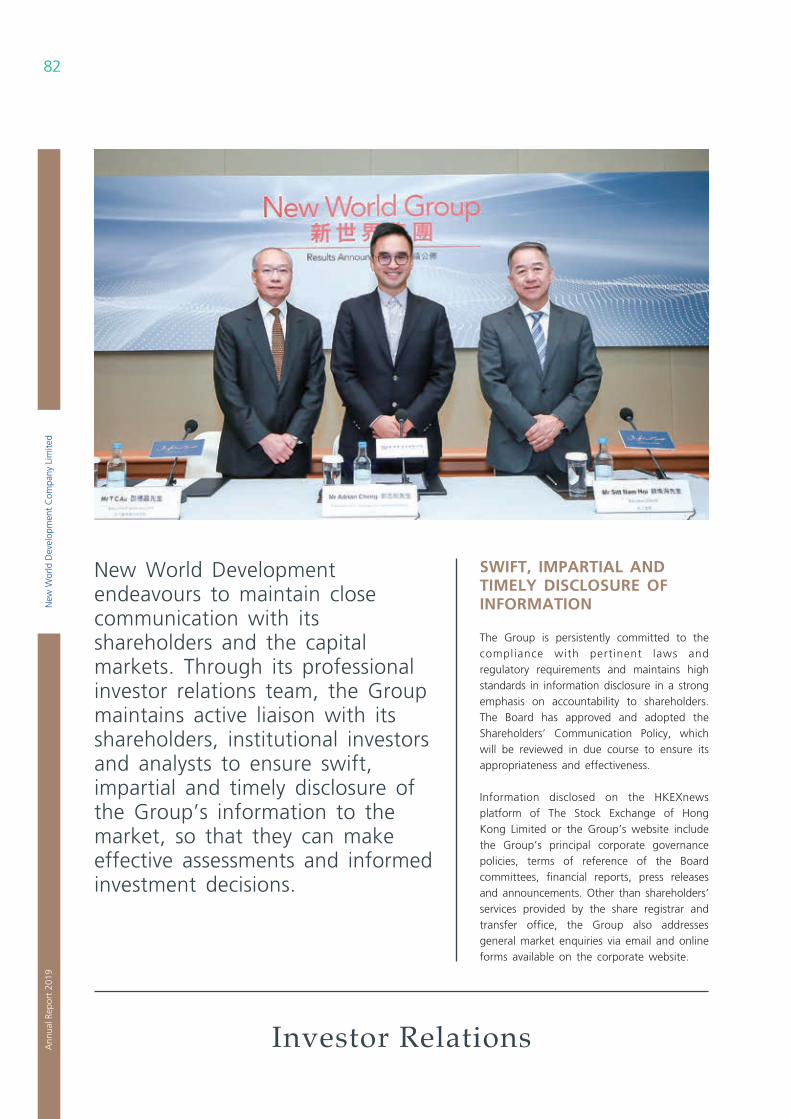
New
Wor
ld D
evel
opm
ent
Com
pany
Lim
ited
82A
nnua
l Rep
ort
2019
Investor Relations
SWIFT, IMPARTIAL AND TIMELY DISCLOSURE OF INFORMATION
The Group is persistently committed to the compliance with pertinent laws and regulatory requirements and maintains high standards in information disclosure in a strong emphasis on accountability to shareholders. The Board has approved and adopted the Shareholders’ Communication Policy, which will be reviewed in due course to ensure its appropriateness and effectiveness.
Information disclosed on the HKEXnews platform of The Stock Exchange of Hong Kong Limited or the Group’s website include the Group’s principal corporate governance policies, terms of reference of the Board committees, financial reports, press releases and announcements. Other than shareholders’ services provided by the share registrar and transfer office, the Group also addresses general market enquiries via email and online forms available on the corporate website.
New World Development endeavours to maintain close communication with its shareholders and the capital markets. Through its professional investor relations team, the Group maintains active liaison with its shareholders, institutional investors and analysts to ensure swift, impartial and timely disclosure of the Group’s information to the market, so that they can make effective assessments and informed investment decisions.
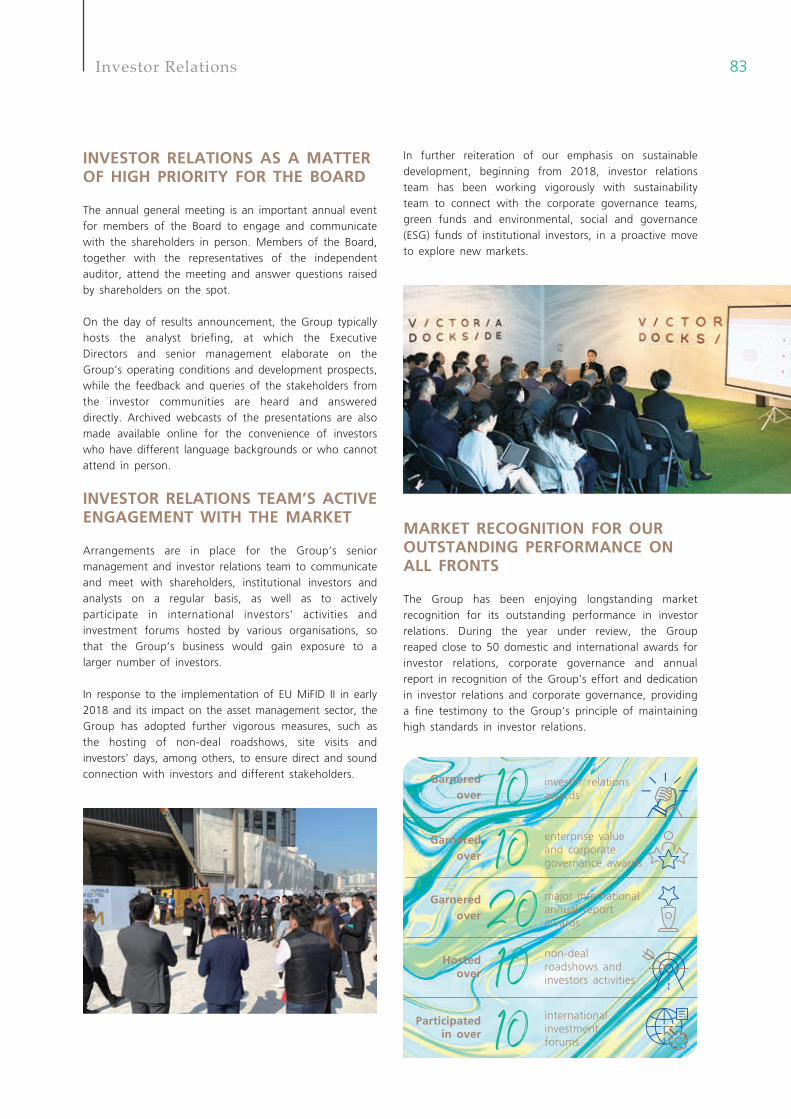
83Investor Relations
INVESTOR RELATIONS AS A MATTER OF HIGH PRIORITY FOR THE BOARD
The annual general meeting is an important annual event for members of the Board to engage and communicate with the shareholders in person. Members of the Board, together with the representatives of the independent auditor, attend the meeting and answer questions raised by shareholders on the spot.
On the day of results announcement, the Group typically hosts the analyst briefing, at which the Executive Directors and senior management elaborate on the Group’s operating conditions and development prospects, while the feedback and queries of the stakeholders from the investor communities are heard and answered directly. Archived webcasts of the presentations are also made available online for the convenience of investors who have different language backgrounds or who cannot attend in person.
INVESTOR RELATIONS TEAM’S ACTIVE ENGAGEMENT WITH THE MARKET
Arrangements are in place for the Group’s senior management and investor relations team to communicate and meet with shareholders, institutional investors and analysts on a regular basis, as well as to actively participate in international investors’ activities and investment forums hosted by various organisations, so that the Group’s business would gain exposure to a larger number of investors.
In response to the implementation of EU MiFID II in early 2018 and its impact on the asset management sector, the Group has adopted further vigorous measures, such as the hosting of non-deal roadshows, site visits and investors’ days, among others, to ensure direct and sound connection with investors and different stakeholders.
In further reiteration of our emphasis on sustainable development, beginning from 2018, investor relations team has been working vigorously with sustainability team to connect with the corporate governance teams, green funds and environmental, social and governance (ESG) funds of institutional investors, in a proactive move to explore new markets.
MARKET RECOGNITION FOR OUR OUTSTANDING PERFORMANCE ON ALL FRONTS
The Group has been enjoying longstanding market recognition for its outstanding performance in investor relations. During the year under review, the Group reaped close to 50 domestic and international awards for investor relations, corporate governance and annual report in recognition of the Group’s effort and dedication in investor relations and corporate governance, providing a fine testimony to the Group’s principle of maintaining high standards in investor relations.
investor relations awards
major international annual report awards
enterprise value and corporate governance awards
Garnered over
Garnered over
Garnered over
international investment forums
non-deal roadshows and investors activities
Hosted over
Participated in over
New
Wor
ld D
evel
opm
ent
Com
pany
Lim
ited
84A
nnua
l Rep
ort
2019
Corporate Information
BOARD OF DIRECTORSExecutive DirectorsDr. Cheng Kar-Shun, Henry GBM GBS (Chairman)Dr. Cheng Chi-Kong, Adrian JP (Executive Vice-chairman and General Manager)Mr. Cheng Chi-HengMs. Cheng Chi-Man, SoniaMr. Au Tak-CheongMr. Sitt Nam-HoiMr. So Chung-Keung, Alfred
Non-executive DirectorsMr. Doo Wai-Hoi, William JP (Non-executive Vice-chairman)Mr. Cheng Kar-Shing, PeterMs. Ki Man-Fung, Leonie GBS SBS JP
Independent Non-executive DirectorsMr. Yeung Ping-Leung, HowardMr. Cha Mou-Sing, Payson JPMr. Cha Mou-Zing, Victor (Alternate Director to Mr. Cha Mou-Sing, Payson)Mr. Ho Hau-Hay, HamiltonMr. Lee Luen-Wai, John BBS JPMr. Liang Cheung-Biu, ThomasMr. Ip Yuk-Keung
COMPANY SECRETARYMr. Wong Man-Hoi
AUDITORPricewaterhouseCoopers
SOLICITORSWoo, Kwan, Lee & LoKao, Lee & YipVincent T.K. Cheung, Yap & CoIu, Lai & LiEversheds
SHARE REGISTRAR AND TRANSFER OFFICETricor Tengis LimitedLevel 54, Hopewell Centre,183 Queen’s Road East,Hong Kong
REGISTERED OFFICE30/F., New World Tower,16–18 Queen’s Road Central, Hong KongTel: (852) 2523 1056Fax: (852) 2810 4673
PRINCIPAL BANKERSAgricultural Bank of ChinaBank of China (Hong Kong)Bank of CommunicationsBank of East AsiaChina Construction Bank (Asia)China Development BankChina Merchants BankCitibank N.A.DBS BankHang Seng BankIndustrial and Commercial Bank of China (Asia)Mizuho BankMUFG Bank, Ltd.Nanyang Commercial BankSumitomo Mitsui Banking CorporationStandard Chartered BankThe Hongkong and Shanghai Banking Corporation
STOCK CODEHong Kong Stock Exchange 0017Reuters 0017.HKBloomberg 17 HK
INFORMATION FOR INVESTORSFor more information about the Group,please contact the Investor Relations Department ofthe Company at:30/F., New World Tower,16–18 Queen’s Road Central,Hong KongTel: (852) 2523 1056Fax: (852) 2810 4673e-mail: [email protected]
WEBSITEwww.nwd.com.hk
85
Report of the Directors
The Directors have pleasure in presenting their annual report and financial statements for the year ended 30 June 2019.
GROUP ACTIVITIES
The principal activities of the Company remain investment holding and property development and investment. The principal activities of the principal subsidiaries, joint ventures and associated companies are shown in notes 49, 50 and 51 to the financial statements.
RESULTS AND APPROPRIATION
The results of the Group for the year ended 30 June 2019 are set out in the consolidated income statement on page 124 of this annual report.
The Directors have resolved to recommend a final cash dividend for the year ended 30 June 2019 of HK$0.37 per share (2018: HK$0.34 per share) to shareholders whose names appear on the register of members of the Company on 22 November 2019. Together with the interim dividend of HK$0.14 per share (2018: HK$0.14 per share), the total dividend for the financial year ended 30 June 2019 is HK$0.51 per share (2018: HK$0.48 per share).
Subject to the passing of the relevant resolutions at the annual general meeting of the Company to be held on 19 November 2019, it is expected that the proposed final dividend will be distributed to shareholders on or about 19 December 2019.
BUSINESS REVIEW
A fair review of the business of the Group, a discussion and analysis of the Group’s performance during the year including analysis using financial key performance indicators, particulars of important events affecting the Group that have occurred since the end of the financial year, description of the principal risks and uncertainties facing the Group, and a discussion on the Group’s environmental policies and performance and the Group’s compliance with relevant laws and regulations that have a significant impact on the Group, and an account of the Group’s key relationships with its stakeholders are provided throughout this annual report, particularly in the sections headed “Financial Highlights”, “Executive Vice-chairman’s Report”, “Corporate Sustainability”, “Corporate Governance Report”, “Management Discussion and Analysis” and “Risk Factors” of this annual report. These discussions form part of this Directors’ Report.
SHARES ISSUED
During the year, as a result of the exercise of share options under the share option scheme of the Company, a total of 38,387,207 shares of the Company, fully paid, were issued for a total consideration of HK$349,418,621.27.
Details of the shares issued during the year are set out in note 36 to the financial statements.
New
Wor
ld D
evel
opm
ent
Com
pany
Lim
ited
86A
nnua
l Rep
ort
2019
Report of the Directors
DEBENTURES ISSUED
Certain subsidiaries of the Company had issued notes for the purpose of financing the general working capital requirement of the Group during the year as follows:
1. On 5 December 2018, US$310.0 million (equivalent to approximately HK$2,418.0 million) 4.75% guaranteed notes due 2023 were issued by New World China Land Limited (“NWCL”) and listed on the Stock Exchange at a price of 99.377% of the principal amount with net proceeds of approximately US$307.0 million (equivalent to approximately HK$2,394.6 million);
2. On 31 January 2019, US$1,000.0 million (equivalent to approximately HK$7,800.0 million) in aggregate principal amount of 5.75% guaranteed senior perpetual capital securities were issued by Celestial Miles Limited and listed on the Stock Exchange, among which US$800.0 million (equivalent to approximately HK$6,240.0 million) were issued at a price of 100.000% of the principal amount and US$200.0 million (equivalent to approximately HK$1,560.0 million) were issued at a price of 100.400% of the principal amount, with aggregate net proceeds of US$991.0 million (equivalent to approximately HK$7,776.9 million);
3. On 7 March 2019, US$500.0 million (equivalent to approximately HK$3,900.0 million) 6.25% guaranteed senior perpetual capital securities were issued by NWD Finance (BVI) Limited and listed on the Stock Exchange at a price of 100.000% of the principal amount with net proceeds of US$495.0 million (equivalent to approximately HK$3,861.0 million);
4. On 2 May 2019, HK$103.0 million 2.65% guaranteed notes due 2022 were issued by NWD (MTN) Limited at a price of 99.001% of the principal amount with net proceeds of HK$102.0 million;
5. On 3 May 2019, HK$400.0 million 2.65% guaranteed notes due 2022 were issued by NWD (MTN) Limited at a price of 99.001% of the principal amount with net proceeds of HK$396.0 million;
6. On 20 May 2019, HK$450.0 million 3.80% guaranteed notes due 2029 were issued by NWD (MTN) Limited and listed on the Stock Exchange at a price of 97.789% of the principal amount with net proceeds of HK$440.1 million;
7. On 29 May 2019, HK$650.0 million 4.05% guaranteed notes due 2034 were issued by NWD (MTN) Limited at a price of 95.127% of the principal amount with net proceeds of HK$618.3 million; and
8. On 27 June 2019, US$650.0 million (equivalent to approximately HK$5,070.0 million) 4.25% guaranteed senior notes due 2029 were issued by Celestial Dynasty Limited and listed on the Stock Exchange at a price of 99.718% of the principal amount with net proceeds of US$641.2 million (equivalent to approximately HK$5,011.9 million).
Save as disclosed above, the Group has not issued any debenture during the year.
EQUITY-LINKED AGREEMENTS
Save for the share option schemes of the Group as set out on pages 98 to 105, no equity-linked agreements were entered into by the Group, or existed during the year.
DISTRIBUTABLE RESERVES
Distributable reserves of the Company as at 30 June 2019, calculated under Part 6 of the Hong Kong Companies Ordinance (Cap. 622), amounted to HK$23,004.5 million (2018: HK$24,041.3 million).
87Report of the Directors
FIVE-YEAR FINANCIAL SUMMARY
A summary of the results and the assets and liabilities of the Group for the last five financial years is set out on pages 240 and 241.
EMPLOYEES AND REMUNERATION POLICIES
At 30 June 2019, over 45,000 staff was employed by entities under the Group’s management. Remuneration policies are reviewed annually. Remuneration and bonuses are awarded to employees based on individual performances and are in line with market practices. Education subsidies are granted to employees who are taking job-related courses. Periodic in-house training programs are also offered. Under the share options schemes of the Company and all the listed subsidiaries of the Group, options may be granted to certain Directors of the Company and certain employees of the Group to subscribe for shares in the Company and/or the respective subsidiaries.
PURCHASE, SALE OR REDEMPTION OF LISTED SECURITIES
During the year, the Company bought back a total of 29,758,000 shares of the Company on the Hong Kong Stock Exchange at an aggregate consideration of HK$321,014,880 (before expenses). All such bought back shares were subsequently cancelled during the year. As at 30 June 2019, the total number of shares of the Company in issue was 10,222,814,058.
Details of the shares bought back during the year are as follows:
MonthNumber of shares
bought back Price paid per share
Aggregate consideration
(before expenses)
Highest LowestHK$ HK$ HK$
July 2018 10,454,000 11.28 10.66 113,408,820September 2018 6,000,000 10.92 10.62 64,512,980October 2018 7,002,000 10.46 9.82 71,611,680January 2019 1,308,000 10.56 10.16 13,452,680May 2019 2,754,000 12.00 11.44 32,162,000June 2019 2,240,000 11.80 11.26 25,866,720
29,758,000 321,014,880
The above share buy-backs were made with a view to enhancing the earnings per share of the Company and thus benefit the shareholders as a whole.
During the year, the Company has not redeemed any of its listed securities. Save as disclosed above, neither the Company nor any of its subsidiaries has purchased or sold any of the Company’s listed securities during the year.
DONATIONS
The Group made charitable and other donations during the year of HK$93.8 million (2018: HK$101.3 million).
New
Wor
ld D
evel
opm
ent
Com
pany
Lim
ited
88A
nnua
l Rep
ort
2019
Report of the Directors
MAJOR ACQUISITIONS AND DISPOSALS
1. On 27 November 2018, Guangzhou Xinpei Investment Co. Ltd. (廣州新沛投資有限公司) (“GXI”), an indirect wholly owned subsidiary of the Group, entered into a transfer agreement and a cooperative development agreement with Guangzhou Metro Group Co., Ltd. (廣州地鐵集團有限公司) (“GMG”), pursuant to which GXI acquired a 65.0% stake in Guangzhou Yaosheng Real Estate Development Co., Ltd. (廣州耀勝房地產開發有限公司) (the “Target”) and assumed 65.0% of GMG’s loan to the Target, for a total consideration of approximately RMB4,781.3 million (equivalent to approximately HK$5,433.3 million). In turn, GMG has agreed to cooperate with GXI to develop a parcel of land located in Hanxi Village, Guangdong which will contain residential, shopping mall and office premises. The said acquisition was completed on 24 December 2018.
2. On 27 December 2018, Earning Star Limited (“Earning Star”), an indirect wholly owned subsidiary of NWS Holdings Limited and a subsidiary of the Group, entered into a share purchase agreement (the “Agreement”) with Bright Victory International Limited (“Bright Victory”), an indirect wholly owned subsidiary of Tongchuangjiuding Investment Management Group Co., Ltd. (同創九鼎投資管理集團股份有限公司) and certain guarantors of Bright Victory in respect of the acquisition of the entire issued share capital of FTLife Insurance Company Limited (“FTLife”), free from any encumbrance upon completion of the acquisition, by Earning Star from Bright Victory at a total consideration of HK$21.5 billion (subject to adjustments). FTLife is a life insurance company in Hong Kong providing a broad range of protective and savings-related life and medical insurance products, serving both individual and institutional clients via tied agents and brokers. Completion of the acquisition is conditional upon satisfaction and/or waiver of certain conditions precedent as set out in the Agreement.
CONNECTED TRANSACTIONS
Connected transactions of the Company during the year and up to the date of this report are set out on pages 93 to 96.
RULES 13.20 AND 13.22 OF THE LISTING RULES
The disclosure pursuant to Rules 13.20 and 13.22 of the Listing Rules is set out on page 108.
DIRECTORS
The Directors of the Company during the year and up to the date of this report are:
Executive DirectorsDr. Cheng Kar-Shun, Henry GBM GBS (Chairman)Dr. Cheng Chi-Kong, Adrian JP (Executive Vice-chairman & General Manager)Mr. Cheng Chi-HengMs. Cheng Chi-Man, SoniaMr. Au Tak-CheongMr. Sitt Nam-HoiMr. So Chung-Keung, Alfred
Non-executive DirectorsMr. Doo Wai-Hoi, William JP (Non-executive Vice-chairman)Mr. Cheng Kar-Shing, PeterMs. Ki Man-Fung, Leonie GBS SBS JP
89Report of the Directors
DIRECTORS (CONTINUED)
Independent Non-executive DirectorsMr. Yeung Ping-Leung, HowardMr. Cha Mou-Sing, Payson JPMr. Cha Mou-Zing, Victor (Alternate Director to Mr. Cha Mou-Sing, Payson)Mr. Ho Hau-Hay, HamiltonMr. Lee Luen-Wai, John BBS JPMr. Liang Cheung-Biu, ThomasMr. Ip Yuk-Keung
In accordance with Article 103(A) of the Company’s Articles of Association, Dr. Cheng Chi-Kong, Adrian, Mr. Yeung Ping-Leung, Howard, Mr. Ho Hau-Hay, Hamilton, Mr. Lee Luen-Wai, John, Mr. Cheng Chi-Heng and Mr. Au Tak-Cheong shall retire by rotation and, being eligible, offer themselves for re-election.
No Director has a service contract which is not determinable by the Company within one year without payment of compensation other than statutory compensation.
A list of names of all the directors who have served on the boards of the Company’s subsidiaries during the year is available on the Company’s website at www.nwd.com.hk.
AUDIT COMMITTEE
An Audit Committee has been established and the members of the Committee as at the date of this report are Mr. Lee Luen-Wai, John, Mr. Yeung Ping-Leung, Howard, Mr. Cha Mou-Sing, Payson, Mr. Ho Hau-Hay, Hamilton, Mr. Liang Cheung-Biu, Thomas and Mr. Ip Yuk-Keung. The principal responsibilities of the Audit Committee include the review and supervision of the Group’s financial reporting process and risk management (including but not limited to business, operation as well as environmental, social and governance related risks) and internal control systems.
DIRECTORS’ INTERESTS IN TRANSACTIONS, ARRANGEMENTS OR CONTRACTS
Save as disclosed in the section headed “Connected Transactions” on pages 93 to 96 of this annual report and contracts amongst group companies, no other transactions, arrangements or contracts of significance to which the Company or any of its subsidiaries was a party and in which a Director of the Company and the Director’s connected entity had a material interest, whether directly or indirectly, subsisted at the end of the year or at any time during the year.
DIRECTORS’ INTERESTS IN SHARES, UNDERLYING SHARES AND DEBENTURES
As at 30 June 2019, interests of the Directors in shares, underlying shares and debentures of the Company and its associated corporations which were recorded in the register to be kept by the Company under Section 352 of the Securities and Futures Ordinance (“SFO”) are set out on pages 97 to 107.
PERMITTED INDEMNITY PROVISION
The Company’s Articles of Association provides that every Director is entitled to be indemnified out of the assets of the Company against all losses or liabilities which he/she may sustain or incur in or about the execution of the duties of his/her office or otherwise in relation thereto.
The Company and its listed subsidiaries have taken out and maintained directors’ liability insurance throughout the year, which provides appropriate cover for the Directors and directors of the subsidiaries of the Group.
New
Wor
ld D
evel
opm
ent
Com
pany
Lim
ited
90A
nnua
l Rep
ort
2019
Report of the Directors
DIRECTORS’ INTERESTS IN COMPETING BUSINESSES
During the year, according to the Listing Rules, the following Directors have interests in the following businesses which are considered to compete or are likely to compete, either directly or indirectly, with the businesses of the Group other than those businesses where the Directors of the Company were appointed as directors to represent the interests of the Company and/or the Group:
Businesses which are considered to compete or likely to compete with the businesses of the Group
Nature of interest of the Director in the entityName of Director Name of entity Description of businesses
Dr. Cheng Kar-Shun, Henry
Chow Tai Fook Enterprises Limited (“CTF”) group of companies
Property investment and development, hotel operations, commercial aircraft leasing, aircraft trading and healthcare investment
Director
FSE Holdings Limited group of companies
Property and carpark management and landscaping
Shareholder
Supreme Harvest Development Limited group of companies
Property investment and development
Director
Silver City International Limited group of companies
Property investment Director
Sunshine Dragon Group Limited group of companies
Property investment Director
Mr. Doo Wai-Hoi, William Ace Action Ltd. group of companies
Property investment Director and shareholder
Amelia Gold Limited group of companies
Property investment Director and shareholder
Fortune Success Limited group of companies
Property investment Director and shareholder
FSE Holdings Limited group of companies
Property and carpark management and landscaping
Shareholder
Fung Seng Enterprises Investment Company Limited group of companies
Property investment Director and shareholder
Fung Seng Enterprises Limited group of companies
Property investment and management
Director and shareholder
Golden Wealth Investment Limited group of companies
Property investment and development
Director and shareholder
Lifestyle International Holdings Limited group of companies
Department stores operations and property investment
Director
Oriental Triumph Inc. group of companies
Property and hotel investment Director and shareholder
Silver City International Limited group of companies
Property investment and food and beverage operations
Director and shareholder
Silver Success Company Limited group of companies
Hotel operations Director and shareholder
Sunshine Dragon Group Limited group of companies
Property investment Director and shareholder
Dr. Cheng Chi-Kong, Adrian
Cheung Hung Development (Holdings) Limited
Property investment and development
Director
CTF group of companies Property investment and development, hotel operations, commercial aircraft leasing, aircraft trading and healthcare investment
Director
New Century Healthcare Holding Co. Limited group of companies
Healthcare investment Director
Mr. Cheng Kar-Shing, Peter
CTF group of companies Property investment and development, hotel operations, commercial aircraft leasing, aircraft trading and healthcare investment
Director
Long Vocation Investments Limited group of companies
Property investment Director and shareholder
Mr. Cheng Chi-Heng CTF group of companies Property investment and development, hotel operations, commercial aircraft leasing, aircraft trading and healthcare investment
Director
91Report of the Directors
DIRECTORS’ INTERESTS IN COMPETING BUSINESSES (CONTINUED)
As the Board of Directors of the Company is independent of the boards of the above-mentioned entities and none of the above Directors can control the Board of the Company, the Group is therefore capable of carrying on its businesses independently of, and at arm’s length from the businesses of these entities.
MANAGEMENT CONTRACTS
No contracts concerning the management and administration of the whole or any substantial part of the business of the Company were entered into or existed during the year.
DIRECTORS’ RIGHTS TO ACQUIRE SHARES OR DEBENTURES
Save as disclosed under the section headed “Share Option Schemes” below, at no time during the year was the Company or any of its subsidiaries a party to any arrangements to enable the Directors of the Company or chief executives or any of their spouse or children under the age of 18 to acquire benefits by means of the acquisition of shares in, or debentures of, the Company or any other body corporate.
SHARE OPTION SCHEMES
Share option schemes of the Group are set out on pages 98 to 105.
SUBSTANTIAL SHAREHOLDERS’ INTERESTS IN SECURITIES
As at 30 June 2019, the interests or short positions of substantial shareholders (as defined in the Listing Rules) in the shares and underlying shares of the Company as recorded in the register required to be kept under Section 336 of the SFO were as follows:
Long positions in shares
Number of shares held Approximate % of
shareholdingNameBeneficial interests
Corporate interests Total
Cheng Yu Tung Family (Holdings) Limited (“CYTFH”)(1) — 4,535,634,444 4,535,634,444 44.37
Cheng Yu Tung Family (Holdings II) Limited (“CYTFH-II”)(2) — 4,535,634,444 4,535,634,444 44.37
Chow Tai Fook Capital Limited (“CTFC”)(3) — 4,535,634,444 4,535,634,444 44.37Chow Tai Fook (Holding) Limited
(“CTFHL”)(4) — 4,535,634,444 4,535,634,444 44.37Chow Tai Fook Enterprises Limited
(“CTF”)(5) 4,123,491,293 412,143,151 4,535,634,444 44.37
Notes:
(1) CYTFH holds 48.98% direct interest in CTFC and is accordingly deemed to have an interest in the shares deemed to be interested by CTFC.
(2) CYTFH-II holds 46.65% direct interest in CTFC and is accordingly deemed to have an interest in the shares deemed to be interested by CTFC.
(3) CTFC holds 81.03% direct interest in CTFHL and is accordingly deemed to have an interest in the shares deemed to be interested by CTFHL.
New
Wor
ld D
evel
opm
ent
Com
pany
Lim
ited
92A
nnua
l Rep
ort
2019
Report of the Directors
SUBSTANTIAL SHAREHOLDERS’ INTERESTS IN SECURITIES (CONTINUED)
(4) CTFHL holds 100% direct interest in CTF and is accordingly deemed to have an interest in the shares interested by or deemed to be interested by CTF.
(5) CTF together with its subsidiaries.
Save as disclosed above, there is no other interest recorded in the register that is required to be kept under Section 336 of the SFO as at 30 June 2019.
SUFFICIENCY OF PUBLIC FLOAT
According to information that is available to the Company, the percentage of the Company’s shares which are in the hands of the public exceeds 25.0% of the Company’s total number of issued shares.
MAJOR CUSTOMERS AND SUPPLIERS
During the year, less than 30.0% of the Group’s turnover and less than 30.0% of the Group’s purchases were attributable to the Group’s five largest customers and five largest suppliers respectively.
AUDITOR
The financial statements have been audited by Messrs. PricewaterhouseCoopers, who retire and, being eligible, offer themselves for re-appointment.
On Behalf of the Board
Dr. Cheng Kar-Shun, HenryChairmanHong Kong, 25 September 2019
93Report of the Directors
CONNECTED TRANSACTIONS
(1) The Company and Chow Tai Fook Enterprises Limited (“CTF”), severally in the proportions of 64.0% and 36.0%, have on 29 August 1995 issued an indemnity (the “Indemnity”) to Renaissance Hotel Group N.V. (“RHG”), a former subsidiary of New World Hotels (Holdings) Limited (“NWHH”), which is now an independent third party, in respect of any obligations of RHG or its subsidiaries may have in respect of certain lease payment obligations under originally 25 leases or guarantees of leases (now one lease remaining) held by Hotel Property Investments (B.V.I.) Ltd. (“HPI”) and its subsidiaries.
On 25 July 1997, NWHH sold its entire interests in HPI to CTF Holdings Ltd.(“CTFH”), a company then controlled by Dr. Cheng Kar-Shun, Henry and Mr. Doo Wai-Hoi, William (“Mr. Doo”), and currently wholly owned by CTF. Under the sale, the Indemnity will continue. Arrangements have therefore been entered into whereby CTF will counter-indemnify the Company fully against any liability arising under the Indemnity in respect of the said lease obligations and guarantees of leases. The final lease expires at the end of August 2019 and all lease payments have been made. The landlord has asserted certain claims for dilapidation in the amount of approximately US$1.7 million (equivalent to approximately HK$13.3 million) and HPI has asserted claims against landlord for approximately the same amount. It is presently estimated that the maximum liability of the Company under the Indemnity will be approximately US$1.7 million (equivalent to approximately HK$13.3 million) in total. Up to the date of this report, no payment has ever been made by the Company or CTF under the Indemnity.
(2) On 22 March 2012, New World Department Store China Limited (“NWDS”) and Chow Tai Fook Jewellery Group Limited (“CTFJ”) entered into a master concessionaire counter agreement (the “Master Concessionaire Counter Agreement”) commencing from 24 April 2012 up to and including 30 June 2014, pursuant to which members of the NWDS Group (i.e. NWDS and its subsidiaries) and the CTFJ Group (i.e. CTFJ and its subsidiaries) may from time to time enter into definitive concessionaire agreements in relation to any transactions arising from the concessionaire arrangements or rental agreements in respect of retailing counters for the sale of jewellery products and watches by the CTFJ Group at properties in the PRC owned by, or leased to the NWDS Group or at which the NWDS Group operates its business.
The Master Concessionaire Counter Agreement will be automatically renewed for a successive period of three years after the initial term or subsequent renewal term subject to compliance with relevant requirements of the Listing Rules.
As CTFJ is a fellow subsidiary of CTF which is a substantial shareholder of the Company, CTFJ is therefore a connected person of the Company under the Listing Rules. Accordingly, the entering into of the Master Concessionaire Counter Agreement and all the transactions contemplated thereunder constitute continuing connected transactions for the Company under the Listing Rules.
Upon expiry of its initial term, the Master Concessionaire Counter Agreement was automatically renewed for three years commencing from 1 July 2014. In anticipation of the expiry of the first renewal term on 30 June 2017, NWDS and CTFJ agreed to further renew the Master Concessionaire Counter Agreement for further three years commencing from 1 July 2017 up to and including 30 June 2020. Details of the second renewal of the Master Concessionaire Counter Agreement and the annual caps set for each of the three financial years ending 30 June 2020 were set out in the announcement of the Company dated 10 April 2017.
For the year ended 30 June 2019, the aggregate amount of the transactions under the Master Concessionaire Counter Agreement amounted to approximately RMB64.4 million (equivalent to approximately HK$74.0 million), which is within the annual cap of RMB135.912 million (equivalent to approximately HK$156.2 million).
New
Wor
ld D
evel
opm
ent
Com
pany
Lim
ited
94A
nnua
l Rep
ort
2019
Report of the Directors
CONNECTED TRANSACTIONS (CONTINUED)
(3) On 10 April 2017, the Company and Mr. Doo entered into a master services agreement (the “Mr. Doo MSA”) for a term of three years commencing from 1 July 2017 up to and including 30 June 2020 in respect of the provision of certain operational and rental services which include contracting services, cleaning and landscaping services, facilities management services, property management services, security and guarding services and rental services between members of the Group and members of the Services Group (being Mr. Doo and any company in the equity capital of which Mr. Doo is or will be directly or indirectly interested so as to exercise or control the exercise of 30.0% (or such other amount as may from time to time be specified in the Code on Takeovers and Mergers (the “Takeovers Code”) as being the level for triggering a mandatory general offer) or more of the voting power at general meetings, or to control the composition of a majority of the board of directors and any other company which is its subsidiary). Subject to compliance with the relevant requirements under the Listing Rules, upon expiration of the initial term or subsequent renewal term, the Mr. Doo MSA will be automatically renewed for a successive period of three years thereafter (or such other period permitted under the Listing Rules). The Mr. Doo MSA and the annual caps set for each of the three financial years ending 30 June 2020 were approved by the independent shareholders of the Company on 26 May 2017.
Mr. Doo is the Non-executive Vice-chairman of the Company and a director of certain subsidiaries of the Company, and hence a connected person of the Company under the Listing Rules. Accordingly, the entering into of the Mr. Doo MSA and all the transactions contemplated thereunder constitute continuing connected transactions for the Company under the Listing Rules.
For the year ended 30 June 2019, the aggregate amount of the transactions under the Mr. Doo MSA amounted to approximately HK$1,711.8 million, which is within the annual cap of HK$5,405.3 million.
(4) On 10 April 2017, the Company and CTF entered into a master services agreement (the “CTF MSA”) for a term of three years commencing from 1 July 2017 up to and including 30 June 2020 in respect of the provision of services including administrative services, contracting services, general and rental services, and project management and consultancy services between members of the Group and members of the CTF Services Group (being CTF, (a) any other company which is its subsidiary or holding company or is a fellow subsidiary of any such holding company, and/or (b) any other company in the equity capital of which CTF and such other companies referred to in (a) above taken together are directly or indirectly interested so as to exercise or control the exercise of 30.0% (or such other amount as may from time to time be specified in the Takeovers Code as being the level for triggering a mandatory general offer) or more of the voting power at general meetings or to control the composition of a majority of the board of directors, and any other company which is its subsidiary, but excluding members of the Group).
Subject to compliance with the relevant requirements under the Listing Rules, upon expiration of the initial term or subsequent renewal term, the CTF MSA will be automatically renewed for a successive period of three years thereafter (or such other period permitted under the Listing Rules). Details of the CTF MSA and the annual caps set for each of the three financial years ending 30 June 2020 were set out in the announcement of the Company dated 10 April 2017.
As CTF is a connected person of the Company, the entering into of the CTF MSA and all the transactions contemplated thereunder constitute continuing connected transactions for the Company under the Listing Rules.
For the year ended 30 June 2019, the aggregate amount of the transactions under the CTF MSA amounted to approximately HK$645.3 million, which is within the annual cap of HK$1,579.1 million.
95Report of the Directors
CONNECTED TRANSACTIONS (CONTINUED)
(5) On 11 April 2014, the Company and CTFJ entered into a master leasing agreement (the “Master Leasing Agreement”) regarding the leasing of premises between members of the Group and members of the CTFJ Group for an initial term of three years commencing from 1 July 2014. Subject to compliance with the relevant requirements under the Listing Rules, upon expiration of the initial term or subsequent renewal term, the Master Leasing Agreement will be automatically renewed for a successive period of three years thereafter.
As CTFJ is a fellow subsidiary of CTF which is a substantial shareholder of the Company, CTFJ is therefore a connected person of the Company under the Listing Rules. Accordingly, the entering into of the Master Leasing Agreement and all the transactions contemplated thereunder constitute continuing connected transactions for the Company under the Listing Rules.
Upon expiry of its initial term, the Master Leasing Agreement was automatically renewed in accordance with its terms and conditions for three years commencing from 1 July 2017 up to and including 30 June 2020. Details of the renewal of the Master Leasing Agreement and the annual caps set for each of the three financial years ending 30 June 2020 were set out in the announcement of the Company dated 13 April 2017.
For the year ended 30 June 2019, the aggregate amount of the transactions under the Master Leasing Agreement amounted to approximately HK$92.3 million, which is within the annual cap of HK$177.1 million.
(6) On 10 April 2017, the Company and CTF entered into a master hotel management services agreement (the “Master Hotel Management Services Agreement”) regarding the provision of hotel management and consultancy services by members of the CTF Group to members of the Group. The Master Hotel Management Services Agreement is for a term of 10 years commencing from 1 July 2017 up to and including 30 June 2027 and will be automatically renewed for a further term of 10 years upon expiration of the initial term subject to compliance with the relevant requirements under the Listing Rules. Details of the Master Hotel Management Services Agreement and the annual caps set for each of the three financial years ending 30 June 2020 were set out in the announcement of the Company dated 10 April 2017.
As CTF is a connected person of the Company, the entering into of the Master Hotel Management Services Agreement and all the transactions contemplated thereunder constitute continuing connected transactions for the Company under the Listing Rules.
For the year ended 30 June 2019, the aggregate amount of the transactions under the Master Hotel Management Services Agreement amounted to approximately HK$116.9 million, which is within the annual cap of HK$224.7 million.
New
Wor
ld D
evel
opm
ent
Com
pany
Lim
ited
96A
nnua
l Rep
ort
2019
Report of the Directors
CONNECTED TRANSACTIONS (CONTINUED)
(7) On 26 July 2019, Esteemed Sino Limited (“Esteemed Sino”, an indirect wholly owned subsidiary of the Company), Praiseworth International Limited (“First Vendor”), Property Giant Investments Limited (“Second Vendor”) and CTF as guarantor entered into a sale and purchase agreement (the “SP Agreement”) pursuant to which Esteemed Sino agreed to acquire 51.0% interest of the entire issued share capital of Silvery Yield Development Limited (“Silvery Yield”) and the related shareholders’ loans from the First Vendor and the Second Vendor (collectively the “Vendors”, which are wholly owned by CTF beneficially) at the total consideration (“Consideration”) of RMB4,010.0 million (equivalent to approximately HK$4,556.8 million) (the “Acquisition”). Silvery Yield and its subsidiaries are principally engaged in the business of property development of Ningbo New World Plaza in Ningbo City, Zhejiang Province, the PRC.
Completion of the Acquisition (“Completion”) took place immediately after the signing of the SP Agreement and Silvery Yield became an indirect wholly owned subsidiary of the Company.
In accordance with the SP Agreement, 20.0% of the Consideration was paid by Silvery Yield to the Vendors upon Completion whereas 80.0% of the Consideration will be payable on or before 31 December 2019.
As CTF is a connected person of the Company, each of the Vendors is a connected person of the Company by virtue of being wholly owned by CTF beneficially and the Acquisition constitutes a connected transaction for the Company under the Listing Rules. Details of the Acquisition were set out in the announcement of the Company dated 26 July 2019.
The price and terms of the continuing connected transactions mentioned in paragraphs (2) to (6) above were determined in accordance with the pricing policies and guidelines as set out in the relevant announcements of the Company. These continuing connected transactions have been reviewed by the Independent Non-executive Directors of the Company who have confirmed that the transactions have been entered into:
(a) in the ordinary and usual course of business of the Group;
(b) on normal commercial terms or better; and
(c) in accordance with the relevant agreements governing them on terms that are fair and reasonable and in the interests of the shareholders of the Company as a whole.
The Company’s auditor was engaged to report on the Group’s continuing connected transactions stated in paragraphs (2) to (6) above in accordance with Hong Kong Standard on Assurance Engagements 3000 (Revised) “Assurance Engagements Other Than Audits or Reviews of Historical Financial Information” and with reference to Practice Note 740 “Auditor’s Letter on Continuing Connected Transactions under the Hong Kong Listing Rules” issued by the Hong Kong Institute of Certified Public Accountants. The auditor has issued his unqualified letter containing his findings and conclusions in respect of the continuing connected transactions disclosed by the Group in accordance with paragraph 14A.56 of the Listing Rules. A copy of the auditor’s letter has been provided by the Company to the HKEx.
Save as disclosed above, a summary of significant related party transactions that did not constitute connected transactions made during the year was disclosed in note 47 to the financial statements.
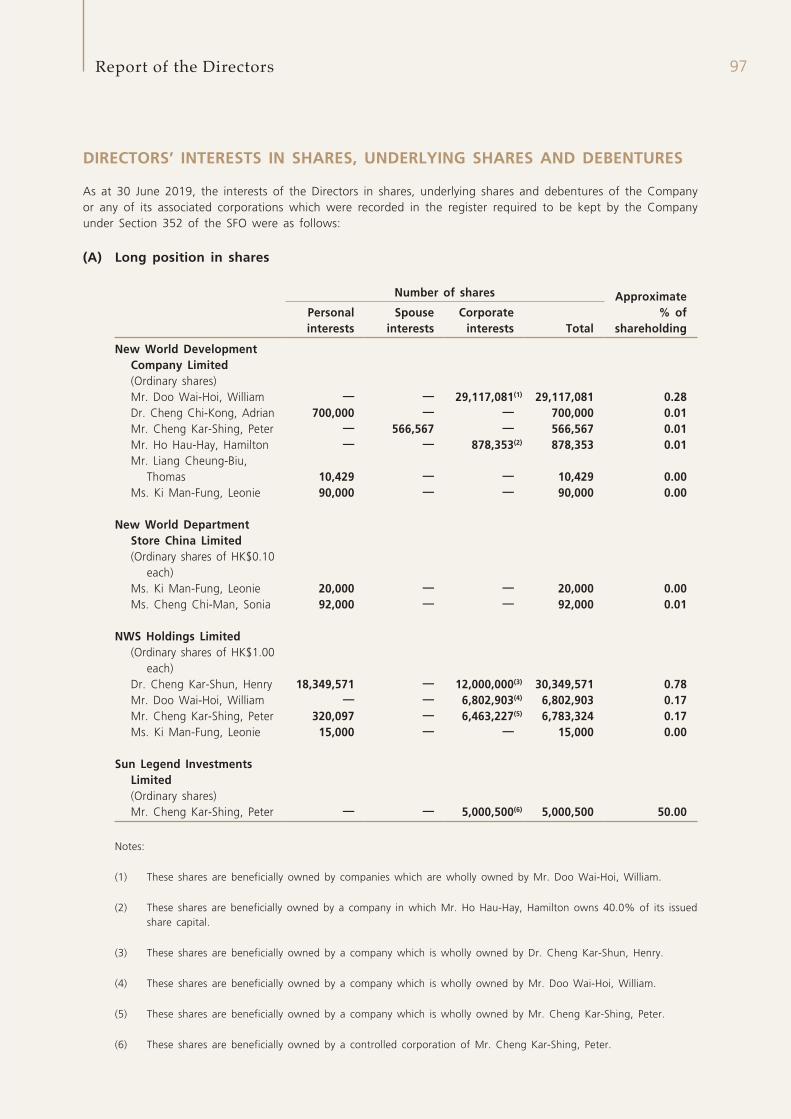
97Report of the Directors
DIRECTORS’ INTERESTS IN SHARES, UNDERLYING SHARES AND DEBENTURES
As at 30 June 2019, the interests of the Directors in shares, underlying shares and debentures of the Company or any of its associated corporations which were recorded in the register required to be kept by the Company under Section 352 of the SFO were as follows:
(A) Long position in shares
Number of shares Approximate % of
shareholdingPersonal interests
Spouse interests
Corporate interests Total
New World Development Company Limited(Ordinary shares)Mr. Doo Wai-Hoi, William — — 29,117,081(1) 29,117,081 0.28Dr. Cheng Chi-Kong, Adrian 700,000 — — 700,000 0.01Mr. Cheng Kar-Shing, Peter — 566,567 — 566,567 0.01Mr. Ho Hau-Hay, Hamilton — — 878,353(2) 878,353 0.01Mr. Liang Cheung-Biu,
Thomas 10,429 — — 10,429 0.00Ms. Ki Man-Fung, Leonie 90,000 — — 90,000 0.00
New World Department Store China Limited(Ordinary shares of HK$0.10
each)Ms. Ki Man-Fung, Leonie 20,000 — — 20,000 0.00Ms. Cheng Chi-Man, Sonia 92,000 — — 92,000 0.01
NWS Holdings Limited(Ordinary shares of HK$1.00
each)Dr. Cheng Kar-Shun, Henry 18,349,571 — 12,000,000(3) 30,349,571 0.78Mr. Doo Wai-Hoi, William — — 6,802,903(4) 6,802,903 0.17Mr. Cheng Kar-Shing, Peter 320,097 — 6,463,227(5) 6,783,324 0.17Ms. Ki Man-Fung, Leonie 15,000 — — 15,000 0.00
Sun Legend Investments Limited(Ordinary shares)Mr. Cheng Kar-Shing, Peter — — 5,000,500(6) 5,000,500 50.00
Notes:
(1) These shares are beneficially owned by companies which are wholly owned by Mr. Doo Wai-Hoi, William.
(2) These shares are beneficially owned by a company in which Mr. Ho Hau-Hay, Hamilton owns 40.0% of its issued share capital.
(3) These shares are beneficially owned by a company which is wholly owned by Dr. Cheng Kar-Shun, Henry.
(4) These shares are beneficially owned by a company which is wholly owned by Mr. Doo Wai-Hoi, William.
(5) These shares are beneficially owned by a company which is wholly owned by Mr. Cheng Kar-Shing, Peter.
(6) These shares are beneficially owned by a controlled corporation of Mr. Cheng Kar-Shing, Peter.
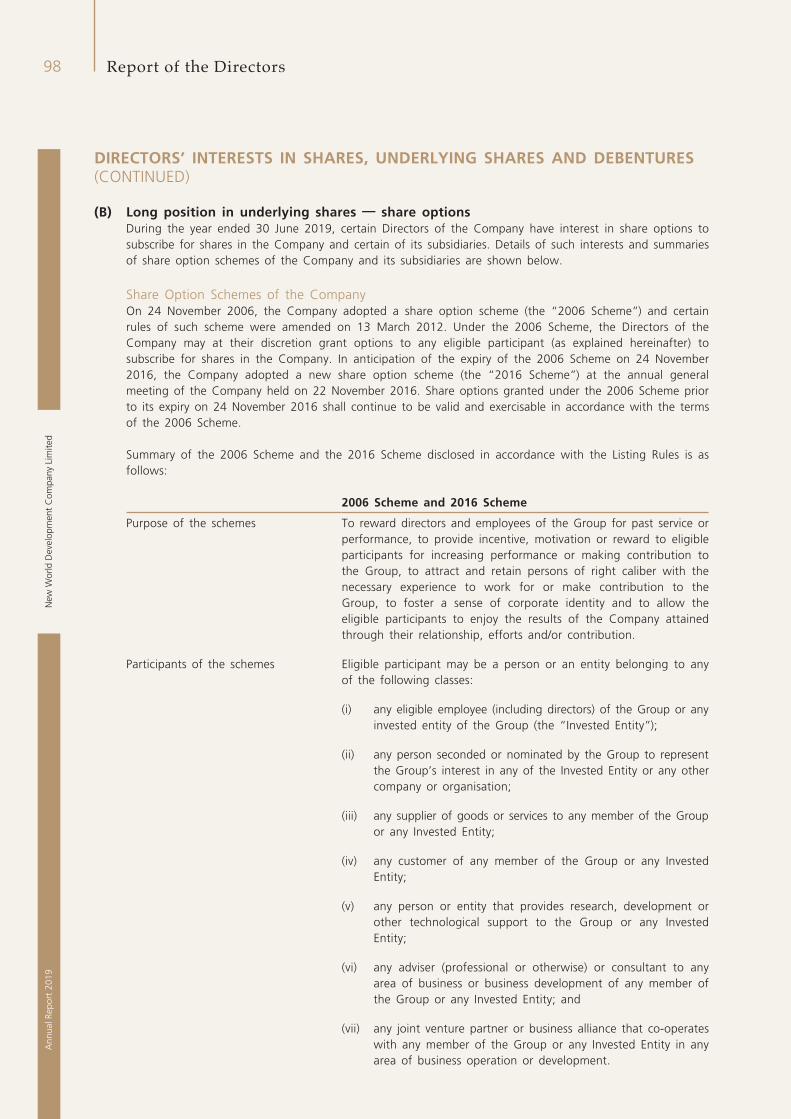
New
Wor
ld D
evel
opm
ent
Com
pany
Lim
ited
98A
nnua
l Rep
ort
2019
Report of the Directors
DIRECTORS’ INTERESTS IN SHARES, UNDERLYING SHARES AND DEBENTURES (CONTINUED)
(B) Long position in underlying shares — share optionsDuring the year ended 30 June 2019, certain Directors of the Company have interest in share options to subscribe for shares in the Company and certain of its subsidiaries. Details of such interests and summaries of share option schemes of the Company and its subsidiaries are shown below.
Share Option Schemes of the CompanyOn 24 November 2006, the Company adopted a share option scheme (the “2006 Scheme”) and certain rules of such scheme were amended on 13 March 2012. Under the 2006 Scheme, the Directors of the Company may at their discretion grant options to any eligible participant (as explained hereinafter) to subscribe for shares in the Company. In anticipation of the expiry of the 2006 Scheme on 24 November 2016, the Company adopted a new share option scheme (the “2016 Scheme”) at the annual general meeting of the Company held on 22 November 2016. Share options granted under the 2006 Scheme prior to its expiry on 24 November 2016 shall continue to be valid and exercisable in accordance with the terms of the 2006 Scheme.
Summary of the 2006 Scheme and the 2016 Scheme disclosed in accordance with the Listing Rules is as follows:
2006 Scheme and 2016 Scheme
Purpose of the schemes To reward directors and employees of the Group for past service or performance, to provide incentive, motivation or reward to eligible participants for increasing performance or making contribution to the Group, to attract and retain persons of right caliber with the necessary experience to work for or make contribution to the Group, to foster a sense of corporate identity and to allow the eligible participants to enjoy the results of the Company attained through their relationship, efforts and/or contribution.
Participants of the schemes Eligible participant may be a person or an entity belonging to any of the following classes:
(i) any eligible employee (including directors) of the Group or any invested entity of the Group (the “Invested Entity”);
(ii) any person seconded or nominated by the Group to represent the Group’s interest in any of the Invested Entity or any other company or organisation;
(iii) any supplier of goods or services to any member of the Group or any Invested Entity;
(iv) any customer of any member of the Group or any Invested Entity;
(v) any person or entity that provides research, development or other technological support to the Group or any Invested Entity;
(vi) any adviser (professional or otherwise) or consultant to any area of business or business development of any member of the Group or any Invested Entity; and
(vii) any joint venture partner or business alliance that co-operates with any member of the Group or any Invested Entity in any area of business operation or development.
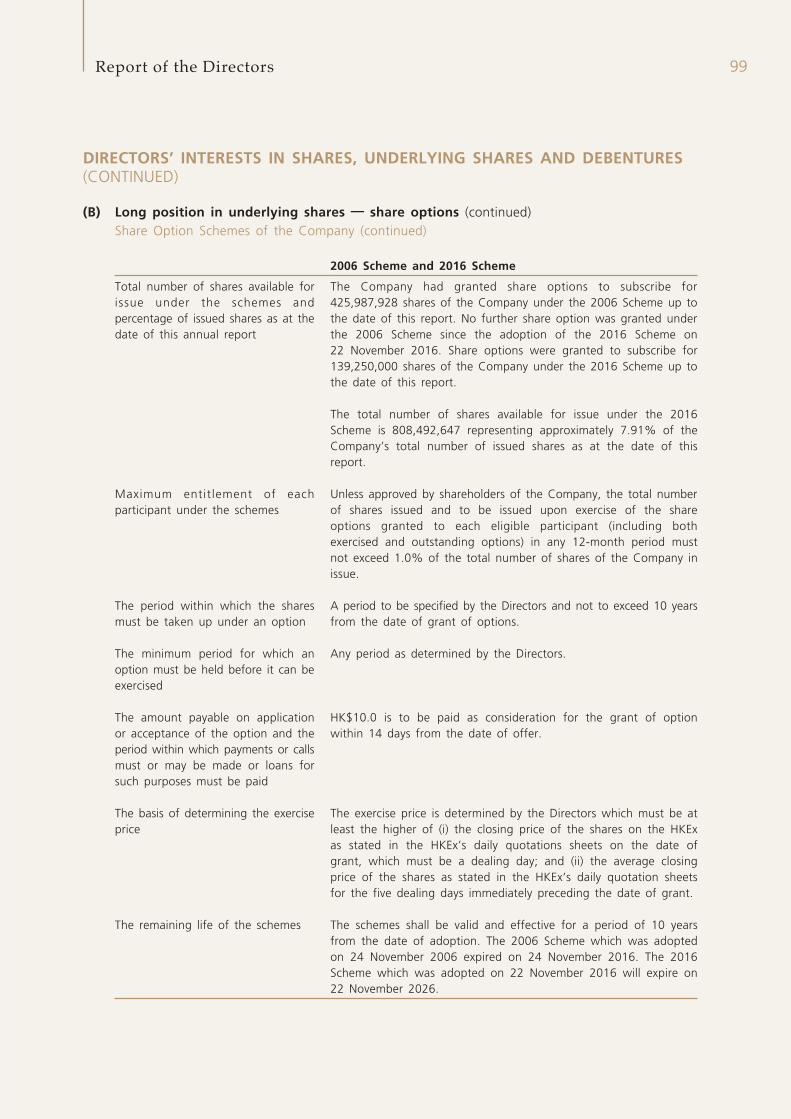
99Report of the Directors
DIRECTORS’ INTERESTS IN SHARES, UNDERLYING SHARES AND DEBENTURES (CONTINUED)
(B) Long position in underlying shares — share options (continued) Share Option Schemes of the Company (continued)
2006 Scheme and 2016 Scheme
Total number of shares available for issue under the schemes and percentage of issued shares as at the date of this annual report
The Company had granted share options to subscribe for 425,987,928 shares of the Company under the 2006 Scheme up to the date of this report. No further share option was granted under the 2006 Scheme since the adoption of the 2016 Scheme on 22 November 2016. Share options were granted to subscribe for 139,250,000 shares of the Company under the 2016 Scheme up to the date of this report.
The total number of shares available for issue under the 2016 Scheme is 808,492,647 representing approximately 7.91% of the Company’s total number of issued shares as at the date of this report.
Maximum entitlement of each participant under the schemes
Unless approved by shareholders of the Company, the total number of shares issued and to be issued upon exercise of the share options granted to each eligible participant (including both exercised and outstanding options) in any 12-month period must not exceed 1.0% of the total number of shares of the Company in issue.
The period within which the shares must be taken up under an option
A period to be specified by the Directors and not to exceed 10 years from the date of grant of options.
The minimum period for which an option must be held before it can be exercised
Any period as determined by the Directors.
The amount payable on application or acceptance of the option and the period within which payments or calls must or may be made or loans for such purposes must be paid
HK$10.0 is to be paid as consideration for the grant of option within 14 days from the date of offer.
The basis of determining the exercise price
The exercise price is determined by the Directors which must be at least the higher of (i) the closing price of the shares on the HKEx as stated in the HKEx’s daily quotations sheets on the date of grant, which must be a dealing day; and (ii) the average closing price of the shares as stated in the HKEx’s daily quotation sheets for the five dealing days immediately preceding the date of grant.
The remaining life of the schemes The schemes shall be valid and effective for a period of 10 years from the date of adoption. The 2006 Scheme which was adopted on 24 November 2006 expired on 24 November 2016. The 2016 Scheme which was adopted on 22 November 2016 will expire on 22 November 2026.
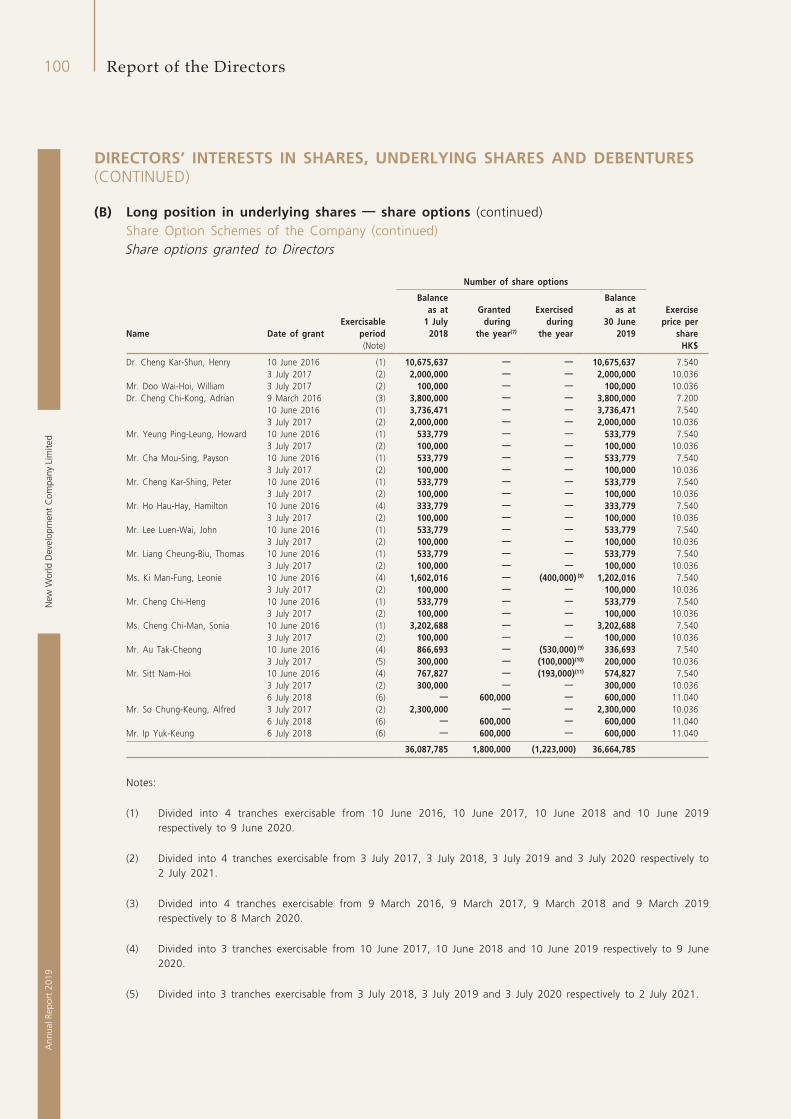
New
Wor
ld D
evel
opm
ent
Com
pany
Lim
ited
100A
nnua
l Rep
ort
2019
Report of the Directors
DIRECTORS’ INTERESTS IN SHARES, UNDERLYING SHARES AND DEBENTURES (CONTINUED)
(B) Long position in underlying shares — share options (continued) Share Option Schemes of the Company (continued) Share options granted to Directors
Number of share options
Name Date of grantExercisable
period
Balance as at
1 July 2018
Granted during
the year(7)
Exercised during
the year
Balance as at
30 June 2019
Exercise price per
share(Note) HK$
Dr. Cheng Kar-Shun, Henry 10 June 2016 (1) 10,675,637 — — 10,675,637 7.5403 July 2017 (2) 2,000,000 — — 2,000,000 10.036
Mr. Doo Wai-Hoi, William 3 July 2017 (2) 100,000 — — 100,000 10.036Dr. Cheng Chi-Kong, Adrian 9 March 2016 (3) 3,800,000 — — 3,800,000 7.200
10 June 2016 (1) 3,736,471 — — 3,736,471 7.5403 July 2017 (2) 2,000,000 — — 2,000,000 10.036
Mr. Yeung Ping-Leung, Howard 10 June 2016 (1) 533,779 — — 533,779 7.5403 July 2017 (2) 100,000 — — 100,000 10.036
Mr. Cha Mou-Sing, Payson 10 June 2016 (1) 533,779 — — 533,779 7.5403 July 2017 (2) 100,000 — — 100,000 10.036
Mr. Cheng Kar-Shing, Peter 10 June 2016 (1) 533,779 — — 533,779 7.5403 July 2017 (2) 100,000 — — 100,000 10.036
Mr. Ho Hau-Hay, Hamilton 10 June 2016 (4) 333,779 — — 333,779 7.5403 July 2017 (2) 100,000 — — 100,000 10.036
Mr. Lee Luen-Wai, John 10 June 2016 (1) 533,779 — — 533,779 7.5403 July 2017 (2) 100,000 — — 100,000 10.036
Mr. Liang Cheung-Biu, Thomas 10 June 2016 (1) 533,779 — — 533,779 7.5403 July 2017 (2) 100,000 — — 100,000 10.036
Ms. Ki Man-Fung, Leonie 10 June 2016 (4) 1,602,016 — (400,000) (8) 1,202,016 7.5403 July 2017 (2) 100,000 — — 100,000 10.036
Mr. Cheng Chi-Heng 10 June 2016 (1) 533,779 — — 533,779 7.5403 July 2017 (2) 100,000 — — 100,000 10.036
Ms. Cheng Chi-Man, Sonia 10 June 2016 (1) 3,202,688 — — 3,202,688 7.5403 July 2017 (2) 100,000 — — 100,000 10.036
Mr. Au Tak-Cheong 10 June 2016 (4) 866,693 — (530,000) (9) 336,693 7.5403 July 2017 (5) 300,000 — (100,000)(10) 200,000 10.036
Mr. Sitt Nam-Hoi 10 June 2016 (4) 767,827 — (193,000)(11) 574,827 7.5403 July 2017 (2) 300,000 — — 300,000 10.0366 July 2018 (6) — 600,000 — 600,000 11.040
Mr. So Chung-Keung, Alfred 3 July 2017 (2) 2,300,000 — — 2,300,000 10.0366 July 2018 (6) — 600,000 — 600,000 11.040
Mr. Ip Yuk-Keung 6 July 2018 (6) — 600,000 — 600,000 11.040
36,087,785 1,800,000 (1,223,000) 36,664,785
Notes:
(1) Divided into 4 tranches exercisable from 10 June 2016, 10 June 2017, 10 June 2018 and 10 June 2019 respectively to 9 June 2020.
(2) Divided into 4 tranches exercisable from 3 July 2017, 3 July 2018, 3 July 2019 and 3 July 2020 respectively to 2 July 2021.
(3) Divided into 4 tranches exercisable from 9 March 2016, 9 March 2017, 9 March 2018 and 9 March 2019 respectively to 8 March 2020.
(4) Divided into 3 tranches exercisable from 10 June 2017, 10 June 2018 and 10 June 2019 respectively to 9 June 2020.
(5) Divided into 3 tranches exercisable from 3 July 2018, 3 July 2019 and 3 July 2020 respectively to 2 July 2021.
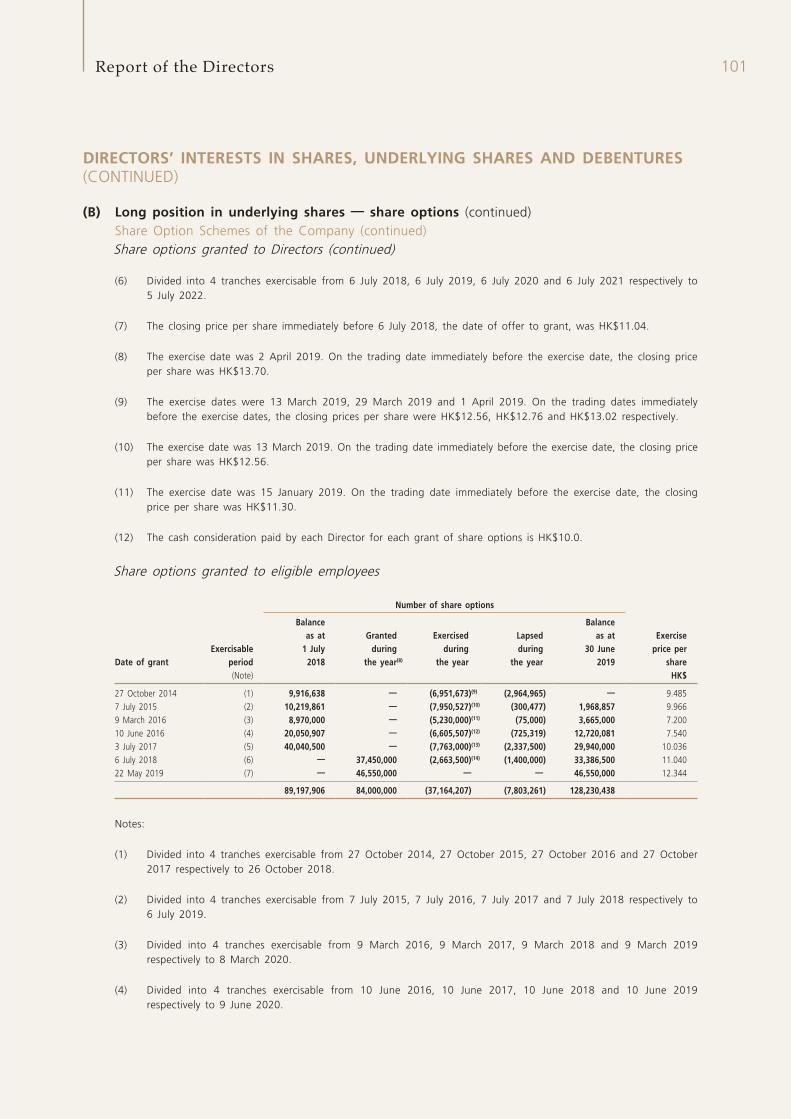
101Report of the Directors
DIRECTORS’ INTERESTS IN SHARES, UNDERLYING SHARES AND DEBENTURES (CONTINUED)
(B) Long position in underlying shares — share options (continued) Share Option Schemes of the Company (continued) Share options granted to Directors (continued)
(6) Divided into 4 tranches exercisable from 6 July 2018, 6 July 2019, 6 July 2020 and 6 July 2021 respectively to 5 July 2022.
(7) The closing price per share immediately before 6 July 2018, the date of offer to grant, was HK$11.04.
(8) The exercise date was 2 April 2019. On the trading date immediately before the exercise date, the closing price per share was HK$13.70.
(9) The exercise dates were 13 March 2019, 29 March 2019 and 1 April 2019. On the trading dates immediately before the exercise dates, the closing prices per share were HK$12.56, HK$12.76 and HK$13.02 respectively.
(10) The exercise date was 13 March 2019. On the trading date immediately before the exercise date, the closing price per share was HK$12.56.
(11) The exercise date was 15 January 2019. On the trading date immediately before the exercise date, the closing price per share was HK$11.30.
(12) The cash consideration paid by each Director for each grant of share options is HK$10.0.
Share options granted to eligible employees
Number of share options
Date of grantExercisable
period
Balance as at
1 July 2018
Granted during
the year(8)
Exercised during
the year
Lapsed during
the year
Balance as at
30 June 2019
Exercise price per
share(Note) HK$
27 October 2014 (1) 9,916,638 — (6,951,673)(9) (2,964,965) — 9.4857 July 2015 (2) 10,219,861 — (7,950,527)(10) (300,477) 1,968,857 9.9669 March 2016 (3) 8,970,000 — (5,230,000)(11) (75,000) 3,665,000 7.20010 June 2016 (4) 20,050,907 — (6,605,507)(12) (725,319) 12,720,081 7.5403 July 2017 (5) 40,040,500 — (7,763,000)(13) (2,337,500) 29,940,000 10.0366 July 2018 (6) — 37,450,000 (2,663,500)(14) (1,400,000) 33,386,500 11.04022 May 2019 (7) — 46,550,000 — — 46,550,000 12.344
89,197,906 84,000,000 (37,164,207) (7,803,261) 128,230,438
Notes:
(1) Divided into 4 tranches exercisable from 27 October 2014, 27 October 2015, 27 October 2016 and 27 October 2017 respectively to 26 October 2018.
(2) Divided into 4 tranches exercisable from 7 July 2015, 7 July 2016, 7 July 2017 and 7 July 2018 respectively to 6 July 2019.
(3) Divided into 4 tranches exercisable from 9 March 2016, 9 March 2017, 9 March 2018 and 9 March 2019 respectively to 8 March 2020.
(4) Divided into 4 tranches exercisable from 10 June 2016, 10 June 2017, 10 June 2018 and 10 June 2019 respectively to 9 June 2020.
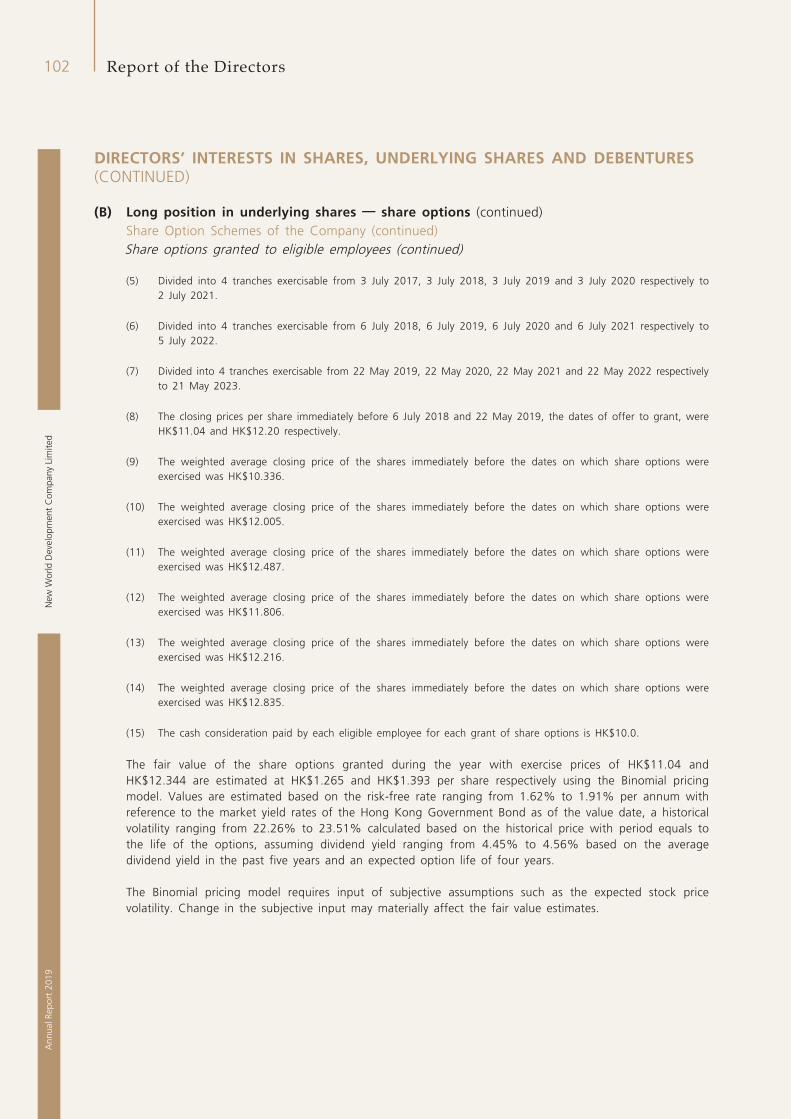
New
Wor
ld D
evel
opm
ent
Com
pany
Lim
ited
102A
nnua
l Rep
ort
2019
Report of the Directors
DIRECTORS’ INTERESTS IN SHARES, UNDERLYING SHARES AND DEBENTURES (CONTINUED)
(B) Long position in underlying shares — share options (continued) Share Option Schemes of the Company (continued) Share options granted to eligible employees (continued)
(5) Divided into 4 tranches exercisable from 3 July 2017, 3 July 2018, 3 July 2019 and 3 July 2020 respectively to 2 July 2021.
(6) Divided into 4 tranches exercisable from 6 July 2018, 6 July 2019, 6 July 2020 and 6 July 2021 respectively to 5 July 2022.
(7) Divided into 4 tranches exercisable from 22 May 2019, 22 May 2020, 22 May 2021 and 22 May 2022 respectively to 21 May 2023.
(8) The closing prices per share immediately before 6 July 2018 and 22 May 2019, the dates of offer to grant, were HK$11.04 and HK$12.20 respectively.
(9) The weighted average closing price of the shares immediately before the dates on which share options were exercised was HK$10.336.
(10) The weighted average closing price of the shares immediately before the dates on which share options were exercised was HK$12.005.
(11) The weighted average closing price of the shares immediately before the dates on which share options were exercised was HK$12.487.
(12) The weighted average closing price of the shares immediately before the dates on which share options were exercised was HK$11.806.
(13) The weighted average closing price of the shares immediately before the dates on which share options were exercised was HK$12.216.
(14) The weighted average closing price of the shares immediately before the dates on which share options were exercised was HK$12.835.
(15) The cash consideration paid by each eligible employee for each grant of share options is HK$10.0.
The fair value of the share options granted during the year with exercise prices of HK$11.04 and HK$12.344 are estimated at HK$1.265 and HK$1.393 per share respectively using the Binomial pricing model. Values are estimated based on the risk-free rate ranging from 1.62% to 1.91% per annum with reference to the market yield rates of the Hong Kong Government Bond as of the value date, a historical volatility ranging from 22.26% to 23.51% calculated based on the historical price with period equals to the life of the options, assuming dividend yield ranging from 4.45% to 4.56% based on the average dividend yield in the past five years and an expected option life of four years.
The Binomial pricing model requires input of subjective assumptions such as the expected stock price volatility. Change in the subjective input may materially affect the fair value estimates.
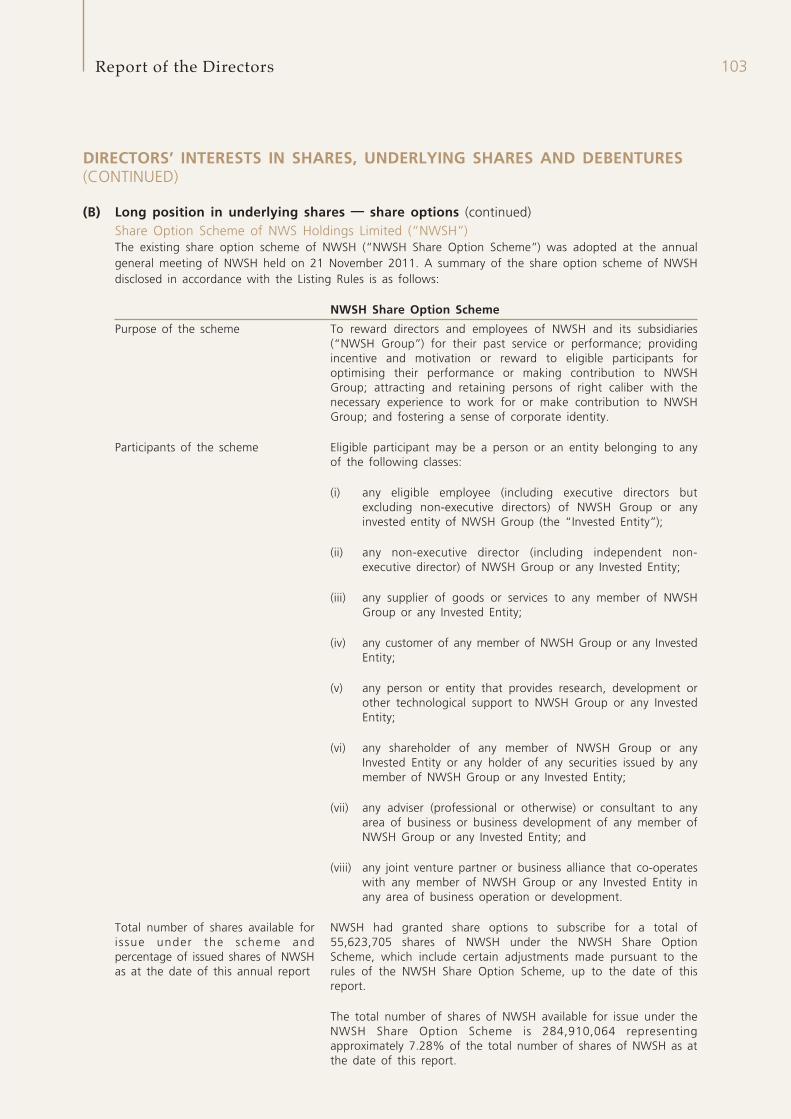
103Report of the Directors
DIRECTORS’ INTERESTS IN SHARES, UNDERLYING SHARES AND DEBENTURES (CONTINUED)
(B) Long position in underlying shares — share options (continued) Share Option Scheme of NWS Holdings Limited (“NWSH”)
The existing share option scheme of NWSH (“NWSH Share Option Scheme”) was adopted at the annual general meeting of NWSH held on 21 November 2011. A summary of the share option scheme of NWSH disclosed in accordance with the Listing Rules is as follows:
NWSH Share Option Scheme
Purpose of the scheme To reward directors and employees of NWSH and its subsidiaries (“NWSH Group”) for their past service or performance; providing incentive and motivation or reward to eligible participants for optimising their performance or making contribution to NWSH Group; attracting and retaining persons of right caliber with the necessary experience to work for or make contribution to NWSH Group; and fostering a sense of corporate identity.
Participants of the scheme Eligible participant may be a person or an entity belonging to any of the following classes:
(i) any eligible employee (including executive directors but excluding non-executive directors) of NWSH Group or any invested entity of NWSH Group (the “Invested Entity”);
(ii) any non-executive director (including independent non-executive director) of NWSH Group or any Invested Entity;
(iii) any supplier of goods or services to any member of NWSH Group or any Invested Entity;
(iv) any customer of any member of NWSH Group or any Invested Entity;
(v) any person or entity that provides research, development or other technological support to NWSH Group or any Invested Entity;
(vi) any shareholder of any member of NWSH Group or any Invested Entity or any holder of any securities issued by any member of NWSH Group or any Invested Entity;
(vii) any adviser (professional or otherwise) or consultant to any area of business or business development of any member of NWSH Group or any Invested Entity; and
(viii) any joint venture partner or business alliance that co-operates with any member of NWSH Group or any Invested Entity in any area of business operation or development.
Total number of shares available for i ssue under the scheme and percentage of issued shares of NWSH as at the date of this annual report
NWSH had granted share options to subscribe for a total of 55,623,705 shares of NWSH under the NWSH Share Option Scheme, which include certain adjustments made pursuant to the rules of the NWSH Share Option Scheme, up to the date of this report.
The total number of shares of NWSH available for issue under the NWSH Share Option Scheme is 284,910,064 representing approximately 7.28% of the total number of shares of NWSH as at the date of this report.
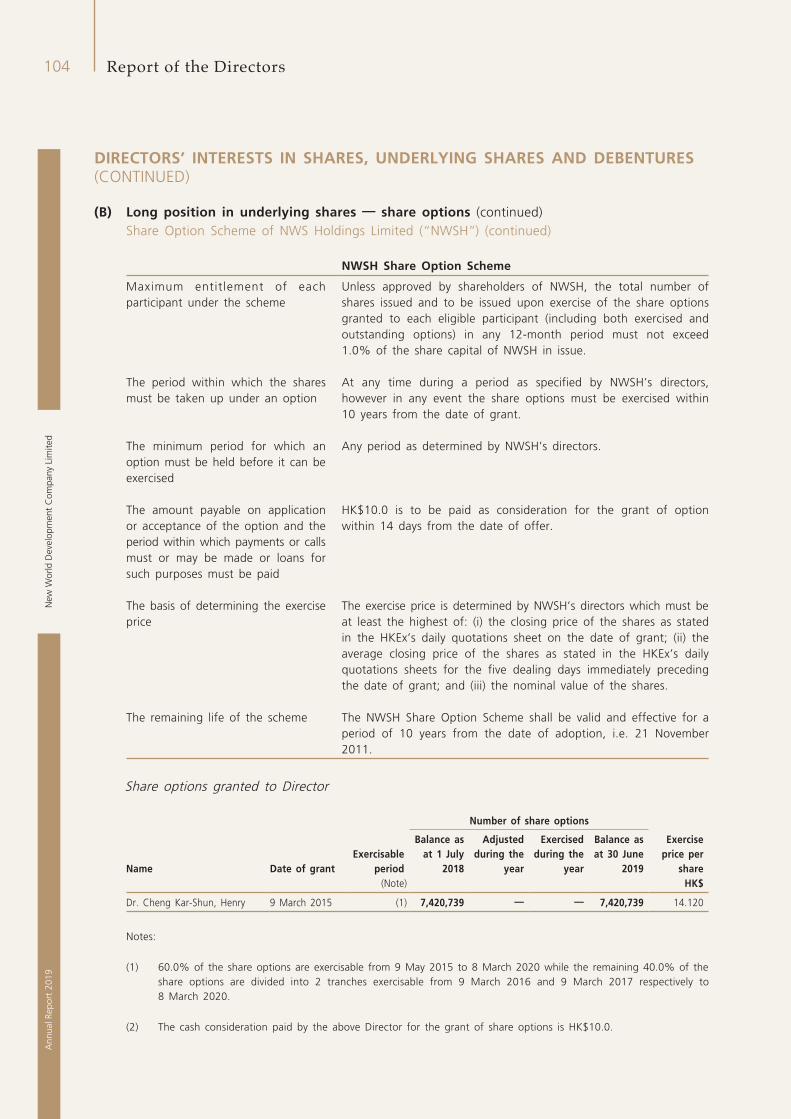
New
Wor
ld D
evel
opm
ent
Com
pany
Lim
ited
104A
nnua
l Rep
ort
2019
Report of the Directors
DIRECTORS’ INTERESTS IN SHARES, UNDERLYING SHARES AND DEBENTURES (CONTINUED)
(B) Long position in underlying shares — share options (continued) Share Option Scheme of NWS Holdings Limited (“NWSH”) (continued)
NWSH Share Option Scheme
Maximum entitlement of each participant under the scheme
Unless approved by shareholders of NWSH, the total number of shares issued and to be issued upon exercise of the share options granted to each eligible participant (including both exercised and outstanding options) in any 12-month period must not exceed 1.0% of the share capital of NWSH in issue.
The period within which the shares must be taken up under an option
At any time during a period as specified by NWSH’s directors, however in any event the share options must be exercised within 10 years from the date of grant.
The minimum period for which an option must be held before it can be exercised
Any period as determined by NWSH’s directors.
The amount payable on application or acceptance of the option and the period within which payments or calls must or may be made or loans for such purposes must be paid
HK$10.0 is to be paid as consideration for the grant of option within 14 days from the date of offer.
The basis of determining the exercise price
The exercise price is determined by NWSH’s directors which must be at least the highest of: (i) the closing price of the shares as stated in the HKEx’s daily quotations sheet on the date of grant; (ii) the average closing price of the shares as stated in the HKEx’s daily quotations sheets for the five dealing days immediately preceding the date of grant; and (iii) the nominal value of the shares.
The remaining life of the scheme The NWSH Share Option Scheme shall be valid and effective for a period of 10 years from the date of adoption, i.e. 21 November 2011.
Share options granted to Director
Number of share options
Name Date of grantExercisable
period
Balance as at 1 July
2018
Adjusted during the
year
Exercised during the
year
Balance as at 30 June
2019
Exercise price per
share(Note) HK$
Dr. Cheng Kar-Shun, Henry 9 March 2015 (1) 7,420,739 — — 7,420,739 14.120
Notes:
(1) 60.0% of the share options are exercisable from 9 May 2015 to 8 March 2020 while the remaining 40.0% of the share options are divided into 2 tranches exercisable from 9 March 2016 and 9 March 2017 respectively to 8 March 2020.
(2) The cash consideration paid by the above Director for the grant of share options is HK$10.0.
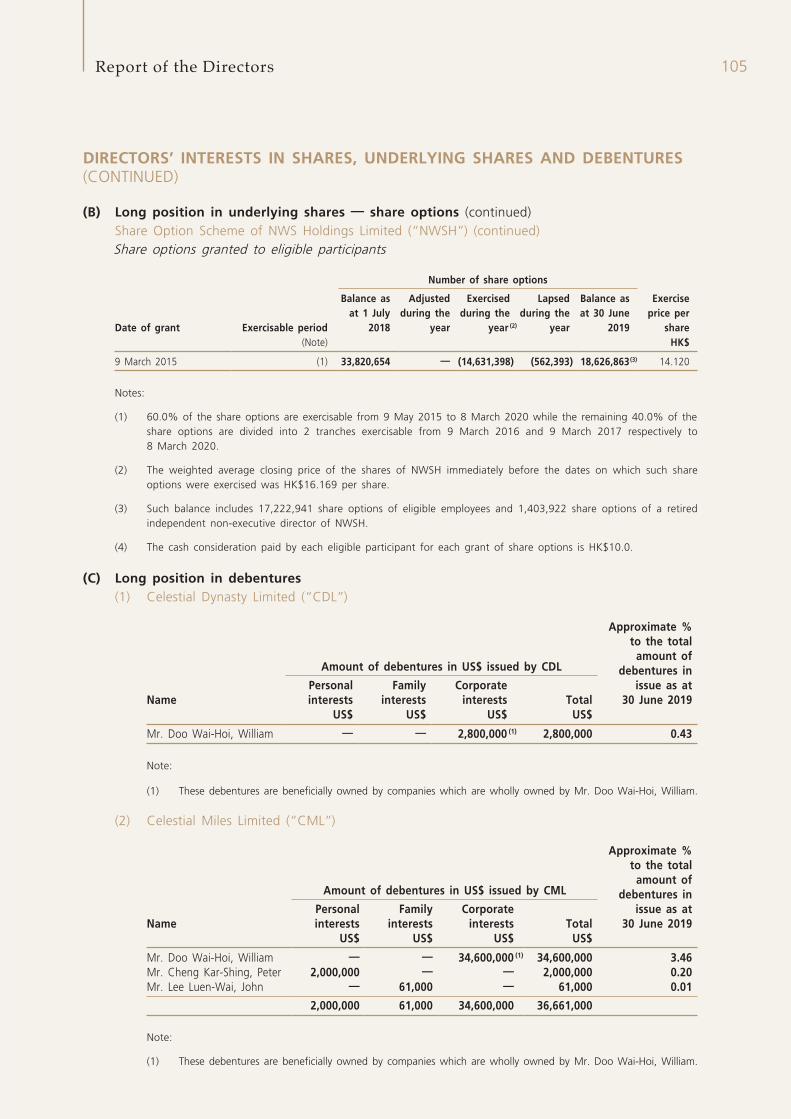
105Report of the Directors
DIRECTORS’ INTERESTS IN SHARES, UNDERLYING SHARES AND DEBENTURES (CONTINUED)
(B) Long position in underlying shares — share options (continued) Share Option Scheme of NWS Holdings Limited (“NWSH”) (continued) Share options granted to eligible participants
Number of share options
Date of grant Exercisable period
Balance as at 1 July
2018
Adjusted during the
year
Exercised during the
year (2)
Lapsed during the
year
Balance asat 30 June
2019
Exercise price per
share(Note) HK$
9 March 2015 (1) 33,820,654 — (14,631,398) (562,393) 18,626,863 (3) 14.120
Notes:
(1) 60.0% of the share options are exercisable from 9 May 2015 to 8 March 2020 while the remaining 40.0% of the share options are divided into 2 tranches exercisable from 9 March 2016 and 9 March 2017 respectively to 8 March 2020.
(2) The weighted average closing price of the shares of NWSH immediately before the dates on which such share options were exercised was HK$16.169 per share.
(3) Such balance includes 17,222,941 share options of eligible employees and 1,403,922 share options of a retired independent non-executive director of NWSH.
(4) The cash consideration paid by each eligible participant for each grant of share options is HK$10.0.
(C) Long position in debentures (1) Celestial Dynasty Limited (“CDL”)
Amount of debentures in US$ issued by CDL
Approximate % to the total
amount of debentures in
issue as at 30 June 2019Name
Personal interests
Family interests
Corporate interests Total
US$ US$ US$ US$
Mr. Doo Wai-Hoi, William — — 2,800,000 (1) 2,800,000 0.43
Note:
(1) These debentures are beneficially owned by companies which are wholly owned by Mr. Doo Wai-Hoi, William.
(2) Celestial Miles Limited (“CML”)
Amount of debentures in US$ issued by CML
Approximate % to the total
amount of debentures in
issue as at 30 June 2019Name
Personal interests
Family interests
Corporate interests Total
US$ US$ US$ US$
Mr. Doo Wai-Hoi, William — — 34,600,000 (1) 34,600,000 3.46Mr. Cheng Kar-Shing, Peter 2,000,000 — — 2,000,000 0.20Mr. Lee Luen-Wai, John — 61,000 — 61,000 0.01
2,000,000 61,000 34,600,000 36,661,000
Note:
(1) These debentures are beneficially owned by companies which are wholly owned by Mr. Doo Wai-Hoi, William.
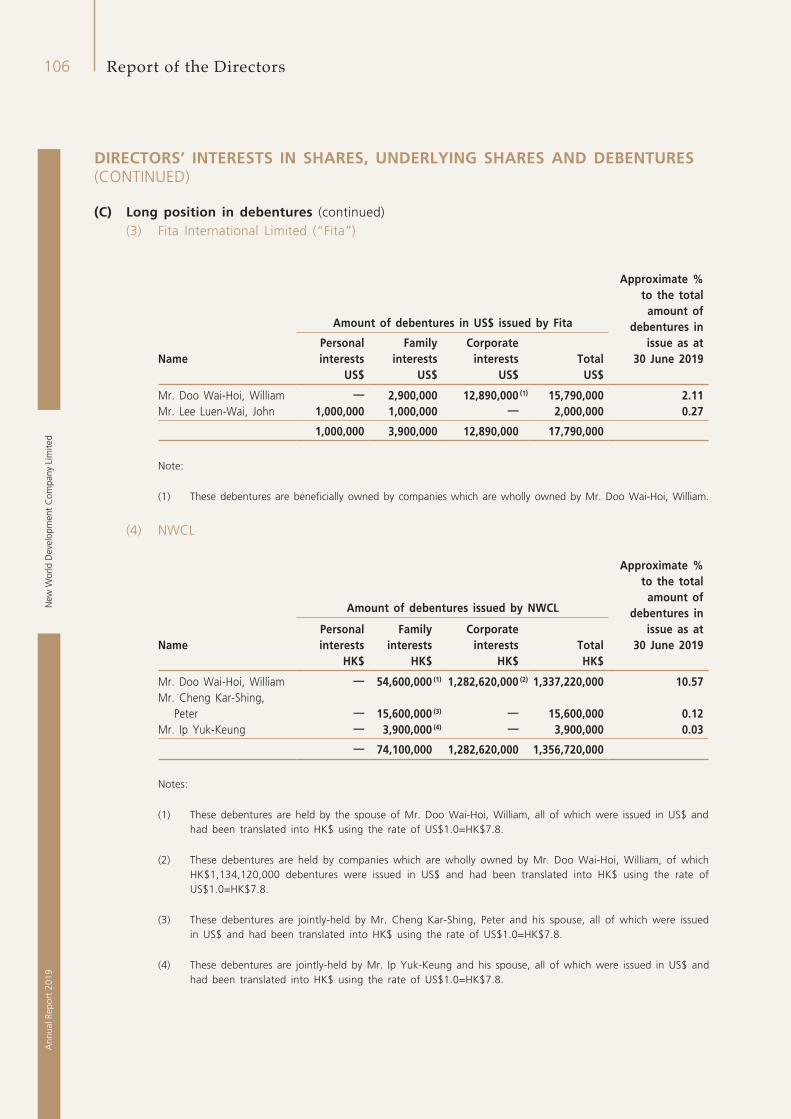
New
Wor
ld D
evel
opm
ent
Com
pany
Lim
ited
106A
nnua
l Rep
ort
2019
Report of the Directors
DIRECTORS’ INTERESTS IN SHARES, UNDERLYING SHARES AND DEBENTURES (CONTINUED)
(C) Long position in debentures (continued) (3) Fita International Limited (“Fita”)
Amount of debentures in US$ issued by Fita
Approximate % to the total
amount of debentures in
issue as at 30 June 2019Name
Personal interests
Family interests
Corporate interests Total
US$ US$ US$ US$
Mr. Doo Wai-Hoi, William — 2,900,000 12,890,000 (1) 15,790,000 2.11Mr. Lee Luen-Wai, John 1,000,000 1,000,000 — 2,000,000 0.27
1,000,000 3,900,000 12,890,000 17,790,000
Note:
(1) These debentures are beneficially owned by companies which are wholly owned by Mr. Doo Wai-Hoi, William.
(4) NWCL
Amount of debentures issued by NWCL
Approximate % to the total
amount of debentures in
issue as at 30 June 2019Name
Personal interests
Family interests
Corporate interests Total
HK$ HK$ HK$ HK$
Mr. Doo Wai-Hoi, William — 54,600,000 (1) 1,282,620,000 (2) 1,337,220,000 10.57Mr. Cheng Kar-Shing,
Peter — 15,600,000 (3) — 15,600,000 0.12Mr. Ip Yuk-Keung — 3,900,000 (4) — 3,900,000 0.03
— 74,100,000 1,282,620,000 1,356,720,000
Notes:
(1) These debentures are held by the spouse of Mr. Doo Wai-Hoi, William, all of which were issued in US$ and had been translated into HK$ using the rate of US$1.0=HK$7.8.
(2) These debentures are held by companies which are wholly owned by Mr. Doo Wai-Hoi, William, of which HK$1,134,120,000 debentures were issued in US$ and had been translated into HK$ using the rate of US$1.0=HK$7.8.
(3) These debentures are jointly-held by Mr. Cheng Kar-Shing, Peter and his spouse, all of which were issued in US$ and had been translated into HK$ using the rate of US$1.0=HK$7.8.
(4) These debentures are jointly-held by Mr. Ip Yuk-Keung and his spouse, all of which were issued in US$ and had been translated into HK$ using the rate of US$1.0=HK$7.8.
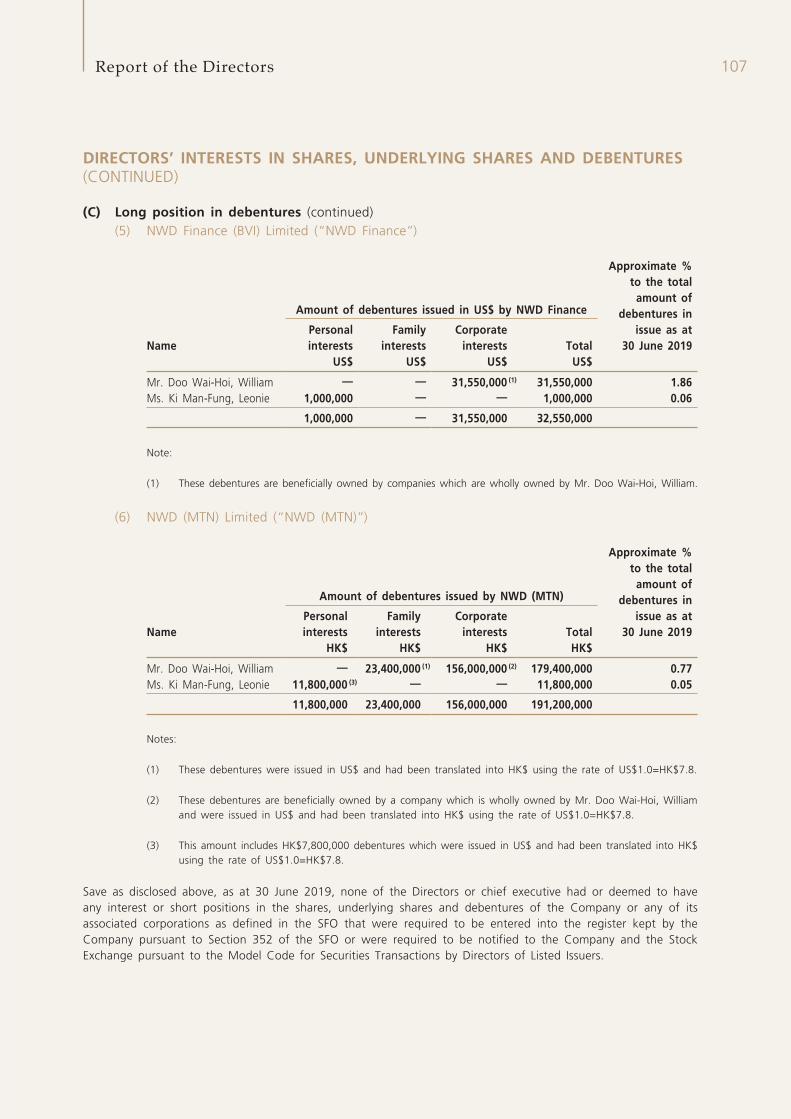
107Report of the Directors
DIRECTORS’ INTERESTS IN SHARES, UNDERLYING SHARES AND DEBENTURES (CONTINUED)
(C) Long position in debentures (continued) (5) NWD Finance (BVI) Limited (“NWD Finance”)
Amount of debentures issued in US$ by NWD Finance
Approximate % to the total
amount of debentures in
issue as at 30 June 2019Name
Personal interests
Family interests
Corporate interests Total
US$ US$ US$ US$
Mr. Doo Wai-Hoi, William — — 31,550,000 (1) 31,550,000 1.86Ms. Ki Man-Fung, Leonie 1,000,000 — — 1,000,000 0.06
1,000,000 — 31,550,000 32,550,000
Note:
(1) These debentures are beneficially owned by companies which are wholly owned by Mr. Doo Wai-Hoi, William.
(6) NWD (MTN) Limited (“NWD (MTN)”)
Amount of debentures issued by NWD (MTN)
Approximate % to the total
amount of debentures in
issue as at 30 June 2019Name
Personal interests
Family interests
Corporate interests Total
HK$ HK$ HK$ HK$
Mr. Doo Wai-Hoi, William — 23,400,000 (1) 156,000,000 (2) 179,400,000 0.77Ms. Ki Man-Fung, Leonie 11,800,000 (3) — — 11,800,000 0.05
11,800,000 23,400,000 156,000,000 191,200,000
Notes:
(1) These debentures were issued in US$ and had been translated into HK$ using the rate of US$1.0=HK$7.8.
(2) These debentures are beneficially owned by a company which is wholly owned by Mr. Doo Wai-Hoi, William and were issued in US$ and had been translated into HK$ using the rate of US$1.0=HK$7.8.
(3) This amount includes HK$7,800,000 debentures which were issued in US$ and had been translated into HK$ using the rate of US$1.0=HK$7.8.
Save as disclosed above, as at 30 June 2019, none of the Directors or chief executive had or deemed to have any interest or short positions in the shares, underlying shares and debentures of the Company or any of its associated corporations as defined in the SFO that were required to be entered into the register kept by the Company pursuant to Section 352 of the SFO or were required to be notified to the Company and the Stock Exchange pursuant to the Model Code for Securities Transactions by Directors of Listed Issuers.
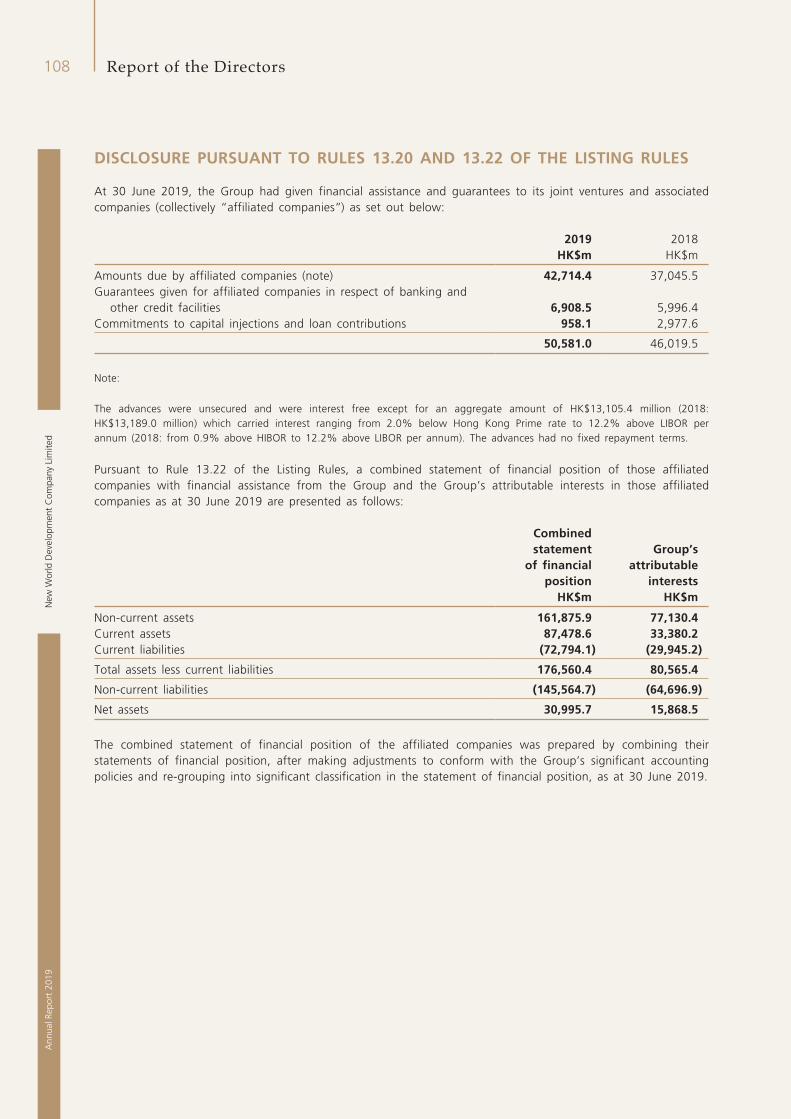
New
Wor
ld D
evel
opm
ent
Com
pany
Lim
ited
108A
nnua
l Rep
ort
2019
Report of the Directors
DISCLOSURE PURSUANT TO RULES 13.20 AND 13.22 OF THE LISTING RULES
At 30 June 2019, the Group had given financial assistance and guarantees to its joint ventures and associated companies (collectively “affiliated companies”) as set out below:
2019 2018HK$m HK$m
Amounts due by affiliated companies (note) 42,714.4 37,045.5Guarantees given for affiliated companies in respect of banking and
other credit facilities 6,908.5 5,996.4Commitments to capital injections and loan contributions 958.1 2,977.6
50,581.0 46,019.5
Note:
The advances were unsecured and were interest free except for an aggregate amount of HK$13,105.4 million (2018: HK$13,189.0 million) which carried interest ranging from 2.0% below Hong Kong Prime rate to 12.2% above LIBOR per annum (2018: from 0.9% above HIBOR to 12.2% above LIBOR per annum). The advances had no fixed repayment terms.
Pursuant to Rule 13.22 of the Listing Rules, a combined statement of financial position of those affiliated companies with financial assistance from the Group and the Group’s attributable interests in those affiliated companies as at 30 June 2019 are presented as follows:
Combined statement
of financial position
Group’s attributable
interestsHK$m HK$m
Non-current assets 161,875.9 77,130.4Current assets 87,478.6 33,380.2Current liabilities (72,794.1) (29,945.2)
Total assets less current liabilities 176,560.4 80,565.4
Non-current liabilities (145,564.7) (64,696.9)
Net assets 30,995.7 15,868.5
The combined statement of financial position of the affiliated companies was prepared by combining their statements of financial position, after making adjustments to conform with the Group’s significant accounting policies and re-grouping into significant classification in the statement of financial position, as at 30 June 2019.
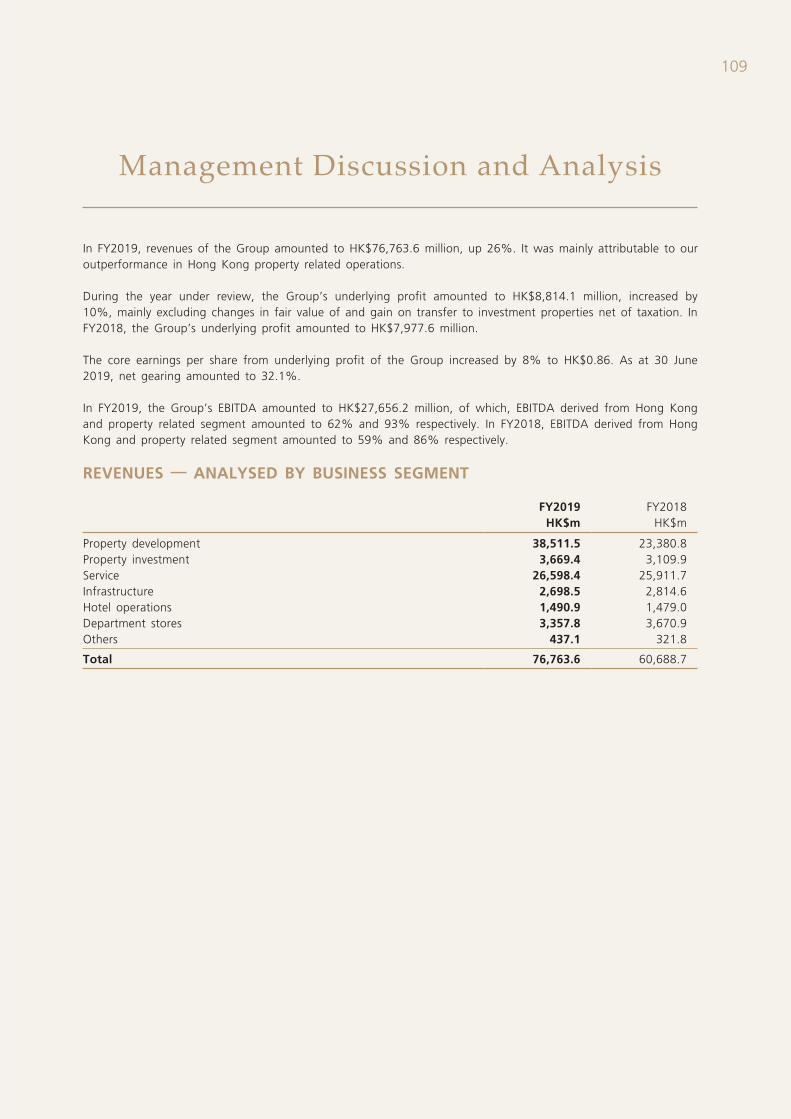
109
Management Discussion and Analysis
In FY2019, revenues of the Group amounted to HK$76,763.6 million, up 26%. It was mainly attributable to our outperformance in Hong Kong property related operations.
During the year under review, the Group’s underlying profit amounted to HK$8,814.1 million, increased by 10%, mainly excluding changes in fair value of and gain on transfer to investment properties net of taxation. In FY2018, the Group’s underlying profit amounted to HK$7,977.6 million.
The core earnings per share from underlying profit of the Group increased by 8% to HK$0.86. As at 30 June 2019, net gearing amounted to 32.1%.
In FY2019, the Group’s EBITDA amounted to HK$27,656.2 million, of which, EBITDA derived from Hong Kong and property related segment amounted to 62% and 93% respectively. In FY2018, EBITDA derived from Hong Kong and property related segment amounted to 59% and 86% respectively.
REVENUES — ANALYSED BY BUSINESS SEGMENT
FY2019 FY2018HK$m HK$m
Property development 38,511.5 23,380.8Property investment 3,669.4 3,109.9Service 26,598.4 25,911.7Infrastructure 2,698.5 2,814.6Hotel operations 1,490.9 1,479.0Department stores 3,357.8 3,670.9Others 437.1 321.8
Total 76,763.6 60,688.7
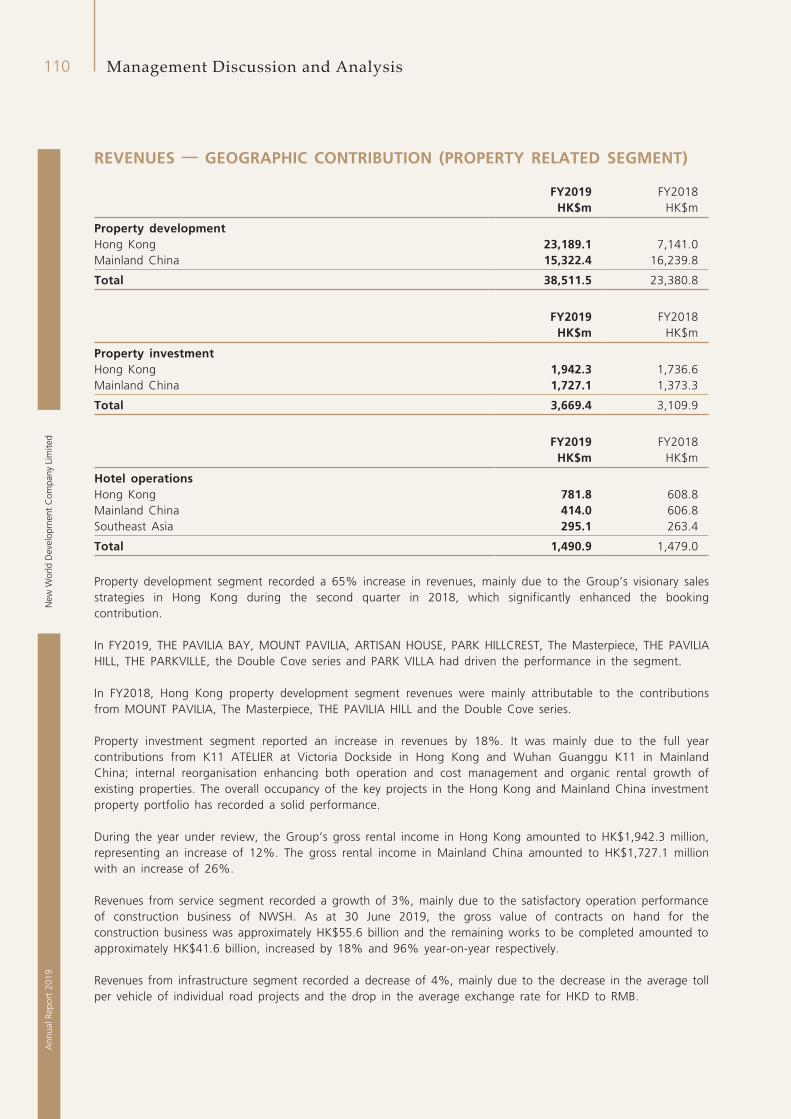
New
Wor
ld D
evel
opm
ent
Com
pany
Lim
ited
110A
nnua
l Rep
ort
2019
Management Discussion and Analysis
REVENUES — GEOGRAPHIC CONTRIBUTION (PROPERTY RELATED SEGMENT)
FY2019 FY2018HK$m HK$m
Property developmentHong Kong 23,189.1 7,141.0Mainland China 15,322.4 16,239.8
Total 38,511.5 23,380.8
FY2019 FY2018HK$m HK$m
Property investmentHong Kong 1,942.3 1,736.6Mainland China 1,727.1 1,373.3
Total 3,669.4 3,109.9
FY2019 FY2018HK$m HK$m
Hotel operationsHong Kong 781.8 608.8Mainland China 414.0 606.8Southeast Asia 295.1 263.4
Total 1,490.9 1,479.0
Property development segment recorded a 65% increase in revenues, mainly due to the Group’s visionary sales strategies in Hong Kong during the second quarter in 2018, which significantly enhanced the booking contribution.
In FY2019, THE PAVILIA BAY, MOUNT PAVILIA, ARTISAN HOUSE, PARK HILLCREST, The Masterpiece, THE PAVILIA HILL, THE PARKVILLE, the Double Cove series and PARK VILLA had driven the performance in the segment.
In FY2018, Hong Kong property development segment revenues were mainly attributable to the contributions from MOUNT PAVILIA, The Masterpiece, THE PAVILIA HILL and the Double Cove series.
Property investment segment reported an increase in revenues by 18%. It was mainly due to the full year contributions from K11 ATELIER at Victoria Dockside in Hong Kong and Wuhan Guanggu K11 in Mainland China; internal reorganisation enhancing both operation and cost management and organic rental growth of existing properties. The overall occupancy of the key projects in the Hong Kong and Mainland China investment property portfolio has recorded a solid performance.
During the year under review, the Group’s gross rental income in Hong Kong amounted to HK$1,942.3 million, representing an increase of 12%. The gross rental income in Mainland China amounted to HK$1,727.1 million with an increase of 26%.
Revenues from service segment recorded a growth of 3%, mainly due to the satisfactory operation performance of construction business of NWSH. As at 30 June 2019, the gross value of contracts on hand for the construction business was approximately HK$55.6 billion and the remaining works to be completed amounted to approximately HK$41.6 billion, increased by 18% and 96% year-on-year respectively.
Revenues from infrastructure segment recorded a decrease of 4%, mainly due to the decrease in the average toll per vehicle of individual road projects and the drop in the average exchange rate for HKD to RMB.
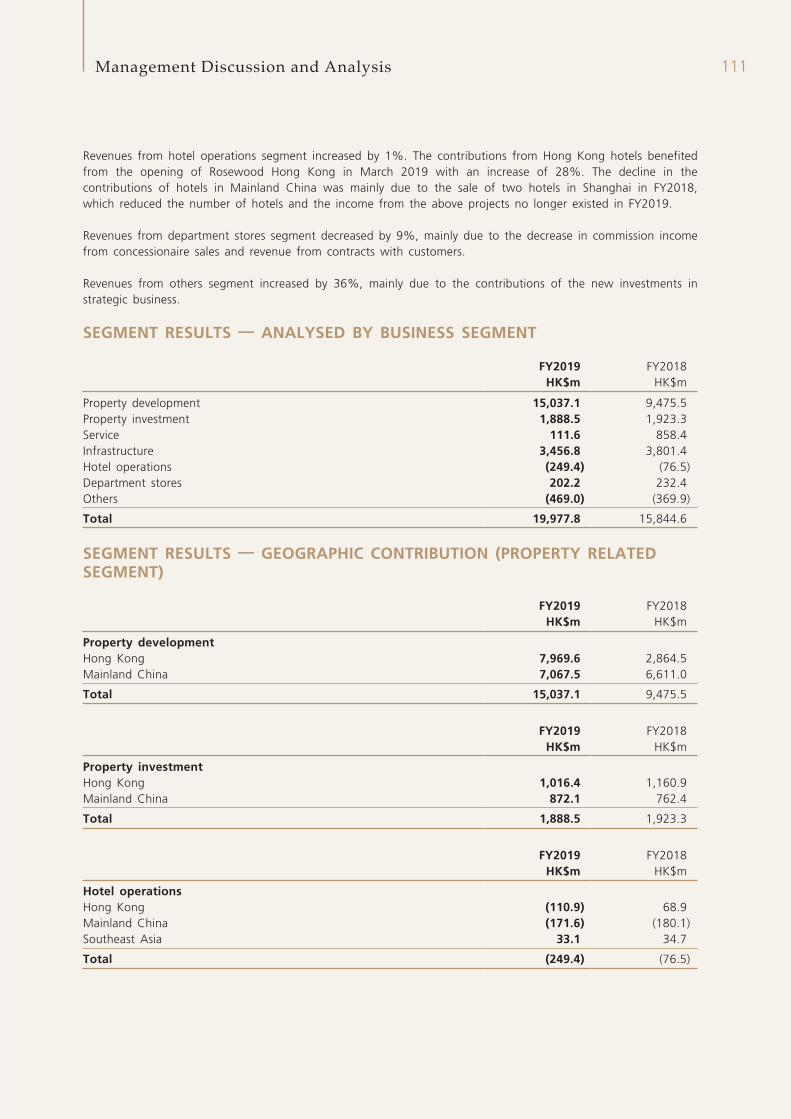
111Management Discussion and Analysis
Revenues from hotel operations segment increased by 1%. The contributions from Hong Kong hotels benefited from the opening of Rosewood Hong Kong in March 2019 with an increase of 28%. The decline in the contributions of hotels in Mainland China was mainly due to the sale of two hotels in Shanghai in FY2018, which reduced the number of hotels and the income from the above projects no longer existed in FY2019.
Revenues from department stores segment decreased by 9%, mainly due to the decrease in commission income from concessionaire sales and revenue from contracts with customers.
Revenues from others segment increased by 36%, mainly due to the contributions of the new investments in strategic business.
SEGMENT RESULTS — ANALYSED BY BUSINESS SEGMENT
FY2019 FY2018HK$m HK$m
Property development 15,037.1 9,475.5Property investment 1,888.5 1,923.3Service 111.6 858.4Infrastructure 3,456.8 3,801.4Hotel operations (249.4) (76.5)Department stores 202.2 232.4Others (469.0) (369.9)
Total 19,977.8 15,844.6
SEGMENT RESULTS — GEOGRAPHIC CONTRIBUTION (PROPERTY RELATED SEGMENT)
FY2019 FY2018HK$m HK$m
Property developmentHong Kong 7,969.6 2,864.5Mainland China 7,067.5 6,611.0
Total 15,037.1 9,475.5
FY2019 FY2018HK$m HK$m
Property investmentHong Kong 1,016.4 1,160.9Mainland China 872.1 762.4
Total 1,888.5 1,923.3
FY2019 FY2018HK$m HK$m
Hotel operationsHong Kong (110.9) 68.9Mainland China (171.6) (180.1)Southeast Asia 33.1 34.7
Total (249.4) (76.5)
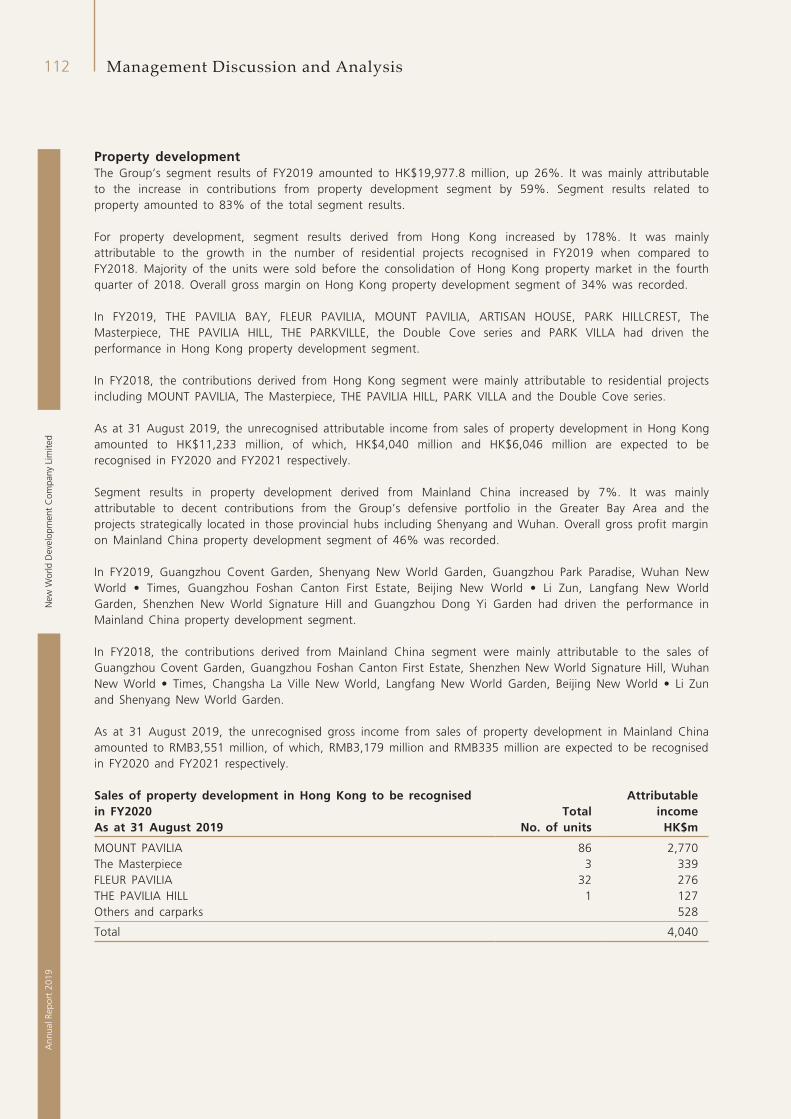
New
Wor
ld D
evel
opm
ent
Com
pany
Lim
ited
112A
nnua
l Rep
ort
2019
Management Discussion and Analysis
Property developmentThe Group’s segment results of FY2019 amounted to HK$19,977.8 million, up 26%. It was mainly attributable to the increase in contributions from property development segment by 59%. Segment results related to property amounted to 83% of the total segment results.
For property development, segment results derived from Hong Kong increased by 178%. It was mainly attributable to the growth in the number of residential projects recognised in FY2019 when compared to FY2018. Majority of the units were sold before the consolidation of Hong Kong property market in the fourth quarter of 2018. Overall gross margin on Hong Kong property development segment of 34% was recorded.
In FY2019, THE PAVILIA BAY, FLEUR PAVILIA, MOUNT PAVILIA, ARTISAN HOUSE, PARK HILLCREST, The Masterpiece, THE PAVILIA HILL, THE PARKVILLE, the Double Cove series and PARK VILLA had driven the performance in Hong Kong property development segment.
In FY2018, the contributions derived from Hong Kong segment were mainly attributable to residential projects including MOUNT PAVILIA, The Masterpiece, THE PAVILIA HILL, PARK VILLA and the Double Cove series.
As at 31 August 2019, the unrecognised attributable income from sales of property development in Hong Kong amounted to HK$11,233 million, of which, HK$4,040 million and HK$6,046 million are expected to be recognised in FY2020 and FY2021 respectively.
Segment results in property development derived from Mainland China increased by 7%. It was mainly attributable to decent contributions from the Group’s defensive portfolio in the Greater Bay Area and the projects strategically located in those provincial hubs including Shenyang and Wuhan. Overall gross profit margin on Mainland China property development segment of 46% was recorded.
In FY2019, Guangzhou Covent Garden, Shenyang New World Garden, Guangzhou Park Paradise, Wuhan New World • Times, Guangzhou Foshan Canton First Estate, Beijing New World • Li Zun, Langfang New World Garden, Shenzhen New World Signature Hill and Guangzhou Dong Yi Garden had driven the performance in Mainland China property development segment.
In FY2018, the contributions derived from Mainland China segment were mainly attributable to the sales of Guangzhou Covent Garden, Guangzhou Foshan Canton First Estate, Shenzhen New World Signature Hill, Wuhan New World • Times, Changsha La Ville New World, Langfang New World Garden, Beijing New World • Li Zun and Shenyang New World Garden.
As at 31 August 2019, the unrecognised gross income from sales of property development in Mainland China amounted to RMB3,551 million, of which, RMB3,179 million and RMB335 million are expected to be recognised in FY2020 and FY2021 respectively.
Sales of property development in Hong Kong to be recognised in FY2020 Total
No. of units
Attributableincome
As at 31 August 2019 HK$m
MOUNT PAVILIA 86 2,770The Masterpiece 3 339FLEUR PAVILIA 32 276THE PAVILIA HILL 1 127Others and carparks 528
Total 4,040
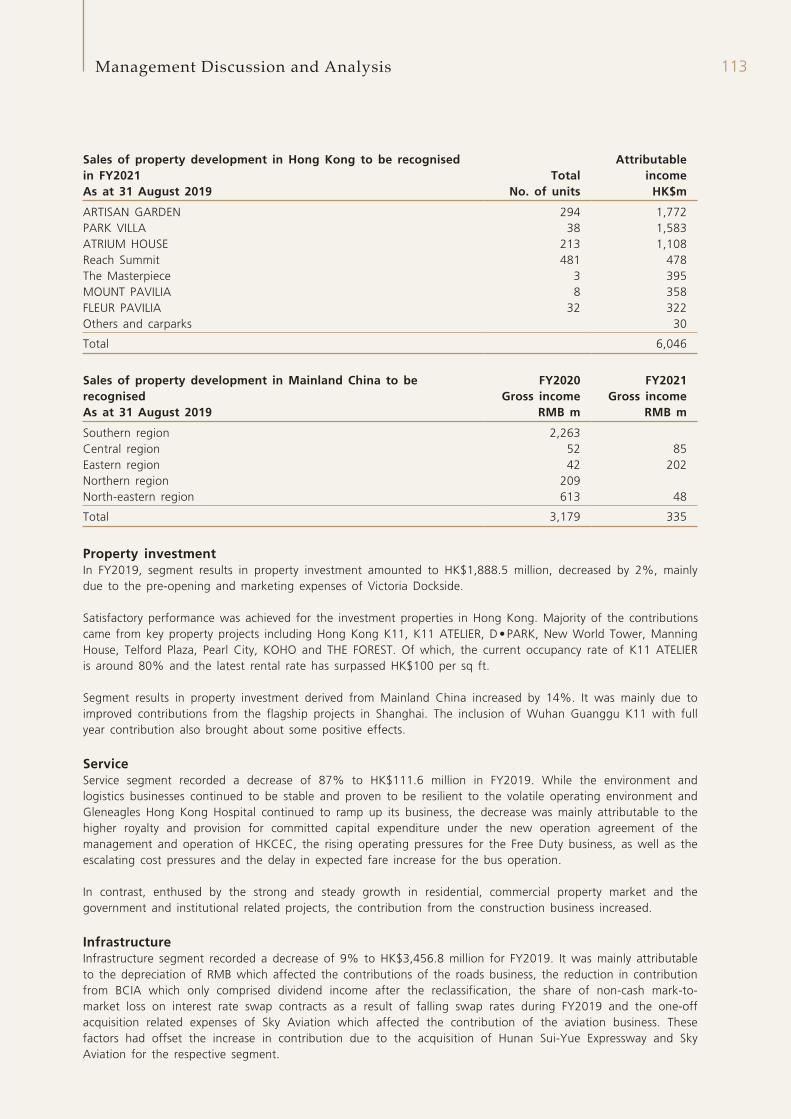
113Management Discussion and Analysis
Sales of property development in Hong Kong to be recognised in FY2021 Total
No. of units
Attributableincome
As at 31 August 2019 HK$m
ARTISAN GARDEN 294 1,772PARK VILLA 38 1,583ATRIUM HOUSE 213 1,108Reach Summit 481 478The Masterpiece 3 395MOUNT PAVILIA 8 358FLEUR PAVILIA 32 322Others and carparks 30
Total 6,046
Sales of property development in Mainland China to be recognised
FY2020 FY2021Gross income Gross income
As at 31 August 2019 RMB m RMB m
Southern region 2,263Central region 52 85Eastern region 42 202Northern region 209North-eastern region 613 48
Total 3,179 335
Property investmentIn FY2019, segment results in property investment amounted to HK$1,888.5 million, decreased by 2%, mainly due to the pre-opening and marketing expenses of Victoria Dockside.
Satisfactory performance was achieved for the investment properties in Hong Kong. Majority of the contributions came from key property projects including Hong Kong K11, K11 ATELIER, D•PARK, New World Tower, Manning House, Telford Plaza, Pearl City, KOHO and THE FOREST. Of which, the current occupancy rate of K11 ATELIER is around 80% and the latest rental rate has surpassed HK$100 per sq ft.
Segment results in property investment derived from Mainland China increased by 14%. It was mainly due to improved contributions from the flagship projects in Shanghai. The inclusion of Wuhan Guanggu K11 with full year contribution also brought about some positive effects.
ServiceService segment recorded a decrease of 87% to HK$111.6 million in FY2019. While the environment and logistics businesses continued to be stable and proven to be resilient to the volatile operating environment and Gleneagles Hong Kong Hospital continued to ramp up its business, the decrease was mainly attributable to the higher royalty and provision for committed capital expenditure under the new operation agreement of the management and operation of HKCEC, the rising operating pressures for the Free Duty business, as well as the escalating cost pressures and the delay in expected fare increase for the bus operation.
In contrast, enthused by the strong and steady growth in residential, commercial property market and the government and institutional related projects, the contribution from the construction business increased.
InfrastructureInfrastructure segment recorded a decrease of 9% to HK$3,456.8 million for FY2019. It was mainly attributable to the depreciation of RMB which affected the contributions of the roads business, the reduction in contribution from BCIA which only comprised dividend income after the reclassification, the share of non-cash mark-to-market loss on interest rate swap contracts as a result of falling swap rates during FY2019 and the one-off acquisition related expenses of Sky Aviation which affected the contribution of the aviation business. These factors had offset the increase in contribution due to the acquisition of Hunan Sui-Yue Expressway and Sky Aviation for the respective segment.
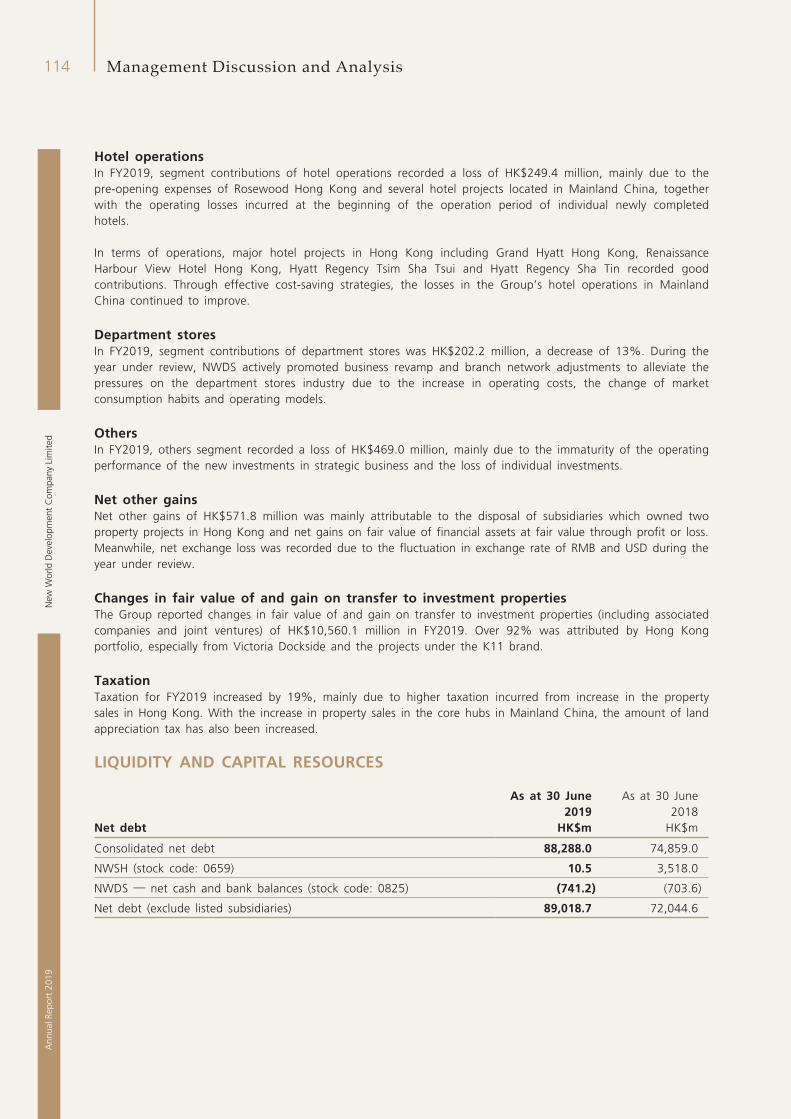
New
Wor
ld D
evel
opm
ent
Com
pany
Lim
ited
114A
nnua
l Rep
ort
2019
Management Discussion and Analysis
Hotel operationsIn FY2019, segment contributions of hotel operations recorded a loss of HK$249.4 million, mainly due to the pre-opening expenses of Rosewood Hong Kong and several hotel projects located in Mainland China, together with the operating losses incurred at the beginning of the operation period of individual newly completed hotels.
In terms of operations, major hotel projects in Hong Kong including Grand Hyatt Hong Kong, Renaissance Harbour View Hotel Hong Kong, Hyatt Regency Tsim Sha Tsui and Hyatt Regency Sha Tin recorded good contributions. Through effective cost-saving strategies, the losses in the Group’s hotel operations in Mainland China continued to improve.
Department storesIn FY2019, segment contributions of department stores was HK$202.2 million, a decrease of 13%. During the year under review, NWDS actively promoted business revamp and branch network adjustments to alleviate the pressures on the department stores industry due to the increase in operating costs, the change of market consumption habits and operating models.
OthersIn FY2019, others segment recorded a loss of HK$469.0 million, mainly due to the immaturity of the operating performance of the new investments in strategic business and the loss of individual investments.
Net other gainsNet other gains of HK$571.8 million was mainly attributable to the disposal of subsidiaries which owned two property projects in Hong Kong and net gains on fair value of financial assets at fair value through profit or loss. Meanwhile, net exchange loss was recorded due to the fluctuation in exchange rate of RMB and USD during the year under review.
Changes in fair value of and gain on transfer to investment propertiesThe Group reported changes in fair value of and gain on transfer to investment properties (including associated companies and joint ventures) of HK$10,560.1 million in FY2019. Over 92% was attributed by Hong Kong portfolio, especially from Victoria Dockside and the projects under the K11 brand.
TaxationTaxation for FY2019 increased by 19%, mainly due to higher taxation incurred from increase in the property sales in Hong Kong. With the increase in property sales in the core hubs in Mainland China, the amount of land appreciation tax has also been increased.
LIQUIDITY AND CAPITAL RESOURCES
As at 30 June 2019
As at 30 June 2018
Net debt HK$m HK$m
Consolidated net debt 88,288.0 74,859.0
NWSH (stock code: 0659) 10.5 3,518.0
NWDS — net cash and bank balances (stock code: 0825) (741.2) (703.6)
Net debt (exclude listed subsidiaries) 89,018.7 72,044.6
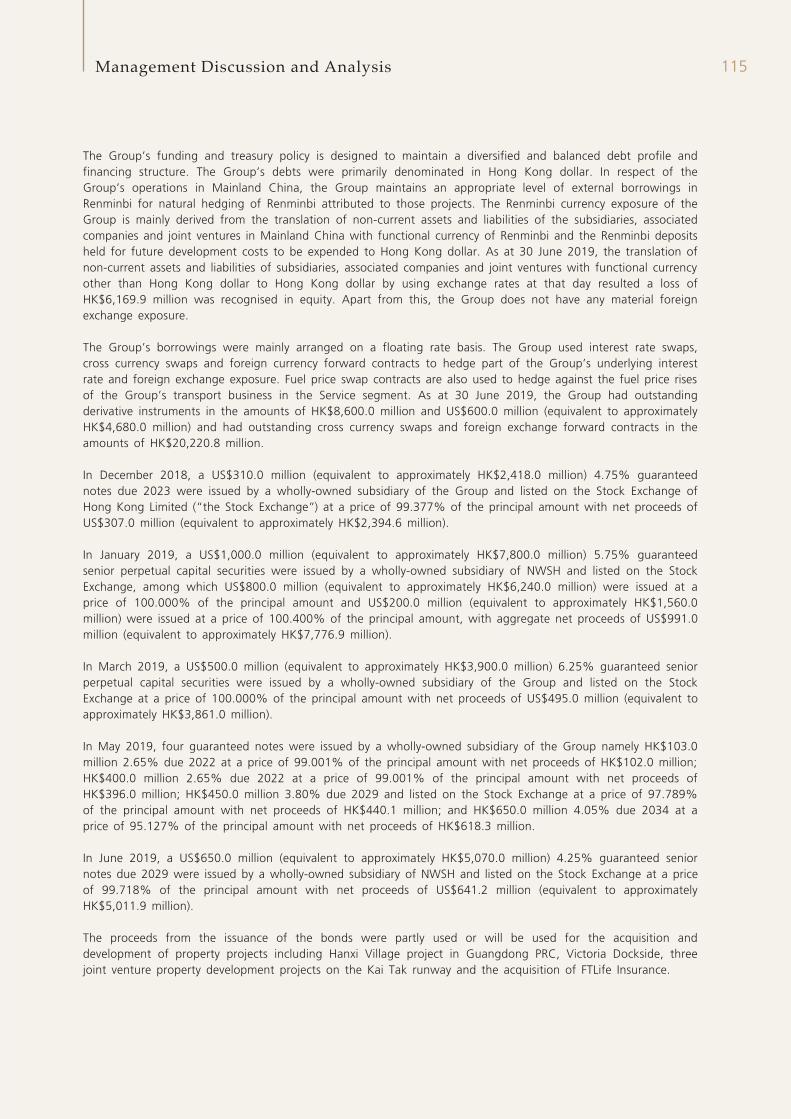
115Management Discussion and Analysis
The Group’s funding and treasury policy is designed to maintain a diversified and balanced debt profile and financing structure. The Group’s debts were primarily denominated in Hong Kong dollar. In respect of the Group’s operations in Mainland China, the Group maintains an appropriate level of external borrowings in Renminbi for natural hedging of Renminbi attributed to those projects. The Renminbi currency exposure of the Group is mainly derived from the translation of non-current assets and liabilities of the subsidiaries, associated companies and joint ventures in Mainland China with functional currency of Renminbi and the Renminbi deposits held for future development costs to be expended to Hong Kong dollar. As at 30 June 2019, the translation of non-current assets and liabilities of subsidiaries, associated companies and joint ventures with functional currency other than Hong Kong dollar to Hong Kong dollar by using exchange rates at that day resulted a loss of HK$6,169.9 million was recognised in equity. Apart from this, the Group does not have any material foreign exchange exposure.
The Group’s borrowings were mainly arranged on a floating rate basis. The Group used interest rate swaps, cross currency swaps and foreign currency forward contracts to hedge part of the Group’s underlying interest rate and foreign exchange exposure. Fuel price swap contracts are also used to hedge against the fuel price rises of the Group’s transport business in the Service segment. As at 30 June 2019, the Group had outstanding derivative instruments in the amounts of HK$8,600.0 million and US$600.0 million (equivalent to approximately HK$4,680.0 million) and had outstanding cross currency swaps and foreign exchange forward contracts in the amounts of HK$20,220.8 million.
In December 2018, a US$310.0 million (equivalent to approximately HK$2,418.0 million) 4.75% guaranteed notes due 2023 were issued by a wholly-owned subsidiary of the Group and listed on the Stock Exchange of Hong Kong Limited (“the Stock Exchange”) at a price of 99.377% of the principal amount with net proceeds of US$307.0 million (equivalent to approximately HK$2,394.6 million).
In January 2019, a US$1,000.0 million (equivalent to approximately HK$7,800.0 million) 5.75% guaranteed senior perpetual capital securities were issued by a wholly-owned subsidiary of NWSH and listed on the Stock Exchange, among which US$800.0 million (equivalent to approximately HK$6,240.0 million) were issued at a price of 100.000% of the principal amount and US$200.0 million (equivalent to approximately HK$1,560.0 million) were issued at a price of 100.400% of the principal amount, with aggregate net proceeds of US$991.0 million (equivalent to approximately HK$7,776.9 million).
In March 2019, a US$500.0 million (equivalent to approximately HK$3,900.0 million) 6.25% guaranteed senior perpetual capital securities were issued by a wholly-owned subsidiary of the Group and listed on the Stock Exchange at a price of 100.000% of the principal amount with net proceeds of US$495.0 million (equivalent to approximately HK$3,861.0 million).
In May 2019, four guaranteed notes were issued by a wholly-owned subsidiary of the Group namely HK$103.0 million 2.65% due 2022 at a price of 99.001% of the principal amount with net proceeds of HK$102.0 million; HK$400.0 million 2.65% due 2022 at a price of 99.001% of the principal amount with net proceeds of HK$396.0 million; HK$450.0 million 3.80% due 2029 and listed on the Stock Exchange at a price of 97.789% of the principal amount with net proceeds of HK$440.1 million; and HK$650.0 million 4.05% due 2034 at a price of 95.127% of the principal amount with net proceeds of HK$618.3 million.
In June 2019, a US$650.0 million (equivalent to approximately HK$5,070.0 million) 4.25% guaranteed senior notes due 2029 were issued by a wholly-owned subsidiary of NWSH and listed on the Stock Exchange at a price of 99.718% of the principal amount with net proceeds of US$641.2 million (equivalent to approximately HK$5,011.9 million).
The proceeds from the issuance of the bonds were partly used or will be used for the acquisition and development of property projects including Hanxi Village project in Guangdong PRC, Victoria Dockside, three joint venture property development projects on the Kai Tak runway and the acquisition of FTLife Insurance.
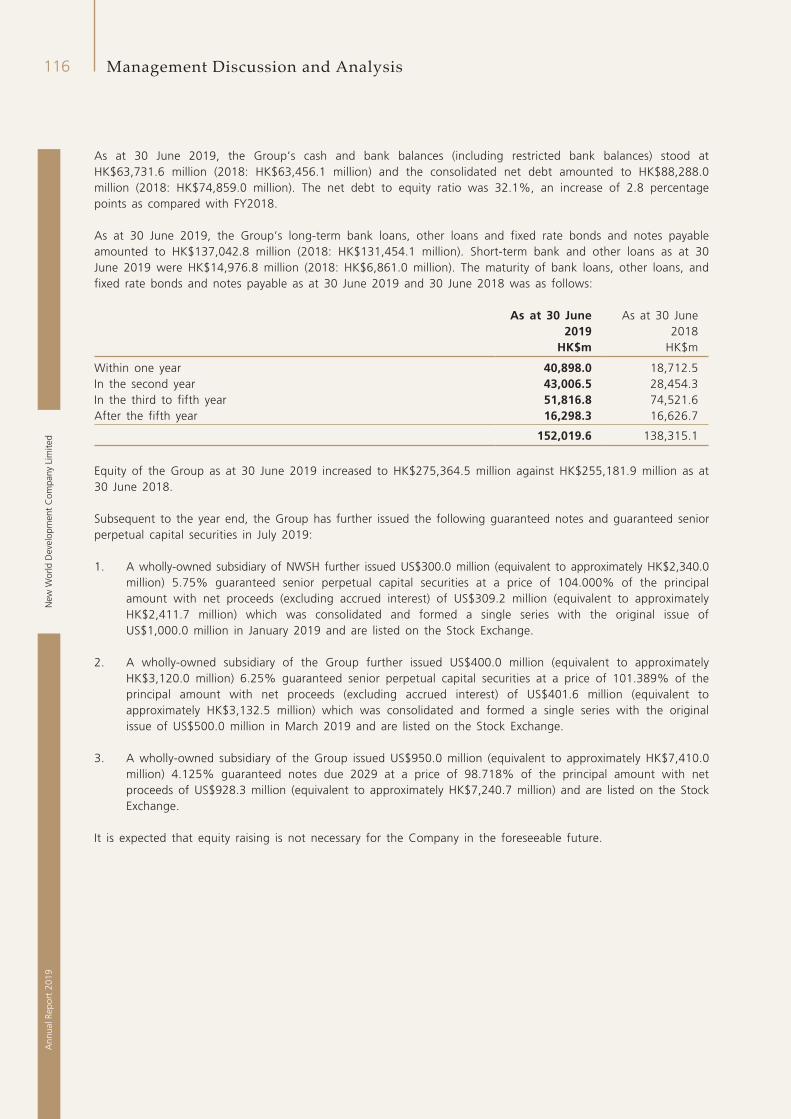
New
Wor
ld D
evel
opm
ent
Com
pany
Lim
ited
116A
nnua
l Rep
ort
2019
Management Discussion and Analysis
As at 30 June 2019, the Group’s cash and bank balances (including restricted bank balances) stood at HK$63,731.6 million (2018: HK$63,456.1 million) and the consolidated net debt amounted to HK$88,288.0 million (2018: HK$74,859.0 million). The net debt to equity ratio was 32.1%, an increase of 2.8 percentage points as compared with FY2018.
As at 30 June 2019, the Group’s long-term bank loans, other loans and fixed rate bonds and notes payable amounted to HK$137,042.8 million (2018: HK$131,454.1 million). Short-term bank and other loans as at 30 June 2019 were HK$14,976.8 million (2018: HK$6,861.0 million). The maturity of bank loans, other loans, and fixed rate bonds and notes payable as at 30 June 2019 and 30 June 2018 was as follows:
As at 30 June 2019
As at 30 June 2018
HK$m HK$m
Within one year 40,898.0 18,712.5In the second year 43,006.5 28,454.3In the third to fifth year 51,816.8 74,521.6After the fifth year 16,298.3 16,626.7
152,019.6 138,315.1
Equity of the Group as at 30 June 2019 increased to HK$275,364.5 million against HK$255,181.9 million as at 30 June 2018.
Subsequent to the year end, the Group has further issued the following guaranteed notes and guaranteed senior perpetual capital securities in July 2019:
1. A wholly-owned subsidiary of NWSH further issued US$300.0 million (equivalent to approximately HK$2,340.0 million) 5.75% guaranteed senior perpetual capital securities at a price of 104.000% of the principal amount with net proceeds (excluding accrued interest) of US$309.2 million (equivalent to approximately HK$2,411.7 million) which was consolidated and formed a single series with the original issue of US$1,000.0 million in January 2019 and are listed on the Stock Exchange.
2. A wholly-owned subsidiary of the Group further issued US$400.0 million (equivalent to approximately HK$3,120.0 million) 6.25% guaranteed senior perpetual capital securities at a price of 101.389% of the principal amount with net proceeds (excluding accrued interest) of US$401.6 million (equivalent to approximately HK$3,132.5 million) which was consolidated and formed a single series with the original issue of US$500.0 million in March 2019 and are listed on the Stock Exchange.
3. A wholly-owned subsidiary of the Group issued US$950.0 million (equivalent to approximately HK$7,410.0 million) 4.125% guaranteed notes due 2029 at a price of 98.718% of the principal amount with net proceeds of US$928.3 million (equivalent to approximately HK$7,240.7 million) and are listed on the Stock Exchange.
It is expected that equity raising is not necessary for the Company in the foreseeable future.
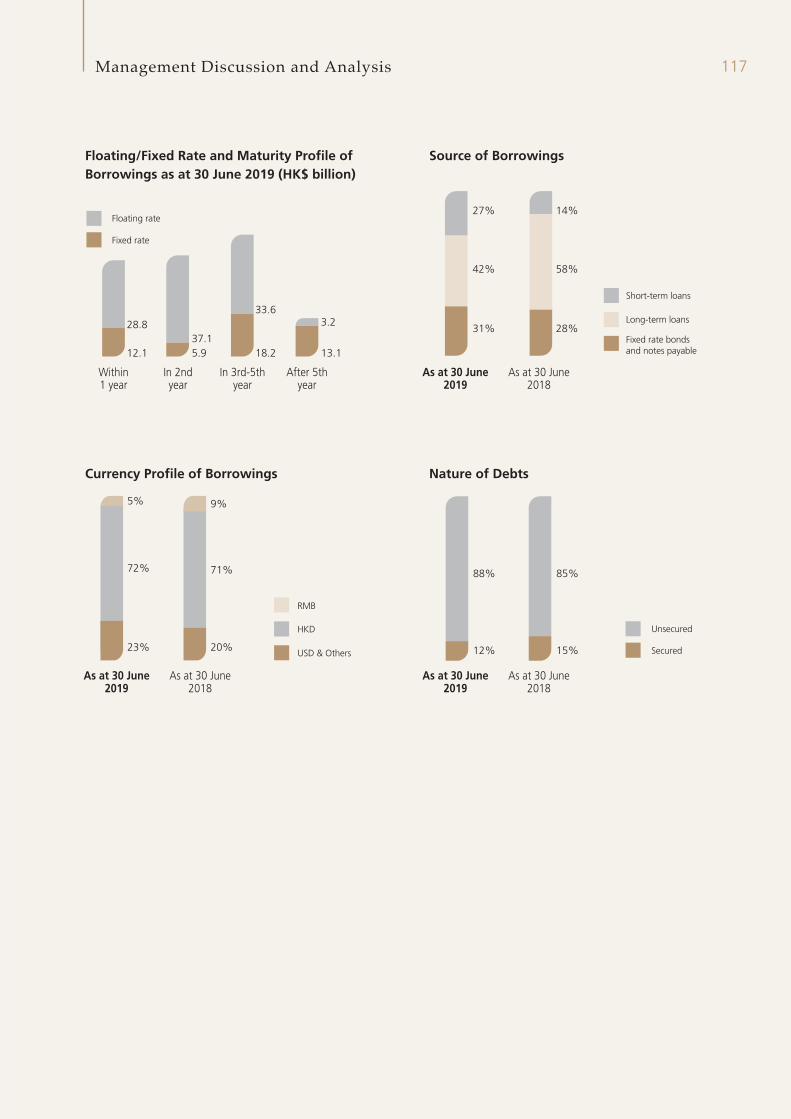
117Management Discussion and Analysis
Floating/Fixed Rate and Maturity Profile ofBorrowings as at 30 June 2019 (HK$ billion)
28.8
12.137.15.9
33.6
18.2 13.1
3.2
Currency Profile of Borrowings
9%
20%
5%
23%
Source of Borrowings
27% 14%
58%
28%
42%
31%
Nature of Debts
88% 85%
15%12%
As at 30 June2019
Within1 year
After 5thyear
In 3rd-5thyear
In 2ndyear
As at 30 June2018
As at 30 June2019
As at 30 June2018
As at 30 June2019
As at 30 June2018
Floating rate
Fixed rate
Unsecured
Secured
RMB
HKD
USD & Others
Short-term loans
Long-term loans
Fixed rate bonds and notes payable
71%72%
New
Wor
ld D
evel
opm
ent
Com
pany
Lim
ited
118A
nnua
l Rep
ort
2019
Independent Auditor ’s Report
INDEPENDENT AUDITOR’S REPORTTO THE MEMBERS OF NEW WORLD DEVELOPMENT COMPANY LIMITED(incorporated in Hong Kong with limited liability)
OPINION
What we have auditedThe consolidated financial statements of New World Development Company Limited (the “Company”) and its subsidiaries (the “Group”) set out on pages 124 to 239, which comprise:
• the consolidated statement of financial position as at 30 June 2019;
• the consolidated income statement for the year then ended;
• the consolidated statement of comprehensive income for the year then ended;
• the consolidated statement of changes in equity for the year then ended;
• the consolidated statement of cash flows for the year then ended; and
• the notes to the consolidated financial statements, which include a summary of significant accounting policies.
Our opinionIn our opinion, the consolidated financial statements give a true and fair view of the consolidated financial position of the Group as at 30 June 2019, and of its consolidated financial performance and its consolidated cash flows for the year then ended in accordance with Hong Kong Financial Reporting Standards (“HKFRSs”) issued by the Hong Kong Institute of Certified Public Accountants (“HKICPA”) and have been properly prepared in compliance with the Hong Kong Companies Ordinance.
BASIS FOR OPINION
We conducted our audit in accordance with Hong Kong Standards on Auditing (“HKSAs”) issued by the HKICPA. Our responsibilities under those standards are further described in the Auditor’s Responsibilities for the Audit of the Consolidated Financial Statements section of our report.
We believe that the audit evidence we have obtained is sufficient and appropriate to provide a basis for our opinion.
IndependenceWe are independent of the Group in accordance with the HKICPA’s Code of Ethics for Professional Accountants (“the Code”), and we have fulfilled our other ethical responsibilities in accordance with the Code.
119Independent Auditor ’s Report
KEY AUDIT MATTERS
Key audit matters are those matters that, in our professional judgement, were of most significance in our audit of the consolidated financial statements of the current period. These matters were addressed in the context of our audit of the consolidated financial statements as a whole, and in forming our opinion thereon, and we do not provide a separate opinion on these matters.
Key audit matters identified in our audit are summarised as follows:
• Valuation of investment properties held by the Group and its joint ventures and associated companies;
• Recoverability of properties for/under development and properties held for sale held by the Group and its joint ventures; and
• Impairment of the Group’s interests in joint ventures and associated companies.
Key Audit Matter How our audit addressed the Key Audit Matter
Valuation of investment properties held by the Group and its joint ventures and associated companies
Refer to notes 6(b), 7 and 17 to the consolidated financial statements.
Our procedures in relation to the valuation of investment properties included:
• We assessed the competence, capability and objectivity of the independent external valuers;
• We obtained the valuation reports and met the independent external valuers to discuss the valuation methodologies and key assumptions;
• We involved our in-house valuation experts and assessed the valuation methodologies and the reasonableness of the key assumptions used in the valuation of investment properties, based on our knowledge of the property industry, research evidence of capitalisation rates, prevailing market rents and comparable market transactions for similar properties, where applicable; and
• We tested, on a sample basis, the data used in the valuation of investment properties, including rental rates from existing tenancies and estimated cost to complete, by agreeing them to the underlying agreements with the tenants and approved budgets, respectively. We also compared the estimated developer’s profit and risk margins to properties with comparable stage of development, where appropriate.
Based on the procedures performed, we found the methodologies used in preparing the valuations were appropriate and the key assumptions were supportable in light of available evidence.
As at 30 June 2019, the investment properties held by the Group and its joint ventures and associated companies were significant to the Group and were stated at fair value. Changes in fair value were recognised in the consolidated income statement.
Independent external valuers were engaged to determine the fair value of investment properties held by the Group and its joint ventures and associated companies as at 30 June 2019.
For completed investment properties, fair value was generally derived by the income capitalisation method and where appropriate, by direct comparison method. Income capitalisation method was based on the capitalisation of the net income and reversionary income potent ia l by adopt ing appropr iate capitalisation rates and prevailing market rents. Direct comparison method was based on comparable market transactions, as adjusted by the property-specific qualitative factors.
For investment properties under development, fair value was derived using the residual method by deducting development costs together with developer’s profit and risk margins from the estimated capital value of the proposed development assuming completed as at the date of valuation.
We focused on this area due to the fact that there are significant judgements and estimates involved in the valuation of investment properties.
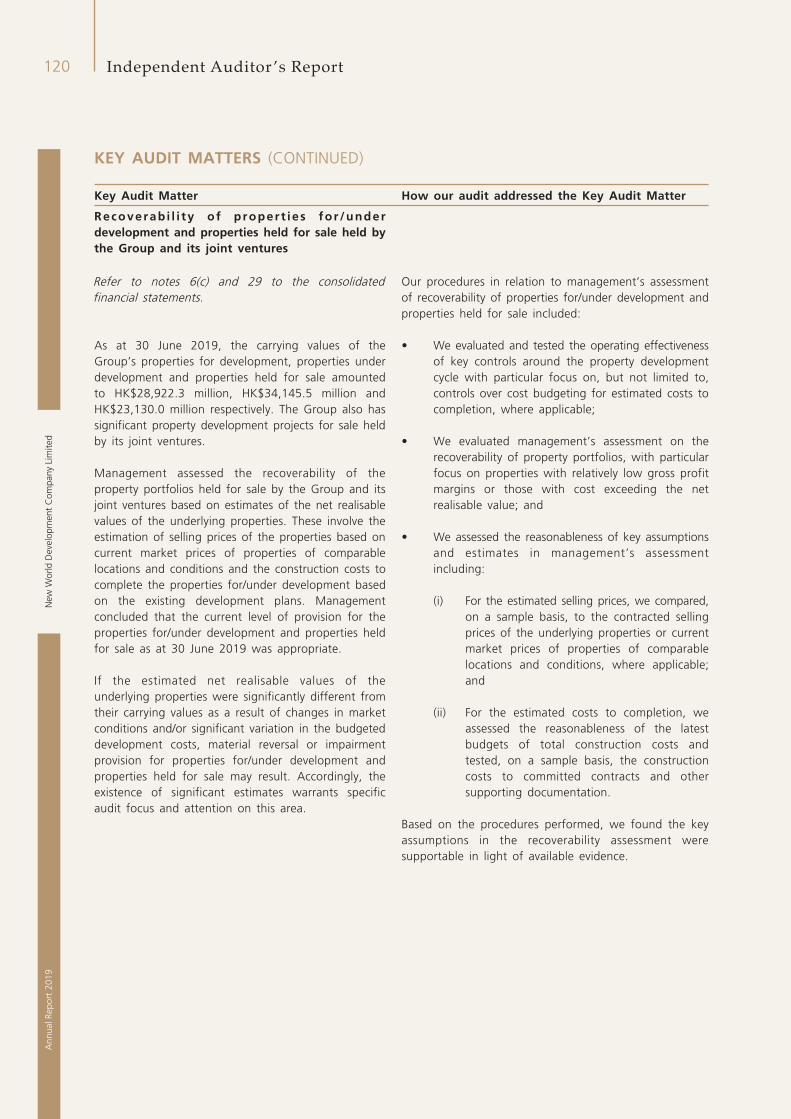
New
Wor
ld D
evel
opm
ent
Com
pany
Lim
ited
120A
nnua
l Rep
ort
2019
Independent Auditor ’s Report
KEY AUDIT MATTERS (CONTINUED)
Key Audit Matter How our audit addressed the Key Audit Matter
Recoverab i l i ty of propert ies for /under development and properties held for sale held by the Group and its joint ventures
Refer to notes 6(c) and 29 to the consolidated financial statements.
Our procedures in relation to management’s assessment of recoverability of properties for/under development and properties held for sale included:
As at 30 June 2019, the carrying values of the Group’s properties for development, properties under development and properties held for sale amounted to HK$28,922.3 million, HK$34,145.5 million and HK$23,130.0 million respectively. The Group also has significant property development projects for sale held by its joint ventures.
Management assessed the recoverability of the property portfolios held for sale by the Group and its joint ventures based on estimates of the net realisable values of the underlying properties. These involve the estimation of selling prices of the properties based on current market prices of properties of comparable locations and conditions and the construction costs to complete the properties for/under development based on the existing development plans. Management concluded that the current level of provision for the properties for/under development and properties held for sale as at 30 June 2019 was appropriate.
If the estimated net realisable values of the underlying properties were significantly different from their carrying values as a result of changes in market conditions and/or significant variation in the budgeted development costs, material reversal or impairment provision for properties for/under development and properties held for sale may result. Accordingly, the existence of significant estimates warrants specific audit focus and attention on this area.
• We evaluated and tested the operating effectiveness of key controls around the property development cycle with particular focus on, but not limited to, controls over cost budgeting for estimated costs to completion, where applicable;
• We evaluated management’s assessment on the recoverability of property portfolios, with particular focus on properties with relatively low gross profit margins or those with cost exceeding the net realisable value; and
• We assessed the reasonableness of key assumptions and estimates in management’s assessment including:
(i) For the estimated selling prices, we compared, on a sample basis, to the contracted selling prices of the underlying properties or current market prices of properties of comparable locations and conditions, where applicable; and
(ii) For the estimated costs to completion, we assessed the reasonableness of the latest budgets of total construction costs and tested, on a sample basis, the construction costs to committed contracts and other supporting documentation.
Based on the procedures performed, we found the key assumptions in the recoverability assessment were supportable in light of available evidence.
121Independent Auditor ’s Report
KEY AUDIT MATTERS (CONTINUED)
Key Audit Matter How our audit addressed the Key Audit Matter
Impairment of the Group’s interests in joint ventures and associated companies
Refer to notes 6(d), 22 and 23 to the consolidated financial statements.
Our procedures in assessing the management’s judgement for the impairment assessments of the Group’s interests in joint ventures and associated companies included:
As at 30 June 2019, the carrying values of the Group’s interests in joint ventures and associated companies amounted to HK$50,865.5 million and HK$25,331.9 million respectively. Management reviewed regularly whether there are any indicators of impairment of the investments by reference to the requirements under HKAS 28 (2011) “Investments in Associates and Joint Ventures” and HKAS 36 “Impairment of Assets”.
For investments where relevant impairment indicators exist, management estimated the recoverable amounts of those investments, being higher of value in use or fair value less costs of disposal. The value in use is determined based on the discounted cash flow projections. Significant judgements are required to determine the key assumptions used in the discounted cash flow models, such as revenue growth, unit price and discount rates. Independent external valuers were also involved in certain value in use assessments, where management considered necessary. Based on the results of these impairment assessments, management concluded that the current level of impairment provision for the Group’s interests in joint ventures and associated companies as at 30 June 2019 was appropriate.
As the impairment assessment involves significant judgements and estimates, we regard this as a key audit matter.
• We evaluated the competence, capabilities and objectivity of the independent external valuers, where applicable;
• With the support of our in-house valuation experts, we assessed the appropriateness of the valuation methodology and the reasonableness of the key assumptions adopted in the cash flow projections;
• We assessed the reasonableness of the discount rates applied by the management in the discounted cash flow models by comparing to external market data and publicly available information;
• We checked the key assumptions to external market data or other supporting evidence, where available; and
• We performed sensitivity analysis on the key assumpt ions adopted in the impairment assessments to understand the impact of reasonable changes in assumptions on the estimated recoverable amounts.
Based on the procedures performed, we found management’s impairment assessments relating to the Group’s interests in joint ventures and associated companies were supported by available evidence.
New
Wor
ld D
evel
opm
ent
Com
pany
Lim
ited
122A
nnua
l Rep
ort
2019
Independent Auditor ’s Report
OTHER INFORMATION
The directors of the Company are responsible for the other information. The other information comprises all of the information included in the annual report other than the consolidated financial statements and our auditor’s report thereon.
Our opinion on the consolidated financial statements does not cover the other information and we do not express any form of assurance conclusion thereon.
In connection with our audit of the consolidated financial statements, our responsibility is to read the other information and, in doing so, consider whether the other information is materially inconsistent with the consolidated financial statements or our knowledge obtained in the audit or otherwise appears to be materially misstated.
If, based on the work we have performed, we conclude that there is a material misstatement of this other information, we are required to report that fact. We have nothing to report in this regard.
RESPONSIBILITIES OF DIRECTORS AND THE AUDIT COMMITTEE FOR THE CONSOLIDATED FINANCIAL STATEMENTS
The directors of the Company are responsible for the preparation of the consolidated financial statements that give a true and fair view in accordance with HKFRSs issued by the HKICPA and the Hong Kong Companies Ordinance, and for such internal control as the directors determine is necessary to enable the preparation of consolidated financial statements that are free from material misstatement, whether due to fraud or error.
In preparing the consolidated financial statements, the directors are responsible for assessing the Group’s ability to continue as a going concern, disclosing, as applicable, matters related to going concern and using the going concern basis of accounting unless the directors either intend to liquidate the Group or to cease operations, or have no realistic alternative but to do so.
The Audit Committee is responsible for overseeing the Group’s financial reporting process.
AUDITOR’S RESPONSIBILITIES FOR THE AUDIT OF THE CONSOLIDATED FINANCIAL STATEMENTS
Our objectives are to obtain reasonable assurance about whether the consolidated financial statements as a whole are free from material misstatement, whether due to fraud or error, and to issue an auditor’s report that includes our opinion. We report our opinion solely to you, as a body, in accordance with Section 405 of the Hong Kong Companies Ordinance and for no other purpose. We do not assume responsibility towards or accept liability to any other person for the contents of this report. Reasonable assurance is a high level of assurance, but is not a guarantee that an audit conducted in accordance with HKSAs will always detect a material misstatement when it exists. Misstatements can arise from fraud or error and are considered material if, individually or in the aggregate, they could reasonably be expected to influence the economic decisions of users taken on the basis of these consolidated financial statements.
As part of an audit in accordance with HKSAs, we exercise professional judgement and maintain professional scepticism throughout the audit. We also:
• Identify and assess the risks of material misstatement of the consolidated financial statements, whether due to fraud or error, design and perform audit procedures responsive to those risks, and obtain audit evidence that is sufficient and appropriate to provide a basis for our opinion. The risk of not detecting a material misstatement resulting from fraud is higher than for one resulting from error, as fraud may involve collusion, forgery, intentional omissions, misrepresentations, or the override of internal control.
123Independent Auditor ’s Report
AUDITOR’S RESPONSIBILITIES FOR THE AUDIT OF THE CONSOLIDATED FINANCIAL STATEMENTS (CONTINUED)
• Obtain an understanding of internal control relevant to the audit in order to design audit procedures that are appropriate in the circumstances, but not for the purpose of expressing an opinion on the effectiveness of the Group’s internal control.
• Evaluate the appropriateness of accounting policies used and the reasonableness of accounting estimates and related disclosures made by the directors.
• Conclude on the appropriateness of the directors’ use of the going concern basis of accounting and, based on the audit evidence obtained, whether a material uncertainty exists related to events or conditions that may cast significant doubt on the Group’s ability to continue as a going concern. If we conclude that a material uncertainty exists, we are required to draw attention in our auditor’s report to the related disclosures in the consolidated financial statements or, if such disclosures are inadequate, to modify our opinion. Our conclusions are based on the audit evidence obtained up to the date of our auditor’s report. However, future events or conditions may cause the Group to cease to continue as a going concern.
• Evaluate the overall presentation, structure and content of the consolidated financial statements, including the disclosures, and whether the consolidated financial statements represent the underlying transactions and events in a manner that achieves fair presentation.
• Obtain sufficient appropriate audit evidence regarding the financial information of the entities or business activities within the Group to express an opinion on the consolidated financial statements. We are responsible for the direction, supervision and performance of the group audit. We remain solely responsible for our audit opinion.
We communicate with the Audit Committee regarding, among other matters, the planned scope and timing of the audit and significant audit findings, including any significant deficiencies in internal control that we identify during our audit.
We also provide the Audit Committee with a statement that we have complied with relevant ethical requirements regarding independence, and to communicate with them all relationships and other matters that may reasonably be thought to bear on our independence, and where applicable, related safeguards.
From the matters communicated with the Audit Committee, we determine those matters that were of most significance in the audit of the consolidated financial statements of the current period and are therefore the key audit matters. We describe these matters in our auditor’s report unless law or regulation precludes public disclosure about the matter or when, in extremely rare circumstances, we determine that a matter should not be communicated in our report because the adverse consequences of doing so would reasonably be expected to outweigh the public interest benefits of such communication.
The engagement partner on the audit resulting in this independent auditor’s report is Mr. Ho Chi Keung.
PricewaterhouseCoopersCertified Public Accountants
Hong Kong, 25 September 2019
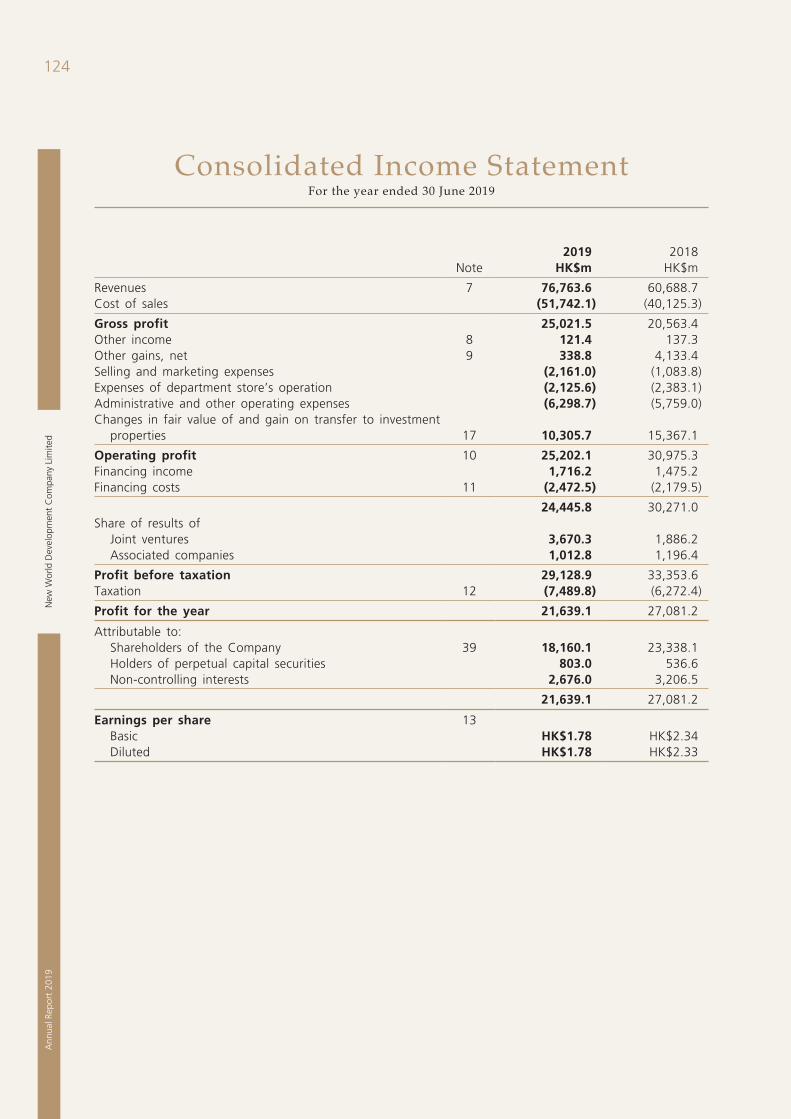
New
Wor
ld D
evel
opm
ent
Com
pany
Lim
ited
124A
nnua
l Rep
ort
2019
Consolidated Income StatementFor the year ended 30 June 2019
2019 2018Note HK$m HK$m
Revenues 7 76,763.6 60,688.7Cost of sales (51,742.1) (40,125.3)
Gross profit 25,021.5 20,563.4Other income 8 121.4 137.3Other gains, net 9 338.8 4,133.4Selling and marketing expenses (2,161.0) (1,083.8)Expenses of department store’s operation (2,125.6) (2,383.1)Administrative and other operating expenses (6,298.7) (5,759.0)Changes in fair value of and gain on transfer to investment
properties 17 10,305.7 15,367.1
Operating profit 10 25,202.1 30,975.3Financing income 1,716.2 1,475.2Financing costs 11 (2,472.5) (2,179.5)
24,445.8 30,271.0Share of results of
Joint ventures 3,670.3 1,886.2Associated companies 1,012.8 1,196.4
Profit before taxation 29,128.9 33,353.6Taxation 12 (7,489.8) (6,272.4)
Profit for the year 21,639.1 27,081.2
Attributable to:Shareholders of the Company 39 18,160.1 23,338.1Holders of perpetual capital securities 803.0 536.6Non-controlling interests 2,676.0 3,206.5
21,639.1 27,081.2
Earnings per share 13Basic HK$1.78 HK$2.34Diluted HK$1.78 HK$2.33
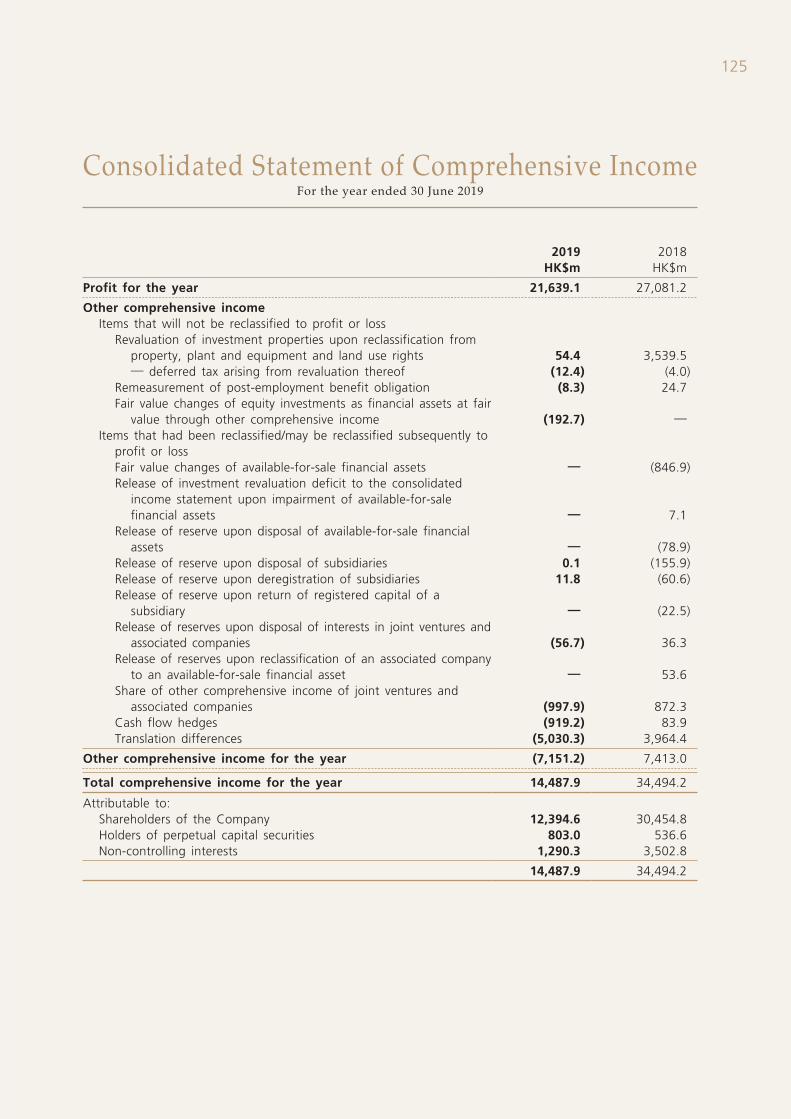
125
Consolidated Statement of Comprehensive IncomeFor the year ended 30 June 2019
2019 2018HK$m HK$m
Profit for the year 21,639.1 27,081.2
Other comprehensive incomeItems that will not be reclassified to profit or loss
Revaluation of investment properties upon reclassification from property, plant and equipment and land use rights 54.4 3,539.5— deferred tax arising from revaluation thereof (12.4) (4.0)
Remeasurement of post-employment benefit obligation (8.3) 24.7Fair value changes of equity investments as financial assets at fair
value through other comprehensive income (192.7) —Items that had been reclassified/may be reclassified subsequently to
profit or lossFair value changes of available-for-sale financial assets — (846.9)Release of investment revaluation deficit to the consolidated
income statement upon impairment of available-for-sale financial assets — 7.1
Release of reserve upon disposal of available-for-sale financial assets — (78.9)
Release of reserve upon disposal of subsidiaries 0.1 (155.9)Release of reserve upon deregistration of subsidiaries 11.8 (60.6)Release of reserve upon return of registered capital of a
subsidiary — (22.5)Release of reserves upon disposal of interests in joint ventures and
associated companies (56.7) 36.3Release of reserves upon reclassification of an associated company
to an available-for-sale financial asset — 53.6Share of other comprehensive income of joint ventures and
associated companies (997.9) 872.3Cash flow hedges (919.2) 83.9Translation differences (5,030.3) 3,964.4
Other comprehensive income for the year (7,151.2) 7,413.0
Total comprehensive income for the year 14,487.9 34,494.2
Attributable to:Shareholders of the Company 12,394.6 30,454.8Holders of perpetual capital securities 803.0 536.6Non-controlling interests 1,290.3 3,502.8
14,487.9 34,494.2
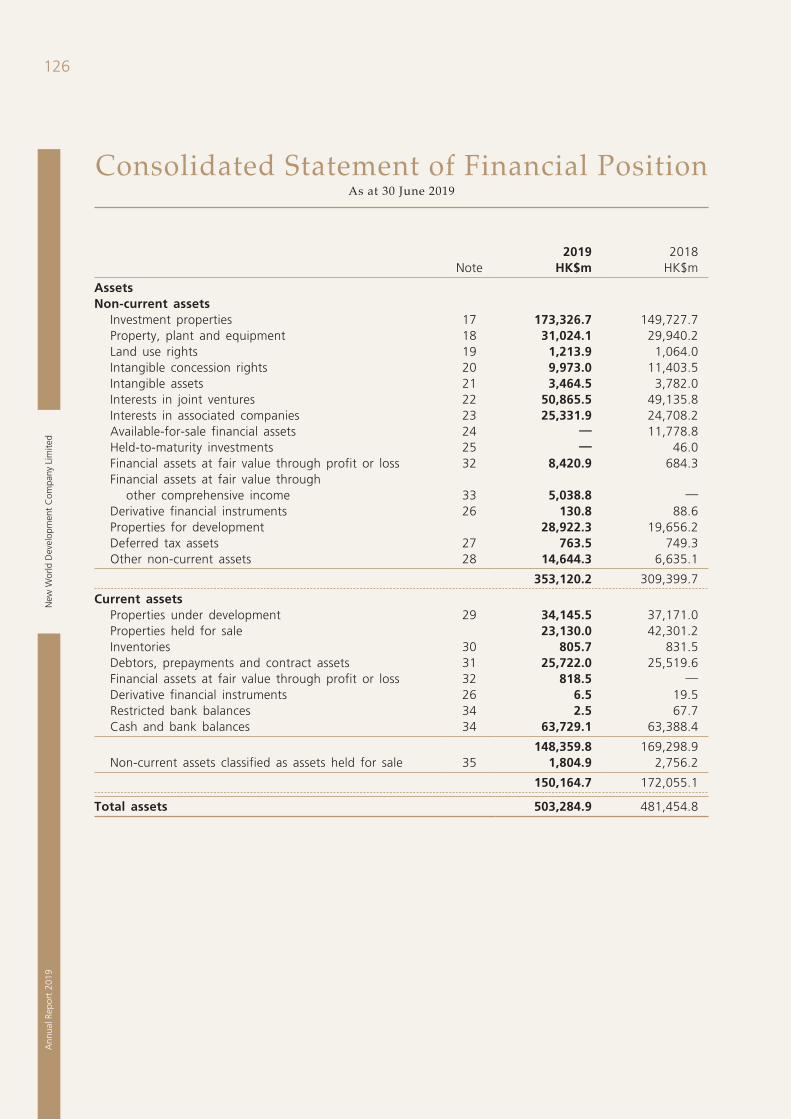
New
Wor
ld D
evel
opm
ent
Com
pany
Lim
ited
126A
nnua
l Rep
ort
2019
Consolidated Statement of Financial PositionAs at 30 June 2019
2019 2018Note HK$m HK$m
AssetsNon-current assets
Investment properties 17 173,326.7 149,727.7Property, plant and equipment 18 31,024.1 29,940.2Land use rights 19 1,213.9 1,064.0Intangible concession rights 20 9,973.0 11,403.5Intangible assets 21 3,464.5 3,782.0Interests in joint ventures 22 50,865.5 49,135.8Interests in associated companies 23 25,331.9 24,708.2Available-for-sale financial assets 24 — 11,778.8Held-to-maturity investments 25 — 46.0Financial assets at fair value through profit or loss 32 8,420.9 684.3Financial assets at fair value through
other comprehensive income 33 5,038.8 —Derivative financial instruments 26 130.8 88.6Properties for development 28,922.3 19,656.2Deferred tax assets 27 763.5 749.3Other non-current assets 28 14,644.3 6,635.1
353,120.2 309,399.7
Current assetsProperties under development 29 34,145.5 37,171.0Properties held for sale 23,130.0 42,301.2Inventories 30 805.7 831.5Debtors, prepayments and contract assets 31 25,722.0 25,519.6Financial assets at fair value through profit or loss 32 818.5 —Derivative financial instruments 26 6.5 19.5Restricted bank balances 34 2.5 67.7Cash and bank balances 34 63,729.1 63,388.4
148,359.8 169,298.9Non-current assets classified as assets held for sale 35 1,804.9 2,756.2
150,164.7 172,055.1
Total assets 503,284.9 481,454.8
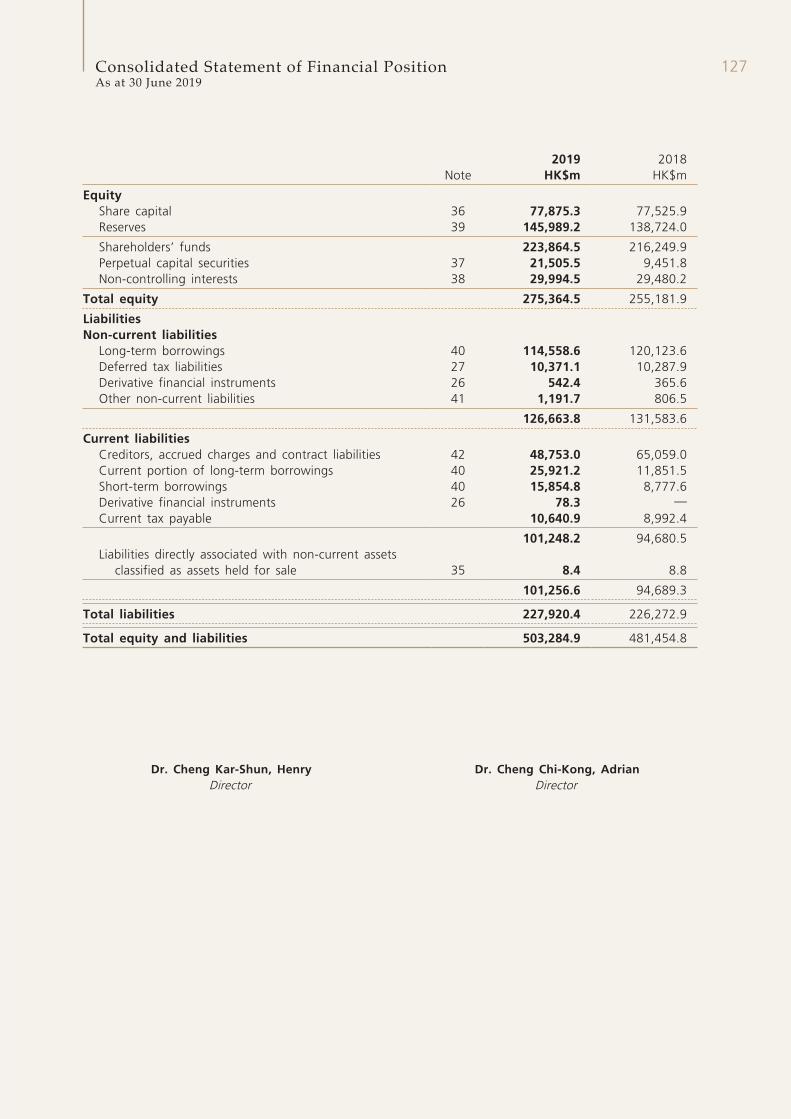
127Consolidated Statement of Financial PositionAs at 30 June 2019
2019 2018Note HK$m HK$m
EquityShare capital 36 77,875.3 77,525.9Reserves 39 145,989.2 138,724.0
Shareholders’ funds 223,864.5 216,249.9Perpetual capital securities 37 21,505.5 9,451.8Non-controlling interests 38 29,994.5 29,480.2
Total equity 275,364.5 255,181.9
LiabilitiesNon-current liabilities
Long-term borrowings 40 114,558.6 120,123.6Deferred tax liabilities 27 10,371.1 10,287.9Derivative financial instruments 26 542.4 365.6Other non-current liabilities 41 1,191.7 806.5
126,663.8 131,583.6
Current liabilitiesCreditors, accrued charges and contract liabilities 42 48,753.0 65,059.0Current portion of long-term borrowings 40 25,921.2 11,851.5Short-term borrowings 40 15,854.8 8,777.6Derivative financial instruments 26 78.3 —Current tax payable 10,640.9 8,992.4
101,248.2 94,680.5Liabilities directly associated with non-current assets
classified as assets held for sale 35 8.4 8.8
101,256.6 94,689.3
Total liabilities 227,920.4 226,272.9
Total equity and liabilities 503,284.9 481,454.8
Dr. Cheng Kar-Shun, Henry Dr. Cheng Chi-Kong, AdrianDirector Director
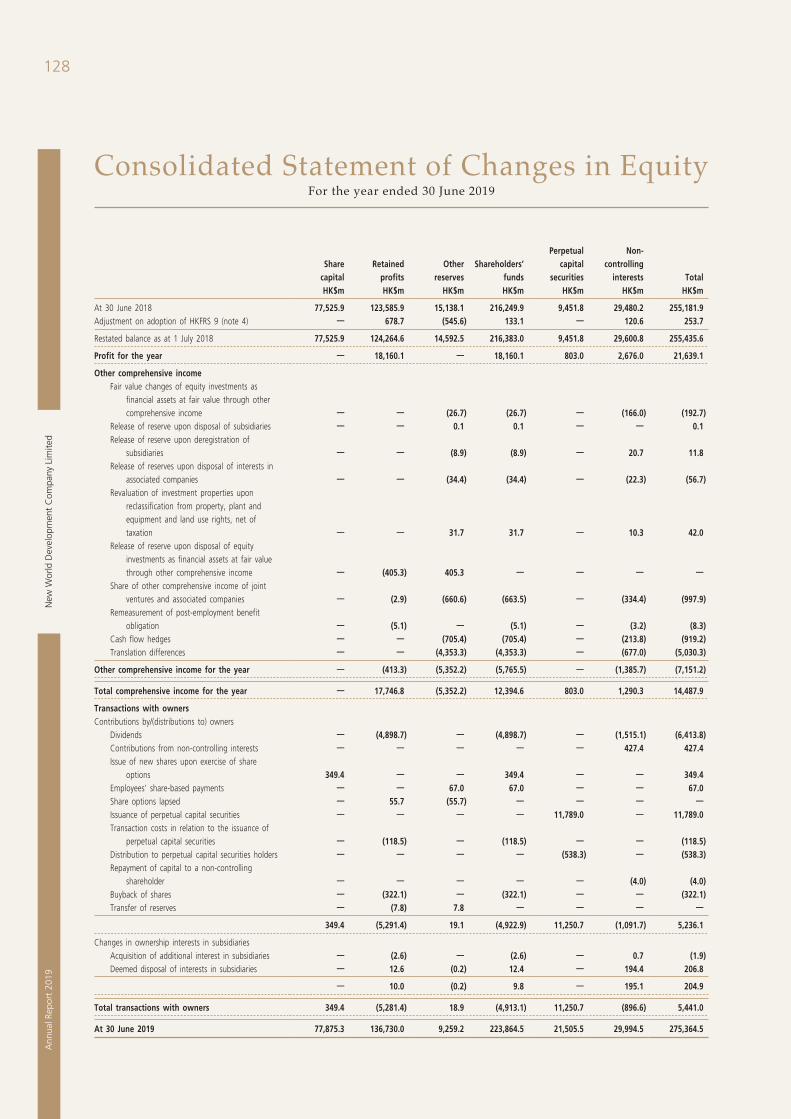
New
Wor
ld D
evel
opm
ent
Com
pany
Lim
ited
128A
nnua
l Rep
ort
2019
Consolidated Statement of Changes in EquityFor the year ended 30 June 2019
Share capital
Retained profits
Other reserves
Shareholders’ funds
Perpetual capital
securities
Non- controlling
interests TotalHK$m HK$m HK$m HK$m HK$m HK$m HK$m
At 30 June 2018 77,525.9 123,585.9 15,138.1 216,249.9 9,451.8 29,480.2 255,181.9Adjustment on adoption of HKFRS 9 (note 4) — 678.7 (545.6) 133.1 — 120.6 253.7
Restated balance as at 1 July 2018 77,525.9 124,264.6 14,592.5 216,383.0 9,451.8 29,600.8 255,435.6
Profit for the year — 18,160.1 — 18,160.1 803.0 2,676.0 21,639.1
Other comprehensive incomeFair value changes of equity investments as
financial assets at fair value through other comprehensive income — — (26.7) (26.7) — (166.0) (192.7)
Release of reserve upon disposal of subsidiaries — — 0.1 0.1 — — 0.1Release of reserve upon deregistration of
subsidiaries — — (8.9) (8.9) — 20.7 11.8Release of reserves upon disposal of interests in
associated companies — — (34.4) (34.4) — (22.3) (56.7)Revaluation of investment properties upon
reclassification from property, plant and equipment and land use rights, net of taxation — — 31.7 31.7 — 10.3 42.0
Release of reserve upon disposal of equity investments as financial assets at fair value through other comprehensive income — (405.3) 405.3 — — — —
Share of other comprehensive income of joint ventures and associated companies — (2.9) (660.6) (663.5) — (334.4) (997.9)
Remeasurement of post-employment benefit obligation — (5.1) — (5.1) — (3.2) (8.3)
Cash flow hedges — — (705.4) (705.4) — (213.8) (919.2)Translation differences — — (4,353.3) (4,353.3) — (677.0) (5,030.3)
Other comprehensive income for the year — (413.3) (5,352.2) (5,765.5) — (1,385.7) (7,151.2)
Total comprehensive income for the year — 17,746.8 (5,352.2) 12,394.6 803.0 1,290.3 14,487.9
Transactions with ownersContributions by/(distributions to) owners
Dividends — (4,898.7) — (4,898.7) — (1,515.1) (6,413.8)Contributions from non-controlling interests — — — — — 427.4 427.4Issue of new shares upon exercise of share
options 349.4 — — 349.4 — — 349.4Employees’ share-based payments — — 67.0 67.0 — — 67.0Share options lapsed — 55.7 (55.7) — — — —
Issuance of perpetual capital securities — — — — 11,789.0 — 11,789.0Transaction costs in relation to the issuance of
perpetual capital securities — (118.5) — (118.5) — — (118.5)Distribution to perpetual capital securities holders — — — — (538.3) — (538.3)Repayment of capital to a non-controlling
shareholder — — — — — (4.0) (4.0)Buyback of shares — (322.1) — (322.1) — — (322.1)Transfer of reserves — (7.8) 7.8 — — — —
349.4 (5,291.4) 19.1 (4,922.9) 11,250.7 (1,091.7) 5,236.1
Changes in ownership interests in subsidiariesAcquisition of additional interest in subsidiaries — (2.6) — (2.6) — 0.7 (1.9)Deemed disposal of interests in subsidiaries — 12.6 (0.2) 12.4 — 194.4 206.8
— 10.0 (0.2) 9.8 — 195.1 204.9
Total transactions with owners 349.4 (5,281.4) 18.9 (4,913.1) 11,250.7 (896.6) 5,441.0
At 30 June 2019 77,875.3 136,730.0 9,259.2 223,864.5 21,505.5 29,994.5 275,364.5
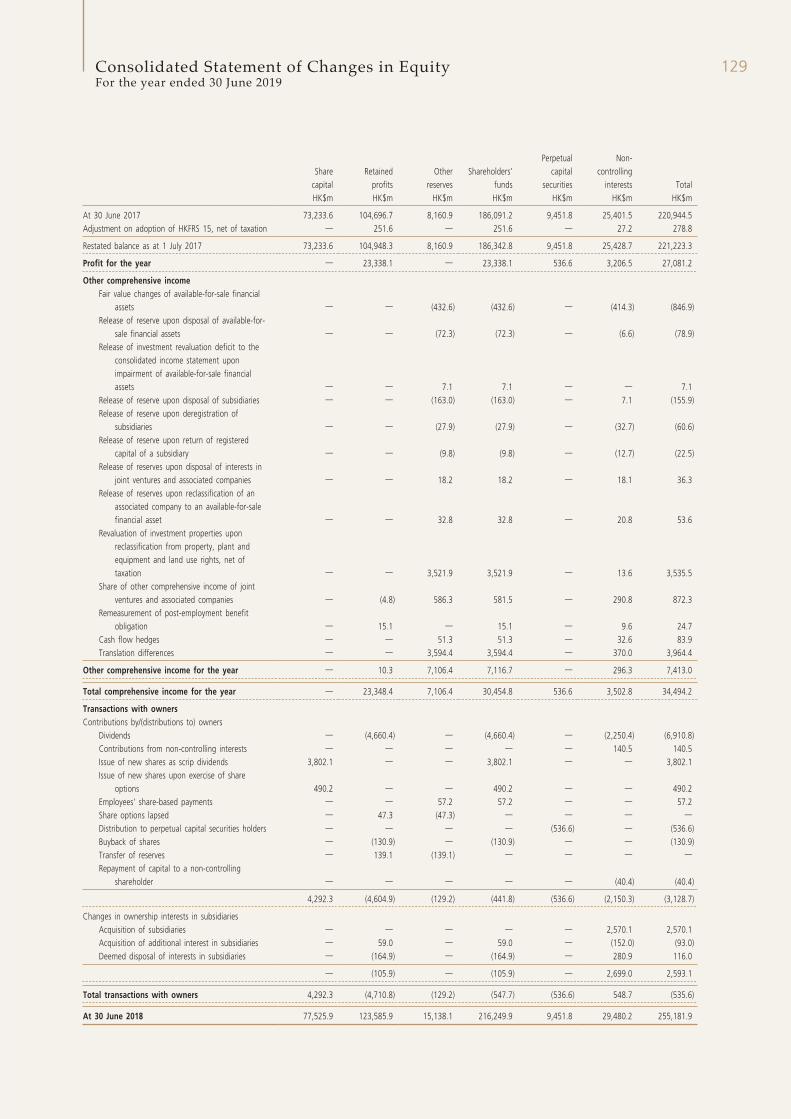
129Consolidated Statement of Changes in EquityFor the year ended 30 June 2019
Share capital
Retained profits
Other reserves
Shareholders’ funds
Perpetual capital
securities
Non- controlling
interests TotalHK$m HK$m HK$m HK$m HK$m HK$m HK$m
At 30 June 2017 73,233.6 104,696.7 8,160.9 186,091.2 9,451.8 25,401.5 220,944.5Adjustment on adoption of HKFRS 15, net of taxation — 251.6 — 251.6 — 27.2 278.8
Restated balance as at 1 July 2017 73,233.6 104,948.3 8,160.9 186,342.8 9,451.8 25,428.7 221,223.3
Profit for the year — 23,338.1 — 23,338.1 536.6 3,206.5 27,081.2
Other comprehensive incomeFair value changes of available-for-sale financial
assets — — (432.6) (432.6) — (414.3) (846.9)Release of reserve upon disposal of available-for-
sale financial assets — — (72.3) (72.3) — (6.6) (78.9)Release of investment revaluation deficit to the
consolidated income statement upon impairment of available-for-sale financial assets — — 7.1 7.1 — — 7.1
Release of reserve upon disposal of subsidiaries — — (163.0) (163.0) — 7.1 (155.9)Release of reserve upon deregistration of
subsidiaries — — (27.9) (27.9) — (32.7) (60.6)Release of reserve upon return of registered
capital of a subsidiary — — (9.8) (9.8) — (12.7) (22.5)Release of reserves upon disposal of interests in
joint ventures and associated companies — — 18.2 18.2 — 18.1 36.3Release of reserves upon reclassification of an
associated company to an available-for-sale financial asset — — 32.8 32.8 — 20.8 53.6
Revaluation of investment properties upon reclassification from property, plant and equipment and land use rights, net of taxation — — 3,521.9 3,521.9 — 13.6 3,535.5
Share of other comprehensive income of joint ventures and associated companies — (4.8) 586.3 581.5 — 290.8 872.3
Remeasurement of post-employment benefit obligation — 15.1 — 15.1 — 9.6 24.7
Cash flow hedges — — 51.3 51.3 — 32.6 83.9Translation differences — — 3,594.4 3,594.4 — 370.0 3,964.4
Other comprehensive income for the year — 10.3 7,106.4 7,116.7 — 296.3 7,413.0
Total comprehensive income for the year — 23,348.4 7,106.4 30,454.8 536.6 3,502.8 34,494.2
Transactions with ownersContributions by/(distributions to) owners
Dividends — (4,660.4) — (4,660.4) — (2,250.4) (6,910.8)Contributions from non-controlling interests — — — — — 140.5 140.5Issue of new shares as scrip dividends 3,802.1 — — 3,802.1 — — 3,802.1Issue of new shares upon exercise of share
options 490.2 — — 490.2 — — 490.2Employees’ share-based payments — — 57.2 57.2 — — 57.2Share options lapsed — 47.3 (47.3) — — — —
Distribution to perpetual capital securities holders — — — — (536.6) — (536.6)Buyback of shares — (130.9) — (130.9) — — (130.9)Transfer of reserves — 139.1 (139.1) — — — —
Repayment of capital to a non-controlling shareholder — — — — — (40.4) (40.4)
4,292.3 (4,604.9) (129.2) (441.8) (536.6) (2,150.3) (3,128.7)
Changes in ownership interests in subsidiariesAcquisition of subsidiaries — — — — — 2,570.1 2,570.1Acquisition of additional interest in subsidiaries — 59.0 — 59.0 — (152.0) (93.0)Deemed disposal of interests in subsidiaries — (164.9) — (164.9) — 280.9 116.0
— (105.9) — (105.9) — 2,699.0 2,593.1
Total transactions with owners 4,292.3 (4,710.8) (129.2) (547.7) (536.6) 548.7 (535.6)
At 30 June 2018 77,525.9 123,585.9 15,138.1 216,249.9 9,451.8 29,480.2 255,181.9
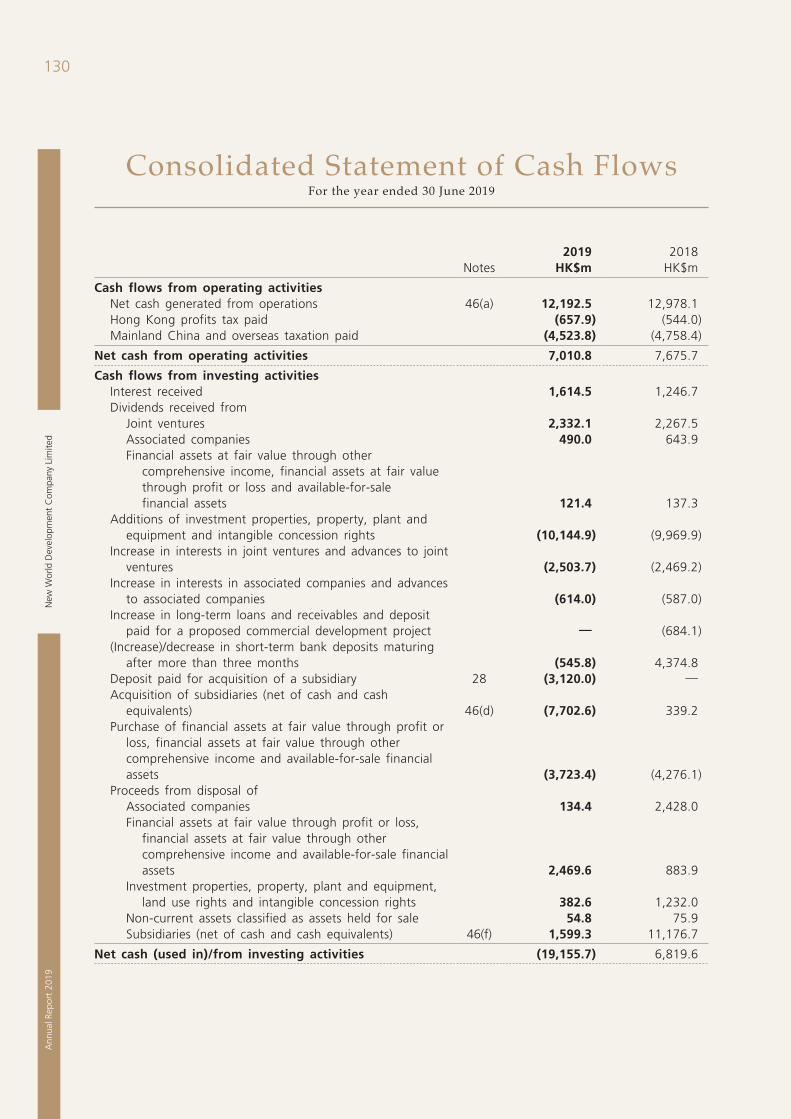
New
Wor
ld D
evel
opm
ent
Com
pany
Lim
ited
130A
nnua
l Rep
ort
2019
Consolidated Statement of Cash FlowsFor the year ended 30 June 2019
2019 2018Notes HK$m HK$m
Cash flows from operating activitiesNet cash generated from operations 46(a) 12,192.5 12,978.1Hong Kong profits tax paid (657.9) (544.0)Mainland China and overseas taxation paid (4,523.8) (4,758.4)
Net cash from operating activities 7,010.8 7,675.7
Cash flows from investing activitiesInterest received 1,614.5 1,246.7Dividends received from
Joint ventures 2,332.1 2,267.5Associated companies 490.0 643.9Financial assets at fair value through other
comprehensive income, financial assets at fair value through profit or loss and available-for-sale financial assets 121.4 137.3
Additions of investment properties, property, plant and equipment and intangible concession rights (10,144.9) (9,969.9)
Increase in interests in joint ventures and advances to joint ventures (2,503.7) (2,469.2)
Increase in interests in associated companies and advances to associated companies (614.0) (587.0)
Increase in long-term loans and receivables and deposit paid for a proposed commercial development project — (684.1)
(Increase)/decrease in short-term bank deposits maturing after more than three months (545.8) 4,374.8
Deposit paid for acquisition of a subsidiary 28 (3,120.0) —Acquisition of subsidiaries (net of cash and cash
equivalents) 46(d) (7,702.6) 339.2Purchase of financial assets at fair value through profit or
loss, financial assets at fair value through other comprehensive income and available-for-sale financial assets (3,723.4) (4,276.1)
Proceeds from disposal ofAssociated companies 134.4 2,428.0Financial assets at fair value through profit or loss,
financial assets at fair value through other comprehensive income and available-for-sale financial assets 2,469.6 883.9
Investment properties, property, plant and equipment, land use rights and intangible concession rights 382.6 1,232.0
Non-current assets classified as assets held for sale 54.8 75.9Subsidiaries (net of cash and cash equivalents) 46(f) 1,599.3 11,176.7
Net cash (used in)/from investing activities (19,155.7) 6,819.6
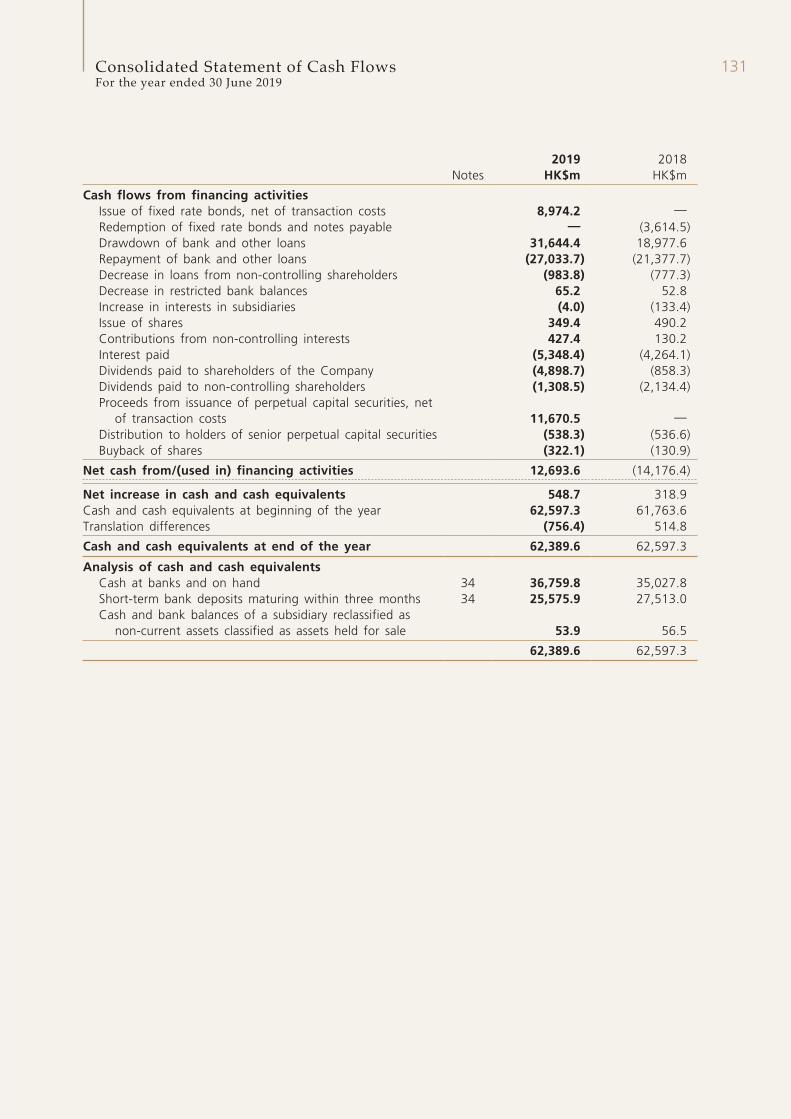
131Consolidated Statement of Cash FlowsFor the year ended 30 June 2019
2019 2018Notes HK$m HK$m
Cash flows from financing activitiesIssue of fixed rate bonds, net of transaction costs 8,974.2 —Redemption of fixed rate bonds and notes payable — (3,614.5)Drawdown of bank and other loans 31,644.4 18,977.6Repayment of bank and other loans (27,033.7) (21,377.7)Decrease in loans from non-controlling shareholders (983.8) (777.3)Decrease in restricted bank balances 65.2 52.8Increase in interests in subsidiaries (4.0) (133.4)Issue of shares 349.4 490.2Contributions from non-controlling interests 427.4 130.2Interest paid (5,348.4) (4,264.1)Dividends paid to shareholders of the Company (4,898.7) (858.3)Dividends paid to non-controlling shareholders (1,308.5) (2,134.4)Proceeds from issuance of perpetual capital securities, net
of transaction costs 11,670.5 —Distribution to holders of senior perpetual capital securities (538.3) (536.6)Buyback of shares (322.1) (130.9)
Net cash from/(used in) financing activities 12,693.6 (14,176.4)
Net increase in cash and cash equivalents 548.7 318.9Cash and cash equivalents at beginning of the year 62,597.3 61,763.6Translation differences (756.4) 514.8
Cash and cash equivalents at end of the year 62,389.6 62,597.3
Analysis of cash and cash equivalentsCash at banks and on hand 34 36,759.8 35,027.8Short-term bank deposits maturing within three months 34 25,575.9 27,513.0Cash and bank balances of a subsidiary reclassified as
non-current assets classified as assets held for sale 53.9 56.5
62,389.6 62,597.3
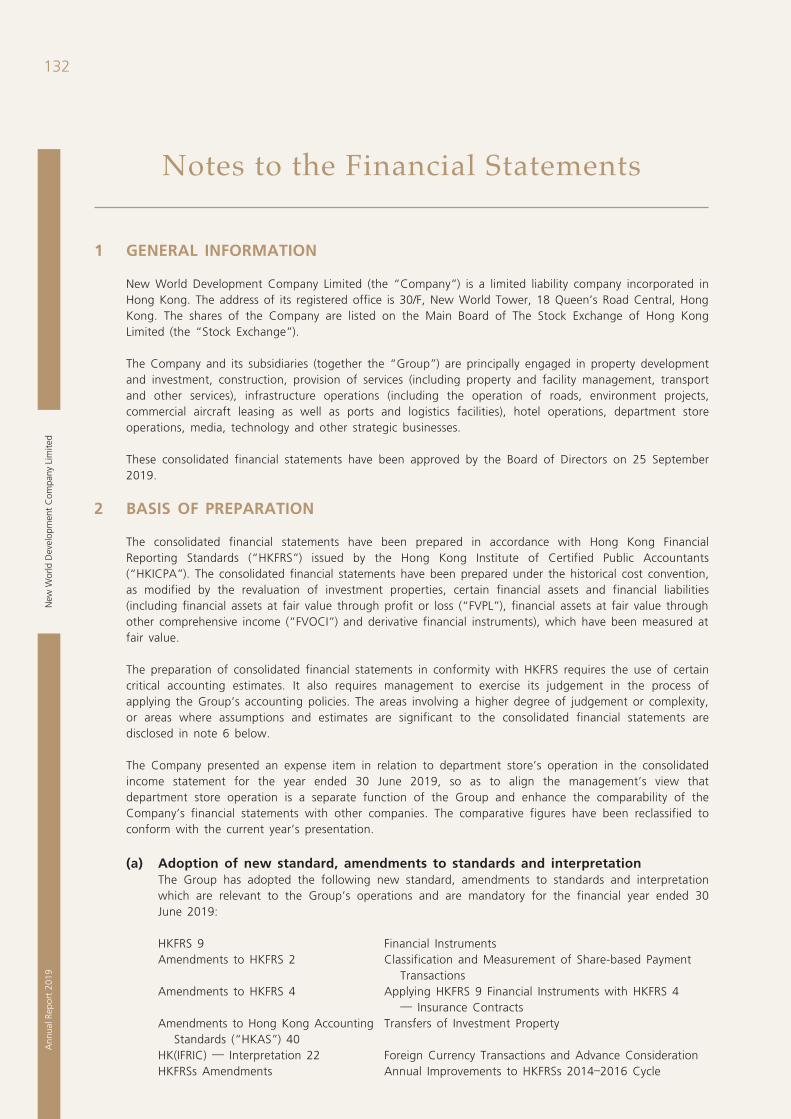
New
Wor
ld D
evel
opm
ent
Com
pany
Lim
ited
132A
nnua
l Rep
ort
2019
Notes to the Financial Statements
1 GENERAL INFORMATION
New World Development Company Limited (the “Company”) is a limited liability company incorporated in Hong Kong. The address of its registered office is 30/F, New World Tower, 18 Queen’s Road Central, Hong Kong. The shares of the Company are listed on the Main Board of The Stock Exchange of Hong Kong Limited (the “Stock Exchange”).
The Company and its subsidiaries (together the “Group”) are principally engaged in property development and investment, construction, provision of services (including property and facility management, transport and other services), infrastructure operations (including the operation of roads, environment projects, commercial aircraft leasing as well as ports and logistics facilities), hotel operations, department store operations, media, technology and other strategic businesses.
These consolidated financial statements have been approved by the Board of Directors on 25 September 2019.
2 BASIS OF PREPARATION
The consolidated financial statements have been prepared in accordance with Hong Kong Financial Reporting Standards (“HKFRS”) issued by the Hong Kong Institute of Certified Public Accountants (“HKICPA”). The consolidated financial statements have been prepared under the historical cost convention, as modified by the revaluation of investment properties, certain financial assets and financial liabilities (including financial assets at fair value through profit or loss (“FVPL”), financial assets at fair value through other comprehensive income (“FVOCI”) and derivative financial instruments), which have been measured at fair value.
The preparation of consolidated financial statements in conformity with HKFRS requires the use of certain critical accounting estimates. It also requires management to exercise its judgement in the process of applying the Group’s accounting policies. The areas involving a higher degree of judgement or complexity, or areas where assumptions and estimates are significant to the consolidated financial statements are disclosed in note 6 below.
The Company presented an expense item in relation to department store’s operation in the consolidated income statement for the year ended 30 June 2019, so as to align the management’s view that department store operation is a separate function of the Group and enhance the comparability of the Company’s financial statements with other companies. The comparative figures have been reclassified to conform with the current year’s presentation.
(a) Adoption of new standard, amendments to standards and interpretationThe Group has adopted the following new standard, amendments to standards and interpretation which are relevant to the Group’s operations and are mandatory for the financial year ended 30 June 2019:
HKFRS 9 Financial InstrumentsAmendments to HKFRS 2 Classification and Measurement of Share-based Payment
TransactionsAmendments to HKFRS 4 Applying HKFRS 9 Financial Instruments with HKFRS 4
— Insurance ContractsAmendments to Hong Kong Accounting
Standards (“HKAS”) 40Transfers of Investment Property
HK(IFRIC) — Interpretation 22 Foreign Currency Transactions and Advance ConsiderationHKFRSs Amendments Annual Improvements to HKFRSs 2014–2016 Cycle
133Notes to the Financial Statements
2 BASIS OF PREPARATION (CONTINUED)
(a) Adoption of new standard, amendments to standards and interpretation (continued)The Group has elected to early adopt HKFRS 15 “Revenue from Contracts with Customers” (“HKFRS 15”) for the year ended 30 June 2018 because the new accounting standard provides more reliable and relevant information for users to assess the amounts, timing and uncertainty of revenue and cash flows. The relevant impact of adoption of HKFRS 15 was included in the 30 June 2018 annual financial statements.
Except for the impact of adoption of HKFRS 9 “Financial Instruments” (“HKFRS 9”), the adoption of other amendments to standards and interpretation does not have significant effect on the results and financial position of the Group.
(b) Adoption of HKFRS 9HKFRS 9 as issued by the HKICPA is effective for the financial year beginning on or after 1 January 2018.
The Group has adopted HKFRS 9 for the year ended 30 June 2019. HKFRS 9 has replaced the provision of HKAS 39 “Financial Instruments: Recognition and Measurement” (“HKAS 39”) that relate to (i) recognition, classification and measurement of financial assets and financial liabilities; (ii) derecognition of financial instruments, (iii) impairment of financial assets and (iv) hedge accounting. As allowed in the transitional provision in HKFRS 9 (2014), comparative figures is not restated. The effects of the adoption of HKFRS 9 are set out in note 4 below.
(c) New standards, amendments to standards and interpretation which are not yet effectiveThe following new standards, amendments to standards and interpretation are mandatory for accounting periods beginning on or after 1 July 2019 or later periods but which the Group has not early adopted:
HKFRS 16 LeasesHKFRS 17 Insurance ContractsAmendments to HKFRS 3 Definition of a BusinessAmendments to HKFRS 9 Prepayment Features with Negative CompensationAmendments to HKFRS 10 and
HKAS 28Sale or Contribution of Assets between an Investor and its
Associate or Joint VentureAmendments to HKAS 1 and HKAS 8 Amendments to Definition of MaterialAmendments to HKAS 19 Plan Amendment, Curtailment or SettlementAmendments to HKAS 28 Long-term Interests in Associates and Joint VenturesHK (IFRIC) — Interpretation 23 Uncertainty over Income Tax TreatmentsHKFRSs Amendments Annual Improvements to HKFRSs 2015–2017 CycleConceptual Framework for Financial
Reporting 2018Revised Conceptual Framework for Financial Reporting
The Group has already commenced an assessment of the likely impact of adopting the above new standards, amendments to standards and interpretation, in which the preliminary assessment of HKFRS 16 “Leases” (“HKFRS 16”) is detailed below.
New
Wor
ld D
evel
opm
ent
Com
pany
Lim
ited
134A
nnua
l Rep
ort
2019
Notes to the Financial Statements
2 BASIS OF PREPARATION (CONTINUED)
(c) New standards, amendments to standards and interpretation which are not yet effective (continued)
HKFRS 16HKFRS 16 addresses the definition of a lease, recognition and measurement of leases and establishes principles for reporting useful information to users of financial statements about the leasing activities of both lessees and lessors. A key change arising from HKFRS 16 is that most operating leases will be accounted for on the consolidated statement of financial position for lessees. The Group is a lessee of certain premises and properties which are currently classified as operating leases. HKFRS 16 provides a new provision for the accounting treatment of leases when the Group is the lessee, almost all leases should be recognised in the form of an asset for the right-of-use and a financial liability at the present value of lease payments that are not paid at the recognition date. The lease payments shall be discounted using either the interest rate implicit in the lease or the lessee’s incremental borrowing rate. Short-term leases of less than twelve months and leases of low-value assets are exempt from the reporting obligation. The new standard will therefore result in an increase in assets and financial liabilities in the consolidated statement of financial position. As for the financial performance impact in the consolidated income statement, straight-line depreciation expense on the right-of-use asset and the interest expenses on the financial liability are recognised and no rental expenses will be recognised. The combination of a straight-line depreciation of the right-of-use asset and the effective interest method applied to the financial liability will result in a higher total charge to consolidated income statement in the initial years of the lease, and decreasing expenses during the latter part of the lease term. The Group will classify cash payment on the lease liability into a principal portion and an interest portion and will present them in the consolidated statement of cash flows.
The Group is considering to elect the modified retrospective approach upon the initial adoption. Under the modified retrospective approach, comparative information for prior periods will not be restated and the Group will recognise the cumulative effect of initially applying the guidance as an adjustment to the opening balance of the consolidated statement of financial position in the year of adoption commencing on 1 July 2019.
As at 30 June 2019, the Group has non-cancellable operating lease commitments in relation to the Group’s various businesses as set out in note 44(b)(ii). It is expected that a substantial portion of the lease commitments will be required to be recognised in the consolidated statement of financial position as right-of-use assets and lease liabilities.
The Group has a lease agreement in relation to the contract as set out in note 44(b)(iii). It is expected that the present value of the unpaid guaranteed rent over the lease term will also be recognised as right-of-use assets or investment properties (depending on the management’s intention on usage) and lease liabilities in the consolidated statement of financial position upon the adoption of HKFRS 16.
The Group’s activities as a lessor does not expect any significant impact on the consolidated financial statements.
The Group has already commenced an assessment of the impact of other new standards, amendments to standards and interpretation, certain of which may be relevant to the Group’s operations and may give rise to changes in accounting policies, changes in disclosures and remeasurement of certain items in the consolidated financial statements.
135Notes to the Financial Statements
2 BASIS OF PREPARATION (CONTINUED)
(d) Hong Kong Companies Ordinance (Cap.622)The consolidated financial statements comply with the applicable requirements of Hong Kong Companies Ordinance (Cap. 622), with the exception of section 381 which requires a company to include all its subsidiary undertakings (within the meaning of Schedule 1 to Cap. 622) in the Company’s annual consolidated financial statements. Section 381 is inconsistent with the requirements of HKFRS 10 “Consolidated Financial Statements” (“HKFRS 10”) so far as Section 381 applies to subsidiary undertakings which are not controlled by the Group in accordance with HKFRS 10. For this reason, under the provisions of section 380(6), the Company has departed from section 381 and has not treated such companies as subsidiaries but they are accounted for in accordance with the accounting policies in notes 3(a)(ii) and 3(a)(iii). Those excluded subsidiary undertakings of the Group are disclosed in notes 50 and 51.
3 PRINCIPAL ACCOUNTING POLICIES
The principal accounting policies adopted for the preparation of these consolidated financial statements, which have been consistently applied to all the years presented, unless otherwise stated, are set out as below:
(a) ConsolidationThe consolidated financial statements incorporate the financial statements of the Company and all its subsidiaries made up to 30 June.
(i) SubsidiariesA subsidiary is an entity (including a structured entity) over which the Group has control. The Group controls an entity when the Group is exposed to, or has rights to, variable returns from its involvement with the entity and has the ability to affect those returns through its power over the entity. Subsidiaries are consolidated from the date on which control is transferred to the Group. They are deconsolidated from the date that control ceases.
The acquisition method of accounting is used to account for business combinations by the Group. The consideration transferred for the acquisition of a subsidiary is the fair values of the assets transferred, the liabilities incurred to the former owners of the acquiree and the equity interests issued by the Group. The consideration transferred includes the fair value of any asset or liability resulting from a contingent consideration arrangement at the acquisition date. Acquisition-related costs are expensed as incurred. Identifiable assets acquired and liabilities and contingent liabilities assumed in a business combination are measured initially at their fair values at the acquisition date. There is a choice, on the basis of each acquisition to measure the non-controlling interest in the acquiree either at fair value or at the non-controlling interest’s proportionate share of the recognised amount of acquiree’s identifiable net assets. If the business combination is achieved in stages, the acquirer’s previously held equity interest in the acquiree is remeasured to fair value at the acquisition date through consolidated income statement.
The excess of the consideration transferred, the amount of any non-controlling interest in the acquiree and the fair value of any previous equity interest in the acquiree at the date of acquisition over the fair value of the Group’s share of the identifiable net assets acquired is recorded as goodwill. If this consideration is less than the fair value of the net assets of the subsidiary acquired in the case of a bargain purchase, the difference is recognised directly in the consolidated income statement.
New
Wor
ld D
evel
opm
ent
Com
pany
Lim
ited
136A
nnua
l Rep
ort
2019
Notes to the Financial Statements
3 PRINCIPAL ACCOUNTING POLICIES (CONTINUED)
(a) Consolidation (continued) (i) Subsidiaries (continued)
Inter-company transactions, balances and unrealised gains on transactions between group companies are eliminated. Unrealised losses are also eliminated, unless the transaction provides evidence of an impairment of the transferred asset. Accounting policies of subsidiaries have been changed where necessary to ensure consistency with the policies adopted by the Group.
When the Group ceases to have control, any retained interest in the entity is remeasured to its fair value at the date when control is lost, with the change in carrying amount recognised in the consolidated income statement. The fair value is the carrying amount for the purposes of subsequently accounting for the retained interest as associated companies, joint ventures or financial assets. In addition, any amounts previously recognised in other comprehensive income in respect of that entity are accounted for as if the Group had directly disposed of the related assets or liabilities. It means the amounts previously recognised in other comprehensive income are reclassified to the consolidated income statement or transferred to another category of equity as specified/permitted by applicable HKFRSs.
The Company’s investments in subsidiaries are stated at cost less provision for impairment losses. The results of subsidiaries are accounted for by the Company on the basis of dividend received and receivable.
(ii) Joint arrangementsUnder HKFRS 11, investments in joint arrangements are classified as either joint ventures or joint operations depending on the contractual rights and obligations each investor.
(1) Joint venturesThe Group recognises its interests in joint ventures using equity method of accounting. Interests in joint ventures are stated in the consolidated financial statements at cost (including goodwill on acquisition) plus the share of post-acquisition results and movements in other comprehensive income less provision for impairment losses. Goodwill represents the excess of the cost of an acquisition over the fair value of the Group’s share of the net identifiable assets of the acquired joint ventures at the date of acquisition.
The Group’s interests in joint ventures include the loans and advances to the joint ventures which, in substance, form part of the Group’s interests in the joint ventures. The loans and advances to the joint ventures are a form of commercial arrangement between the parties to the joint ventures to finance the development of projects and viewed as a mean by which the Group invests in the relevant projects. These loans and advances have no fixed repayment terms and will be repaid when the relevant joint venture has surplus cash flow.
The share of post-acquisition results and other comprehensive income is based on the relevant profit sharing ratios which vary according to the nature of the joint ventures set out as follows:
(a) Equity joint ventures/joint ventures in wholly foreign owned enterprisesEquity joint ventures/joint ventures in wholly foreign owned enterprises are joint ventures in respect of which the capital contribution ratios of the venturers are defined in the joint venture contracts and the profit sharing ratios and share of net assets of the venturers are in proportion to the capital contribution ratios.
137Notes to the Financial Statements
3 PRINCIPAL ACCOUNTING POLICIES (CONTINUED)
(a) Consolidation (continued) (ii) Joint arrangements (continued) (1) Joint ventures (continued) (b) Co-operative joint ventures
Co-operative joint ventures are joint ventures in respect of which the profit sharing ratios of the venturers and share of net assets upon the expiration of the joint venture periods are not in proportion to their capital contribution ratios but are as defined in the joint venture contracts.
(c) Companies limited by sharesCompanies limited by shares are limited liability companies in respect of which each shareholder’s beneficial interests therein is in accordance with the amount of the voting share capital held thereby.
When the Group’s share of losses in a joint venture equals or exceeds its interests in the joint venture (which includes any long-term interests that, in substance, form part of the Group’s net investment in the joint ventures), the Group does not recognise further losses, unless it has incurred obligations or made payments on behalf of the joint ventures.
The Group recognises the portion of gains or losses on the sale of assets by the Group to the joint venture that is attributable to the other venturers. The Group does not recognise its share of profits or losses from the joint venture that result from the purchase of assets from the joint venture until it resells the assets to an independent party. However, a loss on the transaction is recognised immediately if the loss provides evidence of a reduction in the net realisable value of current assets, or an impairment loss.
For equity accounting purpose, accounting policies of joint ventures have been changed where necessary to ensure consistency with the policies adopted by the Group.
The Company’s interests in joint ventures are stated at cost less provision for impairment losses. The results of joint ventures are accounted for by the Company on the basis of dividend received and receivable.
(2) Joint operationsThe assets that the Group has the rights and the liabilities that the Group has the obligations in relation to the joint operations are recognised in the consolidated statement of financial position on an accrual basis and classified according to the nature of the item. The share of expenses that the Group incurs and its share of income that it earns from the joint operations are included in the consolidated income statement.
New
Wor
ld D
evel
opm
ent
Com
pany
Lim
ited
138A
nnua
l Rep
ort
2019
Notes to the Financial Statements
3 PRINCIPAL ACCOUNTING POLICIES (CONTINUED)
(a) Consolidation (continued) (iii) Associated companies
An associated company is a company other than a subsidiary and a joint venture, in which the Group has significant influence, but not control, exercised through representatives on the board of directors.
Interests in associated companies are accounted for by the equity method of accounting and are initially recognised at cost. The Group’s interests in associated companies include goodwill (net of any accumulated impairment loss) identified on acquisition. Goodwill represents the excess of the cost of an acquisition over the fair value of the Group’s share of the net identifiable assets of the acquired associated companies at the date of acquisition. The interests in associated companies also include long-term interest that, in substance, form part of the Group’s net investment in the associated companies.
The Group’s share of its associated companies’ post acquisition profits or losses is recognised in the consolidated income statement, and the share of post-acquisition movements in other comprehensive income is recognised in the consolidated statement of comprehensive income. The cumulative post-acquisition movements are adjusted against the carrying amount of the investment. When the share of losses in an associated company equals or exceeds its interests in the associated company, including any other unsecured receivable, the Group does not recognise further losses, unless it has incurred legal and constructive obligations or made payments on behalf of the associated company.
Unrealised gains on transactions between the Group and its associated companies are eliminated to the extent of the Group’s interests in the associated companies. Unrealised losses are also eliminated unless the transaction provides evidence of an impairment of the asset transferred. For equity accounting purpose, accounting policies of associated companies have been changed where necessary to ensure consistency with the policies adopted by the Group.
The Company’s interests in associated companies are stated at cost less provision for impairment losses. The results of associated companies are accounted for by the Company on the basis of dividend income received and receivable.
Gains or losses on deemed disposal on dilution arising from interests in associated companies are recognised in the consolidated income statement.
The cost of an associated company acquired in stages is measured as the sum of consideration paid for each purchase plus a share of investee’s profits and other equity movements.
The Group ceases to use the equity method from the date an investment ceases to be an associated company that is the date on which the Group ceases to have significant influence over the associated company or on the date it is classified as held for sale.
(iv) Transactions with non-controlling interestsNon-controlling interests is the equity in a subsidiary which is not attributable, directly or indirectly, to a parent. The Group treats transactions with non-controlling interests (namely, acquisitions of additional interests and disposals of partial interests in subsidiaries that do not result in a loss of control) as transactions with equity owners of the Group. For purchases of additional interests in subsidiaries from non-controlling shareholders, the difference between any consideration paid and the relevant share acquired of the carrying value of net assets of the subsidiary is recorded in equity. Gains or losses on disposals of partial interests to non-controlling shareholders are also recorded in equity.
139Notes to the Financial Statements
3 PRINCIPAL ACCOUNTING POLICIES (CONTINUED)
(b) Intangible assets (i) Goodwill
Goodwill arising on acquisitions of subsidiaries is included in intangible assets. Goodwill arising on acquisitions of joint ventures and associated companies is included in interests in joint ventures and associated companies respectively and is tested for impairment as part of overall balance. Separately recognised goodwill is tested annually for impairment and carried at cost less accumulated impairment losses. Impairment losses on goodwill are not reversed. Gains or losses on the disposal of all or part of an entity include the carrying amount of goodwill relating to the entity sold.
Goodwill is allocated to cash-generating units for the purpose of testing for impairment. The allocation is made to those cash-generating units or groups of cash-generating units that are expected to benefit from the business combination in which the goodwill arose.
(ii) TrademarksSeparately acquired trademarks are initially recognised at initial cost. Trademarks acquired in a business combination are recognised at fair value at the date of acquisition. Trademarks have a finite useful life and are subsequently carried at cost less accumulated amortisation and impairment losses. Amortisation is calculated using the straight-line method to allocate the cost of trademarks over their estimated useful lives.
(iii) Operating rightOperating right primarily resulted from the acquisition of right to operate facilities rental and other businesses. Separately acquired operating rights are initially recognised at cost. Operating rights acquired in a business combination are initially recognised at fair value at the acquisition date. Operating right is carried at cost less accumulated amortisation and impairment. Amortisation is calculated using the straight-line method to allocate the cost over the period of the operating right.
(iv) Intangible concession rightsThe Group has entered into various service arrangements (“Service Concessions”) with local government authorities for its participation in the development, financing, operation and maintenance of various infrastructures for public services, such as toll roads and bridges, power plants and water treatment plants (the “Infrastructures”). The Group carries out the construction or upgrade work of Infrastructures from the granting authorities in exchange for the right to operate the Infrastructures concerned and the right to charge users of the respective Infrastructures. The fees collected during the operating periods are attributable to the Group. The relevant Infrastructures are required to be returned to the local government authorities upon the expiry of the operating rights without significant compensation to the Group.
The Group applies the intangible asset model to account for the Infrastructures where they are paid by the users of the Infrastructures and the concession grantors (the respective local governments) have not provided any contractual guarantees in respect of the amounts of construction costs incurred to be recoverable. The consideration to be received during the construction or the upgrade period is classified as contract assets and reclassified as intangible concession rights upon completion.
Land use rights acquired in conjunction with the Service Concessions which the Group has no discretion or latitude to deploy for other services other than the use in the Service Concessions are treated as intangible assets acquired under the Service Concessions.
New
Wor
ld D
evel
opm
ent
Com
pany
Lim
ited
140A
nnua
l Rep
ort
2019
Notes to the Financial Statements
3 PRINCIPAL ACCOUNTING POLICIES (CONTINUED)
(b) Intangible assets (continued) (iv) Intangible concession rights (continued)
Amortisation of intangible concession rights is calculated to write off their costs, where applicable, on an economic usage basis for roads and bridges whereby the amount of amortisation is provided based on the ratio of actual volume compared to the total projected volume or on a straight-line basis for water treatment plants over the periods which the Group is granted the rights to operate these Infrastructures. The total projected volume of the respective Infrastructures is reviewed regularly with reference to both internal and external sources of information and appropriate adjustments will be made should there be a material change.
(c) Non-current assets classified as assets held for saleNon-current assets or disposal group are classified as assets held for sale when their carrying amount is to be recovered principally through a sale transaction and a sale is considered highly probable. They are stated at the lower of carrying amount and fair value less costs to sell if their carrying amount is to be recovered principally through a sale transaction rather than through continuing use.
(d) Land use rightsThe upfront prepayments made for the land use rights held under operating leases are expensed in the consolidated income statement on a straight-line basis over the period of the lease or when there is impairment, the impairment is expensed in the consolidated income statement.
(e) Investment propertiesProperty that is held for long-term rental yields or for capital appreciation or both, and that is not occupied by the Group, is classified as investment property. Investment property also includes property that is being constructed or developed for future use as investment property.
Investment property comprises land held under operating leases and buildings held under finance leases. Land held under operating leases are classified and accounted for as investment property when the rest of the definition of investment property is met. The operating lease is accounted for as if it was a finance lease.
Investment property is measured initially at its cost, including related transaction costs and where applicable borrowing costs. After initial recognition, investment property is carried at fair value. Fair value is determined by professional qualified valuers on an open market value basis at the end of each reporting period. Changes in fair value are recognised in the consolidated income statement.
Subsequent expenditure is included in the carrying amount of the asset only when it is probable that future economic benefits associated with the asset will flow to the Group and the cost of the asset can be measured reliably. All other repairs and maintenance costs are expensed in the consolidated income statement during the financial period in which they are incurred.
If an investment property becomes owner-occupied, it is reclassified as property, plant and equipment, and its fair value at the date of reclassification becomes its cost for accounting purposes.
Where an investment property undergoes a change in use, evidenced by commencement of development with a view to sale, the property is transferred to properties for/under development. The property’s deemed cost for subsequent accounting as properties for/under development is its fair value at the date of change in use.
141Notes to the Financial Statements
3 PRINCIPAL ACCOUNTING POLICIES (CONTINUED)
(e) Investment properties (continued)If an owner-occupied property becomes an investment property because its use has changed, any difference resulting between the carrying amount and the fair value of this property at the date of transfer is recognised in equity as a revaluation of property, plant and equipment. However, if the fair value of the property at the date of transfer which results in a reversal of the previous impairment loss, the write-back is recognised in the consolidated income statement.
For a transfer from properties for/under development or property held for sale to investment properties that will be carried at fair value, any difference between the fair value of the property at that date and its previous carrying amount shall be recognised in the consolidated income statement. Transfers to investment properties shall be made when, and only when, there is a change in use. The inception of an operating lease to another party is generally an evidence of a change in use. A change in use has occurred is based on an assessment of all relevant facts and circumstances. The relevant facts include but not limited to the Group’s business plan, financial resources and legal requirements.
(f) Property, plant and equipmentProperty, plant and equipment are stated at historical cost less accumulated depreciation and impairment losses. Historical cost includes expenditure that is directly attributable to the acquisition of assets. Subsequent costs are included in the carrying amount of the assets or recognised as a separate asset, as appropriate, only when it is probable that future economic benefits associated with the asset will flow to the Group and the cost of the asset can be measured reliably. The carrying amount of the replaced part is derecognised. All other repair and maintenance costs are charged in the consolidated income statement during the financial period in which they are incurred. The carrying amount of an asset is written down immediately to its recoverable amount if the carrying value of an asset is greater than its estimated recoverable amount.
(i) Assets under constructionAll direct costs relating to the construction of property, plant and equipment, including borrowing costs during the construction period are capitalised as the costs of the assets.
(ii) DepreciationNo depreciation is provided on assets under construction until such time when the relevant assets are completed and available for intended use.
Leasehold land classified as finance lease commences amortisation from the time when the land interest becomes available for its intended use. Amortisation on leasehold land classified as finance lease and depreciation on other assets is calculated using the straight-line method to allocate their cost to their residual values over their estimated useful lives, as follows:
Leasehold land classified as finance lease Shorter of remaining lease term of 10 to over 50 years or useful life
Buildings 20 to 40 yearsOther assets 2 to 25 years
The residual values and useful lives of the assets are reviewed, and adjusted if appropriate, at the end of each reporting period.
(iii) Gain or loss on disposalThe gain or loss on disposal of property, plant and equipment is determined by comparing the difference between the net sales proceeds and the carrying amount of the relevant asset, and is recognised in the consolidated income statement.
New
Wor
ld D
evel
opm
ent
Com
pany
Lim
ited
142A
nnua
l Rep
ort
2019
Notes to the Financial Statements
3 PRINCIPAL ACCOUNTING POLICIES (CONTINUED)
(g) Impairment of investments in subsidiaries, joint ventures, associated companies and non-financial assetsNon-financial assets that have an indefinite useful life, for example goodwill, or have not yet been available for use are not subject to amortisation and are tested annually for impairment. Other assets are reviewed for impairment whenever events or changes in circumstances indicate that the carrying amount may not be recoverable. The carrying amount of an asset is written down immediately to its recoverable amount if the carrying amount of the asset is greater than its estimated recoverable amount. An impairment loss is recognised in the consolidated income statement for the amount by which the carrying amount of an asset exceeds its recoverable amount. The recoverable amount is the higher of its fair value less costs of disposal and value in use. For the purpose of assessing impairment, assets are grouped as cash-generating units for which there are separately identifiable cash flows. Non-financial assets other than goodwill that suffered an impairment are reviewed for possible reversal of the impairment at the end of each reporting period.
Impairment testing of the interests in subsidiaries, joint ventures or associated companies is required upon receiving dividends from these interests if the dividend exceeds the total comprehensive income of the subsidiaries, joint ventures or associated companies in the period the dividend is declared or if the carrying amount of the interest in the separate financial statements exceeds the carrying amount in the consolidated financial statements of the investee’s net assets including goodwill.
(h) Investments and other financial assets Accounting policies applied before 1 July 2018
The Group classified its investments in the categories of financial assets at FVPL, loans and receivables, held-to-maturity investments, and available-for-sale financial assets. Management determined the classification of its investments at initial recognition depending on the purpose for which the investments were acquired.
(i) Financial assets at FVPLThe Group classified financial assets held for trading and those designated as FVPL at inception under certain circumstances as financial assets at FVPL. A financial asset was classified in this category if acquired principally for the purpose of selling in the short-term or if so designated by management. They were presented as current assets if they were expected to be settled within 12 months after the end of the reporting period; otherwise, they were classified as non-current.
(ii) Loans and receivablesLoans and receivables were non-derivative financial assets with fixed or determinable payments that were not quoted in an active market. They arose when the Group provided money, goods or services directly to a debtor with no intention of trading the receivable and were included in current assets, except for those with maturities more than 12 months after the end of the reporting period, which were classified as non-current assets.
(iii) Held-to-maturity investmentsHeld-to-maturity investments were non-derivative financial assets with fixed or determinable payments and fixed maturities that management had the positive intention and ability to hold to maturity. Held-to-maturity financial assets were included in non-current assets, except for those with maturities less than 12 months from the end of the reporting period, which were classified as current assets.
143Notes to the Financial Statements
3 PRINCIPAL ACCOUNTING POLICIES (CONTINUED)
(h) Investments and other financial assets (continued) Accounting policies applied before 1 July 2018 (continued) (iv) Available-for-sale financial assets
Investments were designated as available-for-sale financial assets if they did not have fixed maturities and fixed or determinable payments, and management intended to hold them for the medium to long-term. Financial assets that were not classified into any of the other categories were also included in the available-for-sale category.
The financial assets were presented as non-current assets unless they matured, or management intended to dispose of them within 12 months of the end of the reporting period.
Regular way purchases and sales of financial assets were recognised on trade-date, which was the date on which the Group committed to purchase or sell the asset. Financial assets were derecognised when the rights to receive cash flows from the financial assets had expired or had been transferred and the Group had transferred substantially all risks and rewards of ownership.
Available-for-sale financial assets and financial assets at FVPL were subsequently carried at fair value. Loans and receivables and held-to-maturity investments were carried at amortised cost using the effective interest method.
Gains and losses arising from changes in the fair value of the financial assets at FVPL were included in the consolidated income statement in the financial period in which they arose. Changes in the fair value of available-for-sale financial assets were recognised in other comprehensive income. When available-for-sale financial assets were sold, the accumulated fair value adjustments were included in the consolidated income statement as gains or losses from financial assets. Changes in the fair value of monetary financial assets denominated in a foreign currency and classified as available-for-sale were analysed between translation differences resulting from changes in amortised cost of the financial asset and other changes in the carrying amount of the financial asset. The translation differences on monetary financial assets were recognised in the consolidated income statement; translation differences on non-monetary financial assets were recognised in the consolidated statement of comprehensive income.
Financial assets and liabilities were offset and the net amount was reported in the consolidated statement of financial position when there was a legally enforceable right to offset the recognised amounts and there was an intention to settle on a net basis or realise the asset and settle the liability simultaneously.
The fair values of listed investments were based on quoted bid prices at the end of the reporting period. If the market for a financial asset was not active and for unlisted financial assets, the Group established fair value by using valuation techniques. These included the use of recent arm’s length transactions, reference to other instruments that were substantially the same, discounted cash flow analysis and option pricing models, making maximum use of market inputs and relying as little as possible on entity-specific inputs.
New
Wor
ld D
evel
opm
ent
Com
pany
Lim
ited
144A
nnua
l Rep
ort
2019
Notes to the Financial Statements
3 PRINCIPAL ACCOUNTING POLICIES (CONTINUED)
(h) Investments and other financial assets (continued) Accounting policies applied from 1 July 2018 (i) Classification
From 1 July 2018, the Group classifies its financial assets in the following measurement categories:
(a) those to be measured subsequently at fair value (either through other comprehensive income (“OCI”), or through profit or loss), and
(b) those to be measured at amortised cost.
The classification depends on the entity’s business model for managing the financial assets and the contractual terms of the cash flows.
For assets measured at fair value, gains and losses will either be recorded in the consolidated income statement or consolidated statement of comprehensive income. For investments in debt instruments, this will depend on the business model in which the investment is held. For investments in equity instruments that are not held for trading, this will depend on whether the Group has made an irrevocable election at the time of initial recognition to account for the equity investment at fair value through OCI.
The Group reclassifies debt investments when and only when its business model for managing those assets changes.
(ii) Recognition and derecognitionRegular way purchases and sales of financial assets are recognised on trade-date, the date on which the Group commits to purchase or sell the asset. Financial assets are derecognised when the rights to receive cash flows from the financial assets have expired or have been transferred and the Group has transferred substantially all the risks and rewards of ownership.
(iii) MeasurementExcept for trade debtors that do not have a significant financing component, at initial recognition, the Group measures a financial asset at its fair value plus, in the case of a financial asset not at FVPL, transaction costs that are directly attributable to the acquisition of the financial asset. Transaction costs of financial assets carried at FVPL are expensed in the consolidated income statement.
Financial assets with embedded derivatives are considered in their entirety when determining whether their cash flows are solely payment of principal and interest.
145Notes to the Financial Statements
3 PRINCIPAL ACCOUNTING POLICIES (CONTINUED)
(h) Investments and other financial assets (continued) Accounting policies applied from 1 July 2018 (continued) (iii) Measurement (continued) Debt instruments
Subsequent measurement of debt instruments depends on the Group’s business model for managing the asset and the cash flow characteristics of the asset. There are three measurement categories into which the Group classifies its debt instruments:
(a) Amortised costAssets that are held for collection of contractual cash flows where those cash flows represent solely payments of principal and interest are measured at amortised cost. A gain or loss on a debt investment that is subsequently measured at amortised cost and is not part of a hedging relationship is recognised in the consolidated income statement when the asset is derecognised or impaired. Interest income from these financial assets is recognised in the consolidated income statement using the effective interest method.
(b) Financial assets at FVOCIAssets that are held for collection of contractual cash flows and for selling the financial assets, where the assets’ cash flows represent solely payments of principal and interest, are measured at FVOCI. Movements in the carrying amount are taken through OCI, except for the recognition of impairment losses or gains, interest revenue and foreign exchange gains and losses which are recognised in the consolidated income statement. When the financial asset is derecognised, the cumulative gain or loss previously recognised in OCI is reclassified from equity to the consolidated income statement. Interest income from these financial assets is recognised in the consolidated income statement using the effective interest method.
(c) Financial assets at FVPLAssets that do not meet the criteria for amortised cost or FVOCI are measured at FVPL. A gain or loss on a debt investment that is subsequently measured at FVPL and is not part of a hedging relationship is recognised in the consolidated income statement and presented in the period in which it arises.
Equity instrumentsThe Group subsequently measures all equity investments at fair value. Where the Group’s management has elected to present fair value gains and losses on equity investments in OCI, there is no subsequent reclassification of fair value gains and losses to the consolidated income statement following the derecognition of the investment. Dividends from such investments continue to be recognised in the consolidated income statement as other income when the Group’s right to receive payments is established.
Changes in the fair value of financial assets at FVPL are recognised in the consolidated income statement. Impairment losses (and reversal of impairment losses) on equity investments measured at FVOCI are not reported separately from other changes in fair value.
New
Wor
ld D
evel
opm
ent
Com
pany
Lim
ited
146A
nnua
l Rep
ort
2019
Notes to the Financial Statements
3 PRINCIPAL ACCOUNTING POLICIES (CONTINUED)
(i) Derivative financial instruments and hedging activitiesA derivative is initially recognised at fair value on the date a derivative contract is entered into and is subsequently remeasured at its fair value at the end of each reporting period. The accounting for subsequent changes in fair value depends on whether the derivative is designated as a hedging instrument, and if so, the nature of the item being hedged. The Group designates certain derivatives as hedges of a particular risk associated with the cash flows of recognised assets and liabilities and highly probable forecast transactions (cash flow hedges).
At the inception of the hedging, the Group documents the economic relationship between hedging instruments and hedged items, including whether changes in the cash flows of the hedging instruments are expected to offset changes in the cash flows of hedges items. The Group documents its risk management objective and strategy for undertaking its hedge transactions.
The fair values of derivative financial instruments designated in hedge relationships are disclosed in note 26. The full fair value of a hedging derivative is classified as a non-current asset or liability when the remaining maturity of the hedged item is more than 12 months; it is classified as a current asset or liability when the remaining maturity of the hedged item is less than 12 months. Trading derivatives are classified as a current asset or liability.
Cash flow hedge that qualify for hedge accountingThe effective portion of changes in the fair value of derivatives that are designated and qualify as cash flow hedges is recognised in the other reserves within equity. The gain or loss relating to the ineffective portion is recognised immediately in the consolidated income statement.
Amounts accumulated in equity are transferred to the consolidated income statement in the periods when the hedged item affects profit or loss. The gain or loss relating to the effective portion of the hedging instrument is recognised in the consolidated income statement at the same time as the expense on the hedged items.
When a hedging instrument expires, or is sold or terminated, or when a hedge no longer meets the criteria for hedge accounting, any cumulative deferred gain or loss in equity at that time remains in equity until the forecast transaction occurs. When the forecast transaction is no longer expected to occur, the cumulative gain or loss that were reported in equity are immediately reclassified to the consolidated income statement.
Hedge effectiveness is determined at the inception of the hedge relationship, and through periodic prospective effectiveness assessments to ensure that an economic relationship exists between the hedged item and hedging instrument.
The Group enters into hedge relationships where the critical terms of the hedging instrument match exactly with the terms of the hedged item. The Group therefore performs a qualitative assessment of effectiveness. If changes in circumstances affect the terms of the hedged item such that the critical terms no longer match exactly with the critical terms of the hedging instrument, the Group uses the hypothetical derivative method to assess effectiveness.
Hedge ineffectiveness may occur due to:
• the credit/debit value adjustment on the hedging instrument which is not matched by the hedged item; and
• differences in critical terms between the hedged item and hedging instrument.
Derivatives that do not qualify for hedge accountingCertain derivative instruments do not qualify for hedge accounting. Changes in the fair value of any derivative instruments that do not qualify for hedge accounting are recognised immediately in the consolidated income statement.
147Notes to the Financial Statements
3 PRINCIPAL ACCOUNTING POLICIES (CONTINUED)
(j) Impairment of financial assets Accounting policies applied before 1 July 2018 (i) Assets carried at amortised cost
The Group assessed at the end of each reporting period whether there was objective evidence that a financial asset or group of financial assets was impaired. A financial asset or a group of financial assets was impaired and impairment losses were incurred only if there was objective evidence of impairment as a result of one or more events that occurred after the initial recognition of the asset (a “loss event”) and that loss event (or events) had an impact on the estimated future cash flows of the financial asset or group of financial assets that could be reliably estimated.
The criteria that the Group used to determine that there is objective evidence of an impairment loss included:
• Significant financial difficulty of the issuer or obligor;
• A breach of contract, such as a default or delinquency in interest or principal payments;
• The Group, for economic or legal reasons relating to the borrower’s financial difficulty, granting to the borrower a concession that the lender would not otherwise consider;
• It became probable that the borrower would enter bankruptcy or other financial reorganisation;
• The disappearance of an active market for that financial asset because of financial difficulties; or
• Observable data indicating that there was a measurable decrease in the estimated future cash flows from a portfolio of financial assets since the initial recognition of those assets, although the decrease could not yet be identified with the individual financial assets in the portfolio, including:
(1) adverse changes in the payment status of borrowers in the portfolio; or
(2) national or local economic conditions that correlate with defaults on the assets in the portfolio.
The Group first assessed whether objective evidence of impairment existed.
The amount of the loss was measured as the difference between the asset’s carrying amount and the present value of estimated future cash flows (excluding future credit losses that have not been incurred) discounted at the financial asset’s original effective interest rate. The carrying amount of the asset was reduced and the amount of the loss was recognised in the consolidated income statement. If a loan or held-to-maturity investment had a variable interest rate, the discount rate for measuring any impairment loss was the current effective interest rate determined under the contract. As a practical expedient, the Group might measure impairment on the basis of an instrument’s fair value using an observable market price.
If, in a subsequent period, the amount of the impairment loss decreased and the decrease could be related objectively to an event occurring after the impairment was recognised (such as an improvement in the debtor’s credit rating), the reversal of the previously recognised impairment loss was recognised in the consolidated income statement.
New
Wor
ld D
evel
opm
ent
Com
pany
Lim
ited
148A
nnua
l Rep
ort
2019
Notes to the Financial Statements
3 PRINCIPAL ACCOUNTING POLICIES (CONTINUED)
(j) Impairment of financial assets (continued) Accounting policies applied before 1 July 2018 (continued) (ii) Assets classified as available-for-sale
If there was objective evidence of impairment for available-for-sale financial assets, the cumulative loss — measured as the difference between the acquisition cost and the current fair value, less any impairment loss on that financial asset previously recognised in the consolidated income statement — was removed from equity and recognised in the consolidated income statement. Impairment losses recognised in the consolidated income statement on equity instruments were not reversed through the consolidated income statement. If the fair value of a debt instrument classified as available-for-sale increased and the increase could be objectively related to an event occurring after the impairment loss was recognised in consolidated income statement, the impairment loss was reversed through the consolidated income statement.
Accounting policies applied from 1 July 2018The Group has two types of financial assets subject to HKFRS 9’s expected credit loss (“ECL”) model:
• trade debtors and contract assets; and
• debt investments carried at amortised cost.
The impairment methodology applied depends on whether there has been a significant increase in credit risk. Note 5(b) details how the Group determines whether there has been a significant increase in credit risk.
(i) Trade debtors and contract assetsFor trade debtors and contract assets, the Group applies the simplified approach to providing for ECLs, which requires the use of the lifetime expected loss allowance for all trade debtors and contract assets.
(ii) Debt investments at amortised cost and at FVOCIDebt investments at amortised cost and at FVOCI are considered to be low risk, and thus the loss allowance is determined as 12 months ECLs using general ECL model.
(k) Properties for/under developmentProperties for/under development comprise leasehold land and land use rights, development expenditure and borrowing costs capitalised, and are carried at the lower of cost and net realisable value. Net realisable value takes into account the proceeds ultimately expected to be realised, less applicable variable selling expenses and the anticipated costs to complete. Upon completion, the properties are transferred to properties held for sale. Properties under development included in the current assets are expected to be realised in, or is intended for sale in the Group’s normal operating cycle.
(l) Properties held for saleProperties held for sale are initially measured at the carrying amount of the property at the date of reclassification from properties under development. Subsequently, properties held for sale are carried at the lower of cost and net realisable value. Net realisable value is determined by reference to management estimates based on prevailing market conditions.
149Notes to the Financial Statements
3 PRINCIPAL ACCOUNTING POLICIES (CONTINUED)
(m) InventoriesInventories are stated at the lower of cost and net realisable value. Cost is calculated on the weighted average basis. Net realisable value is determined on the basis of anticipated sales proceeds less estimated selling expenses.
(n) Trade and other debtorsTrade and other debtors are amounts due from customers for merchandise sold or services performed in the ordinary course of business. If collection of trade and other debtors is expected in one year or less (or in the normal operating cycle of the business if longer), they are classified as current assets. If not, they are presented as non-current assets.
Trade and other debtors are recognised initially at fair value and subsequently measured at amortised cost using the effective interest method, less provision for impairment. Details of impairment of trade debtors is disclosed in note 3(j).
(o) Contract assets and contract liabilitiesUpon entering into a contract with a customer, the Group obtains rights to receive consideration from the customer and assumes performance obligations to transfer goods or provide services to the customer.
The combination of those rights and performance obligations gives rise to a net contract asset or a net contract liability depending on the relationship between the remaining rights and the performance obligations. The contract is an asset and recognised as contract assets if the cumulative revenue recognised in the consolidated income statement exceeds cumulative payments made by customers. Conversely, the contract is a liability and recognised as contract liabilities if the cumulative payments made by customers exceeds the revenue recognised in the consolidated income statement.
Contract assets are assessed for impairment under the same approach adopted for impairment assessment of financial assets carried at amortised cost. Contract liabilities are recognised as revenue when the Group transfers the goods or services to the customers and therefore satisfies its performance obligation.
The incremental costs of obtaining a contract with a customer are capitalised and presented as contract related assets, if the Group expects to recover those costs, and are subsequently amortised on a systematic basis that is consistent with the transfer to the customers of the goods or services to which the assets relate. The Group recognises an impairment loss in the consolidated income statement to the extent that the carrying amount of the contract related assets recognised exceeds the remaining amounts of consideration that the Group expects to receive less the costs that directly relate to those goods or services and have not been recognised as expenses. Details of impairment of contract assets are disclosed in note 3(j).
(p) Cash and cash equivalentsIn the consolidated statement of cash flows, cash and cash equivalents include cash in hand, deposits held at call with banks, other short-term highly liquid investments with original maturities of three months or less and bank overdrafts. Bank overdrafts are shown within borrowings under current liabilities in the consolidated statement of financial position.
(q) Share capitalOrdinary shares are classified as equity.
Incremental costs directly attributable to the issue of new shares or options are shown in equity as a deduction, net of tax, from the proceeds.
New
Wor
ld D
evel
opm
ent
Com
pany
Lim
ited
150A
nnua
l Rep
ort
2019
Notes to the Financial Statements
3 PRINCIPAL ACCOUNTING POLICIES (CONTINUED)
(r) Perpetual capital securitiesPerpetual capital securities with no contracted obligation to repay its principal or to pay any distribution are classified as part of equity.
(s) Trade and other payablesTrade and other payables are obligations to pay for goods or services that have been acquired in the ordinary course of business from suppliers. Trade and other payables are classified as current liabilities if payment is due within one year or less (or in the normal operating cycle of the business if longer). If not, they are presented as non-current liabilities.
Trade and other payables are recognised initially at fair value and subsequently measured at amortised cost using the effective interest method.
(t) ProvisionsProvisions are recognised when the Group has a present legal or constructive obligation as a result of past events; it is probable that an outflow of resources will be required to settle the obligation; and the amount has been reliably estimated.
Where there are a number of similar obligations, the likelihood that an outflow will be required in settlement is determined by considering the class of obligations as a whole. A provision is recognised even if the likelihood of an outflow with respect to any one item included in the same class of obligations may be small.
Provisions are measured at the present value of the expenditures expected to be required to settle the obligation using a pre-tax rate that reflects current market assessments of the time value of money and the risks specific to the obligation. The increase in the provision due to passage of time is recognised as interest expense.
(u) Contingent liabilities and contingent assetsA contingent liability is a possible obligation that arises from past events and whose existence will only be confirmed by the occurrence or non-occurrence of one or more uncertain future events not wholly within the control of the Group. It can also be a present obligation arising from past events that is not recognised because it is not probable that outflow of economic resources will be required or the amount of obligation cannot be measured reliably.
A contingent liability, other than that assumed in a business combination, is not recognised but is disclosed in the notes to the consolidated financial statements. When a change in the probability of an outflow occurs so that outflow is probable, it will then be recognised as a provision.
A contingent asset is a possible asset that arises from past events and whose existence will be confirmed only by the occurrence or non-occurrence of one or more uncertain events not wholly within the control of the Group.
A contingent asset is not recognised but is disclosed in the notes to the consolidated financial statements when an inflow of economic benefits is probable. When inflow is virtually certain, an asset is recognised.
151Notes to the Financial Statements
3 PRINCIPAL ACCOUNTING POLICIES (CONTINUED)
(v) Current and deferred income taxThe income tax expense or credit for the period is the tax payable on the current period’s taxable income based on the applicable income tax rate for each jurisdiction adjusted by changes in deferred tax assets and liabilities attributable to temporary differences and to unused tax losses.
The current income tax charge is calculated on the basis of the tax laws enacted or substantively enacted at the end of the reporting period in the countries where the Group, joint ventures and associated companies operate and generate taxable income. Management periodically evaluates positions taken in tax returns with respect to situations in which applicable tax regulation is subject to interpretation and establishes provisions where appropriate on the basis of amounts expected to be paid to the tax authorities.
Deferred income tax is provided in full, using the liability method, on temporary differences arising between the tax bases of assets and liabilities and their carrying amounts in the consolidated financial statements. However, the deferred tax liabilities are not recognised if they arise from the initial recognition of goodwill. Deferred income tax is also not accounted for if it arises from initial recognition of an asset or liability in a transaction other than a business combination that at the time of transaction affects neither accounting nor taxable profit or loss. Deferred income tax is determined using tax rates and laws that have been enacted or substantively enacted by the end of the reporting period and are expected to apply when the related deferred income tax asset is realised or the deferred income tax liability is settled.
The deferred tax liability in relation to investment property that is measured at fair value is determined assuming the property will be recovered entirely through sale.
Deferred income tax assets are recognised to the extent that it is probable that future taxable profit will be available against which the temporary differences can be utilised.
Deferred income tax is provided on temporary differences arising on investments in subsidiaries, joint ventures and associated companies, except where the timing of the reversal of the temporary difference can be controlled and it is probable that the temporary difference will not reverse in the foreseeable future.
Deferred income tax assets and liabilities are offset when there is a legally enforceable right to offset current tax assets and liabilities and when the deferred tax balances relate to the same taxation authority. Current tax assets and tax liabilities are offset where the entity has a legally enforceable right to offset and intends either to settle on a net basis, or to realise the asset and settle the liability simultaneously.
Current and deferred tax is recognised in consolidated income statement, except to the extent that it relates to items recognised in other comprehensive income or directly in equity. In this case, the tax is also recognised in other comprehensive income or directly in equity, respectively.
(w) BorrowingsBorrowings are recognised initially at fair value, net of transaction costs incurred. Borrowings are subsequently stated at amortised cost; any difference between the proceeds (net of transaction costs) and the redemption value is recognised in the consolidated income statement or capitalised on the basis set out in note 3(z) over the period of the borrowings using the effective interest method where appropriate.
Borrowings are classified as current liabilities unless the Group has an unconditional right to defer settlement of the liability for at least 12 months after the end of the reporting period.
New
Wor
ld D
evel
opm
ent
Com
pany
Lim
ited
152A
nnua
l Rep
ort
2019
Notes to the Financial Statements
3 PRINCIPAL ACCOUNTING POLICIES (CONTINUED)
(x) Revenue recognitionRevenue comprises the fair value of the consideration received or receivable for the sale of goods and services rendered in the ordinary course of the Group’s activities. Revenue is shown net of value-added tax, returns, rebates and discounts, allowances for credit and other revenue reducing factors after eliminating sales within the Group.
Revenue is recognised when it is probable that future economic benefits will flow to the Group and specific criteria for each of the activities have been met. Estimates are based on historical results, taking into consideration the type of customers, the type of transactions and the specifics of each arrangement.
(i) RentalRental is recognised in the consolidated income statement on a straight-line basis over the lease term.
(ii) Property salesRevenue is recognised when or as the control of the asset is transferred to the customer. Depending on the terms of the contract and the laws that apply to the contract, control of the asset may be transferred over time or at a point in time. If properties have no alternative use to the Group contractually and the Group has an enforceable right to payment from the customers for performance completed to date, the Group satisfies the performance obligation over time and therefore, recognises revenue over time in accordance with the input method for measuring progress. Otherwise, revenue is recognised at a point in time when the customer obtains control of the completed property.
The progress towards complete satisfaction of the performance obligation is measured based on the Group’s efforts or inputs to the satisfaction of the performance obligation, by reference to the contract costs incurred up to the end of reporting period as a percentage of total estimated costs for each contract.
For property development and sales contract for which the control of the property is transferred at a point in time, revenue is recognised when the customer obtains the physical possession or the legal title of the completed property and the Group has present right to payment and the collection of the consideration is probable.
In determining the transaction price, the Group adjusts the promised amount of consideration for the effect of a financing component if it is significant.
(iii) Construction revenueRevenue from construction service contract is recognised over the period of the contract by reference to the progress towards complete satisfaction of that performance obligation using input method.
(iv) Service feesProperty and facilities management service fees, property letting agency fee are recognised when services are rendered.
(v) Infrastructure operationsToll revenue from road and bridge operations, port revenue from cargo, container handling and storage are recognised when services are rendered.
153Notes to the Financial Statements
3 PRINCIPAL ACCOUNTING POLICIES (CONTINUED)
(x) Revenue recognition (continued) (vi) Sales of goods
Income from sales of goods is recognised at a point in time when the goods are delivered to customers and title has passed.
(vii) Fare revenueFare revenue from bus and ferry services is recognised at a point in time when the services are rendered.
(viii) Hotel operationsRevenue from hotel and restaurant operations is recognised upon provision of the services.
(ix) Department store operationsRevenue from sale of goods to retail customers is recognised when the Group sells the product to the customers and the revenue from sale of goods to wholesalers is recognised when control of the products has transferred, being when the products are delivered to the wholesaler. The Group recognises commission income from concessionaire sales upon sale of goods or provision of services by counter suppliers. Payments received in advance that are related to sales of goods or provision of services not yet delivered to customers are deferred and recognised as contract liabilities. Revenue is recognised when goods or services are delivered to customers.
Marketing or promotional offer made to customers at the time of the sale of goods is a separate performance obligation, and the likelihood of settlement of the outstanding performance obligation must be estimated and allocated to the consideration received.
(x) InterestInterest is recognised on a time proportion basis using the effective interest method. When a receivable is impaired, the Group reduces the carrying amount to its recoverable amount, being the estimated future cash flow discounted at the original effective interest rate of the instrument, and continues unwinding the discount as interest income. Interest income on impaired receivables is recognised using the original effective interest rate.
(xi) DividendDividend is recognised when the right to receive payment is established.
(y) Leases (i) Finance leases
Leases that transfer to the Group, as lessee, substantially all the risks and rewards of ownership of assets are classified as finance leases. Finance leases are capitalised at the lease’s inception at the fair value of the leased assets or, if lower, the present value of minimum lease payments. Each lease payment is allocated between the liability and finance cost so as to achieve a constant rate on the finance balance outstanding. The corresponding rental obligations, net of finance charges, are included in liabilities, as creditors, accrued charges and contract liabilities. The finance charges are charged to the consolidated income statement over the lease period so as to produce a constant periodic rate of interest on the remaining balance of the liability for each period.
Assets held under finance leases are depreciated on the basis described in note 3(f)(ii) above.
(ii) Operating leasesLeases in which a significant portion of the risks and rewards of ownership are not transferred to the Group as lessee are classified as operating leases. Payments made under operating leases (net of any incentives received from the lessor) are charged to the consolidated income statement on a straight-line basis over the period of the lease.
New
Wor
ld D
evel
opm
ent
Com
pany
Lim
ited
154A
nnua
l Rep
ort
2019
Notes to the Financial Statements
3 PRINCIPAL ACCOUNTING POLICIES (CONTINUED)
(z) Borrowing costBorrowing costs incurred for the construction of any qualifying assets are capitalised during the period of time that is required to complete and prepare the asset for its intended use. Other borrowing costs are expensed as incurred.
Borrowing costs include interest expense, finance charges in respect of finance lease and exchange differences arising from foreign currency borrowings to the extent that they are regarded as an adjustment to interest costs. The exchange gains and losses that are an adjustment to interest costs include the interest rate differential between borrowing costs that would be incurred if the entity had borrowed funds in its functional currency, and the borrowing costs actually incurred on foreign currency borrowings. Such amounts are estimated based on forward currency rates at the inception of the borrowings.
When the construction of the qualifying assets takes more than one accounting period, the amount of foreign exchange differences eligible for capitalisation is determined on a cumulative basis based on the cumulative amounts of interest expenses that would have been incurred had the entity borrowed in its functional currency. The total amount of foreign exchange differences capitalised cannot exceed the amount of total net foreign exchange differences incurred on a cumulative basis at the end of the reporting period.
(aa) Employee benefits (i) Employee leave entitlements
Employee entitlements to annual leave are recognised when they accrue to employees. A provision is made for the estimated liability for annual leave as a result of services rendered by employees up to the end of the reporting period. Employee entitlements to sick leave and maternity leave are not recognised until the time of leave.
(ii) Bonus plansProvision for bonus plans are recognised when the Group has a present legal or constructive obligation as a result of services rendered by employees and a reliable estimate of the obligation can be made.
(iii) Defined contribution plansA defined contribution plan is a pension plan under which the Group pays contributions into a separate entity. The Group has no legal or constructive obligations to pay further contributions if the fund does not hold sufficient assets to pay all employees the benefits relating to employee service in the current and prior periods. Contributions to defined contribution plans, including the Mandatory Provident Fund Scheme and employee pension schemes established by municipal government in The People’s Republic of China (“PRC”) are expensed as incurred. Contributions are reduced by contributions forfeited by those employees who leave the schemes prior to vesting fully in the contributions, where applicable.
155Notes to the Financial Statements
3 PRINCIPAL ACCOUNTING POLICIES (CONTINUED)
(aa) Employee benefits (continued) (iv) Defined benefit plans
Defined benefit plans define an amount of pension benefit that an employee will receive on retirement, usually dependent on one or more factors such as age, years of service and compensation.
The liability recognised in the consolidated statement of financial position in respect of defined benefit pension plans is the present value of the defined benefit obligation at the end of the reporting period less the fair value of plan assets. The defined benefit obligation is calculated annually by independent actuaries using the projected unit credit method. The present value of the defined benefit obligation is determined by discounting the estimated future cash outflows using interest rates of high-quality corporate bonds that are denominated in the currency in which the benefits will be paid, and that have terms to maturity approximating to the terms of the related pension obligation. In countries where there is no deep market in such bonds, the market rates on government bonds are used.
Actuarial gains and losses arising from experience adjustments and changes in actuarial assumptions are charged or credited to equity in other comprehensive income in the period in which they arise. Past-service costs are recognised immediately in the consolidated income statement.
(v) Share-based compensationThe Group operates a number of equity-settled, share-based compensation plans. The fair value of the employee services received in exchange for the grant of share options is recognised as an expense. The total amount to be expensed over the vesting period is determined by reference to the fair value of the options granted at the date of grant, excluding the impact of any non-market vesting conditions. At the end of each reporting period, the Group revises its estimates of the number of options that are expected to vest. It recognises the impact of the revision of original estimates, if any, in the consolidated income statement, with a corresponding adjustment to equity.
The proceeds received net of any directly attributable transaction costs are credited to share capital (nominal value) when the options are exercised.
On lapse of share options according to the plan, corresponding amount recognised in employees’ share-based compensation reserve is transferred to retained profits.
The grant by the Company of options over its equity instruments to the employees of subsidiary undertakings in the Group is treated as a capital contribution. The fair value of employee services received, measured by reference to the grant date fair value, is recognised over the vesting period as an increase to investment in subsidiary undertakings, with a corresponding credit to equity in the parent entity accounts.
New
Wor
ld D
evel
opm
ent
Com
pany
Lim
ited
156A
nnua
l Rep
ort
2019
Notes to the Financial Statements
3 PRINCIPAL ACCOUNTING POLICIES (CONTINUED)
(ab) Foreign currencies (i) Functional and presentation currency
Items included in the financial statements of each of the Group’s entities are measured using the currency of the primary economic environment in which the entity operates (the “functional currency”). The consolidated financial statements are presented in Hong Kong dollar, which is the Company’s functional and presentation currency.
(ii) Transactions and balancesForeign currency transactions are translated into the functional currency using the exchange rates at the dates of the transactions. Foreign exchange gains and losses resulting from the settlement of such transactions and from the translation of monetary assets and liabilities denominated in foreign currencies at the exchange rates ruling at the end of the reporting period are recognised in the consolidated income statement.
Non-monetary items that are measured at fair value in a foreign currency are translated using the exchange rates at the date when the fair value was determined. Translation differences on assets and liabilities carried at fair value are reported as part of fair value gain or loss. For example, translation differences on financial assets and liabilities held at FVPL are reported as part of the fair value gain or loss. Translation differences on non-monetary financial assets at FVOCI are included in equity.
(iii) Group companiesThe results and financial position of foreign operations that have a functional currency different from the presentation currency are translated into the presentation currency as follows:
(1) assets and liabilities for each consolidated statement of financial position presented are translated at the exchange rate ruling at the date of that consolidated statement of the financial position;
(2) income and expenses for each consolidated income statement are translated at the average exchange rate during the period covered by the consolidated income statement;
(3) all resulting translation differences are recognised as a separate component of equity; and
(4) on the disposal of the Group’s entire interest in a foreign operation, or a disposal involving loss of control over a subsidiary that includes a foreign operation, all of the translation differences accumulated in equity in respect of that operation attributable to the equity holders of the company are reclassified to the consolidated income statement.
In the case of a partial disposal that does not result in the Group losing control over a subsidiary that includes a foreign operation, the proportionate share of accumulated translation differences are re-attributed to non-controlling interests and are not recognised in the consolidated income statement. For all other partial disposals (that is, reductions in the Group’s ownership interest in associated companies or joint ventures that do not result in the Group losing significant influence or joint control), the proportionate share of the accumulated translation difference is reclassified to the consolidated income statement.
Goodwill and fair value adjustments arising on the acquisition of a foreign operation are treated as assets and liabilities of the foreign operation and translated at the exchange rate ruling at the end of the reporting period.
157Notes to the Financial Statements
3 PRINCIPAL ACCOUNTING POLICIES (CONTINUED)
(ac) Insurance contractsThe Group assesses at the end of each reporting period the liabilities under its insurance contracts using current estimates of future cash flows. If the carrying amount of the relevant insurance liabilities is less than the best estimate of the expenditure required to settle the relevant insurance liabilities at the end of the reporting period, the Group recognises the entire difference in the consolidated income statement. These estimates are recognised only when the outflow is probable and the estimates can be reliably measured.
The Group regards its financial guarantee contracts in respect of mortgage facilities provided to certain property purchasers, guarantees provided to its related parties and tax indemnity provided to its non-wholly owned subsidiary as insurance contracts.
(ad) Segment reportingOperating segments are reported in a manner consistent with the internal reporting provided to the chief operating decision-maker. The Board of Directors of the Company has appointed an Executive Committee which assess the financial performance and position of the Group, and makes strategic decisions. The Executive Committee, which has been identified as being the chief operating decision-maker, consists of executive directors of the Company.
Segment assets consist primarily of property, plant and equipment, land use rights, investment properties, intangible concession rights, intangible assets, financial assets at FVOCI, financial assets at FVPL, properties for development, other non-current assets, properties under development, properties held for sale, inventories and receivables and exclude derivative financial instruments, deferred tax assets, restricted bank balances and cash and bank balances. Segment liabilities comprise operating liabilities and exclude items such as current tax payable, deferred tax liabilities and borrowings.
(ae) Dividend distributionDividend distribution to the Company’s shareholders is recognised as a liability in the financial statements in the financial period when the dividends are approved by the Company’s shareholders/directors, where appropriate.
4 CHANGE IN ACCOUNTING POLICY
As explained in note 2 above, the Group has adopted HKFRS 9 from 1 July 2018, which resulted in changes in accounting policies and adjustments to the amounts recognised in the consolidated financial statements. As allowed in the transitional provision in HKFRS 9 (2014), comparative figures are not restated.
The effects of the adoption of HKFRS 9 are as follows:
Classification and measurement of financial instrumentsFrom 1 July 2018, the Group classifies its financial assets as those to be measured subsequently at fair value (either through OCI, or through profit or loss) and those to be measured at amortised cost. The classification depends on the Group’s business model for managing the financial assets and the contractual terms of the cash flows. Changes in accounting policies have been outlined in notes 3(h) and 3(j) above.
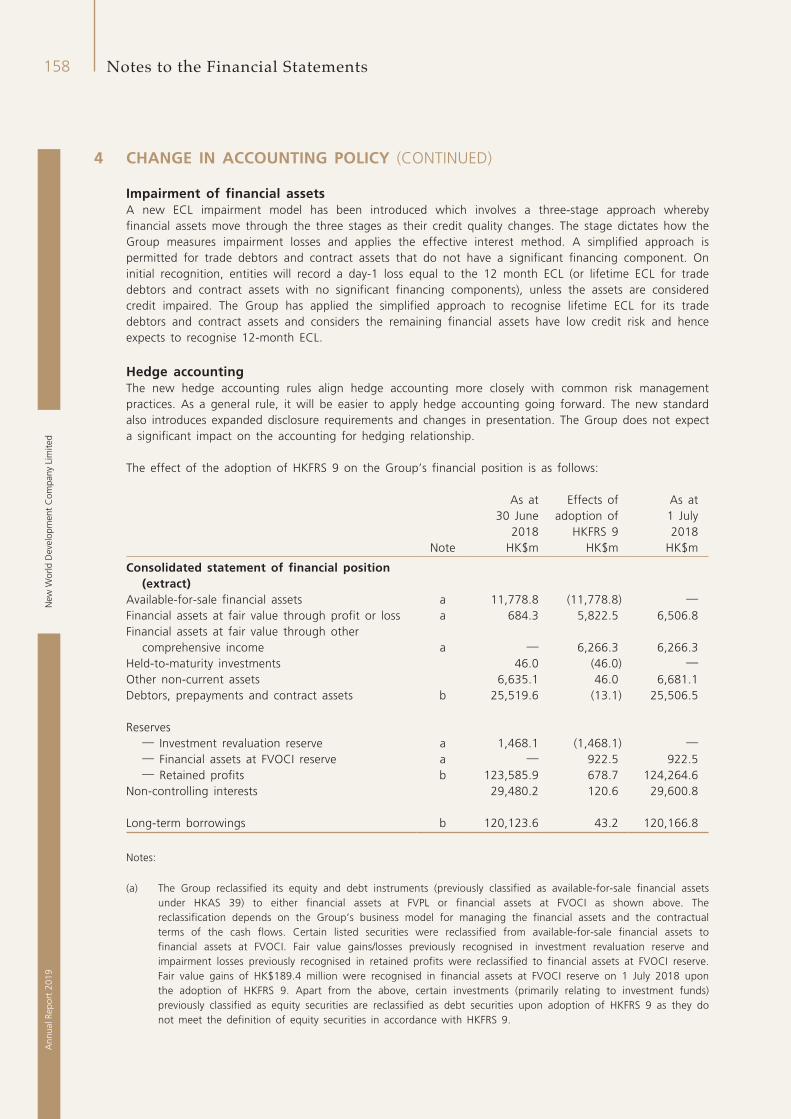
New
Wor
ld D
evel
opm
ent
Com
pany
Lim
ited
158A
nnua
l Rep
ort
2019
Notes to the Financial Statements
4 CHANGE IN ACCOUNTING POLICY (CONTINUED)
Impairment of financial assetsA new ECL impairment model has been introduced which involves a three-stage approach whereby financial assets move through the three stages as their credit quality changes. The stage dictates how the Group measures impairment losses and applies the effective interest method. A simplified approach is permitted for trade debtors and contract assets that do not have a significant financing component. On initial recognition, entities will record a day-1 loss equal to the 12 month ECL (or lifetime ECL for trade debtors and contract assets with no significant financing components), unless the assets are considered credit impaired. The Group has applied the simplified approach to recognise lifetime ECL for its trade debtors and contract assets and considers the remaining financial assets have low credit risk and hence expects to recognise 12-month ECL.
Hedge accountingThe new hedge accounting rules align hedge accounting more closely with common risk management practices. As a general rule, it will be easier to apply hedge accounting going forward. The new standard also introduces expanded disclosure requirements and changes in presentation. The Group does not expect a significant impact on the accounting for hedging relationship.
The effect of the adoption of HKFRS 9 on the Group’s financial position is as follows:
As at 30 June
2018
Effects of adoption of
HKFRS 9
As at 1 July 2018
Note HK$m HK$m HK$m
Consolidated statement of financial position (extract)
Available-for-sale financial assets a 11,778.8 (11,778.8) —Financial assets at fair value through profit or loss a 684.3 5,822.5 6,506.8Financial assets at fair value through other
comprehensive income a — 6,266.3 6,266.3Held-to-maturity investments 46.0 (46.0) —Other non-current assets 6,635.1 46.0 6,681.1Debtors, prepayments and contract assets b 25,519.6 (13.1) 25,506.5
Reserves— Investment revaluation reserve a 1,468.1 (1,468.1) —— Financial assets at FVOCI reserve a — 922.5 922.5— Retained profits b 123,585.9 678.7 124,264.6
Non-controlling interests 29,480.2 120.6 29,600.8
Long-term borrowings b 120,123.6 43.2 120,166.8
Notes:
(a) The Group reclassified its equity and debt instruments (previously classified as available-for-sale financial assets under HKAS 39) to either financial assets at FVPL or financial assets at FVOCI as shown above. The reclassification depends on the Group’s business model for managing the financial assets and the contractual terms of the cash flows. Certain listed securities were reclassified from available-for-sale financial assets to financial assets at FVOCI. Fair value gains/losses previously recognised in investment revaluation reserve and impairment losses previously recognised in retained profits were reclassified to financial assets at FVOCI reserve. Fair value gains of HK$189.4 million were recognised in financial assets at FVOCI reserve on 1 July 2018 upon the adoption of HKFRS 9. Apart from the above, certain investments (primarily relating to investment funds) previously classified as equity securities are reclassified as debt securities upon adoption of HKFRS 9 as they do not meet the definition of equity securities in accordance with HKFRS 9.
159Notes to the Financial Statements
4 CHANGE IN ACCOUNTING POLICY (CONTINUED)
(b) Impairment losses of HK$568.6 million previously recognised in retained profits were reclassified to financial assets at FVOCI reserve. Fair value gains previously recognised in investment revaluation reserve of HK$166.4 million were reclassified to retained profits upon the change of investments from available-for-sale financial assets to financial assets at FVPL. Modification on financial liabilities and increase in impairment losses on trade and other debtors of HK$56.3 million were recognised in retained profits as at 1 July 2018 upon adoption of HKFRS 9.
5 FINANCIAL RISK MANAGEMENT AND FAIR VALUE ESTIMATION
The Group’s activities expose it to a variety of financial risks: market risk (including foreign exchange risk, interest rate risk and price risk), credit risk and liquidity risk. The Group has centralised treasury function for all of its subsidiaries except for listed subsidiaries which arrange their financial and treasury affairs on a stand-alone basis and in a manner consistent with the overall policies of the Group.
(a) Market risk (i) Foreign exchange risk
The Group’s operations are mainly in Hong Kong and Mainland China. Entities within the Group are exposed to foreign exchange risk from future commercial transactions and monetary assets and liabilities that are denominated in a currency that is not the entity’s functional currency.
The Group manages its foreign currency risk by closely monitoring the movement of the foreign currency rates and will consider to enter into foreign exchange forward contracts and foreign exchange swaps to reduce the exposure should the need arises.
At 30 June 2019, the Group’s entities with functional currency of Hong Kong dollar had aggregate United States dollar net monetary assets of HK$5,586.7 million (2018: net monetary liabilities of HK$12,175.4 million). Under the Linked Exchange Rate System in Hong Kong, Hong Kong dollar is pegged to the United States dollar, management therefore considers that there are no significant foreign exchange risk with respect to the United States dollar.
At 30 June 2019, the Group’s entities with functional currency of Hong Kong dollar had aggregate Renminbi net monetary assets of HK$3,328.9 million (2018: HK$3,064.8 million). If Hong Kong dollar had strengthened/weakened by 5% (2018: 5%) against Renminbi with all other variables unchanged, the Group’s profit before taxation would have been HK$166.4 million (2018: HK$153.2 million) lower/higher.
At 30 June 2019, the Group’s entities with functional currency of Renminbi had aggregate United States dollar net monetary assets of HK$237.8 million (2018: HK$188.3 million). If Renminbi had strengthened/weakened by 5% (2018: 5%) against United States dollar with all other variables unchanged, the Group’s profit before taxation would have been HK$11.9 million (2018: HK$9.4 million) lower/higher.
At 30 June 2019, the Group’s entities with functional currency of Renminbi had aggregate Hong Kong dollar net monetary assets of HK$571.9 million (2018: net monetary liabilities of HK$423.1 million). If Renminbi had strengthened/weakened by 5% (2018: 5%) against Hong Kong dollar with all other variables unchanged, the Group’s profit before taxation would have been HK$28.6 million lower/higher (2018: HK$21.2 million higher/lower).
New
Wor
ld D
evel
opm
ent
Com
pany
Lim
ited
160A
nnua
l Rep
ort
2019
Notes to the Financial Statements
5 FINANCIAL RISK MANAGEMENT AND FAIR VALUE ESTIMATION (CONTINUED)
(a) Market risk (continued) (i) Foreign exchange risk (continued)
This sensitivity analysis ignores any offsetting foreign exchange factors and has been determined assuming that the change in foreign exchange rates had occurred at the end of the reporting period. The stated change represents management’s assessment of reasonably possible changes in foreign exchange rates over the period from the end of the reporting period until the end of next reporting period. There are no other significant monetary balances held by group companies at 30 June 2019 and 2018 that are denominated in a non-functional currency. Currency risks as defined by HKFRS 7 arise on account of monetary assets and liabilities being denominated in a currency that is not the functional currency, differences resulting from the translation of financial statements into the Group’s presentation currency are not taken into consideration.
(ii) Interest rate riskThe Group is exposed to interest rate risk through the impact of rate changes on interest bearing assets and liabilities. Cash flow interest rate risk is the risk that changes in market interest rates will impact cash flows arising from variable rate financial instruments. The Group’s interest bearing assets mainly include deposits at bank and amounts due from joint ventures and associated companies. The Group’s floating rate borrowings will be affected by fluctuation of prevailing market interest rates and will expose the Group to cash flow interest rate risk. The Group’s borrowings issued at fixed rates exposed the Group to fair value interest rate risk.
To mitigate the risk, the Group has maintained fixed and floating rate debts. To match with underlying risk faced by the Group, the level of fixed rate debt for the Group is decided after taking into consideration the potential impact of higher interest rates on the consolidated income statement, interest cover and the cash flow cycles of the Group’s businesses and investments.
If interest rates had been 100 basis points (2018: 100 basis points) higher/lower with all other variables held constant, the Group’s profit before taxation would have been HK$211.1 million higher or HK$204.1 million lower (2018: HK$231.4 million higher or HK$233.9 million lower) respectively. The sensitivity analysis has been determined assuming that the change in interest rates had occurred throughout the year and had been applied to the exposure to interest rate risk for financial instruments in existence at the end of the reporting period. The 100 basis points (2018: 100 basis points) increase or decrease represents management’s assessment of a reasonably possible change in those interest rates which have the most impact on the Group over the period until the end of next reporting period. Changes in market interest rates affect the interest income or expense of non-derivative variable-interest financial instruments. As a consequence, they are included in the calculation of profit before taxation sensitivities.
(iii) Price riskThe Group is exposed to securities price risk arising from the listed and unlisted investments held by the Group. Gains or losses arising from changes in the fair value of financial assets at FVOCI and financial assets at FVPL are dealt with in equity and the consolidated income statement respectively. The performance of the Group’s listed and unlisted investments are monitored regularly, together with an assessment of their relevance to the Group’s strategic plans. The Group is also exposed to other price risk arising from fair value of certain interest rate swaps which is determined based on the in-house indexes of banks. Changes in fair value of these interest rate swaps are dealt with in the consolidated income statement. The Group is not exposed to commodity price risk.
161Notes to the Financial Statements
5 FINANCIAL RISK MANAGEMENT AND FAIR VALUE ESTIMATION (CONTINUED)
(a) Market risk (continued) (iii) Price risk (continued)
At 30 June 2019, if the price of listed and unlisted investments in financial assets at FVOCI (2018: available-for-sale financial assets) had been 25% (2018: 25%) higher with all other variables held constant, the Group’s financial assets at FVOCI reserve would have been HK$1,259.7 million higher (2018: investment revaluation reserve would have been HK$2,944.7 million higher). If the price of listed and unlisted investments in financial assets at FVOCI (2018: available-for-sale financial assets) had been 25% (2018: 25%) lower with all other variables held constant, the financial assets at FVOCI reserve would have been HK$1,259.7 million lower (2018: profit before taxation and investment revaluation reserve would have been HK$370.0 million and HK$2,574.7 million lower respectively). The sensitivity analysis has been determined based on a reasonable expectation of possible valuation volatility over the next 12 months.
At 30 June 2019, if the price of listed and unlisted investments in financial assets at FVPL had been 25% (2018: 25%) higher/lower with all other variables held constant, the Group’s profit before taxation would have been HK$2,309.9 million (2018: HK$171.1 million) higher/lower. The sensitivity analysis has been determined based on a reasonable expectation of possible valuation volatility over the next 12 months.
(b) Credit riskThe credit risk of the Group mainly arises from trade and other debtors, other non-current assets, balances receivable from investee companies, joint ventures and associated companies and deposits with banks.
The Group considers the probability of default from initial recognition of assets and whether there has been a significant increase in credit risk on an ongoing basis by close monitoring against established credit policies in each of its core business. To assess whether there is a significant increase in credit risk, the Group compares the risk of a default occurring on the assets, generally on individual basis, as at the reporting date with the risk of default as at the date of initial recognition. It considers available reasonable and supportive forward-looking information. The following indicators are generally incorporated:
• external credit rating (if any);
• average default rate by independent external parties;
• actual or expected significant adverse changes in business, financial or economic conditions that are expected to cause a significant change to the counterparties’ ability to meet their obligations; and
• significant actual and expected changes in the performance and behaviour of the counterparties, including changes in the payment status of counterparties in the Group and changes in the operating results of the counterparties.
A default on a financial asset is when the counterparty fails to make contractual payments when they fall due. Financial assets are considered to be credit-impaired and written off when there is no reasonable expectation of recovery.
For trade debtors and contract assets in relation to provision of services and infrastructure operations, no significant loss allowance had been provided under lifetime expected credit loss assessment with reference to the historical credit loss experience with counterparties and ageing analysis, adjusted for forward-looking factors specific to the counterparties and the economic environment.
New
Wor
ld D
evel
opm
ent
Com
pany
Lim
ited
162A
nnua
l Rep
ort
2019
Notes to the Financial Statements
5 FINANCIAL RISK MANAGEMENT AND FAIR VALUE ESTIMATION (CONTINUED)
(b) Credit risk (continued)For trade debtors in relation to property sales, the Group normally receives deposits or progress payments from individual customers and possesses the control of the property unit prior to the completion of sales transaction. Taking into account the historical settlement of contractual payment and forward-looking factors, management considered the lifetime expected credit loss surrounding property sales receivables is not significant.
For trade debtors in relation to rental income, the Group carries out regular review on these balances and follow-up action on any overdue amounts to minimise exposures to credit risk. The Group measures the lifetime expected credit losses based on the outstanding balances with debtors, offset with the deposit placed to the Group by the counterparties or the assets held by the counterparties expected to be frozen by the court for confiscation, and historical credit loss experience adjusted by the current and forecast economic conditions that may affect the ability of the counterparties to settle receivables.
For mortgage loans receivable, similar to other financial institutions, credit assessments are part of the normal process before approving loans to applicants. Regular review is carried out and stringent monitoring procedures are in place to deal with overdue debts. At the end of each reporting period, the Group reviews the recoverable amount of each individual receivable, taking into account the historical settlement of contractual payments and forward-looking factors under general approach, to ensure that adequate loss allowance is made for irrecoverable amounts, if any.
Impairment on financial assistance provided to investee companies, joint ventures and associated companies, other debtors and other non-current assets such as loans receivables, is measured as either 12-month expected credit losses or lifetime expected credit losses, depending on whether there has been a significant increase in credit risk since initial recognition, through the management’s critical assessment on the recoverable amounts based on underlying assets, historical repayment pattern, the actual and expected changes in business performance and general market default rate. If a significant increase in credit risk of a receivable has occurred since initial recognition, then loss allowance is measured as lifetime expected credit losses.
For deposits with banks mainly placed with high-credit-quality financial institutions, such balances are considered to be of low credit risk as they have an investment credit rating with at least one major agency. No loss allowance is measured under general expected credit loss assessment.
There is no concentration of credit risk with respect to trade debtors and contract assets from third party customers as the customer bases are widely dispersed in different sectors and industries.
The Group provides guarantees to banks in connection with certain property purchasers’ borrowing of mortgage loans to finance their purchase of the properties until the issuance of the official property title transfer certificates by the relevant authority in the Mainland China. If a purchaser defaults on the payment of its mortgage during the term of the guarantee, the bank holding the mortgage may demand the Group to repay the outstanding amount under the loan and any accrued interest thereon. Under such circumstances, the Group is able to retain the purchaser’s deposit and sell the property to recover any amounts paid by the Group to the bank. Therefore the Group’s credit risk is significantly reduced. Nevertheless, the net realisable values of the relevant properties are subject to the fluctuation of the property market in general, the Group assesses at the end of each reporting period the liabilities based on the current estimates of future cash flows. As at 30 June 2019 and 2018, no provision on the above guarantees to banks had been made in the consolidated financial statements.
As at 30 June 2019 and 2018, the carrying amounts of these balances represent the Group’s maximum exposure to credit risk in relation to the financial assets.
163Notes to the Financial Statements
5 FINANCIAL RISK MANAGEMENT AND FAIR VALUE ESTIMATION (CONTINUED)
(c) Liquidity riskPrudent liquidity risk management includes managing the profile of debt maturities and funding sources, maintaining sufficient cash and marketable securities, and ensuring the availability of funding from an adequate amount of committed credit facilities and the ability to close out market positions. It is the policy of the Group to regularly monitor current and expected liquidity requirements and to ensure that adequate funding is available for operating, investing and financing activities. The Group also maintain adequate undrawn committed credit facilities to further reduce liquidity risk in meeting funding requirements (including financing for the Group’s capital commitments as detailed in note 44). The Directors of the Company are of the view that the Group has sufficient resources to meet the Group’s commitments and liabilities as and when they fall due.
The table below analyses the Group’s non-derivative financial liabilities into relevant maturity groupings based on the remaining period at the end of the reporting period to the contractual maturity dates. The amounts disclosed in the table are the contractual undiscounted cash flows.
Non-derivative financial liabilities:
Carrying amount
Total contractual
undiscounted cash flow
Within 1 year or on
demand
Over 1 year but within
5 yearsAfter
5 yearsHK$m HK$m HK$m HK$m HK$m
At 30 June 2019Creditors and accrued
charges 37,565.0 37,565.0 33,518.7 3,982.2 64.1Short-term borrowings 15,854.8 16,544.8 16,544.8 — —Long-term borrowings 140,479.8 156,778.3 32,299.8 105,549.4 18,929.1
At 30 June 2018Creditors and accrued
charges 35,790.6 35,790.6 33,749.4 2,036.2 5.0Short-term borrowings 8,777.6 8,955.1 8,955.1 — —Long-term borrowings 131,975.1 144,098.7 15,737.8 111,024.2 17,336.7
Derivative financial liabilities:
Total contractual
undiscounted cash flow
Within 1 year or on
demand
Over 1 year but within
5 yearsAfter
5 yearsHK$m HK$m HK$m HK$m
At 30 June 2019Derivative financial instruments (net settled) 523.5 83.5 214.7 225.3
At 30 June 2018Derivative financial instruments (net settled) 152.5 91.3 11.3 49.9
There are no gross settled derivative financial instruments as at 30 June 2019.
New
Wor
ld D
evel
opm
ent
Com
pany
Lim
ited
164A
nnua
l Rep
ort
2019
Notes to the Financial Statements
5 FINANCIAL RISK MANAGEMENT AND FAIR VALUE ESTIMATION (CONTINUED)
(d) Capital managementThe Group’s objectives when managing capital are to safeguard the Group’s ability to continue as a going concern in order to provide returns for shareholders and benefits for other stakeholders and to maintain an optimal capital structure to reduce the cost of capital.
The Group generally obtains long-term financing to on-lend or contribute as equity to its subsidiaries, joint ventures and associated companies to meet their funding needs in order to provide more cost efficient financing. In order to maintain or adjust the capital structure, the Group may adjust the amount of dividends paid to shareholders, issue or repurchase shares, raise new debt financing or sell assets to reduce debt.
The Group monitors capital on the basis of the Group’s gearing ratio and makes adjustments to it in light of changes in economic conditions and business strategies. The gearing ratio is calculated as net debt divided by total equity. Net debt is calculated as total borrowings (excluding loans from non-controlling shareholders) less cash and bank balances and restricted bank balances.
The gearing ratios at 30 June 2019 and 2018 were as follows:
2019 2018HK$m HK$m
Consolidated total borrowings (excluding loans from non-controlling shareholders) 152,019.6 138,315.1
Less: cash and bank balances and restricted bank balances (63,731.6) (63,456.1)
Consolidated net debt 88,288.0 74,859.0
Total equity 275,364.5 255,181.9
Gearing ratio 32.1% 29.3%
(e) Fair value estimationThe Group’s financial instruments that are measured at fair value are disclosed by levels of the following fair value measurement hierarchy:
• Quoted prices (unadjusted) in active markets for identical assets or liabilities (level 1).
• Inputs other than quoted prices included within level 1 that are observable for the asset or liability, either directly (that is, as prices) or indirectly (that is, derived from prices) (level 2).
• Inputs for the asset or liability that are not based on observable market data (that is, unobservable inputs) (level 3).
Management determined the fair value of these financial assets within level 2 and level 3 as follows:
• For investments in investment funds, management discussed with the respective fund managers to understand the performance of the underlying investments and fair value measurement basis conducted by the respective fund managers in order to evaluate whether the fair values as stated in the fund statements at the end of reporting period is appropriate;
• For investments in unlisted equity and debt securities with recent transactions, management determined the fair value at the end of reporting period with reference to recent transaction prices of these financial assets;
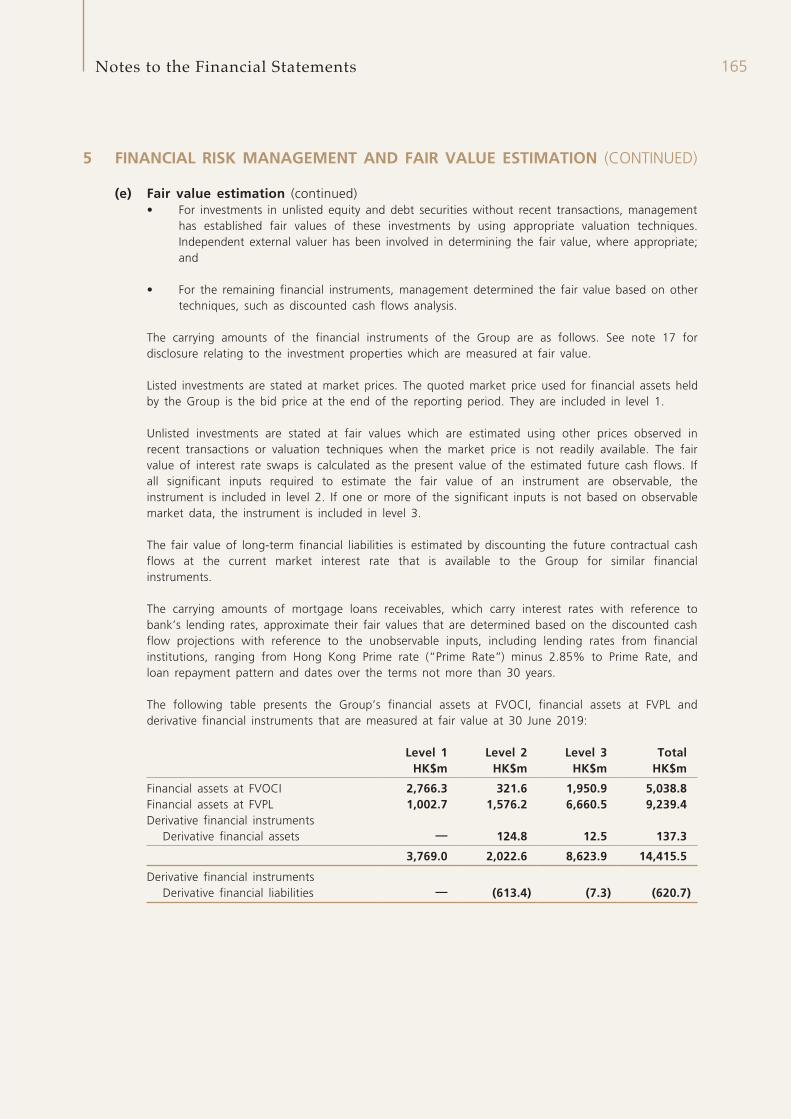
165Notes to the Financial Statements
5 FINANCIAL RISK MANAGEMENT AND FAIR VALUE ESTIMATION (CONTINUED)
(e) Fair value estimation (continued)• For investments in unlisted equity and debt securities without recent transactions, management
has established fair values of these investments by using appropriate valuation techniques. Independent external valuer has been involved in determining the fair value, where appropriate; and
• For the remaining financial instruments, management determined the fair value based on other techniques, such as discounted cash flows analysis.
The carrying amounts of the financial instruments of the Group are as follows. See note 17 for disclosure relating to the investment properties which are measured at fair value.
Listed investments are stated at market prices. The quoted market price used for financial assets held by the Group is the bid price at the end of the reporting period. They are included in level 1.
Unlisted investments are stated at fair values which are estimated using other prices observed in recent transactions or valuation techniques when the market price is not readily available. The fair value of interest rate swaps is calculated as the present value of the estimated future cash flows. If all significant inputs required to estimate the fair value of an instrument are observable, the instrument is included in level 2. If one or more of the significant inputs is not based on observable market data, the instrument is included in level 3.
The fair value of long-term financial liabilities is estimated by discounting the future contractual cash flows at the current market interest rate that is available to the Group for similar financial instruments.
The carrying amounts of mortgage loans receivables, which carry interest rates with reference to bank’s lending rates, approximate their fair values that are determined based on the discounted cash flow projections with reference to the unobservable inputs, including lending rates from financial institutions, ranging from Hong Kong Prime rate (“Prime Rate”) minus 2.85% to Prime Rate, and loan repayment pattern and dates over the terms not more than 30 years.
The following table presents the Group’s financial assets at FVOCI, financial assets at FVPL and derivative financial instruments that are measured at fair value at 30 June 2019:
Level 1 Level 2 Level 3 TotalHK$m HK$m HK$m HK$m
Financial assets at FVOCI 2,766.3 321.6 1,950.9 5,038.8Financial assets at FVPL 1,002.7 1,576.2 6,660.5 9,239.4Derivative financial instruments
Derivative financial assets — 124.8 12.5 137.3
3,769.0 2,022.6 8,623.9 14,415.5
Derivative financial instrumentsDerivative financial liabilities — (613.4) (7.3) (620.7)
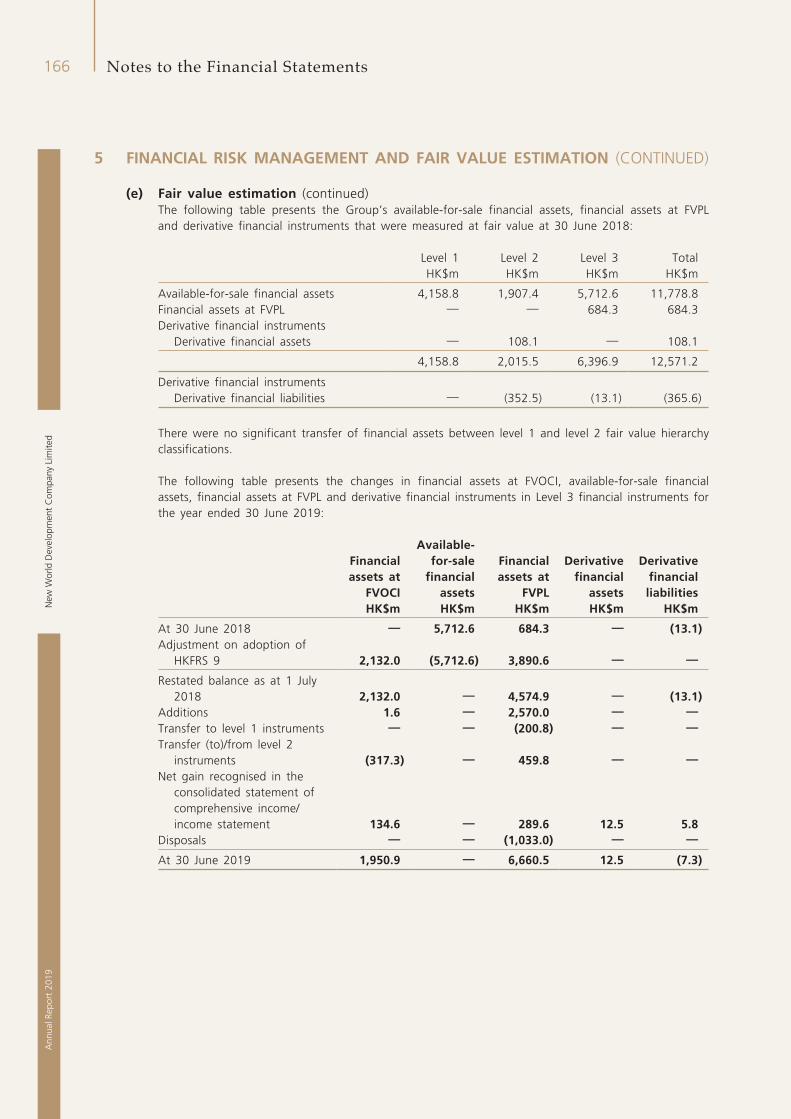
New
Wor
ld D
evel
opm
ent
Com
pany
Lim
ited
166A
nnua
l Rep
ort
2019
Notes to the Financial Statements
5 FINANCIAL RISK MANAGEMENT AND FAIR VALUE ESTIMATION (CONTINUED)
(e) Fair value estimation (continued)The following table presents the Group’s available-for-sale financial assets, financial assets at FVPL and derivative financial instruments that were measured at fair value at 30 June 2018:
Level 1 Level 2 Level 3 TotalHK$m HK$m HK$m HK$m
Available-for-sale financial assets 4,158.8 1,907.4 5,712.6 11,778.8Financial assets at FVPL — — 684.3 684.3Derivative financial instruments
Derivative financial assets — 108.1 — 108.1
4,158.8 2,015.5 6,396.9 12,571.2
Derivative financial instrumentsDerivative financial liabilities — (352.5) (13.1) (365.6)
There were no significant transfer of financial assets between level 1 and level 2 fair value hierarchy classifications.
The following table presents the changes in financial assets at FVOCI, available-for-sale financial assets, financial assets at FVPL and derivative financial instruments in Level 3 financial instruments for the year ended 30 June 2019:
Financial assets at
FVOCI
Available-for-sale
financial assets
Financial assets at
FVPL
Derivative financial
assets
Derivative financial liabilities
HK$m HK$m HK$m HK$m HK$m
At 30 June 2018 — 5,712.6 684.3 — (13.1)Adjustment on adoption of
HKFRS 9 2,132.0 (5,712.6) 3,890.6 — —
Restated balance as at 1 July 2018 2,132.0 — 4,574.9 — (13.1)
Additions 1.6 — 2,570.0 — —Transfer to level 1 instruments — — (200.8) — —Transfer (to)/from level 2
instruments (317.3) — 459.8 — —Net gain recognised in the
consolidated statement of comprehensive income/income statement 134.6 — 289.6 12.5 5.8
Disposals — — (1,033.0) — —
At 30 June 2019 1,950.9 — 6,660.5 12.5 (7.3)
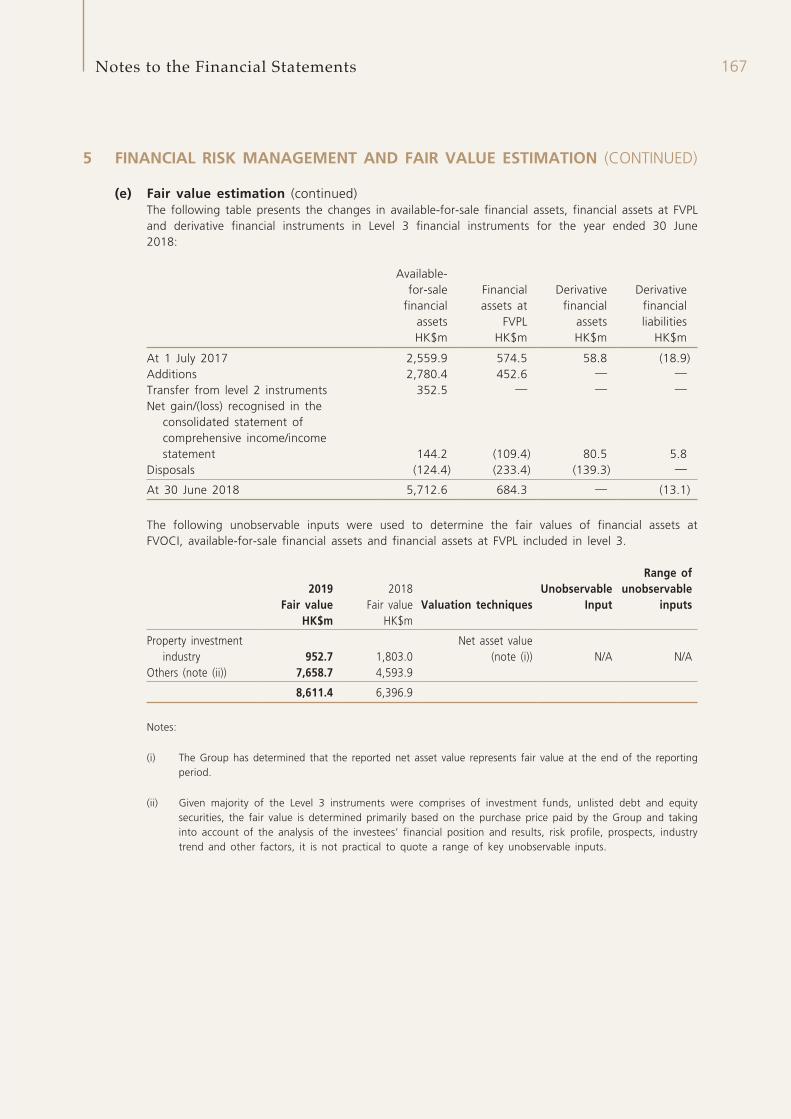
167Notes to the Financial Statements
5 FINANCIAL RISK MANAGEMENT AND FAIR VALUE ESTIMATION (CONTINUED)
(e) Fair value estimation (continued)The following table presents the changes in available-for-sale financial assets, financial assets at FVPL and derivative financial instruments in Level 3 financial instruments for the year ended 30 June 2018:
Available-for-sale
financial assets
Financial assets at
FVPL
Derivative financial
assets
Derivative financial liabilities
HK$m HK$m HK$m HK$m
At 1 July 2017 2,559.9 574.5 58.8 (18.9)Additions 2,780.4 452.6 — —Transfer from level 2 instruments 352.5 — — —Net gain/(loss) recognised in the
consolidated statement of comprehensive income/income statement 144.2 (109.4) 80.5 5.8
Disposals (124.4) (233.4) (139.3) —
At 30 June 2018 5,712.6 684.3 — (13.1)
The following unobservable inputs were used to determine the fair values of financial assets at FVOCI, available-for-sale financial assets and financial assets at FVPL included in level 3.
2019 Fair value
2018 Fair value Valuation techniques
Unobservable Input
Range of unobservable
inputsHK$m HK$m
Property investment industry 952.7 1,803.0
Net asset value (note (i)) N/A N/A
Others (note (ii)) 7,658.7 4,593.9
8,611.4 6,396.9
Notes:
(i) The Group has determined that the reported net asset value represents fair value at the end of the reporting period.
(ii) Given majority of the Level 3 instruments were comprises of investment funds, unlisted debt and equity securities, the fair value is determined primarily based on the purchase price paid by the Group and taking into account of the analysis of the investees’ financial position and results, risk profile, prospects, industry trend and other factors, it is not practical to quote a range of key unobservable inputs.
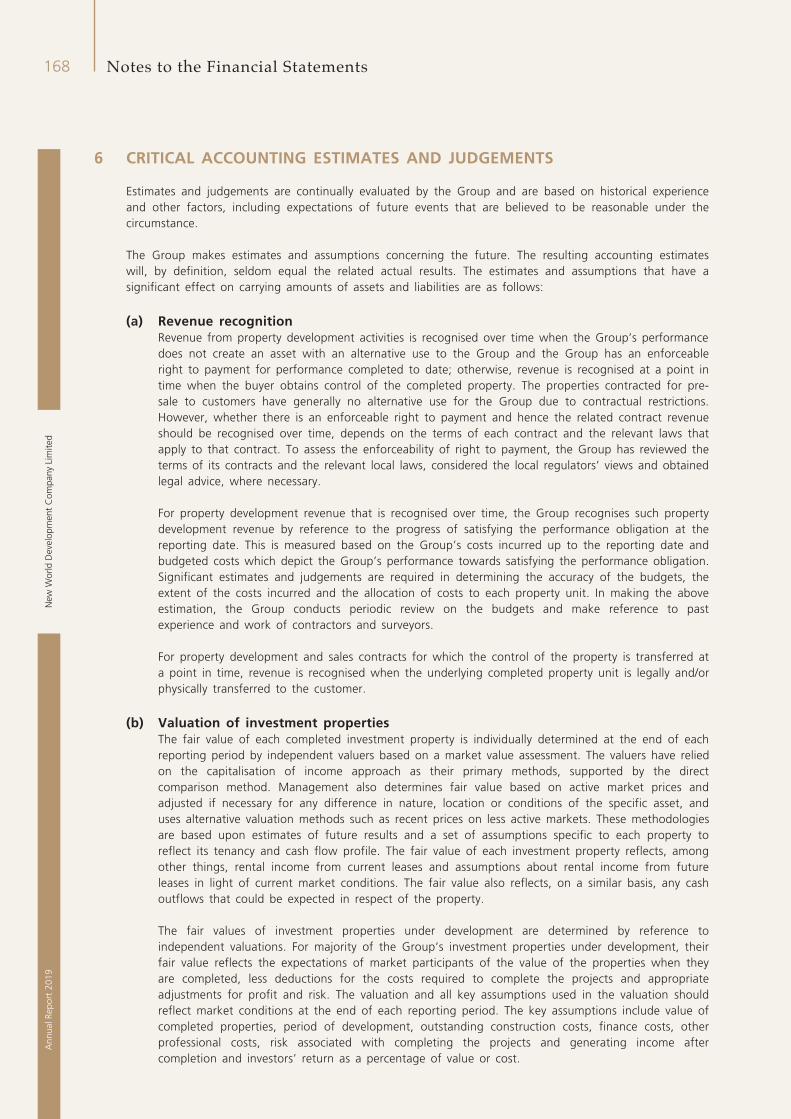
New
Wor
ld D
evel
opm
ent
Com
pany
Lim
ited
168A
nnua
l Rep
ort
2019
Notes to the Financial Statements
6 CRITICAL ACCOUNTING ESTIMATES AND JUDGEMENTS
Estimates and judgements are continually evaluated by the Group and are based on historical experience and other factors, including expectations of future events that are believed to be reasonable under the circumstance.
The Group makes estimates and assumptions concerning the future. The resulting accounting estimates will, by definition, seldom equal the related actual results. The estimates and assumptions that have a significant effect on carrying amounts of assets and liabilities are as follows:
(a) Revenue recognitionRevenue from property development activities is recognised over time when the Group’s performance does not create an asset with an alternative use to the Group and the Group has an enforceable right to payment for performance completed to date; otherwise, revenue is recognised at a point in time when the buyer obtains control of the completed property. The properties contracted for pre-sale to customers have generally no alternative use for the Group due to contractual restrictions. However, whether there is an enforceable right to payment and hence the related contract revenue should be recognised over time, depends on the terms of each contract and the relevant laws that apply to that contract. To assess the enforceability of right to payment, the Group has reviewed the terms of its contracts and the relevant local laws, considered the local regulators’ views and obtained legal advice, where necessary.
For property development revenue that is recognised over time, the Group recognises such property development revenue by reference to the progress of satisfying the performance obligation at the reporting date. This is measured based on the Group’s costs incurred up to the reporting date and budgeted costs which depict the Group’s performance towards satisfying the performance obligation. Significant estimates and judgements are required in determining the accuracy of the budgets, the extent of the costs incurred and the allocation of costs to each property unit. In making the above estimation, the Group conducts periodic review on the budgets and make reference to past experience and work of contractors and surveyors.
For property development and sales contracts for which the control of the property is transferred at a point in time, revenue is recognised when the underlying completed property unit is legally and/or physically transferred to the customer.
(b) Valuation of investment propertiesThe fair value of each completed investment property is individually determined at the end of each reporting period by independent valuers based on a market value assessment. The valuers have relied on the capitalisation of income approach as their primary methods, supported by the direct comparison method. Management also determines fair value based on active market prices and adjusted if necessary for any difference in nature, location or conditions of the specific asset, and uses alternative valuation methods such as recent prices on less active markets. These methodologies are based upon estimates of future results and a set of assumptions specific to each property to reflect its tenancy and cash flow profile. The fair value of each investment property reflects, among other things, rental income from current leases and assumptions about rental income from future leases in light of current market conditions. The fair value also reflects, on a similar basis, any cash outflows that could be expected in respect of the property.
The fair values of investment properties under development are determined by reference to independent valuations. For majority of the Group’s investment properties under development, their fair value reflects the expectations of market participants of the value of the properties when they are completed, less deductions for the costs required to complete the projects and appropriate adjustments for profit and risk. The valuation and all key assumptions used in the valuation should reflect market conditions at the end of each reporting period. The key assumptions include value of completed properties, period of development, outstanding construction costs, finance costs, other professional costs, risk associated with completing the projects and generating income after completion and investors’ return as a percentage of value or cost.
169Notes to the Financial Statements
6 CRITICAL ACCOUNTING ESTIMATES AND JUDGEMENTS (CONTINUED)
(b) Valuation of investment properties (continued)At 30 June 2019, if the market value of investment properties had been 5% (2018: 5%) higher/lower with all other variables held constant, the carrying value of the Group’s investment properties would have been HK$8,666.3 million (2018: HK$7,486.4 million) higher/lower.
(c) Recoverability of properties for/under development and properties held for saleThe Group assesses the carrying amounts of properties for/under development and properties held for sale according to their estimated net realisable value based on the realisability of these properties, taking into account construction costs to completion based on the existing development plans and the estimation of selling prices of the properties of comparable locations and conditions. Provision is made when events or changes in circumstances indicate that the carrying amounts may not be realised. The assessment requires the use of significant estimates.
(d) Impairment of interests in joint ventures and associated companiesThe Group determines whether interests in joint ventures and associated companies are impaired by regularly review whether there are any indicators of impairment of the investments by reference to the requirements under HKAS 28 (2011) “Investments in Associates and Joint Ventures” and HKAS 36 “Impairment of Assets”.
For investments where impairment indicators exist, management estimated the recoverable amounts of the investments, being higher of fair value less costs of disposal and value in use. The value in use of the underlying businesses is determined based on the discounted cash flow projections. Significant judgements are required to determine the key assumptions used in the discounted cash flow models, such as revenue growth, unit price and discount rates. Independent external valuers were also involved in the fair value and value in use assessments, where appropriate. Based on the results of these impairment assessments, management concluded that the current level of impairment provision for the Group’s interests in joint ventures and associated companies as at 30 June 2019 was appropriate.
(e) Impairment of assetsThe Group tests annually whether goodwill has suffered any impairment according to their recoverable amounts determined by the cash-generating units based on value in use calculations. These calculations require the use of estimates which are subject to change of economic environment in future. Details are set out in note 21.
The Group assesses whether there is objective evidence as stated in note 3(j) that trade debtors, contract assets and debt instruments at amortised cost are impaired. It recognises loss allowance based on estimates of the extent and timing of future cash flows using applicable discount rates. The final outcome of the recoverability and cash flows of these receivables will impact the amount of loss allowance required.
(f) Fair value of financial assets at FVPL and financial assets at FVOCIThe fair value of financial assets at FVPL and financial assets at FVOCI that are not traded in an active market is determined by using valuation techniques. The Group uses its judgement to select a variety of methods and determine the fair values primarily based on the purchase price paid by the Group, net asset value and taking into account of the analysis of the investees’ financial trends and results, risk profile, prospects, industry trends and other factors. Independent external valuer has been involved in determining fair value of certain investments. The key assumptions adopted on projected cash flow are based on management’s best estimates.
New
Wor
ld D
evel
opm
ent
Com
pany
Lim
ited
170A
nnua
l Rep
ort
2019
Notes to the Financial Statements
6 CRITICAL ACCOUNTING ESTIMATES AND JUDGEMENTS (CONTINUED)
(g) Estimate of revenue for construction contractsFor revenue from construction work that is recognised over time, the Group recognised such revenue by reference to the progress of satisfying the performance obligation at the reporting date. This is measured based on the Group’s costs incurred up to the reporting date and budgeted costs which depict the Group’s performance towards satisfying the performance obligation. Significant estimates and judgements are required in determining the accuracy of the budgets. In making the above estimation, the Group conducts periodic review on the budgets and makes reference to past experience and work of internal quantity surveyors.
(h) Estimated volume of infrastructures of public servicesThe amortisation for intangible concession rights and impairment assessment of infrastructures for public services using discounted cash flow model are affected by the estimated volume for public services, such as toll roads. Management performs annual reviews to assess the appropriateness of estimated volume by making reference to independent professional studies, if necessary.
The traffic volume is directly and indirectly affected by a number of factors, including the availability, quality, proximity and toll rate differentials of alternative roads and the existence of other means of transportation. The growth of the traffic flow is also highly tied to the future economic and transportation network development of the area in which the infrastructures serve. The growth in future traffic flow projected by the management is highly dependent on the realisation of the aforementioned factors.
(i) Distinction between property development projects, investment properties and owner-occupied propertiesWhen the Group determines whether a property qualifies as an investment property, the Group considers whether the property generates cash flows largely independently of the other assets held by an entity. Owner-occupied properties generate cash flows that are attributable not only to property but also to other assets used in the production or supply process. Properties for/under development and properties held for sale are assets under development and held for sale in the ordinary course of business. The Group shall reclassify a property when, and only when, there is evidence of a change in use.
Some properties comprise a portion that is held to earn rentals or for capital appreciation and another portion that is held for use in the production or supply of goods or services or for administrative purposes. If these portions can be sold or leased out separately, the Group accounts for the portions separately. If the portions cannot be sold separately, the property is accounted as an investment property only if an insignificant portion is held for use in the production or supply of goods or services or for administrative purposes. Judgement is applied in determining whether ancillary services are so significant that a property does not qualify as investment property. The Group considers each property separately in making its judgement.
171Notes to the Financial Statements
7 REVENUES AND SEGMENT INFORMATION
Revenues recognised during the year are as follows:
2019 2018HK$m HK$m
RevenuesProperty sales 38,511.5 23,380.8Rental 3,669.4 3,109.9Contracting 17,359.6 15,488.2Provision of services 9,238.8 10,423.5Infrastructure operations 2,698.5 2,814.6Hotel operations 1,490.9 1,479.0Department store operations 3,357.8 3,670.9Others 437.1 321.8
Total 76,763.6 60,688.7
The Executive Committee of the Company, being the chief operating decision-maker, determines and reviews the Group’s internal reporting in order to assess performance and allocate resources. The operating segments are determined based on the afore-mentioned internal reporting and are reviewed regularly. The Executive Committee considers the business from product and service perspectives, which comprises property development, property investment, services (including facilities management, construction, transport and strategic investments), infrastructure (including roads, environment, logistic and aviation), hotel operations, department store and others (including media and technology and other strategic businesses) segments.
The Executive Committee assesses the performance of the operating segments based on each segment’s operating profit. The measurement of segment operating profit excludes the effect of unallocated corporate expenses. In addition, financing income, financing costs and taxation are not allocated to segments.
Sales between segments are carried out in accordance with terms agreed by the parties involved.
New
Wor
ld D
evel
opm
ent
Com
pany
Lim
ited
172A
nnua
l Rep
ort
2019
Notes to the Financial Statements
7 REVENUES AND SEGMENT INFORMATION (CONTINUED)
Property development
Property investment Service
Infra- structure
Hotel operations
Department stores Others Consolidated
HK$m HK$m HK$m HK$m HK$m HK$m HK$m HK$m
2019Total revenues 38,511.5 3,851.0 35,149.7 2,698.5 1,490.9 3,358.1 515.0 85,574.7Inter-segment — (181.6) (8,551.3) — — (0.3) (77.9) (8,811.1)
Revenues — external 38,511.5 3,669.4 26,598.4 2,698.5 1,490.9 3,357.8 437.1 76,763.6
Revenues from contracts with customers:— Recognised at a point in time 38,252.1 — 6,743.3 2,698.5 576.5 3,357.8 388.0 52,016.2— Recognised over time 259.4 — 19,855.1 — 914.4 — 49.1 21,078.0
38,511.5 — 26,598.4 2,698.5 1,490.9 3,357.8 437.1 73,094.2
Revenues from other source:— Rental income — 3,669.4 — — — — — 3,669.4
38,511.5 3,669.4 26,598.4 2,698.5 1,490.9 3,357.8 437.1 76,763.6
Segment results 13,438.2 1,617.6 (93.2) 1,134.5 (261.3) 202.2 (255.9) 15,782.1Other gains, net 156.2 43.9 148.0 91.8 (9.9) (154.7) 63.5 338.8Changes in fair value of and gain
on transfer to investment properties (note (a)) — 10,272.0 33.7 — — — — 10,305.7
Unallocated corporate expenses (1,224.5)
Operating profit 25,202.1Financing income 1,716.2Financing costs (2,472.5)
24,445.8Share of results
Joint ventures 1,603.0 326.2 194.0 1,752.8 11.8 — (217.5) 3,670.3Associated companies (4.1) 199.1 10.8 802.5 — — 4.5 1,012.8
Profit before taxation 29,128.9Taxation (7,489.8)
Profit for the year 21,639.1
Segment assets 104,877.6 178,943.2 24,124.1 17,409.8 18,225.0 3,935.2 14,940.2 362,455.1Interests in joint ventures 18,456.5 10,465.0 3,464.1 10,355.0 5,200.9 — 2,924.0 50,865.5Interests in associated companies 6,200.5 4,581.6 4,902.8 9,409.7 — 1.6 235.7 25,331.9Unallocated assets 64,632.4
Total assets 503,284.9
Segment liabilities 29,567.2 2,411.4 11,775.2 531.7 438.4 3,043.0 2,186.2 49,953.1Unallocated liabilities 177,967.3
Total liabilities 227,920.4
Additions to non-current assets (note (d)) 11,490.6 10,859.1 3,805.7 34.0 848.5 92.9 22.6 27,153.4
Depreciation and amortisation 53.6 55.3 740.8 882.8 347.3 240.2 134.1 2,454.1Impairment charge and provision 293.3 2.9 41.4 — 8.8 18.0 398.3 762.7
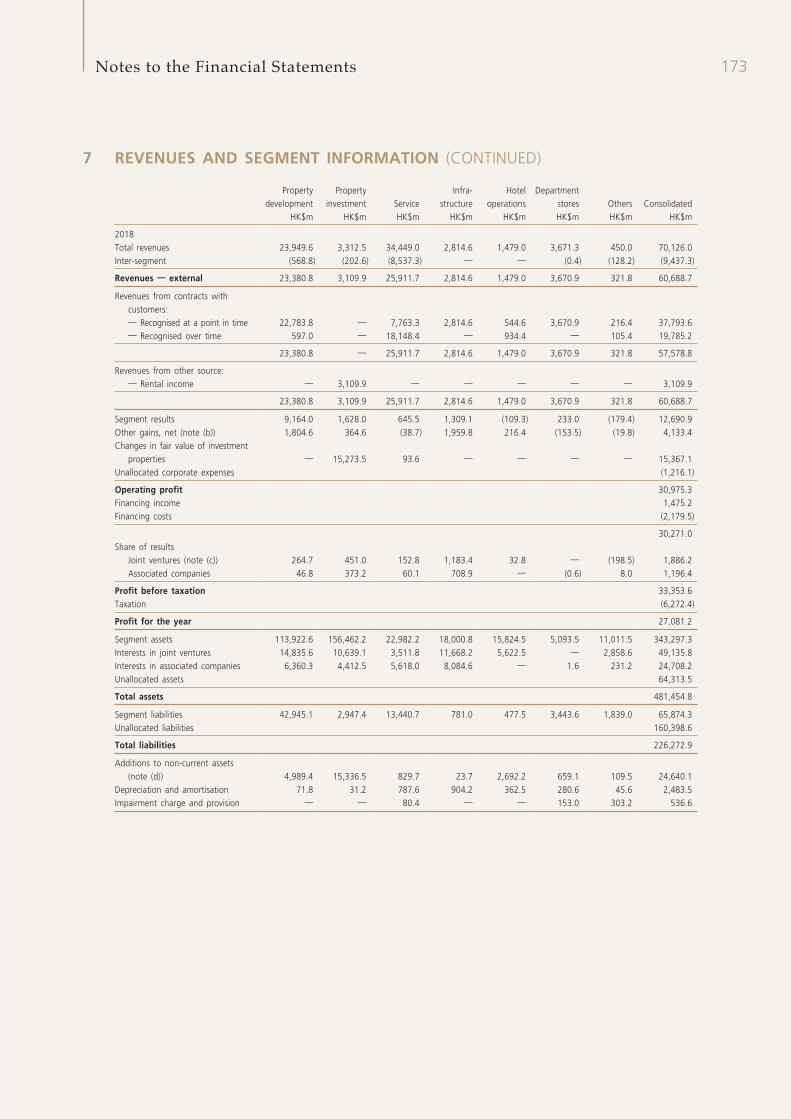
173Notes to the Financial Statements
7 REVENUES AND SEGMENT INFORMATION (CONTINUED)
Property development
Property investment Service
Infra- structure
Hotel operations
Department stores Others Consolidated
HK$m HK$m HK$m HK$m HK$m HK$m HK$m HK$m
2018Total revenues 23,949.6 3,312.5 34,449.0 2,814.6 1,479.0 3,671.3 450.0 70,126.0Inter-segment (568.8) (202.6) (8,537.3) — — (0.4) (128.2) (9,437.3)
Revenues — external 23,380.8 3,109.9 25,911.7 2,814.6 1,479.0 3,670.9 321.8 60,688.7
Revenues from contracts with customers:— Recognised at a point in time 22,783.8 — 7,763.3 2,814.6 544.6 3,670.9 216.4 37,793.6— Recognised over time 597.0 — 18,148.4 — 934.4 — 105.4 19,785.2
23,380.8 — 25,911.7 2,814.6 1,479.0 3,670.9 321.8 57,578.8
Revenues from other source:— Rental income — 3,109.9 — — — — — 3,109.9
23,380.8 3,109.9 25,911.7 2,814.6 1,479.0 3,670.9 321.8 60,688.7
Segment results 9,164.0 1,628.0 645.5 1,309.1 (109.3) 233.0 (179.4) 12,690.9Other gains, net (note (b)) 1,804.6 364.6 (38.7) 1,959.8 216.4 (153.5) (19.8) 4,133.4Changes in fair value of investment
properties — 15,273.5 93.6 — — — — 15,367.1Unallocated corporate expenses (1,216.1)
Operating profit 30,975.3Financing income 1,475.2Financing costs (2,179.5)
30,271.0Share of results
Joint ventures (note (c)) 264.7 451.0 152.8 1,183.4 32.8 — (198.5) 1,886.2Associated companies 46.8 373.2 60.1 708.9 — (0.6) 8.0 1,196.4
Profit before taxation 33,353.6Taxation (6,272.4)
Profit for the year 27,081.2
Segment assets 113,922.6 156,462.2 22,982.2 18,000.8 15,824.5 5,093.5 11,011.5 343,297.3Interests in joint ventures 14,835.6 10,639.1 3,511.8 11,668.2 5,622.5 — 2,858.6 49,135.8Interests in associated companies 6,360.3 4,412.5 5,618.0 8,084.6 — 1.6 231.2 24,708.2Unallocated assets 64,313.5
Total assets 481,454.8
Segment liabilities 42,945.1 2,947.4 13,440.7 781.0 477.5 3,443.6 1,839.0 65,874.3Unallocated liabilities 160,398.6
Total liabilities 226,272.9
Additions to non-current assets (note (d)) 4,989.4 15,336.5 829.7 23.7 2,692.2 659.1 109.5 24,640.1
Depreciation and amortisation 71.8 31.2 787.6 904.2 362.5 280.6 45.6 2,483.5Impairment charge and provision — — 80.4 — — 153.0 303.2 536.6
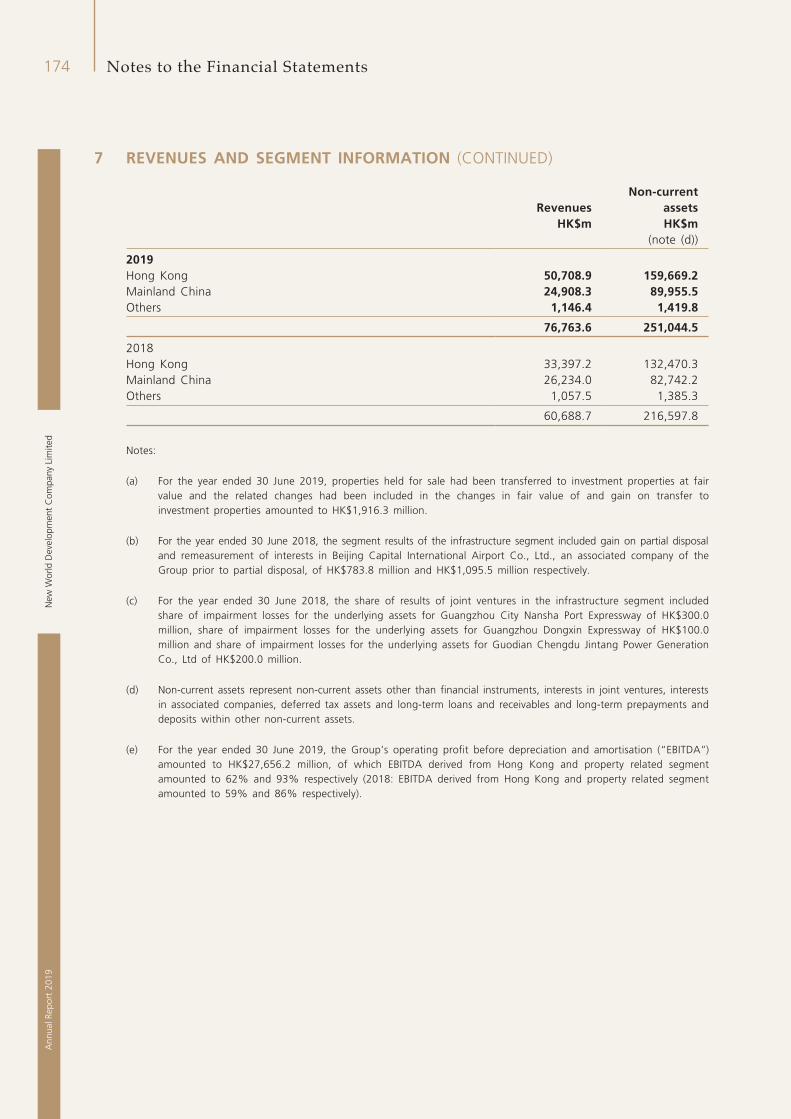
New
Wor
ld D
evel
opm
ent
Com
pany
Lim
ited
174A
nnua
l Rep
ort
2019
Notes to the Financial Statements
7 REVENUES AND SEGMENT INFORMATION (CONTINUED)
RevenuesNon-current
assetsHK$m HK$m
(note (d))
2019Hong Kong 50,708.9 159,669.2Mainland China 24,908.3 89,955.5Others 1,146.4 1,419.8
76,763.6 251,044.5
2018Hong Kong 33,397.2 132,470.3Mainland China 26,234.0 82,742.2Others 1,057.5 1,385.3
60,688.7 216,597.8
Notes:
(a) For the year ended 30 June 2019, properties held for sale had been transferred to investment properties at fair value and the related changes had been included in the changes in fair value of and gain on transfer to investment properties amounted to HK$1,916.3 million.
(b) For the year ended 30 June 2018, the segment results of the infrastructure segment included gain on partial disposal and remeasurement of interests in Beijing Capital International Airport Co., Ltd., an associated company of the Group prior to partial disposal, of HK$783.8 million and HK$1,095.5 million respectively.
(c) For the year ended 30 June 2018, the share of results of joint ventures in the infrastructure segment included share of impairment losses for the underlying assets for Guangzhou City Nansha Port Expressway of HK$300.0 million, share of impairment losses for the underlying assets for Guangzhou Dongxin Expressway of HK$100.0 million and share of impairment losses for the underlying assets for Guodian Chengdu Jintang Power Generation Co., Ltd of HK$200.0 million.
(d) Non-current assets represent non-current assets other than financial instruments, interests in joint ventures, interests in associated companies, deferred tax assets and long-term loans and receivables and long-term prepayments and deposits within other non-current assets.
(e) For the year ended 30 June 2019, the Group’s operating profit before depreciation and amortisation (“EBITDA”) amounted to HK$27,656.2 million, of which EBITDA derived from Hong Kong and property related segment amounted to 62% and 93% respectively (2018: EBITDA derived from Hong Kong and property related segment amounted to 59% and 86% respectively).
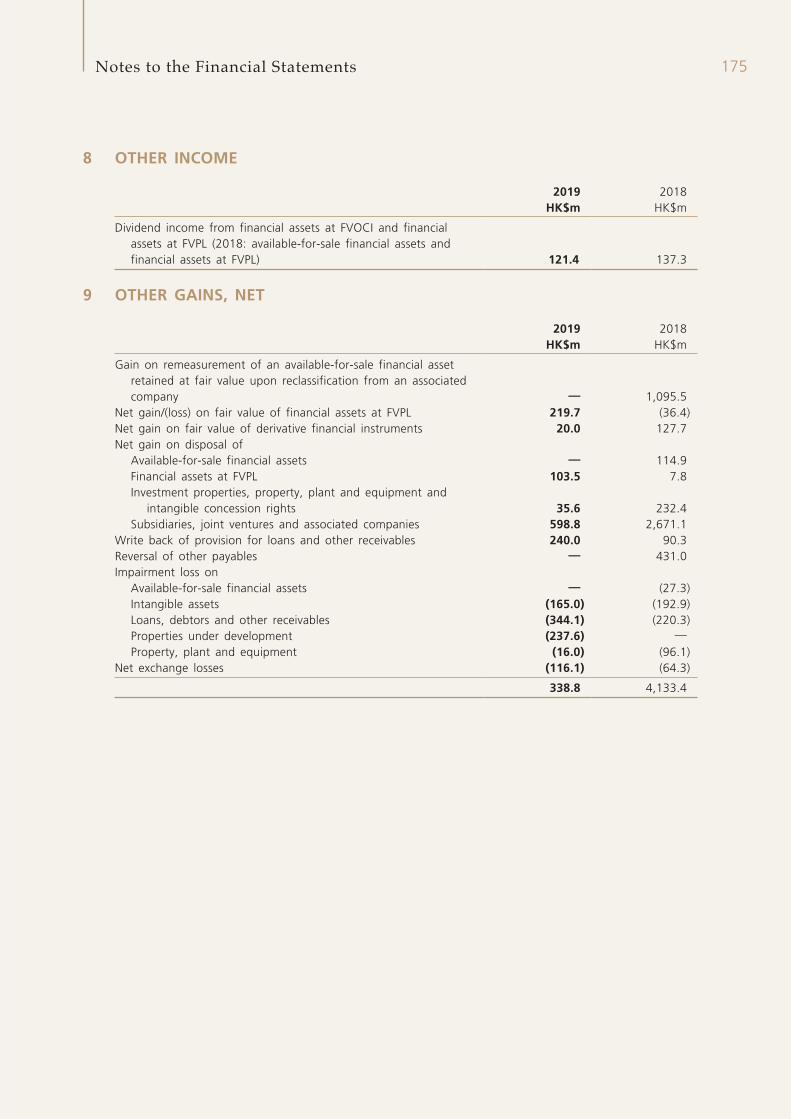
175Notes to the Financial Statements
8 OTHER INCOME
2019 2018HK$m HK$m
Dividend income from financial assets at FVOCI and financial assets at FVPL (2018: available-for-sale financial assets and financial assets at FVPL) 121.4 137.3
9 OTHER GAINS, NET
2019 2018HK$m HK$m
Gain on remeasurement of an available-for-sale financial asset retained at fair value upon reclassification from an associated company — 1,095.5
Net gain/(loss) on fair value of financial assets at FVPL 219.7 (36.4)Net gain on fair value of derivative financial instruments 20.0 127.7Net gain on disposal of
Available-for-sale financial assets — 114.9Financial assets at FVPL 103.5 7.8Investment properties, property, plant and equipment and
intangible concession rights 35.6 232.4Subsidiaries, joint ventures and associated companies 598.8 2,671.1
Write back of provision for loans and other receivables 240.0 90.3Reversal of other payables — 431.0Impairment loss on
Available-for-sale financial assets — (27.3)Intangible assets (165.0) (192.9)Loans, debtors and other receivables (344.1) (220.3)Properties under development (237.6) —Property, plant and equipment (16.0) (96.1)
Net exchange losses (116.1) (64.3)
338.8 4,133.4
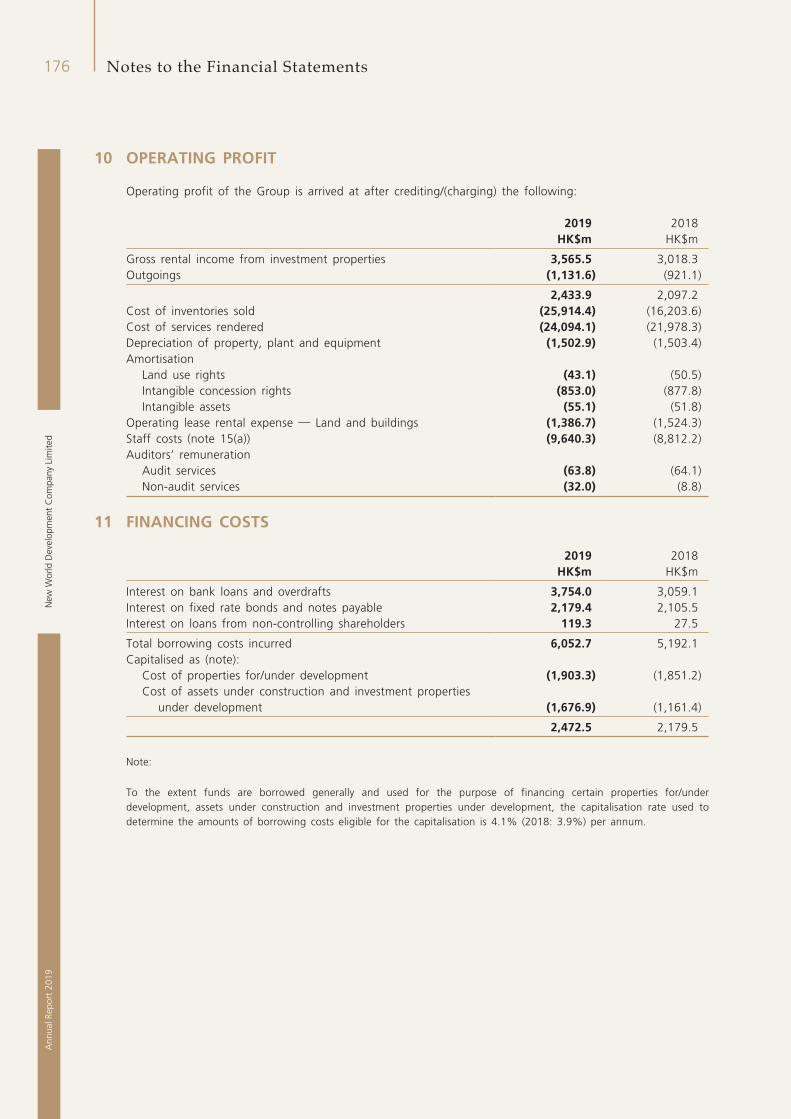
New
Wor
ld D
evel
opm
ent
Com
pany
Lim
ited
176A
nnua
l Rep
ort
2019
Notes to the Financial Statements
10 OPERATING PROFIT
Operating profit of the Group is arrived at after crediting/(charging) the following:
2019 2018HK$m HK$m
Gross rental income from investment properties 3,565.5 3,018.3Outgoings (1,131.6) (921.1)
2,433.9 2,097.2Cost of inventories sold (25,914.4) (16,203.6)Cost of services rendered (24,094.1) (21,978.3)Depreciation of property, plant and equipment (1,502.9) (1,503.4)Amortisation
Land use rights (43.1) (50.5)Intangible concession rights (853.0) (877.8)Intangible assets (55.1) (51.8)
Operating lease rental expense — Land and buildings (1,386.7) (1,524.3)Staff costs (note 15(a)) (9,640.3) (8,812.2)Auditors’ remuneration
Audit services (63.8) (64.1)Non-audit services (32.0) (8.8)
11 FINANCING COSTS
2019 2018HK$m HK$m
Interest on bank loans and overdrafts 3,754.0 3,059.1Interest on fixed rate bonds and notes payable 2,179.4 2,105.5Interest on loans from non-controlling shareholders 119.3 27.5
Total borrowing costs incurred 6,052.7 5,192.1Capitalised as (note):
Cost of properties for/under development (1,903.3) (1,851.2)Cost of assets under construction and investment properties
under development (1,676.9) (1,161.4)
2,472.5 2,179.5
Note:
To the extent funds are borrowed generally and used for the purpose of financing certain properties for/under development, assets under construction and investment properties under development, the capitalisation rate used to determine the amounts of borrowing costs eligible for the capitalisation is 4.1% (2018: 3.9%) per annum.
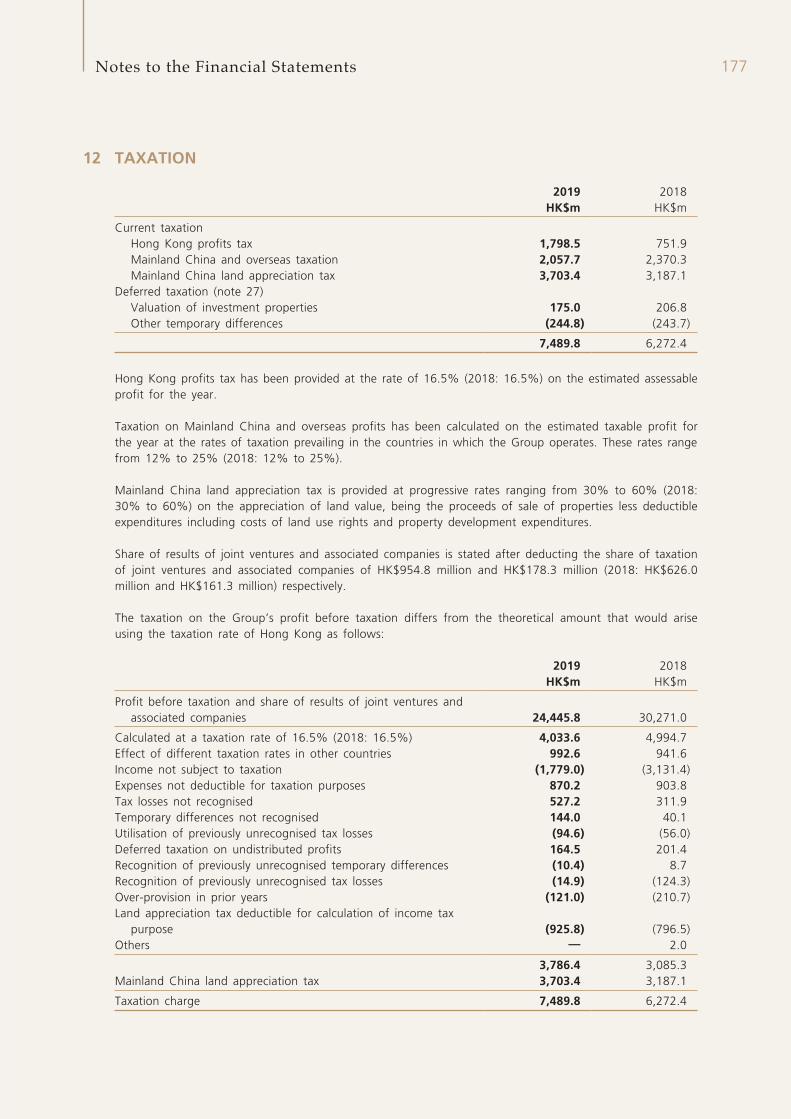
177Notes to the Financial Statements
12 TAXATION
2019 2018HK$m HK$m
Current taxationHong Kong profits tax 1,798.5 751.9Mainland China and overseas taxation 2,057.7 2,370.3Mainland China land appreciation tax 3,703.4 3,187.1
Deferred taxation (note 27)Valuation of investment properties 175.0 206.8Other temporary differences (244.8) (243.7)
7,489.8 6,272.4
Hong Kong profits tax has been provided at the rate of 16.5% (2018: 16.5%) on the estimated assessable profit for the year.
Taxation on Mainland China and overseas profits has been calculated on the estimated taxable profit for the year at the rates of taxation prevailing in the countries in which the Group operates. These rates range from 12% to 25% (2018: 12% to 25%).
Mainland China land appreciation tax is provided at progressive rates ranging from 30% to 60% (2018: 30% to 60%) on the appreciation of land value, being the proceeds of sale of properties less deductible expenditures including costs of land use rights and property development expenditures.
Share of results of joint ventures and associated companies is stated after deducting the share of taxation of joint ventures and associated companies of HK$954.8 million and HK$178.3 million (2018: HK$626.0 million and HK$161.3 million) respectively.
The taxation on the Group’s profit before taxation differs from the theoretical amount that would arise using the taxation rate of Hong Kong as follows:
2019 2018HK$m HK$m
Profit before taxation and share of results of joint ventures and associated companies 24,445.8 30,271.0
Calculated at a taxation rate of 16.5% (2018: 16.5%) 4,033.6 4,994.7Effect of different taxation rates in other countries 992.6 941.6Income not subject to taxation (1,779.0) (3,131.4)Expenses not deductible for taxation purposes 870.2 903.8Tax losses not recognised 527.2 311.9Temporary differences not recognised 144.0 40.1Utilisation of previously unrecognised tax losses (94.6) (56.0)Deferred taxation on undistributed profits 164.5 201.4Recognition of previously unrecognised temporary differences (10.4) 8.7Recognition of previously unrecognised tax losses (14.9) (124.3)Over-provision in prior years (121.0) (210.7)Land appreciation tax deductible for calculation of income tax
purpose (925.8) (796.5)Others — 2.0
3,786.4 3,085.3Mainland China land appreciation tax 3,703.4 3,187.1
Taxation charge 7,489.8 6,272.4
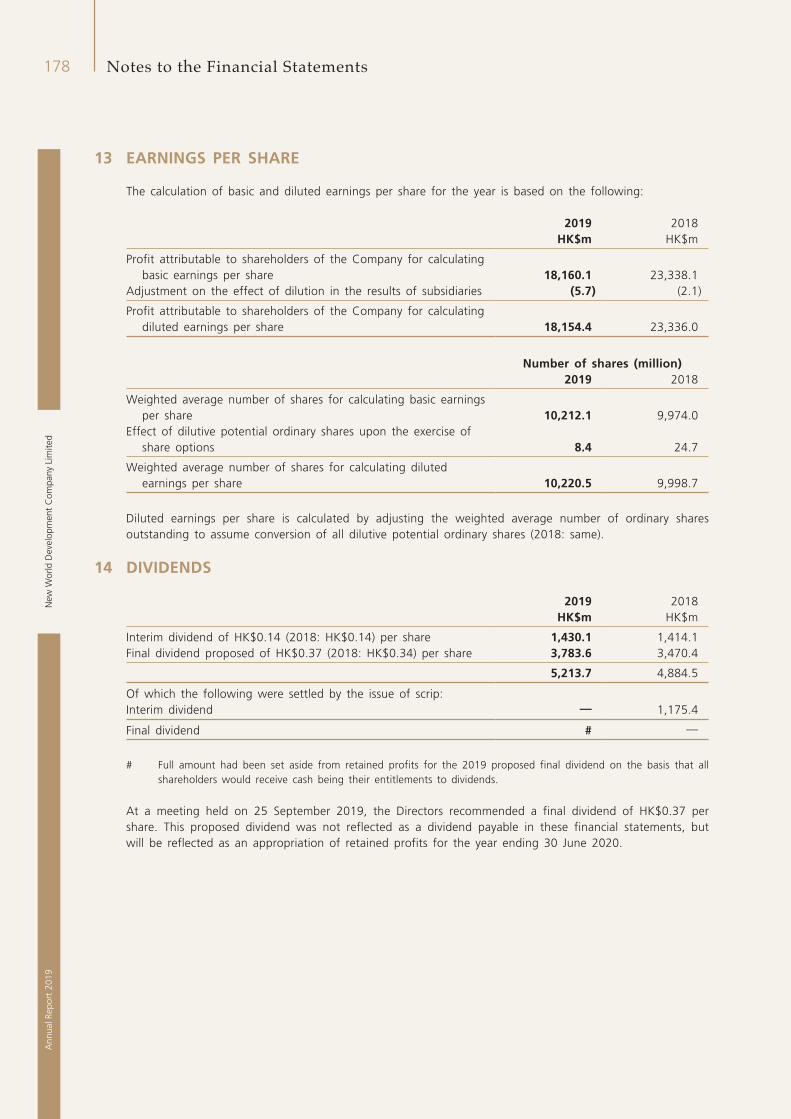
New
Wor
ld D
evel
opm
ent
Com
pany
Lim
ited
178A
nnua
l Rep
ort
2019
Notes to the Financial Statements
13 EARNINGS PER SHARE
The calculation of basic and diluted earnings per share for the year is based on the following:
2019 2018HK$m HK$m
Profit attributable to shareholders of the Company for calculating basic earnings per share 18,160.1 23,338.1
Adjustment on the effect of dilution in the results of subsidiaries (5.7) (2.1)
Profit attributable to shareholders of the Company for calculating diluted earnings per share 18,154.4 23,336.0
Number of shares (million)2019 2018
Weighted average number of shares for calculating basic earnings per share 10,212.1 9,974.0
Effect of dilutive potential ordinary shares upon the exercise of share options 8.4 24.7
Weighted average number of shares for calculating diluted earnings per share 10,220.5 9,998.7
Diluted earnings per share is calculated by adjusting the weighted average number of ordinary shares outstanding to assume conversion of all dilutive potential ordinary shares (2018: same).
14 DIVIDENDS
2019 2018HK$m HK$m
Interim dividend of HK$0.14 (2018: HK$0.14) per share 1,430.1 1,414.1Final dividend proposed of HK$0.37 (2018: HK$0.34) per share 3,783.6 3,470.4
5,213.7 4,884.5
Of which the following were settled by the issue of scrip:Interim dividend — 1,175.4
Final dividend # —
# Full amount had been set aside from retained profits for the 2019 proposed final dividend on the basis that all shareholders would receive cash being their entitlements to dividends.
At a meeting held on 25 September 2019, the Directors recommended a final dividend of HK$0.37 per share. This proposed dividend was not reflected as a dividend payable in these financial statements, but will be reflected as an appropriation of retained profits for the year ending 30 June 2020.
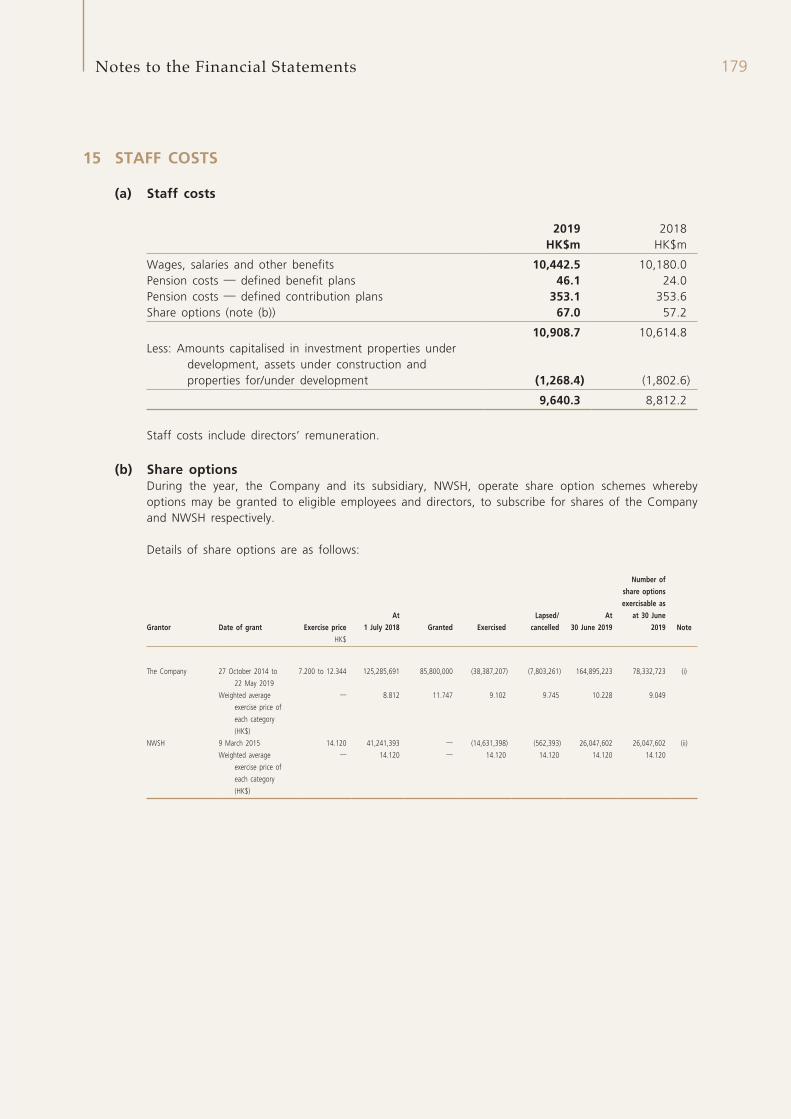
179Notes to the Financial Statements
15 STAFF COSTS
(a) Staff costs
2019 2018HK$m HK$m
Wages, salaries and other benefits 10,442.5 10,180.0Pension costs — defined benefit plans 46.1 24.0Pension costs — defined contribution plans 353.1 353.6Share options (note (b)) 67.0 57.2
10,908.7 10,614.8Less: Amounts capitalised in investment properties under
development, assets under construction and properties for/under development (1,268.4) (1,802.6)
9,640.3 8,812.2
Staff costs include directors’ remuneration.
(b) Share optionsDuring the year, the Company and its subsidiary, NWSH, operate share option schemes whereby options may be granted to eligible employees and directors, to subscribe for shares of the Company and NWSH respectively.
Details of share options are as follows:
Grantor Date of grant Exercise price
At
1 July 2018 Granted Exercised
Lapsed/
cancelled
At
30 June 2019
Number of
share options
exercisable as
at 30 June
2019 Note
HK$
The Company 27 October 2014 to
22 May 2019
7.200 to 12.344 125,285,691 85,800,000 (38,387,207) (7,803,261) 164,895,223 78,332,723 (i)
Weighted average
exercise price of
each category
(HK$)
— 8.812 11.747 9.102 9.745 10.228 9.049
NWSH 9 March 2015 14.120 41,241,393 — (14,631,398) (562,393) 26,047,602 26,047,602 (ii)
Weighted average
exercise price of
each category
(HK$)
— 14.120 — 14.120 14.120 14.120 14.120
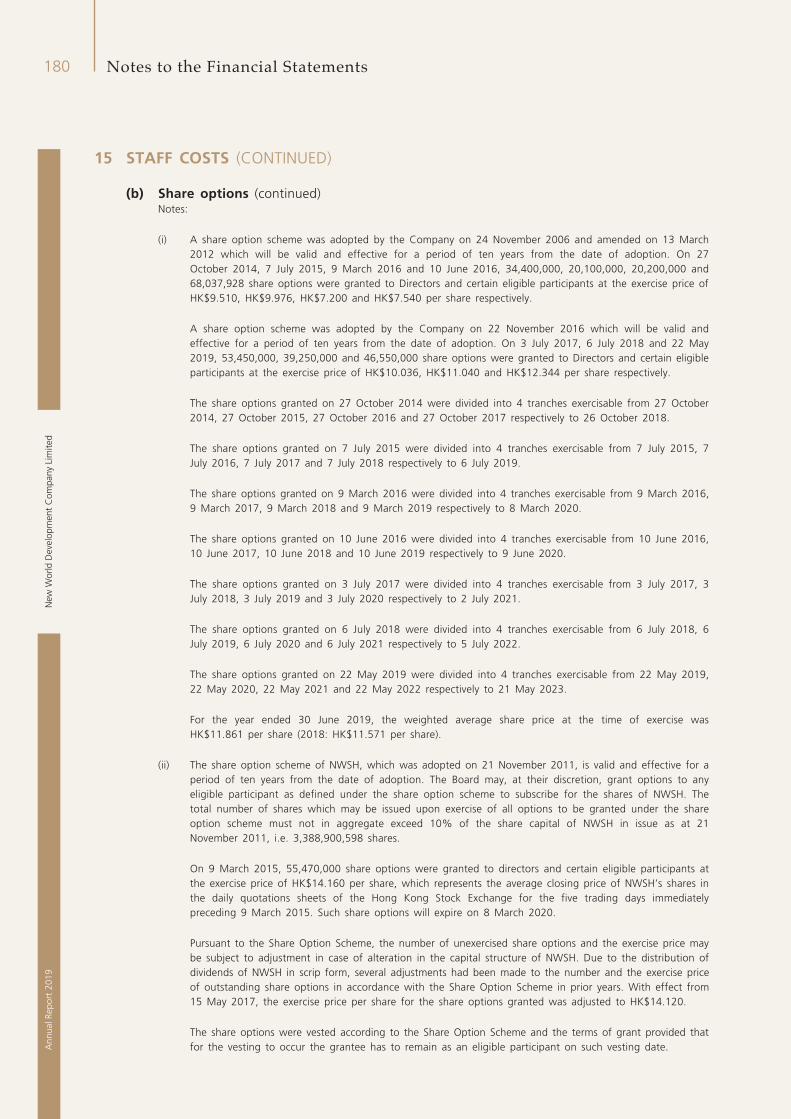
New
Wor
ld D
evel
opm
ent
Com
pany
Lim
ited
180A
nnua
l Rep
ort
2019
Notes to the Financial Statements
15 STAFF COSTS (CONTINUED)
(b) Share options (continued)Notes:
(i) A share option scheme was adopted by the Company on 24 November 2006 and amended on 13 March 2012 which will be valid and effective for a period of ten years from the date of adoption. On 27 October 2014, 7 July 2015, 9 March 2016 and 10 June 2016, 34,400,000, 20,100,000, 20,200,000 and 68,037,928 share options were granted to Directors and certain eligible participants at the exercise price of HK$9.510, HK$9.976, HK$7.200 and HK$7.540 per share respectively.
A share option scheme was adopted by the Company on 22 November 2016 which will be valid and effective for a period of ten years from the date of adoption. On 3 July 2017, 6 July 2018 and 22 May 2019, 53,450,000, 39,250,000 and 46,550,000 share options were granted to Directors and certain eligible participants at the exercise price of HK$10.036, HK$11.040 and HK$12.344 per share respectively.
The share options granted on 27 October 2014 were divided into 4 tranches exercisable from 27 October 2014, 27 October 2015, 27 October 2016 and 27 October 2017 respectively to 26 October 2018.
The share options granted on 7 July 2015 were divided into 4 tranches exercisable from 7 July 2015, 7 July 2016, 7 July 2017 and 7 July 2018 respectively to 6 July 2019.
The share options granted on 9 March 2016 were divided into 4 tranches exercisable from 9 March 2016, 9 March 2017, 9 March 2018 and 9 March 2019 respectively to 8 March 2020.
The share options granted on 10 June 2016 were divided into 4 tranches exercisable from 10 June 2016, 10 June 2017, 10 June 2018 and 10 June 2019 respectively to 9 June 2020.
The share options granted on 3 July 2017 were divided into 4 tranches exercisable from 3 July 2017, 3 July 2018, 3 July 2019 and 3 July 2020 respectively to 2 July 2021.
The share options granted on 6 July 2018 were divided into 4 tranches exercisable from 6 July 2018, 6 July 2019, 6 July 2020 and 6 July 2021 respectively to 5 July 2022.
The share options granted on 22 May 2019 were divided into 4 tranches exercisable from 22 May 2019, 22 May 2020, 22 May 2021 and 22 May 2022 respectively to 21 May 2023.
For the year ended 30 June 2019, the weighted average share price at the time of exercise was HK$11.861 per share (2018: HK$11.571 per share).
(ii) The share option scheme of NWSH, which was adopted on 21 November 2011, is valid and effective for a period of ten years from the date of adoption. The Board may, at their discretion, grant options to any eligible participant as defined under the share option scheme to subscribe for the shares of NWSH. The total number of shares which may be issued upon exercise of all options to be granted under the share option scheme must not in aggregate exceed 10% of the share capital of NWSH in issue as at 21 November 2011, i.e. 3,388,900,598 shares.
On 9 March 2015, 55,470,000 share options were granted to directors and certain eligible participants at the exercise price of HK$14.160 per share, which represents the average closing price of NWSH’s shares in the daily quotations sheets of the Hong Kong Stock Exchange for the five trading days immediately preceding 9 March 2015. Such share options will expire on 8 March 2020.
Pursuant to the Share Option Scheme, the number of unexercised share options and the exercise price may be subject to adjustment in case of alteration in the capital structure of NWSH. Due to the distribution of dividends of NWSH in scrip form, several adjustments had been made to the number and the exercise price of outstanding share options in accordance with the Share Option Scheme in prior years. With effect from 15 May 2017, the exercise price per share for the share options granted was adjusted to HK$14.120.
The share options were vested according to the Share Option Scheme and the terms of grant provided that for the vesting to occur the grantee has to remain as an eligible participant on such vesting date.
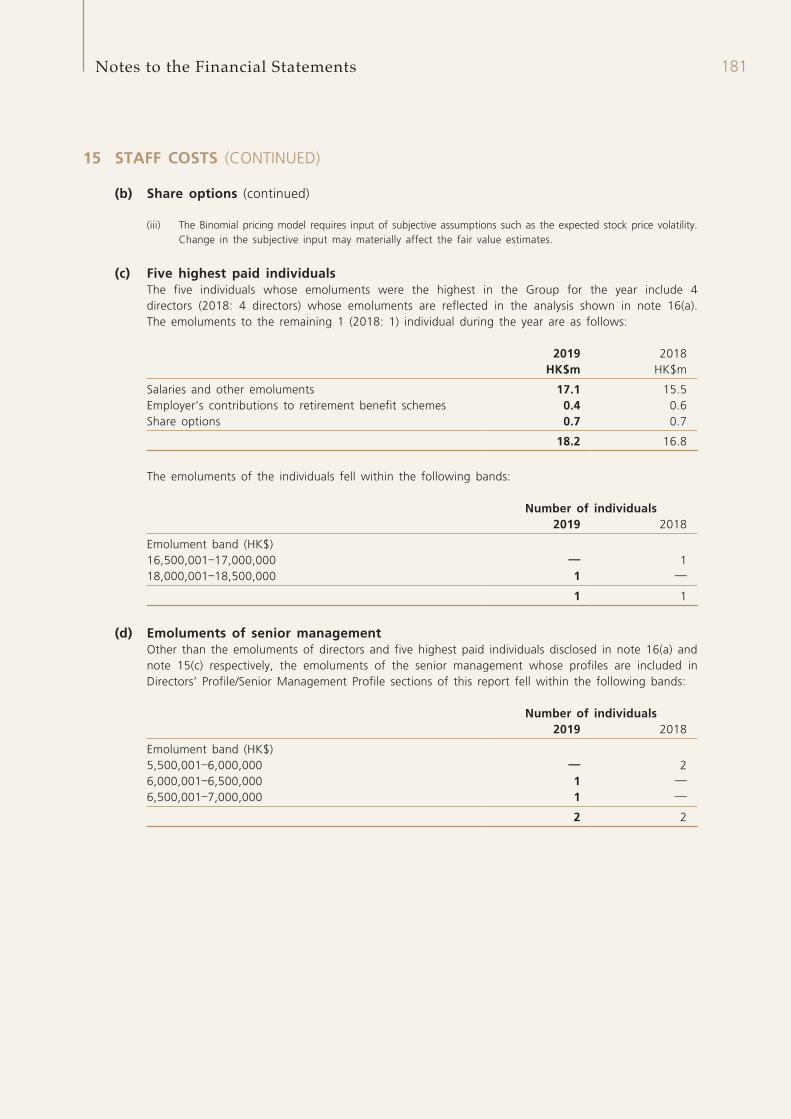
181Notes to the Financial Statements
15 STAFF COSTS (CONTINUED)
(b) Share options (continued)
(iii) The Binomial pricing model requires input of subjective assumptions such as the expected stock price volatility. Change in the subjective input may materially affect the fair value estimates.
(c) Five highest paid individualsThe five individuals whose emoluments were the highest in the Group for the year include 4 directors (2018: 4 directors) whose emoluments are reflected in the analysis shown in note 16(a). The emoluments to the remaining 1 (2018: 1) individual during the year are as follows:
2019 2018HK$m HK$m
Salaries and other emoluments 17.1 15.5Employer’s contributions to retirement benefit schemes 0.4 0.6Share options 0.7 0.7
18.2 16.8
The emoluments of the individuals fell within the following bands:
Number of individuals2019 2018
Emolument band (HK$)16,500,001–17,000,000 — 118,000,001–18,500,000 1 —
1 1
(d) Emoluments of senior managementOther than the emoluments of directors and five highest paid individuals disclosed in note 16(a) and note 15(c) respectively, the emoluments of the senior management whose profiles are included in Directors’ Profile/Senior Management Profile sections of this report fell within the following bands:
Number of individuals2019 2018
Emolument band (HK$)5,500,001–6,000,000 — 26,000,001–6,500,000 1 —6,500,001–7,000,000 1 —
2 2
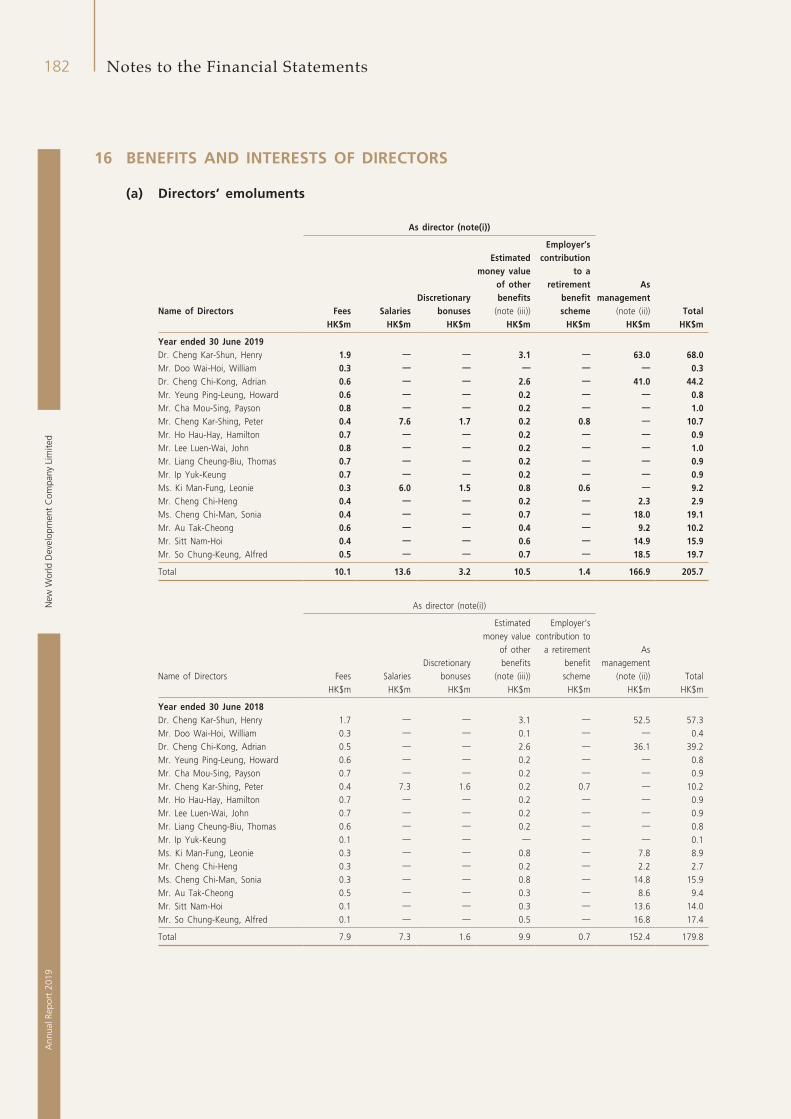
New
Wor
ld D
evel
opm
ent
Com
pany
Lim
ited
182A
nnua
l Rep
ort
2019
Notes to the Financial Statements
16 BENEFITS AND INTERESTS OF DIRECTORS
(a) Directors’ emoluments
As director (note(i))
Name of Directors Fees SalariesDiscretionary
bonuses
Estimated money value
of other benefits
(note (iii))
Employer’s contribution
to a retirement
benefit scheme
As management
(note (ii)) TotalHK$m HK$m HK$m HK$m HK$m HK$m HK$m
Year ended 30 June 2019Dr. Cheng Kar-Shun, Henry 1.9 — — 3.1 — 63.0 68.0Mr. Doo Wai-Hoi, William 0.3 — — — — — 0.3Dr. Cheng Chi-Kong, Adrian 0.6 — — 2.6 — 41.0 44.2Mr. Yeung Ping-Leung, Howard 0.6 — — 0.2 — — 0.8Mr. Cha Mou-Sing, Payson 0.8 — — 0.2 — — 1.0Mr. Cheng Kar-Shing, Peter 0.4 7.6 1.7 0.2 0.8 — 10.7Mr. Ho Hau-Hay, Hamilton 0.7 — — 0.2 — — 0.9Mr. Lee Luen-Wai, John 0.8 — — 0.2 — — 1.0Mr. Liang Cheung-Biu, Thomas 0.7 — — 0.2 — — 0.9Mr. Ip Yuk-Keung 0.7 — — 0.2 — — 0.9Ms. Ki Man-Fung, Leonie 0.3 6.0 1.5 0.8 0.6 — 9.2Mr. Cheng Chi-Heng 0.4 — — 0.2 — 2.3 2.9Ms. Cheng Chi-Man, Sonia 0.4 — — 0.7 — 18.0 19.1Mr. Au Tak-Cheong 0.6 — — 0.4 — 9.2 10.2Mr. Sitt Nam-Hoi 0.4 — — 0.6 — 14.9 15.9Mr. So Chung-Keung, Alfred 0.5 — — 0.7 — 18.5 19.7
Total 10.1 13.6 3.2 10.5 1.4 166.9 205.7
As director (note(i))
Name of Directors Fees SalariesDiscretionary
bonuses
Estimated money value
of other benefits
(note (iii))
Employer’s contribution to
a retirement benefit scheme
As management
(note (ii)) TotalHK$m HK$m HK$m HK$m HK$m HK$m HK$m
Year ended 30 June 2018Dr. Cheng Kar-Shun, Henry 1.7 — — 3.1 — 52.5 57.3Mr. Doo Wai-Hoi, William 0.3 — — 0.1 — — 0.4Dr. Cheng Chi-Kong, Adrian 0.5 — — 2.6 — 36.1 39.2Mr. Yeung Ping-Leung, Howard 0.6 — — 0.2 — — 0.8Mr. Cha Mou-Sing, Payson 0.7 — — 0.2 — — 0.9Mr. Cheng Kar-Shing, Peter 0.4 7.3 1.6 0.2 0.7 — 10.2Mr. Ho Hau-Hay, Hamilton 0.7 — — 0.2 — — 0.9Mr. Lee Luen-Wai, John 0.7 — — 0.2 — — 0.9Mr. Liang Cheung-Biu, Thomas 0.6 — — 0.2 — — 0.8Mr. Ip Yuk-Keung 0.1 — — — — — 0.1Ms. Ki Man-Fung, Leonie 0.3 — — 0.8 — 7.8 8.9Mr. Cheng Chi-Heng 0.3 — — 0.2 — 2.2 2.7Ms. Cheng Chi-Man, Sonia 0.3 — — 0.8 — 14.8 15.9Mr. Au Tak-Cheong 0.5 — — 0.3 — 8.6 9.4Mr. Sitt Nam-Hoi 0.1 — — 0.3 — 13.6 14.0Mr. So Chung-Keung, Alfred 0.1 — — 0.5 — 16.8 17.4
Total 7.9 7.3 1.6 9.9 0.7 152.4 179.8
183Notes to the Financial Statements
16 BENEFITS AND INTERESTS OF DIRECTORS (CONTINUED)
(a) Directors’ emoluments (continued)Notes:
(i) The amounts represented emoluments paid or receivable in respect of a person’s services as a director, whether of the Company or its subsidiary undertakings.
(ii) The amounts represented emoluments paid or receivable in respect of a person’s other services in connection with the management of the affairs of the Company or its subsidiary undertakings and included salaries, discretionary bonuses, employer’s contributions to retirement benefit schemes and housing allowance.
(iii) Other benefits represented share options. The value of the share options granted to the directors of the Company under the share option schemes of the Company and its subsidiaries represents the fair value of these options charged to the consolidated income statement for the year in accordance with HKFRS 2.
(iv) No director waived or agreed to waive any emoluments during the year.
(b) Directors’ material interests in transactions, arrangements or contractsOn 10 April 2017, a master services agreement (the “Mr. Doo MSA”) was entered into between the Company and Mr. Doo Wai-Hoi, William, Non-executive Vice-chairman (“Mr. Doo”) for a term of three years commencing from 1 July 2017 up to and including 30 June 2020 in respect of the provision of the operational and rental services by companies owned by Mr. Doo to the Group, and vice versa. Subject to compliance with the relevant requirements under the Listing Rules, upon expiration of the initial term or subsequent renewal term, the Mr. Doo MSA will be automatically renewed for a successive period of three years thereafter (or such other period permitted under the Listing Rules). The Mr. Doo MSA and the annual caps set for each of the three financial years ending 30 June 2020 were approved by the independent shareholders of the Company on 26 May 2017. For the year ended 30 June 2019, the aggregate amount of the transactions amounted to approximately HK$1,711.8 million (2018: HK$1,728.3 million).
Save as mentioned above, no other significant transactions, arrangements or contracts in relation to the Group’s business to which the Company was a party and in which a director of the Company had a material interest, whether directly or indirectly, subsisted at the end of the year or at any time during the year.
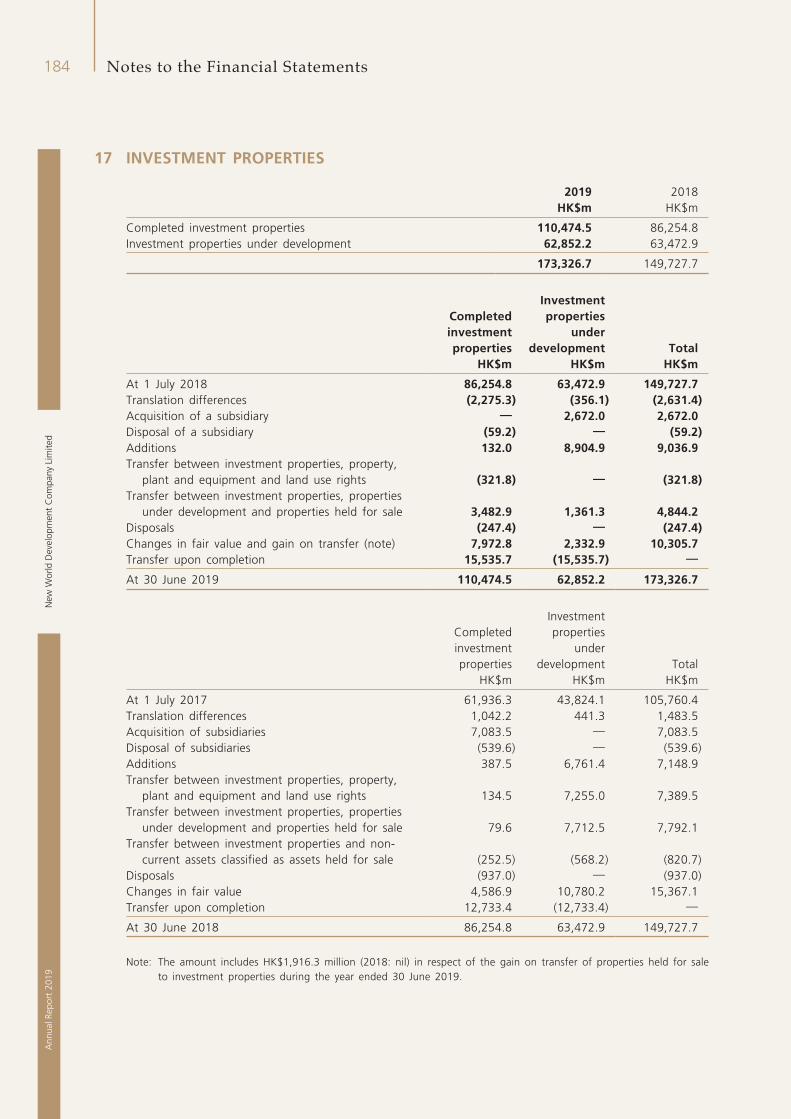
New
Wor
ld D
evel
opm
ent
Com
pany
Lim
ited
184A
nnua
l Rep
ort
2019
Notes to the Financial Statements
17 INVESTMENT PROPERTIES
2019 2018HK$m HK$m
Completed investment properties 110,474.5 86,254.8Investment properties under development 62,852.2 63,472.9
173,326.7 149,727.7
Completed investment properties
Investment properties
under development Total
HK$m HK$m HK$m
At 1 July 2018 86,254.8 63,472.9 149,727.7Translation differences (2,275.3) (356.1) (2,631.4)Acquisition of a subsidiary — 2,672.0 2,672.0Disposal of a subsidiary (59.2) — (59.2)Additions 132.0 8,904.9 9,036.9Transfer between investment properties, property,
plant and equipment and land use rights (321.8) — (321.8)Transfer between investment properties, properties
under development and properties held for sale 3,482.9 1,361.3 4,844.2Disposals (247.4) — (247.4)Changes in fair value and gain on transfer (note) 7,972.8 2,332.9 10,305.7Transfer upon completion 15,535.7 (15,535.7) —
At 30 June 2019 110,474.5 62,852.2 173,326.7
Completed investment properties
Investment properties
under development Total
HK$m HK$m HK$m
At 1 July 2017 61,936.3 43,824.1 105,760.4Translation differences 1,042.2 441.3 1,483.5Acquisition of subsidiaries 7,083.5 — 7,083.5Disposal of subsidiaries (539.6) — (539.6)Additions 387.5 6,761.4 7,148.9Transfer between investment properties, property,
plant and equipment and land use rights 134.5 7,255.0 7,389.5Transfer between investment properties, properties
under development and properties held for sale 79.6 7,712.5 7,792.1Transfer between investment properties and non-
current assets classified as assets held for sale (252.5) (568.2) (820.7)Disposals (937.0) — (937.0)Changes in fair value 4,586.9 10,780.2 15,367.1Transfer upon completion 12,733.4 (12,733.4) —
At 30 June 2018 86,254.8 63,472.9 149,727.7
Note: The amount includes HK$1,916.3 million (2018: nil) in respect of the gain on transfer of properties held for sale to investment properties during the year ended 30 June 2019.
185Notes to the Financial Statements
17 INVESTMENT PROPERTIES (CONTINUED)
Valuation processes of the GroupThe Group measures its investment properties at fair value. The investment properties were revalued by Jones Lang LaSalle Corporate Appraisal and Advisory Limited, Savills Valuation and Professional Services Limited, Knight Frank Petty Limited and Cushman & Wakefield Limited, independent qualified valuers, who hold recognised relevant professional qualification and have recent experience in the locations and segments of the investment properties valued, at 30 June 2019 on an open market value basis. For all investment properties, their current use equates to the highest and best use.
The Group’s finance department includes a team that review the valuation performed by the independent valuers for financial reporting purposes. This team reports directly to the senior management and the Audit Committee. Discussions of valuation processes and results are held between the management and valuers at least once every six months, in line with the Group’s interim and annual reporting dates.
At each financial year end, the finance department verifies all major inputs to the independent valuation reports; assesses property valuation movements when compared to the prior year valuation reports; and holds discussions with the independent valuers.
Valuation techniquesFair value of completed investment properties for commercial, residential, serviced apartment and carparks in Hong Kong and Mainland China and others is generally derived using the income capitalisation method and wherever appropriate, by direct comparison method. Income capitalisation method is based on capitalisation of the net income and reversionary income potential by adopting appropriate capitalisation rates, which are derived from analysis of sale transactions and valuers’ interpretation of prevailing investor requirements or expectations. The prevailing market rents adopted in the valuation have reference to recent lettings, within the subject properties and other comparable properties.
Direct comparison method is based on comparing the property to be valued directly with other comparable properties, which have recently transacted. However, given the heterogeneous nature of real estate properties, appropriate adjustments are usually required to allow for any qualitative differences that may affect the price likely to be achieved by the property under consideration.
Fair value of commercial properties and carpark under development is generally derived using the residual method and wherever appropriate, by direct comparison and income capitalisation method. Residual method is essentially a means of valuing the completed properties by reference to its development potential by deducting development costs together with developer’s profit and risk from the estimated capital value of the proposed development assuming completed as at the date of valuation.
At 30 June 2019 and 2018, all investment properties are included in level 3 in the fair value hierarchy.
There were no changes to the valuation techniques during the year and there were no transfers among the fair value hierarchy during the year.
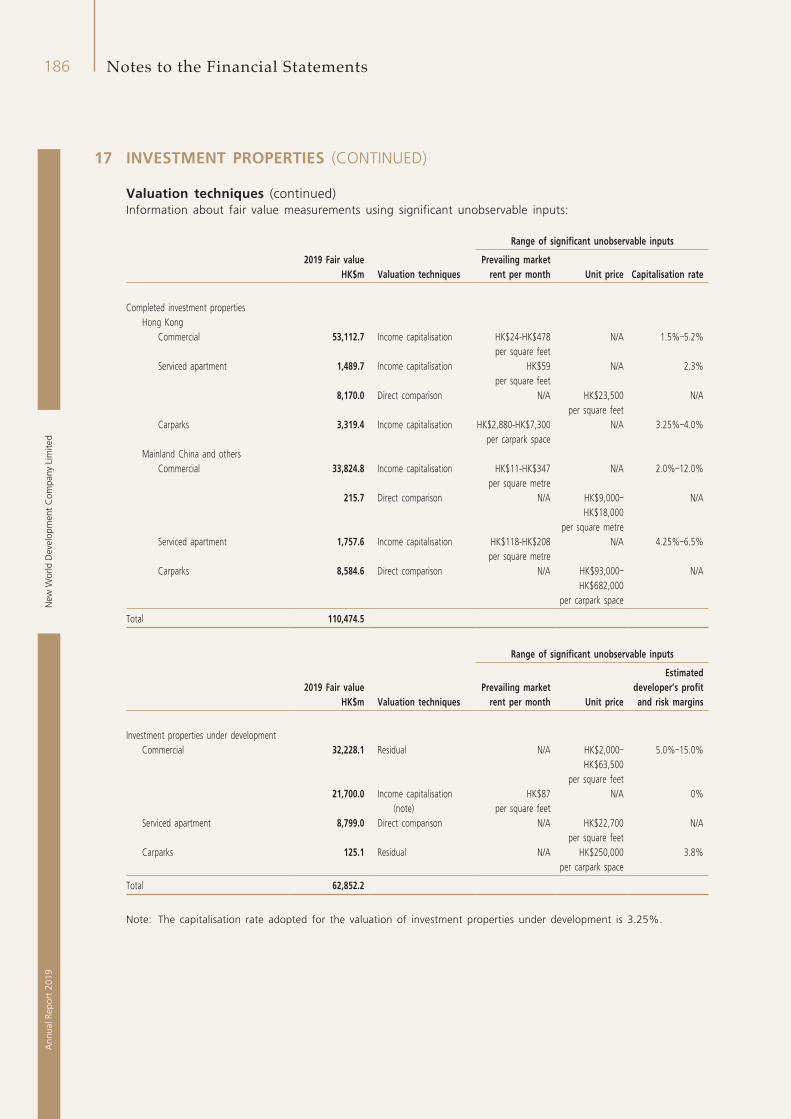
New
Wor
ld D
evel
opm
ent
Com
pany
Lim
ited
186A
nnua
l Rep
ort
2019
Notes to the Financial Statements
17 INVESTMENT PROPERTIES (CONTINUED)
Valuation techniques (continued)Information about fair value measurements using significant unobservable inputs:
Range of significant unobservable inputs
2019 Fair value HK$m Valuation techniques
Prevailing market rent per month Unit price Capitalisation rate
Completed investment propertiesHong Kong
Commercial 53,112.7 Income capitalisation HK$24-HK$478 per square feet
N/A 1.5%–5.2%
Serviced apartment 1,489.7 Income capitalisation HK$59per square feet
N/A 2.3%
8,170.0 Direct comparison N/A HK$23,500per square feet
N/A
Carparks 3,319.4 Income capitalisation HK$2,880-HK$7,300 per carpark space
N/A 3.25%–4.0%
Mainland China and others Commercial 33,824.8 Income capitalisation HK$11-HK$347
per square metreN/A 2.0%–12.0%
215.7 Direct comparison N/A HK$9,000–
HK$18,000per square metre
N/A
Serviced apartment 1,757.6 Income capitalisation HK$118-HK$208per square metre
N/A 4.25%–6.5%
Carparks 8,584.6 Direct comparison N/A HK$93,000–
HK$682,000per carpark space
N/A
Total 110,474.5
Range of significant unobservable inputs
2019 Fair value HK$m Valuation techniques
Prevailing market rent per month Unit price
Estimated developer’s profit and risk margins
Investment properties under developmentCommercial 32,228.1 Residual N/A HK$2,000–
HK$63,500per square feet
5.0%–15.0%
21,700.0 Income capitalisation (note)
HK$87per square feet
N/A 0%
Serviced apartment 8,799.0 Direct comparison N/A HK$22,700per square feet
N/A
Carparks 125.1 Residual N/A HK$250,000per carpark space
3.8%
Total 62,852.2
Note: The capitalisation rate adopted for the valuation of investment properties under development is 3.25%.
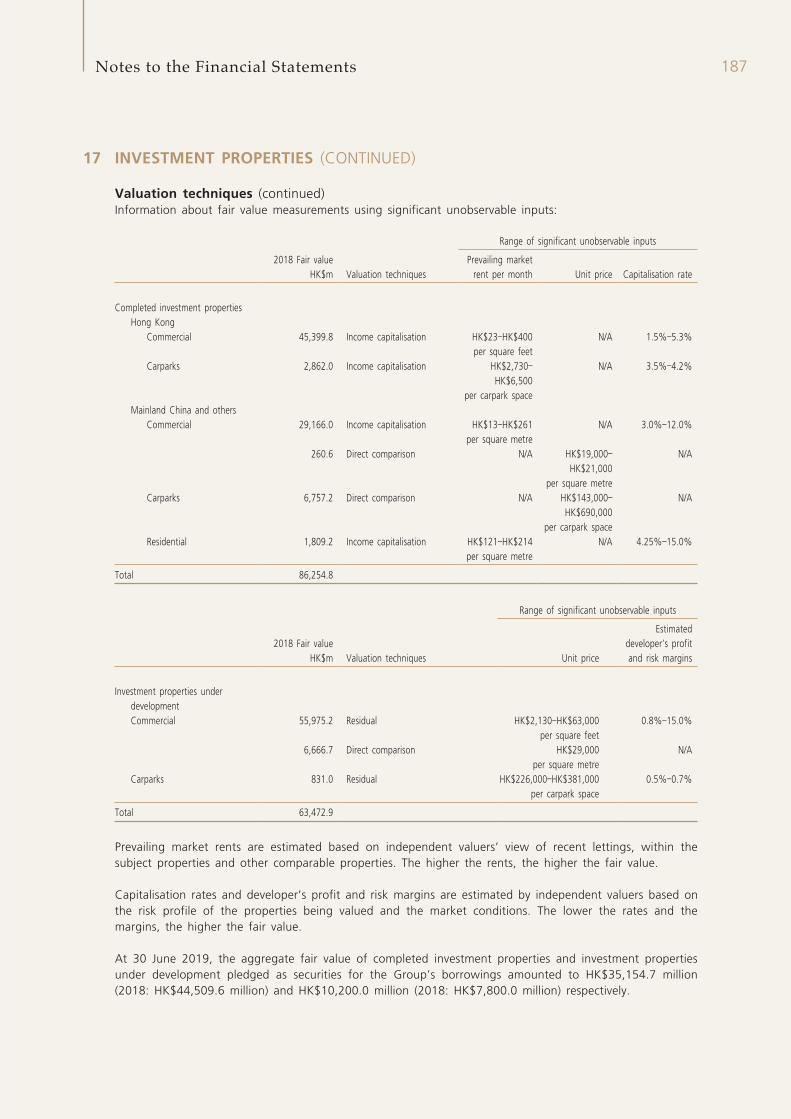
187Notes to the Financial Statements
17 INVESTMENT PROPERTIES (CONTINUED)
Valuation techniques (continued)Information about fair value measurements using significant unobservable inputs:
Range of significant unobservable inputs
2018 Fair value HK$m Valuation techniques
Prevailing market rent per month Unit price Capitalisation rate
Completed investment propertiesHong Kong
Commercial 45,399.8 Income capitalisation HK$23–HK$400per square feet
N/A 1.5%–5.3%
Carparks 2,862.0 Income capitalisation HK$2,730–
HK$6,500per carpark space
N/A 3.5%–4.2%
Mainland China and othersCommercial 29,166.0 Income capitalisation HK$13–HK$261
per square metreN/A 3.0%–12.0%
260.6 Direct comparison N/A HK$19,000–
HK$21,000per square metre
N/A
Carparks 6,757.2 Direct comparison N/A HK$143,000–
HK$690,000per carpark space
N/A
Residential 1,809.2 Income capitalisation HK$121–HK$214per square metre
N/A 4.25%–15.0%
Total 86,254.8
Range of significant unobservable inputs
2018 Fair value HK$m Valuation techniques Unit price
Estimated developer’s profit and risk margins
Investment properties under developmentCommercial 55,975.2 Residual HK$2,130–HK$63,000
per square feet0.8%–15.0%
6,666.7 Direct comparison HK$29,000per square metre
N/A
Carparks 831.0 Residual HK$226,000–HK$381,000per carpark space
0.5%–0.7%
Total 63,472.9
Prevailing market rents are estimated based on independent valuers’ view of recent lettings, within the subject properties and other comparable properties. The higher the rents, the higher the fair value.
Capitalisation rates and developer’s profit and risk margins are estimated by independent valuers based on the risk profile of the properties being valued and the market conditions. The lower the rates and the margins, the higher the fair value.
At 30 June 2019, the aggregate fair value of completed investment properties and investment properties under development pledged as securities for the Group’s borrowings amounted to HK$35,154.7 million (2018: HK$44,509.6 million) and HK$10,200.0 million (2018: HK$7,800.0 million) respectively.
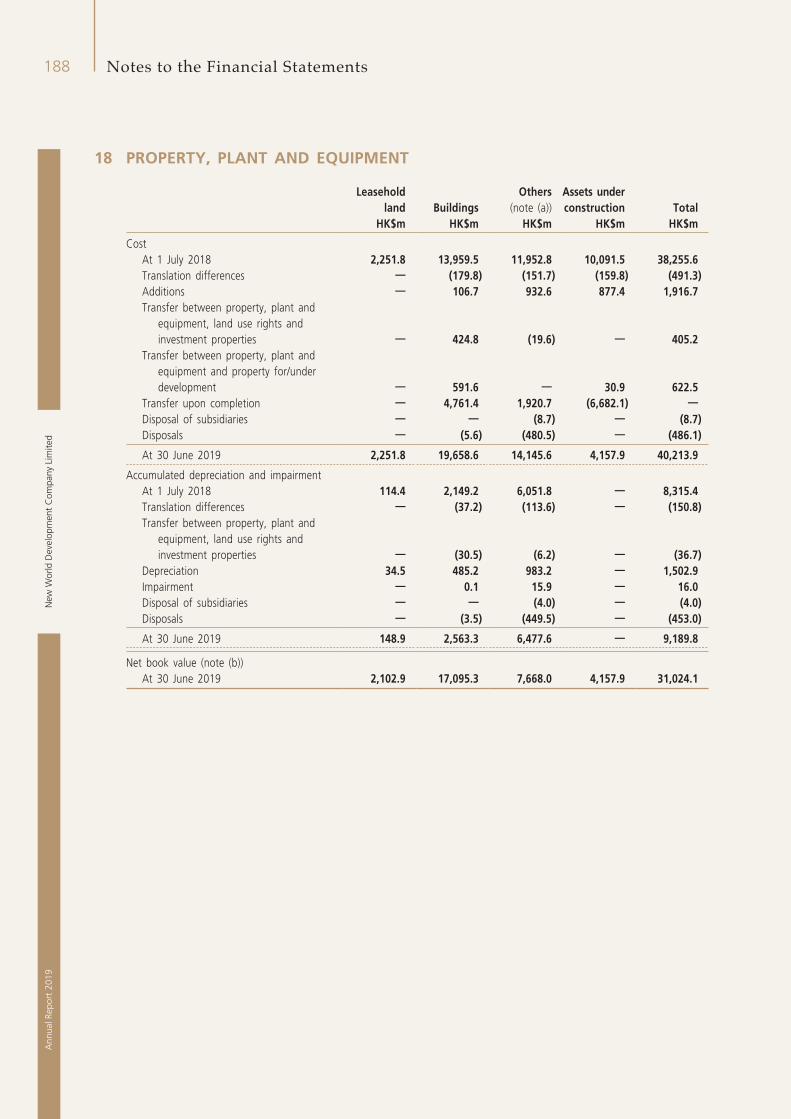
New
Wor
ld D
evel
opm
ent
Com
pany
Lim
ited
188A
nnua
l Rep
ort
2019
Notes to the Financial Statements
18 PROPERTY, PLANT AND EQUIPMENT
Leasehold land Buildings
Others (note (a))
Assets under construction Total
HK$m HK$m HK$m HK$m HK$m
CostAt 1 July 2018 2,251.8 13,959.5 11,952.8 10,091.5 38,255.6Translation differences — (179.8) (151.7) (159.8) (491.3)Additions — 106.7 932.6 877.4 1,916.7Transfer between property, plant and
equipment, land use rights and investment properties — 424.8 (19.6) — 405.2
Transfer between property, plant and equipment and property for/under development — 591.6 — 30.9 622.5
Transfer upon completion — 4,761.4 1,920.7 (6,682.1) —Disposal of subsidiaries — — (8.7) — (8.7)Disposals — (5.6) (480.5) — (486.1)
At 30 June 2019 2,251.8 19,658.6 14,145.6 4,157.9 40,213.9
Accumulated depreciation and impairmentAt 1 July 2018 114.4 2,149.2 6,051.8 — 8,315.4Translation differences — (37.2) (113.6) — (150.8)Transfer between property, plant and
equipment, land use rights and investment properties — (30.5) (6.2) — (36.7)
Depreciation 34.5 485.2 983.2 — 1,502.9Impairment — 0.1 15.9 — 16.0Disposal of subsidiaries — — (4.0) — (4.0)Disposals — (3.5) (449.5) — (453.0)
At 30 June 2019 148.9 2,563.3 6,477.6 — 9,189.8
Net book value (note (b))At 30 June 2019 2,102.9 17,095.3 7,668.0 4,157.9 31,024.1
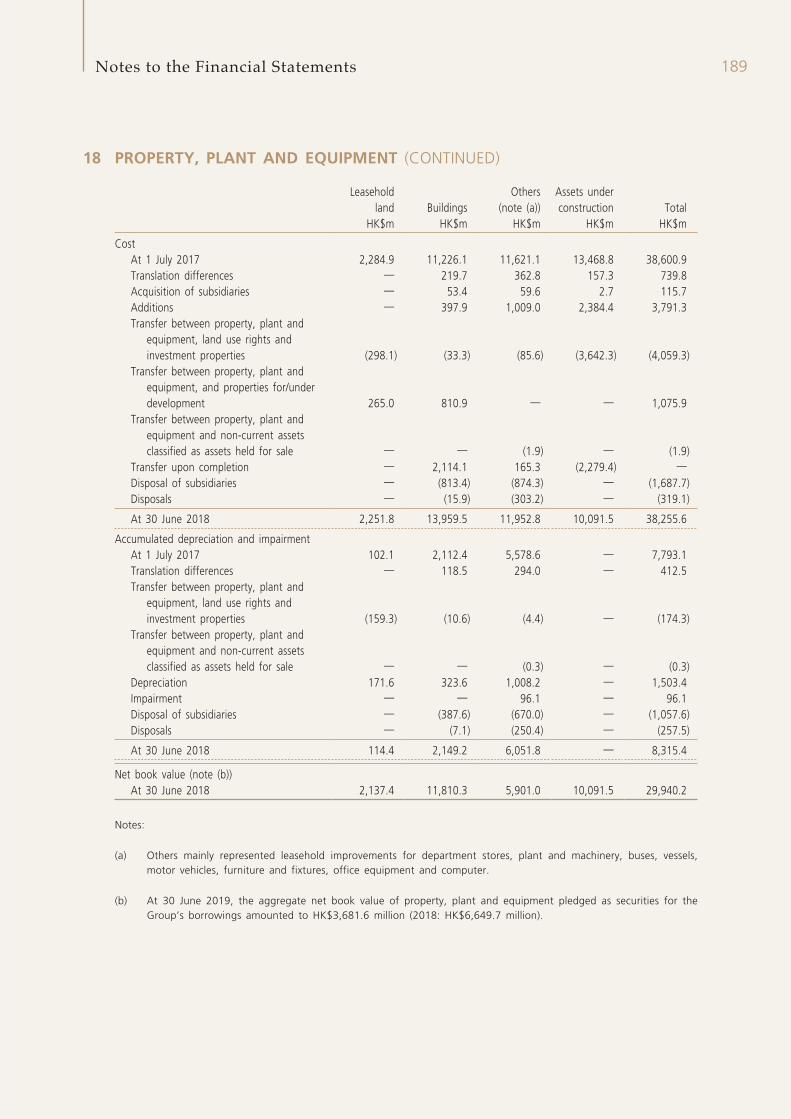
189Notes to the Financial Statements
18 PROPERTY, PLANT AND EQUIPMENT (CONTINUED)
Leasehold land Buildings
Others (note (a))
Assets under construction Total
HK$m HK$m HK$m HK$m HK$m
CostAt 1 July 2017 2,284.9 11,226.1 11,621.1 13,468.8 38,600.9Translation differences — 219.7 362.8 157.3 739.8Acquisition of subsidiaries — 53.4 59.6 2.7 115.7Additions — 397.9 1,009.0 2,384.4 3,791.3Transfer between property, plant and
equipment, land use rights and investment properties (298.1) (33.3) (85.6) (3,642.3) (4,059.3)
Transfer between property, plant and equipment, and properties for/under development 265.0 810.9 — — 1,075.9
Transfer between property, plant and equipment and non-current assets classified as assets held for sale — — (1.9) — (1.9)
Transfer upon completion — 2,114.1 165.3 (2,279.4) —Disposal of subsidiaries — (813.4) (874.3) — (1,687.7)Disposals — (15.9) (303.2) — (319.1)
At 30 June 2018 2,251.8 13,959.5 11,952.8 10,091.5 38,255.6
Accumulated depreciation and impairmentAt 1 July 2017 102.1 2,112.4 5,578.6 — 7,793.1Translation differences — 118.5 294.0 — 412.5Transfer between property, plant and
equipment, land use rights and investment properties (159.3) (10.6) (4.4) — (174.3)
Transfer between property, plant and equipment and non-current assets classified as assets held for sale — — (0.3) — (0.3)
Depreciation 171.6 323.6 1,008.2 — 1,503.4Impairment — — 96.1 — 96.1Disposal of subsidiaries — (387.6) (670.0) — (1,057.6)Disposals — (7.1) (250.4) — (257.5)
At 30 June 2018 114.4 2,149.2 6,051.8 — 8,315.4
Net book value (note (b))At 30 June 2018 2,137.4 11,810.3 5,901.0 10,091.5 29,940.2
Notes:
(a) Others mainly represented leasehold improvements for department stores, plant and machinery, buses, vessels, motor vehicles, furniture and fixtures, office equipment and computer.
(b) At 30 June 2019, the aggregate net book value of property, plant and equipment pledged as securities for the Group’s borrowings amounted to HK$3,681.6 million (2018: HK$6,649.7 million).
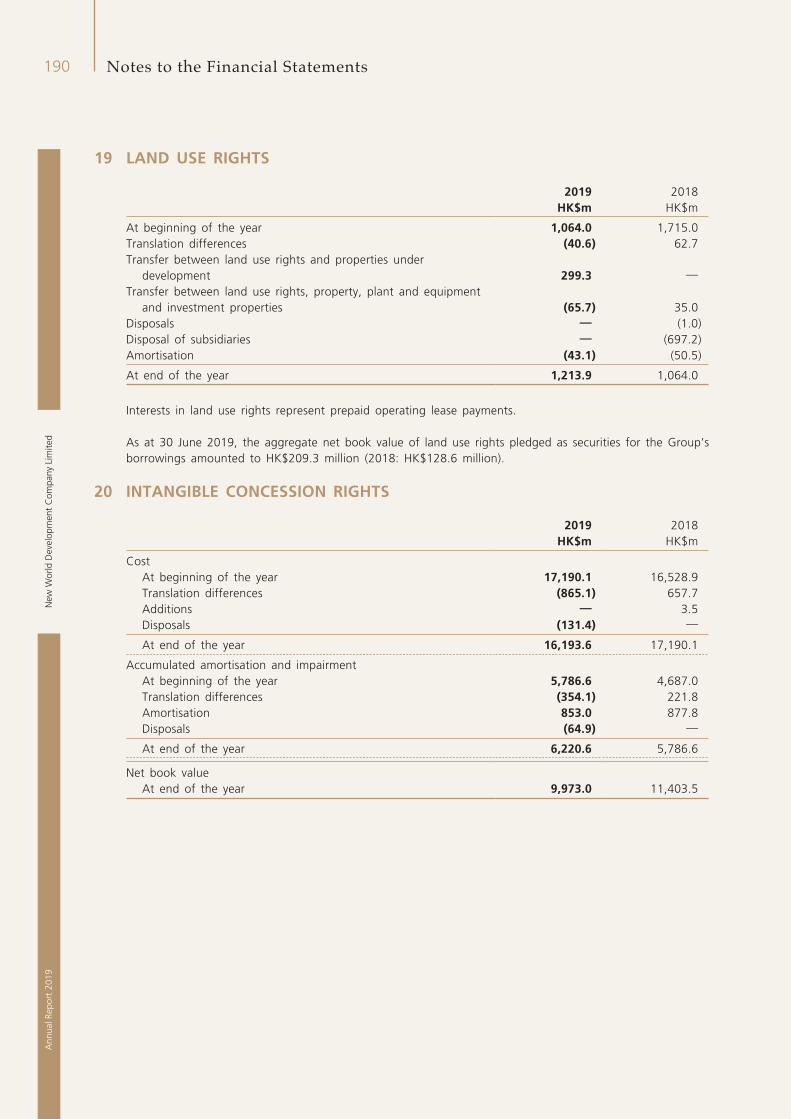
New
Wor
ld D
evel
opm
ent
Com
pany
Lim
ited
190A
nnua
l Rep
ort
2019
Notes to the Financial Statements
19 LAND USE RIGHTS
2019 2018HK$m HK$m
At beginning of the year 1,064.0 1,715.0Translation differences (40.6) 62.7Transfer between land use rights and properties under
development 299.3 —Transfer between land use rights, property, plant and equipment
and investment properties (65.7) 35.0Disposals — (1.0)Disposal of subsidiaries — (697.2)Amortisation (43.1) (50.5)
At end of the year 1,213.9 1,064.0
Interests in land use rights represent prepaid operating lease payments.
As at 30 June 2019, the aggregate net book value of land use rights pledged as securities for the Group’s borrowings amounted to HK$209.3 million (2018: HK$128.6 million).
20 INTANGIBLE CONCESSION RIGHTS
2019 2018HK$m HK$m
CostAt beginning of the year 17,190.1 16,528.9Translation differences (865.1) 657.7Additions — 3.5Disposals (131.4) —
At end of the year 16,193.6 17,190.1
Accumulated amortisation and impairmentAt beginning of the year 5,786.6 4,687.0Translation differences (354.1) 221.8Amortisation 853.0 877.8Disposals (64.9) —
At end of the year 6,220.6 5,786.6
Net book valueAt end of the year 9,973.0 11,403.5
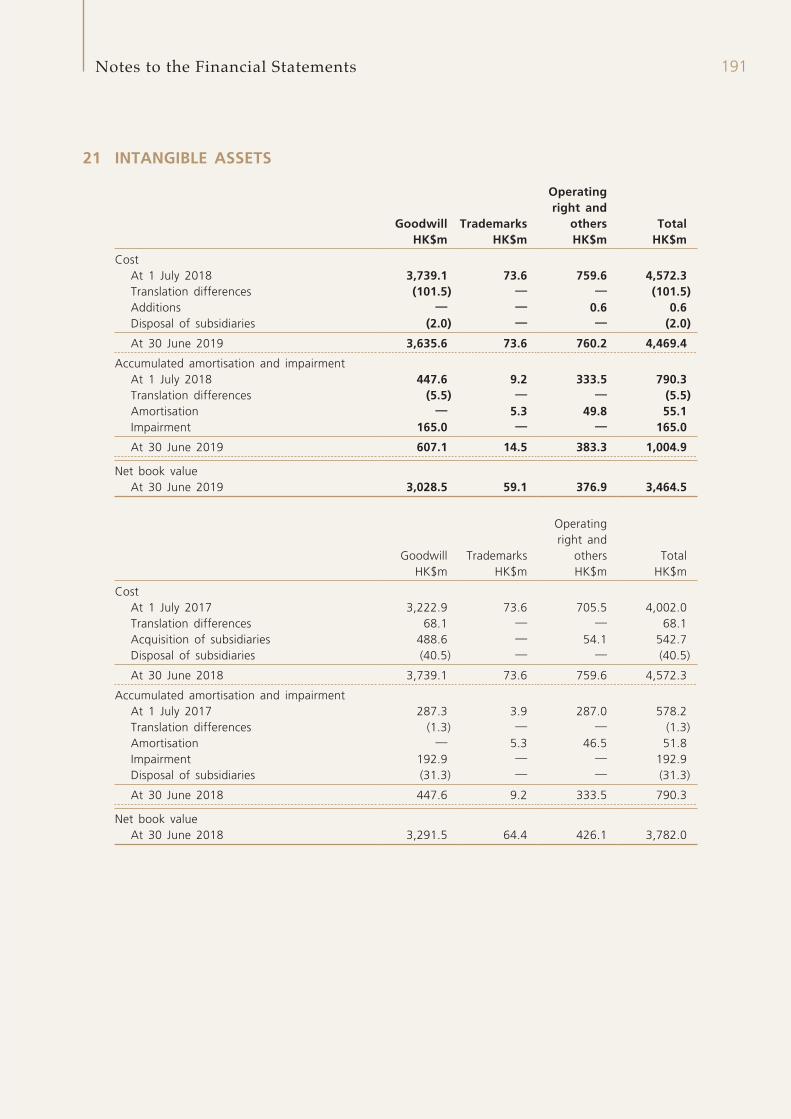
191Notes to the Financial Statements
21 INTANGIBLE ASSETS
Goodwill Trademarks
Operating right and
others TotalHK$m HK$m HK$m HK$m
CostAt 1 July 2018 3,739.1 73.6 759.6 4,572.3Translation differences (101.5) — — (101.5)Additions — — 0.6 0.6Disposal of subsidiaries (2.0) — — (2.0)
At 30 June 2019 3,635.6 73.6 760.2 4,469.4
Accumulated amortisation and impairmentAt 1 July 2018 447.6 9.2 333.5 790.3Translation differences (5.5) — — (5.5)Amortisation — 5.3 49.8 55.1Impairment 165.0 — — 165.0
At 30 June 2019 607.1 14.5 383.3 1,004.9
Net book valueAt 30 June 2019 3,028.5 59.1 376.9 3,464.5
Goodwill Trademarks
Operating right and
others TotalHK$m HK$m HK$m HK$m
CostAt 1 July 2017 3,222.9 73.6 705.5 4,002.0Translation differences 68.1 — — 68.1Acquisition of subsidiaries 488.6 — 54.1 542.7Disposal of subsidiaries (40.5) — — (40.5)
At 30 June 2018 3,739.1 73.6 759.6 4,572.3
Accumulated amortisation and impairmentAt 1 July 2017 287.3 3.9 287.0 578.2Translation differences (1.3) — — (1.3)Amortisation — 5.3 46.5 51.8Impairment 192.9 — — 192.9Disposal of subsidiaries (31.3) — — (31.3)
At 30 June 2018 447.6 9.2 333.5 790.3
Net book valueAt 30 June 2018 3,291.5 64.4 426.1 3,782.0
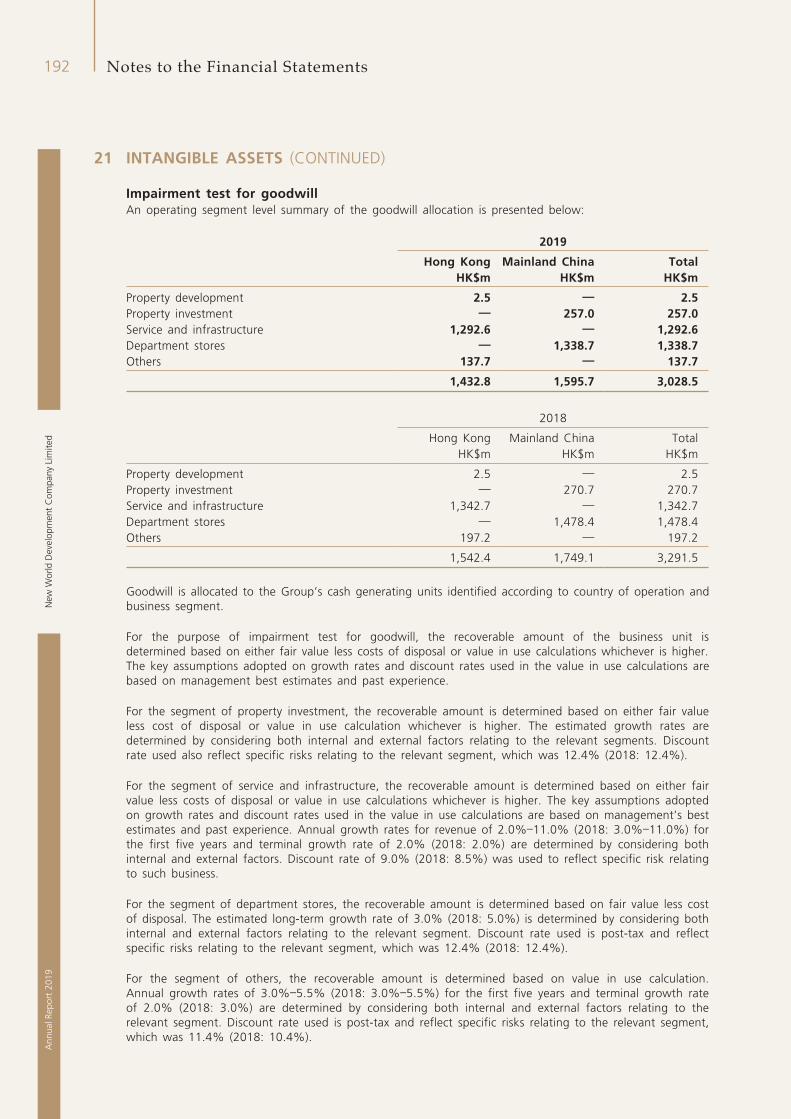
New
Wor
ld D
evel
opm
ent
Com
pany
Lim
ited
192A
nnua
l Rep
ort
2019
Notes to the Financial Statements
21 INTANGIBLE ASSETS (CONTINUED)
Impairment test for goodwillAn operating segment level summary of the goodwill allocation is presented below:
2019
Hong Kong Mainland China TotalHK$m HK$m HK$m
Property development 2.5 — 2.5Property investment — 257.0 257.0Service and infrastructure 1,292.6 — 1,292.6Department stores — 1,338.7 1,338.7Others 137.7 — 137.7
1,432.8 1,595.7 3,028.5
2018
Hong Kong Mainland China TotalHK$m HK$m HK$m
Property development 2.5 — 2.5Property investment — 270.7 270.7Service and infrastructure 1,342.7 — 1,342.7Department stores — 1,478.4 1,478.4Others 197.2 — 197.2
1,542.4 1,749.1 3,291.5
Goodwill is allocated to the Group’s cash generating units identified according to country of operation and business segment.
For the purpose of impairment test for goodwill, the recoverable amount of the business unit is determined based on either fair value less costs of disposal or value in use calculations whichever is higher. The key assumptions adopted on growth rates and discount rates used in the value in use calculations are based on management best estimates and past experience.
For the segment of property investment, the recoverable amount is determined based on either fair value less cost of disposal or value in use calculation whichever is higher. The estimated growth rates are determined by considering both internal and external factors relating to the relevant segments. Discount rate used also reflect specific risks relating to the relevant segment, which was 12.4% (2018: 12.4%).
For the segment of service and infrastructure, the recoverable amount is determined based on either fair value less costs of disposal or value in use calculations whichever is higher. The key assumptions adopted on growth rates and discount rates used in the value in use calculations are based on management’s best estimates and past experience. Annual growth rates for revenue of 2.0%–11.0% (2018: 3.0%–11.0%) for the first five years and terminal growth rate of 2.0% (2018: 2.0%) are determined by considering both internal and external factors. Discount rate of 9.0% (2018: 8.5%) was used to reflect specific risk relating to such business.
For the segment of department stores, the recoverable amount is determined based on fair value less cost of disposal. The estimated long-term growth rate of 3.0% (2018: 5.0%) is determined by considering both internal and external factors relating to the relevant segment. Discount rate used is post-tax and reflect specific risks relating to the relevant segment, which was 12.4% (2018: 12.4%).
For the segment of others, the recoverable amount is determined based on value in use calculation. Annual growth rates of 3.0%–5.5% (2018: 3.0%–5.5%) for the first five years and terminal growth rate of 2.0% (2018: 3.0%) are determined by considering both internal and external factors relating to the relevant segment. Discount rate used is post-tax and reflect specific risks relating to the relevant segment, which was 11.4% (2018: 10.4%).
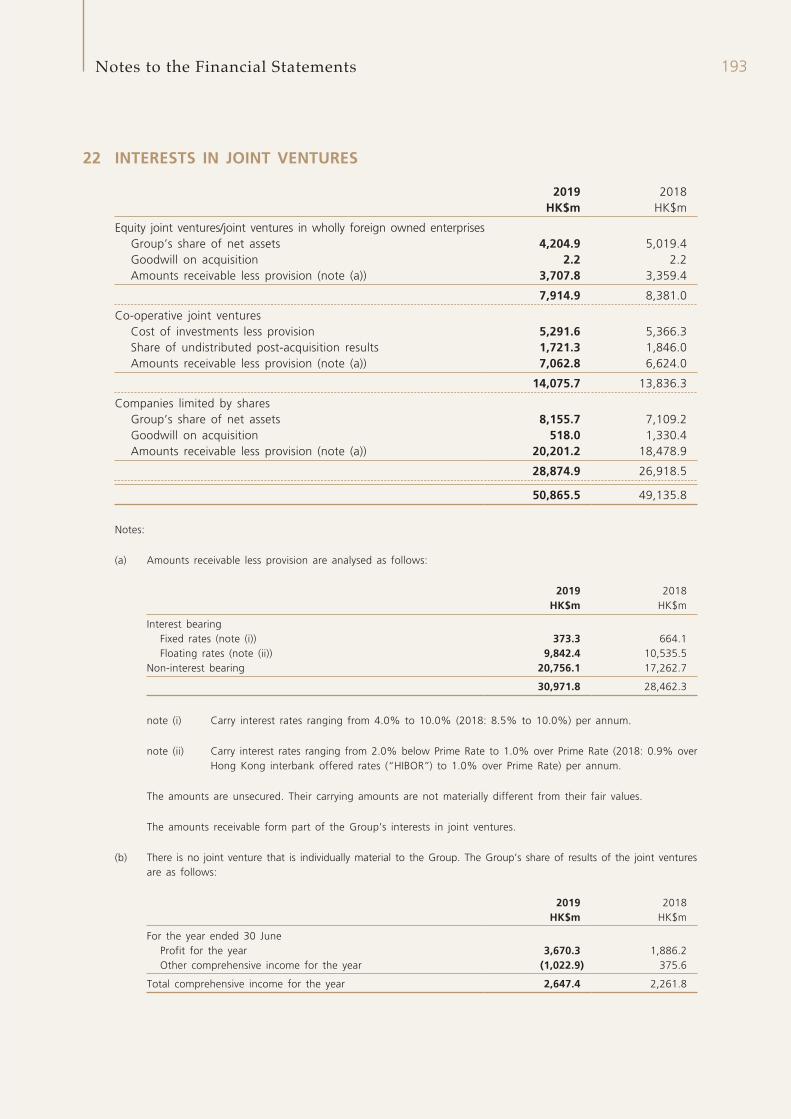
193Notes to the Financial Statements
22 INTERESTS IN JOINT VENTURES
2019 2018HK$m HK$m
Equity joint ventures/joint ventures in wholly foreign owned enterprisesGroup’s share of net assets 4,204.9 5,019.4Goodwill on acquisition 2.2 2.2Amounts receivable less provision (note (a)) 3,707.8 3,359.4
7,914.9 8,381.0
Co-operative joint venturesCost of investments less provision 5,291.6 5,366.3Share of undistributed post-acquisition results 1,721.3 1,846.0Amounts receivable less provision (note (a)) 7,062.8 6,624.0
14,075.7 13,836.3
Companies limited by sharesGroup’s share of net assets 8,155.7 7,109.2Goodwill on acquisition 518.0 1,330.4Amounts receivable less provision (note (a)) 20,201.2 18,478.9
28,874.9 26,918.5
50,865.5 49,135.8
Notes:
(a) Amounts receivable less provision are analysed as follows:
2019 2018HK$m HK$m
Interest bearingFixed rates (note (i)) 373.3 664.1Floating rates (note (ii)) 9,842.4 10,535.5
Non-interest bearing 20,756.1 17,262.7
30,971.8 28,462.3
note (i) Carry interest rates ranging from 4.0% to 10.0% (2018: 8.5% to 10.0%) per annum.
note (ii) Carry interest rates ranging from 2.0% below Prime Rate to 1.0% over Prime Rate (2018: 0.9% over Hong Kong interbank offered rates (“HIBOR”) to 1.0% over Prime Rate) per annum.
The amounts are unsecured. Their carrying amounts are not materially different from their fair values.
The amounts receivable form part of the Group’s interests in joint ventures.
(b) There is no joint venture that is individually material to the Group. The Group’s share of results of the joint ventures are as follows:
2019 2018HK$m HK$m
For the year ended 30 JuneProfit for the year 3,670.3 1,886.2Other comprehensive income for the year (1,022.9) 375.6
Total comprehensive income for the year 2,647.4 2,261.8
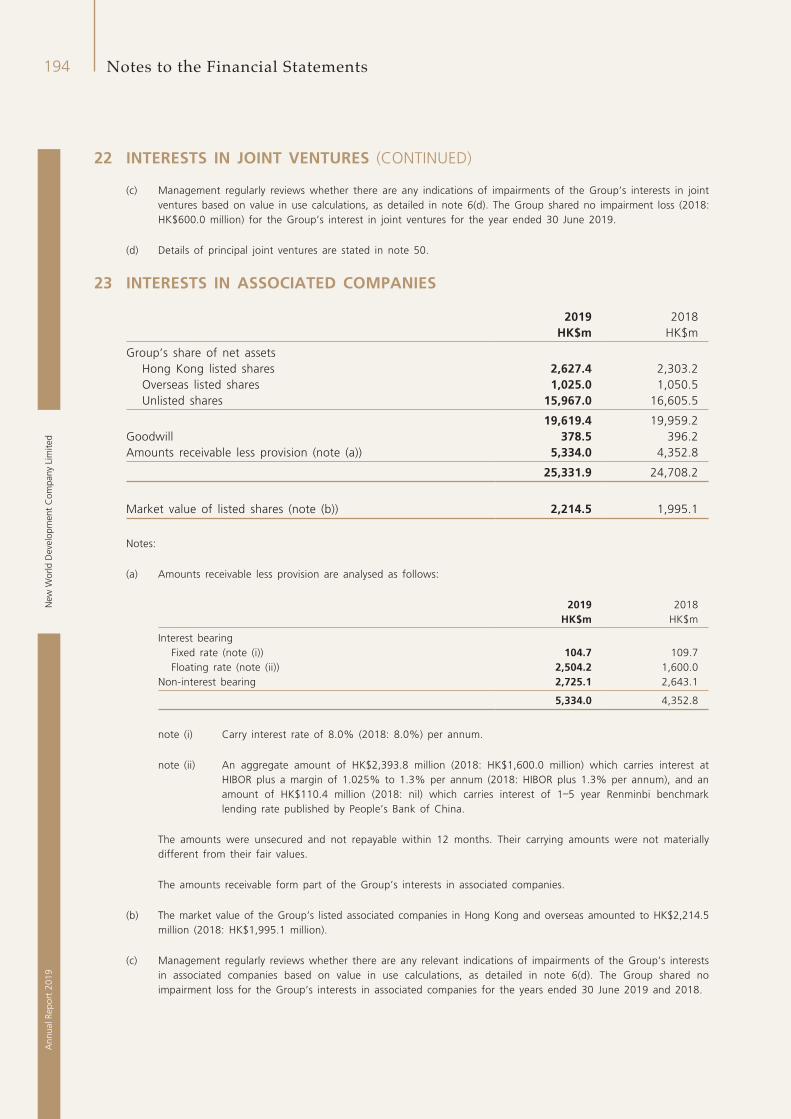
New
Wor
ld D
evel
opm
ent
Com
pany
Lim
ited
194A
nnua
l Rep
ort
2019
Notes to the Financial Statements
22 INTERESTS IN JOINT VENTURES (CONTINUED)
(c) Management regularly reviews whether there are any indications of impairments of the Group’s interests in joint ventures based on value in use calculations, as detailed in note 6(d). The Group shared no impairment loss (2018: HK$600.0 million) for the Group’s interest in joint ventures for the year ended 30 June 2019.
(d) Details of principal joint ventures are stated in note 50.
23 INTERESTS IN ASSOCIATED COMPANIES
2019 2018HK$m HK$m
Group’s share of net assetsHong Kong listed shares 2,627.4 2,303.2Overseas listed shares 1,025.0 1,050.5Unlisted shares 15,967.0 16,605.5
19,619.4 19,959.2Goodwill 378.5 396.2Amounts receivable less provision (note (a)) 5,334.0 4,352.8
25,331.9 24,708.2
Market value of listed shares (note (b)) 2,214.5 1,995.1
Notes:
(a) Amounts receivable less provision are analysed as follows:
2019 2018HK$m HK$m
Interest bearingFixed rate (note (i)) 104.7 109.7Floating rate (note (ii)) 2,504.2 1,600.0
Non-interest bearing 2,725.1 2,643.1
5,334.0 4,352.8
note (i) Carry interest rate of 8.0% (2018: 8.0%) per annum.
note (ii) An aggregate amount of HK$2,393.8 million (2018: HK$1,600.0 million) which carries interest at HIBOR plus a margin of 1.025% to 1.3% per annum (2018: HIBOR plus 1.3% per annum), and an amount of HK$110.4 million (2018: nil) which carries interest of 1–5 year Renminbi benchmark lending rate published by People’s Bank of China.
The amounts were unsecured and not repayable within 12 months. Their carrying amounts were not materially different from their fair values.
The amounts receivable form part of the Group’s interests in associated companies.
(b) The market value of the Group’s listed associated companies in Hong Kong and overseas amounted to HK$2,214.5 million (2018: HK$1,995.1 million).
(c) Management regularly reviews whether there are any relevant indications of impairments of the Group’s interests in associated companies based on value in use calculations, as detailed in note 6(d). The Group shared no impairment loss for the Group’s interests in associated companies for the years ended 30 June 2019 and 2018.
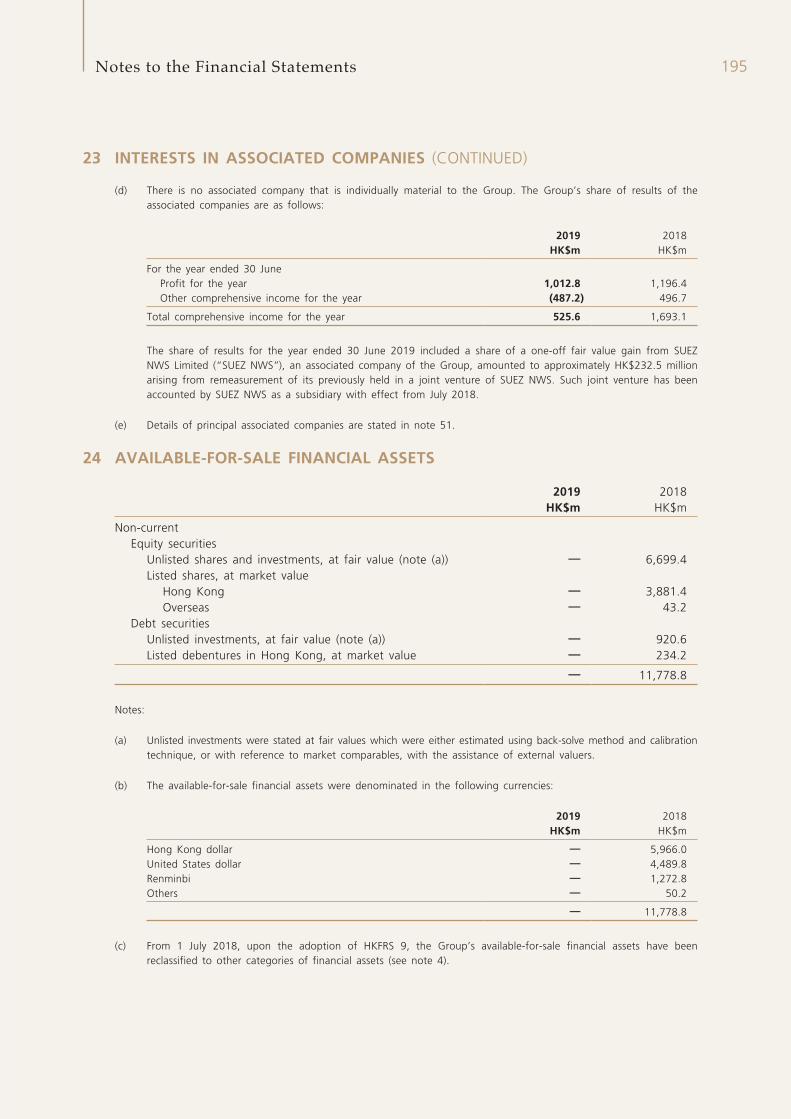
195Notes to the Financial Statements
23 INTERESTS IN ASSOCIATED COMPANIES (CONTINUED)
(d) There is no associated company that is individually material to the Group. The Group’s share of results of the associated companies are as follows:
2019 2018HK$m HK$m
For the year ended 30 JuneProfit for the year 1,012.8 1,196.4Other comprehensive income for the year (487.2) 496.7
Total comprehensive income for the year 525.6 1,693.1
The share of results for the year ended 30 June 2019 included a share of a one-off fair value gain from SUEZ NWS Limited (“SUEZ NWS”), an associated company of the Group, amounted to approximately HK$232.5 million arising from remeasurement of its previously held in a joint venture of SUEZ NWS. Such joint venture has been accounted by SUEZ NWS as a subsidiary with effect from July 2018.
(e) Details of principal associated companies are stated in note 51.
24 AVAILABLE-FOR-SALE FINANCIAL ASSETS
2019 2018HK$m HK$m
Non-currentEquity securities
Unlisted shares and investments, at fair value (note (a)) — 6,699.4Listed shares, at market value
Hong Kong — 3,881.4Overseas — 43.2
Debt securitiesUnlisted investments, at fair value (note (a)) — 920.6Listed debentures in Hong Kong, at market value — 234.2
— 11,778.8
Notes:
(a) Unlisted investments were stated at fair values which were either estimated using back-solve method and calibration technique, or with reference to market comparables, with the assistance of external valuers.
(b) The available-for-sale financial assets were denominated in the following currencies:
2019 2018HK$m HK$m
Hong Kong dollar — 5,966.0United States dollar — 4,489.8Renminbi — 1,272.8Others — 50.2
— 11,778.8
(c) From 1 July 2018, upon the adoption of HKFRS 9, the Group’s available-for-sale financial assets have been reclassified to other categories of financial assets (see note 4).
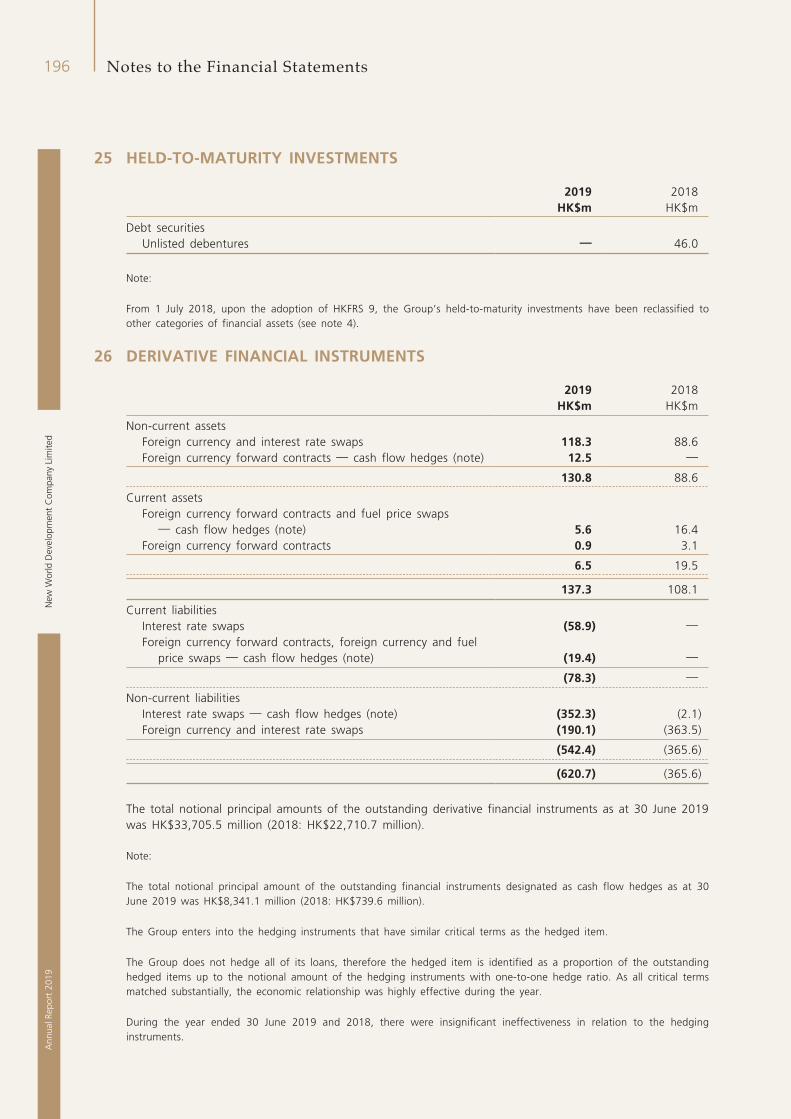
New
Wor
ld D
evel
opm
ent
Com
pany
Lim
ited
196A
nnua
l Rep
ort
2019
Notes to the Financial Statements
25 HELD-TO-MATURITY INVESTMENTS
2019 2018HK$m HK$m
Debt securitiesUnlisted debentures — 46.0
Note:
From 1 July 2018, upon the adoption of HKFRS 9, the Group’s held-to-maturity investments have been reclassified to other categories of financial assets (see note 4).
26 DERIVATIVE FINANCIAL INSTRUMENTS
2019 2018HK$m HK$m
Non-current assetsForeign currency and interest rate swaps 118.3 88.6Foreign currency forward contracts — cash flow hedges (note) 12.5 —
130.8 88.6
Current assetsForeign currency forward contracts and fuel price swaps
— cash flow hedges (note) 5.6 16.4Foreign currency forward contracts 0.9 3.1
6.5 19.5
137.3 108.1
Current liabilitiesInterest rate swaps (58.9) —Foreign currency forward contracts, foreign currency and fuel
price swaps — cash flow hedges (note) (19.4) —
(78.3) —
Non-current liabilitiesInterest rate swaps — cash flow hedges (note) (352.3) (2.1)Foreign currency and interest rate swaps (190.1) (363.5)
(542.4) (365.6)
(620.7) (365.6)
The total notional principal amounts of the outstanding derivative financial instruments as at 30 June 2019 was HK$33,705.5 million (2018: HK$22,710.7 million).
Note:
The total notional principal amount of the outstanding financial instruments designated as cash flow hedges as at 30 June 2019 was HK$8,341.1 million (2018: HK$739.6 million).
The Group enters into the hedging instruments that have similar critical terms as the hedged item.
The Group does not hedge all of its loans, therefore the hedged item is identified as a proportion of the outstanding hedged items up to the notional amount of the hedging instruments with one-to-one hedge ratio. As all critical terms matched substantially, the economic relationship was highly effective during the year.
During the year ended 30 June 2019 and 2018, there were insignificant ineffectiveness in relation to the hedging instruments.
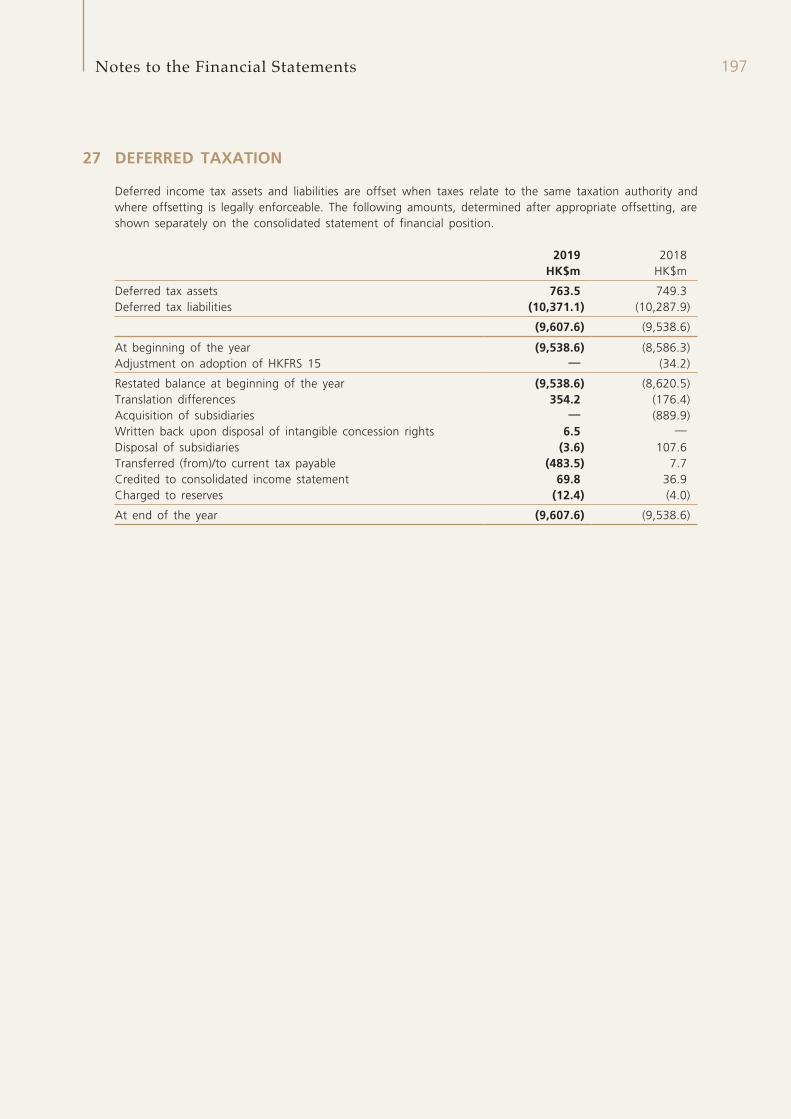
197Notes to the Financial Statements
27 DEFERRED TAXATION
Deferred income tax assets and liabilities are offset when taxes relate to the same taxation authority and where offsetting is legally enforceable. The following amounts, determined after appropriate offsetting, are shown separately on the consolidated statement of financial position.
2019 2018HK$m HK$m
Deferred tax assets 763.5 749.3Deferred tax liabilities (10,371.1) (10,287.9)
(9,607.6) (9,538.6)
At beginning of the year (9,538.6) (8,586.3)Adjustment on adoption of HKFRS 15 — (34.2)
Restated balance at beginning of the year (9,538.6) (8,620.5)Translation differences 354.2 (176.4)Acquisition of subsidiaries — (889.9)Written back upon disposal of intangible concession rights 6.5 —Disposal of subsidiaries (3.6) 107.6Transferred (from)/to current tax payable (483.5) 7.7Credited to consolidated income statement 69.8 36.9Charged to reserves (12.4) (4.0)
At end of the year (9,607.6) (9,538.6)
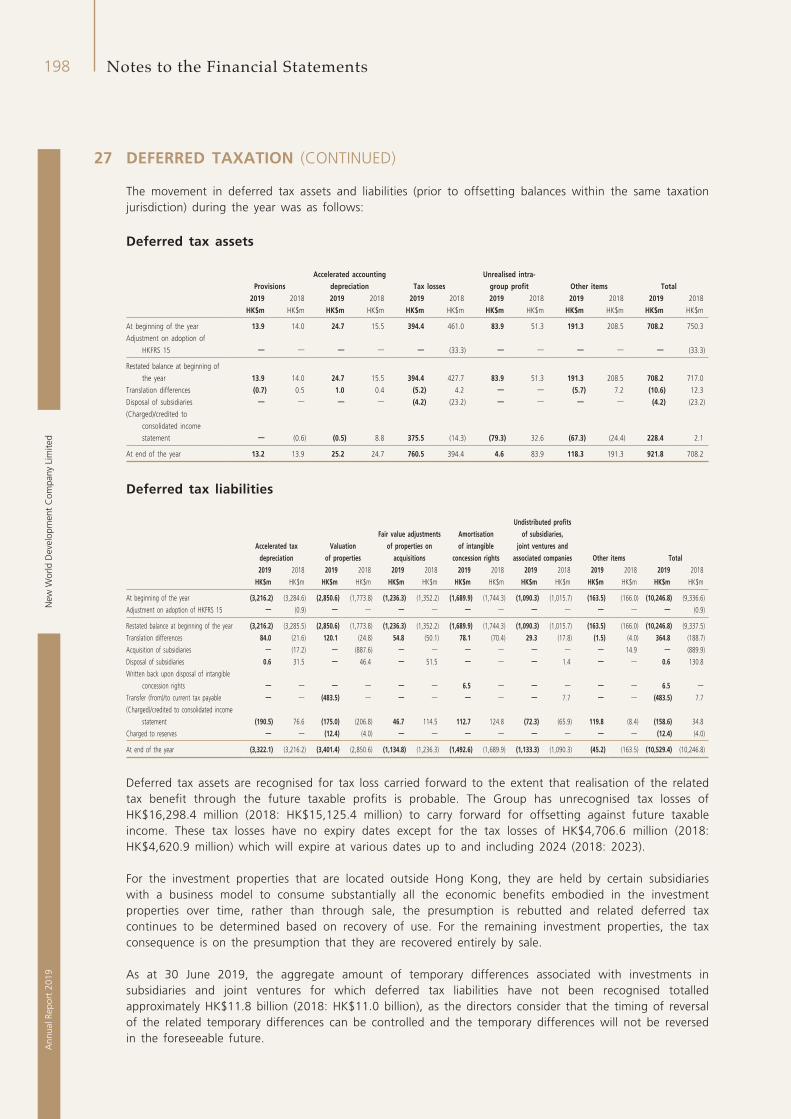
New
Wor
ld D
evel
opm
ent
Com
pany
Lim
ited
198A
nnua
l Rep
ort
2019
Notes to the Financial Statements
27 DEFERRED TAXATION (CONTINUED)
The movement in deferred tax assets and liabilities (prior to offsetting balances within the same taxation jurisdiction) during the year was as follows:
Deferred tax assets
Provisions
Accelerated accounting
depreciation Tax losses
Unrealised intra-
group profit Other items Total
2019 2018 2019 2018 2019 2018 2019 2018 2019 2018 2019 2018
HK$m HK$m HK$m HK$m HK$m HK$m HK$m HK$m HK$m HK$m HK$m HK$m
At beginning of the year 13.9 14.0 24.7 15.5 394.4 461.0 83.9 51.3 191.3 208.5 708.2 750.3
Adjustment on adoption of
HKFRS 15 — — — — — (33.3) — — — — — (33.3)
Restated balance at beginning of
the year 13.9 14.0 24.7 15.5 394.4 427.7 83.9 51.3 191.3 208.5 708.2 717.0
Translation differences (0.7) 0.5 1.0 0.4 (5.2) 4.2 — — (5.7) 7.2 (10.6) 12.3
Disposal of subsidiaries — — — — (4.2) (23.2) — — — — (4.2) (23.2)
(Charged)/credited to
consolidated income
statement — (0.6) (0.5) 8.8 375.5 (14.3) (79.3) 32.6 (67.3) (24.4) 228.4 2.1
At end of the year 13.2 13.9 25.2 24.7 760.5 394.4 4.6 83.9 118.3 191.3 921.8 708.2
Deferred tax liabilities
Accelerated tax
depreciation
Valuation
of properties
Fair value adjustments
of properties on
acquisitions
Amortisation
of intangible
concession rights
Undistributed profits
of subsidiaries,
joint ventures and
associated companies Other items Total
2019 2018 2019 2018 2019 2018 2019 2018 2019 2018 2019 2018 2019 2018
HK$m HK$m HK$m HK$m HK$m HK$m HK$m HK$m HK$m HK$m HK$m HK$m HK$m HK$m
At beginning of the year (3,216.2) (3,284.6) (2,850.6) (1,773.8) (1,236.3) (1,352.2) (1,689.9) (1,744.3) (1,090.3) (1,015.7) (163.5) (166.0) (10,246.8) (9,336.6)
Adjustment on adoption of HKFRS 15 — (0.9) — — — — — — — — — — — (0.9)
Restated balance at beginning of the year (3,216.2) (3,285.5) (2,850.6) (1,773.8) (1,236.3) (1,352.2) (1,689.9) (1,744.3) (1,090.3) (1,015.7) (163.5) (166.0) (10,246.8) (9,337.5)
Translation differences 84.0 (21.6) 120.1 (24.8) 54.8 (50.1) 78.1 (70.4) 29.3 (17.8) (1.5) (4.0) 364.8 (188.7)
Acquisition of subsidiaries — (17.2) — (887.6) — — — — — — — 14.9 — (889.9)
Disposal of subsidiaries 0.6 31.5 — 46.4 — 51.5 — — — 1.4 — — 0.6 130.8
Written back upon disposal of intangible
concession rights — — — — — — 6.5 — — — — — 6.5 —
Transfer (from)/to current tax payable — — (483.5) — — — — — — 7.7 — — (483.5) 7.7
(Charged)/credited to consolidated income
statement (190.5) 76.6 (175.0) (206.8) 46.7 114.5 112.7 124.8 (72.3) (65.9) 119.8 (8.4) (158.6) 34.8
Charged to reserves — — (12.4) (4.0) — — — — — — — — (12.4) (4.0)
At end of the year (3,322.1) (3,216.2) (3,401.4) (2,850.6) (1,134.8) (1,236.3) (1,492.6) (1,689.9) (1,133.3) (1,090.3) (45.2) (163.5) (10,529.4) (10,246.8)
Deferred tax assets are recognised for tax loss carried forward to the extent that realisation of the related tax benefit through the future taxable profits is probable. The Group has unrecognised tax losses of HK$16,298.4 million (2018: HK$15,125.4 million) to carry forward for offsetting against future taxable income. These tax losses have no expiry dates except for the tax losses of HK$4,706.6 million (2018: HK$4,620.9 million) which will expire at various dates up to and including 2024 (2018: 2023).
For the investment properties that are located outside Hong Kong, they are held by certain subsidiaries with a business model to consume substantially all the economic benefits embodied in the investment properties over time, rather than through sale, the presumption is rebutted and related deferred tax continues to be determined based on recovery of use. For the remaining investment properties, the tax consequence is on the presumption that they are recovered entirely by sale.
As at 30 June 2019, the aggregate amount of temporary differences associated with investments in subsidiaries and joint ventures for which deferred tax liabilities have not been recognised totalled approximately HK$11.8 billion (2018: HK$11.0 billion), as the directors consider that the timing of reversal of the related temporary differences can be controlled and the temporary differences will not be reversed in the foreseeable future.
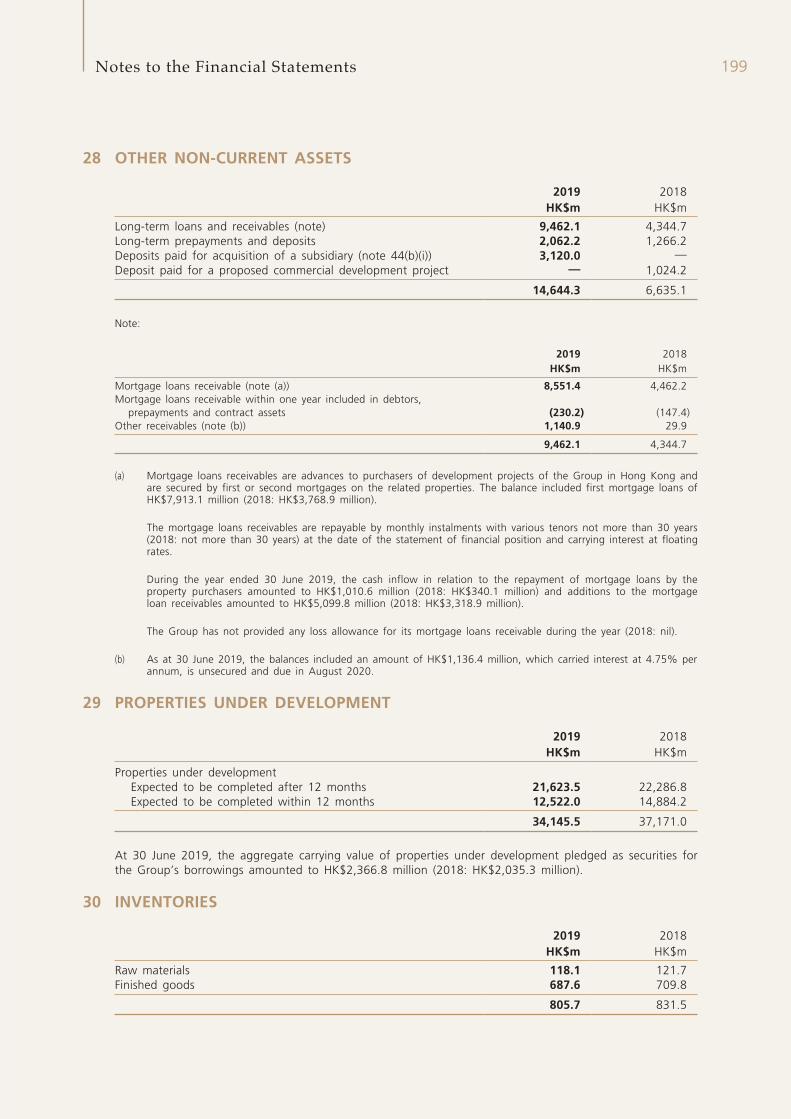
199Notes to the Financial Statements
28 OTHER NON-CURRENT ASSETS
2019 2018HK$m HK$m
Long-term loans and receivables (note) 9,462.1 4,344.7Long-term prepayments and deposits 2,062.2 1,266.2Deposits paid for acquisition of a subsidiary (note 44(b)(i)) 3,120.0 —Deposit paid for a proposed commercial development project — 1,024.2
14,644.3 6,635.1
Note:
2019 2018HK$m HK$m
Mortgage loans receivable (note (a)) 8,551.4 4,462.2Mortgage loans receivable within one year included in debtors,
prepayments and contract assets (230.2) (147.4)Other receivables (note (b)) 1,140.9 29.9
9,462.1 4,344.7
(a) Mortgage loans receivables are advances to purchasers of development projects of the Group in Hong Kong and are secured by first or second mortgages on the related properties. The balance included first mortgage loans of HK$7,913.1 million (2018: HK$3,768.9 million).
The mortgage loans receivables are repayable by monthly instalments with various tenors not more than 30 years (2018: not more than 30 years) at the date of the statement of financial position and carrying interest at floating rates.
During the year ended 30 June 2019, the cash inflow in relation to the repayment of mortgage loans by the property purchasers amounted to HK$1,010.6 million (2018: HK$340.1 million) and additions to the mortgage loan receivables amounted to HK$5,099.8 million (2018: HK$3,318.9 million).
The Group has not provided any loss allowance for its mortgage loans receivable during the year (2018: nil).
(b) As at 30 June 2019, the balances included an amount of HK$1,136.4 million, which carried interest at 4.75% per annum, is unsecured and due in August 2020.
29 PROPERTIES UNDER DEVELOPMENT
2019 2018HK$m HK$m
Properties under developmentExpected to be completed after 12 months 21,623.5 22,286.8Expected to be completed within 12 months 12,522.0 14,884.2
34,145.5 37,171.0
At 30 June 2019, the aggregate carrying value of properties under development pledged as securities for the Group’s borrowings amounted to HK$2,366.8 million (2018: HK$2,035.3 million).
30 INVENTORIES
2019 2018HK$m HK$m
Raw materials 118.1 121.7Finished goods 687.6 709.8
805.7 831.5
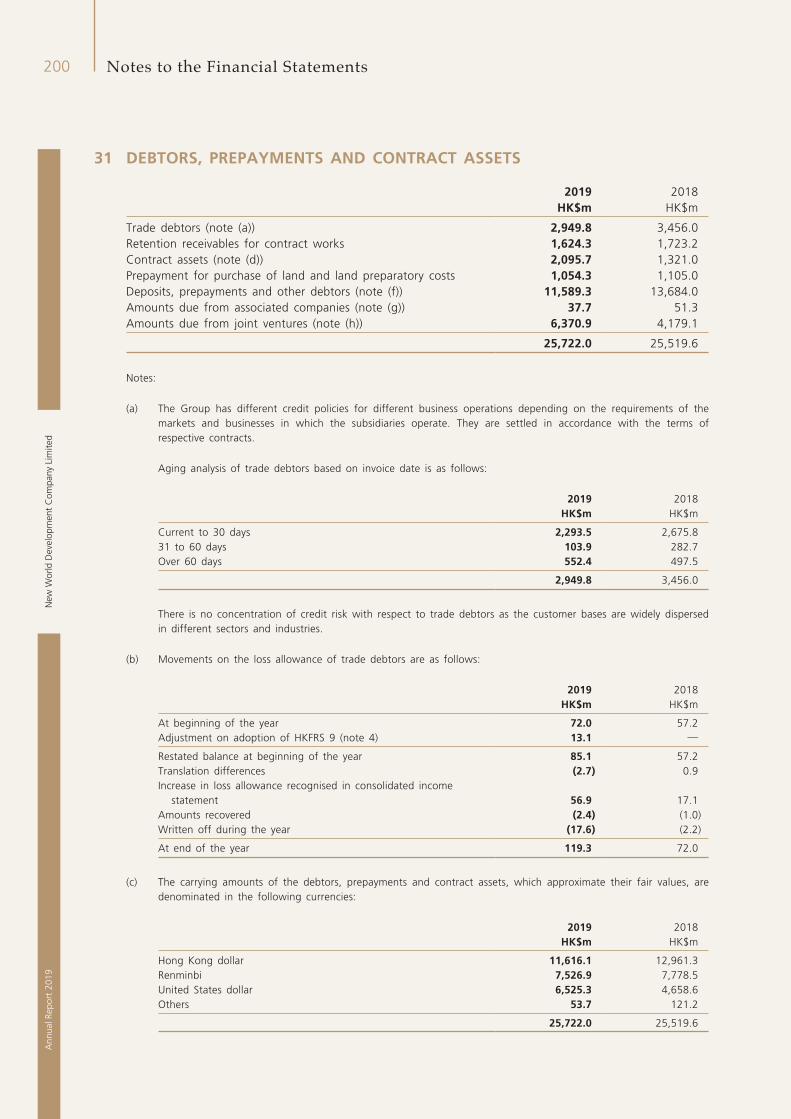
New
Wor
ld D
evel
opm
ent
Com
pany
Lim
ited
200A
nnua
l Rep
ort
2019
Notes to the Financial Statements
31 DEBTORS, PREPAYMENTS AND CONTRACT ASSETS
2019 2018HK$m HK$m
Trade debtors (note (a)) 2,949.8 3,456.0Retention receivables for contract works 1,624.3 1,723.2Contract assets (note (d)) 2,095.7 1,321.0Prepayment for purchase of land and land preparatory costs 1,054.3 1,105.0Deposits, prepayments and other debtors (note (f)) 11,589.3 13,684.0Amounts due from associated companies (note (g)) 37.7 51.3Amounts due from joint ventures (note (h)) 6,370.9 4,179.1
25,722.0 25,519.6
Notes:
(a) The Group has different credit policies for different business operations depending on the requirements of the markets and businesses in which the subsidiaries operate. They are settled in accordance with the terms of respective contracts.
Aging analysis of trade debtors based on invoice date is as follows:
2019 2018HK$m HK$m
Current to 30 days 2,293.5 2,675.831 to 60 days 103.9 282.7Over 60 days 552.4 497.5
2,949.8 3,456.0
There is no concentration of credit risk with respect to trade debtors as the customer bases are widely dispersed in different sectors and industries.
(b) Movements on the loss allowance of trade debtors are as follows:
2019 2018HK$m HK$m
At beginning of the year 72.0 57.2Adjustment on adoption of HKFRS 9 (note 4) 13.1 —
Restated balance at beginning of the year 85.1 57.2Translation differences (2.7) 0.9Increase in loss allowance recognised in consolidated income
statement 56.9 17.1Amounts recovered (2.4) (1.0)Written off during the year (17.6) (2.2)
At end of the year 119.3 72.0
(c) The carrying amounts of the debtors, prepayments and contract assets, which approximate their fair values, are denominated in the following currencies:
2019 2018HK$m HK$m
Hong Kong dollar 11,616.1 12,961.3Renminbi 7,526.9 7,778.5United States dollar 6,525.3 4,658.6Others 53.7 121.2
25,722.0 25,519.6
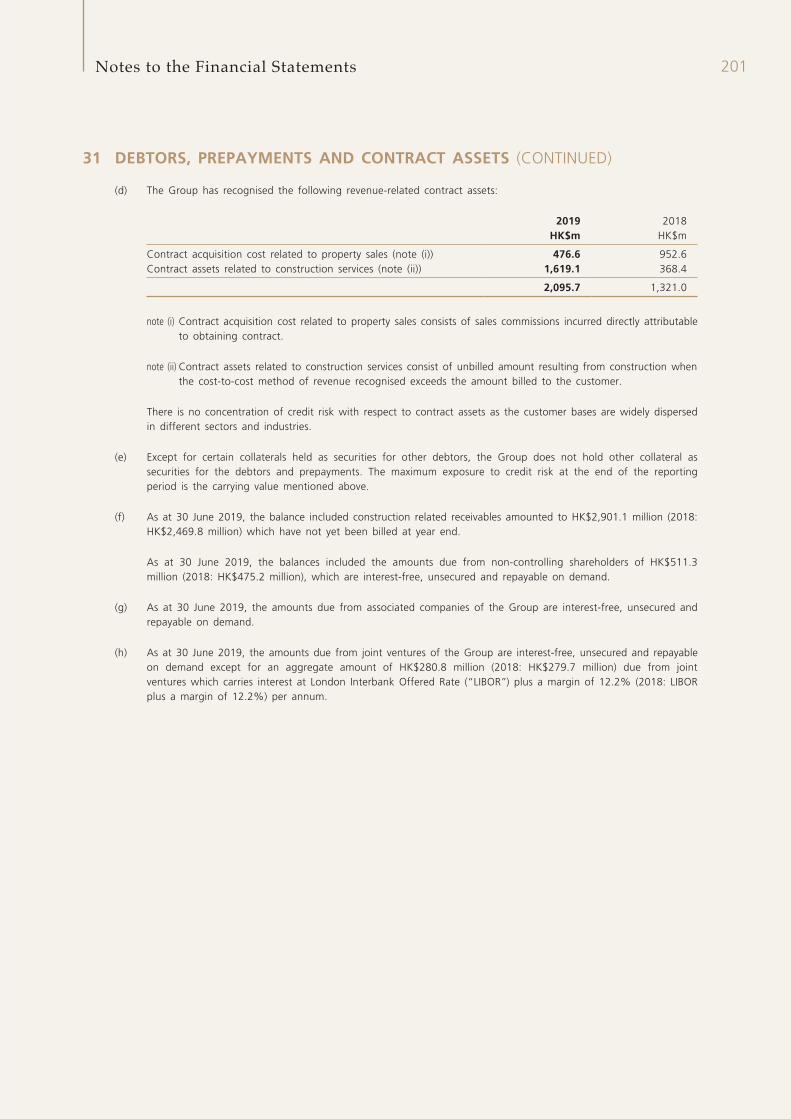
201Notes to the Financial Statements
31 DEBTORS, PREPAYMENTS AND CONTRACT ASSETS (CONTINUED)
(d) The Group has recognised the following revenue-related contract assets:
2019 2018HK$m HK$m
Contract acquisition cost related to property sales (note (i)) 476.6 952.6Contract assets related to construction services (note (ii)) 1,619.1 368.4
2,095.7 1,321.0
note (i) Contract acquisition cost related to property sales consists of sales commissions incurred directly attributable to obtaining contract.
note (ii) Contract assets related to construction services consist of unbilled amount resulting from construction when the cost-to-cost method of revenue recognised exceeds the amount billed to the customer.
There is no concentration of credit risk with respect to contract assets as the customer bases are widely dispersed in different sectors and industries.
(e) Except for certain collaterals held as securities for other debtors, the Group does not hold other collateral as securities for the debtors and prepayments. The maximum exposure to credit risk at the end of the reporting period is the carrying value mentioned above.
(f) As at 30 June 2019, the balance included construction related receivables amounted to HK$2,901.1 million (2018: HK$2,469.8 million) which have not yet been billed at year end.
As at 30 June 2019, the balances included the amounts due from non-controlling shareholders of HK$511.3 million (2018: HK$475.2 million), which are interest-free, unsecured and repayable on demand.
(g) As at 30 June 2019, the amounts due from associated companies of the Group are interest-free, unsecured and repayable on demand.
(h) As at 30 June 2019, the amounts due from joint ventures of the Group are interest-free, unsecured and repayable on demand except for an aggregate amount of HK$280.8 million (2018: HK$279.7 million) due from joint ventures which carries interest at London Interbank Offered Rate (“LIBOR”) plus a margin of 12.2% (2018: LIBOR plus a margin of 12.2%) per annum.
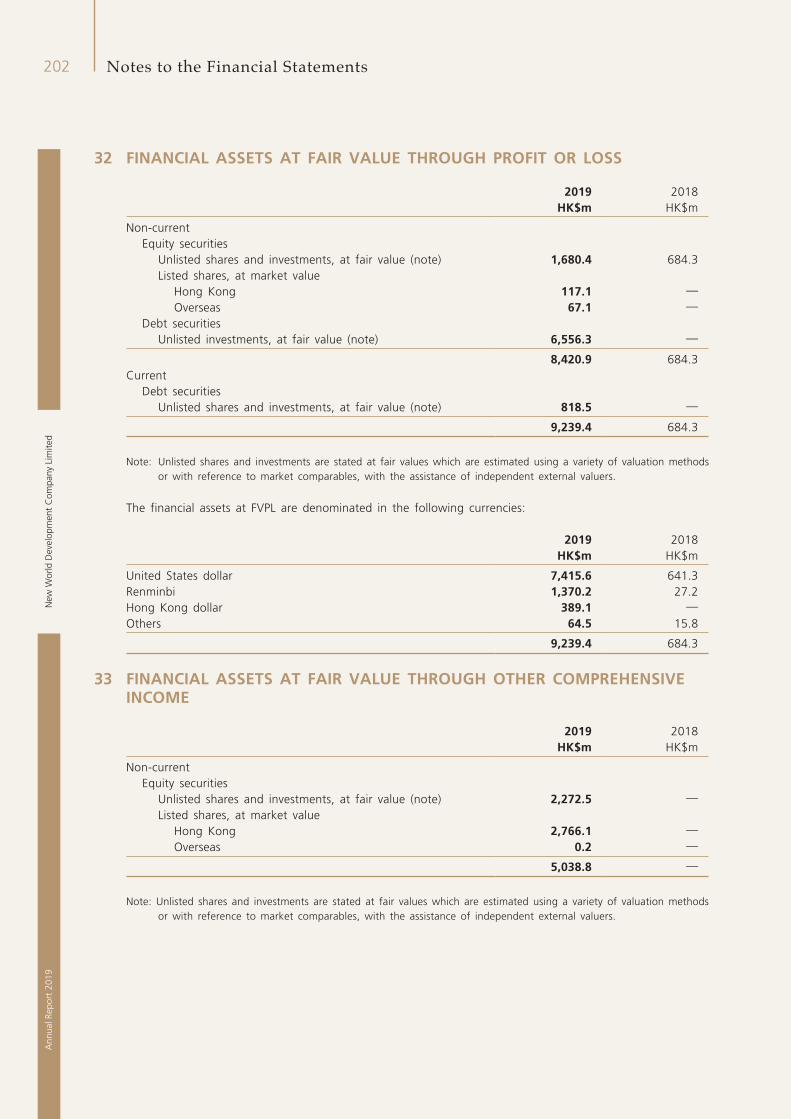
New
Wor
ld D
evel
opm
ent
Com
pany
Lim
ited
202A
nnua
l Rep
ort
2019
Notes to the Financial Statements
32 FINANCIAL ASSETS AT FAIR VALUE THROUGH PROFIT OR LOSS
2019 2018HK$m HK$m
Non-currentEquity securities
Unlisted shares and investments, at fair value (note) 1,680.4 684.3Listed shares, at market value
Hong Kong 117.1 —Overseas 67.1 —
Debt securitiesUnlisted investments, at fair value (note) 6,556.3 —
8,420.9 684.3Current
Debt securitiesUnlisted shares and investments, at fair value (note) 818.5 —
9,239.4 684.3
Note: Unlisted shares and investments are stated at fair values which are estimated using a variety of valuation methods or with reference to market comparables, with the assistance of independent external valuers.
The financial assets at FVPL are denominated in the following currencies:
2019 2018HK$m HK$m
United States dollar 7,415.6 641.3Renminbi 1,370.2 27.2Hong Kong dollar 389.1 —Others 64.5 15.8
9,239.4 684.3
33 FINANCIAL ASSETS AT FAIR VALUE THROUGH OTHER COMPREHENSIVE INCOME
2019 2018HK$m HK$m
Non-currentEquity securities
Unlisted shares and investments, at fair value (note) 2,272.5 —Listed shares, at market value
Hong Kong 2,766.1 —Overseas 0.2 —
5,038.8 —
Note: Unlisted shares and investments are stated at fair values which are estimated using a variety of valuation methods or with reference to market comparables, with the assistance of independent external valuers.
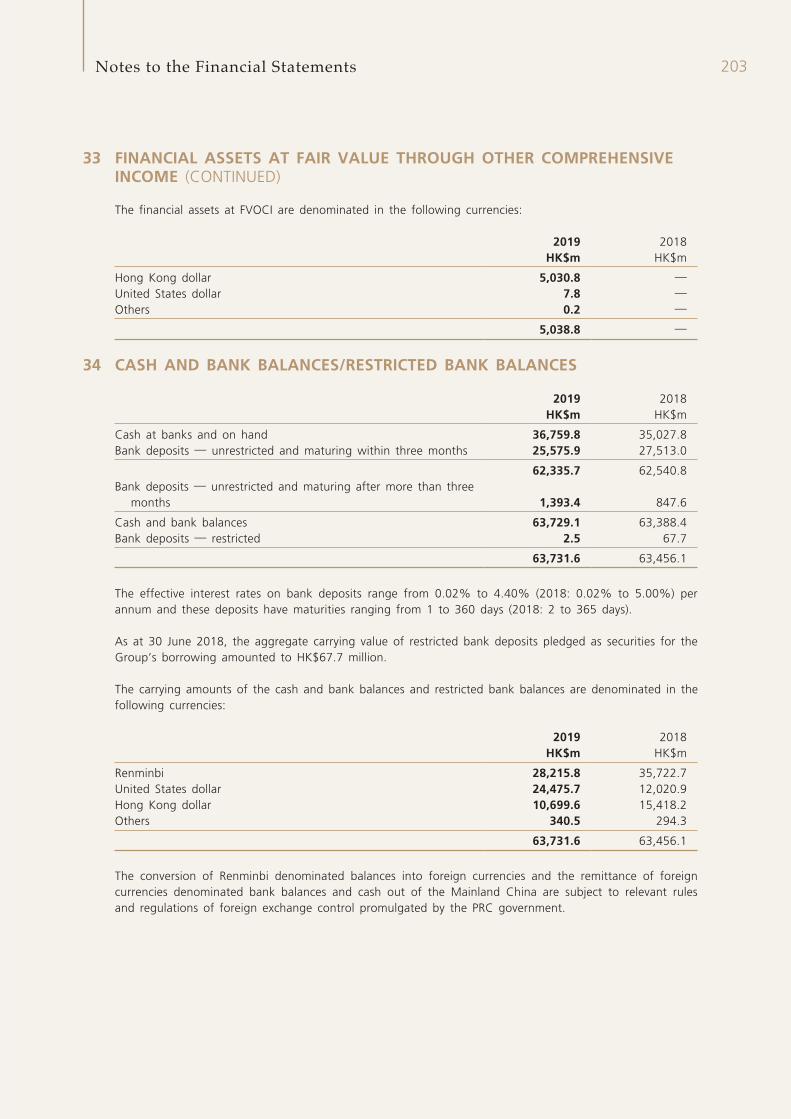
203Notes to the Financial Statements
33 FINANCIAL ASSETS AT FAIR VALUE THROUGH OTHER COMPREHENSIVE INCOME (CONTINUED)
The financial assets at FVOCI are denominated in the following currencies:
2019 2018HK$m HK$m
Hong Kong dollar 5,030.8 —United States dollar 7.8 —Others 0.2 —
5,038.8 —
34 CASH AND BANK BALANCES/RESTRICTED BANK BALANCES
2019 2018HK$m HK$m
Cash at banks and on hand 36,759.8 35,027.8Bank deposits — unrestricted and maturing within three months 25,575.9 27,513.0
62,335.7 62,540.8Bank deposits — unrestricted and maturing after more than three
months 1,393.4 847.6
Cash and bank balances 63,729.1 63,388.4Bank deposits — restricted 2.5 67.7
63,731.6 63,456.1
The effective interest rates on bank deposits range from 0.02% to 4.40% (2018: 0.02% to 5.00%) per annum and these deposits have maturities ranging from 1 to 360 days (2018: 2 to 365 days).
As at 30 June 2018, the aggregate carrying value of restricted bank deposits pledged as securities for the Group’s borrowing amounted to HK$67.7 million.
The carrying amounts of the cash and bank balances and restricted bank balances are denominated in the following currencies:
2019 2018HK$m HK$m
Renminbi 28,215.8 35,722.7United States dollar 24,475.7 12,020.9Hong Kong dollar 10,699.6 15,418.2Others 340.5 294.3
63,731.6 63,456.1
The conversion of Renminbi denominated balances into foreign currencies and the remittance of foreign currencies denominated bank balances and cash out of the Mainland China are subject to relevant rules and regulations of foreign exchange control promulgated by the PRC government.
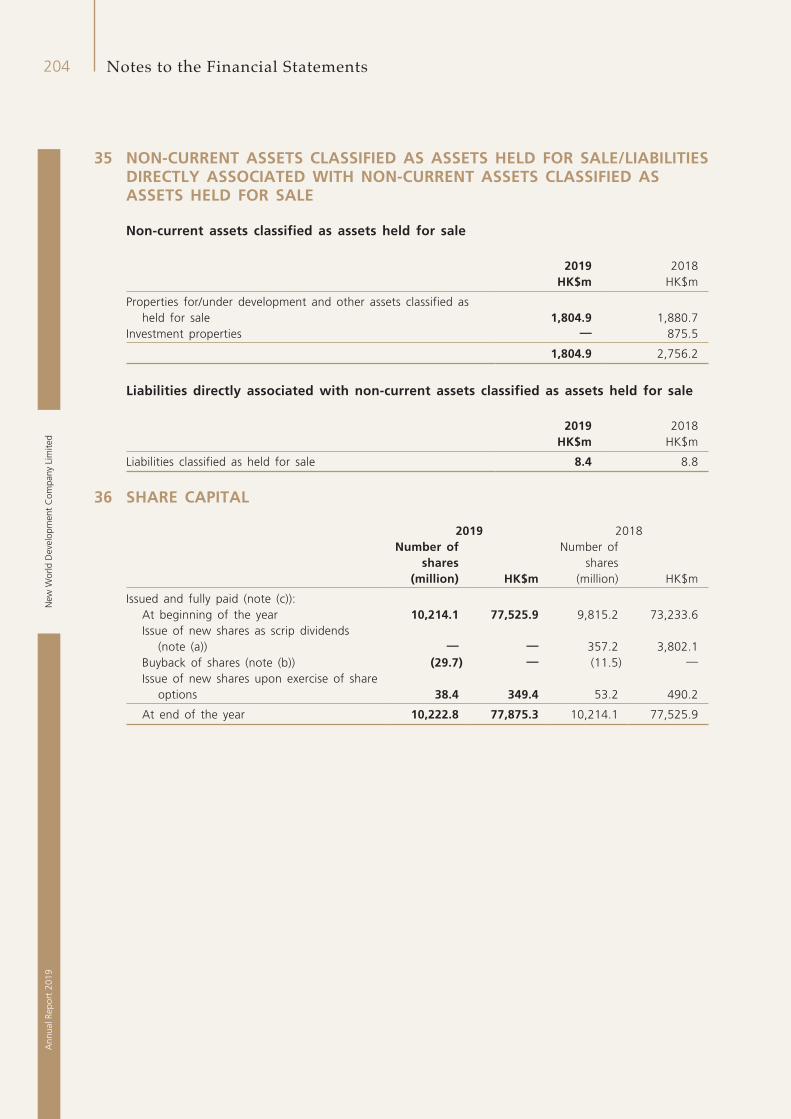
New
Wor
ld D
evel
opm
ent
Com
pany
Lim
ited
204A
nnua
l Rep
ort
2019
Notes to the Financial Statements
35 NON-CURRENT ASSETS CLASSIFIED AS ASSETS HELD FOR SALE/LIABILITIES DIRECTLY ASSOCIATED WITH NON-CURRENT ASSETS CLASSIFIED AS ASSETS HELD FOR SALE
Non-current assets classified as assets held for sale
2019 2018HK$m HK$m
Properties for/under development and other assets classified as held for sale 1,804.9 1,880.7
Investment properties — 875.5
1,804.9 2,756.2
Liabilities directly associated with non-current assets classified as assets held for sale
2019 2018HK$m HK$m
Liabilities classified as held for sale 8.4 8.8
36 SHARE CAPITAL
2019 2018Number of
shares (million) HK$m
Number of shares
(million) HK$m
Issued and fully paid (note (c)):At beginning of the year 10,214.1 77,525.9 9,815.2 73,233.6Issue of new shares as scrip dividends
(note (a)) — — 357.2 3,802.1Buyback of shares (note (b)) (29.7) — (11.5) —Issue of new shares upon exercise of share
options 38.4 349.4 53.2 490.2
At end of the year 10,222.8 77,875.3 10,214.1 77,525.9
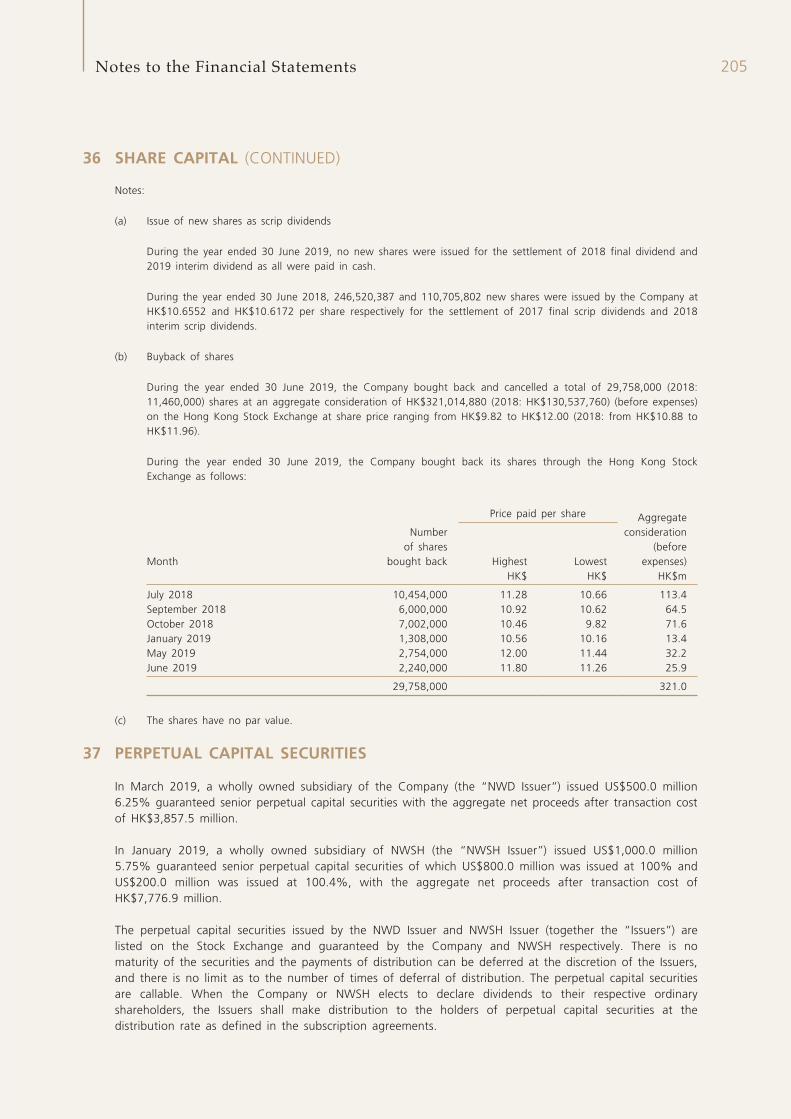
205Notes to the Financial Statements
36 SHARE CAPITAL (CONTINUED)
Notes:
(a) Issue of new shares as scrip dividends
During the year ended 30 June 2019, no new shares were issued for the settlement of 2018 final dividend and 2019 interim dividend as all were paid in cash.
During the year ended 30 June 2018, 246,520,387 and 110,705,802 new shares were issued by the Company at HK$10.6552 and HK$10.6172 per share respectively for the settlement of 2017 final scrip dividends and 2018 interim scrip dividends.
(b) Buyback of shares
During the year ended 30 June 2019, the Company bought back and cancelled a total of 29,758,000 (2018: 11,460,000) shares at an aggregate consideration of HK$321,014,880 (2018: HK$130,537,760) (before expenses) on the Hong Kong Stock Exchange at share price ranging from HK$9.82 to HK$12.00 (2018: from HK$10.88 to HK$11.96).
During the year ended 30 June 2019, the Company bought back its shares through the Hong Kong Stock Exchange as follows:
Price paid per share Aggregate consideration
(before expenses)Month
Number of shares
bought back Highest LowestHK$ HK$ HK$m
July 2018 10,454,000 11.28 10.66 113.4September 2018 6,000,000 10.92 10.62 64.5October 2018 7,002,000 10.46 9.82 71.6January 2019 1,308,000 10.56 10.16 13.4May 2019 2,754,000 12.00 11.44 32.2June 2019 2,240,000 11.80 11.26 25.9
29,758,000 321.0
(c) The shares have no par value.
37 PERPETUAL CAPITAL SECURITIES
In March 2019, a wholly owned subsidiary of the Company (the “NWD Issuer”) issued US$500.0 million 6.25% guaranteed senior perpetual capital securities with the aggregate net proceeds after transaction cost of HK$3,857.5 million.
In January 2019, a wholly owned subsidiary of NWSH (the “NWSH Issuer”) issued US$1,000.0 million 5.75% guaranteed senior perpetual capital securities of which US$800.0 million was issued at 100% and US$200.0 million was issued at 100.4%, with the aggregate net proceeds after transaction cost of HK$7,776.9 million.
The perpetual capital securities issued by the NWD Issuer and NWSH Issuer (together the “Issuers”) are listed on the Stock Exchange and guaranteed by the Company and NWSH respectively. There is no maturity of the securities and the payments of distribution can be deferred at the discretion of the Issuers, and there is no limit as to the number of times of deferral of distribution. The perpetual capital securities are callable. When the Company or NWSH elects to declare dividends to their respective ordinary shareholders, the Issuers shall make distribution to the holders of perpetual capital securities at the distribution rate as defined in the subscription agreements.
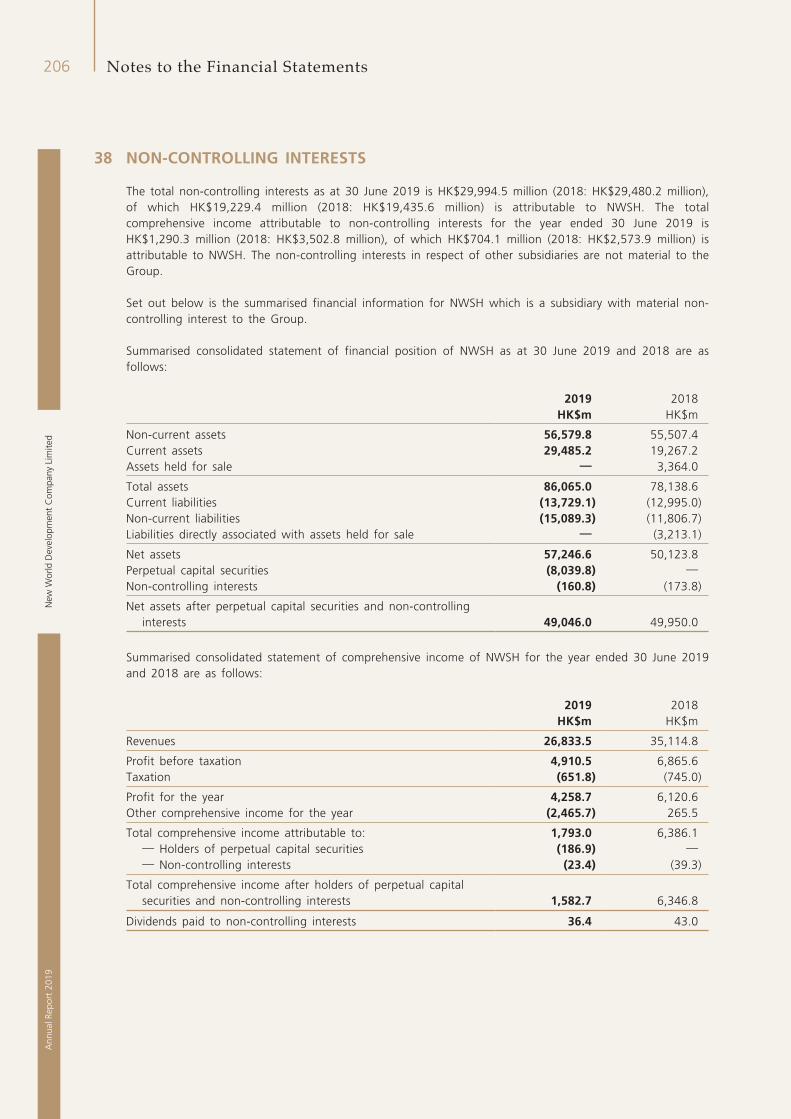
New
Wor
ld D
evel
opm
ent
Com
pany
Lim
ited
206A
nnua
l Rep
ort
2019
Notes to the Financial Statements
38 NON-CONTROLLING INTERESTS
The total non-controlling interests as at 30 June 2019 is HK$29,994.5 million (2018: HK$29,480.2 million), of which HK$19,229.4 million (2018: HK$19,435.6 million) is attributable to NWSH. The total comprehensive income attributable to non-controlling interests for the year ended 30 June 2019 is HK$1,290.3 million (2018: HK$3,502.8 million), of which HK$704.1 million (2018: HK$2,573.9 million) is attributable to NWSH. The non-controlling interests in respect of other subsidiaries are not material to the Group.
Set out below is the summarised financial information for NWSH which is a subsidiary with material non-controlling interest to the Group.
Summarised consolidated statement of financial position of NWSH as at 30 June 2019 and 2018 are as follows:
2019 2018HK$m HK$m
Non-current assets 56,579.8 55,507.4Current assets 29,485.2 19,267.2Assets held for sale — 3,364.0
Total assets 86,065.0 78,138.6Current liabilities (13,729.1) (12,995.0)Non-current liabilities (15,089.3) (11,806.7)Liabilities directly associated with assets held for sale — (3,213.1)
Net assets 57,246.6 50,123.8Perpetual capital securities (8,039.8) —Non-controlling interests (160.8) (173.8)
Net assets after perpetual capital securities and non-controlling interests 49,046.0 49,950.0
Summarised consolidated statement of comprehensive income of NWSH for the year ended 30 June 2019 and 2018 are as follows:
2019 2018HK$m HK$m
Revenues 26,833.5 35,114.8
Profit before taxation 4,910.5 6,865.6Taxation (651.8) (745.0)
Profit for the year 4,258.7 6,120.6Other comprehensive income for the year (2,465.7) 265.5
Total comprehensive income attributable to: 1,793.0 6,386.1— Holders of perpetual capital securities (186.9) —— Non-controlling interests (23.4) (39.3)
Total comprehensive income after holders of perpetual capital securities and non-controlling interests 1,582.7 6,346.8
Dividends paid to non-controlling interests 36.4 43.0
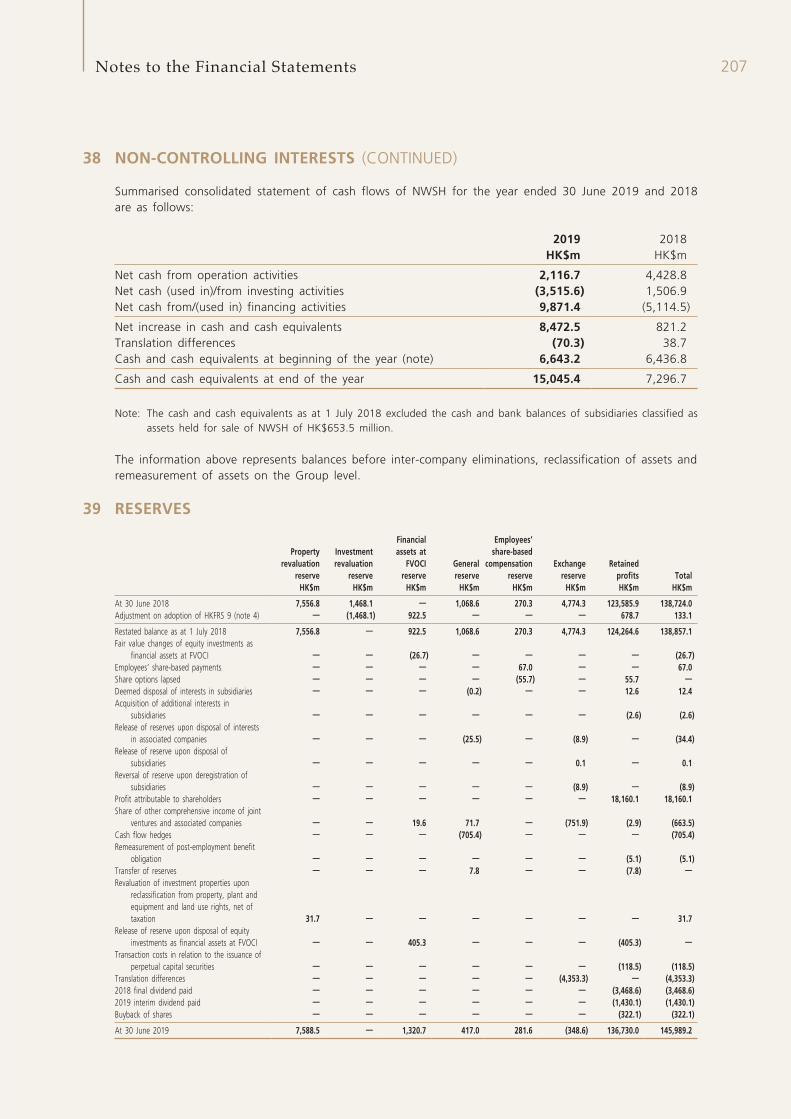
207Notes to the Financial Statements
38 NON-CONTROLLING INTERESTS (CONTINUED)
Summarised consolidated statement of cash flows of NWSH for the year ended 30 June 2019 and 2018 are as follows:
2019 2018HK$m HK$m
Net cash from operation activities 2,116.7 4,428.8Net cash (used in)/from investing activities (3,515.6) 1,506.9Net cash from/(used in) financing activities 9,871.4 (5,114.5)
Net increase in cash and cash equivalents 8,472.5 821.2Translation differences (70.3) 38.7Cash and cash equivalents at beginning of the year (note) 6,643.2 6,436.8
Cash and cash equivalents at end of the year 15,045.4 7,296.7
Note: The cash and cash equivalents as at 1 July 2018 excluded the cash and bank balances of subsidiaries classified as assets held for sale of NWSH of HK$653.5 million.
The information above represents balances before inter-company eliminations, reclassification of assets and remeasurement of assets on the Group level.
39 RESERVES
Property revaluation
reserve
Investment revaluation
reserve
Financial assets at
FVOCI reserve
General reserve
Employees’ share-based
compensation reserve
Exchange reserve
Retained profits Total
HK$m HK$m HK$m HK$m HK$m HK$m HK$m HK$m
At 30 June 2018 7,556.8 1,468.1 — 1,068.6 270.3 4,774.3 123,585.9 138,724.0Adjustment on adoption of HKFRS 9 (note 4) — (1,468.1) 922.5 — — — 678.7 133.1
Restated balance as at 1 July 2018 7,556.8 — 922.5 1,068.6 270.3 4,774.3 124,264.6 138,857.1Fair value changes of equity investments as
financial assets at FVOCI — — (26.7) — — — — (26.7)Employees’ share-based payments — — — — 67.0 — — 67.0Share options lapsed — — — — (55.7) — 55.7 —Deemed disposal of interests in subsidiaries — — — (0.2) — — 12.6 12.4Acquisition of additional interests in
subsidiaries — — — — — — (2.6) (2.6)Release of reserves upon disposal of interests
in associated companies — — — (25.5) — (8.9) — (34.4)Release of reserve upon disposal of
subsidiaries — — — — — 0.1 — 0.1Reversal of reserve upon deregistration of
subsidiaries — — — — — (8.9) — (8.9)Profit attributable to shareholders — — — — — — 18,160.1 18,160.1Share of other comprehensive income of joint
ventures and associated companies — — 19.6 71.7 — (751.9) (2.9) (663.5)Cash flow hedges — — — (705.4) — — — (705.4)Remeasurement of post-employment benefit
obligation — — — — — — (5.1) (5.1)Transfer of reserves — — — 7.8 — — (7.8) —Revaluation of investment properties upon
reclassification from property, plant and equipment and land use rights, net of taxation 31.7 — — — — — — 31.7
Release of reserve upon disposal of equity investments as financial assets at FVOCI — — 405.3 — — — (405.3) —
Transaction costs in relation to the issuance of perpetual capital securities — — — — — — (118.5) (118.5)
Translation differences — — — — — (4,353.3) — (4,353.3)2018 final dividend paid — — — — — — (3,468.6) (3,468.6)2019 interim dividend paid — — — — — — (1,430.1) (1,430.1)Buyback of shares — — — — — — (322.1) (322.1)
At 30 June 2019 7,588.5 — 1,320.7 417.0 281.6 (348.6) 136,730.0 145,989.2
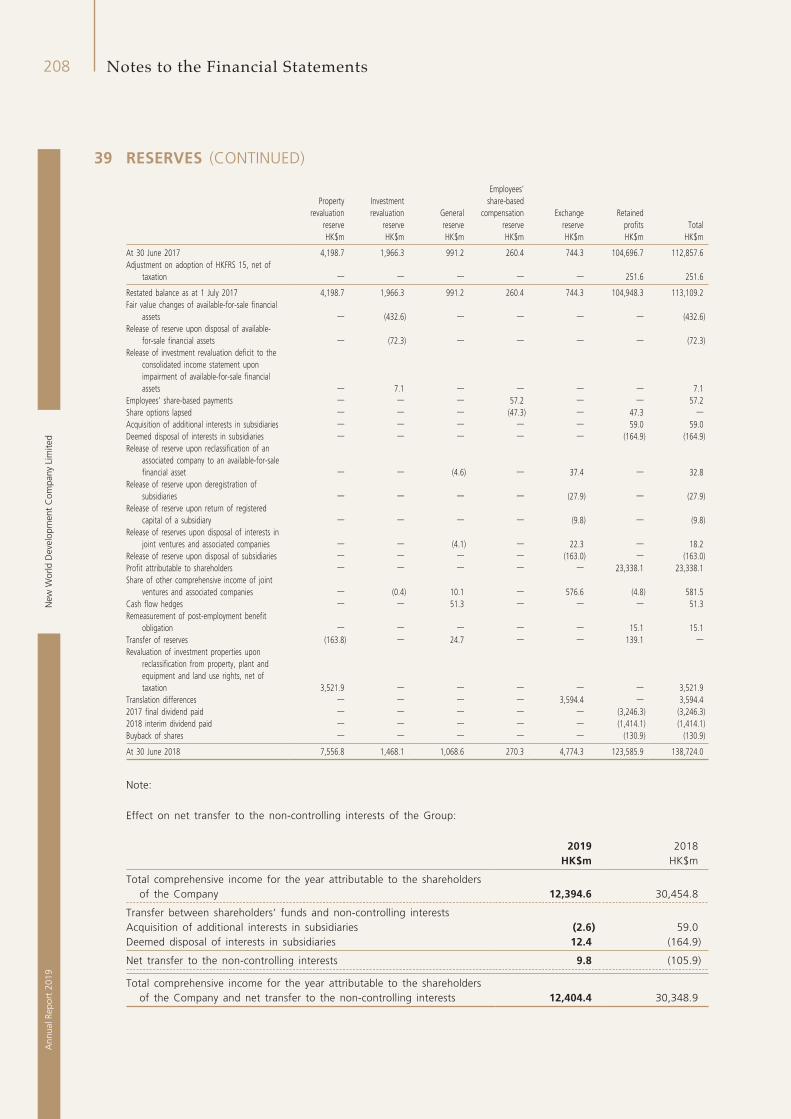
New
Wor
ld D
evel
opm
ent
Com
pany
Lim
ited
208A
nnua
l Rep
ort
2019
Notes to the Financial Statements
39 RESERVES (CONTINUED)
Property revaluation
reserve
Investment revaluation
reserveGeneral reserve
Employees’ share-based
compensation reserve
Exchange reserve
Retained profits Total
HK$m HK$m HK$m HK$m HK$m HK$m HK$m
At 30 June 2017 4,198.7 1,966.3 991.2 260.4 744.3 104,696.7 112,857.6Adjustment on adoption of HKFRS 15, net of
taxation — — — — — 251.6 251.6
Restated balance as at 1 July 2017 4,198.7 1,966.3 991.2 260.4 744.3 104,948.3 113,109.2Fair value changes of available-for-sale financial
assets — (432.6) — — — — (432.6)Release of reserve upon disposal of available-
for-sale financial assets — (72.3) — — — — (72.3)Release of investment revaluation deficit to the
consolidated income statement upon impairment of available-for-sale financial assets — 7.1 — — — — 7.1
Employees’ share-based payments — — — 57.2 — — 57.2Share options lapsed — — — (47.3) — 47.3 —Acquisition of additional interests in subsidiaries — — — — — 59.0 59.0Deemed disposal of interests in subsidiaries — — — — — (164.9) (164.9)Release of reserve upon reclassification of an
associated company to an available-for-sale financial asset — — (4.6) — 37.4 — 32.8
Release of reserve upon deregistration of subsidiaries — — — — (27.9) — (27.9)
Release of reserve upon return of registered capital of a subsidiary — — — — (9.8) — (9.8)
Release of reserves upon disposal of interests in joint ventures and associated companies — — (4.1) — 22.3 — 18.2
Release of reserve upon disposal of subsidiaries — — — — (163.0) — (163.0)Profit attributable to shareholders — — — — — 23,338.1 23,338.1Share of other comprehensive income of joint
ventures and associated companies — (0.4) 10.1 — 576.6 (4.8) 581.5Cash flow hedges — — 51.3 — — — 51.3Remeasurement of post-employment benefit
obligation — — — — — 15.1 15.1Transfer of reserves (163.8) — 24.7 — — 139.1 —Revaluation of investment properties upon
reclassification from property, plant and equipment and land use rights, net of taxation 3,521.9 — — — — — 3,521.9
Translation differences — — — — 3,594.4 — 3,594.42017 final dividend paid — — — — — (3,246.3) (3,246.3)2018 interim dividend paid — — — — — (1,414.1) (1,414.1)Buyback of shares — — — — — (130.9) (130.9)
At 30 June 2018 7,556.8 1,468.1 1,068.6 270.3 4,774.3 123,585.9 138,724.0
Note:
Effect on net transfer to the non-controlling interests of the Group:
2019 2018HK$m HK$m
Total comprehensive income for the year attributable to the shareholders of the Company 12,394.6 30,454.8
Transfer between shareholders’ funds and non-controlling interestsAcquisition of additional interests in subsidiaries (2.6) 59.0Deemed disposal of interests in subsidiaries 12.4 (164.9)
Net transfer to the non-controlling interests 9.8 (105.9)
Total comprehensive income for the year attributable to the shareholders of the Company and net transfer to the non-controlling interests 12,404.4 30,348.9
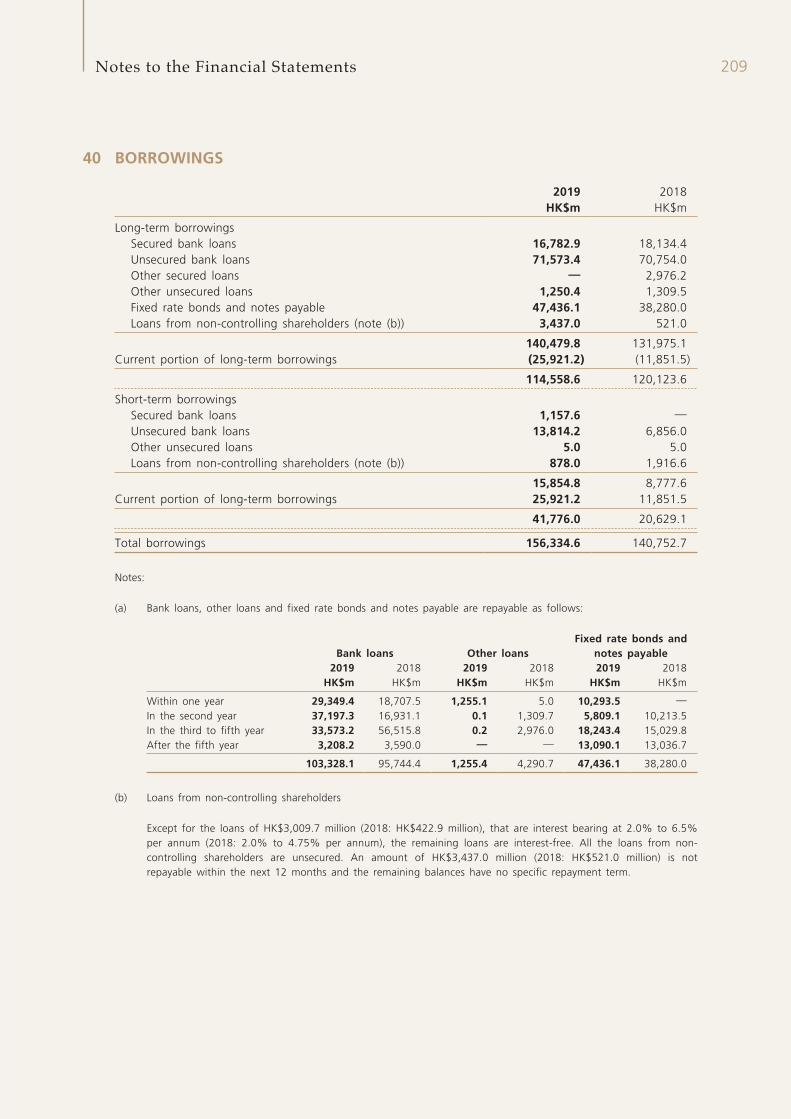
209Notes to the Financial Statements
40 BORROWINGS
2019 2018HK$m HK$m
Long-term borrowingsSecured bank loans 16,782.9 18,134.4Unsecured bank loans 71,573.4 70,754.0Other secured loans — 2,976.2Other unsecured loans 1,250.4 1,309.5Fixed rate bonds and notes payable 47,436.1 38,280.0Loans from non-controlling shareholders (note (b)) 3,437.0 521.0
140,479.8 131,975.1Current portion of long-term borrowings (25,921.2) (11,851.5)
114,558.6 120,123.6
Short-term borrowingsSecured bank loans 1,157.6 —Unsecured bank loans 13,814.2 6,856.0Other unsecured loans 5.0 5.0Loans from non-controlling shareholders (note (b)) 878.0 1,916.6
15,854.8 8,777.6Current portion of long-term borrowings 25,921.2 11,851.5
41,776.0 20,629.1
Total borrowings 156,334.6 140,752.7
Notes:
(a) Bank loans, other loans and fixed rate bonds and notes payable are repayable as follows:
Bank loans Other loansFixed rate bonds and
notes payable2019 2018 2019 2018 2019 2018
HK$m HK$m HK$m HK$m HK$m HK$m
Within one year 29,349.4 18,707.5 1,255.1 5.0 10,293.5 —
In the second year 37,197.3 16,931.1 0.1 1,309.7 5,809.1 10,213.5In the third to fifth year 33,573.2 56,515.8 0.2 2,976.0 18,243.4 15,029.8After the fifth year 3,208.2 3,590.0 — — 13,090.1 13,036.7
103,328.1 95,744.4 1,255.4 4,290.7 47,436.1 38,280.0
(b) Loans from non-controlling shareholders
Except for the loans of HK$3,009.7 million (2018: HK$422.9 million), that are interest bearing at 2.0% to 6.5% per annum (2018: 2.0% to 4.75% per annum), the remaining loans are interest-free. All the loans from non-controlling shareholders are unsecured. An amount of HK$3,437.0 million (2018: HK$521.0 million) is not repayable within the next 12 months and the remaining balances have no specific repayment term.
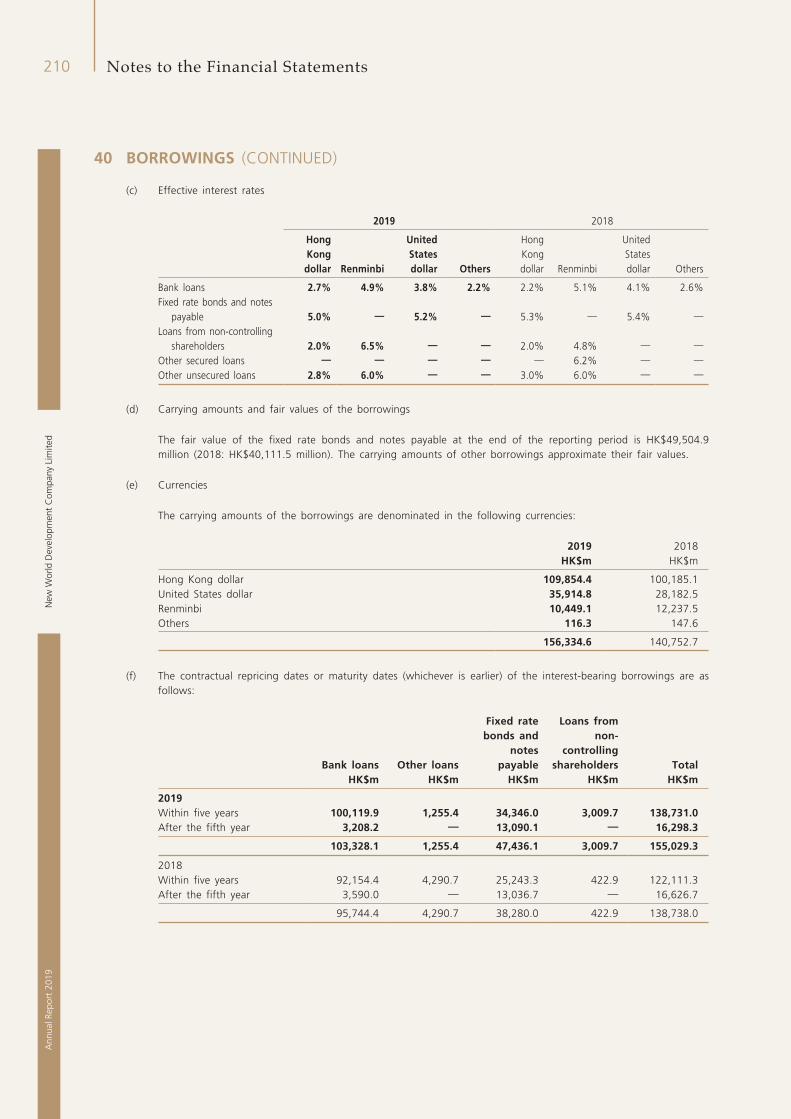
New
Wor
ld D
evel
opm
ent
Com
pany
Lim
ited
210A
nnua
l Rep
ort
2019
Notes to the Financial Statements
40 BORROWINGS (CONTINUED)
(c) Effective interest rates
2019 2018
Hong Kong dollar Renminbi
United States dollar Others
Hong Kong dollar Renminbi
United States dollar Others
Bank loans 2.7% 4.9% 3.8% 2.2% 2.2% 5.1% 4.1% 2.6%Fixed rate bonds and notes
payable 5.0% — 5.2% — 5.3% — 5.4% —
Loans from non-controlling shareholders 2.0% 6.5% — — 2.0% 4.8% — —
Other secured loans — — — — — 6.2% — —
Other unsecured loans 2.8% 6.0% — — 3.0% 6.0% — —
(d) Carrying amounts and fair values of the borrowings
The fair value of the fixed rate bonds and notes payable at the end of the reporting period is HK$49,504.9 million (2018: HK$40,111.5 million). The carrying amounts of other borrowings approximate their fair values.
(e) Currencies
The carrying amounts of the borrowings are denominated in the following currencies:
2019 2018HK$m HK$m
Hong Kong dollar 109,854.4 100,185.1United States dollar 35,914.8 28,182.5Renminbi 10,449.1 12,237.5Others 116.3 147.6
156,334.6 140,752.7
(f) The contractual repricing dates or maturity dates (whichever is earlier) of the interest-bearing borrowings are as follows:
Bank loans Other loans
Fixed rate bonds and
notes payable
Loans from non-
controlling shareholders Total
HK$m HK$m HK$m HK$m HK$m
2019Within five years 100,119.9 1,255.4 34,346.0 3,009.7 138,731.0After the fifth year 3,208.2 — 13,090.1 — 16,298.3
103,328.1 1,255.4 47,436.1 3,009.7 155,029.3
2018Within five years 92,154.4 4,290.7 25,243.3 422.9 122,111.3After the fifth year 3,590.0 — 13,036.7 — 16,626.7
95,744.4 4,290.7 38,280.0 422.9 138,738.0
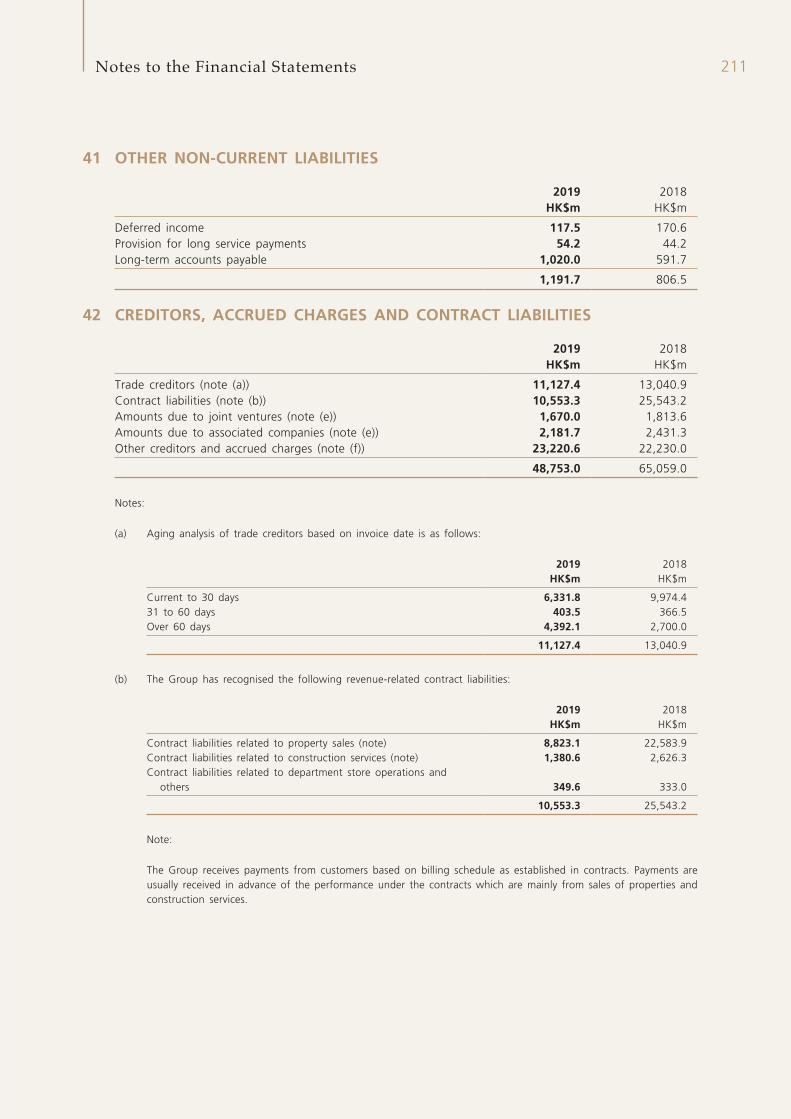
211Notes to the Financial Statements
41 OTHER NON-CURRENT LIABILITIES
2019 2018HK$m HK$m
Deferred income 117.5 170.6Provision for long service payments 54.2 44.2Long-term accounts payable 1,020.0 591.7
1,191.7 806.5
42 CREDITORS, ACCRUED CHARGES AND CONTRACT LIABILITIES
2019 2018HK$m HK$m
Trade creditors (note (a)) 11,127.4 13,040.9Contract liabilities (note (b)) 10,553.3 25,543.2Amounts due to joint ventures (note (e)) 1,670.0 1,813.6Amounts due to associated companies (note (e)) 2,181.7 2,431.3Other creditors and accrued charges (note (f)) 23,220.6 22,230.0
48,753.0 65,059.0
Notes:
(a) Aging analysis of trade creditors based on invoice date is as follows:
2019 2018HK$m HK$m
Current to 30 days 6,331.8 9,974.431 to 60 days 403.5 366.5Over 60 days 4,392.1 2,700.0
11,127.4 13,040.9
(b) The Group has recognised the following revenue-related contract liabilities:
2019 2018HK$m HK$m
Contract liabilities related to property sales (note) 8,823.1 22,583.9Contract liabilities related to construction services (note) 1,380.6 2,626.3Contract liabilities related to department store operations and
others 349.6 333.0
10,553.3 25,543.2
Note:
The Group receives payments from customers based on billing schedule as established in contracts. Payments are usually received in advance of the performance under the contracts which are mainly from sales of properties and construction services.
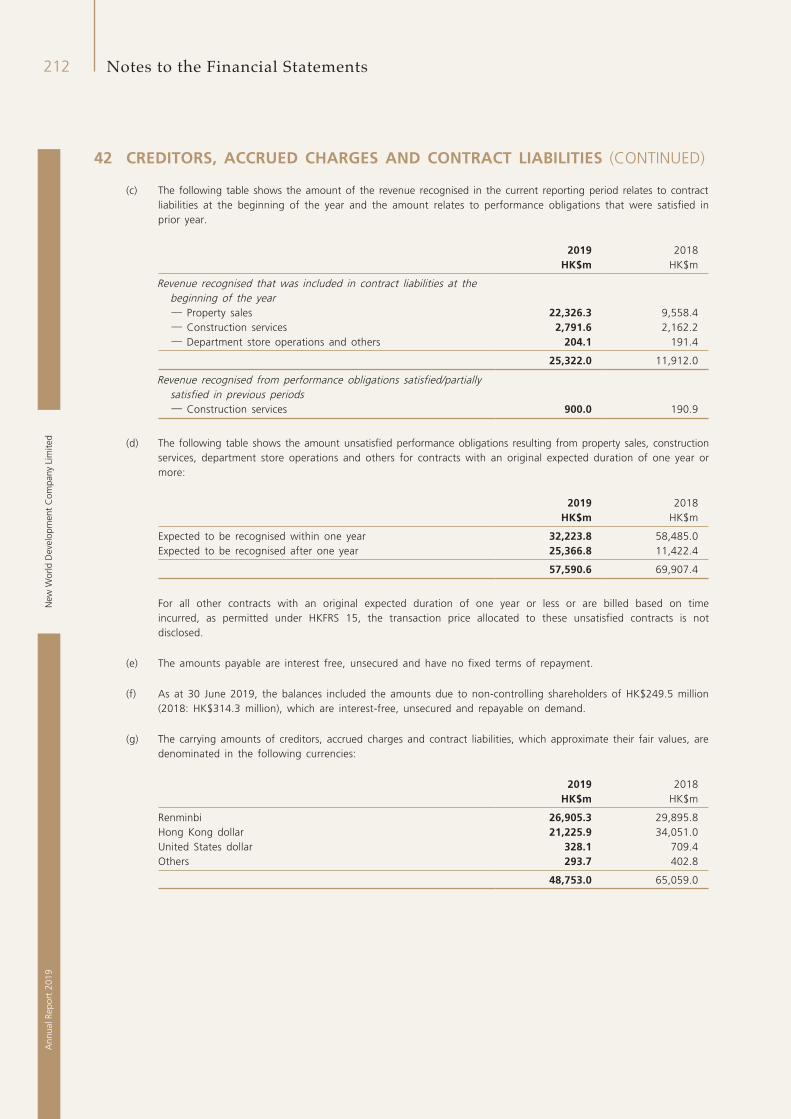
New
Wor
ld D
evel
opm
ent
Com
pany
Lim
ited
212A
nnua
l Rep
ort
2019
Notes to the Financial Statements
42 CREDITORS, ACCRUED CHARGES AND CONTRACT LIABILITIES (CONTINUED)
(c) The following table shows the amount of the revenue recognised in the current reporting period relates to contract liabilities at the beginning of the year and the amount relates to performance obligations that were satisfied in prior year.
2019 2018HK$m HK$m
Revenue recognised that was included in contract liabilities at the beginning of the year— Property sales 22,326.3 9,558.4— Construction services 2,791.6 2,162.2— Department store operations and others 204.1 191.4
25,322.0 11,912.0
Revenue recognised from performance obligations satisfied/partially satisfied in previous periods— Construction services 900.0 190.9
(d) The following table shows the amount unsatisfied performance obligations resulting from property sales, construction services, department store operations and others for contracts with an original expected duration of one year or more:
2019 2018HK$m HK$m
Expected to be recognised within one year 32,223.8 58,485.0Expected to be recognised after one year 25,366.8 11,422.4
57,590.6 69,907.4
For all other contracts with an original expected duration of one year or less or are billed based on time incurred, as permitted under HKFRS 15, the transaction price allocated to these unsatisfied contracts is not disclosed.
(e) The amounts payable are interest free, unsecured and have no fixed terms of repayment.
(f) As at 30 June 2019, the balances included the amounts due to non-controlling shareholders of HK$249.5 million (2018: HK$314.3 million), which are interest-free, unsecured and repayable on demand.
(g) The carrying amounts of creditors, accrued charges and contract liabilities, which approximate their fair values, are denominated in the following currencies:
2019 2018HK$m HK$m
Renminbi 26,905.3 29,895.8Hong Kong dollar 21,225.9 34,051.0United States dollar 328.1 709.4Others 293.7 402.8
48,753.0 65,059.0
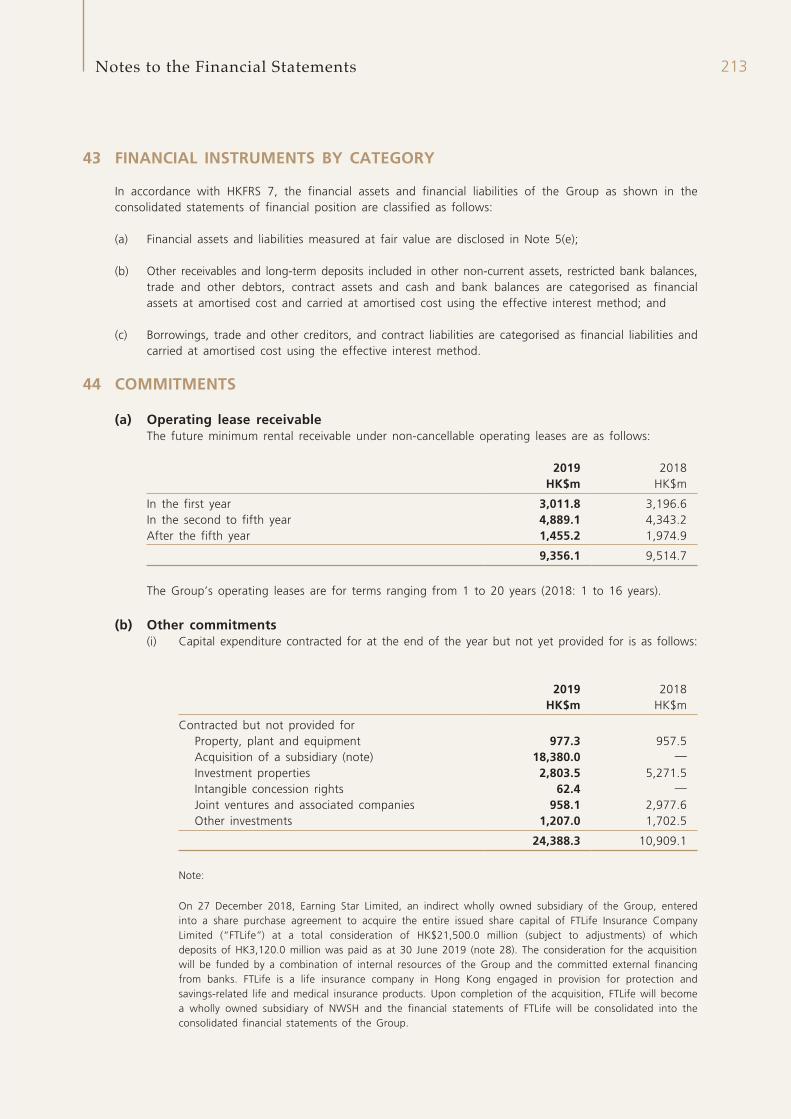
213Notes to the Financial Statements
43 FINANCIAL INSTRUMENTS BY CATEGORY
In accordance with HKFRS 7, the financial assets and financial liabilities of the Group as shown in the consolidated statements of financial position are classified as follows:
(a) Financial assets and liabilities measured at fair value are disclosed in Note 5(e);
(b) Other receivables and long-term deposits included in other non-current assets, restricted bank balances, trade and other debtors, contract assets and cash and bank balances are categorised as financial assets at amortised cost and carried at amortised cost using the effective interest method; and
(c) Borrowings, trade and other creditors, and contract liabilities are categorised as financial liabilities and carried at amortised cost using the effective interest method.
44 COMMITMENTS
(a) Operating lease receivableThe future minimum rental receivable under non-cancellable operating leases are as follows:
2019 2018HK$m HK$m
In the first year 3,011.8 3,196.6In the second to fifth year 4,889.1 4,343.2After the fifth year 1,455.2 1,974.9
9,356.1 9,514.7
The Group’s operating leases are for terms ranging from 1 to 20 years (2018: 1 to 16 years).
(b) Other commitments(i) Capital expenditure contracted for at the end of the year but not yet provided for is as follows:
2019 2018HK$m HK$m
Contracted but not provided forProperty, plant and equipment 977.3 957.5Acquisition of a subsidiary (note) 18,380.0 —Investment properties 2,803.5 5,271.5Intangible concession rights 62.4 —Joint ventures and associated companies 958.1 2,977.6Other investments 1,207.0 1,702.5
24,388.3 10,909.1
Note:
On 27 December 2018, Earning Star Limited, an indirect wholly owned subsidiary of the Group, entered into a share purchase agreement to acquire the entire issued share capital of FTLife Insurance Company Limited (“FTLife”) at a total consideration of HK$21,500.0 million (subject to adjustments) of which deposits of HK3,120.0 million was paid as at 30 June 2019 (note 28). The consideration for the acquisition will be funded by a combination of internal resources of the Group and the committed external financing from banks. FTLife is a life insurance company in Hong Kong engaged in provision for protection and savings-related life and medical insurance products. Upon completion of the acquisition, FTLife will become a wholly owned subsidiary of NWSH and the financial statements of FTLife will be consolidated into the consolidated financial statements of the Group.
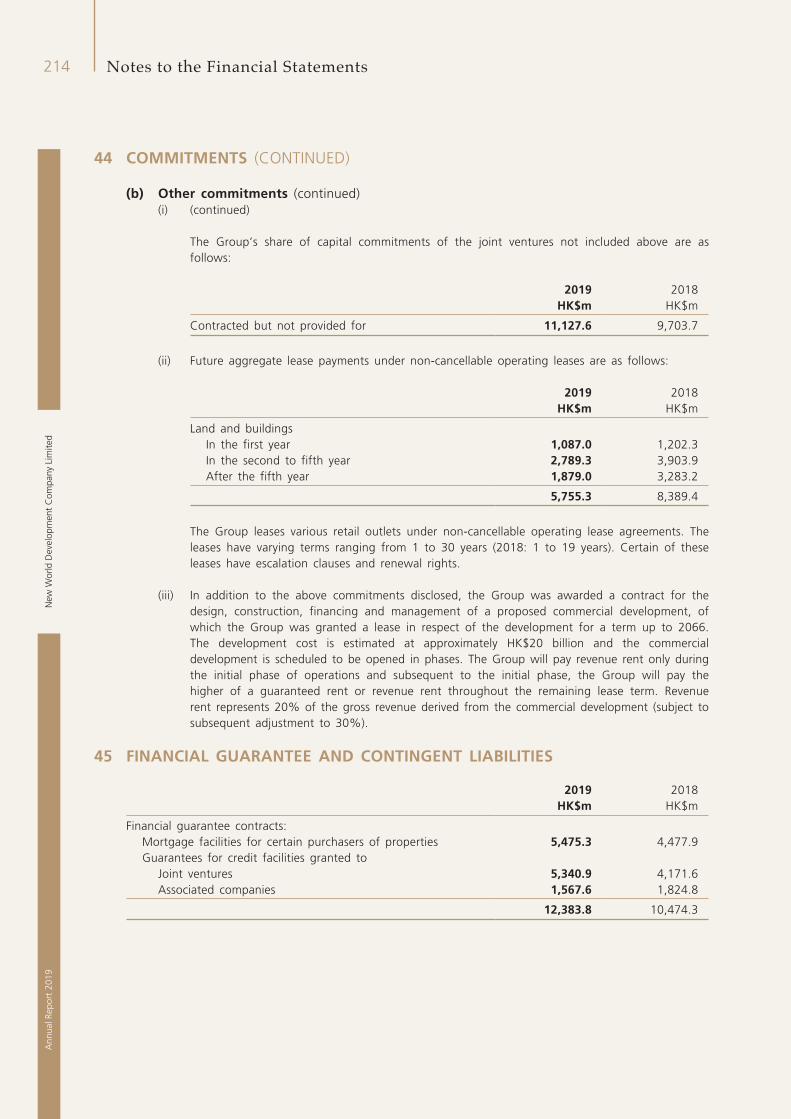
New
Wor
ld D
evel
opm
ent
Com
pany
Lim
ited
214A
nnua
l Rep
ort
2019
Notes to the Financial Statements
44 COMMITMENTS (CONTINUED)
(b) Other commitments (continued)(i) (continued)
The Group’s share of capital commitments of the joint ventures not included above are as follows:
2019 2018HK$m HK$m
Contracted but not provided for 11,127.6 9,703.7
(ii) Future aggregate lease payments under non-cancellable operating leases are as follows:
2019 2018HK$m HK$m
Land and buildingsIn the first year 1,087.0 1,202.3In the second to fifth year 2,789.3 3,903.9After the fifth year 1,879.0 3,283.2
5,755.3 8,389.4
The Group leases various retail outlets under non-cancellable operating lease agreements. The leases have varying terms ranging from 1 to 30 years (2018: 1 to 19 years). Certain of these leases have escalation clauses and renewal rights.
(iii) In addition to the above commitments disclosed, the Group was awarded a contract for the design, construction, financing and management of a proposed commercial development, of which the Group was granted a lease in respect of the development for a term up to 2066. The development cost is estimated at approximately HK$20 billion and the commercial development is scheduled to be opened in phases. The Group will pay revenue rent only during the initial phase of operations and subsequent to the initial phase, the Group will pay the higher of a guaranteed rent or revenue rent throughout the remaining lease term. Revenue rent represents 20% of the gross revenue derived from the commercial development (subject to subsequent adjustment to 30%).
45 FINANCIAL GUARANTEE AND CONTINGENT LIABILITIES
2019 2018HK$m HK$m
Financial guarantee contracts:Mortgage facilities for certain purchasers of properties 5,475.3 4,477.9Guarantees for credit facilities granted to
Joint ventures 5,340.9 4,171.6Associated companies 1,567.6 1,824.8
12,383.8 10,474.3
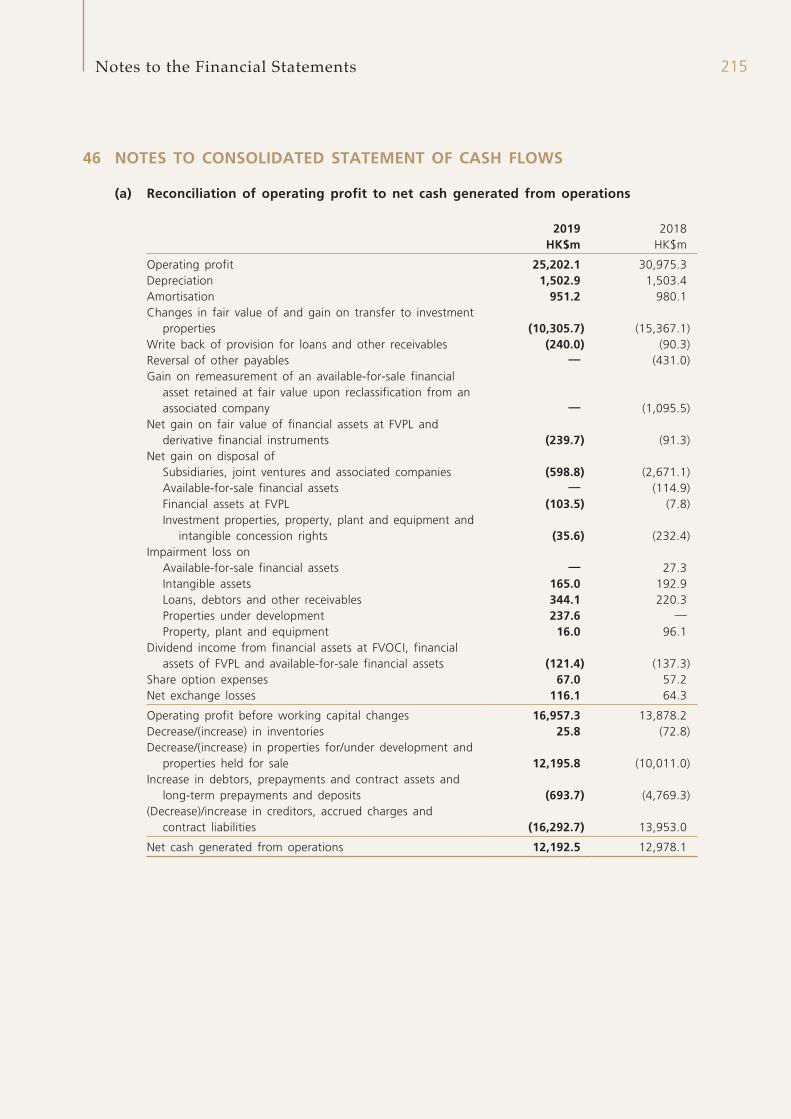
215Notes to the Financial Statements
46 NOTES TO CONSOLIDATED STATEMENT OF CASH FLOWS
(a) Reconciliation of operating profit to net cash generated from operations
2019 2018HK$m HK$m
Operating profit 25,202.1 30,975.3Depreciation 1,502.9 1,503.4Amortisation 951.2 980.1Changes in fair value of and gain on transfer to investment
properties (10,305.7) (15,367.1)Write back of provision for loans and other receivables (240.0) (90.3)Reversal of other payables — (431.0)Gain on remeasurement of an available-for-sale financial
asset retained at fair value upon reclassification from an associated company — (1,095.5)
Net gain on fair value of financial assets at FVPL and derivative financial instruments (239.7) (91.3)
Net gain on disposal ofSubsidiaries, joint ventures and associated companies (598.8) (2,671.1)Available-for-sale financial assets — (114.9)Financial assets at FVPL (103.5) (7.8)Investment properties, property, plant and equipment and
intangible concession rights (35.6) (232.4)Impairment loss on
Available-for-sale financial assets — 27.3Intangible assets 165.0 192.9Loans, debtors and other receivables 344.1 220.3Properties under development 237.6 —Property, plant and equipment 16.0 96.1
Dividend income from financial assets at FVOCI, financial assets of FVPL and available-for-sale financial assets (121.4) (137.3)
Share option expenses 67.0 57.2Net exchange losses 116.1 64.3
Operating profit before working capital changes 16,957.3 13,878.2Decrease/(increase) in inventories 25.8 (72.8)Decrease/(increase) in properties for/under development and
properties held for sale 12,195.8 (10,011.0)Increase in debtors, prepayments and contract assets and
long-term prepayments and deposits (693.7) (4,769.3)(Decrease)/increase in creditors, accrued charges and
contract liabilities (16,292.7) 13,953.0
Net cash generated from operations 12,192.5 12,978.1
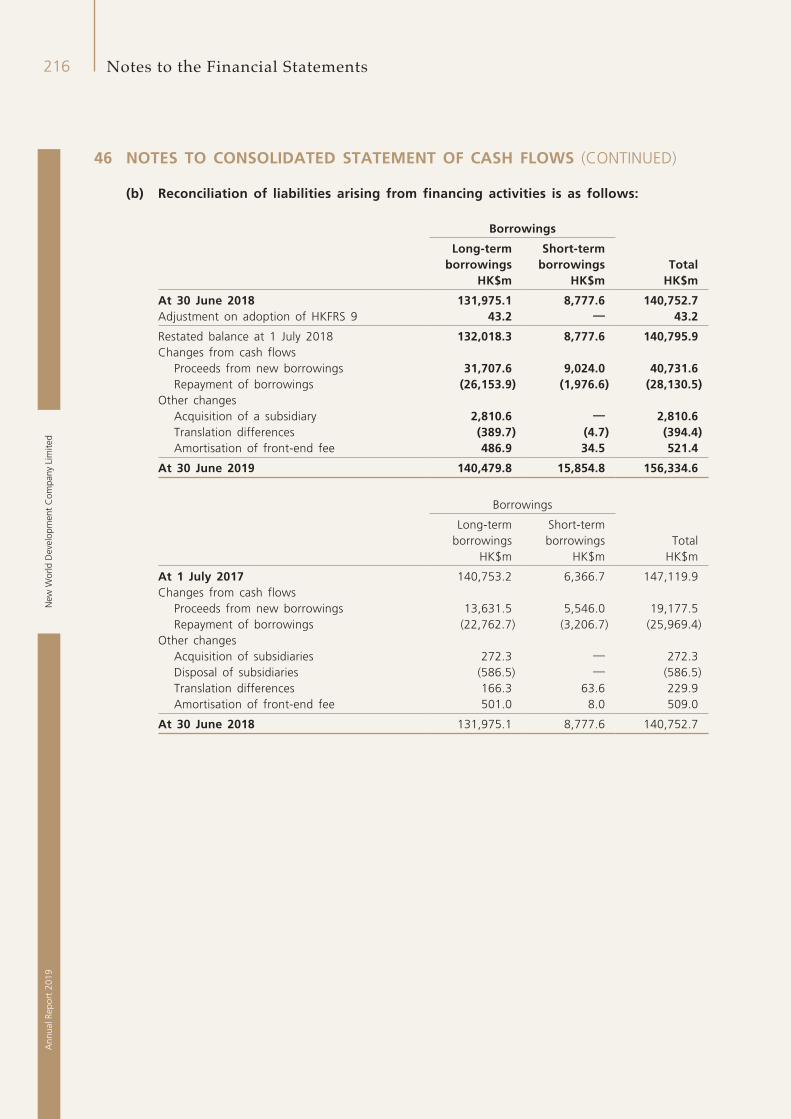
New
Wor
ld D
evel
opm
ent
Com
pany
Lim
ited
216A
nnua
l Rep
ort
2019
Notes to the Financial Statements
46 NOTES TO CONSOLIDATED STATEMENT OF CASH FLOWS (CONTINUED)
(b) Reconciliation of liabilities arising from financing activities is as follows:
Borrowings
Long-term borrowings
Short-term borrowings Total
HK$m HK$m HK$m
At 30 June 2018 131,975.1 8,777.6 140,752.7Adjustment on adoption of HKFRS 9 43.2 — 43.2
Restated balance at 1 July 2018 132,018.3 8,777.6 140,795.9Changes from cash flows
Proceeds from new borrowings 31,707.6 9,024.0 40,731.6Repayment of borrowings (26,153.9) (1,976.6) (28,130.5)
Other changesAcquisition of a subsidiary 2,810.6 — 2,810.6Translation differences (389.7) (4.7) (394.4)Amortisation of front-end fee 486.9 34.5 521.4
At 30 June 2019 140,479.8 15,854.8 156,334.6
Borrowings
Long-term borrowings
Short-term borrowings Total
HK$m HK$m HK$m
At 1 July 2017 140,753.2 6,366.7 147,119.9Changes from cash flows
Proceeds from new borrowings 13,631.5 5,546.0 19,177.5Repayment of borrowings (22,762.7) (3,206.7) (25,969.4)
Other changesAcquisition of subsidiaries 272.3 — 272.3Disposal of subsidiaries (586.5) — (586.5)Translation differences 166.3 63.6 229.9Amortisation of front-end fee 501.0 8.0 509.0
At 30 June 2018 131,975.1 8,777.6 140,752.7
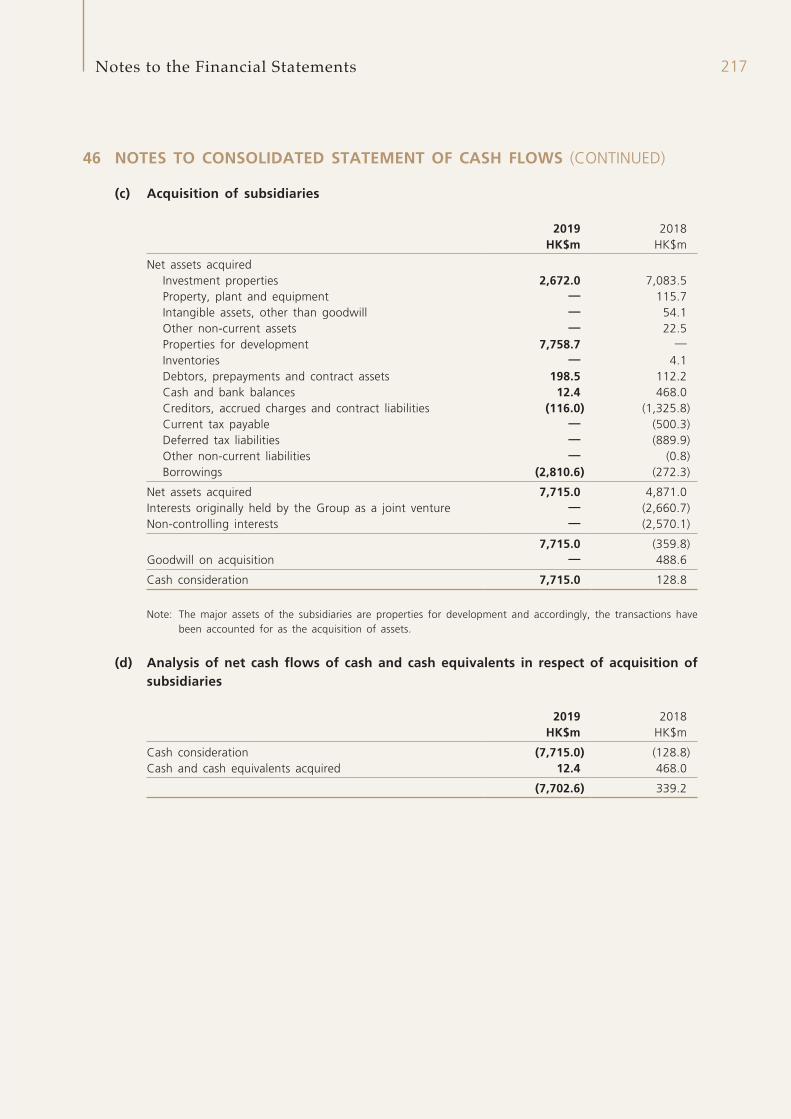
217Notes to the Financial Statements
46 NOTES TO CONSOLIDATED STATEMENT OF CASH FLOWS (CONTINUED)
(c) Acquisition of subsidiaries
2019 2018HK$m HK$m
Net assets acquiredInvestment properties 2,672.0 7,083.5Property, plant and equipment — 115.7Intangible assets, other than goodwill — 54.1Other non-current assets — 22.5Properties for development 7,758.7 —Inventories — 4.1Debtors, prepayments and contract assets 198.5 112.2Cash and bank balances 12.4 468.0Creditors, accrued charges and contract liabilities (116.0) (1,325.8)Current tax payable — (500.3)Deferred tax liabilities — (889.9)Other non-current liabilities — (0.8)Borrowings (2,810.6) (272.3)
Net assets acquired 7,715.0 4,871.0Interests originally held by the Group as a joint venture — (2,660.7)Non-controlling interests — (2,570.1)
7,715.0 (359.8)Goodwill on acquisition — 488.6
Cash consideration 7,715.0 128.8
Note: The major assets of the subsidiaries are properties for development and accordingly, the transactions have been accounted for as the acquisition of assets.
(d) Analysis of net cash flows of cash and cash equivalents in respect of acquisition of subsidiaries
2019 2018HK$m HK$m
Cash consideration (7,715.0) (128.8)Cash and cash equivalents acquired 12.4 468.0
(7,702.6) 339.2
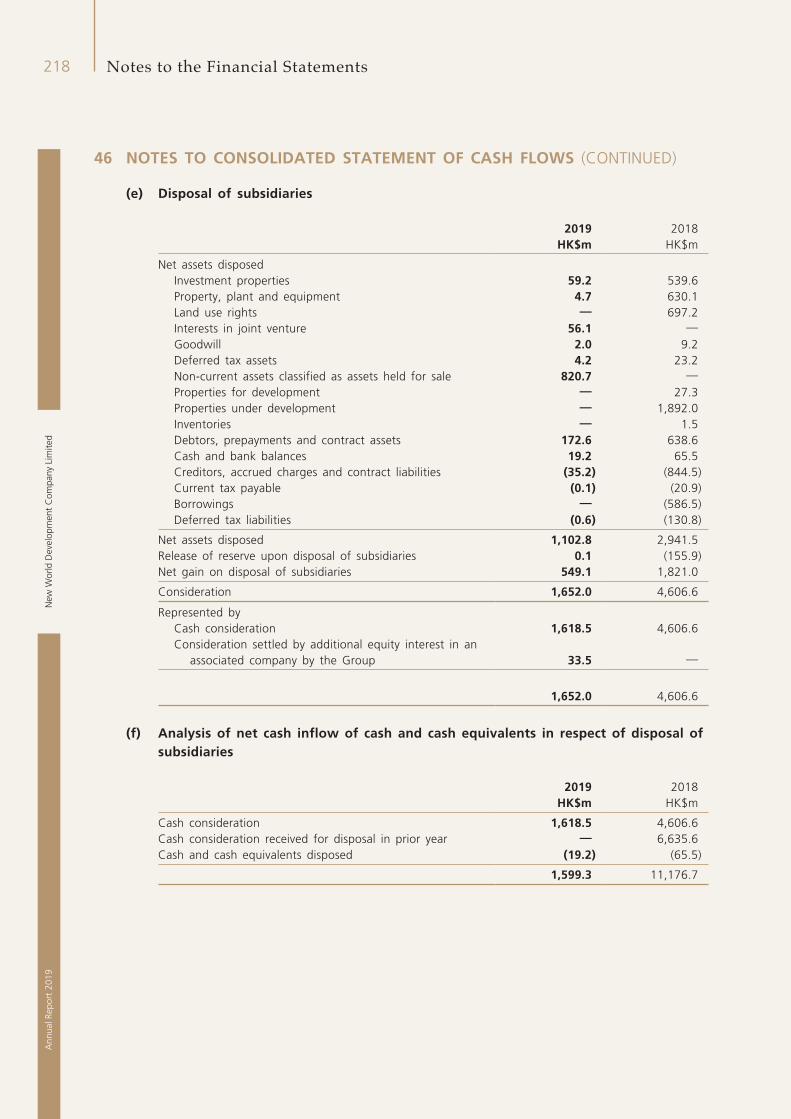
New
Wor
ld D
evel
opm
ent
Com
pany
Lim
ited
218A
nnua
l Rep
ort
2019
Notes to the Financial Statements
46 NOTES TO CONSOLIDATED STATEMENT OF CASH FLOWS (CONTINUED)
(e) Disposal of subsidiaries
2019 2018HK$m HK$m
Net assets disposedInvestment properties 59.2 539.6Property, plant and equipment 4.7 630.1Land use rights — 697.2Interests in joint venture 56.1 —Goodwill 2.0 9.2Deferred tax assets 4.2 23.2Non-current assets classified as assets held for sale 820.7 —Properties for development — 27.3Properties under development — 1,892.0Inventories — 1.5Debtors, prepayments and contract assets 172.6 638.6Cash and bank balances 19.2 65.5Creditors, accrued charges and contract liabilities (35.2) (844.5)Current tax payable (0.1) (20.9)Borrowings — (586.5)Deferred tax liabilities (0.6) (130.8)
Net assets disposed 1,102.8 2,941.5Release of reserve upon disposal of subsidiaries 0.1 (155.9)Net gain on disposal of subsidiaries 549.1 1,821.0
Consideration 1,652.0 4,606.6
Represented byCash consideration 1,618.5 4,606.6Consideration settled by additional equity interest in an
associated company by the Group 33.5 —
1,652.0 4,606.6
(f) Analysis of net cash inflow of cash and cash equivalents in respect of disposal of subsidiaries
2019 2018HK$m HK$m
Cash consideration 1,618.5 4,606.6Cash consideration received for disposal in prior year — 6,635.6Cash and cash equivalents disposed (19.2) (65.5)
1,599.3 11,176.7
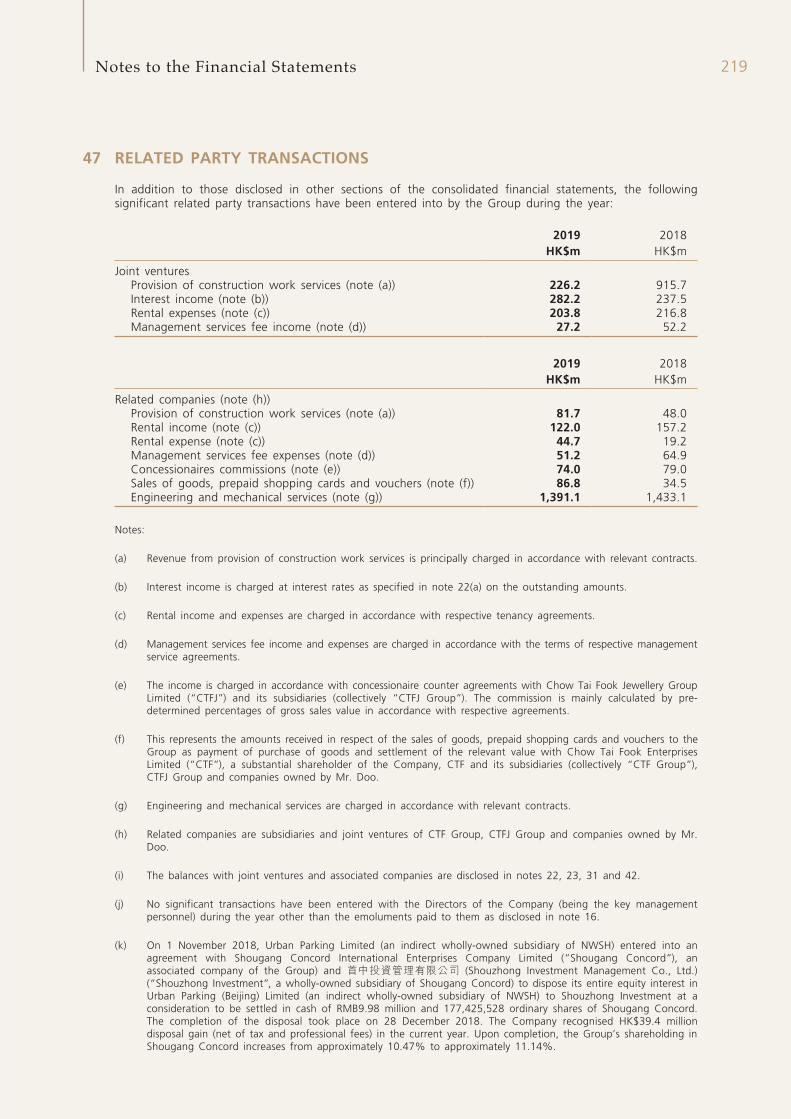
219Notes to the Financial Statements
47 RELATED PARTY TRANSACTIONS
In addition to those disclosed in other sections of the consolidated financial statements, the following significant related party transactions have been entered into by the Group during the year:
2019 2018HK$m HK$m
Joint venturesProvision of construction work services (note (a)) 226.2 915.7Interest income (note (b)) 282.2 237.5Rental expenses (note (c)) 203.8 216.8Management services fee income (note (d)) 27.2 52.2
2019 2018HK$m HK$m
Related companies (note (h))Provision of construction work services (note (a)) 81.7 48.0Rental income (note (c)) 122.0 157.2Rental expense (note (c)) 44.7 19.2Management services fee expenses (note (d)) 51.2 64.9Concessionaires commissions (note (e)) 74.0 79.0Sales of goods, prepaid shopping cards and vouchers (note (f)) 86.8 34.5Engineering and mechanical services (note (g)) 1,391.1 1,433.1
Notes:
(a) Revenue from provision of construction work services is principally charged in accordance with relevant contracts.
(b) Interest income is charged at interest rates as specified in note 22(a) on the outstanding amounts.
(c) Rental income and expenses are charged in accordance with respective tenancy agreements.
(d) Management services fee income and expenses are charged in accordance with the terms of respective management service agreements.
(e) The income is charged in accordance with concessionaire counter agreements with Chow Tai Fook Jewellery Group Limited (“CTFJ”) and its subsidiaries (collectively “CTFJ Group”). The commission is mainly calculated by pre-determined percentages of gross sales value in accordance with respective agreements.
(f) This represents the amounts received in respect of the sales of goods, prepaid shopping cards and vouchers to the Group as payment of purchase of goods and settlement of the relevant value with Chow Tai Fook Enterprises Limited (“CTF”), a substantial shareholder of the Company, CTF and its subsidiaries (collectively “CTF Group”), CTFJ Group and companies owned by Mr. Doo.
(g) Engineering and mechanical services are charged in accordance with relevant contracts.
(h) Related companies are subsidiaries and joint ventures of CTF Group, CTFJ Group and companies owned by Mr. Doo.
(i) The balances with joint ventures and associated companies are disclosed in notes 22, 23, 31 and 42.
(j) No significant transactions have been entered with the Directors of the Company (being the key management personnel) during the year other than the emoluments paid to them as disclosed in note 16.
(k) On 1 November 2018, Urban Parking Limited (an indirect wholly-owned subsidiary of NWSH) entered into an agreement with Shougang Concord International Enterprises Company Limited (“Shougang Concord”), an associated company of the Group) and 首中投資管理有限公司 (Shouzhong Investment Management Co., Ltd.) (“Shouzhong Investment”, a wholly-owned subsidiary of Shougang Concord) to dispose its entire equity interest in Urban Parking (Beijing) Limited (an indirect wholly-owned subsidiary of NWSH) to Shouzhong Investment at a consideration to be settled in cash of RMB9.98 million and 177,425,528 ordinary shares of Shougang Concord. The completion of the disposal took place on 28 December 2018. The Company recognised HK$39.4 million disposal gain (net of tax and professional fees) in the current year. Upon completion, the Group’s shareholding in Shougang Concord increases from approximately 10.47% to approximately 11.14%.
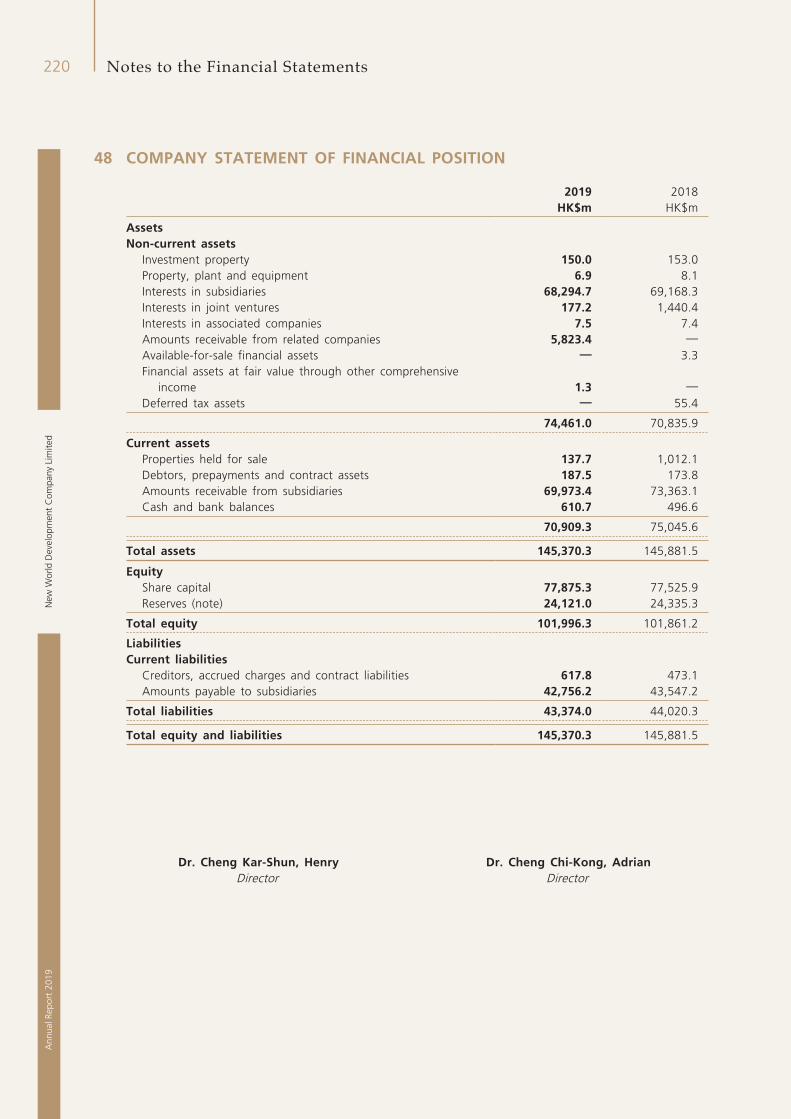
New
Wor
ld D
evel
opm
ent
Com
pany
Lim
ited
220A
nnua
l Rep
ort
2019
Notes to the Financial Statements
48 COMPANY STATEMENT OF FINANCIAL POSITION
2019 2018HK$m HK$m
AssetsNon-current assets
Investment property 150.0 153.0Property, plant and equipment 6.9 8.1Interests in subsidiaries 68,294.7 69,168.3Interests in joint ventures 177.2 1,440.4Interests in associated companies 7.5 7.4Amounts receivable from related companies 5,823.4 —Available-for-sale financial assets — 3.3Financial assets at fair value through other comprehensive
income 1.3 —Deferred tax assets — 55.4
74,461.0 70,835.9
Current assetsProperties held for sale 137.7 1,012.1Debtors, prepayments and contract assets 187.5 173.8Amounts receivable from subsidiaries 69,973.4 73,363.1Cash and bank balances 610.7 496.6
70,909.3 75,045.6
Total assets 145,370.3 145,881.5
EquityShare capital 77,875.3 77,525.9Reserves (note) 24,121.0 24,335.3
Total equity 101,996.3 101,861.2
LiabilitiesCurrent liabilities
Creditors, accrued charges and contract liabilities 617.8 473.1Amounts payable to subsidiaries 42,756.2 43,547.2
Total liabilities 43,374.0 44,020.3
Total equity and liabilities 145,370.3 145,881.5
Dr. Cheng Kar-Shun, Henry Dr. Cheng Chi-Kong, AdrianDirector Director
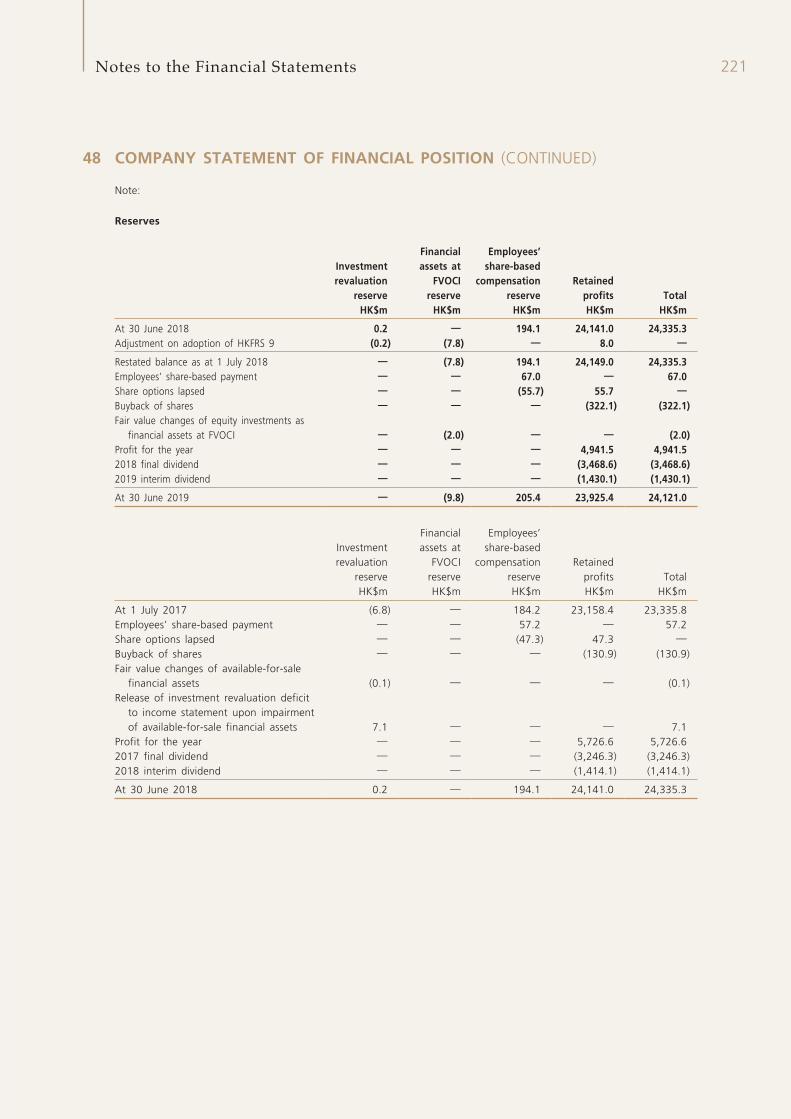
221Notes to the Financial Statements
48 COMPANY STATEMENT OF FINANCIAL POSITION (CONTINUED)
Note:
Reserves
Investment revaluation
reserve
Financial assets at
FVOCI reserve
Employees’ share-based
compensation reserve
Retained profits Total
HK$m HK$m HK$m HK$m HK$m
At 30 June 2018 0.2 — 194.1 24,141.0 24,335.3Adjustment on adoption of HKFRS 9 (0.2) (7.8) — 8.0 —
Restated balance as at 1 July 2018 — (7.8) 194.1 24,149.0 24,335.3Employees’ share-based payment — — 67.0 — 67.0Share options lapsed — — (55.7) 55.7 —Buyback of shares — — — (322.1) (322.1)Fair value changes of equity investments as
financial assets at FVOCI — (2.0) — — (2.0)Profit for the year — — — 4,941.5 4,941.52018 final dividend — — — (3,468.6) (3,468.6)2019 interim dividend — — — (1,430.1) (1,430.1)
At 30 June 2019 — (9.8) 205.4 23,925.4 24,121.0
Investment revaluation
reserve
Financial assets at
FVOCI reserve
Employees’ share-based
compensation reserve
Retained profits Total
HK$m HK$m HK$m HK$m HK$m
At 1 July 2017 (6.8) — 184.2 23,158.4 23,335.8Employees’ share-based payment — — 57.2 — 57.2Share options lapsed — — (47.3) 47.3 —
Buyback of shares — — — (130.9) (130.9)Fair value changes of available-for-sale
financial assets (0.1) — — — (0.1)Release of investment revaluation deficit
to income statement upon impairment of available-for-sale financial assets 7.1 — — — 7.1
Profit for the year — — — 5,726.6 5,726.62017 final dividend — — — (3,246.3) (3,246.3)2018 interim dividend — — — (1,414.1) (1,414.1)
At 30 June 2018 0.2 — 194.1 24,141.0 24,335.3
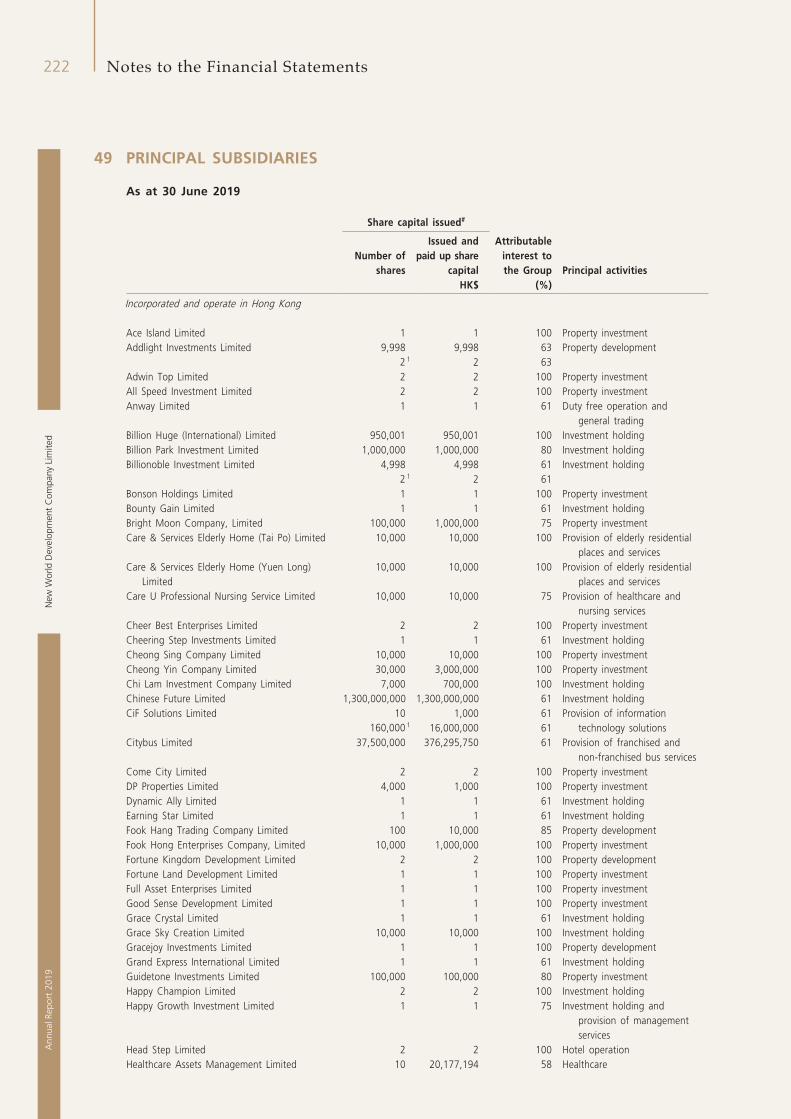
New
Wor
ld D
evel
opm
ent
Com
pany
Lim
ited
222A
nnua
l Rep
ort
2019
Notes to the Financial Statements
49 PRINCIPAL SUBSIDIARIES
As at 30 June 2019
Share capital issued#
Attributable interest to the Group
Number of shares
Issued and paid up share
capital Principal activitiesHK$ (%)
Incorporated and operate in Hong Kong
Ace Island Limited 1 1 100 Property investmentAddlight Investments Limited 9,998 9,998 63 Property development
2 1 2 63Adwin Top Limited 2 2 100 Property investmentAll Speed Investment Limited 2 2 100 Property investmentAnway Limited 1 1 61 Duty free operation and
general tradingBillion Huge (International) Limited 950,001 950,001 100 Investment holdingBillion Park Investment Limited 1,000,000 1,000,000 80 Investment holdingBillionoble Investment Limited 4,998 4,998 61 Investment holding
2 1 2 61Bonson Holdings Limited 1 1 100 Property investmentBounty Gain Limited 1 1 61 Investment holdingBright Moon Company, Limited 100,000 1,000,000 75 Property investmentCare & Services Elderly Home (Tai Po) Limited 10,000 10,000 100 Provision of elderly residential
places and servicesCare & Services Elderly Home (Yuen Long)
Limited10,000 10,000 100 Provision of elderly residential
places and servicesCare U Professional Nursing Service Limited 10,000 10,000 75 Provision of healthcare and
nursing servicesCheer Best Enterprises Limited 2 2 100 Property investmentCheering Step Investments Limited 1 1 61 Investment holdingCheong Sing Company Limited 10,000 10,000 100 Property investmentCheong Yin Company Limited 30,000 3,000,000 100 Property investmentChi Lam Investment Company Limited 7,000 700,000 100 Investment holdingChinese Future Limited 1,300,000,000 1,300,000,000 61 Investment holdingCiF Solutions Limited 10 1,000 61 Provision of information
technology solutions160,000 1 16,000,000 61Citybus Limited 37,500,000 376,295,750 61 Provision of franchised and
non-franchised bus servicesCome City Limited 2 2 100 Property investmentDP Properties Limited 4,000 1,000 100 Property investmentDynamic Ally Limited 1 1 61 Investment holdingEarning Star Limited 1 1 61 Investment holdingFook Hang Trading Company Limited 100 10,000 85 Property developmentFook Hong Enterprises Company, Limited 10,000 1,000,000 100 Property investmentFortune Kingdom Development Limited 2 2 100 Property developmentFortune Land Development Limited 1 1 100 Property investmentFull Asset Enterprises Limited 1 1 100 Property investmentGood Sense Development Limited 1 1 100 Property investmentGrace Crystal Limited 1 1 61 Investment holdingGrace Sky Creation Limited 10,000 10,000 100 Investment holdingGracejoy Investments Limited 1 1 100 Property developmentGrand Express International Limited 1 1 61 Investment holdingGuidetone Investments Limited 100,000 100,000 80 Property investmentHappy Champion Limited 2 2 100 Investment holdingHappy Growth Investment Limited 1 1 75 Investment holding and
provision of management services
Head Step Limited 2 2 100 Hotel operationHealthcare Assets Management Limited 10 20,177,194 58 Healthcare
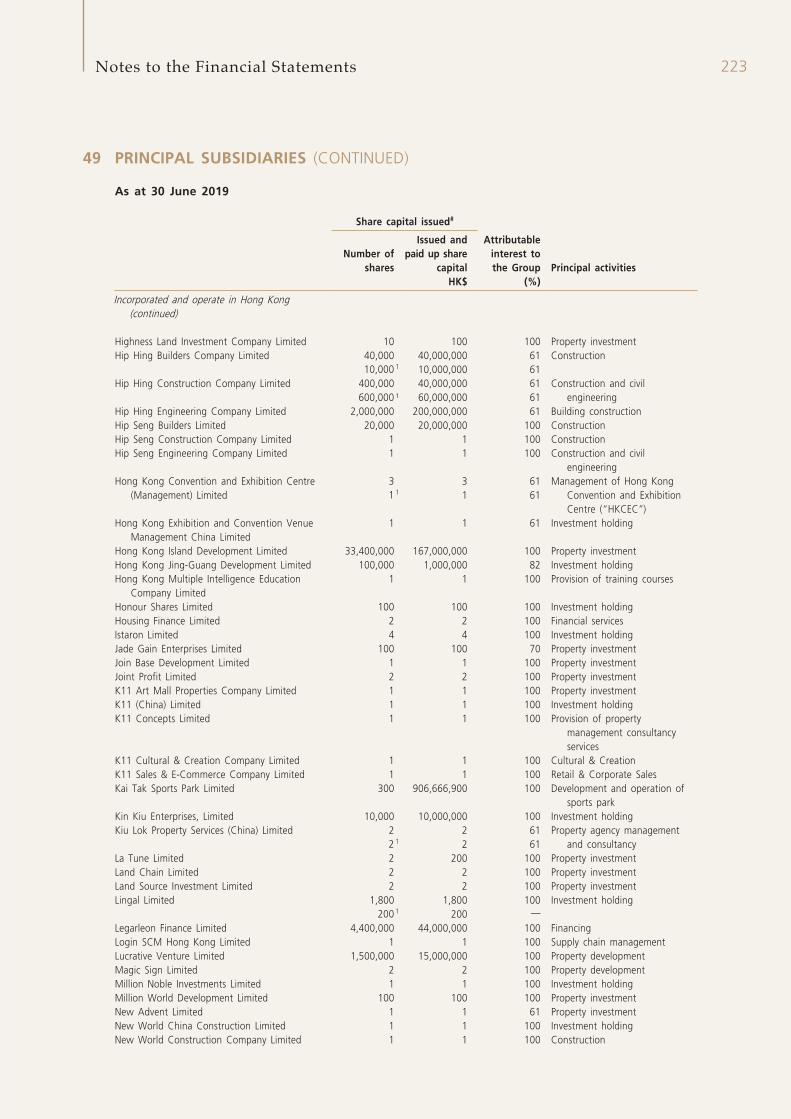
223Notes to the Financial Statements
49 PRINCIPAL SUBSIDIARIES (CONTINUED)
As at 30 June 2019
Share capital issued#
Attributable interest to the Group
Number of shares
Issued and paid up share
capital Principal activitiesHK$ (%)
Incorporated and operate in Hong Kong (continued)
Highness Land Investment Company Limited 10 100 100 Property investmentHip Hing Builders Company Limited 40,000 40,000,000 61 Construction
10,000 1 10,000,000 61Hip Hing Construction Company Limited 400,000 40,000,000 61 Construction and civil
engineering600,000 ¹ 60,000,000 61Hip Hing Engineering Company Limited 2,000,000 200,000,000 61 Building constructionHip Seng Builders Limited 20,000 20,000,000 100 ConstructionHip Seng Construction Company Limited 1 1 100 ConstructionHip Seng Engineering Company Limited 1 1 100 Construction and civil
engineeringHong Kong Convention and Exhibition Centre
(Management) Limited 3 3 61 Management of Hong Kong
Convention and Exhibition Centre (“HKCEC”)
1 1 1 61
Hong Kong Exhibition and Convention Venue Management China Limited
1 1 61 Investment holding
Hong Kong Island Development Limited 33,400,000 167,000,000 100 Property investmentHong Kong Jing-Guang Development Limited 100,000 1,000,000 82 Investment holdingHong Kong Multiple Intelligence Education
Company Limited1 1 100 Provision of training courses
Honour Shares Limited 100 100 100 Investment holdingHousing Finance Limited 2 2 100 Financial servicesIstaron Limited 4 4 100 Investment holdingJade Gain Enterprises Limited 100 100 70 Property investmentJoin Base Development Limited 1 1 100 Property investmentJoint Profit Limited 2 2 100 Property investmentK11 Art Mall Properties Company Limited 1 1 100 Property investmentK11 (China) Limited 1 1 100 Investment holdingK11 Concepts Limited 1 1 100 Provision of property
management consultancy services
K11 Cultural & Creation Company Limited 1 1 100 Cultural & CreationK11 Sales & E-Commerce Company Limited 1 1 100 Retail & Corporate SalesKai Tak Sports Park Limited 300 906,666,900 100 Development and operation of
sports parkKin Kiu Enterprises, Limited 10,000 10,000,000 100 Investment holdingKiu Lok Property Services (China) Limited 2 2 61 Property agency management
and consultancy2 1 2 61La Tune Limited 2 200 100 Property investmentLand Chain Limited 2 2 100 Property investmentLand Source Investment Limited 2 2 100 Property investmentLingal Limited 1,800 1,800 100 Investment holding
200 1 200 —Legarleon Finance Limited 4,400,000 44,000,000 100 FinancingLogin SCM Hong Kong Limited 1 1 100 Supply chain managementLucrative Venture Limited 1,500,000 15,000,000 100 Property developmentMagic Sign Limited 2 2 100 Property developmentMillion Noble Investments Limited 1 1 100 Investment holdingMillion World Development Limited 100 100 100 Property investmentNew Advent Limited 1 1 61 Property investmentNew World China Construction Limited 1 1 100 Investment holdingNew World Construction Company Limited 1 1 100 Construction
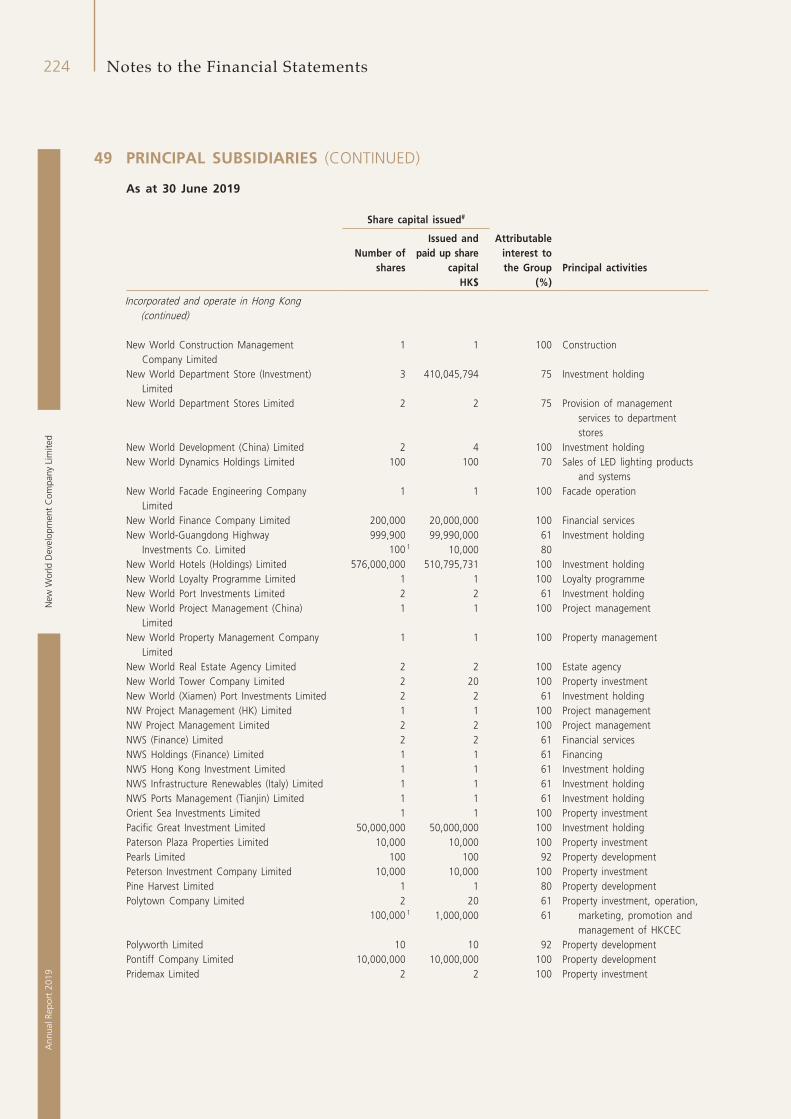
New
Wor
ld D
evel
opm
ent
Com
pany
Lim
ited
224A
nnua
l Rep
ort
2019
Notes to the Financial Statements
49 PRINCIPAL SUBSIDIARIES (CONTINUED)
As at 30 June 2019
Share capital issued#
Attributable interest to the Group
Number of shares
Issued and paid up share
capital Principal activitiesHK$ (%)
Incorporated and operate in Hong Kong (continued)
New World Construction Management Company Limited
1 1 100 Construction
New World Department Store (Investment) Limited
3 410,045,794 75 Investment holding
New World Department Stores Limited 2 2 75 Provision of management services to department stores
New World Development (China) Limited 2 4 100 Investment holdingNew World Dynamics Holdings Limited 100 100 70 Sales of LED lighting products
and systemsNew World Facade Engineering Company
Limited1 1 100 Facade operation
New World Finance Company Limited 200,000 20,000,000 100 Financial servicesNew World-Guangdong Highway
Investments Co. Limited999,900 99,990,000 61 Investment holding
100 1 10,000 80New World Hotels (Holdings) Limited 576,000,000 510,795,731 100 Investment holdingNew World Loyalty Programme Limited 1 1 100 Loyalty programmeNew World Port Investments Limited 2 2 61 Investment holdingNew World Project Management (China)
Limited1 1 100 Project management
New World Property Management Company Limited
1 1 100 Property management
New World Real Estate Agency Limited 2 2 100 Estate agencyNew World Tower Company Limited 2 20 100 Property investmentNew World (Xiamen) Port Investments Limited 2 2 61 Investment holdingNW Project Management (HK) Limited 1 1 100 Project managementNW Project Management Limited 2 2 100 Project managementNWS (Finance) Limited 2 2 61 Financial servicesNWS Holdings (Finance) Limited 1 1 61 FinancingNWS Hong Kong Investment Limited 1 1 61 Investment holdingNWS Infrastructure Renewables (Italy) Limited 1 1 61 Investment holdingNWS Ports Management (Tianjin) Limited 1 1 61 Investment holdingOrient Sea Investments Limited 1 1 100 Property investmentPacific Great Investment Limited 50,000,000 50,000,000 100 Investment holdingPaterson Plaza Properties Limited 10,000 10,000 100 Property investmentPearls Limited 100 100 92 Property developmentPeterson Investment Company Limited 10,000 10,000 100 Property investmentPine Harvest Limited 1 1 80 Property developmentPolytown Company Limited 2 20 61 Property investment, operation,
marketing, promotion and management of HKCEC
100,000 1 1,000,000 61
Polyworth Limited 10 10 92 Property developmentPontiff Company Limited 10,000,000 10,000,000 100 Property developmentPridemax Limited 2 2 100 Property investment
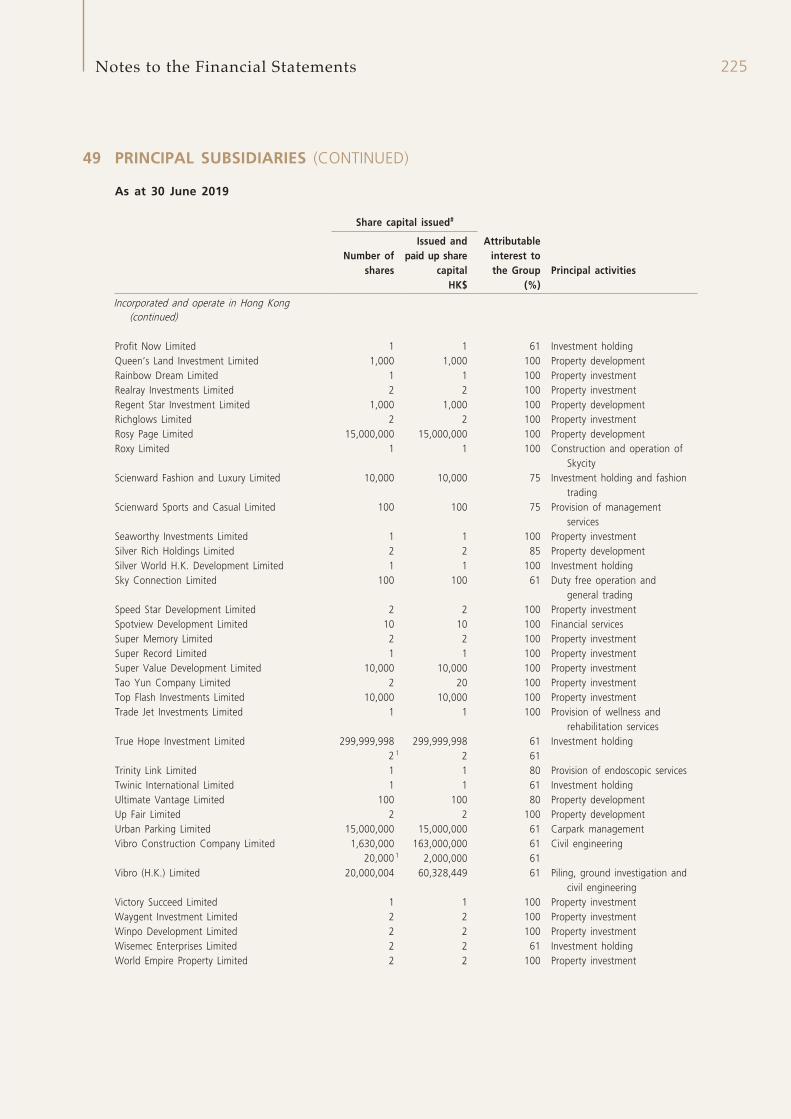
225Notes to the Financial Statements
49 PRINCIPAL SUBSIDIARIES (CONTINUED)
As at 30 June 2019
Share capital issued#
Attributable interest to the Group
Number of shares
Issued and paid up share
capital Principal activitiesHK$ (%)
Incorporated and operate in Hong Kong (continued)
Profit Now Limited 1 1 61 Investment holdingQueen’s Land Investment Limited 1,000 1,000 100 Property developmentRainbow Dream Limited 1 1 100 Property investmentRealray Investments Limited 2 2 100 Property investmentRegent Star Investment Limited 1,000 1,000 100 Property developmentRichglows Limited 2 2 100 Property investmentRosy Page Limited 15,000,000 15,000,000 100 Property developmentRoxy Limited 1 1 100 Construction and operation of
SkycityScienward Fashion and Luxury Limited 10,000 10,000 75 Investment holding and fashion
tradingScienward Sports and Casual Limited 100 100 75 Provision of management
servicesSeaworthy Investments Limited 1 1 100 Property investmentSilver Rich Holdings Limited 2 2 85 Property developmentSilver World H.K. Development Limited 1 1 100 Investment holdingSky Connection Limited 100 100 61 Duty free operation and
general tradingSpeed Star Development Limited 2 2 100 Property investmentSpotview Development Limited 10 10 100 Financial servicesSuper Memory Limited 2 2 100 Property investmentSuper Record Limited 1 1 100 Property investmentSuper Value Development Limited 10,000 10,000 100 Property investmentTao Yun Company Limited 2 20 100 Property investmentTop Flash Investments Limited 10,000 10,000 100 Property investmentTrade Jet Investments Limited 1 1 100 Provision of wellness and
rehabilitation servicesTrue Hope Investment Limited 299,999,998 299,999,998 61 Investment holding
2 1 2 61Trinity Link Limited 1 1 80 Provision of endoscopic servicesTwinic International Limited 1 1 61 Investment holdingUltimate Vantage Limited 100 100 80 Property developmentUp Fair Limited 2 2 100 Property developmentUrban Parking Limited 15,000,000 15,000,000 61 Carpark managementVibro Construction Company Limited 1,630,000 163,000,000 61 Civil engineering
20,000 1 2,000,000 61Vibro (H.K.) Limited 20,000,004 60,328,449 61 Piling, ground investigation and
civil engineeringVictory Succeed Limited 1 1 100 Property investmentWaygent Investment Limited 2 2 100 Property investmentWinpo Development Limited 2 2 100 Property investmentWisemec Enterprises Limited 2 2 61 Investment holdingWorld Empire Property Limited 2 2 100 Property investment
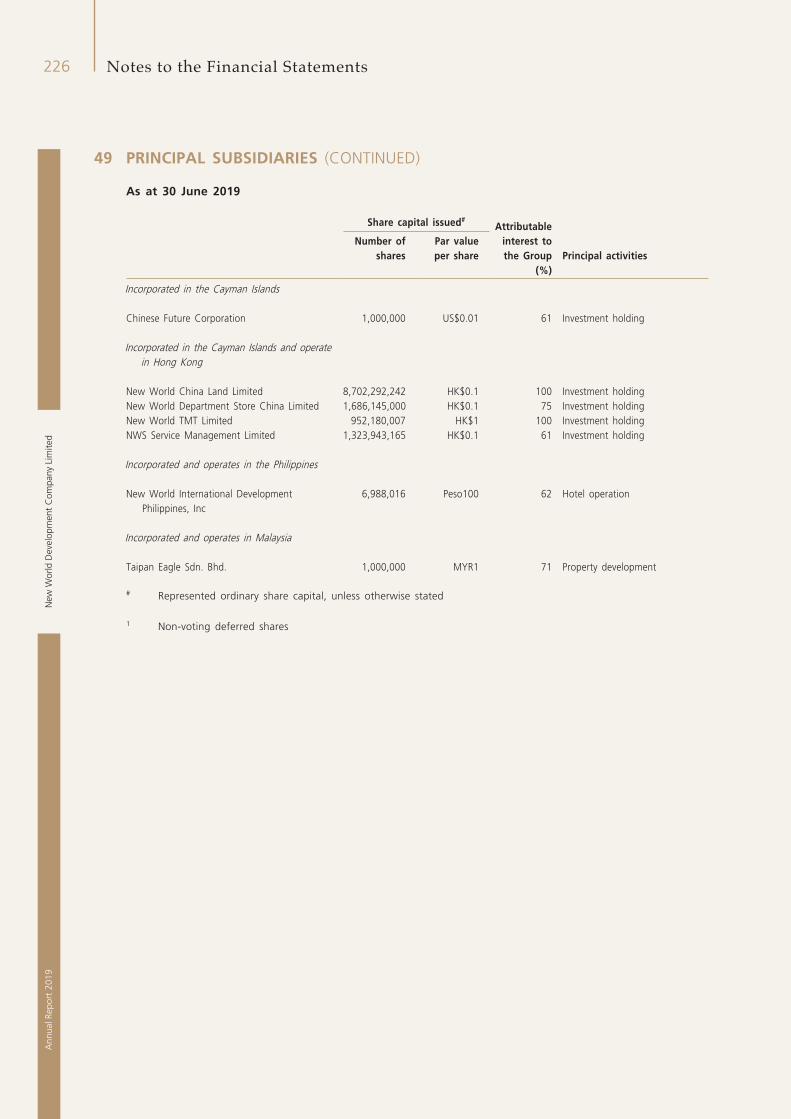
New
Wor
ld D
evel
opm
ent
Com
pany
Lim
ited
226A
nnua
l Rep
ort
2019
Notes to the Financial Statements
49 PRINCIPAL SUBSIDIARIES (CONTINUED)
As at 30 June 2019
Share capital issued#Attributable
interest to the Group
Number of shares
Par value per share Principal activities
(%)
Incorporated in the Cayman Islands
Chinese Future Corporation 1,000,000 US$0.01 61 Investment holding
Incorporated in the Cayman Islands and operate in Hong Kong
New World China Land Limited 8,702,292,242 HK$0.1 100 Investment holdingNew World Department Store China Limited 1,686,145,000 HK$0.1 75 Investment holdingNew World TMT Limited 952,180,007 HK$1 100 Investment holdingNWS Service Management Limited 1,323,943,165 HK$0.1 61 Investment holding
Incorporated and operates in the Philippines
New World International Development Philippines, Inc
6,988,016 Peso100 62 Hotel operation
Incorporated and operates in Malaysia
Taipan Eagle Sdn. Bhd. 1,000,000 MYR1 71 Property development
# Represented ordinary share capital, unless otherwise stated
1 Non-voting deferred shares
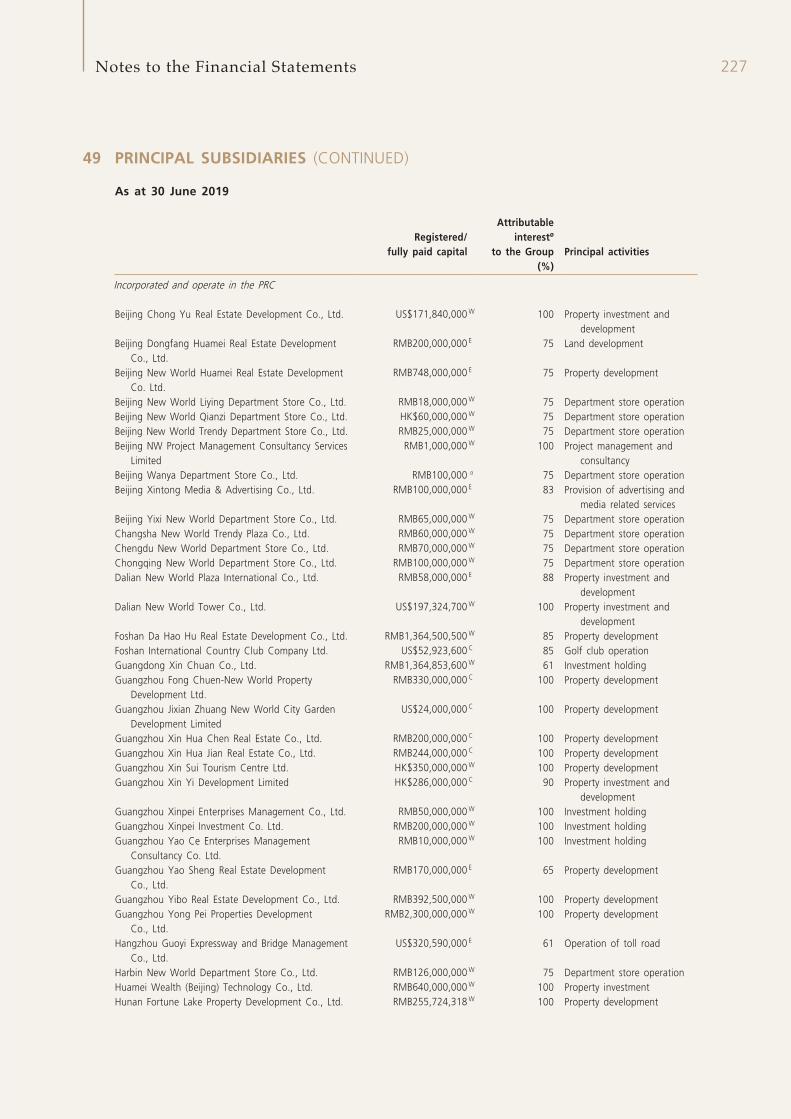
227Notes to the Financial Statements
49 PRINCIPAL SUBSIDIARIES (CONTINUED)
As at 30 June 2019
Registered/ fully paid capital
Attributable interestø
to the Group Principal activities(%)
Incorporated and operate in the PRC
Beijing Chong Yu Real Estate Development Co., Ltd. US$171,840,000 W 100 Property investment and development
Beijing Dongfang Huamei Real Estate Development Co., Ltd.
RMB200,000,000 E 75 Land development
Beijing New World Huamei Real Estate Development Co. Ltd.
RMB748,000,000 E 75 Property development
Beijing New World Liying Department Store Co., Ltd. RMB18,000,000 W 75 Department store operationBeijing New World Qianzi Department Store Co., Ltd. HK$60,000,000 W 75 Department store operationBeijing New World Trendy Department Store Co., Ltd. RMB25,000,000 W 75 Department store operationBeijing NW Project Management Consultancy Services
LimitedRMB1,000,000 W 100 Project management and
consultancyBeijing Wanya Department Store Co., Ltd. RMB100,000 α 75 Department store operationBeijing Xintong Media & Advertising Co., Ltd. RMB100,000,000 E 83 Provision of advertising and
media related servicesBeijing Yixi New World Department Store Co., Ltd. RMB65,000,000 W 75 Department store operationChangsha New World Trendy Plaza Co., Ltd. RMB60,000,000 W 75 Department store operationChengdu New World Department Store Co., Ltd. RMB70,000,000 W 75 Department store operationChongqing New World Department Store Co., Ltd. RMB100,000,000 W 75 Department store operationDalian New World Plaza International Co., Ltd. RMB58,000,000 E 88 Property investment and
developmentDalian New World Tower Co., Ltd. US$197,324,700 W 100 Property investment and
developmentFoshan Da Hao Hu Real Estate Development Co., Ltd. RMB1,364,500,500 W 85 Property developmentFoshan International Country Club Company Ltd. US$52,923,600 C 85 Golf club operationGuangdong Xin Chuan Co., Ltd. RMB1,364,853,600 W 61 Investment holdingGuangzhou Fong Chuen-New World Property
Development Ltd.RMB330,000,000 C 100 Property development
Guangzhou Jixian Zhuang New World City Garden Development Limited
US$24,000,000 C 100 Property development
Guangzhou Xin Hua Chen Real Estate Co., Ltd. RMB200,000,000 C 100 Property developmentGuangzhou Xin Hua Jian Real Estate Co., Ltd. RMB244,000,000 C 100 Property developmentGuangzhou Xin Sui Tourism Centre Ltd. HK$350,000,000 W 100 Property developmentGuangzhou Xin Yi Development Limited HK$286,000,000 C 90 Property investment and
developmentGuangzhou Xinpei Enterprises Management Co., Ltd. RMB50,000,000 W 100 Investment holdingGuangzhou Xinpei Investment Co. Ltd. RMB200,000,000 W 100 Investment holdingGuangzhou Yao Ce Enterprises Management
Consultancy Co. Ltd.RMB10,000,000 W 100 Investment holding
Guangzhou Yao Sheng Real Estate Development Co., Ltd.
RMB170,000,000 E 65 Property development
Guangzhou Yibo Real Estate Development Co., Ltd. RMB392,500,000 W 100 Property developmentGuangzhou Yong Pei Properties Development
Co., Ltd.RMB2,300,000,000 W 100 Property development
Hangzhou Guoyi Expressway and Bridge Management Co., Ltd.
US$320,590,000 E 61 Operation of toll road
Harbin New World Department Store Co., Ltd. RMB126,000,000 W 75 Department store operationHuamei Wealth (Beijing) Technology Co., Ltd. RMB640,000,000 W 100 Property investmentHunan Fortune Lake Property Development Co., Ltd. RMB255,724,318 W 100 Property development
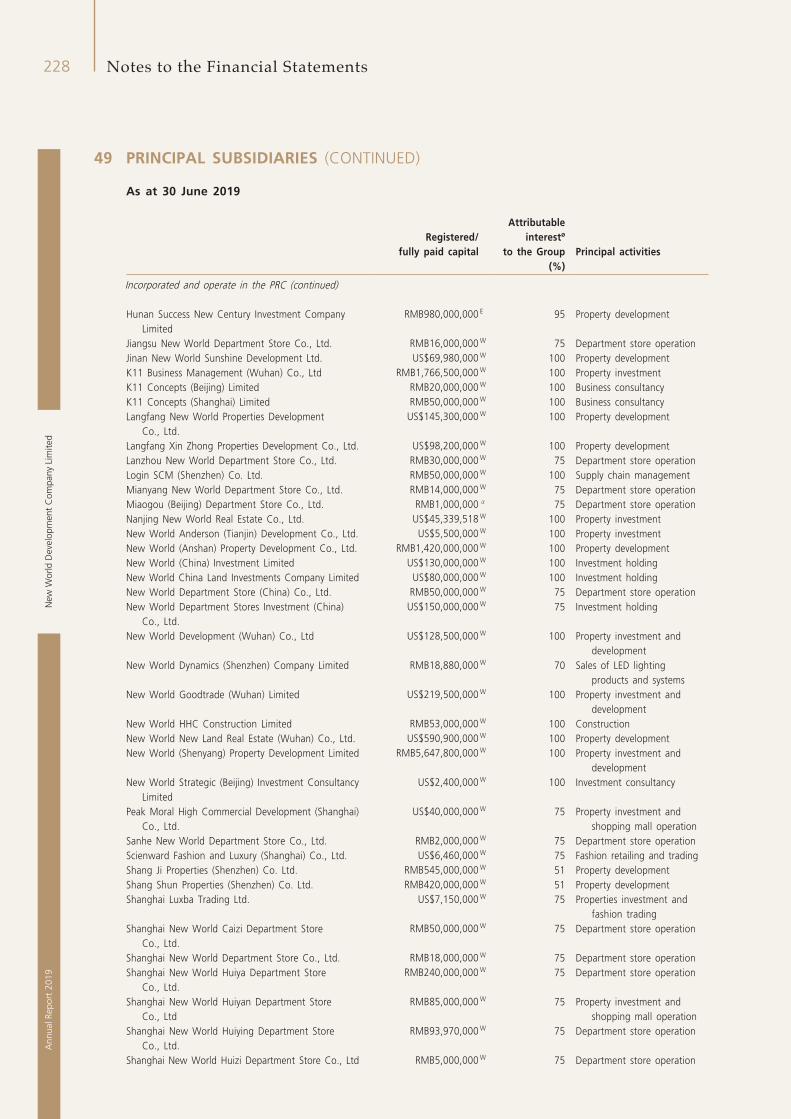
New
Wor
ld D
evel
opm
ent
Com
pany
Lim
ited
228A
nnua
l Rep
ort
2019
Notes to the Financial Statements
49 PRINCIPAL SUBSIDIARIES (CONTINUED)
As at 30 June 2019
Registered/ fully paid capital
Attributable interestø
to the Group Principal activities(%)
Incorporated and operate in the PRC (continued)
Hunan Success New Century Investment Company Limited
RMB980,000,000 E 95 Property development
Jiangsu New World Department Store Co., Ltd. RMB16,000,000 W 75 Department store operationJinan New World Sunshine Development Ltd. US$69,980,000 W 100 Property developmentK11 Business Management (Wuhan) Co., Ltd RMB1,766,500,000 W 100 Property investmentK11 Concepts (Beijing) Limited RMB20,000,000 W 100 Business consultancyK11 Concepts (Shanghai) Limited RMB50,000,000 W 100 Business consultancyLangfang New World Properties Development
Co., Ltd.US$145,300,000 W 100 Property development
Langfang Xin Zhong Properties Development Co., Ltd. US$98,200,000 W 100 Property developmentLanzhou New World Department Store Co., Ltd. RMB30,000,000 W 75 Department store operationLogin SCM (Shenzhen) Co. Ltd. RMB50,000,000 W 100 Supply chain managementMianyang New World Department Store Co., Ltd. RMB14,000,000 W 75 Department store operationMiaogou (Beijing) Department Store Co., Ltd. RMB1,000,000 α 75 Department store operationNanjing New World Real Estate Co., Ltd. US$45,339,518 W 100 Property investmentNew World Anderson (Tianjin) Development Co., Ltd. US$5,500,000 W 100 Property investmentNew World (Anshan) Property Development Co., Ltd. RMB1,420,000,000 W 100 Property developmentNew World (China) Investment Limited US$130,000,000 W 100 Investment holdingNew World China Land Investments Company Limited US$80,000,000 W 100 Investment holdingNew World Department Store (China) Co., Ltd. RMB50,000,000 W 75 Department store operationNew World Department Stores Investment (China)
Co., Ltd.US$150,000,000 W 75 Investment holding
New World Development (Wuhan) Co., Ltd US$128,500,000 W 100 Property investment and development
New World Dynamics (Shenzhen) Company Limited RMB18,880,000 W 70 Sales of LED lighting products and systems
New World Goodtrade (Wuhan) Limited US$219,500,000 W 100 Property investment and development
New World HHC Construction Limited RMB53,000,000 W 100 ConstructionNew World New Land Real Estate (Wuhan) Co., Ltd. US$590,900,000 W 100 Property developmentNew World (Shenyang) Property Development Limited RMB5,647,800,000 W 100 Property investment and
developmentNew World Strategic (Beijing) Investment Consultancy
LimitedUS$2,400,000 W 100 Investment consultancy
Peak Moral High Commercial Development (Shanghai) Co., Ltd.
US$40,000,000 W 75 Property investment and shopping mall operation
Sanhe New World Department Store Co., Ltd. RMB2,000,000 W 75 Department store operationScienward Fashion and Luxury (Shanghai) Co., Ltd. US$6,460,000 W 75 Fashion retailing and tradingShang Ji Properties (Shenzhen) Co. Ltd. RMB545,000,000 W 51 Property developmentShang Shun Properties (Shenzhen) Co. Ltd. RMB420,000,000 W 51 Property developmentShanghai Luxba Trading Ltd. US$7,150,000 W 75 Properties investment and
fashion tradingShanghai New World Caizi Department Store
Co., Ltd.RMB50,000,000 W 75 Department store operation
Shanghai New World Department Store Co., Ltd. RMB18,000,000 W 75 Department store operationShanghai New World Huiya Department Store
Co., Ltd.RMB240,000,000 W 75 Department store operation
Shanghai New World Huiyan Department Store Co., Ltd
RMB85,000,000 W 75 Property investment and shopping mall operation
Shanghai New World Huiying Department Store Co., Ltd.
RMB93,970,000 W 75 Department store operation
Shanghai New World Huizi Department Store Co., Ltd RMB5,000,000 W 75 Department store operation
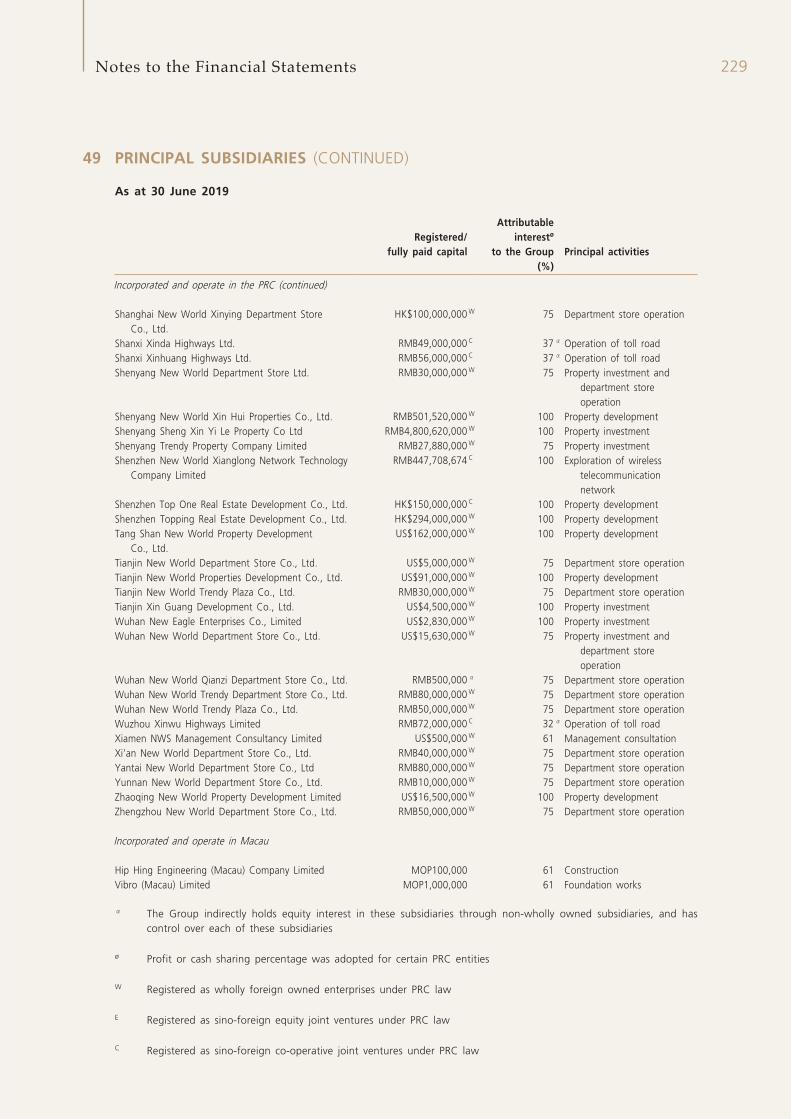
229Notes to the Financial Statements
49 PRINCIPAL SUBSIDIARIES (CONTINUED)
As at 30 June 2019
Registered/ fully paid capital
Attributable interestø
to the Group Principal activities(%)
Incorporated and operate in the PRC (continued)
Shanghai New World Xinying Department Store Co., Ltd.
HK$100,000,000 W 75 Department store operation
Shanxi Xinda Highways Ltd. RMB49,000,000 C 37 α Operation of toll roadShanxi Xinhuang Highways Ltd. RMB56,000,000 C 37 α Operation of toll roadShenyang New World Department Store Ltd. RMB30,000,000 W 75 Property investment and
department store operation
Shenyang New World Xin Hui Properties Co., Ltd. RMB501,520,000 W 100 Property developmentShenyang Sheng Xin Yi Le Property Co Ltd RMB4,800,620,000 W 100 Property investmentShenyang Trendy Property Company Limited RMB27,880,000 W 75 Property investmentShenzhen New World Xianglong Network Technology
Company LimitedRMB447,708,674 C 100 Exploration of wireless
telecommunication network
Shenzhen Top One Real Estate Development Co., Ltd. HK$150,000,000 C 100 Property developmentShenzhen Topping Real Estate Development Co., Ltd. HK$294,000,000 W 100 Property developmentTang Shan New World Property Development
Co., Ltd.US$162,000,000 W 100 Property development
Tianjin New World Department Store Co., Ltd. US$5,000,000 W 75 Department store operationTianjin New World Properties Development Co., Ltd. US$91,000,000 W 100 Property developmentTianjin New World Trendy Plaza Co., Ltd. RMB30,000,000 W 75 Department store operationTianjin Xin Guang Development Co., Ltd. US$4,500,000 W 100 Property investmentWuhan New Eagle Enterprises Co., Limited US$2,830,000 W 100 Property investmentWuhan New World Department Store Co., Ltd. US$15,630,000 W 75 Property investment and
department store operation
Wuhan New World Qianzi Department Store Co., Ltd. RMB500,000 α 75 Department store operationWuhan New World Trendy Department Store Co., Ltd. RMB80,000,000 W 75 Department store operationWuhan New World Trendy Plaza Co., Ltd. RMB50,000,000 W 75 Department store operationWuzhou Xinwu Highways Limited RMB72,000,000 C 32 α Operation of toll roadXiamen NWS Management Consultancy Limited US$500,000 W 61 Management consultationXi’an New World Department Store Co., Ltd. RMB40,000,000 W 75 Department store operationYantai New World Department Store Co., Ltd RMB80,000,000 W 75 Department store operationYunnan New World Department Store Co., Ltd. RMB10,000,000 W 75 Department store operationZhaoqing New World Property Development Limited US$16,500,000 W 100 Property developmentZhengzhou New World Department Store Co., Ltd. RMB50,000,000 W 75 Department store operation
Incorporated and operate in Macau
Hip Hing Engineering (Macau) Company Limited MOP100,000 61 ConstructionVibro (Macau) Limited MOP1,000,000 61 Foundation works
α The Group indirectly holds equity interest in these subsidiaries through non-wholly owned subsidiaries, and has control over each of these subsidiaries
ø Profit or cash sharing percentage was adopted for certain PRC entities
W Registered as wholly foreign owned enterprises under PRC law
E Registered as sino-foreign equity joint ventures under PRC law
C Registered as sino-foreign co-operative joint ventures under PRC law
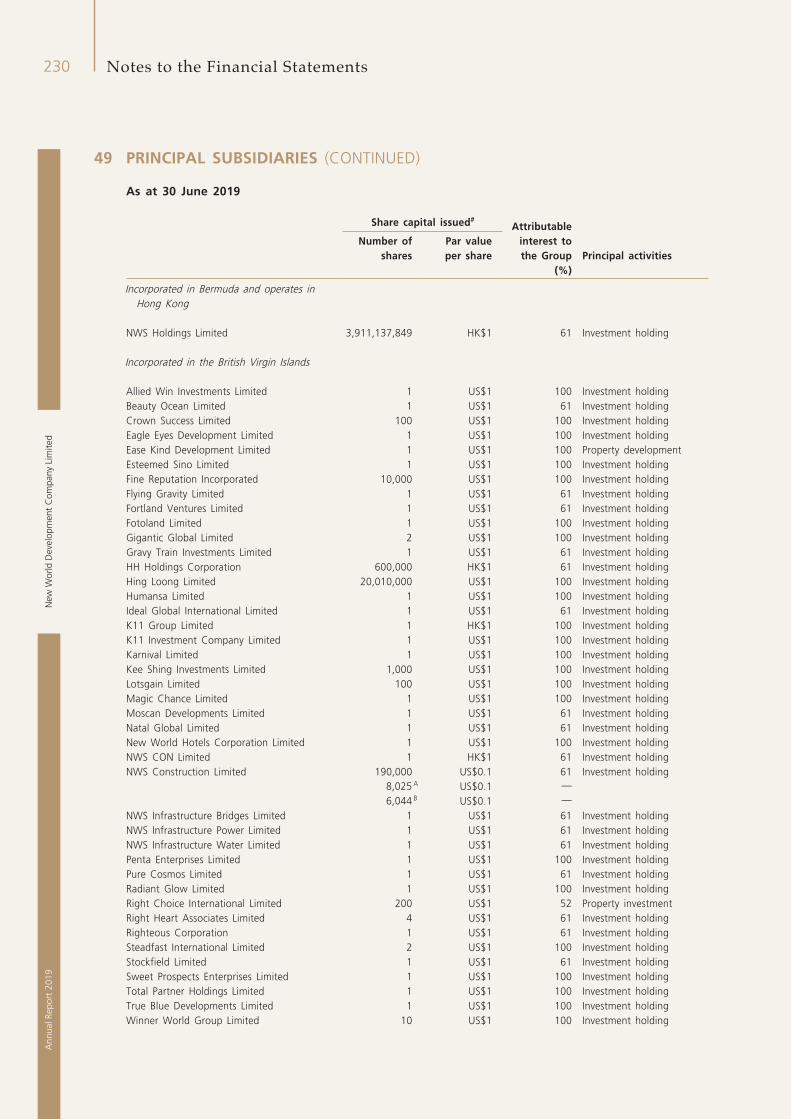
New
Wor
ld D
evel
opm
ent
Com
pany
Lim
ited
230A
nnua
l Rep
ort
2019
Notes to the Financial Statements
49 PRINCIPAL SUBSIDIARIES (CONTINUED)
As at 30 June 2019
Share capital issued#Attributable
interest to the Group
Number of shares
Par value per share Principal activities
(%)
Incorporated in Bermuda and operates in Hong Kong
NWS Holdings Limited 3,911,137,849 HK$1 61 Investment holding
Incorporated in the British Virgin Islands
Allied Win Investments Limited 1 US$1 100 Investment holdingBeauty Ocean Limited 1 US$1 61 Investment holdingCrown Success Limited 100 US$1 100 Investment holdingEagle Eyes Development Limited 1 US$1 100 Investment holdingEase Kind Development Limited 1 US$1 100 Property developmentEsteemed Sino Limited 1 US$1 100 Investment holdingFine Reputation Incorporated 10,000 US$1 100 Investment holdingFlying Gravity Limited 1 US$1 61 Investment holdingFortland Ventures Limited 1 US$1 61 Investment holdingFotoland Limited 1 US$1 100 Investment holdingGigantic Global Limited 2 US$1 100 Investment holdingGravy Train Investments Limited 1 US$1 61 Investment holdingHH Holdings Corporation 600,000 HK$1 61 Investment holdingHing Loong Limited 20,010,000 US$1 100 Investment holdingHumansa Limited 1 US$1 100 Investment holdingIdeal Global International Limited 1 US$1 61 Investment holdingK11 Group Limited 1 HK$1 100 Investment holdingK11 Investment Company Limited 1 US$1 100 Investment holdingKarnival Limited 1 US$1 100 Investment holdingKee Shing Investments Limited 1,000 US$1 100 Investment holdingLotsgain Limited 100 US$1 100 Investment holdingMagic Chance Limited 1 US$1 100 Investment holdingMoscan Developments Limited 1 US$1 61 Investment holdingNatal Global Limited 1 US$1 61 Investment holdingNew World Hotels Corporation Limited 1 US$1 100 Investment holdingNWS CON Limited 1 HK$1 61 Investment holdingNWS Construction Limited 190,000 US$0.1 61 Investment holding
8,025 A US$0.1 —
6,044 B US$0.1 —
NWS Infrastructure Bridges Limited 1 US$1 61 Investment holdingNWS Infrastructure Power Limited 1 US$1 61 Investment holdingNWS Infrastructure Water Limited 1 US$1 61 Investment holdingPenta Enterprises Limited 1 US$1 100 Investment holdingPure Cosmos Limited 1 US$1 61 Investment holdingRadiant Glow Limited 1 US$1 100 Investment holdingRight Choice International Limited 200 US$1 52 Property investmentRight Heart Associates Limited 4 US$1 61 Investment holdingRighteous Corporation 1 US$1 61 Investment holdingSteadfast International Limited 2 US$1 100 Investment holdingStockfield Limited 1 US$1 61 Investment holdingSweet Prospects Enterprises Limited 1 US$1 100 Investment holdingTotal Partner Holdings Limited 1 US$1 100 Investment holdingTrue Blue Developments Limited 1 US$1 100 Investment holdingWinner World Group Limited 10 US$1 100 Investment holding
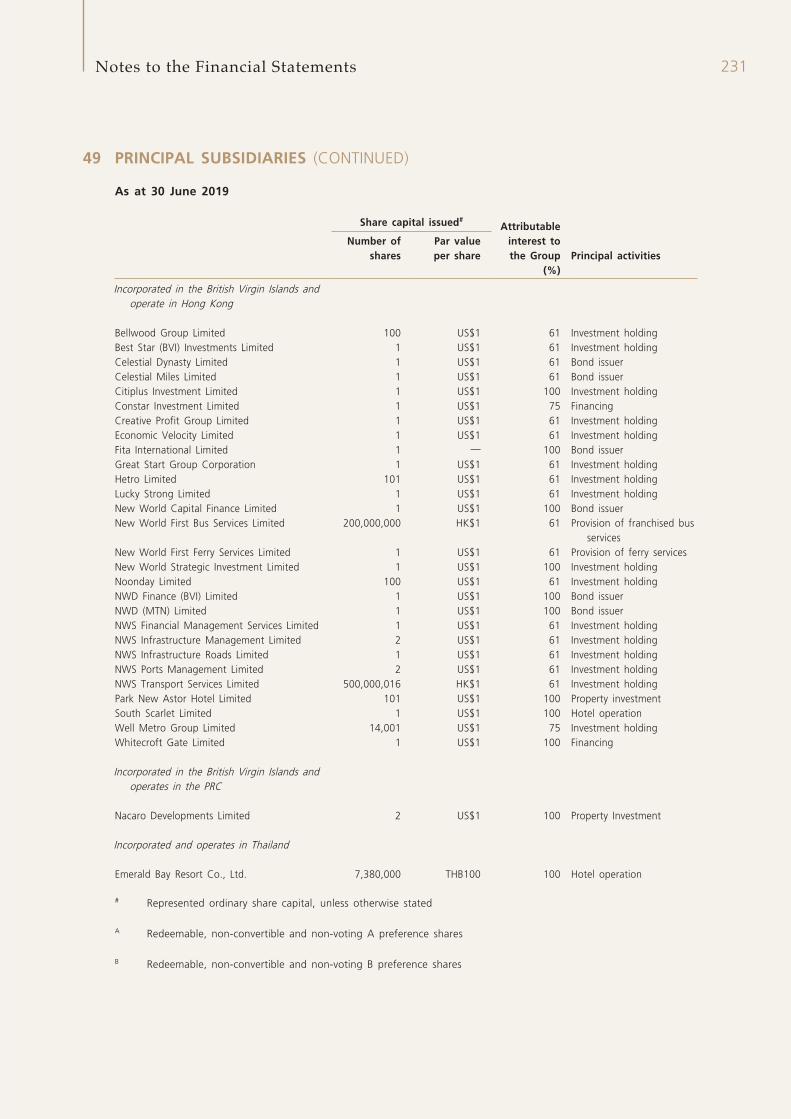
231Notes to the Financial Statements
49 PRINCIPAL SUBSIDIARIES (CONTINUED)
As at 30 June 2019
Share capital issued#Attributable
interest to the Group
Number of shares
Par value per share Principal activities
(%)
Incorporated in the British Virgin Islands and operate in Hong Kong
Bellwood Group Limited 100 US$1 61 Investment holdingBest Star (BVI) Investments Limited 1 US$1 61 Investment holdingCelestial Dynasty Limited 1 US$1 61 Bond issuerCelestial Miles Limited 1 US$1 61 Bond issuerCitiplus Investment Limited 1 US$1 100 Investment holdingConstar Investment Limited 1 US$1 75 FinancingCreative Profit Group Limited 1 US$1 61 Investment holdingEconomic Velocity Limited 1 US$1 61 Investment holdingFita International Limited 1 — 100 Bond issuerGreat Start Group Corporation 1 US$1 61 Investment holdingHetro Limited 101 US$1 61 Investment holdingLucky Strong Limited 1 US$1 61 Investment holdingNew World Capital Finance Limited 1 US$1 100 Bond issuerNew World First Bus Services Limited 200,000,000 HK$1 61 Provision of franchised bus
servicesNew World First Ferry Services Limited 1 US$1 61 Provision of ferry servicesNew World Strategic Investment Limited 1 US$1 100 Investment holdingNoonday Limited 100 US$1 61 Investment holdingNWD Finance (BVI) Limited 1 US$1 100 Bond issuerNWD (MTN) Limited 1 US$1 100 Bond issuerNWS Financial Management Services Limited 1 US$1 61 Investment holdingNWS Infrastructure Management Limited 2 US$1 61 Investment holdingNWS Infrastructure Roads Limited 1 US$1 61 Investment holdingNWS Ports Management Limited 2 US$1 61 Investment holdingNWS Transport Services Limited 500,000,016 HK$1 61 Investment holdingPark New Astor Hotel Limited 101 US$1 100 Property investmentSouth Scarlet Limited 1 US$1 100 Hotel operationWell Metro Group Limited 14,001 US$1 75 Investment holdingWhitecroft Gate Limited 1 US$1 100 Financing
Incorporated in the British Virgin Islands and operates in the PRC
Nacaro Developments Limited 2 US$1 100 Property Investment
Incorporated and operates in Thailand
Emerald Bay Resort Co., Ltd. 7,380,000 THB100 100 Hotel operation
# Represented ordinary share capital, unless otherwise stated
A Redeemable, non-convertible and non-voting A preference shares
B Redeemable, non-convertible and non-voting B preference shares
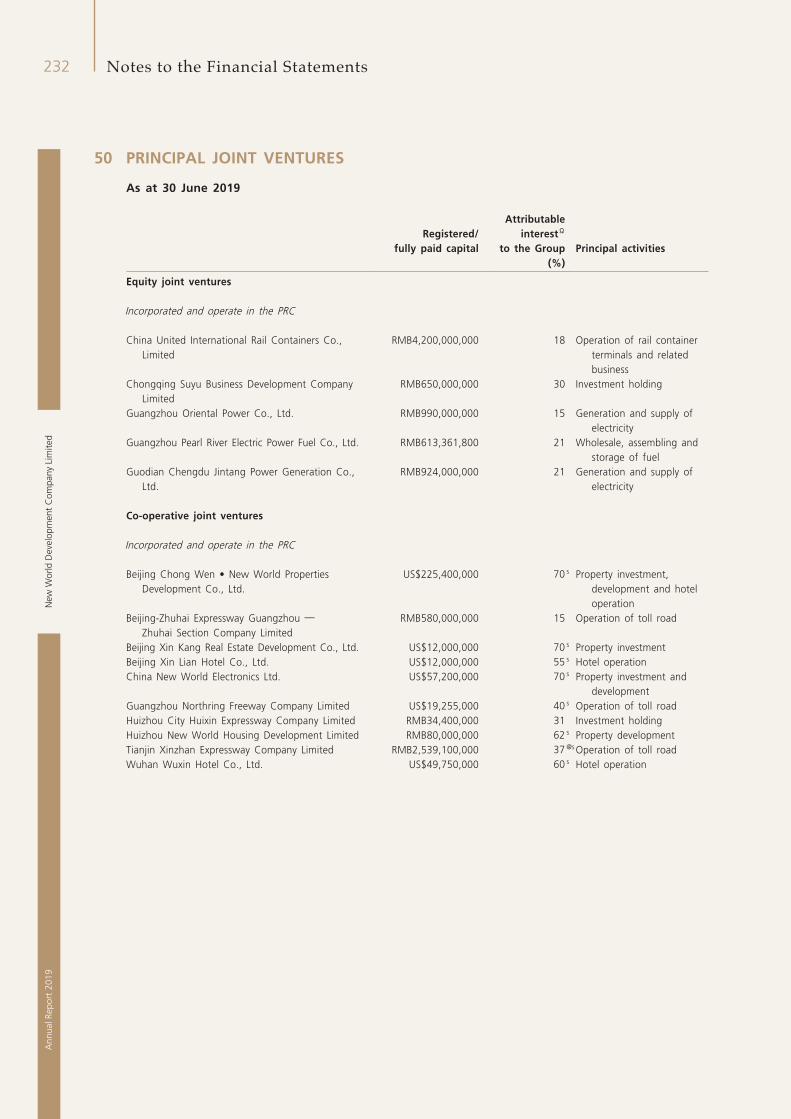
New
Wor
ld D
evel
opm
ent
Com
pany
Lim
ited
232A
nnua
l Rep
ort
2019
Notes to the Financial Statements
50 PRINCIPAL JOINT VENTURES
As at 30 June 2019
Registered/ fully paid capital
Attributable interestΩ
to the Group Principal activities(%)
Equity joint ventures
Incorporated and operate in the PRC
China United International Rail Containers Co., Limited
RMB4,200,000,000 18 Operation of rail container terminals and related business
Chongqing Suyu Business Development Company Limited
RMB650,000,000 30 Investment holding
Guangzhou Oriental Power Co., Ltd. RMB990,000,000 15 Generation and supply of electricity
Guangzhou Pearl River Electric Power Fuel Co., Ltd. RMB613,361,800 21 Wholesale, assembling and storage of fuel
Guodian Chengdu Jintang Power Generation Co., Ltd.
RMB924,000,000 21 Generation and supply of electricity
Co-operative joint ventures
Incorporated and operate in the PRC
Beijing Chong Wen • New World Properties Development Co., Ltd.
US$225,400,000 70 s Property investment, development and hotel operation
Beijing-Zhuhai Expressway Guangzhou — Zhuhai Section Company Limited
RMB580,000,000 15 Operation of toll road
Beijing Xin Kang Real Estate Development Co., Ltd. US$12,000,000 70 s Property investmentBeijing Xin Lian Hotel Co., Ltd. US$12,000,000 55 s Hotel operationChina New World Electronics Ltd. US$57,200,000 70 s Property investment and
developmentGuangzhou Northring Freeway Company Limited US$19,255,000 40 s Operation of toll roadHuizhou City Huixin Expressway Company Limited RMB34,400,000 31 Investment holdingHuizhou New World Housing Development Limited RMB80,000,000 62 s Property developmentTianjin Xinzhan Expressway Company Limited RMB2,539,100,000 37 @s Operation of toll roadWuhan Wuxin Hotel Co., Ltd. US$49,750,000 60 s Hotel operation
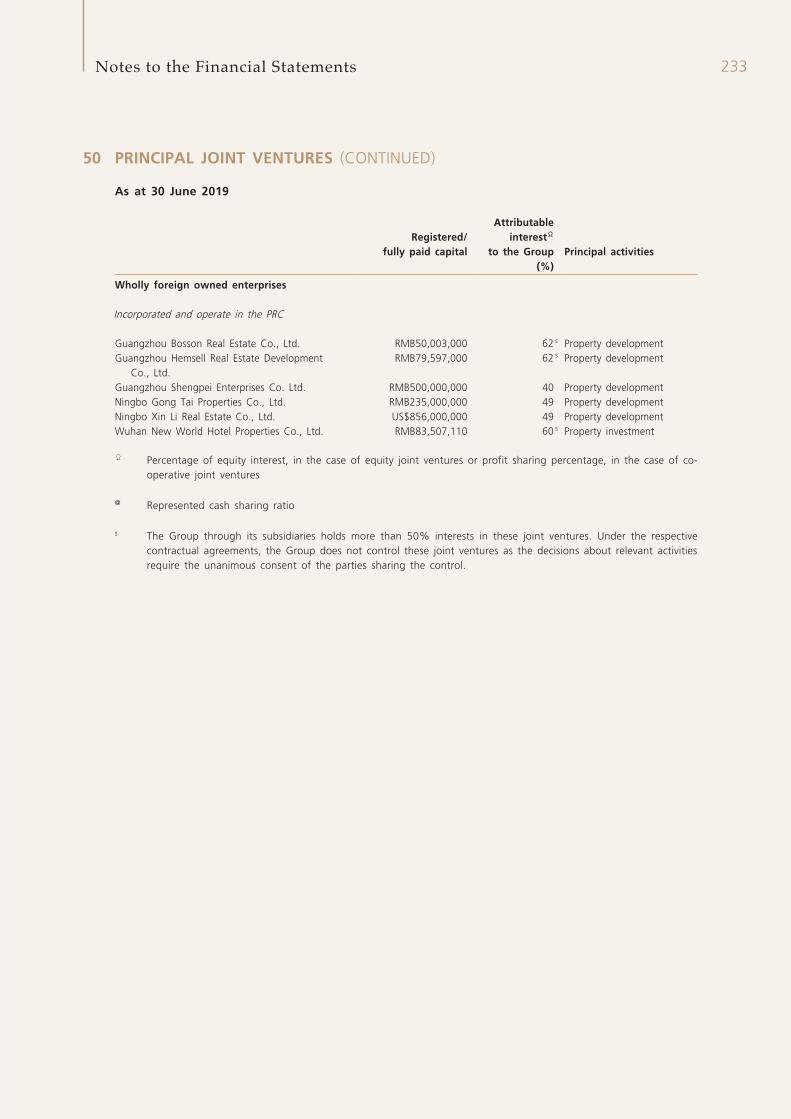
233Notes to the Financial Statements
50 PRINCIPAL JOINT VENTURES (CONTINUED)
As at 30 June 2019
Registered/ fully paid capital
Attributable interestΩ
to the Group Principal activities(%)
Wholly foreign owned enterprises
Incorporated and operate in the PRC
Guangzhou Bosson Real Estate Co., Ltd. RMB50,003,000 62 s Property developmentGuangzhou Hemsell Real Estate Development
Co., Ltd.RMB79,597,000 62 s Property development
Guangzhou Shengpei Enterprises Co. Ltd. RMB500,000,000 40 Property developmentNingbo Gong Tai Properties Co., Ltd. RMB235,000,000 49 Property developmentNingbo Xin Li Real Estate Co., Ltd. US$856,000,000 49 Property developmentWuhan New World Hotel Properties Co., Ltd. RMB83,507,110 60 s Property investment
Ω Percentage of equity interest, in the case of equity joint ventures or profit sharing percentage, in the case of co-operative joint ventures
@ Represented cash sharing ratio
s The Group through its subsidiaries holds more than 50% interests in these joint ventures. Under the respective contractual agreements, the Group does not control these joint ventures as the decisions about relevant activities require the unanimous consent of the parties sharing the control.
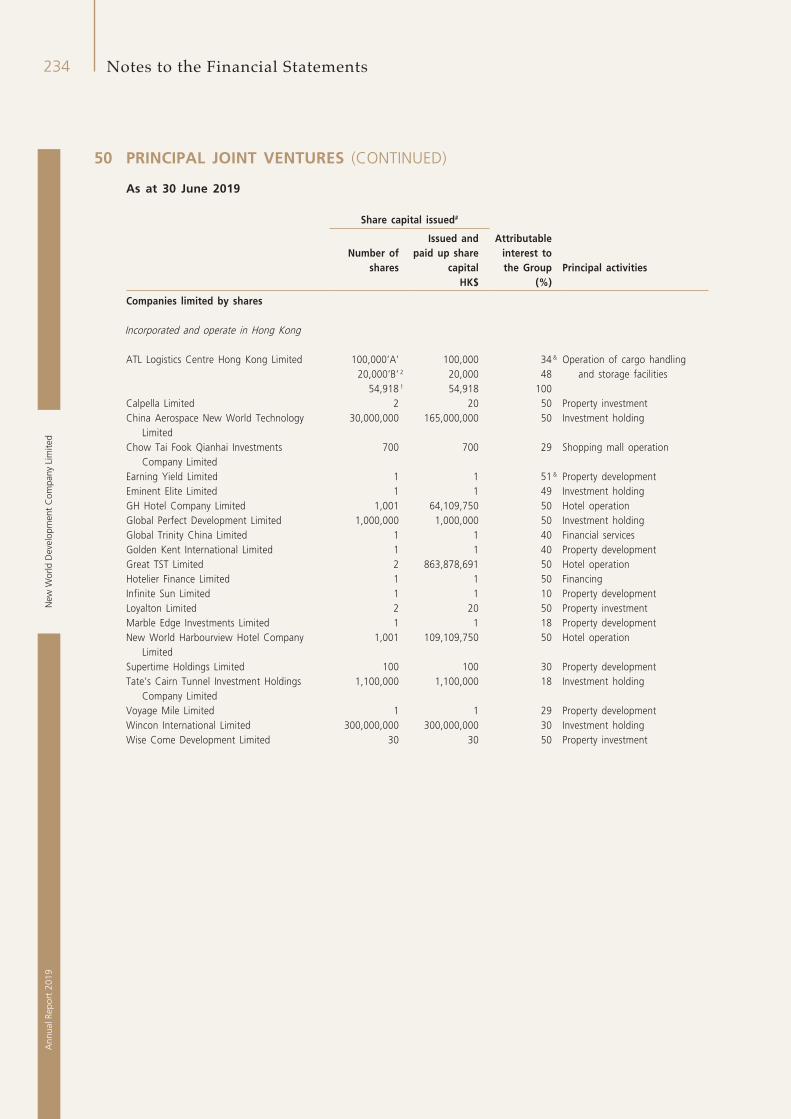
New
Wor
ld D
evel
opm
ent
Com
pany
Lim
ited
234A
nnua
l Rep
ort
2019
Notes to the Financial Statements
50 PRINCIPAL JOINT VENTURES (CONTINUED)
As at 30 June 2019
Share capital issued#
Attributable interest to the Group
Number of shares
Issued and paid up share
capital Principal activitiesHK$ (%)
Companies limited by shares
Incorporated and operate in Hong Kong
ATL Logistics Centre Hong Kong Limited 100,000’A’20,000’B’ 2
100,00020,000
34 &
48Operation of cargo handling
and storage facilities54,918 1 54,918 100
Calpella Limited 2 20 50 Property investmentChina Aerospace New World Technology
Limited30,000,000 165,000,000 50 Investment holding
Chow Tai Fook Qianhai Investments Company Limited
700 700 29 Shopping mall operation
Earning Yield Limited 1 1 51 & Property developmentEminent Elite Limited 1 1 49 Investment holdingGH Hotel Company Limited 1,001 64,109,750 50 Hotel operationGlobal Perfect Development Limited 1,000,000 1,000,000 50 Investment holdingGlobal Trinity China Limited 1 1 40 Financial servicesGolden Kent International Limited 1 1 40 Property developmentGreat TST Limited 2 863,878,691 50 Hotel operationHotelier Finance Limited 1 1 50 FinancingInfinite Sun Limited 1 1 10 Property developmentLoyalton Limited 2 20 50 Property investmentMarble Edge Investments Limited 1 1 18 Property developmentNew World Harbourview Hotel Company
Limited1,001 109,109,750 50 Hotel operation
Supertime Holdings Limited 100 100 30 Property developmentTate’s Cairn Tunnel Investment Holdings
Company Limited1,100,000 1,100,000 18 Investment holding
Voyage Mile Limited 1 1 29 Property developmentWincon International Limited 300,000,000 300,000,000 30 Investment holdingWise Come Development Limited 30 30 50 Property investment
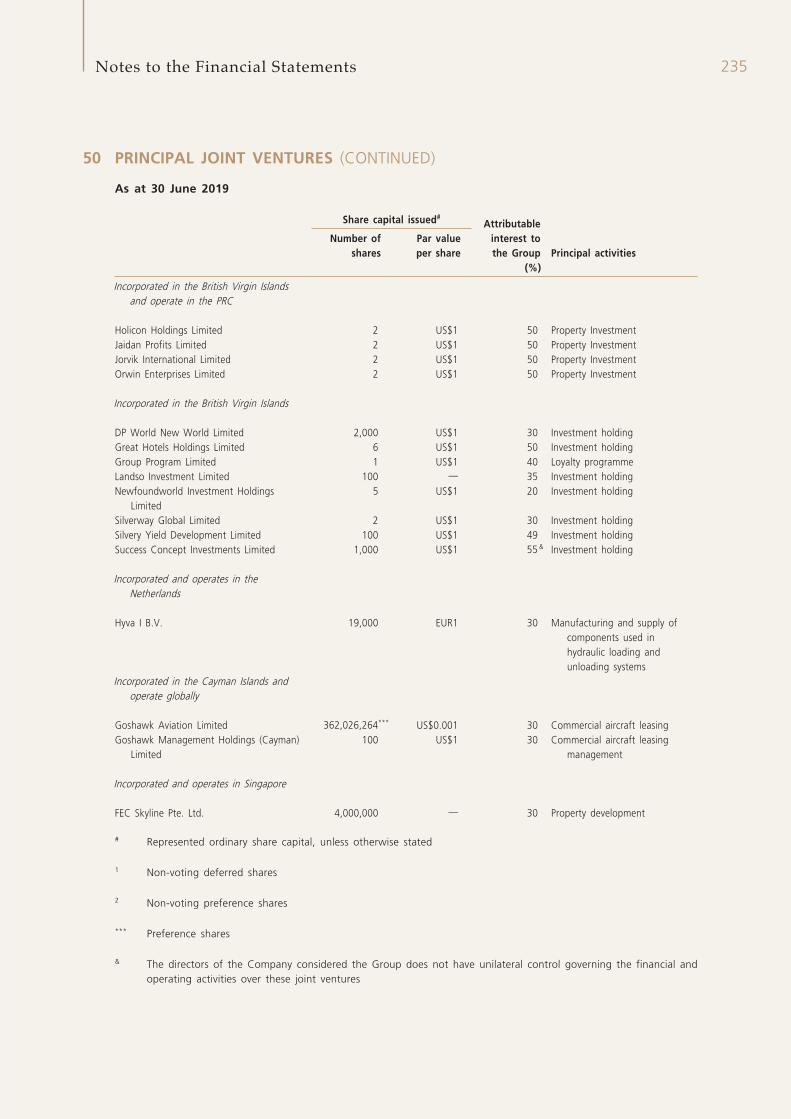
235Notes to the Financial Statements
50 PRINCIPAL JOINT VENTURES (CONTINUED)
As at 30 June 2019
Share capital issued#Attributable
interest to the Group
Number of shares
Par value per share Principal activities
(%)
Incorporated in the British Virgin Islands and operate in the PRC
Holicon Holdings Limited 2 US$1 50 Property InvestmentJaidan Profits Limited 2 US$1 50 Property InvestmentJorvik International Limited 2 US$1 50 Property InvestmentOrwin Enterprises Limited 2 US$1 50 Property Investment
Incorporated in the British Virgin Islands
DP World New World Limited 2,000 US$1 30 Investment holdingGreat Hotels Holdings Limited 6 US$1 50 Investment holdingGroup Program Limited 1 US$1 40 Loyalty programmeLandso Investment Limited 100 — 35 Investment holdingNewfoundworld Investment Holdings
Limited5 US$1 20 Investment holding
Silverway Global Limited 2 US$1 30 Investment holdingSilvery Yield Development Limited 100 US$1 49 Investment holdingSuccess Concept Investments Limited 1,000 US$1 55 & Investment holding
Incorporated and operates in the Netherlands
Hyva I B.V. 19,000 EUR1 30 Manufacturing and supply of components used in hydraulic loading and unloading systems
Incorporated in the Cayman Islands and operate globally
Goshawk Aviation Limited 362,026,264*** US$0.001 30 Commercial aircraft leasingGoshawk Management Holdings (Cayman)
Limited100 US$1 30 Commercial aircraft leasing
management
Incorporated and operates in Singapore
FEC Skyline Pte. Ltd. 4,000,000 — 30 Property development
# Represented ordinary share capital, unless otherwise stated
1 Non-voting deferred shares
2 Non-voting preference shares
*** Preference shares
& The directors of the Company considered the Group does not have unilateral control governing the financial and operating activities over these joint ventures
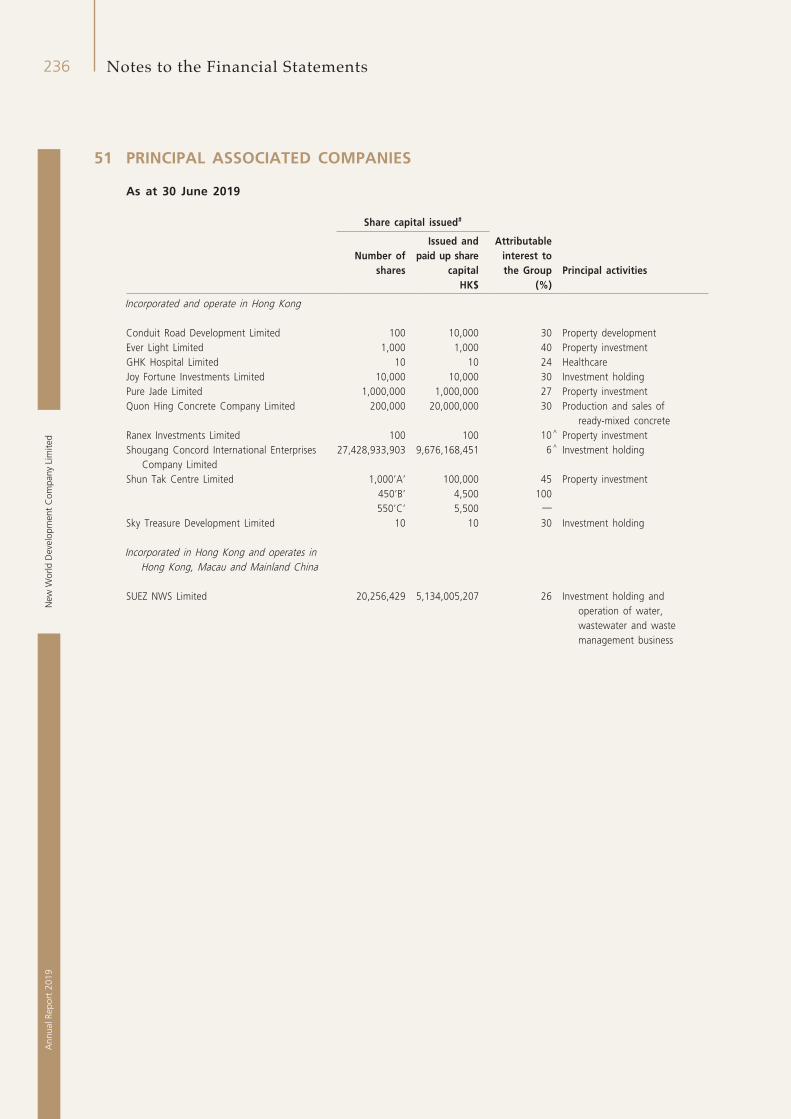
New
Wor
ld D
evel
opm
ent
Com
pany
Lim
ited
236A
nnua
l Rep
ort
2019
Notes to the Financial Statements
51 PRINCIPAL ASSOCIATED COMPANIES
As at 30 June 2019
Share capital issued#
Attributable interest to the Group
Number of shares
Issued and paid up share
capital Principal activitiesHK$ (%)
Incorporated and operate in Hong Kong
Conduit Road Development Limited 100 10,000 30 Property developmentEver Light Limited 1,000 1,000 40 Property investmentGHK Hospital Limited 10 10 24 HealthcareJoy Fortune Investments Limited 10,000 10,000 30 Investment holdingPure Jade Limited 1,000,000 1,000,000 27 Property investmentQuon Hing Concrete Company Limited 200,000 20,000,000 30 Production and sales of
ready-mixed concreteRanex Investments Limited 100 100 10 ̂ Property investmentShougang Concord International Enterprises
Company Limited27,428,933,903 9,676,168,451 6 ̂ Investment holding
Shun Tak Centre Limited 1,000’A’ 100,000 45 Property investment450’B’ 4,500 100550’C’ 5,500 —
Sky Treasure Development Limited 10 10 30 Investment holding
Incorporated in Hong Kong and operates in Hong Kong, Macau and Mainland China
SUEZ NWS Limited 20,256,429 5,134,005,207 26 Investment holding and operation of water, wastewater and waste management business
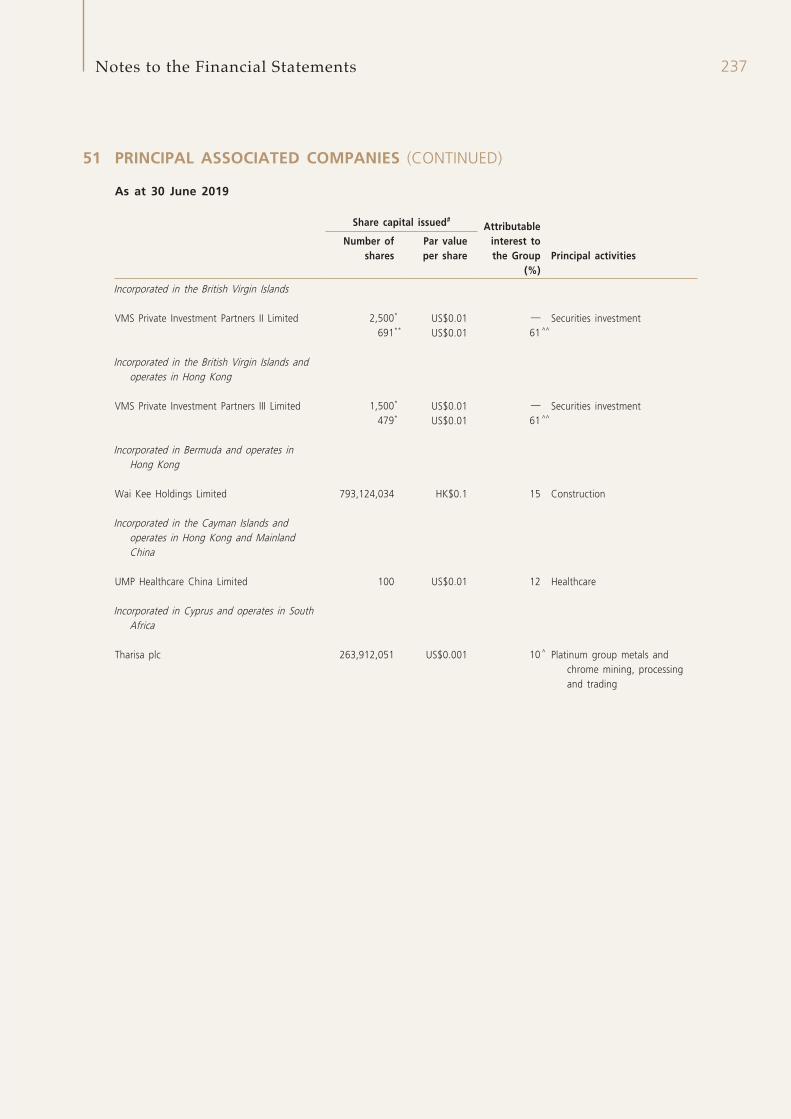
237Notes to the Financial Statements
51 PRINCIPAL ASSOCIATED COMPANIES (CONTINUED)
As at 30 June 2019
Share capital issued#Attributable
interest to the Group
Number of shares
Par value per share Principal activities
(%)
Incorporated in the British Virgin Islands
VMS Private Investment Partners II Limited 2,500* US$0.01 — Securities investment691** US$0.01 61 ̂ ^
Incorporated in the British Virgin Islands and operates in Hong Kong
VMS Private Investment Partners III Limited 1,500* US$0.01 — Securities investment479* US$0.01 61 ̂ ^
Incorporated in Bermuda and operates in Hong Kong
Wai Kee Holdings Limited 793,124,034 HK$0.1 15 Construction
Incorporated in the Cayman Islands and operates in Hong Kong and Mainland China
UMP Healthcare China Limited 100 US$0.01 12 Healthcare
Incorporated in Cyprus and operates in South Africa
Tharisa plc 263,912,051 US$0.001 10 ̂ Platinum group metals and chrome mining, processing and trading
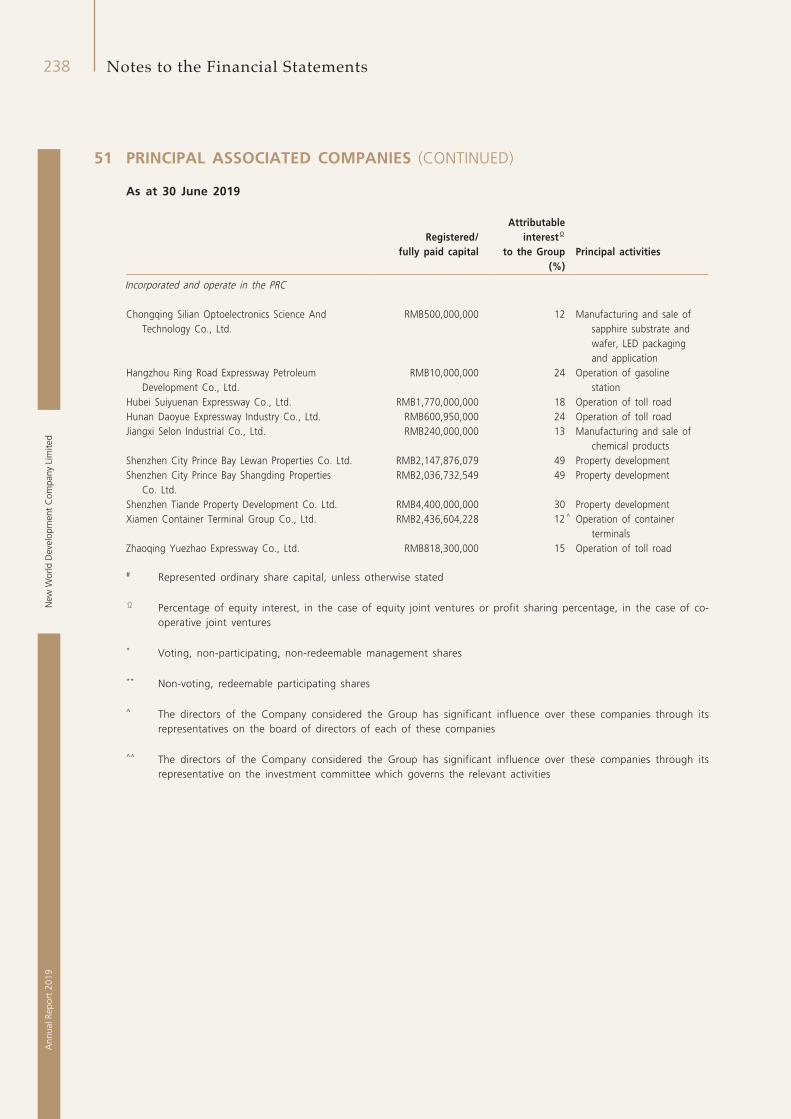
New
Wor
ld D
evel
opm
ent
Com
pany
Lim
ited
238A
nnua
l Rep
ort
2019
Notes to the Financial Statements
51 PRINCIPAL ASSOCIATED COMPANIES (CONTINUED)
As at 30 June 2019
Registered/ fully paid capital
Attributable interestΩ
to the Group Principal activities(%)
Incorporated and operate in the PRC
Chongqing Silian Optoelectronics Science And Technology Co., Ltd.
RMB500,000,000 12 Manufacturing and sale of sapphire substrate and wafer, LED packaging and application
Hangzhou Ring Road Expressway Petroleum Development Co., Ltd.
RMB10,000,000 24 Operation of gasoline station
Hubei Suiyuenan Expressway Co., Ltd. RMB1,770,000,000 18 Operation of toll roadHunan Daoyue Expressway Industry Co., Ltd. RMB600,950,000 24 Operation of toll roadJiangxi Selon Industrial Co., Ltd. RMB240,000,000 13 Manufacturing and sale of
chemical productsShenzhen City Prince Bay Lewan Properties Co. Ltd. RMB2,147,876,079 49 Property developmentShenzhen City Prince Bay Shangding Properties
Co. Ltd.RMB2,036,732,549 49 Property development
Shenzhen Tiande Property Development Co. Ltd. RMB4,400,000,000 30 Property developmentXiamen Container Terminal Group Co., Ltd. RMB2,436,604,228 12 ̂ Operation of container
terminalsZhaoqing Yuezhao Expressway Co., Ltd. RMB818,300,000 15 Operation of toll road
# Represented ordinary share capital, unless otherwise stated
Ω Percentage of equity interest, in the case of equity joint ventures or profit sharing percentage, in the case of co-operative joint ventures
* Voting, non-participating, non-redeemable management shares
** Non-voting, redeemable participating shares
^ The directors of the Company considered the Group has significant influence over these companies through its representatives on the board of directors of each of these companies
^^ The directors of the Company considered the Group has significant influence over these companies through its representative on the investment committee which governs the relevant activities
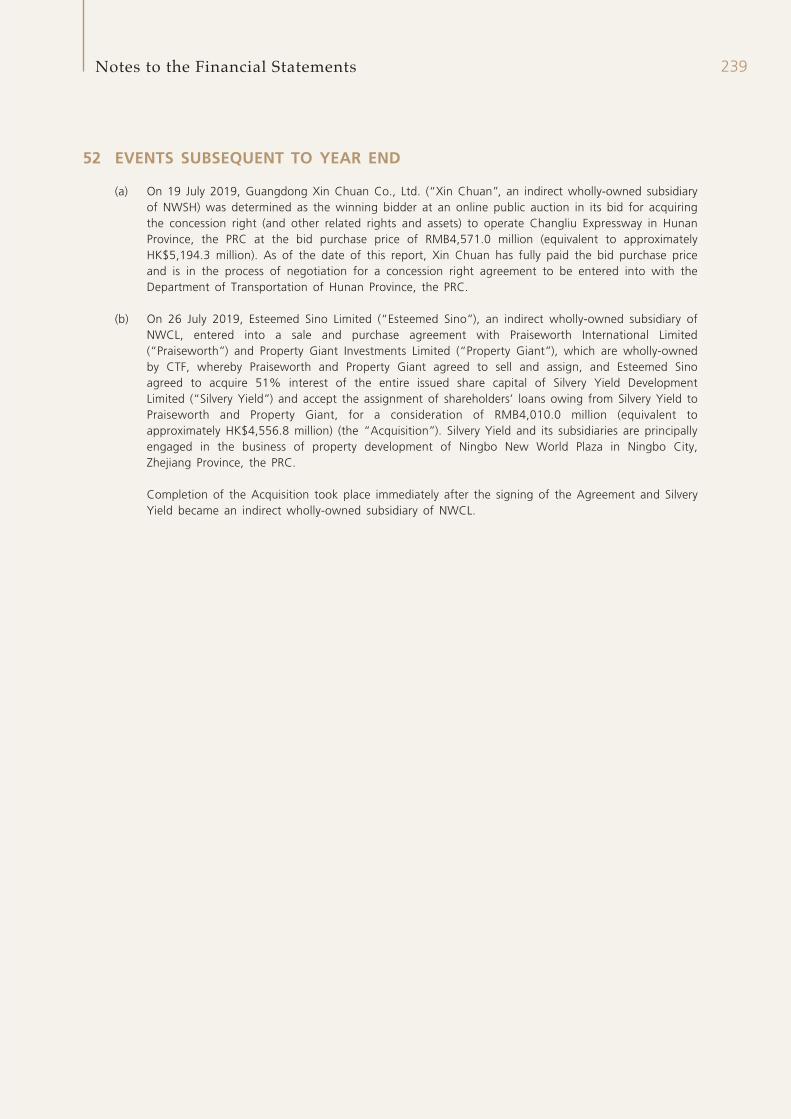
239Notes to the Financial Statements
52 EVENTS SUBSEQUENT TO YEAR END
(a) On 19 July 2019, Guangdong Xin Chuan Co., Ltd. (“Xin Chuan”, an indirect wholly-owned subsidiary of NWSH) was determined as the winning bidder at an online public auction in its bid for acquiring the concession right (and other related rights and assets) to operate Changliu Expressway in Hunan Province, the PRC at the bid purchase price of RMB4,571.0 million (equivalent to approximately HK$5,194.3 million). As of the date of this report, Xin Chuan has fully paid the bid purchase price and is in the process of negotiation for a concession right agreement to be entered into with the Department of Transportation of Hunan Province, the PRC.
(b) On 26 July 2019, Esteemed Sino Limited (“Esteemed Sino”), an indirect wholly-owned subsidiary of NWCL, entered into a sale and purchase agreement with Praiseworth International Limited (“Praiseworth”) and Property Giant Investments Limited (“Property Giant”), which are wholly-owned by CTF, whereby Praiseworth and Property Giant agreed to sell and assign, and Esteemed Sino agreed to acquire 51% interest of the entire issued share capital of Silvery Yield Development Limited (“Silvery Yield”) and accept the assignment of shareholders’ loans owing from Silvery Yield to Praiseworth and Property Giant, for a consideration of RMB4,010.0 million (equivalent to approximately HK$4,556.8 million) (the “Acquisition”). Silvery Yield and its subsidiaries are principally engaged in the business of property development of Ningbo New World Plaza in Ningbo City, Zhejiang Province, the PRC.
Completion of the Acquisition took place immediately after the signing of the Agreement and Silvery Yield became an indirect wholly-owned subsidiary of NWCL.
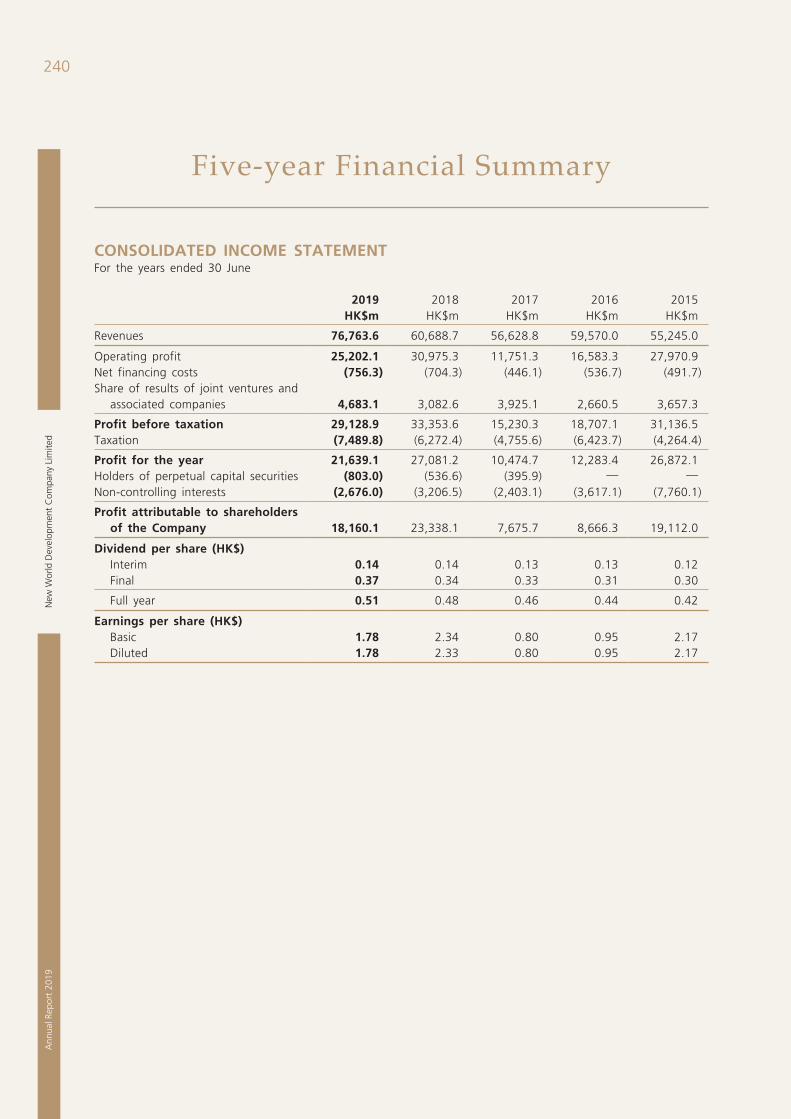
New
Wor
ld D
evel
opm
ent
Com
pany
Lim
ited
240A
nnua
l Rep
ort
2019
Five-year Financial Summary
CONSOLIDATED INCOME STATEMENTFor the years ended 30 June
2019 2018 2017 2016 2015HK$m HK$m HK$m HK$m HK$m
Revenues 76,763.6 60,688.7 56,628.8 59,570.0 55,245.0
Operating profit 25,202.1 30,975.3 11,751.3 16,583.3 27,970.9Net financing costs (756.3) (704.3) (446.1) (536.7) (491.7)Share of results of joint ventures and
associated companies 4,683.1 3,082.6 3,925.1 2,660.5 3,657.3
Profit before taxation 29,128.9 33,353.6 15,230.3 18,707.1 31,136.5Taxation (7,489.8) (6,272.4) (4,755.6) (6,423.7) (4,264.4)
Profit for the year 21,639.1 27,081.2 10,474.7 12,283.4 26,872.1Holders of perpetual capital securities (803.0) (536.6) (395.9) — —Non-controlling interests (2,676.0) (3,206.5) (2,403.1) (3,617.1) (7,760.1)
Profit attributable to shareholders of the Company 18,160.1 23,338.1 7,675.7 8,666.3 19,112.0
Dividend per share (HK$)Interim 0.14 0.14 0.13 0.13 0.12Final 0.37 0.34 0.33 0.31 0.30
Full year 0.51 0.48 0.46 0.44 0.42
Earnings per share (HK$)Basic 1.78 2.34 0.80 0.95 2.17Diluted 1.78 2.33 0.80 0.95 2.17
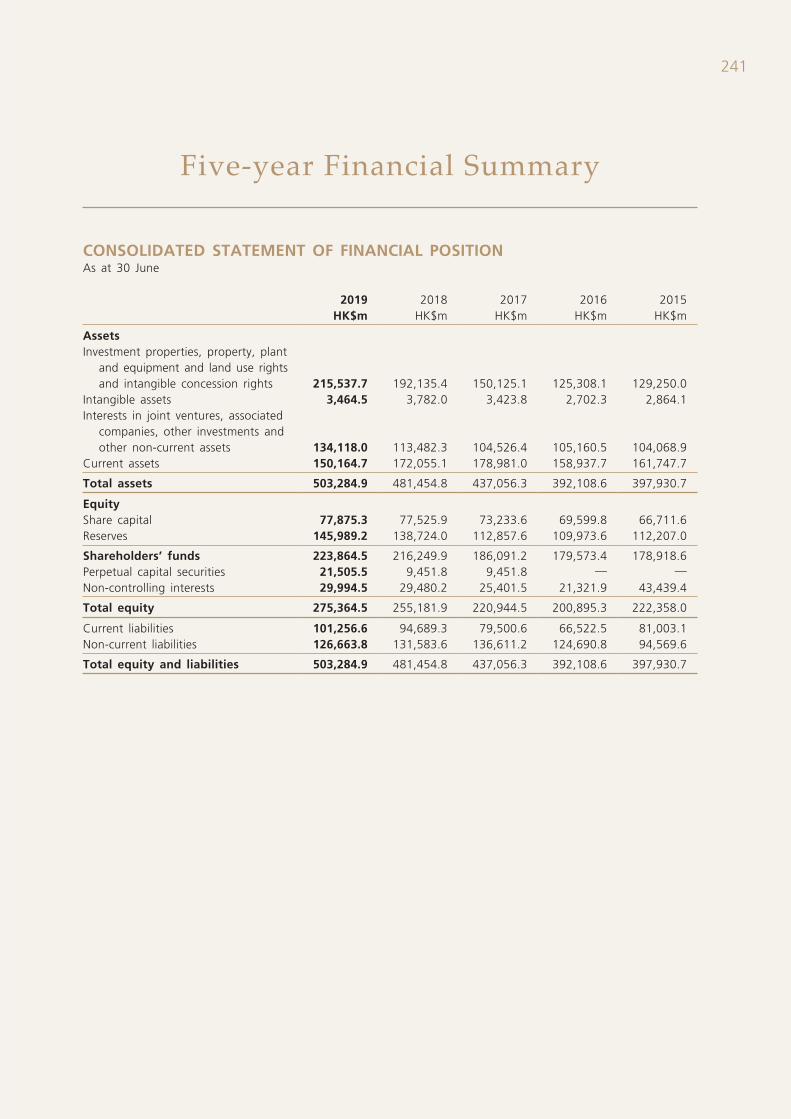
241
Five-year Financial Summary
CONSOLIDATED STATEMENT OF FINANCIAL POSITIONAs at 30 June
2019 2018 2017 2016 2015HK$m HK$m HK$m HK$m HK$m
AssetsInvestment properties, property, plant
and equipment and land use rights and intangible concession rights 215,537.7 192,135.4 150,125.1 125,308.1 129,250.0
Intangible assets 3,464.5 3,782.0 3,423.8 2,702.3 2,864.1Interests in joint ventures, associated
companies, other investments and other non-current assets 134,118.0 113,482.3 104,526.4 105,160.5 104,068.9
Current assets 150,164.7 172,055.1 178,981.0 158,937.7 161,747.7
Total assets 503,284.9 481,454.8 437,056.3 392,108.6 397,930.7
EquityShare capital 77,875.3 77,525.9 73,233.6 69,599.8 66,711.6Reserves 145,989.2 138,724.0 112,857.6 109,973.6 112,207.0
Shareholders’ funds 223,864.5 216,249.9 186,091.2 179,573.4 178,918.6Perpetual capital securities 21,505.5 9,451.8 9,451.8 — —Non-controlling interests 29,994.5 29,480.2 25,401.5 21,321.9 43,439.4
Total equity 275,364.5 255,181.9 220,944.5 200,895.3 222,358.0
Current liabilities 101,256.6 94,689.3 79,500.6 66,522.5 81,003.1Non-current liabilities 126,663.8 131,583.6 136,611.2 124,690.8 94,569.6
Total equity and liabilities 503,284.9 481,454.8 437,056.3 392,108.6 397,930.7
New
Wor
ld D
evel
opm
ent
Com
pany
Lim
ited
242A
nnua
l Rep
ort
2019
Risk Factors
The Group’s business, financial conditions, results of operations and growth prospects may be affected by risks and uncertainties directly or indirectly pertaining to the Group’s business. The risk factors set out below are those that could result in the Group’s business, financial conditions, results of operations or growth prospects differing materially from expected or historical results. Such factors are by no means exhaustive or comprehensive, and there may be other risks in addition to those shown below which are not known to the Group or which may not be material now but could turn out to be material in the future.
A RISKS RELATING TO PROPERTY DEVELOPMENT, SALES, INVESTMENTS AND HOTEL OPERATIONS
1. The Group’s projects are primarily located in Hong Kong and Mainland China. Therefore, the Group’s business and prospects are principally dependent on the performance of the property markets in Hong Kong and Mainland China. The property markets in Hong Kong and Mainland China are subject to numerous local, regional and even global factors, including changes in the social, political, economic and legal environment, as well as changes in government policies and legislations. The Group is also susceptible to changes in the property demand and supply, inflation, interest rates, consumer confidence, consumer spending and consumer preferences in such markets. Other factors beyond the control of the Group, such as the level of personal and household disposable income and conditions of the mortgage market, could also affect the market demand for properties. Any adverse changes in the demand and supply of properties, any measures adopted by the government to restrain the development of the property market or to control property prices or rental values, or further implementation of property market cooling measures or the extension of scope, application and tax rates of existing housing policies in the locations where the Group operates, could have a materially adverse effect on the business, financial conditions, operating results and growth prospects of the Group.
2. Owing to uncertainties associated with the US-China trade war, global financial and economic conditions have become volatile in recent years. In future, if the global economic growth, including that of Mainland China and Hong Kong, experiences a slowdown or decline, potential buyers and tenants of the Group’s properties could be adversely affected, which could result in a decrease in the general demand for the Group’s properties and a decline in their selling prices or rental values. If the market where the Group operates experiences capital outflow, the finance cost of the market may rise, as well as the capital cost of the Group.
3. The Group’s results of operations may fluctuate according to the progress of property development and the timing of its property sales. Revenues from sale of properties (including pre-sale) are recognised when or as the control of the asset is transferred to the customer. Revenues from sale of properties are generally recognised upon the completion of legal assignment when the customer has the ability to direct the use of the property. The Group’s revenues and results may vary from one period to another depending on the number of properties completed in a specific period, or the time and capital required for the completion of construction projects. The timing of its property sales is dependent on the lead time required for the Group to obtain the requisite government approvals, which is beyond the control of the Group.
243Risk Factors
A RISKS RELATING TO PROPERTY DEVELOPMENT, SALES, INVESTMENTS AND HOTEL OPERATIONS (CONTINUED)
4. The Group is subject to fine or sanctions if it does not pay land premiums or does not develop properties according to terms of land grant documents. If the land is repossessed, the Group will not be able to continue its property development on forfeited land, recover the costs incurred for initial acquisition of the repossessed land nor recover development cost and other costs incurred up to the date of the repossession. Any violation of the terms of land grant contracts may restrict or prevent a developer in participating in future land bidding opportunities.
5. The property sectors in Hong Kong and Mainland China are subject to the regulations of their respective governments. In general, developers are required to comply with requirements mandated by applicable laws and regulations, including policies and procedures established by local governments for the implementation thereof. In Mainland China, different provinces, cities and districts may have different applications or interpretations of laws, regulations and policies, and sufficient notice may not be given in respect of such laws, regulations and policies prior to their promulgation owing to evolving economic and other conditions. Hence the Group may not be aware of individual or newly promulgated laws, regulations and policies, or may even violate such regulations, and its operations may be affected as a result. In addition, developers are also required to obtain relevant permits, licenses, certificates and other approvals at various stages during the course of property development. The grant of relevant permits, licenses, certificates and other approvals is dependent on whether the developers and their projects have fulfilled certain conditions set out by the pertinent authorities, and is often subject to the discretion of pertinent government authorities as well as new laws or regulations and policy changes.
6. The Group cannot assure that it will not encounter impediments in fulfilling the conditions or meeting the particular process requirements in order to obtain the required approvals, or will acquire occupation of the land parcels, in relation to its property development project, or can perform its obligations under the land grant contract including the commencement and completion of the development in future. There can be no assurance that the Group’s business will be in compliance with new laws, regulations or policies which come into effect from time to time relating to the particular process related to the granting of the approvals or generally applicable to the overall real estate sector. When the Group fails to obtain the relevant approvals, fulfill the conditions or acquire the land parcels, the relevant projects may not proceed as scheduled or at all.
New
Wor
ld D
evel
opm
ent
Com
pany
Lim
ited
244A
nnua
l Rep
ort
2019
Risk Factors
A RISKS RELATING TO PROPERTY DEVELOPMENT, SALES, INVESTMENTS AND HOTEL OPERATIONS (CONTINUED)
7. The Group is principally engaged in property development and investment. The political and economic environment, land demand and supply conditions, policies, regulatory requirements and restrictions in Mainland China, Hong Kong and other overseas markets could affect the Group’s ability to increase its landbank in such markets and thereby restrain the sustainable growth of its business. Currently, land supply is tight in certain regions, where there is increasingly intense competition for premium land sites among developers, resulting in rising land premiums and increase in land acquisition costs. In the Mainland China and Hong Kong markets, the Group has increased its landbank at relatively reasonable prices through public tenders and auctions by the government, joint project development or acquisition of land use rights by forming joint ventures or associated companies with third parties, redevelopment, renewal or conversion of old buildings, old villages and old cities, and conversion of agricultural land parcels. However, the conversion of agricultural land parcels into residential or commercial uses for some development sites in Hong Kong requires approvals from various government authorities that could be lengthy and complicated and are subject to government policies and the efficiency of approval, and thereby affecting the increase in land reserve directly. The Group cannot assure that such land use conversion will be materialised and that it could accurately anticipate the timeframe and land use of such conversion. If the Group is unable to obtain land use rights on favourable or desirable terms or is unable to acquire additional land reserve at all, there could be a materially adverse effect on its business, financial conditions, operating results and growth prospects.
8. The majority of land use rights in Mainland China and Hong Kong are leased by way of deed or otherwise granted by local governments. Such land deeds are subject to tenures, and the Group is, for the time being, not able to confirm the amount of fees to be paid and conditions to be fulfilled upon the renewal of such land deeds, or even to assure such land use rights can be renewed at all. If the Group is not able to settle any fees payable or meet the conditions for renewal in connection with the relevant land sites, local governments might reject the extension of such land deeds and confiscate the land sites concerned, and the Group’s business, operating results and growth prospects could be adversely affected as a result.
9. A portion of the Group’s revenues is derived from its hotel operations. Since hotel guests are short-term occupants of hotel rooms, they are generally not committed to contracts of medium-term or long-term rental payment. Consequently, a hotel’s occupancy rate and room rate are subject to a high degree of fluctuations due to factors including seasonality, social stability, politics, natural hazards, disease and economic condition as well as the nature of hotel business. In addition, a portion of the Group’s revenues from hotel operations is attributable to catering services, including banqueting services. Typically, demand for banqueting services increases on holidays, festivals and the propitious dates on the Chinese lunar calendar. Although corresponding measures have been taken to cope with the seasonal fluctuations of the hotel business, such measures may be ineffective. Therefore, any comparison of our results of operations between various interims in a financial year may not be meaningful and shall not be relied upon as an indicator for the Group’s performance.
245Risk Factors
A RISKS RELATING TO PROPERTY DEVELOPMENT, SALES, INVESTMENTS AND HOTEL OPERATIONS (CONTINUED)
10. The Group is affected by different factors such as external economic and market conditions, including but not limited to local economic conditions, volatility in overall demand and supply, changes in consumption behaviour, stock market performance and financial turmoil, which will in turn affect the performance of the Group’s investment properties indirectly. The Group’s rental income may be subject to frequent adjustments as a result of competition caused by oversupply of retail and office spaces. The Group’s properties held for leasing may need to be renovated, repaired and re-let on a periodic basis, and the Group may not be able to renew existing leases upon their expiry on existing or desirable terms or enter into new leases, or it may not even be able to renew or re-let the property at all. If a tenant experiences financial problems or goes into insolvency or even bankruptcy, the Group may have to demand payments through legal procedures and may experience delays in the receipt of rental payments, or it may not be able to receive any rental payment at all, resulting in an adverse effect on the Group’s business, operating results and growth prospects. In general, property investment are considered as non-current assets, which may limit the Group’s ability to monetise the property assets in a timely manner.
11. A significant amount of fixed costs are involved in operating investment properties and hotels of the Group, including maintenance costs as well as employees, staff salaries and expenses. These fixed costs may constrain the Group’s ability to respond to adverse market conditions by minimising costs. Where property leasing or hotel industry experiences downturns, or the number of maintenance or renovation increases, such costs may adversely affect the Group’s business, financial conditions, operating results and growth prospects.
New
Wor
ld D
evel
opm
ent
Com
pany
Lim
ited
246A
nnua
l Rep
ort
2019
Risk Factors
A RISKS RELATING TO PROPERTY DEVELOPMENT, SALES, INVESTMENTS AND HOTEL OPERATIONS (CONTINUED)
12. The growth of global online travel or hotel platforms has created opportunities for hotel operators or asset owners in terms of tapping into new clients and promotion in new markets. However, the abovementioned new trends may increase the cost of agency commissions and the rising competition for customer loyalty. Also, it may limit the growth potential of room rate due to keen competition among those platforms, potential risk of last-minute order change and high accessibility of information of customers, such situations may adversely affect the Group’s hotel contribution and results of operations.
13. Substantially all of the Group’s business operations are in Mainland China and substantially all of our revenues are derived from its operations in Mainland China. Accordingly, the Group results of operations and prospects are, to a significant degree, subject to economic, political and legal developments in Mainland China. The economy of Mainland China differs from the economies of most developed countries in many respects, including the extent of government involvement, its level of development, its growth rate and its control over foreign exchange. Mainland China’s economy has been transitioning from a planned economy to a more market-oriented economy. In recent years, the Central Government has implemented measures emphasising market forces for economic reform, the reduction of the state ownership of productive assets and the establishment of sound corporate governance in business enterprises. However, a portion of productive assets in Mainland China is still owned by the Central Government. The Central Government continues to play a significant role in regulating the development of industries. It also exercises significant control over Mainland China’s economic growth through the allocation of resources, controlling payment of foreign currency-denominated obligations, setting monetary policies and providing preferential treatments to particular industries or companies. All of these factors could affect the economic conditions in Mainland China and, in turn, the Group’s business. While the Chinese economy has experienced significant growth in the past 20 years, growth has been uneven across both geographic regions and the various sectors of the economy, growth rates have begun to stabilised recently. The Group cannot predict whether its results of operations and financial conditions could be materially and adversely affected by changes in economic conditions in Mainland China, or the monetary policies, interest rate policies, tax regulations or policies and regulations of the Central Government.
14. A significant portion of the Group’s property development operations is concentrated in Guangdong-Hong Kong-Macao Bay Area. The Group expects that Guangdong-Hong Kong-Macao Bay Area will still continue to account for a significant portion of our property development operations in the near future. If the Guangdong-Hong Kong-Macao Bay Area experiences any adverse economic conditions, such as an economic downturn, natural disaster, contagious disease outbreak or terrorist attack, or if the local governmental authorities adopt regulations that place additional restrictions or burdens on the Group or on the property industry in general, our business, financial conditions and results of operations could be materially and adversely affected.
247Risk Factors
A RISKS RELATING TO PROPERTY DEVELOPMENT, SALES, INVESTMENTS AND HOTEL OPERATIONS (CONTINUED)
15. The rapid economic growth and infrastructure development in Hong Kong and Mainland China in recent years have uplifted the costs of construction materials and wages of workers. In addition, in view of the improvement of general living standards in Hong Kong and Mainland China and recent policies of the Central Government to increase the wages of workers from rural areas, the Group expects that labour costs may continue to increase in the foreseeable future. Other than the higher labour costs, the rising labour demand and in turn more intensified competition for construction workers in regions where the Group operates, such as the growing shortage of construction and service workers in Hong Kong, has made it increasingly difficult for the Group to hire sufficient well-skilled labour for its property development projects and investment properties, hindering its property development business. Increasing cost of construction materials and labour are expected to raise contractors’ fee quotes in our new property development projects. In addition, the Group usually commences pre-sales of properties prior to their completion. In the event that the construction materials and labour costs surge subsequent to the pre-sales, such increases in costs may not be passed on to buyers of the properties. Escalating labour shortage and/or significant increase in costs of labour or construction materials without corresponding reduction of other costs to offset such increases or pass on such increases to the buyers or tenants of our properties may adversely and materially affect the Group’s business, financial conditions, results of operations and growth prospects.
16. The development and sale of and investment in property projects involve multiple stakeholders, including contractors, suppliers, employees, customers, business partners or other third parties. The Group cannot assure that there would be no disagreements or even legal or other disputes with such stakeholders, which could undermine the Group’s reputation, give rise to additional or compensation cost, and cause delays in the development, sales or completion of projects, resulting in an adverse effect on the Group’s business, operating results and growth prospects.
17. The Group’s business and operating results depend to a considerable extent on whether the Group is able to develop and supply premium projects and services that meet the demands of customers. If the Group is not able to accurately predict or anticipate customers’ preferences or demands, the Group’s operating results could be affected. If the Group’s projects or service quality could not meet the required standard or experience any problems, the Group may need to adopt relevant remedial measures at additional expenses, and may suffer disrepute and be subject to claims or legal actions by relevant stakeholders, or the imposition of fines, damages and litigation costs, and the business, operating results and growth prospects of the Group could be adversely affected as a result.
New
Wor
ld D
evel
opm
ent
Com
pany
Lim
ited
248A
nnua
l Rep
ort
2019
Risk Factors
B RISKS RELATING TO FINANCIAL CONDITIONS AND RESULTS OF OPERATIONS
1. The following factors may lower the level of turnover and profit of the Group, while the Group cannot guarantee that the turnover and profit level will be sustained or improved. The Group may not be able to sustain similar patterns or levels of turnover or profit in the future:
I. change in the mix of turnover contributions, such as income from sales of property, rental income from property investment and income from hotels;
II. new market entrants and intensified price competition among existing market players;
III. unfavourable government policies affecting consumer sentiments;
IV. failure to achieve target sales volumes and prices;
V. failure to achieve target rentals, daily room rates and occupancy rates;
VI. decrease in the fair value of investment properties;
VII. the Group’s costs may not decrease in tandem with a reduction in turnover to be derived from properties, as most of the expenses associated with owning and maintaining the Group’s properties are fairly fixed (including land cost, development cost, administration cost, and selling and distribution marketing cost); and
VIII. failure to negotiate volume discounts with suppliers on favourable terms.
2. The Group’s finance costs and interest expenses fluctuate with changes in interest rates. In Hong Kong, the Group’s borrowings include amounts denominated in Hong Kong dollar. The interest rates on some of our outstanding Hong Kong dollar denominated borrowings are benchmarked to the Hong Kong interbank offered rates (“HIBOR”) for Hong Kong dollar. We cannot assure that the benchmark interest rate will not increase in the future, which would increase our finance costs and interest expenses. In Mainland China, the Group’s borrowings also include amounts denominated in RMB. The People’s Bank of China adjusts its benchmark lending rates from time to time in response to domestic and global economic changes. The Group cannot guarantee that the People’s Bank of China will not raise such lending rates in future. In addition, as the Group also borrows from overseas banks and other financial institutions, the availability of sufficient capital in the capital market directly affects the cost of borrowing in relation to the currencies the Group borrows. The Group may also be affected by changes in the prevailing interest rate of the global credit market. Any increase in interest rate in connection with the currencies the Group borrows will increase the Group’s finance costs and customers’ mortgage interest rates and may adversely and materially affect the Group’s business, financial conditions, results of operations and growth prospects.
249Risk Factors
B RISKS RELATING TO FINANCIAL CONDITIONS AND RESULTS OF OPERATIONS (CONTINUED)
3. Fluctuations in the Group’s results of operations may also be induced by other factors, including changes in market demand for the Group’s properties. In addition, the periodicity of the property market also has an impact on the optimal timing for land acquisition as well as the planning of development and sales of properties. As results of operations in relation to property development activities are susceptible to significant fluctuations, comparison of the Group’s results of operations and cash flow position among periods may not be an effective indicator of the Group’s financial performance in any particular period.
4. The Group is required to reassess the fair value of its investment properties at every balance sheet date to which financial statements are made up. Pursuant to HKFRS, investment properties are stated at their fair value, and the variation in their changes should be taken to the consolidated income statement of the financial period in which it is incurred. Based on the appraisal conducted by independent property valuers, the Group recognises the aggregate market value of investment properties at fair value and the related deferred tax in the consolidated statement of financial position, while the variation in changes in fair value and the related deferred tax of investment properties are recognised in the consolidated income statement. Therefore, the assumptions made in appraising investment properties would change under changing market conditions, including lower weighted average capital ratio. Notwithstanding variations in fair value gains and losses, they are not cash items and will not increase or decrease cash and cash equivalent. The amount of revaluation adjustment has been and will continually be subject to changes in market conditions. As such, there can be no assurance that changes in market conditions will continue to generate gains from fair value changes in investment properties at similar level or at all, or there will be no decline in the fair value of the Group’s investment properties. Changes in fair value of investment properties are recognised in the income statement, any significant change in investment properties value may overwhelmingly affect the Group’s results, which may not be able to reflect the Group’s operation and cash flow performance. If the property market in the region where the Group operates slows down, the fair value of the Group’s investment properties may decline.
5. Properties developed by the Group for sales in Mainland China are subject to Land Appreciation Tax (“LAT”). Pursuant to Mainland China relevant tax laws and regulations, prior to the fulfillment of the conditions on the settlement of LAT, the Group makes provisions for the payable amount of LAT from time to time. Provisions for LAT are made on the Group’s own estimates based on, among other things, the amount of deductible items before taxation which is subject to final confirmation by the relevant tax authorities upon settlement of LAT. At the same time, the Group prepays a portion of such provisions to Mainland China tax authorities according to relevant regulations. The Group cannot assure that the relevant tax authorities in Mainland China will agree with the amount of LAT determined by the Group. If the relevant tax authorities determine that its LAT exceed the LAT prepayments and provisions, and seek to collect that excess amount, the Group’s cash flow, results of operations and financial position may be adversely affected. As there are uncertainties as to whether Mainland China tax authorities will apply the LAT collection retrospectively to properties sold before the enforcement of LAT, any payment as a result of the enforcement of LAT collection may significantly restrict the Group’s cash flow position, its ability to finance its land acquisitions and to execute its business plans.
New
Wor
ld D
evel
opm
ent
Com
pany
Lim
ited
250A
nnua
l Rep
ort
2019
Risk Factors
B RISKS RELATING TO FINANCIAL CONDITIONS AND RESULTS OF OPERATIONS (CONTINUED)
6. The results of the Group are presented in Hong Kong dollar, but its various subsidiaries, associated companies and joint ventures may receive turnover and incur expenses in other currencies. Any currency fluctuations on translation of the accounts of these subsidiaries, joint ventures and associated companies and also on the repatriation of earnings, equity investments and loans may therefore impact the Group’s business. Exchange rate of Hong Kong dollar against RMB, the USD or other foreign currencies is affected by, among other things, changes in the political and economic environment of the issuing jurisdictions of the currencies. The exchange rate of RMB against Hong Kong dollar, the USD or other currencies may be re-valued, and may be permitted to enter a full or limited free float. Such situation may result in appreciation or depreciation in RMB against Hong Kong dollar, the USD or other foreign currencies. Continual fluctuations in the exchange rate of the Hong Kong dollar against RMB or other currencies may materially and adversely affect the Group’s business, financial conditions, results of operations and growth prospects.
7. In April 2013, State Administration of Foreign Exchange (“SAFE”) issued the Operation Guidelines for the Administration of Foreign Debt (the “Guidelines”), which became effective on 13 May 2013. The Guidelines stipulate that, amongst other things, (i) with respect to real estate enterprises with foreign investment who obtained approval certificates from commercial authorities and registered with the Ministry of Commerce on or after 1 June 2007, the branches of SAFE will no longer process the foreign debt registrations for such enterprises, (ii) with respect to real estate enterprises with foreign investment established prior to 1 June 2007, such enterprises may borrow foreign debt in accordance with the relevant provisions in the Guidelines, but the amount of foreign debt shall not exceed the surplus between the enterprise’s total investment amount and its registered capital (the “Surplus”); in the event that the enterprise increases its registered capital, and the Surplus after the increase of registered capital is less than the Surplus before the increase of registered capital, then the amount of foreign debt of such enterprise shall not exceed the Surplus after the increase of registered capital, and (iii) in the event that the registered capital of a real estate enterprise with foreign investment is not paid in full, or such real estate enterprise with foreign investment does not obtain State-owned land use right certificate(s), or the capital for real estate projects to be developed is less than 35% of the total investment amount of such projects, such real estate enterprise with foreign investment is prohibited from borrowing foreign debt, and the branches of SAFE will not process the foreign debt registrations for such enterprises. The Guidelines therefore restrict the ability of the Group’s subsidiaries in Mainland China that are real estate enterprises with foreign investment to raise funds offshore for the purpose of injecting such funds into the enterprises by way of shareholder loans. The Group cannot assure that the Central Government will not issue any new policy that will further restrict the ability of the Group in allocating its funds in Mainland China.
251Risk Factors
B RISKS RELATING TO FINANCIAL CONDITIONS AND RESULTS OF OPERATIONS (CONTINUED)
8. The Group maintains a certain level of indebtedness to finance its operation. The Group’s indebtedness could have an adverse effect on it, for example, by:
I. requiring the Group to maintain certain financial ratios;
II. requiring the Group to dedicate a large portion of its cash flow to repay interest and debt, thereby reducing the availability of its cash flow to expand its business;
III. increasing the Group’s vulnerability to adverse economic or industry conditions;
IV. limiting the Group’s flexibility in planning or responding to the changes in its business or the industry in which it operates;
V. limiting the Group’s ability to raise additional debt or equity capital in the future or increasing the cost of such funding;
VI. restricting the Group from making strategic acquisitions or taking advantage of business opportunities;
VII. increasing the difficulty of the Group to meet its obligations in relation to its debt; and
VIII. increasing the cost of borrowings of the Group.
9. The Group is principally engaged in property development business. As such business operation requires substantial capital input, the Group will still need to obtain financing from financial institutions. When the credit market contracts or tightens, the Group cannot assure that there will be sufficient borrowings or that it can refinance. During the period of property development and property construction, the risks that the Group faces also include financing for developments which may not be available on favorable terms and the unavailability of long-term financing. Its business development will be adversely affected to a certain extent.
10. In the future, the Group may from time to time incur other substantial indebtedness, intensifying the risks induced by its indebtedness. The Group’s ability to generate sufficient cash to satisfy its outstanding and future debt obligations will depend on the Group’s operating performance in future, which will be affected by, among other things, the prevailing economic conditions, governmental regulations, the demand for properties in the region where the Group’s business operates and other factors, many of which are beyond the Group’s control. The Group may not generate sufficient cash flow to pay its anticipated operating expenses and to service its debts. In this case, the Group will have to adopt an alternative strategies that may include actions such as reducing or delaying capital expenditures, disposing of the Group’s assets, debt restructuring or refinancing, or seeking equity capital. These strategies may not be implemented on satisfactory terms, or at all. Even they are implemented, they may result in an adverse effect on the Group’s business, financial conditions and results of operations. In addition, if the Group fails to fulfill its payment obligations, comply with any actual covenants or required financial ratios, or breach any restrictive covenants, it may result in a default under the terms of such borrowing. If an event of default occurs, the loan borrower is entitled to request the Group to repay in full or part of its outstanding indebtedness on an accelerated basis.
New
Wor
ld D
evel
opm
ent
Com
pany
Lim
ited
252A
nnua
l Rep
ort
2019
Risk Factors
B RISKS RELATING TO FINANCIAL CONDITIONS AND RESULTS OF OPERATIONS (CONTINUED)
11. The development schedules of property projects will affect the Group’s interest expenses and recognition of income and return. The Group cannot assure that its project development schedules would not be delayed by factors beyond the Group’s control, including social unrest, changes in policies and regulations (such as the Buildings Ordinance and Environmental Ordinances), shortage of construction materials or human resources, construction incidents, labour or legal disputes, changes in building plans or overall project development planning in response to market conditions or regional development, such that its interest expenses would increase and recognition of income would be deferred or additional costs would be incurred.
12. The Hong Kong Institute of Certified Public Accountants (“HKICPA”) has issued new standards, amendments to standards and interpretations which are mandatory for accounting periods beginning on or after 1 July 2018 or later periods, including HKFRS 9 “Financial Instruments” and HKFRS 16 “Leases”. Under HKFRS 9, certain financial assets of the Group that are currently classified as available-for-sale equity securities will be classified and measured as FVOCI and FVPL. Depending on the classification and timing of disposal of the investments, there may be impact on the profit or loss of the Group. The Group will need to recognise part of the fair value change of financial liabilities that is due to changes in its own credit risk in consolidated statement of comprehensive income rather than consolidated income statement. A new expected credit loss (“ECL”) impairment model has been introduced which involves a three-stage approach whereby financial assets move through the three stages as their credit quality changes. The Group expects to apply the simplified approach to recognise lifetime ECL for its trade debtors and contract assets and considers the remaining financial assets have low credit risk and hence expects to recognise 12-month ECL. Under HKFRS 16, it provides a new provision for the accounting treatment of leases when the Group is the lessee, almost all leases should be recognised in the form of an asset (for the right-of-use) and a financial liability (for the payment obligation). As for the financial performance impact in the consolidated income statement, straight-line depreciation expense on the right-of-use asset and the interest expenses on the financial liability are recognised and no rental expenses will be recognised. The combination of a straight-line depreciation of the right-of-use asset and the effective interest rate method applied to the financial liability will result in a higher total charge to consolidated income statements in the initial years of the lease, and decreasing expenses during the latter part of the lease term.
253Risk Factors
C OTHER RISKS
1. An outbreak of any epidemics in the region where the Group operates may result in material disruptions in the Group’s and its tenants’ business. Natural disasters or other catastrophic events, such as earthquake, flood or severe weather conditions, could, depending on its magnitude, significantly disrupt the Group’s business operations or result in significant economic downturn in the affected regions. The Group cannot assure that there will be no occurrence of earthquakes or other natural hazards in the area where it operates, which may result in severe destruction of the Group’s property development projects, assets, cash flow from infrastructure and facilities.
2. The Group is subject to extensive and increasingly stringent environmental protection laws, regulations and decrees that impose fine for violation of such laws, regulations or decrees and provide for the shutdown by the government authorities of any construction sites not in compliance with government orders requiring the cessation or cure of certain activities causing environmental damage. In addition, there is a growing global awareness of environmental issues and the Group may sometimes be expected to meet a standard which is more stringent than the requirement of the prevailing environmental laws and regulations and may cause negative impacts on the costs and operations of its projects. The Group has adopted various environmental protection measures, including conducting environmental assessment on the Group’s property construction project and hiring contractors with good environmental protection and safety track records, and required them to comply with the relevant regulations or laws on environmental protection and safety, whereas such measure may be ineffective. In addition, the Group cannot assure that more stringent environmental projection regulations will not be imposed in the future. If the Group fails to comply with the prevailing or future environmental laws or regulations, or fails to meet public expectations in relation to environmental matters, the Group’s reputation may be damaged or may be required to pay fines or take remedial actions, in which case suspension of operation may be required in the Group’s subsidiaries.
3. The Group considers the intellectual property rights as crucial business assets, key to customer loyalty and essential to the Group’s future growth. The success of the Group’s business depends substantially upon the continued ability to use its brand, trade names and trademarks to increase brand recognition and to further develop its brand. The unauthorised reproduction of the Group trade names or trademarks could diminish the value of the Group’s brand and our market reputation and competitive advantages. The Group relies on a combination of trademarks, trade secrets, confidentiality procedures and contractual provisions to protect our intellectual property rights. Nevertheless, these afford limited protection and preventing unauthorised use of proprietary information can be difficult and expensive. In addition, enforceability, scope and validity of laws governing intellectual property rights in Mainland China are uncertain and still evolving, and could involve substantial risk to us. If the Group was unable to detect unauthorised use of, or take appropriate steps to enforce our intellectual property rights, it could have a material adverse effect on its business, financial conditions and results of operations.
New
Wor
ld D
evel
opm
ent
Com
pany
Lim
ited
254A
nnua
l Rep
ort
2019
Risk Factors
C OTHER RISKS (CONTINUED)
4. The development of and future trends in Hong Kong and Mainland China property industries have been the focus of numerous media reports. As a leading property developer in Hong Kong and Mainland China, information about the Group or its projects appears frequently in various media outlets. Some of these media reports contain inaccurate information about the projects of the Group and the Group. There can be no assurance that there will not be false, inaccurate or adverse media reports about the Group or its projects in the future. In particular, the Group may be required to respond or take defensive and remedial actions with regard to such inaccurate or adverse media reports, which may adversely divert its resources and management’s attention and may materially and adversely impact its business operations. Moreover, there can be no assurance as to the appropriateness, accuracy, completeness or reliability of any media reports regarding the Group. The Group disclaims any media reports containing information that is inconsistent or conflicts with the information contained in its annual report and circulars. Investors should not rely on such information in making a decision as to invest in the Group’s shares and/or its listed securities, and should rely only on the official public information from the Group included in its annual report and corporate announcement.
5. The Group has insurance in place in relation to its various development projects, including third-party and earthquake insurances. In general, such insurances do not cover wars, riots, terrorism and natural disaster, any of which case would result in an unpredictable amount of losses and have negative impacts on the Group’s business and cash flow to a certain extent. Properties could suffer from physical damage by fire or other causes, the Group may be exposed to potential risks associated with public liability claims, resulting in losses which may not be fully compensated for by insurance proceeds, in turn affecting the Group’s financial conditions.
6. Certain business of the Group are operated under concession rights, including the Hong Kong Convention and Exhibition Centre, public bus services, public ferry services, operations of duty-free shops and toll roads etc. The Group cannot assure that such concession rights can be renewed upon their expiry, and the conditions could be worse off than the existing ones even if renewals are approved.
7. While the Group has adopted appropriate protective measures and conducted regular updates in respect of its computer systems and data, the Group cannot assure, given the rapid technological advancement, that its computer systems and networks will not be subject to system breakdown, damage, data loss, leakage or theft caused by external threats such as cyber-attacks, computer viruses and unauthorised visits, resulting in the leak of the Group’s key information, violation of confidentiality regulations or loss incurred by parties providing information, which will undermine the Group’s reputation or subject the Group to the potential risk of loss arising from litigation and affect its business.
8. The International Accounting Standards Board has from time to time issued new and revised International Financial Reporting Standards (“IFRS”). As accounting standards continue to develop, the International Accounting Standards Board may in the future issue more new and revised IFRS and the Group may be required to adopt new accounting policies which might or could have a significant impact on the Group’s business, financial conditions, results of operations or growth prospects.
255Risk Factors
C OTHER RISKS (CONTINUED)
9. To balance and alleviate potential risks relating to property development cycles or in general, the Group is committed to optimising its business portfolios, proposing innovative strategies, identifying projects complementary to the Group’s business for strategic investments or acquisitions, and exploring new business. Nevertheless, the Group cannot assure that all stakeholders will agree with the Group’s strategies and possible new business ventures, or that such strategies and investments in and acquisitions of new projects will be carried out successfully or on favourable and desirable terms. As such, the Group may not be able to achieve its expected return with such strategies and investments, and its business, operating results and growth prospects could be adversely affected as a result.
10. Image of the Group may be affected by possible oppositions or protests during property development, delayed handover of residential units and quality issues.
11. The Group observes a number of other environmental, social and governance (“ESG”) related risks which could have a material impact on the Group’s ability to achieve its objectives and goals, including:
I. quality issues in products and services, as well as business and financial failures of key suppliers, contractors and customers
II. environmental and waste management issues, pollution, climate change impacts on the Group’s assets and operations
III. bribery, corruption, fraud, extortion and money laundering
IV. significant leakage of sensitive and confidential information
V. health and safety (such as safety incidents of both employees and supply chain partners)
12. The Group’s operations require high-calibre staff in numbers. Hence, the Group’s continuous business growth is, to a considerable extent, dependent on whether the Group is able to recruit and retain skilled employees, in particular directors, senior management and key personnel. Currently, there is intense competition for such personnel in the Mainland China and Hong Kong markets, and the Group may need to offer generous remuneration and benefits in order to recruit or retain skilled employees, or it may not be able to recruit or retain skilled employees at all, in which case its business will be affected to a considerable extent.
13. This financial report contains statistics or information derived from government sources or other third-party sources. The Group cannot assure the quality, accuracy and reliability of such information which has not been prepared or verified by the Group or the Group’s subsidiaries, joint ventures or associated companies and does not make any representation as to the accuracy and reliability of such information. Information flows and updates in the current world occur at a fast speed. The Group cannot assure the timeliness or time sensitivity of information derived from government sources or other third-party sources contained in this report. Investors should make their own judgements as to the weight carried by or materiality of statistics or information contained in this report.
14. The Group has established a Risk Management Committee and an internal audit department alongside the adoption of risk management policies. Nevertheless, the Group cannot assure that it can identify, curb and prevent, in a timely manner or at all, all fraudulent, dishonest or otherwise inappropriate behaviours on the part of employees, contractors, suppliers, business partners or other third parties. The occurrence of incidents pertaining to the above could undermine the Group’s reputation or adversely affect the Group’s business, operating results and growth prospects.
New
Wor
ld D
evel
opm
ent
Com
pany
Lim
ited
256A
nnua
l Rep
ort
2019
Risk Factors
D MAJOR RISK FACTORS ON SUBSIDIARIES
New World China Land Limited (“NWCL”)1. NWCL’s property development business is highly susceptible to the prevailing conditions and
performance of Mainland China property market which is heavily regulated by the Central and Local Governments. In response to the domestic and international market volatility, the Central Government will, from time to time adjust its monetary and economic policies to monitoring the growth rate of national economy and economies of various areas in Mainland China. Such policies and regulations would have significant impact on Mainland China property market where NWCL operates.
2. Economic conditions in Mainland China are sensitive to global economic conditions, and it is impossible to predict how the economy of Mainland China will develop in the future and whether it might slow down due to the global crisis or experience a financial crisis in a manner and scale similar to that in the United States and the European countries. As the real estate industry is sensitive to macroeconomic trends, real estate prices tend to fluctuate along with the change of macroeconomic conditions. Furthermore, the recent breakout of US-China trade war would inevitably slow down the economic growth of Mainland China. There are still many uncertainties and the magnitude of impact is unpredictable. The escalation of trade war may further increase the volatility of property prices.
3. These and other issues resulting from the global economic slowdown and financial market turmoil have adversely affected, and may continue to adversely effect, the Mainland China market and consumption capacity in this market, which may lead to a decline in the general demand for NWCL’s products and erosion of their sale prices. In addition, any further tightening of liquidity in the global financial markets and in Mainland China may negatively affect the liquidity of NWCL. Therefore, if the global economic slowdown and turmoil in the financial markets continue, the business, financial conditions and results of operations of NWCL may be adversely affected.
4. NWCL’s property development operations face competitions from both international and local property developers with respect to factors such as locations, facilities and supporting infrastructure, services and pricing. NWCL competes with both local and international companies in capturing new business opportunities in Mainland China. In addition, some local companies have extensive local knowledge and business relationships and/or a longer operational track record in the relevant local markets than NWCL while international companies are able to capitalise on their overseas experience to compete in Mainland China market. Intensified competition between property developers may result in increased costs for land acquisition and an oversupply of properties, both of which may adversely affect NWCL’s business and financial conditions.
5. Property development companies in Mainland China, including subsidiaries of NWCL in Mainland China, are subject to extensive government regulations in most aspects of their operations, including those relating to the acquisitions of land use rights, resettlement and clearance of land, the approval of property development proposals and pre-sales. There can be no assurance that these regulations will not change in the future in a manner which could adversely affect NWCL’s business or results of operations. In addition, the Central Government is presently strengthening its regulation and control of the development of properties. While enforcement of these and other regulations are beneficial to the entire property development industry, it is possible that certain individual regulations could adversely affect property development companies, including NWCL. As regulations continue to develop, prevailing industry practices may not comply with such regulations.
257Risk Factors
D MAJOR RISK FACTORS ON SUBSIDIARIES (CONTINUED)
New World China Land Limited (“NWCL”) (continued)6. The Central Government has in the past imposed restrictions on foreign investments in the property
sector to curtail the overheating of the property sector by, among other things, increasing the capital and other requirements for establishing foreign-invested real estate enterprises, tightening foreign exchange control and imposing restrictions on purchases of properties in Mainland China by foreign persons. Such restrictions may affect NWCL’s ability to make further investments in NWCL’s subsidiaries in Mainland China and as a result may limit its business growth and have a material adverse effect on its business, financial conditions and results of operations.
7. The fiscal and other measures adopted by the Central Government from time to time may limit NWCL’s flexibility and ability to use bank loans to finance its property developments and therefore may require NWCL to maintain a relatively high level of internally-sourced cash. In recent years, the Central Government has tightened the requirements in relation to grant of state-owned land use rights by way of tender, auction and listing for sale and raised the minimum down payment of land premium several times up to 70% of the benchmark price of the locality where the parcel of land is granted, and the bidding deposit at not less than 20% of the minimum land premium. Additionally, a land grant contract is required to be entered into within 10 working days after a land grant deal is closed, and the down payment of 50% of the land premium is to be paid within one month of the signing of the land grant contract, with the remaining to be paid in full within one year of the date of the land grant contract in accordance with provisions of such land grant contract, subject to limited exceptions. Such change of policy may constrain NWCL’s cash otherwise available for additional land acquisitions and construction works.
8. Under tax laws and regulations in Mainland China, NWCL’s properties developed for sale are subject to LAT, which is collectible by the local tax authorities. All income from the sale or transfer of state-owned land use rights, buildings and their ancillary facilities in Mainland China is subject to LAT at progressive rates ranging from 30% to 60% of the appreciation value as defined by the relevant tax laws, with certain exemptions available for the sale of eligible ordinary residential properties if the appreciation does not exceed 20% of the total amount of deductible items as defined in the relevant tax laws. NWCL shall prepay LAT as required by Mainland China local tax authorities if the income is derived from the transfer of properties before the settlement of LAT upon completion of the development project, or the conditions on the settlement of LAT for the development project are not fulfilled.
9. Effective from 1 May 2016, the Central Government rolled out the pilot program for the nationwide replacement of the business tax with the value-added tax (“VAT”) (the “Replacement”), covering the sectors of construction, real estate, financial services and consumer services. 11% VAT rate is applied to the leasing services of real estate, sales of real estate and transfer of land use rights. Pursuant to the relevant provisions of VAT, the applicable VAT rate for eligible taxpayers shall be 5%. Upon the Replacement, the cash flow, expenses and income of NWCL may be affected.
10. A significant portion of NWCL’s operation is in Mainland China and majority of NWCL’s income and expenditures are transacted in RMB. RMB is not freely convertible. The Central Government regulates the conversion between RMB and foreign currencies, and there is significant restriction on the remittance of RMB into and outside Mainland China. The value of RMB is subject to changes in the Central Government policies and to international economic and political developments. Therefore there is no assurance that the exchange rate of RMB will remain stable against foreign currencies in the market and fluctuations in exchange rates may adversely affect the value, translated into Hong Kong dollar, of NWCL’s net assets, earnings and any declared dividends.
New
Wor
ld D
evel
opm
ent
Com
pany
Lim
ited
258A
nnua
l Rep
ort
2019
Risk Factors
D MAJOR RISK FACTORS ON SUBSIDIARIES (CONTINUED)
New World China Land Limited (“NWCL”) (continued)11. In recent years, the Central Government has promulgated administrative measures to gradually liberalise
the control over cross-border remittance of RMB where payment of current account items, including profit distributions, interest payments and expenditure from trade, may be made in foreign currencies without prior approval, but subject to certain procedural requirements. However strict foreign exchange controls continue to be implemented in respect of capital account transactions including repayment of loan principal and return on direct capital investments and investments in negotiable securities. Such exchange controls may impact the distribution plans of NWCL’s subsidiaries in Mainland China to the Group.
12. NWCL’s property development business requires substantial capital investment. NWCL will require additional financing to fund working capital and capital expenditure, to support the future growth of its business and/or to refinance existing debts obligations. NWCL’s ability to arrange for external financing and the cost of such financing are dependent on numerous factors, including general economic and capital market conditions, interest rates, credit availability from banks or other lenders, investor confidence in NWCL, success of its businesses, provisions of tax and securities laws that may be applicable to NWCL’s efforts to raise capital and political and economic conditions in Mainland China. In addition, a substantial portion of NWCL’s borrowings are linked to benchmark lending rates published by the People Bank of China. The People Bank of China has adjusted the benchmark one-year lending rate a number of times in the past in response to the changing Mainland China and global financial and economic conditions. As such, NWCL is exposed to foreign currency exchange risk, interest rate risk, credit risk and liquidity risk.
13. The rapid economic growth and infrastructure development in Mainland China in recent years have uplifted the costs of construction materials and wages of construction workers. In addition, in view of the improvement of general living standard in Mainland China and policies of the Central Government to increase the wages of workers from rural areas, NWCL expects that labour costs may continue to increase in the foreseeable future. Meanwhile, RMB exchange rates are subject to movements in reaction to economic and policy developments. Any significant depreciation in RMB will increase the cost of NWCL’s purchase of construction materials, building equipment and construction machinery from overseas suppliers. Rising costs of construction materials, equipment and labour will cause contractors to raise their prices for undertaking NWCL’s new property development projects. Moreover, NWCL’s property developments are generally launched for pre-sale prior to completion and it may not be able to pass any increased costs to buyers in the event of any rapid rise in the costs of construction materials and labour after the pre-sales. If labour shortage continues to aggravate and/or if the costs of labour or construction materials continue to rise substantially and NWCL is not able to offset such increase by seeking cost reductions in other areas or passing such increased costs to property buyers or tenants, the business, financial conditions, operating results and growth prospects of NWCL could be materially and adversely affected.
259Risk Factors
D MAJOR RISK FACTORS ON SUBSIDIARIES (CONTINUED)
New World Department Store China Limited (“NWDS”) 1. Accelerated advancement in smart business technologies
I. Facing the rapid changes in consumption market, brick-and-mortar retailers must place a stronger focus on membership experience and on updating the application of membership technologies. Members are no longer easily satisfied with merchandise discounts and loyalty points. Instead, they expect more added values in their benefits.
II. Various e-commerce platforms are capitalising on different smart devices to create new retail scenarios and experiences as an important instrument to capture market resources. Some examples are the broad application of AR/VR technologies, as well as “facial recognition”, “virtual changing room”, etc.
III. In the era of omnichannel marketing 4.0, brick-and-mortar stores are facing three main barriers: technology, the internet mindset, as well as bilateral communication.
2. Foreign exchange riskI. NWDS is mainly exposed to foreign exchange risk arising from Hong Kong dollar (“HKD”), United
States dollar (“USD”) and EURO (“EUR”) against Renminbi (“RMB”) and from RMB and EUR against HKD. This foreign exchange risk arises from future commercial transactions or recognised assets and liabilities denominated in a currency that is not the functional currencies of NWDS and each of the subsidiaries. The functional currency of NWDS and most of its subsidiaries is RMB. Therefore, any currency fluctuations may have an impact on NWDS’s financial condition and results of operations.
NWS Holdings Limited (“NWSH”) Strategic risk
1. Business partnership risk due to limited controls in minority interest investment — This risk is mainly related to Roads, Environment, Logistics and Facilities Management business, as well as Strategic Investment of NWSH. The risk trend has increased in FY2019.
2. Investment risk due to long-term commitment to unprofitable projects and deviation from desired return of investment — This risk trend remains stable in FY2019. The risk is mainly related to Roads, Environment, Logistics, Facilities Management, Construction & Transport business as well as Strategic Investment of the NWSH.
3. Risk of unsuccessful cultural integration and retention of senior management for newly acquired businesses — This risk is mainly associated with Aviation business. The trend of this ESG-related risk has remained stable in FY2019.
4. Unfavourable change of government policies — This risk mainly involves Roads, Environment, Logistics and Construction & Transport business. The trend of this ESG-related risk remains stable in FY2019.
Compliance risk5. More stringent regulatory requirements leading to increase in the operational and compliance
costs — This risk is mainly associated with Environment, Facilities Management and Construction & Transport business. The risk trend has increased in FY2019.
New
Wor
ld D
evel
opm
ent
Com
pany
Lim
ited
260A
nnua
l Rep
ort
2019
Risk Factors
D MAJOR RISK FACTORS ON SUBSIDIARIES (CONTINUED)
NWS Holdings Limited (“NWSH”) (continued) Operational risk
6. Unable to renew or renegotiate favourable terms for expiring concessions and key contracts — This risk is mainly faced by Logistics, Facilities Management and Construction & Transport business. The risk trend remains stable in FY2019.
7. Major crises (e.g. safety incidents and natural disasters) affecting business operation and damaging reputation — This risk is mainly associated with Roads, Environment, Logistics, Aviation, Facilities Management and Construction & Transport business. The trend of this ESG-related risk has increased in FY2019.
8. Labour shortage — This is a risk mainly faced by Facilities Management and Construction & Transport business. The trend of this ESG-related risk remains steady in FY2019.
Financial Risk9. Unfavourable fluctuation of foreign currencies resulting in realised/unrealised exchange losses
— The risk is mainly related to Roads, Environment and Logistics business. The risk trend remains stable in FY2019.
10. Interest rate and refinancing risk due to unfavourable fluctuation in interest rate and difficulty in accessing new capital — The risk is mainly associated with Roads and Aviation business. The risk trend has increased in FY2019.
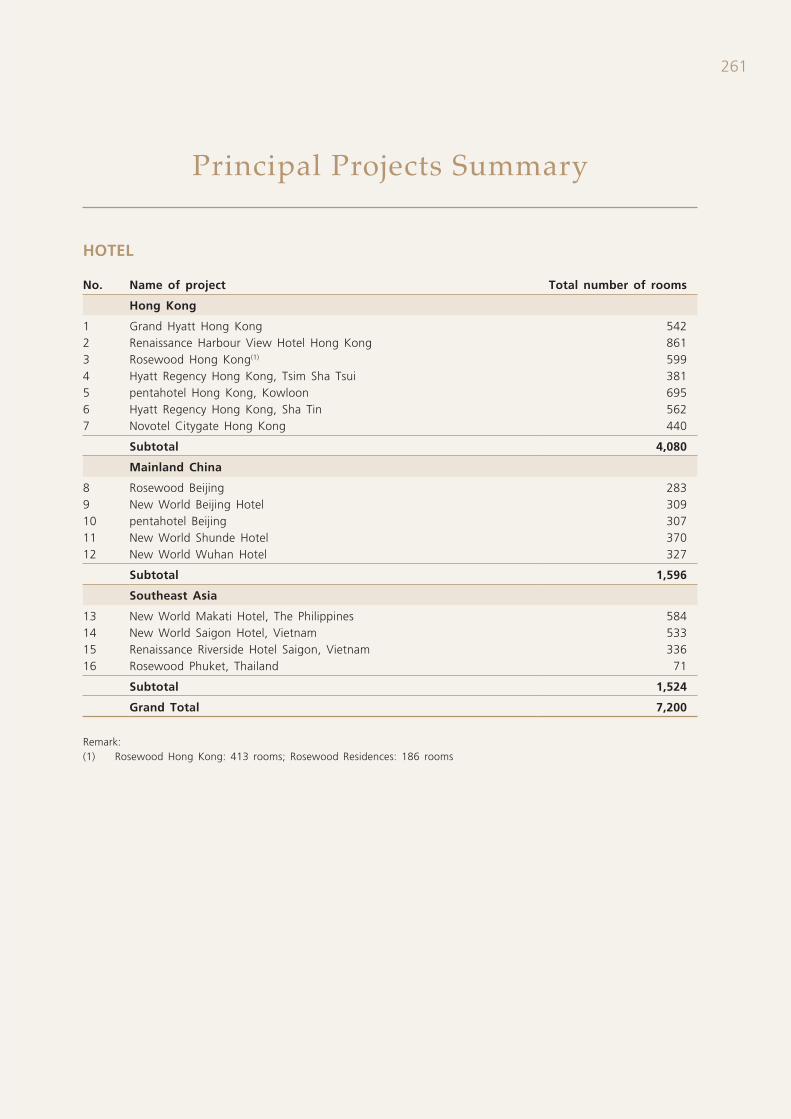
261
Principal Projects Summary
HOTEL
No. Name of project Total number of rooms
Hong Kong
1 Grand Hyatt Hong Kong 5422 Renaissance Harbour View Hotel Hong Kong 8613 Rosewood Hong Kong(1) 5994 Hyatt Regency Hong Kong, Tsim Sha Tsui 3815 pentahotel Hong Kong, Kowloon 6956 Hyatt Regency Hong Kong, Sha Tin 5627 Novotel Citygate Hong Kong 440
Subtotal 4,080
Mainland China
8 Rosewood Beijing 2839 New World Beijing Hotel 30910 pentahotel Beijing 30711 New World Shunde Hotel 37012 New World Wuhan Hotel 327
Subtotal 1,596
Southeast Asia
13 New World Makati Hotel, The Philippines 58414 New World Saigon Hotel, Vietnam 53315 Renaissance Riverside Hotel Saigon, Vietnam 33616 Rosewood Phuket, Thailand 71
Subtotal 1,524
Grand Total 7,200
Remark:(1) Rosewood Hong Kong: 413 rooms; Rosewood Residences: 186 rooms
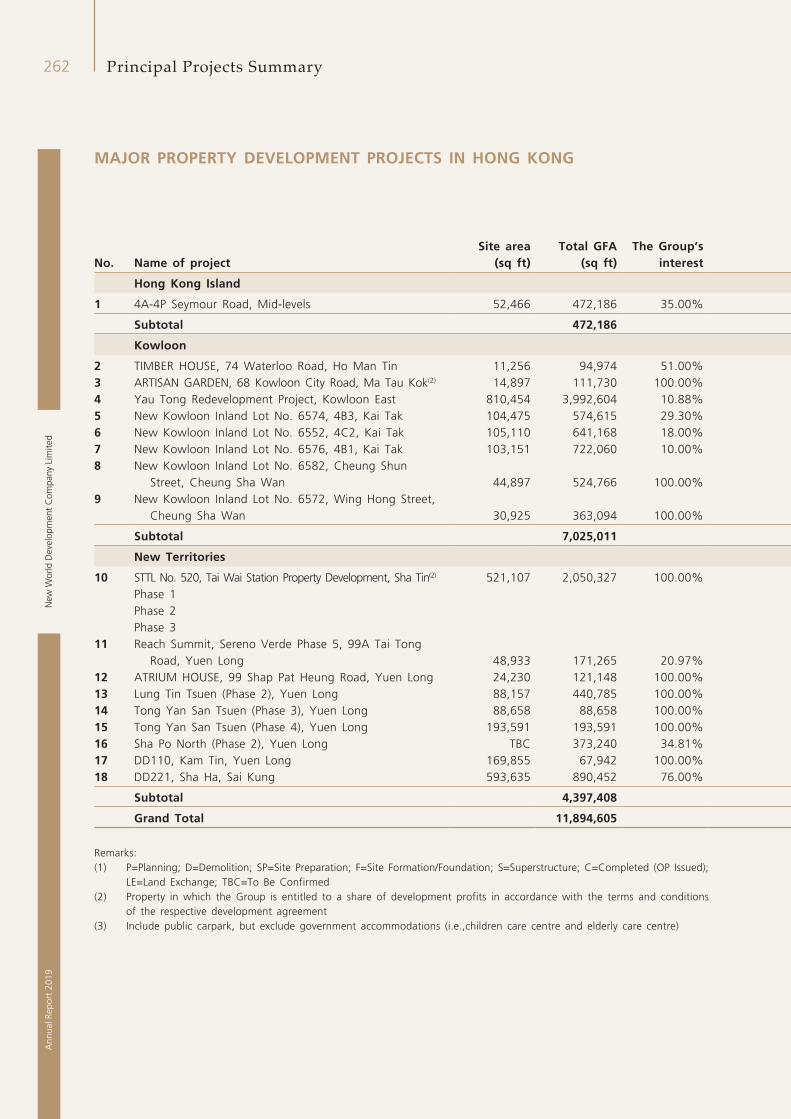
New
Wor
ld D
evel
opm
ent
Com
pany
Lim
ited
262A
nnua
l Rep
ort
2019
Principal Projects Summary
MAJOR PROPERTY DEVELOPMENT PROJECTS IN HONG KONG
No. Name of projectSite area Total GFA The Group’s
interest(sq ft) (sq ft)
Hong Kong Island
1 4A-4P Seymour Road, Mid-levels 52,466 472,186 35.00%
Subtotal 472,186
Kowloon
2 TIMBER HOUSE, 74 Waterloo Road, Ho Man Tin 11,256 94,974 51.00%3 ARTISAN GARDEN, 68 Kowloon City Road, Ma Tau Kok(2) 14,897 111,730 100.00%4 Yau Tong Redevelopment Project, Kowloon East 810,454 3,992,604 10.88%5 New Kowloon Inland Lot No. 6574, 4B3, Kai Tak 104,475 574,615 29.30%6 New Kowloon Inland Lot No. 6552, 4C2, Kai Tak 105,110 641,168 18.00%7 New Kowloon Inland Lot No. 6576, 4B1, Kai Tak 103,151 722,060 10.00%8 New Kowloon Inland Lot No. 6582, Cheung Shun
Street, Cheung Sha Wan 44,897 524,766 100.00%9 New Kowloon Inland Lot No. 6572, Wing Hong Street,
Cheung Sha Wan 30,925 363,094 100.00%
Subtotal 7,025,011
New Territories
10 STTL No. 520, Tai Wai Station Property Development, Sha Tin(2) 521,107 2,050,327 100.00%Phase 1Phase 2Phase 3
11 Reach Summit, Sereno Verde Phase 5, 99A Tai Tong Road, Yuen Long 48,933 171,265 20.97%
12 ATRIUM HOUSE, 99 Shap Pat Heung Road, Yuen Long 24,230 121,148 100.00%13 Lung Tin Tsuen (Phase 2), Yuen Long 88,157 440,785 100.00%14 Tong Yan San Tsuen (Phase 3), Yuen Long 88,658 88,658 100.00%15 Tong Yan San Tsuen (Phase 4), Yuen Long 193,591 193,591 100.00%16 Sha Po North (Phase 2), Yuen Long TBC 373,240 34.81%17 DD110, Kam Tin, Yuen Long 169,855 67,942 100.00%18 DD221, Sha Ha, Sai Kung 593,635 890,452 76.00%
Subtotal 4,397,408
Grand Total 11,894,605
Remarks:(1) P=Planning; D=Demolition; SP=Site Preparation; F=Site Formation/Foundation; S=Superstructure; C=Completed (OP Issued);
LE=Land Exchange; TBC=To Be Confirmed(2) Property in which the Group is entitled to a share of development profits in accordance with the terms and conditions
of the respective development agreement(3) Include public carpark, but exclude government accommodations (i.e.,children care centre and elderly care centre)
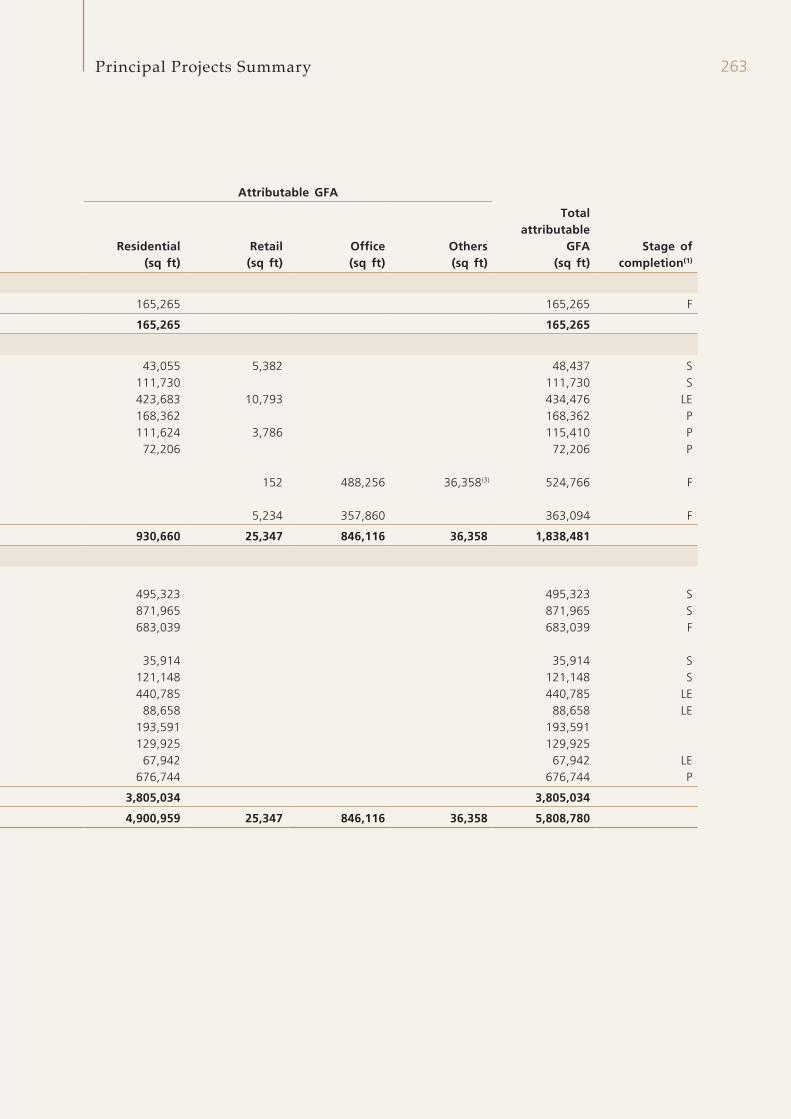
263Principal Projects Summary
Attributable GFA
Residential Retail Office Others
Total attributable
GFA Stage of completion(1)(sq ft) (sq ft) (sq ft) (sq ft) (sq ft)
165,265 165,265 F
165,265 165,265
43,055 5,382 48,437 S111,730 111,730 S423,683 10,793 434,476 LE168,362 168,362 P111,624 3,786 115,410 P
72,206 72,206 P
152 488,256 36,358(3) 524,766 F
5,234 357,860 363,094 F
930,660 25,347 846,116 36,358 1,838,481
495,323 495,323 S871,965 871,965 S683,039 683,039 F
35,914 35,914 S121,148 121,148 S440,785 440,785 LE
88,658 88,658 LE193,591 193,591129,925 129,925
67,942 67,942 LE676,744 676,744 P
3,805,034 3,805,034
4,900,959 25,347 846,116 36,358 5,808,780
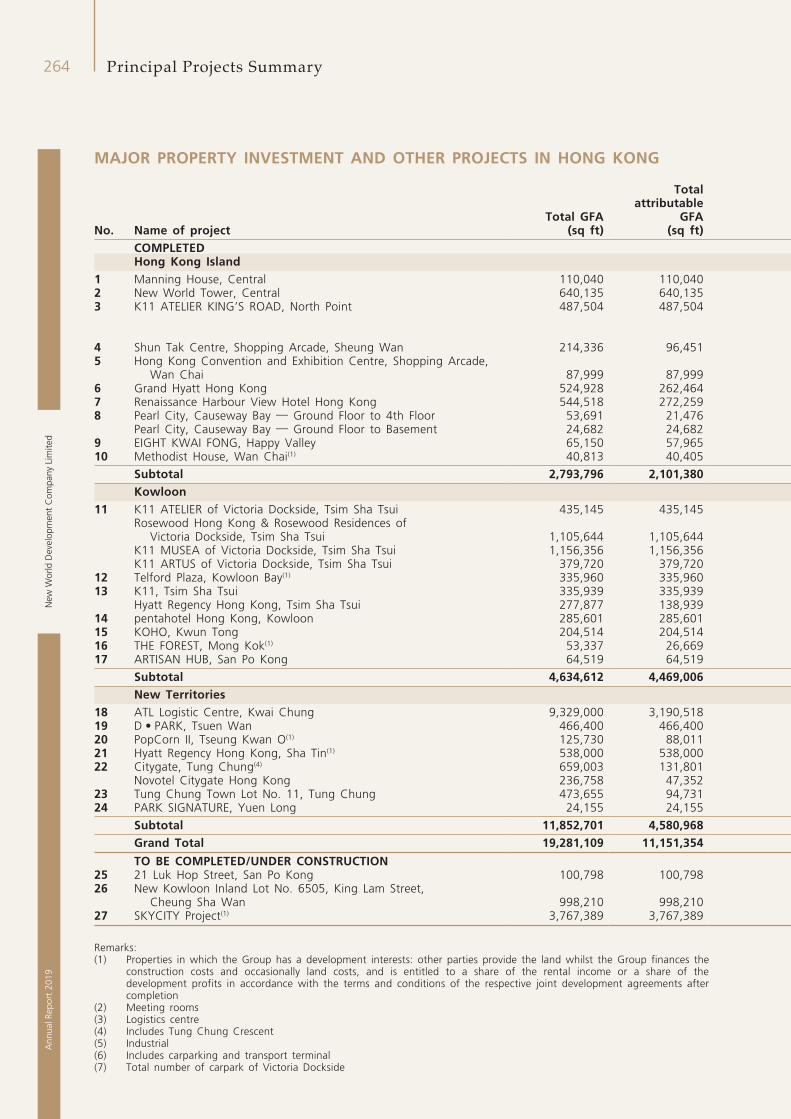
New
Wor
ld D
evel
opm
ent
Com
pany
Lim
ited
264A
nnua
l Rep
ort
2019
Principal Projects Summary
MAJOR PROPERTY INVESTMENT AND OTHER PROJECTS IN HONG KONG
Total GFA
Total attributable
GFANo. Name of project (sq ft) (sq ft)
COMPLETEDHong Kong Island
1 Manning House, Central 110,040 110,0402 New World Tower, Central 640,135 640,1353 K11 ATELIER KING’S ROAD, North Point 487,504 487,504
4 Shun Tak Centre, Shopping Arcade, Sheung Wan 214,336 96,4515 Hong Kong Convention and Exhibition Centre, Shopping Arcade,
Wan Chai 87,999 87,9996 Grand Hyatt Hong Kong 524,928 262,4647 Renaissance Harbour View Hotel Hong Kong 544,518 272,2598 Pearl City, Causeway Bay — Ground Floor to 4th Floor 53,691 21,476
Pearl City, Causeway Bay — Ground Floor to Basement 24,682 24,6829 EIGHT KWAI FONG, Happy Valley 65,150 57,96510 Methodist House, Wan Chai(1) 40,813 40,405
Subtotal 2,793,796 2,101,380Kowloon
11 K11 ATELIER of Victoria Dockside, Tsim Sha Tsui 435,145 435,145Rosewood Hong Kong & Rosewood Residences of
Victoria Dockside, Tsim Sha Tsui 1,105,644 1,105,644K11 MUSEA of Victoria Dockside, Tsim Sha Tsui 1,156,356 1,156,356K11 ARTUS of Victoria Dockside, Tsim Sha Tsui 379,720 379,720
12 Telford Plaza, Kowloon Bay(1) 335,960 335,96013 K11, Tsim Sha Tsui 335,939 335,939
Hyatt Regency Hong Kong, Tsim Sha Tsui 277,877 138,93914 pentahotel Hong Kong, Kowloon 285,601 285,60115 KOHO, Kwun Tong 204,514 204,51416 THE FOREST, Mong Kok(1) 53,337 26,66917 ARTISAN HUB, San Po Kong 64,519 64,519
Subtotal 4,634,612 4,469,006New Territories
18 ATL Logistic Centre, Kwai Chung 9,329,000 3,190,51819 D • PARK, Tsuen Wan 466,400 466,40020 PopCorn II, Tseung Kwan O(1) 125,730 88,01121 Hyatt Regency Hong Kong, Sha Tin(1) 538,000 538,00022 Citygate, Tung Chung(4) 659,003 131,801
Novotel Citygate Hong Kong 236,758 47,35223 Tung Chung Town Lot No. 11, Tung Chung 473,655 94,73124 PARK SIGNATURE, Yuen Long 24,155 24,155
Subtotal 11,852,701 4,580,968Grand Total 19,281,109 11,151,354
TO BE COMPLETED/UNDER CONSTRUCTION25 21 Luk Hop Street, San Po Kong 100,798 100,79826 New Kowloon Inland Lot No. 6505, King Lam Street,
Cheung Sha Wan 998,210 998,21027 SKYCITY Project(1) 3,767,389 3,767,389
Remarks:(1) Properties in which the Group has a development interests: other parties provide the land whilst the Group finances the
construction costs and occasionally land costs, and is entitled to a share of the rental income or a share of the development profits in accordance with the terms and conditions of the respective joint development agreements after completion
(2) Meeting rooms(3) Logistics centre(4) Includes Tung Chung Crescent(5) Industrial(6) Includes carparking and transport terminal(7) Total number of carpark of Victoria Dockside
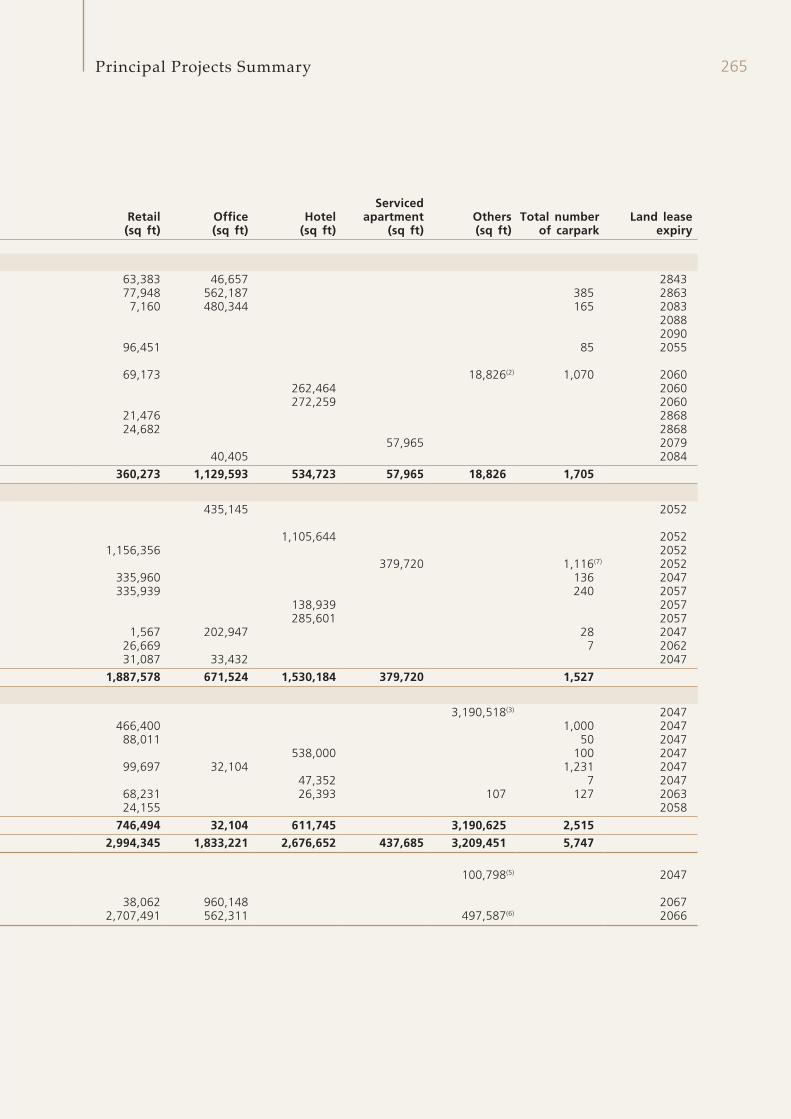
265Principal Projects Summary
Retail Office HotelServiced
apartment Others Total number of carpark
Land lease expiry(sq ft) (sq ft) (sq ft) (sq ft) (sq ft)
63,383 46,657 284377,948 562,187 385 2863
7,160 480,344 165 208320882090
96,451 85 2055
69,173 18,826(2) 1,070 2060262,464 2060272,259 2060
21,476 286824,682 2868
57,965 207940,405 2084
360,273 1,129,593 534,723 57,965 18,826 1,705
435,145 2052
1,105,644 20521,156,356 2052
379,720 1,116(7) 2052335,960 136 2047335,939 240 2057
138,939 2057285,601 2057
1,567 202,947 28 204726,669 7 206231,087 33,432 2047
1,887,578 671,524 1,530,184 379,720 1,527
3,190,518(3) 2047466,400 1,000 2047
88,011 50 2047538,000 100 2047
99,697 32,104 1,231 204747,352 7 2047
68,231 26,393 107 127 206324,155 2058
746,494 32,104 611,745 3,190,625 2,5152,994,345 1,833,221 2,676,652 437,685 3,209,451 5,747
100,798(5) 2047
38,062 960,148 20672,707,491 562,311 497,587(6) 2066
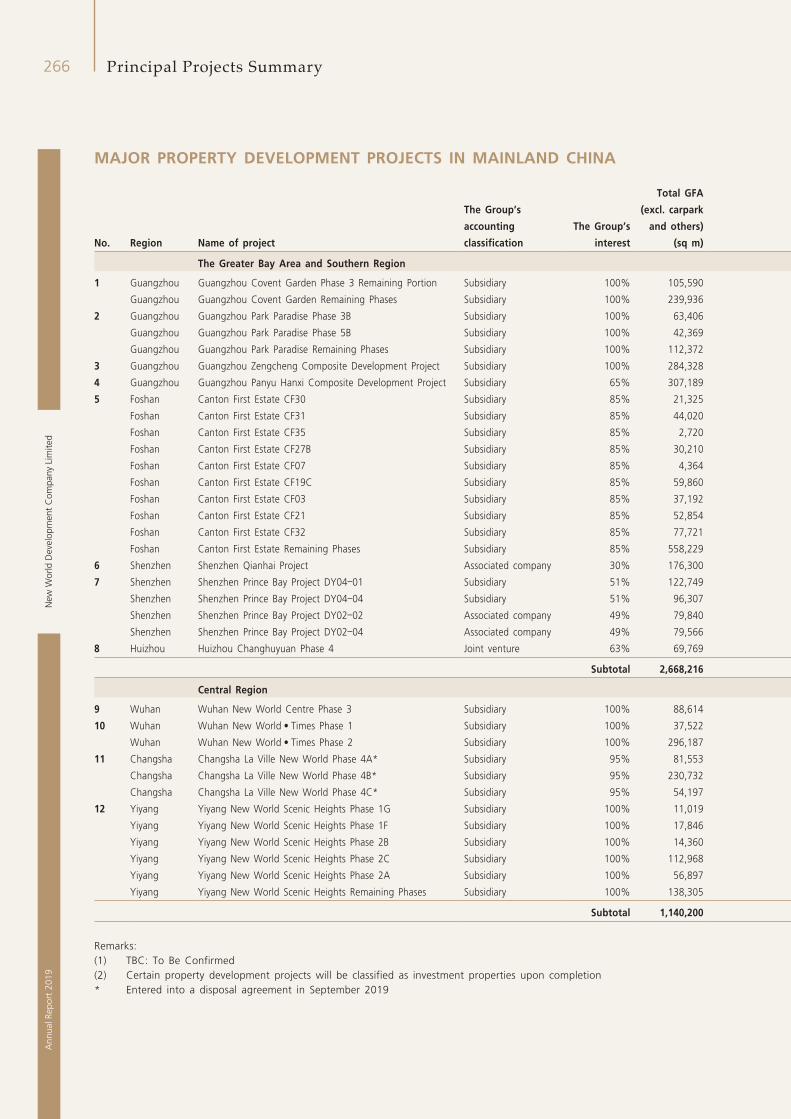
New
Wor
ld D
evel
opm
ent
Com
pany
Lim
ited
266A
nnua
l Rep
ort
2019
Principal Projects Summary
MAJOR PROPERTY DEVELOPMENT PROJECTS IN MAINLAND CHINA
The Group’s
accounting The Group’s
Total GFA
(excl. carpark
and others)
No. Region Name of project classification interest (sq m)
The Greater Bay Area and Southern Region
1 Guangzhou Guangzhou Covent Garden Phase 3 Remaining Portion Subsidiary 100% 105,590
Guangzhou Guangzhou Covent Garden Remaining Phases Subsidiary 100% 239,936
2 Guangzhou Guangzhou Park Paradise Phase 3B Subsidiary 100% 63,406
Guangzhou Guangzhou Park Paradise Phase 5B Subsidiary 100% 42,369
Guangzhou Guangzhou Park Paradise Remaining Phases Subsidiary 100% 112,372
3 Guangzhou Guangzhou Zengcheng Composite Development Project Subsidiary 100% 284,328
4 Guangzhou Guangzhou Panyu Hanxi Composite Development Project Subsidiary 65% 307,189
5 Foshan Canton First Estate CF30 Subsidiary 85% 21,325
Foshan Canton First Estate CF31 Subsidiary 85% 44,020
Foshan Canton First Estate CF35 Subsidiary 85% 2,720
Foshan Canton First Estate CF27B Subsidiary 85% 30,210
Foshan Canton First Estate CF07 Subsidiary 85% 4,364
Foshan Canton First Estate CF19C Subsidiary 85% 59,860
Foshan Canton First Estate CF03 Subsidiary 85% 37,192
Foshan Canton First Estate CF21 Subsidiary 85% 52,854
Foshan Canton First Estate CF32 Subsidiary 85% 77,721
Foshan Canton First Estate Remaining Phases Subsidiary 85% 558,229
6 Shenzhen Shenzhen Qianhai Project Associated company 30% 176,300
7 Shenzhen Shenzhen Prince Bay Project DY04–01 Subsidiary 51% 122,749
Shenzhen Shenzhen Prince Bay Project DY04–04 Subsidiary 51% 96,307
Shenzhen Shenzhen Prince Bay Project DY02–02 Associated company 49% 79,840
Shenzhen Shenzhen Prince Bay Project DY02–04 Associated company 49% 79,566
8 Huizhou Huizhou Changhuyuan Phase 4 Joint venture 63% 69,769
Subtotal 2,668,216
Central Region
9 Wuhan Wuhan New World Centre Phase 3 Subsidiary 100% 88,614
10 Wuhan Wuhan New World • Times Phase 1 Subsidiary 100% 37,522
Wuhan Wuhan New World • Times Phase 2 Subsidiary 100% 296,187
11 Changsha Changsha La Ville New World Phase 4A* Subsidiary 95% 81,553
Changsha Changsha La Ville New World Phase 4B* Subsidiary 95% 230,732
Changsha Changsha La Ville New World Phase 4C* Subsidiary 95% 54,197
12 Yiyang Yiyang New World Scenic Heights Phase 1G Subsidiary 100% 11,019
Yiyang Yiyang New World Scenic Heights Phase 1F Subsidiary 100% 17,846
Yiyang Yiyang New World Scenic Heights Phase 2B Subsidiary 100% 14,360
Yiyang Yiyang New World Scenic Heights Phase 2C Subsidiary 100% 112,968
Yiyang Yiyang New World Scenic Heights Phase 2A Subsidiary 100% 56,897
Yiyang Yiyang New World Scenic Heights Remaining Phases Subsidiary 100% 138,305
Subtotal 1,140,200
Remarks:(1) TBC: To Be Confirmed(2) Certain property development projects will be classified as investment properties upon completion* Entered into a disposal agreement in September 2019
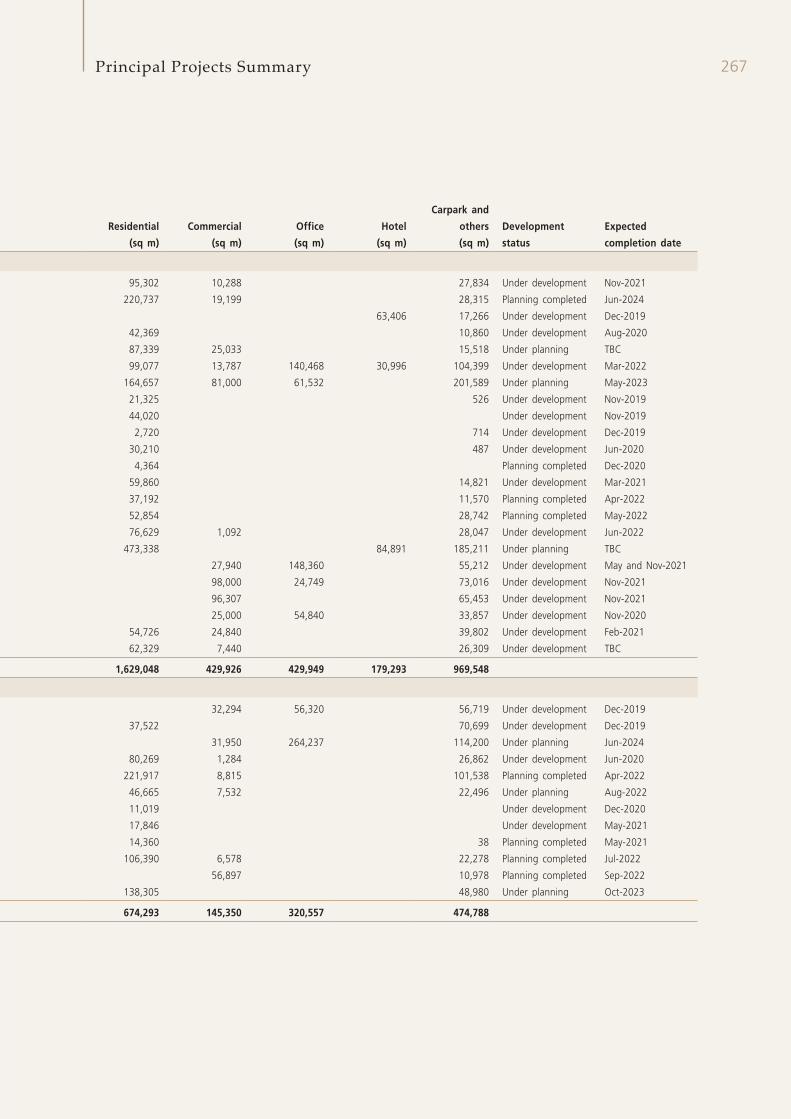
267Principal Projects Summary
Residential Commercial Office Hotel
Carpark and
others Development
status
Expected
completion date(sq m) (sq m) (sq m) (sq m) (sq m)
95,302 10,288 27,834 Under development Nov-2021
220,737 19,199 28,315 Planning completed Jun-2024
63,406 17,266 Under development Dec-2019
42,369 10,860 Under development Aug-2020
87,339 25,033 15,518 Under planning TBC
99,077 13,787 140,468 30,996 104,399 Under development Mar-2022
164,657 81,000 61,532 201,589 Under planning May-2023
21,325 526 Under development Nov-2019
44,020 Under development Nov-2019
2,720 714 Under development Dec-2019
30,210 487 Under development Jun-2020
4,364 Planning completed Dec-2020
59,860 14,821 Under development Mar-2021
37,192 11,570 Planning completed Apr-2022
52,854 28,742 Planning completed May-2022
76,629 1,092 28,047 Under development Jun-2022
473,338 84,891 185,211 Under planning TBC
27,940 148,360 55,212 Under development May and Nov-2021
98,000 24,749 73,016 Under development Nov-2021
96,307 65,453 Under development Nov-2021
25,000 54,840 33,857 Under development Nov-2020
54,726 24,840 39,802 Under development Feb-2021
62,329 7,440 26,309 Under development TBC
1,629,048 429,926 429,949 179,293 969,548
32,294 56,320 56,719 Under development Dec-2019
37,522 70,699 Under development Dec-2019
31,950 264,237 114,200 Under planning Jun-2024
80,269 1,284 26,862 Under development Jun-2020
221,917 8,815 101,538 Planning completed Apr-2022
46,665 7,532 22,496 Under planning Aug-2022
11,019 Under development Dec-2020
17,846 Under development May-2021
14,360 38 Planning completed May-2021
106,390 6,578 22,278 Planning completed Jul-2022
56,897 10,978 Planning completed Sep-2022
138,305 48,980 Under planning Oct-2023
674,293 145,350 320,557 474,788
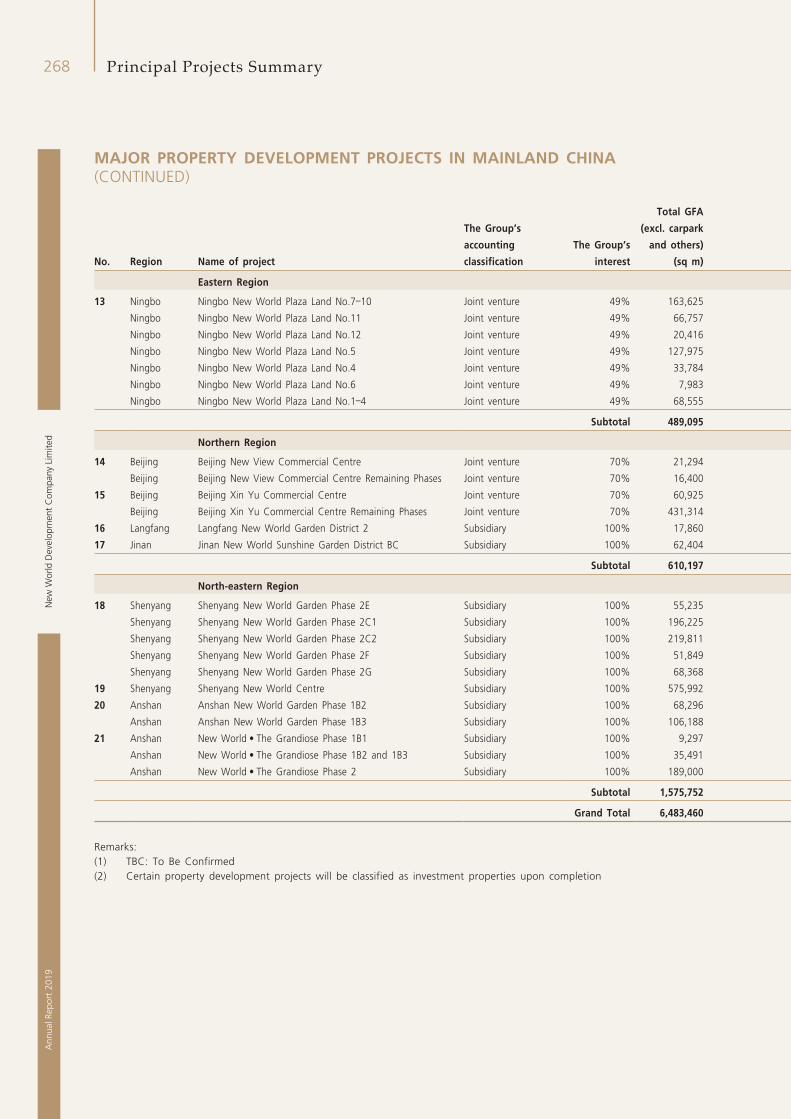
New
Wor
ld D
evel
opm
ent
Com
pany
Lim
ited
268A
nnua
l Rep
ort
2019
Principal Projects Summary
MAJOR PROPERTY DEVELOPMENT PROJECTS IN MAINLAND CHINA (CONTINUED)
The Group’s
accounting The Group’s
Total GFA
(excl. carpark
and others)
No. Region Name of project classification interest (sq m)
Eastern Region
13 Ningbo Ningbo New World Plaza Land No.7–10 Joint venture 49% 163,625
Ningbo Ningbo New World Plaza Land No.11 Joint venture 49% 66,757
Ningbo Ningbo New World Plaza Land No.12 Joint venture 49% 20,416
Ningbo Ningbo New World Plaza Land No.5 Joint venture 49% 127,975
Ningbo Ningbo New World Plaza Land No.4 Joint venture 49% 33,784
Ningbo Ningbo New World Plaza Land No.6 Joint venture 49% 7,983
Ningbo Ningbo New World Plaza Land No.1–4 Joint venture 49% 68,555
Subtotal 489,095
Northern Region
14 Beijing Beijing New View Commercial Centre Joint venture 70% 21,294
Beijing Beijing New View Commercial Centre Remaining Phases Joint venture 70% 16,400
15 Beijing Beijing Xin Yu Commercial Centre Joint venture 70% 60,925
Beijing Beijing Xin Yu Commercial Centre Remaining Phases Joint venture 70% 431,314
16 Langfang Langfang New World Garden District 2 Subsidiary 100% 17,860
17 Jinan Jinan New World Sunshine Garden District BC Subsidiary 100% 62,404
Subtotal 610,197
North-eastern Region
18 Shenyang Shenyang New World Garden Phase 2E Subsidiary 100% 55,235
Shenyang Shenyang New World Garden Phase 2C1 Subsidiary 100% 196,225
Shenyang Shenyang New World Garden Phase 2C2 Subsidiary 100% 219,811
Shenyang Shenyang New World Garden Phase 2F Subsidiary 100% 51,849
Shenyang Shenyang New World Garden Phase 2G Subsidiary 100% 68,368
19 Shenyang Shenyang New World Centre Subsidiary 100% 575,992
20 Anshan Anshan New World Garden Phase 1B2 Subsidiary 100% 68,296
Anshan Anshan New World Garden Phase 1B3 Subsidiary 100% 106,188
21 Anshan New World • The Grandiose Phase 1B1 Subsidiary 100% 9,297
Anshan New World • The Grandiose Phase 1B2 and 1B3 Subsidiary 100% 35,491
Anshan New World • The Grandiose Phase 2 Subsidiary 100% 189,000
Subtotal 1,575,752
Grand Total 6,483,460
Remarks:(1) TBC: To Be Confirmed(2) Certain property development projects will be classified as investment properties upon completion
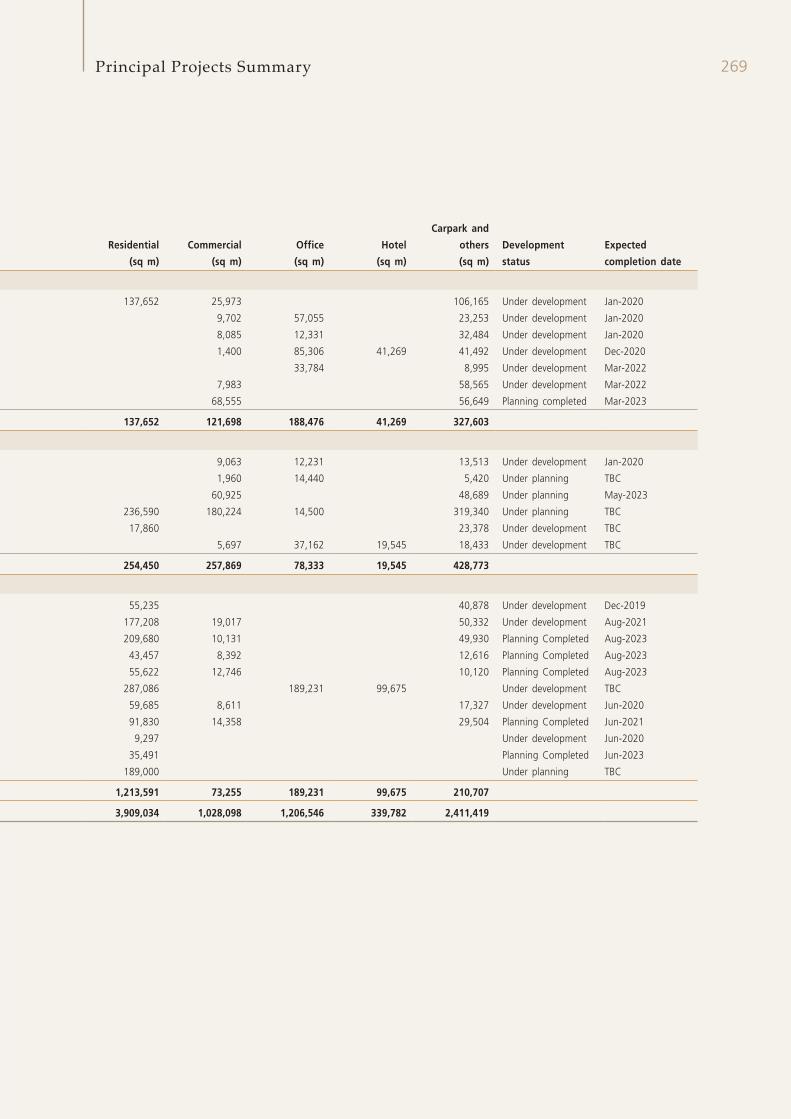
269Principal Projects Summary
Residential Commercial Office Hotel
Carpark and
others Development
status
Expected
completion date(sq m) (sq m) (sq m) (sq m) (sq m)
137,652 25,973 106,165 Under development Jan-2020
9,702 57,055 23,253 Under development Jan-2020
8,085 12,331 32,484 Under development Jan-2020
1,400 85,306 41,269 41,492 Under development Dec-2020
33,784 8,995 Under development Mar-2022
7,983 58,565 Under development Mar-2022
68,555 56,649 Planning completed Mar-2023
137,652 121,698 188,476 41,269 327,603
9,063 12,231 13,513 Under development Jan-2020
1,960 14,440 5,420 Under planning TBC
60,925 48,689 Under planning May-2023
236,590 180,224 14,500 319,340 Under planning TBC
17,860 23,378 Under development TBC
5,697 37,162 19,545 18,433 Under development TBC
254,450 257,869 78,333 19,545 428,773
55,235 40,878 Under development Dec-2019
177,208 19,017 50,332 Under development Aug-2021
209,680 10,131 49,930 Planning Completed Aug-2023
43,457 8,392 12,616 Planning Completed Aug-2023
55,622 12,746 10,120 Planning Completed Aug-2023
287,086 189,231 99,675 Under development TBC
59,685 8,611 17,327 Under development Jun-2020
91,830 14,358 29,504 Planning Completed Jun-2021
9,297 Under development Jun-2020
35,491 Planning Completed Jun-2023
189,000 Under planning TBC
1,213,591 73,255 189,231 99,675 210,707
3,909,034 1,028,098 1,206,546 339,782 2,411,419
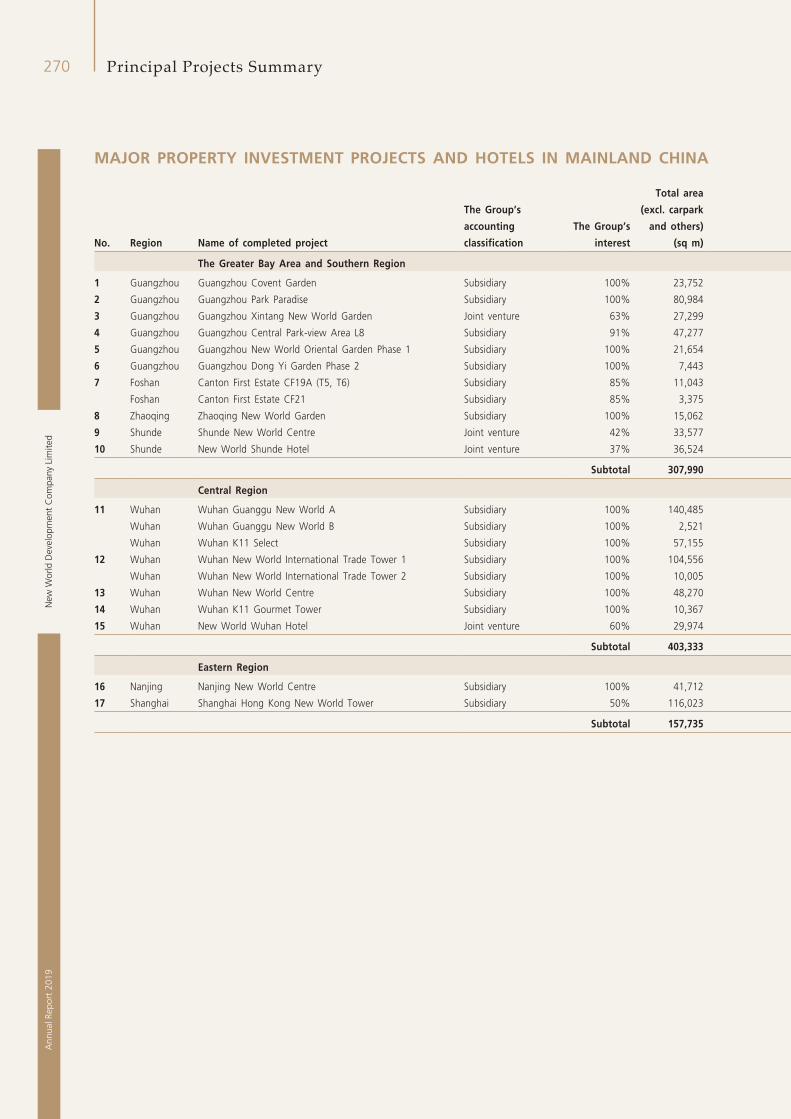
New
Wor
ld D
evel
opm
ent
Com
pany
Lim
ited
270A
nnua
l Rep
ort
2019
Principal Projects Summary
MAJOR PROPERTY INVESTMENT PROJECTS AND HOTELS IN MAINLAND CHINA
The Group’s
accounting The Group’s
Total area
(excl. carpark
and others)
No. Region Name of completed project classification interest (sq m)
The Greater Bay Area and Southern Region
1 Guangzhou Guangzhou Covent Garden Subsidiary 100% 23,752
2 Guangzhou Guangzhou Park Paradise Subsidiary 100% 80,984
3 Guangzhou Guangzhou Xintang New World Garden Joint venture 63% 27,299
4 Guangzhou Guangzhou Central Park-view Area L8 Subsidiary 91% 47,277
5 Guangzhou Guangzhou New World Oriental Garden Phase 1 Subsidiary 100% 21,654
6 Guangzhou Guangzhou Dong Yi Garden Phase 2 Subsidiary 100% 7,443
7 Foshan Canton First Estate CF19A (T5, T6) Subsidiary 85% 11,043
Foshan Canton First Estate CF21 Subsidiary 85% 3,375
8 Zhaoqing Zhaoqing New World Garden Subsidiary 100% 15,062
9 Shunde Shunde New World Centre Joint venture 42% 33,577
10 Shunde New World Shunde Hotel Joint venture 37% 36,524
Subtotal 307,990
Central Region
11 Wuhan Wuhan Guanggu New World A Subsidiary 100% 140,485
Wuhan Wuhan Guanggu New World B Subsidiary 100% 2,521
Wuhan Wuhan K11 Select Subsidiary 100% 57,155
12 Wuhan Wuhan New World International Trade Tower 1 Subsidiary 100% 104,556
Wuhan Wuhan New World International Trade Tower 2 Subsidiary 100% 10,005
13 Wuhan Wuhan New World Centre Subsidiary 100% 48,270
14 Wuhan Wuhan K11 Gourmet Tower Subsidiary 100% 10,367
15 Wuhan New World Wuhan Hotel Joint venture 60% 29,974
Subtotal 403,333
Eastern Region
16 Nanjing Nanjing New World Centre Subsidiary 100% 41,712
17 Shanghai Shanghai Hong Kong New World Tower Subsidiary 50% 116,023
Subtotal 157,735
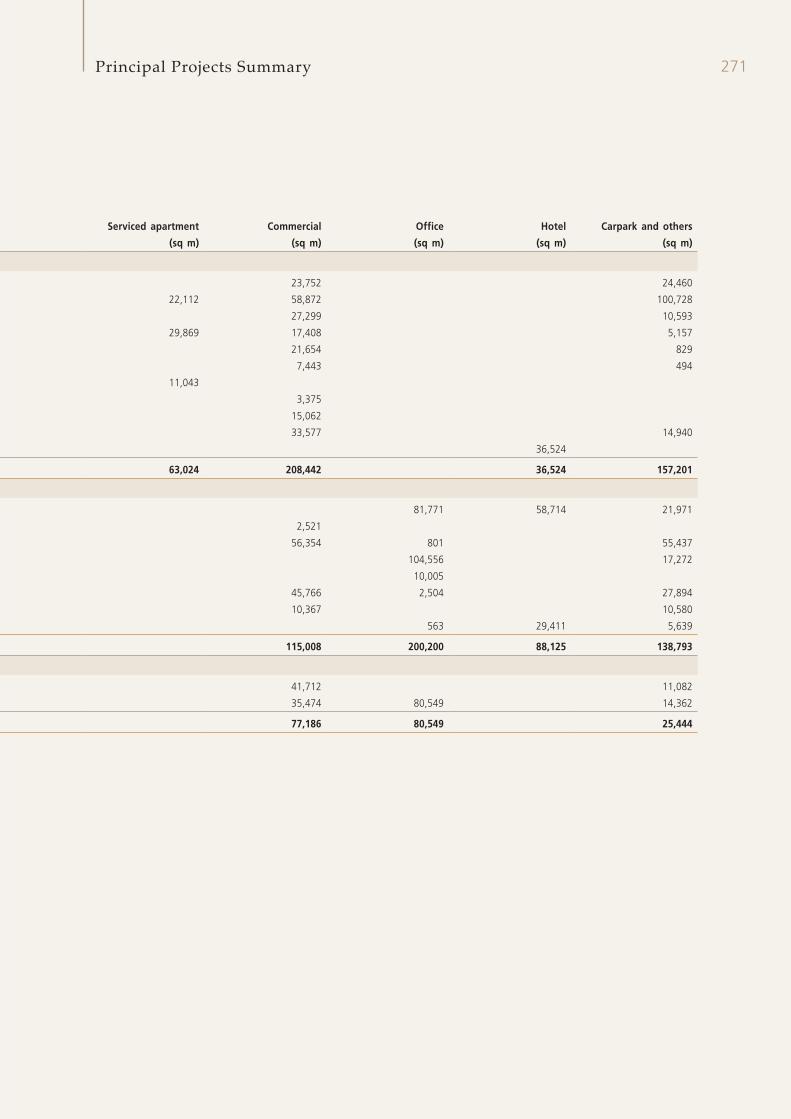
271Principal Projects Summary
Serviced apartment Commercial Office Hotel Carpark and others
(sq m) (sq m) (sq m) (sq m) (sq m)
23,752 24,460
22,112 58,872 100,728
27,299 10,593
29,869 17,408 5,157
21,654 829
7,443 494
11,043
3,375
15,062
33,577 14,940
36,524
63,024 208,442 36,524 157,201
81,771 58,714 21,971
2,521
56,354 801 55,437
104,556 17,272
10,005
45,766 2,504 27,894
10,367 10,580
563 29,411 5,639
115,008 200,200 88,125 138,793
41,712 11,082
35,474 80,549 14,362
77,186 80,549 25,444
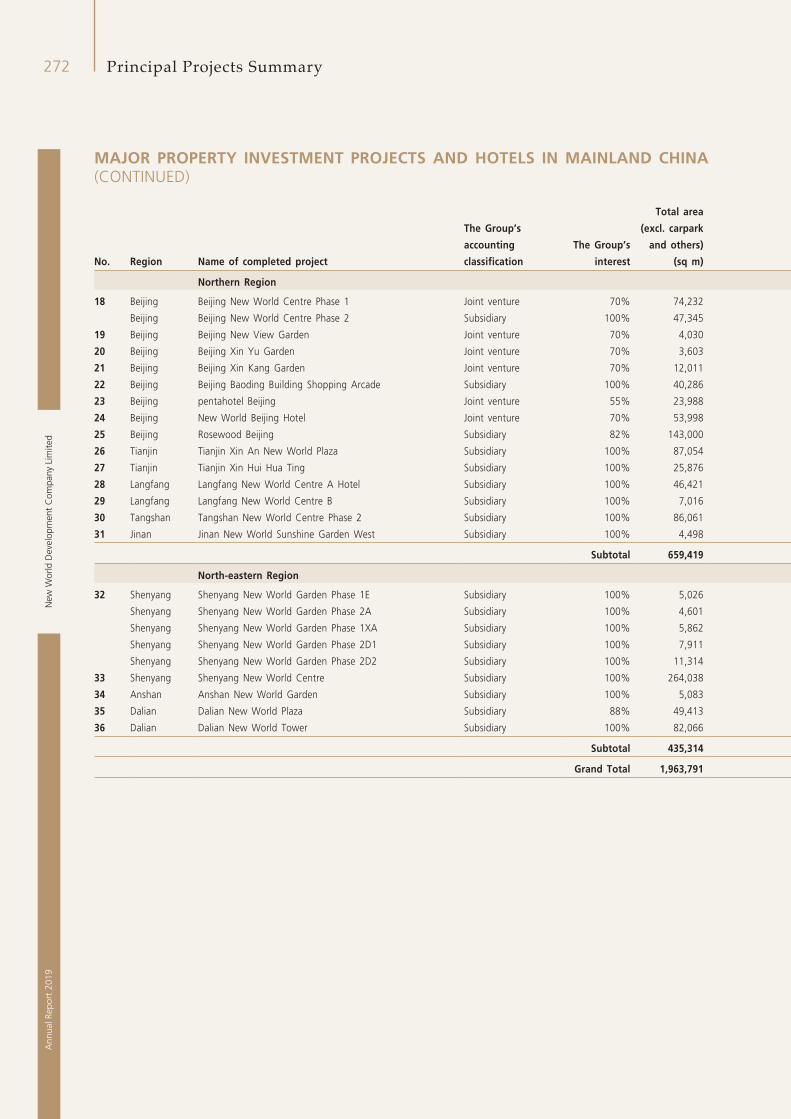
New
Wor
ld D
evel
opm
ent
Com
pany
Lim
ited
272A
nnua
l Rep
ort
2019
Principal Projects Summary
MAJOR PROPERTY INVESTMENT PROJECTS AND HOTELS IN MAINLAND CHINA (CONTINUED)
The Group’s
accounting The Group’s
Total area
(excl. carpark
and others)
No. Region Name of completed project classification interest (sq m)
Northern Region
18 Beijing Beijing New World Centre Phase 1 Joint venture 70% 74,232
Beijing Beijing New World Centre Phase 2 Subsidiary 100% 47,345
19 Beijing Beijing New View Garden Joint venture 70% 4,030
20 Beijing Beijing Xin Yu Garden Joint venture 70% 3,603
21 Beijing Beijing Xin Kang Garden Joint venture 70% 12,011
22 Beijing Beijing Baoding Building Shopping Arcade Subsidiary 100% 40,286
23 Beijing pentahotel Beijing Joint venture 55% 23,988
24 Beijing New World Beijing Hotel Joint venture 70% 53,998
25 Beijing Rosewood Beijing Subsidiary 82% 143,000
26 Tianjin Tianjin Xin An New World Plaza Subsidiary 100% 87,054
27 Tianjin Tianjin Xin Hui Hua Ting Subsidiary 100% 25,876
28 Langfang Langfang New World Centre A Hotel Subsidiary 100% 46,421
29 Langfang Langfang New World Centre B Subsidiary 100% 7,016
30 Tangshan Tangshan New World Centre Phase 2 Subsidiary 100% 86,061
31 Jinan Jinan New World Sunshine Garden West Subsidiary 100% 4,498
Subtotal 659,419
North-eastern Region
32 Shenyang Shenyang New World Garden Phase 1E Subsidiary 100% 5,026
Shenyang Shenyang New World Garden Phase 2A Subsidiary 100% 4,601
Shenyang Shenyang New World Garden Phase 1XA Subsidiary 100% 5,862
Shenyang Shenyang New World Garden Phase 2D1 Subsidiary 100% 7,911
Shenyang Shenyang New World Garden Phase 2D2 Subsidiary 100% 11,314
33 Shenyang Shenyang New World Centre Subsidiary 100% 264,038
34 Anshan Anshan New World Garden Subsidiary 100% 5,083
35 Dalian Dalian New World Plaza Subsidiary 88% 49,413
36 Dalian Dalian New World Tower Subsidiary 100% 82,066
Subtotal 435,314
Grand Total 1,963,791
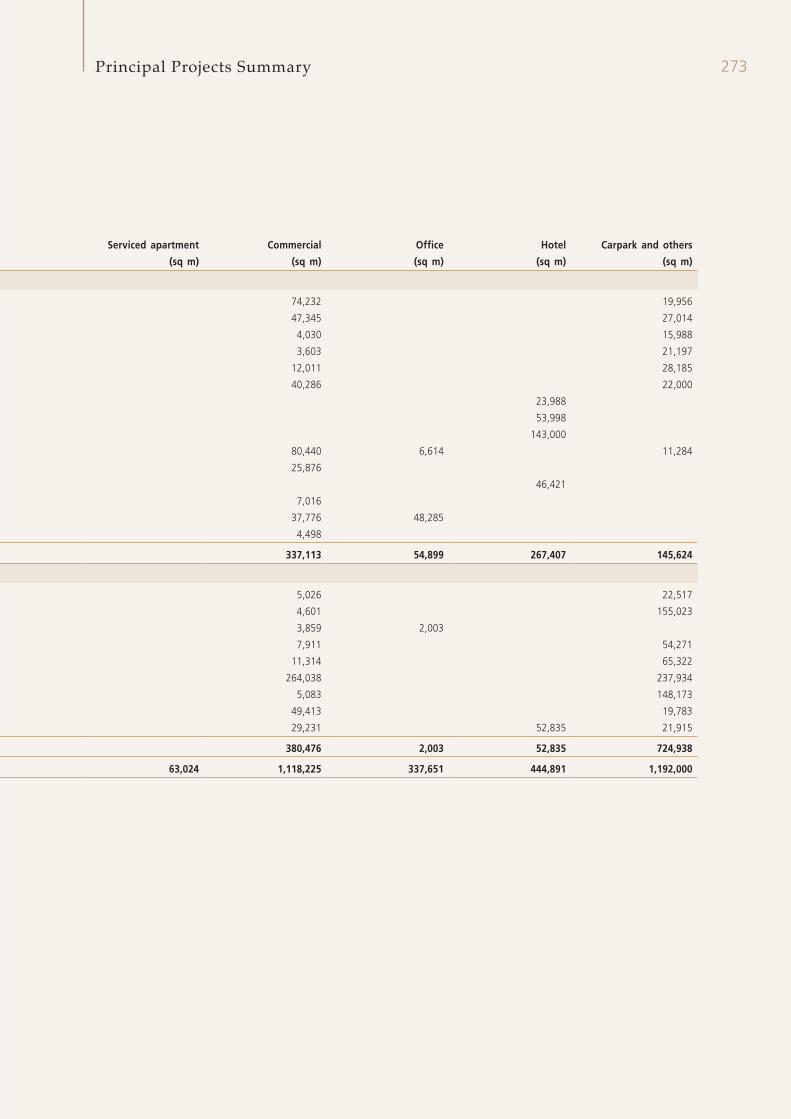
273Principal Projects Summary
Serviced apartment Commercial Office Hotel Carpark and others
(sq m) (sq m) (sq m) (sq m) (sq m)
74,232 19,956
47,345 27,014
4,030 15,988
3,603 21,197
12,011 28,185
40,286 22,000
23,988
53,998
143,000
80,440 6,614 11,284
25,876
46,421
7,016
37,776 48,285
4,498
337,113 54,899 267,407 145,624
5,026 22,517
4,601 155,023
3,859 2,003
7,911 54,271
11,314 65,322
264,038 237,934
5,083 148,173
49,413 19,783
29,231 52,835 21,915
380,476 2,003 52,835 724,938
63,024 1,118,225 337,651 444,891 1,192,000
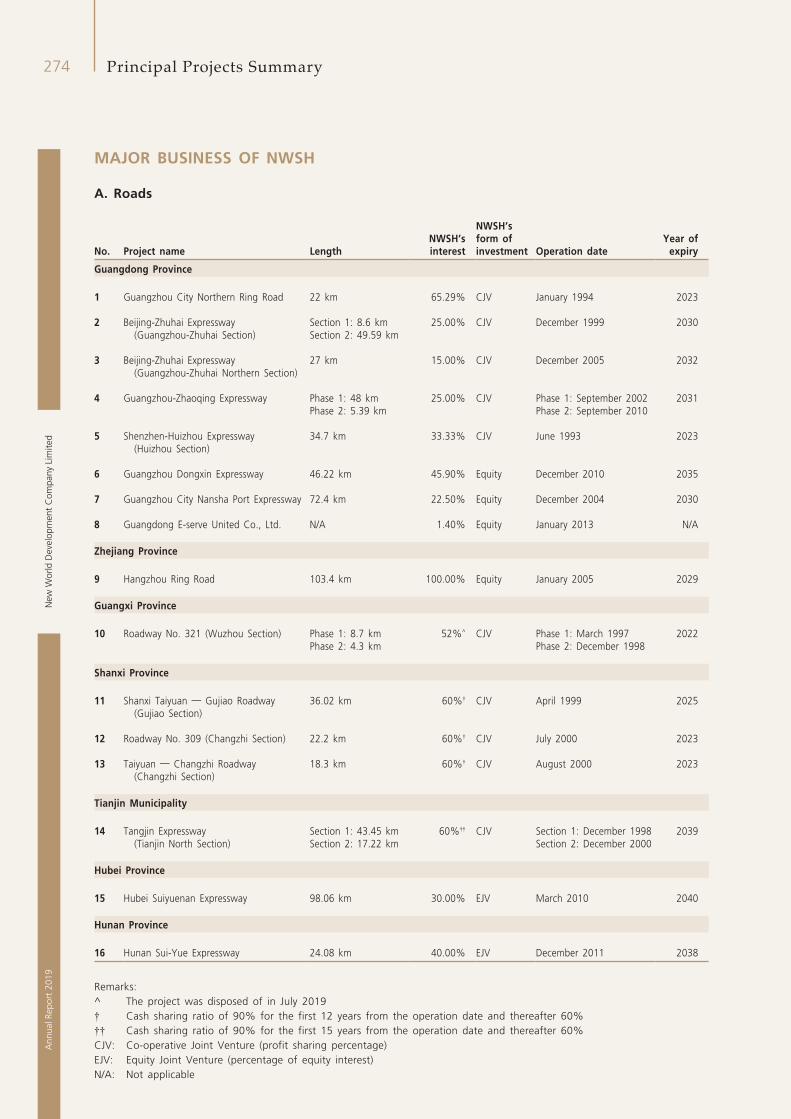
New
Wor
ld D
evel
opm
ent
Com
pany
Lim
ited
274A
nnua
l Rep
ort
2019
Principal Projects Summary
MAJOR BUSINESS OF NWSH
A. Roads
No. Project name LengthNWSH’s interest
NWSH’s form of investment Operation date
Year of expiry
Guangdong Province
1 Guangzhou City Northern Ring Road 22 km 65.29% CJV January 1994 2023
2 Beijing-Zhuhai Expressway (Guangzhou-Zhuhai Section)
Section 1: 8.6 kmSection 2: 49.59 km
25.00% CJV December 1999 2030
3 Beijing-Zhuhai Expressway (Guangzhou-Zhuhai Northern Section)
27 km 15.00% CJV December 2005 2032
4 Guangzhou-Zhaoqing Expressway Phase 1: 48 kmPhase 2: 5.39 km
25.00% CJV Phase 1: September 2002Phase 2: September 2010
2031
5 Shenzhen-Huizhou Expressway (Huizhou Section)
34.7 km 33.33% CJV June 1993 2023
6 Guangzhou Dongxin Expressway 46.22 km 45.90% Equity December 2010 2035
7 Guangzhou City Nansha Port Expressway 72.4 km 22.50% Equity December 2004 2030
8 Guangdong E-serve United Co., Ltd. N/A 1.40% Equity January 2013 N/A
Zhejiang Province
9 Hangzhou Ring Road 103.4 km 100.00% Equity January 2005 2029
Guangxi Province
10 Roadway No. 321 (Wuzhou Section) Phase 1: 8.7 kmPhase 2: 4.3 km
52%^ CJV Phase 1: March 1997 Phase 2: December 1998
2022
Shanxi Province
11 Shanxi Taiyuan — Gujiao Roadway (Gujiao Section)
36.02 km 60%† CJV April 1999 2025
12 Roadway No. 309 (Changzhi Section) 22.2 km 60%† CJV July 2000 2023
13 Taiyuan — Changzhi Roadway (Changzhi Section)
18.3 km 60%† CJV August 2000 2023
Tianjin Municipality
14 Tangjin Expressway (Tianjin North Section)
Section 1: 43.45 kmSection 2: 17.22 km
60%†† CJV Section 1: December 1998 Section 2: December 2000
2039
Hubei Province
15 Hubei Suiyuenan Expressway 98.06 km 30.00% EJV March 2010 2040
Hunan Province
16 Hunan Sui-Yue Expressway 24.08 km 40.00% EJV December 2011 2038
Remarks:^ The project was disposed of in July 2019† Cash sharing ratio of 90% for the first 12 years from the operation date and thereafter 60%†† Cash sharing ratio of 90% for the first 15 years from the operation date and thereafter 60%CJV: Co-operative Joint Venture (profit sharing percentage)EJV: Equity Joint Venture (percentage of equity interest)N/A: Not applicable
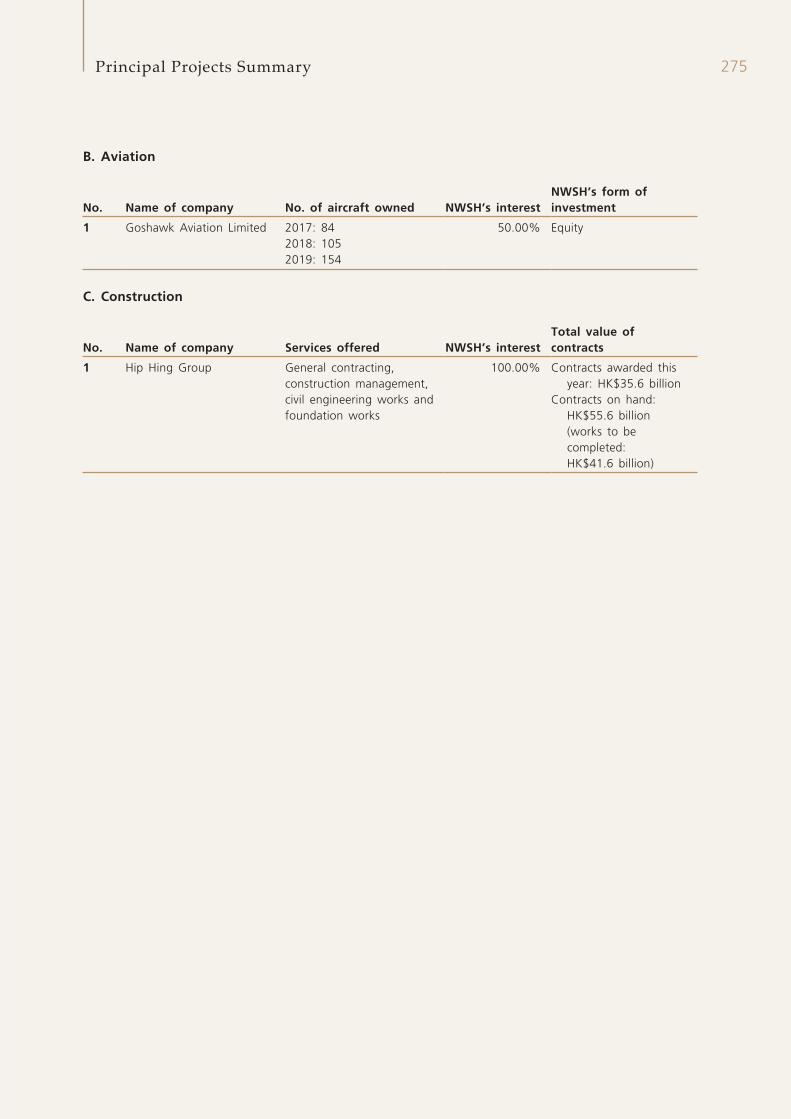
275Principal Projects Summary
B. Aviation
No. Name of company No. of aircraft owned NWSH’s interestNWSH’s form of investment
1 Goshawk Aviation Limited 2017: 842018: 1052019: 154
50.00% Equity
C. Construction
No. Name of company Services offered NWSH’s interestTotal value of contracts
1 Hip Hing Group General contracting, construction management, civil engineering works and foundation works
100.00% Contracts awarded this year: HK$35.6 billion
Contracts on hand: HK$55.6 billion (works to be completed: HK$41.6 billion)
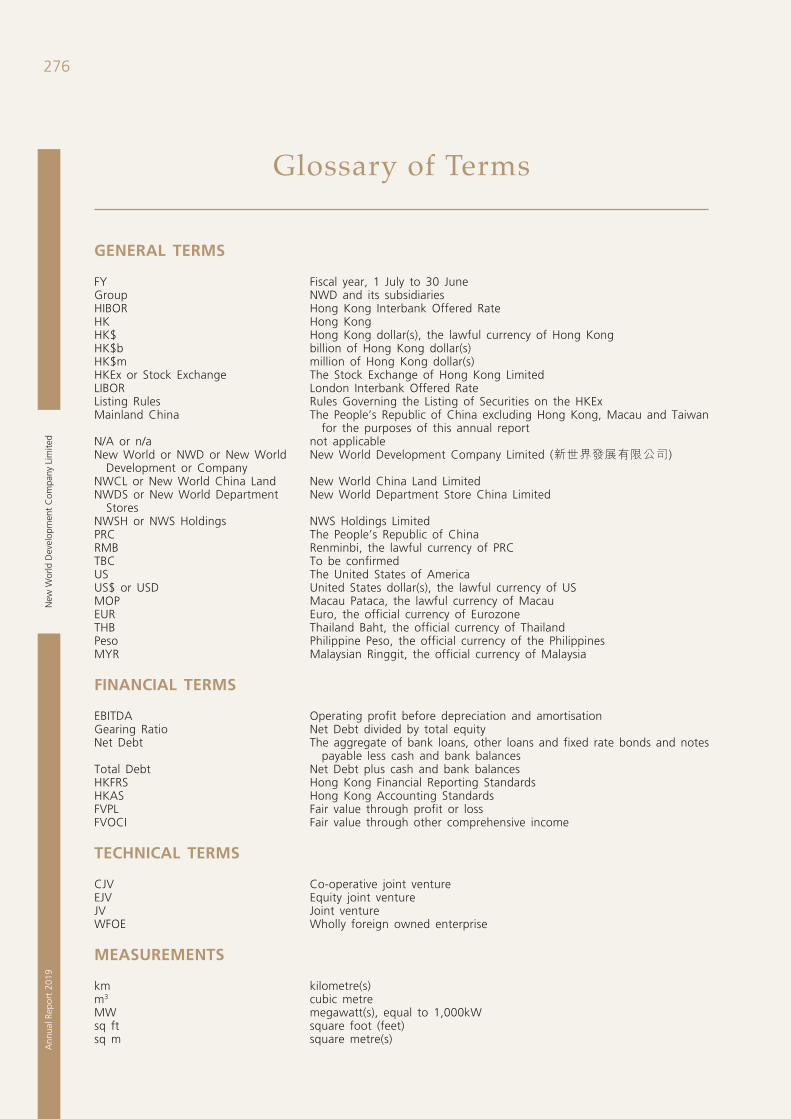
New
Wor
ld D
evel
opm
ent
Com
pany
Lim
ited
276A
nnua
l Rep
ort
2019
Glossary of Terms
GENERAL TERMS
FY Fiscal year, 1 July to 30 JuneGroup NWD and its subsidiariesHIBOR Hong Kong Interbank Offered RateHK Hong KongHK$ Hong Kong dollar(s), the lawful currency of Hong KongHK$b billion of Hong Kong dollar(s)HK$m million of Hong Kong dollar(s)HKEx or Stock Exchange The Stock Exchange of Hong Kong LimitedLIBOR London Interbank Offered RateListing Rules Rules Governing the Listing of Securities on the HKExMainland China The People’s Republic of China excluding Hong Kong, Macau and Taiwan
for the purposes of this annual reportN/A or n/a not applicableNew World or NWD or New World
Development or CompanyNew World Development Company Limited (新世界發展有限公司)
NWCL or New World China Land New World China Land LimitedNWDS or New World Department
StoresNew World Department Store China Limited
NWSH or NWS Holdings NWS Holdings LimitedPRC The People’s Republic of ChinaRMB Renminbi, the lawful currency of PRCTBC To be confirmedUS The United States of AmericaUS$ or USD United States dollar(s), the lawful currency of USMOP Macau Pataca, the lawful currency of MacauEUR Euro, the official currency of EurozoneTHB Thailand Baht, the official currency of ThailandPeso Philippine Peso, the official currency of the PhilippinesMYR Malaysian Ringgit, the official currency of Malaysia
FINANCIAL TERMS
EBITDA Operating profit before depreciation and amortisationGearing Ratio Net Debt divided by total equityNet Debt The aggregate of bank loans, other loans and fixed rate bonds and notes
payable less cash and bank balancesTotal Debt Net Debt plus cash and bank balancesHKFRS Hong Kong Financial Reporting StandardsHKAS Hong Kong Accounting StandardsFVPL Fair value through profit or lossFVOCI Fair value through other comprehensive income
TECHNICAL TERMS
CJV Co-operative joint ventureEJV Equity joint ventureJV Joint ventureWFOE Wholly foreign owned enterprise
MEASUREMENTS
km kilometre(s)m3 cubic metreMW megawatt(s), equal to 1,000kWsq ft square foot (feet)sq m square metre(s)

30/F, New World Tower, 18 Queen’s Road Central, Hong KongTel: (852) 2523 1056 Fax: (852) 2810 4673www.nwd.com.hk
New World Development Company Limited takes every practicable measure to conserve resources and minimise waste.
(Stock Code: 0017)
ANNUAL REPORT 2019
diecut