Annual Report (2018 –2019) Scaling Up Resilient Agricultural ...
79
Submitted to: Annual Report (2018 –2019) Scaling Up Resilient Agricultural Practices, Technologies and Services in the Vulnerable Areas of India Date: October 25, 2019 Simrat Labana Project Management Specialist (Agriculture) USAID/India From: BISA-CIMMYT New Delhi, India COOPERATIVE AGREEMENT NO.: BFS-IO-17-00005 CGIAR2 2017
-
Upload
khangminh22 -
Category
Documents
-
view
1 -
download
0
Transcript of Annual Report (2018 –2019) Scaling Up Resilient Agricultural ...

Submitted to:
Annual Report
(2018 –2019)
Scaling Up Resilient Agricultural Practices, Technologies
and Services in the Vulnerable Areas of India
Date: October 25, 2019
Simrat Labana
Project Management Specialist (Agriculture)
USAID/India
From:
BISA-CIMMYT
New Delhi, India
COOPERATIVE AGREEMENT NO.: BFS-IO-17-00005 CGIAR2 2017

Annual Report 2018-19
Page 1 of 78
LIST OF ACRONYMS AND ABBREVIATIONS
CCAFS Weather Change, Agriculture and Food Security
CGIAR Consultative Group of International Agriculture Research
CIMMYT Centro Internacional de Mejoramiento de Maíz y Trigo (International Maize
and Wheat Improvement Center)
CSA Weather Smart Agriculture
CSR Corporate Social Responsibility
CSV Weather Smart Village
CV Coefficient of Variation
FPOs Farmers Producers Organizations
ICAR Indian Council of Agricultural Research
ICT Information and Communication Technologies
KVK Krishi Vigyan Kendras
LCC Leaf Color Chart
LLL Laser Land Leveler
NGOs Non-Governmental Organizations
NICRA National Initiative for Climate Resilient Agriculture
USAID United States Agency for International Development

Annual Report 2018-19
Page 2 of 78
Contents 1. EXECUTIVE SUMMARY .................................................................................................... 4
2. PROGRAM OVERVIEW AND PERFORMANCE .............................................................. 7
A. Results Framework ........................................................................................................... 7
B. Key Accomplishments and Developments in the Third Year (FY 2018-19) ................... 9
The resilience framework ....................................................................................................... 9
Reporting structure................................................................................................................ 11
Section 1: Improvements in yield and income through adoption of CSA options at
household level ..................................................................................................................... 13
Section 2: Developing community resilience ....................................................................... 24
Section 3: Mitigating climate impacts on environment through reduction in GHG emissions
and improving nutrient use efficiency .................................................................................. 35
Section 4: Sustainability and Scalability of project interventions ........................................ 39
C. Target performance indicators for Second Year (2018-19) ........................................... 45
D. Monitoring and Evaluation Activities ............................................................................ 47
Midline Survey...................................................................................................................... 47
E. Field Visits ..................................................................................................................... 48
F. Success Stories ................................................................................................................... 49
G. Leverage, Cost Share and Financial Monitoring ............................................................ 53
H. Organizational Learning, Development and Collaboration ........................................... 54
A. Anticipated Activities for 2019-2020 ............................................................................. 57
B. Media Coverage Received in 2018-19 ........................................................................... 59
Magazine Article ................................................................................................................... 59
News coverage ...................................................................................................................... 60
C. Communications and Dissemination Activities ............................................................. 60
Webpage ............................................................................................................................... 60
Publications ........................................................................................................................... 61
Blogs ..................................................................................................................................... 61
Newsletter Article ................................................................................................................. 61
3. Annex .................................................................................................................................... 62
A. FTF M&E Indicator Sheet ................................................................................................... 62
Annual Report 2018-19
Page 3 of 78
B. Financial Reporting: FS-425 ................................................................................................ 64
This will be submitted separately via the PMU team. .............................................................. 64
C. Environmental Mitigation and Monitoring (2018-2019) ..................................................... 64
F. Key Project Personal............................................................................................................. 65
4. Appendix ............................................................................................................................... 66
A. Number of super champion, champion and CSA farmers in the selected villages ........ 66
B. List of Weather Resilient Technologies, Practices and Services ................................... 69
C. Progress of project activities .......................................................................................... 71
1. Demo plots ........................................................................................................................ 71
2.Trainings ............................................................................................................................ 73
Progress of trainings and participants in the last two years for Betul district ....................... 73
Progress of trainings and participants in the last two years for Mathura district .................. 73
Progress of trainings and participants in the last two years for Nalanda district .................. 74
3. Convergence ..................................................................................................................... 75
4. Women engaged in micro-enterprise…………………………………………………….79

Annual Report 2018-19
Page 4 of 78
1. EXECUTIVE SUMMARY
In the last few decades, India has made great strides in agriculture and food security. Despite
this, the country has one-fifth of the world’s hungry people and 40 percent of the world’s
malnourished children and women. Producing food sustainably, with shrinking land and water
resources, to meet the needs of a growing population in a changing climate scenario is a herculean
task. Smallholder farmers in India face unprecedented uncertainties including increasing
frequency of extreme weather events such as droughts, floods, heatwaves and hailstorms. As a
result, their yields fluctuate, and their incomes vary with potential impact on their long-term
resilience. There is therefore an urgent need to identify cost-effective, inclusive (with a focus on
gender and socially marginalized groups) and evidence-based integrated solutions to enhance the
adaptive capacity of vulnerable farming communities.
USAID/ India has partnered with Climate Change, Agriculture and Food Security (CCAFS),
South Asia (CCAFS), for a four-year intervention (October 2016 – June 2020) to scale out
weather-resilient agricultural interventions through the Climate Smart Village (CSV) approach.
The focus is generally on a basket of synergistic options, rather than on single technology to
improve cropping and livestock development in targeted areas as a means of enhancing
resilience to climate variability. CCAFS provides technical leadership and overall guidance to
BAIF (an NGO) which is implementing the project on the ground. The project demonstrated a
portfolio of weather resilient technologies, practices and services in 75 villages of Uttar Pradesh
(Mathura district), Bihar (Nalanda district) and Madhya Pradesh (Betul district).
In FY 2019, 11,250 farmers were able to access climate resilient agricultural technologies and best
practices in 75 clusters of villages in eastern India (Bihar, Uttar Pradesh, and Madhya Pradesh). A
suite of 16 technologies/practices/services were targeted at 75 super champion, 1,050 champion
and 10,125 CSA farmers in three districts. The project held 232 trainings and capacity building
activities for 6,281 farmers (Betul- 1,891; Nalanda- 2,545; and Mathura- 1,845), with 32%
participation from women (2,019 numbers) enrolled in the project. The training mainly included
implementation of CSA package of practices in the farmers’ field, preparation of organic
fertilizers, pesticides and vermicomposting, as well as livestock related activities.
The project in partnership with IFFCO Kisan Sanchar Ltd, a private sector ICT provider, is
disseminating weather and climatic information using existing scientific knowledge and farm
conditions to all project farmers. A short survey conducted with a sample of 180 farmers this
year to evaluate the ICT services. Results highlighted that majority of the farmers across districts
prefer the voice messages compared to the text messages as it is easier to understand. While crop
related advisory is highly preferred in Betul and Nalanda, Mathura farmers prefer weather related
advisory as much as crop based. The information provided has been proven useful for most of
the farmers in the three districts and they have used the information to implement changes in the
field within a few days. Almost all farmers expressed interest in continuing the services post

Annual Report 2018-19
Page 5 of 78
project period however the willingness to pay was not in accordance, ranging from 54% of
respondents in Betul to only 23% in Nalanda.
The project also focused on developing water-smart interventions in Betul this year. Four types
of structures have been promoted including wells, farm ponds, check dams and micro-irrigation
such as drip system. This intervention has benefitted 107 households and increased irrigated area
by 51 hectares till date. Majority of the structures were financed through convergence.
The project has developed a very gender inclusive approach from the very beginning. Of the total
11,250 farmers, the project has enrolled more than 4,500 number of women, majorly from Betul,
for uptake and implementation of project activities. The project has adopted a systematic
approach to integrate gender across the key stages of adaptation for which a framework has been
highlighted. Participation of women farmers in trainings has increased significantly, with 2019
women participants this year compared to only 483 last year.
Combining global scientific knowledge with local needs and priorities, the project has made
weather smart technologies, practices and services available to all farmers through innovative local
institutions such as the Custom Hiring Center (CHC) and Cattle Development Center (CDC). In
FY 2019, the project has continued to strengthen 13 CHCs and three CDCs in the project districts.
Cattle improvement is being carried out through Artificial Insemination with over 2,159 animals
having been inseminated this year and 61% of those diagnosed have confirmed pregnancy.
Demonstration and evaluation of weather resilient technologies covers 606 acres of agricultural
land this year and shows significant improvement in yield and incomes of farmers. Seed
replacement with improved seeds, seed treatment before sowing, change in sowing/transplanting
methods, integrated and precision nutrients management, and new water management techniques
such as system of rice intensification (SRI) helped to improve crop yields in the project areas. On
an average, yields have increase by 60% over baseline in the past one year. For instance, yields of
wheat, paddy, gram and pearl millet have improved by 55%, 68%,62% and 57%, respectively.
Similarly, gross incomes have also improved by 92% (Rs. 31,037 per hectare or approx. $437 per
hectare). As an example, farmer incomes have improved by 75%, 102%,87% and 131% for wheat,
paddy, gram and pearl millet respectively.
Extensive outreach and demonstrations have taken place throughout the year for dissemination of
weather resilient technologies and sharing of project results to larger audiences. The project has
established 2,375 number of demo plots in farmer fields covering 606 acres (equivalent to 245
hectare) in all three districts to trail new technologies and package of practice. Capacity building
indirectly focuses on crop related practices in all districts, with trainings also provided for use of
weather information and agro-advisory services and enrollment in the agriculture insurance
program in Mathura and Nalanda.
Annual Report 2018-19
Page 6 of 78
Nutrient use efficiency has increased by 171% over baseline in all three districts for all crops. Seed
replacement with improved seeds, seed treatment before sowing, change in sowing/transplanting
methods, integrated and precision nutrients management, and new water management techniques
such as system of rice intensification (SRI) helped to improve crop yields in the project areas.
Agriculture and livestock are major contributors to the rising emissions of Greenhouse Gases
(GHG). Excess usage of inorganic fertilizers such as Urea contributes to the increase in emission
of the greenhouse gas. The project promoted reduction in Urea input by partially replacing it
with Vermicompost and INM practices for all crops, which has resulted in reduced usage of Urea
and 62% reduction in overall CO2 emission per ton of crop production. Additionally, 32 bio-gas
plants are also contributing to the reduction of the overall carbon footprint from the project
activities.
The project is working in coordination with multiple government departments which has resulted
in leveraging funds of approximately USD 270,506 (INR. 191 lakhs) through several national
flagship programs like Mahatma Gandhi National Rural Employment Guarantee Scheme
(MNREGS), and National Mission for Sustainable Agriculture (NMSA). Convergence with
government schemes and programs has been very high in Betul and Mathura districts with more
than 7,100 project households being benefitted through agriculture and livestock related activities.
New seed distribution and soil health cards have been the most penetrated activities in agriculture
in Betul followed by water-based interventions including sprinkler. New seed distribution in
Mathura and Horticulture training in Nalanda have been the major activities. The project has also
attracted the visits of government officials in Betul and Nalanda district where they have seen the
paddy demo plots and azola units, respectively.
The project developed numerous digital outreach and communication materials for external
audiences such as a project webpage, articles, info-notes and blogs on CCAFS website and
publications that were re-printed / hosted on other websites. Section 2-K (Communications and
Dissemination Activities) has a compilation of all the articles and reports produced by the project
team.
The project has been provided a no-cost extension for the period October 2019 till June 2020.
Key activities for this period include completion of the remaining field and community-
based activities; develop convergence plans with ongoing national flagship programs
and develop high value communication products and models to support scaling up/out of weather
resilient agricultural technologies, practices and services in similar locations. In addition to this,
the project will outline sustainability pathways that can be adopted by communities to adapt or
respond to climate shocks or stresses, beyond the life of the project.

Annual Report 2018-19
Page 7 of 78
2. PROGRAM OVERVIEW AND PERFORMANCE
A. Results Framework
The key goal of this project is to use global and regional knowledge and skills to build resilient
agricultural production system in food insecure and vulnerable areas of the Ingo-Gangetic Plain
(IGP) region through Climate Smart Village (CSV) approach. The focus is generally on a basket
of synergistic options, rather than on single technologies. Major activities include: i) strategic
design of land use options including priority crops, technologies and practices based on agro-
ecological analysis and farmer typologies, ii) promoting weather resilient technologies and
maximizing synergies among interventions; iii) providing value-added information services
including insurance to farmers; iv) facilitating community partnership for knowledge sharing; and
implementation of weather resilient technologies and scaling-out through outreach activities like
farmers’ fairs and videos; and vi) scaling-up through linkages with on-going government schemes
and programs. The project has four major objectives:
1. To scale out weather resilient agricultural technologies, practices and services 75 clusters
of villages in eastern India (Bihar, Uttar Pradesh, and Madhya Pradesh as shown in Picture
1) to build additional evidence for scaling out weather-smart agriculture;
2. To develop new business and institutional models on the CSV approach involving local
organizations, agriculture departments and the private sector (input suppliers, insurance
and ICT companies, and agri-business entrepreneurs) to reach scale;
3. To reach scale by strengthening the capacity of farmers-producers’ groups (FPOs), local
organizations (community based organizations and NGOs), agencies dealing with CSR
Funds, national and international weather adaptation funds, local government involved in
adaptation to weather change in implementing CSV approach; and
4. To promote South-South cooperation to enable other developing countries (especially
Nepal and Bangladesh) to adopt and learn from lessons in India for reaching scale in their
own countries on weather-smart agriculture
This project is implemented in collaboration with local partners, ICT company (for weather
information, agro-advisory and market linkage), insurance industry (for crop insurance program),
input suppliers (for seeds, fertilizers and machines), and national agriculture research systems
(knowledge partners). The project aims to provide direct benefit of weather adaptation to 11,050
farmers and indirect benefits to 50,000 farmers in the project sites. These indirect benefits will be
measured based on coverage areas of project and potential scaling of demonstrated weather
resilient technologies, practices and services.
The target performance indicators of this project include: i) number of farmers/farm households
who have implemented weather resilient agricultural technologies and practices in their farms, ii)
number/amount of technologies or management practices under research, under field testing, or
made available for transfer as a result of project assistance, iii) number of hectares of land under
CSA technology and practice with project assistance, and iv) number of trainings, workshops, farm

Annual Report 2018-19
Page 8 of 78
visits, farm fairs provided to farmers as well as stakeholders organizations. The envisioned
outcomes of this project are: i) development of weather resilient agricultural systems, ii)
improvement in farm production and income, iii) reduction of emission from crop and livestock
production, and iv) strengthen gender and social inclusion through capacity building and involving
in the project activities.
Picture 1: Map highlighting the project districts in India

Annual Report 2018-19
Page 9 of 78
B. Key Accomplishments and Developments in the Third Year (FY 2018-19)
This annual report highlights the projects achievements during period from October 2018 to
September 2019, while also presenting annual trends for some indicators since project inception.
Main targets of this reporting period were: implementation of climate smart technologies, practices
and services in the Rabi (2018-19) and Kharif (2019) in Betul only, capacity building and trainings,
field visit/farmers meetings for scaling out to large number of farmers in the project areas and
progress of project indicators so far. The project has achieved several milestones and
accomplishments that may be highlighted as an indicator of future successes. This report highlights
the project’s key achievements using a resilience framework. The framework defines the project’s
goal and its related activities during this year.
The resilience framework
Resilience refers to the ability of systems, communities, households or individuals to cope with or
mitigate risks as well as recover from adverse events or shocks (FAO 2013). Adaptation plays a
key role in building resilience and is directly related to the vulnerability of the system to shocks.
From a climate change perspective, building resilience is key to strengthening the agricultural
system’s capacity to deal with negative impacts of increasing weather variability and extremities.
Building climate resilience of agriculture is also essential to ensure food security while focusing
on improving productivity.
Figure 1: Climate Resilience Framework for agriculture
Agricultural systems are defined by several social, economic and environmental factors that not
just determine the vulnerability of the system but also define the dynamism of resilience that needs
to be developed (Béné, C et al., 2016)1. For instance, agriculture in a region comprised of poor
farmers, with limited resources and facing severe climate risks may be less resilient to climate
change compared to a region with relatively richer, resource endowed farmers facing similar
1 Béné, C., Al-Hassan, R.M., Amarasinghe, O., Fong, P., Ocran, J., Onumah, E., Ratuniata, R., Van Tuyen, T.,
McGregor, J.A. and Mills, D.J., 2016. Is resilience socially constructed? Empirical evidence from Fiji, Ghana, Sri
Lanka, and Vietnam. Global environmental change, 38, pp.153-170.

Annual Report 2018-19
Page 10 of 78
climate risks. This is because the capacity of the community to adapt to climatic risks will be lower
in case of the former and may take longer to develop.
Figure 1 presents a framework that explains climate resilience for agriculture at three different
levels, individual/household level, community level and system level. At the household level,
resilience is built by enhancing current and future agricultural income in a changing climate by
sustaining and improving crop productivity through CSA technologies, practices and services.
Improved incomes can prevent the household from extreme poverty levels in times of climate risks
and build capacity of farmers to further invest in climate risk adaptation. Similarly, at the
community level, group-based approaches that support collective action and decision making can
promote climate risk adaptation at that level, encouraging social resilience. Finally, efforts to
mitigate overall impact of climate risks on agriculture including mitigation related interventions
and resource use efficiency can help in building environmental resilience at a sectoral or systems
level.
Interventions at each of these three different levels can together contribute to the overall capacity
of the agriculture sector to cope with climate risks. The ability of the agricultural system to build
resilience is also related to the presence of support systems and mechanisms in the form of policies,
institutions and knowledge access. These form the enabling environment present around a system
that can impede or accelerate the resilience building process.
Annual Report 2018-19
Page 11 of 78
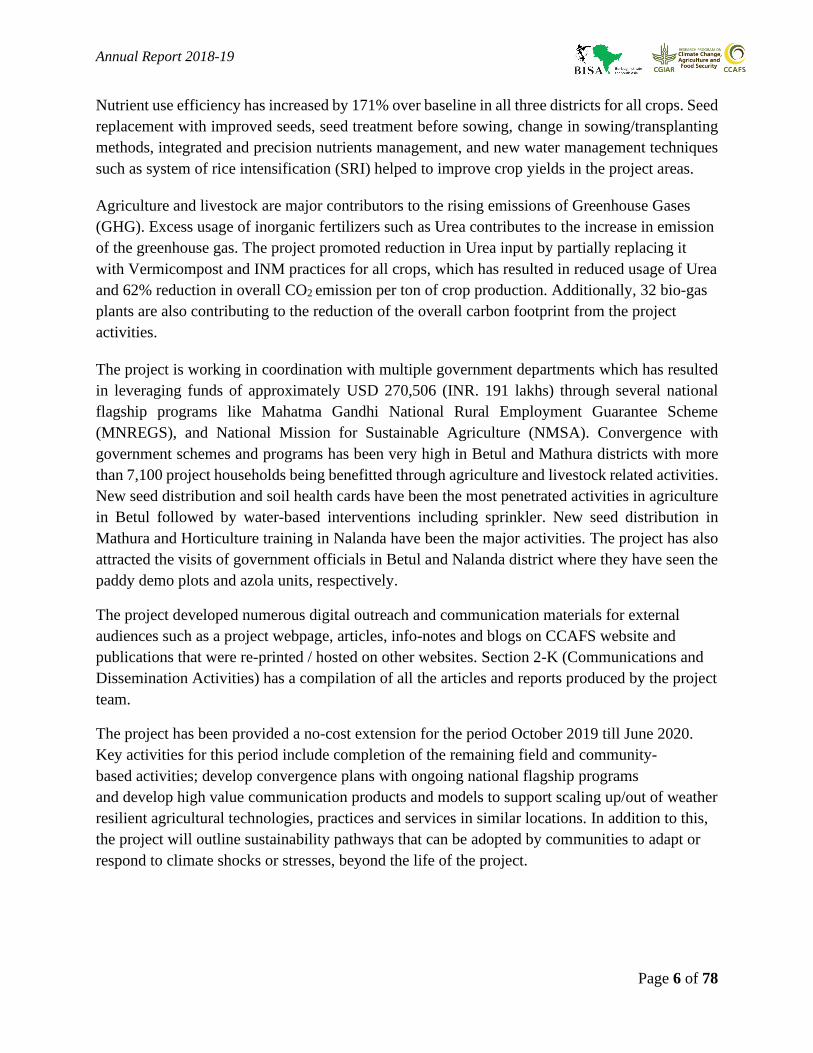
Reporting structure
Based on the framework, figure 2 explains how the project is building on the three types of
Resilience in the 75 villages through an integrated approach to climate risk adaptation.
Figure 2: Structure of the reports Section B based on resilience framework

Annual Report 2018-19
Page 12 of 78
Section 1.
Economic resilience
Annual Report 2018-19
Page 13 of 78
Section 1: Improvements in yield and income through adoption of CSA options at
household level2
In this annual year (2018-19), three types of rainfall related risks were faced during the Kharif
season, excess rainfall in Mathura, delayed rains in Nalanda and less overall rainfall in Betul. In
Nalanda, delayed start of rains resulted in sowing failure for farmers. In Betul, average rainfall
during the Kharif season was even lower than the levels experienced in 2017, affecting water
availability. In Mathura, excess rainfall after sowing lead to damage to the Bajra seeds that were
sown through the traditional broadcasting method. Similarly, in Rabi, hailstorm in Betul and
increase in average temperature in Nalanda were the climate risks faced by farmers. Betul
witnessed hailstorms during the harvesting period in February and March as a result of which
crop yields were affected. in Nalanda, increase in average temperatures during the grain filling
period resulted in lower weight of the seeds and therefore lower yields. There were no significant
climate risks in Mathura during Rabi season.
Climate variability and diverse agro-diversities across all three intervention sites necessitated a
customized suite of option to build the resilience and adaptive capacity of farmers. Depending on
the kind of risk as well as the cropping pattern, the project is promoting weather smart
interventions to enable farmers reduce potential losses from these risks. As a result, farmers will
not only be able to prevent expected losses but also achieve increase yield and incomes in all the
districts. This will enable them to move towards a more economically resilient farming system.
Kharif season
Figure 3 highlights an improvement in average yields and income that is also accompanied by a
reduction in the overall variance of the group pointing towards the development of a resilient
system. Since project inception, the project interventions have enabled the farmers to increase
their yields and incomes every year. On an average, farmers have been able to earn a cumulative
incremental income of INR 55,886 per hectare from Rice and INR 13,047 per hectare from Bajra
in the last two years.
In this annual year (2018-19), Rice was the major Kharif crop cultivated in Betul and Nalanda.
Bajra was cultivated in Mathura as a major Kharif crop. During the season three types of rainfall
related risks were faced during the Kharif season, excess rainfall in Mathura, delayed rains in
Nalanda and less overall rainfall in Betul. In Nalanda, delayed start of rains resulted in sowing
failure for farmers. To mitigate the loss, two types of adaptation strategies were applied. Farmers
with access to irrigation were encouraged to adopt the practice of Direct Seeded Rice (a practice
2 To consolidate the results, an analysis has been conducted to identify yield and income trends of farmers since
project inception. The report highlights results of those set of farmers for whom data is available for all three time
periods. i.e. baseline, year 2017-18(year 2) and year 2018-19(year 3).

Annual Report 2018-19
Page 14 of 78
that requires relatively more water compared to transplanted rice), while the others were given a
short duration variety of Rice to harvest the crop in the limited time available. Overall average
yields have been higher than 103% over baseline with a 142% improvement in income.
Betul saw a decrease in average rainfall during the Kharif season, even lower than the levels
experienced in 2017. Given the knowledge of drought potential in the district, the project
promoted medium duration Rice seed variety, requiring relatively lesser amount of
rainfall/water. This was complemented with alternate wetting and drying irrigation method to use
minimum water. Yields were improved by 33% with gross incomes improving by 62% (Figure
3).
In Mathura, excess rainfall after sowing lead to damage to the Bajra seeds that were sown through
the traditional broadcasting method. However, in the project plots, an improved short duration
Bajra (Pearl millet) variety was promoted for re-sowing. While most of the non-project farmers
kept their land fallow after sowing failure, our project farmers managed to get yield improvement
of 13% over baseline, with a 42% increase in gross income.

Annual Report 2018-19
Page 15 of 78
Figure 3: Yield and gross income trends of Kharif crops, Rice and Bajra in project districts
Rabi season
Wheat has been the major Rabi crops for the three districts across the years. During FY 2018-19,
Betul witnesses’ hailstorms during the harvesting period in February and March as a result of
which crop yields are affected. Similarly, in Nalanda, increase in average temperatures during
the grain filling period resulted in lower weight of the seeds and therefore lower yields.
However, project interventions helped reduce the damage from these risks in both district. In
Betul, stress tolerant seed variety and application of Potash as fertilizer strengthened the crop of
project farmers and prevented damage from hail. At the same time, application of light irrigation
in Nalanda during the heat stress period enabled a reduction in yield loss for project farmers.
Rabi wheat yields therefore improved by 6% and 74% while gross incomes increased by 20%
and 97%, in Betul and Nalanda respectively. In Mathura, there was no significant climatic risk

Annual Report 2018-19
Page 16 of 78
and project interventions enabled a yield and gross income increase of 85% and 109%
respectively vs the baseline.
Figure 4 highlights the improvements in yields and income since project inception for Rabi crops
of Wheat and Gram. The overall variance of the group is also seen across both crops. Since
project inception, the project interventions have enabled the farmers to increase their yields and
incomes every year. On an average, farmers have been able to earn a cumulative incremental
income of INR 60,924 per hectare from Wheat and INR 28,016 per hectare from Gram in the last
two years.
Figure 4: Yield and gross income trends of Rabi crops Wheat and Gram in project districts
The improvements in yield and income have been a result of multiple factors including adoption
of adaptation interventions. While the results are convincing, they represent indicators for a
limited number of farmers in a given season. There is a need to do further work to understand the
replicability and scalability of such interventions.

Annual Report 2018-19
Page 17 of 78
The following sections highlight the key interventions that were promoted during the year
including improved seeds, ICT based weather and agro advisory and water-based interventions
in Betul.
a) Scaling CSA technologies and practices
The project has disseminated a portfolio of weather-smart technologies and practices (Table 1) to
all the direct 11,250 farmer beneficiaries. A technology portfolio for the 75 Super Champion farmers
includes all possible weather resilient technologies, practices and services to test and evaluate in his/her
field. Combination of technologies that include, water, nutrient, carbon, energy and knowledge smart are
considered for the super champion farmers. A technology portfolio for the 1050 Champion Farmers
includes a combination of few most prominent technologies (e.g. improved seed, site specific nutrient
management, livestock feeding management and ICT based weather information and agro-advisory
services). 10,125 CSA Farmers will receive Improved seed (crop and fodder) of seasonal crops, and
agro-advisory and some activities related to livestock management are provided in the CSVs.
Table 1: Portfolio of technologies for different categories of farmer Super Champion Champion farmers CSA farmers
• Improved seed
• Laser Land Levelling
• ICT based weather and agro-
advisory services
• Crop Insurance
• Integrated Nutrient Management
(based on LCC, Green Seeker)
• Alternative Wetting and Drying
• Direct Seeded Rice
• Minimum Tillage
• Fodder Management
• Concentrate Feeding for Livestock
• Stress Tolerant High Yielding
Breeds of Livestock
• Area Specific Mineral Mixture for
Livestock
• Weather Smart Housing for
Livestock
• Biogas
• Other equipment through Custom
Hiring Centers
• Infertility Camps (and other
services through CDC)
• Improved Seeds
• Laser Land Levelling
• ICT based weather and agro-advisory
services
• Crop Insurance
• Integrated Nutrient Management
(based on LCC, Green Seeker)
• Fodder Management
• Concentrate Feeding for Livestock
• Stress Tolerant High Yielding Breeds
of Livestock
• Area Specific Mineral Mixture for
Livestock
• Other equipment through Custom
Hiring Centers
• Infertility Camps (and other services
through CDC)
• ICT based weather and
agro-advisory services
• Crop Insurance
• Livestock development
(De-worming, vaccination
and support for 2 cattle per
family)
• Other equipment through
Custom Hiring Centers
• Infertility Camps (and
other services through
CDC)
A key intervention in the demo plots of Super-Champion and champion farmer plots has been
the distribution of improved seed variety. Figure 5 below highlights the crop varieties promoted
during the project period in the three districts in the last two years. All CSA and other farmers
were linked with improved seed suppliers (KVK, ICAR, retailers) to promote improved, high
Annual Report 2018-19
Page 18 of 78
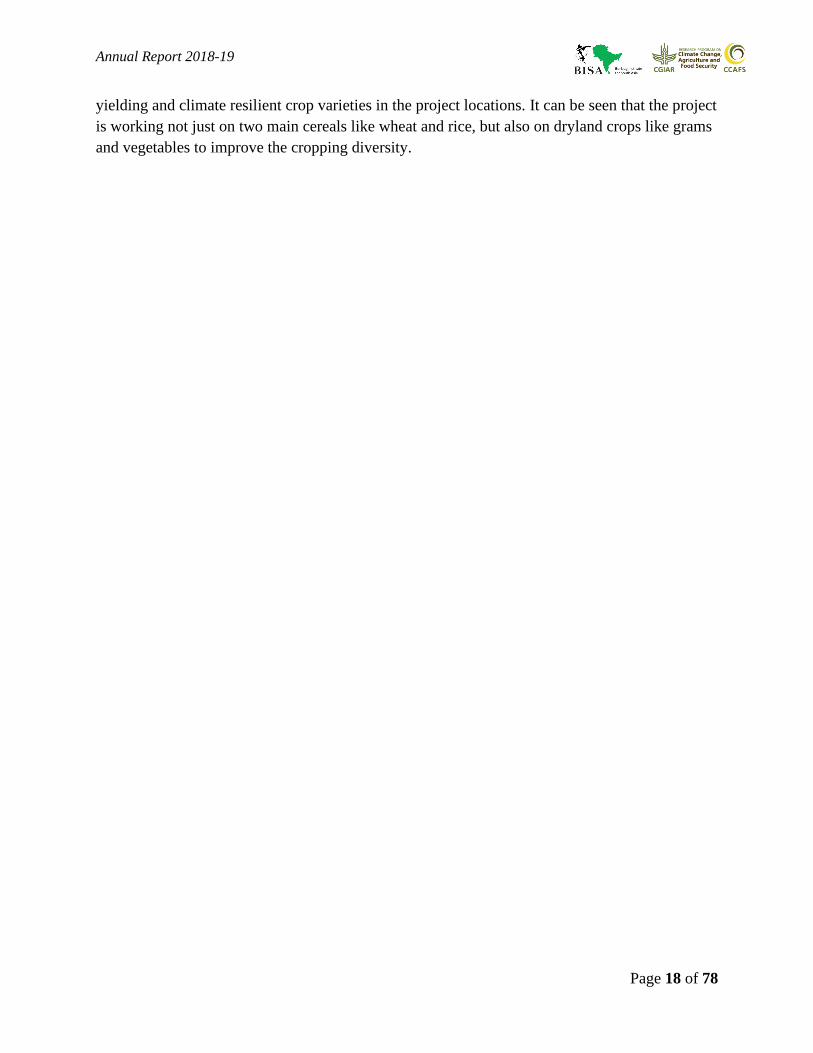
yielding and climate resilient crop varieties in the project locations. It can be seen that the project
is working not just on two main cereals like wheat and rice, but also on dryland crops like grams
and vegetables to improve the cropping diversity.

Annual Report 2018-19
Page 19 of 78
Figure 5: Crop details for Kharif and Rabi seasons3
• Wheat was the key crop this
year contributing to 66% of the
cropped area
• ‘Others’ including fodder
crops such as berseem, oats
and napier grass were
promoted
more in the third year
compared to food crops in
previous years.
• CSA farmers also adopted seeds
of wheat and berseem and
comprised 32% of total farmers
• Gram (Rabi/winter crop) and
Rice (Kharif/ summer crop)
were the key crops last year
comprising 66% of total
cropped area of the demo plots
• Wheat (Rabi or Winter crop)
and Bajra (Kharif/ summer
crop) have been the key crops
promoted in the district, with
only Wheat being promoted
last year
Annual Report 2018-19
Page 20 of 78
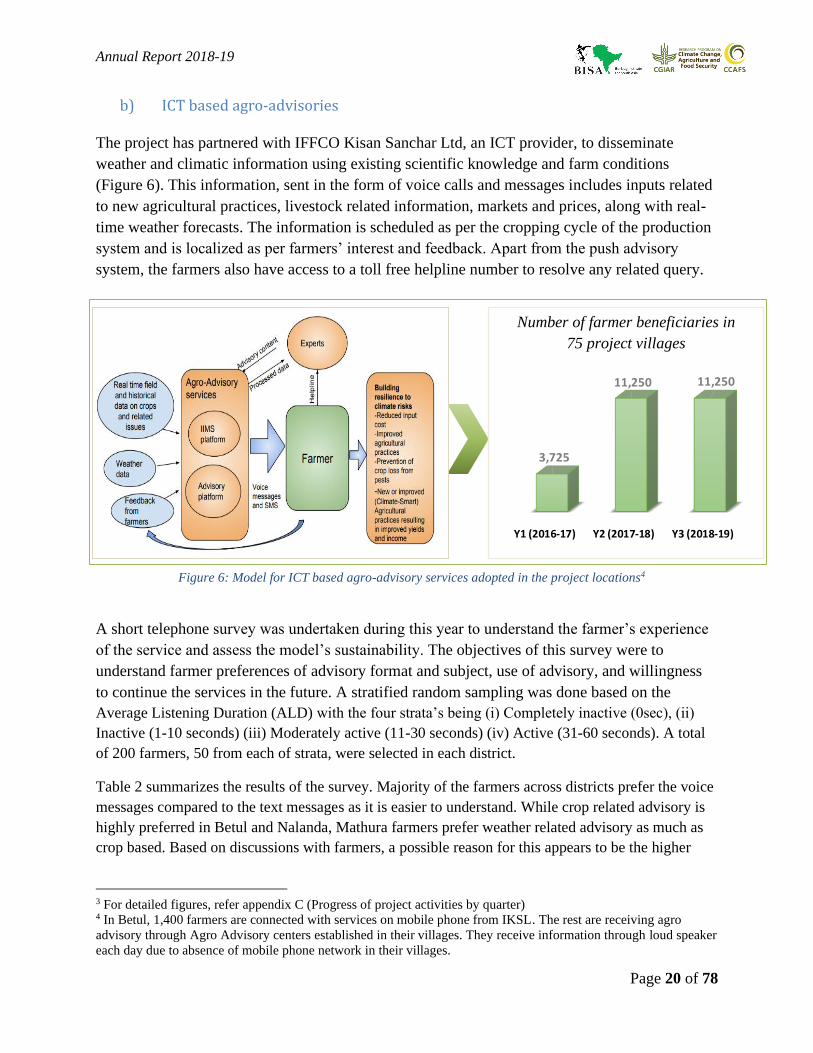
b) ICT based agro-advisories
The project has partnered with IFFCO Kisan Sanchar Ltd, an ICT provider, to disseminate
weather and climatic information using existing scientific knowledge and farm conditions
(Figure 6). This information, sent in the form of voice calls and messages includes inputs related
to new agricultural practices, livestock related information, markets and prices, along with real-
time weather forecasts. The information is scheduled as per the cropping cycle of the production
system and is localized as per farmers’ interest and feedback. Apart from the push advisory
system, the farmers also have access to a toll free helpline number to resolve any related query.
Figure 6: Model for ICT based agro-advisory services adopted in the project locations4
A short telephone survey was undertaken during this year to understand the farmer’s experience
of the service and assess the model’s sustainability. The objectives of this survey were to
understand farmer preferences of advisory format and subject, use of advisory, and willingness
to continue the services in the future. A stratified random sampling was done based on the
Average Listening Duration (ALD) with the four strata’s being (i) Completely inactive (0sec), (ii)
Inactive (1-10 seconds) (iii) Moderately active (11-30 seconds) (iv) Active (31-60 seconds). A total
of 200 farmers, 50 from each of strata, were selected in each district.
Table 2 summarizes the results of the survey. Majority of the farmers across districts prefer the voice
messages compared to the text messages as it is easier to understand. While crop related advisory is
highly preferred in Betul and Nalanda, Mathura farmers prefer weather related advisory as much as
crop based. Based on discussions with farmers, a possible reason for this appears to be the higher
3 For detailed figures, refer appendix C (Progress of project activities by quarter) 4 In Betul, 1,400 farmers are connected with services on mobile phone from IKSL. The rest are receiving agro
advisory through Agro Advisory centers established in their villages. They receive information through loud speaker
each day due to absence of mobile phone network in their villages.
Y1 (2016-17) Y2 (2017-18) Y3 (2018-19)
3,725
11,250 11,250
Number of farmer beneficiaries in
75 project villages

Annual Report 2018-19
Page 21 of 78
reliability and acceptability of mobile based weather information in Mathura compared to other
districts. The information provided has been proven useful for most of the farmers in the three
districts and they have used the information to implement changes in the field within a few days.
Almost all farmers expressed interest in continuing the services post project period however the
willingness to pay was not in accordance, ranging from 54% of respondents in Betul to only 23% in
Nalanda.
Table 2: Response of farmer survey of ICT based weather and agro-advisory services
Betul Mathura Nalanda
Preferences
for
information
format
Preferences
for
information
subject
Usefulness of
information
received
Time taken to
use
information
Interest in
receiving
information
after project
ends
Willingness
to pay for
future
services
c) Focus on water-smart interventions in Betul
Betul district has a high level of drought probability and faces climate risk of delayed monsoons
during the Kharif season as well as less overall rainfall during Rabi season. Lack of water as well

Annual Report 2018-19
Page 22 of 78
as irrigation facilities limit the regions crop production and productivity. Understanding the
importance of efficient water usage, the project focused on developing water-smart interventions
in the district this year. Four types of structures were developed as detailed in table 3. This
intervention has benefitted 107 households and increased irrigated area by 51 hectares till date.
Majority of the structures were financed through convergence.
Table 3: Details of water-based interventions in Betul
Number of
units
Number of
beneficiary
farmers
Total area
irrigated (Ha)
Contribution through
convergence (%)
Wells 36 48 36.4 56
Farm ponds 35 35 8.1 71
Check dams 4 12 4.0 100
Micro-
irrigation 12 12 2.4 100
Total 84 107 51 80
This was a participatory exercise involving regular discussions with farmers, water user groups,
government officials as well as the local governing body (panchayat committee). Discussions
with the Village Climate Management Committees (VCMCs) helped in identifying farmers
based on well availability, crops grown and groundwater levels. Group wells were identified
based on groundwater recharge zones. All plans for developing structures including wells, ponds,
checkdams as well as use of micro-irrigation systems such as drip irrigation were discussed with
the gram panchayat to explore options for convergence. As a result of all these efforts, the
promotion of water-smart interventions was able to benefit 107 households and increase irrigated
area by 51 hectares.
Annual Report 2018-19
Page 23 of 78
Insert Section 2
Section 2: Developing
community resilience

Annual Report 2018-19
Page 24 of 78
Section 2: Developing community resilience
Building resilience at the societal level involve multiple approaches including capacity
development through regular trainings, and involving all social groups, with a focus on gender
inclusion, across activities. These promote collective action that can strengthen the social norms
and processes of the society which in turn enables better adaptation to climate risks.
a) Training and capacity building5
Resilience development is a long-term process that requires consistent efforts to train and build
capacity of all stakeholder, especially the farmers. Regular trainings are required for efficient and
effective adoption of CSA technologies and practices. The training mainly includes
implementation of CSA package of practices in the farmers’ field, time and method of CSA
technology application, preparation and importance of organic fertilizers, pesticides and
vermicompost, as well as livestock related activities. Trainings on use of weather information
and agro-advisory services and enrolment in the agriculture insurance program are also provided.
The project held a total of 232 trainings and capacity building activities for 6,281 farmers in this
year. The focus of trainings has been more towards livestock in Betul and CSA practices in
Nalanda and Mathura. Female participation has also been higher across districts this year with
32% of participants being female compared to only 13% last year. Figure 7 highlight the
progress in the last two years across the three districts.
5 For detailed figures, refer appendix C (Progress of project activities by quarter)

Annual Report 2018-19
Page 25 of 78
Figure 7: Details of trainings conducted in the last two years in the project districts
b) Institutional development
Local institutions support the CSA technology transfer process by keeping all stakeholders
connected with each other. These are primarily community-based approaches that support
collective action and decision making to promote climate change adaptation. Two types of
institutions have been formed to enable technology access to the farmers.

Annual Report 2018-19
Page 26 of 78
Custom Hiring Centers
Picture 2: Women of Custom Hiring Center in Betul district
The institution of Custom Hiring Centers (CHC) have been established with the objective of
ensuring technology transfer to the local community through an institutional and business-oriented
approach. Managed by women farmers, these institutions also contribute to gender integration and
empowerment in the farm community. Given the small landholdings of farmers combined with a
minimal investment capacity for new technologies, the CHC promotes a technology hiring
mechanism to overcome affordability barriers. Therefore, by making CSA technologies available
at a rental cost, the CHCs are enabling farmers to overcome the technology access issue,
facilitating efficient use of inputs, promoting use of CSA to farmers in and around their locality,
and earning a source of income for its members. There are 13 Custom Hiring Centers established
across the three districts who provide 10 major technologies for dissemination among the farmers
(details in Table 4). Knowledge sharing and capacity building sessions followed by participatory
discussions with farmers enabled the selection and shortlisting of technologies to be promoted
through the centers.
Table 4: Major technologies provided through the CHCs in the project districts
Activity Betul Nalanda Mathura
Y2 Y3 Y2 Y3 Y2 Y3
Number of operational CHC 5 5 2 4 4 4

Annual Report 2018-19
Page 27 of 78
Total women members 66 41 24 44 48 51
Number of equipment’s provided through the centers
Spray pump 2 10 - - 20 20
Harvesting Machine (Hand
and motor operated)
1 1 2 4 8 8
Cono-weeder 2 50 6 4 4 4
Rotavator - - - - 4 4
Paddy Transplanter - - 2 4 - -
Sprinkler Irrigation 1 29 2 4 - -
Zero Tillage/Seed drill - - 1 4 - -
Solar Pump 5 5 - - - -
Automatic potato planter - - - - - 4
Table 5 lists the rental incomes, and coverage by CHCs of the three districts. In the last one year
the CHCs services have been hired by 276 farmers and covered 127 hectares of area. Nalanda
CHCs have performed better than the other districts not just in terms of incomes but also in terms
of reach and area covered. This is due to higher awareness among farmers about mechanization as
well as affordable pricing by the CHCs in Nalanda. While Zero Tillage and paddy transplanter
contributed 57% to total incomes, sprinkler has also been a widely adopted water smart technology
rented by 33% of the farmers in Nalanda. Similarly, in Mathura, potato planter has been the most
revenue generating equipment.
Table 5: CHC details in the three districts
Rental
Income
earned by
CHCs
Total rent received for use of technologies (Rs.)
Number of
farmers who have
used the CHC
services
Potential area covered
through CHC
equipment in
Y2 Y3 Q1Y3 Q2Y3 Q3Y3 Q4Y3 Y3 Y3 (Ha)
Betul 2,675 7,860 2,465 4,330 370 695 52 23.8
Mathura - 21,725 19,450 - - 2,275 92 44.1
Nalanda 4,159 21,020 4,700 700 9,230 6,390 132 58.6
Cattle Development Centers
Livestock in the study areas is characterized as low yielding cattle having a poor rate of
conception, poor quality germplasm, and inadequate animal health care. Further, climate stresses
such as drought, heat stress and excess rainfall further affect the health and productivity of the
animals. Therefore, Cattle Development Centers, one each in the three districts have been
established to promote improved breeds of cattle, provide better healthcare for the animals and
build capacity of farmers to better manage their livestock to reduce adverse climatic impacts on
them. Youth participation is encouraged for managing the activities of the institution and
promote the use of CDC interventions to farmers in their villages. These institutions are directly
linked with the local research centers to update them about the latest technologies, practices and
breeds in the field.

Annual Report 2018-19
Page 28 of 78
Picture 3: Livestock health/infertility camp organized by the Cattle Development Centre in Nalanda district
Table 6 provides the details of the services offered by CDC and their coverage in the three districts
since the beginning of operations. Livestock is a major part of Mathura’s rural economy and
therefore the focus on CDC is more there as compared to other districts. During this year the focus
has mostly been on the AI for cow and buffalo. The number of farmers availing AI services (1,665)
increased by 51% this year compared to previous year, especially in Betul. Also, farmers
purchasing mineral mixture for cattle feed almost tripled this year. In addition, goat breeds have
also been promoted and are being provided with natural services for rearing in Mathura and Betul.
Additionally, some farmers in Betul have also availed of the sorted semen services in this year.
Table 6: Details and coverage of services offered by the CDCs since second year
District
name
Service in
CDC(a)
Price per
service
(Rs.)
Unit of
price
Number of farmers availing service Number of animals covered
Y2 Y3 Q1Y3 Q2Y3 Q3Y3 Q4Y3 Y2 Y3 Q1Y3 Q2Y3 Q3Y3 Q4Y3
Mathura
AI general 100 Per AI 700 854 200 230 210 214 1,200 882 210 238 210 224
AI Sorted
Semen
250 Per AI 120 173 40 70 61 2 150 177 40 74 61 2
Mineral
Mixture
65 Per kg 50 523 175 211 137 - 100 1,046 350 422 274 -
Deworming
Tablet
8 Per
Bolus
2,500 486 195 195 96 - 5,000 972 390 390 192 -
Infertility
Camps
- - 600 695 600 95 - - 600 862 712 150 - -
Barberi
goat
- - - - - - - - - 13 -
Nalanda
AI general 100 Per AI 250 206 220 178 108 - 220 624 250 282 92 -
Mineral
Mixture
47.5 (50%
subsidized)
Per
animal
/kg
413 692 331 141 220 - 331 694 413 50 231 -
Annual Report 2018-19
Page 29 of 78
Deworming
Tablet
7.15 (50%
subsidized)
Per
Bolus
1,466 1,374 1,173 76 125 - 1,173 1,635 1,466 41 128 -
Infertility
Camp
20 per
farmer
546 332 332 - - - 332 546 546 - - -
Betul
AI general 100 Per AI 146 393 46 117 23 207 295 422 162 141 64 55
AI sorted
semen
350 Per AI - 39 - - 15 24 - 54 - - 15 39
Mineral
Mixture
120 Per
animal/
farmer
36 180 - 180 - - 100 385 - - - 385
Deworming
Tablet
5 Per
Bolus
105 203 58 145 - - 403 647 142 505 - -
Infertility
Camp
- - 284 170 - - - 170 1,854 478 - - - 478
Vaccinatio
n
- -
194 79 13 35 67
- 695 97 - - 598
Sirohi Goat - - - - - - - 10
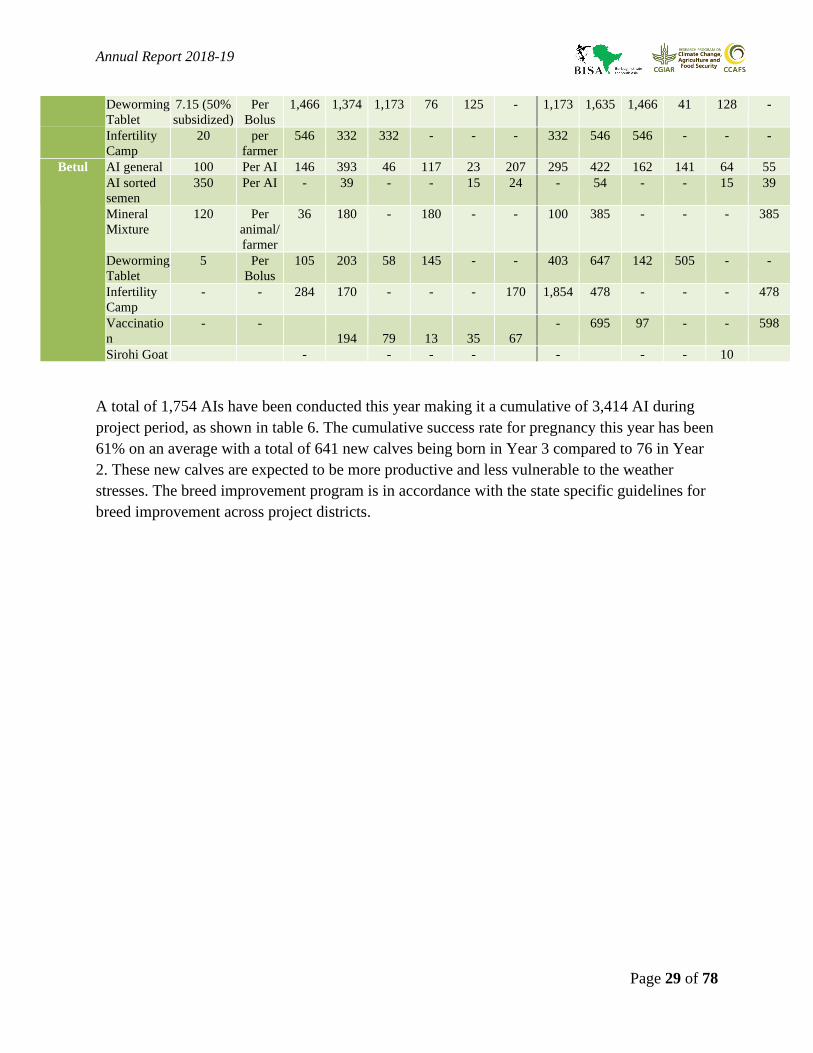
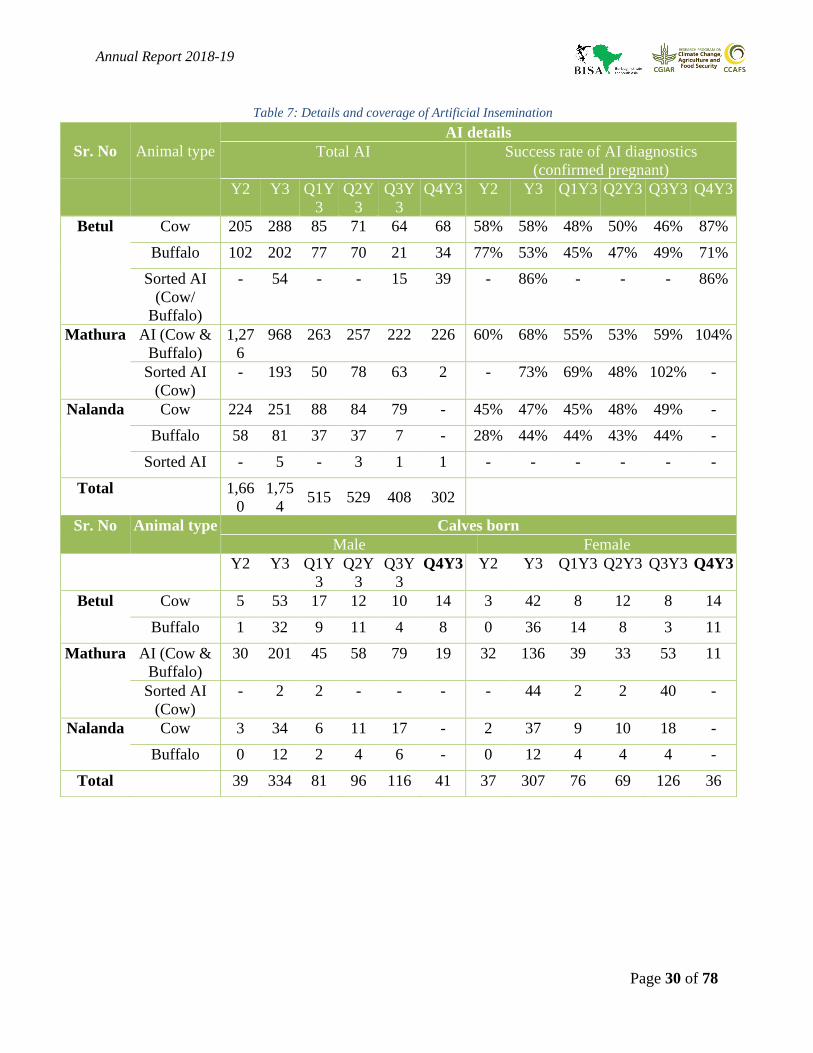
A total of 1,754 AIs have been conducted this year making it a cumulative of 3,414 AI during
project period, as shown in table 6. The cumulative success rate for pregnancy this year has been
61% on an average with a total of 641 new calves being born in Year 3 compared to 76 in Year
2. These new calves are expected to be more productive and less vulnerable to the weather
stresses. The breed improvement program is in accordance with the state specific guidelines for
breed improvement across project districts.
Annual Report 2018-19
Page 30 of 78
Table 7: Details and coverage of Artificial Insemination
Sr. No Animal type
AI details
Total AI Success rate of AI diagnostics
(confirmed pregnant)
Y2 Y3 Q1Y
3
Q2Y
3
Q3Y
3
Q4Y3 Y2 Y3 Q1Y3 Q2Y3 Q3Y3 Q4Y3
Betul Cow 205 288 85 71 64 68 58% 58% 48% 50% 46% 87%
Buffalo 102 202 77 70 21 34 77% 53% 45% 47% 49% 71%
Sorted AI
(Cow/
Buffalo)
- 54 - - 15 39 - 86% - - - 86%
Mathura AI (Cow &
Buffalo)
1,27
6
968 263 257 222 226 60% 68% 55% 53% 59% 104%
Sorted AI
(Cow)
- 193 50 78 63 2 - 73% 69% 48% 102% -
Nalanda Cow 224 251 88 84 79 - 45% 47% 45% 48% 49% -
Buffalo 58 81 37 37 7 - 28% 44% 44% 43% 44% -
Sorted AI - 5 - 3 1 1 - - - - - -
Total 1,66
0
1,75
4 515 529 408 302
Sr. No Animal type Calves born
Male Female
Y2 Y3 Q1Y
3
Q2Y
3
Q3Y
3
Q4Y3 Y2 Y3 Q1Y3 Q2Y3 Q3Y3 Q4Y3
Betul Cow 5 53 17 12 10 14 3 42 8 12 8 14
Buffalo 1 32 9 11 4 8 0 36 14 8 3 11
Mathura AI (Cow &
Buffalo)
30 201 45 58 79 19 32 136 39 33 53 11
Sorted AI
(Cow)
- 2 2 - - - - 44 2 2 40 -
Nalanda Cow 3 34 6 11 17 - 2 37 9 10 18 -
Buffalo 0 12 2 4 6 - 0 12 4 4 4 -
Total 39 334 81 96 116 41 37 307 76 69 126 36

Annual Report 2018-19
Page 31 of 78
c) Gender and social inclusion
Women empowerment has been a focus area in the project’s climate change adaptation
initiatives in agriculture. Integrating considerations of women farmers into adaptation plans can
help to ensure effective implementation on the ground. It can help to reduce the gender gap in
agriculture and promote gender equity in decision making and adoption of new agricultural
technologies and practices. Enhancing women farmer’s knowledge and skills and supporting
their empowerment can make climate change adaptations more effective. Therefore, the project
has adopted a systematic approach to integrate gender across the key stages of adaptation (Figure
8).
Figure 8: Integrating gender across the across the key stages of adaptation
Gender integration started from baseline assessment and majorly involved collection of gender
disaggregated data related to agricultural activities, climate risks impacts and socio-economic
differences at household and community levels. Women’s participation and role in
agricultural activities and decision-making process was considered as a basis for technology
intervention design. The adaptation design focused on identification and prioritization of gender
friendly climate smart agricultural technologies, practices and services. All women super
champion and champion farmers were trained on seed treatment, nutrient
application, intercropping of wheat with legumes and mustard crops and water use efficiency
improving technologies. Additionally, women farmers across the project locations were given
sessions on use of recommended dose of chemical fertilizers, inclusion of farm yard manures
(organic) and preparation of organic pesticide/insecticides through several knowledge sharing
sessions. Figure 9 highlights the increase in women’s participation in trainings and capacity
building exercises since the last two years.

Annual Report 2018-19
Page 32 of 78
Figure 9: Increase in percentage of female participants in trainings in the last two years
Project intervention have enabled empowerment of women farmers through women led
groups, primarily in the form of increased access to climate and market information, community
participation and group-based agency. Listed below are project related achievements that
highlight some of the key indicators of women empowerment:
• Improvements in agency, leadership and community participation:
o In Betul, one woman was selected as a Super Champion, 14 women were
Champion farmers and 134 CSA women and men farmers participated from each
of the 25 villages to lead the technology implementation for creating evidences.
These farmers were provided training and capacity building exercises for
implementing the portfolio of technologies and practices in their farms.
This has led to increased recognition and leadership in the community, access to
knowledge and information, as well as improved participation
in household decision making.
o The intervention has resulted in active participation of women in community
groups, encouraging their participation in CSA related activities in agriculture. In
addition, they also actively seek participation in activities related to health,
nutrition and sanitation, conducted by other local agencies in their villages. For
instance, women in two of the districts of Betul are also involved in programs
such as WASH within which they are benefitting from activities such as vegetable
cultivation, smokeless chulhas, bathrooms and toilets. By participating in multiple
initiatives, therefor, women are being exposed to a wide portfolio of agricultural
as well as domestic interventions, thereby improving their awareness and interest
levels.
Annual Report 2018-19
Page 33 of 78
o Women participated equally in the technology prioritization and community
consultation process, ensuring their production preferences were also addressed
• Improved access to resources:
o ICT based agro-advisory and climate information is being provided to 3,725
women farmers in Betul through mobile phones owned by them or their spouse.
In villages with limited phone connectivity, women farmers can access
information through community-based sources including daily public
announcement on loudspeakers and written messages on notice boards.
o Institutional innovations including Custom Hiring Centers have enabled
technology access especially to women farmers
• Reduction in labor
o Interventions such as Direct Seeded Rice and Biogas are helping women reduce
the labor related to transplanting and fuel wood collection, respectively. In
addition, provision of technologies such as cono-weeder and harvester are also
reducing the time taken for agricultural activities for women farmers

Annual Report 2018-19
Page 34 of 78
Section 3.
Environmental Resilience

Annual Report 2018-19
Page 35 of 78
Section 3: Mitigating climate impacts on environment through reduction in GHG
emissions and improving nutrient use efficiency
Overall environmental sustainability can be achieved by enabling a reduction in Greenhouse Gas
(GHG) emissions as well as improving resource use efficiency. Effectively managing natural
resources can improve the capacity of the system to adapt better to climate risks and also assist in
improving the overall productivity of the system. The section below exemplifies the
environmental resilience component using data from Rabi and Kharif in the last two years.
a) Improving resource use efficiency through improved nutrient management
As a result of continuous training, awareness generation and capacity building exercise, farmers
in all the three districts have reduced usage of excess amounts of fertilizers and pesticides such as
Urea and DAP in all crops. As a result, farmers have saved input costs and also achieved a
reduction in nitrogen usage leading to lower emissions. Table 8 shows the changes in nitrogen use
efficiency across all crops in each district. The efficiency has been calculated by dividing the crop
yields (output) with the nitrogen content of fertilizers (input). The significant increase in efficiency
is due to two factors: reduction in fertilizer input as well as increase in yield outputs.
Table 8: Changes in nitrogen use efficiency across all crops
Crop Nitrogen use efficiency
(yield output/ nitrogen input)
% improvement over
baseline in nitrogen use
efficiency per hectare
Baseline Y1 Y2 Y2 Y3
WHEAT
Betul 28.26 46.04 97.74 62.9% 245.8%
Mathura 26.95 54.20 139.13 101.1% 416.2%
Nalanda 23.30 14.39 41.85 38.3% 79.7%
RICE
Betul 16.43 - 21.26 - 29.4%
Nalanda 15.76 53.68 65.66 240.6% 316.6%
GRAM
Betul 41.39 43.82 52.69 5.9% 27.3%
BAJRA
Mathura 27.91 54.83 102.62 96.5% 87.2%
b) Reduction in Greenhouse Gas (GHG) emission
Reduction in emission through Nutrient Management
Excess usage of inorganic fertilizers such as Urea contributes to the increase in emission of the
greenhouse gas. This can be managed through integrated approaches to the management of
Annual Report 2018-19
Page 36 of 78
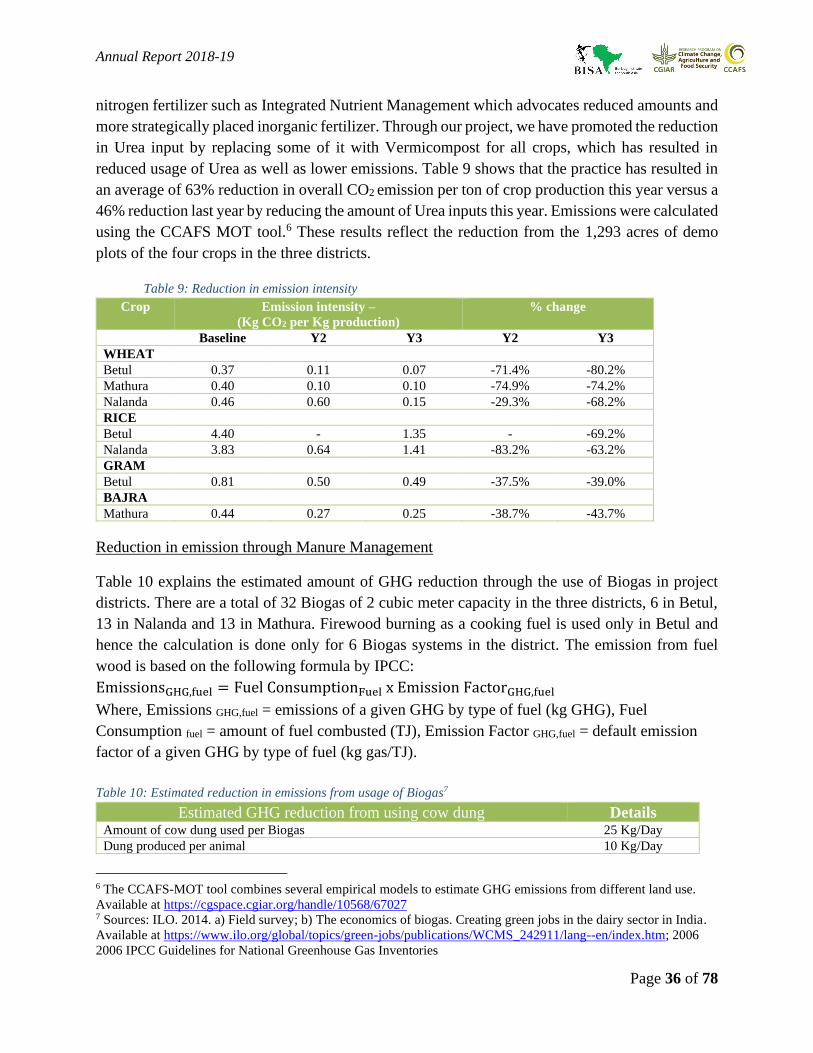
nitrogen fertilizer such as Integrated Nutrient Management which advocates reduced amounts and
more strategically placed inorganic fertilizer. Through our project, we have promoted the reduction
in Urea input by replacing some of it with Vermicompost for all crops, which has resulted in
reduced usage of Urea as well as lower emissions. Table 9 shows that the practice has resulted in
an average of 63% reduction in overall CO2 emission per ton of crop production this year versus a
46% reduction last year by reducing the amount of Urea inputs this year. Emissions were calculated
using the CCAFS MOT tool.6 These results reflect the reduction from the 1,293 acres of demo
plots of the four crops in the three districts.
Table 9: Reduction in emission intensity
Crop Emission intensity –
(Kg CO2 per Kg production)
% change
Baseline Y2 Y3 Y2 Y3
WHEAT
Betul 0.37 0.11 0.07 -71.4% -80.2%
Mathura 0.40 0.10 0.10 -74.9% -74.2%
Nalanda 0.46 0.60 0.15 -29.3% -68.2%
RICE
Betul 4.40 - 1.35 - -69.2%
Nalanda 3.83 0.64 1.41 -83.2% -63.2%
GRAM
Betul 0.81 0.50 0.49 -37.5% -39.0%
BAJRA
Mathura 0.44 0.27 0.25 -38.7% -43.7%
Reduction in emission through Manure Management
Table 10 explains the estimated amount of GHG reduction through the use of Biogas in project
districts. There are a total of 32 Biogas of 2 cubic meter capacity in the three districts, 6 in Betul,
13 in Nalanda and 13 in Mathura. Firewood burning as a cooking fuel is used only in Betul and
hence the calculation is done only for 6 Biogas systems in the district. The emission from fuel
wood is based on the following formula by IPCC:
EmissionsGHG,fuel = Fuel ConsumptionFuel x Emission FactorGHG,fuel
Where, Emissions GHG,fuel = emissions of a given GHG by type of fuel (kg GHG), Fuel
Consumption fuel = amount of fuel combusted (TJ), Emission Factor GHG,fuel = default emission
factor of a given GHG by type of fuel (kg gas/TJ).
Table 10: Estimated reduction in emissions from usage of Biogas7
Estimated GHG reduction from using cow dung Details Amount of cow dung used per Biogas 25 Kg/Day
Dung produced per animal 10 Kg/Day
6 The CCAFS-MOT tool combines several empirical models to estimate GHG emissions from different land use.
Available at https://cgspace.cgiar.org/handle/10568/67027 7 Sources: ILO. 2014. a) Field survey; b) The economics of biogas. Creating green jobs in the dairy sector in India.
Available at https://www.ilo.org/global/topics/green-jobs/publications/WCMS_242911/lang--en/index.htm; 2006
2006 IPCC Guidelines for National Greenhouse Gas Inventories

Annual Report 2018-19
Page 37 of 78
Number of animals required to produce dung (1) 2.50
Emissions per animal per year (2) 1.6 tons of CO2 eq.
Yearly emissions by anima per BioGas (3= 1x2) 4.00
Total number of Biogas in project areas (4) 32
Total annual GHG (methane) emission saving from project Biogas (3 x 4) 128 tons of CO2 eq.
Total estimated GHG reduction from replacing firewood Details
Firewood usage before Biogas 1.760 Ton/Yr
Firewood usage after Biogas 0.208 Ton/Yr
Firewood usage reduction 1.552 Ton/Yr
Number of Biogas in Betul district 6
Total firewood saved in Betul (Ton per year) (5) 9.31 Ton/Yr
Amount of fuel combusted (6) 0.015 TJ/Ton
Emission factor for wood (7) 112 Kg CO2/TJ Total estimated GHG (CO2) emission saving from firewood replacement (5x6x7) 15.6 tons of CO2

Annual Report 2018-19
Page 38 of 78
Section 4.
Sustainability and Scalability

Annual Report 2018-19
Page 39 of 78
Section 4: Sustainability and Scalability of project interventions
Sustainability and scalability of project interventions has been an integral part of the project
implementation strategy from the very beginning. In the past three years, the project has
endeavored to build the capacity of farmers and communities through various approaches to
make project activities self-sustaining. Below are a few approaches:
a) Knowledge and skill development
Apart from regular trainings related to adaptation implementation, farmers are also exposed to
field visits or visits to the local university to gain additional practical knowledge related to both
existing practices as well as new practices. Additionally, farmer fairs are also organized to
involve large number of farmers and highlight the adaptation benefits to non-project farmers. All
these events serve as a cross learning platform for farmers and enable scaling out of the
technologies and practices to neighboring areas. Table 11 highlights the number of such events
in the three districts. In the last one year, 22 such events have taken place, covering more than a
1,000 farmers, out of which 19% were females.
Table 11: number of farmers’ field days and fairs conducted
District Number of events
Total farmers Total male farmers Total female farmers
Y2 Y3 Y2 Y3 Y2 Y3 Y2 Y3 Betul
2 7 1,54
0 296 25 261 15 75
Mathura 14 6 292 295 286 259 6 36 Nalanda 4 9 168 457 150 365 18 92 Total
20 22 2,00
0 1,048 461 885 39 203
b) Convergence with government programs8
The project is working in coordination with multiple government departments and agencies. As a
result, it is also converging its activities with those of other government schemes and programs,
such as Mahatma Gandhi National Rural Employment Guarantee Scheme (MNREGS), and
National Mission for Sustainable Agriculture (NMSA). This is enabling the spread of weather
smart technologies and practices to other farmers in the project districts. As shown in figure 10,
the project has managed to converge an amount of approximately Rs. 191 lakhs (approx. USD
270,506) through multiple schemes across the three districts this year, cumulating it to Rs.295
lakhs (approx. USD 416,193) since inception. More than 7,100 households have benefitted by
convergence this year (approx. 14,000 in total since inception) in both agriculture and livestock
related activities. New seed distribution and soil health cards have been the most penetrated
8 For detailed figures, refer appendix C (Progress of project activities by quarter)

Annual Report 2018-19
Page 40 of 78
activities in agriculture in Betul followed by water-based interventions including sprinkler. New
seed distribution in Mathura and Horticulture training in Nalanda have been the major activities.
The project has also attracted the visits of government officials in Betul and Nalanda district
where they have seen the paddy demo plots and azola units, respectively.
The process of convergence begins with the project teams meeting farmers for discussing issues
that farmers face related to agriculture such as access to seeds, information about new techniques
etc. This is followed by a meeting with the government officials in which the government is
made aware of the farmers’ situation and the project team is provided with information regarding
the governments ongoing agricultural schemes. Based on the requirements then the relevant
scheme information is passed onto the farmers and the project team assist the farmers in
accessing the schemes’ benefits (by helping them in filling out form and delivering their
application to the concerned government authorities). This entire process takes up to 3 months.
Additionally, the project team has facilitated the development of several water structures
(ponds/wells/check dams) to manage water resources in Betul district. These structures will
continue to benefit beneficiary farmers and the adjoining communities well beyond the life of the
project.

Annual Report 2018-19
Page 41 of 78
Figure 10: Amount of convergence and beneficiaries under different schemes

Annual Report 2018-19
Page 42 of 78
c) Scaling framework
The CSA technology adoption and dissemination model (Figure 11) aims to highlight the
process of building climate resilience of a large number of farmers in a systematic and
sustainable manner. The model, implemented by the project in the three districts, promotes
the adoption of CSA technology and services through multiple activities centered on the hub and
spoke method. The hub and spokes are supported by the various elements of the enabling
environment, who continuously interact with the key actors of the model, the Super Champion,
Champion and CSA farmers. At the same time, the model also encourages incorporating the
impacts of technology adoption to make the model more relevant for scaling out.
Figure 11: A schematic illustration of the CSA technology adoption, highlighting the inputs to and the results of
technology dissemination and adoption through the model for building climate resilience.
Several participatory activities such as farmer field visits and farmer fairs facilitate the working
of the hub and spoke method. Champion, and CSA farmers are regularly taken to the demo fields
of Super-Champion farmers to understand the weather smart interventions on the field and the
difference in outputs between the demo and regular plots. Similarly, during farmer fairs, the

Annual Report 2018-19
Page 43 of 78
participants are exposed to the different types of weather smart technologies and practices that
the Super Champion and Champions are implementing. They are also shown some of the demo
plots to understand the benefits of changing the traditional cropping practices. This ensures the
spread of knowledge and the initiation of interactive learning among the farmers.
Implementation of the model in a participatory manner and reducing knowledge barriers for
farmers are essential to ensure sustainable results of the model. Additionally, strengthening of
the model through south-south learning can further add to its relevance for
farmers. Learning’s from the project highlight the willingness of farmers to contribute to the
model when it is designed as per their suitability and needs. The project has therefore ensured to
work in partnership with community stakeholders to set expectations and brainstorm actionable
steps for successful implementation of the model itself. Two key examples in this regard are as
follows:
• Farmers contribute up to 25% of technology cost: From the very beginning, the
project has ensured that all selected Super Champion and Champion farmers also
contribute a share of the portfolio cost that is being implemented on their fields.
Farmers are contributing up to 25% of technology cost in their fields or households,
which includes demonstration plots, installation of biogas plants, azola ponds, etc.
• Paid services thru community-based institutions: The project has promoted
community-based institutions such as Cattle Development Centre which offers
Artificial Insemination services for breed improvement in the range of Rs 100 – 250,
sale of mineral mixture, and on call para-vet services for which a farmer must pay.
These services are available not just for the enrolled farmers in the project but also for
all community members. Improvements in livestock development will continue to
benefit farmers beyond the life of the project. Similarly, the custom hiring centers
have made farm machinery accessible for villagers in project districts. The equipment
is available on rent for the entire community. These community-based institutions
promote a ‘payment model’ to seed the concept of self-reliance and entrepreneurship
in rural communities. In the past three years, there has been an increase in the uptake
of services from the cattle development services and custom hiring centers, and the
project team anticipates continued usage of services from these community centric
institutions beyond the life of the project.
In the extension phase the project team will continue to explore options for sustainability and
scalability of project activities through
• Village level resilience plans: the project team will develop a blueprint of climate
resilience plans for all 75 villages. These plans will be shared with the ‘Gram
Panchayat’/ District level officials to outline areas of future intervention to make
communities climate resilient and where possible create greater convergence with on-
going national flagship programs to cope with climate variability and extreme
weather events.

Annual Report 2018-19
Page 44 of 78
• Explore partnerships with Agribusiness/ CSR Funds/ Philanthropies: In the
extension phase, the project team will attempt to explore partnerships with agri-
businesses, CSR Funds and philanthropic organizations to scale out the concept of
‘Climate Smart Village’ in India.
• Development of material to potentially train village-based carder: The project
will develop a document detailing the process of convergence that will include key
steps as well as challenges involved across different stages of convergence. This
document may be utilized to train a village-based cadre of progressive farmers or
village youth to continue engagement with government officials in the ministry of
agriculture, extension department, KVK/ATMA to update communities on
government programs and technological advancements.

Annual Report 2018-19
Page 45 of 78
C. Target performance indicators for Second Year (2018-19)
This project has following target for the year 2018-2019:
➢ Field demonstration of CSA technologies and practices including ICT and insurance with
all 75 super champion farmers (25 in each project site) and 1050 champion (350 in each
project site)
➢ Provision of adapted seeds to 2,195 farmers in 25 villages located in weather risk prone
areas
➢ 11,250 farmers benefited through participatory videos of CSA technologies, practices and
services
➢ More than 20% female farmer/farmer group’s involvement in the CSVs
Table 12: Target output and input indicators based on work plan Output Indicator Target for
second year
Achievements
Productivity
➢ Average change in yield
(tons per hectare of crop
land)
25%
improvement
from the baseline
Yield (t/Ha) Change in yield
WHEAT Baseline
Rabi 2019/
Kharif 2019 Actual (t/ha) %
Betul 3.23 3.42 0.19 5.9
Mathura 2.89 5.34 2.45 84.7
Nalanda 2.54 4.42 1.88 73.8
GRAM
Betul 0.74 1.20 0.46 61.5
RICE
Betul 1.95 2.6 0.64 32.9
Nalanda 2.20 4.48 2.28 103.5
BAJRA
Mathura 1.5 2.36 0.86 57.3
Income
➢ Average change in income
(Rs per hectare of crop
land)
25%
improvement
from the baseline
Income (Rs./Ha) Change in income
WHEAT Baseline
Rabi 2018/
Kharif 2017
Actual
(Rs./ha) %
Betul 52,455 62,872 10,417 19.9
Mathura 47,005 98,302 51,297 109.1
Nalanda 41,307 81,298 39,991 96.8
GRAM
Betul 29,698 55,394 25,695 86.5
RICE
Betul 28,710 46,460 17,751 61.8
Nalanda 32,352 78,366 46,015 142.2
BAJRA
Mathura 19,971 46,065 26,094 130.7
Input Use Efficiency
➢ Average change in, nutrient
use efficiencies in CSA
farms
25- 50%
improvement
from the baseline
% increase in nitrogen use efficiency per hectare
Crop Baseline
efficiency
Midline
efficiency
Change
WHEAT
Betul 28.26 97.74 245.8%
Mathura 26.95 139.13 416.2%
Nalanda 23.30 41.85 79.7%
RICE
Betul 16.43 21.26 29.4%
Nalanda 15.76 65.66 316.6%
GRAM

Annual Report 2018-19
Page 46 of 78
Betul 41.39 52.69 27.3%
BAJRA
Mathura 27.91 102.62 87.2%
Reduction in emissions
➢ Average change in
emission intensity (CO2
/ton of food production)
from the CSA interventions
25%
improvement
from the baseline
Crop Change in emission intensity
WHEAT
Betul -80.2%
Mathura -74.2%
Nalanda -68.2%
RICE
Betul -69.2%
Nalanda -63.2%
GRAM
Betul -39.0%
BAJRA
Mathura -43.7%
Input indicator Achievements
Number of farmers/farm households who have
implemented CSA technology and practices
Super-Champion Champion CSA
75 1,050 10,125
Number/amount of technologies or management
practices under research, under field testing, or made
available for transfer as a result of project assistance
Super-Champion Champion CSA
16 11 5
Number of acres of land under CSA technology and
practice with project assistance
Super-Champion Champion CSA
205 1,305 1,431
Number of trainings, workshops, farm visits, farm fairs
provided to farmers as well as stakeholders organizations A total of 232 trainings and 22 farmer field days during the year
involving a total of 7,329 farmers
Number of farmers or farm households have access to
weather based agro-advisory, market information and
agriculture insurance 11,250

Annual Report 2018-19
Page 47 of 78
D. Monitoring and Evaluation Activities
Midline Survey
The midline survey was conducted to provide an information base against which to monitor and
assess progress and effectiveness after the activity is completed in the project. The survey provides
data that helps to assess project outputs, contribution to project outcomes and impacts. The specific
objectives of the midline survey were:
• To serve as the second measure of all main program indicators as per the Performance
Indicator
• To highlight the project achievements since inception against the indicator targets described
in the Indicators of Performance
• To gather data that can inform project implementer regarding the areas that are on track or
those that need further attention to achieve project outcomes.
The midline surveys were conducted in all three project districts, Mathura (Uttar Pradesh), Nalanda
(Bihar) and Betul (Madhya Pradesh) to capture the results of the activities in both the Kharif (2018)
and Rabi (2019) seasons. In each districts 25 villages are part of the project. These 25 villages
represent different agro-ecological and socio-economic characteristics of the selected States. In
each of these villages, data was collected from the Super-Champion and Champion farmers on
their use of CSA technologies and practices and the resulting yields and income.

Annual Report 2018-19
Page 48 of 78
E. Field Visits
Every month at least one visit has been done by project leader or field coordinator in the project
districts. In addition, experts from CCAFS have visited several times during 2018-2019. Some
pictures of field visits in the project sites are included below.
Betul: Visit by govt. official to paddy demo plot Betul: Farmer field day
Mathura: Farmers visit to GB Pant Agriculture University Mathura: Farmers training (convergence activity)
Nalanda: Govt. official visit to Azola plot Nalanda: Napier fodder crop growth
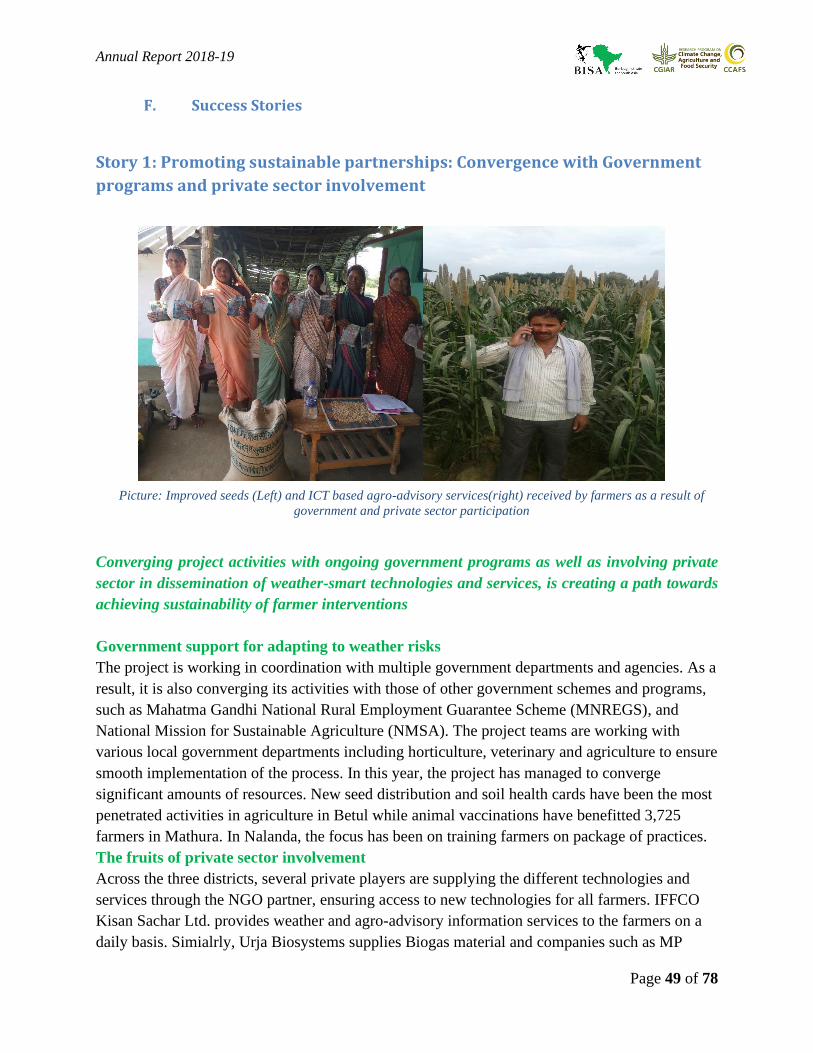
Annual Report 2018-19
Page 49 of 78
F. Success Stories
Story 1: Promoting sustainable partnerships: Convergence with Government
programs and private sector involvement
Picture: Improved seeds (Left) and ICT based agro-advisory services(right) received by farmers as a result of
government and private sector participation
Converging project activities with ongoing government programs as well as involving private
sector in dissemination of weather-smart technologies and services, is creating a path towards
achieving sustainability of farmer interventions
Government support for adapting to weather risks
The project is working in coordination with multiple government departments and agencies. As a
result, it is also converging its activities with those of other government schemes and programs,
such as Mahatma Gandhi National Rural Employment Guarantee Scheme (MNREGS), and
National Mission for Sustainable Agriculture (NMSA). The project teams are working with
various local government departments including horticulture, veterinary and agriculture to ensure
smooth implementation of the process. In this year, the project has managed to converge
significant amounts of resources. New seed distribution and soil health cards have been the most
penetrated activities in agriculture in Betul while animal vaccinations have benefitted 3,725
farmers in Mathura. In Nalanda, the focus has been on training farmers on package of practices.
The fruits of private sector involvement
Across the three districts, several private players are supplying the different technologies and
services through the NGO partner, ensuring access to new technologies for all farmers. IFFCO
Kisan Sachar Ltd. provides weather and agro-advisory information services to the farmers on a
daily basis. Simialrly, Urja Biosystems supplies Biogas material and companies such as MP

Annual Report 2018-19
Page 50 of 78
Agro, Kisan Agro, and Devendra Agriculture works provide machinery to the Custom Hiring
Centers. The support of the private sector is benefitting farmers in accessing and efficiently
utilizing weather smart technologies, practices and services as can be observed from the case
below:
Farmer Name – Shambhu Saran
Village – MadhopurGarh Nalanda (Bihar)
Shambhu had been using Urea and DAP in wheat crop as fertilizers, in quantities much larger than
the required amount, and therefore with higher cost of cultivation He had no information source
to guide him for using the appropriate fertilizer input application. However, now, as part of the
project, he is receiving daily messages and a phone call in the morning about the local weather
condition as well as agriculture related information such as best practices, solutions for pests, crop
diseases among others. This has led him to replace DAP with SSP (Single Super Phosphate), a
fertilizer he never knew could be used for Wheat. He has also reduced his quantities of Urea to
avoid excess usage and expenditure on the same. As a result, he has been able to save more than
Rs. 1000 as input cost.
Success so far: In the second year the project has managed to converge an amount of Rs. 191
lakhs (approx. USD 270,506) through multiple schemes across the three districts. As a result,
more than 7,000 families have been able to benefit in the last three months, especially from
Livestock and seed related schemes.
Story 2: Strengthening livelihoods through livestock health and feed
development in Betul and Mathura
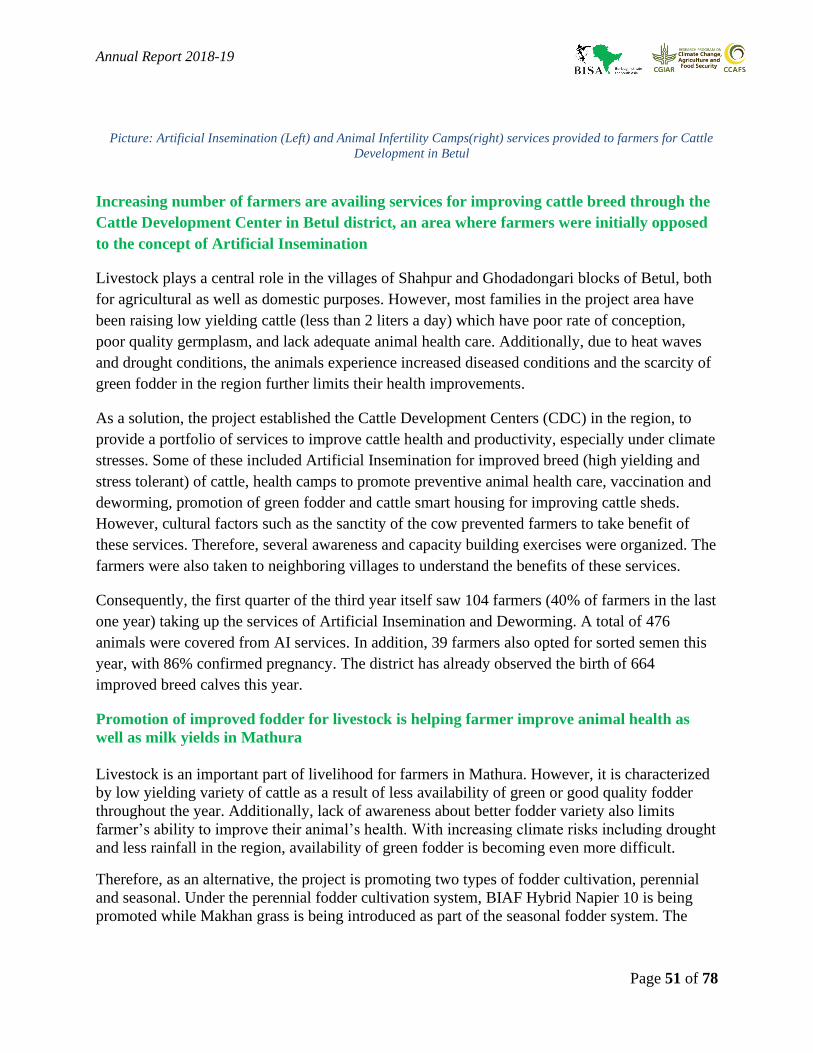
Annual Report 2018-19
Page 51 of 78
Picture: Artificial Insemination (Left) and Animal Infertility Camps(right) services provided to farmers for Cattle
Development in Betul
Increasing number of farmers are availing services for improving cattle breed through the
Cattle Development Center in Betul district, an area where farmers were initially opposed
to the concept of Artificial Insemination
Livestock plays a central role in the villages of Shahpur and Ghodadongari blocks of Betul, both
for agricultural as well as domestic purposes. However, most families in the project area have
been raising low yielding cattle (less than 2 liters a day) which have poor rate of conception,
poor quality germplasm, and lack adequate animal health care. Additionally, due to heat waves
and drought conditions, the animals experience increased diseased conditions and the scarcity of
green fodder in the region further limits their health improvements.
As a solution, the project established the Cattle Development Centers (CDC) in the region, to
provide a portfolio of services to improve cattle health and productivity, especially under climate
stresses. Some of these included Artificial Insemination for improved breed (high yielding and
stress tolerant) of cattle, health camps to promote preventive animal health care, vaccination and
deworming, promotion of green fodder and cattle smart housing for improving cattle sheds.
However, cultural factors such as the sanctity of the cow prevented farmers to take benefit of
these services. Therefore, several awareness and capacity building exercises were organized. The
farmers were also taken to neighboring villages to understand the benefits of these services.
Consequently, the first quarter of the third year itself saw 104 farmers (40% of farmers in the last
one year) taking up the services of Artificial Insemination and Deworming. A total of 476
animals were covered from AI services. In addition, 39 farmers also opted for sorted semen this
year, with 86% confirmed pregnancy. The district has already observed the birth of 664
improved breed calves this year.
Promotion of improved fodder for livestock is helping farmer improve animal health as
well as milk yields in Mathura
Livestock is an important part of livelihood for farmers in Mathura. However, it is characterized
by low yielding variety of cattle as a result of less availability of green or good quality fodder
throughout the year. Additionally, lack of awareness about better fodder variety also limits
farmer’s ability to improve their animal’s health. With increasing climate risks including drought
and less rainfall in the region, availability of green fodder is becoming even more difficult.
Therefore, as an alternative, the project is promoting two types of fodder cultivation, perennial
and seasonal. Under the perennial fodder cultivation system, BIAF Hybrid Napier 10 is being
promoted while Makhan grass is being introduced as part of the seasonal fodder system. The

Annual Report 2018-19
Page 52 of 78
farmers are seeing benefits of cultivating these two types of grasses though improved animal
health and productivity. Farmer Name – Bhim Sen (Champion farmer)
Village – Hathkauli, Mathura (Uttar Pradesh)
Bhim Sen always had difficulty in arranging for good quality fodder for his animal, especially
during the rainy season. He used to feed green grass to Milch animals and dry fodder to others.
The animals were therefore of poor health and low yielding. The farmer the adopted cultivation
of Makhan grass as improved feed for his animals in 0.5 bigah of land. Since the adoption of
improved feed practice, he has observed an improvement in the quality as well as the quantity
(by 1.5 liters a day) of milk from the animals. He is now able to earn an incremental income of
Rs.50 per day. Now, he is also cultivating both BNH10 as well as Makhan grass and is willing to
promote the same to other farmers too.
Story 3: Providing irrigation access through institutional mechanisms in water scarce district of Betul
Picture: Solar pump beneficiaries and sprinkler irrigation in wheat fields in Betul
Farmers in Betul are now able to irrigate their field using solar pumps and sprinkler at
affordable rates through Custom Hiring Centers
Farmers in Betul were highly dependent on rains, especially during Rabi season, to water their
crops. A baseline discussion with the farmer groups revealed lack of access to irrigation for most
farmers and those who owned pumps incurred high diesel costs. As a result of this, farmers
found it challenging to grow two seasonal crops during the Rabi season, limiting food security
and income.
As a solution, the project is now providing access to irrigation sources to these farmers, in
exchange for a rental cost, through Custom Hiring Centers (CHC) established in five villages in

Annual Report 2018-19
Page 53 of 78
the district. The CHCs provide Portable Solar irrigation pumps (PSIP) of 1HP capacity along
with a sprinkler set for irrigating Rabi crops such as Wheat. Solar pumps are a portable structure
and are providing users the liberty to transport the system wherever required and as and when
required. The system can be connected to any water source such as river, well, pond etc, to draw
water for irrigation. As a result of these interventions, farmers are now able to cultivate more
than one crop and are also able to improve yields through adequate provision of water.
Farmer Name – Satoka Bai (Champion farmer)
Village – Chunagosai, Betul (Madhya Pradesh)
Sakota Bai owns 2.5 acres of land and before project commencement adopted flood irrigation
technique for wheat crop which provided insufficient water during the maturity stage of the crop
resulting in loss of yield (by 30-40%). As part of the project, she then used the sprinkler set on
1.5 acres of her land along with adopting other CSA practices including improved seed, line
sowing, optimum utilization of fertilizers, and seed treatment. All these interventions resulted in
optimum application of water to the improved crop variety. As a result, she was able to improve
her yields and income by 66%.
Success so far: The solar pumps and sprinkler sets have already been used by 28 farmers across
43 acres and has generated a total revenue of 6,030 in the last one year.
G. Leverage, Cost Share and Financial Monitoring Table 13: Cost share from CCAFS to the project – We will send a revised version of this along with the financial
information FS-425
Cost share from BAIF to the project: 20% of project cost (mainly capital and technical cost such
as office space and equipment, field staff and part of operational cost.
Cost share from farmers: Up to 25% of technology cost
To ensure sustainability of project interventions, the project has ensured that all selected Super
Champion and Champion farmers also contribute a share of the portfolio cost that is being
implemented on their fields. Farmers are contributing across technologies including crop
portfolios, biogas, ICT based advisory service, livestock services (especially Artificial
Insemination) and in custom hiring centers (member contribution).

Annual Report 2018-19
Page 54 of 78
H. Organizational Learning, Development and Collaboration
1. Encouraging technology adoption through technical trainings: The Custom Hiring Centers
have been formed to help farmers overcome the accessibility barrier and hire technologies at
reasonable rental rates. However, the adoption level of technology remained low, especially
during the second quarter. It was realized that awareness levels regarding the operational
aspects of technology were low and farmers were skeptical on how to use the machines on
the field. To encourage them, the farmers were provided additional trainings by the machine
vendor and/or technical experts who were able to explain the functioning’s of the machines
to the farmers and provide detailed demos on the plots. As a result, there has been an
improved uptake of technology, which will be reflected in the upcoming quarters.
2. Promoting Artificial Insemination sorted semen technology for livestock: In order to boost
cattle productivity, the project is promoting Artificial Insemination (AI) across districts
through Cattle Development Centers. Two types of AI are available, general and sorted
semen. The chances of pregnancy through a general AI are about 50%. However, through
sorted semen, the chances of having a female calf are almost 95%. The two however, differ
in terms of cost. The AI is being provided at subsidized rates of Rs.100 and Rs. 250 per
animal for general and sorted semen, respectively. General AI is being provided in all
districts. The promotion of sorted semen, however, has been challenging despite its
advantages, especially in Nalanda and Betul. The key reasons for non-adoption has been lack
of awareness and trust in technology. However, rigorous capacity building and awareness
exercises have resulted in the commencement of adoption. The progress has been slow due to
the time taken for trust building among the implementing agency and villagers, especially
since the technology is new to them as well as expensive. The importance of the
implementing partner’s presence in the project area prior to project commencement has
therefore been a key learning.
3. Measures to improve women farmers participation in trainings: Women participation in
trainings saw a significant increase towards the third year of the project. There were several
factors that led to this. The first was the targeting of women groups to spread awareness
about trainings (example in Betul). Another was a change in scheduling of trainings based on
the understanding of social norms, as well as time-based availability of women farmers. For
instance, in Mathura separate trainings were held for women farmers in some cases as they
were not very comfortable being part of a group where men were also participating. In
Nalanda, trainings were held based on the availability of women farmers so that they could
also join in the sessions. Efforts were also made to include topics relevant for women farmers
including livestock and skill development. In addition, women in Betul actively
seek participation in activities related to health, nutrition and sanitation, conducted by
other local agencies in their villages. For instance, women in two of the districts of Betul are
also involved in programs such as WASH within which they are benefitting from activities

Annual Report 2018-19
Page 55 of 78
such as vegetable cultivation, smokeless chulhas, bathrooms and toilets. By participating in
multiple initiatives, therefor, women are being exposed to a wide portfolio of agricultural as
well as domestic interventions, thereby improving their awareness and interest levels.
4. Factors for successful running of Custom Hiring Centers: Custom Hiring Centers (CHC)
in Nalanda district have been able to reach a larger number of farmers compared to other
districts. This has been dues to two key reasons, higher level of awareness about
mechanization and the pricing of the technologies available in the CHCs in the district. The
local government is promoting mechanization effectively in the area and linkages have also
been developed with the local KVKs and agriculture department by the field staff. In Betul
districts, lower levels of awareness have been a key reason for lower uptake of CHC
equipment. Similarly, in Mathura, the seasonal usage of machineries limits the CHC
revenues to particular time periods. Efforts are therefore underway to resolve the challenges
being faced in the other two districts to enable sustainability of these centers.
5. The tribal district experience: Working in a tribal district such as Betul has been a different
experience in comparison to the other two districts which are dominated by a non-tribal
population. The first, and an important, step is to understand the socio-cultural settings of the
tribal community before starting any intervention. This makes it necessary to work with the
overall village community and give field level support continuously. Gaining trust is harder
in case of a tribal population. Group based approaches are more acceptable with these
communities as they operate in groups culturally as well (for instance celebrating festivals
together as a community instead of individually). In terms of capacity building, exposure
visits as a medium of extension is more successful as they find it easier to adopt a strategy
after seeing the results on the field instead of hearing about it during trainings. Tribal women
are more active compared to women from non-tribal communities and it is relatively easier to
involve them in gender focused activities. Interventions related to natural resource
management (including biogas) are more acceptable, given their stronger bond with nature.
All these factors were considered and incorporated while implementing the project in Betul
district.
Main activities for next year (2018-2019) include:
• Complete field and community-based activities, develop village level resilience plans to be
shared with district administration, develop gender inclusive climate resilient strategies, and
strengthen convergence plans with on-going government programs.
• South-South collaboration: stakeholder’s consultation meetings and field visits among some
South Asian Countries. This will comprise of exposure visits
by 20 stakeholders between India and Nepal during the extension period.
• Develop/fine-tune business models for promoting agriculture resilient building technologies,
practices and services in the vulnerable areas. The scaling models would target sustainability

Annual Report 2018-19
Page 56 of 78
of current interventions/model to generate long-term economic, social and environmental
benefits.
• Synthesis, outreach and dissemination of project results: development of high value
communication materials e.g. policy briefs, scaling guideline/models, InfoNotes, articles
and case studies, and a web portal.
• Capacity building of stakeholders including trainings and farmer exposure visits.
• Third party end-line survey and stakeholder workshops.
MAJOR ACTIVITIES IN THE EXTENSION PHASE
Activity Method Output 1. Complete field and
community-based activities • Complete 4 seasons of field level
interventions in the locations where four
cropping seasons are not completed yet
• Detailed assessment of institutional
approach (local groups) of scaling CSA
technologies, custom hiring centre’s
(CHC) and cattle development centre’s
(CDC)
• Assessment of convergence and
integration at the community level.
Quarterly and annual reports
Case studies of institutional
approach of scaling out CSA
in the community level.
2. Synthesis, outreach and
dissemination of project
results
• Use baseline survey, plot level data and
third-party end line survey for analysis
• Project webpage/ portal on CCAFS
website
Policy briefs, scaling
guidelines including gender
inclusion pathways,
InfoNotes, CSA success case
studies.
3. South-South collaborations
between stakeholders of India
and Nepal
• Cross-country field visits and meetings
with key stakeholders
Report/blog on South-South
collaboration
4. Develop/fine-tune business
models for promoting
agriculture resilient building
technologies, practices and
services in the vulnerable
areas
• Use baseline, plot level and third-party
end line survey
Report on business model for
institutions, and present CSV
approaches in national and
international seminars.
5. Capacity building of
stakeholders
6. Sustainability Pathways
• Farmer fairs and trainings
• National level stakeholder workshop
• Develop/identify resources that can
support communities beyond the life of
the project
Knowledge and skill
development for technology
implementation. Finalize and
publish training materials:
CSA/CSV implementation
guideline based on field
evidences and examples.

Annual Report 2018-19
Page 57 of 78
A. Anticipated Activities for 2019-2020
Activities Oct-Dec 2019 Jan-Mar 2020 April-Jun 2020
M1 M2 M3 M4 M5 M6 M7 M8 M9
Activity 1: Complete field and community based activities
1.1 • Complete 4 seasons of field level
interventions in the locations where four
cropping seasons are not completed yet
1.2 • Detailed assessment of institutional
approach (farmers CSV groups) of scaling
CSA technologies, custom
hiring centers (CHC) and cattle
development centers (CDC)
• Assessment of convergence and integration
at the community level
1.3 Data collection and analysis at farm and village
level to evaluate preference of technology
Activity 2: Synthesis, outreach and dissemination of project results
2.1
Policy briefs, scaling guideline and models, gender
inclusion pathways, InfoNotes, CSA
dissemination guide books, success case studies.
2.2
Assessment of institutional approach (gender
perspective) of scaling out Climate Resilient
Agriculture
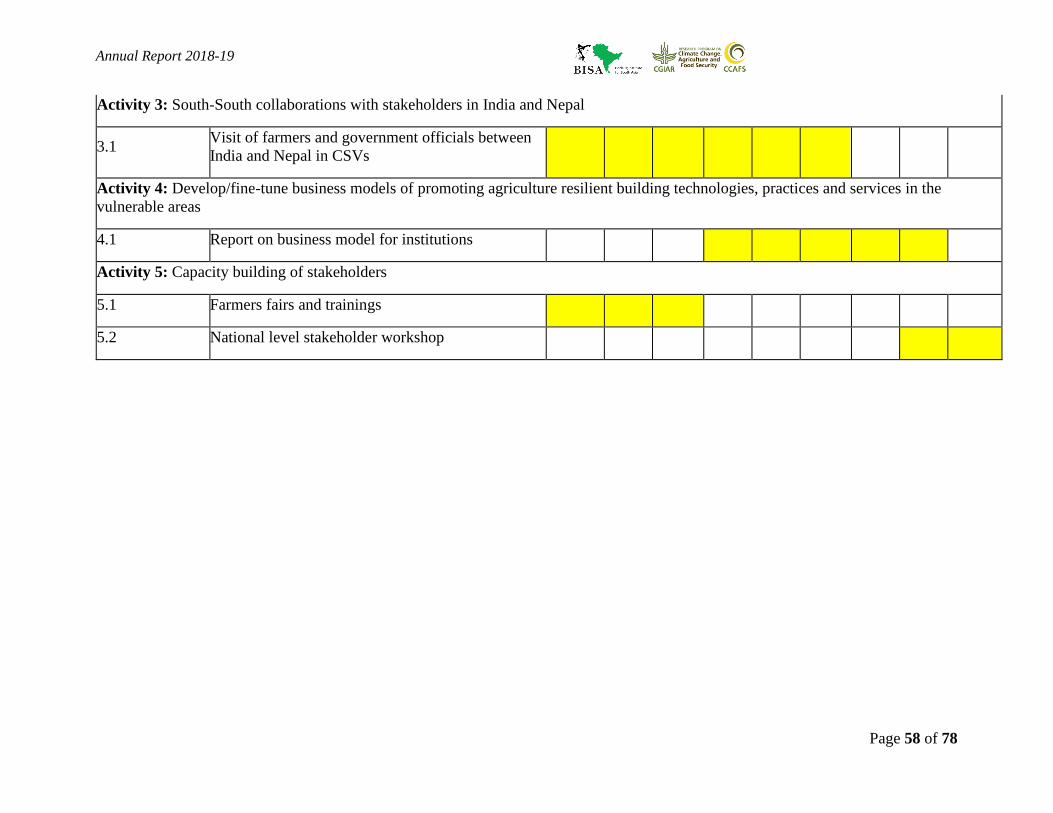
Annual Report 2018-19
Page 58 of 78
Activity 3: South-South collaborations with stakeholders in India and Nepal
3.1 Visit of farmers and government officials between
India and Nepal in CSVs
Activity 4: Develop/fine-tune business models of promoting agriculture resilient building technologies, practices and services in the
vulnerable areas
4.1 Report on business model for institutions
Activity 5: Capacity building of stakeholders
5.1 Farmers fairs and trainings
5.2 National level stakeholder workshop

Annual Report 2018-19
Page 59 of 78
B. Media Coverage Received in 2018-19
Magazine Article
• Arun Khatri-Chhetri and Nitya Chanana and (CCAFS South Asia), Empowering women
farmers for climate change adaptation, Apr 2019, Agriculture World Magazine
https://www.researchgate.net/publication/333395261_Empowering_women_farmers_for
_climate_change_adaptation
News coverage
The farmers meeting during Mathura field visit was covered by a local news channel as seen
below:
C. Communications and Dissemination Activities
Webpage
• A project page has been developed on the CCAFS website describing the key objectives,
activities, outputs, and other related information about the project. The page can be
accessed at https://ccafs.cgiar.org/scaling-out-climate-smart-village-program-vulnerable-
areas-indo-gangetic-plains-india#.XY30IPkzaUk
Publications
• Platforms for women result in higher levels of participation. In Gender Transformative
Adaptation From Good Practice to Better Policy (Published by CARE):
https://reliefweb.int/sites/reliefweb.int/files/resources/CARE_Gender-Transformative-
Adaptation_2019.pdf
Blogs
• Nitya Chanana and Arun Khatri-Chhetri (CCAFS South Asia), Meeting farmers in Indian
Climate-Smart Villages, Apr 2019 https://ccafs.cgiar.org/news/meeting-farmers-indian-climate-smart-villages

Annual Report 2018-19
Page 60 of 78
Newsletter Article
• Arun Khatri-Chhetri and Nitya Chanana (CCAFS South Asia), Setting the stage for
south-south learning, Dec 2018
https://ccafs.cgiar.org/publications/csalp-south-asia-quarterly-newsletter-
vol19#.XD8T6TAzaUk
• Nitya Chanana, Arun Khatri-Chhetri, Kunal Pandey (CCAFS) and Rajashree Joshi
(BAIF), Flowering growth through seeds of inclusion, Jan2018
https://ccafs.cgiar.org/publications/csalp-south-asia-quarterly-newsletter-
vol19#.XD8T6TAzaUk
Other communication material shared on the CCAFS website:
1. Brochure: Scaling up resilient agricultural practices, technologies and services in the
vulnerable areas of India (https://ccafs.cgiar.org/fr/node/55012#.XTgVuPkzZaQ)
2. Infonote: Integrating Gender into the Climate-Smart Village Approach of Scaling out
Adaptation Options in Agriculture (https://reliefweb.int/report/india/integrating-gender-
climate-smart-village-approach-scaling-out-adaptation-options) 9
3. Blog: Women-led Climate-Smart Village in India, all set to blaze a trail
(https://ccafs.cgiar.org/blog/women-led-climate-smart-village-india-all-set-blaze-
trail#.XTgUVPkzZaQ)
4. Blog: From trauma to triumph (https://ccafs.cgiar.org/blog/trauma-
triumph#.XcFNq5ozaUm)
5. Blog: Impacts of Climate-Smart Villages: A non-zero sum game
(https://ccafs.cgiar.org/blog/impacts-climate-smart-villages-non-zero-sum-
game#.XcFNq5ozaUm)10
6. Blog: Tending to the crying earth and the weeping shores
(https://ccafs.cgiar.org/blog/tending-crying-earth-and-weeping-shores#.XcFNx5ozaUm)
7. Newsletter article: A stitch in time saves nine (https://ccafs.cgiar.org/publications/csalp-
south-asia-quarterly-newsletter-vol16#.XTlNoegzaUm)
8. Newsletter article: Women farmers call the tune in Betul, Madhya Pradesh
(https://ccafs.cgiar.org/publications/csalp-south-asia-quarterly-newsletter-
vol16#.XTlNoegzaUm)
9. Newsletter article: Improving farmers’ access to climate-smart agricultural technologies
(https://ccafs.cgiar.org/publications/csalp-south-asia-quarterly-newsletter-
vol17#.XcFN6pozaUm)
10. Newsletter article: Of journeys to the field (https://ccafs.cgiar.org/publications/csalp-
south-asia-quarterly-newsletter-vol17#.XcFN6pozaUm)
11. Newsletter article: Setting the stage for south-south learning
(https://ccafs.cgiar.org/publications/csalp-south-asia-quarterly-newsletter-
vol19#.XcFN7pozaUm)
9 Also highlighted on: https://reliefweb.int/report/india/integrating-gender-climate-smart-village-approach-scaling-
out-adaptation-options
10 Also highlighted on https://www.agrilinks.org/post/impacts-climate-smart-villages-non-zero-sum-game

Annual Report 2018-19
Page 61 of 78
12. Newsletter article: Flowering growth through seeds of inclusion
(https://ccafs.cgiar.org/publications/csalp-south-asia-quarterly-newsletter-
vol19#.XcFN7pozaUm)
Blog: Meeting farmers in Indian Climate-Smart Villages (https://ccafs.cgiar.org/news/meeting-
farmers-indian-climate-smart-villages#.XcFN75ozaUl)
Other communication material hosted on other sites:
1. Empowering Women Farmers for Climate Change Adaptation (article in Agriculture
World magazine):
https://www.researchgate.net/publication/333395261_Empowering_women_farmers_for
_climate_change_adaptation
2. Platforms for women result in higher levels of participation. In Gender Transformative
Adaptation From Good Practice to Better Policy (Published by CARE):
https://reliefweb.int/sites/reliefweb.int/files/resources/CARE_Gender-Transformative-
Adaptation_2019.pdf

Annual Report 2018-19
Page 62 of 78
3. Annex
A. FTF M&E Indicator Sheet Indicator Definition of indicator Disaggregation in information
collection
Standard or
Performance
Input Indicator
Number of farmers and
others who have applied
improved technologies
or management practices
with USG assistance
This indicator measures the total number of direct beneficiary
farmers that implement CSA technologies and practices in their
agriculture production system as a result of project assistance.
- Farmer (marginal, small, medium,
large)
- Gender and youth
- Technology type: seed, nutrient, water
and energy management
- Crop (Rabi/Summer/Kharif)
Standard
Number of technologies
or management practices
under research, under
field testing, or made
available for transfer as a
result of USG assistance
This indicator counts the number of new or significantly
improved technologies that are made available for transfer as a
result of project assistance This includes innovations in water,
nutrient and energy use efficiency, value-addition and post-
harvest Technologies and practices to be counted here are
agriculture-related, including those that address climate change
adaptation and mitigation. Significant improvements to existing
technologies and practices should also be counted.
- Technology type: seed, nutrient, water
and energy management
- Crop (Rabi/Summer/Kharif)
Standard
Number of hectares of
land under improved
technologies or
management practices
with USG assistance
This indicator measures the area (in hectares) of land cultivated
using project promoted improved technology (ies) or
management practice(s) during the reporting year.
- Landholding size (marginal, small,
medium, large)
- Technology type: seed, nutrient, water
and energy management
- Crop (Rabi/Summer/Kharif)
Standard
Number of trainings,
workshops, farm visits,
farm fairs provided to
farmers as well as
stakeholders’
organizations
Number of people
trained in climate change
adaptation supported by
USG assistance
This indicator refers to the number of capacity building exercises
or improved organization-level technologies or management
practices provided to different stakeholders with project
assistance
- Exercise (training, workshop, farm
visits etc.)
- Stakeholder (farmer, government staff,
NGOs and community based
organizations)
- Gender and youth
Performance
Number of farmers or
farm households have
access to weather based
agro-advisory, market
This indicator measures the total number of direct beneficiary
farmers that have access to weather based agro-advisory, market
information and agriculture insurance and use in agriculture
production system as a result of project assistance.
- Service type: weather information,
agro-advisory, market information,
agriculture insurance
- Gender and youth
Performance

Annual Report 2018-19
Page 63 of 78
information and
agriculture insurance
Number of people using
climate information or
implementing risk-
reducing actions to
improve resilience to
climate change as
supported by USG
assistance
- Crop (Rabi/Summer/Kharif)
Indicator Definition of indicator Disaggregation in information
collection
Standard or
Performance
Output Indicator
Average change in yield
(ton) and net income
(Rs.) per hectare of crop
land
This indicator measures the average change in yield (ton/ha) and
income (Rs./ha) from the baseline after the implementation of
CSA technologies and practices in their agriculture production
system as a result of project assistance.
- Farmer (marginal, small, medium,
large)
- Technology type: seed, nutrient, water
and energy management
- Crop (Rabi/Summer/Kharif)
Performance
Average change in
emission intensity (CO2
/ton of food production)
from the CSA
interventions
This indicator measures the average change in emission intensity
(CO2 /ton of food production) from the baseline after the
implementation of CSA technologies and practices in their
agriculture production system as a result of project assistance.
- Technology type: seed, nutrient, water
and energy management
- Crop (Rabi/Summer/Kharif)
- Farmer (marginal, small, medium,
large)
Performance
Number of farmers who
have seen improvement
in yield and income per
hectare of agricultural
land
This indicator measures the number of direct beneficiary farmers
who saw an increase in yield per hectare of agricultural land
from the baseline after the implementation of CSA technologies
and practices in their agriculture production system as a result of
project assistance.
- Landholding size (marginal, small,
medium, large)
- Technology type: seed, nutrient, water
and energy management
- Crop (Rabi/Summer/Kharif)
Performance
Number of hectares of
land showing
improvement in yield
This indicator measures area (in hectares) of land cultivated,
showing increase in yield per hectare of agricultural land from
the baseline after the implementation of CSA technologies and
practices as a result of project assistance
- Landholding size (marginal, small,
medium, large)
- Technology type: seed, nutrient, water
and energy management
- Crop (Rabi/Summer/Kharif)
- Gender and youth
Performance
Average change in
water, nutrient and
energy use per ton of
crop production
This indicator measures the change in water, nutrient and energy
use per ton of crop production from the baseline after the
implementation of CSA technologies and practices as a result of
project assistance
- Landholding size (marginal, small,
medium, large)
- Technology type: seed, nutrient, water
and energy management
- Crop (Rabi/Summer/Kharif)
Performance
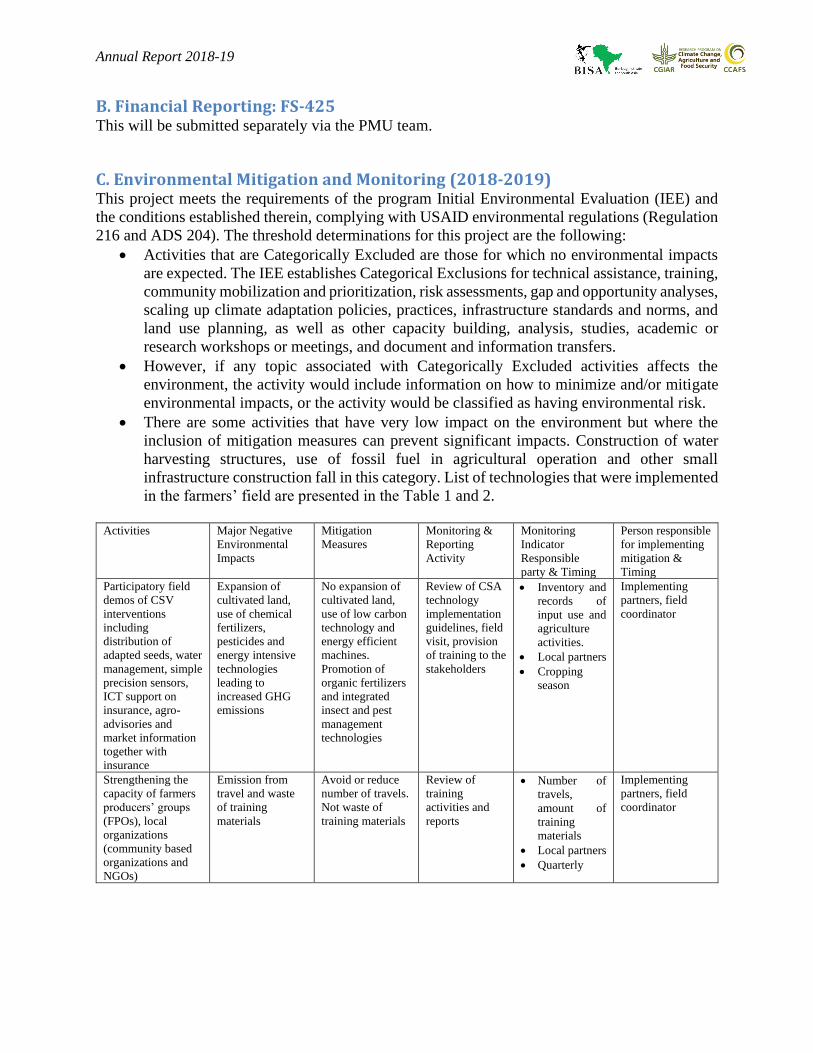
Annual Report 2018-19
B. Financial Reporting: FS-425 This will be submitted separately via the PMU team.
C. Environmental Mitigation and Monitoring (2018-2019) This project meets the requirements of the program Initial Environmental Evaluation (IEE) and
the conditions established therein, complying with USAID environmental regulations (Regulation
216 and ADS 204). The threshold determinations for this project are the following:
• Activities that are Categorically Excluded are those for which no environmental impacts
are expected. The IEE establishes Categorical Exclusions for technical assistance, training,
community mobilization and prioritization, risk assessments, gap and opportunity analyses,
scaling up climate adaptation policies, practices, infrastructure standards and norms, and
land use planning, as well as other capacity building, analysis, studies, academic or
research workshops or meetings, and document and information transfers.
• However, if any topic associated with Categorically Excluded activities affects the
environment, the activity would include information on how to minimize and/or mitigate
environmental impacts, or the activity would be classified as having environmental risk.
• There are some activities that have very low impact on the environment but where the
inclusion of mitigation measures can prevent significant impacts. Construction of water
harvesting structures, use of fossil fuel in agricultural operation and other small
infrastructure construction fall in this category. List of technologies that were implemented
in the farmers’ field are presented in the Table 1 and 2.
Activities Major Negative
Environmental
Impacts
Mitigation
Measures
Monitoring &
Reporting
Activity
Monitoring
Indicator
Responsible
party & Timing
Person responsible
for implementing
mitigation &
Timing
Participatory field
demos of CSV
interventions
including
distribution of
adapted seeds, water
management, simple
precision sensors,
ICT support on
insurance, agro-
advisories and
market information
together with
insurance
Expansion of
cultivated land,
use of chemical
fertilizers,
pesticides and
energy intensive
technologies
leading to
increased GHG
emissions
No expansion of
cultivated land,
use of low carbon
technology and
energy efficient
machines.
Promotion of
organic fertilizers
and integrated
insect and pest
management
technologies
Review of CSA
technology
implementation
guidelines, field
visit, provision
of training to the
stakeholders
• Inventory and
records of
input use and
agriculture
activities.
• Local partners
• Cropping
season
Implementing
partners, field
coordinator
Strengthening the
capacity of farmers
producers’ groups
(FPOs), local
organizations
(community based
organizations and
NGOs)
Emission from
travel and waste
of training
materials
Avoid or reduce
number of travels.
Not waste of
training materials
Review of
training
activities and
reports
• Number of
travels,
amount of
training
materials
• Local partners
• Quarterly
Implementing
partners, field
coordinator

Annual Report 2018-19
F. Key Project Personal Sr # Name Designation Telephone E-mail
1 Dr. Pramod Aggarwal /
Dr. Arun Joshi
Project Advisor 11-25842940 /
11-25842201
2 Dr. Arun KC Project Leader and M&E lead 11-25842940 [email protected]
3 Dr. Paresh Shirsath Adaptation Prioritization Expert 11-25842940 [email protected]
4 Mr. Anil Pimpale Field Coordinator 11-25842940 [email protected] 5 Ms. Nitya Chanana Gender and Adaptation Expert 11-25842940 [email protected]
7 Ms. Sakshi Saini Communication Specialist 11-25842940 [email protected]
8 Ms. Meenakshi
Chandiramani
Admin Assistant 11-25842940 [email protected]
9 Mr. Sachin Srivastava Finance management 11-25842940 [email protected]
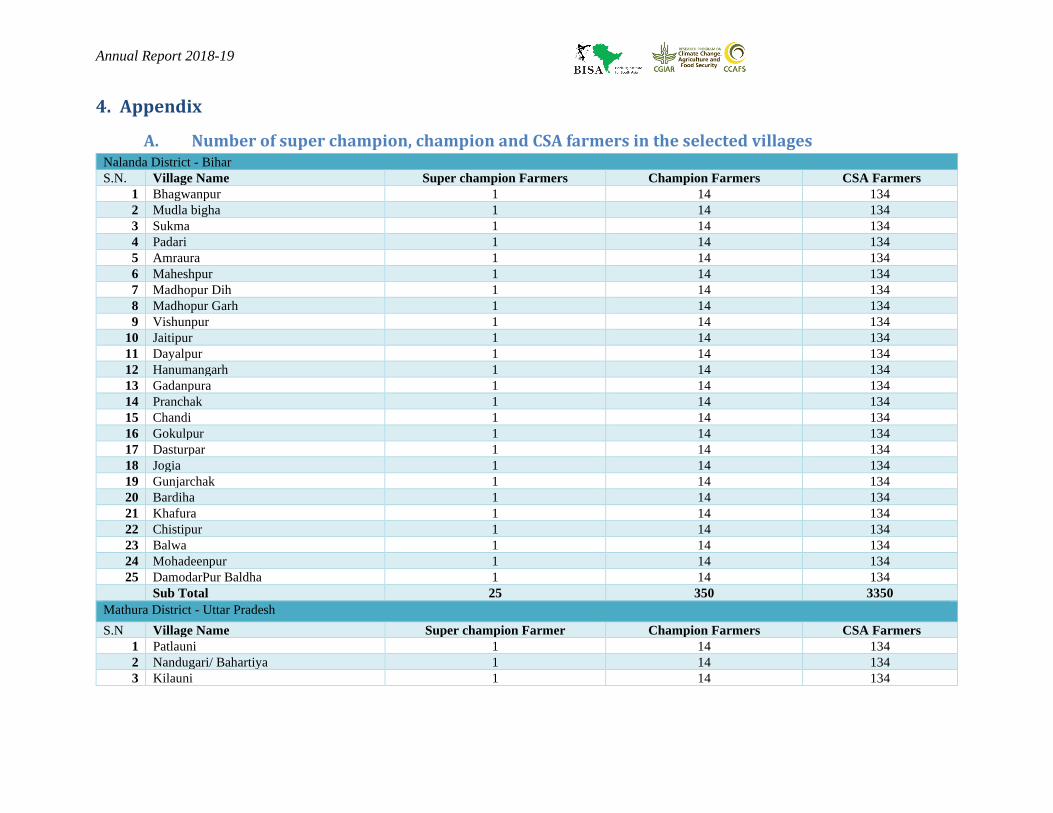
Annual Report 2018-19
4. Appendix
A. Number of super champion, champion and CSA farmers in the selected villages Nalanda District - Bihar
S.N. Village Name Super champion Farmers Champion Farmers CSA Farmers
1 Bhagwanpur 1 14 134
2 Mudla bigha 1 14 134
3 Sukma 1 14 134
4 Padari 1 14 134
5 Amraura 1 14 134
6 Maheshpur 1 14 134
7 Madhopur Dih 1 14 134
8 Madhopur Garh 1 14 134
9 Vishunpur 1 14 134
10 Jaitipur 1 14 134
11 Dayalpur 1 14 134
12 Hanumangarh 1 14 134
13 Gadanpura 1 14 134
14 Pranchak 1 14 134
15 Chandi 1 14 134
16 Gokulpur 1 14 134
17 Dasturpar 1 14 134
18 Jogia 1 14 134
19 Gunjarchak 1 14 134
20 Bardiha 1 14 134
21 Khafura 1 14 134
22 Chistipur 1 14 134
23 Balwa 1 14 134
24 Mohadeenpur 1 14 134
25 DamodarPur Baldha 1 14 134
Sub Total 25 350 3350
Mathura District - Uttar Pradesh
S.N Village Name Super champion Farmer Champion Farmers CSA Farmers
1 Patlauni 1 14 134
2 Nandugari/ Bahartiya 1 14 134
3 Kilauni 1 14 134

Annual Report 2018-19
4 Nagla Mansha 1 14 134
5 Nagla Mohan 1 14 134
6 Barauli 1 14 134
7 Selkheda 1 14 134
8 Sukhdeo Burj 1 14 134
9 Kaush Kheda 1 14 134
10 Sarai Salvahan 1 14 134
11 Averani 1 14 134
12 Pachavar 1 14 134
13 Hathkauli 1 14 134
14 Nagla Girdhar/Maharath 1 14 134
15 Jataura 1 14 134
16 Madaura 1 14 134
17 Naya Bansh/ Tatrauta 1 14 134
18 Pipri 1 14 134
19 Ashagadi 1 14 134
20 Gadsauli 1 14 134
21 Hathuda 1 14 134
22 Nurpur 1 14 134
23 Bashai 1 14 134
24 Ibrahimpur 1 14 134
25 Khappar Pur 1 14 134
Sub Total 25 350 3350
Betul Distric - Madhya Pradesh
Village Name Super champion Farmer Champion Farmers CSA Farmers
Anwariya 1 14 134
Banspur 1 14 134
Chunagosai 1 14 134
Desawadi 1 14 134
Golhai Buzurg 1 14 134
Hirapur 1 14 134
Katasur 1 14 134
Kathawadi 1 14 134
Khakhara 1 14 134
Kundi 1 14 134
Mlajpur 1 14 134
Mokha Mal 1 14 134
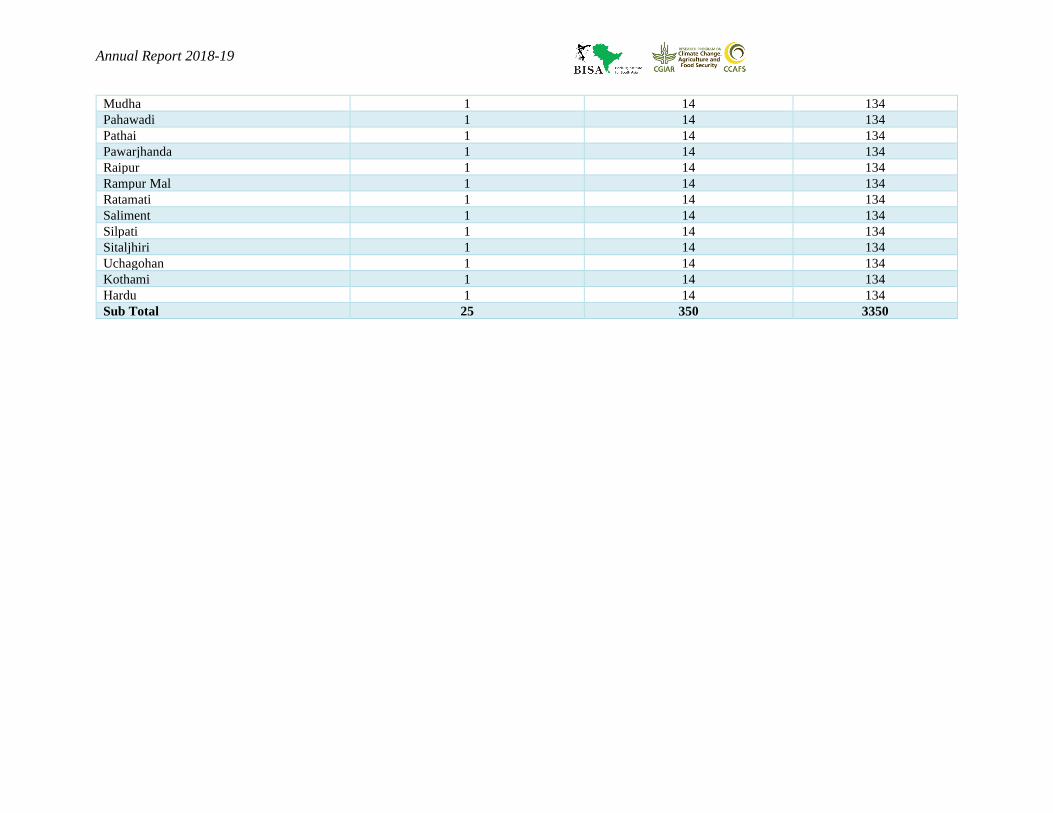
Annual Report 2018-19
Mudha 1 14 134
Pahawadi 1 14 134
Pathai 1 14 134
Pawarjhanda 1 14 134
Raipur 1 14 134
Rampur Mal 1 14 134
Ratamati 1 14 134
Saliment 1 14 134
Silpati 1 14 134
Sitaljhiri 1 14 134
Uchagohan 1 14 134
Kothami 1 14 134
Hardu 1 14 134
Sub Total 25 350 3350

Annual Report 2018-19
B. List of Weather Resilient Technologies, Practices and Services
Water-Smart Interventions that improve Water-Use Efficiency
1. Rainwater Harvesting- Farm Ponds • Collection of rainwater not allowing to run-off and use for agriculture in rainfed/dry areas and
other purposes on site.
2. Drip Irrigation • Application of water directly to the root zone of crops and minimize water loss
3. Sprinkler Irrigation • Method of applying irrigation water which is similar to rainfall, high irrigation efficiency due to
uniform distribution of water
4. Direct Seeded Rice • Requires less water compared to traditional transplanting
5. Alternate Wetting and Drying (Rice) • Need based application of water in the rice filed, minimize overuse of water
6. Systems of Rice Intensification (SRI) • Change in management of plants, soil, water and nutrients in rice cultivation
7. Furrow Irrigated Bed Planting • This method offers more effective control over irrigation and drainage as well as rainwater
management during the monsoon (also improves nutrient use efficiency)
8. Conservation Furrow • Conserve water and allows better drainage and run-off
9. Raised Bed Planting • Conserve water and allows better drainage and run-off
10. Drainage Management • Removal of excess water (flood) through water control structure
11. Cover Crops Method • Reduces evaporation loss of soil water (also adds nutrients into the soil)
Energy-Smart Interventions that improve Energy-Use Efficiency
12. Minimum Tillage • Reduces amount of energy use in land preparation. In long-run, it also improves water
infiltration and organic matter retention into the soil
13. Solar Pumps • Increased access to power through renewable energy; adaptation and mitigation
Nutrient-Smart Interventions that improve Nutrient-Use Efficiency
14. Site Specific Integrated Nutrient Management • Optimum supply of soil nutrients over time and space matching to the requirements of crops
with right product, rate, time and place
15. Green Manuring • Growing and incorporating legume biomass into soil. This practice improves nitrogen supply
and soil quality.
16. Leaf Color Chart/GreenSeeker • Quantify the required amount of nitrogen use based on greenness of crops. Mostly used for split
dose application in rice but also applicable for maize and wheat crops to detect nitrogen
deficiency
17. Intercropping with Legumes • Cultivation of legumes with other main crops in alternate rows or different ratios. This practice
improves nitrogen supply and soil quality

Annual Report 2018-19
Carbon-Smart Interventions that reduce GHG emissions
18. Agro Forestry/Horticulture • Promote carbon sequestration including sustainable land use management
19. Concentrate Feeding for Livestock • Reduces nutrient losses and livestock requires low amount of feed
20. Fodder Management • Promote carbon sequestration including sustainable land use management
21. Integrated Pest Management • Reduces use of chemicals
22. Bio-gas • Reduced methane emissions and fossil fuel use
-Smart Interventions that provide services related to income security and advisories to farmers
23. Weather Smart Housing for Livestock • Protection of livestock from extreme weather events (e.g. heat/cold stresses)
24. Weather Information (seasonal and in season) • Advance weather information help reduce weather risk or take advantage of better seasons
25. Based Crop Agro-Advisory • Weather information based value added agro advisories to the farmers
26. Crop Insurance • Crop-specific insurance to compensate income loss due to vagaries of
Knowledge-Smart Use of combination of science and local knowledge
27. Contingent Crop Planning • Weather risk management plan to cope with major related contingencies like drought, flood,
heat/cold stresses during the crop growing season
28. Improved/Short Duration Crop Varieties • Crop varieties that are tolerant to drought, flood and heat/cold stresses
29. Fodder Banks • Conservation of fodders to manage weather risks
30. Seed Systems/Banks • Ensuring farmers access to weather ready cultivars
31. Stress Tolerant High-Yielding Breeds of Livestock • Livestock breed that perform better under weather stress/drought
32. Livestock & Fishery as Diversification Strategy • Reduce risk of income loss due to weather variability
33. Prophylaxis & Area Specific Mineral Mixture for
Livestock
• Livestock better withstand abiotic stresses
34. Rotational Grazing • Sustainable fodder production from pastures/commons

Annual Report 2018-19
C. Progress of project activities
1. Demo plots
Districts Improved seed crops (variety name)
Number of demo plots
Area of demo (Acre) Number of farmers
Y1
Y2 Y3 Y1
Y2 Y3
Super Champion
Champion CSA
Y1 Y2 Y3 Y1 Y2 Y3 Y1 Y2 Y3
Betul
Wheat (MP 3336) - 137 - 68.5 11 126 - -
Wheat (HI-8672
variety) and mustard
(Samriddhi Gold)
245 - 122.5 - 21 - 224 - - -
Gram (Jg 64,jg 14
Rbs 201) - 238 - 119 14 224 - -
Chickpea (GJ-11)
and mustard
(Samriddhi Gold
130 - 65 - 4 - 126 - - -
Paddy (6444) 142 - 71 - 6 - 136 - - -
Paddy (MTU 11) 205 102.5 16 189
Soyabean (JS-9305) 72 - 36 - 4 - 68 - - -
Vegetable (Chandani (Mirchi), Onion (Nasik Red N53), Bitter Guard (Kundan)
80 - 40 - 4 - 76 - - -
Arhar (NTL 30) 18 - 9 - 2 - 16 - - -
Soyabean (RBS-2001) - 62 - 31 - 4 - 58 - -

Annual Report 2018-19
Tur/Arhar (Asha ICPL -87119)
- 28 - 14 - 1 - 27 - -
Mathura
Wheat (PB502) - 150 - 75 10 140 - -
Wheat (PBW 343) 140 - 70 - 8 - 132 - - -
Mustard (Pioneer 45S42)
8 - 4 - 2 - 6 - - -
Paddy (PB 1509) 15 - 7.5 - 1 - 14 - - -
Bajra (Pioneer 86M84)
120 135 - 64.5 67.5 - 9 9 - 111 135 - - -
Nalanda
Wheat (HD-
967+HD2733,FS/BS) - 428 - 130 24 302 - 226
Wheat (HD- 2967+HD2733+K-307)
180 - 96 - 14 - 196 - 299 -
Berseem (Kaveri) - 552 - 30 24 302 - 226
Oats (Kent) - 552 - 30 5 5 - 2
Napier Grass (BAIF
Hybrid Napier) - 12 - 0.3 23 262 - -
Mustard (RH-749) - 11 - 5.6 1 10 - -
Lentil (KL-5218) 75 - 40 - 5 - 70 - - -
Onion (NHRDF-L28 R) 30 - 16 - 6 - 24 - 6 -
Paddy (Sahbhagi + R-Mansoori)
285 - 154 - 19 - 266 - 296 -
Paddy (R-Sweta,R- Bhagwati)
150 80 10 140 124
Total 270 1555 2375 144.5 798.5 605.9 19 105 133 251 1489 1645 124 601 454

Annual Report 2018-19
2.Trainings
Progress of trainings and participants in the last two years for Betul district
BETUL Number of trainings Total participants Number
of male participants Number of female participants
Y2 Y3 Q1Y3 Q2Y3 Q3Y3 Q4Y3 Y2 Y3 Q1Y3 Q2Y3 Q3Y3 Q4Y3 Y2 Y3 Q1Y3 Q2Y3 Q3Y3 Q4Y3 Y2 Y3 Q1Y3 Q2Y3 Q3Y3 Q4Y3
Crop related
CSA
technologies
and practices
90 50 8 10 12 20 1,899 1,059 268 300 152 339 746 361 62 129 65 105 1,147 698 206 171 87 234
Nutrient
Management 72 29 - - - 29 992 489 - - - 489 164 206 - - - 206 828 283 - - - 283
Livestock
related
practices
5 16 8 1 - 7 122 508 268 63 - 177 32 178 62 40 - 76 90 330 206 23 - 101
Total 167 87 8 11 12 56 3,013 1,788 268 363 152 1,005 942 683 62 169 65 387 2,065 1,105 206 194 87 618
Progress of trainings and participants in the last two years for Mathura district
MATHURA Number of trainings
Total participants Number
of male participants Number of female
participants
Y2 Y3 Q1Y3 Q2Y3 Q3Y3 Q4Y3 Y2 Y3 Q1Y3 Q2Y3 Q3Y3 Q4Y3 Y2 Y3 Q1Y3 Q2Y3 Q3Y3 Q4Y3 Y2 Y3 Q1Y3 Q2Y3 Q3Y3 Q4Y3
Crop related
CSA
technologies
and practices
10 38 19 7 2 10 275 813 338 135 63 277 252 734 319 128 46 241 23 79 19 7 17 36
Nutrient
Management
/Agro-
advisory
2 5 - 4 - 1 72 135 - 112 - 23 62 135 - 112 - 23
10 0 - - - -

Annual Report 2018-19
Livestock
related
practices
7 33 9 11 1 12 224 728 124 225 35 344 224 636 111 225 25 275 - 92 13 - 10 69
Biogas and
CHC 2 8 5 - 1 2 40 169 99 - 24 46 40 113 83 - 14 16 - 56 16 - 10 30
Total 21 84 33 22 4 25 611 1,845 561 472 122 690 578 1,618 513 465 85 555 33 227 48 7 37 135
Progress of trainings and participants in the last two years for Nalanda district
NALANDA Number of trainings Total participants Number
of male participants Number of female participants
Y2 Y3 Q1Y3 Q2Y3 Q3Y3 Q4Y3 Y2 Y3 Q1Y3 Q2Y3 Q3Y3 Q4Y3 Y2 Y3 Q1Y3 Q2Y3 Q3Y3 Q4Y3 Y2 Y3 Q1Y3 Q2Y3 Q3Y3 Q4Y3
Crop related
CSA
technologies
and practices
25 49 14 9 2 24 918 2,199 709 336 127 1,027 767 1,699 583 256 92 738 151 530 126 80 35 289
ICT based
agro
advisory /
Crop
insurance
2 4 - 4 - - 145 280 - 280 - - 99 231 - 231 - - 46 49 - 49 - -
Livestock
related
practices
7 1 1 - - - 235 65 65 0 - - 222 36 36 - - - 29 29 29 - - -
Other
(INM,biogas
and CHC)
4 2 - - - 2 206 128 - 0 - 128 178 86 - - - 86 28 42 - - - 42
Total 38 56 15 13 2 26 1,504 2,672 774 616 127 1,155 1,266 2,022 619 487 92 824 238 650 155 129 35 331

Annual Report 2018-19
3. Convergence
District Activity Amount of convergence (Rs.) Number of beneficiary households Government
scheme/department Y2 Y3 Q1Y3 Q2Y3 Q3Y3 Q4Y3 Y2 Y3 Q1Y3 Q2Y3 Q3Y3 Q4Y3
Betul
Area brought
under new
crops (Seed
distribution)
16,40,212 10,85,742 10,68,442 - 17,300 - 1,686 1576 1417 - 159 Agriculture
Department
Soil Health
Cards - 41,470 11,700.00 - - 29,770 405 319 90 - - 229
PM Flagship
program
Support for
availing the
benefit of
spray pumps
21,000 29000 29,000 - - - 15 2 2 - - -
Agriculture
Department, (Zilla
Palika)
PoP in
Rice/Maize
& Soyabean
- - - - 450 - - -
Sprinkler - 9,49,407 6,22,078 - - 3,27,329 - 30 22 - - 8
Bio gas - 15,000 15,000 - - - 1 - -
Bio-
Pesticide/
Fertiliser
11,424 8,19,810 - - 10,010 8,09,800 21 259 - - 15 244 BRLF
Agricultural
tools 71,138 - - 6 - - Agriculture
Department
Kitchen
Garden (Incl.
vegetable
seeds and
trainings)
- 31,275 6,500 13,650 11,125 - 19 182 71 Horticulture
department
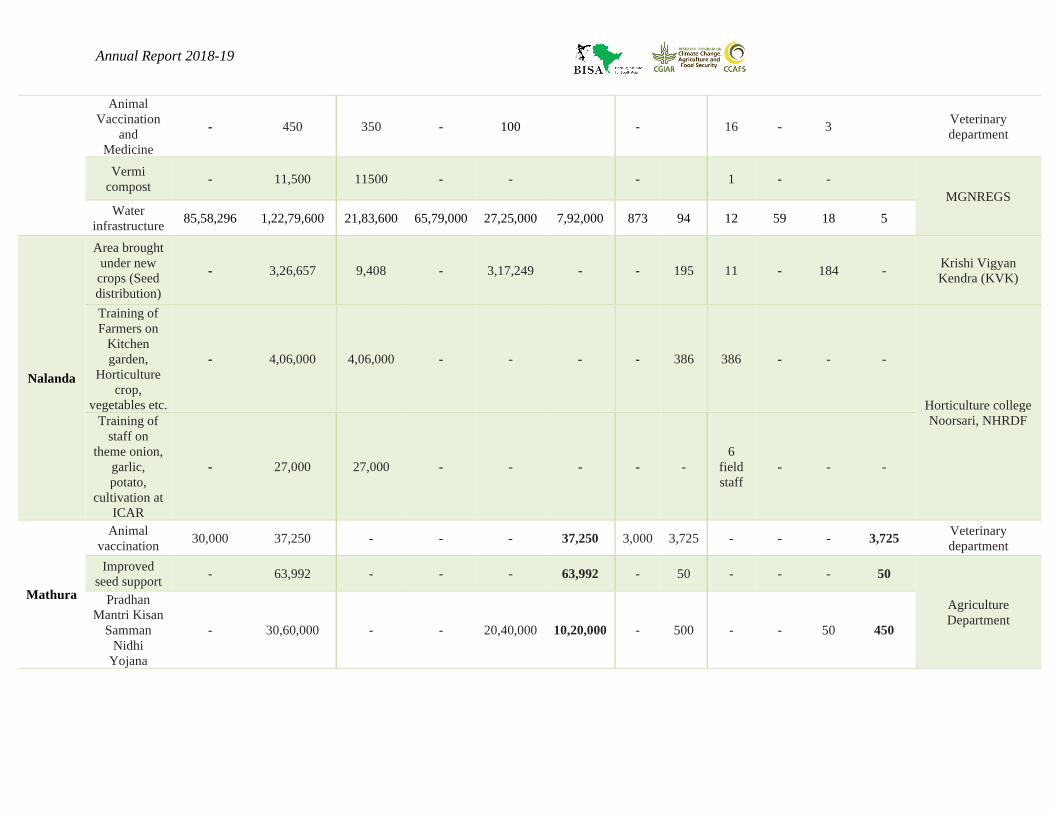
Annual Report 2018-19
Animal
Vaccination
and
Medicine
- 450 350 - 100 - 16 - 3 Veterinary
department
Vermi
compost - 11,500 11500 - - - 1 - -
MGNREGS Water
infrastructure 85,58,296 1,22,79,600 21,83,600 65,79,000 27,25,000 7,92,000 873 94 12 59 18 5
Nalanda
Area brought
under new
crops (Seed
distribution)
- 3,26,657 9,408 - 3,17,249 - - 195 11 - 184 - Krishi Vigyan
Kendra (KVK)
Training of
Farmers on
Kitchen
garden,
Horticulture
crop,
vegetables etc.
- 4,06,000 4,06,000 - - - - 386 386 - - -
Horticulture college
Noorsari, NHRDF Training of
staff on
theme onion,
garlic,
potato,
cultivation at
ICAR
- 27,000 27,000 - - - - -
6
field
staff
- - -
Mathura
Animal
vaccination 30,000 37,250 - - - 37,250 3,000 3,725 - - - 3,725
Veterinary
department
Improved
seed support - 63,992 - - - 63,992 - 50 - - - 50
Agriculture
Department
Pradhan
Mantri Kisan
Samman
Nidhi
Yojana
- 30,60,000 - - 20,40,000 10,20,000 - 500 - - 50 450
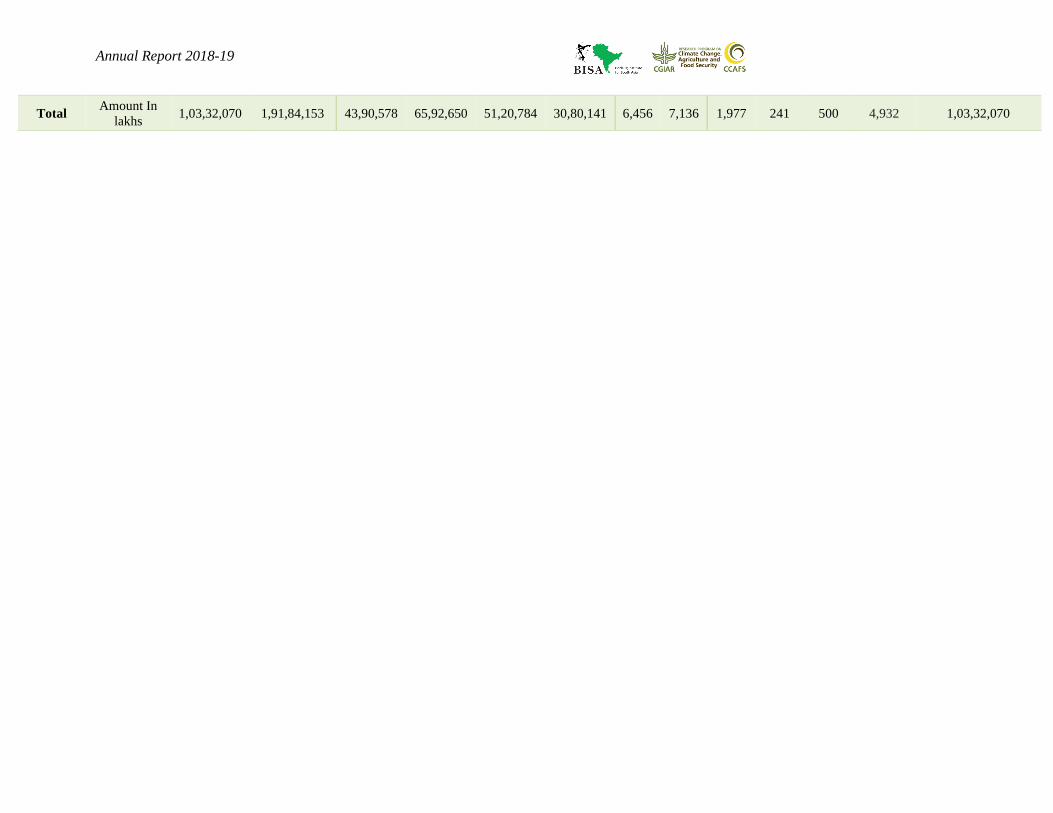
Annual Report 2018-19
Total Amount In
lakhs 1,03,32,070 1,91,84,153 43,90,578 65,92,650 51,20,784 30,80,141 6,456 7,136 1,977 241 500 4,932 1,03,32,070

Annual Report 2018-19
5. Women engaged in micro-enterprises
*Some members are part of both CHC as well as other type of enterpises
**
Enterprise type Group or Individual woman farmer
Custom Hiring Center Group
Sale of organic pesticide/fertiliser Group
Sale of Napier fodder Individual
Vegetable cultivation and sale Group (in Nalanda) / Individual (in Betul)
Sale of seeds Individual
FY 2018-19 Betul Nalanda Mathura Total
Total number of women engaged in micro enterprises*
47 51 51 149
Types of micro enterprises (Custom Hiring Center, Sale of organic pesticide/fertiliser, sale of Napier
fodder, vegetable cultivation and sale, sale of seeds)**
5 2 1 5
Number of days training provided to women to run these micro-enterprises
58 24 14 104
Details
Number of women engaged in CHC 41 44 51 136
Trainings provided for CHC 20 23 14 57
Number of women engaged in other enterprises (Including IPM/NPM, vegetable cultivation, sale of
napier fodder) 14 8 - 22
Trainings provided for other enterprises 46 1 - 47