annual report - 2017 - Incap Corporation
56
ANNUAL REPORT 2017
-
Upload
khangminh22 -
Category
Documents
-
view
4 -
download
0
Transcript of annual report - 2017 - Incap Corporation
ANNUAL REPORT
2017

2
We are an Electronics Manufacturing Services (EMS) company with manufacturing units in India and in Estonia and a sourcing team in Hong Kong. Our professional and competent team is especially focusing on customer service. With our flexible, agile and efficient operations we are able to provide best solutions to meet our customers’ needs.
In EMS marketplace, Incap has a long history and reputation of high quality. Over the years we have learned that alongside with the core EMS market demand of On Time Delivery, Quality and Cost efficiency, our customers expect their partners to be able to adjust into continuous change. That is how we develop and run our operations.
INCAP IN BRIEF
CONTENTS
Incap In Brief .................................................................................................................... 2
Year 2017 ............................................................................................................................. 3
Review by the President and CEO ............................................................ 4
Report of the Board of Directors for 2017 ........................................6
Consolidated Income Statement .............................................................12
Consolidated Balance Sheet .........................................................................14
Consolidated Cash Flow Statement ......................................................15
Consolidated Statement of Changes in Equity ..........................16
Notes to the Consolidated Financial Statements ....................17
Parent Company Income Statement ....................................................33
Parent Company Balance Sheet................................................................34
Parent Company Cash Flow Statement .............................................35
Notes to the Parent Company Financial Statements ..........36
Board of Directors’ Proposal on Measures
Related to the Result ..........................................................................................41
Auditor’s report ........................................................................................................42
Five-year Key Figures ............................................................................................46
Definitions of Key Figures ................................................................................48
Board of Directors ...................................................................................................50
Management Team ................................................................................................51
Shares and Shareholders .................................................................................52
ANNUAL REPORT 2017 | INCAP IN BRIEF

3
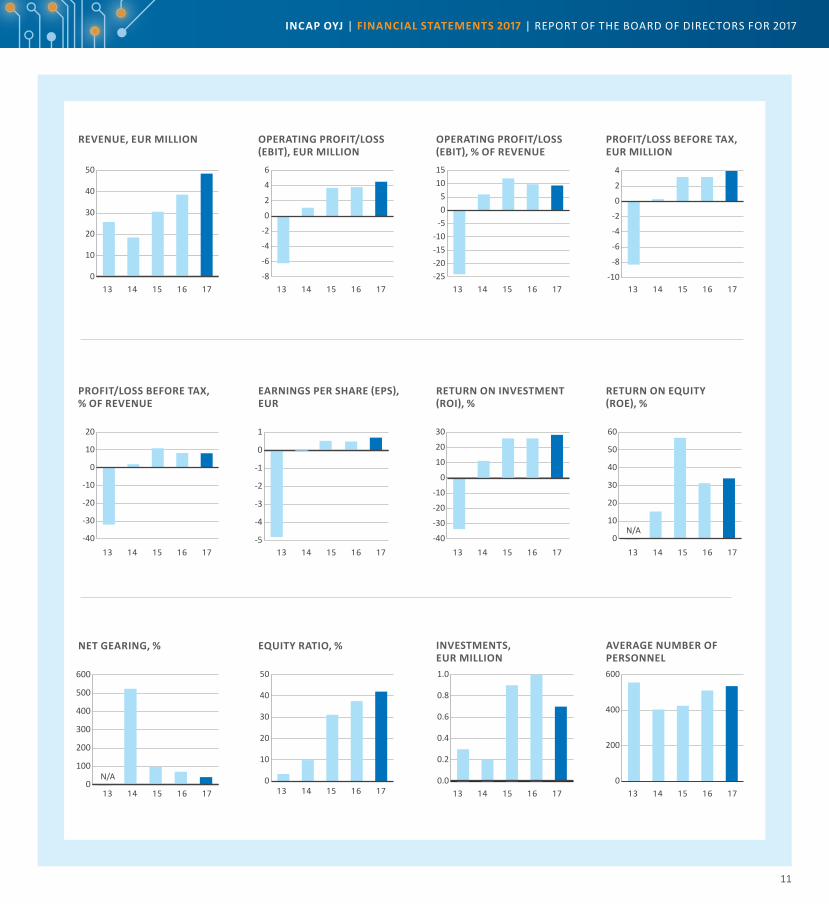
KEY FIGURES (IFRS) 2017 2016
Revenue EUR million 48.5 38.6
Operating profit (EBIT) EUR million 4.5 3.8
share of revenue % 9.3 9.8
Operating profit before tax EUR million 4.0 3.2
Profit for the period EUR million 3.1 2.1
Earnings per share (EPS) EUR 0.71 0.49
Return on investment (ROI) % 28.3 26.0
Equity ratio % 42.0 37.6
Investments EUR million 0.7 1.0
Personnel at year end 570 514
YEAR 2017 Incap continued its profitable growth. The share of operating profit out of revenue stayed at a good level and the company’s financial position strengthened further. Factory extension and renewal of manufacturing capacity enable continued organic growth.
Incap Group’s revenue grew by 26% and the operating profit by 20% year-on-year. Revenue for the first half of the year amounted to EUR 23.8 million and for the second half to EUR 24.8 million. Operating profit was at the same level at approximately EUR 2.3 million on both halves of the year.
The EBIT margin stayed at a good level and the company continued to be among the best companies in its peer group in this respect.
Special attention was paid to the customer-focused flexibility and efficiency of operations. The company’s overhead costs remained low
ensuring profitable operations and continued competitiveness. Thanks to successful cost management the financial position was strengthened further.
The factory extension in India and the modernisation of manufacturing machinery in Estonia enable the acquisition of new customers and new products. The revenue can be increased further without any significant new investments in factory premises.
INCAP OYJ | ANNUAL REPORT 2017 | YEAR 2017

4
STEADY STEPS AHEADIncap continued its strong performance in 2017. Thanks to our solid operational and financial foundation we are in good shape to grow and expand our operations further.
ANNUAL REPORT 2017 | REvIEW BY ThE PRESIDENT AND CEO
5
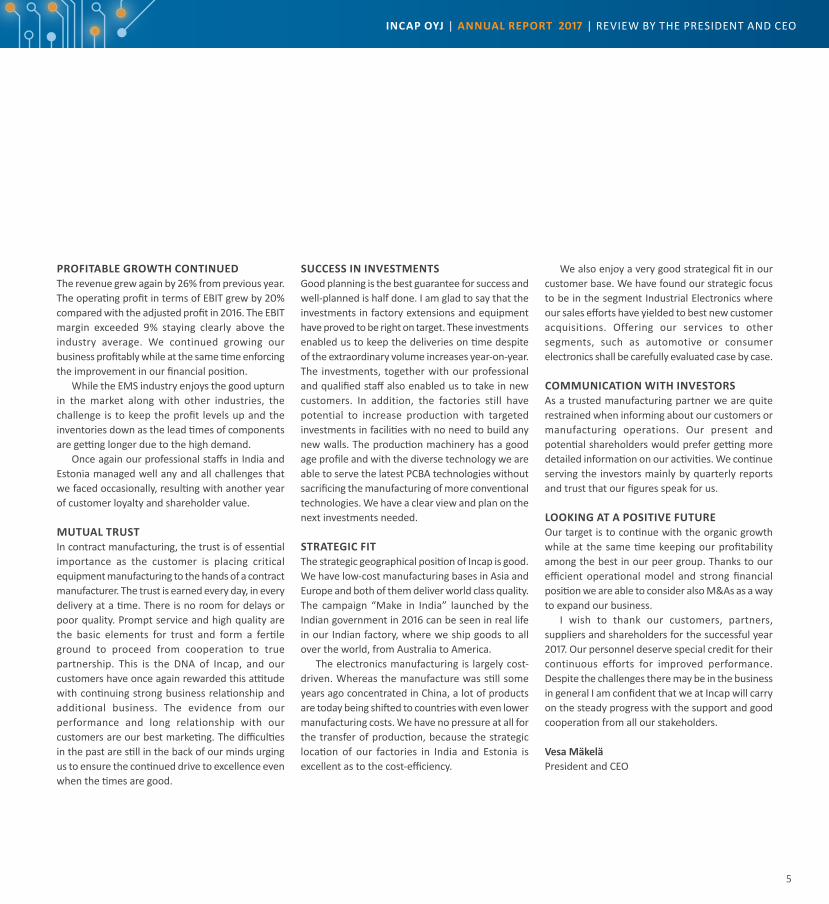
PROFITABLE GROWTH CONTINUEDThe revenue grew again by 26% from previous year. The operating profit in terms of EBIT grew by 20% compared with the adjusted profit in 2016. The EBIT margin exceeded 9% staying clearly above the industry average. We continued growing our business profitably while at the same time enforcing the improvement in our financial position.
While the EMS industry enjoys the good upturn in the market along with other industries, the challenge is to keep the profit levels up and the inventories down as the lead times of components are getting longer due to the high demand.
Once again our professional staffs in India and Estonia managed well any and all challenges that we faced occasionally, resulting with another year of customer loyalty and shareholder value.
MUTUAL TRUST In contract manufacturing, the trust is of essential importance as the customer is placing critical equipment manufacturing to the hands of a contract manufacturer. The trust is earned every day, in every delivery at a time. There is no room for delays or poor quality. Prompt service and high quality are the basic elements for trust and form a fertile ground to proceed from cooperation to true partnership. This is the DNA of Incap, and our customers have once again rewarded this attitude with continuing strong business relationship and additional business. The evidence from our performance and long relationship with our customers are our best marketing. The difficulties in the past are still in the back of our minds urging us to ensure the continued drive to excellence even when the times are good.
SUCCESS IN INVESTMENTSGood planning is the best guarantee for success and well-planned is half done. I am glad to say that the investments in factory extensions and equipment have proved to be right on target. These investments enabled us to keep the deliveries on time despite of the extraordinary volume increases year-on-year. The investments, together with our professional and qualified staff also enabled us to take in new customers. In addition, the factories still have potential to increase production with targeted investments in facilities with no need to build any new walls. The production machinery has a good age profile and with the diverse technology we are able to serve the latest PCBA technologies without sacrificing the manufacturing of more conventional technologies. We have a clear view and plan on the next investments needed.
STRATEGIC FITThe strategic geographical position of Incap is good. We have low-cost manufacturing bases in Asia and Europe and both of them deliver world class quality. The campaign “Make in India” launched by the Indian government in 2016 can be seen in real life in our Indian factory, where we ship goods to all over the world, from Australia to America.
The electronics manufacturing is largely cost-driven. Whereas the manufacture was still some years ago concentrated in China, a lot of products are today being shifted to countries with even lower manufacturing costs. We have no pressure at all for the transfer of production, because the strategic location of our factories in India and Estonia is excellent as to the cost-efficiency.
We also enjoy a very good strategical fit in our customer base. We have found our strategic focus to be in the segment Industrial Electronics where our sales efforts have yielded to best new customer acquisitions. Offering our services to other segments, such as automotive or consumer electronics shall be carefully evaluated case by case.
COMMUNICATION WITH INVESTORSAs a trusted manufacturing partner we are quite restrained when informing about our customers or manufacturing operations. Our present and potential shareholders would prefer getting more detailed information on our activities. We continue serving the investors mainly by quarterly reports and trust that our figures speak for us.
LOOKING AT A POSITIVE FUTUREOur target is to continue with the organic growth while at the same time keeping our profitability among the best in our peer group. Thanks to our efficient operational model and strong financial position we are able to consider also M&As as a way to expand our business.
I wish to thank our customers, partners, suppliers and shareholders for the successful year 2017. Our personnel deserve special credit for their continuous efforts for improved performance. Despite the challenges there may be in the business in general I am confident that we at Incap will carry on the steady progress with the support and good cooperation from all our stakeholders.
Vesa MäkeläPresident and CEO
INCAP OYJ | ANNUAL REPORT 2017 | REvIEW BY ThE PRESIDENT AND CEO
6
REPORT OF THE BOARD OF DIRECTORS FOR 2017Revenue increased by 26% and the operating profit by 20% year-on-year. The factory expansion and renewal of production capacity enable continued profitable growth.
FINANCIAL STATEMENTS 2017 | REPORT OF ThE BOARD OF DIRECTORS FOR 2017
7
BUSINESS ENVIRONMENT IN 2017There were no significant changes in the business environment of Incap Group. The customers are very price-conscious and expect that their manufacturing partners increase efficiency continuously and stay competitive. General cost level remained stable in countries where Incap has operations. Prices of components and raw materials showed a moderate trend of increase.
INCAP GROUP’S REVENUE AND EARNINGS IN 2017Revenue for the financial period amounted to EUR 48.5 million, by approx. 26% more than in 2016 (1–12/2016: EUR 38.6 million). The revenue increased as a result of growing demand of current customers and of the production of new products.
The profitability of Incap Group was good. The full-year operating profit (EBIT) amounted to EUR 4.5 million (EUR 3.8 million), being 9.3% out of revenue (9.8%). In the company’s business, Electronics Manufacturing Services, this is generally considered to be a high level.
The overhead costs remained low ensuring profitable operations and continued competitiveness.
Personnel expenses in the reporting period increased in line with the growing volumes and amounted to EUR 4.1 million (EUR 3.5 million). Other business costs amounted to EUR 3.3 million (EUR 2.6 million). As a result of the growing business volume the material costs increased from EUR 28.5 million to EUR 36.9 million. The value of inventories increased based on the business growth from EUR 5.7 million to EUR 7.7 at the end of the reporting period.
Net financial expenses amounted to EUR 0.5 million (EUR 0.6 million). Depreciation amounted to a total of EUR 0.4 million (EUR 0.4 million).
Profit for the period was EUR 3.1 million (EUR 2.1 million). Earnings per share were EUR 0.71 (EUR 0.49).
INVESTMENTSInvestments in 2017 totalled EUR 0.7 million (EUR 1.0 million) and they were mainly connected with the modernisation of the factory extension in India. The figure does not include the new hired SMT assembly line in Estonia.
QUALITY ASSURANCE AND ENVIRONMENTAL ISSUESIncap Group’s both factories have environmental management and quality assurance systems certified by Bureau veritas. The systems are used as tools for continuous improvement. Environmental management system in both factories complies with ISO 14001:2015, and the quality assurance system complies with ISO 9001:2015. In addition, the Kuressaare factory has updated its operations to meet with the ISO 13485/2016 quality certification for the manufacture of medical devices.
BALANCE SHEET, FINANCING AND CASH FLOWThe balance sheet total on 31 December 2017 stood at EUR 24.8 million (EUR 21.1 million). The Group’s equity at the close of the financial period was EUR 10.4 million (EUR 7.9 million). The parent company's equity totalled EUR 10.7 million (EUR 9.8 million).
The Group’s equity ratio improved further amounting to 42.0% (37.6%). Net gearing improved to 42% (71%).
Liabilities increased slightly to EUR 14.4 million compared with previous year (EUR 13.1 million), of which EUR 7.2 million (EUR 8.0 million) were interest-bearing liabilities. Interest-bearing net debt decreased to EUR 4.4 million (EUR 5.6 million).
The Group’s non-current interest-bearing liabilities amounted to EUR 2.3 million (EUR 3.8 million) while the current interest-bearing liabilities were EUR 4.9 million (EUR 4.2 million). Out of the interest-bearing liabilities EUR 2.6 million are related to the Indian
subsidiary (EUR 1.8 million). Other liabilities include EUR 2.8 million of bank loans and limits granted by the company’s Finnish bank and EUR 1.3 million of factoring financing used in Estonia.
The covenants of the Group’s loans include equity ratio and the Group’s interest-bearing debt in relation to EBITDA, and their status is reviewed every six months. In the review on 31 December 2017 the target level of interest-bearing debt in relation to EBITDA was below 2.5 and the equity ratio more than 25%. The company met these covenants and the actual figure interest-bearing debt/EBITDA on the review date was 1.5 and the equity ratio 42.0%.
As to the loans granted by the Indian bank the company has committed to follow ordinary covenants and the bank’s general loan conditions.
The Group’s cash position during the report period was good. The Group’s quick ratio was 1.0 (1.1), and the current ratio was 1.6 (1.7).
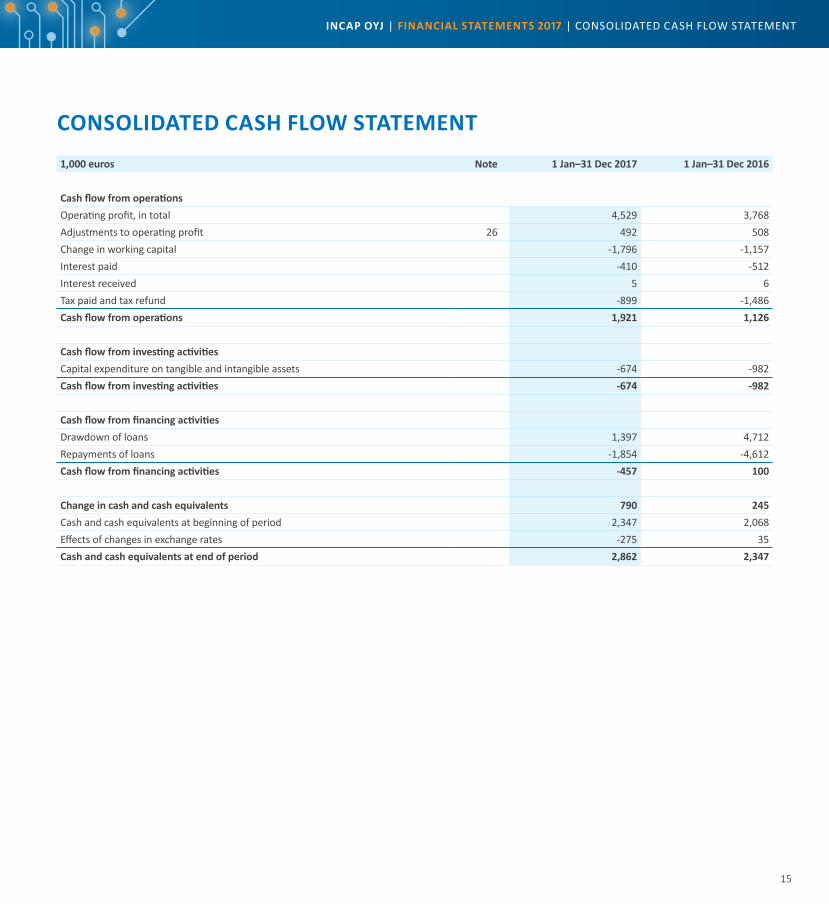
Cash flow from operations was EUR 1.9 million (EUR 1.1 million). On 31 December 2017, the Group’s cash and cash equivalents totalled EUR 2.9 million (EUR 2.3 million). The change in cash and cash equivalents showed an increase of EUR 0.8 million (increase of EUR 0.2 million).
PERSONNEL At the end of 2017, Incap Group had a payroll of 570 employees (514). 87% (85%) of the personnel worked in India, 12% (14%) in Estonia and 0.5% (0.4%) in Finland. At the end of the year, 113 of Incap’s employees were women (106) and 457 were men (408). Permanently employed staff totalled 197 (205) and the number of fixed-term employment contracts was 372 (309). The company had one part-time employment contract at the end of the period (1). The average age of the personnel was 31 years (31).
INCAP OYJ | FINANCIAL STATEMENTS 2017 | REPORT OF ThE BOARD OF DIRECTORS FOR 2017
8
company or deviating from the shareholders' pre-emptive right through one or more directed share issue, if the company has a weighty financial reason to do so, such as developing the company’s equity structure, implementing mergers and acquisitions or other restructuring measures aimed at developing the company’s business, financing of investments and operations or using the shares as a part of the company’s remuneration and compensation system, to the terms and scope decided by the Board of Directors.
The Board has not exercised the authorisation, which is valid until 18 April 2018.
BOARD OF DIRECTORS AND AUDITORThe Annual General Meeting held on 18 April 2017 re-elected Carl-Gustaf von Troil and elected Per Kristiansson, vesa Mäkelä and Johan Ålander as new members to the Board of Directors.
Olle hulteberg acted as the Chairman of the Board of Directors until 18 April 2017 and after that Johan Ålander.
The Board convened 16 times in 2017 and the average attendance rate of Board members was 92.6%.
The firm of independent accountants Ernst & Young Oy continued to act as the company's auditor, with Bengt Nyholm, Authorised Public Accountant, as the principal auditor.
REPORT ON CORPORATE GOVERNANCEIncap Corporation is complying with the Corporate Governance Code of Securities Market Association, which is valid as from 1 January 2016 and is publicly available at the website of Securities Market Association at www.cgfinland.fi. The company will release a report on the company’s corporate governance in compliance with the Securities Market Act as a separate document in connection with the publication of the Report of the Board of Directors and the Annual Report in week 12/2018. The report is available at the company’s website.
MANAGEMENT AND ORGANISATION The duties of CEO of Incap were carried out by ville vuori (B.Sc. Eng., eMBA, born 1973) until 15 October 2017 and after that by vesa Mäkelä (M.Sc. Eng., MBA, born 1964). At the end of the report period the Group’s Management Team included besides the CEO vesa Mäkelä also the local Managing Directors: Murthy Munipalli in India and Otto Pukk in Estonia. After the end of report period on 2 January 2018 Tero Lehtonen (M.Sc. Econ.) was appointed as the Group CFO and a member of the Management Team.
The company’s organisation structure is lean and the corporate functions have been kept streamlined. The Group’s factories in Estonia and in India operate as profit centres and are responsible besides for the actual order-delivery process also for the quotations and pricing in accordance with the corporate guidelines. Key functions of the Group like finance and administration, sales, IT and communications are coordinated by the corporate office.
ANNUAL GENERAL MEETING 2017The Annual General Meeting of Incap Corporation was held in helsinki on 18 April 2017. A total of 27 shareholders participated in the meeting, representing approximately 53.3% of all shares and votes in the company. The Annual General Meeting adopted the financial statements for the financial period ended 31 December 2016 and decided, in accordance with the proposal of the Board of Directors, that no dividend be distributed for the financial period and that the profit for the financial period (EUR 464,201.93) be recognised in equity.
AUTHORISATION OF THE BOARD OF DIRECTORSThe Annual General Meeting held on 18 April 2017 authorized the Board of Directors to decide to issue a maximum of 436,516 new shares either against payment or without payment. The new shares may be issued to the company's shareholders in proportion to their current shareholdings in the
SHARES AND SHAREHOLDERSIncap Corporation has one series of shares, and the number of shares at the end of the period was 4,365,168 (31 December 2016: 4,365,168).
During the financial period, the share price varied between EUR 7.20 and 5.25 (EUR 8.65 and 4.95). The closing price for the period was EUR 6.19 (EUR 5.46). The market capitalisation on 31 December 2017 was EUR 27.0 million (EUR 23.8 million). At the end of financial period, the company had 2,489 shareholders (2,861). Nominee-registered or foreign owners held 36.0% (38.2%) of all shares. The company does not hold any of its own shares.
At the end of the financial period 2017, the members of Incap Corporation’s Board of Directors and the President and CEO and their interest parties owned a total of 40,604 shares or approximately 0.9% of the company’s shares outstanding.
ANNOUNCEMENTS IN ACCORDANCE WITH SECTION 10 OF CHAPTER 9 OF THE SECURITIES MARKET ACT ON A CHANGE IN HOLDINGS The company had no announcements in accordance with Section 10 of Chapter 9 of the Securities Market Act during the financial period.
CORPORATE SOCIAL RESPONSIBILITYIncap is reporting non-financial information as a part of the report of the Board of Directors and Annual Report. The most relevant items of the company’s corporate social responsibility are social responsibility, environmental responsibility and responsibility to stakeholders.
Social responsibility at Incap means that the principles of sustainable development are followed in the company’s operations. Incap practices and develops its business operations in such a way that the productivity and competitiveness are improved in harmony with the demands of the company’s stakeholders and the environment. The progress in human resources development and in well-being at work is measured among others by training hours and by the number of injuries at work. Out
FINANCIAL STATEMENTS 2017 | REPORT OF ThE BOARD OF DIRECTORS FOR 2017
9
of environmental metrics, the company is following the energy consumption, the amount of waste and the degree of recycling. The factory in India is promoting the education of children by granting an annual support for local school development. The factory in Estonia has been rewarded for its positive approach as to children and families.
The feedback from the company’s customers is of major importance when developing the operations and services further. Incap supports its customers in improving product safety by, among other things, paying special attention to eliminating risk factors in products when introducing products to production. Quality inspections and testing carried out during the manufacturing process prevent faulty goods from reaching the market.
Incap monitors the operations of its suppliers and service providers and conducts regular supplier assessments which are used to examine suppliers’ social responsibility in addition to their quality and delivery reliability. Incap recognises its responsibility as a part of the supply chain and strives to promote the success of all of its partners in co-operation.
Incap complies with the local legislation of the countries, in which it has operations and acts as a responsible member of the society. Incap respects and adheres to international agreements on human and children’s rights as well as employees’ rights. Incap’s personnel policy is based on equality between the sexes, nationalities and different ethnic groups. Incap fosters the well-being of its employees by developing occupational safety and by supporting activities that maintain working ability. Employee competence is developed further using goal-oriented training and the promotion of work motivation is addressed in supervisor training, among others. The company’s support is directed to non-profit causes that promote the well-being of children and the youth.
In accordance with its quality and environmental policy, Incap is committed to protecting and conserving environment by preventing pollution and reducing the use of natural resources and raw
materials. Incap strives after minimizing raw material waste in its production and uses in its manufacturing processes methods and materials, which cause as little damage to the nature as possible.
Incap aims at good earnings trend, which supports also the implementation of its corporate social responsibility principles. Financial success ensures that operations and working conditions are improved constantly and guarantees jobs for employees. The company aims to maximize the return on the capital invested by shareholders in the company and to ensure that the company’s value grows steadily.
RISK MANAGEMENTThe Risk Management Policy approved by the Board of Incap Corporation classifies risks as risks connected to the operating environment, operational risks and damage and funding risks. The company’s risk management is mainly focused on risks that threaten the company’s business objectives and continuity of operations. In order to improve its business opportunities, the company is willing to take on managed risks within the scope of the Group’s risk management capabilities. The company regularly reviews its insurance policies as part of its risk management system.
SHORT-TERM RISKS AND FACTORS OF UNCERTAINTY CONCERNING OPERATIONSGeneral risks related to the company’s business operations and sector include the development of customer demand, price competition in contract manufacturing, success in acquisition of new customers, availability and price development of raw material and components, sufficiency of funding, liquidity and exchange rate fluctuations.
The financing position of the company is good and the sufficiency of financing and working capital is at the moment posing no risk.
In the definition of the volumes of internal transactions the actual value added and the so-called “arm’s length” principle are considered.
After the cumulative losses in India were covered during the latter half of 2015, it is possible to repatriate profits also through dividends.
The value of the shares in subsidiaries in the parent group has a significant impact on the parent company’s equity and therefore on, for example, equity ratio. Based on the impairment calculations in connection with the financial statements for 2017 there is no need for any write-down of the value of the shares in subsidiaries. however, based on the company’s estimate there is a risk connected with the valuation of the shares of the Estonian subsidiary because of the previous unprofitable operations of the subsidiary. There is no such risk in the valuation of the subsidiary in India.
Demand for Incap’s services and the company’s financial position are affected by global economic trends and the fluctuation among customer industries. The risks connected with the customer demand and the solvency of customers are monitored and evaluated separately for each customer. The management considers the customer relationship management to be of utmost importance and is paying special attention to it.
The company’s sales are spread over several customer sectors balancing out the impact of the economic fluctuation in different industrial sectors. Out of the total revenue in 2017, approximately 86% came from four biggest customers.
The company’s business segment, electronics manufacturing services, is highly competitive and there are major pressures on cost level management. The company has succeeded in increasing the efficiency of its operations and in lowering the costs. Furthermore, the company’s production is located in countries with competitive levels of wage and general costs.
The most significant exchange rate risk of the company is related to the Indian subsidiary. A remarkable part of the Group’s operations is located in India, and the fluctuation in the exchange rates between Indian Rupee and Euro may have a remarkable effect on revenue and result.
INCAP OYJ | FINANCIAL STATEMENTS 2017 | REPORT OF ThE BOARD OF DIRECTORS FOR 2017

10
The Indian subsidiary of the company had a tax audit in 2016, and based on the audit, the tax authorities do not approve the depreciations made on the capitalized customer contracts during accounting periods 2008/2009–2012/2013 and the transfer costs during the accounting period 2011/2012. The estimated effect with eventual interest is amounting to a maximum of EUR 0.4 million. The company’s complaint is still in the process of tax authorities. The tax debt has been presented in the off-balance sheet liabilities.
EVENTS AFTER THE END OF THE PERIOD The company announced in its financial review in November 2017 that it had detected a discrepancy in the inventory value of the Estonian factory. After the end of report period, on 24 January 2018, the company specified that it will make a write-off of approximately EUR 0.6 million in the inventory value of 2016 due to a periodic error connected with the implementation of the new ERP. For this reason the company has adjusted its financials for 2016 and now, the Group’s operating profit (EBIT) for the full year 2016 is EUR 3.8 million instead of the previously reported EUR 4.4 million and the profit for the year EUR 2.1 million instead of the previous EUR 2.7 million.
STRATEGY AND TARGETSThe positive trend in profitability has enabled the strong development of the company ensuring the future growth. The efficient operational model of the company guarantees fast decision-making and operational flexibility. In 2018, the company is targeting to increase the business volumes further organically while seeking expanding its operations also by M&As.
OUTLOOK FOR 2018Incap’s estimates for future business development are based both on its customers’ forecasts and on the company’s own assessments.
Even though the general prospects in world economy are good, it is difficult to predict the exact development of customer demand and competition. however, many of the company’s customers have indicated that their own demand will grow in 2018.
Inauguration of the new factory extension in India and the investments in increased production efficiency in Estonia are enhancing the possibilities to increase the revenue further.
The Group’s revenue and operating profit (EBIT) in 2018 are estimated to be at the same level or somewhat higher than in 2017, assuming that there are no major changes in exchange rates.
BOARD OF DIRECTORS’ PROPOSAL ON MEASURES RELATED TO THE RESULTThe parent company’s profit for the financial period totals EUR 888,818.01. The Board of Directors will propose to the Annual General Meeting to be held on 17 April 2018 that no dividend be paid and the result for the financial period be recognised in equity. Due to the share capital reduction carried out in 2016 there are limitations for distribution of dividends until the year 2019.
ANNUAL GENERAL MEETING 2018The Annual General Meeting will be held on Tuesday, 17 April 2018 at 3 p.m. at BANK/Wall street, Unioninkatu 20, 00130 helsinki. Notice to the Annual General Meeting will be given on 20 March 2018.
In helsinki, 19 March 2018
INCAP CORPORATIONBoard of Directors
FINANCIAL STATEMENTS 2017 | REPORT OF ThE BOARD OF DIRECTORS FOR 2017
11
REVENUE, EUR MILLION OPERATING PROFIT/LOSS (EBIT), EUR MILLION
OPERATING PROFIT/LOSS (EBIT), % OF REVENUE
PROFIT/LOSS BEFORE TAX, EUR MILLION
PROFIT/LOSS BEFORE TAX,% OF REVENUE
EARNINGS PER SHARE (EPS), EUR
NET GEARING, %
0
10
20
30
40
50
1 3 1 4 1 5 1 6 1 7
-40
-30
-20
-10
0
10
20
1 3 1 4 1 5 1 6 1 7
1 3 1 4 1 5 1 6 1 7
RETURN ON INVESTMENT (ROI), %
RETURN ON EQUITY (ROE), %
EQUITY RATIO, %
-8
-6
-4
-2
0
2
4
6
1 3 1 4 1 5 1 6 1 7
-5
-4
-3
-2
-1
0
1
1 3 1 4 1 5 1 6 1 7
0
10
20
30
40
50
1 3 1 4 1 5 1 6 1 7
INVESTMENTS, EUR MILLION
AVERAGE NUMBER OF PERSONNEL
-25-20-15-10
-505
1015
1 3 1 4 1 5 1 6 1 7
0.0
0.2
0.4
0.6
0.8
1.0
1 3 1 4 1 5 1 6 1 7
1 3 1 4 1 5 1 6 1 7-40
-30
-20
-10
0
10
20
30
0
200
400
600
1 3 1 4 1 5 1 6 1 7
1 3 1 4 1 5 1 6 1 7
N/A
N/A
0
10
20
30
40
50
60
1 3 1 4 1 5 1 6 1 7-10
-8
-6
-4
-2
0
2
4
0
100
200
300
400
500
600
INCAP OYJ | FINANCIAL STATEMENTS 2017 | REPORT OF ThE BOARD OF DIRECTORS FOR 2017
12
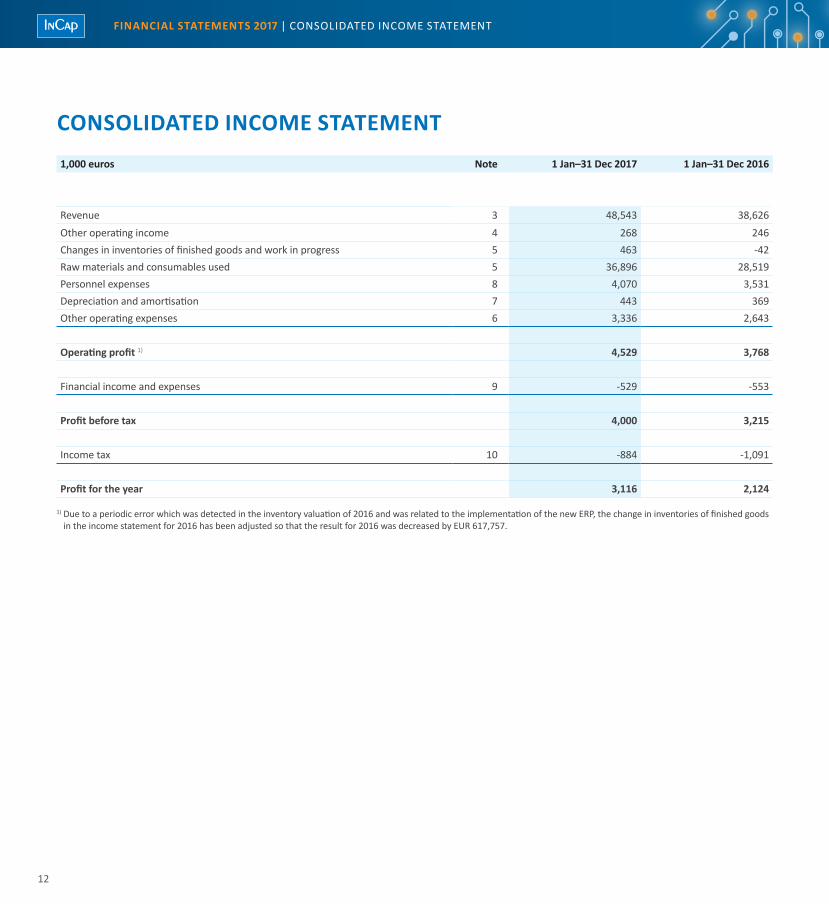
CONSOLIDATED INCOME STATEMENT1,000 euros Note 1 Jan–31 Dec 2017 1 Jan–31 Dec 2016
Revenue 3 48,543 38,626Other operating income 4 268 246Changes in inventories of finished goods and work in progress 5 463 -42Raw materials and consumables used 5 36,896 28,519Personnel expenses 8 4,070 3,531Depreciation and amortisation 7 443 369Other operating expenses 6 3,336 2,643
Operating profit 1) 4,529 3,768
Financial income and expenses 9 -529 -553
Profit before tax 4,000 3,215
Income tax 10 -884 -1,091
Profit for the year 3,116 2,124
1) Due to a periodic error which was detected in the inventory valuation of 2016 and was related to the implementation of the new ERP, the change in inventories of finished goods in the income statement for 2016 has been adjusted so that the result for 2016 was decreased by EUR 617,757.
FINANCIAL STATEMENTS 2017 | CONSOlIDATED INCOME STATEMENT
13
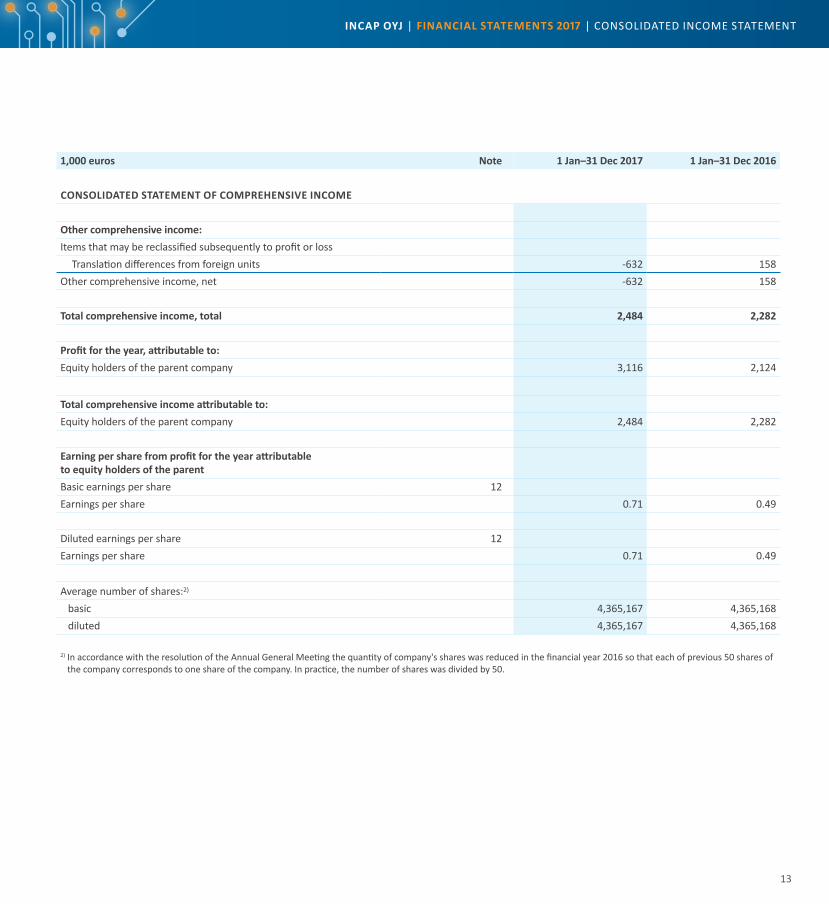
1,000 euros Note 1 Jan–31 Dec 2017 1 Jan–31 Dec 2016
CONSOLIDATED STATEMENT OF COMPREHENSIVE INCOME
Other comprehensive income:Items that may be reclassified subsequently to profit or loss
Translation differences from foreign units -632 158Other comprehensive income, net -632 158
Total comprehensive income, total 2,484 2,282
Profit for the year, attributable to:Equity holders of the parent company 3,116 2,124
Total comprehensive income attributable to:Equity holders of the parent company 2,484 2,282
Earning per share from profit for the year attributable to equity holders of the parentBasic earnings per share 12Earnings per share 0.71 0.49
Diluted earnings per share 12Earnings per share 0.71 0.49
Average number of shares:2)
basic 4,365,167 4,365,168 diluted 4,365,167 4,365,168
2) In accordance with the resolution of the Annual General Meeting the quantity of company's shares was reduced in the financial year 2016 so that each of previous 50 shares of the company corresponds to one share of the company. In practice, the number of shares was divided by 50.
INCAP OYJ | FINANCIAL STATEMENTS 2017 | CONSOlIDATED INCOME STATEMENT
14
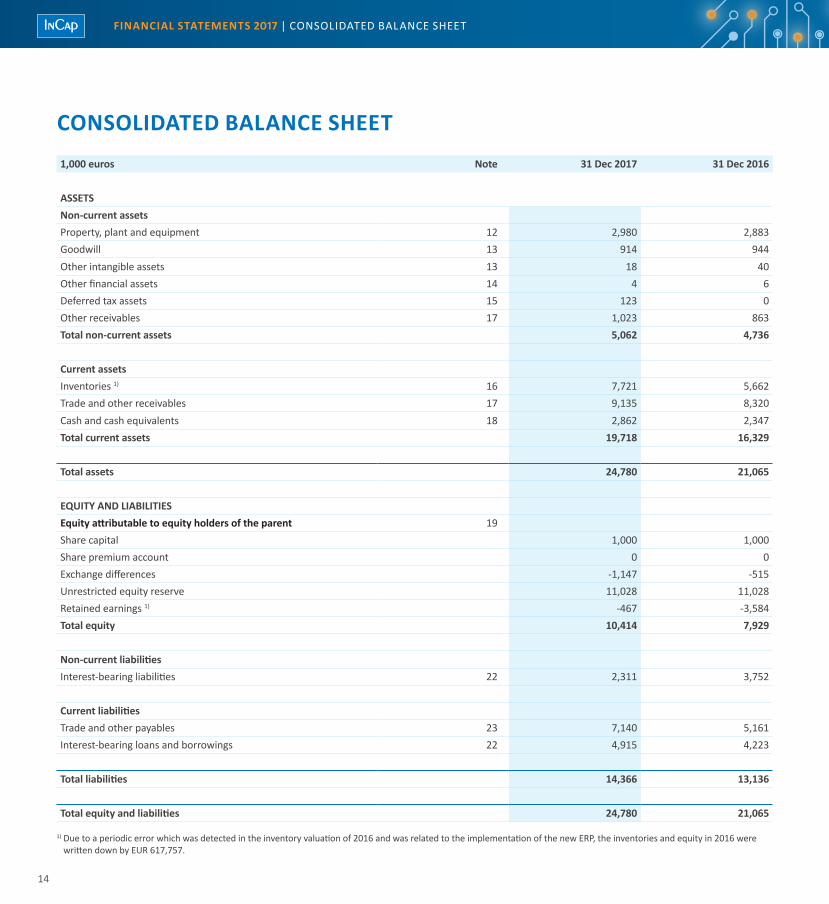
CONSOLIDATED BALANCE SHEET1,000 euros Note 31 Dec 2017 31 Dec 2016
ASSETSNon-current assetsProperty, plant and equipment 12 2,980 2,883Goodwill 13 914 944Other intangible assets 13 18 40Other financial assets 14 4 6Deferred tax assets 15 123 0Other receivables 17 1,023 863Total non-current assets 5,062 4,736
Current assetsInventories 1) 16 7,721 5,662Trade and other receivables 17 9,135 8,320Cash and cash equivalents 18 2,862 2,347Total current assets 19,718 16,329
Total assets 24,780 21,065
EQUITY AND LIABILITIESEquity attributable to equity holders of the parent 19Share capital 1,000 1,000Share premium account 0 0Exchange differences -1,147 -515Unrestricted equity reserve 11,028 11,028Retained earnings 1) -467 -3,584Total equity 10,414 7,929
Non-current liabilitiesInterest-bearing liabilities 22 2,311 3,752
Current liabilitiesTrade and other payables 23 7,140 5,161Interest-bearing loans and borrowings 22 4,915 4,223
Total liabilities 14,366 13,136
Total equity and liabilities 24,780 21,065
1) Due to a periodic error which was detected in the inventory valuation of 2016 and was related to the implementation of the new ERP, the inventories and equity in 2016 were written down by EUR 617,757.
FINANCIAL STATEMENTS 2017 | CONSOlIDATED BAlANCE SHEET
15
CONSOLIDATED CASH FLOW STATEMENT1,000 euros Note 1 Jan–31 Dec 2017 1 Jan–31 Dec 2016
Cash flow from operationsOperating profit, in total 4,529 3,768Adjustments to operating profit 26 492 508Change in working capital -1,796 -1,157Interest paid -410 -512Interest received 5 6Tax paid and tax refund -899 -1,486Cash flow from operations 1,921 1,126
Cash flow from investing activitiesCapital expenditure on tangible and intangible assets -674 -982Cash flow from investing activities -674 -982
Cash flow from financing activitiesDrawdown of loans 1,397 4,712Repayments of loans -1,854 -4,612Cash flow from financing activities -457 100
Change in cash and cash equivalents 790 245Cash and cash equivalents at beginning of period 2,347 2,068Effects of changes in exchange rates -275 35Cash and cash equivalents at end of period 2,862 2,347
INCAP OYJ | FINANCIAL STATEMENTS 2017 | CONSOlIDATED CASH FlOW STATEMENT
16
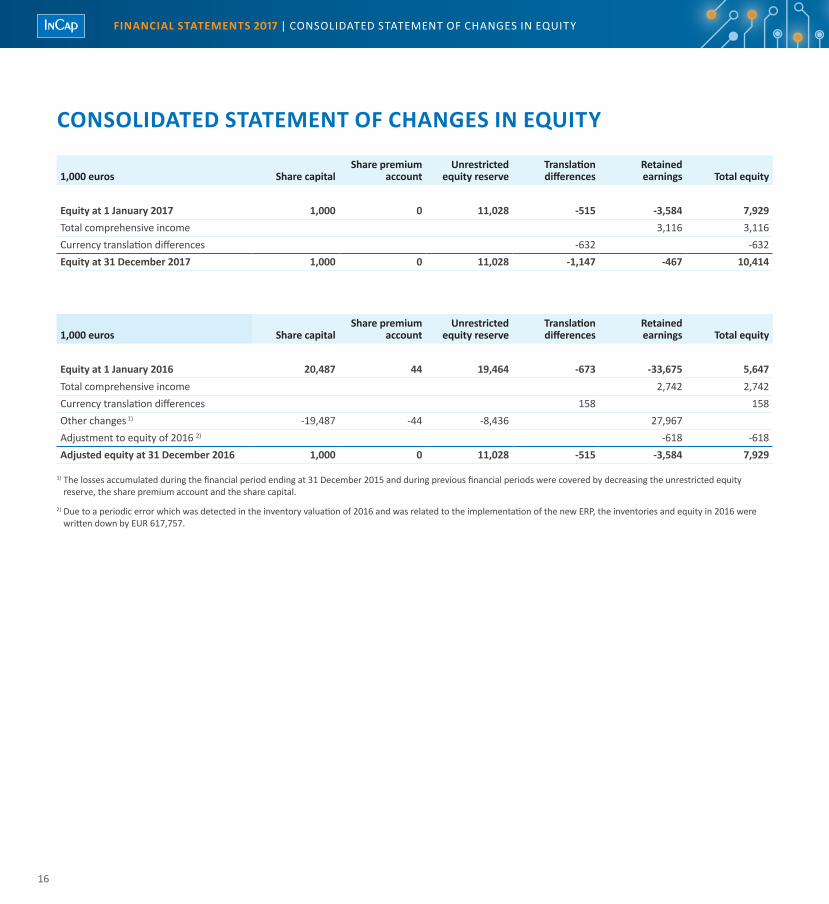
CONSOLIDATED STATEMENT OF CHANGES IN EQUITY
1,000 euros Share capitalShare premium
accountUnrestricted
equity reserveTranslation differences
Retained earnings Total equity
Equity at 1 January 2017 1,000 0 11,028 -515 -3,584 7,929Total comprehensive income 3,116 3,116Currency translation differences -632 -632Equity at 31 December 2017 1,000 0 11,028 -1,147 -467 10,414
1,000 euros Share capitalShare premium
accountUnrestricted
equity reserveTranslation differences
Retained earnings Total equity
Equity at 1 January 2016 20,487 44 19,464 -673 -33,675 5,647Total comprehensive income 2,742 2,742Currency translation differences 158 158Other changes 1) -19,487 -44 -8,436 27,967Adjustment to equity of 2016 2) -618 -618Adjusted equity at 31 December 2016 1,000 0 11,028 -515 -3,584 7,929
1) The losses accumulated during the financial period ending at 31 December 2015 and during previous financial periods were covered by decreasing the unrestricted equity reserve, the share premium account and the share capital.
2) Due to a periodic error which was detected in the inventory valuation of 2016 and was related to the implementation of the new ERP, the inventories and equity in 2016 were written down by EUR 617,757.
FINANCIAL STATEMENTS 2017 | CONSOLIDATED STATEMENT OF ChANGES IN EQUITY
17
NOTES TO THE CONSOLIDATED FINANCIAL STATEMENTS
ACCOUNTING PRINCIPLES APPLIED IN THE CONSOlIDATED FINANCIAl STATEMENTS
BASIS OF PREPARATIONThese Incap Group financial statements have been prepared in accordance with International Financial Reporting Standards in conformity with the IAS and IFRS standards and SIC and IFRIC interpretations in force at the balance sheet date, 31 December 2017. The notes to the consolidated financial statements also comply with Finnish accounting and company legislation.
The financial statements in the official compiled version are presented in unabbreviated form to an accuracy of two decimals. In the Annual Report, the financial statement data is presented in thousands of euros.
The preparation of financial statements in accordance with IFRS calls for the making of certain estimates by Group management as well as for management’s judgement in applying accounting policies. The estimates having the greatest effect on the financial statement figures are presented in the note “Accounting policies requiring management’s judgement and key sources of estimation uncertainty.”
SUBSIDIARIESThe consolidated financial statements include the parent company Incap Corporation and its subsidiaries Incap Electronics Estonia OÜ, Incap hong Kong Ltd., Incap Contract Manufacturing Services Pvt. Ltd. and Euro-ketju Oy, which has no operations.
Intra-Group share ownership has been eliminated by means of the purchase method. Acquired subsidiaries are included in the consolidated financial statements from the time when the Group has obtained control, and divested subsidiaries up to the time when control ceases. All intra-Group transactions, receivables, liabilities, unrealised gains and internal distribution of profits are eliminated when preparing the consolidated financial statements.
TRANSLATION OF ITEMS DENOMINATED IN FOREIGN CURRENCY
Separate companiesTransactions denominated in foreign currency are recorded in the functional currency using the exchange rate on the date of the transaction. Balance sheet items denominated in foreign currency are translated to the functional currency using the exchange rates at the balance sheet date.
Gains and losses resulting from transactions denominated in foreign currency and the translation of balance sheet items are recorded in the income statement. Exchange gains and losses resulting from operations are recorded under the corresponding items above operating profit. Exchange gains and losses resulting from loans denominated in foreign currency are recorded under financial income and expenses.
GroupFigures relating to the profit and financial position of Group units are measured in the main functional currency of each unit. The Incap Group’s financial statements are presented in euros, which is the functional and presentation currency of the Group’s parent company.
The income and expense items in the income statements of foreign Group companies have been translated to euros using the average exchange rate during the year, and their balance sheets using the exchange rates at the balance sheet date. The translation of the profit for the financial year using different exchange rates in the income statement and the balance sheet results in an exchange difference, which is recorded in equity. The exchange differences arising from the elimination of the acquisition cost of foreign subsidiaries and equity items accumulated after the acquisition are recorded in equity.
PROPERTY, PLANT AND EQUIPMENTProperty, plant and equipment are measured at original cost less accumulated depreciation and impairment losses. Property, plant and equipment are depreciated using the straight-line method over their estimated useful life. The estimated useful lives of assets are the following:
• Buildings 18–24 years• Machinery and equipment 3–10 years• Motor vehicles 3–5 years
The residual value of assets and their useful lives are reviewed at each balance sheet date and, if necessary, are adjusted to reflect changes that have occurred in the expectations for an asset’s economic benefits.
Subsequent costs are included in the carrying amount of an item of property, plant and equipment only when it is probable that future economic benefits from the asset will flow to the Group. Other repair and maintenance expenses are recognised as an expense as they arise.
Depreciation of an item of property, plant and equipment ceases when the asset is classified as for sale in accordance with IFRS 5 Non-current Assets held for Sale and Discontinued Operations. Non-current assets held for sale are measured at the lower by carrying amount or by the fair value less the selling expenses. Depreciations on assets held for sale have been ceased at the date of classification.
Capital gains and losses on the retirements and disposals of property, plant and equipment are recorded either in other operating income or expenses.
BORROWING COSTSBorrowing costs are recognised as an expense in the period in which they are incurred.
INCAP OYJ | FINANCIAL STATEMENTS 2017 | NOTES TO THE CONSOlIDATED FINANCIAl STATEMENTS
18
GOVERNMENT GRANTSGovernment grants are recorded on a net basis as a deduction from property, plant and equipment, whereby the grants are recognised as income in the form of smaller depreciation charges over the useful life of an asset.
INTANGIBLE ASSETS Goodwill is the proportion of the acquisition cost which exceeds the Group’s share of the fair value, at the date of acquisition, of the net asset value of a company acquired after 1 January 2004. Other costs directly attributable to an acquisition are also included in the acquisition cost.
Goodwill and other intangible assets with an indefinite useful life, such as the value of customer relationships, are not amortised but are tested annually for any impairment. The testing involves the allocation of goodwill to units generating cash flow and the measurement at cost less impairment losses. Research and development expenditure is recorded as an expense in the income statement.
An intangible asset is recorded in the balance sheet only if the cost of the asset can be determined reliably and it is probable that the expected future economic benefits that are attributable to the asset will flow to the entity. Intangible assets are recorded in the balance sheet at cost and amortised in the income statement over their known or estimated useful life.
The Incap Group’s intangible assets are amortised over 3─5 years.
INVENTORIESInventories are measured at the lower of acquisition cost or net realisable value. Cost is determined using the weighted average cost method. The cost of finished and semi-finished products comprises raw materials, direct labour expenses, other direct expenses as well as fixed and variable production overheads, based on the normal capacity of the production facilities.
The net realisable value is the estimated selling price of the asset less the estimated costs incurred in bringing the product to its present condition and selling expenses. The company is evaluating annually the inventory realisable and usable value and is making write-downs if required.
LEASES
The Group as lesseeLeases of property, plant and equipment where the lessee bears the risks and rewards of ownership are classified as finance leases. An asset obtained on a finance lease is recorded in the lessee’s balance sheet at the start of the lease period at the lower of the fair value of the leased property and the present value of the minimum lease payment. An asset obtained on a finance lease is depreciated over the shorter of the useful life of the asset and the lease term. Lease payments for items of property, plant and equipment are split between financial expenses and a reduction in lease liabilities for the period of the lease finance agreement. Finance lease liabilities are included in the Incap Group’s interest-bearing liabilities.
When the lessor retains the risks and rewards of ownership, the agreement is treated as an operating lease. Lease payments paid on operating leases are recorded as an expense in the income statement.
IMPAIRMENT At each balance sheet date, the Incap Group assesses whether there is any indication that the value of an asset item may be impaired. If any such indication exists, the asset item is tested for impairment to assess its recoverable amount. Impairment testing is done at the lowest possible unit level which is independent of other units and whose cash flows can be distinguished from the other cash flows of the entity.
An impairment loss is recorded when the carrying amount of an asset item is greater than its recoverable amount. The recoverable amount is the higher of an asset’s net selling price and its value in use. value in use refers to the estimated discounted cash flows obtainable from referred asset item or cash-generating unit.
An impairment loss is recognised in profit or loss. If an impairment loss is allocated to a cash-generating unit, it is allocated first to reduce the carrying amount of any goodwill allocated to the cash-generating unit and thereafter to the other assets of the unit pro rata on the basis of the carrying amount of each asset in the unit. An impairment loss is reversed if the recoverable amount of the asset has changed since the last impairment loss was recognised. An impairment loss is not, however, reversed to an extent greater than what the carrying amount of the asset would have been without the recording of the impairment loss.
The Incap Group’s goodwill is tested annually. An impairment loss recorded on goodwill is not reversed under any circumstances.
EMPLOYEE BENEFITS
Pension obligationsThe Incap Group’s pension plans are classified as defined-benefit and defined-contribution plans. Payments made for defined contribution plans are recognised as an expense in the income statement for the period which the debit concerns. The obligations of defined-benefit plans concerning the Indian unit are calculated separately for each plan using the projected unit credit method. Pension costs are recorded as an expense for the duration of employees’ period of service on the basis of actuarial calculations carried out by authorised actuaries.
SHARE-BASED PAYMENTThe Incap Group has applied IFRS 2 Share-based Payment to all share option plans. Warrants are measured at fair value at the time they are granted and entered as an expense in the income statement in even instalments during the vesting period. The expense determined at the moment of granting the options is based on the Incap Group’s estimate of the number of options that will vest at the end of the vesting period. The fair value is determined on the basis of the Black-Scholes pricing model for share options.
The Incap Group updates the estimate of the final number of share options at each balance sheet date. Changes in the estimates are recorded in the income statement. When granted share options are exercised, the cash payments received on the basis of share subscriptions (adjusted for any transaction expenses) are recognised in equity and invested non-restricted equity reserve.
During the report period 2017 Incap Corporation has had no share options.
FINANCIAL STATEMENTS 2017 | NOTES TO THE CONSOlIDATED FINANCIAl STATEMENTS
19
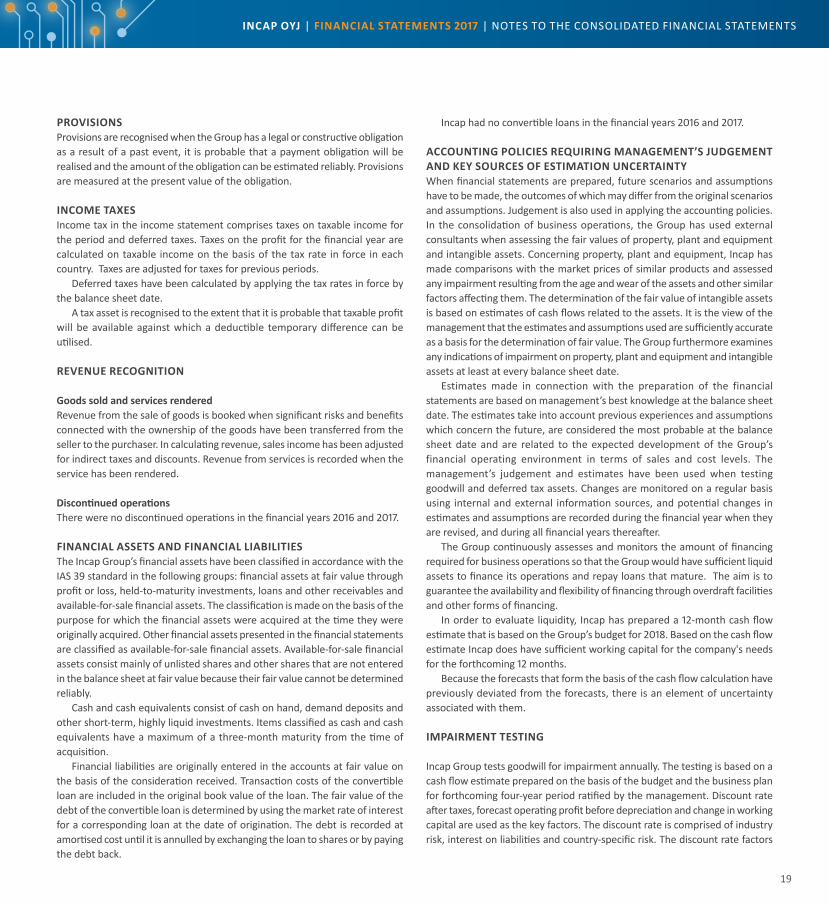
PROVISIONS Provisions are recognised when the Group has a legal or constructive obligation as a result of a past event, it is probable that a payment obligation will be realised and the amount of the obligation can be estimated reliably. Provisions are measured at the present value of the obligation.
INCOME TAXESIncome tax in the income statement comprises taxes on taxable income for the period and deferred taxes. Taxes on the profit for the financial year are calculated on taxable income on the basis of the tax rate in force in each country. Taxes are adjusted for taxes for previous periods.
Deferred taxes have been calculated by applying the tax rates in force by the balance sheet date.
A tax asset is recognised to the extent that it is probable that taxable profit will be available against which a deductible temporary difference can be utilised.
REVENUE RECOGNITION
Goods sold and services renderedRevenue from the sale of goods is booked when significant risks and benefits connected with the ownership of the goods have been transferred from the seller to the purchaser. In calculating revenue, sales income has been adjusted for indirect taxes and discounts. Revenue from services is recorded when the service has been rendered.
Discontinued operationsThere were no discontinued operations in the financial years 2016 and 2017.
FINANCIAL ASSETS AND FINANCIAL LIABILITIES The Incap Group’s financial assets have been classified in accordance with the IAS 39 standard in the following groups: financial assets at fair value through profit or loss, held-to-maturity investments, loans and other receivables and available-for-sale financial assets. The classification is made on the basis of the purpose for which the financial assets were acquired at the time they were originally acquired. Other financial assets presented in the financial statements are classified as available-for-sale financial assets. Available-for-sale financial assets consist mainly of unlisted shares and other shares that are not entered in the balance sheet at fair value because their fair value cannot be determined reliably.
Cash and cash equivalents consist of cash on hand, demand deposits and other short-term, highly liquid investments. Items classified as cash and cash equivalents have a maximum of a three-month maturity from the time of acquisition.
Financial liabilities are originally entered in the accounts at fair value on the basis of the consideration received. Transaction costs of the convertible loan are included in the original book value of the loan. The fair value of the debt of the convertible loan is determined by using the market rate of interest for a corresponding loan at the date of origination. The debt is recorded at amortised cost until it is annulled by exchanging the loan to shares or by paying the debt back.
Incap had no convertible loans in the financial years 2016 and 2017.
ACCOUNTING POLICIES REQUIRING MANAGEMENT’S JUDGEMENT AND KEY SOURCES OF ESTIMATION UNCERTAINTYWhen financial statements are prepared, future scenarios and assumptions have to be made, the outcomes of which may differ from the original scenarios and assumptions. Judgement is also used in applying the accounting policies. In the consolidation of business operations, the Group has used external consultants when assessing the fair values of property, plant and equipment and intangible assets. Concerning property, plant and equipment, Incap has made comparisons with the market prices of similar products and assessed any impairment resulting from the age and wear of the assets and other similar factors affecting them. The determination of the fair value of intangible assets is based on estimates of cash flows related to the assets. It is the view of the management that the estimates and assumptions used are sufficiently accurate as a basis for the determination of fair value. The Group furthermore examines any indications of impairment on property, plant and equipment and intangible assets at least at every balance sheet date.
Estimates made in connection with the preparation of the financial statements are based on management’s best knowledge at the balance sheet date. The estimates take into account previous experiences and assumptions which concern the future, are considered the most probable at the balance sheet date and are related to the expected development of the Group’s financial operating environment in terms of sales and cost levels. The management’s judgement and estimates have been used when testing goodwill and deferred tax assets. Changes are monitored on a regular basis using internal and external information sources, and potential changes in estimates and assumptions are recorded during the financial year when they are revised, and during all financial years thereafter.
The Group continuously assesses and monitors the amount of financing required for business operations so that the Group would have sufficient liquid assets to finance its operations and repay loans that mature. The aim is to guarantee the availability and flexibility of financing through overdraft facilities and other forms of financing.
In order to evaluate liquidity, Incap has prepared a 12-month cash flow estimate that is based on the Group’s budget for 2018. Based on the cash flow estimate Incap does have sufficient working capital for the company's needs for the forthcoming 12 months.
Because the forecasts that form the basis of the cash flow calculation have previously deviated from the forecasts, there is an element of uncertainty associated with them.
IMPAIRMENT TESTING
Incap Group tests goodwill for impairment annually. The testing is based on a cash flow estimate prepared on the basis of the budget and the business plan for forthcoming four-year period ratified by the management. Discount rate after taxes, forecast operating profit before depreciation and change in working capital are used as the key factors. The discount rate is comprised of industry risk, interest on liabilities and country-specific risk. The discount rate factors
INCAP OYJ | FINANCIAL STATEMENTS 2017 | NOTES TO THE CONSOlIDATED FINANCIAl STATEMENTS
20
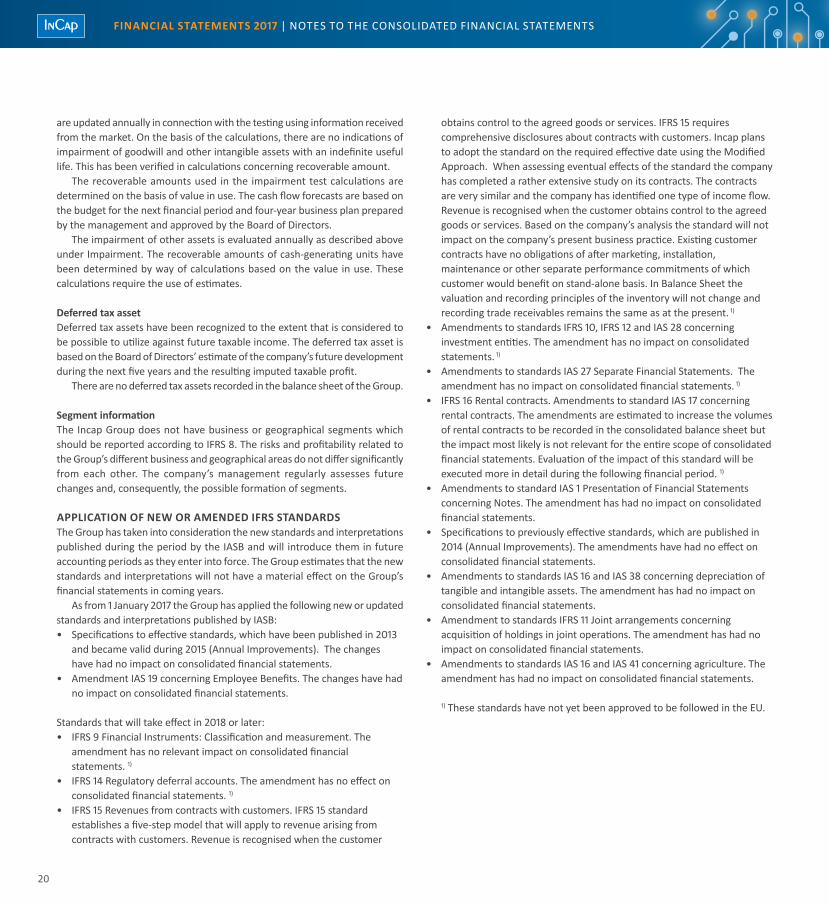
are updated annually in connection with the testing using information received from the market. On the basis of the calculations, there are no indications of impairment of goodwill and other intangible assets with an indefinite useful life. This has been verified in calculations concerning recoverable amount.
The recoverable amounts used in the impairment test calculations are determined on the basis of value in use. The cash flow forecasts are based on the budget for the next financial period and four-year business plan prepared by the management and approved by the Board of Directors.
The impairment of other assets is evaluated annually as described above under Impairment. The recoverable amounts of cash-generating units have been determined by way of calculations based on the value in use. These calculations require the use of estimates.
Deferred tax assetDeferred tax assets have been recognized to the extent that is considered to be possible to utilize against future taxable income. The deferred tax asset is based on the Board of Directors’ estimate of the company’s future development during the next five years and the resulting imputed taxable profit.
There are no deferred tax assets recorded in the balance sheet of the Group.
Segment informationThe Incap Group does not have business or geographical segments which should be reported according to IFRS 8. The risks and profitability related to the Group’s different business and geographical areas do not differ significantly from each other. The company’s management regularly assesses future changes and, consequently, the possible formation of segments.
APPLICATION OF NEW OR AMENDED IFRS STANDARDSThe Group has taken into consideration the new standards and interpretations published during the period by the IASB and will introduce them in future accounting periods as they enter into force. The Group estimates that the new standards and interpretations will not have a material effect on the Group’s financial statements in coming years.
As from 1 January 2017 the Group has applied the following new or updated standards and interpretations published by IASB:• Specifications to effective standards, which have been published in 2013
and became valid during 2015 (Annual Improvements). The changes have had no impact on consolidated financial statements.
• Amendment IAS 19 concerning Employee Benefits. The changes have had no impact on consolidated financial statements.
Standards that will take effect in 2018 or later:• IFRS 9 Financial Instruments: Classification and measurement. The
amendment has no relevant impact on consolidated financial statements. 1)
• IFRS 14 Regulatory deferral accounts. The amendment has no effect on consolidated financial statements. 1)
• IFRS 15 Revenues from contracts with customers. IFRS 15 standard establishes a five-step model that will apply to revenue arising from contracts with customers. Revenue is recognised when the customer
obtains control to the agreed goods or services. IFRS 15 requires comprehensive disclosures about contracts with customers. Incap plans to adopt the standard on the required effective date using the Modified Approach. When assessing eventual effects of the standard the company has completed a rather extensive study on its contracts. The contracts are very similar and the company has identified one type of income flow. Revenue is recognised when the customer obtains control to the agreed goods or services. Based on the company’s analysis the standard will not impact on the company’s present business practice. Existing customer contracts have no obligations of after marketing, installation, maintenance or other separate performance commitments of which customer would benefit on stand-alone basis. In Balance Sheet the valuation and recording principles of the inventory will not change and recording trade receivables remains the same as at the present. 1)
• Amendments to standards IFRS 10, IFRS 12 and IAS 28 concerning investment entities. The amendment has no impact on consolidated statements. 1)
• Amendments to standards IAS 27 Separate Financial Statements. The amendment has no impact on consolidated financial statements. 1)
• IFRS 16 Rental contracts. Amendments to standard IAS 17 concerning rental contracts. The amendments are estimated to increase the volumes of rental contracts to be recorded in the consolidated balance sheet but the impact most likely is not relevant for the entire scope of consolidated financial statements. Evaluation of the impact of this standard will be executed more in detail during the following financial period. 1)
• Amendments to standard IAS 1 Presentation of Financial Statements concerning Notes. The amendment has had no impact on consolidated financial statements.
• Specifications to previously effective standards, which are published in 2014 (Annual Improvements). The amendments have had no effect on consolidated financial statements.
• Amendments to standards IAS 16 and IAS 38 concerning depreciation of tangible and intangible assets. The amendment has had no impact on consolidated financial statements.
• Amendment to standards IFRS 11 Joint arrangements concerning acquisition of holdings in joint operations. The amendment has had no impact on consolidated financial statements.
• Amendments to standards IAS 16 and IAS 41 concerning agriculture. The amendment has had no impact on consolidated financial statements.
1) These standards have not yet been approved to be followed in the EU.
FINANCIAL STATEMENTS 2017 | NOTES TO THE CONSOlIDATED FINANCIAl STATEMENTS
21
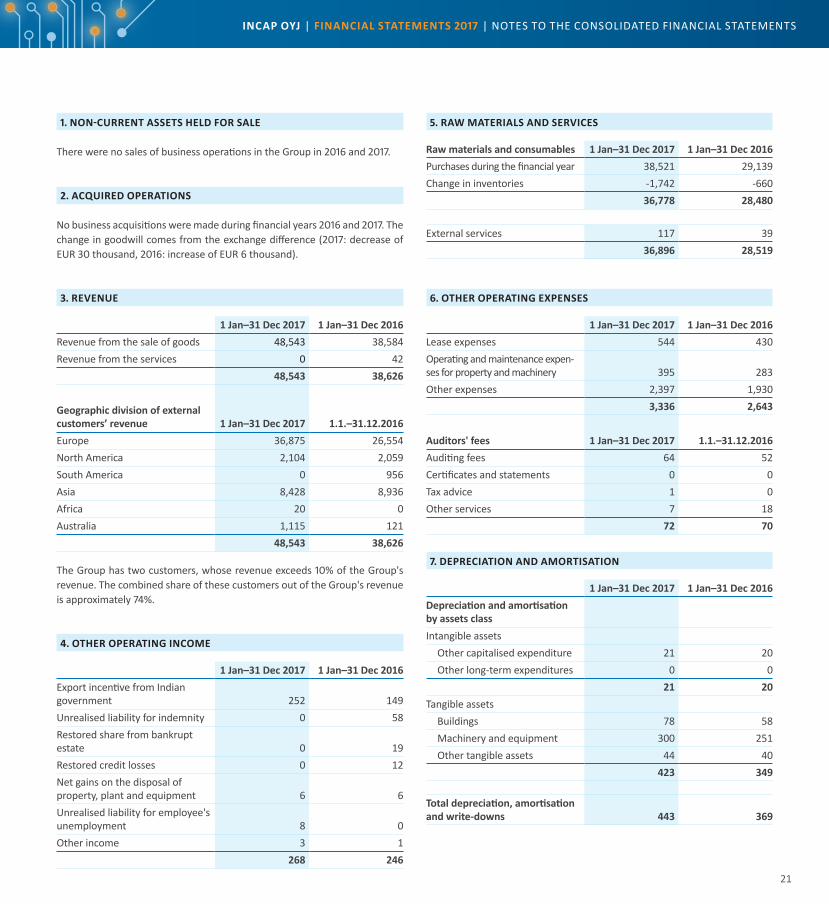
1. NON-CURRENT ASSETS HELD FOR SALE
There were no sales of business operations in the Group in 2016 and 2017.
2. ACQUIRED OPERATIONS
No business acquisitions were made during financial years 2016 and 2017. The change in goodwill comes from the exchange difference (2017: decrease of EUR 30 thousand, 2016: increase of EUR 6 thousand).
3. REVENUE
1 Jan–31 Dec 2017 1 Jan–31 Dec 2016Revenue from the sale of goods 48,543 38,584Revenue from the services 0 42
48,543 38,626
Geographic division of external customers’ revenue 1 Jan–31 Dec 2017 1.1.–31.12.2016Europe 36,875 26,554North America 2,104 2,059South America 0 956Asia 8,428 8,936Africa 20 0Australia 1,115 121
48,543 38,626
The Group has two customers, whose revenue exceeds 10% of the Group's revenue. The combined share of these customers out of the Group's revenue is approximately 74%.
4. OTHER OPERATING INCOME
1 Jan–31 Dec 2017 1 Jan–31 Dec 2016Export incentive from Indian government 252 149Unrealised liability for indemnity 0 58Restored share from bankrupt estate 0 19Restored credit losses 0 12Net gains on the disposal of property, plant and equipment 6 6Unrealised liability for employee's unemployment 8 0Other income 3 1
268 246
5. RAW MATERIALS AND SERVICES
Raw materials and consumables 1 Jan–31 Dec 2017 1 Jan–31 Dec 2016Purchases during the financial year 38,521 29,139Change in inventories -1,742 -660
36,778 28,480
External services 117 3936,896 28,519
6. OTHER OPERATING EXPENSES
1 Jan–31 Dec 2017 1 Jan–31 Dec 2016Lease expenses 544 430Operating and maintenance expen-ses for property and machinery 395 283Other expenses 2,397 1,930
3,336 2,643
Auditors' fees 1 Jan–31 Dec 2017 1.1.–31.12.2016Auditing fees 64 52Certificates and statements 0 0Tax advice 1 0Other services 7 18
72 70
7. DEPRECIATION AND AMORTISATION
1 Jan–31 Dec 2017 1 Jan–31 Dec 2016Depreciation and amortisation by assets classIntangible assets
Other capitalised expenditure 21 20Other long-term expenditures 0 0
21 20Tangible assets
Buildings 78 58Machinery and equipment 300 251Other tangible assets 44 40
423 349
Total depreciation, amortisation and write-downs 443 369
INCAP OYJ | FINANCIAL STATEMENTS 2017 | NOTES TO THE CONSOlIDATED FINANCIAl STATEMENTS
22
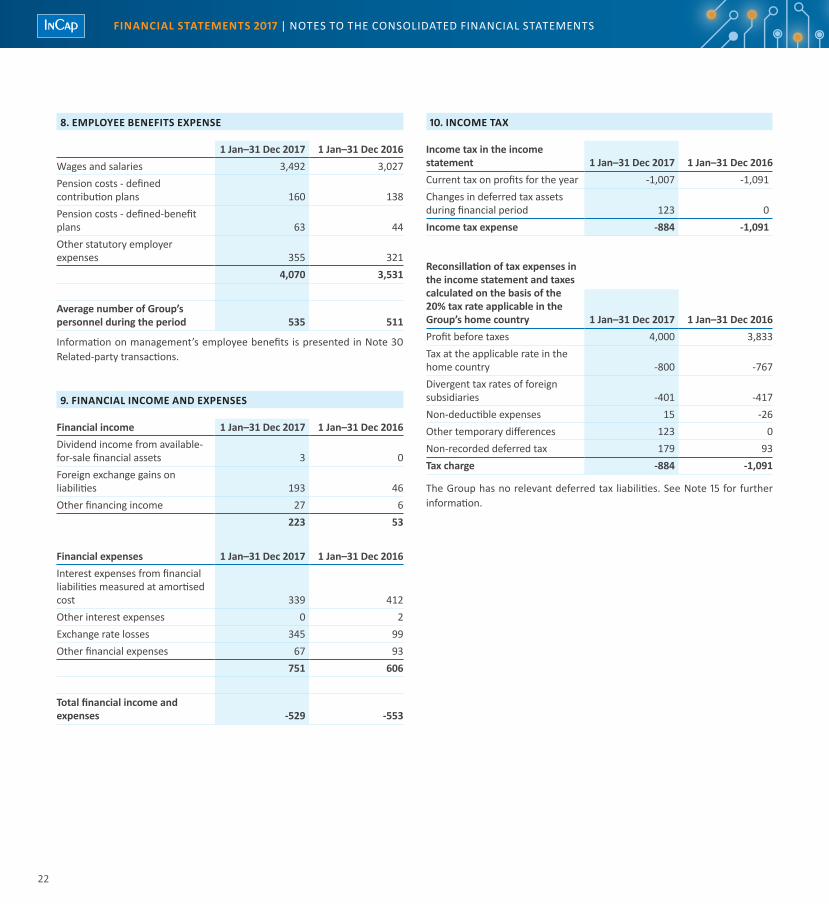
8. EMPLOYEE BENEFITS EXPENSE
1 Jan–31 Dec 2017 1 Jan–31 Dec 2016Wages and salaries 3,492 3,027Pension costs - defined contribution plans 160 138Pension costs - defined-benefit plans 63 44Other statutory employer expenses 355 321
4,070 3,531
Average number of Group’s personnel during the period 535 511
Information on management’s employee benefits is presented in Note 30 Related-party transactions.
9. FINANCIAL INCOME AND EXPENSES
Financial income 1 Jan–31 Dec 2017 1 Jan–31 Dec 2016Dividend income from available-for-sale financial assets 3 0Foreign exchange gains on liabilities 193 46Other financing income 27 6
223 53
Financial expenses 1 Jan–31 Dec 2017 1 Jan–31 Dec 2016Interest expenses from financial liabilities measured at amortised cost 339 412Other interest expenses 0 2Exchange rate losses 345 99Other financial expenses 67 93
751 606
Total financial income and expenses -529 -553
10. INCOME TAX
Income tax in the income statement 1 Jan–31 Dec 2017 1 Jan–31 Dec 2016Current tax on profits for the year -1,007 -1,091Changes in deferred tax assets during financial period 123 0Income tax expense -884 -1,091
Reconsillation of tax expenses in the income statement and taxes calculated on the basis of the 20% tax rate applicable in the Group’s home country 1 Jan–31 Dec 20161 Jan–31 Dec 2017Profit before taxes 4,000 3,833Tax at the applicable rate in the home country -800 -767Divergent tax rates of foreign subsidiaries -401 -417Non-deductible expenses 15 -26Other temporary differences 123 0Non-recorded deferred tax 179 93Tax charge -884 -1,091
The Group has no relevant deferred tax liabilities. See Note 15 for further information.
FINANCIAL STATEMENTS 2017 | NOTES TO THE CONSOlIDATED FINANCIAl STATEMENTS
23
11. EARNINGS PER SHARE
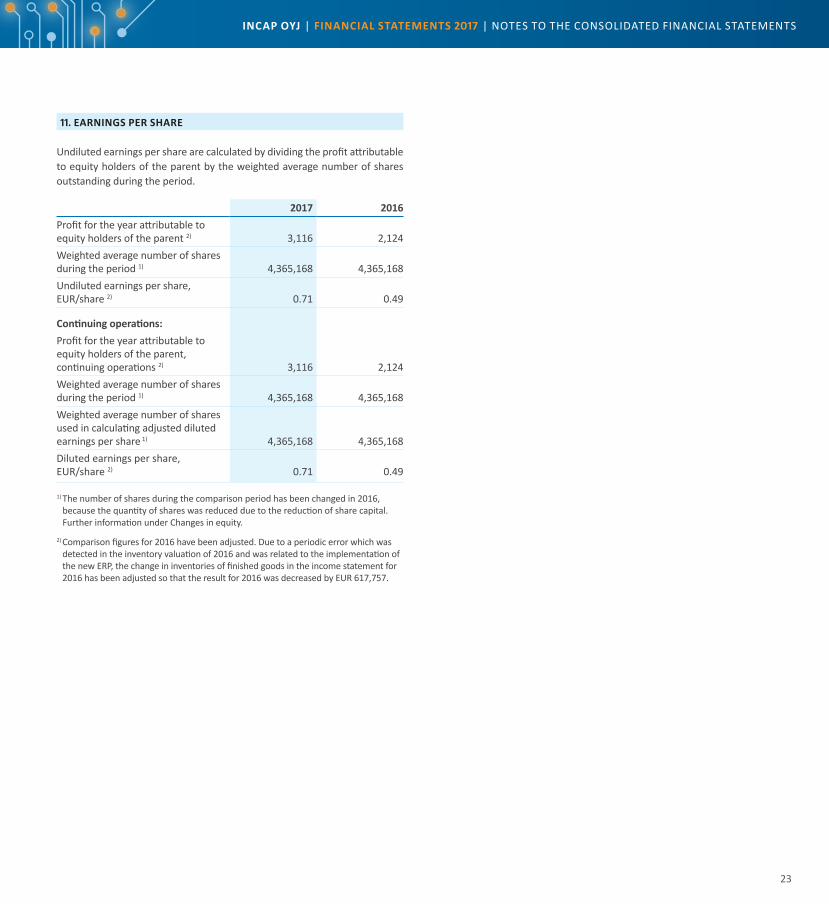
Undiluted earnings per share are calculated by dividing the profit attributable to equity holders of the parent by the weighted average number of shares outstanding during the period.
2017 2016Profit for the year attributable to equity holders of the parent 2) 3,116 2,124Weighted average number of shares during the period 1) 4,365,168 4,365,168Undiluted earnings per share, EUR/share 2) 0.71 0.49
Continuing operations:Profit for the year attributable to equity holders of the parent, continuing operations 2) 3,116 2,124Weighted average number of shares during the period 1) 4,365,168 4,365,168Weighted average number of shares used in calculating adjusted diluted earnings per share 1) 4,365,168 4,365,168Diluted earnings per share, EUR/share 2) 0.71 0.49
1) The number of shares during the comparison period has been changed in 2016, because the quantity of shares was reduced due to the reduction of share capital. Further information under Changes in equity.
2) Comparison figures for 2016 have been adjusted. Due to a periodic error which was detected in the inventory valuation of 2016 and was related to the implementation of the new ERP, the change in inventories of finished goods in the income statement for 2016 has been adjusted so that the result for 2016 was decreased by EUR 617,757.
INCAP OYJ | FINANCIAL STATEMENTS 2017 | NOTES TO THE CONSOlIDATED FINANCIAl STATEMENTS
24
12. PROPERTY, PLANT AND EQUIPMENT
Land Buildings and
advancesMachinery and
equipmentOther tangible
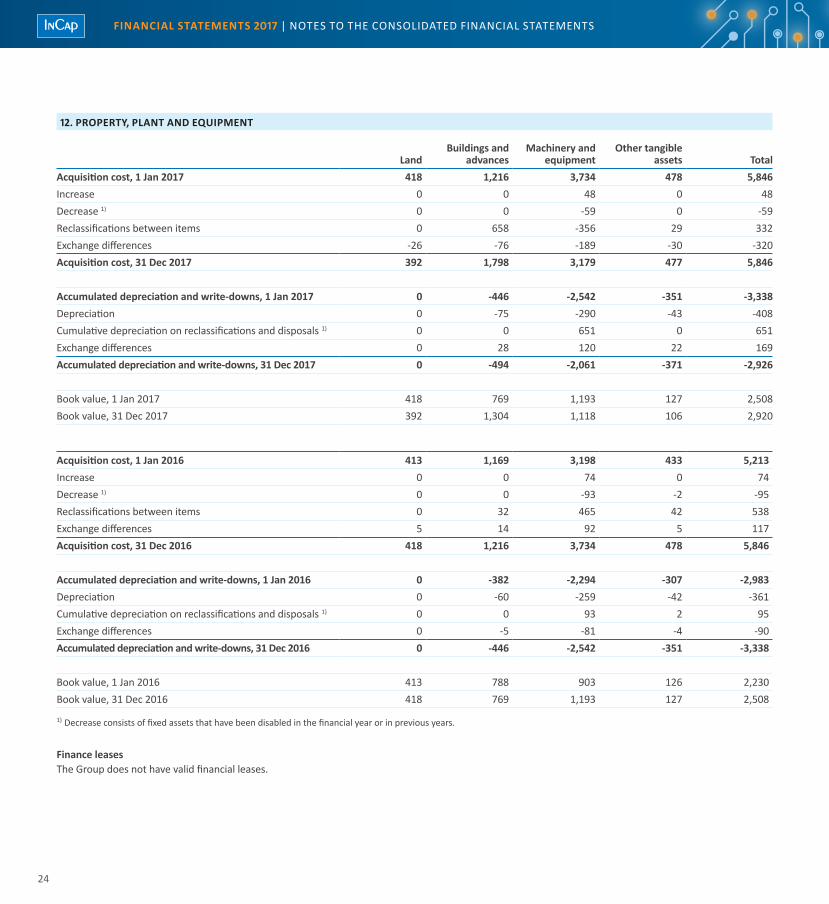
assets TotalAcquisition cost, 1 Jan 2017 418 1,216 3,734 478 5,846Increase 0 0 48 0 48Decrease 1) 0 0 -59 0 -59Reclassifications between items 0 658 -356 29 332Exchange differences -26 -76 -189 -30 -320Acquisition cost, 31 Dec 2017 392 1,798 3,179 477 5,846
Accumulated depreciation and write-downs, 1 Jan 2017 0 -446 -2,542 -351 -3,338Depreciation 0 -75 -290 -43 -408Cumulative depreciation on reclassifications and disposals 1) 0 0 651 0 651Exchange differences 0 28 120 22 169Accumulated depreciation and write-downs, 31 Dec 2017 0 -494 -2,061 -371 -2,926
Book value, 1 Jan 2017 418 769 1,193 127 2,508Book value, 31 Dec 2017 392 1,304 1,118 106 2,920
Acquisition cost, 1 Jan 2016 413 1,169 3,198 433 5,213Increase 0 0 74 0 74Decrease 1) 0 0 -93 -2 -95Reclassifications between items 0 32 465 42 538Exchange differences 5 14 92 5 117Acquisition cost, 31 Dec 2016 418 1,216 3,734 478 5,846
Accumulated depreciation and write-downs, 1 Jan 2016 0 -382 -2,294 -307 -2,983Depreciation 0 -60 -259 -42 -361Cumulative depreciation on reclassifications and disposals 1) 0 0 93 2 95Exchange differences 0 -5 -81 -4 -90Accumulated depreciation and write-downs, 31 Dec 2016 0 -446 -2,542 -351 -3,338
Book value, 1 Jan 2016 413 788 903 126 2,230Book value, 31 Dec 2016 418 769 1,193 127 2,508
1) Decrease consists of fixed assets that have been disabled in the financial year or in previous years.
Finance leasesThe Group does not have valid financial leases.
FINANCIAL STATEMENTS 2017 | NOTES TO THE CONSOlIDATED FINANCIAl STATEMENTS
25
13. INTANGIBLE ASSETS
GoodwillOther intangible
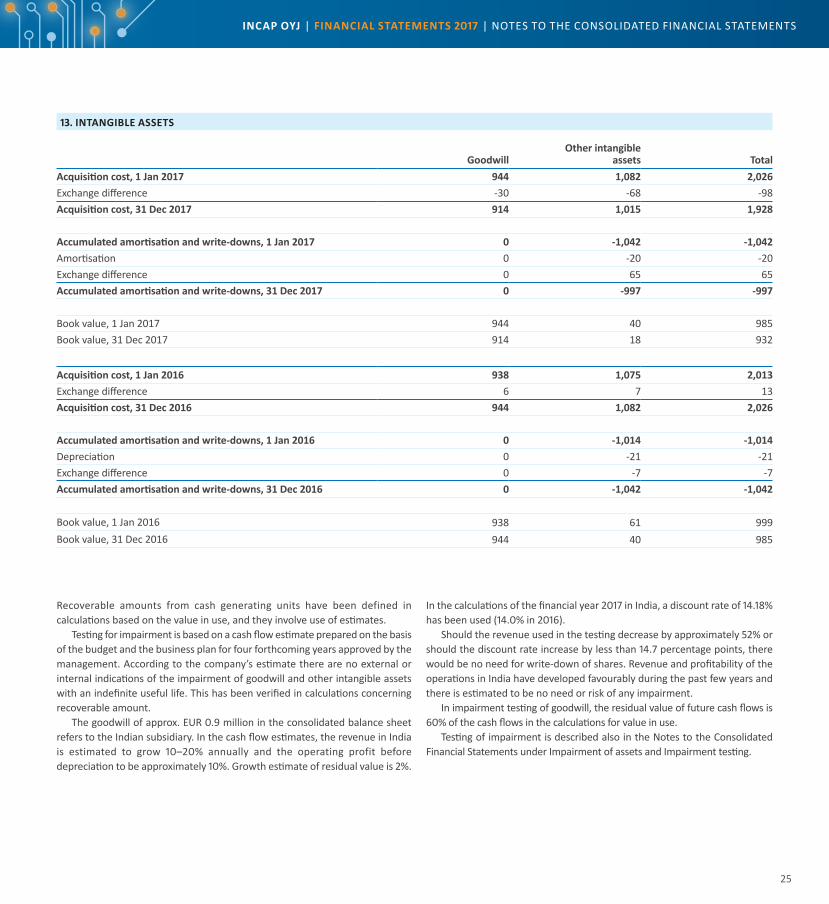
assets TotalAcquisition cost, 1 Jan 2017 944 1,082 2,026Exchange difference -30 -68 -98Acquisition cost, 31 Dec 2017 914 1,015 1,928
Accumulated amortisation and write-downs, 1 Jan 2017 0 -1,042 -1,042Amortisation 0 -20 -20Exchange difference 0 65 65Accumulated amortisation and write-downs, 31 Dec 2017 0 -997 -997
Book value, 1 Jan 2017 944 40 985Book value, 31 Dec 2017 914 18 932
Acquisition cost, 1 Jan 2016 938 1,075 2,013Exchange difference 6 7 13Acquisition cost, 31 Dec 2016 944 1,082 2,026
Accumulated amortisation and write-downs, 1 Jan 2016 0 -1,014 -1,014Depreciation 0 -21 -21Exchange difference 0 -7 -7Accumulated amortisation and write-downs, 31 Dec 2016 0 -1,042 -1,042
Book value, 1 Jan 2016 938 61 999Book value, 31 Dec 2016 944 40 985
Recoverable amounts from cash generating units have been defined in calculations based on the value in use, and they involve use of estimates.
Testing for impairment is based on a cash flow estimate prepared on the basis of the budget and the business plan for four forthcoming years approved by the management. According to the company’s estimate there are no external or internal indications of the impairment of goodwill and other intangible assets with an indefinite useful life. This has been verified in calculations concerning recoverable amount.
The goodwill of approx. EUR 0.9 million in the consolidated balance sheet refers to the Indian subsidiary. In the cash flow estimates, the revenue in India is estimated to grow 10–20% annually and the operating profit before depreciation to be approximately 10%. Growth estimate of residual value is 2%.
In the calculations of the financial year 2017 in India, a discount rate of 14.18% has been used (14.0% in 2016).
Should the revenue used in the testing decrease by approximately 52% or should the discount rate increase by less than 14.7 percentage points, there would be no need for write-down of shares. Revenue and profitability of the operations in India have developed favourably during the past few years and there is estimated to be no need or risk of any impairment.
In impairment testing of goodwill, the residual value of future cash flows is 60% of the cash flows in the calculations for value in use.
Testing of impairment is described also in the Notes to the Consolidated Financial Statements under Impairment of assets and Impairment testing.
INCAP OYJ | FINANCIAL STATEMENTS 2017 | NOTES TO THE CONSOlIDATED FINANCIAl STATEMENTS

26
14. FINANCIAL ASSETS AVAILABLE-FOR-SALE
2017 2016Publicly quoted shares 4 6Total available-for-sale investments at the end of the year 4 6
The fair value of publicly quoted investments in shares does not differ mate-rially from their carrying amount.
15. DEFERRED TAX ASSETS AND LIABILITIES
During the financial year 2017, deferred tax assets of EUR 122,915 have been recorded in the Indian subsidiary. No deferred tax assets against accumulated losses have been recorded in the Group in the financial periods 2016 or 2017. The parent company's confirmed tax losses amount to EUR 21.6 million on 31 December 2017. The parent company's deferred tax assets amount to approximately EUR 4.3 million and none of it has been recorded in the consolidated balance sheet. Out of the confirmed tax losses, EUR 4.2 million expired in 2017. Remaining confirmed tax losses will expire in years 2018–2025.
16. INVENTORIES
2017 2016Raw materials and supplies 1) 5,704 3,864Work in progress 645 835Finished goods 905 571Advance payments 466 393
7,721 5,6621) Due to a periodic error which was detected in the inventory valuation of 2016 and
was related to the implementation of the new ERP, a write-down of EUR 617,757 was done in the inventory and equity in 2016.
17. TRADE AND OTHER RECEIVABLES
Trade and other receivables – non-current 20162017Tax and other receivables from authorities in Indian subsidiary 1,005 817Other non-current receivables 140 46
1,146 863
Trade and other receivables – current 2017 2016Trade receivables 7,380 7,578Loan receivables 20 19Prepaid expenses and accrued income 1,568 554Other receivables 167 168
9,135 8,320
The fair values of receivables do not differ from their book value. Receivables are not exposed to any significant credit risks.
Aging structure of trade receivables and items recorded as credit losses 20162017Not past due 5,967 6,407Past due
less than 30 days 1,034 88730–60 days 255 20161–90 days 10 58Over 90 days 114 24
7,380 7,578
Items recorded as credit losses 68 36
Distribution of current receivables by currency, 1,000 EUR 20162017USD 3,795 2,685INR 3,525 2,349EUR 1,815 3,286
9,135 8,320
18. CASH AND CASH EQUIVALENTS
2017 2016Cash and bank accounts 2,862 2,347
2,862 2,347
The cash and cash equivalents according to the cash flow statement comprise same items.
19. NOTES TO THE STATEMENT OF CHANGES IN EQUITY
Number of shares Equity
Share premium account
31 Dec 2017 4,365,168 1,000 031 Dec 2016 4,365,168 1,000 0
The Annual General Meeting resolved on 6 April 2016 to cover the losses accumulated during the financial period ending at 31 December 2015 and during previous financial periods by decreasing the unrestricted equity reserve by EUR 16,804,218.62, the share premium account by EUR 44,316.59 and the share capital by EUR 11,118,952.29. After covering the losses the remaining share capital was further decreased by EUR 8,367,817.21 by transferring the funds to the unrestricted equity reserve.
In accordance with the resolution of the Annual General Meeting the quantity of company’s shares was reduced in the financial year 2016 so that each of previous 50 shares of the company correspond to one share of the company. In practice, the number of shares was divided by 50.
FINANCIAL STATEMENTS 2017 | NOTES TO THE CONSOlIDATED FINANCIAl STATEMENTS
27
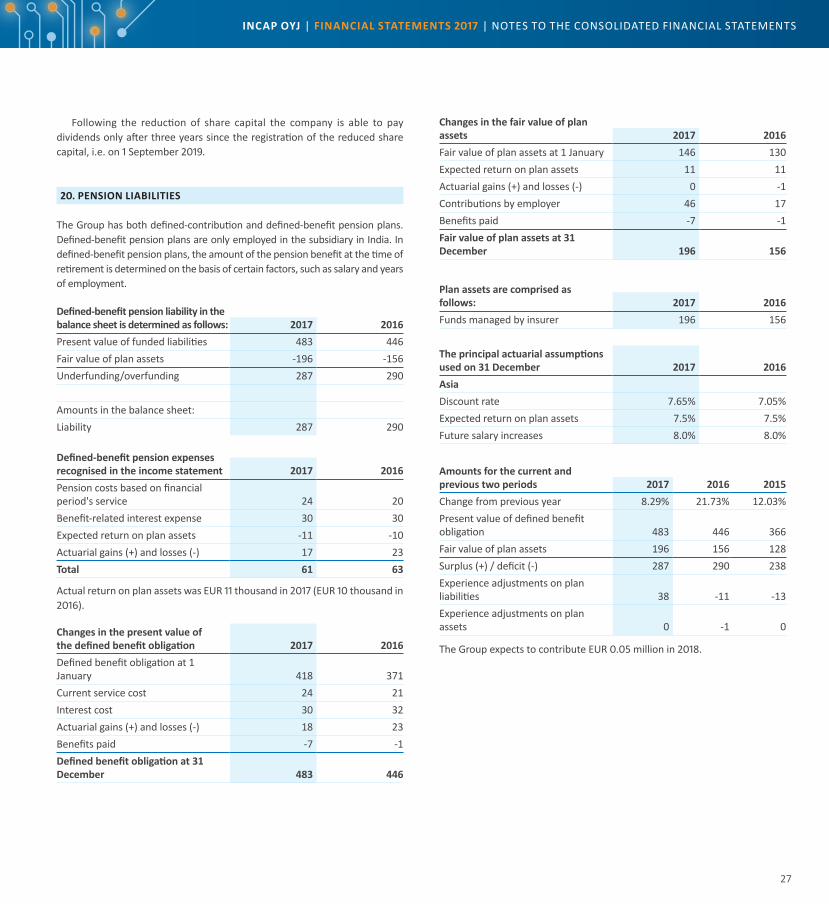
Following the reduction of share capital the company is able to pay dividends only after three years since the registration of the reduced share capital, i.e. on 1 September 2019.
20. PENSION LIABILITIES
The Group has both defined-contribution and defined-benefit pension plans. Defined-benefit pension plans are only employed in the subsidiary in India. In defined-benefit pension plans, the amount of the pension benefit at the time of retirement is determined on the basis of certain factors, such as salary and years of employment.
Defined-benefit pension liability in the balance sheet is determined as follows: 2017 2016Present value of funded liabilities 483 446Fair value of plan assets -196 -156Underfunding/overfunding 287 290
Amounts in the balance sheet:Liability 287 290
Defined-benefit pension expenses recognised in the income statement 2017 2016Pension costs based on financial period's service 24 20Benefit-related interest expense 30 30Expected return on plan assets -11 -10Actuarial gains (+) and losses (-) 17 23Total 61 63
Actual return on plan assets was EUR 11 thousand in 2017 (EUR 10 thousand in 2016).
Changes in the present value of the defined benefit obligation 2017 2016Defined benefit obligation at 1 January 418 371Current service cost 24 21Interest cost 30 32Actuarial gains (+) and losses (-) 18 23Benefits paid -7 -1Defined benefit obligation at 31 December 483 446
Changes in the fair value of plan assets 2017 2016Fair value of plan assets at 1 January 146 130Expected return on plan assets 11 11Actuarial gains (+) and losses (-) 0 -1Contributions by employer 46 17Benefits paid -7 -1Fair value of plan assets at 31 December 196 156
Plan assets are comprised as follows: 2017 2016Funds managed by insurer 196 156
The principal actuarial assumptions used on 31 December 2017 2016AsiaDiscount rate 7.65% 7.05%Expected return on plan assets 7.5% 7.5%Future salary increases 8.0% 8.0%
Amounts for the current and previous two periods 2017 2016 2015Change from previous year 8.29% 21.73% 12.03%Present value of defined benefit obligation 483 446 366Fair value of plan assets 196 156 128Surplus (+) / deficit (-) 287 290 238Experience adjustments on plan liabilities 38 -11 -13Experience adjustments on plan assets 0 -1 0
The Group expects to contribute EUR 0.05 million in 2018.
INCAP OYJ | FINANCIAL STATEMENTS 2017 | NOTES TO THE CONSOlIDATED FINANCIAl STATEMENTS
28
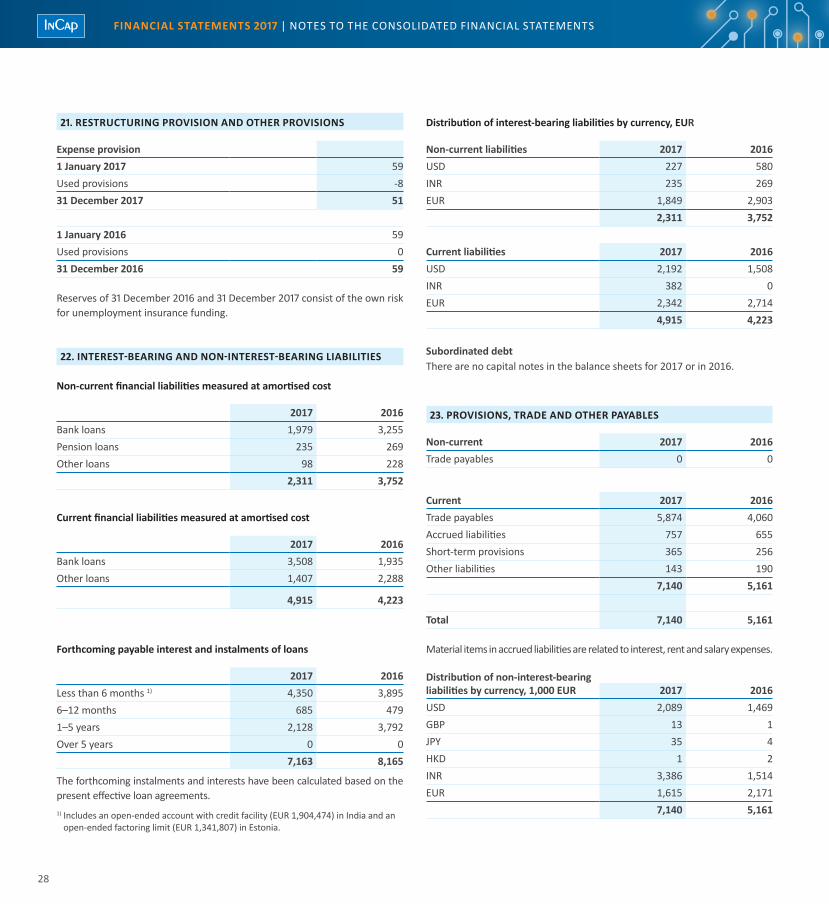
21. RESTRUCTURING PROVISION AND OTHER PROVISIONS
Expense provision1 January 2017 59Used provisions -831 December 2017 51
1 January 2016 59Used provisions 031 December 2016 59
Reserves of 31 December 2016 and 31 December 2017 consist of the own risk for unemployment insurance funding.
22. INTEREST-BEARING AND NON-INTEREST-BEARING LIABILITIES
Non-current financial liabilities measured at amortised cost
2017 2016Bank loans 1,979 3,255Pension loans 235 269Other loans 98 228
2,311 3,752
Current financial liabilities measured at amortised cost
2017 2016Bank loans 3,508 1,935Other loans 1,407 2,288
4,915 4,223
Forthcoming payable interest and instalments of loans
2017 2016less than 6 months 1) 4,350 3,8956–12 months 685 4791–5 years 2,128 3,792Over 5 years 0 0
7,163 8,165
The forthcoming instalments and interests have been calculated based on the present effective loan agreements.1) Includes an open-ended account with credit facility (EUR 1,904,474) in India and an
open-ended factoring limit (EUR 1,341,807) in Estonia.
Distribution of interest-bearing liabilities by currency, EUR
Non-current liabilities 2017 2016USD 227 580INR 235 269EUR 1,849 2,903
2,311 3,752
Current liabilities 2017 2016USD 2,192 1,508INR 382 0EUR 2,342 2,714
4,915 4,223
Subordinated debtThere are no capital notes in the balance sheets for 2017 or in 2016.
23. PROVISIONS, TRADE AND OTHER PAYABLES
Non-current 2017 2016Trade payables 0 0
Current 2017 2016Trade payables 5,874 4,060Accrued liabilities 757 655Short-term provisions 365 256Other liabilities 143 190
7,140 5,161
Total 7,140 5,161
Material items in accrued liabilities are related to interest, rent and salary expenses.
Distribution of non-interest-bearing liabilities by currency, 1,000 EUR 2017 2016USD 2,089 1,469GBP 13 1JPY 35 4HKD 1 2INR 3,386 1,514EUR 1,615 2,171
7,140 5,161
FINANCIAL STATEMENTS 2017 | NOTES TO THE CONSOlIDATED FINANCIAl STATEMENTS
29
24. MANAGEMENT OF FINANCIAL RISKS
The nature of the Incap Group’s business exposes the company to currency, interest rate, credit and liquidity risks. The objective of the Group’s financial risk management policy is to minimise the adverse effects of changes in financial markets on its result and cash flow.
The company’s finance administration identifies and assesses the risks, obtains the necessary instruments for hedging the risks and reports to the President and CEO and the Board of Directors on these risks and any changes in them. hedging transactions are carried out in accordance with the principles approved by the Group’s Board of Directors. Currency forward contracts, currency loans and interest rate swaps are used in risk management, whenever necessary. The financial structure of subsidiaries is planned, assessed and controlled with a view to the management of financial risks.
CURRENCY RISKSBecause the Incap Group operates in the euro zone and Asia, the company's business involves currency risk. In accordance with its risk management policy, the company aims to hedge itself from currency risks with currency options and currency forward contracts. In the Estonian company, a part of material purchases is made in USD. The respective transaction position is taken into consideration when calculating the company-specific position and is hedged in accordance with the currency risk policy. The company does not apply hedge accounting in accordance with IAS 39.
The short-term working capital financing liabilities of the Indian subsidiary are mainly USD-denominated, and the company additionally has an overdraft facility denominated in the Indian rupee.
Incap uses the subsidiary’s home currency (Indian rupee, INR) in invoicing between the parent company and the subsidiary. Therefore, exposure to transaction risk concerns almost completely the Group’s parent company and the foreign subsidiary is not exposed to substantial transaction risk. The risk exposure of the parent company’s balance sheet is hedged with forward exchange agreements and options when necessary.
In line with the Group’s currency risk policy the euro-denominated investment made in the subsidiary in India has not been hedged. The currency exchange differences arising from the investment are presented under exchange differences in the Group’s non-restricted equity. Strengthening of INR exchange rate in relation to EUR by 15% increases the Group’s equity by EUR 148,670 while weakening of INR exchange rate in relation to EUR by 15% decreases the Group’s equity by EUR 201,142 compared with the exchange difference at 31 December 2017.
INTEREST RATE RISK At the balance sheet date, interest-bearing liabilities in the consolidated balance sheet totalled EUR 7.2 million (EUR 8.0 million). Only a minor part of the interest-bearing liabilities have a fixed rate. The weighted average duration of the interest-bearing non-current loan at the balance sheet date is 1.4 years. Bank overdrafts and factoring limits have been treated as bullet loans. The Group has not carried out special hedging measures against interest rate risks during the financial year.
The Group analyses its interest rate exposure by preparing calculations of the defined interest rate change on the company’s result, when needed. Calculations are made only for the loans that have the largest impact on the overall interest rate exposure. A change of +1%/-1% in the market interest rates of variable rate loans would change the Group’s annual interest rate expenses by EUR +/- 73 thousand at 31 December 2017.
CREDIT RISKThe principles and responsibilities of credit control are defined in the Group’s documented operating methods. The Group has significant receivables from several large Finnish and global customers. These customers are well-established, long-standing and creditworthy. When a new customer relationship is established, the company assesses the annual volume generated by the new business, its share in revenue and the customer’s creditworthiness.
A total of EUR 68 thousand of credit losses were recorded during the financial year. During 2017 the Group has not renegotiated payment terms for receivables that would otherwise have been due or that would have decreased in value. Group has taken a credit insurance to secure trade receivables.
The aging structure of trade receivables is presented in Note 17.
LIQUIDITY RISKThe Group continuously evaluates and monitors the amount of financing required by business operations, so that it has sufficient liquid funds to finance operations and repay due loans. The company strives to ensure the availability and flexibility of financing by using credit facilities and other forms of financing.
Incap's main sources of financing are cash flow from operations, loans from financial institutions and share issues.
The company’s interest-bearing liabilities on 31 December 2017 amounted to EUR 7.2 million (8.0 million on 31 December 2016). Of this amount, EUR 6.8 million is bank loan and EUR 2.6 million out of it concerns the Indian subsidiary. Out of the separate factoring credit line for the Estonian subsidiary in an Estonian bank, EUR 1.3 million was in use at the end of the financial period.
INCAP OYJ | FINANCIAL STATEMENTS 2017 | NOTES TO THE CONSOlIDATED FINANCIAl STATEMENTS
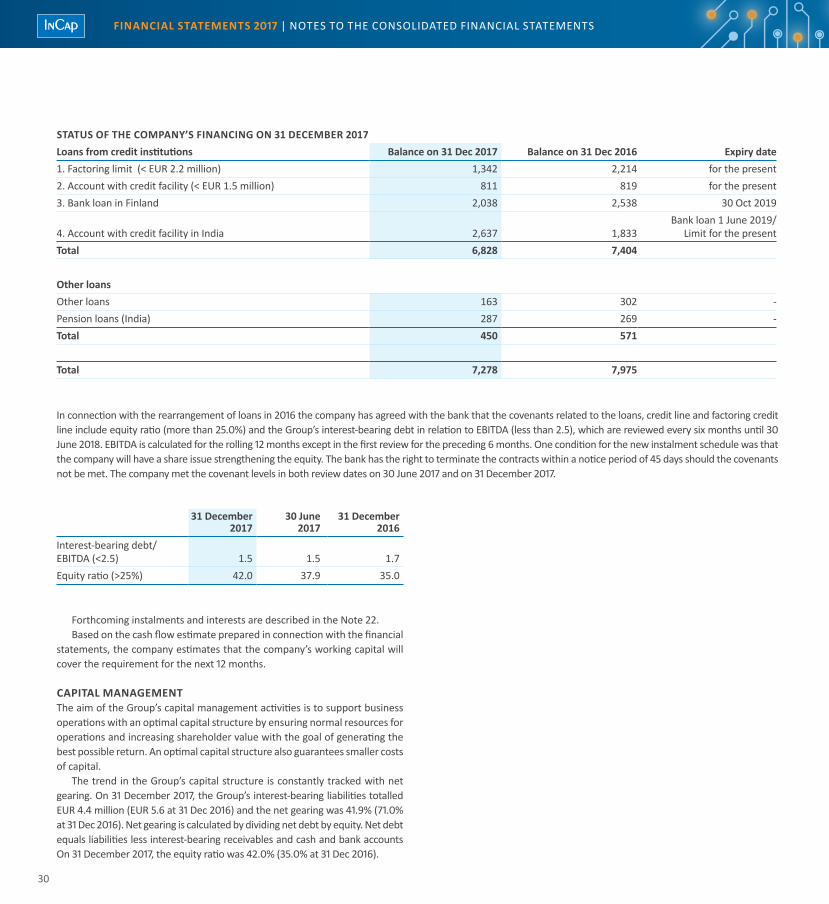
30
STATUS OF THE COMPANY’S FINANCING ON 31 DECEMBER 2017 Loans from credit institutions Balance on 31 Dec 2017 Balance on 31 Dec 2016 Expiry date1. Factoring limit (< EUR 2.2 million) 1,342 2,214 for the present2. Account with credit facility (< EUR 1.5 million) 811 819 for the present3. Bank loan in Finland 2,038 2,538 30 Oct 2019
4. Account with credit facility in India 2,637 1,833Bank loan 1 June 2019/
limit for the presentTotal 6,828 7,404
Other loans Other loans 163 302 -Pension loans (India) 287 269 - Total 450 571
Total 7,278 7,975
In connection with the rearrangement of loans in 2016 the company has agreed with the bank that the covenants related to the loans, credit line and factoring credit line include equity ratio (more than 25.0%) and the Group’s interest-bearing debt in relation to EBITDA (less than 2.5), which are reviewed every six months until 30 June 2018. EBITDA is calculated for the rolling 12 months except in the first review for the preceding 6 months. One condition for the new instalment schedule was that the company will have a share issue strengthening the equity. The bank has the right to terminate the contracts within a notice period of 45 days should the covenants not be met. The company met the covenant levels in both review dates on 30 June 2017 and on 31 December 2017.
31 December 2017
30 June 2017
31 December 2016
Interest-bearing debt/ EBITDA (<2.5) 1.5 1.5 1.7Equity ratio (>25%) 42.0 37.9 35.0
Forthcoming instalments and interests are described in the Note 22.Based on the cash flow estimate prepared in connection with the financial
statements, the company estimates that the company’s working capital will cover the requirement for the next 12 months.
CAPITAL MANAGEMENTThe aim of the Group’s capital management activities is to support business operations with an optimal capital structure by ensuring normal resources for operations and increasing shareholder value with the goal of generating the best possible return. An optimal capital structure also guarantees smaller costs of capital.
The trend in the Group’s capital structure is constantly tracked with net gearing. On 31 December 2017, the Group’s interest-bearing liabilities totalled EUR 4.4 million (EUR 5.6 at 31 Dec 2016) and the net gearing was 41.9% (71.0% at 31 Dec 2016). Net gearing is calculated by dividing net debt by equity. Net debt equals liabilities less interest-bearing receivables and cash and bank accounts On 31 December 2017, the equity ratio was 42.0% (35.0% at 31 Dec 2016).
FINANCIAL STATEMENTS 2017 | NOTES TO THE CONSOlIDATED FINANCIAl STATEMENTS

31
25. FAIR VALUE OF FINANCIAL ASSETS AND LIABILITIES
The fair values of financial assets do not differ from their book values.
Financial liabilities Book value 2017 Fair value 2017 Book value 2016 Fair value 2016Bank loans 5,486 5,486 5,190 5,190Pension loans 287 287 269 269Other interest-bearing loans 1,453 1,453 2,516 2,516
The fair value of current liabilities do not differ materially from their book value.The company has at the balance sheet date no financial assets and liabilities at fair value through profit or loss.
26. ADJUSTMENTS TO CASH FLOWS FROM OPERATIONS
2017 2016Non-cash transactions -41 36Use of provision for rents in Estonia 0 0Use of provision for salaries 0 0Depreciation and write-downs 428 382Change in finance lease agreements due to IFRS adjustments 0 0Paid leasing rents to cash flow from financing activities 0 0Employee benefits 0 0Transfer of gains of disposals of tangible assets to cash flow from investing activities 0 0Gains (-) and losses (+) of disposals of fixed assets and other non-current assets -6 -6Write-down of inventory 111 95Other items recognised directly to equity 0 0
492 508
27. CHANGES IN LIABILITIES ARISING FROM FINANCING ACTIVITIES
1 January 2017 Cash flow ReclassifiedForeign exchange
movements 31 December 2017Current interest-bearing loans and borrowings 4,223 -681 1 340 86 4,967Non-current interest-bearing loans and borrowings 3,752 -142 -1,340 41 2,311Total 7,975 -823 0 127 7,278
INCAP OYJ | FINANCIAL STATEMENTS 2017 | NOTES TO THE CONSOlIDATED FINANCIAl STATEMENTS
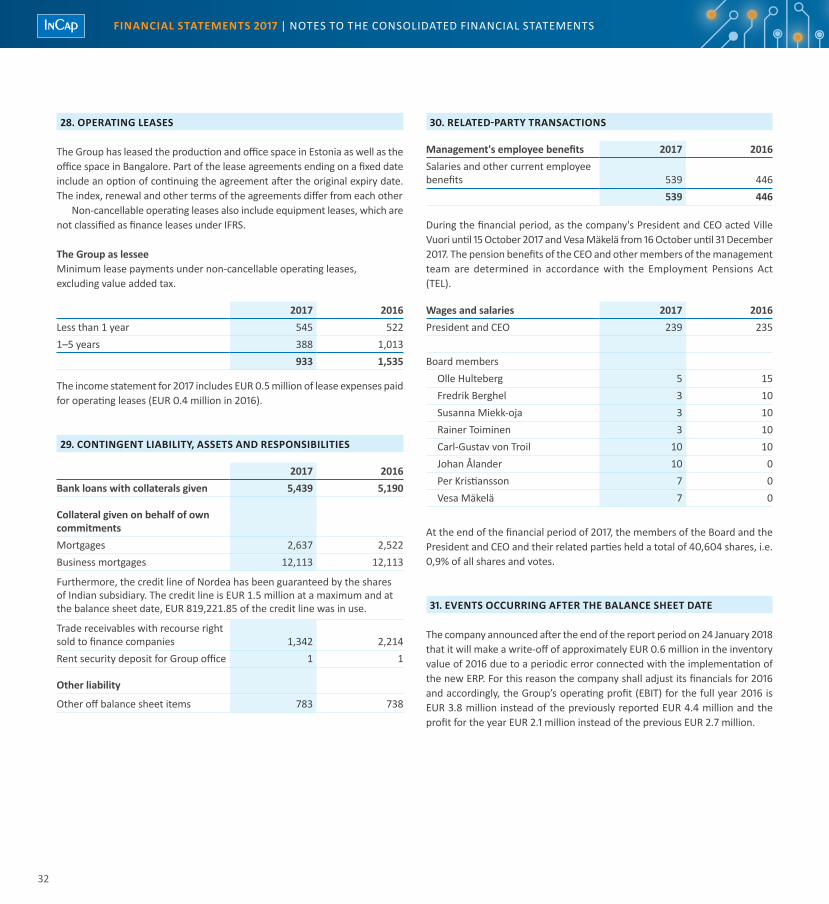
32
28. OPERATING LEASES
The Group has leased the production and office space in Estonia as well as the office space in Bangalore. Part of the lease agreements ending on a fixed date include an option of continuing the agreement after the original expiry date. The index, renewal and other terms of the agreements differ from each other
Non-cancellable operating leases also include equipment leases, which are not classified as finance leases under IFRS.
The Group as lesseeMinimum lease payments under non-cancellable operating leases,excluding value added tax.
2017 2016less than 1 year 545 5221–5 years 388 1,013
933 1,535
The income statement for 2017 includes EUR 0.5 million of lease expenses paid for operating leases (EUR 0.4 million in 2016).
29. CONTINGENT LIABILITY, ASSETS AND RESPONSIBILITIES
2017 2016Bank loans with collaterals given 5,439 5,190
Collateral given on behalf of own commitmentsMortgages 2,637 2,522Business mortgages 12,113 12,113
Furthermore, the credit line of Nordea has been guaranteed by the shares of Indian subsidiary. The credit line is EUR 1.5 million at a maximum and at the balance sheet date, EUR 819,221.85 of the credit line was in use.
Trade receivables with recourse right sold to finance companies 1,342 2,214Rent security deposit for Group office 1 1
Other liability
Other off balance sheet items 783 738
30. RELATED-PARTY TRANSACTIONS
Management's employee benefits 2017 2016Salaries and other current employee benefits 539 446
539 446
During the financial period, as the company's President and CEO acted ville vuori until 15 October 2017 and vesa Mäkelä from 16 October until 31 December 2017. The pension benefits of the CEO and other members of the management team are determined in accordance with the Employment Pensions Act (TEl).
Wages and salaries 2017 2016President and CEO 239 235
Board membersOlle hulteberg 5 15Fredrik Berghel 3 10Susanna Miekk-oja 3 10Rainer Toiminen 3 10Carl-Gustav von Troil 10 10Johan Ålander 10 0Per Kristiansson 7 0vesa Mäkelä 7 0
At the end of the financial period of 2017, the members of the Board and the President and CEO and their related parties held a total of 40,604 shares, i.e. 0,9% of all shares and votes.
31. EVENTS OCCURRING AFTER THE BALANCE SHEET DATE
The company announced after the end of the report period on 24 January 2018 that it will make a write-off of approximately EUR 0.6 million in the inventory value of 2016 due to a periodic error connected with the implementation of the new ERP. For this reason the company shall adjust its financials for 2016 and accordingly, the Group’s operating profit (EBIT) for the full year 2016 is EUR 3.8 million instead of the previously reported EUR 4.4 million and the profit for the year EUR 2.1 million instead of the previous EUR 2.7 million.
FINANCIAL STATEMENTS 2017 | NOTES TO THE CONSOlIDATED FINANCIAl STATEMENTS
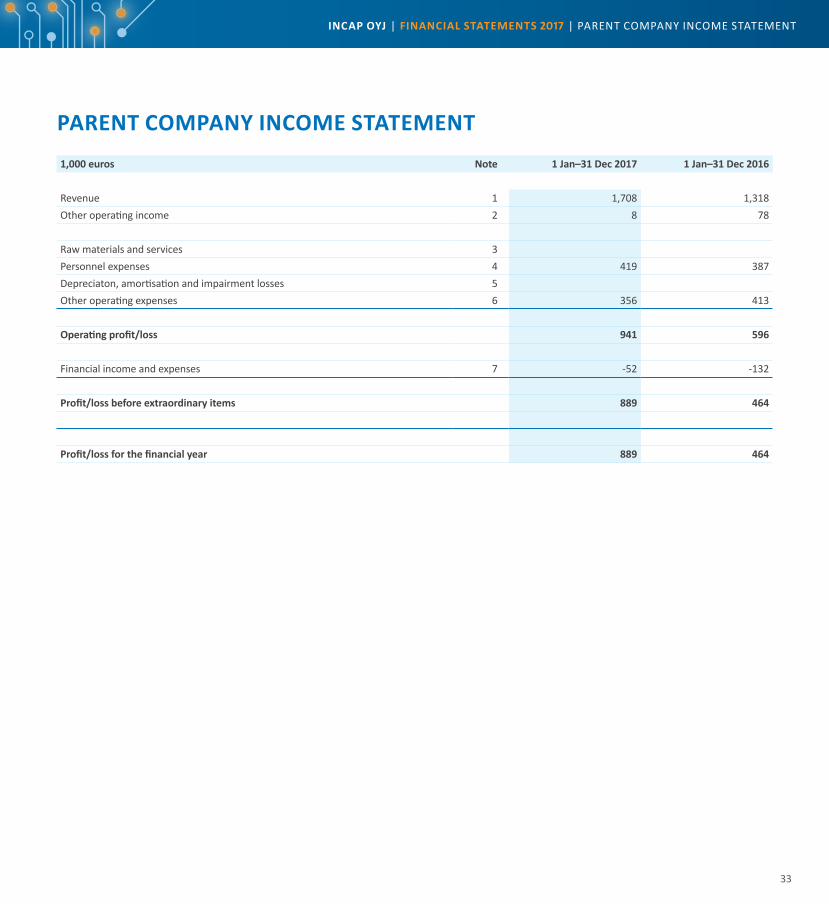
33
PARENT COMPANY INCOME STATEMENT1,000 euros Note 1 Jan–31 Dec 2017 1 Jan–31 Dec 2016
Revenue 1 1,708 1,318Other operating income 2 8 78
Raw materials and services 3Personnel expenses 4 419 387Depreciaton, amortisation and impairment losses 5Other operating expenses 6 356 413
Operating profit/loss 941 596
Financial income and expenses 7 -52 -132
Profit/loss before extraordinary items 889 464
Profit/loss for the financial year 889 464
INCAP OYJ | FINANCIAL STATEMENTS 2017 | PARENT COMPANY INCOME STATEMENT
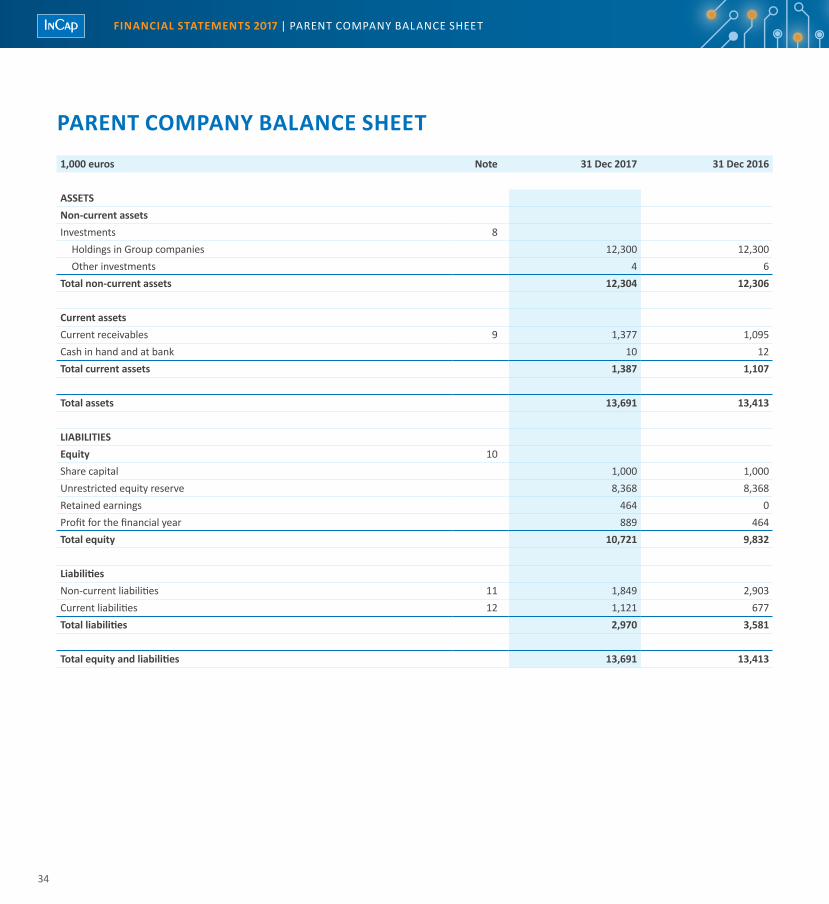
34
PARENT COMPANY BALANCE SHEET1,000 euros Note 31 Dec 2017 31 Dec 2016
ASSETSNon-current assetsInvestments 8
Holdings in Group companies 12,300 12,300Other investments 4 6
Total non-current assets 12,304 12,306
Current assetsCurrent receivables 9 1,377 1,095Cash in hand and at bank 10 12Total current assets 1,387 1,107
Total assets 13,691 13,413
LIABILITIESEquity 10Share capital 1,000 1,000Unrestricted equity reserve 8,368 8,368Retained earnings 464 0Profit for the financial year 889 464Total equity 10,721 9,832
LiabilitiesNon-current liabilities 11 1,849 2,903Current liabilities 12 1,121 677Total liabilities 2,970 3,581
Total equity and liabilities 13,691 13,413
FINANCIAL STATEMENTS 2017 | PARENT COMPANY BALANCE ShEET
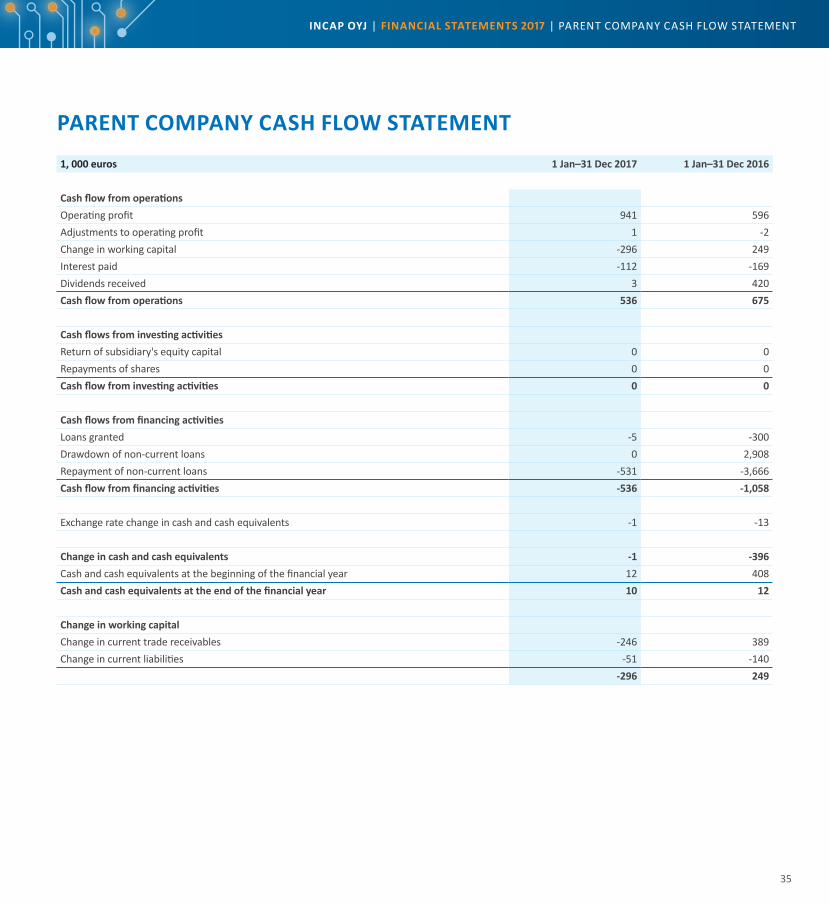
35
PARENT COMPANY CASH FLOW STATEMENT1, 000 euros 1 Jan–31 Dec 2017 1 Jan–31 Dec 2016
Cash flow from operationsOperating profit 941 596Adjustments to operating profit 1 -2Change in working capital -296 249Interest paid -112 -169Dividends received 3 420Cash flow from operations 536 675
Cash flows from investing activitiesReturn of subsidiary's equity capital 0 0Repayments of shares 0 0Cash flow from investing activities 0 0
Cash flows from financing activitiesloans granted -5 -300Drawdown of non-current loans 0 2,908Repayment of non-current loans -531 -3,666Cash flow from financing activities -536 -1,058
Exchange rate change in cash and cash equivalents -1 -13
Change in cash and cash equivalents -1 -396Cash and cash equivalents at the beginning of the financial year 12 408Cash and cash equivalents at the end of the financial year 10 12
Change in working capitalChange in current trade receivables -246 389Change in current liabilities -51 -140
-296 249
INCAP OYJ | FINANCIAL STATEMENTS 2017 | PARENT COMPANY CASh FLOW STATEMENT

36
ACCOUNTING POLICIES
PRINCIPLES OF MEASUREMENT AND PERIODISATIONNon-current assetsNon-current tangible and intangible assets are recorded in the balance sheet at historical cost less depreciation according to plan and amortisation. Investment grants received have been entered as a credit to the respective asset item. Depreciation according to plan has been calculated according to the straight-line method on the basis of the useful life of the property, plant and equipment. There are no non-current assets in the financial statements for 2017.
INTANGIBLE ASSETS• Goodwill 5–6 years• Consolidated goodwill 5 years• Other intangible rights 3–5 years
TANGIBLE ASSETS• Buildings and structures 18–24 years• Machinery and equipment 3–10 years• Motor vehicles 3–5 years
Financial assets and management of financial risksTrade receivables and payables are not exposed to significant interest rate or foreign currency risks. The company has however carried out hedging measures against exchange rate fluctuations during the financial year according to the company’s protection policy.
Foreign currency transactionsItems denominated in foreign currency have been translated at the average rate stated by the European Central Bank at the balance sheet date. Exchange differences between sales and purchases have been allocated as a credit or debit to respective items.
Leases In the parent company’s financial statements, lease payments for property, plant and equipment obtained on a finance lease are included as lease expenses in other operating expenses.
Periodisation of pension expensesEmployees’ pension security including supplementary benefits has been insured with pension insurance companies. Pension expenses are recognised as an expense during their year of accrual.
Income taxes Incap Corporation has, for taxation purposes, unused losses amounting to EUR 21.6 million, which have been approved and can be utilised in the years 2018–2025.
Impairment testing of shares in subsidiaries The value of subsidiaries in the parent group is the acquisition cost plus subsequent investments to strengthen the equity of the subsidiaries. The value of the shares has a significant impact on the parent company’s equity and therefore on, for example, equity ratio.
The impairment testing of shares in subsidiaries has been carried out on the basis of the situation at the end of December 2017. The recoverable amounts are determined in calculations on the basis of the value in use, and the preparation of these calculations requires the use of judgement.
The value of subsidiaries in the parent group is approximately EUR 12.3 million.
In cash flow estimates, the revenue in India is estimated to grow by 10–20% annually and the operating profit is approximately 10%. The residual value is estimated to grow by 2%. In the calculations for the financial period 2017, the discount rate of 14.18% has been used in India (14.0% in financial period 2016). Should the operating profit used in the testing decrease by approximately 52% or should the discount rate increase less than 14.7 percentage points, there would be no need for write-down of shares. Should the estimated residual value growth be 0%, there would be no need for write-down of shares. Because the revenue and profitability in India have shown a positive trend during the few past years, it is estimated that there is no need or risk for a write-down of shares.
In cash flow estimates, the revenue in Estonia is estimated to decrease by approximately 20% in 2018 and after that to grow annually by 5%, and the operating profit is estimated to be approximately 3.5–5%. The residual value is estimated to grow by 2%. In the calculations for the financial period 2017, the discount rate of 8.5% has been used in Estonia (8.72% in financial period 2016). Should the operating profit used in the testing decrease by approximately 36% or should the discount rate increase less than 4.5 percentage points, there would be no need for write-down of shares. Should the estimated residual value growth be 0%, there would be no need for write-down of shares. It is estimated that there is no need for write-down of shares of the Estonian subsidiary in 2017. The levels of revenue and operating profit before depreciation used in the impairment calculations of the Estonian subsidiary do not reflect the actual development during the preceding years and there is an element of uncertainty associated with them.
NOTES TO THE PARENT COMPANY FINANCIAL STATEMENTS
FINANCIAL STATEMENTS 2017 | NOTES TO ThE PARENT COMPANY FINANCIAL STATEMENTS

37
1. REVENUE
Revenue by market area 1 Jan–31 Dec 2017 1 Jan–31 Dec 2016Finland 0 0Europe 234 84Other 1,474 1,234
1,708 1,318
2. OTHER OPERATING INCOME
2017 2016Unrealised liability for indemnity 0 58Restored share from bankrupt estate 0 19Unrealised liability for employee's unemployment 8 0Other income 0 0
8 78
3. RAW MATERIALS AND SERVICES
2017 2016Raw materials and consumablesPurchases during the financial year 0 0
External services 0 00 0
4. PERSONNEL EXPENSES AND NUMBER OF PERSONNEL
2017 2016Average number of employees 3 2
3 2
Personnel expensesWages and salaries 382 336Pension expenses 27 20Other social security expenses 9 31
419 387
Salaries and bonus of the managementCEO and the Board 280 290
280 290
5. DEPRECIATION AND AMORTISATION
2017 2016Depreciation according to plan 0 0
6. OTHER OPERATING EXPENSES
2017 2016lease payments 50 50Maintenance expenses for machinery and properties 13 17Other expenses 292 346
356 413
Auditors feesAuthorised Public Accountant Firm Ernst & Young Oy 15 17Certificates and statements 0 0Tax advice 0 0Other services 7 11
21 28
7. FINANCIAL INCOME AND EXPENSES
2017 2016Dividend income
From other companies 3 0Other interest and financial income
From Group companies 38 45From other companies 23 1
Interest paid and other financial expenses
To Group companies 6 0To other companies 110 178
-52 -132
The financial statements have been compiled in accordance with Chapter 2 of the Accounting Act.
INCAP OYJ | FINANCIAL STATEMENTS 2017 | NOTES TO ThE PARENT COMPANY FINANCIAL STATEMENTS

38
8. INVESTMENTS
Shares in subsidiariesReceivables from Group
companies Other shares TotalAcquisition cost, 1 Jan 2017 12,300 0 6 12,306Decrease 0 0 -2 -2Acquisition cost, 31 Dec 2017 12,300 0 4 12,304
Book value, 31 Dec 2017 12,300 0 4 12,304Book value, 31 Dec 2016 12,300 0 6 12,306
FINANCIAL STATEMENTS 31 DECEMBER 2017The Group’s equity at the close of the financial period was EUR 10.4 million (EUR 7.9 million in 2016) and the parent company’s equity was EUR 10.7 million (EUR 9.8 million in 2016). The equity of the Group is increased by the profit of the parent company.
The value of shares in subsidiaries in the parent company is the acquisition cost plus subsequent investments to strengthen the equity of the subsidiaries. In the financial statements of the parent company, the value of the Indian subsidiary’s shares in the balance sheet is approximately EUR 8.2 million and the value of the Estonian subsidiary approximately EUR 4.1 million.
The value of the shares in subsidiaries has a significant impact on the parent company’s equity and accordingly on equity ratio, among others. The impairment testing of subsidiaries has been carried out based on the situation at the close of the financial period 2017. The recoverable amounts used in the impairment test calculations are determined on the basis of use value.
The cash flow forecasts are based on the budget for next financial period and the business plan prepared for the four forthcoming years by the management and approved by the Board. In cash flow estimates, the revenue in India is estimated to grow by 10–20% annually and the operating profit before depreciation is approximately 10%. In cash flow estimates, the revenue in Estonia is estimated to grow by 5% annually and the operating profit before depreciation is 3.5–5%. The residual value is estimated to grow by 2%.
The discount rate is comprised of industry risk, interest on liabilities and country-specific risk. The discount rate factors are updated annually in connection with the testing using information received from the market. In the calculations for the financial period 2017, the discount rate of 14.18% has been used in India and 8.5% in Estonia.
Should the revenue used in the testing decrease by approximately 52% in India or 36% in Estonia, or should the discount rate increase by less than 4.5 percentage points in Estonia and 14.7 percentage points in India, there would be no need for write-down of shares.
The profitability in the Indian subsidiary is at a good level and there is no need or risk of related write-down. As to the Estonian subsidiary, the levels of revenue and operating profit before depreciation used in the impairment test calculation do not reflect the actual development during preceding years, and
therefore there is an element of uncertainty associated with them. 80% of the business value of the Estonian subsidiary consists of a so-called residual value.
The revenue of the Estonian subsidiary increased in 2017 by approximately 65% and the operating profit before depreciation by approximately 17.5%.
GROUP COMPANIESIncap Electronics Estonia OÜ, Kuressaare, Estonia Incap Contract Manufacturing Services Pvt. Ltd., Bangalore, India Euro-ketju Oy, helsinki, Finland Incap hong Kong Limited, hong Kong
Incap Corporation owns 100% of Incap Electronics Estonia OÜ, Incap hong Kong Ltd and Incap Contract Manufacturing Services Pvt. Ltd. All companies are combined in the parent company consolidated financial statements. Euro-ketju Oy is a non-operating company.
9. RECEIVABLES
2017 2016Non-currentTrade receivables 0 0
Amount owed by Group companiesTrade receivables 540 293Interest receivables 77 39Other receivables 742 747
1,358 1,080
Other receivables 8 10Prepaid expenses and accrued income 10 5Total receivables 1,377 1,095
FINANCIAL STATEMENTS 2017 | NOTES TO ThE PARENT COMPANY FINANCIAL STATEMENTS
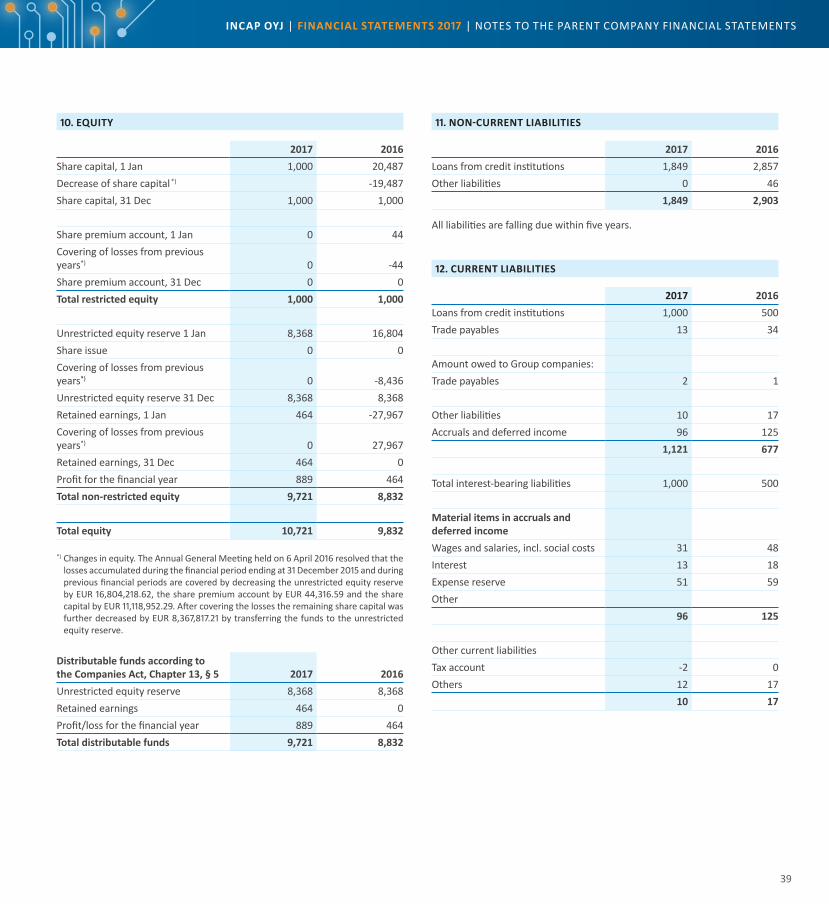
39
10. EQUITY
2017 2016Share capital, 1 Jan 1,000 20,487Decrease of share capital *) -19,487Share capital, 31 Dec 1,000 1,000
Share premium account, 1 Jan 0 44Covering of losses from previous years*) 0 -44Share premium account, 31 Dec 0 0Total restricted equity 1,000 1,000
Unrestricted equity reserve 1 Jan 8,368 16,804Share issue 0 0Covering of losses from previous years*) 0 -8,436Unrestricted equity reserve 31 Dec 8,368 8,368Retained earnings, 1 Jan 464 -27,967Covering of losses from previous years*) 0 27,967Retained earnings, 31 Dec 464 0Profit for the financial year 889 464Total non-restricted equity 9,721 8,832
Total equity 10,721 9,832
*) Changes in equity. The Annual General Meeting held on 6 April 2016 resolved that the losses accumulated during the financial period ending at 31 December 2015 and during previous financial periods are covered by decreasing the unrestricted equity reserve by EUR 16,804,218.62, the share premium account by EUR 44,316.59 and the share capital by EUR 11,118,952.29. After covering the losses the remaining share capital was further decreased by EUR 8,367,817.21 by transferring the funds to the unrestricted equity reserve.
Distributable funds according to the Companies Act, Chapter 13, § 5 2017 2016Unrestricted equity reserve 8,368 8,368Retained earnings 464 0Profit/loss for the financial year 889 464Total distributable funds 9,721 8,832
11. NON-CURRENT LIABILITIES
2017 2016Loans from credit institutions 1,849 2,857Other liabilities 0 46
1,849 2,903
All liabilities are falling due within five years.
12. CURRENT LIABILITIES
2017 2016Loans from credit institutions 1,000 500Trade payables 13 34
Amount owed to Group companies:Trade payables 2 1
Other liabilities 10 17Accruals and deferred income 96 125
1,121 677
Total interest-bearing liabilities 1,000 500
Material items in accruals and deferred incomeWages and salaries, incl. social costs 31 48Interest 13 18Expense reserve 51 59Other
96 125
Other current liabilitiesTax account -2 0Others 12 17
10 17
INCAP OYJ | FINANCIAL STATEMENTS 2017 | NOTES TO ThE PARENT COMPANY FINANCIAL STATEMENTS
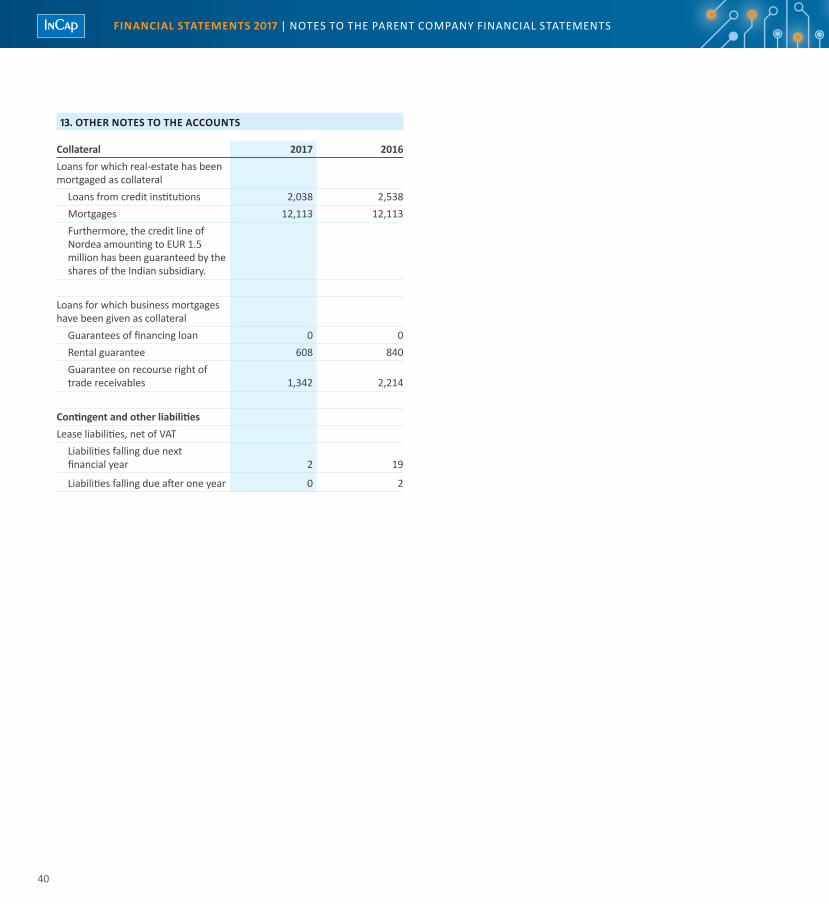
40
13. OTHER NOTES TO THE ACCOUNTS
Collateral 2017 2016Loans for which real-estate has been mortgaged as collateral
Loans from credit institutions 2,038 2,538Mortgages 12,113 12,113Furthermore, the credit line of Nordea amounting to EUR 1.5 million has been guaranteed by the shares of the Indian subsidiary.
Loans for which business mortgages have been given as collateral
Guarantees of financing loan 0 0Rental guarantee 608 840Guarantee on recourse right of trade receivables 1,342 2,214
Contingent and other liabilitiesLease liabilities, net of vAT
Liabilities falling due next financial year 2 19
Liabilities falling due after one year 0 2
FINANCIAL STATEMENTS 2017 | NOTES TO ThE PARENT COMPANY FINANCIAL STATEMENTS
41
BOARD OF DIRECTORS’ PROPOSAL ON MEASURES RELATED TO THE RESULT
The parent company’s profit for the financial period totalled EUR 888,818.01. The Board will propose to the Annual General Meeting on 17 April 2018 that no dividend be paid and the result for the financial period be recognised in equity.
helsinki, 19 March 2018
Johan Ålander Per KristianssonChairman of the Board Board member Carl-Gustaf von Troil Vesa MäkeläBoard member Board member, President and CEO
INCAP OYJ | FINANCIAL STATEMENTS 2017 | BOARD OF DIRECTORS’ PROPOSAL ON MEASURES RELATED TO ThE RESULT
42
REPORT ON ThE AUDIT OF FINANCIAL STATEMENTS
OPINION We have audited the financial statements of Incap Oyj (business identity code 0608849-6) for the year ended 31 December, 2017. The financial statements comprise the consolidated balance sheet, income statement, statement of comprehensive income, statement of changes in equity, statement of cash flows and notes, including a summary of significant accounting policies, as well as the parent company’s balance sheet, income statement, statement of cash flows and notes.
In our opinion• the consolidated financial statements give a true and fair view of the group’s
financial position as well as its financial performance and its cash flows in accordance with International Financial Reporting Standards (IFRS) as adopted by the EU.
• the financial statements give a true and fair view of the parent company’s financial performance and financial position in accordance with the laws and regulations governing the preparation of financial statements in Finland and comply with statutory requirements.
Our opinion is consistent with the additional report submitted to the Board of Directors.
BASIS FOR OPINION We conducted our audit in accordance with good auditing practice in Finland. Our responsibilities under good auditing practice are further described in the Auditor’s Responsibilities for the Audit of Financial Statements section of our report.
We are independent of the parent company and of the group companies in accordance with the ethical requirements that are applicable in Finland and are relevant to our audit, and we have fulfilled our other ethical responsibilities in accordance with these requirements.
In our best knowledge and understanding, the non-audit services that we have provided to the parent company and group companies are in compliance with laws and regulations applicable in Finland regarding these services, and we have not provided any prohibited non-audit services referred to in Article 5(1) of regulation (EU) 537/2014. The non-audit services that we have provided have been disclosed in note 6 to the consolidated financial statements.
We believe that the audit evidence we have obtained is sufficient and appropriate to provide a basis for our opinion.
KEY AUDIT MATTERSKey audit matters are those matters that, in our professional judgment, were of most significance in our audit of the financial statements of the current period. These matters were addressed in the context of our audit of the financial statements as a whole, and in forming our opinion thereon, and we do not provide a separate opinion on these matters.
We have fulfilled the responsibilities described in the Auditor’s responsibilities for the audit of the financial statements section of our report, including in relation to these matters. Accordingly, our audit included the performance of procedures designed to respond to our assessment of the risks of material misstatement of the financial statements. The results of our audit procedures, including the procedures performed to address the matters below, provide the basis for our audit opinion on the accompanying financial statements.
We have also addressed the risk of management override of internal controls. This includes consideration of whether there was evidence of management bias that represented a risk of material misstatement due to fraud.
AUDITOR’S REPORT (Translation of the Finnish original)
To the Annual General Meeting of Incap Oyj
FINANCIAL STATEMENTS 2017 | AUDITOR’S REPORT
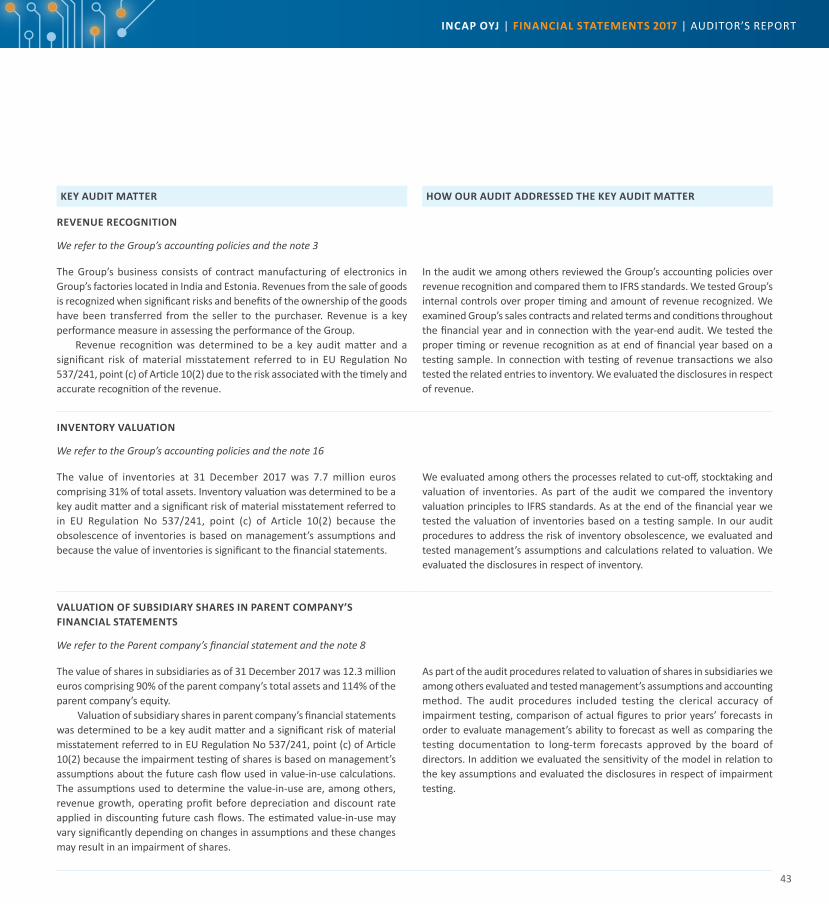
43
KEY AUDIT MATTER HOW OUR AUDIT ADDRESSED THE KEY AUDIT MATTER
REVENUE RECOGNITION
We refer to the Group’s accounting policies and the note 3
The Group’s business consists of contract manufacturing of electronics in Group’s factories located in India and Estonia. Revenues from the sale of goods is recognized when significant risks and benefits of the ownership of the goods have been transferred from the seller to the purchaser. Revenue is a key performance measure in assessing the performance of the Group.
Revenue recognition was determined to be a key audit matter and a significant risk of material misstatement referred to in EU Regulation No 537/241, point (c) of Article 10(2) due to the risk associated with the timely and accurate recognition of the revenue.
In the audit we among others reviewed the Group’s accounting policies over revenue recognition and compared them to IFRS standards. We tested Group’s internal controls over proper timing and amount of revenue recognized. We examined Group’s sales contracts and related terms and conditions throughout the financial year and in connection with the year-end audit. We tested the proper timing or revenue recognition as at end of financial year based on a testing sample. In connection with testing of revenue transactions we also tested the related entries to inventory. We evaluated the disclosures in respect of revenue.
INVENTORY VALUATION
We refer to the Group’s accounting policies and the note 16
The value of inventories at 31 December 2017 was 7.7 million euros comprising 31% of total assets. Inventory valuation was determined to be a key audit matter and a significant risk of material misstatement referred to in EU Regulation No 537/241, point (c) of Article 10(2) because the obsolescence of inventories is based on management’s assumptions and because the value of inventories is significant to the financial statements.
We evaluated among others the processes related to cut-off, stocktaking and valuation of inventories. As part of the audit we compared the inventory valuation principles to IFRS standards. As at the end of the financial year we tested the valuation of inventories based on a testing sample. In our audit procedures to address the risk of inventory obsolescence, we evaluated and tested management’s assumptions and calculations related to valuation. We evaluated the disclosures in respect of inventory.
VALUATION OF SUBSIDIARY SHARES IN PARENT COMPANY’S FINANCIAL STATEMENTS
We refer to the Parent company’s financial statement and the note 8
The value of shares in subsidiaries as of 31 December 2017 was 12.3 million euros comprising 90% of the parent company’s total assets and 114% of the parent company’s equity.
valuation of subsidiary shares in parent company’s financial statements was determined to be a key audit matter and a significant risk of material misstatement referred to in EU Regulation No 537/241, point (c) of Article 10(2) because the impairment testing of shares is based on management’s assumptions about the future cash flow used in value-in-use calculations. The assumptions used to determine the value-in-use are, among others, revenue growth, operating profit before depreciation and discount rate applied in discounting future cash flows. The estimated value-in-use may vary significantly depending on changes in assumptions and these changes may result in an impairment of shares.
As part of the audit procedures related to valuation of shares in subsidiaries we among others evaluated and tested management’s assumptions and accounting method. The audit procedures included testing the clerical accuracy of impairment testing, comparison of actual figures to prior years’ forecasts in order to evaluate management’s ability to forecast as well as comparing the testing documentation to long-term forecasts approved by the board of directors. In addition we evaluated the sensitivity of the model in relation to the key assumptions and evaluated the disclosures in respect of impairment testing.
INCAP OYJ | FINANCIAL STATEMENTS 2017 | AUDITOR’S REPORT
44
RESPONSIBILITIES OF THE BOARD OF DIRECTORS AND THE MANAGING DIRECTOR FOR THE FINANCIAL STATEMENTS The Board of Directors and the Managing Director are responsible for the preparation of consolidated financial statements that give a true and fair view in accordance with International Financial Reporting Standards (IFRS) as adopted by the EU, and of financial statements that give a true and fair view in accordance with the laws and regulations governing the preparation of financial statements in Finland and comply with statutory requirements. The Board of Directors and the Managing Director are also responsible for such internal control as they determine is necessary to enable the preparation of financial statements that are free from material misstatement, whether due to fraud or error.
In preparing the financial statements, the Board of Directors and the Managing Director are responsible for assessing the parent company’s and the group’s ability to continue as going concern, disclosing, as applicable, matters relating to going concern and using the going concern basis of accounting. The financial statements are prepared using the going concern basis of accounting unless there is an intention to liquidate the parent company or the group or cease operations, or there is no realistic alternative but to do so.
AUDITOR’S RESPONSIBILITIES FOR THE AUDIT OF FINANCIAL STATEMENTS Our objectives are to obtain reasonable assurance on whether the financial statements as a whole are free from material misstatement, whether due to fraud or error, and to issue an auditor’s report that includes our opinion. Reasonable assurance is a high level of assurance, but is not a guarantee that an audit conducted in accordance with good auditing practice will always detect a material misstatement when it exists. Misstatements can arise from fraud or error and are considered material if, individually or in aggregate, they could reasonably be expected to influence the economic decisions of users taken on the basis of the financial statements.
As part of an audit in accordance with good auditing practice, we exercise professional judgment and maintain professional skepticism throughout the audit. We also: • Identify and assess the risks of material misstatement of the financial
statements, whether due to fraud or error, design and perform audit procedures responsive to those risks, and obtain audit evidence that is sufficient and appropriate to provide a basis for our opinion. The risk of not detecting a material misstatement resulting from fraud is higher than for one resulting from error, as fraud may involve collusion, forgery, intentional omissions, misrepresentations, or the override of internal control.
• Obtain an understanding of internal control relevant to the audit in order to design audit procedures that are appropriate in the circumstances, but not for the purpose of expressing an opinion on the effectiveness of the parent company’s or the group’s internal control.
• Evaluate the appropriateness of accounting policies used and the reasonableness of accounting estimates and related disclosures made by management.
• Conclude on the appropriateness of the Board of Directors’ and the Managing Director’s use of the going concern basis of accounting and based on the audit evidence obtained, whether a material uncertainty exists related to events or conditions that may cast significant doubt on the parent company’s or the group’s ability to continue as a going concern. If we conclude that a material uncertainty exists, we are required to draw attention in our auditor’s report to the related disclosures in the financial statements or, if such disclosures are inadequate, to modify our opinion. Our conclusions are based on the audit evidence obtained up to the date of our auditor’s report. however, future events or conditions may cause the parent company or the group to cease to continue as a going concern.
• Evaluate the overall presentation, structure and content of the financial statements, including the disclosures, and whether the financial statements represent the underlying transactions and events so that the financial statements give a true and fair view.
• Obtain sufficient appropriate audit evidence regarding the financial information of the entities or business activities within the group to express an opinion on the consolidated financial statements. We are responsible for the direction, supervision and performance of the group audit. We remain solely responsible for our audit opinion.
We communicate with those charged with governance regarding, among other matters, the planned scope and timing of the audit and significant audit findings, including any significant deficiencies in internal control that we identify during our audit.
We also provide those charged with governance with a statement that we have complied with relevant ethical requirements regarding independence, and communicate with them all relationships and other matters that may reasonably be thought to bear on our independence, and where applicable, related safeguards.
From the matters communicated with those charged with governance, we determine those matters that were of most significance in the audit of the financial statements of the current period and are therefore the key audit matters. We describe these matters in our auditor’s report unless law or regulation precludes public disclosure about the matter or when, in extremely rare circumstances, we determine that a matter should not be communicated in our report because the adverse consequences of doing so would reasonably be expected to outweigh the public interest benefits of such communication.
FINANCIAL STATEMENTS 2017 | AUDITOR’S REPORT
45
OTHER REPORTING REQUIREMENTS
Information on our audit engagementWe were first appointed as auditors by the Annual General Meeting on 21 March 2002 and our appointment represents a total period of uninterrupted engagement of 16 years.
Other informationThe Board of Directors and the Managing Director are responsible for the other information. The other information comprises the report of the Board of Directors and the information included in the Annual Report, but does not include the financial statements and our auditor’s report thereon. We have obtained the report of the Board of Directors prior to the date of this auditor’s report, and the Annual Report is expected to be made available to us after that date.
Our opinion on the financial statements does not cover the other information.
In connection with our audit of the financial statements, our responsibility is to read the other information identified above and, in doing so, consider whether the other information is materially inconsistent with the financial statements or our knowledge obtained in the audit, or otherwise appears to be materially misstated. With respect to report of the Board of Directors, our responsibility also includes considering whether the report of the Board of Directors has been prepared in accordance with the applicable laws and regulations.
In our opinion, the information in the report of the Board of Directors is consistent with the information in the financial statements and the report of the Board of Directors has been prepared in accordance with the applicable laws and regulations.
If, based on the work we have performed on the other information that we obtained prior to the date of this auditor’s report, we conclude that there is a material misstatement of this other information, we are required to report that fact. We have nothing to report in this regard.
In helsinki 20th of March, 2018
Ernst & Young OyAuthorized Public Accountant Firm
Bengt NyholmAuthorized Public Accountant
INCAP OYJ | FINANCIAL STATEMENTS 2017 | AUDITOR’S REPORT

46
FIVE-YEAR KEY FIGURES
IFRS 2017 2016 1) 2015 2014 2013Revenue EUR million 48.5 38.6 30.6 18.5 25.8Growth/change % 26 26 65 -28 -60Operating profit/loss EUR million 4.5 3.8 3.7 1.1 -6.2
Share of revenue % 9.3 9.8 12.1 5.7 -23.9Profit/loss before tax EUR million 4.0 3.2 3.2 0.3 -8.3
Share of revenue % 8.2 8.3 11.0 2.0 -32.0
Return on equity (ROE) % 2) 34.0 31.3 56.9 15.4 725.7Return on investment (ROI) % 28.3 26.0 26.0 11.2 -33.6Total assets EUR million 24.8 21.1 18.1 14.4 15.8
Equity ratio % 42.0 37.6 31.2 9.9 3.4Net gearing % 41.9 71.0 98.3 524 1,559Interest-bearing net debt EUR million 4.4 5.6 5.6 7.5 7.7Quick ratio 1.0 1.1 1.1 0.6 0.6Current ratio 1.6 1.7 1.8 0.9 0.9 Investments EUR million 0.7 1.0 0.9 0.2 0.3
Share of revenue % 1.4 3 3 1 1R&D expenditure EUR milliona 0 0 0 0 0.1
Share of revenue % 0 0 0 0 0
Average number of employees 535 511 425 404 556Dividends EUR million 3) 0 0 0 0 0
1) Key figures for the year 2016 have been changed to meet with the adjusted result and the related balance sheet. 2) In the calculation of return on equity, the numerator and the denominator are negative in the year 2013. 3) The Board of Directors proposes to the Annual General Meeting that no dividend be paid out.
FINANCIAL STATEMENTS 2017 | FIvE-YEAR KEY FIGURES
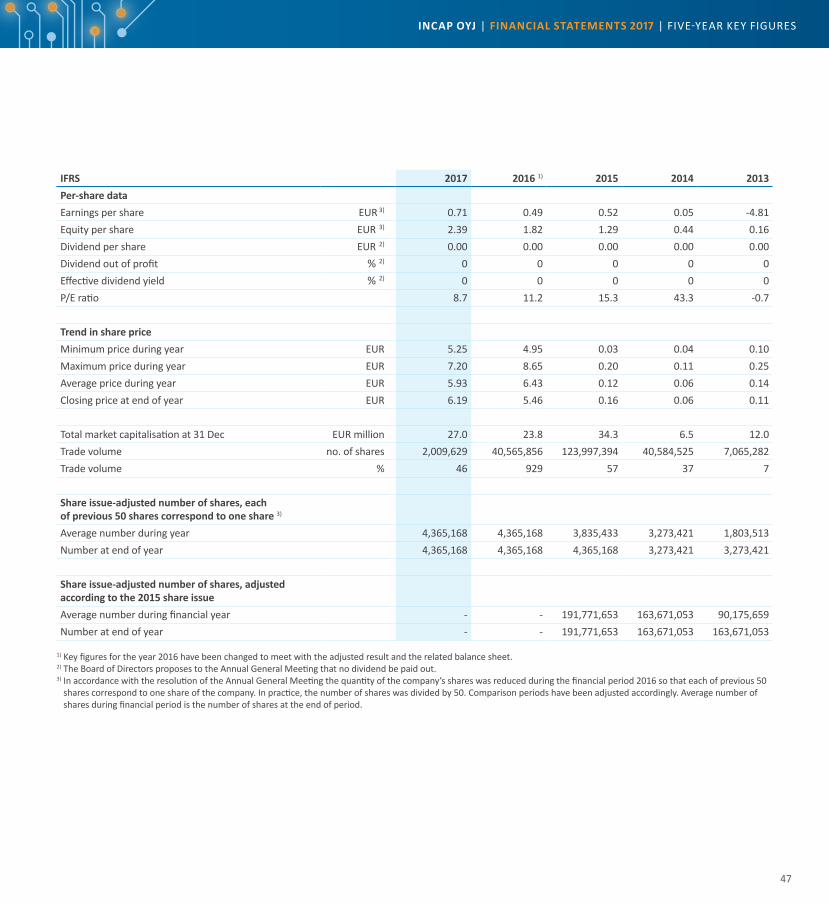
47
IFRS 2017 2016 1) 2015 2014 2013Per-share dataEarnings per share EUR 3) 0.71 0.49 0.52 0.05 -4.81Equity per share EUR 3) 2.39 1.82 1.29 0.44 0.16Dividend per share EUR 2) 0.00 0.00 0.00 0.00 0.00Dividend out of profit % 2) 0 0 0 0 0Effective dividend yield % 2) 0 0 0 0 0P/E ratio 8.7 11.2 15.3 43.3 -0.7
Trend in share priceMinimum price during year EUR 5.25 4.95 0.03 0.04 0.10Maximum price during year EUR 7.20 8.65 0.20 0.11 0.25Average price during year EUR 5.93 6.43 0.12 0.06 0.14Closing price at end of year EUR 6.19 5.46 0.16 0.06 0.11
Total market capitalisation at 31 Dec EUR million 27.0 23.8 34.3 6.5 12.0Trade volume no. of shares 2,009,629 40,565,856 123,997,394 40,584,525 7,065,282Trade volume % 46 929 57 37 7
Share issue-adjusted number of shares, each of previous 50 shares correspond to one share 3) Average number during year 4,365,168 4,365,168 3,835,433 3,273,421 1,803,513Number at end of year 4,365,168 4,365,168 4,365,168 3,273,421 3,273,421
Share issue-adjusted number of shares, adjusted according to the 2015 share issue Average number during financial year - - 191,771,653 163,671,053 90,175,659Number at end of year - - 191,771,653 163,671,053 163,671,053
1) Key figures for the year 2016 have been changed to meet with the adjusted result and the related balance sheet. 2) The Board of Directors proposes to the Annual General Meeting that no dividend be paid out. 3) In accordance with the resolution of the Annual General Meeting the quantity of the company’s shares was reduced during the financial period 2016 so that each of previous 50
shares correspond to one share of the company. In practice, the number of shares was divided by 50. Comparison periods have been adjusted accordingly. Average number of shares during financial period is the number of shares at the end of period.
INCAP OYJ | FINANCIAL STATEMENTS 2017 | FIvE-YEAR KEY FIGURES
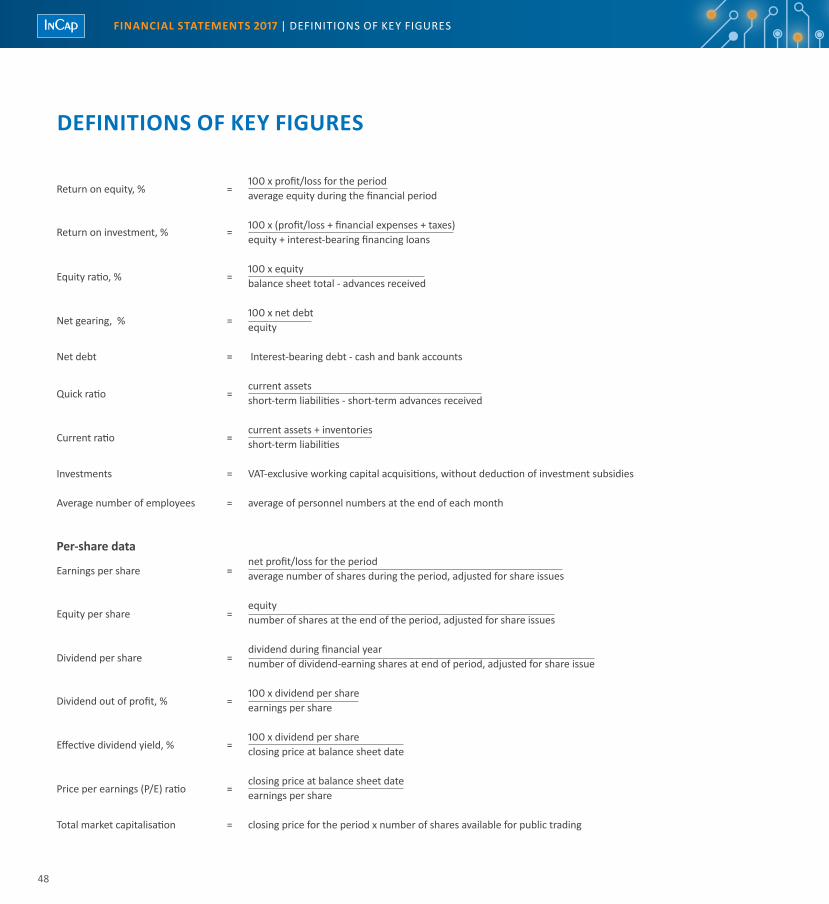
48
DEFINITIONS OF KEY FIGURES
Per-share data
Earnings per share = net profit/loss for the period
average number of shares during the period, adjusted for share issues
Equity per share = equity
number of shares at the end of the period, adjusted for share issues
Dividend per share = dividend during financial year
number of dividend-earning shares at end of period, adjusted for share issue
Dividend out of profit, % = 100 x dividend per share
earnings per share
Effective dividend yield, % = 100 x dividend per share
closing price at balance sheet date
Price per earnings (P/E) ratio = closing price at balance sheet date
earnings per share
Total market capitalisation = closing price for the period x number of shares available for public trading
Return on equity, % = 100 x profit/loss for the period
average equity during the financial period
Return on investment, % = 100 x (profit/loss + financial expenses + taxes)
equity + interest-bearing financing loans
Equity ratio, % = 100 x equity
balance sheet total - advances received
Net gearing, % = 100 x net debt
equity
Net debt = Interest-bearing debt - cash and bank accounts
Quick ratio = current assets
short-term liabilities - short-term advances received
Current ratio = current assets + inventories
short-term liabilities
Investments = vAT-exclusive working capital acquisitions, without deduction of investment subsidies
Average number of employees = average of personnel numbers at the end of each month
FINANCIAL STATEMENTS 2017 | DEFINITIONS OF KEY FIGURES

49
INCAP OYJ | FINANCIAL STATEMENTS 2017

50
Chairman of the BoardJOHAN ÅLANDERB.Sc. (BA), born 1959A non-executive director, who is independent of the company and its major shareholders
Johan Ålander is the Managing Director of NIGA International AB, a mergers and acquisitions advisory company. Ålander has previously been managing director of the electronic components distributor ElektronikGruppen AB (publ) and of the Touch Screen manufacturer Bröderna Danielson AB as well as vice President of the contract manufacturer AB Segerström & Svensson (publ).
Board member as from 18 April 2017.
Incap shares: -
BOARD OF DIRECTORS
PER KRISTIANSSONM.Sc. (BA), born 1967A non-executive director, who is independent of the company and its major shareholders
Per Kristiansson is active as Managing Director of väner expressen since 2011. he has previously served among others as purchasing director at Inission AB as well as at Löfberg Group.
Board member as from 18 April 2017.
Incap shares: -
CARL-GUSTAF VON TROIL B.Sc. (Eng.), born 1954A non-executive director, who is independent of the company and its major shareholders
Carl-Gustaf von Troil is a member of the Board at United Bankers and acts as a partner and asset manager at UB Wealth management. He has acted as Managing Director and Board member in several companies in banking, investment and property businesses. he is a member of the Board in several companies in the United Bankers Group.
Board member as from 6 April 2016.
Incap shares (direct ownership and holding of interest parties): 40,604 pcs
VESA MÄKELÄM.Sc. (Eng.), MBA, born 1964A director, who is independent of major shareholders
vesa Mäkelä has acted previously as Region vice President for North and Central Europe at GS-Hydro Group. he has been managing various industrial divisions and companies in Finland and abroad, among others in Konecranes, valtra and Specma. vesa Mäkelä was appointed President and CEO of Incap Group as from 16 October 2017.
Board member as from 18 April 2017.
Incap shares: -
None of the Directors is holding stock options.
ANNUAL REPORT 2017 | BOARD OF DIRECTORS

51
MANAGEMENT TEAM
VESA MÄKELÄPresident and CEOM.Sc. (Eng.), MBA, born 1964
President and CEO of Incap Group since 16 October 2017. Before that he acted as Region vP, North and Central Europe at GS-Hydro Group. he has been managing various industrial divisions and companies in Finland and abroad, among others in Konecranes, valtra and Specma. vesa Mäkelä also is a member of the Board of Directors of Incap as from 18 April 2017.
Members of the management team are holding no shares or stock options of the company.
TERO LEHTONENCFOM.Sc. (Econ), born 1967
With the company since 1 January 2018 as the Chief Financial Officer. He has previously worked among others at Specma Oy as the CFO and in other managerial positions.
OTTO PUKKDirector, Operations EstoniaM.Sc.B.E., born 1978
With the company as from 2015. he has served previously at Eesti Energia Technology Industries and ETAl Group, among others.
MURTHY MUNIPALLIDirector, Operations India & Sales AsiaM.Sc. (Eng.), MBA, born 1964
With the company as from 2008, serving first as Sales Director and as Managing Director of the Indian subsidiary. he has worked previously at Spike Techno logies ltd (present Qualcomm) and Tata Elxsi Ltd.
INCAP OYJ | ANNUAL REPORT 2017 | MANAGEMENT TEAM
52
SHARES AND SHAREHOLDERS
Incap Corporation’s shares are listed on the Nasdaq helsinki since 5 May 1997. In the Nordic OMX List, Incap belongs to the Small Cap segment and the industry sector of Incap is Industrials/Industrial Goods & Services. The company code is ICP and the book-entry type code is ICP1v.
The price of Incap Corporation’s share varied in the range of EUR 7.20 to EUR 5.25 during the financial year. The last quotation in trading at the end of the year 2017 was EUR 6.19. The company’s market capitalisation on 31 December 2017 was EUR 27.0 million. At the close of the financial year, the company had 2,489 shareholders, and 36.0% of the shares were nominee-registered.
SHAREHOLDER AGREEMENTSThe Board of Directors is not aware of any shareholder agreements concerning the ownership and voting rights of the company’s shares.
SHAREHOLDINGS OF THE BOARD OF DIRECTORS AND THE PRESIDENTThe members of the company’s Board of Directors, the President and their interest parties owned a total of 40,604 shares, or 0.9% of the company’s shares and votes. Changes in the holdings of the Board of Directors, the President and the Group management team are announced in stock exchange releases, which are available on the company’s website at www.incapcorp.com, section Investors/News.
Incap Corporation has one series of shares and a total of 4,365,168 shares on 31 December 2017. Company’s share capital registered in the trade registry was EUR 1,000,000 on 31 December 2017. The company does not own any of its own shares
FINANCIAL STATEMENTS 2017 | SHARES AND SHAREHOlDERS
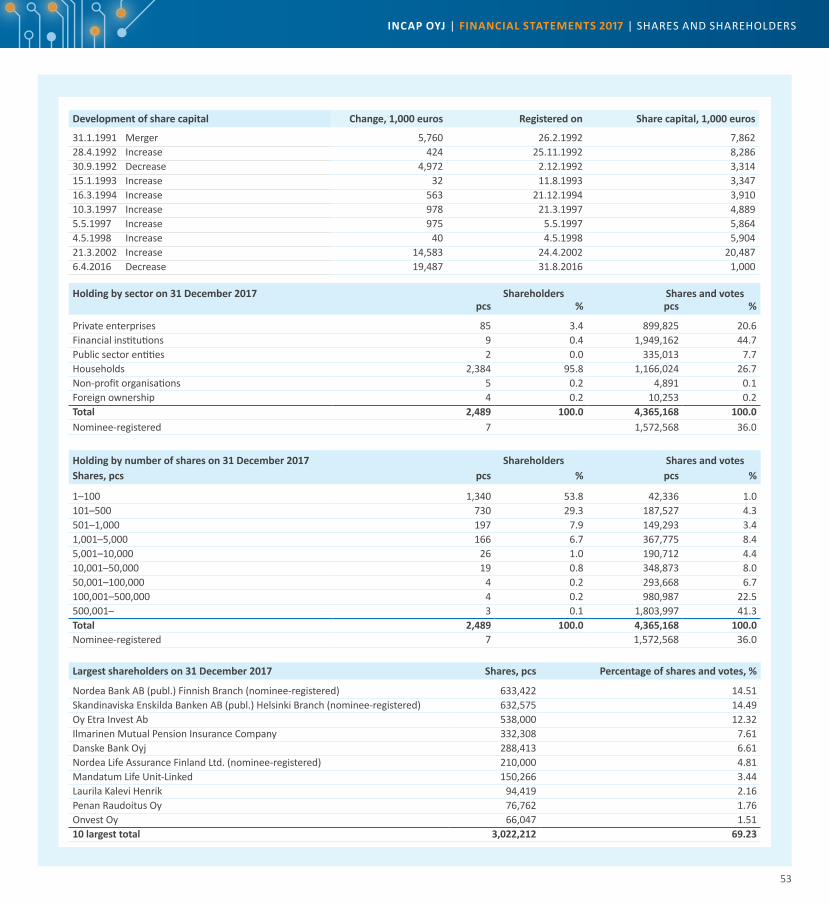
53
Holding by sector on 31 December 2017 Shareholders Shares and votespcs % pcs %
Private enterprises 85 3.4 899,825 20.6Financial institutions 9 0.4 1,949,162 44.7Public sector entities 2 0.0 335,013 7.7Households 2,384 95.8 1,166,024 26.7Non-profit organisations 5 0.2 4,891 0.1Foreign ownership 4 0.2 10,253 0.2Total 2,489 100.0 4,365,168 100.0Nominee-registered 7 1,572,568 36.0
Development of share capital Change, 1,000 euros Registered on Share capital, 1,000 euros
31.1.1991 Merger 5,760 26.2.1992 7,86228.4.1992 Increase 424 25.11.1992 8,28630.9.1992 Decrease 4,972 2.12.1992 3,31415.1.1993 Increase 32 11.8.1993 3,34716.3.1994 Increase 563 21.12.1994 3,91010.3.1997 Increase 978 21.3.1997 4,8895.5.1997 Increase 975 5.5.1997 5,8644.5.1998 Increase 40 4.5.1998 5,90421.3.2002 Increase 14,583 24.4.2002 20,4876.4.2016 Decrease 19,487 31.8.2016 1,000
Largest shareholders on 31 December 2017 Shares, pcs Percentage of shares and votes, %
Nordea Bank AB (publ.) Finnish Branch (nominee-registered) 633,422 14.51Skandinaviska Enskilda Banken AB (publ.) helsinki Branch (nominee-registered) 632,575 14.49Oy Etra Invest Ab 538,000 12.32Ilmarinen Mutual Pension Insurance Company 332,308 7.61Danske Bank Oyj 288,413 6.61Nordea life Assurance Finland ltd. (nominee-registered) 210,000 4.81Mandatum life Unit-linked 150,266 3.44laurila Kalevi Henrik 94,419 2.16Penan Raudoitus Oy 76,762 1.76Onvest Oy 66,047 1.5110 largest total 3,022,212 69.23
Holding by number of shares on 31 December 2017 Shareholders Shares and votesShares, pcs pcs % pcs %
1–100 1,340 53.8 42,336 1.0101–500 730 29.3 187,527 4.3501–1,000 197 7.9 149,293 3.41,001–5,000 166 6.7 367,775 8.45,001–10,000 26 1.0 190,712 4.410,001–50,000 19 0.8 348,873 8.050,001–100,000 4 0.2 293,668 6.7100,001–500,000 4 0.2 980,987 22.5500,001– 3 0.1 1,803,997 41.3Total 2,489 100.0 4,365,168 100.0Nominee-registered 7 1,572,568 36.0
INCAP OYJ | FINANCIAL STATEMENTS 2017 | SHARES AND SHAREHOlDERS

54
NOTES
FINANCIAL STATEMENTS 2017 | NOTES

55
INCAP OYJ | FINANCIAL STATEMENTS 2017 | NOTES
2015VUOSIKERTOMUS
2016INCAP OYJMannerheimintie 113, 5th floorFI-00280 helsinki, FinlandTel. +372 45 217 23
INCAP ELECTRONICS ESTONIA OÜTehnika 9EE-93815 Kuressaare, EstoniaTel. +372 45 217 23Fax +372 45 209 55
INCAP HONG KONG LIMITEDRoom 102, Tak Fung Building79–81 Connaught Road CentralHong KongTel. +852 2520 0690Fax +852 2520 0870
INCAP CONTRACT MANUFACTURING SERVICES PVT. LTD.Pandithanahalli, hirehalli PostTumkur 572 168Karnataka, IndiaTel. +91 816 224 3270–75 / 816 398 1100Fax +91 816 224 3278
Domicile: HelsinkiWebsite: www.incapcorp.comE-mail: [email protected] ID: FI 0608849-6