Annual Report 2013 " Being
256
Annual Report 2013 “Being active and having a positive outlook on life is what keeps me going every day.”
-
Upload
independent -
Category
Documents
-
view
0 -
download
0
Transcript of Annual Report 2013 " Being

Annual Report 2013
“ Being active and having a positive outlook on life is what keeps me going every day.”

Please go to page 4 for more
More at gsk.com
Cautionary statement regarding forward-looking statements
The Group’s reports filed with or furnished to the US Securities and Exchange Commission (SEC), including this document and written information released, or oral statements made, to the public in the future by or on behalf of the Group, may contain forward-looking statements. Forward-looking statements give the Group’s current expectations or forecasts of future events. An investor can identify these statements by the fact that they do not relate strictly to historical or current facts. They use words such as ‘anticipate’, ‘estimate’, ‘expect’, ‘intend’, ‘will’, ‘project’, ‘plan’, ‘believe’ and other words and terms of similar meaning in connection with any discussion of future operating or financial performance. In particular, these include statements relating to future actions, prospective products or product approvals, future performance or results of current and anticipated products, sales efforts, expenses, the outcome of contingencies such as legal proceedings, and financial results. The Group undertakes no obligation to update any forward-looking statements, whether as a result of new information, future events or otherwise.
Forward-looking statements involve inherent risks and uncertainties. The Group cautions investors that a number of important factors, including those in this document, could cause actual results to differ materially from those contained in any forward-looking statement. Such factors include, but are not limited to, those discussed under ‘Risk factors’ on pages 232 to 241 of this Annual Report.
* A number of adjusted measures are used to report the performance of our business. These measures are defined on page 58 and a reconciliation of core results to total results is set out on page 65.
“ Our performance in 2013 was defined by remarkable R&D output and further delivery of sustained financial performance for our shareholders.”
Performance highlights
£26.5bnGroup turnover
1stin Access to Medicines Index
£5.2bnReturned to shareholders
£7.0bnTotal operating profit
13%Estimated return on R&D investment
112.2pCore* earnings per share
£8.0bnCore* operating profit
1stPharmaceutical company to sign AllTrials campaign for research transparency
6Major medicines approved
10Potential phase III study starts in 2014/15
6Potential medicines with phase III data expected 2014/15
112.5pTotal earnings per share
“ Health is important to me, I try to take care of my health with all the tools I have and do the best that I can with it.”
Betty, COPD patient, North Carolina, USA
Front cover storyBetty, aged 65, (pictured) has Chronic Obstructive Pulmonary Disease (COPD). She only has 25% lung capacity. This means she finds even everyday tasks difficult, but medicines and inhaled oxygen allow her to live as normal a life as she can. Betty’s mindset is to stay busy and active, so every week she goes to rehab exercise classes.
COPD is a disease of the lungs that leads to damaged airways, causing them to become narrower and making it harder for air to get in and out. 210 million people around the world are estimated to have COPD.
Patients like Betty are the reason GSK has been investing more in respiratory research than any other healthcare company over the past 40 years. For more on our research into new medicines see page 34.
Overview of 2013
Overview

Contents
Strategic reportChairman’s statement 2CEO’s review 4Business overview 6The global context 8Our business model 12Our strategic priorities 14How we performed 16 Risk management 18 Grow 20 Deliver 32 Simplify 44 Our financial architecture 48Responsible business 50 Financial review 58
Governance & remunerationOur Board 76Our Corporate Executive Team 80Chairman’s letter 82Board report to shareholders 83Committee reports 89Remuneration CommitteeChairman’s Annual Statement 96Annual report on remuneration 97Remuneration policy report 117
Financial statementsDirectors’ statement ofresponsibilities 128Independent Auditors’ report 129Financial statements 132Notes to the financial statements 136Financial statements ofGlaxoSmithKline plc preparedunder UK GAAP 211
Investor informationQuarterly trend 218Five-year record 222Product development pipeline 225Products, competition andintellectual property 229 Risk factors 232Share capital and share price 242Dividends 244Tax information for shareholders 244Annual General Meeting 2014 245US law and regulation 247Shareholder services and contacts 249
Our mission
At GSK our mission is to improve the quality of human life by enabling people to do more, feel better, live longer.
GSK Annual Report 2013 1

Strategic report Chairman’s statement
Chairman’s statementTo shareholdersThe value of the significant changes that have been made in recent years is evidenced in our performance this year
“ Since Sir Andrew became CEO, the company has returned £30 billion to shareholders.”
It is clear from the following pages that the Group made good progress against its strategy in 2013.
The Board believes the business is seeing the benefits of the significant changes the management team has driven over recent years to deliver sustainable growth, reduce risk and enhance returns to shareholders.
The notably strong performance from the R&D organisation in 2013 – with six major new product approvals in areas including respiratory disease, HIV and cancer – is critical to the longer-term prospects of the Group. That this has been achieved at the same time as R&D is effectively managing its cost base to deliver an improved estimated rate of return of 13% is particularly encouraging.
It is worth noting that since Sir Andrew became CEO, GSK’s market capitalisation has grown from approximately £55 billion to around £80 billion and the company has returned some £30 billion to shareholders via £20 billion of dividends and £10 billion of share buy-backs.
Risk management and commitment to ethical behaviourThe Board aims to assure the integrity of GSK’s business operations through rigorous processes and systems and during the year, risk management was once again a key part of the Board’s discussions.
Through the Audit & Risk Committee, we oversee the issues and challenges faced by management, and encourage the creation of an environment in which GSK can achieve its strategic ambitions in a responsible and sustainable manner.
I have no doubt that commercial success is directly linked to operating in a responsible way and which meets the changing expectations of society. In this respect, the company continues to adopt industry-leading positions on a range of issues.
The announcement of plans during 2013 to evolve the way the business interacts with healthcare professionals and pays sales staff are developments I was particularly pleased to see.
In the same way the Board strongly supports the commitments the company has made to advance transparency around clinical trial data, and welcomes the subsequent actions of other companies in this field. Over time, it is to be hoped these steps will advance medical science and improve patient care.
The allegations of fraudulent behaviour by certain employees within our business in China are wholly contrary to the company’s values. In addition to the Chinese Government investigation, we have commissioned an independent review of our Chinese operations by the law firm Ropes and Gray, and we will implement all appropriate actions as necessary on conclusion of these investigations.
2 GSK Annual Report 2013

Governance and remunerationWe have been mindful of the changes outlined in the new UK Narrative and Remuneration Reporting regulations and this Annual Report adheres to the new reporting standards.
In particular, this year’s Remuneration Report comprises two parts that will each require shareholder approval at the Group’s forthcoming AGM. Further details are set out in Tom de Swann’s letter to shareholders on page 96 of this Report.
Board changes and compositionThere were a number of changes to the Board during the year. I would like to thank Sir Crispin Davis, who stood down in May, for his valuable contributions over nearly ten years of service. In April, we were pleased to have Hans Wijers join the Board as a Non-Executive Director. His extensive experience of running global companies has already proved to be of great value to Board discussions.
There were also planned changes in the Chairmanships of several Board Committees. Tom de Swaan succeeded Sir Crispin Davis as Chairman of the Remuneration Committee and Judy Lewent succeeded Tom as Chairman of the Audit & Risk Committee, with Tom remaining as a member of that committee.
In addition, I would like to thank Sir Deryck Maughan for agreeing to remain on the Board for up to an additional two years having succeeded Sir Robert Wilson as Senior Independent Director in May. Sir Deryck’s considerable experience and knowledge of GSK’s businesses will provide continuity and balance.
Finally, Sir Robert Wilson stands down at the 2014 AGM after ten years of exceptional service and I would like to thank him for his longstanding commitment to the Group.
Regarding composition of the Board, our priority is to have diversity in terms of gender, length of tenure and business experience across developed and emerging markets. During the year, GSK had 33% female representation on the Board, a level that exceeds the original aspiration to have 25% by the start of 2013. The Board firmly believes that a diverse balance of experience, insight, perspectives and background among its Board members is in the best long-term interests of the Group and its shareholders.
ProspectsIn closing, the Board would like to thank Sir Andrew and his executive team for their commitment during a year in which the Group once again demonstrated its ability to deliver innovation while constantly striving for substantial change. I am confident the Group will continue to identify and grasp the many opportunities that will strengthen GSK’s performance, reward its shareholders, and create sustainable long-term value for society.
Sir Christopher Gent Chairman
Board gender diversity
Female Male
10
12
8
6
4
2
02011 2012 2013
12
3
5 5
10 10
GSK Annual Report 2013 3

Strategic report CEO’s review
Our CEO’sReview of the yearCompany performance in 2013 was defined by remarkable output from our R&D organisation
Over the past six years we have been making fundamental changes at GSK to deliver innovation and access to our products for patients and customers, and improved sustainable financial performance for our shareholders.
In 2013, we saw further strong delivery against these priorities.
During the year, we led the sector for new medicine approvals and returned £5.2 billion to shareholders through dividends and share buy-backs – helping generate the best annual total shareholder return (TSR) performance since the formation of GSK.
We grew sales and earnings in line with guidance with turnover up 1% to £26.5 billion and core earnings per share up 4% to 112.2p (both CER). We achieved this trading result despite some unexpected challenges, including significantly reduced sales in our Chinese business.
During 2013, we also continued to take action to reform our business model to better meet the expectations of society. In particular, we took industry-leading positions and actions to improve global public health, increase transparency of our clinical data, and modernise our commercial practices and interactions with customers.
Exceptional R&D delivery 2013 was the most productive period of R&D output in the company’s history.
Of the six major new medicine files we profiled at the start of 2013, five were approved: Breo and Anoro for respiratory disease, Tafinlar and Mekinist for melanoma (skin cancer) and Tivicay for HIV. We are expecting regulatory decisions for albiglutide, the remaining asset in this group, in the first half of 2014. In addition, we launched our new injectable quadrivalent flu vaccine in the USA.
Overall, GSK accounted for 19% of FDA new drug approvals during 2013 and, since 2009, we have achieved more FDA approvals of new molecular entities (NMEs) than any other company.
The conversion of our advanced pipeline to approved products represents the next step in our strategy to deliver sustainable organic growth and value to shareholders.
In particular, I want to note the growing strength of our respiratory portfolio. With Advair, Flovent, Ventolin, Breo, Anoro and seven other respiratory products in late-stage development, we are confident in our ability to maintain a leadership position in this area well into the next decade.
In addition to the highlighted approvals, our future pipeline opportunity remains extensive. We have around 40 NMEs in phase II/III clinical development. In 2014 and 2015 we expect phase III read-outs for six NMEs and are planning ten NME phase III starts in key areas such as respiratory, oncology and immuno-inflammation.
Importantly, we also continue to improve our financial efficiency in R&D and our estimated internal rate of return of our R&D investments is now 13%. This is good progress and we continue to target 14% on a longer-term basis.
Improved R&D productivity is also underpinning our strategy to create more flexibility around the pricing of our new medicines to meet the needs of payers and governments.
“ We led the sector for new medicine approvals and returned £5.2 billion to shareholders.”
4 GSK Annual Report 2013

Broadly based sales growthIn terms of sales, we saw a broadly-based performance in 2013. There was an improved performance in our US business, where sales were up 1% (or 4% excluding the divestment of Vesicare). We also saw stabilisation of our European business, which reported flat sales, with the benefits of our restructuring programme helping to offset economic and pricing pressures in the region.
We remain committed to investing for continuing growth in our important Emerging Markets business. Sales in the region were up 5% for the year and 11% in the fourth quarter, excluding China.
During the year, we also took steps to increase our equity holdings in our fast-growing Indian pharmaceuticals and consumer subsidiaries and announced plans to build new manufacturing capacity in the country.
Consumer Healthcare sales grew 4% excluding divested brands, with growth across all regions.
Optimising and re-shaping our portfolioWe continue to take steps to optimise and focus our portfolio.
During 2013 we divested our anti-coagulant products for more than £700 million. We also created a new Established Products Portfolio made up of our older, largely non-promoted brands, with the aim of finding more opportunities to reduce complexity, enhance profitability and optimise the value of this group of products.
We also completed a significant divestment in our Consumer Healthcare business with the sale of drinks brands Lucozade and Ribena to Suntory of Japan for £1.35 billion. While these are iconic brands, particularly in the UK, we believe their growth potential is better realised by a company with existing category presence and a substantial drinks distribution infrastructure in the emerging markets.
Financial efficiencies and cash generationOperationally we continue to restructure and simplify our business to reduce our long-term cost base. In 2013 we delivered incremental year-on-year savings of around £400 million from both ongoing and structural initiatives.
This is creating greater flexibility to invest in our growth markets and new product launches and – together with continued improvement in our financial efficiency – strengthens our ability to deliver earnings per share growth ahead of sales.
The business remains highly cash generative with £4.7 billion in free cash flow in 2013. In addition, we realised £2.5 billion from divestments leaving net debt of £12.6 billion at the end of the year. We continue to focus on using cash to protect our credit profile and fund organic investment and restructuring programmes as well as our ongoing commitment to a growing dividend, further share buy-backs and bolt-on acquisitions –whichever offers the most attractive returns.
Changing our business modelWe made considerable further progress during 2013 on our agenda to operate responsibly and meet the changing expectations of society.
We made new commitments to increase transparency of our clinical research. Early in the year we announced our support for the AllTrials campaign and became the first pharmaceutical company to commit to publishing the detailed clinical study reports for all of our medicines. In May, we were also the first in our industry to launch an online system enabling researchers to request access to the anonymised patient-level data from our clinical trials. I am pleased that other companies are now also adopting this approach.
We also announced plans to evolve the way we sell and market products to healthcare professionals to further align our activities with the interests of patients and remove the perception of conflict of interest. Specifically, we plan to stop direct payments to healthcare professionals for speaking engagements and for attendance at medical conferences, and extend the principle of our US ‘Patient First’ programme globally, to decouple sales team remuneration from prescription generation.
We continue to expand access to our medicines to people living in the developing world.
During 2013 we signed a ground-breaking five-year partnership with Save the Children to combine the resources and capabilities of our two organisations to help save the lives of one million children living in the poorest countries in Africa.
I was delighted we achieved a significant milestone for our malaria vaccine candidate which demonstrated that it could potentially halve the number of malaria cases in young children. This vaccine has the potential to save the lives of hundreds of thousands of children in Africa and we now plan to file for approval during 2014. We are committed to making it available at a not-for-profit price.
There is no higher priority for me than the values-based conduct of our employees. In the past few years, we have focused on bringing to life our values of transparency, respect for people, integrity and patient focus, and being thoughtful about what they really mean at a human level.
It is because of my strong belief in our company’s values that the allegations made in China about the behaviour of some individuals were so disappointing. The investigation into this matter by the authorities in China continues and we are co-operating fully. As a company, we are committed to learning the lessons and taking all appropriate action in relation to the outcome of their investigation.
OutlookLooking to 2014, we see continued momentum for the business and are targeting core earnings per share (EPS) growth of 4-8% CER on turnover growth of around 2% CER on an ex-divestment basis (2013 EPS base of 108.4p, turnover £25.6 billion). The range in our guidance takes into account the roll-out of new products along with potential competition from generics to our older products such as Lovaza.
In closing, I would like to thank all our employees, partners and suppliers for their continued commitment and support. Overall, I am confident that our core focus on innovative product development and our programme of investment, coupled with the changes we are making to our business model, are positioning the company competitively for the long term.
Sir Andrew Witty Chief Executive Officer
GSK Annual Report 2013 5

Strategic report Business overview
Business overview What we do We are a science-led global healthcare company that researches and develops a broad range of innovative products in three primary areas of pharmaceuticals, vaccines and consumer healthcare
£26.5bn2013 Group turnover (up 1% CER)
Pharmaceuticals Vaccines Consumer Healthcare
Our Pharmaceuticals business develops and makes medicines to treat a broad range of acute and chronic diseases. Our portfolio is made up of both patent-protected and off-patent medicines.
£17.9bnTurnover
67%of Group
Sales by therapy area
£m
Respiratory 7,516
Anti-virals 667
Central nervous system 1,483
Cardiovascular and urogenital 2,239
Metabolic 174
Anti-bacterials 1,239
Oncology and emesis 969
Dermatology 770
Rare diseases 495
Immuno-inflammation 161
ViiV Healthcare (HIV) 1,386
Other 799
Read more on page 60
Our Vaccines business is one of the largest in the world, producing paediatric and adult vaccines against a range of infectious diseases. In 2013, we distributed more than 860 million doses to 170 countries, of which over 80% were supplied to developing countries.
£3.4bnTurnover
13%of Group
Sales by category
£m
Paediatric vaccines 1,916Includes vaccines against: polio, diphtheria, tetanus, pertussis, measles, mumps, rubella, meningitis C, chicken pox, pneumococcal disease and rotavirus infection
Adolescent, adult and travel 1,504Includes vaccines against: flu (pandemic and seasonal), human papilloma virus (cervical cancer), hepatitis A and B, typhoid, meningitis A,C,W,Y, and booster vaccines against diphtheria, tetanus, pertussis and polio
Read more on page 61
We develop and market a range of consumer healthcare products based on scientific innovation. We have brands in four main categories: Total Wellness, Oral Care, Nutrition and Skin Health. These include a number of well-known brands such as Sensodyne, Panadol and Horlicks.
£5.2bnTurnover
20%of Group
Sales by category
£m
Total Wellness 1,935
Oral Care 1,884
Nutrition 1,096
Skin Health 272
Read more on page 62
6 GSK Annual Report 2013

99,451Employees
Our global reachWe have a significant global commercial presence in more than 150 markets, a network of 86 manufacturing sites in 36 countries and large R&D centres in the UK, USA, Spain, Belgium and China.
We have reshaped our business over recent years to better align to the strategic approach we have had in place since 2008. This has allowed us to better access markets with high-growth potential including those in Asia Pacific, Latin America and Japan.
How we’re structuredWhile we have three primary areas of business, our commercial business is structured as a combination of regional units and areas of focus.
For Pharmaceuticals and Vaccines, we operate in geographical segments that combine these two businesses. Our Consumer Healthcare business functions as a global unit, as does ViiV Healthcare, the specialist HIV company we founded with Pfizer in 2009, joined by Shionogi in 2012.
Other trading turnover includes Canada, Puerto Rico, Australasia, central vaccine tender sales and contract manufacturing sales.
Turnover by segment£bn
US Pharmaceuticals and Vaccines 7.2
Europe Pharmaceuticals and Vaccines 5.2
EMAP Pharmaceuticals and Vaccines 4.7
Japan Pharmaceuticals and Vaccines 1.6
ViiV Healthcare 1.4
Other trading 1.2
Consumer Healthcare 5.2
£3.4bnCore R&D expenditure in 2013
10Potential phase III study starts in 2014/15
R&D Our business is sustained through investment in R&D. In 2013 we spent £3.4 billion before non-core items*, £3.9 billion in total, in our search to develop innovative medicines, vaccines and consumer products.
During the year we saw significant delivery from our late-stage pipeline, with six key medicines approved by regulators in the USA alone.
We have dedicated research programmes for diseases that affect the developing world. We are one of the few healthcare companies researching both new vaccines and new medicines for all three of the World Health Organization’s priority diseases: HIV/AIDS, malaria and tuberculosis.
Core R&D expenditure allocation in 2013
£m %
Pharmaceuticals 2,726 80
Vaccines 496 15
Consumer Healthcare 178 5
Read more on page 36
* The calculation of core results and non-core items is set out on page 65.
Employees by region 2008
USA Europe EMAP Japan Other
21%
45%
26%
3%5%
Employees by region 2013
USA Europe EMAP Japan Other
17%
39%
38%
3% 3%
40%
34%
16%
5% 5%
Turnover by region 2008
USA Europe EMAP Japan Other
33%
28%
25%
7%7%
Turnover by region 2013
USA Europe EMAP Japan Other
GSK Annual Report 2013 7

Strategic report The global context
The global contextOpportunities and challengesDespite continuing macro-economic and market challenges around the world, there remains a significant need for medicines and healthcare treatments.
£219bn sales in 2013
Global economic overviewGlobal economic growth for 2013 continued to be affected by the fallout from the international financial crisis that began in 2008. At 3%, performance was slower than the 3.5% originally predicted by the International Monetary Fund (IMF), and also just below growth in the preceding year of 3.1%.
In the USA, the economy grew at an annual rate of 1.9%. Indicators suggest an underlying recovery, supported by a rebound in the housing market and a continued fall in the unemployment rate, from a peak of 10% in 2009 to 6.7% by the end of 2013. Despite earlier announcements, the Federal Reserve held off tapering its quantitative easing measures in the year.
In the Eurozone the economy remained weak, unemployment high and labour markets depressed. Growth for the year was -0.4%. The stringent fiscal reforms introduced in a number of Eurozone countries caused social and political tensions.
In Japan, the government’s fiscal stimulus and monetary easing to support private consumption and investment appears to be having an effect. The economy grew 1.7% during the year.
Performance of emerging markets and other regions was highly variable. In China, growth remained stable at 7.7%, with much of this growth coming in the second half of the year from inward investment. India grew at 4.4%. Growth was subdued in the economies of the Middle East and North Africa, Latin America and Russia compared with 2012. Many currencies were put under pressure by the US Federal Reserve’s tapering announcements in May 2013.
Based on IMF assessments, the outlook for global economic growth in 2014 is 3.7%, with the highest rates likely to be seen in the developing economies of India, other Asian regions and sub-Saharan Africa (see Figure 1). Factors such as political turbulence within the European Union and instability in the Middle East are likely to continue to affect the international business environment.
The global healthcare marketSales in the world pharmaceutical market rose slightly to £511 billion (CER) in the year to September 2013, from £499 billion in the previous year, according to the industry information company IMS.
Emerging markets and Asia Pacific saw the largest sales growth at 10%, pushing the proportion of total sales from this region up to 22% for 2013. Sales from Europe were largely unchanged, at 24% of the total. North American pharmaceutical sales were £219 billion, representing 43% of the market.
The top therapeutic classes by sales were unchanged in terms of positioning. Oncology/immunomodulatory represented 16% of total sales (10% growth), central nervous system had 15% (a decline of 1%), while other areas also had declines (see Figure 2).
The IMS Institute for Healthcare Informatics predicts that annual spend on prescription medicines will grow slowly – between 1-4% – in North America, Europe and Japan, whereas spending in emerging nations will grow 10-13% overall as a result of economic expansion and population changes in these markets.
Population growth and evolving lifestylesPopulation growth, increasing prosperity in emerging markets, global changes in lifestyle and governments’ responses to these dynamics are all likely to expand the need for medicines and other healthcare products in the future.
The United Nations forecasts that the global population will reach 9.6 billion in 2050 compared with 7.2 billion in 2013. While birth rates decline in Europe and Japan, this is likely to be offset by the sharp rise in populations elsewhere, particularly in the Middle East and southern Asia.
Regional pharmaceutical market sales
USAUS sales were steady in 2013. This was partly a result of patent expiries on blockbuster medicines. However, the North American region still remains the top pharmaceutical market by total sales.
2012 2013 2014 2015
World output Advanced economies Emerging market and developing countries
Source: WEO Update, January 2014 (IMF)
4
2
5
1
3
6
Figure 1: Current and predicted growth rates (%)
0
£511bnTotal global pharmaceutical market sales
Source: IMS data 2013
8 GSK Annual Report 2013

EMAPEmerging markets continue to grow quickly with sales up 10% in 2013. Sales in these diverse areas are predicted to continue to grow strongly.
EuropeOverall performance was better in Europe than in 2012, with sales up approximately 1%. Austerity measures and fiscal issues in many countries are the main drivers for continued slow growth in the region.
JapanWhile mandatory price cuts of 5-6% have been imposed in alternate years, sales in Japan saw approximately 2% growth in 2013 and the market continues to be supportive of new medicines.
£55bn sales in 2013
£124bn sales in 2013
£113bn sales in 2013
People are also living longer, partly as a result of medical advances like vaccination that have prevented or treated diseases that previously caused a significant number of deaths. As people live longer, they are more likely to develop diseases of ageing, leading to greater demand for medical treatments.
Countries with rising populations are many of the same economies that are experiencing improved economic outlooks. As prosperity increases, we have seen trends towards more sedentary lifestyles, increased consumption of food, alcohol and tobacco and a corresponding rise in chronic, non-communicable diseases (NCDs) such as type 2 diabetes and heart disease. These diseases already disproportionately affect low and middle-income countries, where nearly 80% of deaths from NCDs occur. In 2008, the WHO projected a global increase in deaths from NCDs of 17% by 2018, with the greatest increase in the African (27%) and the Eastern Mediterranean regions (25%).
Governments around the globe are under pressure to improve healthcare provision. Where a strong healthcare infrastructure is absent, people often purchase medicines themselves, and households in developing countries spend a greater proportion of their income on healthcare than their counterparts in more developed markets. A recent Pharma Futures report estimates these out-of-pocket costs can be as high as 40% in China and India, and 25% in Brazil.
Economic growth in emerging markets is likely to be mirrored by increased spending on healthcare from both governments and individuals. Demand for medicines, vaccines and consumer healthcare products is expected to continue to grow significantly faster in these regions than in more mature markets over the next few years.
A number of non-governmental organisations and the World Health Organization, are leading efforts to support regions and countries in prioritising and introducing wider healthcare provision. There is a particular emphasis on infant immunisations, which ultimately have the potential to prevent millions of deaths (see Figure 3 on page 10).
Price controls and regulatory pressuresThe prescription medicines and vaccines industry is highly regulated. Individual governments have overall responsibility for determining which products can be marketed in their countries and in many cases, through state-regulated systems, how these products are priced.
The wide variations in regional and country-specific laws around regulations of medicines can present challenges to the availability of new products in different markets. As many governments have been seeking to control costs and reduce spending, national healthcare budgets – particularly the proportion spent on medicines – have been squeezed.
Figure 2: Total global sales of medicines by therapeutic classes (%)
Oncology/Immunomodulatory (9.5%) Central Nervous System (-1.0%) Alimentary Tract and Metabolic (6.5%) Cardiovascular System (-6.8%) Respiratory System (-2.3%)
15.8%
6.6%
14.8%
12.0%
12.3%
(% growth of global sales at CER)
All other therapy areas combined38.5%
Reference: IMS data 2013 Data does not include vaccines sales.
GSK Annual Report 2013 9

Strategic report The global context
The global contextcontinued
Figure 3: The best chance for childhoodAccording to the World Health Organization (WHO), a wide range of vaccines are available for, or contribute to, the prevention and control of 25 vaccine-preventable infections. As birth rates rise in developing countries, there is a tremendous opportunity to offer children protection from the many infections common in childhood and preventable by these vaccines. In its Global Vaccine Action Plan from 2011-2020, the WHO predicts that widening access to vaccines could prevent between 24.6 – 25.8 million deaths by the end of the decade.
The expedited review process was introduced by the US Food and Drug Administration in 2012 as a way of speeding up the availability of medicines intended to treat serious or life-threatening conditions. A recent review found it had reduced the number of years required for clinical testing. Candidate medicines with ‘breakthrough therapy’ designation had an average of 5.1 years of clinical testing before being approved, compared with 7.5 years for those that underwent a standard review.
5yrsFigure 4: Expedited development
USAThe US regulatory agency, the Food and Drug Administration (FDA), approved 27 new molecular entities in 2013, down from 39 in 2012. Many of these approvals marked the first approval of the medicine in any market. A number of experimental medicines had their development and review expedited under the ‘breakthrough therapy designation’ programme, as a result of the 2012 Safety and Innovation Act. This Act was designed to speed up the approvals process for medicines intended to treat serious or life threatening conditions, and is enabling medicines to reach patients sooner (see Figure 4 Expedited development).
In the USA, there are no government price controls on private sector purchases. However, pharmaceutical manufacturers are required by federal law to provide rebates to the government on certain medicines in order to qualify for reimbursement under various healthcare programmes. These rebates are shared between the states and the federal government to offset the overall cost of prescription drugs provided through the Medicaid insurance programme for low-income Americans. Rebates were increased and expanded through the Affordable Care Act (ACA). Although the increase means additional costs for pharmaceutical manufacturers, it is also allowing Medicaid to provide greater access for patients to prescription medicines.
This expansion of the Medicaid programme, together with new health insurance marketplaces and a financial penalty for certain Americans who choose not to purchase insurance, which launched on 1 January 2014, caused a great deal of uncertainty in the insurance market through 2013.
Europe
The European Medicines Agency (EMA), which regulates new medicines for the European Union, approved 38 medicines containing new active substances in 2013. This compared with the 35 novel medicines approved in 2012. Europe also had the first two approvals for biosimilar monoclonal antibodies (mAbs).
The Pharmacovigilance Risk Assessment Committee (PRAC), introduced as part of the revised EU pharmacovigilance legislation, completed its first year of operation in 2013 and led to an increase in the amount of information available to the public about regulators’ scrutiny of the safety of medicines.
For both industry and regulators this legislation created new resourcing needs, as the requirements around monitoring, reporting and managing of safety issues expanded.
The year saw further debate on EU proposals to improve the regulations around conducting clinical trials, with the aim of boosting clinical research in EU member states. The proposals are nearing finalisation and could simplify clincial trials processes in Europe when they come into effect in 2016.
Austerity programmes and restricted budgets continued to create challenges for healthcare systems across Europe. In most countries, the pressure on drug prices remained high and governments used a range of cost containment measures, such as International Reference Pricing, to squeeze efficiencies out of drug budgets.
Overall, access for patients to treatments remains variable. Increasing use of managed entry schemes for launching new products, significant reforms of pricing systems (eg in France, UK and Sweden) and industry-wide stability agreements to manage the entire drugs budget have all helped to some extent. Furthermore, in some countries, policies have been implemented to reduce shortages of medicines, while in others, patients have seen their payments for prescription products increase.
Japan The Japanese regulator, the Pharmaceutical and Medical Device Agency (PMDA), approved 17 medicines containing new active ingredients in the six months from April to September 2013.
In April 2013, the PMDA produced a roadmap outlining its desire to further strengthen partnerships with foreign regulatory agencies including the FDA, the EMA and agencies in Asia. This heightened spirit of co-operation should speed up regulatory approvals, improve the quality of safety measures, as well as improve the quality and quantity of research and the speed at which information can be shared globally.
The government in Japan continues to progress a number of additional initiatives that are likely to affect the prescriptions medicine industry. These include the goal of having 60% of all prescriptions filled by generic medicines by March 2018, and the introduction of health technology assessments for evaluating pharmaceuticals and medical devices.
10 GSK Annual Report 2013

Emerging marketsAcross emerging markets, prescription medicines are regulated in a variety of ways in different countries. For the industry, this can present significant challenges, such as a requirement for additional market-specific documentation. For example, markets such as China, India, Russia, Vietnam and Nigeria now require local clinical data in order to meet regulatory requirements.
Marketing authorisation application (MAA) requirements continue to evolve in the emerging markets to align more closely with those in Europe, the USA and Japan, in terms of both format and content.
Many governments in the region, including Indonesia, China and India, are looking to expand the population covered by the government-funded health schemes. This could increase the opportunities for high- volume tenders but also impact pricing.
Although the specific tools and methods each country implements to control health spending varies, governments everywhere continue to seek ways to manage healthcare spending, including spending on medicines.
In many of the larger emerging markets, such as Brazil, Russia, China and India, governments are attempting to manage costs through pricing controls. In several markets, the authorities are looking for ways to control or help manage the out-of-pocket spending by patients themselves. For example, India is introducing price controls on both patented and non-patented products. International reference prices remains a frequent approach to reducing pricing in countries like Turkey, Brazil and Australia. China and Russia are also expected to introduce this soon. Other trends in the emerging markets include protectionist policies that favour local or domestic suppliers.
Intellectual property and patent protection The journey from scientific breakthrough to approved new medicine or vaccine takes many years and can incur significant costs. To ensure a reasonable reward for this expertise and investment, research-based pharmaceutical companies rely on the protection of their intellectual property via patents, trademarks, regulatory data protection, registered designs, copyrights and domain name registrations.
Patents generally have a 20-year term from filing but, because of the long development time for medicines, patent life is significantly eroded before launch. In some countries, some of the lost time can be restored. Sometimes, patents may be challenged before they expire. Courts may determine that a patent is invalid, non-infringed or unenforceable, leading to the loss of protection on that innovation in that legal jurisdiction. (Significant litigation for GSK is summarised in Note 44 to the Financial statements, ‘Legal proceedings’.)
We operate in markets where intellectual property rights, particularly patents and data protection, are less enforceable as governments seek to control prices and increase access to medicines for their population by limiting such rights.
Cutting red tape New European proposals to cut clinical trial regulation could simplify R&D requirements in EU member states
ReferencesFig 3 – GVAP plan: http://www.who.int/immunization/global_vaccine_action_plan/DoV_GVAP_2012_2020/en/index.html
Fig 4 – FDA review process/approvals: http://www.reuters.com/article/2013/10/29/us-usa-fda-jama-idUSBRE99R12920131029
Countries such as India, Brazil and Argentina have introduced or are considering practices that may restrict the grant of patents for certain types of inventions that are commonly available in developed countries. There are also indications that some countries are considering more widespread use of compulsory licensing, where essentially, an individual or company seeking to use another’s patents can do so without seeking the rights holder’s consent, and pays the patent owner a set – usually low – fee for the license.
When patents expire on medicines, these medicines can be subject to competition from generic products. The effect of this is particularly acute in Western markets, where generic products can rapidly capture a large share of the market. As generic manufacturers typically do not incur significant costs for R&D, they are able to offer their products at considerably lower prices than branded competitors.
The same pressures for generic competition do not apply as significantly to vaccines and other biological products, or to products where patents exist on both active ingredients and the delivery device. In emerging markets, a known heritage or brand for existing medicines – whether on patent or not – is also valued by patients.
Consumer healthcareThe development timelines for consumer healthcare products are significantly shorter and the intellectual property protections are not the same as for prescription medicines. However, consumer healthcare products are also subject to national regulation comparable for the testing, approval, manufacturing, labelling and marketing of products. High standards of technical appraisal frequently involve a lengthy review and approval process, which can cause delay to our product launches.
Consumer healthcare products also have a greater reliance on brand loyalty and trademark protection to create value across all markets, not just those in developing countries. This market is becoming more challenging. Retailers have consolidated and globalised, which is strengthening their negotiating powers.
CompetitionOur main consumer healthcare competitors include Colgate-Palmolive, Johnson & Johnson, Procter & Gamble, Reckitt Benckiser, Unilever, Pfizer and Novartis.
Competition for our prescription products comes from other companies researching and making patent-protected medicines with indications to treat similar diseases to our medicines. Our principal research-based pharmaceutical and vaccines competitors include AbbVie, Amgen, AstraZeneca, Bayer, Bristol-Myers Squibb, Eli Lilly, Johnson & Johnson, Merck & Co, Novartis, NovoNordisk, Pfizer, Roche Holdings, Sanofi and Takeda.
In addition, many other locally-operating companies compete with GSK in certain markets.
GSK Annual Report 2013 11

Strategic report Our business model
Our business modelHow we create valueWe continute to adapt our business model to deliver sustainable performance through innovation and expanding access
Our missionWe have a challenging and inspiring mission: to improve the quality of human life by enabling people to do more, feel better, live longer. This mission gives us the purpose to develop innovative medicines and products and make them available to as many people who need them as possible.
Our mission is underpinned by a number of key factors:
Our valuesWe put our values of patient focus, transparency, integrity and respect for people at the heart of every decision we make. We are focused on integrating these values into our culture, decision-making and how we work. As well as meeting the quality and policy controls required of us, we continue to review and challenge our practices to ensure that our actions meet or exceed the expectations of society.
See Responsible Business on page 50
Our people Our people are critical to our ability to achieve our mission. We rely on their knowledge, expertise and ability to innovate. Every employee is asked to perform with ethical integrity. We strive to create a workplace culture where employees feel valued and able to take ownership of their professional development and maximise their potential.
See Responsible Business on page 50
Our strategic prioritiesOur three strategic priorities are to grow a diversified global business, deliver more products of value and simplify our operating model. These have been in place since 2008 and are designed to help us produce sustainable growth and improved operational and financial performance. We have reshaped our business to better align to this strategic approach and we are now a substantially different company in terms of geography, products and capabilities than we were five years ago.
See Strategic Priorities on page 14
Our insightsWe continuously investigate the needs of patients and consumers. This understanding helps us ensure our medicines and products meet the requirements of those they are intended for while also addressing the specific needs of the markets where we make them available.
Our business modelWe have a broadly based and balanced business across pharmaceuticals, vaccines and consumer healthcare. At the core of our business model are the concepts of innovation and access. We create value by researching and manufacturing innovative products and making these accessible to as many people who need them as possible.
Improving healthcare and making it affordable and accessible to more people is a huge challenge, and one that requires a combined effort.
ManufacturingMaking and shipping high standard products around the world
Commercialisation and distributionIncreasing access to our products
R&DDiscovering and developing innovative medicines
OutputsOur business model
Benefits to patients and customers
Cash and profit generation
Shareholder value and returns
Wider benefits to society
Our mission
To improve the quality of human life by enabling people to do more, feel better, live longer.
Underpinned by
Our values
Our people
Our strategic priorities
Our insights
Reinvestment
12 GSK Annual Report 2013

To meet this challenge, everyone involved – industry, healthcare professionals, universities, healthcare funders including governments, charities and regulators – need to work together. With this in mind, partnership and collaboration is a key principle of our business approach.
We continue to reform our business model. For example, we have taken industry-leading positions to improve global public health through our pricing and access strategies, increase transparency of our clinical trial data, and modernise our commercial practices and interactions with customers.
R&DDiscovering and developing new medicines is a long, expensive and uncertain process that requires us to be highly selective in where we invest our resources. Our primary goal in R&D is to develop innovative new medicines that offer significant improvements over existing treatments and so we focus our efforts on areas where the science presents new opportunities most likely to lead to significant medical advances.
As a large research-based company, we have significant scale, resource and expertise that we can bring to the search for new medicines. In recent years we have challenged the traditional hierarchical R&D business model by creating smaller, more agile and accountable early-stage R&D groups. These groups are tasked with seeking out the biological targets involved in disease and creating the molecules or biopharmaceuticals that will ultimately become new medicines.
We have also increased the work we do alongside external partners, capturing the scientific diversity that exists across academia, research charities and within other companies and sharing the inherent risks of R&D.
In the process of our research, we grow knowledge and expertise and create intellectual property. Our business model ultimately relies on an environment that appropriately protects this intellectual property and provides us with an opportunity to earn a reasonable return on our R&D investment.
See Deliver section on page 32
ManufacturingOur ability to consistently produce high quality products and distribute them through our global network is a key part of our business model. Our extensive manufacturing organisation and supply chain makes and distributes our products to over 150 countries around the world.
See Simplify section on page 44
Commercialisation and distributionOur commercial success depends on market presence and customer understanding. With our focus on expanding access, we seek to make our products as widely accessible as possible to countries at all levels of income and development.
A GSK presence in a market is frequently a requirement before a medicine can be made available, so our wide geographical spread helps with this. In addition, this allows us to understand the unique characteristics of each marketplace and adapt our business model to address specific healthcare needs and requirements.
We have taken a strategic decision to introduce more flexible approaches to pricing that reflect a country’s wealth and ability to pay. In the poorest countries, this has included capping prices at 25% of developed market levels, and forming alliances with non- governmental organisations to reduce prices through high-volume contracts.
In developed markets, we have pioneered novel reimbursement approaches to widen access to our newer medicines and priced these at or below current treatments.
See Grow section on page 20
OutputsDelivering innovation and maximising access to our products generates value for patients, shareholders, and society more widely.
Our primary contribution is to make products that provide benefits to patients and consumers.
Successful delivery of this generates profitable and sustainable performance. In turn, this allows us to generate value and returns for our shareholders and enables us to reinvest in the business.
We also create value by making direct and indirect economic and social contributions in the countries where we operate. These wider benefits to society include contributions through tax, employment and enhancing the well-being of local communities through our global community initiatives.
GSK Annual Report 2013 13

Growa diversified business
We have been creating a more balanced business and product portfolio, capable of delivering sustainable sales growth. This is centred on our three business areas of Pharmaceuticals, Vaccines and Consumer Healthcare.
Total sales grew 1% to £26.5 billion in 2013 (3% excluding divestments).
Performance was generated from multiple businesses and geographies reflecting successful implementation of the strategy.
Delivermore products of value
We have changed our R&D organisation so that it is better able to sustain a pipeline of products that offer valuable improvements in treatment for patients and healthcare providers.
This is underpinned by a focus on improving productivity and rates of return in R&D.
During 2013, we received approvals for six major new products and several new indications for existing medicines and vaccines.
We also generated a high volume of phase III data on key assets in our pipeline.
Our estimated return on R&D investment increased to 13%.
Strategic report Our strategic priorities
Our aim Our progress
Our strategic prioritiesHow we deliverOur strategy is designed to deliver sustainable growth, reduce risk and improve long-term financial performance and returns to shareholders
Simplifythe operating model
As our business continues to change shape, we are transforming how we operate so that we can reduce complexity and become more efficient.
This frees up resources to reinvest elsewhere in the business.
We have several restructuring programmes which are on track to deliver total annual savings of £3.9 billion by 2016 compared with 2007. During 2013 we delivered incremental savings of £400 million.
We are also making good progress transforming our manufacturing network, supply chain and enterprise wide processes.
Responsiblebusiness
In 2013 we have made considerable further progress on our agenda to operate responsibly.
Specifically, we took action to increase transparency of clinical research data and modernise our commercial operations and interactions with customers.
We also made progress on driving access to medicines in the poorest countries and passed a key milestone in the development of a potential vaccine against malaria.
Being a responsible business is central to our strategy, and how we deliver success is just as important as what we achieve. Ensuring our values are embedded in our culture and decision-making helps us better meet the expectations of society.
14 GSK Annual Report 2013

•Successfullaunchandcommercialisation of new products from our pipeline
•Continuetoinvestinkey growth businesses including Emerging Markets, Vaccines and Consumer Healthcare
•Lookforfurtheropportunitiesto increase focus and optimise value of our product portfolio
£26.5bnGroup turnover
39%Group turnover outside USA and Europe
Read more on page 20
6Significant new product approvals in 2013
40Potential medicines in phase II/III development
•DeliveryofphaseIIIdatafor six potential new medicines and vaccines and around 10 NME phase III starts across 2014/2015
•ContinuedfocusonincreasingR&D rate of return
Read more on page 32
Our prioritiesHighlights
£400mIncremental savings in 2013
10Days reduction in working capital
Read more on page 44
•Furthercostsavingsdeliveryfrom our restructuring programmes
•Furtherroll-outofstandardisedenterprise platforms and delivery of an integrated supply chain
60%Increase in the volume of medicines supplied to Least Developed Countries since 2010
1stPharmaceutical company to sign AllTrials campaign for research transparency
Read more on page 50
•FileourRTS,Smalariavaccinecandidate for approval in 2014 and, if approved, offer at a not-for-profit price
• Implementchangesonhowwe incentivise our sales teams and work with healthcare professionals
Financial architecture Our financial architecture is designed to support the delivery of our strategy and to enhance returns to shareholders. It is focused on four key priorities: delivering sustainable sales growth, improving operating leverage, improving financial efficiency and converting more of our earnings into cash.
By applying this architecture consistently, we are driving better and more consistent decision making across the company and improving delivery of our key financial objectives of earnings per share growth and free cash flow generation, which can then be returned to shareholders or reinvested in bolt-on acquisitions, wherever the most attractive returns are available.
Implementing this financial architecture helped us to return £5.2 billion to shareholders through dividends and buy-backs in 2013.
Outlook For 2014, we are targeting core earnings per share growth of 4-8% CER (from 2013 base of 108.4p adjusted for divestments completed during 2013) on sales growth of around 2% CER (from 2013 base of £25,602 million adjusted for divestments completed during 2013).
The range in our guidance reflects the transition we expect to see in our portfolio during the year as we roll-out new products but also face potential competition from generics to older products such as Lovaza.
GSK Annual Report 2013 15

Strategic report How we performed
How we performedKey indicatorsWe measure our performance against a number of key indicators and the remuneration of our executives is based on many of these
£26.5bnGroup turnover
112.2pCore earnings per sharea
112.5pTotal earnings per share
£5.2bnCash returned to shareholders
£8.0bnCore operating profit and margina
12
10
8
6
4
2
0
How we performed Core operating profit was £8.0 billion. Core operating margin declined 1.0 percentage point to 30.2%, reflecting expected increases in cost of sales partially offset by higher royalty income and lower R&D expenditure.
Why it’s important Our objective remains to improve operating leverage. The margin indicates how costs are being managed as sales grow.
£7.0bnTotal operating profit and margin
2011
(6)
31.9%
(4) –
(3)(6)
2012 2013
31.2% 30.2%
Reported growth CER %
Reported growth £ %
6
5
4
3
2
1
0
How we performed During 2013, GSK returned £5.2 billion to shareholders via dividends and share buy-backs.
Why it’s important We continue to focus on delivering dividend growth and returning free cash flow to shareholders through share buy-backs where this offers a more attractive return than alternative investments.
2011
75 13 (18)
2012 2013
Reported growth £ %
150
125
100
75
50
25
0
How we performed Non-core items included gains on the disposal of the Group’s Lucozade and Ribena business and the anti-coagulant products of £1,331 million. The impact of non-core items in the year largely offset each other.
2011
>100
>100
27
23
2012 2013
Reported growth CER %
Reported growth £ %150
125
100
75
50
25
0
How we performed Effective cost control and delivery of financial efficiencies enabled the Group to deliver core EPS of 112.2p, an increase of 4% (CER).
Why it’s important Earnings per share show the portion of our profit allocated to each share. It is a key indicator of our performance and the returns we are generating for shareholders.2011
(7) –
(3) 1
2012 2013
Reported growth CER %
Reported growth £ %
4
(8)
8.7
114.5111.4 112.2 103.6
91.6
112.5
12
10
8
6
4
2
0
How we performed Total operating profit was £7.0 billion. Total operating margin declined 1.1 percentage points to 26.5%, reflecting expected increases in cost of sales partially offset by higher royalty income and lower R&D expenditure.
2011
>100 (3)
(6)
(1)
(4)
2012 2013
28.2% 27.6%26.5%
Reported growth CER %
Reported growth £ %
7.7 7.3 7.0
8.2 8.0
Div
iden
dB
uy-
back
s
Buy
-ba
cks
Div
iden
d
Div
iden
d
5.6
6.3
5.2
3.8 3.7
2.530
25
20
15
10
5
0
How we performed Turnover was up 1%, and up 3% adjusting for disposals in the prior year. This was driven by growth in the USA, Japan and EMAP.
Why it’s important A key objective of our strategy is to deliver sustainable, broadly-sourced sales growth.
2011
(3)
(4)
(1)
(3)
1
–
2012 2013
Reported growth CER %
Reported growth £ %
27.426.4 26.5
(7) >100
(9)
(12)
Buy
-ba
cks
3.4
2.21.5
16 GSK Annual Report 2013
a We use a number of adjusted measures to report the performance of our business. These include core results, which are used by management for planning and reporting purposes and may not be directly comparable with similarly described measures used by other companies. Core results exclude a number of items from total results. A full definition of core results can be found on page 58 and a reconciliation between core results and total results is provided on page 65.
b The remuneration of our executives is linked to the marked key indicators. Further information on our executive pay policy can be found in our Remuneration report on page 96.
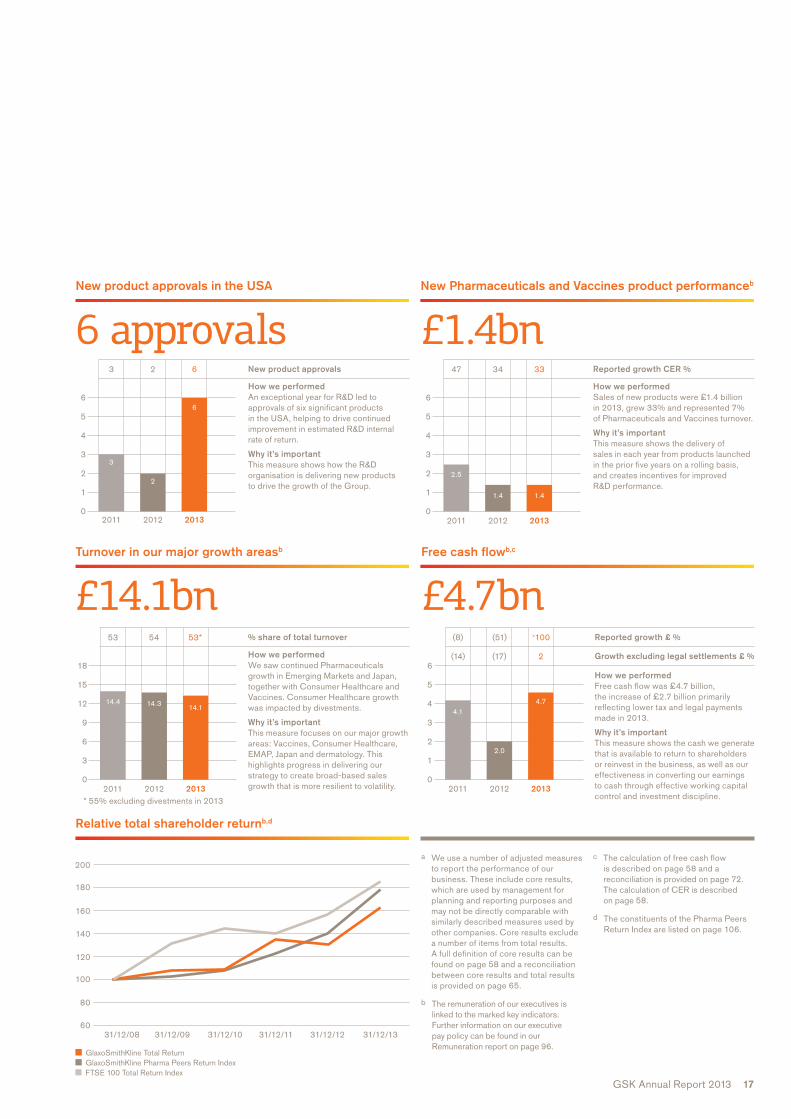
£4.7bnFree cash flowb,c
£14.1bnTurnover in our major growth areasb
£1.4bnNew Pharmaceuticals and Vaccines product performanceb
18
6
15
5
12
4
9
3
6
2
3
1
0
0
How we performed We saw continued Pharmaceuticals growth in Emerging Markets and Japan, together with Consumer Healthcare and Vaccines. Consumer Healthcare growth was impacted by divestments.
Why it’s important This measure focuses on our major growth areas: Vaccines, Consumer Healthcare, EMAP, Japan and dermatology. This highlights progress in delivering our strategy to create broad-based sales growth that is more resilient to volatility.
How we performed Sales of new products were £1.4 billion in 2013, grew 33% and represented 7% of Pharmaceuticals and Vaccines turnover.
Why it’s important This measure shows the delivery of sales in each year from products launched in the prior five years on a rolling basis, and creates incentives for improved R&D performance.
2011
2011
53
47
54
34
53*
33
2012
2012
2013
2013
% share of total turnover
Reported growth CER %
6
5
4
3
2
1
0
How we performed Free cash flow was £4.7 billion, the increase of £2.7 billion primarily reflecting lower tax and legal payments made in 2013.
Why it’s important This measure shows the cash we generate that is available to return to shareholders or reinvest in the business, as well as our effectiveness in converting our earnings to cash through effective working capital control and investment discipline.
2011
(8) (51)
(17)
>100
2
2012 2013
Reported growth £ %
Growth excluding legal settlements £ %
4.1
2.0
4.714.4 14.3 14.1
2.5
1.4 1.4
(14)
Relative total shareholder returnb,d
200
180
160
140
120
100
80
31/12/08 31/12/09 31/12/10 31/12/11 31/12/12 31/12/1360
GlaxoSmithKline Total Return GlaxoSmithKline Pharma Peers Return Index FTSE 100 Total Return Index
c The calculation of free cash flow is described on page 58 and a reconciliation is provided on page 72. The calculation of CER is described on page 58.
d The constituents of the Pharma Peers Return Index are listed on page 106.
6 approvalsNew product approvals in the USA
6
5
4
3
2
1
0
How we performed An exceptional year for R&D led to approvals of six significant products in the USA, helping to drive continued improvement in estimated R&D internal rate of return.
Why it’s important This measure shows how the R&D organisation is delivering new products to drive the growth of the Group.
2011
3 2 6
2012 2013
New product approvals
3
2
6
* 55% excluding divestments in 2013
GSK Annual Report 2013 17

Strategic report Risk management
Risk managementOur approach to riskWe have rigorous processes and systems in place to help assure the integrity of our business operations which include how we identify and manage the risks that could impact our business
The management of risk is an important factor in the long-term success of our business and is a key focus of our Board and senior management. Sound risk management helps us address the inherent risks in our business while creating value for shareholders, protecting company assets and maintaining our focus on the fundamentals of product quality, safety and sustainability.
Our aim is to identify, assess and manage risk at all levels of the organisation. Employees are expected to take accountability for identifying and escalating encountered risks so that they can be appropriately managed. Our risk management hierarchy is focused on making such escalation simple, rapid and transparent. This approach allows us to balance our level and type of risk exposure with our ability to pursue our strategic priorities.
The hierarchy of our risk management governance is shown in Figure 1. The diagram summarises the linked roles, responsibilities and relationships between different oversight and management groups. Figure 2 provides a representation of the process and framework around risk management.
We are committed to conducting business in accordance with all applicable laws and regulations. Our established company policies, standards and internal controls, together with our company values, underpin our approach to risk management.
Global risk managementThe Board is responsible for ensuring that risks that could adversely impact the company are appropriately managed, with the oversight of this managed through the Audit and Risk Committee (ARC). The ARC will take a holistic view, looking at our financial results and controls, the operations or our businesses and their management of risk, as well as considering new emerging risks. (Further information on the Board’s responsibilities is included in the Corporate Governance section, see page 82.)
While the Board and ARC set the direction of our risk management and policies, it is our Corporate Executive Team (CET) that has responsibility for identifying, approving, monitoring and enforcing key policies concerning risks and controls that determine how the Group conducts its business.
Figure 1: Governance structure of risk management
Audit & Risk Committee
Responsible for reviewing and approving the adequacy and effectiveness of our risk management and internal controls
Board ofDirectors
Responsible for our system of corporate governance, strategy, risk management and financial performance
Risk Oversight and Compliance Council
Authorised by the Board to assist the Audit & Risk Committee in overseeing the risk management and internal control activities of the Group
Corporate Executive Team
Supports the CEO in managing our business and activities
Risk Management and Compliance Boards
Ensure that appropriate internal controls for effective risk management are implemented
Business units Responsible for identifying, assessing and managing risks within their business
Acc
ount
abili
ty fo
r m
onito
ring
Res
pons
ibili
ty fo
r im
plem
entin
g
Independent Business Monitoring
Independent Assurance
Risk
Management
Dis
cipl
ine
and
Enfo
rcem
ent Written
Standards
& Controls
Trai
ning
Communicatio
nManagementMonitoring
Responding
to Problem
s
Enterprise Oversight
GSK Values
Business Activities
Key Individual Accountability Line Management Accountability with Compliance Business Management Accountability with Compliance Audit & Assurance
Our internal control framework, in conjunction with our values, helps to ensure that we effectively manage risks as we conduct our business activities.
We are subject to inspections and audits conducted by external parties, including regulatory agencies, to assess the adequacy of our internal control framework. We actively address findings from these activities and take appropriate corrective actions to improve our internal controls across the Group.
Figure 1: Governance structure of risk management
Figure 2: Our control framework
18 GSK Annual Report 2013

Tax and treasuryFailure to comply with tax law or significant losses due to treasury activities.
Crisis and continuity managementInability to recover and sustain critical operations following a disruption or to respond to a crisis incident in a timely manner regardless of cause.
Financial reporting and disclosureNon-compliance with financial reporting and disclosure requirements or changes to the recognition of income and expenses.
Information protectionRisk to the Group’s business activity if critical or sensitive computer systems or information are not available when needed, are accessed by those not authorised, or are deliberately changed or corrupted.
Intellectual propertyFailure to appropriately secure and protect intellectual property rights.
Supply chain continuityFailure to deliver a continuous supply of compliant finished product.
Product qualityFailure to ensure product quality throughout manufacturing and distribution processes resulting in non-compliance with good manufacturing practice (GMP) and regulations.
Environment, health and safety and sustainabilityFailure to ethically manage environment, health and safety and sustainability consistent with company objectives, policies and relevant laws and regulations.
Principal risks
Each year, CET reviews the risks facing the Group and agrees a list of the most significant risks – referred to as Principal risks – that require particular attention from a Group perspective including those that could cause our actual results to differ materially from expected and historical results. A summary of our Principal risks is set out below, while a full description of each risk is presented in ‘Risk factors’ on pages 232 to 241.
In addition, CET considers how each of the Principal risks could interact across the company and have a compound impact. Specific accountability is assigned to designated individuals responsible for developing the overall Group approach to those Principal risks identified as having a particular exposure in this regard.
The work of CET and ARC is supported by the Risk Oversight and Compliance Council (ROCC), whose membership comprises senior executives representing the various business units and global support functions making up GSK.
It is the responsibility of ROCC to ensure each area of the business has robust processes in place to identify risks, assign clear accountability, and monitor the effectiveness of internal controls and mitigation plans. Processes are in place to ensure business units and global support functions escalate significant operational compliance issues, internal and external audit results, and investigations to ROCC and then onward to ARC in a timely manner.
We expect our third parties to uphold the same high standards we set for ourselves and establish appropriate governance to help ensure that our expectations are met.
Risk management within the businessOperational day-to-day management of risk rests within the business. We are committed to being a responsible, values-based business and management is responsible for embedding this into our culture, decision making and how we work.
The Principal risks listed below are those we believe could cause our actual results to differ materially from expected and historical results. They are not listed in order of significance. A full description of risk definition, context, potential impact and mitigating activities is set out on pages 232 to 241 in ‘Risk factors’.
Each business unit and global support function maintains a Risk Management and Compliance Board (RMCB). The purpose of the RMCBs is to identify specific operational, legal, and compliance risks that may affect the achievement of business objectives and to help ensure that appropriate internal controls are implemented. The relevant CET members accountable for different parts of the business each present an annual report to ROCC and ARC.
Our Global Risk Officer and Global Ethics and Compliance team are responsible for supporting the effective integration of risk management into our business units and global support functions. Audit & Assurance is responsible for independently assessing the adequacy and effectiveness of the management of risk areas and reporting outcomes to ROCC and ARC. These groups maintain independent reporting lines outside of business management.
Commercial practices and scientific engagementFailure to engage in commercial and/or scientific activities that are consistent with the letter and spirit of legal, industry, or company requirements relating to marketing and communications about our medicines and associated therapeutic areas; appropriate interactions with healthcare professionals (HCPs) and patients; and legitimate and transparent transfer of value.
Research practicesFailure to protect and inform patients involved in human clinical trial research; conduct objective, ethical preclinical and clinical trials using sound scientific principles; guarantee the integrity of discovery, preclinical, and clinical development data; manage human biological samples according to established ethical standards and regulatory expectations; treat animals ethically and practice good animal welfare; appropriately disclose human subject research for medicinal products; and ensure the integrity of our regulatory filings and of the data that we publish.
Patient safetyFailure to appropriately collect, review, follow-up, or report adverse events from all potential sources. This could compromise the Group’s ability to conduct robust safety signal detection and interpretation and to ensure that appropriate decisions are taken with respect to the risk/benefit profile of the Group’s products, including the completeness and accuracy of product labels and the pursuit of additional studies/analyses, as appropriate.
Anti-bribery and corruptionFailure to foster a culture within the company in which bribery and corruption are unacceptable; adopt measures and embed procedures to prevent bribery and corruption by employees, complementary workers and through third party interactions; investigate allegations of bribery and corruption and remediate issues identified; and comply with applicable ABAC legislation.
GSK Annual Report 2013 19

Strategic report Grow
Grow
Progress summary
We continue to pursue our strategy of generating sustained and broadly based sales growth.
Over the past six years we have created a more balanced business and product portfolio, capable of delivering sustainable sales growth.
We believe our positions in Vaccines and Consumer Healthcare and in key Pharmaceutical therapeutic areas including respiratory and HIV provides us with significant competitive advantage and opportunity for synergies.
Regionally we continue to make significant investments in higher-growth markets, for example in Asia-Pacific, Latin America and Japan. We have reshaped our US business to reflect changing market dynamics and to enable the successful launch of the multiple new product approvals we have received over the last year. In Europe we are restructuring to improve efficiencies and focus resources on growth opportunities in what continues to be a challenging environment.
Reported turnover grew 1% in 2013 to £26.5 billion (+3% excluding divestments).
Performance was in line with our guidance despite some unexpected challenges and was generated from multiple businesses and geographies reflecting successful implementation of our strategy.
We saw an encouraging return to growth in our US pharmaceuticals and vaccines business and stabilisation of our European business. Reported pharmaceutical and vaccine sales grew 1% in our Emerging Markets region (+5% excluding China).
Our Consumer Healthcare business also made further progress with sales up 4%, excluding divestments.
During the year we completed the divestment of drinks brands Lucozade and Ribena and two anti-coagulant drugs Arixtra and Fraxiparine. We also formed an Established Products Portfolio of largely non-promoted brands, which will be reported separately from 2014.
Group turnover over 3 years £bn
35
30
25
20
15
10
05
02011 2012 2013
27.4
1%2013 reported growth CER%
3%2013 reported growth CER% excluding divestments
Sales in emerging markets over 3 years £bn
07
06
05
04
03
02
01
02011 2012 2013
6.46.8 6.7 2%
2013 reported growth CER%
25%2013 % of group sales
26.4 26.5
20 GSK Annual Report 2013

Building our business in emerging marketsAs part of our focus on emerging markets, we have invested heavily in Brazil over recent years. The economy there is expanding quickly, and – in terms of healthcare – is now the sixth largest pharmaceutical market in the world.
Pharmaceutical and vaccines sales in our business in Brazil increased by 6% during 2013, contributing to overall growth across the emerging markets region of 5% for the year (excluding China).
As well as expanding sales of our medicines and vaccines in Brazil, we are committed to scientific research in Latin America. Through our ‘Trust in Science’ programme, we collaborate with outstanding scientific groups to explore new ways to treat priority diseases.
During 2013, we also formed a collaboration with the São Paulo Research Foundation to create a new sustainable chemistry centre.
In our photo: A doctor in a hospital in Rio de Janeiro. Brazil has more than 320,000 doctors but also the largest population – over 200 million – in South America. Their public healthcare system offers full coverage for every citizen.
Our prioritiesSuccessful launch and commercialisation of new products from our pipeline is a key priority for 2014.
At the same time, we will continue to invest in our target growth businesses such as Emerging Markets, Vaccines and Consumer Healthcare.
We will continue to look for further opportunities to drive synergies across Pharmaceuticals, Vaccines and Consumer Healthcare, and review our product portfolio to increase focus, reduce complexity and optimise value.
References IMS World Review 2012 Analyst; http://www.abpi.org.uk/industry-info/knowledge-hub/global-industry/Pages/industry-market-.aspx
http://data.worldbank.org/indicator/SH.MED.PHYS.ZS
http://www.kantarhealth.com/docs/ebooks/brazil-the-gem-of-latin-america.pdf
GSK Annual Report 2013 21

Strategic report Grow
MarketplaceThe USA is undergoing perhaps the greatest transformation in its healthcare system for 50 years. Implementation of the Affordable Care Act (ACA), much of which starts in 2014, will mean changes for patients, physicians, payers and the pharmaceutical industry.
There is significant opportunity for all healthcare stakeholders, including government entities, healthcare providers, and private industry, to work together to address the challenges of rising costs, an ageing population and an epidemic of chronic disease. These factors, along with economic uncertainty, are placing greater emphasis on the demand for higher quality care, lower costs and better health outcomes.
PerformanceUS Pharmaceuticals and Vaccines turnover rose 1%, but grew 4% when the impact of the conclusion of the Vesicare co-promotion agreement in Q1 2012 is excluded. Pharmaceuticals turnover was down 1% (up 2% excluding Vesicare) and vaccines turnover grew 17%. Core operating profit was up 3%.
By therapy area there were particularly strong performances in respiratory, oncology and vaccines.
Respiratory sales grew 7%, with Advair up 8% to £2.8 billion. Estimated underlying growth for Advair was 6% with some volume decline offset by a positive impact of price and mix. Flovent sales were up 6% to £482 million in line with estimated underlying growth for the year. Ventolin sales grew 4% to £291 million. The launch of Breo Ellipta began in Q4 2013 with £6 million of sales recorded in the quarter.
Oncology sales grew by 17%, reflecting continued strong growth contributions from Votrient (up 56% to £144 million) and Promacta (up 33% to £73 million), which benefited from a new indication for thrombocytopenia associated with hepatitis C received during Q4 2012. Arzerra sales grew 18% to £46 million. Oncology performance also reflected contributions totalling £21 million from Tafinlar and Mekinist, which were both launched in Q2 2013 as monotherapy treatments and have achieved strong initial uptake in the BRAF V600 melanoma market.
Cardiovascular and urogenital sales fell 16% largely due to the ending of the Vesicare co-promotion agreement in 2012 while Central Nervous System sales declined 15% largely due to generic competition to the Lamictal franchise.
In Vaccines, a sales increase of 17% was primarily the result of increases in Infanrix/Pediarix sales of 23% to £271 million and Boostrix sales of 23% to £183 million, both of which benefited from competitor supply shortages. Fluarix/FluLaval sales were also strong, up 65% to £146 million, following the launch of the Quadrivalent flu formulation in 2013.
Portfolio progressIn the course of 2013, six approvals were received from the FDA: Breo Ellipta and Anoro Ellipta for respiratory disease, Tafinlar and Mekinist for melanoma, and a new injectable quadrivalent flu vaccine, as well as ViiV Healthcare’s Tivicay for HIV. Overall, GSK accounted for 19% of FDA new drug approvals during 2013 and since 2009 we have achieved more approvals by the FDA of new molecular entities (NME) than any other company.
The approvals of Breo Ellipta and Anoro Ellipta add to the strength of our respiratory portfolio. Supplemented by our existing products and a further seven that are in late-stage development, we are confident in our ability to maintain a leadership position in this area well into the next decade.
A number of other products are awaiting review or decisions by the FDA. We have submitted Arzerra as first-line treatment of chronic lymphocytic leukaemia (CLL). We have also submitted an FDA application for albiglutide, for adult patients with type 2 diabetes and filed New Drug Applications (NDAs) for fluticasone furoate for asthma, and umeclidinium bromide (UMEC) for patients with COPD, including chronic bronchitis and emphysema.
Pharmaceuticals and VaccinesUSAOur US business performed well in a dynamic and challenging environment and made very good progress in new product approvals
Breakdown of turnover
£mGrowth CER %
Respiratory 3,655 7Anti-virals 57 (2)Central nervous system 440 (15)Cardiovascular and urogenital 1,244 (16)
Metabolic 4 >100Anti-bacterials 27 30Oncology and emesis 380 17Vaccines 978 17Dermatology 140 (40)Rare diseases 113 (4)Immuno-inflammation 148 >100
Turnover £bn
07
06
05
04
03
02
01
02011 2012 2013
7.0 7.0 7.2 27%% of group turnover
1%Reported growth CER%
08
Operating profit £bn
05
04
03
02
01
02011 2012 2013
4.6 4.8 5.0 £5.0bnOperating profit
3%Reported growth CER%
22 GSK Annual Report 2013

Other developmentsIn September, the FDA published draft guidance on how to establish bioequivalence between inhaled medicines like Advair that contain fluticasone propionate and salmeterol administered through the Diskus and proposed generic versions. We have submitted comments on the draft guidance. The FDA has not identified a date for release of the final guidelines. If any generic applicant were to seek market entry before the lapse of Diskus patent protection in August 2016, it would need to send GSK a paragraph IV certification.
In November, the FDA eased restrictions on patient access to Avandia (rosiglitazone) following an FDA Advisory Committee review of the results from the Rosiglitazone Evaluated for Cardiovascular Outcomes and Regulation of Glycemia in Diabetes (RECORD) clinical trial.
We continue to see significant improvements in customer interactions following the changes we made in 2011 to de-couple the pay from the number of prescriptions issued for our sales representatives.
Following our announcement in December to change the way we interact with healthcare professionals, we will start the process to implement these changes in the USA in 2014 and expect it to be in place across the business by the start of 2016.
As part of our initiatives to support the health and well-being of communities in the markets in which we operate, we invested £221 million in our Patient Assistance programmes in the USA during 2013. These programmes are designed to help underprivileged families in the USA access essential healthcare.
Working with government to provide bioterrorism protection
Anthrax is one of the most likely agents to be used in a bioterrorist attack, and the US Centers for Disease Control and Prevention (CDC) has classified it as a category A biothreat.
Following many years of collaboration with the Biomedical Advanced Research and Development Authority, in 2013 we were awarded a new contract to provide our inhalation anthrax treatment, raxibacumab, to the Department of Health and Human Services (HHS).
We will provide 60,000 doses over four years, at a value of approximately $196 million ($23 million of which were realised in 2013) and are proud to be helping protect US citizens against bioterrorism. This forms part of a broader five-year base contract.
The raxibacumab contract is the latest in a long line of examples of how we work closely with the US government. We are working with the US government and the Texas A&M University System to establish a $91 million biodefence and pandemic influenza-vaccines manufacturing facility in Texas.
In a novel approach to drug development funding, we were awarded up to $200 million in 2013 to develop new antibiotics via a public-private agreement. This marks the first time that HHS has taken a portfolio approach to funding drug development with a private sector company.
Cav
allin
i Jam
es /
BS
IP/S
cien
ce P
hoto
Lib
rary
GSK Annual Report 2013 23

Strategic report Grow
MarketplaceEurope remains a challenging environment as governments continue to implement austerity measures.
France, Germany and the UK all introduced or announced either cuts, freezes or reductions to the medicines budgets in the course of 2013.
In southern Europe, austerity measures have also continued to drive price reductions. However, in October 2013 the Spanish government announced plans to repay most of its €4.1 billion debt to the pharmaceutical industry.
The introduction of Health Technology Assessment (HTA) systems is also impacting the European marketplace. Governments are using HTAs to guide decisions on the allocation of healthcare resources, including expenditure on medicines. Assessment criteria are becoming more challenging around what are viewed as acceptable comparators, incremental benefits against clinical measures, and patient populations.
PerformanceEuropean Pharmaceuticals and Vaccines turnover was £5.2 billion, flat compared with 2012, as the benefits of the recent restructuring and refocusing of the business were offset by continued pricing pressures and generic competition to a number of products.
Pharmaceutical sales were down 1% to £4 billion while Vaccines grew by 3% to £1 billion, largely due to an improved tender performance. Operating profit in Europe rose 3%.
By therapy area, respiratory sales were down 3%, reflecting increased competition in many markets. Seretide sales were down 2% to £1.5 billion, with some volume decrease but no net impact of price and mix. Serevent and Flovent sales were down 17% and 7% respectively.
In oncology, sales grew 28% to £339 million, led by sales of Votrient, which increased by 91% to £130 million, as it continued to build market share in many markets. Revolade received approval for use in thrombocytopenia associated with hepatitis C at the end of Q3 and sales in the year increased by 47% to £55 million. Tafinlar was launched in Q3 2013 in certain markets and has achieved strong uptake in these early launch markets.
Sales of Central Nervous System products fell 11% due to generic competition.
The 3% growth in vaccines sales in 2013 was driven primarily by successful tenders for our rotavirus vaccine Rotarix and Boostrix for diphtheria, tetanus and pertussis. This was supplemented by the launch of our Nimenrix vaccine for various strains of meningitis.
Portfolio progressIn 2013, a number of new products received approval in Europe. These included Relvar Ellipta for asthma and COPD, Tafinlar for advanced metastatic melanoma and a four-strain influenza vaccine.
Additionally, a two-dose schedule was approved for cancer vaccine Cervarix in 9-14 year old girls. Synflorix was also approved for immunisation against pneumonia in infants and children. Approval was granted in new indications for two existing products in oncology; Revolade for chronic hepatitis C-associated thrombocytopenia and Tyverb, which can be used in conjunction with trastuzumab for certain types of breast cancer.
Other developmentsWe have been restructuring our European business over the course of 2012 and 2013 to reduce inefficiencies and ensure we focus investment into the areas with most growth potential. The reorganisation was largely complete by the end of 2013.
In Pharmaceuticals, last year we divested our anti-coagulant products, Arixtra and Fraxiparine, to The Aspen Group for more than £700 million. As part of the same transaction, we agreed to transfer a manufacturing site in France to Aspen in 2014.
In December, we announced changes to the way that we will compensate global sales employees who work directly with prescribing healthcare professionals (HCPs), removing individual sales targets. These changes will roll out to our global sales force during 2014.
We also announced changes to how we work with healthcare professionals. During 2014, we will start the process to end direct payments to healthcare professionals for speaking engagements or attendance at medical conferences by the start of 2016.
Pharmaceuticals and VaccinesEuropeIn Europe, we have been restructuring to improve our business performance and support new product approvals
Breakdown of turnover
£mGrowth CER %
Respiratory 1,907 (3)Anti-virals 66 (14)Central nervous system 355 (11)Cardiovascular and urogenital 533 2
Metabolic 42 41Anti-bacterials 393 (6)Oncology and emesis 339 28Vaccines 1,049 3Dermatology 170 5Rare diseases 129 1Immuno-inflammation 8 100
Turnover £bn
07
06
05
04
03
02
01
02011 2012 2013
5.75.0 5.2
19%% of group turnover
flatReported growth CER%
08
Operating profit £bn
05
04
03
02
01
02011 2012 2013
3.22.6 2.8
£2.8bnOperating profit
3%Reported growth CER%
24 GSK Annual Report 2013

An openness to offer early access to innovative medicines
We are committed to ensuring that patients who could benefit most from our innovative medicines can access them and we are developing novel approaches to ensure we can do this in a sustainable manner.
By engaging with governments, healthcare professionals and regulators we are committed to ensuring patients who are appropriate for our medicines can benefit from them as soon as they are available.
When we launched our kidney cancer product Votrient in the UK, we agreed to provide head-to-head data against the standard of care within two years: if the results were positive we would retain the price; if they were negative we would pay a rebate and reduce the price. In 2013, the results became available. They were positive and it was agreed that we could retain the original price.
Across Europe, we continue to see an increasing number of patients benefiting from Votrient, now that it has achieved reimbursement status for two cancer types across the region, advanced kidney cancer and soft-tissue sarcoma.
By engaging with oncologists, we are also ensuring that eligible patients across Europe are able to access Tafinlar ahead of reimbursement – at no cost.
Initiatives such as these have contributed to growth in our oncology business in the last five years. By bringing innovative medicines to market and helping patients with cancer access these medicines quickly, we are seeking to be a key partner in oncology.
Our European business supported a number of initiatives to support health, well-being and science education in local communities. In the UK, we were a major supporter of WellChild, the national charity for sick children. We also implemented our science education programme which works with secondary school teachers to help inspire young people to continue their studies in science, technology, engineering and maths (STEM) subjects, to help them make the connection between the science they learn in the classroom and potential future careers.
We also continued to provide financial support to Barretstown, a camp in Ireland that provides therapeutic recreation programmes for children with serious illnesses and their families.
GSK Annual Report 2013 25

Strategic report Grow
MarketplaceWe remain optimistic about the long-term prospects in the emerging markets and the EMAP region continues to be a major engine of growth for our industry. Characterised by growing populations, increased GDP, more demanding middle classes and greater spending on healthcare, the business fundamentals in the region are strong and are expected to remain so in the coming years.
Economic and currency volatility continued to cause short-term uncertainty in some countries. Subdued growth can in part be attributed to price pressures created by governments more tightly managing healthcare budgets, particularly in Brazil, Korea and India.
PerformanceEMAP Pharmaceuticals and Vaccines turnover grew 1% to £4.7 billion in 2013, adversely affected by the ongoing investigation in China and some vaccine supply issues. Excluding China, Pharmaceuticals and Vaccines sales were up 5% in EMAP. Operating profit in EMAP was down 3%.
Regionally, Pharmaceuticals and Vaccines growth was strong in the Middle East/Africa (up 7%), Latin America (up 6%) and South-East Asia (up 6%), partially offset by declines in Korea (down 9%) and India (down 5%). Performance in India was affected by government price controls introduced in the middle of the year. However, we continue to be optimistic about business prospects in the country, as demonstrated by our open offer to increase our holding in our publicly-listed Indian pharmaceuticals subsidiary. We aim to complete this transaction in 2014.
In China, sales were down 18%. Our business in China has been the subject of an investigation by government authorities after allegations of fraudulent behaviour. We are concerned and disappointed by these allegations and are co-operating fully with the Chinese authorities.
Pharmaceuticals sales in EMAP rose 2% to £3.6 billion (up 5% excluding China). In the respiratory therapy area, sales grew by 4%, led by Seretide, up 4% to £429 million. Veramyst grew 16% to £71 million and Ventolin sales were up 2% to £171 million.
Oncology sales grew 18% to £149 million, led by strong growth of Votrient (up 77% to £37 million) and Promacta (up 92% to £22 million). However, sales of Tykerb and Hycamtin declined (9% to £47 million and 36% to £7 million respectively).
Sales of anti-bacterials grew 5% to £750 million. This was primarily due to an 11% increase in sales of Augmentin to £393 million.
Sales of anti-virals fell 20% due to declines in Zeffix and Hepsera.
Vaccines sales grew 1% to £1.1 billion (3% excluding China), reflecting strong tender performances from Cervarix and Infanrix/Pediarix, partially offset by a tough comparison with 2012. In Brazil, we maintained existing vaccine tenders and signed a new technology transfer agreement for Boostrix. In India we finalised a joint venture to focus on early stage research and development of a six-in-one combination paediatric vaccine to help protect children from polio and other infectious diseases.
Portfolio progressIn addition to filing our new pipeline products in EMAP countries, we are also implementing a ‘catch-up’ programme, which aims to bring more of our established products to developing countries. As part of this programme, we received approvals for a further 26 products treating non-communicable diseases, respiratory, antibiotics and oncology in 2013.
Other developmentsFollowing our announcement in December, some markets within our EMAP business have started to implement changes to the way that we compensate our sales employees who work directly with prescribing healthcare professionals (HCPs), removing individual sales targets. These changes will roll out to our entire global sales force during 2014.
Pharmaceuticals and VaccinesEMAPOur Emerging Markets and Asia Pacific business delivered strong performance despite political unrest and economic uncertainty in some markets
Turnover £bn
2011 2012 2013
4.5 4.7 4.7
18%% of group turnover
1%Reported growth CER%
Breakdown of turnover
£mGrowth CER %
Respiratory 877 4Anti-virals 293 (20)Central nervous system 341 7Cardiovascular and urogenital 281 (2)
Metabolic 68 9Anti-bacterials 750 5Oncology and emesis 149 18Vaccines 1,124 1Dermatology 397 6Rare diseases 48 2Immuno-inflammation 1 –
Operating profit £bn
05
04
03
02
01
02011 2012 2013
1.5 1.6 1.5
£1.5bnOperating profit
(3)%Reported growth CER%
07
06
05
04
03
02
01
0
08
26 GSK Annual Report 2013

Across the EMAP region, we are continuing to expand in the least-developed markets, where we estimate there are some 240 million people who are underserved by healthcare provision. Our Developing Countries Market Access (DCMA) unit manages our commercial business in the world’s poorest countries and focuses on volume rather than profit growth. We have now created a new operating unit to embrace countries across sub-Saharan Africa and other Least Developed Countries. This is the first step in a broader growth strategy for Africa.
We remain fully committed to supporting healthcare across all the emerging markets, despite the challenges that exist in some countries and regions. We believe that improving patient access to medicines and vaccines is not just for patient benefit but is also key to the longer-term success of the business.
In May, we added to our commitment to the GAVI Alliance, with a new agreement to supply Cervarix to four new GAVI demonstration projects at a significantly discounted price. We also extended the Synflorix vaccine supply agreement in order to protect an additional 80 million children in the world’s poorest countries from pneumococcal diseases such as meningitis and pneumonia. These latest commitments add to our existing agreements to supply GAVI with up to 480 million doses of Synflorix over the next decade and 132 million doses of Rotarix over the next five years.
As part of our drive to improve access to vaccines and healthcare in developing countries, we entered into two new partnerships: one with Save the Children and another with Barclays bank. The alliance with Save the Children is a long-term strategic global partnership which aims to help save the lives of one million children by combining the expertise, resources and influence of the two groups. It will touch many areas of our business, in particular using our R&D knowledge. For more on this partnership see page 55.
The partnership with Barclays seeks to increase access to affordable healthcare while helping to create improved economic conditions for growth. We will be combining our skills and expertise with those of Barclays to help remove financial barriers to healthcare access, and also supporting small business development and job creation, starting in Zambia.
In May, we announced our financial support for the One Million Community Health Workers campaign, which aims to train health workers to provide essential services to the poorest communities in sub-Saharan Africa.
A new formulation to help those on low incomes
In the emerging markets, we have been looking at innovative ways to expand access to our products.
For instance, asthma patients in emerging markets on low incomes have to pay for medicines directly. However, many of these people are often paid on a weekly or even daily basis and so the purchase of medicines, which are normally sold in large packs, can be out of reach for many.
In response, we have developed smaller pack sizes and an inhaler device that is less costly to produce. Ventolin Rotacaps uses a re-engineered version of our established GSK inhaler technology, but one that is five times less expensive to produce.
We have packaged the actual medicine into individual dose capsules, allowing this to be purchased in quantities as small as four capsules at a time. This cuts the overall cost of the medicine, enabling more patients to buy the medicine in quantities that fit with their cash flow.
The new inhaler is available in four markets – the Philippines, Indonesia, Kenya and Nigeria – and we have submitted it for regulatory approvals in other markets. Ultimately we hope it will open up access to many more patients who are currently unable to afford inhaled respiratory medicines.
GSK Annual Report 2013 27

Strategic report Grow
Pharmaceuticals and VaccinesJapan
MarketplaceJapan remains the world’s second largest prescription medicine market after the USA. The vast majority of residents are covered by social health insurance, with the remainder receiving public assistance. Demand for high-quality medical treatments remains high.
In April 2013, the government announced plans for the further promotion of the use of generic medicines with an explicit goal to increase to 60% the generic drugs share of the market. This has already accelerated generic launches in some categories.
PerformancePharmaceuticals and Vaccines sales in Japan grew by 1% to £1.7 billion in 2013. A 9% growth in Pharmaceuticals sales was partially offset by a 76% decline in Vaccines sales. Operating profit in Japan grew 4%.
By therapy area, respiratory sales grew 9% to £567 million. Adoair sales increased by 8% to £277 million and there was also strong growth from Veramyst (up 28% to £49 million) and Xyzal (up 27% to £120 million). Relvar Ellipta was launched in December and recorded sales of £3 million.
Anti-viral sales grew 26% due to the government’s decision to stockpile our flu antiviral, Relenza.
In rare diseases, sales of the pulmonary arterial hypertension (PAH) medicine Volibris increased 50% to £42 million. However sales of Flolan fell by 9% due to the impact of the price reduction of 2012, as well as the launch of generic epoprostenol by various manufacturers.
Several other pharmaceutical products performed strongly. Benign prostatic hyperplasia treatment, Avolve (dutasteride), increased sales by 25% to £114 million and became the market leader in January 2014. Central Nervous System (CNS) medicines remain an important therapy area and our anti-epileptic Lamictal performed strongly, with sales growing 28% to £83 million. However, generic competition led to a 22% decline in sales for our anti-depressant, Paxil.
Vaccines sales were down 76%, primarily reflecting the impact on Cervarix of the suspension of the recommendation for the use of HPV vaccines in Japan during the second half of 2013 and the adverse comparison with 2012, which benefited from the final stages of the catch-up HPV vaccination programme.
Portfolio progressIn 2013, the Japanese business received three regulatory approvals – Arzerra for Chronic Lymphocytic Leukemia (CLL), Relvar Ellipta for asthma and Paxil for Post-Traumatic Stress Disorder (PTSD) – bringing the total number of approvals since 2000 to 76. Approval was also received for Xyzal in January 2014 for allergic rhinitis.
We have been focusing on reducing the gap between approvals of pipeline products in Japan and those in the USA and Europe. In 2013, Japan became the first country to receive regulatory approval for Relvar Ellipta in asthma with its launch taking place early December.
In September, trametinib, dabrafenib, dolutegravir and mepolizumab (for Churg Strauss Syndrome) were granted orphan drug status subject to priority review. GSK now has 23 orphan drug designations in Japan.
Other developmentsThe Japanese government reviews the prices of prescription medicines funded by health insurance every two years, resulting in average price cuts of 5-6%, and the next revision is due in April 2014. Discussions between the authorities and the industry around pricing began at the end of the year.
In September 2013, we published details of payments to healthcare professionals. This was in keeping with the new guidelines on transparency from the Japan Pharmaceutical Manufacturers Association.
We continue to support and invest in the health and well-being of communities in the markets in which we operate. In 2013, we provided further financial support for the area affected by the 2011 Great East Japan earthquake. In addition, we supported our Save the Children partnership through employee fundraising.
The strong performance of our pharmaceutical products offsets a challenging environment for our vaccines business in Japan
Turnover £bn
07
06
05
04
03
02
01
02011 2012 2013
2.1 2.01.7
6%% of group turnover
1%Reported growth CER%
08
Breakdown of turnover
£mGrowth CER %
Respiratory 567 9Anti-virals 230 26Central nervous system 307 (5)Cardiovascular and urogenital 119 23
Metabolic 50 (17)Anti-bacterials 23 (3)Oncology and emesis 63 36Vaccines 36 (76)Dermatology 28 3Rare diseases 184 18
Operating profit £bn
05
04
03
02
01
02011 2012 2013
1.2 1.2 1.0
£1.0bnOperating profit
4%Reported growth CER%
28 GSK Annual Report 2013

ViiV Healthcare
MarketplaceThere are currently 35 million people living with HIV/AIDS across the world. Around 36 million people have died from AIDS-related causes since 1984, with deaths during 2012 estimated at close to 4,400 per day.
In the USA, the HIV market continues to grow at a modest rate. The European marketplace is strong, despite austerity measures, changing healthcare systems and the associated pricing pressures.
Our business outside these regions remains an important priority. This continued focus has resulted in the establishment of a new Middle East and Africa hub in 2013. In least-developed, low-income and sub-Saharan Africa countries, the major market issue is one of access.
PerformanceViiV Healthcare turnover for 2013 was flat at £1.4 billion as the growth generated by Epzicom/Kivexa and Selzentry/Celsentri (maraviroc), together with the introduction of the newly approved Tivicay (dolutegravir), was offset by the impact of continued competition to older products. Operating profit grew 3%.
There was strong growth from Epzicom/Kivexa (up 14% to £763 million) and Selzentry/Celsentri (up 10% to £143 million). Epzicom/Kivexa is performing particularly well across all regions of the business, reflecting increased confidence in the marketplace and enhanced position in local guidelines in both North America and Europe.
The highlight of 2013 was the approval of Tivicay in the USA in August. Physician response to Tivicay has been extremely positive and the product launch trajectory is on pace with the best recent launches in the HIV space. Tivicay recorded sales of £19 million in 2013.
Regionally, sales in North America grew, driven by good performance of Epzicom and Selzentry, together with the launch of Tivicay. In Europe sales declined, with the arrival of generic competition to Combivir offsetting strong growth for Kivexa. In our International region sales also declined, with an increase in generic competition for the mature portfolio balanced by strong growth for Kivexa in Latin America, Japan and Russia.
A key element of our International strategy is to create local partnerships with generics manufacturers in Middle Income Countries – and at the end of 2013 we confirmed a new relationship with Emcure, to launch generic maraviroc as Axentri in India.
Portfolio progressViiV Healthcare filed its investigational single-tablet regimen combining dolutegravir, abacavir and lamivudine known as dolutegravir-Trii in the USA and EU in October.
Work on experimental integrase inhibitor GSK-744 continues to progress. A study of the long-acting injectable form of this drug is set to begin in the second quarter of 2014.
Other developmentsAccess to medicines is a major focus for ViiV Healthcare and during 2013 we maintained our commitment to supporting people with HIV in 138 countries. The company offers royalty-free voluntary licences and not-for-profit pricing in all low-income and least-developed countries and in sub-Saharan Africa, where 75% of all people with HIV live. For middle-income countries, we take a case-by-case approach that assesses local needs. All our HIV medicines, including those in the pipeline and new breakthroughs such as Tivicay, are covered by this access policy.
In 2013 we announced a voluntary licence to the Medicine’s Patent Pool foundation to improve access to abacavir for children living with HIV.
In addition, we have a number of community initiatives and currently support over 300 projects around the world through Positive Action, the Positive Action for Children Fund and our Paediatric Innovation Seed Fund.
During 2013, ViiV Healthcare also committed over $2.3 million towards funding grassroots projects in the USA, addressing gaps in care and services for people living with or at risk from HIV/AIDS.
We continue to support the Paediatric Innovation Seed Fund, which focused on five projects during 2013, including a collaboration with the Clinton Health Access Initiative and Mylan Pharmaceuticals. This partnership aims to produce a taste-masked, dispersible medicine for paediatric use and in November 2013, Mylan filed a regulatory dossier to the WHO pre-qualification regulatory approval procedure.
ViiV Healthcare saw an important milestone with the approval and launch of dolutegravir, a new treatment for HIV
Turnover £bn
07
06
05
04
03
02
01
02011 2012 2013
1.6 1.4 1.4
5%% of group turnover
flatReported growth CER%
08
Breakdown of turnover
£mGrowth CER %
Combivir 116 (36)Epivir 43 (10)Epzicom/Kivexa 763 14Selzentry 143 10Trizivir 97 (10)
Operating profit £bn
05
04
03
02
01
02011 2012 2013
0.9 0.8 0.9
£0.9bnOperating profit
3%Reported growth CER%
GSK Annual Report 2013 29

Breakdown of turnover
£m Growth CER %
Total Wellness 1,935 (5)Oral Care 1,884 6Nutrition 1,096 7Skin Health 272 5
Consumer Healthcare
MarketplaceThe global consumer healthcare marketplace is wide and diverse, with each individual marketplace or region presenting its own challenges and opportunities.
In the developed economies of Europe, Asia and North America, competition is intense as the main market players strive to gain market share via innovation and aggressive marketing. Increasingly, premium-branded competitors must drive market value by offering consumers superior, clearly differentiated products to compete with own-label offerings.
Growth slowed slightly in the emerging markets. In the long term, prospects remain strong, driven by an emerging middle class, greater disposable income and increased GDP.
PerformanceOverall, Consumer Healthcare turnover grew 2% to £5.2 billion in 2013. Excluding the non-core OTC brands that were divested in the first half of 2012, turnover grew 4%. Operating profit for Consumer Healthcare grew 3%.
Our Consumer Healthcare business is structured around four categories; Total Wellness, Oral Care, Nutrition and Skin Health.
Total Wellness sales, excluding the non-core OTC brands that were divested in the first half of 2012, grew 1% to £1.9 billion. A severe cold and flu season in early 2013 helped drive growth of several respiratory brands. This was offset by a 40% reduction of Total Wellness sales in China, driven by regulatory changes.
A 6% increase in Oral Care sales to £1.9 billion was driven by growth of Sensodyne toothpaste for Sensitivity and Acid erosion which was up 15% and denture care brands up by 9%.
Our Nutrition category grew 7% with emerging markets recording a 14% increase. Family Nutrition (Horlicks) was up 14%, due to increased consumer access in India and geographic expansion into Bangladesh and Pakistan. In addition, Functional beverages grew by 11% in emerging markets, and 3% in Europe.
Skin Health sales grew 5% to £272 million, led by Abreva in the USA.
At a regional level, excluding the non-core OTC products divested in 2012, US sales grew 2% to £951 million, led by strong contributions from Oral Care brands, alli and Abreva. This was partially offset by declines in gastro-intestinal products, due to increased competitor activity, and in smoking control products.
In Europe, sales grew 3% to £1.8 billion, helped by strong growth in products for respiratory health and pain. Oral Care sales in Europe were flat, as strong growth in Sensodyne and denture care brands was offset by a decline in Aquafresh, which was impacted by some supply issues in Q4.
Rest of World markets, which include India, China, Latin America and Africa, grew 6% to £2.4 billion, reflecting growth across most categories and markets. Performance in India was particularly strong with sales up 16%. India remains an important market for the business and this was reinforced by our investment in our publicly-listed Consumer Healthcare subsidiary as we brought our holding share to 72.5% during the year.
Other developmentsWe extended our approach to innovation with the launch of the Shopper Science Lab (see case study) and the Human Performance Lab (more on this on page 42).
These two world-class facilities enrich our ability to better serve our consumers, by deepening our understanding of what influences their decision at shelf, and improving our R&D capability by working with elite performers to understand human performance and applying that to new products for mass consumers.
We also continued with our strategy to increase the focus on a core portfolio of Consumer Healthcare brands, with a particular emphasis on emerging markets. An element of this was the sale of our Lucozade and Ribena drinks brands to Suntory Beverage & Food Ltd, the Japanese consumer goods company, for £1.35 billion. We completed the sale at the end of 2013.
Consumer Healthcare performance was strong, particularly in our Oral Care and Nutrition areas, and was boosted by our renewed focus on core brands
Turnover £bn
07
06
05
04
03
02
01
02011 2012 2013
5.3 5.2 5.2
20%% of group turnover
2%Reported growth CER%
08
Operating profit £bn
05
04
03
02
01
02011 2012 2013
1.1 0.9 0.9
£0.9bnOperating profit
3%Reported growth CER%
Strategic report Grow
30 GSK Annual Report 2013

Shopping the habits of shoppers
At GSK, innovation isn’t limited to our R&D organisation. We also see how technological innovation could allow us to deepen our understanding of what influences consumer decisions. This will enable us to improve the experience for our consumers and ultimately increase sales. The opening of our high tech shopper research facility, the Shopper Science Lab, is a significant step towards this.
It is the largest and most advanced shopper insight and collaboration facility in Europe, fitted out with cutting-edge technology including a virtual insight and engagement touch screen wall, eye-tracking and skin sensors to monitor consumers emotional reactions and a mock retail and pharmacy store.
We can use the Shopper Science Lab to explore habits and behaviours to understand what influences consumer choices. The flexibility of the facility allows us to analyse different store layouts, shelf enhancements and packaging displays to improve the shopper experience at point of purchase. Through this, we can collaborate with our retail partners to identify the best joint value creation opportunities.
Investing in facilities such as the SSL, allows GSK to stay at the forefront of the science of shopping, giving us a competitive advantage in the fast-paced world of consumer healthcare. This is completely in keeping with our aim of becoming the first and best fast-moving consumer healthcare company driven by science and values.
GSK Annual Report 2013 31

Strategic report Deliver
Progress summary
Our strategy to increase productivity in R&D and to improve rates of return is underpinned by changes made in recent years to our organisation and our ways of working. We have broken up the traditional hierarchical R&D business structure to create smaller, agile and more autonomous teams of scientists. We have also increased the level of externalisation of our research, allowing us to explore new areas of science while sharing risk with other groups.
Being more rigorous in how we allocate investment across Pharmaceutical, Vaccine and Consumer Healthcare R&D, and changing our processes so we are able to make decisions earlier around pipeline progressions, has meant that only those medicines that are significantly differentiated from existing therapies are being progressed.
All of this has been underpinned by a focus on improving rates of return in R&D.
We believe these changes to our R&D organisation and ways of working are allowing us to sustain a pipeline of products that offer valuable improvements in treatment for patients and healthcare providers.
During 2013, we received approvals for six significant new products, including treatments for the respiratory diseases asthma and COPD, malignant melanoma (skin cancer) and HIV, as well as a new vaccine against four strains of flu. We also received approval for new indications for several existing vaccines and cancer medicines.
As well as gaining these significant approvals, in 2013 we also generated a high volume of phase III data on key assets in our pipeline. This is an unprecedented level of late-stage pipeline delivery for the company.
Overall, our return on Pharmaceuticals and Vaccines R&D investment has been increasing, due to a combination of greater innovation, effective asset progression and successful approvals, coupled with reductions in R&D spend. We continue to target an internal rate of return of 14% on a longer term basis.
Deliver
01
02011 2012 2013
New product approvals in the USA
07
06
05
04
03
023
2
66new product approvals in 2013
Estimated internal rate of return
14
12
10
08
06
04
02
02010 2013 Target
11
1314 13%
estimated IRR in 2013
32 GSK Annual Report 2013

Our prioritiesWe remain confident in our ability to sustain pipeline delivery, with a key focus for 2014 and 2015 being the delivery of phase III data for six potential new medicines and vaccines.
We are also planning for phase III stage progressions for around ten new products in key areas such as respiratory, oncology and vaccines in 2014/15.
Driving improvements in ways of working across the R&D organisation will continue to be a priority, so that increasing levels of output can be maintained without increased expenditure.
Treating HIVHIV/Aids has claimed more than 36 million lives in the past 30 years. In the USA, more than 1.1 million people have HIV. Due to improvements in treatments, a 20-year old with HIV on treatment in the USA is now expected to live until they are over 70 – a life expectancy approaching that of the general population.
We established ViiV Healthcare with Pfizer in 2009, to focus on HIV treatment and research. After a long-term collaboration on the joint development of several novel medicines, we were joined by Shionogi in 2012.
In 2013, ViiV Healthcare received approval for Tivicay (dolutegravir), an integrase inhibitor for the treatment of HIV, providing patients with a new treatment option.
Parker (pictured) learned he was HIV-positive in 2008.
“ Being healthy to me means doing everything I possibly can to keep my body in the best shape it can be, so that I may spend more time with the people I care about.”
Parker, aged 26, from Texas, USA
References World Health Organization. HIV/AIDS Fact Sheet. Accessed from http://www.who.int/mediacentre/factsheets/fs360/en/ Accessed on December 5, 2013
Centers for Disease Control and Prevention. HIV in the United States: At A Glance. Accessed from http://www.cdc.gov/hiv/statistics/basics/ataglance.html. Accessed on December 5, 2013
Samji H, Cescon A, Hogg RS, Modur SP, Althoff KN, et al. (2013) Closing the Gap: Increases in Life Expectancy among Treated HIV-Positive Individuals in the United States and Canada. PLoS ONE 8(12): e81355. doi:10.1371/journal.pone.0081355
GSK Annual Report 2013 33

Initial phase III data were also received for darapladib in chronic coronary heart disease and the therapeutic vaccine MAGE-A3 in melanoma. While the primary endpoint in the darapladib study and the first co-primary endpoint in the MAGE-A3 study were not met, we are in the process of further analysing these data to determine whether there are patient sub-groups which would benefit from these treatments. Further phase III studies of MAGE A3 in lung cancer and darapladib for acute coronary syndrome will read out in 2014.
We handed back rights to partner companies for four assets in 2013: IPX066 in Parkinson’s disease was returned to Impax Pharmaceuticals due to delays in the anticipated regulatory approval and launch dates; and disappointing phase III data prompted us to return rights for migalastat in Fabry disease to Amicus Therapeutics, for vercirnon in Crohn’s disease to Chemocentryx, and for drisapersen in Duchenne muscular dystrophy to Prosensa. We also decided not to pursue development of Tykerb in either head and neck or gastric cancer, after studies of this medicine in these indications failed to meet their primary endpoints.
We remain confident that we are capable of delivering a strong, sustainable pipeline of potential new medicines. We have around 40 new molecular entities (NMEs) in phase II/III clinical development and in 2014/2015 expect phase III read-outs for 6 NMEs including MAGE-A3, darapladib, and mepolizumab in severe asthma. Phase III studies will also start for around ten new assets.
Strategic report Deliver
Pipeline progress New treatment optionsOur R&D organisation performed exceptionally well in 2013, with a record number of approvals, and encouraging evidence of our ability to sustain this output
Of the six major new medicine files we profiled at the start of 2013, five were approved: Breo and Anoro for respiratory disease, Tafinlar and Mekinist for melanoma (skin cancer) and Tivicay for HIV. We are expecting regulatory decisions for albiglutide, the remaining asset in this group, in the first half of 2014. In addition, we launched our new injectable quadrivalent flu vaccine in the USA.
This is the most productive period in the company’s history. Overall GSK accounted for 19% of FDA new drug approvals during 2013 and since 2009 we have achieved more approvals for new molecular entities in the USA then any other company.
Respiratory Within respiratory, Breo Ellipta, a once-daily combined steroid and long-acting beta agonist, was approved in the USA as a treatment for COPD, and the same product, under the name Relvar Ellipta, was approved for the treatment of asthma in Japan. Relvar Ellipta also received marketing authorisation in Europe for both COPD and asthma.
Another new product for COPD, Anoro Ellipta, was also approved in the USA. Anoro Ellipta is the first once-daily product to reach the market in the USA that combines two long-acting bronchodilators in a single inhaler. Both Relvar/Breo and Anoro are administered using our novel inhaler device, Ellipta.
Oncology Our oncology business was strengthened by a number of regulatory approvals in 2013. Two new products, Tafinlar and Mekinist, were approved in the USA for use singly in metastatic melanoma and, under the FDA’s accelerated approval process, for use as the first combination of oral targeted therapies. This accelerated approval is contingent on the results of the phase III trial, which is designed to evaluate the clinical benefit of the combination in this patient population. Tafinlar also gained European approval, and we expect a decision in Europe in 2014 on both Mekinist and the combination use. New indications for two existing products in our portfolio – Tyverb and Revolade – were also approved by regulators.
HIV/AidsViiV Healthcare, the company we established with Pfizer in 2009 to focus on HIV treatment and research, gained approval for Tivicay in the USA and Europe. Tivicay is the first once-daily integrase inhibitor that does not need to be used in conjunction with a booster drug, and it has been approved for use both in treatment-naive and treatment-experienced patients.
VaccinesDuring the year we gained approvals for two new quadrivalent flu vaccines: Flulaval in the USA and Fluarix in Europe. These four-strain vaccines provide added protection versus traditional trivalent vaccines.
In Europe, our HPV vaccine, Cervarix, received approval for a two-dose schedule, in addition to the existing three doses. The European Medicines Agency also approved an additional indication against pnuemonia for Synflorix in infants and children. Pneumonia continues to be one of the leading causes of death in children under five.
A strong pipelinePromising progress was made in 2013 with a number of phase III assets progressing to regulatory filing by year’s end.
Files were submitted in the USA and Europe for albiglutide, a treatment for type 2 diabetes, a single tablet combination of Tivicay and ViiV’s Kivexa for the treatment of HIV, Arzerra as a first line treatment for chronic lymphocytic leukemia (CLL) and umeclidinium, the long-acting muscuranic antagonist component of Anoro, for COPD.
In the USA we filed fluticasone fuorate, the steroid component of Relvar/Breo, as a monotherapy in asthma and in Europe submitted Votrient for ovarian cancer.
We expect regulatory decisions in Europe in 2014 on Anoro Ellipta, Incruse, Mekinist and Mekinist/Tafinlar combination use.
2013 was an important year for our malaria vaccine candidate, with phase III data showing that over 18 months of follow-up, the vaccine almost halved the number of malaria cases in young children, and reduced by around a quarter the number of malaria cases in infants. Using these data, we intend to submit a regulatory file in Europe for this asset in 2014.
34 GSK Annual Report 2013
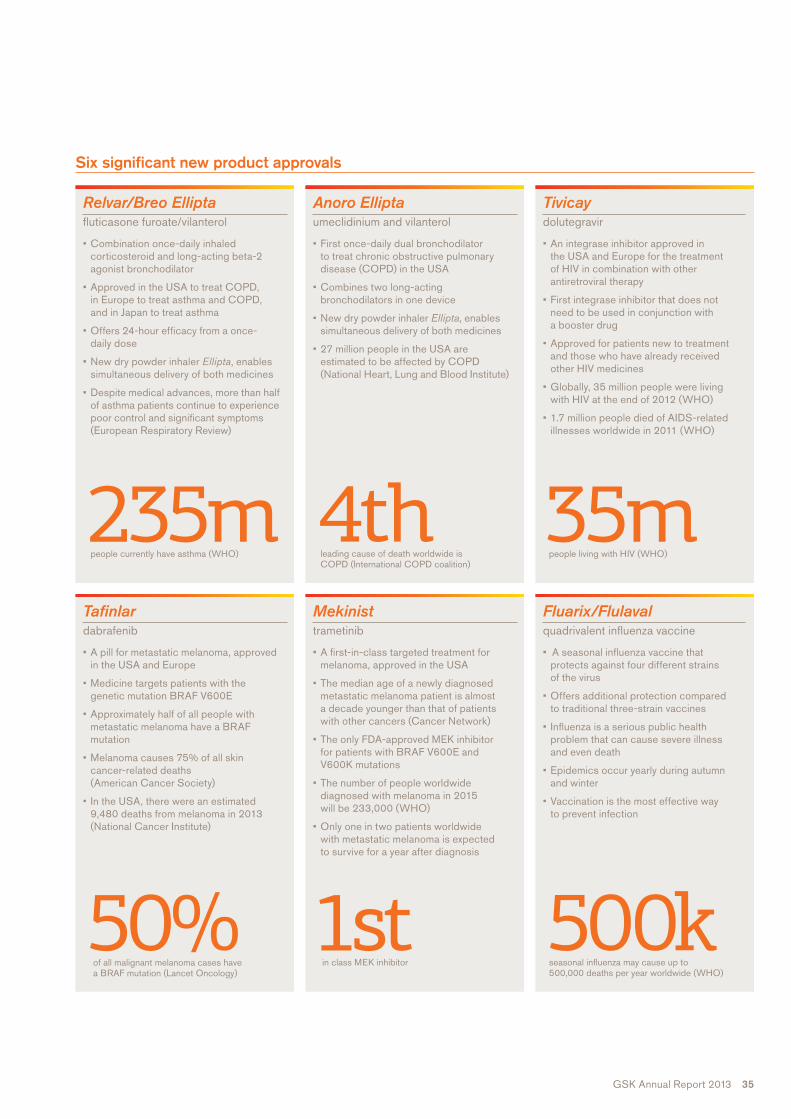
Six significant new product approvals
•Apillformetastaticmelanoma,approvedin the USA and Europe
• Medicinetargetspatientswiththegenetic mutation BRAF V600E
•Approximatelyhalfofallpeoplewithmetastatic melanoma have a BRAF mutation
•Melanomacauses75%ofallskincancer-related deaths (American Cancer Society)
• IntheUSA,therewereanestimated9,480 deaths from melanoma in 2013 (National Cancer Institute)
Tafinlardabrafenib
of all malignant melanoma cases have a BRAF mutation (Lancet Oncology)
50%
•Afirst-in-classtargetedtreatmentformelanoma, approved in the USA
•Themedianageofanewlydiagnosedmetastatic melanoma patient is almost a decade younger than that of patients with other cancers (Cancer Network)
•TheonlyFDA-approvedMEKinhibitor for patients with BRAF V600E and V600K mutations
•Thenumberofpeopleworldwidediagnosed with melanoma in 2015 will be 233,000 (WHO)
•Onlyoneintwopatientsworldwide with metastatic melanoma is expected to survive for a year after diagnosis
Mekinisttrametinib
in class MEK inhibitor1st
•Anintegraseinhibitorapprovedin the USA and Europe for the treatment of HIV in combination with other antiretroviral therapy
•Firstintegraseinhibitorthatdoesnotneed to be used in conjunction with a booster drug
•Approvedforpatientsnewtotreatmentand those who have already received other HIV medicines
•Globally,35millionpeoplewerelivingwith HIV at the end of 2012 (WHO)
•1.7millionpeoplediedofAIDS-relatedillnesses worldwide in 2011 (WHO)
Tivicaydolutegravir
people living with HIV (WHO)
35m
•Combinationonce-dailyinhaledcorticosteroid and long-acting beta-2 agonist bronchodilator
•ApprovedintheUSAtotreatCOPD, in Europe to treat asthma and COPD, and in Japan to treat asthma
•Offers24-hourefficacyfromaonce- daily dose
•NewdrypowderinhalerEllipta, enables simultaneous delivery of both medicines
•Despitemedicaladvances,morethanhalfof asthma patients continue to experience poor control and significant symptoms (European Respiratory Review)
Relvar/Breo Elliptafluticasone furoate/vilanterol
people currently have asthma (WHO)
235m
•Firstonce-dailydualbronchodilatorto treat chronic obstructive pulmonary disease (COPD) in the USA
•Combinestwolong-actingbronchodilators in one device
•NewdrypowderinhalerEllipta, enables simultaneous delivery of both medicines
•27millionpeopleintheUSAareestimated to be affected by COPD (National Heart, Lung and Blood Institute)
Anoro Elliptaumeclidinium and vilanterol
leading cause of death worldwide is COPD (International COPD coalition)
4th•Aseasonalinfluenzavaccinethat
protects against four different strains of the virus
•Offersadditionalprotectioncompared to traditional three-strain vaccines
• Influenzaisaseriouspublichealthproblem that can cause severe illness and even death
•Epidemicsoccuryearlyduringautumnand winter
•Vaccinationisthemosteffectiveway to prevent infection
Fluarix/Flulavalquadrivalent influenza vaccine
seasonal influenza may cause up to 500,000 deaths per year worldwide (WHO)
500k
GSK Annual Report 2013 35

Strategic report Deliver
Investment in R&DFocus on productivity
Our primary goal in R&D is to discover and develop new medicines that provide advances on current treatments and are valued by both patients and payers.
Over 12,300 people work in our R&D organisation and our core R&D spend was £3.4 billion on R&D during the year.
Our R&D spend is spread across our three businesses: Pharmaceuticals, Vaccines and Consumer Healthcare.
The R&D process for pharmaceuticals and vaccines is long, expensive and uncertain, and it is difficult to predict which products will succeed or fail. It is therefore important to drive efficiencies wherever possible to offset these risks. A key priority in 2013 continued to be implementing improvements across our R&D organisation, so that increasing levels of output could be maintained without increased expenditure.
The level of regulation and the approvals processes for consumer healthcare products differ from those in pharmaceuticals and vaccines research as the development times are shorter and the costs are significantly less. Innovation in consumer products is based on developing new products and formulations that meet customers’ needs.
Across all three areas, we make decisions about our R&D investment based on where we see the best opportunities, both in the market and in the science. We believe this is more effective than determining investment requirements on the basis of a fixed proportion of sales.
Calculating the rate of return in R&DDeclining R&D productivity is an issue that the pharmaceutical industry as a whole has faced over the past decade. As a result it has become more important for companies to provide a greater level of transparency on the returns that their R&D organisations make to determine capital investment allocation.
This rate of return is determined by assessing the R&D costs involved in discovering and developing our late stage pipeline projects against the profits of newly approved medicines and vaccines as they achieve regulatory approval and become available to patients. Careful allocation of R&D spending is critical.
In 2010, we calculated that our estimated R&D internal rate of return (IRR) was 11% and stated a long-term aim of increasing this to 14%. The combination of innovation, effective asset progression and successful approvals with reductions in R&D spend has led to an improvement in the current estimated IRR to 13%. We continue to target 14% on a longer-term basis.
This improvement in estimated IRR is an important measure of our financial discipline and our strategic progress to improve the economics of research and development. It also underpins our strategy to create more flexibility around the pricing of our new medicines.
Calculation of our IRR incorporates actual and predicted sales figures based on probabilities of success for medicines in the pipeline. We also take into account an estimate of attributable R&D costs, estimated profit margins, capital investment and working capital requirements.
The calculation for 2013 includes products launched from 1 January 2012 to 31 December 2013 and compounds in phases IIb and III of the development process. The calculation is based on actual sales from 2011 to 2013, and forecast sales up to 2034, adjusted to reflect expected failure rates, which are broadly in line with standard industry failure rates. The cost base used in this calculation comprises an estimate of attributable R&D costs and actual and projected milestone payments where appropriate.
Core R&D expenditure
Pharmaceuticals Vaccines Consumer Healthcare
80%
15%
5%
We remain committed to improving productivity in research and development, so we can develop more innovative new products with greater efficiency
36 GSK Annual Report 2013

Pharmaceuticals R&DOur search for new medicines
More than 10,500 people are employed in our Pharmaceuticals R&D business. In 2013 our pharmaceuticals core R&D expenditure was £2.7 billion, a decline of 5% compared to the previous year. When this is viewed in the context of the record number of approvals we gained and our strong pipeline outputs this year, we believe this is evidence that our strategy of increasing R&D productivity is working.
The length of time and costs involved in drug discovery and development make it essential that we are highly selective in where we invest our resources. We distribute expenditure across early stage research and late-stage development, and we focus on those areas where scientific advances have opened up new opportunities that we consider most likely to lead to significant medical advances. We also ensure we evaluate all experimental products at key points in the development pathway, so we can be confident we are putting resources in the projects we believe have the highest probability of succeeding.
Our key R&D centres are in the UK, USA, Spain and China. In 2013 we announced plans to significantly expand and rejuvenate some of these facilities – most significantly in Pennsylvania in the USA – to ensure we are well placed to maintain our position as a leader in R&D and to attract new talent.
Early-stage researchIn early-stage research (drug discovery), our aim is to identify the biological targets involved in the development of diseases and then to create small molecules or biopharmaceuticals that interact with these disease targets, ultimately leading to new medicines.
In recent years we have transformed our pharmaceutical R&D organisation with the aim of enhancing efficiency and productivity. Our new approach has three key elements. First, we have broken up the traditional hierarchical R&D business model and created smaller, more agile early-stage R&D groups called Discovery Performance Units (DPUs). Second, we have changed our processes so that we are progressing only those experimental medicines that are significantly differentiated from existing therapies. Third, we are increasing the amount of research we do with external partners, enabling us to access new areas of science and to share the risk of development.
Our DPU structure helps us to maintain flexibility in our discovery research investment, while focusing on the most promising scientific opportunities.
We had 42 DPUs in 2013. Each DPU has between 5 and 70 scientists who all work on a particular disease pathway or area of science. The DPU is responsible for discovery and development of potential new medicines through to early stage clinical trials (up to the completion of phase lla).
Core Pharmaceutical investment
Discovery Development Facilities and central support
27%
56%
17%
Our pharmaceuticals R&D organisation has been restructured to create research groups that are more agile, autonomous and outward-facing. We believe this structure is key to building a strong pipeline of innovative new medicines
Timeline and development stages for pharmaceutical research
Drug discovery
5,000-10,000 compounds
250 compounds
5 compounds
20-100Number of patients/subjects
Pre
-dis
cove
ry
IND submitted
20-100 20-100
Phase I Phase II Phase III
Preclinical Clinical trials Regulatory review
1 approved new medicine
Approval and launch
Post-marketing surveillance
3-6 years 6-7 years 0.5-2 years
NDA submitted
GSK Annual Report 2013 37

Nurturing the biotech ecosystem
Strategic report Deliver
Pharmaceuticals R&Dcontinued
DPUs are given their own budget, and progress against DPU business plans is regularly reviewed by the Discovery Investment Board (DIB). Membership of the DIB includes senior R&D and commercial management, and external individuals with expertise including life science investment experience and an understanding of payer perspectives. It is chaired by the President of R&D.
In 2013 we continued to be active in deal making and collaborating with external companies, individuals and academics. In particular we have been active in venture funding and were instrumental in the start up of four venture funds during the year focusing on different areas of science or regions (see below, Nurturing the biotech ecosystem). In 2013, we also ran two competitions – one with the goal of increasing understanding in the nascent field of bioelectronics, and the other with a view to forming partnerships with academia.
Our core discovery expenditure was £742 million in 2013, down approximately 7% against 2012.
Late-stage development When a compound has demonstrated a potential proof of concept in how it works, we make a decision on whether to advance it into late-stage development.
This is also known as commit to medicine development. This decision is typically made after phase IIa trials, during which the compound is tested in a small number of human volunteers. At this point, we will devise and instigate larger-scale studies in humans using the investigational medicine to further investigate its efficacy and safety.
At the same time, we work to optimise the compound’s physical properties and its formulation so that it can be produced efficiently and in sufficient quantities through the manufacturing process. In some cases, our research may include developing new devices to deliver these medicines (see case study, Patient-centric design).
If all of these stages are successful, we can use the results of our studies to submit a regulatory file for approval with regulatory agencies.
The responsibility for guiding an investigational medicine through the later stages of development to filing rests with our Medicines Development Teams (MDTs), small units of six to ten people.
We now have around 40 new molecular entities in phase II/III clinical development.
GovernanceThe R&D governance structure aims to ensure clear accountabilities and product reviews. The oversight of strategic issues and overall budget management across R&D is owned by the R&D Executive team. There are three governance boards that determine investment over the lifecycle of R&D and early commercialisation, beginning with the DIB, as described earlier.
Our Portfolio Investment Board (PIB) assesses the technical, commercial and investment case for each project to progress in development. The PIB is co-chaired by the Chairman of R&D and the President of North America Pharmaceuticals, and includes the heads of each pharmaceutical region along with the head of global manufacturing.
The PIB is accountable for investment decisions and funding allocation across all late-stage Pharma R&D investments, Medicines Discovery and Development, Biopharm R&D, Oncology, Stiefel, Rare Diseases and Emerging Markets R&D. This allows investment decisions to be made in a holistic way, ensuring a balance and diversity of assets of differing risk profiles, novelty, opportunity, development cost and potential to be reimbursed by payers.
Discovery research is exciting and innovative but also time consuming and high risk. Those factors, along with the global economic downturn, have resulted in fewer investments in early-stage life sciences companies over the past several years. A number of venture capital firms have stopped investing altogether in the sector; there are fewer investments and the average amount invested has fallen.
To fill those gaps and ensure that innovative ideas don’t get lost because of a lack of financing, we have taken a creative approach to early research investment through the creation of and participation in a number of venture capital funds, including one fund with a pharmaceutical industry competitor.
In 2013 alone, we have been instrumental in the start-up of four venture funds focusing on different areas of science (rare diseases and bioelectronics) or regions (west coast of the USA).
One of those funds, with San Diego-based Avalon Ventures, is ground-breaking in its efforts to fund and launch up to ten early-stage life science companies. The first company to be formed out of that collaboration was announced in December, less than nine months after the fund was formally launched.
Through our participation in these venture funding activities, we gain access to a broad range of early research programmes and in some cases have an option to buy companies that demonstrate scientific promise.
38 GSK Annual Report 2013

Projects are reviewed by the PIB at certain key decision points: ‘commit to medicine development’, ‘commit to phase III’ and ‘commit to file’. Funding is generally allocated up to the next key decision point, typically between two and four years ahead. The PIB also carries out an annual late-stage funding review, where investment in all projects is reviewed, adjusted if necessary and prioritised. No individual late-stage project has incurred annual expenditure of more than 10% of the total annual R&D expenditure.
Our Commercial Accountability Board (CAB) is responsible for commercial alignment and investment decisions on our innovative marketed products portfolio, governing the transition from R&D portfolio to our commercial operations. CAB reviews individual assets at the ‘commit to launch’ milestone and beyond, including endorsement of the commercial strategy and global targets for assets. CAB also approves investments in phase IIIb/IV evidence generation, conducts post-launch reviews and annual reviews of reimbursement decisions against predicted performance.
Other important governance boards in R&D include the Scientific Review Board (SRB), the governing body accountable for the scientific assessment of the R&D portfolio to support investment decision making at the Portfolio Investment Board (PIB). At the SRB, there will be a debate, review and endorsement of a unified R&D view on the scientific aspects of all assets. The SRB establishes a view on the overall scientific promise of the asset; development plan to deliver the asset; cost effectiveness of the clinical plan; opportunities and risks to the likely product profile; and gaps where evidence is missing or remains uncertain. The SRB view is the formal R&D position communicated at the PIB.
Two other important governance boards in R&D are the Technology Investment Board (TIB), which makes investment decisions for new platform technologies and licensing or options- based collaborations up to the point of entry into clinical trials; and the New Product Supply (NPS) Board, which is the governing body accountable for the technical feasibility and infrastructure assessments covering all aspects of the physical product and supply chain.
Our Regulatory Governance Board, launched in 2012 and led by the Chief Regulatory Officer, operated throughout 2013 with its focus on enhancing compliance with company-wide standards, increasing efficiency of regulatory services, and aligning capabilities with business needs both globally and locally.
Patient-centric design
A key challenge in designing inhalers for asthma and COPD treatments is to make the delivery mechanism as simple and reliable as possible for patients, while ensuring it effectively delivers each dose of medicine.
GSK has been at the forefront of respiratory science since the launch of Ventolin over 40 years ago. This year we unveiled the new Ellipta multi-dose dry powder inhaler, marking the next generation of GSK innovation in inhalation devices.
The Ellipta inhaler is the result of more than ten years of design, development and planning, which involved testing and tailoring our designs based on patient experience. It is designed to be easy for patients to use, with the minimum number of steps: open, inhale & close. It will be used across all our new inhaled respiratory medicines. The Ellipta inhaler was recently approved to deliver the Relvar/Breo and Anoro inhalation products.
The Ellipta inhaler is unusual in that the two compounds that make up the Relvar/Breo, fluticasone furoate and vilanterol, or Anoro, umeclidiminum and vilanterol, are stored separately within the inhaler, rather than being combined and stored together. The compounds only come into contact when the dose is administered, or ‘actuated’, by the patient. This means that for two medicines, there is no need to blend them together, which would require a new formulation being developed for each new dual combination.
This separate storage is especially important as not all combinations of medicines can be blended due to physical or chemical interactions. Where medicines can be blended, the Ellipta has the potential to allow three or more compounds to be stored and delivered. Potentially this could enable new treatment combinations in a single inhaler.
GSK Annual Report 2013 39

Strategic report Deliver
Vaccines R&DPrevention efforts
Our research on vaccines can be divided into early-stage research and later-stage development. Our aim is to identify and develop vaccines that can help the body raise an immune response against an infective organism or – with our newer-stage research – diseased cells.
As with pharmaceuticals R&D, the resources required and length of time it takes to discover and develop new vaccines means it is essential that we are highly selective in where we concentrate our efforts. We focus on those areas where advances have opened up new scientific opportunities that we consider most likely to lead to significant medical advances.
Discovery and development The discovery and development of a new vaccine is a complex process that typically takes between 10 and 12 years.
Vaccine discovery begins by identifying new antigens, which are specific structures on pathogens (viruses, bacteria or parasites) or on cancer cells that are recognised by the immune system. We then produce these pathogens in yeast, bacteria or mammalian cells and genetically manipulate them so that they can be purified and formulated in to a vaccine. It is the antigen that creates the body’s immune response.
Our vaccines R&D is centred on discovering and developing prophylactic and therapeutic vaccines to protect people against infectious diseases, cancers and chronic disorders
Our R&D effort within vaccines is focused on the development of new prophylactic and therapeutic vaccines while stringently managing and prioritising our investment decisions. Our core R&D investment in 2013 was £496 million, down 3% against 2012. We have more than 1,600 scientists working on the development of new vaccines. We currently have around 16 vaccines in development for a range of diseases and received a number of approvals and new indications this year (see pages 34-35).
A key part of our approach in vaccines R&D is expanding our access to new vaccine technologies. Our acquisition this year of the Swiss-based company Okairos is an example of this. This purchase provided us with access to a novel vaccine platform technology that could play an important role in the development of new prophylactic vaccines as well as new classes of therapeutic vaccines. This acquisition also brought in early-stage assets for diseases such as respiratory syncytial virus, hepatitis C virus, malaria, tuberculosis, ebola and HIV.
A highlight from 2013 were the results from a large-scale phase III trial of our malaria vaccine candidate, RTS,S. This demonstrated that the vaccine continued to protect young children and infants from clinical malaria up to 18 months after vaccination.
Vaccines research and development cycle
Identify Antigens
Produce Antigens
Pre-Clinical Testing Phase I Phase II Phase III File
Research (including Immunology)
Proof of concept
Registration/ Post marketing surveillance
1-10 years 2-3 years 2-4 years >1 year
Pre-clinical development
Transfer process to manufacturing
Clinical development (including Post marketing surveillance)
Scientists working on new vaccines
Vaccines in development
1,600
16
Highlights
40 GSK Annual Report 2013

In some cases, the formulation of the vaccine into clinical lots involves mixing antigens with our proprietary adjuvant systems. We use adjuvants to improve the immune system’s response to antigens contained in vaccines and we have been innovating in the area of adjuvant systems for more than 20 years. Candidate vaccines are usually a combination of several antigens, and the final composition of the vaccine (antigens and adjuvant) may change over time.
Traditionally, vaccines have been used to prevent illness. However, we are pioneering a different approach designed to programme the body’s immune system to fight existing diseases and this represents a new treatment model as a therapeutic vaccine. We are evaluating the immunotherapeutic concept against a variety of tumour types.
The first read out on phase III data from our investigational MAGE-A3 antigen-specific cancer immunotherapeutic in melanoma patients came through in 2013. While the trial did not meet its first co-primary endpoint, we will be continuing the trial until the second co-primary endpoint is assessed, with results expected in 2015. The same asset is also in development in lung cancer, and phase III data for this indication will read out in 2014.
Partnerships and collaborations, both with scientific partners and funding bodies, play an increasingly important role in our vaccines research. An example of our collaborative approach is a new research agreement with the Bill & Melinda Gates Foundation (BMGF) which aims to accelerate advances in vaccine R&D that have the potential to transform global health.
Our R&D efforts also include the lifecycle management of vaccines already on the market and those that we anticipate will emerge from the pipeline. We do this to increase the value our products can bring, by extending their reach and adapting them to ensure they meet the needs of patients.
Governance In 2012 we further consolidated the organisation of vaccine discovery and development teams, to simplify the infrastructure, focus on timely decision making and enhance clarity and accountability. Since then, we have continued to improve efficiency through investment in operational transformation programmes.
We have continued to emphasise the importance of our Project teams and Vaccine Leadership Teams, which are responsible for day-to-day progress of our research and development, including identifying and developing new products.
The board has an overall view of both early and advanced projects. It is chaired by our senior vice presidents for discovery and development. All VDCB recommendations to progress projects are submitted to VIB.
The VIB is chaired by our President of Vaccines. This board makes the final decision on whether to invest in a project, by evaluating the VDCB’s recommendation alongside public health benefit, business opportunity, development costs and risks, the project timing and overall evolution of our portfolio of vaccines.
There are several key decision points in the vaccine development process: commit to research (decide to initiate full research programme), commit to candidate development (decide to invest resources to move to clinical development); commit to early clinical development; commit to phase III; registration and launch.
Oversight of these key decisions rests with two bodies the Vaccine Development and Commercial Board (VDCB) and the Vaccine Investment Board (VIB).
The VDCB reviews the research project strategy and advises on its scientific, technical and commercial feasibility.
The science of the supply chain
Many vaccines need to be kept at a constant temperature – between 2C and 8C – from manufacture up until administration. This cold-chain, as it is known, is considered by many to be the biggest challenge in getting vaccines out to people around the world, particularly in hot, remote and resource-limited regions.
In an effort to overcome this challenge, we signed an early stage research partnership with the Bill & Melinda Gates Foundation (BMGF) this year. The $1.8 million agreement will support research into seeing if we can make some of our vaccines more heat stable, thus reducing the need for continuous refrigeration.
This initiative is part of a vaccine discovery partnership that was unveiled in October 2013 in Brazil, which would also fund research into other biomedical technologies that have the potential to overcome a significant and long-standing barrier to vaccine access in developing countries. Overall the partnership aims to integrate key players in vaccine development – biotechnology institutions, pharmaceutical companies, non-government organisations (NGOs) and academia – to drive advances in vaccine R&D that have the potential to transform global health.
GAV
I/Adr
ian
Bro
oks
GSK Annual Report 2013 41

Strategic report Deliver
Consumer Healthcare R&DProduct innovation
Our ‘innovation portfolio’ is critical to how we continue to grow our Consumer Healthcare business. Our focus is on creating a continual pipeline of new, scientifically differentiated products which define our four Consumer Healthcare categories.
Through new technologies and formulations we provide products that meet the needs of consumers and are valued by experts. These reinforce our leadership positions, particularly in areas such as sensitive teeth, family nutrition and smoking cessation.
Our commitment to innovation was reflected in our investment of £178 million in core Consumer Healthcare R&D in 2013, which increased 14% from 2012. Overall, 13% of sales came from innovative products launched in recent years. Key contributions came from:
NiQuitin Strips Launched in 2013, NiQuitin Strips is the first and only oral stop-smoking aid in a strip format designed for light smokers. The patented formula that suspends nicotine in a polymer system/water soluble matrix, combined with the thin format, enables it to dissolve in the mouth in approximately 3 minutes. Clinical studies have shown its effectiveness in relieving the urge to smoke in 50 seconds, allowing consumers to benefit from fast, effective craving relief in a discrete format. We have already launched this product in three markets.
Sensodyne Repair & ProtectOur Oral Care innovation continued to lead the sensitive teeth category with the introduction of Sensodyne Repair & Protect in the USA. By developing a novel non-aqueous stannous fluoride formulation, our Oral Care R&D team were able to help consumers who deal with dentin hypersensitivity. The active ingredient in Sensodyne Repair & Protect, stannous fluoride, builds a repairing layer over the vulnerable areas of teeth, to help protect from pain. Due to its instability in water, it has not been used in oral health products for many years. Addressing the stability issues and incorporating into the product formulation, Sensodyne Repair & Protect provides proven and effective lasting relief from the twinge of sensitivity and offers everyday cavity protection with fluoride.
Women’s Horlicks Continuing the success of our range of Horlicks across the Indian sub-continent, we launched Women’s Horlicks. This scientific formulation specifically meets the unique nutritional needs of women in the region. Designed to include 100% of the daily requirements of iron, calcium, folate and other vital nutrients, the product has become the first health drink for women in India with the complete list of macronutrients to be recommended by the World Health Organization.
Our ongoing commitment to innovation, creating new, scientifically differentiated products, is demonstrated by the 13% contribution to global sales from these products in 2013
R&D investment in 2013
of global sales from innovative products
£178m
13%
Highlights
The study of human performance
The GSK Human Performance Lab is a leading science facility focused on applied and discovery research. It combines our science expertise, external advisors and cutting-edge technology to deepen our understanding of human performance.
By working in partnership with individuals and organisations committed to elite human performance – professional athletes, sports governing bodies, sports teams, extreme explorers – we will be able to improve our understanding of how the body and brain function and what can be done to drive improvements in human performance.
With this scientific data and performance results, our scientists can apply the research to developing new products that not only meet, but anticipate the health needs of the wider population.
42 GSK Annual Report 2013

Pipeline progressLate stage summaryOur pipeline remains extensive. In total we have around 40 new molecular entities (NMEs) in phase II/III clinical development. A summary of pharmaceuticals and vaccines in phase III development is set out below. A more comprehensive list of our medicines and vaccines in phases I to III of development is available on pages 225-228.
Therapeutic area Compound Indication Phase III Filed Approved
Respiratory mepolizumab severe asthma (also eosinophilic granulomatosis •with polyangiitis)
Relvar/Breo Ellipta COPD – mortality outcomes •(vilanterol† + fluticasone furoate)vilanterol† COPD •fluticasone furoate asthma •Incruse Ellipta* (umeclidinium) COPD (also hyperhidrosis) •Anoro Ellipta (umeclidinium + vilanterol†) COPD •Relvar/Breo Ellipta asthma •(vilanterol† + fluticasone furoate)Relvar/Breo Ellipta COPD •(vilanterol† + fluticasone furoate)
Paediatric Vaccines MMR measles, mumps, rubella prophylaxis •(US)Mosquirix (Malaria RTS,S)† malaria prophylaxis (Plasmodium falciparum) •Nimenrix (MenACWY-TT) Neisseria meningitis groups A, C, W & Y disease •
prophylaxisOther Vaccines Zoster† Herpes Zoster prophylaxis •
Flu (pre-) pandemic pre-pandemic & pandemic influenza prophylaxis •Flu vaccine seasonal influenza prophylaxis •
Antigen-Specific Cancer MAGE-A3 immunotherapeutic† treatment of melanoma •Immunotherapeutic MAGE-A3 immunotherapeutic† treatment of non-small cell lung cancer •HIV dolutegravir + abacavir HIV infections – fixed dose combination •
sulphate + lamivudineTivicay (dolutegravir) HIV infections •
Oncology Arzerra (ofatumumab)† chronic lymphocytic leukaemia, use in relapsed patients •Arzerra (ofatumumab)† diffuse large B cell lymphoma (relapsed patients) •Arzerra (ofatumumab)† follicular lymphoma (refractory & relapsed patients) •Mekinist (trametinib)† metastatic melanoma, adjuvant therapy •+ Tafinlar (dabrafenib)Tyverb/Tykerb (lapatinib) breast cancer, neo-adjuvant & adjuvant therapy •Votrient (pazopanib) renal cell cancer, adjuvant therapy •Arzerra (ofatumumab)† chronic lymphocytic leukaemia, first line therapy •Votrient (pazopanib) ovarian cancer, maintenance therapy •Mekinist (trametinib)† metastatic melanoma •Mekinist (trametinib)† metastatic melanoma •+ Tafinlar (dabrafenib)Revolade/Promacta hepatitis C induced thrombocytopaenia •(eltrombopag)†
Tafinlar (dabrafenib) metastatic melanoma •Tyverb/Tykerb (lapatinib) metastatic breast cancer, in combination with •
trastuzumabCardiovascular & darapladib atherosclerosis (also diabetic macular oedema) •Metabolic Eperzan (albiglutide) type 2 diabetes •Immuno-inflammation Benlysta s.c. (belimumab) systemic lupus erythematosus •
Benlysta (belimumab) vasculitis •sirukumab† rheumatoid arthritis •
Rare diseases 2696273† adenosine deaminase severe combined immune •deficiency (ADA-SCID)
mepolizumab eosinophilic granulomatosis with polyangiitis •(also severe asthma)
Volibris (ambrisentan)† chronic thromboembolic pulmonary hypertension •Infectious diseases Relenza i.v. (zanamivir)† influenza •Dermatology Toctino (alitretinoin)† chronic hand eczema •
Duac low dose acne vulgaris •
† In-licence or other alliance relationship with third party* The use of the brand name is not approved by any regulatory authorities
GSK Annual Report 2013 43

Progress summary
Reducing complexity in our business remains a central element of our strategy. In doing so we can stop waste and inefficiencies and reinvest savings elsewhere in the business.
Over the last six years we have been implementing significant restructuring programmes.
We are transforming our global manufacturing network and supply chain to make it more efficient and better able to respond to the needs of our customers and patients.
We are also investing in new technology to streamline different parts of the business including manufacturing, supply chain, finance and HR.
We are undertaking a broad range of restructuring change programmes which began from 2007 onwards and are simplifying many areas of our business from supply chains to finance, HR and R&D.
In total, our ongoing restructuring programmes delivered annual savings of £3.0 billion in 2013 and are expected to deliver £3.9 billion of annual savings by 2016. Year on year incremental savings from ongoing and structural programmes were £400 million in 2013.
Safety and quality remain the priority of our manufacturing and supply organisation. We are transforming our operations to improve service for end customers and ensure safety and sustainability in our operations.
We have created six regional business centres across the globe to bring together support functions in order to streamline and standardise functional support to the businesses.
Our global ERP system deployment made significant progress in 2013, with 70% of our European Pharmaceutical revenue and 25% of our European Consumer Healthcare revenue now on the system.
The creation of the Established Products Portfolio allows us to better allocate resources to the new portfolio of medicines while also achieving reduction in inefficiencies and realising some opportunities for reinvestment.
Simplify
Restructuring annual savings £bn
07
06
05
04
03
02
01
02012 2013 Target
(2016)
2.53.0
3.9
£3.0bnrestructuring savings in 2013
Working capital days
210
180
150
120
90
60
30
02012 2013
194176
10working capital days improvement in 2013 (adjusted for divestments in 2013 and intangible asset impairments)
2011
202
Strategic report Simplify
44 GSK Annual Report 2013

Our prioritiesWe continue to restructure and simplify our business to reduce the long-term cost base.
In manufacturing we will continue to focus on delivering products of value at optimal cost and reduce pack presentations, manufacturing defects and waste.
We will fast track the implementation of the integrated supply chain supported by enterprise resource planning (ERP) in order to improve supply service levels, reduce stock outs and reduce the cost of the supply chain.
In Core Business Services we will continue to migrate services and focus on improving service efficiency and effectiveness.
We will also manage our Established Products Portfolio to reduce complexity, enhance profitability and optimise the value of this group of products.
Proximity productionSales of our Oral care products, Polident and Poligrip, increased by 10% in 2013 and are projected to grow significantly over the coming years.
As part of our ongoing efforts to create a streamlined and flexible supply chain, we moved the manufacturing of the active ingredient in Poligrip and Polident from a factory in the USA to Cork, Ireland in 2013. Now the ingredient travels just 50 miles down the road to where the products are manufactured in Dungarvan. This is expected to produce a 17% reduction in the Poligrip cost of goods by 2017 and will also reduce carbon emissions.
Pictured: One of our employees at our Dungarvan site in Ireland.
“ The production of the active ingredient in Cork will dramatically increase the speed of response to any changes in customer demand, as well as reducing the cost of production and delivery.”
Joe Power, VP and site director, Cork
GSK Annual Report 2013 45

Strategic report Simplify
SimplifyOur operating model
We have 86 sites in 36 countries manufacturing our pharmaceuticals, consumer healthcare products and vaccines. Our GMS division is responsible for 72 of these sites, employing more than 27,000 people who make and supply our Pharmaceutical and Consumer Healthcare products. The remaining 14 sites, employing 7,500 staff, are run by our Vaccines business.
We continue to review this network and seek opportunities to optimise its operations. During 2013, we closed three smaller manufacturing sites in Singapore, USA and Mexico, sold our Coleford site in the UK as part of the divestment of our Lucozade and Ribena brands and announced that one further site would leave our network in 2014. We also completed the integration of the former Human Genome Science manufacturing site in the USA, and acquired the DeMiclen Consumer Healthcare manufacturing facility in Slovakia to support growth.
We have invested in our manufacturing network throughout the year, with commitments totalling more than £300 million being announced across key centres such as the UK and India to implement improvements and technological advances into our manufacturing processes.
Supply chain progress GMS has aligned organisationally to a new model with responsibility for the entire Pharmaceutical and Consumer Healthcare supply chains – from the supplier through to delivery to the customer – creating a fully integrated supply chain.
Since 2011 our Consumer Healthcare business has been reforming and simplifying its supply chain model to implement this end-to-end chain. This has delivered over £300 million in savings since it began and created greater operating flexibility, allowing us to deliver products to customers more quickly and efficiently.
We have transferred the learnings from this during 2013 to our Pharmaceuticals manufacturing operations, creating supply chain structures aligned from supplier through to delivery to customer.
Our Vaccines supply chain is also implementing an end-to-end transformation programme to improve customer service, reduce inventories through lead-time reduction, and to improve forecast accuracy. In 2013 our key priorities here were the implementation of end-to-end inventory management, and of a new sales and operational planning process. These are well underway and will be finalised by the end of 2014.
In 2013 we continued to transform our operating model to reduce costs and complexity and improve efficiency
The transformation of our operating model and processes remains a key business strategy, enabling us to standardise and streamline important aspects of our business, including our supply chain.
Our restructuring programmes are continuing to contribute and support the delivery of significant savings. These savings are then available to be re-invested in our priority growth businesses, new product launches, or returns to shareholders.
Restructuring progressWe began our Operational Excellence restructuring programme in 2007. This programme remains on track to deliver £2.8 billion of annual savings in 2014.
In 2013 as this programme was coming to a close, we announced a new Major Change programme with a focus on improving supply chain processes, building capabilities in manufacturing and R&D, and restructuring our European business. This programme is in its early stages and remains on track to deliver £1 billion of annual savings by 2016. Together, these two restructuring programmes produced annual savings of £3.0 billion in 2013.
In addition to these programmes, we began a separate structural initiative in 2012 to reshape our long-term operating expenses and liabilities. In 2013 this produced a reduction of approximately £280 million in our long-term employment costs through restructuring of our post-employment medical benefits. In 2012 there was a benefit of £395 million when we restructured our pension obligations.
Taking these ongoing and structural initiatives together in 2013, we delivered incremental year-on-year savings of around £400 million with a similar amount expected in 2014 helping to offset mix pressure and fund ongoing investment requirements.
We have also continued our integration of Human Genome Sciences into the business, and restructuring benefits in 2013 from this were around £130 million.
Global manufacturing and supplyThe global manufacturing and supply (GMS) division is focused on delivering a transformational plan to enable us to manufacture and supply both the new product portfolio and our existing products to consistently high quality and with increased efficiency.
Further simplification in our supply chain is driving greater efficiency in areas including logistics and warehousing, procurement, portfolio simplification and manufacturing. These programmes are at an early stage but have already reduced volatility and improved responsiveness allowing better inventory management which has already delivered £100 million of benefits in our Pharmaceutical supply chain in 2013.
We have also been reducing the complexity of our portfolio of existing products. By discontinuing unprofitable packs and standardising pack presentation formats we are improving operational efficiency while ensuring patient and customer needs are met (see case study opposite). This year we have reached our target of 10% discontinuations by year end and remain on target to achieve the reduction of 25% of packs in our portfolio over the four-year period to 2016.
Core Business ServicesThe Core Business Services (CBS) group was set up in 2011 to bring together support functions including facilities management, HR, IT, finance and procurement, into a centralised team to streamline and standardise these operations. Our aim is to increase productivity, and free up time in the businesses so they can focus on the execution of business strategy in their local markets, and reduce the number of global support staff.
We have invested in a global enterprise resource planning (ERP) system which is playing an important role in reducing costs, improving service levels and reducing working capital in manufacturing, the supply chain and commercial operations. Roll-out of the ERP is on time and on budget.
Following the positive start made in 2012, further progress was made through 2013 in enrolling our European pharmaceutical and vaccines markets on our commercial ERP system. 70% of our European Pharmaceuticals revenues and 25% of our Consumer Healthcare revenues are now on the system.
In 2013, we completed advance deployment of the forecasting and planning element of the ERP system to markets in Latin America. Now all GSK businesses in the region forecast and plan on the same system to the same data standards. This has enabled the consolidation of reporting and business analysis.
46 GSK Annual Report 2013

We are also accelerating the deployment of improved forecasting and planning processes across the Group, enabled by ERP. This should result in a reduction in supply chain operating costs, reduced inventory levels, and improved forecasting. The roll out is expected to be completed by mid 2015.
A key element of the CBS approach has been the creation of six regional multifunctional business service centres that will focus on delivering robust and effective services to the markets, sites and regions. In 2013, we opened four centres – one in Costa Rica, two in the USA and one in the UK – complementing those in Kuala Lumpur and Poland that began operation in 2012. This global network is the foundation for standardising and continuously improving the support services offered to all business units. This centralised model will improve process efficiency and effectiveness and free up time in the businesses so they can focus on the execution of business strategy in their local markets.
Cutting variation in a drive to enhance productivity
At the beginning of 2013, we conducted an audit which identified that our manufacturing group was making our migraine treatment, Imigran, in more than 360 different packs of varying size and quantity of tablets. Each different pack format required a unique manufacturing process, meaning that the more pack formats we make, the greater the cost and complexity of manufacturing.
In a bid to reduce these costs, we looked at ways to simplify the number of pack formats. This involved a review of all of the Imigran packs and listening to patients to find out which pack formats they liked best.
As a result, we were able to discontinue 8% of the Imigran pack formats during 2013 and expect to cut a further 5% in 2014. We achieved these cost reductions with no change in total supply of the medicine. By discontinuing the least popular pack formats, we have more resource to ensure we continue to meet demand for the most popular Imigran packs.
The reduction in pack formats for this product was just one part of an overall global initiative that we started in 2013 to reduce our number of packs by around 20%. In 2013, we discontinued 10% of our pack formats and we are aiming to cut a further 9% of our overall number of pack formats by the end of 2014.
This initiative is particularly important for our Established Products Portfolio (EPP). EPP comprises around 50 products, as well as our branded generics business and other local products that, together, make up annual sales of around £4 billion. Many of these products are no longer promoted, and so it is important that operating costs and processes for these products are simplified as far as possible, to allow us to focus on new product launches and products with the greatest growth potential.
Under the umbrella of CBS we have also conducted a number of targeted programmes to simplify our business and take out costs. In IT, for example, the introduction of new global platforms to run standard enterprise-wide processes and reduce the number of individual business applications has seen the organisation decommission 407 applications since the beginning of 2012 – 8% of the total.
By developing global category strategies, we have begun to standardise the material specifications and removed complexity from our supply base.
In HR, we started implementing the people management element of the system globally. By the end of 2013, all the GSK and agency employees in Canada and Latin America were on the system.
GSK Annual Report 2013 47

Our financial architecture
Our financial architecture is designed to support the execution of our strategy and to enhance returns to shareholders
GSK’s financial architecture is focused on four key priorities: delivering sustainable sales growth, improving operating leverage, improving financial efficiency and converting more of our earnings into cash.
Our financial architecture is designed to ensure we are maximising the returns from more sustainable sales growth. To do this we continue to simplify our business, allocate our resources more efficiently and flexibly and build leverage across the P&L to drive earnings per share faster than sales and in turn convert more of those earnings into cash that we can reinvest in the business and return to shareholders, wherever the returns look most attractive.
By applying this architecture consistently, we are driving better and more consistent decision making across the company. Our capital allocation decisions are rigorously benchmarked using a Cash Flow Return on Investment (CFROI) framework.
Sales growthReported sales in 2013 grew 1% to £26.5 billion. Excluding the impact of product disposals made in 2012, sales grew 3%. Five businesses – respiratory, oncology, Vaccines, ViiV Healthcare and Consumer Healthcare – accounted for around 70% of sales in 2013 and grew by 4% (CER). As we move into 2014, we expect to deliver sales growth of around 2% CER (excluding products divested in 2013).
Operating leverageIn 2013, core operating profit was flat at CER. On a reported basis, the core operating margin declined by 1 percentage point of which 0.5 related to negative impact from currency. The operating margin benefited from reduced R&D costs and higher royalty receipts offset by expected upward pressure on cost of sales from the unwinding of costs of manufacturing volume shortfalls, adverse mix and the impact of preparing for the launches of new pipeline products. The Group’s continuing restructuring programmes contributed incremental year-on-year savings of around £400 million from both ongoing and structural initiatives.
Earnings per shareIn 2013, the significant progress in improving our financial efficiency, together with our continued share buy-back programme, enabled us to deliver core EPS up 4% to 112.2p which was at the top end of our EPS guidance range of 3% to 4%.
In 2014, we expect to deliver core EPS growth of 4-8% CER, on turnover growth of around 2% CER, on an ex-divestment basis (2013 EPS base of 108.4p, turnover base £25.6 billion).
Cash conversionThe business remains highly cash-generative and we continue to focus on improving conversion of earnings into cash through greater focus on cash generation and capital allocation. A particular focus is on working capital and in 2013 we continued to make progress. Excluding the distorting impact of disposals and intangible write-offs, we reduced the working capital conversion cycle by ten days in 2013.
On a cash basis, we delivered an additional £46 million of savings despite renewed growth in many of our businesses and the need to start building inventory behind our new launches. We are developing an end-to-end supply chain that joins our manufacturing and commercial businesses to increase visibility, accountability and flexibility, hence reducing the inventory required and releasing cash.
Returns to shareholdersFree cash flow is available to invest in the business or to return to shareholders consistent with protecting our credit profile. The priority is to cover the dividend but free cash flow above and beyond this requirement is available for share buy-backs or bolt-on acquisitions, wherever the most attractive returns are available.
The decision as to how to allocate such cash flow is rigorously benchmarked using a returns-based framework based on CFROI comparisons.
In 2013 we returned £5.2 billion of cash to shareholders. We paid £3.7 billion in dividends with our ordinary dividend up 5% to 78p per share. In addition we bought back £1.5 billion of shares as part of the long-term programme that we started in 2011.
In 2014 we expect to deliver continued dividend growth and we are currently targeting share repurchases of £1–2 billion.
Strategic report Our financial architecture
The £280 million contribution from structural benefits in 2013 which related to savings in our long-term employment costs through restructuring of our post-employment medical benefits was approximately £115 million lower than in 2012 when we restructured our pension obligations.
We remain focused on managing our cost base more effectively. Our Operational Excellence programme was initiated in 2007 and remains on track to deliver annual savings of £2.8 billion in 2014. In addition our new major change programme, announced in 2013 is on track to deliver pre-tax savings of at least £1 billion by 2016.
We continue to balance cost savings with continued investment in the business to support the new launches of our R&D pipeline, which will be a key driver of future sales growth. With increasing contributions from pipeline sales in 2014 onwards, we remain confident that we can drive improvement in the core operating margin over the medium term.
Financial efficiencyDespite the pressure on the operating margin in 2013, financial efficiencies delivered significant value during the year and contributed positive leverage to our reported core earnings per share (EPS).
We made further financial efficiency gains in 2013, taking advantage of an era of low interest rates to secure more attractive long-term funding rates, without losing flexibility. Overall we have reduced net funding costs by 3 percentage points since 2010 while maintaining our targeted credit rating of A1/P1 to preserve access to short-term capital markets.
We also continue to align our tax strategy with our future business profile and have implemented a number of measures to centralise our Pharmaceutical intellectual property and product inventory ownership in the UK. This allowed us to reduce our 2013 core tax rate to 23.0% from 24.4% in 2012, which is ahead of our expectations at the beginning of the year. We continue to expect improvements in the tax rate, especially as new products come through which will benefit from the newly introduced patent box arrangements in the UK. Our core tax rate in 2014 is expected to be around 22%.
48 GSK Annual Report 2013

Financial architecture to drive improved returns
Focus on returns
Sales growth
Operating leverage
Financial efficiency
Cash flow growth
EPS
Free cash flow
Returns to shareholders
Measurement and reportingFrom January 2014, the Group will report the Established Products Portfolio of more than 50 tail brands with sales totalling £4.2 billion in 2013 (£3.9 billion excluding divestments) as a separate segment. We have set up this segment to bring greater focus on how we optimise value and in particular profits and cash from this group of products. Where we can realise more attractive value than our own efforts we will also consider further divestments.
GSK Annual Report 2013 49

Strategic report Responsible business
ResponsiblebusinessBeing a responsible business is central to our strategy and mission, and how we deliver success is just as important as what we achieve.
Operating responsibly and ensuring our values are embedded in our culture and decision-making helps us better meet the expectations of society.
In 2013 we continued to take bold steps to modify our business model. Specifically we made further progress on driving access to our medicines in the poorest countries, took action to increase
the transparency of our clinical research and modernise our commercial practices and the way we interact with our customers, and passed a significant milestone in the development of a potential vaccine against malaria.
We continue to invest in our people and are working hard to reduce our environmental footprint.
We made good progress in 2013 towards our forward-looking commitments that we announced in 2012. These commitments are reported across our four areas and they aim to address unmet global health needs and are aligned with our strategic priorities and values.
Health for all• IncreasedthevolumeofmedicinessuppliedtoLeast
Developed Countries since 2010 by 60%.
•Achievedamajormilestoneinthedevelopmentofourmalaria vaccine candidate, RTS,S, which will lead us to submit a regulatory file in 2014 to make the vaccine available at a not-for-profit price in sub-Saharan Africa.
•FormedaninnovativenewpartnershipwithSavetheChildren to help save the lives of one million children over five years.
Our behaviour•Becamethefirstpharmaceuticalcompanytoenable
external researchers to access detailed anonymised patient-level data from our clinical trials through a new online system.
•Announcedplanstoevolvethewaywesellandmarket products to healthcare professionals to further align the company’s activities with the interests of patients.
Our people•Begantheroll-outofpreventativehealthcare
benefits through our Partnership for Prevention programme which will be available to employees and their families worldwide by 2018.
•Launchedanewperformancemanagementsystemto better link employee reward with our values.
Our planet•OurScope1and2carbonemissionsfromour
operations grew slightly by 0.6% in 2013, although these have declined by 7% since 2010.
•Webecamethefirstcompanytobeawardedglobalcertification to the Carbon Trust’s Water Standard in recognition of our year-on-year reductions in operational water use globally.
Progress summary
50 GSK Annual Report 2013

Malaria milestoneLast year, malaria killed an estimated 627,000 people and more than three quarters of these deaths occurred in children under five.
The malaria parasite endemic in sub-Saharan Africa, Plasmodium falciparum, is also the most serious type of malaria where acute infections can rapidly become life-threatening.
Working in partnerships with others, we have been carrying out research into a vaccine to fight malaria for more than 30 years. In 2013, we achieved a major milestone in the development of the world’s first vaccine against P falciparum. Phase III data showed that our vaccine almost halved the number of cases in young children (aged 5-17 months at first vaccination) in the 18 months after vaccination.
Based on this data and previous studies, we plan to submit a regulatory application to the European Medicines Agency in 2014 and the vaccine could be available as early as 2016.
Nahya (pictured), a paediatrician, has been involved in the RTS,S malaria vaccine trial at the Ifakara Health Institute in Tanzania.
“ It’s our hope that the malaria vaccine could help many, many children. It could help reduce the burden of malaria as a disease.”
Nahya Salim, paediatrician and research scientist in Tanzania, Africa
ReferencesWorld Health Organization – Fact sheet on the World Malaria Report 2013. December 2013.
http://www.who.int/malaria/media/world_malaria_report_2013/en/index.html
Wellcome trust – Plasmodium falciparum http://malaria.wellcome.ac.uk/doc_WTD023865.html
Our prioritiesIn 2014, we will continue to challenge our business model at every level to ensure we are responding to the needs of patients and meeting the wider expectations of society.
Next year we will begin a two-year process to end the practice of paying health care professionals to speak on our behalf. This move will help put patient interests first.
GSK Annual Report 2013 51

Strategic report Responsible business
To improve access, we employ innovative funding mechanisms and use a flexible pricing approach that is based on a country’s wealth and ability to pay. Our Developing Countries and Market Access (DCMA) operating unit seeks to increase patient access to our medicines and vaccines for around 800 million people in the Least Developed Countries (LDCs), as defined by the United Nations.
Since the DCMA unit was established in 2010, the volume of medicines we supply to LDCs has increased by 60% from 55 million units in 2010 to 89 million in 2013.
The price of our patented medicines in the LDCs is capped at no more than a quarter of our developed world prices. Since 2009 we have also re-invested 20% of our profits in the LDCs into local healthcare capacity-building projects in those countries. In 2013 this amounted to £5.1 million and since 2009 we have reinvested £15 million.
We aim to make our established, off-patent products available to developing countries through our ‘catch up’ programme. Through this programme, we have been seeking approvals for our medicines in these markets, and have received approvals for 26 products in 2013.
In vaccines, we have used a tiered pricing model for over 20 years and, in 2013, we updated our approach to better align with a country’s ability to pay. For the least well-off countries, we work closely with GAVI and UNICEF to improve access to vaccines. These organisations, which purchase large volumes of vaccines for the world’s poorest children, always benefit from our lowest prices.
We aim to take a responsible approach to pricing in all markets. It is important that prices reflect the value our medicines bring to patients but we are also very mindful of the burden of healthcare costs. For example, we have priced our newly launched products at or below the prices for those currently available, despite their positively differentiated profiles. For example, in the USA we launched Tafinlar, our BRAF inhibitor, last year with a price around 30% lower than an existing BRAF inhibitor.
Diseases of the developing world Neglected tropical diseases (NTDs) like leprosy and intestinal worms affect billions of people in the world’s most vulnerable communities. As a leading member of the London Declaration, GSK is working with the Bill & Melinda Gates Foundation and 12 other pharmaceutical companies to control or eliminate ten of the 17 NTDs by 2020 that affect 1.4 billion people.
Responsible businessOur approachHow we conduct our business is just as important to us as the financial results we achieve. We strive to put our values at the heart of every decision we make and to meet or exceed the expectations of society
Our commercial success is directly linked to operating in a responsible way. We report our approach and the progress we are making across four areas:
•Healthforall
•Ourbehaviour
•Ourpeople
•Ourplanet
In 2012, we developed longer-term commitments across these four areas. They reflect global health needs and are aligned with our strategic priorities and our values of transparency, respect for people, integrity and patient focus.
This year we will be reporting on our progress against these commitments in our 2013 Corporate Responsibility Report available on gsk.com/responsibility.
The following pages provide an overview of our approach.
Health for all Our mission is to improve the quality of human life by enabling people to do more, feel better, live longer. The main way we can do this is through developing new medicines, vaccines and consumer products and increasing access to these products for those who need them, regardless of their ability to pay. At the same time, we need to generate returns so that we can be a sustainable business that invests in research for the new treatments of tomorrow.
To achieve this, we have been evolving our business model and implementing novel approaches such as flexible pricing structures. We have also been accelerating our innovation processes by opening up our research findings and resources to others, and working in new ways with partners.
Access to healthcare We are committed to improving access to patients who need our products irrespective of their ability to pay, by focusing on product affordability and availability, and investing in stronger healthcare systems in developing countries.
Strategic report Responsible business
Our most significant contribution to this is in the elimination of lymphatic filariasis (LF) and control of soil-transmitted helminths (intestinal worms) through the donation of albendazole tablets. In 2013, we shipped 763 million tablets, bringing the total donated to more than 4 billion tablets since 1998.
We are also researching new treatments for other diseases such as sleeping sickness, Chagas disease and visceral leishmaniasis.
Approximately 627,000 malaria-related deaths were reported last year and GSK is committed to tackling this disease. We have invested $350 million in the development of our malaria vaccine candidate RTS,S, including collaborations with the PATH Malaria Vaccine Initiative and support from the Bill & Melinda Gates Foundation. This year, our clinical trial reported further data on the vaccine (see page 34) and we intend to submit a regulatory application in 2014. We are also developing tafenoquine for the treatment and relapse prevention of P vivax malaria.
We remain committed to supporting the World Health Organization objective of eradicating polio completely by 2018 by providing vaccines to UNICEF. In 2013, we provided 412 million doses of oral polio vaccine to the Global Polio Eradication Initiative.
Innovative science to create value for all Our approach to R&D includes our strategy for open innovation for the diseases of the developing world, which seeks to stimulate innovation and enhance the productivity of our research process. This research has transformed our approach to intellectual property and external partnerships.
While our current open innovation models focus on diseases of the developing world, we are also exploring ways to extend these models to solve other significant health challenges where the traditional business model is inadequate, including anti-microbial resistance and non-communicable diseases such as Alzheimer’s disease.
In early 2014, we joined the Accelerated Medicines Partnership (AMP) – a new partnership between the National Institutes of Health (NIH), ten pharmaceutical companies and three non-profit organisations. The goal of the AMP is to transform the current model for developing new diagnostics and treatments in challenging disease areas and make the data generated available to the broad biomedical community. We will be participating in and providing funding for the Alzheimer’s pilot.
52 GSK Annual Report 2013

We also believe that by sharing our research findings – both positive and negative – we can stimulate innovation and help others to build on our existing research. Our aim is that this will accelerate the drug-development process to produce new medicines for patients.
Health and well-being in our communities We are committed to improving the health and well-being of our communities by supporting programmes that improve healthcare infrastructure, enhance science and health education and assist in humanitarian relief.
In 2013, GSK donated medicines valued at £146 million (at cost) and £54 million in cash. Product donations worth £3.8 million were provided to our partners AmeriCares, Direct Relief, IMA World Health, MAP International and Project HOPE for humanitarian aid. These partners distributed donated medicines to 87 countries in 2013. This included providing supplies of antibiotics and basic medicines to those affected by conflicts and natural disasters, including the earthquake in Pakistan, the typhoon in the Philippines and the tornadoes in the USA.
GSK’s annual IMPACT Awards have channelled more than £8 million to over 450 outstanding healthcare charities in the UK and the USA over the past 16 years.
Our behaviourWe aim to put the interests of patients and consumers first and to have our decisions guided by our four values of transparency, respect for people, integrity and patient focus. We have policies, guidance and codes of conduct in place for our people, our partners and our suppliers.
Living our values and principles Ethical conduct is a priority for GSK. We need to operate with integrity around the world, in our interactions with patients, prescribers, payers and governments and we must live our values. Failure to uphold high ethical standards could impact our company’s success.
Our zero tolerance approach to bribery and corruption applies to everyone at GSK as well as third parties who act on behalf of the company.
In this context we were concerned and disappointed by allegations of fraudulent behaviour in our China business. We are taking this matter extremely seriously and are co-operating fully with the Chinese authorities.
We have taken a number of actions, including commissioning an independent report from international legal firm Ropes and Gray, who have extensive experience in anti-corruption and international risk.
We are committed to learning any lessons required as a result of the Chinese investigation and will take all appropriate steps as necessary at its outcome. We remain fully committed to China, supporting the government’s healthcare reforms and to supplying our products to patients.
In 2013, we simplified the policies underpinning our Code of Conduct and completed our annual business certification programme. The Ethical Leadership Certification requires managers and designated employees to certify their awareness, understanding, and compliance with GSK’s values and policies. Over 65,000 designated employees had completed the certification process in 2013.
We continue to support the Guiding Principles on Business and Human Rights, as endorsed by the United Nations Human Rights Council in 2011. In recognition of these principles, we undertook a systemic assessment in 2013 to identify our human rights impacts and prioritised seven areas to further examine GSK’s policies and processes. We also updated our GSK Human Rights Statement based on the findings of our assessment.
Research practices We seek to ensure that our research practices meet high ethical standards and patient safety remains our first priority.
Our clinical trials are conducted in accordance with Good Clinical Practice (GCP) guidelines. All employees complete training on GCP before undertaking any roles related to GSK-sponsored clinical research. In 2013, there were 44,685 GCP-related training activities. We also conducted 323 clinical-quality assurance assessments.
In addition, we conducted 51 investigations of suspected irregularities and took corrective action where appropriate. Independent regulatory authorities also performed 112 inspections of GSK sites and the investigators we used to conduct clinical trials.
58%23%
19%
Programmes supported by financial giving in 2013
Health and well-being Education Other
24%
66%
2%8%
Our giving in 2013
Cash £54 million Product and in-kind £146 million Time £4 million Management £17 million
£m Cash 54 Product and in-kind 146 Time 4 Management 17
GSK Annual Report 2013 53

Responsible businesscontinued
Strategic report Responsible business
In 2013 we began a programme that will modify nearly 200 packaging lines across 25 manufacturing sites internationally, allowing us to provide unique serial numbers on nearly 7,000 stock keeping units.
We greatly value the relationships we have with our many suppliers and understand the pressures on cash flow and financing faced by smaller companies. Following a change to our standard payment terms for suppliers in the UK and USA in 2012, we offered to review these payment terms for smaller suppliers identified as micro, small and medium size enterprises in Europe or diverse suppliers in the USA. We also offer a range of supply chain finance options to both our UK and US suppliers.
Several companies have taken up these opportunities already and we are planning increased communications to make more of our smaller suppliers aware of the support available.
Sales and marketing with integrity GSK has an important role to play in supporting education for healthcare professionals (HCPs) and in providing accurate information about our medicines to help them make the best treatment decision for their patients. In 2013, we announced plans to evolve the way we interact with HCPs to further align our activities with the interests of patients.
In 2014, we will implement a new compensation system that will apply to all GSK sales employees who detail our prescription products to prescribing healthcare professionals. This will mean sales professionals being evaluated and rewarded for their technical knowledge, the quality of the service they deliver to support improved patient care, and the overall performance of our business, replacing individual sales targets.
This follows the success of our actions in the USA where we decoupled reward for our sales representatives from the number of prescriptions issued, focusing instead on demonstration of our values and on the patient.
In addition, we intend to phase out the practice of paying HCPs to speak on our behalf about our products or disease areas to audiences who can prescribe or influence prescribing.
We will work to implement these changes effectively in line with local laws and regulations across our global business by the start of 2016.
We will strengthen our own dedicated medical and scientific capability to appropriately lead engagement with HCPs. We will improve our multi-channel capability, including use of digital technologies, to ensure appropriate product and disease area information can be provided to HCPs conveniently. Finally, we will support fair, balanced and objective medical education for HCPs through provision of independent educational grants.
We will continue to offer appropriate fees to HCPs who provide services for GSK-sponsored clinical research, advisory activities and market research. These activities are essential to provide us with insights on specific diseases, identification of symptoms and diagnosis, application of clinical trial data or medication dosage and administration, and on how to effectively and appropriately communicate the benefits and risks of its medicines to help meet patient needs.
Our peopleOur people are essential to our success. We focus on building their individual capabilities and aim to support and empower them to be the best they can be.
Talent and leadership development We aim to attract and retain the most talented people by investing in training and development that is tailored to individuals’ needs and recognises the potential of our employees.
In 2013 over 3,500 leaders completed our Leading Delivery programme, which helps middle-level managers translate the strategic ambition of our business into meaningful action. We also enrolled over 140 leaders onto Leading Business, which is designed to develop the capabilities of those managing a business function. For people who are new to management positions, we launched Management Essentials, which teaches basic management skills.
During the year, we continued to support entry-level students through internships, industrial placements, apprenticeships and graduate schemes. In 2013, we increased our graduate intake to 334 from 303 (in 2012) as part of our aim to recruit 450 graduates a year by 2015.
Coaching was a global focus in 2013. We reached over 6,500 leaders in 30 countries through our coaching programmes to strengthen leadership capabilities.
In 2013, we built on our long-standing commitment to clinical trial transparency. To facilitate further research that can help advance medical science or improve patient care, we launched an online system to enable researchers to request access to detailed anonymised patient-level data from our clinical trials. We also began publishing Clinical Study Reports (CSRs) once the medicines have been approved or terminated from development. This will extend back to the formation of GSK in 2000, starting with the most commonly prescribed medicines. We also support the AllTrials campaign, which calls for full reporting of methods and results of all trials.
In early-stage research, we use a number of methods for drug discovery work, including in some cases research involving animals. We use alternatives to animals whenever we can. However, in some studies animal research is the only method that can be used to demonstrate the effects of a potential new medicine in a living body before it is tested in humans. When animals are used in research, we are committed to acting ethically and practising good animal welfare and minimising the number of animals used. In 2013, the number of animals we used declined by 10% and was 33% lower than in 2000. Most animals in our research – including research carried out by contractors – are mice. Less than 0.3% of the animals we use are non-human primates.
Manufacturing and supply Efficient and responsible manufacturing and supply is key to GSK. We expect suppliers to uphold the same high standards we set for ourselves, which is based on our Code of Conduct.
We conduct audits on governance, risk management, environmental, health and safety and sustainability issues on a subset of suppliers, which have been identified as critical to our supply chain.
GSK is also a member of the Pharmaceutical Supply Chain Initiative (PSCI), which audits suppliers on their labour practices, and their environment, health and safety performance.
Moving to an end-to-end supply chain operating model for our Pharmaceutical and Consumer Healthcare products will standardise and improve controls across our entire supply chain.
During 2013 we continued to address the problem of counterfeiting. One effective measure, initially adopted in China, is to use serial numbers on product packages to enable electronic monitoring for the purpose of patient safety.
54 GSK Annual Report 2013

Our PULSE volunteer partnership programme gives employees the opportunity to work full-time for three or six months with a non-profit organisation or charity to help address global healthcare challenges while developing their leadership skills. In 2013, 99 employees volunteered with 47 organisations, including Save the Children, as part of our new global partnership with the charity.
Inclusion and diversity Our focus is to enable gender diversity in management and senior roles. In 2013, we introduced targeted individual and group coaching and sponsorship for emerging diverse talent. In 2014, we will invite employees to join dialogue sessions to discuss and address hidden barriers that could hinder gender diversity.
At the end of 2013, 57% of our global workforce were male and 43% were female.The percentage of women in managementcontinued to rise in 2013.
Women in management positions (%)
2009 2010 2011 2012 2013SVP, VP 25 25 26 27 28
Director 36 37 38 39 40
Manager 42 42 42 43 44
Total 38 38 39 40 41
Women represent 21% of our Corporate Executive Team and we have exceeded our goal to achieve at least 25% female board representation by 2013. Female Non-Executive Directors make up 33% of the Board. We ranked joint third in the 2013 Female FTSE 100 Board Report, a study of women’s representation on the boards of the UK’s top companies.
Employees by gender (number)
Male Female TotalBoard 10 5 15
Management* 9,483 6,705 16,188
Total employees 56,621 42,830 99,451
* Management: senior managers as defined in the Companies Act 2006 (Strategic Report and Directors’ Report) Regulations 2013, which includes persons responsible for planning, directing or controlling the activities of the company, or a strategically significant part of the company, other than the Board, including directors of undertakings included in the consolidated accounts.
Partnership with Save the Children to help save 1 million lives
We aim to help save the lives of 1 million children through our partnership with Save the Children. By combining our R&D capabilities and on-the-ground expertise, we will bring much-needed medicines and vaccines to some of the world’s poorest children, train thousands of healthcare workers, and seek to alleviate child malnutrition.
This new partnership builds on our collaboration with Save the Children over the past eight years, including as part of our 20% reinvestment programme in Least Developed Countries and our Africa Malaria Partnership.
We are investing at least £15 million in this initiative and encouraging our employees to contribute £1 million a year through fund raising. We are establishing two signature programmes to demonstrate interventions in the Democratic Republic of Congo (DRC) and Kenya, while a joint paediatric board will look at new or repurposed products to tackle the causes of newborn and infant death.
One of our first life-saving projects is the reformulation of chlorhexidine, an antiseptic found in our Corsodyl mouthwash, into a gel for umbilical cord cleansing to prevent infection in newborns.
We are also registering a child-friendly, powder-based antibiotic in the DRC to help fight pneumonia, one of the biggest killers of children under five. These interventions are two of the 13 recommended in the report of the UN Commission on Life-Saving Commodities.
We also teamed up with Save the Children to award US$1 million in recognition of healthcare innovations originating in the developing world designed to reduce infant mortality. In 2013, the award was split between five organisations. The largest portion was awarded to Friends of Sick Children in Malawi, for their development of a low-cost device to help newborn infants breathe.
Elis
sa B
ogos
/Sav
e th
e C
hild
ren
GSK Annual Report 2013 55
Setting the standard in employee healthcare
We are putting our values into practice by offering competitive benefits packages, including preventive healthcare for employees and their families.
Our Partnership for Prevention (P4P) programme offers all eligible employees and their family members access to up to 40 preventive health services at little or no cost. P4P will be available to employees across GSK by 2018. To date P4P benefits are in place for over 5,200 employees and family members in 11 countries.
As part of the P4P pilot, which ran in 2012, we focused on encouraging employees to do more exercise and improve their diet and have since developed a global physical fitness programme that will be launched in 2014.
Responsible businesscontinued
Strategic report Responsible business
Making sure that people with disabilities have access to career opportunities and capturing their talent is a global focus for us. In 2014, we will establish a Global Disability Council within GSK to agree priority areas for improving opportunities for disabled people, develop objectives to drive our disability agenda forward, and monitor and report on our progress.
The rich cultural diversity of our employees is a key strength in helping us meet the diverse needs of patients and healthcare providers in countries in which we operate. Staff based in our Emerging Markets, Asia Pacific and Japan regions represented 43% of our total workforce in 2013. Six nationalities are represented on the Corporate Executive Team and Board.
We monitor and benchmark the proportion of ethnic minorities in our workforce against industry averages and the national population in countries such as the UK and USA and engage with groups representing diverse communities.
Engaging our people Our CEO and members of the Corporate Executive Team deliver live broadcasts and messages to keep employees updated about the company’s progress towards its strategy and commitments.
Our frequent global employee survey helps us understand our performance as an employer. During 2013, we have taken steps to address issues identified by the last survey, completed in 2012, with a focus on training leaders to be better coaches, supporting employees through change and better recognising individuals’ contributions.
In 2013, we introduced interim surveys for individual business units and functions and covered some 36,000 employees. Results showed that most businesses had made significant improvements in team leader effectiveness, a priority area for improvement based on the 2012 survey results.
GSK employees were again enthusiastic participants in our Orange Day volunteer programme, which gives staff one paid day a year for this purpose. In 2013, we also challenged employees around the world to work together to raise over £1 million a year for five years for Save the Children.
Health and safety and well-being As a progressive healthcare company, we believe that helping our employees be healthy, resilient and productive is a priority and brings our mission to life for our people.
To achieve our goal of zero harm to employees, we focus on preventing incidents before they occur and in 2013 training activities focused on key risks such as driver safety and machinery-related incidents. We had two serious incidents in 2013. The injury and illness rate in 2013 was 0.29 per 100,000 hours worked – down from 0.33 in 2012. This was under-reported in 2013 and we are working to include data from a number of Commercial Operations business units.
We also worked to increase reporting of near miss incidents so that we can better understand how and why such events occur and then share this knowledge across the business to help prevent more serious incidents. As a result, in 2013, we reported 131,924 such events – an increase of 98% since 2012.
We also expanded our network of health and safety co-ordinators who make sure our safety programmes are on track, and expanded a driver safety programme to five continents.
We continued to implement risk reduction initiatives and further improved process safety in manufacturing and R&D to prevent serious events such as fires, explosions and releases of hazardous substances.
Our Energy for Performance programme helps employees remain focused and energised and productive. By the end of 2013, 44,500 employees in 55 countries had participated in energy and resilience training since 2008.
Our Employee Assistance Programme offers advice, information and counselling through a confidential helpline and website and is available to employees.
Performance, reward and recognition Incentivising behaviour that is consistent with our values is a priority in the way we evaluate, recognise and reward performance. In 2013, we announced a new performance system that will come into effect in 2014. This system is designed to ensure our employees understand what is expected of them and help them connect their contribution to the delivery of our strategy and their reward.
For our most senior people, we disincentivise unethical working practices using a ‘clawback’ mechanism that allows us to recover performance-related pay.
We are committed to supporting the health and well-being of our employees and their families and during the year we began to phase in our global preventive healthcare initiative, the Partnership for Prevention programme (see Setting the standard in employee healthcare).
56 GSK Annual Report 2013

Our planetTo ensure we can continue to deliver high- quality products to patients and consumers in the future, we must protect the natural resources we need to make them today.
Carbon We have set ambitious targets to achieve a carbon-neutral value chain by 2050. Our operational emissions remain lower than our 2010 baseline and we are engaging with employees, suppliers and customers to address carbon emissions in our value chain – from sourcing of raw materials and transport, to use and disposal of our products. We are using carbon footprint analyses of our top 35 products to target the most effective reductions.
Our scope 1 & 2 carbon emissions from our operations grew slightly by 0.6% in 2013, although these have declined by 7% since 2010. The investments we made in 2013 will start to deliver further carbon emission reductions in 2014 (see Carbon emissions table). Scope 1 emissions refer to all direct greenhouse gas emissions, including burning fuels for energy, emissions from sales force cars, emissions during manufacture of metered dose inhalers and other process emissions from our manufacturing operations and waste treatment. Scope 2 emissions include indirect greenhouse gas emissions from consumption of purchased electricity, heat or steam.
Our scope 3 emissions (excluding raw materials) increased by 1.5% in 2013 across the value chain due to strong sales of HFA propellant-based inhalers, and have increased 11% since 2010. Scope 3 emissions are all the other indirect emissions, not included in scope 2, such as embedded carbon dioxide in purchased raw materials, the propellant released when patients use and dispose of our metered dose inhalers, as well as business travel by air and logistics.
Materially important emissions – such as the emissions from the use of our metered dose inhalers – are detailed in our value chain carbon footprint performance data, published in our 2013 Corporate Responsibility Report.
Important achievements in 2013 include:
•TheBestinContinuingCarbonReductionAward 2013 from the Carbon Trust for year-on-year overall reductions in emissions.
•Collaboratinginthelaunchofatooltohelpcompanies calculate the carbon footprint of tablet medicines that are distributed in blister packs.
•BeingnamedintheCDPPerformanceLeadership Indices as a global leader in tackling carbon emissions and for our transparent reporting.
Water In 2013, we achieved a further 2% reduction in water use from the previous year, keeping us on track to meet our target to cut operational water use by 20% by 2015 from our 2010 baseline.
We mapped water usage across our value chain in 2013 and identified that the production of the raw materials we use accounts for an estimated 84% of our total water footprint and our own operations represent just 1%.
In 2013, we became the first company to be awarded global certification to the Carbon Trust’s Water Standard. As part of the assessment, the Carbon Trust audited sites in the UK, USA and India.
Waste In 2013, we generated 11% more waste than in 2012 as a result of business growth, but we reduced our waste by 6% compared to our 2010 baseline. Only 6% of total waste was sent to landfill and 37 of our sites have now achieved zero waste to landfill – up from 34 in 2012. By 2020, we aim to halve our operational waste compared to 2010 and have zero waste to landfill.
In the UK, we installed equipment at our site in Ware to dismantle spent respiratory inhalers so we can recycle the components.
In 2013, we repeated our survey of suppliers of packaging and leaflet paper and used this information to help us in our purchasing decisions.
Other impacts We manage a range of other important issues to reduce our environmental impact. For example we use ‘green chemistry’, which aims to reduce the use of hazardous chemicals and processes from drug development by replacing them with those that have a lower environmental impact.
Our Green Chemistry Performance Unit, established in 2012, researches ways to replace hazardous or unsustainable chemicals with better alternatives.
To support research into sustainable chemistry, we are investing in a new centre of excellence for green chemistry at the University of Nottingham in the UK and have pledged annual funding until 2024 for a second Centre of Excellence for Sustainable Chemistry in São Paulo, Brazil. In Singapore, we are funding research into green and sustainable manufacturing as part of our partnership with the Singapore Economic Development Board.
Carbon emissions
Tonne CO2e 2010 2011 2012 2013
Scope 1 emissions 1,011,180 1,035,856 1,018,014 1,037,288Scope 2 emissions 964,215 881,101 804,253 796,034
Total scope 1&2 emissions 1,975,395 1,916,957 1,822,267 1,833,322
Intensity ratios 2010 2011 2012 2013
Sales Revenue £ 000,000 28,392 27,387 26,431 26,505Scope 1&2 (tonnes CO2e)/ sales revenue £ (millions)
69.6 70.0 68.9 69.2
FTE 96,461 97,389 99,488 99,451Scope 1&2 (tonnes CO2e)/FTE 20.5 19.7 18.3 18.4
The scope 1 and scope 2 carbon emissions are calculated according to The Greenhouse Gas Protocol: A Corporate Accounting and Reporting Standard (Revised Edition) (see table). We were certified to the Carbon Trust Carbon Standard in 2012 which certifies that we are making year-on-year overall reductions in emissions associated with operations and transport and will be applying for recertification in 2014. These emissions are not materially important to our carbon reduction strategy.
GSK Annual Report 2013 57

58 GSK Annual Report 2013
Strategic report Financial review
Group performanceOur financial review discusses the operating and financial performance of the Group, the financial outlook and our financial resources. We compare the results for each year primarily with results of the preceding year and on a CER basis. In this review we discuss the results on both a core basis and a total basis.
All growth rates included in this Report are at constant exchange rates (CER) unless otherwise stated. CER growth is discussed below.
We use a number of adjusted measures to report the performance of our business. These measures are used by management for planning and reporting purposes and in discussions with and presentations to investment analysts and rating agencies and are defined below. These measures are not defined in IFRS and may not be comparable with similarly described measures used by other companies.
Core results reportingCore results exclude the following items from total results: amortisation and impairment of intangible assets (excluding computer software) and goodwill; major restructuring costs, including those costs following material acquisitions; legal charges (net of insurance recoveries) and expenses on the settlement of litigation and government investigations; other operating income other than royalty income; disposals of associates, products and businesses, and acquisition accounting adjustments for material acquisitions, together with the tax effects of all of these items.
Major restructuring costs charged in arriving at operating profit include costs arising under the Operational Excellence restructuring programme, initiated in 2007 and expanded in 2009, 2010 and 2011, the Major Change restructuring programme initiated in 2013 and restructuring costs following the acquisitions of Human Genome Sciences, Inc. in August 2012 and Stiefel Laboratories, Inc. in July 2009.
Reconciliations of core results to total results are presented on page 65.
Core results reporting aligns business performance reporting around the underlying trading performance of the Group and its primary growth drivers by removing the volatility inherent in many of the non-core items.
Core results reporting is utilised as the basis for internal performance reporting and the core results are presented and discussed in this Financial review as we believe that this approach provides investors with a clearer view of the underlying trading performance of the Group. We also believe that this approach should make the Group’s results more comparable with the majority of our peers, many of which use similar forms of underlying performance reporting to discuss their results, although the precise calculations may differ. The Financial review also presents and discusses the total results of the Group.
Free cash flowFree cash flow is the net cash inflow from operating activities less capital expenditure, interest and dividends paid to non-controlling interests plus proceeds from the sale of property, plant and equipment and dividends received from joint ventures and associated undertakings. Free cash flow growth is calculated on a sterling basis. A reconciliation is presented on page 72.
Working capital conversion cycleThe working capital conversion cycle is calculated as the number of days sales outstanding plus days inventory outstanding, less days purchases outstanding.
CER growthIn order to illustrate underlying performance, it is our practice to discuss the results in terms of constant exchange rate (CER) growth. This represents growth calculated as if the exchange rates used to determine the results of overseas companies in Sterling had remained unchanged from those used in the previous year. CER% represents growth at constant exchange rates. £% represents growth at actual exchange rates.
Restatement of comparative informationAs set out in Note 1 to the Financial statements, ‘Presentation of financial statements’, an amendment to IAS 19 ‘Employee benefits’ has been implemented in the year. The effect has been to reduce total operating profit for 2013 by £160 million (2012 – £92 million; 2011 – £73 million). Comparative information has been restated accordingly.
Financial review
The Financial review summarises the performance of the Group for the year, in comparison with the results of the previous year. The Financial review also sets out the balance sheet position of the Group at 31 December 2013

GSK Annual Report 2013 59
Financial review 2013Group turnover by business
2013
£m
2012 (restated)
£m
GrowthCER%
*
Growth
£%
Pharmaceuticals 17,898 17,936 1 –Vaccines 3,420 3,325 2 3Pharmaceuticals and Vaccines 21,318 21,261 1 –Consumer Healthcare 5,187 5,170 2 –
26,505 26,431 1 –
* CER% represents growth at constant exchange rates. £% represents growth at actual exchange rates.
Total Group turnover for 2013 was £26,505 million, up 1%. Excluding the impact of disposals, primarily the conclusion of the Vesicare co-promotion agreement in the US in Q1 2012 and the non-core OTC brands divested in H1 2012, turnover grew 3%. Pharmaceuticals and Vaccines turnover grew 1% and excluding disposals, grew 2%. Pharmaceuticals turnover grew 1% and, excluding disposals, grew 2%, as growth in the US, Japan and EMAP was partially offset by continued pricing pressures and generic competition in Europe. ViiV Healthcare turnover for 2013 was flat. Vaccines turnover grew 2%, despite the adverse comparison with strong Cervarix sales in Japan in 2012. Excluding Cervarix in Japan, Vaccines sales grew 5%, reflecting the strong growth in the US of Infanrix/Pediarix and Boostrix, both of which benefited from competitor supply issues, and Fluarix/FluLaval, which benefited from the launch of the new Quadrivalent formulation, as well as a better performance by the business in Europe. Consumer Healthcare turnover increased 2% to £5,187 million, but excluding the non-core OTC brands divested in H1 2012, turnover grew 4%.
Group turnover by geographic region
2013
£m
2012 (restated)
£m
GrowthCER%
Growth
£%
US 8,730 8,476 2 3Europe 7,511 7,326 (1) 3EMAP 6,746 6,788 2 (1)Japan 1,890 2,225 2 (15)Other 1,628 1,616 4 1
26,505 26,431 1 –
Group sales outside the USA and Europe accounted for 39% of total turnover and reported growth of 2%, adversely impacted by sales declines in China.
Group turnover by segment
2013£m
2012 (restated)
£m
GrowthCER%
Growth
£%
Pharmaceuticals and Vaccines: US 7,192 7,000 1 3 Europe 5,166 5,001 – 3 EMAP 4,698 4,721 1 – Japan 1,657 1,969 1 (16) ViiV Healthcare 1,386 1,374 – 1 Other trading and unallocated 1,219 1,196 5 2Pharmaceuticals and Vaccines 21,318 21,261 1 –Consumer Healthcare 5,187 5,170 2 –
26,505 26,431 1 –
In the US, Pharmaceuticals and Vaccines turnover was up 1%, but grew 4% excluding the impact of the conclusion of the Vesicare co-promotion agreement in Q1 2012. Pharmaceuticals turnover was down 1% but excluding Vesicare, grew 2%. Sales of Respiratory products grew 7% to £3,655 million, led by an 8% growth in Advair, although this performance included the benefit of favourable stocking patterns in the fourth quarter. Oncology products also performed well, growing 17% to £380 million, led by strong performances from Votrient and Promacta and the initial impact of the launches of Tafinlar and Mekinist monotherapies during the year. These gains were partially offset by the impact of generic competition to Lamictal and a number of Dermatology products. The 17% increase in Vaccines sales primarily resulted from the increases in Infanrix/Pediarix and Boostrix sales, both of which benefited from competitor supply shortages. Fluarix/FluLaval sales were also strong following the launch of the Quadrivalent flu formulation in 2013.
Europe Pharmaceuticals and Vaccines turnover was £5,166 million, flat compared with 2012, as the benefits of the recent restructuring and refocusing of the business were offset by continued pricing pressures and generic competition to a number of products. Pharmaceutical sales were down 1% to £4,117 million. Seretide sales declined 2% on a 2% volume decline but flat pricing. Oncology products, particularly Votrient and Promacta, performed well, as did Avodart, but growth from these products was more than offset by lower sales of a number of older products, which were particularly impacted by continued pricing measures and generic competition. Vaccines sales grew 3%, largely due to an improved tender performance.
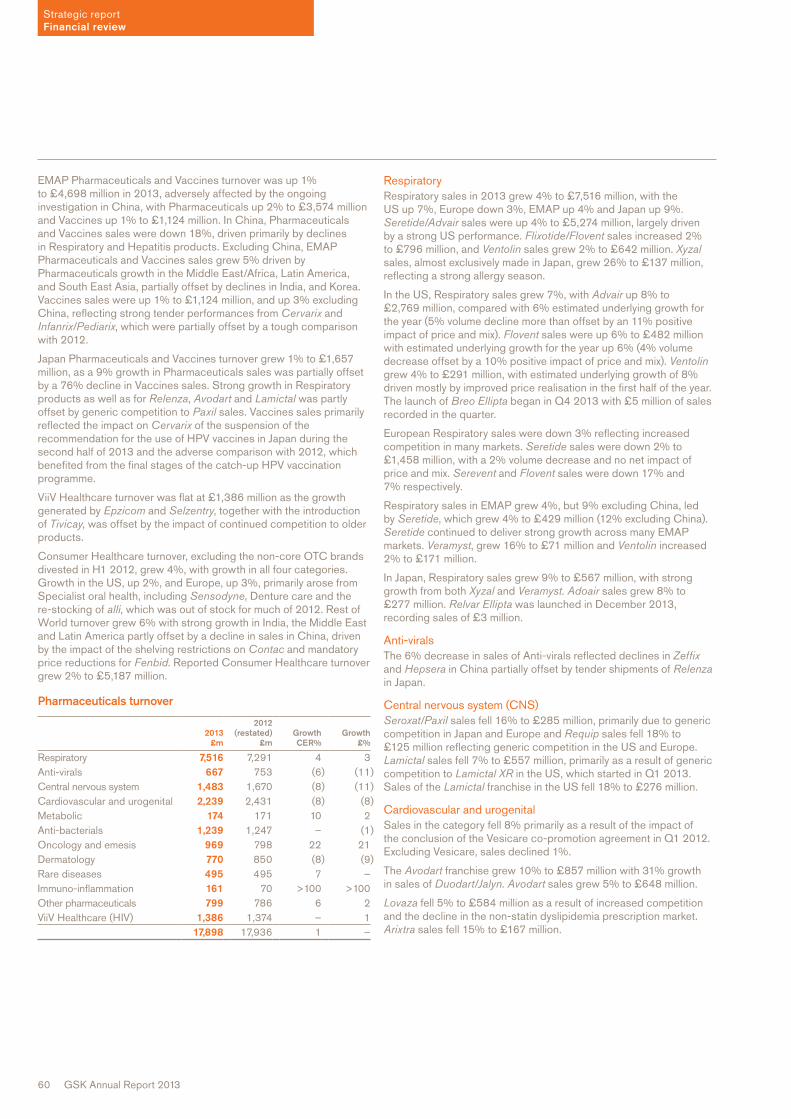
60 GSK Annual Report 2013
Strategic report Financial review
EMAP Pharmaceuticals and Vaccines turnover was up 1% to £4,698 million in 2013, adversely affected by the ongoing investigation in China, with Pharmaceuticals up 2% to £3,574 million and Vaccines up 1% to £1,124 million. In China, Pharmaceuticals and Vaccines sales were down 18%, driven primarily by declines in Respiratory and Hepatitis products. Excluding China, EMAP Pharmaceuticals and Vaccines sales grew 5% driven by Pharmaceuticals growth in the Middle East/Africa, Latin America, and South East Asia, partially offset by declines in India, and Korea. Vaccines sales were up 1% to £1,124 million, and up 3% excluding China, reflecting strong tender performances from Cervarix and Infanrix/Pediarix, which were partially offset by a tough comparison with 2012.
Japan Pharmaceuticals and Vaccines turnover grew 1% to £1,657 million, as a 9% growth in Pharmaceuticals sales was partially offset by a 76% decline in Vaccines sales. Strong growth in Respiratory products as well as for Relenza, Avodart and Lamictal was partly offset by generic competition to Paxil sales. Vaccines sales primarily reflected the impact on Cervarix of the suspension of the recommendation for the use of HPV vaccines in Japan during the second half of 2013 and the adverse comparison with 2012, which benefited from the final stages of the catch-up HPV vaccination programme.
ViiV Healthcare turnover was flat at £1,386 million as the growth generated by Epzicom and Selzentry, together with the introduction of Tivicay, was offset by the impact of continued competition to older products.
Consumer Healthcare turnover, excluding the non-core OTC brands divested in H1 2012, grew 4%, with growth in all four categories. Growth in the US, up 2%, and Europe, up 3%, primarily arose from Specialist oral health, including Sensodyne, Denture care and the re-stocking of alli, which was out of stock for much of 2012. Rest of World turnover grew 6% with strong growth in India, the Middle East and Latin America partly offset by a decline in sales in China, driven by the impact of the shelving restrictions on Contac and mandatory price reductions for Fenbid. Reported Consumer Healthcare turnover grew 2% to £5,187 million.
Pharmaceuticals turnover
2013
£m
2012 (restated)
£m
GrowthCER%
Growth
£%
Respiratory 7,516 7,291 4 3Anti-virals 667 753 (6) (11)Central nervous system 1,483 1,670 (8) (11)Cardiovascular and urogenital 2,239 2,431 (8) (8)Metabolic 174 171 10 2Anti-bacterials 1,239 1,247 – (1)Oncology and emesis 969 798 22 21Dermatology 770 850 (8) (9)Rare diseases 495 495 7 –Immuno-inflammation 161 70 >100 >100Other pharmaceuticals 799 786 6 2ViiV Healthcare (HIV) 1,386 1,374 – 1
17,898 17,936 1 –
RespiratoryRespiratory sales in 2013 grew 4% to £7,516 million, with the US up 7%, Europe down 3%, EMAP up 4% and Japan up 9%. Seretide/Advair sales were up 4% to £5,274 million, largely driven by a strong US performance. Flixotide/Flovent sales increased 2% to £796 million, and Ventolin sales grew 2% to £642 million. Xyzal sales, almost exclusively made in Japan, grew 26% to £137 million, reflecting a strong allergy season.
In the US, Respiratory sales grew 7%, with Advair up 8% to £2,769 million, compared with 6% estimated underlying growth for the year (5% volume decline more than offset by an 11% positive impact of price and mix). Flovent sales were up 6% to £482 million with estimated underlying growth for the year up 6% (4% volume decrease offset by a 10% positive impact of price and mix). Ventolin grew 4% to £291 million, with estimated underlying growth of 8% driven mostly by improved price realisation in the first half of the year. The launch of Breo Ellipta began in Q4 2013 with £5 million of sales recorded in the quarter.
European Respiratory sales were down 3% reflecting increased competition in many markets. Seretide sales were down 2% to £1,458 million, with a 2% volume decrease and no net impact of price and mix. Serevent and Flovent sales were down 17% and 7% respectively.
Respiratory sales in EMAP grew 4%, but 9% excluding China, led by Seretide, which grew 4% to £429 million (12% excluding China). Seretide continued to deliver strong growth across many EMAP markets. Veramyst, grew 16% to £71 million and Ventolin increased 2% to £171 million.
In Japan, Respiratory sales grew 9% to £567 million, with strong growth from both Xyzal and Veramyst. Adoair sales grew 8% to £277 million. Relvar Ellipta was launched in December 2013, recording sales of £3 million.
Anti-viralsThe 6% decrease in sales of Anti-virals reflected declines in Zeffix and Hepsera in China partially offset by tender shipments of Relenza in Japan.
Central nervous system (CNS)Seroxat/Paxil sales fell 16% to £285 million, primarily due to generic competition in Japan and Europe and Requip sales fell 18% to £125 million reflecting generic competition in the US and Europe. Lamictal sales fell 7% to £557 million, primarily as a result of generic competition to Lamictal XR in the US, which started in Q1 2013. Sales of the Lamictal franchise in the US fell 18% to £276 million.
Cardiovascular and urogenitalSales in the category fell 8% primarily as a result of the impact of the conclusion of the Vesicare co-promotion agreement in Q1 2012. Excluding Vesicare, sales declined 1%.
The Avodart franchise grew 10% to £857 million with 31% growth in sales of Duodart/Jalyn. Avodart sales grew 5% to £648 million.
Lovaza fell 5% to £584 million as a result of increased competition and the decline in the non-statin dyslipidemia prescription market. Arixtra sales fell 15% to £167 million.

GSK Annual Report 2013 61
MetabolicThe increase in Metabolic product sales primarily reflected higher sales of Prolia in Europe and EMAP.
Anti-bacterialsAugmentin sales grew 5% to £630 million with strong growth in EMAP, reflecting, in part, a comparison with some supply interruptions in 2012. Zinnat sales were flat at £169 million, and Zinacef sales fell 14% to £55 million.
Oncology and emesisOncology and emesis sales grew 22% to £969 million, marking the second consecutive year of double digit percentage growth for the business. US sales were up 17% with strong performances by Votrient, Promacta and Arzerra, but also contributions from the launches of two new metastatic melanoma products Tafinlar and Mekinist. Sales in Europe grew 28% and EMAP grew 18%. Votrient sales grew 80% to £331 million, Promacta sales grew 46% to £186 million and Arzerra sales grew 23% to £75 million. Tykerb/Tyverb sales fell 13% to £207 million due to increased competition. Both Hycamtin in Europe and EMAP and Argatroban in the US continued to be adversely affected by generic competition.
In the US, there were continued strong growth contributions from Votrient, up 56% to £144 million, and Promacta, up 33% to £73 million, which benefited from a new indication for thrombocytopenia associated with Hepatitis C received during Q4 2012. Arzerra grew 18% to £46 million. The US performance also reflects contributions totalling £21 million from Tafinlar and Mekinist, which were both launched in Q2 2013 as monotherapy treatments and achieved strong uptake in the BRAF V600 melanoma market during the first few months on the market. In January 2014, Tafinlar and Mekinist were approved by the FDA for combination use.
In Europe, sales grew 28% to £339 million, led by sales of Votrient, which increased by 91% to £130 million, as it continued to build market share in many markets. Revolade received approval in Europe for use in thrombocytopenia associated with Hepatitis C at the end of Q3 2013 and sales in the year increased by 47% to £55 million. Tafinlar was launched in Q3 2013 in certain markets and has achieved strong uptake in these early launch markets.
EMAP sales grew 18% to £149 million led by strong growth of Votrient (up 77% to £37 million) and Promacta (up 92% to £22 million). In the region Tykerb was down 9% to £47 million, and Hycamtin was down 36% to £7 million.
DermatologySales declined 8% to £770 million, primarily as a result of the decline in the US, down 40% to £140 million, which continued to suffer from the impact of generic competition, particularly to Bactroban, Duac and Soriatane, together with the effect of the disposal of a number of tail brands in Q2 2013. EMAP sales grew 6% to £397 million, reflecting strong growth in Bactroban, Dermovate and Duac particularly in Middle East/Africa and Latin America. European sales grew 5% to £170 million.
Rare diseasesVolibris, up 21% to £147 million, and Mepron, up 8% to £101 million, were the main drivers of the 7% growth in the category. Flolan sales fell 16% to £103 million, primarily as a result of the biennial price reduction in Japan in Q2 2012 and continued generic competition in the US and Europe.
Immuno-inflammationBenlysta turnover in the year was £146 million, with £134 million in the US. Total in-market sales of Benlysta in the US in 2012 were £96 million.
ViiV Healthcare (HIV)ViiV Healthcare sales of £1,386 million were flat as sales in the US were up 5%, Europe down 3% and EMAP down 12%. Epzicom/Kivexa sales increased 14% to £763 million and Selzentry was up 10% to £143 million. Tivicay recorded sales of £19 million from the early stages of its launch in the US, which started in August 2013. Tivicay was approved in Europe in January 2014 and launches are planned in several markets throughout 2014. Growth contributions within this business were offset by declines in the mature portion of the portfolio, mainly Combivir, down 36% to £116 million
Vaccines turnover
2013 £m
2012£m
GrowthCER%
Growth£%
Vaccines sales 3,420 3,325 2 3
Performance of the Vaccines business improved towards the end of the year, with a significant increase in tender sales in the last quarter. The 2% increase in Vaccines sales was principally attributable to the growth of Infanrix/Pediarix, Fluarix/FluLaval and Boostrix, which was largely offset by the decline of Cervarix in Japan, reflecting the suspension of the recommendations for the use of HPV vaccines in Japan, together with an adverse comparison with strong Cervarix sales in 2012, which benefited from the final stages of the HPV vaccination catch-up programme in Japan. Cervarix sales declined 37% to £172 million. Excluding Cervarix in Japan, Vaccines sales increased by 5%.
Infanrix/Pediarix sales increased 9% to £862 million, with the growth primarily reflecting stronger tender shipments in Europe and EMAP as well as the benefit in the US of a competitor supply shortage. Boostrix sales, which also benefited from a competitor supply issue in the US, grew 19% to £288 million.
Sales of hepatitis vaccines fell 4% to £629 million, primarily reflecting lower sales in the US as a result of the return of competing vaccines to the market during the second half of 2012, together with declines in Europe and China.
Synflorix sales increased 2% to £405 million, helped by strong tender sales in Middle East/Africa and Latin America.
Rotarix sales grew 5% to £375 million, with strong growth in Middle East/Africa and Europe partially offset by the impact of increased competition in Japan.
Fluarix/FluLaval sales increased 25% to £251 million, following the launch of the Quadrivalent formulation in the US.

62 GSK Annual Report 2013
Strategic report Financial review
Sales from new pharmaceutical and vaccine launches
2013 £m
2012£m
GrowthCER%
Growth£%
Pharmaceuticals:Arzerra 75 60 23 25Benlysta 146 70 >100 >100Duodart/Jalyn 209 157 31 33Lamictal XR 98 148 (34) (34)Mekinist 10 – – –Potiga/Trobalt 11 7 43 57Prolia 51 26 96 96Relvar/Breo Ellipta 8 – – –Tafinlar 16 – – –Tivicay 19 – – –Votrient 331 183 80 81Xgeva 7 – >100 >100Dermatology 8 7 20 14
Vaccines:Synflorix 405 385 2 5Nimenrix 12 1 >100 >100
1,406 1,044 33 35
New products are those launched in the last five years (2009 to 2013 inclusive). Sales of new products were £1,406 million in 2013, grew 33% in the year and represented 7% of Pharmaceuticals and Vaccines turnover. In Q4 2013, sales of new products were £465 million, grew 50% and represented 8% of Pharmaceuticals and Vaccines turnover.
Tafinlar and Mekinist, both for metastatic melanoma, were approved and launched in the US in Q2 2013. In Q3 2013, Tivicay, for the treatment of HIV-1 patients, was approved and launched in the US and Tafinlar was granted approval and launched in Europe. In Q4 2013, Breo Ellipta was launched in the US for COPD and Relvar Ellipta was granted approval in Europe for COPD and asthma and launched in Q1 2014. In addition, launch activities are currently underway for Anoro Ellipta, which was approved in the US for the treatment of COPD in December 2013.
Consumer Healthcare turnover
2013 £m
2012 (restated)
£m
GrowthCER%
Growth
£%
Total wellness 1,935 2,057 (5) (6)Oral care 1,884 1,806 6 4 Nutrition 1,096 1,050 7 4Skin health 272 257 5 6
5,187 5,170 2 –
2013
£m
2012 (restated)
£m
GrowthCER%
Growth
£%
USA 951 926 1 3Europe 1,819 1,802 (1) 1ROW 2,417 2,442 4 (1)
5,187 5,170 2 –
Consumer Healthcare turnover grew 2% in the year. Excluding the non-core OTC brands that were divested in H1 2012, turnover grew 4% reflecting overall growth in all three regions.
Total wellnessTotal wellness sales, excluding the non-core OTC brands that were divested in H1 2012, grew 1%. In both the US and Europe alli reported strong growth, in large part due to being out of stock for much of 2012. A severe cold and flu season in early 2013 helped drive growth of several respiratory brands including Coldrex, Beechams and Panadol Cold and Flu. This growth was partly offset by a 57% reduction in sales in China of Contac, due to new shelving requirements, and Fenbid, down 31%, in advance of mandatory price reductions.
Oral careStrong growth in Oral care sales was led by growth in Specialist oral health, with Sensodyne Sensitivity and Acid erosion up 15% and denture care brands up 9%, but Aquafresh was down 12%.
NutritionNutrition sales grew 7% with strong growth in Rest of World markets, led by Horlicks, up 14%, and Boost in India and key expansion markets in the sub-continent. Lucozade grew 4% and Ribena grew 3%.
Skin healthSkin health sales grew 5%, led by Abreva in the US.
Regional performanceExcluding the non-core OTC products divested in 2012, US sales grew 2%, led by strong contributions from Oral care brands, alli and Abreva. This was partially offset by declines in Gastro-intestinal products, reflecting increased competitor activity, and Smoking control products impacted by supply disruptions. In Europe, sales grew 3% helped by sales of alli and strong growth in products for Respiratory health and Pain. Oral care sales in Europe were flat, as strong growth in Sensodyne and denture care brands was offset by a decline in Aquafresh, due in part to supply issues in Q4 2013. Rest of World markets grew 6%, reflecting growth across most categories and markets, particularly in India, partially offset by a 23% reduction of sales in China, mainly due to the reduction in sales of Contac and Fenbid.

GSK Annual Report 2013 63
Core resultsWe use the core reporting basis to manage the performance of the Group and the definition of core results is set out on page 58. A review of the Group’s total results is set out on pages 66 to 67. The reconciliation of total results to core results is presented on page 65.
Cost of sales
20132012
(restated) Growth
£m% of
turnover
£m% of
turnover CER% £%Cost of sales (7,549) (28.5) (7,109) (26.9) 6 6
Core cost of sales was 28.5% of turnover compared with 26.9% in 2012. Net of currency effects of 0.3 percentage points and the impact of a 0.3 percentage point reduction to the 2012 cost of sales percentage due to the settlement in early 2012 of a royalty agreement and the conclusion of the Vesicare agreement, the cost of sales percentage increased 1.0 percentage points. This reflected the expected impact of the unwinding of costs of manufacturing volume shortfalls, adverse mix and the impact of preparing for the launches of new pipeline products, partially offset by ongoing cost management, better price realisation and restructuring benefits.
Selling, general and administration
20132012
(restated) Growth
£m% of
turnover £m% of
turnover CER% £%Selling, general and administration (7,928) (29.9) (7,905) (29.9) 1 –
Core SG&A costs as a percentage of sales were 29.9%, flat on 2012, as the net favourable year-on-year benefits of the Group’s restructuring programmes and ongoing cost management efforts funded investments in growth businesses and preparations for new product launches.
Advertising and promotion expenses decreased 2%, Selling and distribution decreased 1% and general administration increased 6%.
Research and development
20132012
(restated) Growth
£m% of
turnover £m% of
turnover CER% £%Research and development (3,400) (12.8) (3,485) (13.2) (3) (2)
Core R&D expenditure declined 3% to £3,400 million (12.8% of turnover) compared with £3,485 million (13.2% of turnover) in 2012. This reflected the completion of a number of large trials, the phasing of ongoing project spending as well as continuing cost management.
We remain focused on delivering an improved return on our investment in R&D. Sales contribution, reduced attrition and cost reduction are all important drivers of an improving internal rate of return. R&D expenditure is not determined as a percentage of sales, but instead capital is allocated using strict returns based criteria.
The operations of Pharmaceuticals R&D are broadly split into Discovery activities (up to the completion of phase IIa trials) and Development work (from phase IIb onwards).
The table below analyses core R&D expenditure by these categories:
2013
£m
2012 (restated)
£m
Discovery 742 800Development 1,535 1,655Facilities and central support functions 449 377Pharmaceuticals R&D 2,726 2,832Vaccines R&D 496 498Consumer Healthcare R&D 178 155Core R&D 3,400 3,485
The proportion of Pharmaceuticals R&D investment made in the late-stage portfolio decreased from 58% of Pharmaceuticals R&D costs in 2012 to 56% in 2013.
Royalty incomeRoyalty income was £387 million (2012: £306 million) and included a prior year royalty catch-up adjustment recorded early in 2013.
Core operating profit
20132012
(restated) Growth
£m% of
turnover £m% of
turnover CER% £%Core operating profit 8,015 30.2 8,238 31.2 – (3)
Core operating profit was £8,015 million, flat in CER terms on a turnover increase of 1%. The core operating margin of 30.2% was 1.0 percentage points lower than in 2012. Excluding currency effects, the margin declined 0.5 percentage points. This reflected the negative impact of an expected increase in cost of sales, partially offset by higher royalty income and lower R&D expenditure, as the Group’s continuing restructuring programmes contributed incremental year-on-year savings of around £400 million from both ongoing and structural initiatives.
The contribution in 2013 from structural benefits was approximately £115 million lower than in 2012. Total savings realised from changes to post-retirement medical obligations in 2013 were approximately £280 million. In 2012, the Group realised £395 million of savings from the capping of future pensionable salary increases and a change in the basis of future discretionary pension increases from RPI to CPI in certain legacy plans.

64 GSK Annual Report 2013
Strategic report Financial review
Core operating profit by business
20132012
(restated) Growth
£mMargin
% £mMargin
% CER% £%Pharmaceuticals 6,633 37.1 6,652 37.1 3 –Vaccines 1,096 32.0 1,169 35.2 (8) (6)Pharmaceuticals and Vaccines 7,729 36.3 7,821 36.8 1 (1)Consumer Healthcare 913 17.6 908 17.6 3 1
8,642 32.6 8,729 33.0 2 (1)Corporate & other unallocated costs (627) (491) 30 28Core operating profit 8,015 30.2 8,238 31.2 – (3)
Core operating profit by segment
20132012
(restated) Growth
£m% of
turnover £m% of
turnover CER% £%Pharmaceuticals and Vaccines USA 4,993 69.4 4,786 68.4 3 4 Europe 2,829 54.8 2,629 52.6 3 8 EMAP 1,468 31.2 1,560 33.0 (3) (6) Japan 978 59.0 1,179 59.9 4 (17) ViiV Healthcare 885 63.9 849 61.8 3 4 Pharmaceutical R&D (2,823) (2,778) 1 2 Other trading and unallocated pharmaceuticals (601) (49.3) (404) (33.8) 31 49Pharmaceuticals and Vaccines 7,729 36.3 7,821 36.8 1 (1)Consumer Healthcare 913 17.6 908 17.6 3 1
8,642 32.6 8,729 33.0 2 (1)Corporate & other unallocated costs (627) (491) 30 28Core operating profit 8,015 30.2 8,238 31.2 – (3)
Net finance costs
Finance income2013
£m2012
£mInterest and other income 59 77Fair value movements 2 2
61 79
Finance expenseInterest expense (726) (745)Unwinding of discounts on liabilities – (10)Remeasurements and fair value movements (5) (24)Other finance expense (22) (24)
(753) (803)
Core net finance expense was £692 million compared with £724 million in 2012, despite higher average net debt levels during the year, largely driven by continuing share repurchases and dividends to shareholders. This reflected our strategy to improve the funding profile of the Group. Net debt at 31 December 2013 was £1.4 billion lower than at 31 December 2012, reflecting receipts of £2.5 billion from the disposals of businesses, intangible assets, Aspen shares and other investments realised largely at the end of the year.
Share of after tax profits of associates and joint venturesThe share of after tax profits of associates of £43 million (2012 – £29 million) principally arose from the Group’s holding in Aspen Pharmacare.
Core profit before taxation
20132012
(restated) Growth
£m% of
turnover £m% of
turnover CER% £%Core profit before tax 7,366 27.8 7,543 28.5 – (2)
TaxationTax on core profit amounted to £1,695 million and included recognition of US R&D credits reflected in the effective core tax rate of 23.0% (2012: 24.4%).
We continue to believe that we have made adequate provision for the liabilities likely to arise from periods which are open and not yet agreed by tax authorities. The ultimate liability for such matters may vary from the amounts provided and is dependent upon the outcome of agreements with the relevant tax authorities or litigation.
Core earnings per shareCore EPS of 112.2p (2012 – 111.4p) increased 4% in CER terms and 1% at actual exchange rates.
DividendThe Board declared four interim dividends resulting in a dividend for the year of 78 pence, a 4 pence increase on the dividend for 2012. See Note 16 to the financial statements, ‘Dividends’.

GSK Annual Report 2013 65
Core results reconciliation – 31 December 2013
Core
results £m
Intangible
amortisation £m
Intangible
impairment £m
Major
restructuring £m
Legal
charges £m
Acquisition accounting
and other £m
Total
results £m
Turnover 26,505 26,505Cost of sales (7,549) (450) (408) (178) (8,585)Gross profit 18,956 (450) (408) (178) 17,920
Selling, general and administration (7,928) (300) (252) (8,480)Research and development (3,400) (97) (331) (39) (56) (3,923)Royalty income 387 387 Other operating income – 1,124 1,124Operating profit 8,015 (547) (739) (517) (252) 1,068 7,028
Net finance costs (692) (6) (8) (706)Profit on disposal of interest in associates and joint ventures – 282 282Share of after tax profits of associates and joint ventures 43 43 Profit before taxation 7,366 (547) (739) (523) (252) 1,342 6,647
Taxation (1,695) 149 226 145 9 147 (1,019)Tax rate 23.0% 15.3%Profit after taxation 5,671 (398) (513) (378) (243) 1,489 5,628
Profit attributable to non-controlling interests 250 (58) 192Profit attributable to shareholders 5,421 (398) (513) (378) (243) 1,547 5,436
Earnings per share 112.2p (8.2)p (10.7)p (7.8)p (5.0)p 32.0p 112.5p
Weighted average number of shares (millions) 4,831 4,831
Core results reconciliation – 31 December 2012 (restated)
Core
results £m
Intangible
amortisation £m
Intangible
impairment £m
Major
restructuring £m
Legal
charges £m
Acquisition accounting
and other £m
Total results
£m
Turnover 26,431 26,431Cost of sales (7,109) (378) (309) (128) (1) (7,925)Gross profit 19,322 (378) (309) (128) (1) 18,506
Selling, general and administration (7,905) (418) (436) (30) (8,789)Research and development (3,485) (99) (384) (11) (3,979)Royalty income 306 306 Other operating income 1,256 1,256 Operating profit 8,238 (477) (693) (557) (436) 1,225 7,300
Net finance costs (724) (1) (4) (729)Share of after tax profits of associates and joint ventures 29 29 Profit before taxation 7,543 (477) (693) (558) (436) 1,221 6,600
Taxation (1,838) 145 196 (285) 150 (290) (1,922)Tax rate 24.4% 29.1%Profit after taxation 5,705 (332) (497) (843) (286) 931 4,678
Profit attributable to non-controlling interests 235 (136) 10 70 179 Profit attributable to shareholders 5,470 (332) (361) (853) (286) 861 4,499
Earnings per share 111.4p (6.8)p (7.3)p (17.4)p (5.8)p 17.5p 91.6p
Weighted average number of shares (millions) 4,912 4,912

66 GSK Annual Report 2013
Strategic report Financial review
Total results
20132012
(restated) Growth% of % of
£m turnover £m turnover CER% £%Turnover 26,505 100 26,431 100 1 –Cost of sales (8,585) (32.4) (7,925) (30.0) 8 8Selling, general and administration (8,480) (32.0) (8,789) (33.3) (3) (4)Research and development
(3,923
)
(14.8
)
(3,979
)
(15.1
)
(2
)
(1)
Royalty income 387 1.5 306 1.2 25 26Other operating income 1,124 4.2 1,256 4.8 (10) (11)Operating profit 7,028 26.5 7,300 27.6 (1) (4)Net finance costs (706) (729)Profit on disposal of interest in associates 282 –Share of after tax profits of associates and joint ventures 43 29Profit before taxation 6,647 6,600 4 1Taxation (1,019) (1,922)Total profit after taxation for the year 5,628 4,678 24 20Total profit attributable to shareholders 5,436 4,499 Earnings per share (p) 112.5 91.6 27 23Earnings per ADS (US$) 3.53 2.91
Cost of salesTotal cost of sales was 32.4% of turnover compared with 30.0% in 2012. The increase primarily reflected the expected impact of the unwinding of costs of manufacturing volume shortfalls, adverse mix effects, the impact of preparing for the launches of new pipeline products and higher amortisation and impairments of intangible assets, partially offset by ongoing cost management, better price realisation and restructuring benefits.
Selling, general and administrationTotal SG&A costs decreased to 32.0% of turnover compared with 33.3% in 2012, reflecting lower legal and restructuring charges. The net favourable year-on-year benefits of the Group’s restructuring programmes and ongoing cost management efforts funded investments in growth businesses and preparations for new product launches.
Advertising and promotion expenses decreased 2%, selling and distribution fell 1% and general and administration decreased 5%, primarily reflecting lower legal charges.
Research and developmentTotal R&D expenditure declined 2% to £3,923 million (14.8% of turnover) compared with £3,979 million (15.1% of turnover) in 2012. This reflected the completion of a number of large trials, the phasing of ongoing project spending as well as continuing cost management, partially offset by higher restructuring and required regulatory charges.
Other operating incomeOther operating income of £1,124 million (2012 – £1,256 million) included the profit on the disposal of the Lucozade and Ribena business and the anti-coagulant products of £1,331 million. The 2012 income included gains on the profit on disposal of the non-core OTC brands of £559 million and the gain of £581 million arising on the revaluation of pre-existing collaborations as part of the HGS and ViiV Healthcare/Shionogi joint venture acquisitions.
Operating profitTotal operating profit was £7,028 million compared with £7,300 million in 2012. The non-core items resulted in total net charges of £987 million in 2013 (2012 – £938 million).
The intangible asset amortisation of £547 million (2012 – £477 million) included £94 million related to the amortisation of the Benlysta intangible asset acquired as part of the HGS acquisition in late 2012. Intangible asset impairments of £739 million (2012 – £693 million) included write-offs of several R&D assets, together with the partial impairment of Lovaza, reflecting a reassessment of the Group’s expectations on the likelihood of potential generic competition.
Major restructuring charges of £517 million (2012 – £557 million) comprised £238 million under the Operational Excellence programme, £260 million under the Major Change programme and £19 million related to the acquisition of HGS.
The Operational Excellence programme was initiated in 2007 and after several expansions is expected to cost approximately £4.85 billion. It is expected to deliver annual pre-tax savings of approximately £2.9 billion by the end of 2014.
The Major Change programme focuses on opportunities to simplify our supply chain processes, build the Group’s capabilities in manufacturing and R&D, and restructure our European Pharmaceuticals business. The programme is expected to cost £1.5 billion, of which the non-cash charge will be £350 million, and is expected to deliver annual pre-tax savings of at least £1.0 billion by 2016.
Legal charges of £252 million (2012 – £436 million) principally related to provisions for existing product liability matters.
Acquisition accounting and other credits of a net £1,068 million (2012 – £1,225 million credit) included items related to major acquisitions, business, equity investment and asset disposals, one-off required regulatory charges in R&D and certain other adjusting items. The 2013 net credit included gains on the disposals of the Lucozade and Ribena business and the anti-coagulant products of £1,331 million. The 2012 net credit included gains on the profit on disposal of the non-core OTC brands of £559 million and the gain of £581 million arising on the revaluation of pre-existing collaborations as part of the HGS and ViiV Healthcare/Shionogi joint venture acquisitions.
Net finance costs
Finance income2013
£m2012
£mInterest and other finance income 59 77Fair value movements 2 2
61 79
Finance expenseInterest expense (726) (745)Unwinding of discounts on liabilities (14) (15)Remeasurements and fair value movements (5) (24)Other finance expense (22) (24)
(767) (808)
Total net finance expense was £706 million compared with £729 million in 2012, despite higher average net debt levels during the year, reflecting our strategy to improve the funding profile of the Group.

GSK Annual Report 2013 67
Profit on disposal of interest in associatesThe pre-tax profit on disposal of interest in associates was £282 million (2012 – £nil) and reflected the disposal of 28.2 million ordinary shares in Aspen Pharmacare for £429 million.
Share of after tax profits of associates and joint venturesThe share of after tax profits of associates of £43 million (2012 – £29 million) principally arose from the Group’s holdings in Aspen Pharmacare.
Profit before taxationTaking account of net finance costs, the profit on disposal of interest in associates and the share of profits of associates, profit before taxation was £6,647 million compared with £6,600 million in 2012, a 4% CER increase and a 1% increase in sterling terms.
Taxation
2013 £m
2012 (restated)
£mUK corporation tax at the UK statutory rate 265 350Less double taxation relief – (180)
265 170Overseas taxation 1,284 1,510Current taxation 1,549 1,680Deferred taxation (530) 242Taxation on total profits 1,019 1,922
The charge for taxation on total profits amounted to £1,019 million and represented an effective tax rate of 15.3% (2012 – 29.1%), reflecting the differing tax effects of the various non-core items. It included a net deferred tax charge of £234 million related to the unwinding of deferred profit in inventory as existing inventory produced prior to the 2012 restructuring of the supply chain is sold. The 2013 charge for taxation on total profits also included deferred tax credits of £393 million, primarily reflecting continuing restructuring of the supply chain compared to a predominantly non cash deferred tax charge of £420 million in 2012. The Group’s balance sheet at 31 December 2013 included a tax payable liability of £1,452 million and a tax recoverable asset of £129 million.
We continue to believe that we have made adequate provision for the liabilities likely to arise from periods which are open and not yet agreed by tax authorities. The ultimate liability for such matters may vary from the amounts provided and is dependent upon the outcome of agreements with relevant tax authorities or litigation.
Earnings per shareTotal earnings per share was 112.5p for the year, compared with 91.6p in 2012 and non-core net credits totalled 0.3p (2012 – 19.8p charges).
Critical accounting policiesThe consolidated financial statements are prepared in accordance with IFRS, as adopted for use in the European Union, and also with IFRS as issued by the IASB, following the accounting policies approved by the Board and described in Note 2 to the financial statements, ‘Accounting principles and policies’. We are required to make estimates and assumptions that affect the amounts of assets, liabilities, revenue and expenses reported in the financial statements. Actual amounts and results could differ from those estimates.
The critical accounting policies, for which information on the judgements and estimates made is given in Note 3 to the financial statements, ‘Key accounting judgements and estimates’, and in the relevant detailed notes to the financial statements as indicated below, relate to the following areas:
• Turnover
• Taxation (Note 14)
• Legal and other disputes (Notes 29 and 44)
• Impairments of goodwill and other intangible assets (Notes 18 and 19)
• Pensions and other post-employment benefits (Note 28).
Information on the judgements and estimates made in these areas is given in Note 3 to the financial statements, ‘Key accounting judgements and estimates’.
TurnoverIn respect of the Turnover accounting policy, our largest business is US Pharmaceuticals and Vaccines, and the US market has the most complex arrangements for rebates, discounts and allowances. The following briefly describes the nature of the arrangements in existence in our US Pharmaceuticals and Vaccines business:
• We have arrangements with certain indirect customers whereby the customer is able to buy products from wholesalers at reduced prices. A chargeback represents the difference between the invoice price to the wholesaler and the indirect customer’s contractual discounted price. Accruals for estimating chargebacks are calculated based on the terms of each agreement, historical experience and product growth rates
• Customer rebates are offered to key managed care and group purchasing organisations (GPO) and other direct and indirect customers. These arrangements require the customer to achieve certain performance targets relating to the value of product purchased, formulary status or pre-determined market shares relative to competitors. The accrual for customer rebates is estimated based on the specific terms in each agreement, historical experience and product growth rates
• The US Medicaid programme is a state-administered programme providing assistance to certain poor and vulnerable patients. In 1990, the Medicaid Drug Rebate Program was established to reduce state and federal expenditure on prescription drugs. In 2010, the Patient Protection and Affordable Care Act became law. We participate by providing rebates to states. Accruals for Medicaid rebates are calculated based on the specific terms of the relevant regulations or the Patient Protection and Affordable Care Act
• Cash discounts are offered to customers to encourage prompt payment. These are accrued for at the time of invoicing and adjusted subsequently to reflect actual experience
• We record an accrual for estimated sales returns by applying historical experience of customer returns to the amounts invoiced, together with market related information such as stock levels at wholesalers, anticipated price increases and competitor activity.

68 GSK Annual Report 2013
Strategic report Financial review
A reconciliation of gross turnover to net turnover for the US Pharmaceuticals and Vaccines business is as follows:
2013
2012 (restated)
2011 (restated)
£m
Margin %
£m
Margin %
£m
%
Gross turnover 10,066 100 9,758 100 9,770 100
Market driven segments (1,136) (11) (1,035) (10) (885) (9)Government mandated and state programs (1,450) (14) (1,463) (15) (1,521) (15)Cash discounts (184) (2) (177) (2) (176) (2)Customer returns (83) (1) (147) (1) (105) (1)Prior year adjustments 89 1 129 1 94 1Other items (110) (2) (65) (1) (155) (2)Total deductions (2,874) (29) (2,758) (28) (2,748) (28)Net turnover 7,192 71 7,000 72 7,022 72
Market driven segments consist primarily of Managed Care and Medicare plans with which GSK negotiates contract pricing that is honoured via rebates and chargebacks. Mandated segments consist primarily of Medicaid and Federal government programs which receive government mandated pricing via rebates and chargebacks.
The total balance sheet accruals for rebates, discounts, allowances and returns in the US Pharmaceuticals and Vaccines business at 31 December 2013 and 31 December 2012 were as follows:
At 31 December
2013 £m
At 31 December
2012 £m
Managed care, Medicare Part D and GPO rebates 413 390US government and state programs 540 559Cash discounts 21 21Customer returns 194 217Other 20 23Total 1,188 1,210
A monthly process is operated to monitor inventory levels at wholesalers for any abnormal movements. This process uses gross sales volumes, prescription volumes based on third party data sources and information received from key wholesalers. The aim of this is to maintain inventories at a consistent level from year to year based on the pattern of consumption.
On this basis, US Pharmaceuticals and Vaccines inventory levels at wholesalers and in other distribution channels at 31 December 2013 were estimated to amount to approximately five weeks of turnover. This calculation uses third party information, the accuracy of which cannot be totally verified, but is believed to be sufficiently reliable for this purpose.
Legal and other disputesIn respect of the accounting policy for Legal and other disputes, the following briefly describes the process by which we determine the level of provision that is necessary.
In accordance with the requirements of IAS 37, ‘Provisions, contingent liabilities and contingent assets’, we provide for anticipated settlement costs where an outflow of resources is considered probable and a reliable estimate may be made of the likely outcome of the dispute and legal and other expenses arising from claims against the Group. We may become involved in significant legal proceedings, in respect of which it is not possible to make a reliable estimate of the expected financial effect, if any, that could result from ultimate resolution of the proceedings. In these cases, appropriate disclosure about such cases would be included in the Annual Report, but no provision would be made.
This position could change over time and, therefore, there can be no assurance that any losses that result from the outcome of any legal proceedings will not exceed by a material amount the amount of the provisions reported in the Group’s financial statements.
Like many pharmaceutical companies, we are faced with various complex product liability, anti-trust and patent litigation, as well as investigations of its operations conducted by various governmental regulatory agencies. Throughout the year, the General Counsel of the Group, as head of the Group’s legal function, and the Senior Vice President and Head of Global Litigation for the Group, who is responsible for all litigation and government investigations, routinely brief the Chief Executive Officer, the Chief Financial Officer and the Board of Directors on the significant litigation pending against the Group and governmental investigations of the Group.
These meetings, as appropriate, detail the status of significant litigation and government investigations and review matters such as the number of claims notified to us, information on potential claims not yet notified, assessment of the validity of claims, progress made in settling claims, recent settlement levels and potential reimbursement by insurers.
The meetings also include an assessment of whether or not there is sufficient information available for us to be able to make a reliable estimate of the potential outcomes of the disputes. Often, external counsel assisting us with various litigation matters and investigations will also assist in the briefing of the Board and senior management. Following these discussions, for those matters where it is possible to make a reliable estimate of the amount of a provision, if any, that may be required, the level of provision for legal and other disputes is reviewed and adjusted as appropriate.

GSK Annual Report 2013 69
Financial position and resources
2013 £m
2012 (restated)
£mAssetsNon-current assetsProperty, plant and equipment 8,872 8,776Goodwill 4,205 4,359Other intangible assets 9,283 10,161Investments in associates and joint ventures 323 579Other investments 1,202 787Deferred tax assets 2,084 2,391Derivative financial instruments 1 54Other non-current assets 889 682Total non-current assets 26,859 27,789
Current assetsInventories 3,900 3,969Current tax recoverable 129 103Trade and other receivables 5,442 5,242Derivative financial instruments 155 49Liquid investments 66 81Cash and cash equivalents 5,534 4,184Assets held for sale 1 64Total current assets 15,227 13,692Total assets 42,086 41,481
LiabilitiesCurrent liabilitiesShort-term borrowings (2,789) (3,631)Trade and other payables (8,317) (8,054)Derivative financial instruments (127) (63)Current tax payable (1,452) (1,374)Short-term provisions (992) (693)Total current liabilities (13,677) (13,815)
Non-current liabilitiesLong-term borrowings (15,456) (14,671)Deferred tax liabilities (693) (1,004)Pensions and other post-employment benefits (2,189) (3,121)Other provisions (552) (699)Derivative financial instruments (3) (2)Other non-current liabilities (1,704) (1,432)Total non-current liabilities (20,597) (20,929)Total liabilities (34,274) (34,744)Net assets 7,812 6,737
EquityShare capital 1,336 1,349Share premium account 2,595 2,022Retained earnings 913 642Other reserves 2,153 1,787Shareholders’ equity 6,997 5,800Non-controlling interests 815 937
Total equity 7,812 6,737
Property, plant and equipmentOur business is science-based, technology-intensive and highly regulated by governmental authorities. We allocate significant financial resources to the renewal and maintenance of our property, plant and equipment to minimise risks of interruption of production and to achieve compliance with regulatory standards. A number of our processes use chemicals and hazardous materials.
The total cost of our property, plant and equipment at 31 December 2013 was £18,853 million, with a net book value of £8,872 million. Of this, land and buildings represented £3,909 million, plant and equipment £2,509 million and assets in construction £2,454 million. In 2013, we invested £1,235 million in new and renewal property, plant and equipment. This is mainly related to a large number of projects for the renewal, improvement and expansion of facilities at various worldwide sites. Property is mainly held freehold. New investment is financed from our liquid resources. At 31 December 2013, we had contractual commitments for future capital expenditure of £443 million and operating lease commitments of £777 million. We believe that our facilities are adequate for our current needs.
We observe stringent procedures and use specialist skills to manage environmental risks from our activities. Environmental issues, sometimes dating from operations now modified or discontinued, are reported under ‘Our Planet’ on page 57 and in Note 44 to the financial statements, ‘Legal proceedings’.
GoodwillGoodwill decreased during the year to £4,205 million at December 2013, from £4,359 million. The decrease primarily reflects a weakening of overseas currencies.
Other intangible assetsOther intangible assets include the cost of intangibles acquired from third parties and computer software. The net book value of other intangible assets as at 31 December 2013 was £9,283 million (2012 – £10,161 million). The decrease in 2013 reflected assets acquired from the acquisition of Okairos AG of £190 million, capitalised development costs of £246 million and £183 million of computer software costs, more than offset by the amortisation and impairment of existing intangibles of £682 million and £745 million, respectively.
InvestmentsWe held investments, including associates and joint ventures, with a carrying value at 31 December 2013 of £1,525 million (2012 – £1,366 million). The market value at 31 December 2013 was £2,212 million (2012 – £1,968 million). The largest of these investments are in an associate, Aspen Pharmacare Holdings Limited, which had a book value at 31 December 2013 of £229 million (2012 – £430 million) and an investment in Theravance, Inc. which had a book value at 31 December 2013 of £644 million (2012 – £362 million). During the year we sold 28.2 million shares in Aspen Pharmacare Holdings Limited, representing 6.2% of our interest, for £429 million. The investments include equity stakes in companies where the Group has research collaborations, which provide access to biotechnology developments of potential interest and interests in companies that arise from business divestments.

70 GSK Annual Report 2013
Strategic report Financial review
Derivative financial instruments: assetsWe had both non-current and current derivative financial instruments held at fair value of £156 million (2012 – £103 million). The majority of this amount relates to interest rate swaps and foreign exchange contracts both designated and non-designated (inter-company loans and deposits) as accounting hedges.
InventoriesInventory of £3,900 million has decreased by £69 million during the year. The decrease reflects the impact of the disposal of the Lucozade/Ribena and anti-coagulant products businesses partly offset by higher vaccine stocks and stockbuilding for new product launches.
Trade and other receivablesTrade and other receivables of £5,442 million have increased from 2012 reflecting the receivable due from Aspen in respect of the inventory and a manufacturing site which formed part of the disposal of the anti-coagulants products business partly offset by a weakening of overseas currencies.
Derivative financial instruments: liabilitiesWe held both non-current and current derivative financial instruments at fair value of £130 million (2012 – £65 million). This primarily relates to foreign exchange contracts both designated and non-designated (inter-company loans and deposits, external debt and legal provisions) as accounting hedges.
Trade and other payablesTrade and other payables amounting to £8,317 million have increased from £8,054 million in 2012, reflecting the current year accrual in respect of the acquisition of further shares in the Group’s Indian Pharmaceutical subsidiary of £635 million partly offset by the effect of the increased shareholding in the Indian Consumer Healthcare subsidiary accrued in 2012, together with a weakening of overseas currencies.
ProvisionsWe carried deferred tax provisions and other short-term and non-current provisions of £2,237 million at 31 December 2013 (2012 – £2,396 million) in respect of estimated future liabilities, of which £646 million (2012 – £527 million) related to legal and other disputes. Provision has been made for legal and other disputes, indemnified disposal liabilities, employee related liabilities and the costs of restructuring programmes to the extent that at the balance sheet date a legal or constructive obligation existed and could be reliably estimated.
Pensions and other post-employment benefitsWe account for pension and other post-employment arrangements in accordance with IAS 19. The deficits, net of surpluses before allowing for deferred taxation were £613 million (2012 – £1,312 million) on pension arrangements and £1,246 million (2012 – £1,685 million) on unfunded post-employment liabilities.
In December 2010, the UK scheme purchased an insurance contract that will guarantee payment of specified pensioner liabilities. This contract was valued at £775 million at 31 December 2013.
Net debt2013
£m2012
£m
Cash, cash equivalents and liquid investments 5,600 4,265Borrowings – repayable within one year (2,789) (3,631)Borrowings – repayable after one year (15,456) (14,671)Net debt (12,645) (14,037)
Net debt decreased by £1,392 million and reflected the receipts of £2.5 billion from the disposals of the Lucozade/Ribena and anti-coagulant products businesses, intangible assets, part of the Group’s investment in Aspen Pharmacare Holdings Limited and other investments. The impact of these was partly offset by the consideration paid to increase the shareholding in the Group’s Indian Consumer Healthcare subsidiary from 43.2% to 72.5% at a cost of £588 million and to acquire Okarios AG for £205 million.
The Group’s strong cash generation enabled the financing of share repurchases of £1.5 billion and dividend payments of £3.7 billion.
Movements in net debt
2013 £m
2012 £m
Net debt at beginning of year (14,037) (9,003)Increase/(decrease) in cash and bank overdrafts 1,473 (1,607)Cash inflow from liquid investments (15) (224)Net increase in long-term loans (1,913) (4,430)Net repayment of short-term loans 1,872 816Debt of subsidiary undertakings acquired (6) (3)Exchange movements (34) 385Other movements 15 29Net debt at end of year (12,645) (14,037)
Total equityAt 31 December 2013, total equity had increased from £6,737 million at 31 December 2012 to £7,812 million. The increase arose principally from a reduction in the pension deficit of £699 million, a reduction in the post-retirement provision of £439 million and retained profits in the year exceeding shares repurchased, partly offset by the liability of £635 million arising from the open offer to purchase shares held by the non-controlling interest in the Group’s Indian Pharmaceutical subsidiary, GlaxoSmithKline Pharmaceuticals Limited.
A summary of the movements in equity is set out below.
2013
£m
2012 (restated)
£mTotal equity at beginning of year 6,747 8,827Prior year adjustment - IAS 19R (10) (13)At 1 January, as restated 6,737 8,814Total comprehensive income for the year 6,215 4,014Dividends to shareholders (3,680) (3,814)Shares issued 585 356Changes in non-controlling interests (625) (218)Forward contract relating to non-controlling interest – 8Shares purchased and cancelled or held as Treasury shares (1,504) (2,493)Consideration received for shares transferred by ESOP Trusts – 58Shares acquired by ESOP Trusts (45) (37)Share-based incentive plans 294 211Tax on share-based incentive plans 73 9Distributions to non-controlling interests (238) (171)Total equity at end of year 7,812 6,737
The changes in non-controlling interests in the year primarily arose from the voluntary open offer to acquire further shares in GSK Pharmaceuticals Ltd, the Group’s Pharmaceutical subsidiary in India.

GSK Annual Report 2013 71
Share purchasesIn 2013, the Employee Share Ownership Plan (ESOP) Trusts acquired £45 million of shares in GlaxoSmithKline plc (2012 – £37 million). Shares are held by the Trusts to satisfy future exercises of options and awards under the Group share option and award schemes. A proportion of the shares held by the Trusts are in respect of awards where the rules of the scheme require us to satisfy exercises through market purchases rather than the issue of new shares. The shares held by the Trusts are matched to options and awards granted.
At 31 December 2013, the ESOP Trusts held 64 million (2012 – 75 million) GSK shares against the future exercise of share options and share awards. The carrying value of £355 million (2012 – £391 million) has been deducted from other reserves. The market value of these shares was £1,025 million (2012 – £1,004 million).
During 2013, 92.4 million shares were repurchased at a cost of £1,504 million (see Note 33 ‘Share capital and share premium account’). We are currently targeting further repurchases of £1-2 billion during 2014. The exact amount and timing of future purchases, and whether the shares will be held as Treasury shares or be cancelled, will be determined by the company and is dependent on market conditions and other factors. At 31 December 2013, we held 487.4 million shares as Treasury shares (2012 – 495 million shares), at a cost of £6,829 million (2012 – £6,602 million), which has been deducted from retained earnings.
No shares were purchased in the period 1 January 2014 to 5 February 2014.
Commitments and contingent liabilitiesFinancial commitments are summarised in Note 40 to the financial statements, ‘Commitments’. Other contingent liabilities and obligations in respect of short and long-term debt are set out in Note 31 to the financial statements, ‘Contingent liabilities’ and Note 32 to the financial statements, ‘Net debt’.
Amounts provided for pensions and post-retirement benefits are set out in Note 28 to the financial statements, ‘Pensions and other post-employment benefits’. Amounts provided for restructuring programmes and legal, environmental and other disputes are set out in Note 29 to the financial statements, ‘Other provisions’.
Contractual obligations and commitmentsThe following table sets out our contractual obligations and commitments at 31 December 2013 as they fall due for payment.
Total Under 1 yr 1-3 yrs 3-5 yrs 5 yrs+£m £m £m £m £m
Loans 18,281 2,747 2,689 3,903 8,942Interest on loans 10,063 674 1,244 1,049 7,096Finance lease obligations 80 27 36 12 5Finance lease charges 7 2 4 1 –Operating lease commitments 777 134 170 110 363Intangible assets 7,056 419 1,107 1,251 4,279Property, plant & equipment 443 372 69 2 –Investments 111 29 53 15 14Purchase commitments 614 205 261 148 –Pensions 510 85 170 170 85Other commitments 233 75 123 35 –Total 38,175 4,769 5,926 6,696 20,784
Commitments in respect of loans and future interest payable on loans are disclosed before taking into account the effect of derivatives.
We have entered into a number of research collaborations to develop new compounds with other pharmaceutical companies. The terms of these arrangements can include upfront fees, equity investments, loans and commitments to fund specified levels of research. In addition, we will often agree to make further payments if future ‘milestones’ are achieved.
As some of these agreements relate to compounds in the early stages of development, the potential obligation to make milestone payments will continue for a number of years if the compounds move successfully through the development process. Generally, the closer the product is to marketing approval, the greater the possibility of success. The amounts shown above within intangible assets represent the maximum that would be paid if all milestones were achieved, and include £5.2 billion which relates to externalised projects in the discovery portfolio. A number of new commitments were made in 2013 under licensing and other agreements, including arrangements with Adimab LLC, Immunocore Ltd and MorphoSys AG.
In 2013, we reached an agreement with the trustees of the UK pension schemes to make additional contributions over a three year period, including in 2013, to eliminate the pension deficit identified at the 31 December 2011 actuarial funding valuation. If the deficit persists, further contributions would be payable in the following four years depending on the level of deficit. The table above includes this commitment but excludes the normal ongoing annual funding requirement in the UK of approximately £120 million. For further information on pension obligations, see Note 28 to the financial statements, ‘Pensions and other post-employment benefits’.
Contingent liabilities The following table sets out contingent liabilities, comprising discounted bills, performance guarantees, letters of credit and other items arising in the normal course of business, and when they are expected to expire.
Total Under 1 yr 1-3 yrs 3-5 yrs 5 yrs+£m £m £m £m £m
Guarantees 103 75 2 1 25Other contingent liabilities 95 2 27 18 48Total 198 77 29 19 73
In the normal course of business, we have provided various indemnification guarantees in respect of business disposals in which legal and other disputes have subsequently arisen. A provision is made where an outflow of resources is considered probable and a reliable estimate can be made of the likely outcome of the dispute and this is included in Note 29 to the financial statements, ‘Other provisions’.
We provide for the outcome of tax, legal and other disputes when an outflow of resources is considered probable and a reliable estimate of the outflow may be made. At 31 December 2013, other than for those disputes where provision has been made, it was not possible to make a reliable estimate of the potential outflow of funds that might be required to settle disputes where the possibility of there being an outflow was more than remote.
The ultimate liability for such matters may vary significantly from the amounts provided and is dependent upon the outcome of litigation proceedings and negotiations with the relevant tax authorities. This is discussed further in ‘Risk factors’ on pages 232 to 241 and Notes 14 and 44 to the financial statements, ‘Taxation’ and ‘Legal proceedings’.

72 GSK Annual Report 2013
Strategic report Financial review
Cash generation and conversion A summary of the consolidated cash flow is set out below.
2013 £m
2012 £m
Net cash inflow from operating activities 7,222 4,375Net cash inflow/(outflow) from investing activities 524 (2,631)Net cash outflow from financing activities (6,273) (3,351)Increase/(decrease) in cash and bank overdrafts 1,473 (1,607)
Cash and bank overdrafts at beginning of year 3,906 5,605Increase/(decrease) in cash and bank overdrafts 1,473 (1,607)Exchange adjustments (148) (92)Cash and bank overdrafts at end of year 5,231 3,906
Cash and bank overdrafts at end of year comprise:Cash and cash equivalents 5,534 4,184Overdrafts (303) (278)
5,231 3,906
The net cash inflow from operating activities for the year was £7,222 million (2012 – £4,374 million). The increase primarily reflected legal settlements being some £2.5 billion lower than in 2012, together with the phasing of restructuring expenditure, lower tax payments and pension contributions, partially offset by a smaller reduction in working capital compared with 2012 given supply chain investments in inventory and launch preparation.
Free cash flowFree cash flow is the amount of cash generated by the business after meeting our obligations for interest, tax and dividends paid to non-controlling interests, and after capital expenditure on property, plant and equipment and intangible assets.
2013 2012
Free cash flow (£m) 4,657 2,049Free cash flow growth (%) >100% (51)%
Free cash flow was £4,657 million for the year. The increase on 2012 primarily reflected the impact of lower tax payments and special UK pension contributions, partly offset by a smaller reduction in working capital and increased expenditure on property, plant and equipment. We paid dividends to shareholders of £3,680 million, and spent £1,504 million on repurchasing shares.
A reconciliation of net cash inflow from operating activities, which is the closest equivalent IFRS measure, to free cash flow is shown below.
Reconciliation of free cash flow2013
£m2012
£m
Net cash inflow from operating activities 7,222 4,375Purchase of property, plant and equipment (1,188) (1,051)Purchase of intangible assets (513) (469)Disposal of property, plant and equipment 46 68Interest paid (749) (779)Interest received 59 30Dividends received from joint ventures and associated undertakings 18 46Distributions to non-controlling interests (238) (171)Free cash flow 4,657 2,049
Investment appraisalWe have a formal process for assessing potential investment proposals in order to ensure decisions are aligned with our overall strategy. This process includes an assessment of the cash flow return on investment (CFROI), as well as its net present value (NPV) and internal rate of return (IRR) where the timeline for the project is very long term. We also consider the impact on earnings and credit profile where relevant.
The discount rate used to perform financial analyses is decided internally, to allow determination of the extent to which investments cover our cost of capital. For specific investments the discount rate may be adjusted to take into account country or other risk weightings.
Capital expenditure and financial investmentCash payments for tangible and intangible fixed assets amounted to £1,701 million (2012 - £1,520 million) and disposals realised £2,033 million (2012 – £1,124 million). Cash payments to acquire equity investments of £133 million (2012 – £229 million) were made in the year and sales of equity investments realised £59 million (2012 – £28 million).
Future cash flowWe expect that future operating cash flow will be sufficient to fund our operating and debt service costs, to satisfy normal levels of capital expenditure, to meet obligations under existing licensing agreements, to meet the expenditure arising from the major restructuring programmes (the precise timing of which is uncertain) outlined in Note 10 to the financial statements, ‘Major restructuring costs’ and to meet other routine outflows including tax and dividends, subject to the ‘Risk factors’ discussed on pages 232 to 241. We may from time to time have additional demands for finance, such as for acquisitions and share repurchases. We have access to other sources of liquidity from short and long-term capital markets and banks and other financial institutions, in addition to the cash flow from operations, for such needs.
Working capital
2013 2012
Working capital percentage of turnover (%) 19% 21%Working capital conversion cycle (days) 176 194
Our working capital programme has continued to make progress with further improvements in the collection of receivables and more effective management of payables balances. During the year a number of initiatives were implemented across our supply chains supporting the Pharmaceutical, Vaccines and Consumer Healthcare businesses that have provided stronger end-to-end accountability in each case. These programmes are at an early stage but have already reduced volatility and improved responsiveness allowing better inventory management. The net impact on inventory has been limited in 2013 as significant investments have also been made in improving service levels and preparing for new product launches.
The reported working capital conversion cycle days are distorted by divestments made during the year and the intangible asset impairments included in the denominator used in the conversion cycle computation. The year-end 2013 and 2012 conversion cycles, adjusted for these factors, were around 190 days and around 200 days, respectively, a reduction of 10 days.

GSK Annual Report 2013 73
2,500
2,000
1,500
1,000
500
3,000
Maturity profile of gross debt£m equivalent
GBP bonds EUR bonds USD bonds Commercial Paper Other bank borrowings Leases
2014 2015 2016 2017 2018 2022 2025 2027 2033 2034 2038 2039 20422023 2043 20450
Treasury policiesGSK reports in Sterling and pays dividends out of sterling profits. The role of Corporate Treasury is to monitor and manage our external and internal funding requirements and financial risks in support of our strategic objectives. GSK operates on a global basis, primarily through subsidiary companies, and we manage our capital to ensure that our subsidiaries are able to operate as going concerns and to optimise returns to shareholders through an appropriate balance of debt and equity. Treasury activities are governed by policies approved by the Board of Directors, most recently on 9 July 2013. A Treasury Management Group (TMG) meeting chaired by our Chief Financial Officer, takes place on a monthly basis to review treasury activities. Its members receive management information relating to treasury activities.
Capital managementOur financial strategy supports the Group’s strategic priorities and it is regularly reviewed by the Board. We manage the capital structure of the Group through an appropriate mix of debt and equity.
GSK’s financial architecture is designed to support the delivery of the Group’s strategy, and to enhance returns to shareholders. There are four key priorities: delivering sustainable sales growth, improving operating leverage, improving financial efficiency and converting more of our earnings into cash. The free cash flow generated can then be returned to shareholders or reinvested in bolt-on acquisitions, wherever the most attractive returns are available. GSK continues to apply strict financial and returns-based criteria such as cash flow return on investment in order to allocate capital and assess investment opportunities, whilst protecting its credit profile.
The business remains highly cash generative and in 2013 GSK generated £4.7 billion in free cash flow. In addition, we realised £2.5 billion from divestments. In 2013, we returned a total of £5.2 billion to shareholders, £3.7 billion in dividends and £1.5 billion in share repurchases. Net debt at the end of the year stood at £12.6 billion, a reduction of £1.4 billion compared to the previous year.
In 2014, we expect to deliver continued dividend growth and as part of the long-term share buyback programme are targeting share repurchases of £1-2 billion depending on market conditions.
For further details see Note 41 to the financial statements ‘Financial instruments and related disclosures’.
LiquidityAs at 31 December 2013, our cash and liquid investments were held as follows:
2013 £m
2012 £m
Bank balances and deposits 4,641 3,456US Treasury and Treasury repo only money market funds 893 728Corporate debt instruments 1 7Government securities 65 74
5,600 4,265
Cash and liquid investments of £3.9 billion, including amounts held by ViiV Healthcare, were held centrally at 31 December 2013.
We had net debt of £12.6 billion at 31 December 2013. The table below summarises cash and gross debt after the effects of hedging.
2013 £m
2012 £m
Cash and liquid investments 5,600 4,265Gross debt – fixed (15,593) (15,205) – floating (2,651) (3,090) – non-interest bearing (1) (7)Net debt (12,645) (14,037)
GSK’s policy is to borrow centrally in order to meet anticipated funding requirements. The cash flow forecast and funding requirements are monitored by the TMG on a monthly basis. Our strategy is to diversify liquidity sources using a range of facilities and to maintain broad access to funding markets.
GSK’s long-term credit ratings have remained unchanged since February 2008. Our current ratings are A+ (stable outlook) by Standard and Poor’s and A1 (negative outlook) by Moody’s Investors Service (‘Moody’s’). Our short-term credit ratings are A-1 and P-1 with Standard and Poor’s and Moody’s respectively.
Maturity profile of gross debt

74 GSK Annual Report 2013
Strategic report Financial review
Treasury operationsThe objective of treasury activity is to manage the post-tax net cost or income of financial operations to the benefit of earnings. We use a variety of financial instruments to finance our operations and derivative financial instruments to manage market risks from these operations. These derivatives, principally comprising forward foreign currency contracts and interest rate swaps, are used to swap borrowings and liquid assets into currencies required for Group purposes and to manage exposure to financial risks from changes in foreign exchange rates and interest rates.
We do not hold or issue derivatives for speculative purposes. Our Treasury policies specifically prohibit such activity. All transactions in financial instruments are undertaken to manage the risks arising from underlying business activities, not for speculation.
Interest rate risk managementGSK’s objective is to minimise the effective net interest cost and to balance the mix of debt at fixed and floating interest rates over time. The policy on interest rate risk management limits the amount of floating interest payments to a prescribed percentage of operating profit.
We use interest rate swaps to redenominate one of our bonds into floating interest rates. The duration of these swaps matches the duration of the principal instrument. These interest rate derivative instruments are accounted for as fair value hedges of the relevant liability.
Foreign exchange risk managementForeign currency transaction exposures arising on internal and external trade flows are not generally hedged. The Group’s objective is to minimise the exposure of overseas operating subsidiaries to transaction risk by matching local currency income with local currency costs where possible. Our internal trading transactions are matched centrally and we manage inter-company payment terms to reduce foreign currency risk. Foreign currency cash flows can be hedged selectively under the management of Corporate Treasury and the TMG. Where possible, we manage the cash surpluses or borrowing requirements of subsidiary companies centrally using forward contracts to hedge future repayments back into the originating currency.
In order to reduce foreign currency translation exposure, we seek to denominate borrowings in the currencies of our principal assets and cash flows. These are primarily denominated in US dollars, Euros and Sterling. Certain borrowings can be swapped into other currencies as required.
Borrowings denominated in, or swapped into, foreign currencies that match investments in overseas Group assets may be treated as a hedge against the relevant assets. Forward contracts in major currencies are also used to reduce exposure to our investment in overseas Group assets. The TMG reviews the ratio of borrowings to assets for major currencies monthly.
Counterparty risk managementGSK sets global counterparty limits for each of our banking and investment counterparties based on long-term credit ratings from Moody’s and Standard and Poor’s. Corporate Treasury’s usage of these limits is monitored daily by a Corporate Compliance Officer (CCO) who operates independently of Corporate Treasury. Any breach of these limits would be reported to the CFO immediately. The CCO also monitors the credit rating of these counterparties and, when changes in ratings occur, notifies Corporate Treasury so that changes can be made to investment levels or to authority limits as appropriate. In addition, relationship banks and their credit ratings are reviewed regularly and a report is presented annually to the TMG for approval.
Group reporting in 2014During 2014, GSK intends to report core results performance measured against 2013 core results excluding divestments completed during 2013. The divestments include the disposals of Lucozade and Ribena, the anti-coagulant products and several other minor products. Summary restated 2013 core results excluding divestments for 2013 are set out below.
Core results
£m
Divested businesses
£m
Core results excluding
divestments £m
Turnover 26,505 (903) 25,602
Cost of sales (7,549) 474 (7,075)Selling, general and administration (7,928) 179 (7,749)Research and development (3,400) 6 (3,394)Royalty income 387 – 387Operating profit 8,015 (244) 7,771
Profit before tax 7,366 (244) 7,122Profit after tax 5,671 (184) 5,487Profit attributable to shareholders 5,421 (184) 5,237Earnings per share (pence) 112.2p (3.8)p 108.4p
A reconciliation of core results to total results is set out on page 65.
Strategic ReportThe Strategic Report was approved by a duly authorised Committee of the Board of Directors on 26 February 2014 and signed on its behalf by:
Simon Dingemans Chief Financial Officer 26 February 2014

GSK Annual Report 2013 75
In this section
Our Board 76Our Corporate Executive Team 80Chairman’s letter 82Board report to shareholders 83Committee reports 89Remuneration Committee Chairman’s Annual Statement 96Annual report on remuneration 97Remuneration policy report 117
Governance &remuneration

76 GSK Annual Report 2013
Our Board
Sir Christopher Gent 65Chairman
Nationality British
Appointment date 1 June 2004 and as Chairman on 1 January 2005
Committee membershipChairman of the Nominations and Corporate Responsibility Committees and a member of the Remuneration and Finance Committees
Skills and experience Sir Christopher has many years of experience of leading global businesses and a track record of delivering outstanding performance in highly competitive industries. He was appointed Managing Director of Vodafone plc in 1985 and then became its Chief Executive Officer in 1997 until his retirement in 2003.
External appointments Sir Christopher is a Non-Executive Director of Ferrari SpA, a Senior Adviser at Bain & Co and a member of the British Airways International Business Advisory Board.
Diversity
20%Scientific
Finance
Industry
International experienceExperience
TenureNon-Executives
Number of directors with this experienceGlobal
USA
Europe
EMAP
11
Composition
The Board considers each of its Non-Executive Directors to be independent in accordance with the UK Corporate Governance Code.
0-3 years
4-6 years
7-10 years
Executive
Non-Executive
Male
Female
Governance & remuneration Our Board
27%
53%
Sir Andrew Witty 49Chief Executive Officer
Nationality British
Appointment date 31 January 2008 and as Chief Executive Officer on 21 May 2008
Committee membershipMember of the Finance Committee
Skills and experience Sir Andrew joined GSK in 1985. He has worked in the UK, South Africa, the USA and Singapore in various senior roles. In 2003, he was appointed President of GSK Europe and joined GSK’s Corporate Executive Team.
In 2003 he was awarded the Public Service Medal by the Government of Singapore and in August 2012 was also awarded the Public Service Star. In the 2012 New Year Honours list, he was awarded a Knighthood for services to the economy and to the UK pharmaceutical industry. He served as the Lead Non-Executive Board member for the Department of Business, Innovation and Skills to December 2013. He was also President of the European Federation of Pharmaceutical Industries and Associations until July 2013.
External appointments Sir Andrew is a member of the UK Prime Minister’s Business Advisory Group and was appointed to the UK Business Ambassador Group in January 2014.
151410
42%20%
80%
67%
33%
8%
50%
Simon Dingemans 50Chief Financial Officer
Nationality British
Appointment date 4 January 2011 and as Chief Financial Officer on 1 April 2011
Committee membershipMember of the Finance Committee
Skills and experience Prior to joining GSK, Simon had over 25 years of experience in investment banking at SG Warburg and Goldman Sachs. During this time, he advised a broad range of large corporates across a number of industry sectors, including pharmaceuticals and consumer healthcare. Simon advised GSK for over a decade before his appointment and was closely involved in a number of GSK’s key strategic projects, including the establishment of ViiV Healthcare.
External appointments Simon is a member of the Corporate Development Council for the National Theatre and Deputy Chairman of the 100 Group.

GSK Annual Report 2013 77
Dr Moncef Slaoui 54Chairman, Global R&D & Vaccines
Nationality Moroccan, Belgian & American
Appointment date 17 May 2006
Committee membershipMember of the Finance Committee
Skills and experience Moncef joined GSK Vaccines in 1988 where he engineered the development of a robust vaccines pipeline. He then led Worldwide Business Development for pharmaceutical products before his appointment to lead R&D in 2006. He was also given overall responsibility for GSK’s Oncology Business in 2010; for GSK Vaccines in 2011; and for all Global Franchises in 2012. He has a PhD in Molecular Biology and Immunology from Université Libre de Bruxelles and has published more than 100 scientific papers and presentations. Prior to joining GSK, Moncef was Professor of Immunology at the University of Mons, Belgium.
External appointments Moncef is a member of the PhRMA and the Biotechnology Industry Organization boards in the USA and a member of the Advisory Committee to the Director of National Institutes of Health. He is also an adviser to the Qatar Foundation, and a member of the Qatar Biomedical Research Institute Scientific Advisory Committee. Moncef has advised the US President’s Council of Advisors on Science and Technology and he was a member of the Board of the Agency for Science, Technology & Research (A*STAR) until January 2011.
Sir Deryck Maughan 66Senior Independent Non-Executive Director
Nationality British
Appointment date 1 June 2004 and as Senior Independent Non-Executive Director on 1 May 2013
Committee membershipMember of the Audit & Risk, Nominations, Remuneration and Finance Committees
Skills and experience Sir Deryck has a wealth of international corporate and investment banking experience, having previously served as Chairman and Chief Executive Officer of Citigroup International and of Salomon Brothers Inc. He served as Vice Chairman of the New York Stock Exchange from 1996 to 2000.
External appointments Sir Deryck is a Senior Adviser to, and former partner of, Kohlberg Kravis Roberts & Co. He is a Non-Executive Director of BlackRock, Inc. and Thomson Reuters. He is a Trustee of the British Museum and of New York University Langone Medical Center. He is also a Director of Lincoln Center.
Professor Sir Roy Anderson 66Independent Non-Executive Director & Scientific Expert
Nationality British
Appointment date 1 October 2007
Committee membershipMember of the Nominations and Finance Committees
Skills and experience Professor Sir Roy is a world-renowned medical scientist with advanced knowledge of infectious disease epidemiology and is currently Professor of Infectious Disease in the Faculty of Medicine, Imperial College, London. He is a fellow and member of the Policy Advisory Board of the Royal Society, and a fellow of the Academy of Medical Sciences and the Royal Statistical Society. He is an Honorary Fellow of the Institute of Actuaries and a Foreign Associate Member of the Institute of Medicine at the US National Academy of Sciences and the French Academy of Sciences. Professor Sir Roy’s background enables him to bring scientific experience to the Board’s deliberations.
External appointments Professor Sir Roy is a member of the International Advisory Board of Holdingham Group and he is a Trustee of the Natural History Museum, London.
Dr Stephanie Burns 59Independent Non-Executive Director
Nationality American
Appointment date 12 February 2007
Committee membershipMember of the Corporate Responsibility, Remuneration and Finance Committees
Skills and experience Stephanie is a recognised global business leader, having served as Chairman, President and CEO of Dow Corning Corporation until her retirement at the end of 2011. She has a strong scientific background, with a PhD in organic chemistry with an organosilicon specialty, and is a staunch advocate for science education. She was an officer and chairman of the American Chemistry Council.
External appointments Stephanie was appointed a Non-Executive Director of Corning Inc in January 2012. She was appointed as a Director to the Board of Kellogg Company on 25 February 2014. She sat on the US President’s Export Council. Stephanie was also an officer of the Society of Chemical Industry, America Section, and is the past Honorary President of the UK-based parent society.

78 GSK Annual Report 2013
Stacey Cartwright 50Independent Non-Executive Director
Nationality British
Appointment date 1 April 2011
Committee membershipMember of the Audit & Risk and Finance Committees
Skills and experience Stacey is a Chartered Accountant and has extensive experience of global consumer businesses and of corporate finance. She served as Executive Vice President, Chief Financial Officer of Burberry Group plc until July 2013. Prior to joining Burberry Group plc in 2004, Stacey held the role of Chief Financial Officer at Egg plc between 1999 and 2003, and from 1988 to 1999 she worked in various finance-related positions at Granada Group plc.
External appointments Stacey is Chief Executive Officer of the Harvey Nichols Group of Companies, a role to which she was appointed in February 2014.
Dr Daniel Podolsky 60Independent Non-Executive Director & Scientific Expert
Nationality American
Appointment date 1 July 2006
Committee membershipMember of the Audit & Risk, Corporate Responsibility and Finance Committees
Skills and experience Daniel is a world-renowned researcher who has advanced knowledge of underlying mechanisms of disease and new therapies for gastrointestinal disorders. He was formerly Mallinckrodt Professor of Medicine and Chief of Gastroenterology at Massachusetts General Hospital and Harvard Medical School, and previously served as the Chief Academic Officer of Partners Healthcare System. Daniel’s current responsibilities in leading a large academic medical centre give him relevant insight into healthcare delivery. Daniel brings scientific expertise to the Board and the Audit & Risk Committee’s deliberations.
External appointments Daniel is President of the University of Texas Southwestern Medical Center and holds the Philip O’Bryan Montgomery, Jr., M.D. Distinguished Presidential Chair in Academic Administration, and the Doris and Bryan Wildenthal Distinguished Chair in Medical Science. He is a member of the Institute of Medicine of the US National Academy of Sciences, member of the Board of the Southwestern Medical Foundation and is a Director of Antibe Therapeutics, Inc.
He is also a member of the National Academies of Sciences Board on Army Science and Technology.
Lynn Elsenhans 57Independent Non-Executive Director
Nationality American
Appointment date 1 July 2012
Committee membershipMember of the Audit & Risk, Corporate Responsibility and Finance Committees
Skills and experience Lynn has a wealth of experience of running a global business and significant knowledge of the global markets in which GSK operates. She served as Chair, President and Chief Executive Officer of Sunoco Inc from 2009 to 2012. Prior to joining Sunoco in 2008 as President and Chief Executive Officer, Lynn worked for Royal Dutch Shell which she joined in 1980 and where she held a number of senior roles, including Executive Vice President, Global Manufacturing from 2005 to 2008.
External appointments Lynn is a Non-Executive Director of Baker Hughes Inc, a Director of the Texas Medical Center, and a Director of The First Tee of Greater Houston. She is also a Trustee of the United Way of Greater Houston and a Trustee of Rice University.
Judy Lewent 65Independent Non-Executive Director
Nationality American
Appointment date 1 April 2011
Committee membership
Chairman of the Audit & Risk Committee and member of the Remuneration and Finance Committees.
Skills and experience Judy has extensive knowledge of the global pharmaceutical industry and of corporate finance, having joined Merck & Co in 1980 and then served as Chief Financial Officer from 1990 to 2007 when she retired. Judy has previously served as a Non-Executive Director of Motorola Inc., Dell Inc. and Quaker Oats Company.
External appointments Judy is a Non-Executive Director of Thermo Fisher Scientific Inc and Motorola Solutions Inc. She is also a Trustee of the Rockefeller Family Trust and Chairperson of the Audit Committee of Rockefeller Financial Services, a life member of the Massachusetts Institute of Technology Corporation and a member of the American Academy of Arts and Sciences. Judy is a Non-Executive Director of Purdue Pharma Inc, Napp Pharmaceutical Holdings Limited and certain Mundipharma International Limited companies.
Governance & remuneration Our Board
Our Boardcontinued

GSK Annual Report 2013 79
Tom de Swaan 67Independent Non-Executive Director
Nationality Dutch
Appointment date 1 January 2006
Committee membershipChairman of the Remuneration Committee and a member of the Audit & Risk, Nominations and Finance Committees
Skills and experience Tom has had a long and distinguished career in the European banking industry, having been a member of the Managing Board and Chief Financial Officer of ABN AMRO. Tom has held various executive positions at the Dutch Central Bank and was a Non-Executive Director of the Financial Services Authority (now the Financial Conduct Authority) from 2001 to 2007. He was previously a Non-Executive Director of KPMG’s Public Interest Committee and was also Vice Chairman of the Supervisory Board and Chairman of the Audit Committee of Royal Ahold.
External appointments Tom is Chairman of the Supervisory Board of VanLanschot Bankiers and Chairman of the Board of Directors of Zurich Insurance Group. He is a member of the Supervisory Board of Royal DSM.
Jing Ulrich 46Independent Non-Executive Director
Nationality American
Appointment date 1 July 2012
Committee membershipMember of the Audit & Risk and Finance Committees
Skills and experience Jing is Managing Director and Vice Chairman of Asia Pacific at JPMorgan Chase. She advises the firm’s most senior global clients across all asset classes while building relationships with executives at Asia’s leading enterprises. Jing is one of the most prominent advisors to the large global asset management companies, sovereign wealth funds, and multinational corporations. She works with all lines of business at JPMorgan Chase to foster greater cross-border collaboration and strengthen senior client relationships in Asia Pacific and the rest of the world.
Jing was Managing Director and Chair of Global Markets, China at JPMorgan between 2005 and 2013. From 2003 to 2005, Jing worked for Deutsche Bank as Managing Director, Head of Greater China Equities. She previously held financial positions, specialising in the Asia Pacific region, with CLSA Asia Pacific Markets and the Emerging Markets Investors Corporation. She was educated at Harvard and Stanford Universities.
External appointments Jing is an Independent Director of Ermenegildo Zegna SpA.
Hans Wijers 63Independent Non-Executive Director
Nationality Dutch
Appointment date 1 April 2013
Committee membershipMember of the Corporate Responsibility, Remuneration and Finance Committees
Skills and experience Hans has a broad range of business, economic and political experience, having served as Chief Executive Officer and Chairman at Akzo Nobel NV from 2002 to 2012. Hans had a long and distinguished career in academia, public service and strategy consulting. He served as a senior vice president of the Boston Consulting Group from 1998 to 2002.
External appointments Hans is Chairman of the Supervisory Board of Heineken NV and also Deputy Chairman and Non-Executive Director of Royal Dutch Shell. He is also Chairman of the Supervisory Board of AFC Ajax.
Sir Robert Wilson 70Independent Non-Executive Director
Nationality British
Appointment date 1 November 2003
Committee membershipMember of the Corporate Responsibility Nominations and Finance Committees
Skills and experienceSir Robert has had a long and distinguished career in industry, mainly with Rio Tinto, where he became Chief Executive Officer in 1991 and then Executive Chairman in 1997 until his retirement in October 2003. Sir Robert then became Non-Executive Chairman of BG Group plc from January 2004 until May 2012. He was also Chairman of The Economist Group between 2003 and 2009. He has been a Non-Executive Director at BP, Diageo and Boots.
He stood down as the Senior Independent Non-Executive Director, and as a member of the Audit & Risk Committee, on 1 May 2013.
External appointmentsSir Robert is a senior adviser to Morgan Stanley, Chairman of Riverstone Energy Limited and Chairman of the Accenture Global Mining Executive Council.

80 GSK Annual Report 2013
Our Corporate Executive Team
Sir Andrew WittyChief Executive Officer
See ‘Our Board’ on page 76.
Simon DingemansChief Financial Officer
See ‘Our Board’ on page 76.
Abbas HussainPresident, Europe, Japan and EMAP
Abbas was appointed President, Europe and EMAP in September 2012 and became responsible for Japan in March 2013. He joined the company as President, Emerging Markets & Asia Pacific in June 2008.
Previously Abbas spent 20 years at Eli Lilly where he held positions including President, Europe and before that Vice President, Europe with specific responsibility for the Western European mid-size countries, Africa & Middle East Area/Commonwealth of Independent States and Central & Eastern Europe regions. He also held positions in sales and marketing across Australasia and India.
Abbas was appointed to ViiV Healthcare Ltd. Board in October 2009 and the Aspen Board in December 2009.
Born in Madras, India, Abbas has a degree in Medicinal Chemistry & Pharmacology from Loughborough University.
Bill LouvSenior Vice President, Core Business Services
Bill was appointed to create and lead Core Business Services (CBS) in April 2010. CBS integrates the shared services of the global support functions. He was previously Chief Information Officer.
Bill joined the company in 1994 as Vice President of Medical Data Sciences, and has held a number of increasingly senior roles in R&D and IT.
Bill has a Bachelor of Science degree in Biology from the College of William and Mary, and Master of Science and Doctor of Philosophy degrees in Statistics from the University of Florida.
David RedfernChief Strategy Officer
David was appointed Chief Strategy Officer in May 2008 and is responsible for proactive exploration of new business opportunities, strategic planning and the leadership of the dermatology business. In addition to his current role, he was appointed Chairman of the Board of ViiV Healthcare Ltd. in April 2011.
Previously, he was Senior Vice President, Northern Europe with responsibility for managing GSK’s pharmaceutical businesses in that region and prior to that Senior Vice President for Central and Eastern Europe. David joined the company in 1994 and held a series of finance roles before becoming Finance Director of the European business from 1999-2002.
David has a Bachelor of Science degree from Bristol University in the UK and is a Chartered Accountant.
Governance & remuneration Our Corporate Executive Team
Simon BicknellSenior Vice President, Governance, Ethics and Assurance
Simon was appointed Senior Vice President, Governance, Ethics and Assurance in January 2011 and he is responsible for risk management, compliance and strategic auditing.
Simon joined the Company Secretariat in 1984 and became Deputy Company Secretary of Glaxo Wellcome in 1995. He was appointed Company Secretary of GlaxoSmithKline plc in May 2000 and combined this position with his role as Corporate Compliance Officer from 2006 until his current appointment.
After gaining his Law degree, Simon qualified as a barrister in 1983 and is a member of Middle Temple.
Deirdre ConnellyPresident, North America Pharmaceuticals
Deirdre joined GSK as President, North America Pharmaceuticals in February 2009 after working at Eli Lilly and Company for 24 years. She held a variety of positions including President of US Operations, Senior Vice President of Global Commercialisations for Woman’s Health and Senior Vice President of Human Resources.
Deirdre is a native of San Juan, Puerto Rico. She holds a Bachelor’s degree in Marketing and Economics from Lycoming College in Pennsylvania. She graduated from Harvard University’s Advance Management Programme in 1999.
Deirdre serves as a Director on the PhRMA Board, the Board of Macy’s Inc. and the Harvard University Public Health Policy Council.
Roger ConnorPresident, Global Manufacturing & Supply
Roger is President, Global Manufacturing & Supply (GMS). He was appointed to this role in January 2013, after working for a year as President Designate, GMS.
Roger joined GSK in 1998 from AstraZeneca and has worked in a number of roles within finance and manufacturing strategy, including at GSK sites at Cork in Ireland and Ware in the UK. Prior to his role in GMS, Roger was Vice President, Office of the CEO and Corporate Strategy from February 2010.
He holds a Degree in Mechanical and Manufacturing Engineering from Queen’s University Belfast and a Masters in Manufacturing Leadership from Cambridge University. He is also a Chartered Accountant.

GSK Annual Report 2013 81
Dr Moncef SlaouiChairman, Global R&D & Vaccines
See ‘Our Board’ on page 77.
Patrick VallancePresident, Pharmaceuticals R&D
Patrick was appointed President, Pharmaceuticals R&D, in January 2012. Prior to his appointment he was Senior Vice President, Medicines Discovery and Development.
Patrick joined the company in 2006 as Head of Drug Discovery. He focused the organisation on science that has the best chance of leading to new medicines, and created small, multidisciplinary teams called Discovery Performance Units. He is transforming the way in which we approach late stage clinical trial design and execution.
Prior to joining GSK Patrick was a clinical academic at University College London. Patrick is a member of the Board of the Agency for Science, Technology & Research (A*STAR) and is a director of Genome Research Limited.
Emma WalmsleyPresident, Consumer Healthcare Worldwide
Emma assumed the role of President, Consumer Healthcare Worldwide in October 2011 after joining GSK in May 2010 as President of Consumer Healthcare Europe.
Under Emma’s leadership the business has a new strategic direction to become the first and best fast moving Consumer Healthcare company, driven by science and values, combining the very best of GSK’s scientific knowledge with the speed and marketing excellence of the fast moving consumer goods world.
Prior to joining GSK, Emma worked with L’Oreal for 17 years where she held a variety of marketing and general management roles in Paris, London and New York. From 2007 she was based in Shanghai as General Manager, Consumer Products, L’Oreal China.
She has a degree in Classics and Modern Languages from Oxford University.
Dan TroySenior Vice President & General Counsel
Dan joined the company as Senior Vice President & General Counsel in September 2008.
He was previously a Partner at the Washington law firm Sidley Austin LLP, where he represented mainly pharmaceutical companies and trade associations on matters related to the US Food and Drug Administration (FDA) and government regulations. Dan was formerly Chief Counsel for the FDA, where he served as a primary liaison to the White House and the US Department of Health and Human Services.
Dan is a graduate from Cornell University’s School of Industrial and Labor Relations, and earned his law degree from Columbia University School of Law.
Claire ThomasSenior Vice President, Human Resources
Claire was appointed Senior Vice President, Human Resources in May 2008 and is responsible for GSK’s Environmental Sustainability Strategy. She was previously Senior Vice President, Human Resources, Pharmaceuticals International.
Claire joined the company in 1996 and was appointed Senior Vice President, Human Resources, and Pharmaceuticals Europe in 2001, where she successfully led the HR function through the merger.
Prior to joining the company she worked for Ford Motor Company, holding various positions in Human Resources.
Claire has a Bachelor of Science degree in Economics, Management and Industrial Relations from the University of Wales. Claire was honoured as an Outstanding European Woman of Achievement in 2007.
Phil ThomsonSenior Vice President, Global Communications
Phil was appointed Senior Vice President, Global Communications in August 2010. He has responsibility for Media Relations, Investor Relations, Corporate Responsibility, Internal Communications and Product Communications.
Phil joined Glaxo Wellcome as a commercial trainee in 1996, moving from pharmaceutical brand marketing to product communications. In 1999 he became a Director of Media Relations for Glaxo Wellcome plc and in 2001, took up the position of Director, Investor Relations for GSK. In 2004, he returned to Corporate Media Relations as Vice President.
Phil earned his degree in English and History from Durham University.

82 GSK Annual Report 2013
Governance & remuneration Corporate governance
Dear ShareholderAs Chairman of the Board, I am committed to ensuring that GSK operates at the highest standards of corporate governance. We believe our governance structure underpins our ability to deliver the Group’s strategy to grow a diversified business, deliver more products of value and simplify the operating model.
New Governance & remuneration reporting changesIn light of the new provisions in the Financial Reporting Council’s update to the UK Corporate Governance Code (the updated Code), and the commencement of the new Remuneration Reporting Regulations, we have reviewed our governance and corporate reporting arrangements. The updated Code is available at www.frc.org.uk.
With respect to the principal areas of change set out in the updated Code, we have taken the following actions:
• In last year’s Annual Report we disclosed, ahead of time, our diversity policy and measurable diversity targets. I am pleased to report that, in relation to gender diversity, we have maintained our female representation on the Board at 33% since July 2012, which places GSK firmly in the top ten of the FTSE 100 in terms of female board member representation.
• Enhancements have been made to the Audit & Risk Committee report (ARC report) on pages 89 to 92. These enhancements include discussion of the significant issues relating to the financial statements that the Committee considered and addressed during the year. The ARC report also highlights to shareholders the key areas of focus of the Committee during the year.
The new Remuneration Reporting Regulations came into effect for the 2013 financial reporting year. We were a participating member of the GC100 and Investor Group that helped to develop guidance aimed at assisting UK quoted companies to understand the practical implementation of these new Regulations. The introduction of these Regulations have also provided us with the opportunity to take a fresh look at how we present the reporting of our Directors’ remuneration arrangements.
The new style Remuneration Report on pages 96 to 126 now comprises:
• a Chairman’s statement in which Tom de Swaan, the Remuneration Committee Chairman, reflects on the Committee’s decisions during the year and outlines the Committee’s agenda for 2014;
• an Annual report on remuneration which sets out how the Committee has implemented GSK’s remuneration policy during the year, and the way in which we propose to operate GSK’s policy in 2014; and
• a Remuneration policy report which sets out GSK’s proposed remuneration policy, to apply for three years from the end of our Annual General Meeting on 7 May 2014.
Annual governance meetingsDuring the year, I was pleased to Chair governance meetings with shareholders in the UK and the US alongside Judy Lewent, Chair of the Audit & Risk Committee, and Sir Deryck Maughan, the Senior Independent Director (SID). At these meetings, I was able to discuss a broad range of governance matters with shareholders, including Board and management dynamics, Director induction, training and development arrangements, and succession planning, whilst imparting details of the important work undertaken by the Nominations and Corporate Responsibility Committees. Judy provided an overview of the role and activities of the Audit & Risk Committee and Sir Deryck shared his insights and perspectives on our Board and governance structure with shareholders, since taking over the role of SID from Sir Robert Wilson in May 2013.
The following pages outline our approach to governance. Building on the work undertaken in last year’s Annual Report to restructure the Corporate governance report, this year, in addition to consolidating several of the statutory disclosures into the Shareholder Information section of the Annual Report on pages 242 to 250, our risk disclosures that have previously appeared in the Corporate governance report have been incorporated into an expanded risk management section on pages 18 to 19.
I commend this report to all of our shareholders.
Sir Christopher Gent Chairman 26 February 2014
Corporate governanceLetter to shareholders

GSK Annual Report 2013 83
Board report to shareholders – Oversight and stewardship in 2013 and future actions
The BoardThe Board is pleased to report that it was in full compliance with the requirements of the UK Corporate Governance Code.
The Board is responsible for the long-term success of the company, corporate governance, strategy, risk management and financial performance. It is accountable to shareholders for ensuring that the Group is appropriately managed and governed, and delivers GSK’s strategy to Grow, Deliver and Simplify.
2013 Board programmeThe Board met six times in 2013 and each Board member attended all scheduled Board meetings with the exception of Sir Deryck Maughan, Tom de Swaan and Hans Wijers who were each unable to attend one meeting due to prior business commitments. They each conveyed their views and comments to the Chairman on the matters to be discussed, which were shared with the other Directors at the meeting.
The Board agendas were shaped to create more time for strategic discussion and debate, and included ‘Deep Dive’ reviews of key issues for the business, to ensure focused consideration of our strategic priorities. During 2013, the agendas for Board meetings included the following business:
Month Strategy Board oversight Governance Risk oversight*
January Review extension of Operational Excellence programme
Review of 2012 financial results and outlook for 2013 Review of Notice of AGM Re-appointment of auditors
Review of internal 2012 Board evaluation report Secretary’s Report (including regulatory and governance updates)
Review of risk and internal controls process
March Review EMAP performance and strategy update ‘Deep Dive’ – global franchises and product launch readinessReview of business development projects
Preparation for AGM Secretary’s Report (including regulatory and governance updates)
May Annual Global Manufacturing and Supply and Vaccines business reviews
Preparation for AGMSecretary’s Report(including regulatory and governance updates)
July ‘Deep Dive’ – pipeline launches Review of talent and leadership development strategyReview of Treasury funding and pensions strategiesReview of long range forecast
Annual North America and R&D pharmaceuticals reviews
Review of capital and licensing proposals
Secretary’s Report (including regulatory and governance updates)
October Review of output from the annual Board & CET strategy meetingReview of Group Insurance strategyReview of US pension fund investment and hedging strategy
Annual business reviews of Consumer Healthcare and Japan
Review of projects and transactions approved by the Board Secretary’s Report (including regulatory and governance updates)
December ‘Deep Dive’ – China businessEurope strategy update reviewReview and approval of 2014-16 plan
Secretary’s Report (including regulatory and governance updates)
* During the year, all Board members were invited to attend the Audit & Risk Committee meetings where risk matters were routinely discussed.
2013 Board performanceDuring 2012, the Board identified certain actions to assist in adding further value to its deliberations. The performance of the Board in 2013 against these actions is set out below:
Actions Progress/Achievement
(i) The external landscapeBoard members were keen to supplement their understanding of the external landscape with ‘teach-ins’ on a range of topics, such as various therapeutic areas, the design of phase III trials, pricing, biopharmaceuticals, pharmacogenomics and emerging technology in R&D.
The Board programme was expanded to include briefings in these areas by Dr Moncef Slaoui and members of his senior team. The Board in October visited GSK’s R&D facility in Upper Providence as part of the Board/CET strategy meeting to view at first hand, emerging technologies in R&D and manufacturing.
(ii) Oversight of strategyThe Board wished to spend more time on business unit strategy, competitor analysis, pricing regimes, acquisition strategy and emerging issues.
The Board programme was adjusted to set aside more time for ‘Deep Dive’ and business development reviews during the year.
(iii) Board compositionThe Nominations Committee was tasked with identifying further suitable candidates to replace Board members due to retire in the next few years.
The Nominations Committee continues to focus on long-term recruitment of Non-Executive Directors.The Board was pleased to welcome a new Non-Executive Director, Hans Wijers, who provides experience of running global organisations to the Board’s deliberations.
These actions are set out in full on page 96 of GSK’s 2012 Annual Report, which discusses the internally facilitated evaluation of the Board’s activities by the Senior Independent Director.

84 GSK Annual Report 2013
Governance & remuneration Corporate governance
Board report to shareholders – Oversight and stewardship in 2013 and future actions continued
2013 & 2014 AGMs – Key highlights at a glance
2013 AGM – held on 1 May 2013 at QEII Conference Centre, London
2014 AGM – to be held on 7 May 2014 at QEII Conference Centre, London
• Full Director attendance• 3.7 to 3.75 billion votes cast for each resolution (76.5% of issued
share capital)• Sir Crispin Davis stood down after nine years’ service• All other Directors retired and were either elected or re-elected to
the Board, receiving at least 97.8% of the votes cast in favour• Highest votes in favour: 99.9% to elect or re-elect a number of
Directors• Lowest votes in favour: 90.2% to reduce the required notice for
a general meeting
• Sir Robert Wilson will stand down from the Board after ten years’ of service
• All other Directors will stand for re-election to the Board• The Board believes that each Director is effective and demonstrates
commitment to his or her role• Each Director has been formally evaluated by the Chairman before
standing for re-election
Induction programme – Hans Wijers(i) Individually designed and facilitated: by the Chairman and the Company Secretary.
(ii) Purpose: to orientate and familiarise Hans, who was appointed to the Board in 2013, with our strategy to Grow, Deliver and Simplify and with the industry, our organisation and our governance arrangements.
(iii) Customised: to take account of his experience, geographical background and business perspectives, together with the Committees on which he would serve.
Key elements of the one-to-one induction briefing sessions and site visits undertaken by Hans in 2013 are set out below:
Contact/Activity Induction content
Executive Directors GSK’s strategic, financial and R&D priorities
CET members Wide spectrum of GSK business operations, including Pharmaceuticals, Vaccines and Consumer Healthcare businesses, Strategic Development, Investor Relations and Global Communications and CR strategies
Senior Executives Focused on a number of core functions such as Finance, Tax, Treasury, Audit and Assurance, Risk Management and Investor Relations
Company Secretary Legal and regulatory duties of a UK listed company director and the corporate governance practices within GSK
Site visits Tours of our GMS and R&D sites in Upper Merrion and Upper Providence in the US
Investor meetings Meetings with investors as requested
The induction and training programme for Hans has continued in 2014, with a focus on internal management meeting attendance and operational site visits in order to provide Hans with a good perspective on how management operates, and to provide him with opportunities to meet key talent within GSK, as well as to deepen his understanding of key business issues.
Board performance action points for 2014The agreed action points arising from the 2013 Board evaluation review facilitated by our Senior Independent Director, Sir Deryck Maughan, against which progress will be disclosed in GSK’s 2014 Annual Report, are set out below:
(i) Strategy The Board would look to take a longer term view (ten years) of the key strategic issues facing the company.
(ii) Board meetings Time spent on routine matters would be further managed to enable strategic/business discussions to take priority, whilst ensuring the critical areas of oversight were maintained.
(iii) Annual Board/CET meetings The structure and format of these sessions would be reviewed to ensure that they are appropriately geared to realising maximum value in terms of strategic insights and direction setting.
(iv) China review All appropriate actions would be reviewed by the Board and implemented as necessary on the conclusion of the external investigation, and the Ropes and Gray independent review.

GSK Annual Report 2013 85
Leadership and effectiveness
The BoardThe Board met six times in 2013, with each member attending as follows:
Number of meetings held whilst a
Board member
Number ofmeetings attended
Sir Christopher Gent 6 6/6Sir Andrew Witty 6 6/6Simon Dingemans 6 6/6Dr Moncef Slaoui 6 6/6Professor Sir Roy Anderson 6 6/6Dr Stephanie Burns 6 6/6Stacey Cartwright 6 6/6Sir Crispin Davis* 3 3/3Lynn Elsenhans 6 6/6Judy Lewent 6 6/6Sir Deryck Maughan 6 5/6Dr Daniel Podolsky 6 6/6Tom de Swaan 6 5/6Jing Ulrich 6 6/6Hans Wijers** 4 3/4Sir Robert Wilson 6 6/6
In addition to the scheduled meetings, the Board also met on a quorate basis on three occasions to consider corporate transactions, including authorising the disposal of the Lucozade and Ribena brands, and the China investigations.
* Sir Crispin Davis retired from the Board on 1 May 2013.
** Hans Wijers was appointed as a Non-Executive Director with effect from 1 April 2013.
Sir Deryck Maughan, Tom de Swaan and Hans Wijers were each unable to attend one Board meeting due to prior business commitments.
The ChairmanSir Christopher Gent’s role as Chairman is to lead and manage the business of the Board and to provide direction and focus, while ensuring that there is a clear structure for the effective operation of the Board and its Committees. He sets the agenda for Board discussions to promote effective and constructive debate and to support a sound decision-making process, ensuring that the Board receives accurate, timely and clear information, in particular about the company’s performance.
Sir Christopher works closely with Sir Andrew Witty to ensure that the strategies and actions agreed by the Board are effectively implemented and provides support and advice to Sir Andrew, while respecting his executive responsibility for managing the Group. The division of responsibilities between the Chairman and the CEO has been agreed by the Board and is set out in the governance section of our website.
Sir Christopher is responsible to shareholders for the performance of the Group and leads discussions and the development of relations with them.
Non-Executive DirectorsThe Non-Executive Directors provide a strong, independent element on the Board. They are well placed to constructively challenge and support management and to shape proposals on strategy and succession planning. Between them, they bring independent judgement and a breadth of skills and experience gained at the most senior levels of international business operations and academia.
Senior Independent DirectorSir Deryck Maughan has been our Senior Independent Director (SID) since 1 May 2013, when he succeeded Sir Robert Wilson, who had been our SID since 20 May 2009. Sir Deryck’s role is to act as a sounding board for Sir Christopher and a trusted intermediary for the other Directors. He is also available as an additional point of contact for shareholders. His responsibilities include the evaluation of the performance of the Chairman and, at the request of the Chairman, evaluating the Board and its Committees (in collaboration with the Committee Chairmen) in years when the evaluation is conducted internally. The SID also works with the Chairman on the process for the selection of a new Chairman as appropriate, and he chairs the Nominations Committee when agreeing the recommendation to the Board for the Chairman’s successor.
Sir Deryck maintains an understanding of the issues and concerns of our major shareholders through meetings with them and through reports from our Investor Relations team.
CEOSir Andrew is responsible for the management of the business, developing the Group’s strategic direction for consideration and approval by the Board and implementing the agreed strategy. He is assisted by other members of the Corporate Executive Team (CET), which meets at least 11 times a year and more often if required.
Short biographies of the members of the CET are given under ‘Our Corporate Executive Team’ on pages 80 and 81.
Company SecretaryThe Company Secretary, Victoria Whyte, is a solicitor and a Fellow of the Institute of Chartered Secretaries and Administrators. Victoria was formerly Deputy Secretary and Secretary to the Remuneration Committee. She has acted as Secretary to the Board and all the Board’s Committees since her appointment as Company Secretary on 1 January 2011.
The Company Secretary supports the Chairman in designing the induction for new Directors, in the delivery of the corporate governance agenda, in particular in the planning of agendas for the annual cycle of Board and Committee meetings, and in ensuring that information is made available to Board members on a timely basis. The Company Secretary advises the Directors on Board procedures and corporate governance matters, and arranges for the Non-Executive Directors to attend internal management meetings and make visits to our business operations to enhance their knowledge and understanding of the business.
During 2013, the Company Secretary responded to various consultations on the evolving global governance and corporate reporting agenda on behalf of the Group and engaged with shareholders to ensure they fully understood GSK’s governance and remuneration arrangements.
IndependenceThe Board considers all of its Non-Executive Directors to be independent in character and judgement and free from any business or other relationship which could materially interfere with the exercise of their judgement. The Chairman satisfied the independence test on his appointment to the Board.
The independence of those Non-Executive Directors who have served on the Board for over six years was subjected to a rigorous review. In particular, the Board considered that Sir Deryck Maughan and Sir Robert Wilson, who have served on the Board for over nine years, continued to demonstrate the characteristics of independence, such as challenging management and taking part in rigorous debate, whilst possessing outstanding knowledge of the company’s business affairs.
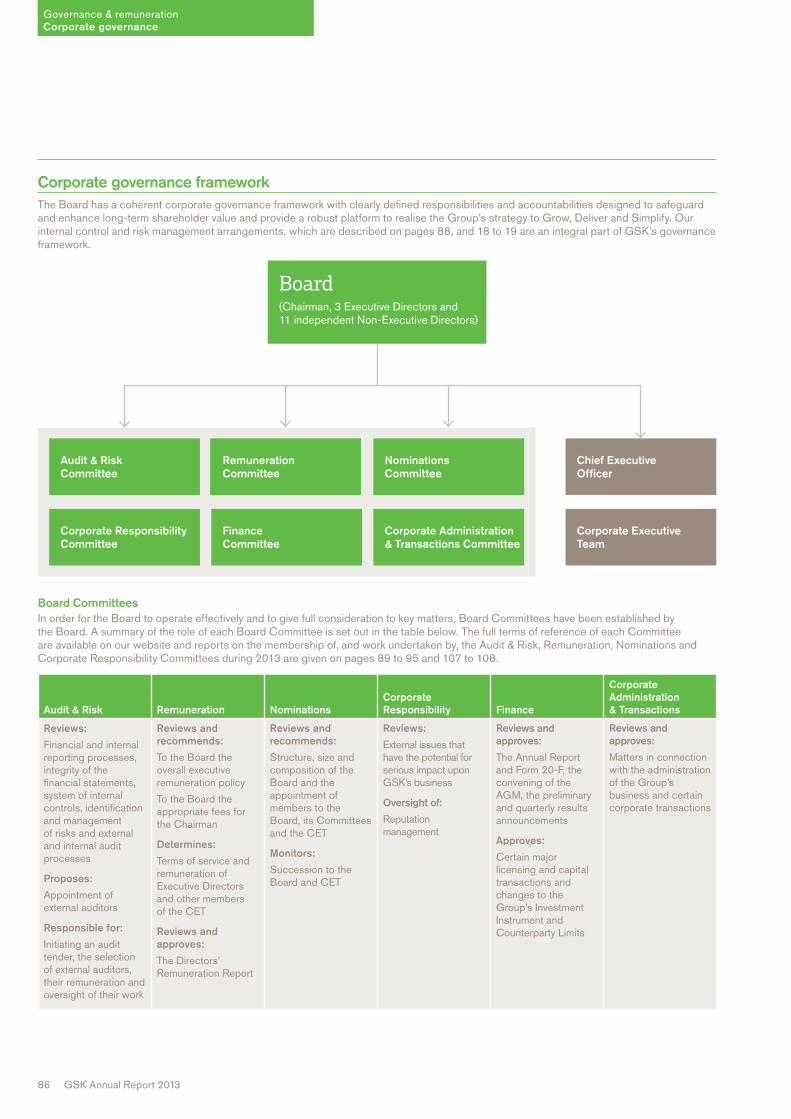
86 GSK Annual Report 2013
Governance & remuneration Corporate governance
Corporate governance frameworkThe Board has a coherent corporate governance framework with clearly defined responsibilities and accountabilities designed to safeguard and enhance long-term shareholder value and provide a robust platform to realise the Group’s strategy to Grow, Deliver and Simplify. Our internal control and risk management arrangements, which are described on pages 88, and 18 to 19 are an integral part of GSK’s governance framework.
Board CommitteesIn order for the Board to operate effectively and to give full consideration to key matters, Board Committees have been established by the Board. A summary of the role of each Board Committee is set out in the table below. The full terms of reference of each Committee are available on our website and reports on the membership of, and work undertaken by, the Audit & Risk, Remuneration, Nominations and Corporate Responsibility Committees during 2013 are given on pages 89 to 95 and 107 to 108.
Audit & Risk Remuneration NominationsCorporate Responsibility Finance
Corporate Administration & Transactions
Reviews:Financial and internal reporting processes, integrity of the financial statements, system of internal controls, identification and management of risks and external and internal audit processes
Proposes:Appointment of external auditors
Responsible for:Initiating an audit tender, the selection of external auditors, their remuneration and oversight of their work
Reviews and recommends:To the Board the overall executive remuneration policyTo the Board the appropriate fees for the Chairman
Determines:Terms of service and remuneration of Executive Directors and other members of the CET
Reviews and approves:The Directors’ Remuneration Report
Reviews and recommends:Structure, size and composition of the Board and the appointment of members to the Board, its Committees and the CET
Monitors:Succession to the Board and CET
Reviews:External issues that have the potential for serious impact upon GSK’s business
Oversight of:Reputation management
Reviews and approves:The Annual Report and Form 20-F, the convening of the AGM, the preliminary and quarterly results announcements
Approves:Certain major licensing and capital transactions and changes to the Group’s Investment Instrument and Counterparty Limits
Reviews and approves:Matters in connection with the administration of the Group’s business and certain corporate transactions
Audit & Risk Committee
Remuneration Committee
Nominations Committee
Corporate Responsibility Committee
Finance Committee
Corporate Administration & Transactions Committee
Chief Executive Officer
Corporate Executive Team
Board(Chairman, 3 Executive Directors and 11 independent Non-Executive Directors)

GSK Annual Report 2013 87
Board induction, business awareness and trainingThe induction programme for Hans Wijers presented on page 84 illustrates the typical induction format for a new Director.
To ensure that Non-Executive Directors develop and maintain a greater insight and understanding of the business, they are invited to attend internal management meetings, including meetings of the CET, the Research & Development Executive, the Product Executive, the Scientific Review Board, the Portfolio Investment Board, the Commercial Accountability Board and the Risk Oversight and Compliance Council. They also meet employees informally during visits to the Group’s operations and at receptions held around Board meetings.
The Board is kept up-to-date on legal, regulatory and governance matters through regular papers from the Company Secretary and presentations by internal and external advisers.
During the year, the Board was briefed on various developments in narrative and executive remuneration reporting, going concern, risk management, board diversity, the impact of the UK and EU reviews of the audit market, market abuse and insider trading, shareholder engagement and other developments in corporate governance, including the requirements of the September 2012 update to the UK Corporate Governance Code.
The Board members undertook specific refresher training on, and under the provisions of, the Corporate Integrity Agreement (CIA) in 2013 which was delivered at the Audit & Risk Committee. Each new Board member will, as part of his or her induction programme, receive comprehensive training on the CIA. Hans Wijers has taken part in such a training session in 2013 as part of his induction.
Sir Christopher also meets with each Director annually on a one-to-one basis to discuss his or her ongoing training and development requirements.
Board compositionWe seek to build an effective and complementary Board, whose capability is appropriate for the scale, complexity and strategic positioning of our business. The process for Board appointments is led by the Nominations Committee and is described on pages 93 to 94.
We are mindful of the need to balance the composition of the Board and its Committees and to refresh them progressively over time so that we can draw upon the experience of longer serving Directors, while tapping into the new external perspectives and insights which more recent appointees bring to the Board’s deliberations.
Non-Executive Directors are drawn from a wide range of industries and backgrounds, including pharmaceutical and healthcare, medical research and academia, and retail and financial services, and have appropriate experience of complex organisations with global reach. Some have considerable experience of the pharmaceutical industry and the more recent appointees bring a new approach to the Group, and to Board discussions.
Board diversity We are committed to the diversity of our boardroom and we are similarly committed to equal opportunities for all our employees at all levels of the organisation. The diversity and inclusiveness of our workforce are promoted throughout GSK.
We believe that a key requirement of an effective board is that it comprises a range and balance of skills, experience, knowledge, gender and independence, with individuals that are prepared to challenge each other and work as a team. This needs to be backed up by a diversity of personal attributes, including character, intellect, sound judgement, honesty and courage.
The Board’s diversity policy is set out on page 94 and for details of the gender diversity of GSK’s global workforce, see page 55 of Responsible business.
Time allocationEach Non-Executive Director has a letter of appointment which sets out the terms and conditions of his or her directorship.
Sir Christopher and the Non-Executive Directors are expected to devote such time as is necessary for the proper performance of their duties. No precise timings are given as this will vary from year to year depending on the company’s activities. Directors are expected to attend all Board meetings, and any additional meetings as required.
They are also expected to attend meetings of the Committees of which they are members, the Audit & Risk Committee meetings (which are open to all Directors in furtherance of their risk and compliance responsibilities) and strategy sessions, and to make visits to operational sites. In addition, Board members are invited to attend at least one CET meeting a year and may attend certain Research & Development Executive and other operational meetings.
2013 Board and Chairman’s evaluationThe Board carries out an evaluation of its performance and the performance of its Committees every year which is facilitated externally every third year. The progress of the Board against the outcomes of the 2012 evaluation, which was internally facilitated by the previous SID, Sir Robert Wilson, is reported on page 83. The action points arising from the 2013 evaluation of the Board facilitated by the current SID, Sir Deryck Maughan, are disclosed on page 84. The feedback from the Board evaluation is summarised below.
The Board is viewed by all Board members as effective. The pharmaceutical industry is undergoing fundamental change and the Board has worked hard to understand the opportunities and risks this poses to our strategy, and is supportive of the direction articulated by the management team. Debates are open and robust and everyone is encouraged to contribute. Corporate responsibility, ethics and compliance are taken seriously, and there is a good balance between the core values of the company and the interests of shareholders.
The openness of Sir Andrew and the management team to Board input is viewed by the Board members as exemplary. The ability for Directors to attend management meetings and visit sites enhances the Board’s competence.
The Board is well balanced in terms of diversity of experiences, however, the desirability of adding an experienced Director from the UK listed environment is acknowledged.
The Board Committees have strong and engaged leaders, significant workloads to discharge, and play an important role in the company’s governance.

88 GSK Annual Report 2013
Governance & remuneration Corporate governance
The Non-Executive Directors, led by Sir Deryck, met separately, without Sir Christopher being present, to discuss his performance. They considered his leadership, performance and overall contribution to be of a high standard.
The Chairmen of each of the Board Committees undertook separate evaluations of their Committees and the outcome of each evaluation was reported and discussed with the respective Committee and the Board.
In addition, Sir Christopher met with all the Non-Executive Directors independently of the Executive Directors.
Accountability
Internal control frameworkThe Board recognises its responsibilities to present a fair, balanced and understandable assessment of the Group’s position and prospects.
The Board has accountability for reviewing and approving the effectiveness of internal controls operated by the Group, including financial, operational and compliance controls, and risk management.
The internal control framework (the Framework) has been in operation for the whole of the year and continues to operate up to the date of approval of this Annual Report. The Framework is the process by which compliance with laws and regulations, the reliability of financial reporting and the effectiveness and efficiency of operations are reviewed. The Framework assists in the identification, evaluation, and management of principal risks as required by the UK Corporate Governance Code (the UK Code), and is designed to manage rather than eliminate the risk of not achieving business objectives. We believe the Framework provides reasonable, but not absolute assurance against material misstatement or loss.
The Audit & Risk Committee (the Committee) receives reports on areas of significant risk to the Group and on related internal controls. Following consideration of these reports, the Committee reports annually to the Board on the effectiveness of controls.
The Board, through the Committee, has reviewed the assessment of risks and the Framework, and has considered the effectiveness of the system of internal controls in operation in the Group for the year covered by this Annual Report and up to the date of its approval by the Board. The Board’s review focuses on the company and its subsidiaries and does not extend to material associated undertakings, joint ventures or other investments, although it considers the risk of the company’s participation in these activities. There are established procedures and controls in place to identify entities whose results must be consolidated with the Group’s results.
We believe the process followed by the Board in reviewing the system of internal controls accords with the guidance on internal control issued by the Turnbull Committee.
This is in accordance with the provisions of the UK Code, which provide that the Board is responsible for determining the nature and extent of the significant risks it is willing to take in achieving its strategic objectives. The Board provides oversight to help ensure that the Group maintains sound risk management and internal control systems.
A review of the Group’s risk management approach is further discussed in the Risk Management section on pages 18 to 19. Our management of each principal risk is explained on pages 232 to 241.
Relations with shareholdersWe work to engage effectively with shareholders through our regular communications, the AGM and other investor relations activities.
We announce our financial results on a quarterly basis. The annual results are included in our Annual Report. All shareholders receive an Annual Summary which advises them that our Annual Report and Notice of our Annual General Meeting are available on our website.
During the year, Sir Andrew Witty and Simon Dingemans gave presentations to institutional investors, analysts and the media on the full year results, which are also available via webcast and teleconference. After the first, second and third quarter results, we hold webcast teleconferences for the same audience. Our results are available on our website.
Our Investor Relations department, with offices in London and Philadelphia, acts as a focal point for communications with investors. Sir Andrew, Simon and Sir Christopher maintain a continuous dialogue with institutional shareholders on performance, plans and objectives through a programme of regular meetings. During the year they held over 90 individual meetings with investors and they have also hosted approximately 29 group meetings with investors and potential investors.
The Company Secretary acts as a focal point for communications on corporate governance matters. We also have a small central Corporate Responsibility (CR) team which co-ordinates strategy, policy development and reporting specifically with respect to CR matters. The team communicates with socially responsible investors and other stakeholders.
Sir Christopher also meets regularly with institutional shareholders to hear their views and discuss issues of mutual importance, and communicates their views to the other members of the Board. The SID and all the Non-Executive Directors are available to meet with shareholders.
The Remuneration Committee Chairman, the Chairman and the Head of Human Resources held their annual meetings with major shareholders in November to discuss executive remuneration.
In addition, the Chairman, Audit & Risk Committee Chair and the SID held separate meetings with major UK shareholders in December, and with major US shareholders in January 2014 on governance matters.
We have a briefing process in place for Non-Executive Directors, managed by Sir Christopher, to focus on sector specific issues and general shareholder preferences.
Remuneration ReportOur Remuneration Report comprises the Remuneration Committee Chairman’s Annual Statement, the Annual Report on Remuneration and the Remuneration Policy Report, and is set out on pages 96 to 126.
Committee ReportsThe reports on the Audit & Risk, Nominations and Corporate Responsibility Committees describing the activities of those Committees during the year, are set out on pages 89 to 95.

GSK Annual Report 2013 89
Audit & Risk Committee Report
Dear ShareholderDuring 2013, the Committee’s agenda included a review of the integrity of our financial results, the appropriateness of the system of internal controls, our business operations across the world and their management of risk, as well as focusing consideration on new emerging risks.
The Committee’s Report, which includes descriptions of the work undertaken by the Committee during the year, has been modified to reflect new Audit Committee responsibilities and reporting requirements under the UK Corporate Governance Code (the UK Code) and Guidance for Audit Committees issued by the Financial Reporting Council (FRC) in September 2012. In particular, the Committee Report discusses the significant issues that the Committee considered and addressed in relation to the financial statements and outlines how the Committee has assisted the Board of Directors in making their statement on page 128, confirming that GSK’s 2013 Annual Report and Accounts are fair, balanced and understandable.
Since the start of 2013, after the Committee and the Board considered the division between their work in terms of risk management, it was agreed that all Board members would be invited to attend the entire Committee meetings. The Board continued to cover those risks specifically reserved for its review to ensure continuity and consistency of coverage and oversight.
I have completed my first full year as the Chair of the Committee and, in that time, I have enhanced my knowledge and understanding of the Group through meetings with a range of senior executives to discuss issues brought to the Committee by management, by attending CET, Risk Oversight Compliance Council and other management meetings, as well as connecting with the network of Compliance Officers, on whom the Group relies to oversee and drive compliance within GSK.
As a matter of routine, I also held pre-Committee briefing meeting sessions with management and the external auditors and generally made myself available if any Director, senior executive, or the external audit partner wished to discuss any particular matters with me in more detail.
I was pleased to attend, alongside the Chairman and the Senior Independent Director, my first annual governance meetings that were held with major UK shareholders in December 2013, and major US shareholders in January 2014, at which I had the opportunity to discuss areas of mutual importance in relation to the work of the Committee.
Events during the year have brought evidence that vigilance and continuous improvements to our internal control and risk management processes and systems must remain a high priority for the Committee. The allegations of fraudulent behaviour within our business in China are currently under investigation by the authorities in the country. Separately, we have commissioned an independent review by the international law firm, Ropes and Gray, into what has happened in China.
Ropes and Gray report directly to GSK’s General Counsel and, as Chair of the Committee, I have unfettered access to the law firm partners who are leading this independent investigation. In addition, time continues to be set aside at Committee meetings to consider this matter.
Finally, I was delighted to welcome Jing Ulrich and Lynn Elsenhans as new members of the Committee as part of the ongoing refreshment of the composition of the Committee, and I am pleased with the contribution they have already made to the Committee’s deliberations.
Judy LewentAudit & Risk Committee Chairman
Membership and attendanceThe membership of the Committee, together with appointment dates and attendance at meetings during 2013, is set out below:
Members Committee member since
Attendance at full meetings during
2013
Judy Lewent (Chairman from1 January 2013) 1 April 2011 6/6Professor Sir Roy Anderson* 20 May 2009 3/3Stacey Cartwright 1 April 2011 6/6Lynn Elsenhans 1 January 2014 0/0Sir Deryck Maughan 21 January 2005 4/6Dr Daniel Podolsky 1 January 2007 6/6Tom de Swaan 1 January 2006 5/6Jing Ulrich 1 May 2013 3/3Sir Robert Wilson* 12 December 2003 3/3
* Professor Sir Roy Anderson and Sir Robert Wilson both stood down as members of the Committee on 1 May 2013.
Tom de Swaan was unable to attend one and Sir Deryck Maughan was unable to attend two Committee meetings due to prior business commitments.
In addition to the six scheduled meetings, the Committee also met on a quorate basis on four occasions to review or approve matters associated with the Annual Report and Accounts and Form 20-F, and preliminary and quarterly results announcements.
All Board members are invited to attend the Committee meetings and other attendees include: Attendee
Regular attendee
Attends as required
Chairman ✓
CEO ✓
CFO ✓
General Counsel ✓
Financial Controller ✓
Head of Audit & Assurance ✓
Company Secretary – Secretary to theCommittee ✓
Chairman, Research & Development ✓
Head of Governance, Ethics & Assurance ✓
Chief Medical Officer ✓
Chief Product Quality Officer ✓
External auditor ✓
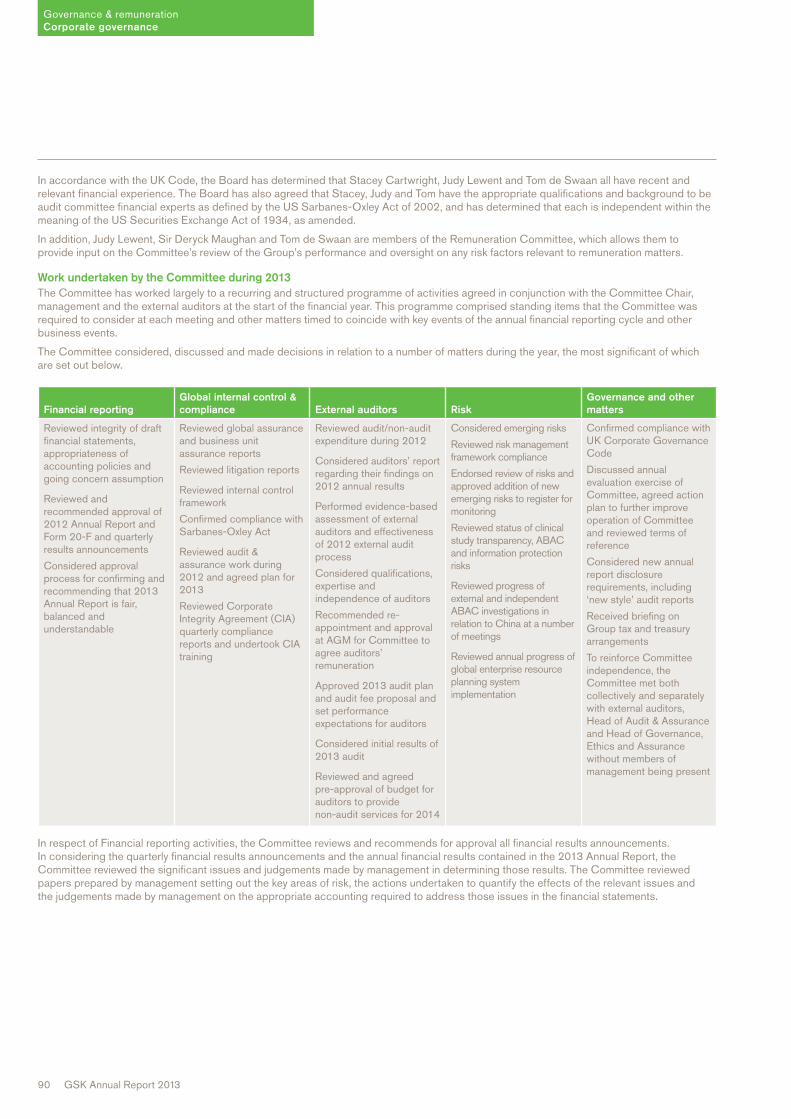
90 GSK Annual Report 2013
Governance & remuneration Corporate governance
In accordance with the UK Code, the Board has determined that Stacey Cartwright, Judy Lewent and Tom de Swaan all have recent and relevant financial experience. The Board has also agreed that Stacey, Judy and Tom have the appropriate qualifications and background to be audit committee financial experts as defined by the US Sarbanes-Oxley Act of 2002, and has determined that each is independent within the meaning of the US Securities Exchange Act of 1934, as amended.
In addition, Judy Lewent, Sir Deryck Maughan and Tom de Swaan are members of the Remuneration Committee, which allows them to provide input on the Committee’s review of the Group’s performance and oversight on any risk factors relevant to remuneration matters.
Work undertaken by the Committee during 2013The Committee has worked largely to a recurring and structured programme of activities agreed in conjunction with the Committee Chair, management and the external auditors at the start of the financial year. This programme comprised standing items that the Committee was required to consider at each meeting and other matters timed to coincide with key events of the annual financial reporting cycle and other business events.
The Committee considered, discussed and made decisions in relation to a number of matters during the year, the most significant of which are set out below.
Financial reportingGlobal internal control & compliance External auditors Risk
Governance and other matters
Reviewed integrity of draft financial statements, appropriateness of accounting policies and going concern assumption
Reviewed and recommended approval of 2012 Annual Report and Form 20-F and quarterly results announcementsConsidered approval process for confirming and recommending that 2013 Annual Report is fair, balanced and understandable
Reviewed global assurance and business unit assurance reports Reviewed litigation reports
Reviewed internal control frameworkConfirmed compliance with Sarbanes-Oxley Act
Reviewed audit & assurance work during 2012 and agreed plan for 2013Reviewed Corporate Integrity Agreement (CIA) quarterly compliance reports and undertook CIA training
Reviewed audit/non-audit expenditure during 2012
Considered auditors’ report regarding their findings on 2012 annual results
Performed evidence-based assessment of external auditors and effectiveness of 2012 external audit processConsidered qualifications, expertise and independence of auditorsRecommended re-appointment and approval at AGM for Committee to agree auditors’ remuneration
Approved 2013 audit plan and audit fee proposal and set performance expectations for auditors
Considered initial results of 2013 audit
Reviewed and agreed pre-approval of budget for auditors to provide non-audit services for 2014
Considered emerging risks Reviewed risk management framework complianceEndorsed review of risks and approved addition of new emerging risks to register for monitoringReviewed status of clinical study transparency, ABAC and information protection risks
Reviewed progress of external and independent ABAC investigations in relation to China at a number of meetings
Reviewed annual progress of global enterprise resource planning system implementation
Confirmed compliance with UK Corporate Governance CodeDiscussed annual evaluation exercise of Committee, agreed action plan to further improve operation of Committee and reviewed terms of referenceConsidered new annual report disclosure requirements, including ‘new style’ audit reportsReceived briefing on Group tax and treasury arrangementsTo reinforce Committee independence, the Committee met both collectively and separately with external auditors, Head of Audit & Assurance and Head of Governance, Ethics and Assurance without members of management being present
In respect of Financial reporting activities, the Committee reviews and recommends for approval all financial results announcements. In considering the quarterly financial results announcements and the annual financial results contained in the 2013 Annual Report, the Committee reviewed the significant issues and judgements made by management in determining those results. The Committee reviewed papers prepared by management setting out the key areas of risk, the actions undertaken to quantify the effects of the relevant issues and the judgements made by management on the appropriate accounting required to address those issues in the financial statements.

GSK Annual Report 2013 91
Effectiveness of external auditorsIn evaluating the effectiveness of the audit process prior to making a recommendation on the re-appointment of the external auditors, the Committee reviews the effectiveness of their performance against criteria which it agrees, in conjunction with management, at the beginning of each year’s audit.
As part of this process, the Committee considers feedback on the prior year’s external audit gathered through a client satisfaction survey facilitated by the auditors’ client service review team, which is independent of the engagement team that undertook the audit work. The survey seeks feedback from the financial management team at corporate and business unit level. It covers four key areas – the robustness of the audit process, the quality of the delivery, the quality of the people and the quality of the service. Having reviewed the feedback and noted any areas of improvement to be implemented on the following year’s audit, provided the Committee is satisfied with the effectiveness of the external audit process, it will recommend the re-appointment of the auditors at the forthcoming AGM.
Details of the current criteria for judging the effectiveness of the external auditors are set out below:
• deliver a smooth-running, thorough and efficiently executed audit• provide accurate, up-to-date knowledge of technical issues on
a timely basis• serve as an industry resource, communicating best practice and
industry trends in reporting
• adhere to all independence policies, including GSK’s policies, ISA (UK&I) 220 and SEC requirements
• deliver a focused and consistent audit approach globally that reflects local risks and materiality
• co-ordinate appropriately with GSK’s Audit & Assurance function
• provide consistency of advice at all levels.
Audit partner rotationThe external auditors are required to rotate the audit engagement partner every five years. The previous audit partner stepped down from his position after the audit of GSK’s financial statements for 2012 had been concluded.
After a robust review process by the Committee, together with the involvement of the CEO and CFO, to select his replacement, the Committee approved the appointment of a new audit engagement partner with effect from the financial year commencing on 1 January 2013.
Audit firm tenderingThe Committee keeps under review the ongoing legislative proposals on audit tendering and rotation from the EU and the Competition Commission, and will implement them when they become final. These proposals have effectively superseded the FRC’s comply-or-explain approach that underpins the UK Code which would otherwise have applied to the company for the first time this year. The FRC plans to withdraw this tendering provision during 2014.
The significant issues considered in relation to the financial statements for the year ended 31 December 2013 are set out in the following table, together with a summary of the financial outcomes where appropriate. In addition, the Committee and the external auditors have discussed the significant issues addressed by the Committee during the year and the areas of particular audit focus, as described in the Independent Auditor’s Report on pages 129 to 131.
Significant issues considered by the Committee in relation to the financial statements How the issue was addressed by the Committee
Going concern basis for the preparation of the financial statements
The Committee considered the outcome of management’s half-yearly reviews of current and forecast net debt positions and the various financing facilities and options available to the Group. Following a review of the risk and potential impact of unforeseen events, the Committee confirmed that the application of the going concern basis for the preparation of the financial statements continued to be appropriate.
Revenue recognition, including returns and rebates (RAR) accruals
The Committee reviewed management’s approach to the timing of recognition of revenue and accruals for customer returns and rebates. The US Pharmaceuticals and Vaccines accrual for returns and rebates was £1.2 billion at 31 December 2013 and the Committee reviewed the basis on which the accrual had been made and concurred with management’s judgements on the amounts involved. A fuller description of the process operated in the US Pharmaceuticals and Vaccines business in determining the level of accrual necessary is set out in ‘Critical accounting policies’ on page 67.
Provisions for legal matters, including recent government investigations in China to the extent that they can be determined
The Committee received detailed reports on actual and potential litigation from both internal and external legal counsel, together with a number of detailed updates concerning the ongoing government investigations in China. Management outlined the levels of provision considered necessary in respect of potential adverse litigation outcomes and also those areas, including in respect of the China investigation, where it was not yet possible to determine if a provision was necessary, or its amount. At 31 December 2013, the provision for legal matters was £0.6 billion, as set out in Note 29 to the financial statements, ‘Other provisions’.
Provisions for tax issues The Committee considered current tax disputes and areas of potential risk and concurred with management’s judgement on the levels of tax contingencies required. At 31 December 2013, the Group’s balance sheet included a tax payable liability of £1.5 billion.
Impairments of intangible assets The Committee reviewed management’s process for reviewing and testing goodwill and other intangible assets for potential impairment. The Committee accepted management’s judgements on the intangible assets that required writing down and the resulting impairment charge of £739 million in 2013. See Note 19 to the financial statements, ‘Other intangible assets’ for more details.
Provisions for pension and other post-employment obligations
The Committee reviewed the significant assumptions adopted by management for the valuations of obligations for the Group’s largest pension and post-retirement healthcare schemes in the UK and the US, together with the resultant net obligation amounts, as calculated by external actuaries. The Group’s net deficit at 31 December 2013 amounted to £1.9 billion as set out in Note 28 to the financial statements, ‘Pensions and other post-employment benefits’.

92 GSK Annual Report 2013
Governance & remuneration Corporate governance
PricewaterhouseCoopers LLP have remained in place as auditors since the Group’s inception in December 2000 and the audit contract has not been put out to tender in that period. Their performance has been reviewed annually by the Committee since that time. As part of its review of the implications of the end of the previous audit partner’s five year term, the Committee considered the appropriateness of putting in place a tender process. This included assessing the FRC’s most recent guidance on the subject, the level of change currently underway inside the Group and improvements to the auditors’ services, including fee levels proposed by the auditors. The review concluded that a tender was not in the company’s interests at this time and the Committee consequently approved the appointment of the new audit partner. However, the Committee agreed that this issue should be reviewed regularly as part of the annual appointment process.
Non-audit services
The Sarbanes-Oxley Act of 2002 prohibits the engagement of the external auditors for the provision of certain services such as legal, actuarial, internal audit outsourcing, or financial information systems design. Where the external auditors are permitted to provide non-audit services, the Committee ensures that auditor objectivity and independence are safeguarded by a policy requiring pre-approval by the Committee for such services. The total fees for non-audit work cannot exceed 50% of the audit fee, except in special circumstances where there would be clear advantage in the company’s auditors undertaking such additional work. These services may include audit, audit-related, tax and other services. Pre-approval is detailed as to the particular service or categories of service, and is subject to a specific budget. All non-audit services over £50,000 are put out to competitive tender with other financial service providers, in line with the Group’s procurement process, unless the skills and experience of the external auditors make them a suitable supplier of the non-audit service under consideration, in which case a request for proposal is submitted by the relevant CET member to the CFO for approval.
Provision of non-audit servicesThere are guidelines which set out the Group’s policy on engaging the external auditors to provide non-audit services, which include:
• ascertaining that the skills and experience of the external auditors make them a suitable supplier of the non-audit services
• ensuring adequate safeguards are in place so that the objectivity and independence of the Group audit are not threatened or compromised, and
• ensuring that the fee levels do not exceed 50% of the annual audit fee.
The external auditors and management report regularly to the Committee regarding the extent of services provided in accordance with this pre-approval and the fees for the services performed. The Committee may also pre-approve additional services on a case-by-case basis. Fees paid to the company’s auditor and its associates are set out below. Further details are given in Note 8 to the financial statements, ‘Operating profit’.
Where possible, other accounting firms are engaged to undertake non-audit services.
Audit/non audit service three year comparison graph (£m)
Code of Conduct and reporting linesWe also have a number of well established policies, including a Code of Conduct, which is available on the governance section of our website, and confidential reporting lines for the reporting and investigation of unlawful conduct. An updated version of the Code of Conduct was published in January 2014.
Fair, balanced and understandable assessmentOne of the key compliance requirements of a group’s financial statements is for the Annual Report and Accounts to be fair, balanced and understandable. The coordination and review of Group-wide contributions into the Annual Report and Accounts follows a well established and documented process, which is performed in parallel with the formal process undertaken by the external auditors.
The Committee received a summary of the approach taken by management in the preparation of GSK’s 2013 Annual Report and Accounts to ensure that it met the requirements of the UK Code. This enabled the Committee, and then the Board, to confirm that GSK’s 2013 Annual Report taken as a whole is fair, balanced and understandable.
Committee evaluationThe Committee’s annual evaluation was carried out by the Committee Chairman and concluded that the Committee continued to operate effectively, with full participation from all members and executive management attendees and members commented favourably on a very good level of access to the Committee Chairman.
In terms of enhancements to the Committee’s deliberations, it was agreed that a heightened focus on time management and attention on key risk areas during the meetings would assist the Committee’s overall effectiveness.
20132011 2012
17.3
19.1
6.4
17.3
5.9
Audit and assurance servicesAll other services, including tax, regulatory, compliance and treasury-related services
5.8
0
20
16
12
8
4

GSK Annual Report 2013 93
Nominations Committee Report
Sir Christopher GentNominations Committee Chairman
MembershipThe membership of the Nominations Committee (the Committee), together with appointment dates and attendance at meetings, is set out below:
Members Committee member since
Attendance at full meetings during 2013
Sir Christopher Gent(Chairman since1 January 2005) 9 December 2004 5/5Professor Sir Roy Anderson 1 October 2012 5/5Sir Crispin Davis* 9 July 2009 2/2Sir Deryck Maughan 9 July 2009 4/5Tom de Swaan 1 October 2012 4/5Sir Robert Wilson 28 March 2008 5/5
* Sir Crispin Davis retired from the Board on 1 May 2013.
Tom de Swaan and Sir Deryck Maughan were each unable to attend one Committee meeting due to prior business commitments.
Other attendees at Committee meetings may include:
Attendee
Regular attendee
Attends as required
Chief Executive Officer ✓
Head of Human Resources ✓
Company Secretary – Secretary to the
Committee ✓
Appropriate external advisers ✓
Work of the Committee during 2013
Main responsibilitiesThe main responsibilities of the Committee are set out on page 86.
Appointment of new Non-Executive DirectorsDuring 2013, the Committee’s particular area of focus was the search for new Non-Executive Directors as the phased refreshment of the Board has progressed.
When recruiting Non-Executive Directors, the Committee evaluates the particular skills, knowledge, independence, experience and diversity, including gender, that would benefit and balance the Board most appropriately for each appointment.
During the search process, broad selection criteria are generally used which focus on achieving a balance between continental European, British, American and emerging markets experience, and having individuals with expertise and capabilities developed in various sectors and specialities.
MWM and Egon Zhender, who specialise in the recruitment of high calibre Non-Executive Directors, were engaged to ensure that the widest possible pool of candidates was available to select from. MWM and Egon Zhender only provide recruitment consultancy services to the Committee. Dossiers of potential Non-Executive appointees were considered by the Committee and candidates were shortlisted for interview on merit and against objective criteria, after assessing their relevant qualifications and time commitments.
After interviewing suitable candidates, the Committee was pleased to recommend to the Board Hans Wijers as a potential Non-Executive Director. He was appointed to the Board on 1 April 2013. The Board considered that this appointment achieved the aim of appointing a candidate who has experience of running global companies.
It is currently intended that Sir Christopher Gent will step down as Chairman at the end of 2015 and the Committee has made progress in the search for his successor.
Board and committee changesThe Board’s proactive approach to the refreshment of the Board has resulted in orderly changes in the composition of the Board and its Committees on the recommendation of the Committee which are set out below.
Sir Crispin Davis did not stand for re-election at the AGM in May after nine years’ of service and Sir Robert Wilson will not stand for re-election at the AGM in 2014 after ten years’ of service. Given the number of recent appointments, and that a further long-standing Board member is to step down from the Board by May 2014, Sir Deryck Maughan agreed to stand for re-election by shareholders for up to a further two years before stepping down from the Board at the 2016 AGM. The Chairman and Sir Deryck are conducting the search for the Chairman’s successor and Sir Deryck will also provide continuity and balance to the composition of the Board, given his significant knowledge of GSK’s business affairs. Sir Deryck has brought his own style to the role of Senior Independent Director since he succeeded Sir Robert Wilson after the closure of the AGM in May 2013, and the Board has confirmed that he continues to demonstrate the characteristics of independence in carrying out his role on the Board.
Tom de Swaan succeeded Sir Crispin Davis as Chairman of the Remuneration Committee and Judy Lewent succeeded Tom de Swaan as Chairman of the Audit & Risk Committee on 1 January 2013. Tom de Swaan has been a member of the Remuneration Committee since May 2009 and continues to be a member of the Audit & Risk Committee. Judy has been a member of the Audit & Risk Committee since April 2011.
Dr Stephanie Burns was appointed to the Remuneration Committee with effect from 1 May 2013. Jing Ulrich was appointed to the Audit & Risk Committee also with effect from 1 May 2013, on the same date that both Professor Sir Roy Anderson and Sir Robert Wilson stepped down from the Audit & Risk Committee. Sir Robert Wilson was appointed as a member of the Corporate Responsibility Committee with effect from 1 May 2013, and Hans Wijers was appointed as a member of the Remuneration and Corporate Responsibility Committees with effect from 10 October 2013. Lynn Elsenhans was appointed as a member of the Audit & Risk Committee with effect from 1 January 2014.

94 GSK Annual Report 2013
Governance & remuneration Corporate governance
Board diversityThe Committee is responsible for developing measurable objectives to support the implementation of the Board’s diversity policy, including gender, and for monitoring progress towards the achievement of these objectives. In May 2011, we announced our aspiration to increase the female representation on the Board to at least 25% by 2013. We were able to report in the 2011 Annual Report that encouraging progress had been made towards this target, with 20% of the Board’s Directors being women at that stage. As part of the continued refreshment of the Board, both Lynn Elsenhans and Jing Ulrich were appointed as new Non-Executive Directors in July 2012, taking the cadre of women on the Board to 33%. We were pleased to have delivered early and exceeded the target we had set ourselves and have maintained this level of female representation at Board level throughout 2013.
We also have a good representation of women in management positions which is illustrated on page 55 as part of the gender diversity of GSK’s global workforce. We will continue to support efforts to further increase the pipeline of women into senior positions within GSK. We also support the engagement of executive search firms, such as MWM and Egon Zhender, who have signed up to the Voluntary Code of Conduct on gender diversity and best practice.
Committee evaluationThe annual evaluation of the Committee’s effectiveness was undertaken by the Committee Chairman. The responses were shared with the Committee and it was concluded that the Committee continued to operate effectively. It was agreed that the process the Committee used to identify new appointees was much improved.
Corporate Responsibility Committee Report
Sir Christopher GentCorporate Responsibility Committee Chairman
MembershipThe membership of the Corporate Responsibility Committee (the Committee), together with appointment dates and attendance at meetings, is set out below:
Members
Committee member since
Attendance at full meetings during 2013
Sir Christopher Gent(Chairman from1 January 2005) 9 December 2004 5/5Dr Stephanie Burns 6 December 2007 5/5Lynn Elsenhans 1 October 2012 5/5Dr Daniel Podolsky 1 July 2006 5/5Hans Wijers 10 October 2013 0/1Sir Robert Wilson 1 May 2013 3/3
Hans Wijers was unable to attend one Committee meeting due to prior business commitments.
Other attendees at Committee meetings include:
AttendeeRegular
attendeeAttends
as required
Chief Executive Officer ✓
Chairman, Global R&D & Vaccines ✓
General Counsel ✓
Head of Governance, Ethics & Assurance ✓
Head of Global Communications ✓
Head of Global Corporate Responsibility ✓
Company Secretary ✓
Other Executives ✓
Independent External Corporate Responsibility Adviser ✓
Independent external corporate responsibility adviserTo augment GSK’s engagement with stakeholder opinion, in May 2013, Sophia Tickell was appointed as an independent external adviser to the Committee, a position that she had held previously from March 2009 to July 2011. Ms Tickell has extensive experience in the pharmaceuticals industry in improving health systems productivity, sustainability in energy supply and distribution, climate change policy and short-termism in financial markets.

GSK Annual Report 2013 95
She is the co-founder and Director of Meteos, from where she directs the Pharma Futures Series, which aims to align better societal and shareholder value. She holds a number of other board and advisory roles.
Ms Tickell attended meetings of the Committee and provided independent advice and guidance on corporate and social responsibility matters to both the Chairman and the CEO.
Main responsibilities The main responsibilities of the Corporate Responsibility Committee are set out on page 86.
The Committee has a rolling agenda and receives reports from members of the CET and senior managers to ensure that progress in meeting GSK’s Corporate Responsibility commitments, which were set in 2012, within four areas of focus, is reviewed on an annual basis, as follows:
• Health for all: innovating to address currently unmet health needs; improving access to our products, irrespective of where people live or their ability to pay; and controlling or eliminating diseases affecting the world’s most vulnerable people
• Our behaviour: putting the interests of patients and consumers first, driven by our values in everything we do and backed by robust policies and strong compliance processes
• Our people: enabling our people to thrive and develop as individuals to deliver our mission
• Our planet: growing our business while reducing our environmental impact across the value chain.
The Committee also reviews and approves the Corporate Responsibility Report which is available for reference on www.gsk.com/responsibility.
Work of the Committee during 2013During 2013, the Committee focused its attention on several issues including:
CR Focus area Specific topics considered in 2013
Health for all R&D investment including diseases of the developing world, eg malaria and open innovation strategy
New partnership to address access and child mortality eg Save the Children partnership
Our behaviour The US Patient First incentive compensation program and selling competency model
Further embedding values-based decision making in the organisation
Human rights impact assessment
Conduct and public disclosure of clinical research, transparency of detailed data behind trial results
Replacement, refinement and reduction in use of animals in research and development
Responsibility in our supply chain – standards, working practices and diversity
Approach to public policy and interactions with patient advocacy groups
Our people Organisational change and employee relations
Inclusion and diversity
Leadership, development and approach to performance management
Employee health, safety and wellbeing
Volunteering
Our planet Environmental performance in our supply chain
Committee evaluationThe Committee’s annual evaluation was carried out by the Committee Chairman and concluded that the Committee continued to operate effectively with full participation from all members and executive management attendees.
Directors’ ReportFor the purposes of the UK Companies Act 2006, the Directors’ Report of GlaxoSmithKline plc for the year ended 31 December 2013 comprises pages 75 to 95 of the Corporate Governance Report, the Directors’ Responsibility Statements on pages 128 and 211, and pages 232 to 248 of Investor Information. As it is entitled to do by the Companies Act 2006, the Board has chosen to set out in the Strategic Report those matters required to be disclosed in the Directors’ Report which it considers to be of strategic importance to the Company, as follows:
• risk management objectives and policies (pages 18,19, 73, and 74)
• likely future developments of the company (throughout the Strategic Report)
• research and development activities (pages 32 to 43)
• inclusion and diversity, (page 55)
• provision of information to, and consultation with employees (pages 54 to 56)
• carbon emissions (page 57)
The Directors’ Report has been drawn up and presented in accordance with and in reliance upon English company law and the liabilities of the Directors in connection with that report shall be subject to the limitations and restrictions provided by such law. The Directors’ Report was approved by a duly authorised Committee of the Board of Directors on 26 February 2014 and signed on its behalf by:
Sir Christopher Gent Chairman 26 February 2014

96 GSK Annual Report 2013
Governance & remuneration Directors’ Remuneration Report
Dear Shareholder As the Chairman of GSK’s Remuneration Committee (the Committee), I am pleased to present our Directors’ Remuneration Report for 2013, for which we will be seeking your approval at our AGM on 7 May 2014. In line with the new remuneration reporting regime, the Directors’ Remuneration Report is split into two separate reports. The Annual Report on Remuneration will be subject to an advisory shareholder vote at the 2014 AGM while the Remuneration Policy Report will be subject to a binding vote.
Key decisions and changes in 2013The executive remuneration environment continued to evolve at pace during 2013. The new reporting regulations offered fresh opportunity to discuss our remuneration practices and policies with shareholders.
We are proud of our track record in listening to the views of our shareholders and we have made a number of decisions during the year relating to executive remuneration, to ensure incentive arrangements remain appropriate for GSK and are in the long-term interests of shareholders. The key changes are highlighted below:
• During 2013, we reviewed the design of long-term incentives with the main objectives being simplification and responding to concerns previously raised by some investors. As a result of this review and investor consultation during the year, we are changing the way in which our long-term incentives operate:
Directors’ Remuneration ReportChairman’s Annual Statement
– We are removing the business diversification measure from the Performance Share Plan (PSP) and from the Deferred Annual Bonus Plan (DABP) matching awards to be made from 2014 onwards. Business diversification remains important, but the business mix is now appropriate and growth can still be delivered without the additional focus of this specific measure. The remaining performance measures will continue to have equal weighting. This change has the effect of increasing the proportion of the award based on TSR, adjusted free cash flow and R&D new product performance from 25% to 33%.
– We are extending the time horizons by introducing an additional two-year holding period for PSP awards for Executive Directors to be made from 2015 onwards.
• The Committee decided that it would be appropriate to award our Executive Directors salary increases of 2.5% for 2014, consistent with the average salary budget for other UK and US employees across our business.
• Furthermore, the Committee decided that it would be appropriate for there to be no increase in the annual and long-term incentive opportunities for our Executive Directors.
Performance and pay in 2013The Group generated its best TSR performance since its formation and £5.2 billion of cash was returned to shareholders. In determining remuneration awards for 2013 it was the Committee’s view that the executive team demonstrated strong delivery and successful implementation of the Group’s strategic priorities. In particular, it was an exceptional year for R&D productivity.
GSK delivered sales and earnings growth in line with its guidance and led the industry in new product approvals. These new products will strengthen businesses in Respiratory, Vaccines, HIV and Oncology. Importantly, the Committee notes that substantial future opportunities remain for the Group, with a total of 40 new molecular entities currently in Phase II/III development.
Further action was also taken to streamline and increase the focus of the Group. Non-core products and other assets were divested for proceeds of £2.5 billion and ongoing, organic structural initiatives delivered incremental year-on-year savings of around £400 million.
The Committee reviewed the efforts made by Sir Andrew and his team in 2013 to improve global public health, increase transparency of clinical data and modernise GSK’s commercial practices and interactions with customers. The ongoing investigation by authorities in China was also considered by the Committee. Both Sir Andrew and the Board are mindful of the impact this issue has had on the reputation of the company. As a result, the bonuses awarded for 2013 were lower than they otherwise might have been.
The executives continue to align their personal interests with those of shareholders. Sir Andrew has elected again this year to defer the maximum permitted under the company’s DABP and, as at 31 December 2013, he held more than twice the value of GSK shares required by the company’s share ownership requirements.
2013 remuneration for executives and related performance under the annual bonus and long-term incentives (PSP awards and DABP matching awards) is described in our Annual Report on Remuneration on pages 99 to 101.
Agenda for 2014The Committee held shareholder meetings in November 2013, at which we shared updates on remuneration matters in the last 12 months and proposals for 2014 onwards.
During 2014, the Committee will continue to keep executive remuneration arrangements under review. We will also continue our regular dialogue with shareholders and will hold our annual meetings with GSK’s largest investors later in 2014 to listen to their views and feedback.
The Committee and the company take a keen interest in external views on remuneration matters. In particular, we have consulted widely on our remuneration policy with shareholders for their feedback and input. We responded to issues raised and were pleased to receive support from the investors we consulted.
I commend both our reports (Annual Report on Remuneration and Remuneration Policy Report) to shareholders for approval at our AGM.
Tom de Swaan Remuneration Committee Chairman 26 February 2014

GSK Annual Report 2013 97
Total remuneration for 2013 (audited)
The total remuneration for 2013 for each Executive Director is set out in the table below:
Sir Andrew Witty,
CEO
Simon Dingemans,
CFO
Dr Moncef Slaoui, Chairman,
Global R&D & Vaccines 2013
£000% of total
2012 £000
% of total
2013 £000
% of total
2012 £000
% of total
2013 $000
% of total
2012 $000
% of total
Salary 1,059 1,033 699 682 1,180 1,153Benefits(1) 67 84 65 73 747 447Total fixed pay 1,126 16% 1,117 25% 764 23% 755 61% 1,927 23% 1,600 24%
Pay for performanceAnnual bonus – including the amount deferred
1,875
905
886
343
1,973
1,404
Value earned from LTI awards: (2)
Matching awards under Deferred
Annual Bonus Plan (3)
249
125
n/a
n/a
485
n/a
Performance Share Plan 3,250 1,780 1,502 n/a 3,763 1,690Total value earned from LTI awards 3,499 1,905 1,502 n/a 4,248 1,690Total pay for performance 5,374 74% 2,810 64% 2,388 73% 343 28% 6,221 74% 3,094 47%
Pension (4) 707 10% 459 11% 140 4% 136 11% 266 3% 1,931 29%
Total remuneration (5) 7,207 4,386 3,292 1,234 8,414 6,625
Notes:(1) Certain expenses incurred in the normal course of business are considered to be taxable benefits and as such the table above now includes these figures
for 2012 (restated) and 2013. Further details are provided on page 98.(2) An analysis of the value of LTIs earned by Sir Andrew Witty, Simon Dingemans and Dr Moncef Slaoui is set out on pages 112 to 114.(3 The performance period for Simon Dingemans’ first award under the DABP ends on 31 December 2014. The earliest period for which remuneration will
be recorded under the DABP for Simon Dingemans will therefore be the year ending 31 December 2014.(4) Full details of the pensions accrued to date for the Executive Directors in receipt of a pension from GSK are given on page 105. (5) Following due consideration by the Committee, there has been no reduction of outstanding awards or vesting levels (malus) applied during 2013 in respect
of any of the Executive Directors.
The following sections provide details of each element of ‘Total remuneration’ including how we intend to implement the policy for 2014.
* The Committee may, in specific circumstances and in line with stated principles, apply clawback/malus as it determines appropriate.
Salary Benefits Annual bonus
Value earned from long-term
incentive awards
Pension Total remuneration*+ + + + = =
Annual report on remuneration

98 GSK Annual Report 2013
Governance & remuneration Directors’ Remuneration Report
Comparator groups for pay and performanceThe Committee uses two primary pay comparator groups when considering executive pay:
UK cross-industry comparator group†
Global pharmaceutical comparator group
Anglo American France SanofiAstraZeneca Switzerland NovartisBG Group Roche HoldingsBHP Billiton UK AstraZenecaBP USA AbbVie*British American Tobacco Amgen*Diageo Bristol-Myers SquibbReckitt Benckiser Eli LillyRio Tinto Johnson & JohnsonRoyal Dutch Shell Merck & CoSAB Miller PfizerTescoUnileverVodafone* Amgen and AbbVie are included for remuneration benchmarking, but
are not included in the TSR comparator group.† From 2013 onwards financial services companies have been removed as new regulatory regimes on remuneration applied in that sector make their pay structures less comparable. SAB Miller has been added to the group.
The global pharmaceutical comparator group is also used as the basis for the TSR comparator group which features in our long-term incentive awards.
The primary pay comparator group for each of the Executive Directors is shown in the table below:
Primary pay comparator group
DirectorUK
cross-industryGlobal
pharmaceutical
Sir Andrew Witty ✓
Simon Dingemans ✓
Dr Moncef Slaoui ✓
When reviewing the CEO’s remuneration, the Committee also references pay for a group of leading European companies whose selection is based on their size and complexity.
Summary of total package competitive positioning for the CEO
SalaryFor 2014, the average salary increase budget for employees other than Executive Directors will be approximately 2.5% in both the UK and USA.
The Committee decided to give the Executive Directors salary increases in line with those increases. Sir Andrew Witty, Simon Dingemans and Dr Moncef Slaoui each received a base salary increase of 2.5%.
The table below sets out the base salaries of the Executive Directors over the last two years and for 2014.
% change
Base salary
2014 2013 2012
Sir Andrew Witty 2.5% £1,087,300 £1,060,800 £1,040,000Simon Dingemans 2.5% £717,700 £700,150 £686,400Dr Moncef Slaoui 2.5% $1,211,800 $1,182,200 $1,159,000
Benefits (audited)The following table shows a breakdown of the grossed up cash value of the benefits received by the Executive Directors in 2013 and 2012.
Sir Andrew Witty
Simon Dingemans
Dr Moncef Slaoui
2013 benefits £ £ $
Employee benefits(1) 17,338 21,692 156,529 Travel(2) 35,960 29,939 82,163 International assignment(3) – – 501,229 Other benefits(4) 13,483 13,483 6,652 Total 2013 benefits 66,781 65,114 746,573
2012 benefits (restated) £ £ $
Employee benefits(1) 20,198 24,636 177,443 Travel(2) 51,835 34,571 121,739 International assignment(3) – – 140,690 Other benefits(4) 12,021 13,904 6,930 Total 2012 benefits 84,054 73,111 446,802
(1) Employee benefits include healthcare, car allowance, personal financial advice and life assurance/death in service.
(2) Travel expenses include car travel, family, spouse and partner costs associated with accompanying the director on GSK business, which are deemed to be taxable benefits on the individual.
(3) Dr Moncef Slaoui was seconded to the UK in November 2010 in order to enable him to be closer to the Vaccines business as he assumed operational responsibility for that part of the Group. The secondment ended on 31 December 2013. In line with other senior GSK expatriates, he received appropriate assignment expenses, including accommodation, location allowance, relocation specific financial advice and tax equalisation.
(4) Other benefits comprise expenses incurred in the ordinary course of business, which are deemed to be taxable benefits on the individual and as such have been included in the table above for 2012 (restated) and 2013.
No significant changes to the provision of benefits are proposed for 2014. For further details please refer to page 117 of the Policy Report.
Total remuneration benchmarking (£m)
12
10
8
6
4
Lower quartile to median Median to upper quartile Current position
UK cross-industry group
Global pharmaceutical group
European cross-industry group
Benchmarking includes salary and the expected value of incentives based on the Committee’s agreed benchmarking methodology.

GSK Annual Report 2013 99
Financial performance Personal performance
Sir Andrew Witty75% on core Group operating profit 25% on core Group profit
before interest and tax Individual objectivesSimon Dingemans
Dr Moncef Slaoui 50% on R&D and 25% on Vaccines performance
For further details see page 118 of the Policy Report.
Financial performance
Core Group operating profit and core Group profit before interest and taxThe company’s performance in 2013, both in terms of core Group operating profit and core Group profit before interest and tax, represented further strong delivery for the Group despite some unexpected challenges and reflected the improving balance of our sales base. This reflects improvements in our US and European businesses, as well as effective cost control and financial efficiencies.
R&D and Vaccines performance Targets for the year around pipeline growth and value were exceeded. This reflects the most productive period of R&D output in the company’s history. Six major new products were approved (Breo Ellipta, Anoro Ellipta, Tafinlar, Mekinist and Tivicay as well as a new injectable quadrivalent flu vaccine launched in the US) with five additional regulatory filings completed. The company’s pipeline remains extensive with 40 new molecular entities (NMEs) in Phase II/III clinical development. GSK remains on track to deliver its target long-term rate of return on R&D spend of 14%. Targets for the year around Vaccines performance were also exceeded reflecting strong sales, in particular, of Infanrix/Pediarix, Fluarix/FluLaval and Boostrix.
The table below sets out the matters the Committee considered in respect of the individual objectives set for each Executive Director.
Personal performance
Sir Andrew Witty Sir Andrew continued to demonstrate strong leadership of GSK in what remains a challenging operating environment for healthcare. For 2013, Sir Andrew’s remuneration reflects strong delivery of the Group’s strategy across all areas of the business and the subsequent realisation of returns for shareholders.
GSK delivered sales and earnings growth in 2013, with core EPS of 112.2p up 4% on 2012 (at CER) and in line with market guidance. Sales growth was generated from multiple businesses and geographies reflecting successful implementation of the Group’s strategy to source growth more broadly.
2013 was a year of exceptional R&D productivity. GSK led the industry in new product delivery with six major products approved and five additional regulatory filings completed. This productivity was set against a backdrop of continued improvement in the estimated rate of return for R&D, now at 13%. The new product launches will strengthen businesses in Respiratory, Vaccines, HIV and Oncology. The Group’s pipeline opportunity also remains substantial with a total of 40 NMEs currently in Phase II/III development and with Phase III starts planned for ten potential new products in 2014/2015.
Under Sir Andrew’s leadership, the Group generated its best TSR performance, in 2013, since the formation of GSK. £5.2 billion of cash was returned to shareholders with a full-year dividend of 78 pence up 5% on 2012 and share repurchases of £1.5 billion.
Sir Andrew continued to strengthen and focus GSK’s core business areas. In 2013, the Group divested non-core products and other assets for proceeds of £2.5 billion. GSK also increased its shareholding in its Indian Consumer subsidiary. Ongoing organic structural initiatives delivered incremental year-on-year savings of around £400 million and new efficiencies resulting from the Group’s strategic priority to simplify its business are increasingly evident in manufacturing, supply chain and core business services.
Sir Andrew continued to adopt industry-leading positions on multiple corporate responsibility issues in 2013. During the year, GSK was widely acknowledged to have taken further innovative steps to improve global public health in developing countries, to increase access and transparency of its clinical data and to modernise its commercial practices and interactions with customers. At Sir Andrew’s request, the impact of the ongoing investigation by Chinese authorities into the Group’s subsidiary business in China was also considered by the Board in their evaluation of his performance for 2013.
Pay for performance (audited)Annual bonusThe majority of the annual bonus opportunity is based on a formal review of performance against stretching financial targets. This outcome is then adjusted to reflect individual performance by applying an individual performance multiplier.
For the financial measures, the bonus threshold is 90% of target, with the maximum being payable for achievement of 110% of target. The bonus threshold of 90% reflects the stretching nature of the bonus targets.
2013 performance against targetsFor 2013, the annual bonus was based on the following performance measures. As the actual targets are linked to the company’s financial and strategic plan, the Committee believes that the targets remain commercially sensitive. The 2013 targets are therefore not disclosed.

100 GSK Annual Report 2013
Governance & remuneration Directors’ Remuneration Report
2014
Matchingaward
% of total bonus deferred into
shares or ADS2013 2012
Sir Andrew Witty 57,060 shares 50% 50%Simon Dingemans 18,876 shares 35% 50%Dr Moncef Slaoui 18,214 ADS 50% 50%
Vesting of matching awards with a performance period ending 31 December 2013 is shown on pages 112 and 113.
Performance conditions for matching awards made in 2014 under the Deferred Annual Bonus Plan (DABP) are the same as for the Performance Share Plan and are described on page 103.
2014 Award
2014 Award level
as % of base salary
2013 Award level
as % of base salary
Sir Andrew Witty* 397,066 shares 600% 600%Simon Dingemans 174,729 shares 400% 400%Dr Moncef Slaoui 111,851 ADS 500% 500%
* 25% of Sir Andrew Witty’s 2013 and 2014 PSP awards are subject to a further two-year vesting period (five years in total).
PSP and DABP matching awards are both subject to performance and continued employment.
The following table shows actual bonuses earned compared to opportunity for 2013 and 2012.
Opportunity (% of salary)
Level achieved (% of salary) Bonus paid
On target
Maximum
2013
20122013
£/$0002012
£/$000
Sir Andrew Witty 125% 200% 177% 87% £1,875 £905
Simon Dingemans 80% 180% 127% 50% £886 £343
Dr Moncef Slaoui 85% 200% 167% 121% $1,973 $1,404
2014 operation of annual bonus planNo changes are proposed to the operation of the annual bonus plan for 2014. Inevitably, targets linked directly to the financial and strategic plan are commercially sensitive and the Committee does not consider it appropriate to disclose annual bonus targets during the year. However, details of performance achieved will be disclosed in the 2014 Annual Report.
Deferred Annual Bonus Plan and matching awardsThe levels of participation in 2012 and 2013 for the Executive Directors are shown in the table below, together with the maximum matching awards granted in 2014 in respect of the deferrals of the 2013 bonuses.
Performance Share PlanThe table below shows Performance Share Plan (PSP) award levels for 2013 and 2014 for each Executive Director:
Long-term incentive plans (audited)
2013 performance against targets continued
Personal performance
Simon Dingemans GSK delivered sales and earnings growth in 2013, with core EPS of 112.2p up 4% on 2012 (at CER) and in line with market guidance. Simon Dingemans continued to drive operating and financial efficiencies, with year-on-year cost savings of around £400 million contributing to overall 2013 performance and increased core earnings per share on a constant currency basis.
Simon drove the delivery of £4.8 billion in adjusted free cash flow in 2013 which, along with £2.5 billion realised from divestments, gives the company the flexibility it needs to protect its credit profile, fund organic investment and restructuring programmes and to meet its commitment to a growing dividend, further share buy-backs and bolt-on acquisitions. He also continued to achieve a reduction in our effective core tax rate to 23% (2012: 24.4%).
Dr Moncef Slaoui Dr Moncef Slaoui delivered a year of exceptional performance for R&D in terms of approvals, filings and pipeline as detailed above. Under his leadership, the Vaccines business also delivered solid sales growth despite the adverse impact on Cervarix sales resulting from the suspension of the recommendations for the use of HPV vaccines in Japan. He has successfully established the new integrated way of working between R&D and other parts of the business to create a strong, new product launch capability.

GSK Annual Report 2013 101
2010 awards with a performance period ending 31 December 2013 (audited)The awards granted to Executive Directors in 2010 were based in part on performance over three years (70%) and in part on performance over four years (30%). The portion of awards measured over the four years to 31 December 2013 lapsed in full, as GSK’s TSR rank position was 9th in a comparator group of ten pharmaceutical companies (GSK and nine other companies).
Performancemeasures and relative weighting
Vesting
Performance targets and performance achieved
% of maximum
% of award
Business diversificationperformance (25%)
The business diversification measure was based on an aggregate three-year revenue target for Vaccines, Consumer Healthcare, Dermatology and Emerging Markets, Asia Pacific and Japan. The vesting schedule is shown below. Aggregate sales for the period were £44.05 billion.
Target % vesting*
Maximum £48.59 billion 100%£47.17 billion 75%£44.81 billion 50%
Threshold £42.46 billion 25%
42% 10.5%
R&D new product performance (25%)
The R&D new product performance measure was based on an aggregate three-year revenue target for New Product sales. New Products are defined as products launched in the performance period and the two preceding years. Therefore products launched in the years 2009 to 2013 were included. The vesting schedule is shown below. Aggregate sales for the period were £4.18 billion.
Target % vesting*
Maximum £4.69 billion 100%£4.26 billion 75%£4.05 billion 50%
Threshold £3.84 billion 25%
65% 16.3%
Adjusted free cash flow performance (25%)
Adjusted free cash flow (AFCF) for the three years was £16.80 billion which, in line with the Committee’s agreed principles, included adjustments for a number of material distorting items, including legal settlements, exchange rate movements and special pension contributions.
The AFCF vesting schedule was disclosed at the time of grant. 25% (threshold) of the award vests for achieving AFCF of £16.15 billion, 50% for achieving £16.65 billion, 75% for achieving £18.32 billion and 100% (maximum) for achieving £19.15 billion, with straight-line vesting between these points.
52% 13.0%
Relative TSR performance (25%)
GSK’s TSR rank position was 7th in the comparator group of ten pharmaceutical companies (GSK and nine other companies). The vesting schedule and comparator group is as set out for the 2014 awards on page 103.
0% 0%
Total vesting in respect of 2013 39.8%
* Straight-line vesting applies between these points.
2011 awards with a performance period ending 31 December 2013 (audited)The Committee reviewed the performance of the PSP and DABP matching awards granted to Executive Directors in 2011. The performance achieved in the full three years to 31 December 2013 and the actual vesting levels are set out in the table below. The Committee previously provided estimates of vesting for 2011 awards in GSK’s 2011 and 2012 Annual Reports. Those estimates were based on performance achieved at that time and the following reflects performance achieved over the course of the whole performance period. No discretion was exercised in determining these vesting levels.
Due to commercial sensitivities, the targets for R&D new products and business diversification were not disclosed at the time of grant and the Committee committed to disclosing them at the time of vesting. These targets are shown in the table below.

102 GSK Annual Report 2013
Governance & remuneration Directors’ Remuneration Report
Update on performance of ongoing awardsThe Committee reviewed the performance of the PSP and DABP matching awards granted to Executive Directors in 2012 and 2013. The following tables provide an estimate of vesting taking into account performance to date. Actual vesting levels will only be determined based on performance over the full three-year performance periods. The indications below should therefore not be regarded as predictions of the final vesting levels.
2012 awards with a performance period ending 31 December 2014
Performance measures and relative weighting
Performance update
Business diversificationperformance(25%)
Business diversification performance for the 2012 awards measures aggregate three-year sales across Vaccines, Dermatology, Consumer Healthcare and Emerging Markets, Asia Pacific and Japan. Threshold performance results in 25% vesting and maximum performance (114% of threshold) results in 100% vesting.
Based on aggregate sales for 2012 and 2013, and based on performance measure definitions, vesting is currently estimated to be between 25% and 50% of the maximum for this element.
R&D new product performance (25%)
R&D new product sales performance measures aggregate three-year sales for new products launched in the three-year performance period and preceding two years, i.e. 2010-2014. Threshold performance results in 25% vesting and maximum performance (122% of threshold) results in 100% vesting.
Based on aggregate sales of new products for 2012 and 2013, and based on performance measure definitions, vesting is currently estimated to be around threshold.
Adjusted free cash flow performance (25%)
The adjusted free cash flow (AFCF) vesting schedule for the 2012 awards was disclosed at the time of grant.
25% (threshold) of the award vests for achieving AFCF of £17.30 billion, 50% for achieving £17.84 billion, 75% for achieving £19.62 billion and 100% (maximum) for achieving £20.52 billion, with straight-line vesting between these points.
Based on adjusted free cash flow for 2012 and 2013, and based on performance measure definitions, vesting is currently estimated to be below threshold.
Relative TSR performance (25%)
For the period 1 January 2012 to 31 December 2013, GSK’s TSR rank position was 9th in the comparator group of ten pharmaceutical companies (GSK and nine other companies). The vesting schedule and comparator group are as set out for the 2014 awards on page 103. If the ranking position remains at this level, vesting would be below threshold.
Current estimate of potential total vesting for 2012 awards Less than 25% vesting
2013 awards with a performance period ending 31 December 2015 (audited)
Performance measures and relative weighting
Performance update
Business diversificationperformance(25%)
Business diversification performance for the 2013 awards measures aggregate three-year sales across Vaccines, Consumer Healthcare and Emerging Markets, Asia Pacific and Japan. Threshold performance results in 25% vesting and maximum performance (114% of threshold) results in 100% vesting.
There were good sales for the year for these business areas. Based on aggregate sales for the year, and based on performance measure definitions, vesting is currently estimated to be between 50% and 75% of the maximum for this element.
R&D new product performance (25%)
R&D new product sales performance measures aggregate three-year sales for new products launched in the three-year performance period and preceding two years, i.e. 2011-2015. Threshold performance results in 25% vesting and maximum performance (122% of threshold) results in 100% vesting.
There were strong sales of new products in the year. GSK is also on track to deliver its target long-term rate of return on R&D spend of 14% (13% for 2013). Based on aggregate sales of new products for the year, and based on performance measure definitions, vesting is currently estimated to be between 75% and 100%.
Adjusted free cash flow performance (25%)
The adjusted free cash flow (AFCF) vesting schedule for the 2013 awards was disclosed at the time of grant.
25% (threshold) of the award vests for achieving AFCF of £14.06 billion, 50% for achieving £14.49 billion, 75% for achieving £15.94 billion and 100% (maximum) for achieving £16.66 billion, with straight-line vesting between these points.
Based on adjusted free cash flow for the year, and on performance measure definitions, vesting is currently estimated to be between 50% and 75%.
Relative TSR performance (25%)
For the period 1 January 2013 to 31 December 2013, GSK’s TSR rank position was 9th in the comparator group of ten pharmaceutical companies (GSK and nine other companies). The vesting schedule and comparator group are as set out for the 2014 awards on page 103. If the ranking position remains at this level, vesting would be below threshold.
Current estimate of potential total vesting for 2013 awards Between 50% and 75% vesting
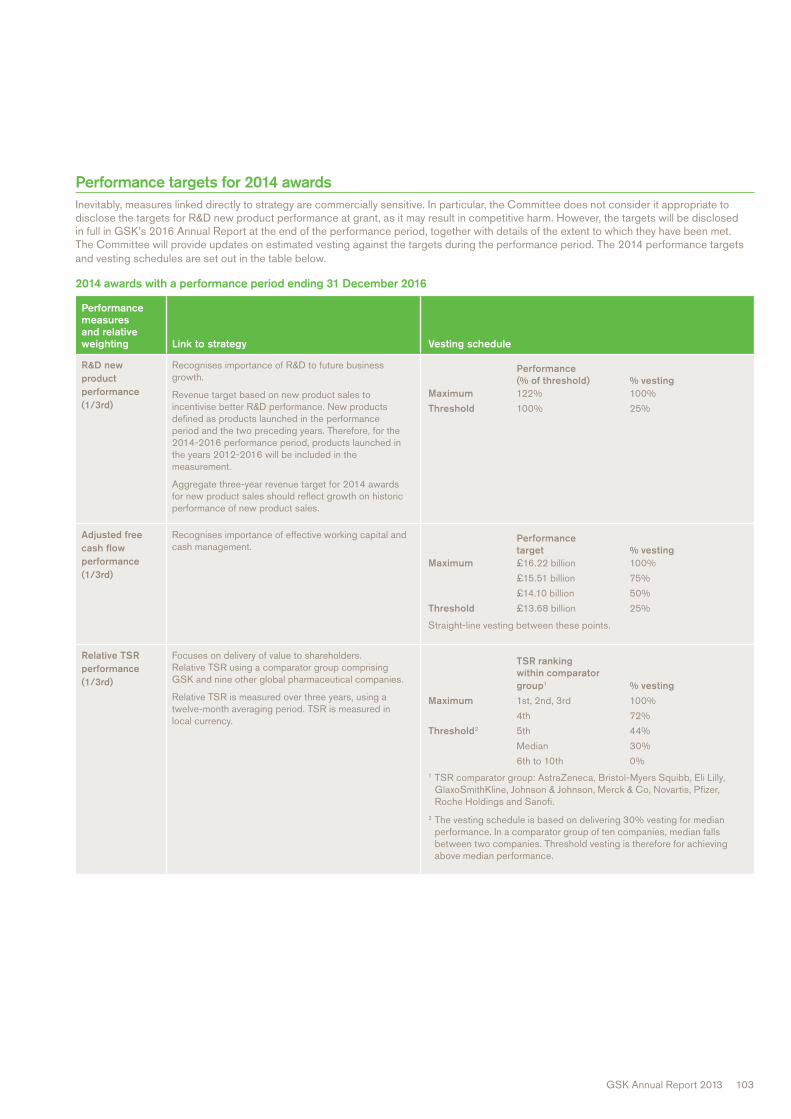
GSK Annual Report 2013 103
Performance targets for 2014 awardsInevitably, measures linked directly to strategy are commercially sensitive. In particular, the Committee does not consider it appropriate to disclose the targets for R&D new product performance at grant, as it may result in competitive harm. However, the targets will be disclosed in full in GSK’s 2016 Annual Report at the end of the performance period, together with details of the extent to which they have been met. The Committee will provide updates on estimated vesting against the targets during the performance period. The 2014 performance targets and vesting schedules are set out in the table below.
2014 awards with a performance period ending 31 December 2016
Performance measures and relative weighting Link to strategy
Vesting schedule
R&D new product performance(1/3rd)
Recognises importance of R&D to future business growth.
Revenue target based on new product sales to incentivise better R&D performance. New products defined as products launched in the performance period and the two preceding years. Therefore, for the 2014-2016 performance period, products launched in the years 2012-2016 will be included in the measurement.
Aggregate three-year revenue target for 2014 awards for new product sales should reflect growth on historic performance of new product sales.
Performance (% of threshold)
% vesting
Maximum 122% 100%Threshold 100% 25%
Adjusted free cash flow performance(1/3rd)
Recognises importance of effective working capital and cash management.
Performance target
% vesting
Maximum £16.22 billion 100%£15.51 billion 75%£14.10 billion 50%
Threshold £13.68 billion 25%
Straight-line vesting between these points.
Relative TSR performance(1/3rd)
Focuses on delivery of value to shareholders. Relative TSR using a comparator group comprising GSK and nine other global pharmaceutical companies.
Relative TSR is measured over three years, using a twelve-month averaging period. TSR is measured in local currency.
TSR ranking within comparator group1 % vesting
Maximum 1st, 2nd, 3rd 100%4th 72%
Threshold2 5th 44%Median 30%6th to 10th 0%
1 TSR comparator group: AstraZeneca, Bristol-Myers Squibb, Eli Lilly, GlaxoSmithKline, Johnson & Johnson, Merck & Co, Novartis, Pfizer, Roche Holdings and Sanofi.
2 The vesting schedule is based on delivering 30% vesting for median performance. In a comparator group of ten companies, median falls between two companies. Threshold vesting is therefore for achieving above median performance.

104 GSK Annual Report 2013
Governance & remuneration Directors’ Remuneration Report
Deferred Annual Bonus Plan Performance Share Plan Share Option Plan
Year of grant
Performance period
Total vesting
%
Vesting
under TSR
%
Vesting under
adjusted free cash flow
%
Vesting under
R&D new product
%
Vesting under
business diversification
%
Total vesting
%
Vesting
under EPS
%
2004 2005–2007 n/a 38.5 n/a n/a n/a 38.5 1002006 2006–2008 n/a 0 n/a n/a n/a 0 50.72007 2007–2009 n/a 35 n/a n/a n/a 35 02008 2008–2010 n/a 35 n/a n/a n/a 35 02009 2009–2011/12 n/a 9 40 n/a n/a 49 02010 2010–2012/13 30 9 16 n/a n/a 25 n/a2011 2011–2013 40 0 13 16 11 40 n/a
For the Deferred Annual Bonus Plan, the 2010 awards were subject wholly to TSR performance and 2011 awards were subject to the same performance measures as PSP awards.
Historical vesting for GSK’s LTIsThe following table shows historical vesting levels under the company’s long-term incentive plans (Deferred Annual Bonus Plan matching awards, Performance Share Plan and Share Option Plan) in respect of awards made to executives since 2004.
Other all-employee share plansThe Executive Directors participate in various all-employee share plans, including ShareSave and ShareReward.
The ShareSave Plan is a UK HM Revenue & Customs approved plan open to all UK employees. Participants may save up to £250 a month from their net salaries for a fixed term of three years and at the end of the savings period they have the option to buy GSK shares at a discount of up to 20% of the market price set at the launch of each savings contract. Sir Andrew Witty and Simon Dingemans make monthly contributions into the ShareSave Plan.
The ShareReward Plan is a UK HM Revenue & Customs approved plan open to all UK employees on the same terms. Participants contribute up to £125 a month from their gross salaries to purchase GSK shares and the company matches the number of GSK shares bought each month under this arrangement. Sir Andrew Witty and Simon Dingemans each contribute £125 a month to buy shares under the ShareReward Plan.
Dilution limitsAll awards are made under plans which incorporate dilution limits consistent with the guidelines provided by the Association of British Insurers. These limits are 10% in any rolling ten year period for all plans and 5% in any rolling ten year period for executive share plans. Estimated dilution from existing awards made over the last ten years up to 31 December 2013 is as follows:
Payments to past directors during 2013 (audited)Julian Heslop retired on 31 March 2011. The outstanding balance of his 2010 PSP award with a performance period ending 31 December 2013 lapsed in full as the performance criteria were not met.
Payments for loss of office during 2013 (audited)There have been no payments for loss of office to Executive Directors during 2013.
Share ownership requirementsTo align the interests of executives with those of shareholders, executives are required to build up and maintain significant holdings of shares in GSK over time.
Executives are required to continue to satisfy these shareholding requirements for a minimum of 12 months following retirement from the company.
Current share ownership requirements (SOR) are set out in the table below:
Share ownership requirements
CEO 4x base salaryOther Executive Directors 3x base salaryOther CET members 2x base salary
Shareholdings for the purpose of SOR as at 21 February 2014 and achievement of SOR, based upon an average share price for the 90 working days preceding that date, were as set out in the following table (audited):
Holdings for SOR purposes as at
21 February 2014
31 December 2012
Increase in shareholding
%
Achievement of SOR
%
Sir Andrew Witty 734,002 449,987 63% 272%Simon Dingemans 152,460 70,362 117% 114%Dr Moncef Slaoui 498,823 296,584 68% 361%
Any outstanding share awards still subject to performance criteria or continued employment are not included in the shareholdings for the purpose of SOR.
All GSK employee share plans
Actual Limit
Executive share plans
Actual Limit
10
8
6
4
2
0
10%
3.31%
5%
3.59%

GSK Annual Report 2013 105
Pension (audited)The arrangements for the current Executive Directors are set out in the table below.
Pension arrangements
Sir Andrew Witty Sir Andrew Witty is a member of the Glaxo Wellcome defined benefit pension plan with an accrual rate of 1/30th of final pensionable salary. This plan has been closed to new entrants since 2001. The section of the plan that Sir Andrew is a member of provides for a normal retirement age of 60 and a maximum pension value of 2/3rds of pensionable salary. From 1 April 2013, pensionable earnings increases are limited to 2% per annum for all members, including Sir Andrew.
Simon Dingemans Simon Dingemans is not a member of any GSK pension plan for pension contributions and instead receives a cash payment in lieu of pension of 20% of base salary in line with GSK’s defined contribution pension plan rates.
Simon Dingemans receives death in service and ill-health insurance that is provided as part of the pension plan. This has been included in employee benefits on page 98.
Dr Moncef Slaoui Dr Moncef Slaoui is a member of the US Cash Balance Pension Plan and the Supplemental Cash Balance Pension Plan which provides for an Executive Pension Credit. GSK makes annual contributions to Dr Moncef Slaoui’s pension plans of 38% of his base salary. The plans provide a cash sum at retirement and the fund increases at an interest rate set annually in advance, based on the 30 year US Treasury bond rate. The plan has no entitlement to a spouse’s pension or to pension increases.
Dr Moncef Slaoui was an active member of the Belgium Fortis Plan until 31 May 2006 and has been a deferred member since. This plan is a defined benefit plan with a lump sum payable at a normal retirement age of 60. There are no further company contributions to this plan.
Dr Moncef Slaoui is also a member of the GSK 401(k) savings scheme open to all US employees and the Executive Supplemental Savings Plan (ESSP), a savings scheme open to executives to accrue benefits above US government limits imposed on the GSK 401(k) plan. Contributions to both plans are invested in a range of funds. The combined contribution rate under the plans is up to 6% (2% core contributions plus a match of up to 4%) of total base salary and bonus, less any bonus deferred under the Deferred Annual Bonus Plan.
The following table shows the breakdown of the pension values set out on page 97.
Pension remuneration values
Sir Andrew Witty Simon Dingemans Dr Moncef Slaoui
2013 £000
2012 £000
2013 £000
2012 £000
2013 000
2012 000
UK defined benefit 739 490 – – – –US defined benefit – – – – – $1,658Belgian defined benefit – – – – €101 €114Employer cash contributions – – 140 136 $127 $122Member contributions (32) (31) – – – –Total pension remuneration value 707 459 140 136 $266 $1,931
a) The pension remuneration figures have been calculated in accordance with the methodology set out in the Remuneration Regulations. In calculating the defined benefit pension values for 2013, the difference between the accrued pension as at 31.12.2013 and the accrued pension as at 31.12.2012 increased by inflation (2.2% for UK defined benefit, 1.2% for Belgium defined benefit), has been multiplied by 20. Where this results in a negative value, this has been deemed to be zero. In calculating total values, amounts have been translated from Euros into US dollars using an exchange rate of 1.38 for 2013 and 1.32 for 2012.
b) For Sir Andrew, further details regarding the 2013 pension values are set out in the table below.
Sir Andrew Witty Accrued pension as at 31.12.2013 (£ p.a.)
Accrued pension as at 31.12.2012 (£ p.a.)
Pension remuneration value for 2013 (£000)
UK – Funded 69,251 67,496 5UK – Unfunded 562,855 514,841 734Total 632,106 582,337 739
Sir Andrew joined GSK predecessor companies in 1991 and progressed through roles of increasing seniority within GSK until he was appointed CEO in May 2008. During this time, he has built up pensionable service through the different tiers of the Glaxo Wellcome Pension Plan. His current pension entitlement is a product of his service and progression within GSK.
c) For Dr Moncef Slaoui, further details regarding the 2013 pension values are set out in the table below.
Dr Moncef Slaoui Accrued pension as at 31.12.2013 (p.a.)
Accrued pension as at 31.12.2012 (p.a.)
Pension remuneration value for 2013 (000)
US – Funded $12,200 $13,116 –US – Unfunded $325,080 $337,217 –Belgium – Funded €84,000 €78,000 €101US – 401(k) & ESSP – – $127Total – – $266
Dr Moncef Slaoui joined GSK predecessor companies in 1988 and he progressed through a number of senior roles within GSK until he was appointed Chairman, Research & Development in June 2006. During this time, he has built up pensionable service in the Belgium Fortis Plan and US Cash Balance Plan and Supplemental Pension Plan. Annual employer cash contributions were made to the 401(k) Plan and Executive Supplemental Savings Plan. His current pension entitlement is a product of his service and progression within GSK.

106 GSK Annual Report 2013
Governance & remuneration Directors’ Remuneration Report
Performance graph and table The following graph sets out the performance of the company relative to the FTSE 100 index, and to the pharmaceutical performance comparator group for the five year period to 31 December 2013. The graph has been prepared in accordance with the Remuneration Regulations and is not an indication of the likely vesting of awards granted under any of the company’s incentive plans. These indices were selected for comparison purposes as they reflect both the index of which GSK is a constituent and the industry in which it operates.
Remuneration table
2013 £000
2012 £000
2011 £000
2010 £000
2009 £000
CEO (Sir Andrew Witty)CEO single figure of remuneration 7,207 4,386 6,807 4,562 5,790Annual bonus award(1)
(% of maximum) 88% 44% 100% 59% 100%Vesting of LTI awards (% of maximum) (6) 31% (5) 24% (4) 70% (3) 35% (2) 35%
(1) 2009 and 2010 bonus amounts include amounts paid under the Operational Efficiency Bonus in place for those years. The overall maximum receivable was subject to a limit of 200% of base salary.
(2) In respect of the 2007 PSP award. Sir Andrew also had an outstanding award over 195,500 share options, granted in 2007 which lapsed in full. These have not been included in the total vesting percentage due to the distorting effect of aggregating conditional shares and share options.
(3) In respect of the 2008 PSP award. Sir Andrew also had an outstanding award over 525,000 share options, granted in 2008 which lapsed in full. These have not been included in the total vesting percentage due to the distorting effect of aggregating conditional shares and share options.
(4) In respect of the three-year element of the 2009 PSP award.(5) In respect of the four-year element of the 2009 PSP award, the
three-year element of the 2010 PSP award and the 2010 DABP matching award.
(6) In respect of the four-year element of the 2010 PSP award, the 2011 PSP award and the 2011 DABP matching award.
Percentage change in remuneration of CEO Base salary Benefits Annual bonus
CEO Sir Andrew Witty 2.5% (21)% 107%UK employees 2.7% 0% 36%
This reflects salary earned in, benefits received in and annual bonus earned in respect of 2013 compared to 2012. For the wider UK employee population, the salary increase includes the annual salary review as well as any additional changes in the year, eg on promotion. The 0% increase for benefits for UK employees reflects there being no change to benefits policies or levels during the year. It does not reflect any changes to the level of benefits an individual may have received as a result of a change in role, eg promotion. The UK population was considered to be the most relevant comparison as it most closely reflects the economic environment encountered by the CEO.
Relative importance of payThe following table sets out the percentage changes in the Group’s dividends to shareholders, share buy-back and total employee pay.
2013 £m
2012 £m
% change
Total employee pay 7,591 6,935 9.5%Dividends 3,680 3,814 (3.5)%Share buy-back 1,504 2,493 (39.7)%
The figures in the table above are as set out on pages 135 and 149. The 2012 dividend figure includes the supplemental dividend of £248 million paid in 2012. Dividends declared in respect of 2013 were £3,754 million (2012: £3,614 million), i.e. an increase of 3.9%. The timing of share buy-backs is influenced by market conditions and price.
Total employee pay is for all Group employees globally.
External appointments for Executive Directors The Board encourages Executive Directors to hold one external directorship once they have become established in their role, to broaden their experience and development, and help increase the pool of candidates for Non-Executive Directors. Any outside appointments are considered by the Nominations Committee to ensure they would not cause a conflict of interest and are then approved by the Chairman on behalf of the Board. It is the company’s policy that remuneration earned from such appointments may be kept by the individual Executive Director.
During 2013, Dr Moncef Slaoui received $8,000 in relation to his membership of the Qatar Biomedical Research Institute Scientific Advisory Committee. There are no other external appointments for which he receives any remuneration. During 2013, Sir Andrew Witty and Simon Dingemans did not hold any external appointments for which they were remunerated.
60 31/12/08 31/12/1331/12/09 31/12/10 31/12/11 31/12/12
GlaxoSmithKline Total Return GlaxoSmithKline Pharma Peers Total Return Index*FTSE 100 Total Return Index
* This index comprises AstraZeneca, Bristol-Myers Squibb, Eli Lilly, Johnson & Johnson, Merck & Co, Novartis, Pfizer, Roche Holdings and Sanofi.
140
100
160
80
120
180
200

GSK Annual Report 2013 107
The Remuneration Committee
Role of the CommitteeThe role of the Committee is to set the company’s remuneration policy so that GSK is able to recruit, retain and motivate its executives. The remuneration policy is regularly reviewed to ensure that it is consistent with the company’s scale and scope of operations, supports the business strategy and growth plans and helps drive the creation of shareholder value.
Terms of referenceThe Committee’s full terms of reference are available on the company’s website. The terms of reference, which are reviewed at least annually, were last revised in December 2013 in light of best practice and the new remuneration regulations.
GovernanceThe Board considers all of the members of the Committee to be independent Non-Executive Directors in accordance with the UK Corporate Governance Code, with the exception of Sir Christopher Gent, Chairman of the company, who was considered independent on appointment.
The Committee met six times in scheduled meetings during 2013, with each member attending as follows:
Members
Committee
member since
Attendance at full
meetings during 2013
Tom de Swaan 20 May 2009 6/6(Chairman from 1 January 2013)Dr Stephanie Burns 1 May 2013 3/3Sir Christopher Gent 1 January 2007 6/6Judy Lewent 1 January 2013 6/6Sir Deryck Maughan 1 July 2012 5/6Hans Wijers 10 October 2013 0/1
Sir Deryck Maughan and Hans Wijers were each unable to attend one Committee meeting due to prior business commitments.
In addition to the six scheduled meetings, the Committee met in full on three occasions to further consider the remuneration matters under review in the year including the review of long-term incentive design and the 2013 Remuneration Report under the new regulations. The Committee also met on a quorate basis on two occasions to approve the formal grant of long-term incentive awards to employees below the Corporate Executive Team.
Committee meetings usually include a closed session, during which only members of the Committee are present. Other individuals may also be invited to attend Committee meetings during the year. Executives and other Committee attendees are not involved in any decisions, and are not present at any discussions regarding their own remuneration.
Other attendees at Committee meetings include:
Attendee
Regular attendee
Attends as required
CEO ✓
CFO ✓
Head of Human Resources ✓
Head of Reward ✓
Secretary to the Committee ✓
Committee Adviser – Deloitte LLP ✓
Adviser to the Committee The Committee has access to external advice as required. During the year, the Committee carried out a formal review of the independent advisers to the Committee. As a result of this review, the Committee decided to reappoint Deloitte LLP to provide it with independent advice on executive remuneration. The Committee Chairman agrees the protocols under which Deloitte provides advice and the Committee is satisfied that the advice they have received from Deloitte has been objective and independent.
Deloitte is a member of the Remuneration Consultants’ Group and, as such, voluntarily operates under the code of conduct in relation to executive remuneration consulting in the UK. The code of conduct can be found at www.remunerationconsultantsgroup.com.
Deloitte provided independent commentary on matters under consideration by the Committee and provided updates on market practice and legislative requirements. Deloitte’s fees for advice provided to the Committee in 2013 were £328,000. Fees were charged on a time and materials basis. Deloitte LLP also provided other consulting, tax and assurance services to GSK during the year, however, the Committee are satisfied that this does not compromise the independence of the advice they have received from Deloitte.
Towers Watson provided additional market data to the Committee.
Commitment to shareholdersThe Committee engages in regular dialogue with shareholders and holds annual meetings with GSK’s largest investors to discuss and take feedback on its remuneration policy. In particular, the Committee discusses any significant changes to the policy or the measures used to assess performance.
Shareholder votes on remuneration matters AGM
Total votes
cast (Billion)
Total votes
for (%)
Total votes against (%)
Votes withheld (Million)
2013 3.8 94.6 5.4 34.4

108 GSK Annual Report 2013
Governance & remuneration Directors’ Remuneration Report
Principal activities and matters addressed during 2013
The Committee’s principal activities and matters addressed during 2013 are set out below:
RemunerationMonth Overall Incentives Governance and other matters
January Approve executives’ 2013 remuneration, including salaries of CEO, CFO and Chairman, Global R&D & VaccinesRemuneration environment update
Review and approve executives’ 2012 bonusesSet 2013 bonus objectives
Review draft 2012 Remuneration Report
February Review LTI performance outcomes and approve vesting of outstanding 2009 LTI awards (2009-2012) and 2010 LTI awards (2010-2012)Approve LTI measures and targets for 2013 awards (2013-2015), and grant awards to Executive Directors and below
Approve 2012 Remuneration Report
March Remuneration environment update, including consideration of new reporting regulations
Review shareholder feedbackSet Committee’s agenda for 2013
July Update on new remuneration reporting regulations, including early draft of 2013 Remuneration ReportCET remuneration review
Review of long-term incentive design (performance measures, comparator group and time horizons)
Review AGM feedback and external environment Approve Committee evaluation processReview of independent adviser
July Grant interim 2013 LTI awards (below executives)
August Grant main 2013 Share Value Plan awards (below executives)
September Review of pay comparator groups Continuation of review of long-term incentive design (performance measures, comparator group and time horizons)
Review of external remuneration environment
October Update on executives’ pension arrangements Review draft disclosures for 2013 Remuneration Report
Update on LTI vesting for 2011 awards (2011-2013)
Review of Chairman’s fees
November Review of terms and conditions and policies
Approve materials for annual investor meeting
November Annual meeting with investors
December Annual pay reviewApprove Executive Directors’ 2014 salaries
Review feedback from shareholder meetingsReview findings from Committee evaluationReview draft 2013 Remuneration Report
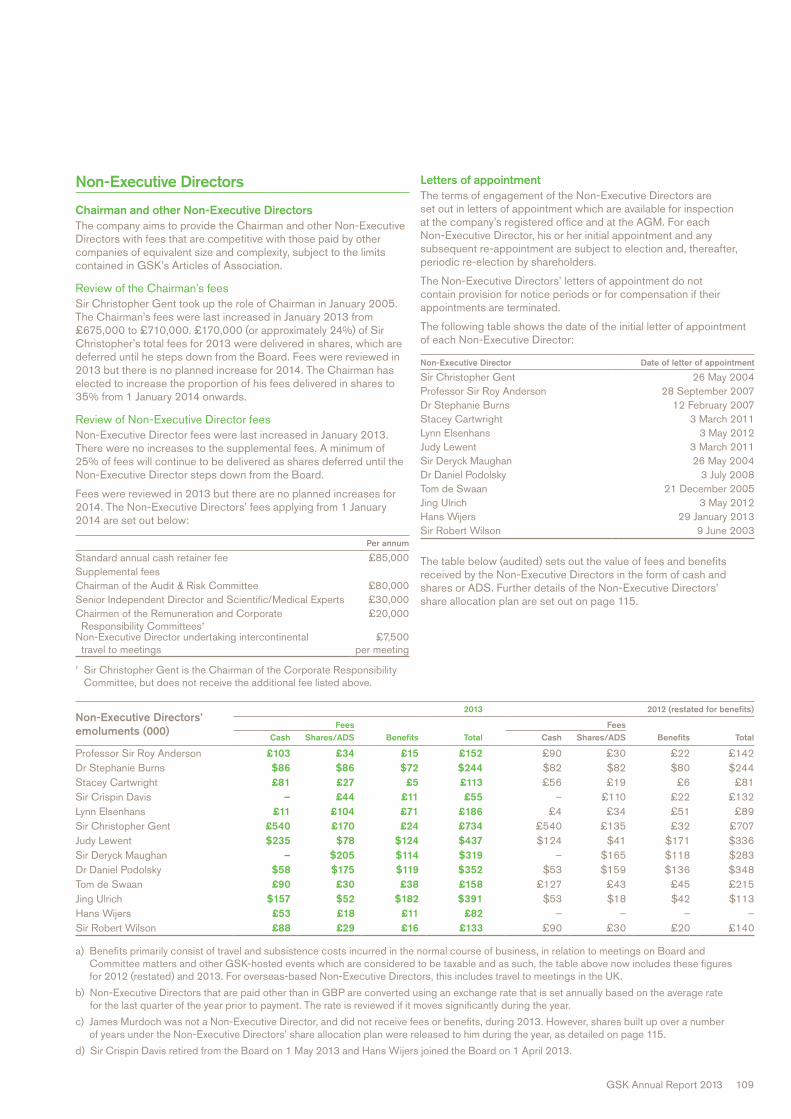
GSK Annual Report 2013 109
Non-Executive Directors
Chairman and other Non-Executive Directors The company aims to provide the Chairman and other Non-Executive Directors with fees that are competitive with those paid by other companies of equivalent size and complexity, subject to the limits contained in GSK’s Articles of Association.
Review of the Chairman’s feesSir Christopher Gent took up the role of Chairman in January 2005. The Chairman’s fees were last increased in January 2013 from £675,000 to £710,000. £170,000 (or approximately 24%) of Sir Christopher’s total fees for 2013 were delivered in shares, which are deferred until he steps down from the Board. Fees were reviewed in 2013 but there is no planned increase for 2014. The Chairman has elected to increase the proportion of his fees delivered in shares to 35% from 1 January 2014 onwards.
Review of Non-Executive Director feesNon-Executive Director fees were last increased in January 2013. There were no increases to the supplemental fees. A minimum of 25% of fees will continue to be delivered as shares deferred until the Non-Executive Director steps down from the Board.
Fees were reviewed in 2013 but there are no planned increases for 2014. The Non-Executive Directors’ fees applying from 1 January 2014 are set out below:
Per annum
Standard annual cash retainer fee £85,000Supplemental feesChairman of the Audit & Risk Committee £80,000Senior Independent Director and Scientific/Medical Experts £30,000Chairmen of the Remuneration and Corporate Responsibility Committees†
£20,000
Non-Executive Director undertaking intercontinental travel to meetings
£7,500 per meeting
† Sir Christopher Gent is the Chairman of the Corporate Responsibility Committee, but does not receive the additional fee listed above.
Letters of appointmentThe terms of engagement of the Non-Executive Directors are set out in letters of appointment which are available for inspection at the company’s registered office and at the AGM. For each Non-Executive Director, his or her initial appointment and any subsequent re-appointment are subject to election and, thereafter, periodic re-election by shareholders.
The Non-Executive Directors’ letters of appointment do not contain provision for notice periods or for compensation if their appointments are terminated.
The following table shows the date of the initial letter of appointment of each Non-Executive Director:
Non-Executive Director Date of letter of appointment
Sir Christopher Gent 26 May 2004Professor Sir Roy Anderson 28 September 2007Dr Stephanie Burns 12 February 2007Stacey Cartwright 3 March 2011Lynn Elsenhans 3 May 2012Judy Lewent 3 March 2011Sir Deryck Maughan 26 May 2004Dr Daniel Podolsky 3 July 2008Tom de Swaan 21 December 2005Jing Ulrich 3 May 2012Hans Wijers 29 January 2013Sir Robert Wilson 9 June 2003
The table below (audited) sets out the value of fees and benefits received by the Non-Executive Directors in the form of cash and shares or ADS. Further details of the Non-Executive Directors’ share allocation plan are set out on page 115.
Non-Executive Directors’ emoluments (000)
2013 2012 (restated for benefits)
Fees FeesCash Shares/ADS Benefits Total Cash Shares/ADS Benefits Total
Professor Sir Roy Anderson £103 £34 £15 £152 £90 £30 £22 £142Dr Stephanie Burns $86 $86 $72 $244 $82 $82 $80 $244Stacey Cartwright £81 £27 £5 £113 £56 £19 £6 £81Sir Crispin Davis – £44 £11 £55 – £110 £22 £132Lynn Elsenhans £11 £104 £71 £186 £4 £34 £51 £89Sir Christopher Gent £540 £170 £24 £734 £540 £135 £32 £707Judy Lewent $235 $78 $124 $437 $124 $41 $171 $336Sir Deryck Maughan – $205 $114 $319 – $165 $118 $283Dr Daniel Podolsky $58 $175 $119 $352 $53 $159 $136 $348Tom de Swaan £90 £30 £38 £158 £127 £43 £45 £215Jing Ulrich $157 $52 $182 $391 $53 $18 $42 $113Hans Wijers £53 £18 £11 £82 – – – –Sir Robert Wilson £88 £29 £16 £133 £90 £30 £20 £140
a) Benefits primarily consist of travel and subsistence costs incurred in the normal course of business, in relation to meetings on Board and Committee matters and other GSK-hosted events which are considered to be taxable and as such, the table above now includes these figures for 2012 (restated) and 2013. For overseas-based Non-Executive Directors, this includes travel to meetings in the UK.
b) Non-Executive Directors that are paid other than in GBP are converted using an exchange rate that is set annually based on the average rate for the last quarter of the year prior to payment. The rate is reviewed if it moves significantly during the year.
c) James Murdoch was not a Non-Executive Director, and did not receive fees or benefits, during 2013. However, shares built up over a number of years under the Non-Executive Directors’ share allocation plan were released to him during the year, as detailed on page 115.
d) Sir Crispin Davis retired from the Board on 1 May 2013 and Hans Wijers joined the Board on 1 April 2013.

110 GSK Annual Report 2013
Governance & remuneration Directors’ Remuneration Report
Directors’ interests in shares (audited) The following interests of the Directors of the company in office at 31 December 2013 and their connected persons are shown below.
Breakdown of share plan interests as at 31 December 2013: Total directors’ interests as at: Shares/ADS Options
21 February
201431 December
20131 January
2013
Unvested and subject to
performance
Unvested and not subject to performance
Unvested and subject to
performance
Unvested and not subject to performance
Vested but not exercised
Exercised in the year
Executive DirectorsSharesSir Andrew Witty 734,002 566,142 449,987 1,699,512 – – 124,038 267,493 172,958Simon Dingemans 152,460 84,872 70,362 655,570 – – 44,794 – –Dr Moncef Slaoui 53,340 53,089 63,472 – – – – 95,320 25,981ADSDr Moncef Slaoui 222,742 164,995 116,556 560,662 67,164 – – 4,235 –
Non-Executive DirectorsSharesProfessor Sir Roy Anderson 17,254 17,254 14,401 – 17,254 – – – –Dr Stephanie Burns 44 44 44 – – – – – –Stacey Cartwright 4,367 4,367 2,547 – 4,246 – – – –Tom de Swaan 24,059 24,059 21,168 – 24,059 – – – –Sir Christopher Gent 109,404 109,404 94,212 – 109,404 – – – –Hans Wijers 1,113 1,113 – – 1,113 – – – –Sir Robert Wilson 30,842 30,842 27,953 – 24,714 – – – –ADSDr Stephanie Burns 14,284 14,284 12,008 – 14,219 – – – –Lynn Elsenhans 5,620 5,620 2,181 – 4,620 – – – –Judy Lewent 13,200 13,200 11,542 – 3,200 – – – –Sir Deryck Maughan 36,198 36,198 30,720 – 36,198 – – – –Dr Daniel Podolsky 25,876 25,876 21,383 – 25,876 – – – –Jing Ulrich 1,809 1,809 734 – 1,471 – – – –
a) Unvested shares and ADS and unvested options held by Executive Directors which are not subject to performance reflect bonus deferrals under the Deferred Annual Bonus Plan and ShareSave awards.
b) One GSK ADS represents two GSK shares. c) Total interests include shares purchased through the GlaxoSmithKline ShareReward Plan. During 2013, 148 and 106 shares were awarded to Sir Andrew
Witty and Simon Dingemans respectively under the plan. The balance of shares within the plan is as follows:
ShareReward Plan 21 February 2014 31 December 2013 1 January 2013
Sir Andrew Witty 2,489 2,429 2,134Simon Dingemans 643 604 392
Dr Moncef Slaoui does not participate in the ShareReward Plan.
d) Total interests include shares or ADS resulting from the deferral of bonus (and the subsequent re-investment of dividends) under the Deferred Annual Bonus Plan. The totals shown in the table below include bonus deferrals, but exclude any unvested matching awards which are subject to ongoing performance criteria. The amounts represent the gross share and ADS balances prior to the sale of any shares or ADS to satisfy tax liabilities.
Deferred Annual Bonus Plan (bonus deferrals) 21 February 2014 31 December 2013 1 January 2013
Sir Andrew Witty (Shares) 181,785 123,262 112,833Simon Dingemans (Shares) 63,669 44,268 29,970Dr Moncef Slaoui (ADS) 78,331 59,424 40,269
e) Total interests at 21 February 2014 include any shares or ADS which vested due to performance under elements of the Performance Share Plan (2011-2013 awards), less those sold to satisfy tax liabilities on the vested amounts (see pages 112 to 114 for further details).
f) For Dr Moncef Slaoui, total interests include ADS purchased within the 401(k) Plan and the US Executive Supplemental Savings Plan (ESSP), and ADS awarded to Dr Moncef Slaoui’s connected person under the Share Value Plan (SVP). The relevant balances are as follows:
Dr Moncef Slaoui 21 February 2014 31 December 2013 1 January 2013
US Retirement Savings Plans 10,538 10,241 8,249Share Value Plan 7,740 7,740 5,390
As an Executive Director, Dr Moncef Slaoui is not eligible to receive awards under the SVP. The SVP awards shown above reflect the holdings of Dr Moncef Slaoui’s connected person, who is also an employee of GSK. The awards are subject to three-year vesting periods and vesting is contingent on continued employment within GSK. Any gains arising on vesting are not included in Dr Moncef Slaoui’s total remuneration figures. During the year, the connected person was granted 2,990 ADS on 27 August 2013 at a grant price of $51.76 (face value of $154,762). Dr Moncef Slaoui’s total interests in shares also include PSP awards held by his connected person, who is also an employee of GSK. These awards are subject to performance criteria relevant to employees below the CET. As at 31 December 2013, the connected person held 3,898 ADS under award, comprising awards made in 2012 (2,103 ADS) and 2013 (1,795 ADS) including dividend re-investment.

GSK Annual Report 2013 111
g) For Sir Andrew Witty and Simon Dingemans, the unvested options not subject to performance include holdings of 776 and 526 respectively as at 31 December 2013 in the ShareSave Plan, in which they participate on the same terms as all other employees. No ShareSave awards were granted to Sir Andrew Witty during 2013. Simon Dingemans was granted 216 options under the plan on 1 December 2013. The remainder of unvested options not subject to performance relate to bonus deferrals structured as nil-cost options under the DABP.
h) For the Executive Directors, the following table provides details of vested but unexercised options as at 31 December 2013 under the Share Option Plan (SOP). GSK granted options under this plan to Executive Directors on an annual basis until 2009.
Number of shares under optionDate of grant Lapse date Exercise price Sir Andrew Witty Dr Moncef Slaoui
02.12.04 01.12.14 £11.23 177,500 26,80021.02.06 20.02.16 £14.68 89,993 68,520
267,493 95,320
i) The ADS vested but unexercised options totalling 4,235 for Dr Moncef Slaoui represents the ADS options held by Dr Moncef Slaoui’s connected person, who is also an employee of GSK.
j) The following table sets out details of options (including nil-cost options under the DABP and Annual Investment Plan) exercised during 2013 by Executive Directors. Simon Dingemans did not exercise any options during the year (his first nil-cost options under the DABP will become exercisable in 2015).
Type of award
Date of grantNumber of shares
under option
Date of exercise
Exercise priceMarket
price at exerciseGain on exercise
(£000)
Sir Andrew Witty SOP 15.12.03 136,000 13.05.13 £12.70 £16.81 £559 DABP – deferral 22.02.10 28,429 13.05.13 – £16.83 £478 DABP – matching 22.02.10 8,529 13.05.13 – £16.83 £144
172,958 £1,181Dr Moncef Slaoui Annual Investment Plan 20.03.03 5,143 15.03.13 – £14.95 £77
20.03.04 5,228 15.03.13 – £14.95 £7818.03.05 5,393 15.03.13 – £14.95 £8120.03.06 10,217 15.03.13 – £14.95 £153
25,981 £389
k) In respect of options under the SOP and the ShareSave plans, the remuneration receivable by an Executive Director is calculated on the date that the options first vest. The remuneration is the difference between the amount the Executive Director is required to pay to buy the shares or ADS and the total value of the shares or ADS on the vesting date. If the Executive Director chooses not to exercise the options on the vesting date, any subsequent increase or decrease in the amount realised will be due to movements in the share or ADS price between the vesting date and the date of exercise. This increase or decrease in value is the result of an investment decision by the Executive Director and, as such, is not recorded as remuneration. No options vested for Executive Directors during 2013.
l) For Non-Executive Directors, total interests include shares or ADS received as part or all of their fees under the Share Allocation Plan (see page 115 for further details and balances). Note that dividends received on shares or ADS under the plan during 2013 were converted into shares or ADS as at 31 December 2013.
m) Hans Wijers joined the Board on 1 April 2013.
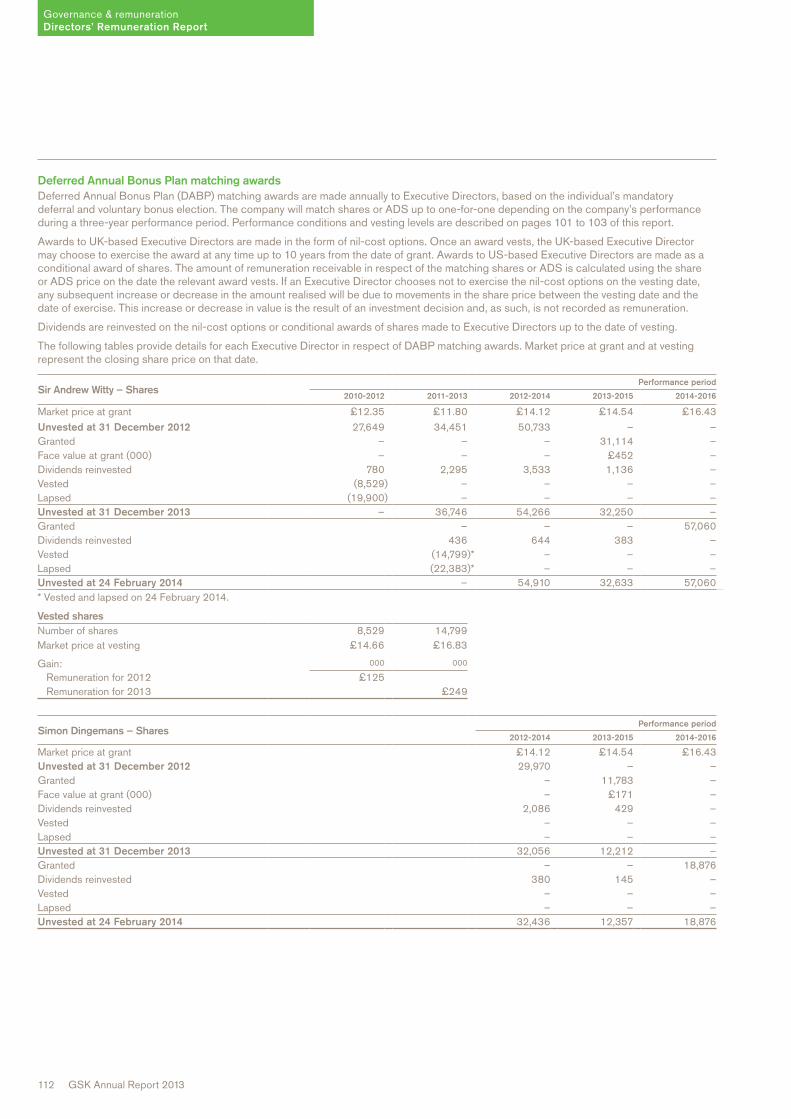
112 GSK Annual Report 2013
Governance & remuneration Directors’ Remuneration Report
Deferred Annual Bonus Plan matching awardsDeferred Annual Bonus Plan (DABP) matching awards are made annually to Executive Directors, based on the individual’s mandatory deferral and voluntary bonus election. The company will match shares or ADS up to one-for-one depending on the company’s performance during a three-year performance period. Performance conditions and vesting levels are described on pages 101 to 103 of this report.
Awards to UK-based Executive Directors are made in the form of nil-cost options. Once an award vests, the UK-based Executive Director may choose to exercise the award at any time up to 10 years from the date of grant. Awards to US-based Executive Directors are made as a conditional award of shares. The amount of remuneration receivable in respect of the matching shares or ADS is calculated using the share or ADS price on the date the relevant award vests. If an Executive Director chooses not to exercise the nil-cost options on the vesting date, any subsequent increase or decrease in the amount realised will be due to movements in the share price between the vesting date and the date of exercise. This increase or decrease in value is the result of an investment decision and, as such, is not recorded as remuneration.
Dividends are reinvested on the nil-cost options or conditional awards of shares made to Executive Directors up to the date of vesting.
The following tables provide details for each Executive Director in respect of DABP matching awards. Market price at grant and at vesting represent the closing share price on that date.
Sir Andrew Witty – SharesPerformance period
2010-2012 2011-2013 2012-2014 2013-2015 2014-2016
Market price at grant £12.35 £11.80 £14.12 £14.54 £16.43Unvested at 31 December 2012 27,649 34,451 50,733 – –Granted – – – 31,114 –Face value at grant (000) – – – £452 –Dividends reinvested 780 2,295 3,533 1,136 –Vested (8,529) – – – –Lapsed (19,900) – – – –Unvested at 31 December 2013 – 36,746 54,266 32,250 –Granted – – – 57,060Dividends reinvested 436 644 383 –Vested (14,799)* – – –Lapsed (22,383)* – – –Unvested at 24 February 2014 – 54,910 32,633 57,060* Vested and lapsed on 24 February 2014.
Vested sharesNumber of shares 8,529 14,799Market price at vesting £14.66 £16.83
Gain: 000 000
Remuneration for 2012 £125 Remuneration for 2013 £249
Simon Dingemans – SharesPerformance period
2012-2014 2013-2015 2014-2016
Market price at grant £14.12 £14.54 £16.43Unvested at 31 December 2012 29,970 – –Granted – 11,783 –Face value at grant (000) – £171 –Dividends reinvested 2,086 429 –Vested – – –Lapsed – – –Unvested at 31 December 2013 32,056 12,212 –Granted – – 18,876Dividends reinvested 380 145 –Vested – – –Lapsed – – –Unvested at 24 February 2014 32,436 12,357 18,876

GSK Annual Report 2013 113
Deferred Annual Bonus Plan matching awards continued
Dr Moncef Slaoui – ADSPerformance period
2011-2013 2012-2014 2013-2015 2014-2016
Market price at grant $38.22 $44.68 $44.27 $54.17Unvested at 31 December 2012 20,259 20,010 – –Granted – – 15,859 –Face value at grant (000) – – $702 –Dividends reinvested 1,337 1,383 576 –Vested – – – –Lapsed – – – –Unvested at 31 December 2013 21,596 21,393 16,435 –Granted – – – 18,214Dividends reinvested 252 249 192 –Vested (8,696)* – – –Lapsed (13,152)* – – –Unvested at 24 February 2014 – 21,642 16,627 18,214* Vested and lapsed on 24 February 2014.
Vested ADSNumber of ADS 8,696Market price at vesting $55.75
Gain: 000
Remuneration for 2013 $485
Performance Share Plan awardsPerformance Share Plan (PSP) awards are made to Executive Directors on an annual basis. Under the terms of the PSP, the number of shares or ADS vesting is determined following the end of the relevant performance period and is dependent on GSK’s performance during that period. Performance conditions and vesting levels are described on pages 101 to 103.
Dividends are reinvested on the performance shares or ADS awarded to executives throughout the performance period and up to the date of vesting. At vesting, UK participants receive the relevant number of shares and US participants may defer receipt of all or part of their vested awards. The amount of remuneration receivable in respect of performance shares is calculated using the share or ADS price on the date the relevant PSP award vests.
The PSP awards made to Sir Andrew Witty in 2012, 2013 and 2014 have three year performance periods. However, the deeds of award specify that 25% of the awards will be subject to a further two year vesting period (five years in total). During this two year period, there are no additional performance criteria and the awards will only lapse if Sir Andrew is dismissed for cause. The remuneration in respect of these awards will therefore be considered to be realised in full following the determination by the Remuneration Committee of the vesting levels of the initial 75% of the awards (i.e. full remuneration will be recognised at the end of the three-year performance period).
The following tables provide details for each Executive Director in respect of PSP awards. Market price at grant and at vesting represent the closing share price on that date. Executive Directors
Sir Andrew Witty – SharesPerformance period
2009-2012 2010-2012 2010-2013 2011-2013 2012-2014 2013-2015 2014-2016
Market price at grant £10.62 £12.04 £12.04 £11.78 £14.12 £14.54 £16.43Unvested at 31 December 2012 166,648 330,718 141,736 457,869 452,186 – –Granted – – – – – 437,744 –Face value at grant (000) – – – – – £6,365 –Dividends reinvested 4,700 9,327 9,183 30,378 31,278 15,876 –Vested – (121,445) – – – – –Lapsed (171,348) (218,600) – – – – –Unvested at 31 December 2013 – – 150,919 488,247 483,464 453,620 –Granted – – – – 397,066Dividends reinvested 1,795 5,808 5,751 5,395 –Vested – (196,634) – – –Lapsed (152,714) (297,421) – – –Unvested at 21 February 2014 – – 489,215 459,015 397,066
Vested shares:Number of shares – 121,445 – 196,634Market price at vesting £14.66 £14.66 £16.53 £16.53
Gain: 000 000 000 000
Remuneration for 2012 – £1,780 Remuneration for 2013 – £3,250

114 GSK Annual Report 2013
Governance & remuneration Directors’ Remuneration Report
Performance Share Plan awards continued
Simon Dingemans – SharesPerformance period
2011-2013 2012-2014 2013-2015 2014-2016
Market price at grant £11.78 £14.12 £14.54 £16.43Unvested at 31 December 2012 211,535 174,091 – –Granted – – 192,613 –Face value at grant (000) – – £2,801 –Dividends reinvested 14,035 12,042 6,985 –Vested – – – –Lapsed – – – –Unvested at 31 December 2013 225,570 186,133 199,598 –Granted – – – 174,729Dividends reinvested 2,683 2,214 2,374 –Vested (90,845) – – –Lapsed (137,408) – – –Unvested at 21 February 2014 – 188,347 201,972 174,729
Vested shares:Number of shares 90,845Market price at vesting £16.53
Gain: 000
Remuneration for 2013 £1,502
Dr Moncef Slaoui – ADSPerformance period
2009-2012 2010-2012 2010-2013 2011-2013 2012-2014 2013-2015 2014-2016
Market price at grant $33.71 $37.32 $37.32 $38.13 $44.68 $44.27 $54.17Unvested at 31 December 2012 24,462 104,029 44,584 159,276 132,708 – –Granted – – – – – 133,521 –Face value at grant (000) – – – – – $5,911 –Dividends reinvested 699 2,973 2,899 10,466 9,091 4,794 –Vested – (38,215) – – – – –Lapsed (25,161) (68,787) – – – – –Unvested at 31 December 2013 – – 47,483 169,742 141,799 138,315 –Granted – – – – 111,851Dividends reinvested 554 1,979 1,653 1,613 –Vested – (68,345) – – –Lapsed (48,037) (103,376) – – –Unvested at 21 February 2014 – – 143,452 139,928 111,851
Vested sharesNumber of ADS – 38,215 – 68,345Market price at vesting $44.22 $44.22 $55.06 $55.06
Gain: 000 000 000 000
Remuneration for 2012 – $1,690 Remuneration for 2013 – $3,763
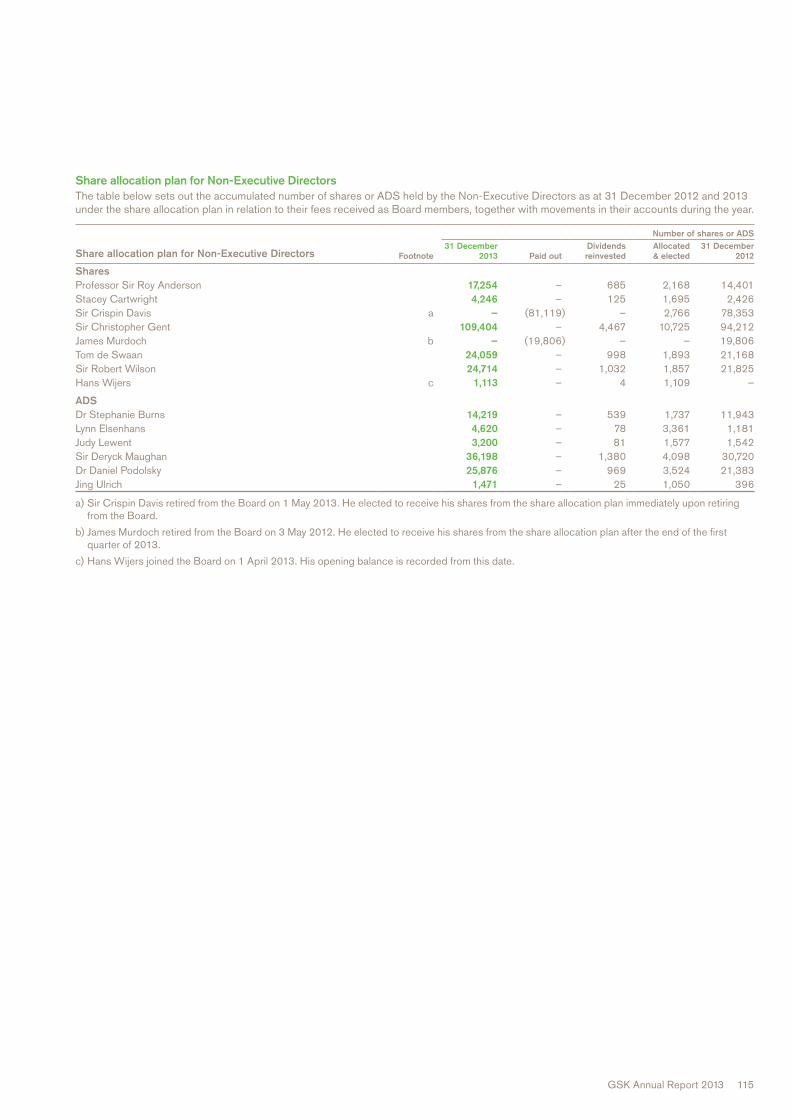
GSK Annual Report 2013 115
Share allocation plan for Non-Executive DirectorsThe table below sets out the accumulated number of shares or ADS held by the Non-Executive Directors as at 31 December 2012 and 2013 under the share allocation plan in relation to their fees received as Board members, together with movements in their accounts during the year.
Share allocation plan for Non-Executive Directors
Number of shares or ADS
Footnote31 December
2013
Paid outDividends reinvested
Allocated & elected
31 December 2012
SharesProfessor Sir Roy Anderson 17,254 – 685 2,168 14,401Stacey Cartwright 4,246 – 125 1,695 2,426Sir Crispin Davis a – (81,119) – 2,766 78,353Sir Christopher Gent 109,404 – 4,467 10,725 94,212James Murdoch b – (19,806) – – 19,806Tom de Swaan 24,059 – 998 1,893 21,168Sir Robert Wilson 24,714 – 1,032 1,857 21,825Hans Wijers c 1,113 – 4 1,109 –
ADSDr Stephanie Burns 14,219 – 539 1,737 11,943Lynn Elsenhans 4,620 – 78 3,361 1,181Judy Lewent 3,200 – 81 1,577 1,542Sir Deryck Maughan 36,198 – 1,380 4,098 30,720Dr Daniel Podolsky 25,876 – 969 3,524 21,383Jing Ulrich 1,471 – 25 1,050 396
a) Sir Crispin Davis retired from the Board on 1 May 2013. He elected to receive his shares from the share allocation plan immediately upon retiring from the Board.
b) James Murdoch retired from the Board on 3 May 2012. He elected to receive his shares from the share allocation plan after the end of the first quarter of 2013.
c) Hans Wijers joined the Board on 1 April 2013. His opening balance is recorded from this date.

116 GSK Annual Report 2013
Governance & remuneration Directors’ Remuneration Report
Directors and Senior ManagementFurther information is provided on compensation and interests of Directors and Senior Management as a group (‘the group’). For this purpose, the group is defined as the Non-Executive and Executive Directors, other members of the Corporate Executive Team and the Company Secretary. For the financial year 2013, the following table sets out aggregate remuneration for the group for the periods during which they served in that capacity.
Remuneration for 2013 (£)
Total compensation paid 22,956,905Aggregate increase in accrued pension benefits (net of inflation) 282,475Aggregate payments to defined contribution schemes 927,191
During 2013, members of the group were awarded shares and ADS under the company’s various share plans, as set out in the table below.
Awards Dividend reinvestment awardsAwarded during 2013 Shares ADS Shares ADS
Deferred Annual Bonus Plan 93,309 26,087 19,278 6,280Performance Share Plan 1,519,865 313,594 274,664 70,198Deferred Investment Awards(a) (b) – – 4,908 –Share Value Plan(b) 15,146 2,990 – –
a) Notional shares and ADS.b) Executive Directors are not eligible to receive Deferred Investment Awards or participate in the Share Value Plan.
At 21 February 2014, the group had the following interests in shares and ADS of the company. Holdings issued under the various executive share plans are described in Note 42 to the financial statements, ‘Employee share schemes’ on page 199.
Interests at 21 February 2014 Shares ADS Notes
Owned 1,396,328 535,100 Represents less than 1% of issued share capitalUnexercised options 1,287,123 39,845Deferred Annual Bonus Plan 485,315 149,014 Includes shares and ADS vested but unexercisedPerformance Share Plan 4,166,903 963,712 Includes shares and ADS vested and deferredDeferred Investment Awards 80,279 – Notional shares and ADSShare Value Plan 79,511 28,420

GSK Annual Report 2013 117
Remuneration policyThe total remuneration for each Executive Director comprises the following elements:
Future policy tableThe company’s Remuneration policy from 7 May 2014 in respect of each of the above elements is outlined in the table below.
* The Committee may, in specific circumstances and in line with stated principles, apply clawback/malus as it determines appropriate.
Salary Benefits
Value earned from long-term
incentive awards
Pension Total remuneration*+ + =Annual
bonus + +
Purpose and link to strategyTo provide a core reward for the role.
Set at a level appropriate to secure and retain high calibre individuals needed to deliver the Group’s strategic priorities.
OperationIndividual’s role, experience and performance and independently sourced data for relevant comparator groups considered when determining salary levels.
Salary increases typically take effect in the first quarter of each year.
Salaries are normally paid in the currency of the Executive Director’s home country.
OpportunityThere is no formal maximum limit, however, ordinarily, salary increases will be broadly in line with the average increases for the wider GSK workforce.
However, increases may be higher to reflect a change in the scope of the individual’s role, responsibilities or experience. Salary adjustments may also reflect wider market conditions in the geography in which the individual operates.
Salary levels for 2014 are set out on page 98.
Performance measuresThe overall performance of the individual is a key consideration when determining salary increases.
Purpose and link to strategyLevels are set to recruit and retain high calibre individuals to execute the business strategy.
OperationExecutive Directors are eligible to receive benefits in line with the policy for other employees which may vary by location. These include car allowances, healthcare, life assurance/death in service (where not provided as part of the individual’s pension arrangements), personal financial advice and contractual post-retirement benefits. Executive Directors are also eligible to participate in all-employee share schemes (eg ShareSave and ShareReward Plan), under which they are subject to the same terms as all other employees.
In order to recognise the high business and travel requirements of the role, Executive Directors are also entitled to car travel and may be accompanied by their spouse/partner on business trips. Other benefits include expenses incurred in the ordinary course of business, which are deemed to be taxable benefits on the individual.
Benefit provision is tailored to reflect market practice in the geography in which the Executive Director is based and different policies may apply if current or future Executive Directors are based in a different country.
OpportunityThere is no formal maximum limit as benefits costs can fluctuate depending on changes in provider cost and individual circumstances.
Details of current benefits and costs are set out in the Annual Report on Remuneration.
Performance measuresNone
Purpose and link to strategyGSK may require Executive Directors to relocate in order to meet business requirements.
OperationIn line with the policy for other employees, secondment and travel expenses are provided for executives on overseas placement to facilitate the relocation process and to provide a continued standard of living while on assignment.
International assignment allowances cover: relocation costs; accommodation based on size of family with appropriate security; location allowance; relocation-specific tax and financial advice; school fees; and tax equalisation.
OpportunityRelocation benefits are dependent on a number of factors such as home and host country, family size and duration of the assignment.
It is therefore not possible to provide typical values or limits.
Performance measuresNone
Salary Benefits International assignment policy
Remuneration policy report

118 GSK Annual Report 2013
Governance & remuneration Directors’ Remuneration Report
Purpose and link to strategyTo incentivise and recognise execution of the business strategy on an annual basis.
Rewards the achievement of stretching annual financial and strategic business targets and delivery of personal objectives.
OperationFinancial, operational and business targets are set at the start of the year by the Committee and bonus levels are determined by the Committee based on performance against those targets.
Individual objectives are set at the start of the year by the Committee and performance against objectives is assessed by the Committee.
Executive Directors are required to defer 25% of any bonus earned into shares, or ADS as appropriate, for three years. They may defer up to an additional 25% of bonus earned, i.e. up to an overall maximum deferral of 50%. Deferred shares vest at the end of the three year performance period.
Deferred bonus shares are eligible for dividend equivalents up to the date of vesting.
The Committee may apply judgement in making appropriate adjustments to individual annual bonus amounts.
Clawback and/or malus provisions apply as described on page 119.
Annual bonus
Threshold bonus as
a % of base salary
Maximum bonus as a
% of base salary
CEO 40 200
CFO 26 180
Chairman, Global R&D & Vaccines
27
200
OpportunityThe threshold and maximum bonus opportunities for Executive Directors are as follows:
Performance measuresBased on financial targets and individual performance objectives.
25% based on core Group profit before interest and tax for all Executive Directors. For the CEO and CFO, the balance is based on core Group operating profit. For other Executive Directors, the balance is based on relevant business unit performance.
Individual performance objectives A multiplier, based on the achievement of individual performance targets, is applied to the bonus awarded for performance against the financial or operational targets.
Purpose and link to strategyPension arrangements provide a competitive level of retirement income.
OperationPension arrangements are structured in accordance with the plans operated in the country in which the individual is likely to retire. Where the individual chooses not to become a member of the pension plan, cash in lieu of the relevant pension contribution is paid instead.
New Executive Directors in the UK will be entitled either to join the defined contribution pension plan or to receive a cash payment in lieu of pension contribution.
Where an individual is a member of a GSK legacy defined benefit plan, a defined contribution plan or an alternative pension plan arrangement and is subsequently appointed to the Board, he or she may remain a member of that plan.
Pension
OpportunityPension arrangements for existing Executive Directors are as follows:
Sir Andrew Witty is a member of the legacy Glaxo Wellcome defined benefit plan with an accrual rate of 1/30th of final pensionable salary per annum. From 1 April 2013, pensionable earnings increases are limited to 2% per annum for all members, including Sir Andrew Witty.
Simon Dingemans is not a member of any GSK pension plan for pension contributions and instead receives a cash payment of 20% of salary in lieu of pension contribution.
Dr Moncef Slaoui is a member of the US Cash Balance Pension Plans, the GSK 401(k) plan and the Executive Supplemental Savings Plan. He is also a deferred member of the Belgium Fortis Plan.
The policy for a new external recruit is:
UK:
• 20% of salary contribution to defined contribution plan and further 5% in matched contributions in line with the policy for other members of the plan; or
• 20% of salary cash payment in lieu of pension contribution.
US:
Eligible for the same benefits as other US senior executives:
• Cash Balance Pension Plan and Supplemental Cash Balance Pension Plan, including Executive Pension Credit, provide maximum contribution of 38% of base salary across all pension plans.
• GSK 401(k) plan (formerly the US Retirement Savings Plan) and the Executive Supplemental Savings Plan with core contributions of 2% of salary and bonus and matched contributions of 4% of salary and bonus .
Global:
• Eligible for appropriate equivalent arrangement not in excess of the US/UK arrangements.
Performance measuresNone

GSK Annual Report 2013 119
Purpose and link to strategyTo incentivise and recognise delivery of the longer term business priorities, financial growth and increases in shareholder value compared to other pharmaceutical companies.
In addition, to provide alignment with shareholder interests, a retention element, to encourage long-term shareholding and discourage excessive risk taking.
OperationDABP Deferred shares may be matched subject to the achievement of performance conditions over three years. Matching awards may be conditional shares or nil-cost options and are eligible for dividend equivalents in respect of the performance period.
PSP Conditional awards are made annually with vesting dependent on the achievement of performance conditions over three years.
From 2015 awards onwards, vested awards must be held for a further two years, i.e. five years in total, prior to release. 25% of the CEO’s 2012, 2013 and 2014 PSP awards are subject to an additional two-year vesting period.
Awards are eligible for dividend equivalents up to the date of vesting.
Performance targets for the DABP and PSP are set at the start of each performance period.
Clawback and/or malus provisions apply as described below.
Clawback and malusWith effect from the 2013 annual bonus (payable in 2014), Executive Directors are required to defer a minimum of 25% of their annual bonus into the DABP. In the event of a ‘triggering event’ (eg significant misconduct by way of violation of regulation, law, or a significant GSK policy, such as Code of Conduct) the company will have the ability to claw back up to three years’ annual and deferred bonuses as well as vested and unvested LTIs. A separate Recoupment Committee has been established to investigate relevant claims of misconduct.
Additionally, where there has been continuity of responsibility between initiation of an adverse event and its emergence as a problem, the adverse event should be taken into account in assessing annual bonus awards and LTI vesting levels in the year the problem is identified and for future periods. The Committee may make appropriate adjustments to individual annual bonuses as well as grant and vesting levels of LTI awards to reflect this.ments to individual annual bonus amounts.
Deferred Annual Bonus Plan (DABP) and Performance Share Plan (PSP)
% of salary
CEO 600
CFO 400
Chairman, Global R&D & Vaccines
500
OpportunityDABP Maximum bonus deferral of 50% of annual bonus (25% mandatory and up to an additional 25% voluntary).
Maximum matching opportunity level is on a one share for one share basis subject to performance criteria over three years.
PSP The normal maximum award limit is six times base salary per annum on the maximum initial value of performance shares that may be granted under the PSP to an individual in any one year.
The PSP rules allow for the Committee to make awards of more than 600% of salary in exceptional circumstances.
Current award levels for each of the Executive Directors are as follows:
Performance measuresThree equally weighted performance measures:
• R&D new product performance*
• Adjusted free cash flow*
• Relative TSR†
* 25% vests at threshold up to 100% for maximum performance
† Against comparator group currently comprising GSK and nine other global pharmaceutical companies, with 30% vesting at median, rising to 100% vesting for upper quartile performance.
For details of unvested 2012, 2013 and 2014 awards, see pages 102 and 103, and pages 112 to 114.

120 GSK Annual Report 2013
Governance & remuneration Directors’ Remuneration Report
Performance measure Rationale Calculation methodology
R&D new product performance
Recognises the importance of R&D to future business growthOne of the key indicators used to assess performance in the pharmaceutical industry is the strength of a company’s product pipeline. The R&D new product performance measure recognises the importance of R&D to future business growth and has been included as a measure in order to incentivise R&D performance and drive the development and sales of new products. The Committee believes that it is a robust and appropriate measure as it reflects actual delivery from the pipeline and launch excellence.
The target is based on sales of new products launched in the performance period and the preceding two years.
The aggregate three-year revenue target should reflect growth on historic performance.
Vesting may be reduced if insufficient progress has been made during the performance period towards GSK’s target return on R&D investment.
The Committee recognises that, from time to time, it may be appropriate for the company to respond to an emerging pandemic, as this supports GSK’s ethical responsibilities and values. The impact of such revenue will be included, unless the Committee considers that this did not add to shareholder value and provided that underlying performance was sufficiently positive.
Adjusted free cash flow performance
Recognises the importance of effective working capital and cash managementThe use of cash flow as a performance measure is intended to recognise the importance of effective working capital management and of generating cash from assets for future value-creating investments and for returns to shareholders.
Aggregate three-year adjusted free cash flow target.
Adjustments may be made for materially distorting items which may include exchange rate movements, major legal and taxation settlements and special pension contributions.
Relative TSR performance
Focuses on delivery of value to shareholders The Committee recognises that the delivery of value to shareholders is a key priority. Relative total shareholder return against a peer group of global pharmaceutical companies was selected in order to closely align the interests of Executive Directors with those of our investors.
The Committee regularly reviews the composition of the TSR comparator group.
Relative TSR is measured over three years, using a 12-month averaging period. TSR is measured in local currency.
Long-term incentive measuresThe Committee has selected three equally weighted performance measures to focus Executive Directors’ long-term remuneration on the delivery of GSK’s key strategic priorities. From 2014, PSP and DABP awards made to Executive Directors are based on R&D new product performance, adjusted free cash flow and relative TSR.
In addition to setting robust targets, the Committee has implemented a number of safeguards to ensure the targets are met in a sustainable way and any performance reflects genuine achievement against targets and therefore represents the delivery of value for shareholders.
For each performance measure, the impact of any acquisition or divestment will be quantified and adjusted for after the event. Any major adjustment in the calculation of performance measures will be disclosed to shareholders on vesting. The principal safeguards are detailed under each measure below. The Chairman of the Audit & Risk Committee and other members, who are also members of the Remuneration Committee, provide input on the Audit & Risk Committee’s review of the Group’s performance and oversight of any risk factors relevant to remuneration decisions.
The rationale behind each performance measure and how it is calculated are as follows (for vesting schedules please see page 103 of the Annual Report on Remuneration):

GSK Annual Report 2013 121
The Committee determines the remuneration package of new Executive Directors on a case-by-case basis depending on the role, the market from which they will operate and their experience. Total remuneration levels will be set by reference to a relevant pay comparator group and, where appropriate, will allow for future development in the role.
It is expected that new Executive Directors will participate in short and long-term incentive plans on the same basis as existing directors. However, in exceptional circumstances, the Committee reserves the flexibility to set the incentive limit for a new Executive Director at up to an additional 50% of the existing limits.
The Committee retains this flexibility in recognition of the high levels of variable pay in GSK’s global pharmaceutical competitors. However, the Committee will only use this flexibility when it is considered to be in the best interests of the company and its investors. Furthermore, it will only use this flexibility in relation to external recruits, and any such awards will be in line with the principles in the future policy table and subject to performance conditions.
Pension arrangements for external appointments as an Executive Director will be as set out in the remuneration policy table on page 118.
Other benefits will be provided in line with the policy for existing Executive Directors.
Where required to meet business needs, relocation support will be provided in line with company policy.
For any internal appointments, entitlements under existing remuneration elements will continue, including pension entitlements and any outstanding awards. However, where not already the case, internal appointments will be required to move to Executive Director contractual terms, including termination provisions.
The Committee is mindful of the sensitivity relating to recruitment packages and, in particular, the ‘buying out’ of rights relating to previous employment and sign-on payments. It will therefore seek to minimise such arrangements. However, in certain circumstances, to enable the recruitment of exceptional talent, the Committee may determine that such arrangements are in the best interests of the company and its shareholders. Such arrangements will, where possible, be on a like-for-like basis with the forfeited awards. Arrangements will therefore vary depending on the plans and arrangements put in place by the previous employer and may be in the form of cash or shares and may or may not be subject to performance conditions. Explanations will be provided where payments are made either as compensation for previous remuneration forfeited or as a sign-on payment.
The remuneration arrangements for any newly appointed Executive Director will be disclosed as soon as practicable after the appointment.
The following policy and principles apply to the roles of Chairman and Non-Executive Director.
ChairmanFees will be set at a level that is competitive with those paid by other companies of equivalent size and complexity. Fees will be paid partly in shares.
Non-Executive DirectorsFee levels for new Non-Executive Directors will be set on the same basis as for existing Non-Executive Directors of the company. Subject to local laws and regulations, fees will be paid partly in shares.
In the event of a Non-Executive Director with a different role and responsibilities being appointed, fee levels will be benchmarked and set by reference to comparable roles in companies of equivalent size and complexity.
Annual bonus measuresThe annual bonus is designed to drive the achievement of GSK’s annual financial and strategic business targets and the delivery of personal objectives.
The majority of the annual bonus opportunity is based on a formal review of performance against stretching financial targets. This outcome is then adjusted to reflect individual performance by applying an individual performance multiplier. For reasons of commercial sensitivity, specific personal objectives are kept confidential.
Financial performance Individual performance
The Committee believes that it is important for the majority of the CEO and the CFO’s financial targets to be based on core Group operating profit with a smaller element based on core Group Profit Before Interest and Tax to reflect their wider responsibility for driving profitable investments in associates and joint ventures.
Bonus measures for R&D employees, including Dr Moncef Slaoui, are linked to pipeline performance. A robust governance structure has been established to ensure that the bonus payable fairly reflects R&D productivity and performance.
To recognise Dr Moncef Slaoui’s current dual responsibility for Global R&D & Vaccines, an element of his bonus is currently based on Vaccines performance. Consistent with the other Executive Directors, an element of his bonus is also currently based on core Group Profit Before Interest and Tax.
CEOIndividual performance objectives for Sir Andrew Witty are set by the Board in January each year. The Board focuses on the strategic priorities that have been developed for the Group. Following the end of the financial year, the Board reviews his performance generally and against the set objectives to determine the appropriate bonus payable for his performance.
Other Executive DirectorsThe CEO sets individual objectives for the other Executive Directors in line with company strategy and makes recommendations to the Committee regarding their performance against those objectives at the end of the year. Those recommendations are then considered by the Committee before it determines the level of bonuses payable.
Approach to recruitment remuneration
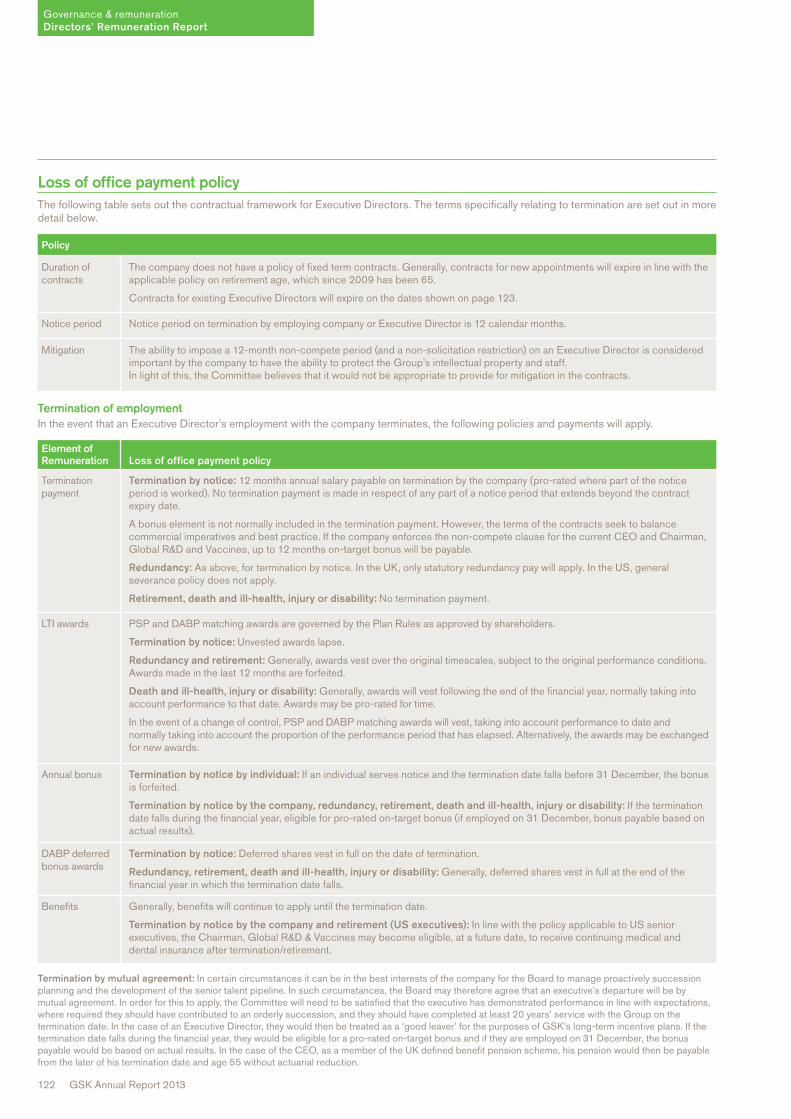
122 GSK Annual Report 2013
Governance & remuneration Directors’ Remuneration Report
Loss of office payment policyThe following table sets out the contractual framework for Executive Directors. The terms specifically relating to termination are set out in more detail below.
Policy
Duration of contracts
The company does not have a policy of fixed term contracts. Generally, contracts for new appointments will expire in line with the applicable policy on retirement age, which since 2009 has been 65.
Contracts for existing Executive Directors will expire on the dates shown on page 123.
Notice period Notice period on termination by employing company or Executive Director is 12 calendar months.
Mitigation The ability to impose a 12-month non-compete period (and a non-solicitation restriction) on an Executive Director is considered important by the company to have the ability to protect the Group’s intellectual property and staff. In light of this, the Committee believes that it would not be appropriate to provide for mitigation in the contracts.
Termination of employment In the event that an Executive Director’s employment with the company terminates, the following policies and payments will apply.
Element of Remuneration
Loss of office payment policy
Termination payment
Termination by notice: 12 months annual salary payable on termination by the company (pro-rated where part of the notice period is worked). No termination payment is made in respect of any part of a notice period that extends beyond the contract expiry date.
A bonus element is not normally included in the termination payment. However, the terms of the contracts seek to balance commercial imperatives and best practice. If the company enforces the non-compete clause for the current CEO and Chairman, Global R&D and Vaccines, up to 12 months on-target bonus will be payable.
Redundancy: As above, for termination by notice. In the UK, only statutory redundancy pay will apply. In the US, general severance policy does not apply.
Retirement, death and ill-health, injury or disability: No termination payment.
LTI awards PSP and DABP matching awards are governed by the Plan Rules as approved by shareholders.
Termination by notice: Unvested awards lapse.
Redundancy and retirement: Generally, awards vest over the original timescales, subject to the original performance conditions. Awards made in the last 12 months are forfeited.
Death and ill-health, injury or disability: Generally, awards will vest following the end of the financial year, normally taking into account performance to that date. Awards may be pro-rated for time.
In the event of a change of control, PSP and DABP matching awards will vest, taking into account performance to date and normally taking into account the proportion of the performance period that has elapsed. Alternatively, the awards may be exchanged for new awards.
Annual bonus Termination by notice by individual: If an individual serves notice and the termination date falls before 31 December, the bonus is forfeited.
Termination by notice by the company, redundancy, retirement, death and ill-health, injury or disability: If the termination date falls during the financial year, eligible for pro-rated on-target bonus (if employed on 31 December, bonus payable based on actual results).
DABP deferred bonus awards
Termination by notice: Deferred shares vest in full on the date of termination.
Redundancy, retirement, death and ill-health, injury or disability: Generally, deferred shares vest in full at the end of the financial year in which the termination date falls.
Benefits Generally, benefits will continue to apply until the termination date.
Termination by notice by the company and retirement (US executives): In line with the policy applicable to US senior executives, the Chairman, Global R&D & Vaccines may become eligible, at a future date, to receive continuing medical and dental insurance after termination/retirement.
Termination by mutual agreement: In certain circumstances it can be in the best interests of the company for the Board to manage proactively succession planning and the development of the senior talent pipeline. In such circumstances, the Board may therefore agree that an executive’s departure will be by mutual agreement. In order for this to apply, the Committee will need to be satisfied that the executive has demonstrated performance in line with expectations, where required they should have contributed to an orderly succession, and they should have completed at least 20 years’ service with the Group on the termination date. In the case of an Executive Director, they would then be treated as a ‘good leaver’ for the purposes of GSK’s long-term incentive plans. If the termination date falls during the financial year, they would be eligible for a pro-rated on-target bonus and if they are employed on 31 December, the bonus payable would be based on actual results. In the case of the CEO, as a member of the UK defined benefit pension scheme, his pension would then be payable from the later of his termination date and age 55 without actuarial reduction.

GSK Annual Report 2013 123
Termination of employment continuedThe Committee does not anticipate the exercise of discretion provided by the PSP and DABP plan rules in respect of termination payments. However, there may be unforeseen circumstances where this is in the best interests of the company and its shareholders. Where it is necessary to exercise discretion, explanations will be provided.
Where an Executive Director leaves the company, the Committee will carry out an assessment of the individual’s performance and conduct over the time in role. If it is determined that the individual’s performance or conduct was contrary to the legitimate expectations of the company, the Committee reserves the right to apply appropriate mechanisms such as ‘clawback’ (see page 119), or reduction or lapsing of outstanding incentive awards (‘malus’), to ensure that any termination payments are in the best interests of the company and its shareholders.
In the case of termination for cause, all payments and unvested awards are forfeited except shares deferred under the DABP (which vest in full on the date of termination) and accrued salary and expenses.
Service contractsThe table below sets out the relevant dates of the current Executive Directors’ service contracts, which are available for review at the company’s registered office during office hours.
Date of contract
Effective date Expiry date Notes
Sir Andrew Witty
18.06.08 22.05.08 31.08.24 Contract amended on 04.02.10 to remove entitlement to bonus on termination
Simon Dingemans
08.09.10 04.01.11 30.04.28
Dr Moncef Slaoui
21.12.10 21.12.10 01.08.19 Contract replaced on 21.12.10, principally to remove entitlement to bonus on termination
Differences between remuneration policy for Executive Directors and other employeesWhen setting remuneration levels for the Executive Directors, the Committee considers the prevailing market conditions, the competitive environment (through comparison with the remuneration of executives at companies of similar size, complexity and international reach) and the positioning and relativities of pay and employment conditions across the broader GSK workforce.
In particular, the Committee considers the range of base salary rises for the workforces of those parts of GSK where the CEO, CFO and Chairman, Global R&D & Vaccines are employed. This is considered to be the most relevant comparison as these populations reflect most closely the economic environments encountered by the individuals.
The same principles apply to the remuneration policy for Executive Directors and other employees although the remuneration offered to Executive Directors under this policy has a stronger emphasis on performance-related pay than that offered to other employees of the Group.
• Salary and benefits (including pension) are tailored to the local market.
• The annual bonus plan applies to the wider employee population and is based on business and individual performance.
• A combination of performance-related and restricted share plans applies to the wider employee population.
• All-employee share plans are available to employees in the UK, including the HM Revenue & Customs approved UK ShareSave and ShareReward Plans.
The company conducts regular employee surveys which include feedback on remuneration matters.
In the wider organisation, we have aligned our performance and reward systems with our values and introduced a new performance system in 2014 that formally evaluates employees on both ‘what’ they need to do and ‘how’ they do it. Also, for our most senior people we dis-incentivise unethical working practices using a ‘clawback’ mechanism that allows us to recover performance-related pay.

124 GSK Annual Report 2013
Governance & remuneration Directors’ Remuneration Report
Scenarios for future total remunerationThe charts opposite provide illustrations of the future total remuneration for each of the Executive Directors in respect of the remuneration opportunity granted to each of them in 2014 under the Policy. A range of potential outcomes is provided for each Executive Director and the underlying assumptions are set out below.
All scenarios:• 2014 base salary has been used.
• 2013 benefits and pension figures have been used, i.e. based on actual amounts received in 2013 in respect of the ongoing policy.
• Each Executive Director is assumed to defer 50% of their annual bonus (the maximum permitted amount) and receive the corresponding matching award under the DABP (included within the value of LTI awards).
• The amounts shown under value of LTI awards for the DABP and PSP are based on the bonus opportunity and the relevant multiples of 2014 salary respectively. They do not include amounts in respect of dividends reinvested and do not factor in changes to share price over the vesting period.
Fixed:• None of the pay for performance (annual bonus and LTI) would
be payable.
Expected:• For the annual bonus, it is assumed that target financial
performance is achieved, and the performance of each Executive Director would result in an individual performance multiplier of 100% (i.e. no increase to the financial performance element of the bonus has been applied). This results in an assumed bonus of 125%, 80% and 85% of salary for Sir Andrew Witty, Simon Dingemans and Dr Moncef Slaoui respectively.
• For the LTI awards, threshold levels of vesting are assumed.
Maximum:• It is assumed that the annual bonus would be payable at the
maximum level and that the awards under the DABP and PSP would vest in full.
12,000
CEO (£000)
10,000
8,000
6,000
4,000
2,0001,861
100%
Fixed Expected Maximum
5,477
11,647
34% 16%
25%
41%
19%
65%
CFO (£000)
923100%
Fixed Expected Maximum
2,486
5,731
37% 16%23%40%
23%
61%
Chairman, Global R&D & Vaccines($000)
2,224
100%
Fixed Expected Maximum
5,314
11,919
42% 19%
19%
39%
20%
61%
Long-term variable remuneration Annual variable remunerationFixed remuneration
0
12,000
10,000
8,000
6,000
4,000
2,000
0
12,000
10,000
8,000
6,000
4,000
2,000
0

GSK Annual Report 2013 125
Non-Executive Director remuneration policy
Element Purpose and link to strategy Overview
Chairman’s fee To provide an inclusive flat rate fee that is competitive with those paid by other companies of equivalent size and complexity subject to the limits contained in GSK’s Articles of Association.
There is no formal maximum, however, fees are reviewed annually and set by reference to a review of the Chairman’s performance and independently sourced market data.
The Remuneration Committee is responsible for evaluating and making recommendations to the Board on the fees payable to the Chairman. The Chairman does not participate in discussions in respect of his fees.
Fees can be paid in a combination of cash and/or GSK shares or ADS.
See further details of GSK’s Non-Executive Director’s share allocation plan below.
Basic fee There is no formal maximum, however, fees are reviewed annually and set by reference to independently sourced market data.
The Chairman and CEO are responsible for evaluating and making recommendations to the Board on the fees payable to the company’s Non-Executive Directors.
A minimum of 25% is delivered in the form of GSK shares or ADS.
See further details of GSK’s Non-Executive Director’s share allocation plan below.
Supplemental fees To provide additional compensation for Non-Executive Directors (excluding the Chairman) taking on additional Board responsibilities or undertaking intercontinental travel to meetings.
Additional fees for Committee Chairmen, intercontinental travel and the Senior Independent Director. Current fee levels are set out on page 109 of the Annual Report on Remuneration.
Benefits To facilitate execution of responsibilities and duties required by the role.
Travel and subsistence costs for Non-Executive Directors are incurred in the normal course of business in relation to meetings on Board and Committee matters and other GSK-hosted events. For overseas-based Non-Executive Directors, this includes travel to meetings in the UK. Non-Executive Directors may from time to time be accompanied by their spouse or partner to these meetings or events. The costs associated with the above are all met by the company and in some instances, they are deemed to be taxable and therefore treated as benefits for the Non-Executive Director.
Non-Executive Directors’ share allocation plan
To enhance the link between directors and shareholders, GSK requires Non-Executive Directors to receive a significant part of their fees in the form of GSK shares or ADS.
At least 25% of the Non-Executive Directors’ total fees, excluding those of the Chairman, are paid in the form of GSK shares or ADS and allocated to a share or ADS account.
The Non-Executive Directors may also take the opportunity to invest part or all of the balance of their fees into the same share or ADS account.
The GSK shares or ADS which are notionally awarded to the Non-Executive Directors and allocated to their interest accounts are set out in the table on page 115 and are included in the Directors’ interests table on page 110.
The accumulated balances of these GSK shares or ADS, together with the notional dividends accrued, are not paid out to Non-Executive Directors until they leave the Board. Upon leaving, the Non-Executive Directors will receive either the GSK shares or ADS, or a cash amount equivalent to the value of the GSK shares or ADS at the date of leaving, or date of payment if later.
Letter of appointment
Non-Executive Directors’ and the Chairman’s terms of engagement are set out in letters of appointment as set out in the table on page 109.
Non-Executive Directors will be subject to annual election or re-election and will normally serve no longer than nine years from the date of first election by shareholders at a general meeting.
The Chairman will be subject to annual appointment by shareholders and may serve longer than nine years from the date of first election by shareholders at a general meeting.

126 GSK Annual Report 2013
Governance & remuneration Directors’ Remuneration Report
Operation and scope of Remuneration policy The current Remuneration policy (the Policy) is set out on pages 117 to 125 and it is intended that the Policy for GSK’s Executive and Non-Executive Directors will apply from the close of the company’s Annual General Meeting on 7 May 2014 after it has been submitted by the Committee for approval by shareholders. The Committee currently intends to operate in accordance with this Policy prior to the Annual General Meeting, with the exception of the additional two-year holding period for Performance Share Plan awards which will apply to awards made in 2015 onwards.
The Committee has written this Policy principally in relation to the remuneration arrangements for the CEO, CFO and Chairman, Global R&D & Vaccines whilst taking into account the possible recruitment of a replacement or an additional Executive Director during the operation of this Policy. The Committee intends this Policy to operate for the period set out above in its entirety. However, it may after due consideration, seek to change the Policy during this period, but only if it believes it is appropriate to do so for the long-term success of the company, after consultation with shareholders and having sought shareholder approval at a general meeting.
In drafting this Policy, the Committee reserves the right to make any remuneration payments and payments for loss of office (including exercising any discretions available to it in connection with such payments) notwithstanding that they are not in line with the Policy set out above where the terms of the payment were agreed (i) before the policy came into effect or (ii) at a time when the relevant individual was not a director of the company and, in the opinion of the Committee, the payment was not in consideration for the individual becoming a director of the company. For these purposes “payments” includes the Committee satisfying awards of variable remuneration. In relation to an award over shares, the terms of the payment are “agreed” at the time the award is granted.
The Committee may also make minor amendments to the Policy set out in this report (for regulatory, exchange control, tax or administrative purposes or to take account of a change in legislation) without obtaining shareholder approval for such amendments.
Statement of consideration of shareholder views The Committee engages in regular dialogue with shareholders and holds annual meetings with GSK’s largest investors to discuss and take feedback on its remuneration policy and governance matters.
The annual meetings were held in November 2013, at which Tom de Swaan, Committee Chairman, shared updates on remuneration matters in the last 12 months and proposals for 2014 onwards. In particular this covered the changes to performance conditions applying to long-term incentives, the introduction of an additional two-year holding period for performance share awards (i.e. five years in total) which will apply to Executive Directors for awards made in 2015 onwards and policies that are now required to be disclosed in the Remuneration Policy Report.
Basis of preparationThe Directors’ Remuneration Report has been prepared in accordance with the Companies Act 2006 and The Large and Medium-sized Companies and Groups (Accounts and Reports) (Amendment) Regulations 2013 (the Regulations). In accordance with the Regulations, the following parts of the Annual Report on Remuneration are subject to audit: total remuneration figures for Executive Directors including further details for each element of remuneration (salary, benefits, annual bonus, long-term incentive awards and pension); Non-Executive Directors’ fees and emoluments received in the year; Directors’ interests in shares, including interests in GSK share plans; payments to past directors; payments for loss of office; and share ownership requirements and holdings, for which the opinion thereon is expressed on page 129. The remaining sections of the Directors’ Remuneration Report are not subject to audit nor are the pages referred to from within the audited sections.
The Directors’ Remuneration Report has been approved by the Board of Directors and signed on its behalf by
Tom de Swaan Remuneration Committee Chairman 26 February 2014

GSK Annual Report 2013 127
In this section
Directors’ statement of responsibilities 128Independent Auditor’s report 129Financial statements 132Notes to the financial statements 136Financial statements of GlaxoSmithKline plc prepared under UK GAAP 211
Financialstatements

128 GSK Annual Report 2013
Financial statements Directors’ statement of responsibilities
The Directors are responsible for preparing the Annual Report, the Remuneration Report and the Group financial statements in accordance with applicable law and regulations.
UK Company law requires the Directors to prepare financial statements for each financial year. Under that law the Directors are required to prepare the Group financial statements in accordance with International Financial Reporting Standards (IFRS) as adopted by the European Union. In preparing the Group financial statements, the Directors have also elected to comply with IFRS, as issued by the International Accounting Standards Board (IASB). Under company law the Directors must not approve the Group financial statements unless they are satisfied that they give a true and fair view of the state of affairs of the Group and of the profit or loss of the Group for that period.
In preparing those financial statements, the Directors are required to:
• select suitable accounting policies and then apply them consistently;
• make judgements and accounting estimates that are reasonable and prudent;
• state that the Group financial statements comply with IFRS as adopted by the European Union and IFRS as issued by the IASB, subject to any material departures disclosed and explained in the Group financial statements.
The Directors are responsible for keeping adequate accounting records that are sufficient to show and explain the company’s transactions and disclose with reasonable accuracy at any time the financial position of the Group and to enable them to ensure that the Group financial statements and the Remuneration Report comply with the Companies Act 2006 and Article 4 of the IAS Regulation. They are also responsible for safeguarding the assets of the Group and hence for taking reasonable steps for the prevention and detection of fraud and other irregularities.
The Group financial statements for the year ended 31 December 2013, comprising principal statements and supporting notes, are set out in ‘Financial statements’ on pages 132 to 210 of this report. The responsibilities of the auditors in relation to the Group financial statements are set out in the Independent Auditors’ report on pages 129 to 131.
The Group financial statements for the year ended 31 December 2013 are included in the Annual Report, which is published in printed form and made available on our website. The Directors are responsible for the maintenance and integrity of the Annual Report on our website in accordance with UK legislation governing the preparation and dissemination of financial statements. Access to the website is available from outside the UK, where comparable legislation may be different.
Each of the current Directors, whose names and functions are listed in the Corporate Governance section of the Annual Report 2013 confirms that, to the best of his or her knowledge:
• the Group financial statements, which have been prepared in accordance with IFRS as adopted by the EU and IFRS as issued by the IASB, give a true and fair view of the assets, liabilities, financial position and profit of the Group; and
• the Strategic Report and risk sections of the Annual Report include a fair review of the development and performance of the business and the position of the Group, together with a description of the principal risks and uncertainties that it faces.
Disclosure of information to auditorsThe Directors in office at the date of this Report have each confirmed that:
• so far as he or she is aware, there is no relevant audit information of which the company’s auditors are unaware; and
• he or she has taken all the steps that he or she ought to have taken as a Director to make himself or herself aware of any relevant audit information and to establish that the company’s auditors are aware of that information.
This confirmation is given and should be interpreted in accordance with the provisions of section 418 of the Companies Act 2006.
Going concern basisPages 58 to 74 contain information on the performance of the Group, its financial position, cash flows, net debt position and borrowing facilities. Further information, including Treasury risk management policies, exposures to market and credit risk and hedging activities, is given in Note 41 to the financial statements, ‘Financial instruments and related disclosures’. After making enquiries, the Directors have a reasonable expectation that the Group has adequate resources to continue in operational existence for the foreseeable future. For this reason, they continue to adopt the going concern basis in preparing the financial statements.
Internal controlThe Board, through the Audit & Risk Committee, has reviewed the assessment of risks and the internal control framework that operates in GSK and has considered the effectiveness of the system of internal control in operation in the Group for the year covered by this report and up to the date of its approval by the Board of Directors.
The UK Corporate Governance CodeThe Board considers that GlaxoSmithKline plc applies the principles and provisions of the UK Corporate Governance Code maintained by the Financial Reporting Council, as described in the Corporate Governance section on pages 82 to 95, and has complied with its provisions. The Board further considers that the Annual Report, taken as a whole, is fair, balanced and understandable, and provides the information necessary for shareholders to assess the Group’s performance, business model and strategy.
As required by the Financial Conduct Authority’s Listing Rules, the auditors have considered the Directors’ statement of compliance in relation to those points of the UK Corporate Governance Code which are specified for their review.
Annual ReportThe Annual Report for the year ended 31 December 2013, comprising the Report of the Directors, the Remuneration Report, the Financial statements and additional information for investors, has been approved by the Board of Directors and signed on its behalf by
Sir Christopher GentChairman26 February 2014
Directors’ statement of responsibilitiesin relation to the Group financial statements

GSK Annual Report 2013 129
Our opinion In our opinion, the Group financial statements defined below:
•giveatrueandfairviewofthestateoftheGroup’saffairsat 31 December 2013 and of the Group’s profit and cash flows for the year then ended;
•havebeenproperlypreparedinaccordancewithInternationalFinancial Reporting Standards (IFRSs) as adopted by the European Union; and
•havebeenpreparedinaccordancewiththerequirementsof the Companies Act 2006 and Article 4 of the IAS Regulation.
This opinion is to be read in the context of what we say in the remainder of this report.
Separate opinion in relation to IFRSs as issued by the IASBAs explained in Note 1 to the financial statements, the Group, in addition to applying IFRSs as adopted by the European Union, has also applied IFRSs as issued by the International Accounting Standards Board (IASB).
In our opinion, the Group financial statements comply with IFRSs as issued by the IASB.
What we have auditedThe Group financial statements, which are prepared by GlaxoSmithKline plc, comprise:
•theGroupbalancesheetat31December2013;
•theGroupincomestatementandstatementofcomprehensiveincome for the year then ended;
•theGroupstatementofchangesinequityandstatementof cash flows for the year then ended; and
•thenotestotheGroupfinancialstatements,whichincludeasummary of significant accounting policies and other explanatory information.
The financial reporting framework that has been applied in their preparation comprises applicable law and IFRSs as adopted by the European Union.
What an audit of financial statements involves We conducted our audit in accordance with International Standards on Auditing (UK and Ireland) (ISAs (UK & Ireland)). An audit involves obtaining evidence about the amounts and disclosures in the financial statements sufficient to give reasonable assurance that the financial statements are free from material misstatement, whether caused by fraud or error. This includes an assessment of:
•whethertheaccountingpoliciesareappropriatetotheGroup’scircumstances and have been consistently applied and adequately disclosed;
•thereasonablenessofsignificantaccountingestimatesmade by the Directors; and
•theoverallpresentationofthefinancialstatements.
In addition, we read all the financial and non-financial information in the Annual Report to identify material inconsistencies with the audited Group financial statements and to identify any information that is apparently materially incorrect based on, or materially inconsistent with, the knowledge acquired by us in the course of performing the audit. If we become aware of any apparent material misstatements or inconsistencies, we consider the implications for our report.
Overview of our audit approach
MaterialityWe set certain thresholds for materiality. These helped us to determine the nature, timing and extent of our audit procedures and to evaluate the effect of misstatements, both individually and on the financial statements as a whole.
Based on our professional judgement, we determined materiality for the Group financial statements as a whole to be £332 million which represents 5% of profit before taxation.
We agreed with the Audit & Risk Committee that we would report to them misstatements identified during our audit above £10 million as well as misstatements below that amount that, in our view, warranted reporting for qualitative reasons.
Overview of the scope of our auditThe Group financial statements are a consolidation of reporting units, comprising the Group’s operating businesses and centralised functions.
In establishing the overall approach to the Group audit, we determined the type of work that needed to be performed at the reporting units by us, as the Group audit team, or by component auditors within PwC UK and from other PwC network firms operating under our instruction. Where the work was performed by component auditors, we determined the level of involvement we needed to have in the audit work at those reporting units to be able to conclude whether sufficient appropriate audit evidence had been obtained as a basis for our opinion on the Group financial statements as a whole.
We identified 28 reporting units which, in our view, required an audit of their complete financial information, either due to their size or their risk characteristics. Specific audit procedures on certain specified balances and transactions were performed at a further 26 reporting units. Together with additional procedures performed at the Group level, this gave us the evidence that we needed for our opinion on the Group financial statements as a whole.
Areas of particular audit focusIn preparing the financial statements, the Directors made a number of subjective judgements, for example in respect of significant accounting estimates that involved making assumptions and considering future events that are inherently uncertain. We primarily focused our work in these areas by assessing the Directors’ judgements against available evidence, forming our own judgements and evaluating the disclosures in the financial statements.
In our audit, we tested and examined information, using sampling and other auditing techniques, to the extent we considered necessary to provide a reasonable basis for us to draw conclusions. We obtained audit evidence through testing the effectiveness of controls, substantive procedures or a combination of both.
We considered the following areas to be those that required particular focus in the current year. This is not a complete list of all risks or areas of focus identified by our audit. We discussed these areas of focus with the Audit & Risk Committee. Their report on those matters that they considered to be significant issues in relation to the financial statements is set out on page 91.
Independent Auditors’ reportto the members of GlaxoSmithKline plc

130 GSK Annual Report 2013
Financial statements Independent Auditors’ report
Independent Auditors’ report continued
Area of focus How the scope of our audit addressed the area of focus
Rebates, discounts, allowances and returns in the US Pharmaceuticals and Vaccines businessWe focused on this area because rebates, discounts, allowances and returns arrangements for the US Pharmaceuticals and Vaccines business are complex and because establishing an appropriate accrual requires significant judgement and estimates by the Directors. The Directors have determined an accrual of £1.2 billion to be necessary at 31 December 2013.
We tested the calculation of the accruals, validating assumptions by reference to third party data and assessing the judgements taken for reasonableness against historical trends.
We also evaluated the design and operating effectiveness of controls in the rebates, discounts, allowances and returns process.
Core Business Services As part of the simplification of its operating model, the Group has continued the roll-out of an enterprise-wide resource planning system (ERP). In addition, financial transaction processing has been centralised at business process outsourcing locations (BPOs) and other accounting services have been centralised at business service centres (BSCs).
Consequently, 2013 has been a year of significant change for the finance function. As such, we identified a heightened risk that control design and operation might be impacted during this period of transition.
We evaluated the design and tested the operating effectiveness of key controls both before and after the migration to the centralised processing environment. We tested the accuracy and completeness of data migration into the new ERP and the controls over this process.
We managed and directed centrally the audit work performed by component auditors at the BPOs and BSCs and performed oversight visits to the significant entities that were impacted by these changes in 2013.
Potential implications of alleged illegal actsFollowing the allegations by the Chinese authorities of illegal acts by the Group’s Chinese business, we identified the following risks:•Thattheallegedillegalactsmightgiveriseto
fines or other legal penalties (in the event that the allegations are proven) which have not been appropriately recorded or measured in the financial statements;
•ThatthecarryingvalueofassetsintheGroup’sChinese business is not supportable in light of the subsequent decline in trading and the potential impact on future business; and
•Thatillegalactssimilartothoseallegedtohaveoccurred in China have occurred elsewhere in the Group.
Refer to Note 44 to the Group financial statements.
We considered the ongoing work of the independent investigators appointed by the Company and assessed whether their scope is sufficient and whether the results of the investigation to date support the Directors’ conclusions.
We performed oversight visits to China to review the approach and testing results of the component auditor.
We assessed the Directors’ determination that it is not possible to reliably estimate the financial effect, if any, of these allegations or its timing.
We assessed the reasonableness of the assumptions and trading forecasts that the Directors used to support the carrying value of assets in the Chinese business.
We performed additional audit tests at certain locations outside of China, which were designed to evaluate whether the practices alleged in China occurred at other locations across the Group.
Fraud in revenue recognitionThere is a presumed risk of fraud in revenue recognition in ISAs (UK & Ireland) because of the pressure that management may feel to achieve the planned results.
We focused on the validity of revenue recognised close to the year-end as well as the accruals for rebates, discounts, allowances and returns where calculations can be complex and involve estimation.
We evaluated the relevant IT systems and tested the internal controls over the validity and timing of revenue recognised in the financial statements as well as the completeness of accruals for rebates, discounts, allowances and returns. We also tested journal entries posted to revenue accounts and on consolidation to identify unusual or irregular items.
We assessed the accounting for material new agreements, trading arrangements (with customers and wholesalers) and one-off transactions.
We performed year-end sales cut-off testing to check that revenue was recorded in the correct period.
Risk of management override of internal controlsISAs (UK & Ireland) require that we consider this risk.
We assessed the overall control environment of the Group, including the arrangements for staff to “whistle-blow” inappropriate actions and we interviewed senior management and the Group’s internal audit function. We examined the significant accounting estimates and judgements relevant to the financial statements for evidence of bias by the Directors that may represent a risk of material misstatement due to fraud. We also tested journal entries including consolidation entries.
This was in addition to the audit work described above in relation to alleged illegal acts and fraud in revenue recognition.
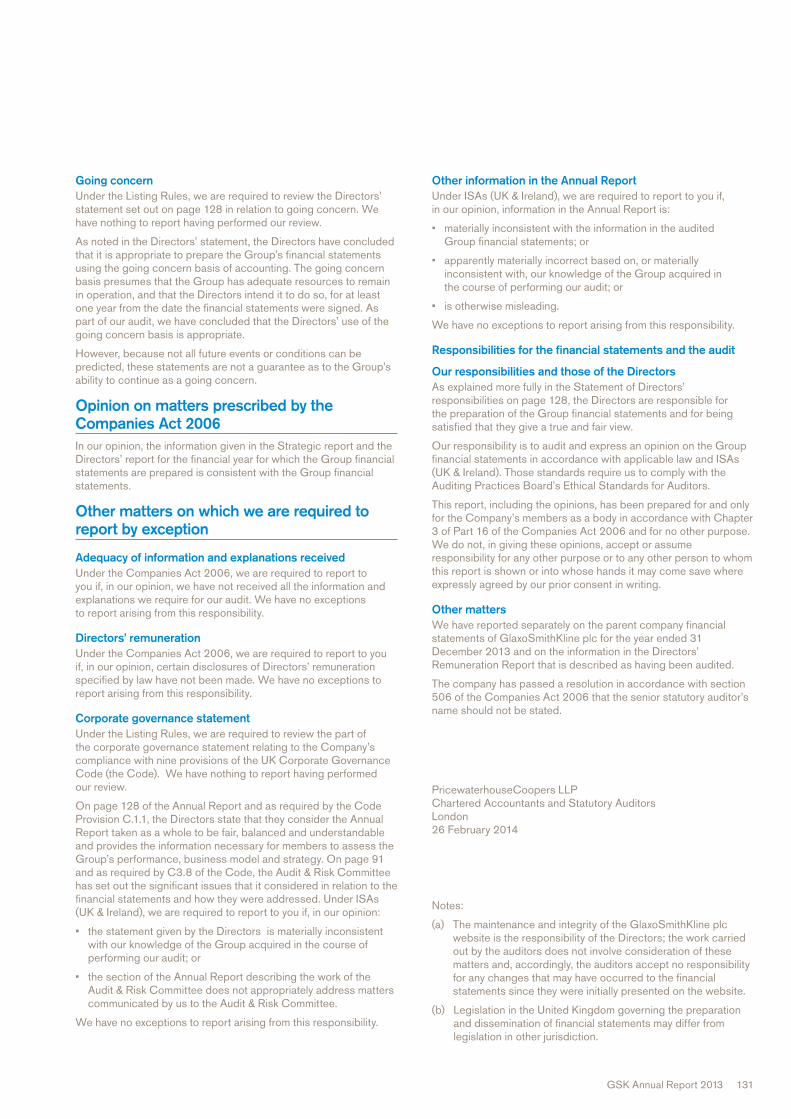
GSK Annual Report 2013 131
Going concern Under the Listing Rules, we are required to review the Directors’ statement set out on page 128 in relation to going concern. We have nothing to report having performed our review.
As noted in the Directors’ statement, the Directors have concluded that it is appropriate to prepare the Group’s financial statements using the going concern basis of accounting. The going concern basis presumes that the Group has adequate resources to remain in operation, and that the Directors intend it to do so, for at least one year from the date the financial statements were signed. As part of our audit, we have concluded that the Directors’ use of the going concern basis is appropriate.
However, because not all future events or conditions can be predicted, these statements are not a guarantee as to the Group’s ability to continue as a going concern.
Opinion on matters prescribed by the Companies Act 2006In our opinion, the information given in the Strategic report and the Directors’ report for the financial year for which the Group financial statements are prepared is consistent with the Group financial statements.
Other matters on which we are required to report by exception
Adequacy of information and explanations receivedUnder the Companies Act 2006, we are required to report to you if, in our opinion, we have not received all the information and explanations we require for our audit. We have no exceptions to report arising from this responsibility.
Directors’ remunerationUnder the Companies Act 2006, we are required to report to you if, in our opinion, certain disclosures of Directors’ remuneration specified by law have not been made. We have no exceptions to report arising from this responsibility.
Corporate governance statementUnder the Listing Rules, we are required to review the part of the corporate governance statement relating to the Company’s compliance with nine provisions of the UK Corporate Governance Code (the Code). We have nothing to report having performed our review.
On page 128 of the Annual Report and as required by the Code Provision C.1.1, the Directors state that they consider the Annual Report taken as a whole to be fair, balanced and understandable and provides the information necessary for members to assess the Group’s performance, business model and strategy. On page 91 and as required by C3.8 of the Code, the Audit & Risk Committee has set out the significant issues that it considered in relation to the financial statements and how they were addressed. Under ISAs (UK & Ireland), we are required to report to you if, in our opinion:
•thestatementgivenbytheDirectorsismateriallyinconsistentwith our knowledge of the Group acquired in the course of performing our audit; or
•thesectionoftheAnnualReportdescribingtheworkoftheAudit & Risk Committee does not appropriately address matters communicated by us to the Audit & Risk Committee.
We have no exceptions to report arising from this responsibility.
Other information in the Annual ReportUnder ISAs (UK & Ireland), we are required to report to you if, in our opinion, information in the Annual Report is:
•materiallyinconsistentwiththeinformationintheaudited Group financial statements; or
•apparentlymateriallyincorrectbasedon,ormateriallyinconsistent with, our knowledge of the Group acquired in the course of performing our audit; or
•isotherwisemisleading.
We have no exceptions to report arising from this responsibility.
Responsibilities for the financial statements and the audit
Our responsibilities and those of the Directors As explained more fully in the Statement of Directors’ responsibilities on page 128, the Directors are responsible for the preparation of the Group financial statements and for being satisfied that they give a true and fair view.
Our responsibility is to audit and express an opinion on the Group financial statements in accordance with applicable law and ISAs (UK & Ireland). Those standards require us to comply with the Auditing Practices Board’s Ethical Standards for Auditors.
This report, including the opinions, has been prepared for and only for the Company’s members as a body in accordance with Chapter 3 of Part 16 of the Companies Act 2006 and for no other purpose. We do not, in giving these opinions, accept or assume responsibility for any other purpose or to any other person to whom this report is shown or into whose hands it may come save where expressly agreed by our prior consent in writing.
Other matters We have reported separately on the parent company financial statements of GlaxoSmithKline plc for the year ended 31 December 2013 and on the information in the Directors’ Remuneration Report that is described as having been audited.
The company has passed a resolution in accordance with section 506 of the Companies Act 2006 that the senior statutory auditor’s name should not be stated.
PricewaterhouseCoopers LLPChartered Accountants and Statutory AuditorsLondon26 February 2014
Notes:
(a) The maintenance and integrity of the GlaxoSmithKline plc website is the responsibility of the Directors; the work carried out by the auditors does not involve consideration of these matters and, accordingly, the auditors accept no responsibility for any changes that may have occurred to the financial statements since they were initially presented on the website.
(b) Legislation in the United Kingdom governing the preparation and dissemination of financial statements may differ from legislation in other jurisdiction.
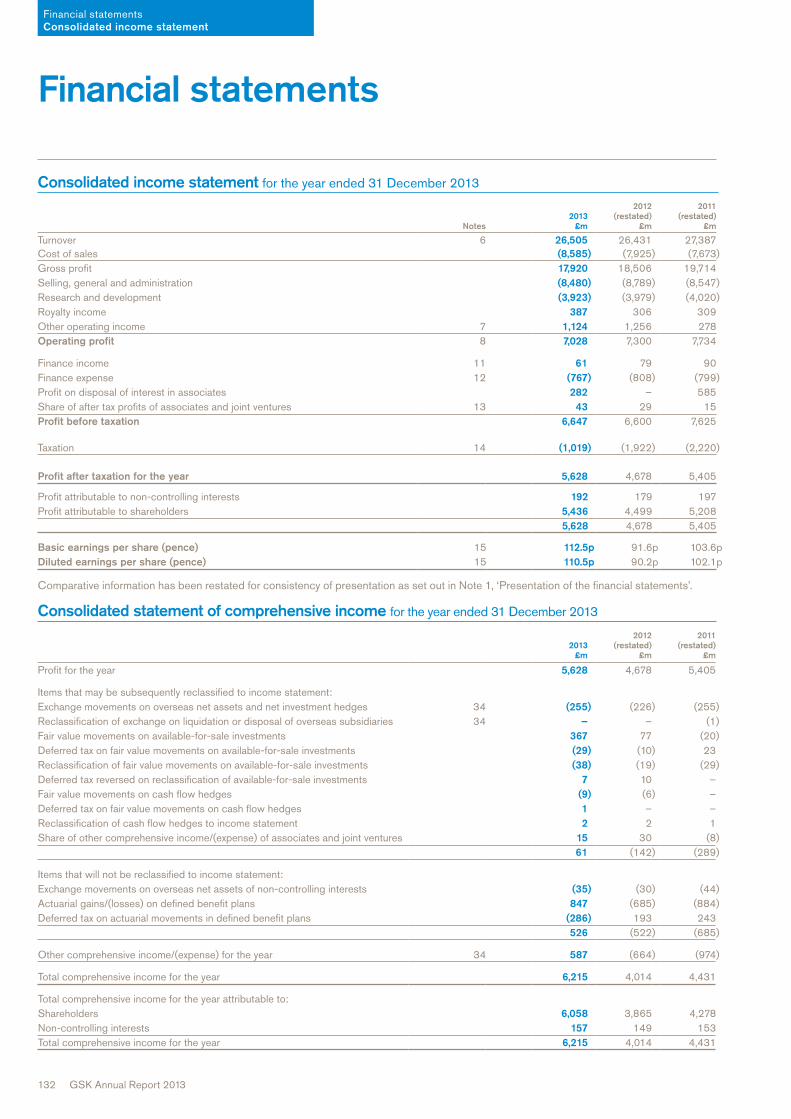
132 GSK Annual Report 2013
Financial statements Consolidated income statement
Notes2013
£m
2012 (restated)
£m
2011 (restated)
£m
Turnover 6 26,505 26,431 27,387Cost of sales (8,585) (7,925) (7,673)Gross profit 17,920 18,506 19,714Selling, general and administration (8,480) (8,789) (8,547)Research and development (3,923) (3,979) (4,020)Royalty income 387 306 309Other operating income 7 1,124 1,256 278Operating profit 8 7,028 7,300 7,734
Finance income 11 61 79 90Finance expense 12 (767) (808) (799)Profit on disposal of interest in associates 282 – 585Share of after tax profits of associates and joint ventures 13 43 29 15Profit before taxation 6,647 6,600 7,625
Taxation 14 (1,019) (1,922) (2,220)
Profit after taxation for the year 5,628 4,678 5,405
Profit attributable to non-controlling interests 192 179 197Profit attributable to shareholders 5,436 4,499 5,208
5,628 4,678 5,405
Basic earnings per share (pence) 15 112.5p 91.6p 103.6pDiluted earnings per share (pence) 15 110.5p 90.2p 102.1p
Comparative information has been restated for consistency of presentation as set out in Note 1, ‘Presentation of the financial statements’.
Consolidated statement of comprehensive income for the year ended 31 December 2013
2013
£m
2012 (restated)
£m
2011 (restated)
£m
Profit for the year 5,628 4,678 5,405
Items that may be subsequently reclassified to income statement:Exchange movements on overseas net assets and net investment hedges 34 (255) (226) (255)Reclassification of exchange on liquidation or disposal of overseas subsidiaries 34 – – (1)Fair value movements on available-for-sale investments 367 77 (20)Deferred tax on fair value movements on available-for-sale investments (29) (10) 23Reclassification of fair value movements on available-for-sale investments (38) (19) (29)Deferred tax reversed on reclassification of available-for-sale investments 7 10 –Fair value movements on cash flow hedges (9) (6) –Deferred tax on fair value movements on cash flow hedges 1 – –Reclassification of cash flow hedges to income statement 2 2 1Share of other comprehensive income/(expense) of associates and joint ventures 15 30 (8)
61 (142) (289)
Items that will not be reclassified to income statement:Exchange movements on overseas net assets of non-controlling interests (35) (30) (44)Actuarial gains/(losses) on defined benefit plans 847 (685) (884)Deferred tax on actuarial movements in defined benefit plans (286) 193 243
526 (522) (685)
Other comprehensive income/(expense) for the year 34 587 (664) (974)
Total comprehensive income for the year 6,215 4,014 4,431
Total comprehensive income for the year attributable to:Shareholders 6,058 3,865 4,278Non-controlling interests 157 149 153Total comprehensive income for the year 6,215 4,014 4,431
Consolidated income statement for the year ended 31 December 2013
Financial statements

GSK Annual Report 2013 133
Notes
2013
£m
2012 (restated)
£m
Non-current assetsProperty, plant and equipment 17 8,872 8,776Goodwill 18 4,205 4,359Other intangible assets 19 9,283 10,161Investments in associates and joint ventures 20 323 579Other investments 21 1,202 787Deferred tax assets 14 2,084 2,391Derivative financial instruments 41 1 54Other non-current assets 22 889 682Total non-current assets 26,859 27,789
Current assetsInventories 23 3,900 3,969Current tax recoverable 14 129 103Trade and other receivables 24 5,442 5,242Derivative financial instruments 41 155 49Liquid investments 32 66 81Cash and cash equivalents 25 5,534 4,184Assets held for sale 26 1 64Total current assets 15,227 13,692Total assets 42,086 41,481
Current liabilitiesShort-term borrowings 32 (2,789) (3,631)Trade and other payables 27 (8,317) (8,054)Derivative financial instruments 41 (127) (63)Current tax payable 14 (1,452) (1,374)Short-term provisions 29 (992) (693)Total current liabilities (13,677) (13,815)
Non-current liabilitiesLong-term borrowings 32 (15,456) (14,671)Deferred tax liabilities 14 (693) (1,004)Pensions and other post-employment benefits 28 (2,189) (3,121)Other provisions 29 (552) (699)Derivative financial instruments 41 (3) (2)Other non-current liabilities 30 (1,704) (1,432)Total non-current liabilities (20,597) (20,929)Total liabilities (34,274) (34,744)Net assets 7,812 6,737
EquityShare capital 33 1,336 1,349Share premium account 33 2,595 2,022Retained earnings 34 913 642Other reserves 34 2,153 1,787Shareholders’ equity 6,997 5,800Non-controlling interests 815 937Total equity 7,812 6,737
The financial statements on pages 132 to 210 were approved by the Board on 26 February 2014 and signed on its behalf by
Sir Christopher Gent Chairman
Consolidated balance sheet as at 31 December 2013

134 GSK Annual Report 2013
Financial statements Consolidated statement of changes in equity
Shareholders’ equity
Share
capital £m
Share
premium £m
Retained earnings
(restated) £m
Other
reserves £m
Total (restated)
£m
Non-controlling
interests £m
Total equity
(restated)£m
At 1 January 2011 as previously reported 1,418 1,428 4,779 1,262 8,887 858 9,745Prior year adjustment - IAS 19 – – (20) – (20) – (20)At 1 January 2011 as restated 1,418 1,428 4,759 1,262 8,867 858 9,725
Profit for the year – – 5,208 – 5,208 197 5,405 Other comprehensive expense for the year – – (909) (21) (930) (44) (974)Total comprehensive income for the year – – 4,299 (21) 4,278 153 4,431
Distributions to non-controlling interests – – – – – (234) (234)Dividends to shareholders – – (3,406) – (3,406) – (3,406)Changes in non-controlling interests – – – – – 18 18 Forward contract relating to non-controlling interest – – – (29) (29) – (29)Ordinary shares issued 5 245 – – 250 – 250Ordinary shares purchased and cancelled or held as Treasury shares (36) – (2,191) 36 (2,191) – (2,191)Ordinary shares acquired by ESOP Trusts – – – (36) (36) – (36 )Ordinary shares transferred by ESOP Trusts – – – 45 45 – 45Write-down of shares held by ESOP Trusts – – (345) 345 – – – Share-based incentive plans – – 191 – 191 – 191 Tax on share-based incentive plans – – 50 – 50 – 50 At 31 December 2011 1,387 1,673 3,357 1,602 8,019 795 8,814
Profit for the year – – 4,499 – 4,499 179 4,678 Other comprehensive expense for the year – – (665) 31 (634) (30) (664)Total comprehensive income for the year – – 3,834 31 3,865 149 4,014
Distributions to non-controlling interests – – – – – (171) (171)Dividends to shareholders – – (3,814) – (3,814) – (3,814)Changes in non-controlling interests – – (382) – (382) 164 (218)Forward contract relating to non-controlling interest – – – 8 8 – 8Ordinary shares issued 7 349 – – 356 – 356Ordinary shares purchased and cancelled or held as Treasury shares (45) – (2,493) 45 (2,493) – (2,493)Ordinary shares acquired by ESOP Trusts – – – (37) (37) – (37)Ordinary shares transferred by ESOP Trusts – – – 58 58 – 58Write-down of shares held by ESOP Trusts – – (80) 80 – – –Share-based incentive plans – – 211 – 211 – 211Tax on share-based incentive plans – – 9 – 9 – 9At 31 December 2012 1,349 2,022 642 1,787 5,800 937 6,737
Profit for the year – – 5,436 – 5,436 192 5,628 Other comprehensive income/(expense) for the year – – 316 306 622 (35) 587Total comprehensive income for the year – – 5,752 306 6,058 157 6,215
Distributions to non-controlling interests – – – – – (238) (238)Dividends to shareholders – – (3,680) – (3,680) – (3,680)Changes in non-controlling interests – – (584) – (584) (41) (625)Ordinary shares issued 12 573 – – 585 – 585Ordinary shares purchased and cancelled or held as Treasury shares (25) – (1,504) 25 (1,504) – (1,504)Ordinary shares acquired by ESOP Trusts – – – (45) (45) – (45)Write-down of shares held by ESOP Trusts – – (80) 80 – – –Share-based incentive plans – – 294 – 294 – 294Tax on share-based incentive plans – – 73 – 73 – 73At 31 December 2013 1,336 2,595 913 2,153 6,997 815 7,812
Consolidated statement of changes in equity for the year ended 31 December 2013

GSK Annual Report 2013 135
Notes
2013
£m
2012 (restated)
£m
2011 (restated)
£m
Cash flow from operating activitiesProfit after taxation for the year 5,628 4,678 5,405 Adjustments reconciling profit after tax to operating cash flows 36 2,871 1,370 2,308Cash generated from operations 8,499 6,048 7,713 Taxation paid (1,277) (1,673) (1,463)Net cash inflow from operating activities 7,222 4,375 6,250
Cash flow from investing activitiesPurchase of property, plant and equipment (1,188) (1,051) (923)Proceeds from sale of property, plant and equipment 46 68 100 Purchase of intangible assets (513) (469) (405)Proceeds from sale of intangible assets 136 1,056 237Purchase of equity investments (133) (229) (76)Proceeds from sale of equity investments 59 28 68 Purchase of businesses, net of cash acquired 38 (247) (2,235) (264)Disposal of businesses 38 1,851 – –Investments in associates and joint ventures 20 (8) (99) (35)Proceeds from disposal of subsidiary and interest in associate 429 – 1,034 Decrease in liquid investments 15 224 30 Interest received 59 30 97 Dividends from associates and joint ventures 18 46 25 Net cash inflow/(outflow) from investing activities 524 (2,631) (112)
Cash flow from financing activitiesProceeds from own shares for employee share options – 58 45Shares acquired by ESOP Trusts (45) (37) (36)Issue of share capital 33 585 356 250 Purchase of own shares for cancellation or to be held as Treasury shares (1,504) (2,493) (2,191)Purchase of non-controlling interests (588) (14) –Increase in long-term loans 1,913 4,430 –Increase in short-term loans – 1,743 45 Repayment of short-term loans (1,872) (2,559) (8)Net repayment of obligations under finance leases (31) (35) (38)Interest paid (749) (779) (769)Dividends paid to shareholders (3,680) (3,814) (3,406)Distributions to non-controlling interests (238) (171) (234)Other financing cash flows (64) (36) 110 Net cash outflow from financing activities (6,273) (3,351) (6,232)
Increase/(decrease) in cash and bank overdrafts 37 1,473 (1,607) (94)
Cash and bank overdrafts at beginning of year 3,906 5,605 5,807Exchange adjustments (148) (92) (108)Increase/(decrease) in cash and bank overdrafts 1,473 (1,607) (94)Cash and bank overdrafts at end of year 5,231 3,906 5,605
Cash and bank overdrafts at end of year comprise:Cash and cash equivalents 5,534 4,184 5,714 Overdrafts (303) (278) (109 )
5,231 3,906 5,605
Consolidated cash flow statement for the year ended 31 December 2013

136 GSK Annual Report 2013
Financial statements Notes to the financial statements
1 Presentation of the financial statements
Description of businessGlaxoSmithKline is a major global healthcare group which is engaged in the creation and discovery, development, manufacture and marketing of pharmaceutical products including vaccines, over-the-counter (OTC) medicines and health-related consumer products. GSK’s principal pharmaceutical products include medicines in the following therapeutic areas: respiratory, anti-virals, central nervous system, cardiovascular and urogenital, metabolic, anti-bacterials, oncology and emesis, dermatology, rare diseases, immuno-inflammation, vaccines and HIV.
Compliance with applicable law and IFRSThe financial statements have been prepared in accordance with the Companies Act 2006, Article 4 of the IAS Regulation and International Accounting Standards (IAS) and International Financial Reporting Standards (IFRS) and related interpretations, as adopted by the European Union.
The financial statements are also in compliance with IFRS as issued by the International Accounting Standards Board.
Composition of financial statements The consolidated financial statements are drawn up in Sterling, the functional currency of GlaxoSmithKline plc, and in accordance with IFRS accounting presentation. The financial statements comprise:
• Consolidated income statement
• Consolidated statement of comprehensive income
• Consolidated balance sheet
• Consolidated statement of changes in equity
• Consolidated cash flow statement
• Notes to the financial statements.
Composition of the GroupA list of the subsidiary and associated undertakings which, in the opinion of the Directors, principally affected the amount of profit or the net assets of the Group is given in Note 43, ‘Principal Group companies’.
Accounting principles and policiesThe financial statements have been prepared using the historical cost convention modified by the revaluation of certain items, as stated in the accounting policies, and on a going concern basis.
The financial statements have been prepared in accordance with the Group’s accounting policies approved by the Board and described in Note 2, ‘Accounting principles and policies’. Information on the application of these accounting policies, including areas of estimation and judgement is given in Note 3, ‘Key accounting judgements and estimates’.
The preparation of the financial statements in conformity with generally accepted accounting principles requires management to make estimates and assumptions that affect the reported amounts of assets and liabilities and disclosure of contingent assets and liabilities at the date of the financial statements and the reported amounts of revenues and expenses during the reporting period. Actual results could differ from those estimates.
Implementation of new accounting standardsAn amendment to IAS 19 ‘Employee benefits’ was issued in June 2011 and was implemented by GSK from 1 January 2013. The amendment eliminates the ability to defer the recognition of gains and losses (the ‘corridor’ method), requires remeasurements to be presented in other comprehensive income, requires past service cost to be recognised in the income statement in the year of the plan amendment rather than deferring the portion related to unvested benefits, requires the return on plan assets recognised in the income statement to be calculated using the same rate as the discount rate applied to the pension obligation and makes several other minor accounting and disclosure changes.
The revised Standard increased the pension charge in 2013 by approximately £160 million. Comparative periods have been restated and as a result the pension charge for 2012 has increased by £92 million and for 2011 by £73 million.
In addition, the following new or amended accounting standards have been implemented in 2013. These had no material impact on the current period:
• IFRS 10 ‘Consolidated financial statements’
• IFRS 11 ‘Joint arrangements’
• IFRS 12 ‘Disclosures of interests in other entities’
• IFRS 13 ‘Fair value measurement’
• IAS 1 ‘Presentation of items of other comprehensive income’
• IAS 28 ‘Investments in associates and joint ventures’
• IFRS 7 ‘Disclosures – Offsetting financial assets and financial liabilities’.
The Group has also adopted early an amendment to IAS 36 ‘Impairment of Assets’ in relation to recoverable amount disclosures for non-financial assets, with effect from 1 January 2013.
Financial periodThese financial statements cover the financial year from 1 January to 31 December 2013, with comparative figures for the financial years from 1 January to 31 December 2012 and, where appropriate, from 1 January to 31 December 2011.
Parent company financial statementsThe financial statements of the parent company, GlaxoSmithKline plc, have been prepared in accordance with UK GAAP and with UK accounting presentation. The company balance sheet is presented on page 213 and the accounting policies are given on page 214.
2 Accounting principles and policies
Consolidation The consolidated financial statements include:
• the assets and liabilities, and the results and cash flows, of the company and its subsidiaries, including ESOP Trusts
• the Group’s share of the results and net assets of associates and joint ventures
• the Group’s share of assets, liabilities, revenue and expenses of joint operations.
The financial statements of entities consolidated are made up to 31 December each year.
Notes to the financial statements

GSK Annual Report 2013 137
2 Accounting principles and policies continuedEntities over which the Group has the power to direct the relevant activities so as to affect the returns to the Group, generally through control over the financial and operating policies, are accounted for as subsidiaries. Where the Group has the ability to exercise joint control over, and rights to the net assets of, entities, the entities are accounted for as joint ventures. Where the Group has the ability to exercise joint control over an arrangement, but has rights to specified assets and obligations for specified liabilities of the arrangement, the arrangement is accounted for as a joint operation. Where the Group has the ability to exercise significant influence over entities, they are accounted for as associates. The results and assets and liabilities of associates and joint ventures are incorporated into the consolidated financial statements using the equity method of accounting. The Group’s rights to assets, liabilities, revenue and expenses of joint operations are included in the consolidated financial statements in accordance with those rights and obligations.
Interests acquired in entities are consolidated from the date the Group acquires control and interests sold are de-consolidated from the date control ceases.
Transactions and balances between subsidiaries are eliminated and no profit before tax is taken on sales between subsidiaries until the products are sold to customers outside the Group. The relevant proportion of profits on transactions with joint ventures, joint operations and associates is also deferred until the products are sold to third parties. Transactions with non-controlling interests are recorded directly in equity. Deferred tax relief on unrealised intra-Group profit is accounted for only to the extent that it is considered recoverable.
Goodwill is capitalised as a separate item in the case of subsidiaries and as part of the cost of investment in the case of joint ventures and associates. Goodwill is denominated in the currency of the operation acquired.
Where the cost of acquisition is below the fair value of the net assets acquired, the difference is recognised directly in the income statement.
Business combinationsBusiness combinations are accounted for using the acquisition accounting method. Identifiable assets, liabilities and contingent liabilities acquired are measured at fair value at acquisition date. The consideration transferred is measured at fair value and includes the fair value of any contingent consideration. Where the consideration transferred, together with the non-controlling interest, exceeds the fair value of the net assets, liabilities and contingent liabilities acquired, the excess is recorded as goodwill. The costs of acquisition are charged to the income statement in the period in which they are incurred.
Where not all of the equity of a subsidiary is acquired the non-controlling interest is recognised either at fair value or at the non-controlling interest’s share of the net assets of the subsidiary, on a case-by-case basis. Changes in the Group’s ownership percentage of subsidiaries are accounted for within equity.
Foreign currency translation Foreign currency transactions are booked in the functional currency of the Group company at the exchange rate ruling on the date of transaction. Foreign currency monetary assets and liabilities are retranslated into the functional currency at rates of exchange ruling at the balance sheet date. Exchange differences are included in the income statement.
On consolidation, assets and liabilities, including related goodwill, of overseas subsidiaries, associates and joint ventures, are translated into Sterling at rates of exchange ruling at the balance sheet date. The results and cash flows of overseas subsidiaries, associates and joint ventures are translated into Sterling using average rates of exchange.
Exchange adjustments arising when the opening net assets and the profits for the year retained by overseas subsidiaries, associates and joint ventures are translated into Sterling, less exchange differences arising on related foreign currency borrowings which hedge the Group’s net investment in these operations, are taken to a separate component of equity.
When translating into Sterling the assets, liabilities, results and cash flows of overseas subsidiaries, associates and joint ventures which are reported in currencies of hyper-inflationary economies, adjustments are made where material to reflect current price levels. Any loss on net monetary assets is charged to the consolidated income statement.
RevenueRevenue is recognised in the income statement when goods or services are supplied or made available to external customers against orders received, title and risk of loss is passed to the customer, reliable estimates can be made of relevant deductions and all relevant obligations have been fulfilled, such that the earnings process is regarded as being complete.
Turnover represents net invoice value after the deduction of discounts and allowances given and accruals for estimated future rebates and returns. The methodology and assumptions used to estimate rebates and returns are monitored and adjusted regularly in the light of contractual and legal obligations, historical trends, past experience and projected market conditions. Market conditions are evaluated using wholesaler and other third-party analyses, market research data and internally generated information. Value added tax and other sales taxes are excluded from revenue.
Where the Group co-promotes a product and the counterparty records the sale, the Group records its share of revenue as co-promotion income within turnover. The nature of co-promotion activities is such that the Group records no costs of sales. Pharmaceutical turnover includes co-promotion revenue of £37 million (2012 – £234 million; 2011 – £221 million). In addition, initial or event-based milestone income (excluding royalty income) arising on development or marketing collaborations of the Group’s compounds or products with other parties is recognised in turnover. Milestone income of £78 million is included in turnover in 2013.
Royalty income is recognised on an accruals basis in accordance with the terms of the relevant licensing agreements.
ExpenditureExpenditure is recognised in respect of goods and services received when supplied in accordance with contractual terms. Provision is made when an obligation exists for a future liability in respect of a past event and where the amount of the obligation can be reliably estimated. Manufacturing start-up costs between validation and the achievement of normal production are expensed as incurred. Advertising and promotion expenditure is charged to the income statement as incurred. Shipment costs on inter-company transfers are charged to cost of sales; distribution costs on sales to customers are included in selling, general and administrative expenditure.
Restructuring costs are recognised and provided for, where appropriate, in respect of the direct expenditure of a business reorganisation where the plans are sufficiently detailed and well advanced, and where appropriate communication to those affected has been undertaken.

138 GSK Annual Report 2013
Financial statements Notes to the financial statements
2 Accounting principles and policies continued
Research and development Research and development expenditure is charged to the income statement in the period in which it is incurred. Development expenditure is capitalised when the criteria for recognising an asset are met, usually when a regulatory filing has been made in a major market and approval is considered highly probable. Property, plant and equipment used for research and development is capitalised and depreciated in accordance with the Group’s policy.
Environmental expenditureEnvironmental expenditure related to existing conditions resulting from past or current operations and from which no current or future benefit is discernible is charged to the income statement. The Group recognises its liability on a site-by-site basis when it can be reliably estimated. This liability includes the Group’s portion of the total costs and also a portion of other potentially responsible parties’ costs when it is probable that they will not be able to satisfy their respective shares of the clean-up obligation. Recoveries of reimbursements are recorded as assets when virtually certain.
Legal and other disputesProvision is made for the anticipated settlement costs of legal or other disputes against the Group where an outflow of resources is considered probable and a reliable estimate can be made of the likely outcome. In addition, provision is made for legal or other expenses arising from claims received or other disputes. In respect of product liability claims related to certain products, there is sufficient history of claims made and settlements to enable management to make a reliable estimate of the provision required to cover unasserted claims. In certain cases, an incurred but not reported (IBNR) actuarial technique is used to determine this estimate.
The Group may become involved in legal proceedings, in respect of which it is not possible to make a reliable estimate of the expected financial effect, if any, that could result from ultimate resolution of the proceedings. In these cases, appropriate disclosure about such cases would be included but no provision would be made. Costs associated with claims made by the Group against third parties are charged to the income statement as they are incurred.
Pensions and other post-employment benefitsThe costs of providing pensions under defined benefit schemes are calculated using the projected unit credit method and spread over the period during which benefit is expected to be derived from the employees’ services, consistent with the advice of qualified actuaries. Pension obligations are measured as the present value of estimated future cash flows discounted at rates reflecting the yields of high quality corporate bonds. Pension scheme assets are measured at fair value at the balance sheet date.
The costs of other post-employment liabilities are calculated in a similar way to defined benefit pension schemes and spread over the period during which benefit is expected to be derived from the employees’ services, in accordance with the advice of qualified actuaries.
Actuarial gains and losses and the effect of changes in actuarial assumptions, are recognised in the statement of comprehensive income in the year in which they arise.
The Group’s contributions to defined contribution plans are charged to the income statement as incurred.
Employee share plansIncentives in the form of shares are provided to employees under share option and share award schemes.
The fair values of these options and awards are calculated at their grant dates using a Black-Scholes option pricing model and charged to the income statement over the relevant vesting periods.
The Group provides finance to ESOP Trusts to purchase company shares on the open market to meet the obligation to provide shares when employees exercise their options or awards. Costs of running the ESOP Trusts are charged to the income statement. Shares held by the ESOP Trusts are deducted from other reserves. A transfer is made between other reserves and retained earnings over the vesting periods of the related share options or awards to reflect the ultimate proceeds receivable from employees on exercise.
Property, plant and equipmentProperty, plant and equipment (PP&E) is stated at the cost of purchase or construction less provisions for depreciation and impairment. Financing costs are capitalised within the cost of qualifying assets in construction.
Depreciation is calculated to write off the cost less residual value of PP&E, excluding freehold land, using the straight-line basis over the expected useful life. Residual values and lives are reviewed, and where appropriate adjusted, annually. The normal expected useful lives of the major categories of PP&E are:
Freehold buildings 20 to 50 yearsLeasehold land and buildings Lease term or 20 to 50 yearsPlant and machinery 10 to 20 yearsEquipment and vehicles 3 to 10 years
On disposal of PP&E, the cost and related accumulated depreciation and impairments are removed from the financial statements and the net amount, less any proceeds, is taken to the income statement.
LeasesLeasing agreements which transfer to the Group substantially all the benefits and risks of ownership of an asset are treated as finance leases, as if the asset had been purchased outright. The assets are included in PP&E or computer software and the capital elements of the leasing commitments are shown as obligations under finance leases. Assets held under finance leases are depreciated on a basis consistent with similar owned assets or the lease term if shorter. The interest element of the lease rental is included in the income statement. All other leases are operating leases and the rental costs are charged to the income statement on a straight-line basis over the lease term.
GoodwillGoodwill is stated at cost less impairments. Goodwill is deemed to have an indefinite useful life and is tested for impairment at least annually.
Where the fair value of the interest acquired in an entity’s assets, liabilities and contingent liabilities exceeds the consideration paid, this excess is recognised immediately as a gain in the income statement.

GSK Annual Report 2013 139
2 Accounting principles and policies continued
Other intangible assetsIntangible assets are stated at cost less provisions for amortisation and impairments.
Licences, patents, know-how and marketing rights separately acquired or acquired as part of a business combination are amortised over their estimated useful lives, generally not exceeding 20 years, using the straight-line basis, from the time they are available for use. The estimated useful lives for determining the amortisation charge take into account patent lives, where applicable, as well as the value obtained from periods of non-exclusivity. Asset lives are reviewed, and where appropriate adjusted, annually. Contingent milestone payments are recognised at the point that the contingent event becomes certain. Any development costs incurred by the Group and associated with acquired licences, patents, know-how or marketing rights are written off to the income statement when incurred, unless the criteria for recognition of an internally generated intangible asset are met, usually when a regulatory filing has been made in a major market and approval is considered highly probable.
Acquired brands are valued independently as part of the fair value of businesses acquired from third parties where the brand has a value which is substantial and long-term and where the brands either are contractual or legal in nature or can be sold separately from the rest of the businesses acquired. Brands are amortised over their estimated useful lives of up to 20 years, except where it is considered that the useful economic life is indefinite.
The costs of acquiring and developing computer software for internal use and internet sites for external use are capitalised as intangible fixed assets where the software or site supports a significant business system and the expenditure leads to the creation of a durable asset. ERP systems software is amortised over seven to ten years and other computer software over three to five years.
Impairment of non-current assetsThe carrying values of all non-current assets are reviewed for impairment, either on a stand-alone basis or as part of a larger cash generating unit, when there is an indication that the assets might be impaired. Additionally, goodwill, intangible assets with indefinite useful lives and intangible assets which are not yet available for use are tested for impairment annually. Any provision for impairment is charged to the income statement in the year concerned.
Impairments of goodwill are not reversed. Impairment losses on other non-current assets are only reversed if there has been a change in estimates used to determine recoverable amounts and only to the extent that the revised recoverable amounts do not exceed the carrying values that would have existed, net of depreciation or amortisation, had no impairments been recognised.
Investments in associates, joint ventures and joint operationsInvestments in associates and joint ventures are carried in the consolidated balance sheet at the Group’s share of their net assets at date of acquisition and of their post-acquisition retained profits or losses together with any goodwill arising on the acquisition. The Group recognises its rights to assets, liabilities, revenue and expenses of joint operations.
Available-for-sale investmentsLiquid investments and other investments are classified as available-for-sale investments and are initially recorded at fair value plus transaction costs and then remeasured at subsequent reporting dates to fair value. Unrealised gains and losses on available-for-sale investments are recognised directly in other comprehensive income. Impairments arising from the significant or prolonged decline in fair value of an equity investment reduce the carrying amount of the asset directly and are charged to the income statement.
On disposal or impairment of the investments, any gains and losses that have been deferred in other comprehensive income are reclassified to the income statement. Dividends on equity investments are recognised in the income statement when the Group’s right to receive payment is established. Equity investments are recorded in non-current assets unless they are expected to be sold within one year.
Purchases and sales of equity investments are accounted for on the trade date and purchases and sales of other available-for-sale investments are accounted for on settlement date.
InventoriesInventories are included in the financial statements at the lower of cost (including raw materials, direct labour, other direct costs and related production overheads) and net realisable value. Cost is generally determined on a first in, first out basis. Pre-launch inventory is held as an asset when there is a high probability of regulatory approval for the product. Before that point a provision is made against the carrying value to its recoverable amount; the provision is then reversed at the point when a high probability of regulatory approval is determined.
Trade receivablesTrade receivables are carried at original invoice amount less any provisions for doubtful debts. Provisions are made where there is evidence of a risk of non-payment, taking into account ageing, previous experience and general economic conditions. When a trade receivable is determined to be uncollectable it is written off, firstly against any provision available and then to the income statement.
Subsequent recoveries of amounts previously provided for are credited to the income statement. Long-term receivables are discounted where the effect is material.
Trade payablesTrade payables are initially recognised at fair value and then held at amortised cost which equates to nominal value. Long-term payables are discounted where the effect is material.
Cash and cash equivalentsCash and cash equivalents comprise cash in hand, current balances with banks and similar institutions and highly liquid investments with maturities of three months or less. They are readily convertible into known amounts of cash and have an insignificant risk of changes in value.
BorrowingsAll borrowings are initially recorded at the amount of proceeds received, net of transaction costs. Borrowings are subsequently carried at amortised cost, with the difference between the proceeds, net of transaction costs, and the amount due on redemption being recognised as a charge to the income statement over the period of the relevant borrowing.

140 GSK Annual Report 2013
Financial statements Notes to the financial statements
2 Accounting principles and policies continued
TaxationCurrent tax is provided at the amounts expected to be paid applying tax rates that have been enacted or substantively enacted by the balance sheet date.
Deferred tax is provided in full, using the liability method, on temporary differences arising between the tax bases of assets and liabilities and their carrying amounts in the financial statements. Deferred tax assets are recognised to the extent that it is probable that future taxable profits will be available against which the temporary differences can be utilised. Deferred tax is provided on temporary differences arising on investments in subsidiaries, associates and joint ventures, except where the timing of the reversal of the temporary difference can be controlled and it is probable that the temporary difference will not reverse in the foreseeable future. Deferred tax is provided using rates of tax that have been enacted or substantively enacted by the balance sheet date.
Derivative financial instruments and hedgingDerivative financial instruments are used to manage exposure to market risks. The principal derivative instruments used by GSK are foreign currency swaps, interest rate swaps and forward foreign exchange contracts. The Group does not hold or issue derivative financial instruments for trading or speculative purposes.
Derivative financial instruments are classified as held-for-trading and are carried in the balance sheet at fair value. Derivatives designated as hedging instruments are classified on inception as cash flow hedges, net investment hedges or fair value hedges.
Changes in the fair value of derivatives designated as cash flow hedges are recognised in other comprehensive income to the extent that the hedges are effective. Ineffective portions are recognised in profit or loss immediately. Amounts deferred in other comprehensive income are reclassified to the income statement when the hedged item affects profit or loss.
Net investment hedges are accounted for in a similar way to cash flow hedges.
Changes in the fair value of derivatives designated as fair value hedges are recorded in the income statement, together with the changes in the fair value of the hedged asset or liability.
Changes in the fair value of any derivative instruments that do not qualify for hedge accounting are recognised immediately in the income statement.
DiscountingWhere the time effect of money is material, balances are discounted to current values using appropriate rates of interest. The unwinding of the discounts is recorded in finance income and finance expense.
3 Key accounting judgements and estimatesIn preparing the financial statements, management is required to make estimates and assumptions that affect the amounts of assets, liabilities, revenue and expenses reported in the financial statements. Actual amounts and results could differ from those estimates. The following are considered to be the key accounting judgements and estimates made.
TurnoverRevenue is recognised when title and risk of loss is passed to the customer, reliable estimates can be made of relevant deductions and all relevant obligations have been fulfilled, such that the earnings process is regarded as being complete.
Gross turnover is reduced by rebates, discounts, allowances and product returns given or expected to be given, which vary by product arrangements and buying groups. These arrangements with purchasing organisations are dependent upon the submission of claims some time after the initial recognition of the sale. Accruals are made at the time of sale for the estimated rebates, discounts or allowances payable or returns to be made, based on available market information and historical experience.
Because the amounts are estimated they may not fully reflect the final outcome, and the amounts are subject to change dependent upon, amongst other things, the types of buying group and product sales mix.
The level of accrual is reviewed and adjusted regularly in the light of contractual and legal obligations, historical trends, past experience and projected market conditions. Market conditions are evaluated using wholesaler and other third-party analyses, market research data and internally generated information. Future events could cause the assumptions on which the accruals are based to change, which could affect the future results of the Group.
TaxationCurrent tax is provided at the amounts expected to be paid, and deferred tax is provided on temporary differences between the tax bases of assets and liabilities and their carrying amounts, at the rates that have been enacted or substantively enacted by the balance sheet date.
Deferred tax assets are recognised to the extent that it is probable that future taxable profits will be available against which the temporary differences can be utilised, based on management’s assumptions relating to the amounts and timing of future taxable profits. Factors affecting the tax charge in future years are set out in Note 14, ‘Taxation’. A 1% change in the Group’s effective tax rate in 2013 would have changed the total tax charge for the year by approximately £66 million.
The Group has open tax issues with a number of revenue authorities. Where an outflow of funds is believed to be probable and a reliable estimate of the outcome of the dispute can be made, management provides for its best estimate of the liability. These estimates take into account the specific circumstances of each dispute and relevant external advice, are inherently judgemental and could change substantially over time as new facts emerge and each dispute progresses. Details relating to significant unresolved disputes are set out in Note 14, ‘Taxation’. GSK continues to believe that it has made adequate provision for the liabilities likely to arise from open assessments. Where open issues exist the ultimate liability for such matters may vary from the amounts provided and is dependent upon the outcome of negotiations with the relevant tax authorities or, if necessary, litigation proceedings.

GSK Annual Report 2013 141
3 Key accounting judgements and estimates continued
Legal and other disputesThe Group provides for anticipated settlement costs where an outflow of resources is considered probable and a reliable estimate may be made of the likely outcome of the dispute and legal and other expenses arising from claims against the Group. These estimates take into account the specific circumstances of each dispute and relevant external advice, are inherently judgmental and could change substantially over time as new facts emerge and each dispute progresses. Details of the status and various uncertainties involved in the significant unresolved disputes are set out in Note 44, ‘Legal proceedings’.
The company’s Directors, having taken legal advice, have established provisions after taking into account the relevant facts and circumstances of each matter and in accordance with accounting requirements. In respect of product liability claims related to certain products there is sufficient history of claims made and settlements to enable management to make a reliable estimate of the provision required to cover unasserted claims. The Group may become involved in legal proceedings, in respect of which it is not possible to make a reliable estimate of the expected financial effect, if any, that will result from ultimate resolution of the proceedings. In these cases, appropriate disclosure about such cases would be included, but no provision would be made and no contingent liability can be quantified. At 31 December 2013 provisions for legal and other disputes amounted to £0.6 billion (2012 – £0.5 billion).
The ultimate liability for legal claims may vary from the amounts provided and is dependent upon the outcome of litigation proceedings, investigations and possible settlement negotiations. The position could change over time and, therefore, there can be no assurance that any losses that result from the outcome of any legal proceedings will not exceed the amount of the provisions reported in the Group’s financial statements by a material amount.
Goodwill and other intangible asset impairmentsGoodwill is deemed to have an indefinite life and so is not amortised. Annual impairment tests of the cash generating units to which goodwill is allocated are performed. Impairment tests are based on established market multiples or risk-adjusted future cash flows discounted using appropriate interest rates. The assumptions used in these impairment tests are set out in Note 18, ‘Goodwill’.
In each case the valuations indicate sufficient headroom such that a reasonably possible change to key assumptions is unlikely to result in an impairment of the related goodwill.
Impairment tests on other intangible assets are undertaken if events occur which call into question the carrying values of the assets. Where brands are not amortised, they are subject to annual impairment tests. Valuations for impairment tests are based on established market multiples or risk-adjusted future cash flows over the estimated useful life of the asset, where limited, discounted using appropriate interest rates as set out in Note 19, ‘Other intangible assets’.
The assumptions relating to future cash flows, estimated useful lives and discount rates are based on business forecasts and are therefore inherently judgemental. Future events could cause the assumptions used in these impairment tests to change with a consequent adverse effect on the future results of the Group.
Pensions and other post-employment benefitsThe costs of providing pensions and other post-employment benefits are charged to the income statement in accordance with IAS 19 ‘Employee benefits’ over the period during which benefit is derived from the employee’s services. The costs are assessed on the basis of assumptions selected by management. These assumptions include future earnings and pension increases, discount rates, expected long-term rates of return on assets and mortality rates, and are disclosed in Note 28, ‘Pensions and other post-employment benefits’.
The expected long-term rates of return on bonds are determined based on the portfolio mix of index-linked, government and corporate bonds. An equity risk premium is added to this for equities.
Discount rates are derived from AA rated corporate bond yields except in countries where there is no deep market in corporate bonds where government bond yields are used. Sensitivity analysis is provided in Note 28, ‘Pensions and other post-employment benefits’, but a 0.25% reduction in the discount rate would lead to an increase in the net pension deficit of approximately £554 million and an increase in the annual pension cost of approximately £32 million. The selection of different assumptions could affect the future results of the Group.

142 GSK Annual Report 2013
Financial statements Notes to the financial statements
4 New accounting requirementsThe following new and amended accounting standards have been issued by the IASB and are likely to affect future Annual Reports, although, in their current forms, none is expected to have a material impact on the results or financial position of the Group.
An amendment to IAS 32 ‘Offsetting financial assets and financial liabilities’ was issued in December 2011 and will be implemented by the Group from 1 January 2014. The amendment provides additional guidance on when financial assets and financial liabilities may be offset.
IFRS 9 ‘Financial instruments’ was first issued in November 2009 and has since been amended several times. The Standard will eventually replace IAS 39 and covers the classification, measurement and derecognition of financial assets and financial liabilities together with a new hedge accounting model. The IASB intends to expand IFRS 9 to add new requirements for impairment and for it to become a complete replacement of IAS 39 in due course, although no date for its mandatory implementation has been set.
An amendment to IAS 19 ‘Defined benefit plans: Employee contribution’ was issued in November 2013 and will be implemented by the Group from 1 January 2015. The amendment provides additional guidance on the treatment of contributions to defined benefit plans from employees and third parties.
5 Exchange ratesThe Group uses the average of exchange rates prevailing during the period to translate the results and cash flows of overseas subsidiaries, joint ventures and associated undertakings into Sterling and period end rates to translate the net assets of those undertakings. The currencies which most influence these translations and the relevant exchange rates were:
2013 2012 2011
Average rates:US$/£ 1.57 1.59 1.61Euro/£ 1.18 1.23 1.15Yen/£ 153 127 128
Period end rates:US$/£ 1.66 1.63 1.55Euro/£ 1.20 1.23 1.20Yen/£ 174 141 120
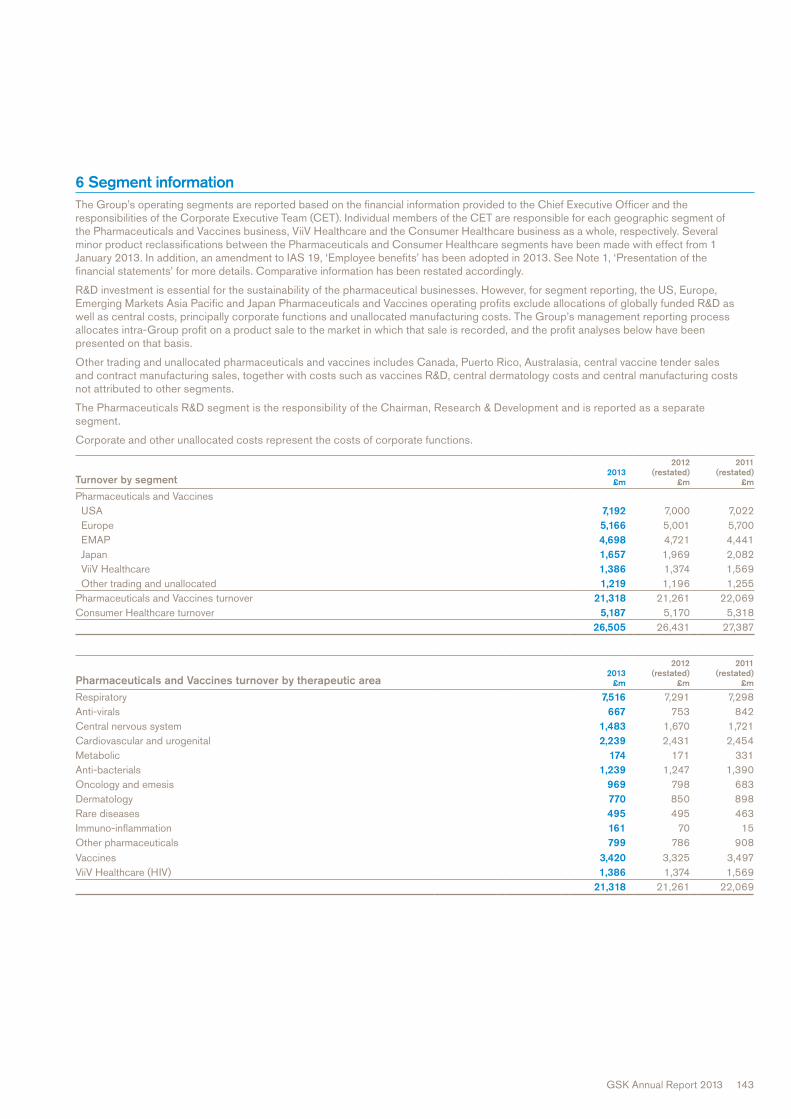
GSK Annual Report 2013 143
6 Segment informationThe Group’s operating segments are reported based on the financial information provided to the Chief Executive Officer and the responsibilities of the Corporate Executive Team (CET). Individual members of the CET are responsible for each geographic segment of the Pharmaceuticals and Vaccines business, ViiV Healthcare and the Consumer Healthcare business as a whole, respectively. Several minor product reclassifications between the Pharmaceuticals and Consumer Healthcare segments have been made with effect from 1 January 2013. In addition, an amendment to IAS 19, ‘Employee benefits’ has been adopted in 2013. See Note 1, ‘Presentation of the financial statements’ for more details. Comparative information has been restated accordingly.
R&D investment is essential for the sustainability of the pharmaceutical businesses. However, for segment reporting, the US, Europe, Emerging Markets Asia Pacific and Japan Pharmaceuticals and Vaccines operating profits exclude allocations of globally funded R&D as well as central costs, principally corporate functions and unallocated manufacturing costs. The Group’s management reporting process allocates intra-Group profit on a product sale to the market in which that sale is recorded, and the profit analyses below have been presented on that basis.
Other trading and unallocated pharmaceuticals and vaccines includes Canada, Puerto Rico, Australasia, central vaccine tender sales and contract manufacturing sales, together with costs such as vaccines R&D, central dermatology costs and central manufacturing costs not attributed to other segments.
The Pharmaceuticals R&D segment is the responsibility of the Chairman, Research & Development and is reported as a separate segment.
Corporate and other unallocated costs represent the costs of corporate functions.
Turnover by segment2013
£m
2012 (restated)
£m
2011 (restated)
£m
Pharmaceuticals and Vaccines USA 7,192 7,000 7,022 Europe 5,166 5,001 5,700 EMAP 4,698 4,721 4,441 Japan 1,657 1,969 2,082 ViiV Healthcare 1,386 1,374 1,569 Other trading and unallocated 1,219 1,196 1,255Pharmaceuticals and Vaccines turnover 21,318 21,261 22,069Consumer Healthcare turnover 5,187 5,170 5,318
26,505 26,431 27,387
Pharmaceuticals and Vaccines turnover by therapeutic area
2013
£m
2012 (restated)
£m
2011 (restated)
£m
Respiratory 7,516 7,291 7,298Anti-virals 667 753 842Central nervous system 1,483 1,670 1,721Cardiovascular and urogenital 2,239 2,431 2,454Metabolic 174 171 331Anti-bacterials 1,239 1,247 1,390Oncology and emesis 969 798 683Dermatology 770 850 898Rare diseases 495 495 463Immuno-inflammation 161 70 15Other pharmaceuticals 799 786 908Vaccines 3,420 3,325 3,497ViiV Healthcare (HIV) 1,386 1,374 1,569
21,318 21,261 22,069

144 GSK Annual Report 2013
Financial statements Notes to the financial statements
6 Segment information continued
Consumer Healthcare turnover by category
2013
£m
2012(restated)
£m
2011(restated)
£m
Total wellness 1,935 2,057 2,310Oral care 1,884 1,806 1,722Nutrition 1,096 1,050 1,025Skin health 272 257 261
5,187 5,170 5,318
During 2013, US Pharmaceuticals and ViiV Healthcare made sales to three wholesalers of approximately £2,071 million (2012 – £2,303 million; 2011 – £2,360 million), £2,658 million (2012 – £2,447 million; 2011 – £2,215 million) and £1,695 million (2012 – £1,318 million; 2011 – £1,374 million) respectively, after allocating final-customer discounts to the wholesalers.
Segment profit 2013
£m
2012(restated)
£m
2011 (restated)
£m
Pharmaceuticals and Vaccines USA 4,993 4,786 4,646 Europe 2,829 2,629 3,154 EMAP 1,468 1,560 1,476 Japan 978 1,179 1,249 ViiV Healthcare 885 849 882 Pharmaceuticals R&D (2,823) (2,778) (2,801) Other trading and unallocated costs (601) (404) (311)Pharmaceuticals and Vaccines operating profit 7,729 7,821 8,295Consumer Healthcare operating profit 913 908 1,128Segment profit 8,642 8,729 9,423Corporate and other unallocated costs (627) (491) (693)Other reconciling items between segment profit and operating profit (987) (938) (996)Operating profit 7,028 7,300 7,734
Finance income 61 79 90Finance costs (767) (808) (799)Profit on disposal of interest in associates 282 – 585Share of after tax profits of associates and joint ventures 43 29 15Profit before taxation 6,647 6,600 7,625Taxation (1,019) (1,922) (2,220)Profit after taxation for the year 5,628 4,678 5,405
Depreciation and amortisation by segment 2013 £m
2012(restated)
£m
2011 (restated)
£m
Pharmaceuticals and Vaccines USA 14 16 31 Europe 21 24 29 EMAP 30 28 34 Japan 6 7 7 ViiV Healthcare 2 2 4 Pharmaceuticals R&D 171 178 180 Other trading and unallocated costs 436 478 465Pharmaceuticals and Vaccines depreciation and amortisation 680 733 750Consumer Healthcare depreciation and amortisation 74 127 133Segment depreciation and amortisation 754 860 883Corporate and other unallocated depreciation and amortisation 109 108 99Other reconciling items between segment depreciation and amortisation and total depreciation and amortisation 551 477 441Total depreciation and amortisation 1,414 1,445 1,423

GSK Annual Report 2013 145
6 Segment information continued
PP&E, intangible asset and goodwill impairment by segment 2013 £m
2012(restated)
£m
2011 (restated)
£m
Pharmaceuticals and Vaccines USA 1 1 1 Europe 2 1 1 EMAP 1 1 – Japan – – 1 ViiV Healthcare – – 1 Pharmaceuticals R&D 22 2 2 Other trading and unallocated costs 33 30 43Pharmaceuticals and Vaccines impairment 59 35 49Consumer Healthcare impairment 11 1 5Segment impairment 70 36 54Corporate and other unallocated impairment – 18 9Other reconciling items between segment impairment and total impairment 799 700 240Total impairment 869 754 303
PP&E and intangible asset impairment reversals by segment 2013 £m
2012 (restated)
£m
2011 (restated)
£m
Pharmaceuticals and Vaccines USA – – – Europe (2) – – EMAP – – – Japan – – – ViiV Healthcare – – – Pharmaceuticals R&D (2) (4) (3) Other trading and unallocated costs (16) (60) (32)Pharmaceuticals and Vaccines impairment reversals (20) (64) (35)Consumer Healthcare impairment reversals (4) – –Segment impairment reversals (24) (64) (35)Corporate and other unallocated impairment reversals – (3) –Other reconciling items between segment impairment reversals and total impairment reversals – (59) –Total impairment reversals (24) (126) (35)

146 GSK Annual Report 2013
Financial statements Notes to the financial statements
6 Segment information continued
Net assets by segment2013
£m
2012 (restated)
£m
Pharmaceuticals and Vaccines USA 157 515 Europe 892 887 EMAP 2,097 2,323 Japan 362 409 ViiV Healthcare 1,267 1,529 Pharmaceuticals R&D 590 650 Other trading and unallocated assets 14,465 13,943Pharmaceuticals and Vaccines net operating assets 19,830 20,256Consumer Healthcare net operating assets 2,856 3,045 Segment net operating assets 22,686 23,301Corporate and other unallocated net operating assets (2,647) (3,324)Net operating assets 20,039 19,977
Net debt (12,645) (14,037)Investments in associates and joint ventures 323 579Derivative financial instruments 26 38Current and deferred taxation 68 116Assets held for sale 1 64Net assets 7,812 6,737
The other trading and unallocated Pharmaceuticals and Consumer Healthcare segments include assets for the centrally managed Pharmaceutical, Vaccine and Consumer Healthcare manufacturing operations, the depreciation on which, totalling £518 million (2012 – £601 million; 2011 – £599 million) is recovered through the standard cost of product charged to businesses.
Geographical informationThe UK is regarded as being the Group’s country of domicile.
Turnover by location of customer2013
£m
2012 (restated)
£m
2011 (restated)
£m
UK 1,541 1,525 1,612USA 8,730 8,476 8,696Rest of World 16,234 16,430 17,079External turnover 26,505 26,431 27,387
Turnover by location of subsidiary 2013 £m
2012 £m
2011 £m
UK 4,174 3,738 3,850USA 11,684 11,250 11,797Rest of World 18,515 19,719 20,986Turnover including inter-segment turnover 34,373 34,707 36,633
UK 1,772 1,508 1,557USA 3,026 2,886 3,140Rest of World 3,070 3,882 4,549Inter-segment turnover 7,868 8,276 9,246
UK 2,402 2,230 2,293USA 8,658 8,364 8,657Rest of World 15,445 15,837 16,437External turnover 26,505 26,431 27,387

GSK Annual Report 2013 147
6 Segment information continued
Operating profit by location2013
£m
2012 (restated)
£m
2011 (restated)
£m
UK 568 1,454 1,014USA 3,063 1,391 3,274Rest of World 3,397 4,455 3,446Total operating profit 7,028 7,300 7,734
Net operating assets by location2013
£m
2012 (restated)
£mUK 6,314 2,686USA 3,975 5,635Rest of World 9,750 11,656Net operating assets 20,039 19,977
Non-current assets by location
2013 £m
2012 (restated)
£mUK 6,565 6,888USA 6,675 7,312Rest of World 9,607 9,875Non-current assets 22,847 24,075
Non-current assets by location excludes amounts relating to other investments, deferred tax assets, derivative financial instruments, pension assets, amounts receivable under insurance contracts and certain other non-current receivables.
7 Other operating income2013
£m2012
£m2011
£m
Impairment of equity investments (70) (26) (78)Disposal of equity investments 38 19 10Disposal of businesses and assets and legal settlements 1,413 661 322Gain on settlement of pre-existing collaborations on acquisition of HGS – 233 –Gain on acquisition of the Shionogi-ViiV Healthcare joint venture – 349 –Fair value remeasurements on contingent consideration recognised in business combinations (251) (13) –Fair value adjustments on derivative financial instruments 12 3 10Other (expense)/income (18) 30 14
1,124 1,256 278
Disposal of businesses, other assets and legal settlements in 2013 includes the gain on disposal of the Lucozade and Ribena business to Suntory of £1,057 million and the gain on the sale of the worldwide intellectual property rights (excluding certain EMAP markets) of the anti-coagulant products business to Aspen Group of £274 million. Fair value remeasurements on contingent consideration recognised in business combinations arose principally on the contingent consideration payable for the acquisition of the former Shionogi-ViiV Healthcare joint venture.

148 GSK Annual Report 2013
Financial statements Notes to the financial statements
8 Operating profit
The following items have been included in operating profit:
2013
£m
2012 (restated)
£m
2011 (restated)
£m
Employee costs (Note 9) 7,591 6,935 6,824Advertising 808 839 910Distribution costs 371 386 432Depreciation of property, plant and equipment 732 871 893Impairment of property, plant and equipment, net of reversals 100 (68) 155Amortisation of intangible assets 682 574 530Impairment of intangible assets and goodwill, net of reversals 745 696 113Net foreign exchange losses 41 61 25Inventories: Cost of inventories included in cost of sales 7,290 6,851 6,793 Write-down of inventories 338 302 85 Reversal of prior year write-down of inventories (43) (61) (62)Operating lease rentals: Minimum lease payments 127 156 139 Contingent rents 12 14 11 Sub-lease payments 2 3 4Fees payable to the company’s auditor and its associates in relation to the Group (see below) 24.9 23.2 23.7
The reversals of prior year write-downs of inventories principally arise from the reassessment of usage or demand expectations prior to inventory expiration.
Included within operating profit are major restructuring charges of £517 million (2012 – £557 million; 2011 – £590 million), see Note 10, ‘Major restructuring costs’.
Fees payable to the company’s auditor and its associates:2013
£m2012
£m2011
£m
Audit of parent company and consolidated financial statements 4.6 3.9 3.7Audit of the company’s subsidiaries 10.6 10.1 10.2Audit-related assurance services, including attestation under s.404 of Sarbanes-Oxley Act 2002 3.9 3.3 3.4Audit and audit-related services 19.1 17.3 17.3Taxation compliance 0.6 0.4 0.2Taxation advice 3.3 3.2 2.5Other assurance services 1.5 1.7 2.8All other services 0.4 0.6 0.9
24.9 23.2 23.7
In addition to the above, fees paid in respect of the GSK pension schemes were:
2013 £m
2012 £m
2011 £m
Audit 0.4 0.6 0.4Other services – – –

GSK Annual Report 2013 149
9 Employee costs
2013 £m
2012 (restated)
£m
2011 (restated)
£m
Wages and salaries 6,262 5,846 5,312Social security costs 685 643 641Pension and other post-employment costs, including augmentations (Note 28) 170 95 414Cost of share-based incentive plans 319 220 198Severance and other costs from integration and restructuring activities 155 131 259
7,591 6,935 6,824
The Group provides benefits to employees, commensurate with local practice in individual countries, including, in some markets, healthcare insurance, subsidised car schemes and personal life assurance.
The charge for pension and other post-employment costs in 2013 includes a credit of £279 million following a restructuring of US post-retirement medical obligations. The charge in 2012 includes a credit of £395 million following a change in policy relating to discretionary pension increases under certain UK pension schemes and the introduction of a limit on future pensionable pay increases in all UK schemes. These are set out in Note 28, ‘Pensions and other post-employment benefits’.
The cost of share-based incentive plans is analysed as follows:
2013 £m
2012 £m
2011 £m
Share Value Plan 243 156 146Performance Share Plan 47 45 23Share option plans 4 11 20Other plans 25 8 9
319 220 198
The average number of persons employed by the Group (including Directors) during the year was:
2013 Number
2012 Number
2011 Number
Manufacturing 31,586 31,033 30,939Selling, general and administration 55,660 54,803 53,826Research and development 12,571 12,845 12,636
99,817 98,681 97,401
The average number of Group employees excludes temporary and contract staff. The numbers of Group employees at the end of each financial year are given in the financial record on page 224. The average number of persons employed by GlaxoSmithKline plc in 2013 was nil (2012 – nil).
The compensation of the Directors and Senior Management (members of the CET) in aggregate, was as follows:
2013 £m
2012 £m
2011 £m
Wages and salaries 23 20 24Social security costs 3 2 2Pension and other post-employment costs 3 3 3Cost of share-based incentive plans 13 13 11
42 38 40

150 GSK Annual Report 2013
Financial statements Notes to the financial statements
10 Major restructuring costsMajor restructuring costs charged in arriving at operating profit include restructuring costs arising under the Operational Excellence programme, initiated in 2007 and expanded in 2009, 2010 and 2011, under the Major Change programme initiated in 2013, following the acquisition of Human Genome Sciences, Inc. (HGS) in August 2012 and following the acquisition of Stiefel Laboratories, Inc. in July 2009.
Of the total restructuring costs of £517 million incurred in 2013, £223 million was incurred under the Operational Excellence programme and £260 million under the Major Change programme in the following areas:
• Restructuring of the Pharmaceuticals business in Europe leading to staff reductions in sales force and administration.
• Projects to rationalise Core Business Services and to simplify or eliminate processes leading to staff reduction in support functions.
• Transformation of the Manufacturing and Vaccines businesses to deliver a step change in quality, cost and productivity.
• The rationalisation of the Consumer Healthcare business.
Costs of £19 million were incurred under the restructuring programme related to the integration of HGS. The remaining costs of £15 million were incurred under the restructuring programme related to the integration of the Stiefel business.
The analysis of the costs charged to operating profit under these programmes is as follows:
2013 £m
2012 £m
2011 £m
Increase in provision for major restructuring programmes (see Note 29) (179) (268) (249)Amount of provision reversed unused (see Note 29) 11 12 11Impairment losses recognised (60) (7) (131)Other non-cash charges (5) (18) (48)Other cash costs (284) (276) (173)
(517) (557) (590)
Asset impairments of £60 million (2012 – £7 million; 2011 – £131 million) and other non-cash charges totalling £5 million (2012 – £18 million; 2011 – £48 million) are non-cash items, principally accelerated depreciation where asset lives have been shortened as a result of the major restructuring programmes. All other charges have been or will be settled in cash and include the termination of leases, site closure costs, consultancy and project management fees.
11 Finance income2013
£m2012
£m2011
£m
Interest income arising from: cash and cash equivalents 55 59 63 available-for-sale investments 2 5 7 loans and receivables 2 9 15Realised gains on liquid investments – 4 5Fair value adjustments on derivatives at fair value through profit or loss 2 2 –
61 79 90
All derivatives at fair value through profit or loss other than designated and effective hedging instruments (see Note 41, ‘Financial instruments and related disclosures’) are classified as held-for-trading financial instruments under IAS 39.

GSK Annual Report 2013 151
12 Finance expense2013
£m2012
£m2011
£m
Interest expense arising on: financial liabilities at amortised cost (708) (731) (718) derivatives at fair value through profit or loss (18) (14) (26)Fair value hedges: fair value movements on derivatives designated as hedging instruments (37) (28) (12) fair value adjustments on hedged items 36 27 11Fair value movements on other derivatives at fair value through profit or loss (2) (13) (15)Unwinding of discounts on provisions (14) (15) (12)Movements on amounts owed to non-controlling interests (2) (10) (7)Other finance expense (22) (24) (20)
(767) (808) (799)
All derivatives at fair value through profit or loss other than designated and effective hedging instruments (see Note 41, ‘Financial instruments and related disclosures’) are classified as held-for-trading financial instruments under IAS 39. Interest expense arising on derivatives at fair value through profit or loss relates to swap interest expense.
13 Associates and joint venturesAt 31 December 2013, the Group held one significant associate, Aspen Pharmacare Holdings Limited (Aspen). Summarised income statement information in respect of Aspen is set out below:
2013 £m
2012 £m
2011 £m
Turnover 1,485 1,280 1,164Profit after taxation 247 313 216Comprehensive income 192 163 (44)Total comprehensive income 439 476 172
The results of Aspen included in the summarised income statement information above represent the estimated earnings of the Aspen group in the year, adjusted for transactions between GSK and Aspen.
Amounts relating to joint ventures principally arise from a 50% interest in one joint venture, Japan Vaccine Co., Ltd., with Daiichi Sankyo Co., Ltd. Aggregated financial information in respect of other associated undertakings and joint ventures is set out below:
2013 £m
2012 £m
2011 £m
Associates: Share of turnover 26 27 110 Share of after tax profits – 1 5 Share of other comprehensive income – – – Share of total comprehensive income – 1 5
Joint ventures: Share of turnover 199 203 14 Share of after tax losses (2) (30) (31) Share of other comprehensive income – – – Share of total comprehensive income (2) (30) (31)
Sales to joint ventures and associates 103 124 104

152 GSK Annual Report 2013
Financial statements Notes to the financial statements
14 Taxation
Taxation charge based on profits for the year
2013
£m
2012 (restated)
£m
2011 (restated)
£m
UK corporation tax at the UK statutory rate 265 350 632Less double taxation relief – (180) (164)
265 170 468Overseas taxation 1,284 1,510 1,598Current taxation 1,549 1,680 2,066Deferred taxation (530) 242 154
1,019 1,922 2,220
The deferred tax credit in 2013 arises predominantly as a result of non cash items related to the continuing restructuring of our supply chain and intellectual property ownership.
Reconciliation of the taxation rate on Group profits2013
%2012
%2011
%
UK statutory rate of taxation 23.3 24.5 26.5Differences in overseas taxation rates 6.5 4.2 2.5Benefit of intellectual property incentives (2.8) (2.4) (2.1)R&D credits (1.3) (1.1) (1.6)Inter-company stock profit (1.8) 1.1 (0.7)Impact of share-based payments – – (0.2)Reduction in tax rate for unrecognised losses (0.3) (0.6) (0.4)Other permanent differences 1.0 (1.1) 0.4Re-assessments of prior year estimates (3.0) (2.2) 1.7Disposal of associate (1.0) – 1.7Tax on unremitted earnings 0.3 0.4 1.1Restructuring (5.6) 6.3 0.2Tax rate 15.3 29.1 29.1
The Group operates in countries where the tax rate differs from the UK tax rate. The impact of these overseas taxes on the overall rate of tax is shown above.
The Group is required under IFRS to create a deferred tax asset in respect of unrealised inter-company profit arising on inventory held by the Group at the year-end by applying the tax rate of the country in which the inventory is held (rather than the tax rate of the country where the profit was originally made and the tax paid, which is the practice under UK and US GAAP). As a result of this difference in accounting treatment the Group tax rate on current period inter-company profit under IFRS reduced by 1.8% in 2013 (2012 – 1.1% increase; 2011 – 0.7% decrease) arising from changes in the location of work-in-progress and finished goods.
Tax on items charged to equity and statement of comprehensive income
2013
£m
2012 (restated)
£m
2011 (restated)
£m
Current taxation Share based payments 31 34 3
31 34 3
Deferred taxation Share-based payments 42 (25) 47 Defined benefit plans (286) 193 243 Fair value movements on cash flow hedges 1 – – Fair value movements on available-for-sale investments (22) – 23
(265) 168 313Total (charge)/credit to equity and statement of comprehensive income (234) 202 316
All of the above items have been charged to the statement of comprehensive income except for tax on share based payments.
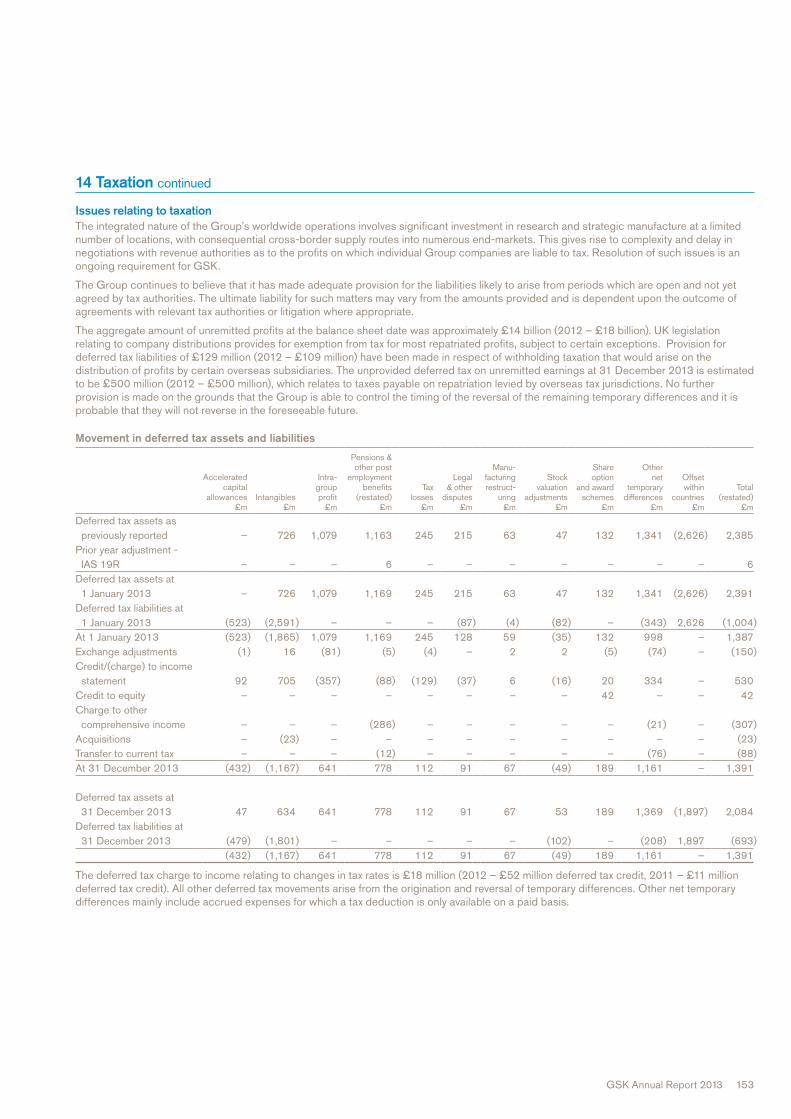
GSK Annual Report 2013 153
14 Taxation continued
Issues relating to taxationThe integrated nature of the Group’s worldwide operations involves significant investment in research and strategic manufacture at a limited number of locations, with consequential cross-border supply routes into numerous end-markets. This gives rise to complexity and delay in negotiations with revenue authorities as to the profits on which individual Group companies are liable to tax. Resolution of such issues is an ongoing requirement for GSK.
The Group continues to believe that it has made adequate provision for the liabilities likely to arise from periods which are open and not yet agreed by tax authorities. The ultimate liability for such matters may vary from the amounts provided and is dependent upon the outcome of agreements with relevant tax authorities or litigation where appropriate.
The aggregate amount of unremitted profits at the balance sheet date was approximately £14 billion (2012 – £18 billion). UK legislation relating to company distributions provides for exemption from tax for most repatriated profits, subject to certain exceptions. Provision for deferred tax liabilities of £129 million (2012 – £109 million) have been made in respect of withholding taxation that would arise on the distribution of profits by certain overseas subsidiaries. The unprovided deferred tax on unremitted earnings at 31 December 2013 is estimated to be £500 million (2012 – £500 million), which relates to taxes payable on repatriation levied by overseas tax jurisdictions. No further provision is made on the grounds that the Group is able to control the timing of the reversal of the remaining temporary differences and it is probable that they will not reverse in the foreseeable future.
Movement in deferred tax assets and liabilities
Accelerated capital
allowances £m
Intangibles £m
Intra- group profit
£m
Pensions & other post
employment benefits
(restated) £m
Tax losses
£m
Legal & other
disputes £m
Manu-
facturing restruct-
uring £m
Stock valuation
adjustments £m
Share option
and award schemes
£m
Other
net temporary
differences £m
Offset within
countries £m
Total (restated)
£m
Deferred tax assets as previously reported – 726 1,079 1,163 245 215 63 47 132 1,341 (2,626) 2,385Prior year adjustment - IAS 19R – – – 6 – – – – – – – 6Deferred tax assets at 1 January 2013 – 726 1,079 1,169 245 215 63 47 132 1,341 (2,626) 2,391Deferred tax liabilities at 1 January 2013 (523) (2,591) – – – (87) (4) (82) – (343) 2,626 (1,004)At 1 January 2013 (523) (1,865) 1,079 1,169 245 128 59 (35) 132 998 – 1,387Exchange adjustments (1) 16 (81) (5) (4) – 2 2 (5) (74) – (150)Credit/(charge) to income statement 92 705 (357) (88) (129) (37) 6 (16) 20 334 – 530Credit to equity – – – – – – – – 42 – – 42Charge to other comprehensive income – – – (286) – – – – – (21) – (307)Acquisitions – (23) – – – – – – – – – (23)Transfer to current tax – – – (12) – – – – – (76) – (88)At 31 December 2013 (432) (1,167) 641 778 112 91 67 (49) 189 1,161 – 1,391
Deferred tax assets at 31 December 2013 47 634 641 778 112 91 67 53 189 1,369 (1,897) 2,084Deferred tax liabilities at 31 December 2013 (479) (1,801) – – – – – (102) – (208) 1,897 (693)
(432) (1,167) 641 778 112 91 67 (49) 189 1,161 – 1,391
The deferred tax charge to income relating to changes in tax rates is £18 million (2012 – £52 million deferred tax credit, 2011 – £11 million deferred tax credit). All other deferred tax movements arise from the origination and reversal of temporary differences. Other net temporary differences mainly include accrued expenses for which a tax deduction is only available on a paid basis.

154 GSK Annual Report 2013
Financial statements Notes to the financial statements
14 Taxation continued
Tax losses Recognised Unrecognised
2013 £m
2012 £m
2013 £m
2012 £m
Trading losses expiring:Within 10 years 151 190 131 150In more than 10 years 75 421 680 549Available indefinitely 175 237 3,908 4,053At 31 December 401 848 4,719 4,752Deferred tax asset 112 245 – –
In addition, the Group had capital losses of approximately £3.2 billion in respect of which no deferred tax asset has been recognised. Deferred tax assets are recognised where it is probable that future taxable profit will be available to utilise losses.
Factors affecting the tax charge in future years As a global organisation there are many factors which could affect the future effective tax rate of the Group. The mix of profits across different territories, transfer pricing and other disputes with tax authorities and the location of research and development activity can all have a significant impact on the Group’s effective tax rate.
Changes to tax legislation in territories where the Group has business operations could also impact the Group’s effective tax rate. In December 2012, the UK Government announced that as part of the ongoing phased reduction in the main rate of corporation tax, the main rate will reduce to 21% with effect from April 2014. In March 2013, a further reduction in the main rate of corporation tax to 20% was announced which will take effect from 1 April 2015. The deferred tax movements reflect the reduction in the UK tax rate from 23% to 21% with effect from 1 April 2014, and to 20% with effect from 1 April 2015, as these have been substantively enacted.
15 Earnings per share
2013 pence
2012 (restated)
pence
2011 (restated)
pence
Basic earnings per share 112.5 91.6 103.6Diluted earnings per share 110.5 90.2 102.1
Basic earnings per share has been calculated by dividing the profit attributable to shareholders by the weighted average number of shares in issue during the period after deducting shares held by the ESOP Trusts and Treasury shares. The trustees have waived their rights to dividends on the shares held by the ESOP Trusts.
Diluted earnings per share has been calculated after adjusting the weighted average number of shares used in the basic calculation to assume the conversion of all potentially dilutive shares. A potentially dilutive share forms part of the employee share schemes where its exercise price is below the average market price of GSK shares during the period and any performance conditions attaching to the scheme have been met at the balance sheet date.
The numbers of shares used in calculating basic and diluted earnings per share are reconciled below.
Weighted average number of shares in issue2013
millions2012
millions2011
millions
Basic 4,831 4,912 5,028Dilution for share options and awards 88 77 71Diluted 4,919 4,989 5,099

GSK Annual Report 2013 155
16 Dividends2013 2012 2011
Paid/payable
Dividend per share
(pence)
Totaldividend
£m
Paid/payable
Dividend per share
(pence)
Totaldividend
£m
Paid/payable
Dividend per share
(pence)
Totaldividend
£m
First interim 11 July 2013 18 878 5 July 2012 17 846 7 July 2011 16 814Second interim 3 October 2013 18 864 4 October 2012 17 830 6 October 2011 16 809Third interim 9 January 2014 19 910 3 January 2013 18 870 5 January 2012 17 847Fourth interim 10 April 2014 23 1,102 11 April 2013 22 1,068 12 April 2012 21 1,043Annual total 78 3,754 74 3,614 70 3,513Supplemental 12 April 2012 5 248Total 78 3,754 74 3,614 75 3,761
Under IFRS interim dividends are only recognised in the financial statements when paid and not when declared. GSK normally pays a dividend two quarters after the quarter to which it relates and one quarter after it is declared. The 2013 financial statements recognise those dividends paid in 2013, namely the third and fourth interim dividends for 2012, and the first and second interim dividends for 2013.
The amounts recognised in each year are as follows:
2013 £m
2012 £m
2011 £m
Dividends to shareholders 3,680 3,814 3,406
17 Property, plant and equipment
Land and buildings
£m
Plant, equipment
and vehicles£m
Assets in
construction £m
Total £m
Cost at 1 January 2012 6,351 10,389 2,092 18,832Exchange adjustments (186) (239) (57) (482)Additions 85 209 871 1,165Additions through business combinations 18 15 – 33Capitalised borrowing costs – – 9 9Disposals and write-offs (250) (630) (3) (883)Reclassifications 533 376 (977) (68)Transfer from assets held for sale 81 49 6 136Cost at 31 December 2012 6,632 10,169 1,941 18,742Exchange adjustments (68) (105) (29) (202)Additions 57 230 948 1,235Additions through business combinations 12 11 – 23Capitalised borrowing costs – – 16 16Disposals and write-offs (77) (516) (2) (595)Reclassifications 107 233 (340) –Transfer to assets held for sale (53) (296) (17) (366)Cost at 31 December 2013 6,610 9,726 2,517 18,853

156 GSK Annual Report 2013
Financial statements Notes to the financial statements
17 Property, plant and equipment continued
Land and buildings
£m
Plant, equipment
and vehicles£m
Assets in
construction £m
Total £m
Depreciation at 1 January 2012 (2,396) (7,041) – (9,437)Exchange adjustments 73 164 – 237Charge for the year (228) (643) – (871)Disposals and write-offs 150 491 – 641Transfer from assets held for sale (36) (20) – (56)Depreciation at 31 December 2012 (2,437) (7,049) – (9,486)Exchange adjustments 38 80 – 118Charge for the year (214) (518) – (732)Disposals and write-offs 51 422 – 473Transfer to assets held for sale 20 139 – 159Depreciation at 31 December 2013 (2,542) (6,926) – (9,468)
Impairment at 1 January 2012 (138) (443) (66) (647)Exchange adjustments 3 9 2 14Disposals and write-offs 21 103 1 125Impairment losses (18) (38) (2) (58)Reversal of impairments 19 104 3 126Transfer from assets held for sale (39) (1) – (40)Impairment at 31 December 2012 (152) (266) (62) (480)Exchange adjustments 1 8 – 9Disposals and write-offs 14 44 – 58Impairment losses (23) (100) (1) (124)Reversal of impairments 2 22 – 24Transfer (from)/to assets held for sale (1) 1 – –Impairment at 31 December 2013 (159) (291) (63) (513)
Total depreciation and impairment at 31 December 2012 (2,589) (7,315) (62) (9,966)Total depreciation and impairment at 31 December 2013 (2,701) (7,217) (63) (9,981)
Net book value at 1 January 2012 3,817 2,905 2,026 8,748
Net book value at 31 December 2012 4,043 2,854 1,879 8,776
Net book value at 31 December 2013 3,909 2,509 2,454 8,872
The net book value at 31 December 2013 of the Group’s land and buildings comprises freehold properties £3,478 million (2012 – £3,611 million), properties with leases of 50 years or more £366 million (2012 – £376 million) and properties with leases of less than 50 years £65 million (2012 – £56 million).
Included in land and buildings at 31 December 2013 are leased assets with a cost of £784 million (2012 – £766 million), accumulated depreciation of £313 million (2012 – £315 million), impairment of £40 million (2012 – £19 million) and a net book value of £431 million (2012 – £432 million). Included in plant, equipment and vehicles at 31 December 2013 are leased assets with a cost of £99 million (2012 – £110 million), accumulated depreciation of £47 million (2012 – £55 million), impairment of £10 million (2012 – £nil) and a net book value of £42 million (2012 – £55 million). Some lease agreements include renewal or purchase options or escalation clauses.
The impairment losses principally arise from decisions to rationalise facilities and are calculated based on either fair value less costs of disposal or value in use. The fair value less costs of disposal valuation methodology uses significant inputs which are not based on observable market data, and therefore this valuation technique is classified as level 3 of the fair value hierarchy. These calculations determine the net present value of the projected risk-adjusted, post-tax cash flows of the relevant asset or cash generating unit, applying a discount rate of the Group post-tax weighted average cost of capital (WACC) of 7%, adjusted where appropriate for relevant specific risks. For value in use calculations, where an impairment is indicated and a pre-tax cash flow calculation is expected to give a materially different result, the test would be reperformed using pre-tax cash flows and a pre-tax discount rate. The Group WACC is equivalent to a pre-tax discount rate of approximately 10%. The impairment losses have been charged to cost of sales £32 million (2012 – £25 million), R&D £14 million (2012 – £9 million) and SG&A £78 million (2012 – £24 million), and include £62 million (2012 – £7 million) arising from the major restructuring programmes.
Reversals of impairment arise from subsequent reviews of the impaired assets where the conditions which gave rise to the original impairments are deemed no longer to apply. All of the reversals have been credited to cost of sales.
The carrying value at 31 December 2013 of assets for which impairments have been charged or reversed in the year was £6 million (2012 – £44 million).

GSK Annual Report 2013 157
18 Goodwill2013
£m2012
£m
Cost at 1 January 4,359 3,754Exchange adjustments (134) (177)Additions through business combinations (Note 38) 53 873Transfer to assets held for sale (55) –Movements in contingent consideration balances (18) (91)Cost at 31 December 4,205 4,359
Net book value at 1 January 4,359 3,754
Net book value at 31 December 4,205 4,359
The movement in the contingent consideration balance mainly arises in respect of the acquisition of Pfizer Inc’s HIV business on 14 April 2009.
The carrying value of goodwill, translated at year-end exchange rates, is made up of balances arising on acquisition of the following businesses:
Cash generating unit
2013 £m
2012 £m
Stiefel Laboratories, Inc. US, Europe, EMAP 832 845Human Genome Sciences, Inc. US, Europe, EMAP, Japan, Other Pharmaceuticals and Vaccines 778 779Reliant Pharmaceuticals, Inc. US Pharmaceuticals and Vaccines 421 429ID Biomedical Corporation US, Europe, EMAP, Japan, Other Pharmaceuticals and Vaccines 409 444Sirtris Pharmaceuticals, Inc. US, Europe, EMAP, Japan, Other Pharmaceuticals and Vaccines 285 291Domantis Limited US, Europe, EMAP, Japan, Other Pharmaceuticals and Vaccines 181 181GlaxoSmithKline K.K. Japan Pharmaceuticals and Vaccines 179 221CNS, Inc. Consumer Healthcare 133 135Pfizer HIV business ViiV Healthcare 129 152Maxinutrition Group Holdings Limited Consumer Healthcare 114 114Polfa Poznan S.A. Europe Pharmaceuticals and Vaccines 109 109Certain businesses from UCB S.A. EMAP Pharmaceuticals and Vaccines 87 88NovaMin Technology, Inc. Consumer Healthcare 51 50Others 497 521
4,205 4,359
The goodwill arising on the acquisition of Stiefel has been allocated to the US, Europe and EMAP cash generating units for impairment testing purposes as the benefits of the acquired business are split between these cash generating units.
The goodwill arising on the acquisitions of Human Genome Sciences, ID Biomedical, Sirtris Pharmaceuticals and Domantis has been split between the US, Europe, EMAP, Japan and Other Pharmaceutical and Vaccines cash generating units for impairment testing purposes as either the benefit of the acquired businesses is split between these cash generating units or the acquired businesses do not generate independent cash flows.
The total of goodwill allocated to US Pharmaceuticals and Vaccines amounted to £2,013 million (2012 – £1,878 million). The amounts allocated to the other cash generating units were not significant relative to the total balance.

158 GSK Annual Report 2013
Financial statements Notes to the financial statements
18 Goodwill continuedThe recoverable amounts of the cash generating units are assessed using either a fair value less costs of disposal model or a value in use model. Value in use is calculated as the net present value of the projected risk-adjusted post-tax cash flows plus a terminal value of the cash generating unit to which the goodwill is allocated. Initially a post-tax discount rate is applied to calculate the net present value of the post-tax cash flows. The discount rate used is based on the Group WACC of 7%, as most cash generating units have integrated operations across large parts of the Group. The discount rate is adjusted where appropriate for specific country or currency risks.
Fair value less costs of disposal is calculated using a similar discounted cash flow approach. A post-tax discount rate is applied to the projected risk-adjusted post-tax cash flows and terminal value. The valuation methodology uses significant inputs which are not based on observable market data, therefore, this valuation technique is classified as level 3 in the fair value hierarchy.
Details relating to the discounted cash flow models used in the impairment tests of the Pharmaceuticals and Vaccines and Consumer Healthcare cash generating units are as follows:
Valuation basis Higher of fair value less costs of disposal and value in use
Key assumptions Sales growth rates Profit margins Terminal growth rate Discount rateTaxation rate
Determination of assumptions Growth rates are internal forecasts based on both internal and external market information.Margins reflect past experience, adjusted for expected changes.Terminal growth rates based on management’s estimate of future long-term average growth rates.Discount rates based on Group WACC, adjusted where appropriate.Taxation rates based on appropriate rates for each region
Period of specific projected cash flows 5 years
Terminal growth rate and discount rate Terminal growth rate Discount rate
US Pharmaceuticals and Vaccines 1% p.a. 7%Europe Pharmaceuticals and Vaccines 1% p.a. 8%EMAP Pharmaceuticals and Vaccines 1.5% p.a. 10%Japan Pharmaceuticals and Vaccines 0.5% p.a. 6%ViiV Healthcare 2.5% p.a. 10%Other Pharmaceuticals and Vaccines 1% p.a. 7%Consumer Healthcare 3% p.a. 7%
The terminal growth rates do not exceed the long-term projected growth rates for the relevant markets. The terminal growth rates used in the fair value less costs of disposal calculations for the cash generating units reflect the impact of future generic competition and take account of new product launches.
The Pharmaceutical and Vaccines cash generating units comprise a collection of smaller cash generating units including assets with indefinite lives with a carrying value of £599 million (2012 – £609 million). The Consumer Healthcare cash generating unit also comprises a collection of smaller cash generating units including brands with indefinite lives with a carrying value of £1.52 billion (2012 – £1.52 billion).
Details of indefinite life brands are given in Note 19 ‘Other intangible assets’.
In each case the valuations indicate sufficient headroom such that a reasonably possible change to key assumptions is unlikely to result in an impairment of the related goodwill.

GSK Annual Report 2013 159
19 Other intangible assetsComputer
software £m
Licences, patents, etc.
£m
Amortised brands
£m
Indefinite life brands
£m
Total
£mCost at 1 January 2012 1,358 7,776 128 2,278 11,540Exchange adjustments (30) (233) (8) (67) (338)Capitalised internal development costs 62 74 – – 136Additions through business combinations 2 3,258 – – 3,260Capitalised borrowing costs 5 7 – – 12Other additions 49 209 – – 258Disposals and asset write-offs (13) (487) – – (500)Reclassifications 68 – – – 68Transfer from/(to) assets held for sale – – 292 (27) 265Cost at 31 December 2012 1,501 10,604 412 2,184 14,701Exchange adjustments (27) (143) – (37) (207)Capitalised internal development costs 79 246 – – 325Additions through business combinations – 191 7 – 198Capitalised borrowing costs 5 1 – – 6Other additions 99 141 – – 240Disposals and asset write-offs (26) (346) – – (372)Transfer (to)/from assets held for sale – (222) – 44 (178)Cost at 31 December 2013 1,631 10,472 419 2,191 14,713
Amortisation at 1 January 2012 (946) (2,105) (32) – (3,083)Exchange adjustments 20 70 – – 90Charge for the year (97) (453) (24) – (574)Disposals and asset write-offs 11 15 – – 26Transfer from assets held for sale – – (50) – (50)Amortisation at 31 December 2012 (1,012) (2,473) (106) – (3,591)Exchange adjustments 17 65 1 – 83Charge for the year (128) (536) (18) – (682)Disposals and asset write-offs 21 2 – – 23Transfer to assets held for sale – 85 – – 85Amortisation at 31 December 2013 (1,102) (2,857) (123) – (4,082)
Impairment at 1 January 2012 (36) (592) – (27) (655)Exchange adjustments – 20 2 1 23Impairment losses (3) (536) (131) (26) (696)Disposals and asset write-offs – 379 – – 379Impairment at 31 December 2012 (39) (729) (129) (52) (949)Exchange adjustments – 9 – 1 10Impairment losses (6) (702) (11) (26) (745)Disposals and asset write-offs 4 332 – – 336Impairment at 31 December 2013 (41) (1,090) (140) (77) (1,348)
Total amortisation and impairment at 31 December 2012 (1,051) (3,202) (235) (52) (4,540)Total amortisation and impairment at 31 December 2013 (1,143) (3,947) (263) (77) (5,430)
Net book value at 1 January 2012 376 5,079 96 2,251 7,802
Net book value at 31 December 2012 450 7,402 177 2,132 10,161
Net book value at 31 December 2013 488 6,525 156 2,114 9,283
The net book value of computer software includes £247 million (2012 – £303 million) of internally generated costs.
The charge for impairments in the year includes the impairments of Lovaza, reflecting a reassessment of the Group’s expectations on the likelihood of potential generic competition; Chemocentryx, Retigabine and Panmira/Flair. The carrying value at 31 December 2013 of intangible assets, for which impairments have been charged or reversed in the year, following those impairments or reversals, was £290 million (2012 – £253 million).

160 GSK Annual Report 2013
Financial statements Notes to the financial statements
19 Other intangible assets continuedAmortisation and impairment losses, net of reversals, have been charged in the income statement as follows:
Amortisation Net impairment losses
2013 £m
2012 (restated
£m)
2013
£m
2012 (restated
£m)
Cost of sales 451 378 408 309Selling, general and administration 128 97 6 3Research and development 103 99 331 384
682 574 745 696
Licences, patents, etc. includes a large number of acquired licences, patents, know-how agreements and marketing rights, which are either marketed or in use, or still in development. The net book value includes £93 million (2012 – £8 million) of internally generated costs. Note 38, ‘Acquisitions and disposals’ gives details of additions through business combinations in the year. The book values of the largest individual items are as follows:
2013 £m
2012 £m
Dolutegravir 1,769 1,777Benlysta 1,142 1,183FluLaval/Fluviral 466 549Selzentry 235 251Arzerra 271 276Okairos technology platform 190 –Lovaza 123 445Duac 120 130Toctino 110 128Fraxiparine – 91Others 2,099 2,572
6,525 7,402
Indefinite life brands comprise a portfolio of Consumer Healthcare products primarily acquired with the acquisitions of Sterling Winthrop, Inc. in 1994, Block Drug Company, Inc. in 2001 and CNS, Inc. in 2006, together with a number of pharmaceutical brands from the acquisition of Stiefel Laboratories, Inc. in 2009. The book values of the major brands are as follows:
2013 £m
2012 £m
Panadol 393 413Sensodyne 257 256Stiefel trade name 199 201Breathe Right 192 191Physiogel 166 174Polident 109 108Biotene 106 106Corega 97 97Poligrip 67 66Others 528 520
2,114 2,132
Each of these brands is considered to have an indefinite life, given the strength and durability of the brand and the level of marketing support. The brands are in relatively similar stable and profitable market sectors, with similar risk profiles, and their size, diversification and market shares mean that the risk of market-related factors causing a reduction in the lives of the brands is considered to be relatively low. The Group is not aware of any material legal, regulatory, contractual, competitive, economic or other factor which could limit their useful lives. Accordingly, they are not amortised.
Each brand is tested annually for impairment and other amortised intangible assets are tested when indicators of impairment arise. This testing applies a fair value less costs of disposal methodology, generally using five year post-tax cash flow forecasts with a terminal value calculation and a discount rate equal to the Group post-tax WACC of 7%, adjusted where appropriate for country and currency specific risks. This valuation methodology uses significant inputs which are not based on observable market data, and therefore this valuation technique is classified as level 3 of the fair value hierarchy. The main assumptions include future sales price and volume growth, product contribution and the future expenditure required to maintain the product’s marketability and registration in the relevant jurisdictions. These assumptions are based on past experience and are reviewed as part of management’s budgeting and strategic planning cycle for changes in market conditions and sales erosion through competition. The terminal growth rates applied of between nil and 3% are management’s estimates of future long-term average growth rates of the relevant markets. In each case the valuations indicate sufficient headroom such that a reasonably possible change to key assumptions is unlikely to result in an impairment of these intangible assets.

GSK Annual Report 2013 161
20 Investments in associates and joint venturesJoint
ventures £m
Associates
£m
2013 Total
£m
Joint ventures
£m
Associates
£m
2012 Total
£m
At 1 January 22 557 579 29 531 560Exchange adjustments (3) (109) (112) (3) (32) (35)Additions 1 7 8 58 41 99Disposals (1) (139) (140) – – –Transfer to other investments – (37) (37) – – –Distributions received (2) (16) (18) (25) (21) (46)Other movements – – – (7) (21) (28)(Loss)/profit after tax recognised in the consolidated income statement (2) 45 43 (30) 59 29At 31 December 15 308 323 22 557 579
Investments in joint ventures principally arise from a 50% interest in one joint venture, Japan Vaccine Co., Ltd., with Daiichi Sankyo Co., Ltd. The joint venture holds the development and commercial rights for existing preventative vaccines from both parent companies. It will supply vaccines including Human Papillomavirus (HPV) vaccine, Rotavirus vaccine, Seasonal flu vaccine, Mumps vaccine, Diphtheria Pertussis (DTP) vaccine and Measles Rubella vaccine (MRV) in Japan.The Group held one significant associate at 31 December 2013, Aspen Pharmacare Holdings Limited. At 31 December 2013, the Group owned 56.5 million shares or 12.4% of Aspen. Aspen, listed on the Johannesburg Stock Exchange, is Africa’s largest pharmaceutical manufacturer and a major supplier of branded and generic pharmaceutical, healthcare and nutritional products to the southern African and selected international markets. The investment had a market value of £872 million (2012 – £1,037 million). Although the Group holds less than 20% of the ownership interest and voting control of Aspen, the Group has the ability to exercise significant influence through both its shareholding and its nominated director’s active participation on the Aspen Board of Directors. During the year the Group disposed of 6.2% of its shareholding (see Note 35).
Summarised balance sheet information in respect of Aspen is set out below:
2013 £m
2012 £m
Non-current assets 1,442 1,268Current assets 968 789
Current liabilities (869) (564)Non-current liabilities (672) (520)
Net assets 869 973
The summarised balance sheet information in respect of Aspen is based on preliminary results information and analysts forecasts available at 31 December 2013 with adjustments for transactions between GSK and Aspen.
A reconciliation of the summarised financial information to the carrying amount of the Aspen investment is set out below:2013
£m2012
£m
At 1 January 973 797Profit for the year 247 313Other comprehensive income 192 163Exchange adjustments (289) 39Dividends paid (45) (54)Other movements (209) (285)At 31 December 869 973
Interest in associated undertaking at 12.4% (2012 – 18.6%) 108 181Goodwill 121 249
Carrying value at 31 December 229 430

162 GSK Annual Report 2013
Financial statements Notes to the financial statements
21 Other investments2013
£m2012
£m
At 1 January 787 590Exchange adjustments (25) (31)Additions 132 229 Net fair value movements 379 78Impairment losses (71) (28)Transfer from investments in associates and joint ventures 58 –Equity investments converted into subsidiary on acquisition of business – (23)Disposals (58) (28)At 31 December 1,202 787
Other investments comprise non-current equity investments which are available-for-sale investments recorded at fair value at each balance sheet date. For investments traded in an active market, the fair value is determined by reference to the relevant stock exchange quoted bid price. For other investments, the fair value is estimated by management with reference to relevant available information, including the current market value of similar instruments and discounted cash flows of the underlying net assets. The Group holds a number of equity investments in entities where the Group has entered into research collaborations. Other investments include listed investments of £1,000 million (2012 – £589 million), the increase arising from both additions and fair value adjustments.
Additions in the year include further investments in Theravance Inc. (Theravance) of £83 million. Net fair value movements include an increase in the value of the investment in Theravance of £212 million. Although GSK owns 27% of the common stock of Theravance it is accounted for as an equity investment due to voting and other restrictions contained in GSK’s governance agreement with Theravance which prevent the Group from exerting significant influence.
On disposal of investments, fair value movements are reclassified from equity to the income statement based on average cost for shares acquired at different times.
The impairment losses recorded above have been recognised in the income statement for the year within other operating income, together with amounts reclassified from the fair value reserve on recognition of the impairments. These impairments initially result from prolonged or significant declines in the fair value of the equity investments below acquisition cost, subsequent to which any further declines in fair value are immediately taken to the income statement.
Other investments include assets that have been impaired. The carrying value of these assets at 31 December has been calculated as follows:
2013 £m
2012 £m
Original cost 555 481Cumulative impairments recognised in the income statement (410) (381)Subsequent fair value increases 147 71Carrying value at 31 December 292 171
22 Other non-current assets2013
£m2012
£m
Amounts receivable under insurance contracts 396 359Pension schemes in surplus 330 124Other receivables 163 199
889 682
23 Inventories2013
£m2012
£m
Raw materials and consumables 937 965Work in progress 1,450 1,337Finished goods 1,513 1,667
3,900 3,969

GSK Annual Report 2013 163
24 Trade and other receivables 2013
£m2012
£m
Trade receivables, net of provision for bad and doubtful debts 3,966 4,115Prepaid pension contributions – 1Other prepayments and accrued income 290 284Interest receivable 9 11Employee loans and advances 37 40Other receivables 1,140 791
5,442 5,242
Trade receivables include £262 million (2012 – £257 million) after provision for bad and doubtful debts (£294 million before provision, 2012 – £315 million) due from state hospital authorities in Greece, Ireland, Italy, Portugal and Spain. Trade receivables also include £19 million (2012 – £31 million) due from associates and joint ventures. Other receivables includes £233 million (2012– £nil) due from associates and joint ventures.
Bad and doubtful debt provision2013
£m2012
£m
At 1 January 165 152Exchange adjustments (2) (5)Charge for the year 29 34Subsequent recoveries of amounts provided for (48) (12)Utilised (7) (4)At 31 December 137 165
25 Cash and cash equivalents2013
£m2012
£m
Cash at bank and in hand 2,549 1,465Short-term deposits 2,985 2,719
5,534 4,184
The increase in cash and cash equivalents reflects disposal proceeds of £2.5 million, largely received towards the end of 2013.
26 Assets held for sale2013
£m2012
£m
Land and buildings – 10Plant, equipment and vehicles – 9Intangible assets 1 45
1 64
Non-current assets are transferred to assets held for sale when it is expected that their carrying amounts will be recovered principally through disposal and a sale is considered likely. They are held at the lower of carrying amount and fair value less costs to sell.

164 GSK Annual Report 2013
Financial statements Notes to the financial statements
27 Trade and other payables2013
£m2012
£m
Trade payables 2,739 2,666Wages and salaries 1,049 915Social security 109 112Other payables 906 881Deferred income 167 162Customer return and rebate accruals 1,599 1,640Other accruals 1,748 1,678
8,317 8,054
At 31 December 2013, Other payables include £620 million in respect of the maximum potential amount payable to non-controlling shareholders in GSK Pharmaceuticals Ltd, the Group’s pharmaceuticals subsidiary in India, under a voluntary open offer to purchase additional shares announced in December 2013. The purchase is expected to complete in the first half of 2014. At 31 December 2012, Other payables include £585 million in respect of the maximum potential amount payable to non-controlling shareholders in GSK Consumer Healthcare Ltd, the Group’s consumer healthcare subsidiary in India (see Note 39).
Customer return and rebate accruals are provided for by the Group at the point of sale in respect of the estimated rebates, discounts or allowances payable to customers, including £1,188 million (2012 – £1,210 million) in respect of US Pharmaceuticals and Vaccines. Accruals are made at the time of sale but the actual amounts paid are based on claims made some time after the initial recognition of the sale. As the amounts are estimated they may not fully reflect the final outcome and are subject to change dependent upon, amongst other things, the types of buying group and product sales mix. The level of accrual is reviewed and adjusted quarterly in the light of historical experience of actual rebates, discounts or allowances given and returns made and any changes in arrangements. Future events could cause the assumptions on which the accruals are based to change, which could affect the future results of the Group.
Trade and other payables include £9 million (2012 – £19 million) due to associates and joint ventures.
28 Pensions and other post-employment benefits
Pension and other post-employment costs
2013
£m
2012 (restated
£m)
2011 (restated
£m)
UK pension schemes 139 (230) 112US pension schemes 95 92 89Other overseas pensions schemes 111 129 129Unfunded post-retirement healthcare schemes (175) 104 84
170 95 414Analysed as:Funded defined benefit/hybrid pension schemes 283 (67) 258Unfunded defined benefit pension schemes 30 14 26Unfunded post-retirement healthcare schemes (175) 104 84Defined benefit schemes 138 51 368Defined contribution pension schemes 32 44 46
170 95 414
The net reduction in the post-retirement healthcare schemes cost in 2013 arises from the restructuring of US post-retirement medical obligations. The reduction in the UK pension scheme cost in 2012 relates to the one-off adjustments arising from the capping of future pensionable salary increases and a change in the basis of future discretionary pension increased from RPI to CPI in certain legacy plans. For further details see page 165.
The costs of the defined benefit pension and post-retirement healthcare schemes are charged in the income statement as follows:
2013
£m
2012 (restated
£m)
2011 (restated
£m)
Cost of sales 104 (2) 118Selling, general and administration 27 114 196Research and development 7 (61) 54
138 51 368
GSK entities operate pension arrangements which cover the Group’s material obligations to provide pensions to retired employees. These arrangements have been developed in accordance with local practices in the countries concerned. Pension benefits can be provided by state schemes; by defined contribution schemes, whereby retirement benefits are determined by the value of funds arising from contributions paid in respect of each employee; or by defined benefit schemes, whereby retirement benefits are based on employee pensionable remuneration and length of service. Some ‘hybrid’ defined benefit schemes also include defined contribution sections.

GSK Annual Report 2013 165
28 Pensions and other post-employment benefits continuedPension costs of defined benefit schemes for accounting purposes have been calculated using the projected unit method. In certain countries pension benefits are provided on an unfunded basis, some administered by trustee companies. Formal, independent, actuarial valuations of the Group’s main plans are undertaken regularly, normally at least every three years.
Actuarial movements in the year are recognised through the statement of comprehensive income. Discount rates are derived from AA rated corporate bond yields except in countries where there is no deep market in corporate bonds where government bond yields are used. Discount rates are selected to reflect the term of the expected benefit payments. Projected inflation rate and pension increases are long-term predictions based on the yield gap between long-term index-linked and fixed interest Gilts. In the UK, mortality rates are determined by adjusting the SAPS standard mortality tables to reflect recent scheme experience. These rates are then projected to reflect improvements in life expectancy in line with the CMI projections with a long-term rate of improvement of 1.25% per year for both males and females. In the USA, mortality rates are calculated using the RP2000 fully generational table, projected using scale AA, with the white collar adjustment.
The average life expectancy assumed now for an individual at the age of 60 and projected to apply in 2033 for an individual then at the age of 60 is as follows:
UK USA
Male Years
Female Years
Male Years
Female Years
Current 27.5 29.7 24.9 26.4Projected for 2033 29.4 31.5 26.7 27.6
The assets of funded schemes are generally held in separately administered trusts, either as specific assets or as a proportion of a general fund, or are insurance contracts. Assets are invested in different classes in order to maintain a balance between risk and return. Investments are diversified to limit the financial effect of the failure of any individual investment. The Group reviewed the investment strategy of the UK plans in 2011 and the asset allocation for the UK plans has been adjusted to approximately 55% return seeking assets and 45% liability matching assets. In 2013, the target asset allocation of the US plans was also updated to 55% return seeking assets and 45% liability matching assets.
In the UK the defined benefit pension schemes operated for the benefit of former Glaxo Wellcome employees and former SmithKline Beecham employees remain separate. These schemes were closed to new entrants in 2001 and subsequent UK employees are entitled to join a defined contribution scheme. In the USA the former Glaxo Wellcome and SmithKline Beecham defined benefit schemes were merged during 2001. In addition, the Group operates a number of post-retirement healthcare schemes, the principal one of which is in the USA.
During 2013, the Group restructured US post-retirement medical obligations for both active and retired members under the age of 65. The current plan for participants over 65, paid for medical expenses in excess of those covered by Medicare Part A and Part B as well as for prescription drugs. Under the new arrangement these participants will instead be eligible to receive an amount, from age 65, from a health reimbursement account, based on years service, subject to an inflation linked maximum of $1,500 per year. Those already retired and over the age of 65 have also been given the option to switch to this new arrangement. The impact of this change in 2013 is a credit to the income statement of £279 million and a similar reduction in the post-retirement obligation.
During 2012, the Group changed its policy towards granting discretionary pension increase in the Smithkline Beecham defined benefit schemes. In the year, the Group also introduced a limit for all UK defined benefit schemes of 2% per year on the rate at which pensionable pay may increase.
The Group has applied the following financial assumptions in assessing the defined benefit liabilities:
UK USA Rest of World
2013 % pa
2012 % pa
2011 % pa
2013 % pa
2012 % pa
2011 % pa
2013 % pa
2012 % pa
2011 % pa
Rate of increase of future earnings 2.00 2.00 4.00 4.00 4.00 4.00 2.80 3.00 2.90Discount rate 4.50 4.40 4.80 4.60 3.80 4.40 3.40 3.30 4.20Expected pension increases 3.40 3.00 3.00 n/a n/a n/a 2.10 1.90 1.90Cash balance credit/conversion rate n/a n/a n/a 4.20 3.35 3.75 0.90 1.30 1.20Inflation rate 3.40 3.00 3.00 2.25 2.25 2.25 1.80 1.70 1.60
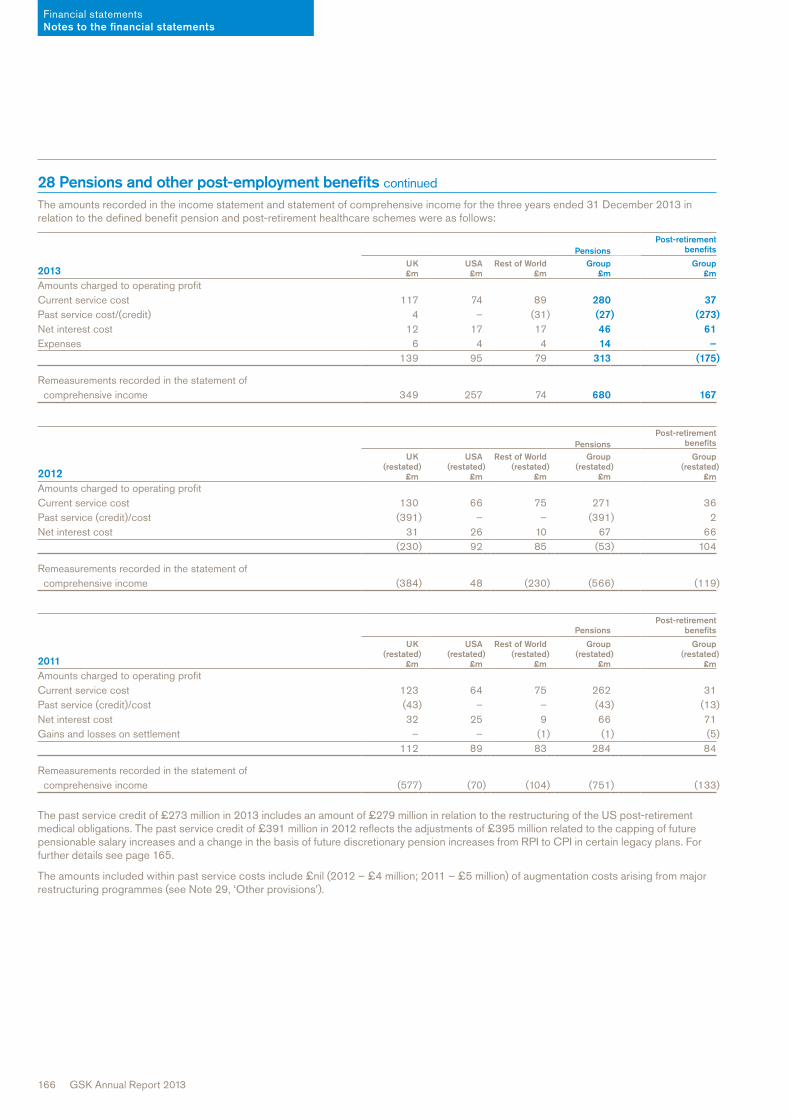
166 GSK Annual Report 2013
Financial statements Notes to the financial statements
28 Pensions and other post-employment benefits continuedThe amounts recorded in the income statement and statement of comprehensive income for the three years ended 31 December 2013 in relation to the defined benefit pension and post-retirement healthcare schemes were as follows:
Pensions
Post-retirement benefits
2013UK £m
USA £m
Rest of World £m
Group £m
Group £m
Amounts charged to operating profitCurrent service cost 117 74 89 280 37Past service cost/(credit) 4 – (31) (27) (273)Net interest cost 12 17 17 46 61Expenses 6 4 4 14 –
139 95 79 313 (175)
Remeasurements recorded in the statement of comprehensive income 349 257 74 680 167
Pensions
Post-retirement benefits
2012UK
(restated £m
)USA
(restated £m
)Rest of World
(restated £m
)Group
(restated £m
)Group
(restated £m
)
Amounts charged to operating profitCurrent service cost 130 66 75 271 36Past service (credit)/cost (391) – – (391) 2Net interest cost 31 26 10 67 66
(230) 92 85 (53) 104
Remeasurements recorded in the statement of comprehensive income (384) 48 (230) (566) (119)
Pensions
Post-retirement benefits
2011
UK (restated
£m)
USA (restated
£m)
Rest of World (restated
£m)
Group (restated
£m)
Group (restated
£m)
Amounts charged to operating profitCurrent service cost 123 64 75 262 31Past service (credit)/cost (43) – – (43) (13)Net interest cost 32 25 9 66 71Gains and losses on settlement – – (1) (1) (5)
112 89 83 284 84
Remeasurements recorded in the statement of comprehensive income (577) (70) (104) (751) (133)
The past service credit of £273 million in 2013 includes an amount of £279 million in relation to the restructuring of the US post-retirement medical obligations. The past service credit of £391 million in 2012 reflects the adjustments of £395 million related to the capping of future pensionable salary increases and a change in the basis of future discretionary pension increases from RPI to CPI in certain legacy plans. For further details see page 165.
The amounts included within past service costs include £nil (2012 – £4 million; 2011 – £5 million) of augmentation costs arising from major restructuring programmes (see Note 29, ‘Other provisions’).

GSK Annual Report 2013 167
28 Pensions and other post-employment benefits continuedA summarised balance sheet presentation of the Group defined benefit pension schemes and other post-retirement benefits is set out in the table below:
2013
£m
2012 (restated
£m)
2011 (restated
£m)
Recognised in Other non-current assets: Pension schemes in surplus 330 124 20Recognised in Pensions and other post-employment benefits: Pension schemes in deficit (943) (1,436) (1,496) Post-retirement benefits (1,246) (1,685) (1,616)
(2,189) (3,121) (3,112)
The fair values of the assets and liabilities of the UK and US defined benefit pension schemes, together with aggregated data for other defined benefit pension schemes in the Group are as follows:
At 31 December 2013UK £m
USA £m
Rest of World £m
Group £m
Equities: – listed 6,474 1,202 422 8,098 – unlisted – – 9 9Property: – unlisted 254 131 5 390Corporate bonds: – listed 1,484 531 57 2,072 – unlisted – – 20 20Government bonds: – listed 2,376 320 517 3,213Other assets: – listed 284 330 48 662 – unlisted 372 – 389 761Fair value of assets 11,244 2,514 1,467 15,225Present value of scheme obligations (11,132) (2,793) (1,913) (15,838)Recognised on the balance sheet 112 (279) (446) (613)
Included in other non-current assets 292 – 38 330Included in pensions and other post-employment benefits (180) (279) (484) (943)
112 (279) (446) (613)
Actual return on plan assets 1,383 218 98 1,699
In December 2010, the UK scheme purchased an insurance contract that will guarantee payment of specified pensioner liabilities. This is included within ‘Other assets’ and the ‘Present value of scheme obligations’ in the table above at a value of £775 million (2012 – £751 million; 2011 – £735 million). Additional insurance contracts have also been purchased in other countries and are included within ‘Other assets’ in the table above at a value of £366 million (2012 – £327 million; 2011 – £306 million). In October 2013, the UK schemes entered into repurchase agreements to gain exposure to index-linked gilts. The related loan is also included within ‘Other assets’ at a value of £(407) million (2012 – £nil; 2011 – £nil).
At 31 December 2012
UK (restated
£m)
USA (restated
£m)
Rest of World (restated
£m)
Goup (restated
£m)
Equities: – listed 5,270 1,018 276 6,564Property: – unlisted 265 116 5 386Corporate bonds: – listed 1,439 586 19 2,044Government bonds: – listed 2,054 427 657 3,138Other assets: – listed 291 374 93 758 – unlisted 662 – 327 989Fair value of assets 9,981 2,521 1,377 13,879Present value of scheme obligations (10,298) (2,979) (1,914) (15,191)Recognised on the balance sheet (317) (458) (537) (1,312)
Included in other non-current assets 103 – 21 124Included in pensions and other post-employment benefits (420) (458) (558) (1,436)
(317) (458) (537) (1,312)
Actual return on plan assets 665 308 118 1,091

168 GSK Annual Report 2013
Financial statements Notes to the financial statements
28 Pensions and other post-employment benefits continued
At 31 December 2011
UK (restated
£m)
USA (restated
£m)
Rest of World (restated
£m)
Goup (restated
£m)
Equities: – listed 4,349 907 254 5,510Property: – listed 274 163 6 443Corporate bonds: – listed 1,306 797 8 2,111Government bonds: – listed 2,048 427 665 3,140Other assets: – listed – 161 45 206 – unlisted 1,142 – 306 1,448Fair value of assets 9,119 2,455 1,284 12,858Present value of scheme obligations (9,779) (2,945) (1,610) (14,334)Recognised on the balance sheet (660) (490) (326) (1,476)
Included in other non-current assets – – 20 20Included in pensions and other post-employment benefits (660) (490) (346) (1,496)
(660) (490) (326) (1,476)
Actual return on plan assets 285 188 21 494
Pensions
Post-retirement benefits
Movements in fair values of assets
UK(restated
£m)
USA (restated
£m)
Rest of World (restated
£m)
Group(restated
£m)
Group(restated
£m)
Assets at 1 January 2011 8,618 2,310 1,228 12,156 –Exchange adjustments – 18 (11) 7 –Interest income 405 109 55 569 –Remeasurement (120) 79 (34) (75) –Employer contributions 530 146 108 784 70Scheme participants’ contributions 7 – 9 16 12Benefits paid (321) (207) (71) (599) (82)Assets at 31 December 2011 9,119 2,455 1,284 12,858 –Exchange adjustments – (125) (56) (181) –Interest income 381 97 55 533 –Remeasurement 284 211 63 558 –Employer contributions 497 52 86 635 76Scheme participants’ contributions 33 – 9 42 15Benefits paid (333) (169) (58) (560) (91)Settlements and curtailments – – (6) (6) –Assets at 31 December 2012 9,981 2,521 1,377 13,879 –Exchange adjustments – (49) (45) (94) –Interest income 385 96 45 526 –Expenses (6) (4) (4) (14)Remeasurement 998 122 53 1,173 –Employer contributions 219 20 104 343 76Scheme participants’ contributions 26 – 10 36 15Benefits paid (359) (192) (73) (624) (91)Assets at 31 December 2013 11,244 2,514 1,467 15,225 –
The UK defined benefit schemes include defined contribution sections with account balances totalling £1,366 million at 31 December 2013 (2012 – £1,112 million; 2011 – £957 million).
During 2013, the Group made special funding contributions to the UK pension schemes totalling £93 million (2012 – £366 million; 2011 – £368 million) and £nil million (2012 – £32 million; 2011 – £82 million) to the US scheme. In 2013, GSK reached an agreement with the trustees of the UK pension schemes to make additional contributions to eliminate the pension deficit identified at the 31 December 2011 actuarial funding valuation. Based on the funding agreements following the 2011 valuation, the additional contributions are expected to be £85 million in 2014. The contributions were based on a government bond yield curve approach to selecting the discount rate; the rate chosen included an allowance for expected investment returns which reflected the asset mix of the schemes.
Employer contributions for 2014, including special funding contributions, are estimated to be approximately £330 million in respect of defined benefit pension schemes and £80 million in respect of post-retirement benefits.

GSK Annual Report 2013 169
28 Pensions and other post-employment benefits continued
PensionsPost-retirement
benefits
Movements in defined benefit obligations
UK(restated
£m)
USA (restated
£m)
Rest of World (restated
£m)
Group(restated
£m)
Group(restated
£m)
Obligations at 1 January 2011 (9,119) (2,781) (1,479) (13,379) (1,459)Exchange adjustments – (24) 15 (9) (10)Service cost (123) (64) (75) (262) (31)Past service cost 43 – – 43 13Interest cost (437) (134) (64) (635) (71)Settlements and curtailments – – 1 1 5Remeasurement (457) (149) (70) (676) (133)Scheme participants’ contributions (7) – (9) (16) (12)Benefits paid 321 207 71 599 82Obligations at 31 December 2011 (9,779) (2,945) (1,610) (14,334) (1,616)Exchange adjustments – 149 74 223 78Service cost (130) (66) (75) (271) (36)Past service cost 391 – – 391 (2)Interest cost (412) (123) (65) (600) (66)Settlements and curtailments – – 6 6 –Remeasurement (668) (163) (293) (1,124) (119)Scheme participants’ contributions (33) – (9) (42) (15)Benefits paid 333 169 58 560 91Obligations at 31 December 2012 (10,298) (2,979) (1,914) (15,191) (1,685)Exchange adjustments – 46 37 83 9Service cost (117) (74) (89) (280) (37)Past service cost (4) – 31 27 273Interest cost (397) (113) (62) (572) (61)Other movements – – – – 12Remeasurement (649) 135 21 (493) 167Scheme participants’ contributions (26) – (10) (36) (15)Benefits paid 359 192 73 624 91Obligations at 31 December 2013 (11,132) (2,793) (1,913) (15,838) (1,246)
The UK defined benefit schemes include defined contribution sections with obligations totalling £1,366 million at 31 December 2013 (2012 – £1,112 million; 2011 – £957 million).
The defined benefit pension obligation is analysed as follows:
2013
£m
2012(restated
£m)
2011 (restated
£m)
Funded (15,432) (14,789) (13,956)Unfunded (406) (402) (378)
(15,838) (15,191) (14,334)
The liability for the US post-retirement healthcare scheme has been assessed using the same assumptions as for the US pension scheme, together with the assumption for future medical inflation of 6.5% (2012 – 7%), grading down to 5.0% in 2022 and thereafter. During 2013, the US post-retirement healthcare scheme was amended (see page 165 for further details). The impact of this change is a one-off reduction in the post-retirement obligation of £279 million. At 31 December 2013 the US post-retirement healthcare scheme obligation was £1,066 million (2012 – £1,504 million; 2011 – £1,446 million).
Post-retirement benefits are unfunded.

170 GSK Annual Report 2013
Financial statements Notes to the financial statements
28 Pensions and other post-employment benefits continued
The movement in the net defined benefit liability is as follows:
Fair value of assets
£m
Present value of obligation
£m
Net total £m
At 1 January 2011, restated 12,156 (13,379) (1,223)Exchange adjustments 7 (9) (2)Service cost – (262) (262)Past service cost – 43 43Interest income/cost 569 (635) (66)Settlements and curtailments – 1 1Remeasurements: Return on plan assets, excluding amounts included in interest (75) – (75) Loss from change in financial assumptions – (584) (584) Experience losses – (92) (92)Employers contributions 784 – 784Scheme participants’ contributions 16 (16) –Benefits paid (599) 599 –At 31 December 2011 12,858 (14,334) (1,476)Exchange adjustments (181) 223 42Service cost – (271) (271)Past service cost – 391 391Interest income/cost 533 (600) (67)Settlements and curtailments (6) 6 –Remeasurements: Return on plan assets, excluding amounts included in interest 558 – 558 Gain from change in demographic assumptions – 55 55 Loss from change in financial assumptions – (1,071) (1,071) Experience losses – (108) (108)Employers contributions 635 – 635Scheme participants’ contributions 42 (42) –Benefits paid (560) 560 –At 31 December 2012 13,879 (15,191) (1,312)Exchange adjustments (94) 83 (11)Service cost – (280) (280)Past service cost – 27 27Interest income/cost 526 (572) (46)Remeasurements: Return on plan assets, excluding amounts included in interest 1,173 – 1,173 Loss from change in demographic assumptions – (89) (89) Loss from change in financial assumptions – (118) (118) Experience losses – (286) (286)Employers contributions 343 – 343Scheme participants’ contributions 36 (36) –Benefits paid (624) 624 –Expenses/other movements (14) – (14)At 31 December 2013 15,225 (15,838) (613)
The remeasurements included within post-retirement benefits are detailed below:
2013 £m
2012£m
2011 £m
(Loss)/gain from change in demographic assumptions (1) 1 –Gain/(loss) from change in financial assumptions 143 (132) (130)Experience gains/(losses) 25 12 (3)
167 (119) (133)

GSK Annual Report 2013 171
28 Pensions and other post-employment benefits continued
The defined benefit pension obligation analysed by membership category is as follows:
2013 £m
2012£m
2011£m
Active 5,053 4,695 4,557Retired 7,137 6,930 6,439Deferred 3,648 3,566 3,338
15,838 15,191 14,334
The post-retirement benefit obligation analysed by membership category is as follows:
2013 £m
2012£m
2011£m
Active 545 708 615Retired 699 975 1,000Deferred 2 2 1
1,246 1,685 1,616
The weighted average duration of the defined benefit obligation is as follows:
2013 years
2012years
2011 years
Pension benefits 16 16 16Post-retirement benefits 12 11 16
Sensitivity analysisEffect of changes in assumptions used on the benefit obligations and on the 2014 annual defined benefit pension and post retirement costs after the revisions to IAS 19.
£m
A 0.25% decrease in discount rate would have the following approximate effect:
Increase in annual pension cost 32 Decrease in annual post-retirement benefits cost (1) Increase in pension obligation 554 Increase in post-retirement benefits obligation 35
A one year increase in life expectancy would have the following approximate effect:
Increase in annual pension cost 19 Increase in annual post-retirement benefits cost 2 Increase in pension obligation 359 Increase in post-retirement benefits obligation 34
A 1% increase in the rate of future healthcare inflation would have the following approximate effect:
Increase in annual post-retirement benefits cost 3 Increase in post-retirement benefits obligation 60
A 0.25% increase in inflation would have the following approximate effect:
Increase in annual pension cost 21 Increase in pension obligation 359

172 GSK Annual Report 2013
Financial statements Notes to the financial statements
29 Other provisionsLegal
and other disputes
£m
Major restructuring programmes
£m
Employee related
provisions £m
Other
provisions £m
Total £m
At 1 January 2013 527 373 227 265 1,392Exchange adjustments (20) (1) (1) 1 (21)Charge for the year 286 179 54 138 657Reversed unused (36) (15) (2) (32) (85)Unwinding of discount 1 6 – 7 14Utilised (115) (189) (18) (97) (419)Reclassifications and other movements 3 (4) – 7 6At 31 December 2013 646 349 260 289 1,544
To be settled within one year 635 160 34 163 992To be settled after one year 11 189 226 126 552At 31 December 2013 646 349 260 289 1,544
Legal and other disputesThe Group is involved in a substantial number of legal and other disputes, including notification of possible claims, as set out in Note 44 ‘Legal proceedings’. Provisions for legal and other disputes include amounts relating to product liability (principally relating to Avandia, Paxil and Poligrip), anti-trust (principally relating to Wellbutrin, Flonase and Lamictal), government investigations (principally relating to the ‘Colorado investigation’ settlement, Avandia-related investigations, Average Wholesale Price (AWP) and nominal price investigations), contract terminations, self-insurance, environmental clean-up and property rental.
The charge for the year of £286 million (£251 million net of reversals and estimated insurance recoveries) primarily related to provisions for product liability cases regarding Paxil, Poligrip and other products and various government investigations.
The discount on the provisions decreased by £nil in 2013 (2012 – £3 million) and was calculated using risk-adjusted projected cash flows and risk-free rates of return. The movement in 2013 includes a decrease of £nil (2012 – £1 million) arising from a change in the discount rate in the year.
In respect of product liability claims related to certain products, there is sufficient history of claims made and settlements to enable management to make a reliable estimate of the provision required to cover unasserted claims. The ultimate liability for such matters may vary from the amounts provided and is dependent upon the outcome of litigation proceedings, investigations and possible settlement negotiations.
It is in the nature of the Group’s business that a number of these matters may be the subject of negotiation and litigation over many years. Litigation proceedings, including the various appeal procedures, often take many years to reach resolution, and out-of-court settlement discussions can also often be protracted. The Group is in potential settlement discussions in a number of the disputes for which amounts have been provided and, based on its current assessment of the progress of these disputes, estimates that £0.6 billion of the amount provided at 31 December 2013 will be settled within one year.
At 31 December 2013, it was expected that £1 million (2012 – £3 million) of the provision made for legal and other disputes will be reimbursed by third party insurers. This amount is included within the Other receivables balances in Note 22, ‘Other non-current assets’ and Note 24, ‘Trade and other receivables’. For a discussion of legal issues, see Note 44, ‘Legal proceedings’.

GSK Annual Report 2013 173
29 Other provisions continued
Major restructuring programmesIn October 2007 the Group announced the Operational Excellence programme to improve the effectiveness and productivity of its operations (see Note 10, ‘Major restructuring costs’). In addition, in 2013, the Group initiated the Major Change restructuring programme focused on opportunities to simplify supply chain processes, build the Group’s capabilities in manufacturing and R&D and restructure the European Pharmaceuticals business.
Provisions for staff severance payments are made when management has made a formal decision to eliminate certain positions and this has been communicated to the groups of employees affected and appropriate consultation procedures completed, where appropriate. No provision is made for staff severance payments that are made immediately.
Pension augmentations arising from staff redundancies of £nil (2012 – £4 million) have been charged during the year and then transferred to the pension obligations provision as shown in Note 28, ‘Pensions and other post-employment benefits’. Asset write-downs have been recognised as impairments of property, plant and equipment in Note 17, ‘Property, plant and equipment’. The majority of the amounts provided are expected to be utilised in the next two years.
Employee related provisionsEmployee related provisions include obligations for certain medical benefits to disabled employees and their spouses in the USA. At 31 December 2013, the provision for these benefits amounted to £111 million (2012 – £113 million). Other employee benefits reflect a variety of provisions for severance costs, jubilee awards and other long-service benefits.
Other provisionsIncluded in other provisions are insurance provisions of £31 million (2012 – £29 million), onerous property lease provisions of £33 million (2012 – £16 million) and a number of other provisions including vehicle insurance and regulatory matters.
30 Other non-current liabilities2013
£m2012
£m
Accruals and deferred income 101 73Other payables 1,603 1,359
1,704 1,432
The increase in other payables primarily arises from contingent consideration of £253 million relating to the acquisition of the 50% share of the Shionogi-ViiV Healthcare joint venture previously held by Shionogi & Co Ltd in 2012.

174 GSK Annual Report 2013
Financial statements Notes to the financial statements
31 Contingent liabilitiesAt 31 December 2013, contingent liabilities, comprising guarantees, discounted bills and other items arising in the normal course of business, amounted to £198 million (2012 – £209 million). At 31 December 2013, £nil (2012 – £nil) of financial assets were pledged as collateral for contingent liabilities. Provision is made for the outcome of tax, legal and other disputes where it is both probable that the Group will suffer an outflow of funds and it is possible to make a reliable estimate of that outflow. At 31 December 2013, other than for those disputes where provision has been made, it was not possible to make a reliable estimate of the potential outflow of funds that might be required to settle disputes where the possibility of there being an outflow was more than remote. Descriptions of the significant tax, legal and other disputes to which the Group is a party are set out in Note 14, ‘Taxation’ and Note 44, ‘Legal proceedings’.
32 Net debt
Listing exchange2013
£m2012
£m
Current assets:Liquid investments 66 81Cash and cash equivalents 5,534 4,184
5,600 4,265Short-term borrowings:Bank loans and overdrafts (352) (323)Commercial paper (1,491) (1,748)Obligations under finance leases (27) (27)4.85% US$ US Medium Term Note 2013 New York Stock Exchange – (1,533)4.375% US$ US Medium Term Note 2014 London Stock Exchange (919) –
(2,789) (3,631)Long-term borrowings:4.375% US$ US Medium Term Note 2014 London Stock Exchange – (970)0.75% US$ US Medium Term Note 2015 New York Stock Exchange (601) (611)3.875% € European Medium Term Note 2015 London Stock Exchange (1,330) (1,296)0.7% US$ US Medium Term Note 2016 New York Stock Exchange (751) –1.50% US$ US Medium Term Note 2017 New York Stock Exchange (1,199) (1,219)5.625% € European Medium Term Note 2017 London Stock Exchange (1,038) (1,013)5.65% US$ US Medium Term Note 2018 New York Stock Exchange (1,653) (1,683)2.85% US$ US Medium Term Note 2022 New York Stock Exchange (1,193) (1,214)2.8% US$ US Medium Term Note 2023 New York Stock Exchange (743) –4.00% € European Medium Term Note 2025 London Stock Exchange (618) (602)3.375% £ European Medium Term Note 2027 London Stock Exchange (591) (590)5.25% £ European Medium Term Note 2033 London Stock Exchange (983) (982)5.375% US$ US Medium Term Note 2034 London Stock Exchange (299) (305)6.375% US$ US Medium Term Note 2038 New York Stock Exchange (1,641) (1,670)6.375% £ European Medium Term Note 2039 London Stock Exchange (694) (694)5.25% £ European Medium Term Note 2042 London Stock Exchange (987) (986)4.2% US$ US Medium Term Note 2043 New York Stock Exchange (294) –4.25% £ European Medium Term Note 2045 London Stock Exchange (788) (787)Obligations under finance leases (53) (49)
(15,456) (14,671)Net debt (12,645) (14,037)

GSK Annual Report 2013 175
32 Net debt continued
Current assetsLiquid investments are classified as available-for-sale investments. At 31 December 2013, they included US Treasury Notes and other government bonds. The effective interest rate on liquid investments at 31 December 2013 was approximately 0.5% (2012 – approximately 2.6%). Liquid investment balances at 31 December 2013 earning interest at floating and fixed rates amount to £65 million and £1 million respectively (2012 – £74 million and £7 million).
The effective interest rate on cash and cash equivalents at 31 December 2013 was approximately 1.3% (2012 – approximately 1.7%). Cash and cash equivalents at 31 December 2013 earning interest at floating and fixed rates amount to £5,298 million and £1 million respectively (2012 – £3,876 million and £1 million).
GSK’s policy regarding the credit quality of cash and cash equivalents is referred to in Note 41, ‘Financial instruments and related disclosures’.
Short-term borrowingsGSK has a $10 billion (£6.0 billion) US commercial paper programme, of which $2.5 billion (£1.5 billion) was in issue at 31 December 2013 (2012 – $2.9 billion (£1.7 billion)). GSK also has £1.9 billion of five year committed medium-term facilities and $2.5 billion (£1.5 billion) of 364 day committed facilities. These facilities were put in place in September 2012 and September 2013 respectively and were undrawn at 31 December 2013. Liquid investments, cash and cash equivalents were as shown in the table on page 174.
The weighted average interest rate on current bank loans and overdrafts at 31 December 2013 was 3.7% (2012 – 2.1%). The weighted average interest rate on commercial paper borrowings at 31 December 2013 was 0.18% (2012 – 0.20%).
Long-term borrowingsAt the year-end, GSK had long-term borrowings of £15.5 billion (2012 – £14.7 billion) of which £8.8 billion (2012 – £9.5 billion) falls due in more than five years. The average effective pre-swap interest rate of all notes in issue at 31 December 2013 was approximately 4.5% (2012 – approximately 4.9%).
Long-term borrowings repayable after five years carry interest at effective rates between 3.11% and 6.76%. The repayment dates range from 2022 to 2045.
Pledged assetsThe Group has pledged investments in US Treasury Notes with a par value of $105 million (£63 million) (2012 – $119 million (£74 million)) as security against irrevocable letters of credit issued on the Group’s behalf in respect of the Group’s self-insurance activity. Provisions in respect of self-insurance are included within the provisions for legal and other disputes discussed in Note 29, ‘Other provisions’. At 31 December 2013, £69 million of the Group’s cash balance was held in an escrow account in connection with the Group’s offer to purchase shares in its Indian pharmaceutical subsidiary. In addition, £48 million (2012 – £49 million) of assets included in Note 22, ‘Other non-current assets’, which do not form part of Net debt, were pledged as collateral against future rental payments under operating lease arrangements entered into by Human Genome Sciences, Inc. prior to its acquisition by the Group.
Finance lease obligations
2013 £m
2012£m
Rental payments due within one year 29 30Rental payments due between one and two years 24 21Rental payments due between two and three years 16 17Rental payments due between three and four years 9 9Rental payments due between four and five years 4 2Rental payments due after five years 5 6Total future rental payments 87 85Future finance charges (7) (9)Total finance lease obligations 80 76

176 GSK Annual Report 2013
Financial statements Notes to the financial statements
33 Share capital and share premium account
Ordinary Shares of 25p eachShare
premium
Number £m £m
Share capital authorisedAt 31 December 2011 10,000,000,000 2,500At 31 December 2012 10,000,000,000 2,500At 31 December 2013 10,000,000,000 2,500Share capital issued and fully paidAt 1 January 2011 5,670,458,177 1,418 1,428Issued under employee share schemes 21,949,144 5 245Share capital cancelled (142,204,223) (36) –
At 31 December 2011 5,550,203,098 1,387 1,673Issued under employee share schemes 28,045,821 7 349Share capital cancelled (180,652,950) (45) –At 31 December 2012 5,397,595,969 1,349 2,022Issued under employee share schemes 44,610,727 12 573Share capital cancelled (100,000,000) (25) –At 31 December 2013 5,342,206,696 1,336 2,595
31 December 2013 000
31 December 2012000
Number of shares issuable under employee share schemes (Note 42) 91,303 114,985Number of unissued shares not under option 4,566,351 4,487,419
At 31 December 2013, of the issued share capital, 63,613,528 shares were held in the ESOP Trusts, 487,433,663 shares were held as Treasury shares and 4,791,159,505 shares were in free issue. All issued shares are fully paid. The nominal, carrying and market values of the shares held in the ESOP Trusts are disclosed in Note 42, ‘Employee share schemes’.
A total of 92 million shares were purchased by the company during 2013 at a cost of £1,504 million and 100 million shares were cancelled.
Monthly purchases of shares during 2013 were as follows:
Number of shares
000
Average share price excluding commission and stamp duty
£March 3,480,000 14.97May 6,303,185 17.29June 15,570,000 16.46July 5,101,000 16.75August 11,635,900 16.70September 17,323,000 16.01October 23,834,500 15.67November 4,083,997 16.18December 5,150,754 15.95Total 92,482,336 16.18
For details of substantial shareholdings refer to page 242.

GSK Annual Report 2013 177
34 Movements in equity Retained earnings and other reserves amounted to £3,066 million at 31 December 2013 (2012 – £2,429 million; 2011 – £4,959 million) of which £307 million (2012 – £372 million; 2011 – £421 million) relates to joint ventures and associated undertakings. The cumulative translation exchange in equity is as follows:
Net translation exchange included in:
Retained earnings
(restated) £m
Fair value reserve
£m
Non-
controlling interests
£m
Total translation exchange (restated)
£m
At 1 January 2011 1,309 11 (24) 1,296Exchange movements on overseas net assets (259) 4 (44) (299)Reclassification of exchange on liquidation of overseas subsidiary (1) – – (1)At 31 December 2011 1,049 15 (68) 996Exchange movements on overseas net assets (203) (23) (30) (256)At 31 December 2012 846 (8) (98) 740Exchange movements on overseas net assets (260) 5 (35) (290)At 31 December 2013 586 (3) (133) 450
The analysis of other comprehensive income by equity category is as follows:
2013
Retained earnings
£m
Other
reserves £m
Non- controlling
interests £m
Total £m
Items that may be subsequently reclassified to income statement: Exchange movements on overseas net assets and net investment hedges (260) 5 – (255) Fair value movements on available-for-sale investments – 367 – 367 Deferred tax on fair value movements on available-for-sale investments – (29) – (29) Reclassification of fair value movements on available-for-sale investments – (38) – (38) Deferred tax on reclassification of fair value movements on available-for-sale investments – 7 – 7 Reclassification of cash flow hedges to income statement – 2 – 2 Fair value movements on cash flow hedges – (9) – (9) Deferred tax on fair value movements on cash flow hedges – 1 – 1 Share of other comprehensive income of associates and joint ventures 15 – – 15
Items that will not be reclassified to income statement: Exchange movements on overseas net assets of non-controlling interests – – (35) (35) Actuarial gains on defined benefit plans 847 – – 847 Deferred tax on actuarial movements in defined benefit plans (286) – – (286)Other comprehensive income/(expense) for the year 316 306 (35) 587
2012
Retained earnings
(restated) £m
Other
reserves £m
Non- controlling
interests £m
Total
(restated) £m
Items that may be subsequently reclassified to income statement: Exchange movements on overseas net assets and net investment hedges (203) (23) – (226) Fair value movements on available-for-sale investments – 77 – 77 Deferred tax on fair value movements on available-for-sale investments – (10) – (10) Reclassification of fair value movements on available-for-sale investments – (19) – (19) Deferred tax on reclassification of fair value movements on available-for-sale investments – 10 – 10 Reclassification of cash flow hedges to income statement – 2 – 2 Fair value movements on cash flow hedges – (6) – (6) Share of other comprehensive income of associates and joint ventures 30 – – 30
Items that will not be reclassified to income statement: Exchange movements on overseas net assets of non-controlling interests – – (30) (30) Actuarial losses on defined benefit plans (685) – – (685) Deferred tax on actuarial movements in defined benefit plans 193 – – 193Other comprehensive (expense)/income for the year (665) 31 (30) (664)

178 GSK Annual Report 2013
Financial statements Notes to the financial statements
34 Movements in equity continued
2011
Retained earnings
(restated) £m
Other
reserves £m
Non- controlling
interests £m
Total
(restated) £m
Items that may be subsequently reclassified to income statement: Exchange movements on overseas net assets and net investment hedges (259) 4 – (255) Reclassification of exchange on liquidation or disposal of overseas subsidiaries (1) – – (1) Fair value movements on available-for-sale investments – (20) – (20) Deferred tax on fair value movements on available-for-sale investments – 23 – 23 Reclassification of fair value movements on available-for-sale investments – (29) – (29) Reclassification of cash flow hedges to income statement – 1 – 1 Share of other comprehensive expense of associates and joint ventures (8) – – (8)
Items that will not be reclassified to income statement: Exchange movement on overseas net assets of non-controlling interests – – (44) (44) Actuarial losses on defined benefit plans (884) – – (884) Deferred tax on actuarial movements in defined benefit plans 243 – – 243Other comprehensive expense for the year (909) (21) (44) (974)
The analysis of other reserves is as follows:
ESOP Trust shares
£m
Fair value reserve
£m
Cash flow hedge reserve
£m
Other reserves
£m
Total
£mAt 1 January 2011 (845) 89 (4) 2,022 1,262Transferred to income and expense in the year on disposals – (10) 3 – (7)Transferred to income and expense in the year on impairment – (19) – – (19)Net fair value movement in the year – 10 (5) – 5Ordinary Shares purchased and cancelled – – – 36 36Ordinary Shares acquired by ESOP Trusts (36) – – – (36)Ordinary Shares transferred by ESOP Trusts 44 – – – 44Write-down of shares held by ESOP Trusts 345 – – – 345Forward contract on non-controlling interest – – – (28) (28)At 31 December 2011 (492) 70 (6) 2,030 1,602Transferred to income and expense in the year on disposals – (18) 2 – (16)Transferred to income and expense in the year on impairment – (1) – – (1)Net fair value movement in the year – 54 (6) – 48Ordinary Shares purchased and cancelled – – – 45 45Ordinary Shares acquired by ESOP Trusts (37) – – – (37)Ordinary Shares transferred by ESOP Trusts 58 – – – 58Write-down of shares held by ESOP Trusts 80 – – – 80Forward contract on non-controlling interest – – – 8 8At 31 December 2012 (391) 105 (10) 2,083 1,787Transferred to income and expense in the year on disposals – (38) 2 – (36)Transferred to income and expense in the year on impairment – (1) – – (1)Net fair value movement in the year – 347 (4) – 343Ordinary Shares purchased and cancelled – – – 25 25Ordinary Shares acquired by ESOP Trusts (45) – – – (45)Write-down of shares held by ESOP Trusts 80 – – – 80At 31 December 2013 (356) 413 (12) 2,108 2,153
Other reserves include various non-distributable merger and pre-merger reserves amounting to £1,849 million at 31 December 2013 (2012 – £1,849 million; 2011 – £1,849 million). Other reserves also include the capital redemption reserve created as a result of the share buy-back programme amounting to £280 million at 31 December 2013 (2012 – £256 million; 2011 – £211 million).

GSK Annual Report 2013 179
35 Related party transactionsGSK held a 12.4% interest in Aspen Pharmacare Holdings Limited at 31 December 2013 (2012 – 18.6%). During 2013, GSK sold 28.2 million shares, representing 6.2% of Aspen’s share capital for £429 million.
During 2013, GSK distributed £64 million (2012 – £68 million) of its products through Aspen’s extensive distribution network. At 31 December 2013, the balance due to GSK from Aspen was £11 million (2012 – £12 million) and the balance payable by GSK to Aspen was £9 million (2012 – £3 million). On 31 December 2013, GSK completed the sale of the worldwide intellectual property rights (excluding certain EMAP markets) of the anti-coagulant products business to the Aspen Group, together with related inventory and a manufacturing site for consideration of £732 million, of which £233 million has been deferred and is receivable in 2014.
In May 2013, the ViiV Healthcare Shire Canada joint venture was dissolved. GSK acquired the net assets of the former partnership through its subsidiary ViiV Healthcare ULC. ViiV Canada now owns and operates the business of the former partnership.
At 31 December 2013, GSK held a 50% interest in Japan Vaccine Co. Ltd (JVC) through its subsidiary GlaxoSmithKline K.K. This joint venture with Daiichi Sankyo Co., Ltd is primarily responsible for the development and marketing of certain prophylactic vaccines in Japan. During 2013, GSK sold £36 million of its vaccine products into the joint venture. At 31 December 2013, the balance due to GSK from JVC was £8 million and the balance payable by GSK to JVC was £nil.
The aggregate compensation of the Directors and CET is given in Note 9, ‘Employee Costs’.
36 Adjustments reconciling profit after tax to operating cash flows
2013£m
2012(restated)
£m
2011 (restated)
£m
Profit after tax 5,628 4,678 5,405
Tax on profits 1,019 1,922 2,220Share of after tax profits of associates and joint ventures (43) (29) (15)Finance income net of finance expense 706 729 709Depreciation 732 871 893Amortisation of intangible assets 682 574 530Impairment and assets written off 928 654 346Profit on sale of businesses (1,331) – –Profit on sale of intangible assets (78) (652) (236)Profit on sale of investments in associates (282) – (585)Profit on sale of equity investments (36) (16) (10)Changes in working capital: (Increase)/decrease in inventories (95) 37 (157) Decrease in trade receivables 16 183 192 Increase in other receivables (218) (27) (69) Increase in trade payables 125 177 442 Increase in other payables 393 132 2 Decrease in pension and other provisions (165) (2,839) (2,108)Share-based incentive plans 319 220 198Fair value adjustments (12) (575) (10)Other 211 9 (34)
2,871 1,370 2,308
Cash generated from operations 8,499 6,048 7,713

180 GSK Annual Report 2013
Financial statements Notes to the financial statements
37 Reconciliation of net cash flow to movement in net debt2013
£m2012
£m2011
£m
Net debt at beginning of year (14,037) (9,003) (8,859)
Increase/(decrease) in cash and bank overdrafts 1,473 (1,607) (94)Cash inflow from liquid investments (15) (224) (30)Net increase in long-term loans (1,913) (4,430) –Net repayment of/(increase in) short-term loans 1,872 816 (37)Net repayment of obligations under finance leases 31 35 38Net non-cash funds of subsidiary undertakings acquired (6) (3) (10)Exchange adjustments (34) 385 (10)Other non-cash movements (16) (6) (1)Movement in net debt 1,392 (5,034) (144)
Net debt at end of year (12,645) (14,037) (9,003)
Analysis of changes in net debt
At 1 January 2013
£mExchange
£mOther
£mReclassifications
£mAcquisitions
£mCash flow
£m
At 31December 2013
£m
Liquid investments 81 – – – – (15) 66
Cash and cash equivalents 4,184 (155) – – – 1,505 5,534Overdrafts (278) 7 – – – (32) (303)
3,906 (148) – – – 1,473 5,231
Debt due within one year:Commercial paper (1,748) – – – – 257 (1,491)European and US Medium Term Notes (1,533) (29) 38 (1,007) – 1,612 (919)Other (72) 2 (8) (22) (6) 30 (76)
(3,353) (27) 30 (1,029) (6) 1,899 (2,486)
Debt due after one year:European and US Medium Term Notes (14,622) 140 (15) 1,007 – (1,913) (15,403)Other (49) 1 (31) 22 – 4 (53)
(14,671) 141 (46) 1,029 – (1,909) (15,456)
Net debt (14,037) (34) (16) – (6) 1,448 (12,645)
For further information on significant changes in net debt see Note 32, ‘Net debt’.

GSK Annual Report 2013 181
38 Acquisitions and disposalsDetails of the acquisition and disposal of significant subsidiaries and associates, joint ventures and other businesses are given below:
2013
AcquisitionsDuring the year GSK completed the acquisition of three businesses for cash, including Okairos AG, a European based biopharmaceutical company focused on the development of a specific vaccine technology in the prophylactic and therapeutic fields, which was acquired in May. The total purchase price for these businesses of £255 million included £7 million of cash acquired and £1 million of contingent consideration.
Book value
£m
Fair value adjustments
£m
Fair value
£mNet assets acquired Intangibles – 198 198 Property, plant and equipment 20 3 23 Inventory 6 – 6 Trade and other receivables 16 – 16 Other assets including cash and cash equivalents 8 – 8 Deferred tax provision – (23) (23) Trade and other payables (26) – (26)
24 178 202Goodwill – 53 53
24 231 255
Cash consideration paid 254Contingent consideration 1Total consideration 255
If the acquisitions had been made at the beginning of the year, it is estimated that Group turnover would have increased by approximately £50 million for the year. Okairos has been fully integrated into the GSK business and it is not practicable to separately identify the impact on the Group profit for the year. The other acquisitions occured shortly before the end of the year and had no material impact on the Group profit for the year.
The goodwill arising on the acquisitions reflects potential for business synergies and the value of workforce acquired. The majority of this goodwill is not expected to be deductible for income tax purposes.
The results of the acquisitions are reported within the US, Europe, EMAP, Japan, Other trading and unallocated Pharmaceuticals and Vaccines and Consumer Healthcare operating segments. The transactions were accounted for using the acquisition accounting method.
Acquisition costs expensed in 2013 totalled £2 million.
Contingent consideration2013
£m2012
£m
At 1 January 697 78Exchange adjustments – 1Additions 1 696Remeasurement through goodwill (18) (91)Remeasurement through income statement 251 13Settlement (7) –At 31 December 924 697
Disposals
Lucozade and RibenaOn 31 December 2013, GSK completed the sale of the Lucozade and Ribena business including a manufacturing site and related inventory to Suntory Beverage and Food Ltd for £1,352 million in cash and recognised a profit on disposal in Other operating income of £1,057 million. Lucozade and Ribena sales, excluding retained markets, totalled £527 million for the year ending 31 December 2013.
£m
Cash consideration 1,352
Net assets sold Inventory (45) Property, plant and equipment (149) Goodwill (24)
(218)Disposal costs (77)Profit on disposal 1,057

182 GSK Annual Report 2013
Financial statements Notes to the financial statements
38 Acquisitions and disposals continued
Anti-coagulant businessOn 31 December 2013, GSK completed the sale of the anti-coagulant business comprising of worldwide intellectual property rights (excluding China, India and Pakistan) of Fraxiparine and Arixtra together with related inventory and a manufacturing site to the Aspen Group for consideration of £732 million, of which £499 million was received in cash and £233 million was deferred.
The £233 million deferred consideration receivable relates to inventory and a manufacturing site and is receivable in 2014. £138 million of consideration receivable relates to inventory which is subject to true up upon final transfer of inventory in 2014.
Profit on disposal of £274 million was recognised in Other operating income. Worldwide sales of Fraxiparine and Arixtra, excluding retained markets, were £345 million for the year ending 31 December 2013.
£m
Cash consideration 499Cash consideration receivable 233
732Net assets sold Inventory (138) Property, plant and equipment (91) Intangible assets (80) Goodwill (31)
(340)Disposal costs (79)Total profit on disposal 313Deferral of profit (39)Profit recognised in year 274
GSK holds an investment in Aspen Pharmacare Holdings Limited (Aspen) which is accounted for as an investment in an associate. £39 million of the total profit on disposal, representing GSK’s continuing interest through its shareholding in Aspen, has therefore been deferred.
Investments in associates and joint venturesIn November 2013, GSK sold one third of its shareholding in Aspen, representing 6.2% of the issued share capital of the company, for £429 million in cash. At 31 December 2013, GSK held 12.4% of Aspen and continued to recognise its investment in Aspen as an associate.
£m
Cash consideration 429Net book value of shares (132)Reclassification of exchange from other comprehensive income (42)Reclassification of fair value movements from other comprehensive income 19Profit on disposal 274
Cash flows
Business acquisitions
and disposals £m
Associates and joint ventures
£m
Total £m
Cash consideration paid 254 8 262Cash and cash equivalents acquired (7) – (7)Cash consideration paid, net of cash acquired 247 8 255
Total cash consideration payable, net of cash acquired 248 8 256Contingent consideration (1) – (1)Cash consideration paid, net of cash acquired 247 8 255
Total cash proceeds receivable 2,084 429 2,513Cash proceeds deferred (233) – (233)Net cash proceeds from disposals 1,851 429 2,280

GSK Annual Report 2013 183
38 Acquisitions and disposals continued
2012
AcquisitionsHuman Genome Sciences, Inc.On 3 August 2012, GSK completed the acquisition of 100% of the issued share capital of Human Genome Sciences, Inc. (HGS), a US based biopharmaceutical company focused on the development of protein and anti-body drugs for the treatment of immuno-inflammation diseases, for cash. The goodwill arising on the acquisition of this business reflected the potential business synergies and realisation of the full value of Benlysta, albiglutide, darapladib and other assets by simplifying and optimising R&D, commercial and manufacturing operations through complete ownership of the assets. The goodwill recognised is not expected to be deductible for income tax purposes.
The results of the acquired business are reported as part of the US, Europe, EMAP, Japan and Other trading and unallocated costs operating segments. The transaction was accounted for using the acquisition accounting method.
The pro-forma turnover for the HGS business for the full year 2012 was £154 million. During 2012, GSK recorded turnover of £69 million from HGS products. As the HGS products had been fully integrated into the GSK business, it was not practicable to separately identify the impact of the acquisition on the Group profit for the year.
Acquisition costs expensed in 2012 arising on this acquisition amounted to £28 million.
Book value
£m
Fair value adjustments
£m
Fair value
£mNet assets acquired Intangible assets – 1,249 1,249 Property, plant and equipment 21 10 31 Trade and other receivables 33 – 33 Other assets including cash and cash equivalents 431 83 514 Deferred tax asset – 156 156 Trade and other liabilities (86) (173) (259)
399 1,325 1,724Goodwill – 791 791
399 2,116 2,515
Cash consideration paid 2,282Gain on settlement of pre-existing collaborations 233Total consideration 2,515
Shionogi-ViiV Healthcare joint ventureOn 29 October 2012, GSK acquired the 50% share of the Shionogi-ViiV Healthcare joint venture previously held by Shionogi & Co, Ltd. The assets acquired included the investigational medicine dolutegravir and early stage integrase inhibitor compounds in development.
Total consideration comprised a 10% equity stake in ViiV Healthcare, GSK’s existing 50% investment in the joint venture and contingent consideration payable in cash in the future, together with a deferred tax asset and a loss on settlement of pre-existing relationships. The contingent consideration is payable based on a percentage of the future sales performance of compounds developed by the joint venture, if they become marketed products, and so the total amount payable is unlimited.
The results of the acquired business are reported as part of ViiV Healthcare. The transaction was accounted for using the acquisition accounting method.
Acquisition costs expensed in 2012 arising on this acquisition amounted to £2 million.

184 GSK Annual Report 2013
Financial statements Notes to the financial statements
38 Acquisitions and disposals continued
Book value
£m
Fair value adjustments
£m
Fair value
£mNet assets acquired Intangible assets – 1,777 1,777 Deferred tax provision – (628) (628)
– 1,149 1,149Negative goodwill – (124) (124)
– 1,025 1,025
Consideration settled by shares in ViiV Healthcare 377Contingent consideration 659Deferred tax on contingent consideration (236)Fair value of investment in joint venture converted into subsidiary 256Loss on settlement of pre-existing relationships (31)Total consideration 1,025
Other acquisitionsDuring 2012, GSK completed two smaller acquisitions for cash. The total cash consideration paid of £206 million included £2 million of cash acquired.
Book value
£m
Fair value adjustments
£m
Fair value
£mNet assets acquired Intangible assets – 232 232 Property, plant and equipment 2 – 2 Trade and other receivables 2 – 2 Other assets including cash and cash equivalents 2 – 2 Deferred tax provision – (14) (14) Trade and other liabilities (8) 4 (4)
(2) 222 220Goodwill – 82 82
(2) 304 302
Cash consideration paid 206Contingent consideration 37Fair value of equity investment converted into subsidiary 23Gain on settlement of pre-existing relationships 36Total consideration 302
If the other acquisitions had been made at the beginning of the year, it is estimated that Group turnover would have increased by £27 million for the year. As some of the acquisitions had been fully integrated into the GSK business it was not practicable to separately identify the impact of the acquisitions on the Group profit for the year.
The goodwill arising on the acquisitions reflects the potential for business synergies and further sales growth through the increase in GSK’s market presence following the acquisitions of these market participants. None of the goodwill recognised is expected to be deductible for income tax purposes.
The results of the acquisitions are reported as part of the Europe Pharma and Research & Development reportable operating segments.
The Group recognised a settlement gain of £36 million as a result of measuring at fair value relationships that had existed prior to the acquisition date. The gain was recognised in Other operating income on the income statement.
Acquisition costs expensed in 2012 arising on other acquisitions totalled £9 million.

GSK Annual Report 2013 185
38 Acquisitions and disposals continued
Investments in associates and joint venturesGSK made cash contributions of £39 million into the Shionogi-ViiV Healthcare joint venture prior to its acquisition as a subsidiary and made cash investments of £19 million into a new joint venture in which the Group held a share of 50%. GSK also made cash investments of £41 million into associates.
Cash flows
Human Genome Sciences
£m
Shionogi- ViiV joint venture
£m
Other
acquisitions £m
Total business
acquisitions £m
Associates and joint ventures
£m
Total £m
Cash consideration paid 2,282 – 206 2,488 99 2,587Cash and cash equivalents acquired (251) – (2) (253) – (253)Cash consideration paid, net of cash acquired 2,031 – 204 2,235 99 2,334
Total cash consideration payable, net of cash acquired 2,031 659 241 2,931 99 3,030Contingent consideration – (659) (37) (696) – (696)Cash consideration paid, net of cash acquired 2,031 – 204 2,235 99 2,334
2011
AcquisitionsDuring the year GSK completed four subsidiary acquisitions for cash. The total purchase price of £299 million included £16 million of cash acquired.
Book value
£m
Fair value adjustments
£m
Fair value
£mNet assets acquired Intangible assets 6 122 128 Property, plant and equipment 52 (1) 51 Trade and other receivables 16 – 16 Other assets including cash and cash equivalents 23 1 24 Deferred tax provision – (31) (31) Other liabilities (32) (1) (33)
65 90 155Goodwill – 168 168
65 258 323
Cash consideration paid 299Fair value of investment in joint venture converted into subsidiary 24Total consideration 323
If the acquisitions had been made at the beginning of the year, it is estimated that Group turnover would have increased by £75 million for the year. As some of the subsidiaries have been fully integrated into the GSK business it is not practicable to separately identify the impact of the acquisitions on the Group profit for the year.
The goodwill arising on the acquisitions reflects the potential for business synergies and further sales growth through the increase in GSK’s market presence following the acquisitions of these businesses. In addition, goodwill of £10 million was recognised in respect of fair value adjustments to prior year acquisitions. None of the goodwill recognised is expected to be deductible for income tax purposes.
The results of the acquisitions are reported as part of the US, Europe, EMAP, Japan, Other trading and unallocated Pharmaceuticals and Vaccines and Consumer Healthcare operating segments.
The Group recognised a loss of £1 million as a result of remeasuring to fair value an associate held prior to the acquisition date. This loss is reported as a loss on disposal of interest in associates in the income statement.
Acquisition costs expensed in 2011 arising on acquisitions totalled £2 million.
Investments in associates and joint venturesGSK made cash contributions of £33 million in a joint venture in which the Group has a 50% share, made cash investments in associates totalling £2 million and transferred a £3 million equity investment into associates as the Group has increased its shareholding from 5% to 37%.

186 GSK Annual Report 2013
Financial statements Notes to the financial statements
38 Acquisitions and disposals continued
DisposalsGSK disposed of one subsidiary. The cash outflow on disposal was £10 million net of cash disposed. On 1 February 2011 GSK disposed of its entire 18% shareholding in Quest Diagnostics Inc., a US clinical laboratory business listed on the New York Stock Exchange. The sale comprised a secondary public offering and an accompanying repurchase of shares by Quest Diagnostics which together generated a profit on disposal of £584 million before tax.
Cash flows
Other
acquisitions £m
Associates and joint ventures
£m
Total £m
Cash consideration paid 299 35 334Cash and cash equivalents acquired (16) – (16)Cash consideration paid, net of cash acquired 283 35 318
Total cash consideration payable, net of cash acquired 283 35 318Deferred consideration (19) – (19)Cash consideration paid, net of cash acquired 264 35 299
Net cash (outflow)/proceeds from disposals, net of cash disposed (10) 1,044 1,034
39 Non-controlling interestsThe Group has one subgroup that has material non-controlling interests, ViiV Healthcare Limited and its subsidiaries. The ViiV Healthcare group is focused on the research, development and worldwide commercialisation of HIV medicines. Summarised financial information in respect of the ViiV Healthcare group is set out below:
2013 £m
2012 £m
2011 £m
Turnover 1,371 1,337 1,537Profit after taxation 190 492 422Other comprehensive expense (9) (12) (14)Total comprehensive income 181 480 408
Total comprehensive income/(expense) for the year attributable to non-controlling interests 76 (4) 71Dividends paid to non-controlling interests 106 51 119
2013 £m
2012 £m
Non-current assets 2,273 2,323Current assets 997 1,045Total assets 3,270 3,368Current liabilities (463) (422)Non-current liabilities (2,253) (1,940 )Total liabilities (2,716) (2,362)Net assets 554 1,006
Non-controlling interests attributable to the subgroup 530 545
2013 £m
2012 £m
2011 £m
Net cash inflow from operating activities 637 620 385Net cash outflow from investing activities (27) (31) (29)Net cash outflow from financing activities (662) (350) (802)(Decrease)/increase in cash and bank overdrafts in the year (52) 239 (446)
The above financial information relates to the ViiV Healthcare group on a stand-alone basis, before the impact of Group-related adjustments.
Acquisitions of non-controlling interestsOn 5 February 2013, GSK increased its shareholding in GlaxoSmithKline Consumer Healthcare Ltd (India) from 43.2% to 72.5% (representing an increase in shares held of 12,319,749 at a price of INR 3,900 per share) for £588 million. The carrying amount of the non-controlling interests acquired was £58 million.
On 16 December 2013 GSK announced a voluntary open offer to increase its stake in GlaxoSmithKline Pharmaceuticals Limited, its pharmaceuticals subsidiary in India, from 50.7% to up to 75% (representing a maximum increase in shares held of 20,609,774 shares at a price of INR 3,100 per share). The offer period began on 18 February 2014 and is expected to close in March 2014. As the announcement of the offer obliged GSK to complete the purchase at the price offered, the risks and rewards of ownership of the shares are deemed to have passed to GSK from that date. The carrying amount of the non-controlling interest deemed to have been acquired was £61 million and an obligation of £620 million to pay the non-controlling shareholders was recorded in Other payables (see Note 27) at 31 December 2013.

GSK Annual Report 2013 187
40 Commitments Contractual obligations and commitments
2013 £m
2012 £m
Contracted for but not provided in the financial statements:Intangible assets 7,056 7,780Property, plant and equipment 443 572Investments 111 72Purchase commitments 614 762Pensions 510 368Other commitments 233 268Interest on loans 10,063 10,207Finance lease charges 7 9
19,037 20,038
The commitments related to intangible assets include milestone payments, which are dependent on successful clinical development or on meeting specified sales targets, and which represent the maximum that would be paid if all milestones, however unlikely, are achieved. The amounts are not risk-adjusted or discounted. A number of commitments were made in 2013 under licensing and other agreements, including arrangements with Adimab LLC, Immunicore Ltd and MorphoSys AG. These new arrangements were more than offset by reduced commitments due on prior year transactions including amendments to the agreements with ChemoCentryx Inc. and Panmira Pharmaceuticals LLC.
In 2013, GSK reached an agreement with the trustees of the UK pension schemes to make additional contributions to eliminate the pension deficit identified at the 31 December 2011 actuarial funding valuation. The table above includes this commitment, but excludes the normal ongoing annual funding requirement in the UK of approximately £120 million.
The Group also has other commitments which principally relate to revenue payments to be made under licences and other alliances.
Commitments in respect of future interest payable on loans are disclosed before taking into account the effect of interest rate swaps.
Commitments under non-cancellable operating leases are disclosed below. £322 million (2012 – £343 million) is provided against these commitments on the Group’s balance sheet.
Commitments under non-cancellable operating leases2013
£m 2012
£mRental payments due within one year 134 146Rental payments due between one and two years 97 98Rental payments due between two and three years 73 77Rental payments due between three and four years 58 61Rental payments due between four and five years 52 54Rental payments due after five years 363 413Total commitments under non-cancellable operating leases 777 849

188 GSK Annual Report 2013
Financial statements Notes to the financial statements
41 Financial instruments and related disclosuresGSK reports in Sterling and pays dividends out of Sterling profits. The role of Corporate Treasury is to monitor and manage the external and internal funding requirements and financial risks in support of the strategic objectives. GSK operates on a global basis, primarily through subsidiary companies and manages its capital to ensure that subsidiaries are able to operate as going concerns and to optimise returns to shareholders through an appropriate balance of debt and equity. Treasury activities are governed by policies approved by the Board of Directors, most recently on 9 July 2013.
A Treasury Management Group (TMG) meeting, chaired by the Chief Financial Officer, takes place on a monthly basis to review treasury activities. Its members receive management information relating to these activities. Internal audit reviews the Treasury internal control environment regularly.
GSK uses a variety of financial instruments to finance its operations and derivative financial instruments to manage market risks from these operations. These derivatives, principally comprising forward foreign currency contracts and interest rate swaps, are used to swap borrowings and liquid assets into currencies required for Group purposes and to manage exposure to financial risks from changes in foreign exchange rates and interest rates.
GSK does not hold or issue derivatives for speculative purposes and the Treasury policies specifically prohibit such activity. All transactions in financial instruments are undertaken to manage the risks arising from underlying business activities, not for speculation.
Capital managementGSK’s financial strategy supports the Group’s strategic priorities and is regularly reviewed by the Board. GSK manages the capital structure of the Group through an appropriate mix of debt and equity. GSK’s financial architecture is designed to support the delivery of the Group’s strategy, and to enhance returns to shareholders. There are four key priorities: delivering sustainable sales growth, improving operating leverage, improving financial efficiency and converting more of our earnings into cash. The free cash flow generated can then be returned to shareholders or reinvested in bolt-on acquisitions, wherever the most attractive returns are available. GSK continues to apply strict financial and returns-based criteria such as cash flow return on investment in order to allocate capital and assess investment opportunities, whilst protecting its credit profile.
The business remains highly cash generative and in 2013 GSK generated £4.7 billion in free cash flow. In addition, the Group realised £2.5 billion from divestments. In 2013 we returned a total of £5.2 billion to shareholders, £3.7 billion in dividends and £1.5 billion in share repurchases. Net debt at the end of the year was £12.6 billion, a reduction of £1.4 billion compared to the previous year.
In 2014, GSK expects to deliver continued dividend growth and as part of the long-term share buyback programme is targeting share repurchases of £1-2 billion depending on market conditions.
The capital structure of the Group consists of net debt of £12.6 billion (see Note 32, ‘Net debt’) and shareholders’ equity of £7.0 billion (see ’Consolidated statement of changes in equity‘ on page 134). Total capital, including that provided by non-controlling interests of £0.8 billion, is £20.4 billion.
Liquidity riskGSK’s policy is to borrow centrally in order to meet anticipated funding requirements. The cash flow forecast and funding requirements are monitored by the TMG on a monthly basis. The strategy is to diversify liquidity sources using a range of facilities and to maintain broad access to funding markets.
At 31 December 2013, GSK had £2.8 billion of borrowings repayable within one year and held £5.6 billion of cash and cash equivalents and liquid investments of which £3.3 billion was held centrally (including the disposal proceeds received at the end of December). GSK also has access to short-term finance under a $10 billion (£6.0 billion) US commercial paper programme and $2.5 billion (£1.5 billion) was in issue under this programme at 31 December 2013. GSK has £1.9 billion five year committed medium-term facilities and $2.5 billion (£1.5 billion) of 364 day committed facilities. These facilities were put in place in September 2012 and September 2013 respectively and were undrawn at 31 December 2013. GSK considers this level of committed facilities to be adequate given current liquidity requirements.
GSK has a £15 billion European Medium Term Note programme and at 31 December 2013, £7.1 billion of notes were in issue under this programme. The Group also has a US shelf registration statement and at 31 December 2013, had $15.5 billion (£9.3 billion) of notes in issue under this programme. GSK’s long-term borrowings mature at dates between 2015 and 2045.
GSK’s long-term credit ratings have remained unchanged since February 2008. GSK’s current ratings are A+ (stable outlook) by Standard and Poor’s and A1 (negative outlook) by Moody’s Investors Service (‘Moody’s’). The Group’s short-term credit ratings are A-1 and P-1 with Standard and Poor’s and Moody’s respectively.
Market risk
Interest rate risk managementGSK’s objective is to minimise the effective net interest cost and to balance the mix of debt at fixed and floating interest rates over time. The policy on interest rate risk management limits the amount of floating interest payments to a prescribed percentage of operating profit.
GSK uses interest rate swaps to redenominate one of its bonds into floating interest rates. The duration of these swaps matches the duration of the principal instrument. These interest rate derivative instruments are accounted for as fair value hedges of the relevant liability.

GSK Annual Report 2013 189
2013Aa1/AA+
£mAa3/AA-
£mA1/A+
£mA2/A
£mA3/A-
£mBaa1/BBB+
£mBaa2/BBB
£mBaa3/BBB-
£mBa2/BB
£m
UnratedTotal
£m
Bank balances and deposits – 2,823 637 967 48 8 – 157 – 1 4,641US Treasury and Treasury repo only money market funds 893 – – – – – – – – – 893Corporate debt instruments – 1 – – – – – – – – 1Government securities 64 – – – – – – – 1 – 653rd party financial derivatives – 66 11 54 17 – – – – – 148Total 957 2,890 648 1,021 65 8 – 157 1 1 5,748
2012Aa1/AA+
£mAa3/AA-
£mA1/A+
£mA2/A
£mA3/A-
£mBaa1/BBB+
£mBaa2/BBB
£mBaa3/BBB-
£mBa2/BB
£m
UnratedTotal
£m
Bank balances and deposits – 1,189 825 412 860 7 – 158 5 – 3,456US Treasury and Treasury repo only money market funds 728 – – – – – – – – – 728Corporate debt instruments – 7 – – – – – – – – 7Government securities 74 – – – – – – – – – 743rd party financial derivatives – 8 37 33 20 – – – – – 98Total 802 1,204 862 445 880 7 – 158 5 – 4,363
The credit ratings in the above tables are as assigned by Moody’s and Standard and Poor’s respectively. Where the opinion of the two rating agencies differ, GSK assigns the lower rating of the two to the counterparty. Where local rating agency data is the only source available, the ratings are converted to global ratings equivalent to those of Moody’s or Standard and Poor’s using published conversion tables.
41 Financial instruments and related disclosures continued
Foreign exchange risk managementForeign currency transaction exposures arising on internal and external trade flows are not generally hedged. The Group’s objective is to minimise the exposure of overseas operating subsidiaries to transaction risk by matching local currency income with local currency costs where possible. GSK’s internal trading transactions are matched centrally and inter-company payment terms are managed to reduce foreign currency risk. Foreign currency cash flows can be hedged selectively under the management of Corporate Treasury and the TMG. Where possible, GSK manages the cash surpluses or borrowing requirements of subsidiary companies centrally using forward contracts to hedge future repayments back into the originating currency. In order to reduce foreign currency translation exposure, the Group seeks to denominate borrowings in the currencies of the principal assets and cash flows. These are primarily denominated in US dollars, Euros and Sterling. Certain borrowings can be swapped into other currencies as required. Borrowings denominated in, or swapped into, foreign currencies that match investments in Group overseas assets may be treated as a hedge against the relevant assets. Forward contracts in major currencies are also used to reduce exposure to the Group’s investment in overseas assets (see ‘Net investment hedges’ section of this note for further details). The TMG reviews the ratio of borrowings to assets for major currencies monthly.
Credit riskThe Group considers its maximum credit risk at 31 December 2013 to be £10,922 million (31 December 2012 – £9,469 million) which is the total of the Group’s financial assets with the exception of ’Other investments’ (comprising equity investments) which bear equity risk rather than credit risk. See page 191 for details on the Group’s total financial assets. At 31 December 2013, GSK’s greatest concentration of credit risk was £2.6 billion (2012 – £1.2 billion) with HSBC (Aa3/AA-), including the disposal proceeds received at the end of December.
Treasury-related credit riskGSK sets global counterparty limits for each of GSK’s banking and investment counterparties based on long-term credit ratings from Moody’s and Standard and Poor’s.
Corporate Treasury’s usage of these limits is monitored daily by a Corporate Compliance Officer (CCO) who operates independently of Corporate Treasury. Any breach of these limits would be reported to the CFO immediately. The CCO also monitors the credit rating of these counterparties and, when changes in ratings occur, notifies Corporate Treasury so that changes can be made to investment levels or to authority limits as appropriate. In addition, relationship banks and their credit ratings are reviewed regularly and a report is presented annually to the TMG for approval.
GSK actively manages its exposure to credit risk, reducing surplus cash balances wherever possible. This is part of the Treasury strategy to regionalise cash management and to concentrate cash centrally as much as possible. GSK has continued to maintain its conservative approach to counterparty risk throughout the period. The table below sets out the credit exposure to counterparties by rating for liquid investments, cash and cash equivalents and derivatives. The gross asset position on each derivative contract is considered for the purpose of this table, although, under ISDA agreements, the amount at risk is the net position with each counterparty. Table (e) on page 195 sets out the Group’s financial assets and liabilities on an offset basis.
The £2.8 billion bank balances and deposits invested in Aa3/AA- rated counterparties at 31 December 2013 is significantly higher than the equivalent at 31 December 2012 as a result of the disposal proceeds received at the end of December 2013. Compared to last year, there is a significantly higher amount of bank balances and deposits held with A2/A rated counterparties whilst the amount has significantly decreased with A3/A- rated counterparties. This is as a result of GSK’s bank balances and deposits held with Citibank, which have shifted due to Moody’s upgrading Citibank NA’s rating from A3 to A2.
The £157 million invested with Baa3/BBB- rated counterparties includes bank balances or deposits with HDFC Bank, State Bank of India, BBVA Venezuela, Halk and Emirates bank. These counterparties are used either for local cash management purposes or for local investment purposes where GSK is not the sole shareholder.
The £1 million invested with a Ba2/BB rated counterparty relates to an investment in Pakistan Government treasury bills and the £1 million held with an unrated bank is with Islandsbanki which is used for cash management purposes in Iceland.

190 GSK Annual Report 2013
Financial statements Notes to the financial statements
41 Financial instruments and related disclosures continued
GSK’s centrally managed cash reserves amounted to £3.3 billion at 31 December 2013, all available within 3 months. This excludes £0.6 billion centrally managed cash held by ViiV Healthcare, a 77.4% owned subsidiary. The Group has invested centrally managed liquid assets in bank deposits and Aaa/AAA rated US Treasury and Treasury repo only money market funds (these bear credit exposure to the US Government (Aaa/AA+ rated)).
Wholesale and retail credit riskOutside the USA, no customer accounts for more than 5% of the Group’s trade receivables balance.
In the USA, in line with other pharmaceutical companies, the Group sells its products through a small number of wholesalers in addition to hospitals, pharmacies, physicians and other groups. Sales to the three largest wholesalers amount to approximately 83% of the Group’s US Pharmaceuticals and Vaccines turnover. At 31 December 2013, the Group had trade receivables due from these three wholesalers totalling £835 million (2012 – £815 million). The Group is exposed to a concentration of credit risk in respect of these wholesalers such that, if one or more of them encounters financial difficulty, it could materially and adversely affect the Group’s financial results.
The Group’s credit risk monitoring activities relating to these wholesalers include a review of their quarterly financial information and Standard & Poor’s credit ratings, development of GSK internal risk ratings, and establishment and periodic review of credit limits. However, the Group believes there is no further credit risk provision required in excess of the normal provision for bad and doubtful debts (see Note 24, ‘Trade and other receivables’).
Fair value of financial assets and liabilitiesThe table on page 191 presents the carrying amounts and the fair values of the Group’s financial assets and liabilities at 31 December 2013 and 31 December 2012.
The fair values of the financial assets and liabilities are included at the price that would be received to sell an asset or paid to transfer a liability in an orderly transaction between market participants at the measurement date.
The following methods and assumptions were used to estimate the fair values:
• Cash and cash equivalents – approximates to the carrying amount
• Liquid investments – based on quoted market prices or calculated based on observable inputs in the case of marketable securities; based on principal amounts in the case of non-marketable securities because of their short repricing periods
• Other investments – equity investments traded in an active market determined by reference to the relevant stock exchange quoted bid price; other equity investments determined by reference to the current market value of similar instruments or by reference to the discounted cash flows of the underlying net assets
• Short-term loans, overdrafts and commercial paper – approximates to the carrying amount because of the short maturity of these instruments
• Long-term loans – based on quoted market prices in the case of European and US Medium term notes and other fixed rate borrowings (a level 1 fair value measurement); approximates to the carrying amount in the case of floating rate bank loans and other loans
• Contingent consideration for business acquisitions after 1 January 2010 – based on present values of expected future cash flows
• Interest rate swaps and foreign exchange contracts – based on the present value of contractual cash flows using market sourced data (exchange rates or interest rates) at the balance sheet date
• Receivables and payables – approximates to the carrying amount
• Company-owned life insurance policies – based on cash surrender value
• Lease obligations – approximates to the carrying amount.
Fair value of investments in GSK sharesAt 31 December 2013, the Employee Share Ownership Plan (ESOP) Trusts held GSK shares with a carrying value of £355 million (2012 – £391 million) and a fair value of £1,025 million (2012 – £1,004 million) based on quoted market price. The shares represent purchases by the ESOP Trusts to satisfy future exercises of options and awards under employee incentive schemes. The carrying value, which is the lower of cost or expected proceeds, of these shares has been recognised as a deduction from other reserves. At 31 December 2013, GSK held Treasury shares at a cost of £6,829 million (2012 – £6,602 million) which has been deducted from retained earnings.
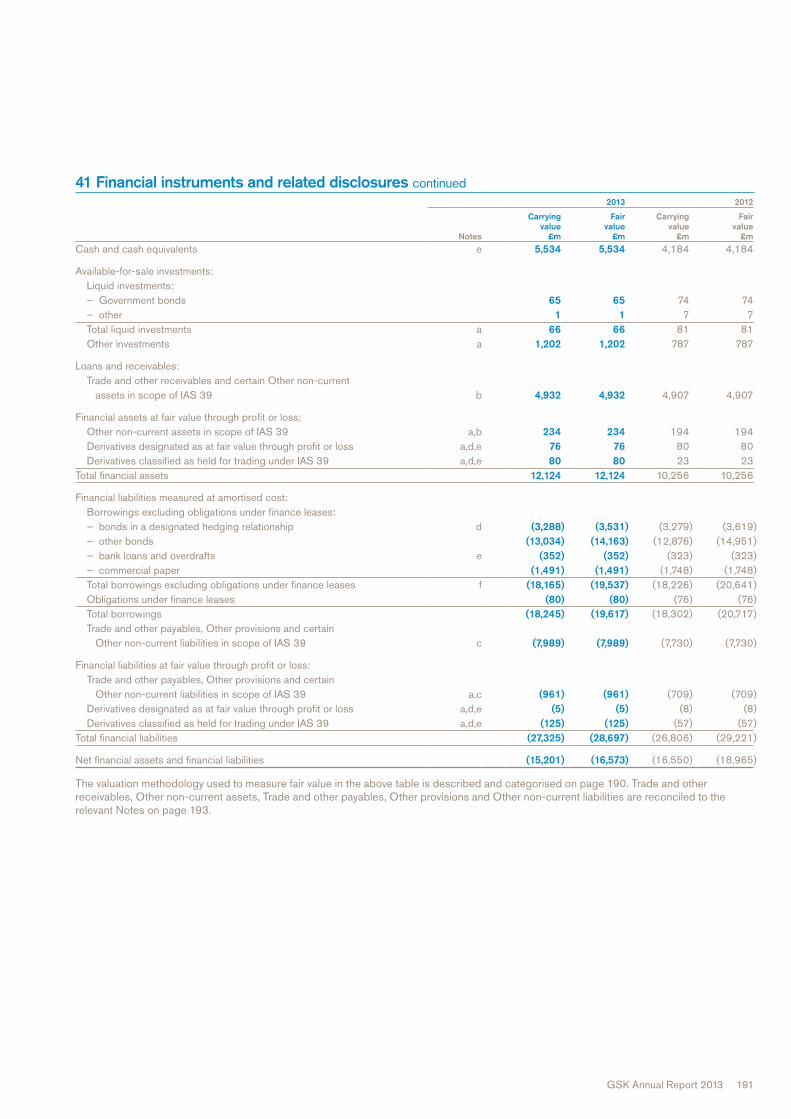
GSK Annual Report 2013 191
41 Financial instruments and related disclosures continued2013 2012
Notes
Carrying value
£m
Fair value
£m
Carrying value
£m
Fair value
£mCash and cash equivalents e 5,534 5,534 4,184 4,184
Available-for-sale investments: Liquid investments: – Government bonds 65 65 74 74 – other 1 1 7 7 Total liquid investments a 66 66 81 81 Other investments a 1,202 1,202 787 787
Loans and receivables: Trade and other receivables and certain Other non-current assets in scope of IAS 39 b 4,932 4,932 4,907 4,907
Financial assets at fair value through profit or loss: Other non-current assets in scope of IAS 39 a,b 234 234 194 194 Derivatives designated as at fair value through profit or loss a,d,e 76 76 80 80 Derivatives classified as held for trading under IAS 39 a,d,e 80 80 23 23Total financial assets 12,124 12,124 10,256 10,256
Financial liabilities measured at amortised cost: Borrowings excluding obligations under finance leases: – bonds in a designated hedging relationship d (3,288) (3,531) (3,279) (3,619) – other bonds (13,034) (14,163) (12,876) (14,951) – bank loans and overdrafts e (352) (352) (323) (323) – commercial paper (1,491) (1,491) (1,748) (1,748) Total borrowings excluding obligations under finance leases f (18,165) (19,537) (18,226) (20,641) Obligations under finance leases (80) (80) (76) (76) Total borrowings (18,245) (19,617) (18,302) (20,717) Trade and other payables, Other provisions and certain Other non-current liabilities in scope of IAS 39 c (7,989) (7,989) (7,730) (7,730)
Financial liabilities at fair value through profit or loss: Trade and other payables, Other provisions and certain Other non-current liabilities in scope of IAS 39 a,c (961) (961) (709) (709) Derivatives designated as at fair value through profit or loss a,d,e (5) (5) (8) (8) Derivatives classified as held for trading under IAS 39 a,d,e (125) (125) (57) (57)Total financial liabilities (27,325) (28,697) (26,806) (29,221)
Net financial assets and financial liabilities (15,201) (16,573) (16,550) (18,965)
The valuation methodology used to measure fair value in the above table is described and categorised on page 190. Trade and other receivables, Other non-current assets, Trade and other payables, Other provisions and Other non-current liabilities are reconciled to the relevant Notes on page 193.

192 GSK Annual Report 2013
Financial statements Notes to the financial statements
41 Financial instruments and related disclosures continued
(a) Financial instruments held at fair valueThe following tables categorise the Group’s financial assets and liabilities held at fair value by the valuation methodology applied in determining their fair value. Where possible, quoted prices in active markets are used (Level 1). Where such prices are not available, the asset or liability is classified as Level 2, provided all significant inputs to the valuation model used are based on observable market data. If one or more of the significant inputs to the valuation model is not based on observable market data, the instrument is classified as Level 3. Other investments classified as Level 3 in the tables below comprise equity investments in unlisted entities with which the Group has entered into research collaborations and also investments in emerging life science companies. Other non-current liabilities classified as level 3 comprise contingent consideration for business acquisitions.
At 31 December 2013Level 1
£mLevel 2
£mLevel 3
£mTotal
£mFinancial assets at fair valueAvailable–for–sale financial assets: Liquid investments 65 1 – 66 Other investments 1,000 – 202 1,202Financial assets at fair value through profit or loss: Other non-current assets – 232 2 234 Derivatives designated as at fair value through profit or loss – 76 – 76 Derivatives classified as held for trading under IAS 39 – 79 1 80
1,065 388 205 1,658
Financial liabilities at fair valueFinancial liabilities at fair value through profit or loss: Trade and other payables – – (3) (3) Other non-current liabilities – – (958) (958) Derivatives designated as at fair value through profit or loss – (5) – (5) Derivatives classified as held for trading under IAS 39 – (124) (1) (125)
– (129) (962) (1,091)
At 31 December 2012Level 1
£mLevel 2
£mLevel 3
£mTotal
£mFinancial assets at fair valueAvailable–for–sale financial assets: Liquid investments 74 7 – 81 Other investments 589 – 198 787Financial assets at fair value through profit or loss: Other non-current assets – 194 – 194 Derivatives designated as at fair value through profit or loss – 80 – 80 Derivatives classified as held for trading under IAS 39 – 22 1 23
663 303 199 1,165
Financial liabilities at fair valueFinancial liabilities at fair value through profit or loss: Other non-current liabilities – – (709) (709) Derivatives designated as at fair value through profit or loss – (8) – (8) Derivatives classified as held for trading under IAS 39 – (55) (2) (57)
– (63) (711) (774)
Movements in the year for financial instruments measured using Level 3 valuation methods are presented below:2013
£m2012
£mAt 1 January (512) 205Net losses recognised in the income statement (262) (32)Net gains recognised in other comprehensive income 2 4Contingent consideration liabilities for businesses acquired during the year (1) (696)Equity investment converted into subsidiary on acquisition of business – (23)Equity investment additions 45 44Equity investment disposals (10) (7)Transfers from Level 3 (17) –Exchange (2) (7)At 31 December (757) (512)
Net losses of £251 million (2012 – £24 million) attributable to Level 3 financial instruments held at the end of the year were reported in Other operating income, of which £251 million (2012 – £13 million) arose from remeasurement of contingent consideration liabilities, principally the contingent consideration payable for the acquisition of the former Shionogi-ViiV Healthcare joint venture. Net gains of £1 million (2012 – £nil) were reported in Selling, general and administration. Net gains of £nil (2012 – £3 million) attributable to Level 3 equity investments held at the end of the year were reported in Other comprehensive income as Fair value movements on available-for-sale investments.

GSK Annual Report 2013 193
41 Financial instruments and related disclosures continuedThe net liability position of £757 million (2012 – £512 million) in respect of financial instruments measured using Level 3 valuation methods at 31 December includes £923 million (2012 – £670 million) in respect of contingent consideration payable for the acquisition in 2012 of the former Shionogi-ViiV Healthcare joint venture. This consideration is expected to be paid over several years and will vary in line with sales of Tivicay (dolutegravir). Regulatory approval for this product was obtained in the USA and Canada during the year and in the European Union in January 2014. The table below shows on an indicative basis the income statement and balance sheet sensitivity to reasonably possible changes in key inputs to the valuation of this liability.
Increase/(decrease) in financial liability and loss/(gain) in Income statement from change in key inputs2013
£m10% increase in sales forecasts 10510% decrease in sales forecasts (104)1% increase in market interest rates (56)1% decrease in market interest rates 62
(b) Trade and other receivables and Other non-current assets in scope of IAS 39The following table reconciles financial instruments within Trade and other receivables and Other non-current assets which fall within the scope of IAS 39 to the relevant balance sheet amounts. The financial assets are predominantly non-interest earning. Financial instruments within the Other non-current assets balance include company-owned life insurance policies. Other assets include tax receivables, pension surplus balances and prepayments, which are outside the scope of IAS 39.
2013 2012
At fair value through
profit or loss £m
Loans and
receivables £m
Financial
instruments £m
Other £m
Total £m
At fair value through
profit or loss £m
Loans and
receivables £m
Financial
instruments £m
Other £m
Total £m
Trade and other receivables (Note 24)
–
4,664
4,664
778
5,442
– 4,577
4,577
665
5,242
Other non-current assets (Note 22)
234
268
502
387
889
194
330
524
158
682
234 4,932 5,166 1,165 6,331 194 4,907 5,101 823 5,924
The following table shows the age of such financial assets which are past due and for which no provision for bad or doubtful debts has been made:
2013 £m
2012 £m
Past due by 1–30 days 142 118Past due by 31–90 days 152 129Past due by 91–180 days 89 100Past due by 181–365 days 64 71Past due by more than 365 days 79 41
526 459
Amounts past due by greater than 90 days and for which no provision for bad or doubtful debts has been made total £232 million (2012 – £212 million). Of this balance £133 million (2012 – £99 million) relates to receivables due from state hospital authorities in Greece, Ireland, Italy, Portugal and Spain. The total receivables due from state hospital authorities in these countries (current and past due, net of provisions) is £262 million (2012 – £257 million).
(c) Trade and other payables, Other provisions and Other non-current liabilities in scope of IAS 39The following table reconciles financial instruments within Trade and other payables, Other provisions and Other non-current liabilities which fall within the scope of IAS 39 to the relevant balance sheet amounts. The financial liabilities are predominantly non-interest bearing. Accrued wages and salaries are included within financial liabilities. Other liabilities include payments on account, tax and social security payables and provisions which do not arise from contractual obligations to deliver cash or another financial asset, which are outside the scope of IAS 39.
2013 2012
At fair value through
profit or loss £m
Other liabilities
£m
Financial instruments
£m
Other
£m
Total
£m
At fair value through
profit or loss £m
Other
liabilities £m
Financial instruments
£m
Other
£m
Total
£m
Trade and other payables (Note 27)
(3
)
(7,798
)
(7,801
)
(516
)
(8,317
)
–
(7,485
)
(7,485
)
(569
)
(8,054
)
Other provisions (Note 29)
–
(148
)
(148
)
(1,396
)
(1,544
)
–
(157
)
(157
)
(1,235
)
(1,392
)
Other non-current liabilities (Note 30)
(958
)
(43
)
(1,001
)
(703
)
(1,704
)
(709
)
(88
)
(797
)
(635
)
(1,432
)
(961) (7,989) (8,950) (2,615) (11,565) (709) (7,730) (8,439) (2,439) (10,878)

194 GSK Annual Report 2013
Financial statements Notes to the financial statements
41 Financial instruments and related disclosures continued
(d) Derivative financial instruments and hedging programmesThe following table sets out the fair values of derivatives held by GSK.
2013 Fair value
2012 Fair value
Assets £m
Liabilities £m
Assets £m
Liabilities £m
Fair value hedges – Interest rate swaps (principal amount – £904 million (2012 – £920 million)) 18 – 54 –
Net investment hedges – Foreign exchange contracts (principal amount – £7,221 million (2012 – £7,529 million)) 58 (1) 25 (8)
Cash flow hedges – Foreign exchange contracts (principal amount – £92 million (2012 – £242 million)) – (4) 1 –
Derivatives designated as at fair value through profit or loss 76 (5) 80 (8)
Foreign exchange contracts (principal amount – £11,651 million (2012 – £10,270 million)) 74 (120) 18 (53)
Embedded and other derivatives 6 (5) 5 (4)
Derivatives classified as held for trading under IAS 39 80 (125) 23 (57)Total derivative instruments 156 (130) 103 (65)
Analysed as: Current 155 (127) 49 (63) Non-current 1 (3) 54 (2)Total 156 (130) 103 (65)
Foreign exchange contracts classified as held for trading under IAS 39The principal amount on foreign exchange contracts is the absolute total of outstanding positions at the balance sheet date. The Group’s foreign exchange contracts are for periods of 12 months or less. At 31 December 2013, the Group held outstanding foreign exchange contracts consisting primarily of foreign currency swaps with a net liability fair value of £46 million (£74 million asset less £120 million liability). At December 2012 the fair value was £35 million net liability (£18 million asset less £53 million liability). The £11 million net liability fair value increase from 2012 is due to additional hedging of inter-company loans and deposits, external debt and legal provisions that are not designated as accounting hedges. Fair value movements are taken to the income statement in the period to offset the exchange gains and losses on the related inter-company lending and borrowing, external debt and legal provisions.
Fair value hedgesThe Group has designated a series of interest rate swaps as a fair value hedge. The risk being hedged is the variability of the fair value of the bond arising from interest rate fluctuations. Gains and losses on fair value hedges are disclosed in Note 12, ‘Finance expense’.
The carrying value of bonds in a designated hedging relationship on page 191 includes £919 million (2012 - £970 million) that is designated a hedged item in a fair value hedge relationship.
Net investment hedgesDuring the year, certain foreign exchange contracts were designated as net investment hedges in respect of the foreign currency translation risk arising on consolidation of the Group’s net investment in its European (Euro) and Japanese (Yen) foreign operations as shown in the table above.
The carrying value of bonds in a designated hedging relationship on page 191 includes £2,369 million (2012 - £2,309 million) that is designated a hedging instrument in a net investment hedge relationship.
Cash flow hedgesDuring 2013, the Group entered into forward foreign exchange contracts which it designated as cash flow hedges of its foreign exchange exposure arising on Euro and US dollar denominated coupon payments relating to the Group’s European and US medium term notes.
At 31 December 2012, the Group designated a cash flow hedge of a foreign exchange exposure arising on the recognition of a liability denominated in Indian Rupee in the Group’s consolidated financial statements.
In addition, the Group carries a balance in reserves that arose from pre-hedging fluctuations in long-term interest rates when pricing bonds issued during the year as disclosed in Note 32. The balance is reclassified to finance costs over the life of these bonds.
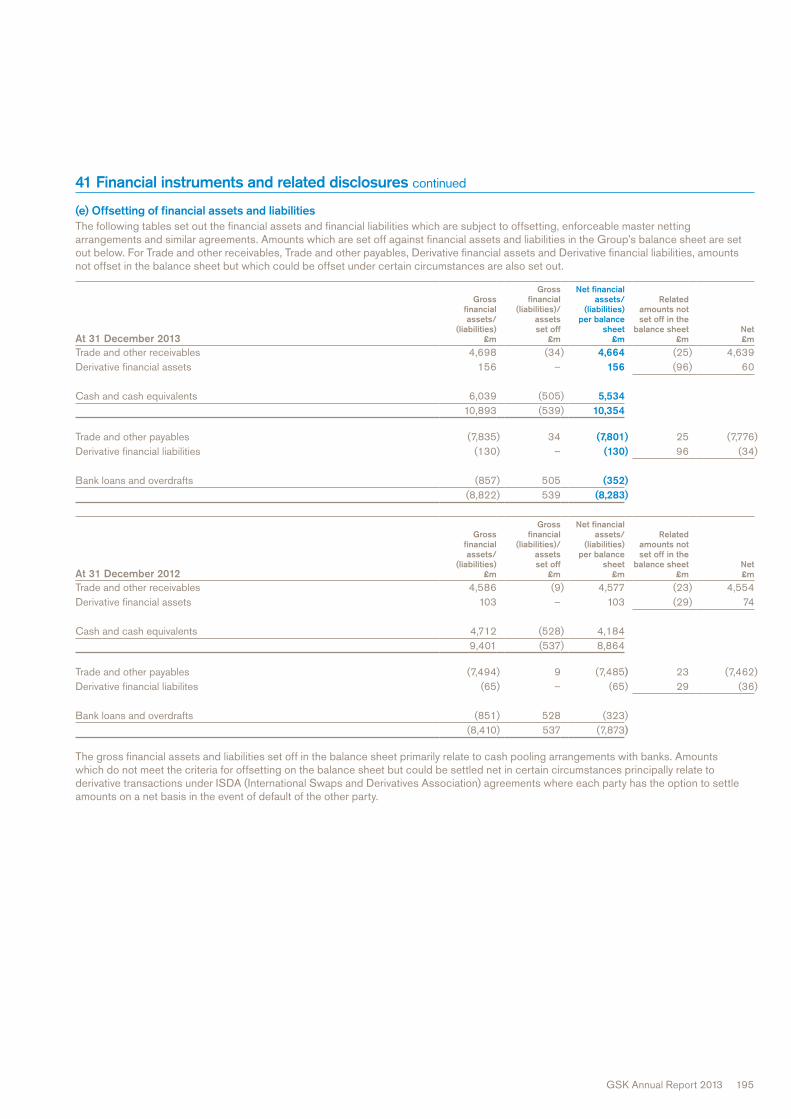
GSK Annual Report 2013 195
41 Financial instruments and related disclosures continued
(e) Offsetting of financial assets and liabilitiesThe following tables set out the financial assets and financial liabilities which are subject to offsetting, enforceable master netting arrangements and similar agreements. Amounts which are set off against financial assets and liabilities in the Group’s balance sheet are set out below. For Trade and other receivables, Trade and other payables, Derivative financial assets and Derivative financial liabilities, amounts not offset in the balance sheet but which could be offset under certain circumstances are also set out.
At 31 December 2013
Gross financial assets/
(liabilities) £m
Gross financial
(liabilities)/ assets set off
£m
Net financial assets/
(liabilities) per balance
sheet £m
Related amounts not set off in the
balance sheet £m
Net £m
Trade and other receivables 4,698 (34) 4,664 (25) 4,639Derivative financial assets 156 – 156 (96) 60
Cash and cash equivalents 6,039 (505) 5,53410,893 (539) 10,354
Trade and other payables (7,835) 34 (7,801) 25 (7,776)Derivative financial liabilities (130) – (130) 96 (34)
Bank loans and overdrafts (857) 505 (352)(8,822) 539 (8,283)
At 31 December 2012
Gross financial assets/
(liabilities) £m
Gross financial
(liabilities)/ assets set off
£m
Net financial assets/
(liabilities) per balance
sheet £m
Related amounts not set off in the
balance sheet £m
Net £m
Trade and other receivables 4,586 (9) 4,577 (23) 4,554Derivative financial assets 103 – 103 (29) 74
Cash and cash equivalents 4,712 (528) 4,1849,401 (537) 8,864
Trade and other payables (7,494) 9 (7,485) 23 (7,462)Derivative financial liabilites (65) – (65) 29 (36)
Bank loans and overdrafts (851) 528 (323)(8,410) 537 (7,873)
The gross financial assets and liabilities set off in the balance sheet primarily relate to cash pooling arrangements with banks. Amounts which do not meet the criteria for offsetting on the balance sheet but could be settled net in certain circumstances principally relate to derivative transactions under ISDA (International Swaps and Derivatives Association) agreements where each party has the option to settle amounts on a net basis in the event of default of the other party.

196 GSK Annual Report 2013
Financial statements Notes to the financial statements
41 Financial instruments and related disclosures continued
(f) Debt interest rate repricing tableThe following table sets out the exposure of the Group to interest rates on debt, including commercial paper, before and after the effect of interest rate swaps. The maturity analysis of fixed rate debt is stated by contractual maturity and of floating rate debt by interest rate repricing dates. For the purpose of this table, debt is defined as all classes of borrowings other than obligations under finance leases.
2013 2012
Debt £m
Effect of interest
rate swaps £m
Total £m
Debt £m
Effect of interest
rate swaps £m
Total £m
Floating and fixed rate debt less than one year (2,762) – (2,762) (3,604) (970) (4,574)Between one and two years (1,932) – (1,932) (970) 970 –Between two and three years (751) – (751) (1,907) – (1,907)Between three and four years (2,237) – (2,237) – – –Between four and five years (1,653) – (1,653) (2,232) – (2,232)Between five and ten years (1,936) – (1,936) (2,897) – (2,897)Greater than ten years (6,894) – (6,894) (6,616) – (6,616)Total (18,165) – (18,165) (18,226) – (18,226)Original issuance profile: Fixed rate interest (16,432) 919 (15,513) (16,155) 970 (15,185) Floating rate interest (1,732) (919) (2,651) (2,064) (970) (3,034)Total interest bearing (18,164) – (18,164) (18,219) – (18,219)Non-interest bearing (1) – (1) (7) – (7)
(18,165) – (18,165) (18,226) – (18,226)
The Group holds interest rate swaps, designated as fair value hedges, to convert £919 million of fixed rate debt with a maturity of less than one year (2012 – £970 million with a maturity between one and two years) into a floating rate exposure.
(g) Sensitivity analysisForeign exchange and interest rate sensitivity analysis has been prepared on the assumption that the amount of net debt, the ratio of fixed to floating interest rates of the debt and derivatives portfolio and the proportion of financial instruments in foreign currencies are all constant and on the basis of the hedge designations as at 31 December. Financial instruments affected by market risk include cash and cash equivalents, borrowings, trade receivables and payables and derivative financial instruments.
The following analyses are intended to illustrate the sensitivity of such financial instruments to changes in foreign exchange and interest rates.
Foreign exchange sensitivityThe table below shows on an indicative basis only the Group’s sensitivity to foreign exchange rates on its US dollar, Euro and Yen financial instruments.
These three currencies are the major foreign currencies in which GSK’s financial instruments are denominated. GSK has considered movements in these currencies and has concluded that a 10 cent or 10 yen movement in rates against Sterling is reasonable.
In this analysis, financial instruments are only considered sensitive to foreign exchange rates where they are not in the functional currency of the entity that holds them. Obligations under finance leases, inter-company loans that are fully hedged to maturity and certain non-derivative financial instruments not in net debt are excluded as they do not present a material exposure. Foreign exchange sensitivity on Group assets and liabilities other than financial instruments is not included in the calculation.
The movement in the income statement in the table below relates primarily to cash and cash equivalents, inter-company loans and deposits, inter-company trading balances, hedging instruments for legal provisions and trade receivables and payables which are not denominated in the functional currency of the entity that holds them. Whilst the hedging instruments provide economic hedges, the related remeasurement of provisions is not included in the calculation.
2013 2012
Income statement impact of non-functional currency foreign exchange exposures
Increase in income
£m
Increase in income
£m
10 cent appreciation of the US dollar (2012: 10 cent) 40 4110 cent appreciation of the Euro (2012: 10 cent) 8 2910 yen appreciation of the Yen (2012: 10 yen) 1 –
An equivalent depreciation in the above currencies would cause the following decrease in income £35 million, £6 million and £1 million for US dollar, Euro and Yen exchange rates respectively (2012 – £36 million, £25 million and £nil).

GSK Annual Report 2013 197
41 Financial instruments and related disclosures continuedThe movements in equity in the table below relate to hedging instruments (foreign exchange derivatives and external debt) designated as a net investment hedge to hedge the Group assets denominated in Euro and Yen.
2013 2012
Equity impact of non-functional currency foreign exchange exposures
(Decrease) in equity
£m
(Decrease) in equity
£m
10 cent appreciation of the US dollar (2012: 10 cent) – –10 cent appreciation of the Euro (2012: 10 cent) (840) (814)10 yen appreciation of the Yen (2012: 10 yen) (21) (49)
An equivalent depreciation in the above currencies would cause the following increase in equity: £nil, £711 million and £19 million for US dollar, Euro and Yen exchange rates respectively (2012 – £nil, £691 million and £42 million).
The table below presents the Group’s sensitivity to foreign exchange rates based on the composition of net debt as shown in Note 32 adjusting for the effects of foreign exchange derivatives that are not part of net debt but affect future foreign currency cash flows.
2013 2012
Impact of foreign exchange movements on net debt
(Increase)/ decrease in
net debt £m
(Increase)/ decrease in
net debt £m
10 cent appreciation of the US dollar (2012: 10 cent) (447) (460)10 cent appreciation of the Euro (2012: 10 cent) 289 24810 yen appreciation of the Yen (2012: 10 yen) 10 15
An equivalent depreciation in the above currencies would have the following impact on net debt: £396 million, £(244) million and £(9) million for US dollar, Euro and Yen exchange rates respectively (2012 – £407 million, £(211) million and £(13) million).
Interest rate sensitivityThe table below shows on an indicative basis only the Group’s sensitivity to interest rates on its floating rate Sterling, US dollar and Euro financial instruments, being issued debt, bank borrowings, cash and cash equivalents and liquid investments. GSK has considered movements in these interest rates over the last three years and has concluded that a 1% (100 basis points) increase is a reasonable benchmark. Debt and bank borrowings with a maturity of less than one year is floating rate for this calculation. Interest rate movements on derivative financial instruments designated as fair value hedges are deemed to have an immaterial effect on the Group Income Statement due to compensating amounts in the carrying value of debt. A 1% (100 basis points) movement in interest rates is not deemed to have a material effect on equity.
2013 2012
Income statement impact of interest rate movements
Increase/ (decrease) in
income £m
Increase/ (decrease) in
income £m
1% (100 basis points) increase in Sterling interest rates (2012: 1%) 13 51% (100 basis points) increase in US dollar interest rates (2012: 1%) 16 –1% (100 basis points) increase in Euro interest rates (2012: 1%) (8) (12)
The increase in interest income is due to higher levels of indicative cash at the balance sheet date. These interest rates could not be decreased by 1% (100 basis points) as they are currently less than 1.0%. The maximum increase/(decrease) in income would therefore be limited to £(5) million, £nil and £2 million for Sterling, US dollar and Euro interest rates respectively (2012 – £(2) million, £nil and £nil).
(h) Contractual cash flows for non-derivative financial liabilities and derivative instrumentsThe following tables provides an analysis of the anticipated contractual cash flows including interest payable for the Group’s non-derivative financial liabilities on an undiscounted basis. The impact of interest rate swaps has been excluded. For the purpose of this table, debt is defined as all classes of borrowings except for obligations under finance leases. Interest is calculated based on debt held at 31 December without taking account of future issuance. Floating rate interest is estimated using the prevailing interest rate at the balance sheet date. Cash flows in foreign currencies are translated using spot rates at 31 December. Contractual cash flows in respect of operating lease vacant space provisions are excluded from the table below as they are included in the Commitments under non-cancellable operating leases table in Note 40, ‘Commitments’.
At 31 December 2013
Debt £m
Interest on debt £m
Obligations
under finance leases
£m
Finance charge on obligationsunder finance
leases £m
Trade payables and other
liabilities not in net debt
£m
Total £m
Due in less than one year (2,747) (674) (27) (2) (7,797) (11,247)Between one and two years (1,936) (650) (22) (2) (108) (2,718)Between two and three years (753) (594) (14) (2) (85) (1,448)Between three and four years (2,246) (582) (8) (1) (116) (2,953)Between four and five years (1,657) (467) (4) – (149) (2,277)Between five and ten years (1,958) (2,032) (5) – (1,282) (5,277)Greater than ten years (6,984) (5,064) – – (1,440) (13,488)Gross contractual cash flows (18,281) (10,063) (80) (7) (10,977) (39,408)

198 GSK Annual Report 2013
Financial statements Notes to the financial statements
41 Financial instruments and related disclosures continued
Contractual cash flows for non-derivative financial liabilities and derivative instruments
At 31 December 2012
Debt £m
Interest on debt £m
Obligations
under finance leases
£m
Finance charge on obligationsunder finance
leases £m
Trade payables and other
liabilities not in net debt
£m
Total £m
Due in less than one year (3,607) (690) (27) (3) (7,485) (11,812)Between one and two years (920) (633) (19) (2) (129) (1,703)Between two and three years (1,914) (610) (15) (2) (10) (2,551)Between three and four years – (558) (8) (1) (34) (601)Between four and five years (2,243) (549) (2) – (60) (2,854)Between five and ten years (2,914) (1,967) (5) (1) (583) (5,470)Greater than ten years (6,704) (5,200) – – (853) (12,757)Gross contractual cash flows (18,302) (10,207) (76) (9) (9,154) (37,748)
The increase in contractual cash flows for non-derivative financial liabilities of £1.7 billion over the year results principally from an increase of £1.6 billion in forecast future cash flows in respect of contingent consideration payable for the acquisition of the former Shionogi-ViiV Healthcare joint venture in 2012.
The table below provides an analysis of the anticipated contractual cash flows for the Group’s derivative instruments, excluding embedded derivatives and equity options which are not material, using undiscounted cash flows. Cash flows in foreign currencies are translated using spot rates at 31 December. The gross cash flows of foreign exchange contracts are presented for the purposes of this table, though, in practice, the Group uses standard settlement arrangements to reduce its liquidity requirements on these instruments.
The amounts receivable and payable in less than one year have increased compared to 31 December 2012 due to higher levels of hedging of inter-company loans and external debt. This is reflected in the increased principal amounts shown in the table below.
2013 2012
Receivables £m
Payables £m
Receivables £m
Payables £m
Due in less than one year 18,890 (18,871) 17,822 (18,047)Between one and two years – – 20 (2)Gross contractual cash flows 18,890 (18,871) 17,842 (18,049)
42 Employee share schemes The Group operates share option schemes, whereby options are granted to employees to acquire shares or ADS in GlaxoSmithKline plc at the grant price, savings-related share option schemes and share award schemes. In addition, GSK operates the Performance Share Plan, whereby awards are granted to employees to acquire shares or ADS in GlaxoSmithKline plc at no cost, subject to the achievement by the Group of specified performance targets and the Share Value Plan, whereby awards are granted to employees to acquire shares or ADS in GlaxoSmithKline plc at no cost after a three year vesting period. The granting of restricted share awards has replaced the granting of options to employees as the cost of the scheme more readily equates to the potential gain to be made by the employee.
Grants under share option schemes are normally exercisable between three and ten years from the date of grant. Grants of restricted shares and share awards are normally exercisable at the end of the three year vesting/performance period. Grants under savings-related share option schemes are normally exercisable after three years’ saving. Grants under share option schemes and awards under the Performance Share Plan are normally granted to employees to acquire shares or ADS in GSK plc but in some circumstances will be settled in cash. Options under the share option schemes were granted at the market price ruling at the date of grant. In accordance with UK practice, the majority of options under the savings-related share option schemes are granted at a price 20% below the market price ruling at the date of grant. Share options awarded to the Directors and the CET are subject to performance criteria.
Option pricingFor the purposes of valuing options and awards to arrive at the share based payment charge, the Black-Scholes option pricing model has been used. The assumptions used in the model for 2011, 2012 and 2013 are as follows:
2013 2012 2011
Risk-free interest rate 0.7% 0.1% – 0.5% 0.5% – 1.9%Dividend yield* 5.3% 5.2% 5.8%Volatility 20% 18% – 23% 24% – 28%Expected lives of savings-related share options and share award schemes 3-4 years 3-4 years 3-4 yearsWeighted average share price for grants in the year: Shares £16.14 £14.35 £11.90 ADS $50.49 $45.57 $39.10
* 0% for those plans where dividends are reinvested.

GSK Annual Report 2013 199
42 Employee share schemes continued
Volatility is determined based on the three and five year share price history where appropriate. The fair value of performance share plan grants take into account market conditions. Expected lives of options were determined based on weighted average historic exercises of options.
Options outstanding Share option schemes – shares
Share option schemes – ADS
Savings-related share option schemes
Number
000
Weighted exercise
price
Weighted fair
value
Number
000
Weighted exercise
price
Weighted fair
value
Number
000
Weighted exercise
price
Weighted fair
valueAt 1 January 2011 110,100 £14.02 72,111 $45.73 5,955 £9.59Options granted – – – – – – – – –Options exercised (14,618) £11.97 (3,883) $38.61 (4,068) £9.55Options lapsed (35,112) £17.27 (23,338) $51.21 (317) £9.70At 31 December 2011 60,370 £12.62 44,890 $43.50 1,570 £9.68Options granted – – – – – – 4,210 £11.59 £1.76Options exercised (12,473) £11.97 (9,698) $39.33 (1,230) £9.67Options lapsed (5,168) £13.28 (4,593) $45.99 (89) £9.82At 31 December 2012 42,729 £12.72 30,599 $44.36 4,461 £11.48Options granted – – – – – 1,092 £12.47 £2.33Options exercised (20,355) £12.78 (12,099) $41.62 (241) £9.79Options lapsed (2,112) £12.63 (1,192) $42.94 (210) £11.34At 31 December 2013 20,262 £12.68 17,308 $46.37 5,102 £11.78Range of exercise prices on options outstanding at year end £10.76 – £14.93 $33.42 – $58.00 £11.59 – £12.47Weighted average market price on exercise £15.93 $49.88 £15.40Weighted average remaining contractual life 4.2 years 3.6 years 2.5 years
Options outstanding at 31 December 2013
Share option schemes – shares
Share option schemes – ADS
Savings-related share option schemes
Year of grant
Number
000
Weighted exercise
price
Latest exercise
date
Number
000
Weighted exercise
price
Latest exercise
date
Number
000
Weighted exercise
price
Latest exercise
date2004 1,545 £11.22 01.12.14 1,919 $43.42 01.12.14 – – –2005 57 £13.09 01.11.15 195 $47.29 31.10.15 – – –2006 2,854 £14.69 28.07.16 3,410 $51.33 28.07.16 – – –2007 3,344 £14.80 25.07.17 4,055 $57.52 25.07.17 – – –2008 2,829 £11.49 22.07.18 2,641 $45.04 22.07.18 – – –2009 3,862 £11.76 22.07.19 1,930 $33.72 21.07.19 – – –2010 5,771 £12.03 21.07.20 3,158 $37.28 21.07.20 – – –2011 – – – – – – – – –2012 – – – – – – 4,012 £11.59 01.05.162013 – – – – – – 1,090 £12.47 01.05.17Total 20,262 £12.68 17,308 $46.37 5,102 £11.78
Options normally become exercisable from three years from the date of grant but may, under certain circumstances, vest earlier as set out within the various scheme rules.
There has been no change in the effective exercise price of any outstanding options during the year.
Options exercisable Share option schemes - shares
Share option schemes - ADS
Savings-related share option schemes
Number
000
Weighted exercise
price
Number
000
Weighted exercise
price
Number
000
Weighted exercise
priceAt 31 December 2011 42,432 £12.92 33,143 $46.33 – –
At 31 December 2012 33,930 £12.90 24,706 $46.10 261 £9.72
At 31 December 2013 20,262 £12.68 17,308 $46.37 – –

200 GSK Annual Report 2013
Financial statements Notes to the financial statements
42 Employee share schemes continued
GlaxoSmithKline share award schemes
Performance Share PlanThe Group operates a Performance Share Plan whereby awards are granted to Directors and senior executives at no cost. The percentage of each award that vests is based upon the performance of the Group over a defined measurement period with dividends reinvested during the same period. For awards granted from 2011 onwards to Directors and members of the CET, the performance conditions are based on four equally weighted measures over a three year performance period. The first measure is based on the achievement of adjusted free cash flow targets. The second measure is based on relative TSR performance against a comparator group. The remaining two measures are based on business-specific performance measures on business diversification and R&D new product performance. For details on the calculation of these measures, see the Remuneration Report on pages 96 to 126.
For awards granted in 2009 and 2010 to Directors and members of the CET, 40% of the award is based on the achievement of adjusted free cash flow targets over a three year measurement period. The remaining 60% of the award is based on relative TSR performance against a comparator group. Half of the TSR element of each award is measured over three years and half over four years.
For those awards made to all other eligible employees the performance conditions consist of two parts, each of which applies to 50% of the award. The first part of the performance condition compares GSK’s EPS growth to the increase in the UK Retail Prices Index over the three year measurement period. The second part of the performance condition is based on strategic or operational business measures, over a three year measurement period, specific to the employee’s business area.
The fair value of the awards is determined based on the closing share price on the day of grant. For TSR performance elements, this is adjusted by the likelihood of that condition being met, as assessed at the time of grant.
Number of shares and ADS issuable Shares
Number (000)Weighted fair value
ADS Number (000)
Weighted fair value
At 1 January 2011 8,893 3,613Awards granted 4,712 £9.66 1,740 $31.65Awards exercised (660) (315)Awards cancelled (2,404) (1,112)At 31 December 2011 10,541 3,926Awards granted 4,797 £11.43 1,645 $37.63Awards exercised (1,388) (485)Awards cancelled (1,794) (710)At 31 December 2012 12,156 4,376Awards granted 5,205 £13.36 1,603 $42.41Awards exercised (1,022) (453)Awards cancelled (2,977) (1,041)At 31 December 2013 13,362 4,485
During the year 722,000 shares and 251,000 ADS were awarded through dividends reinvested. These are included above.
Share Value PlanThe Group operates a Share Value Plan whereby awards are granted, in the form of shares, to certain employees at no cost. The awards vest after three years and there are no performance criteria attached. The fair value of these awards is determined based on the closing share price on the day of grant, after deducting the expected future dividend yield over the duration of the award.
Number of shares and ADS issuableShares
Number (000)Weighted fair value
ADS Number (000)
Weighted fair value
At 1 January 2011 14,252 10,978Awards granted 10,923 £9.78 7,481 $32.02Awards exercised (4,677) (3,698)Awards cancelled (1,040) (680)At 31 December 2011 19,458 14,081Awards granted 11,411 £11.96 7,595 $38.51Awards exercised (4,650) (3,410)Awards cancelled (901) (478)At 31 December 2012 25,318 17,788Awards granted 12,011 £14.76 7,681 $46.04Awards exercised (5,324) (4,009)Awards cancelled (938) (622)At 31 December 2013 31,067 20,838

GSK Annual Report 2013 201
42 Employee share schemes continued
Employee Share Ownership Plan TrustsThe Group sponsors Employee Share Ownership Plan (ESOP) Trusts to acquire and hold shares in GlaxoSmithKline plc to satisfy awards made under employee incentive plans and options granted under employee share option schemes. The trustees of the ESOP Trusts purchase shares on the open market with finance provided by the Group by way of loans or contributions. Costs of running the ESOP Trusts are charged to the income statement. Shares held by the ESOP Trusts are deducted from other reserves and held at the value of proceeds receivable from employees on exercise. If there is deemed to be a permanent diminution in value this is reflected by a transfer to retained earnings. The Trusts also acquire and hold shares to meet notional dividends re-invested on deferred awards under the SmithKline Beecham Mid-Term Incentive Plan. The trustees have waived their rights to dividends on the shares held by the ESOP Trusts.
Shares held for share award schemes 2013 2012
Number of shares (000) 63,613 75,066
£m £mNominal value 16 19Carrying value 354 390Market value 1,024 1,002
Shares held for share option schemes 2013 2012
Number of shares (000) 139 139
£m £mNominal value – –Carrying value 1 1Market value 1 2

202 GSK Annual Report 2013
Financial statements Notes to the financial statements
43 Principal Group companiesThe following represent the principal subsidiaries and associates of the GlaxoSmithKline Group at 31 December 2013. Details are given of the principal country of operation, the location of the headquarters, the business sector and the business activities. The equity share capital of these entities is wholly owned by the Group except where its percentage interest is shown otherwise. All companies are incorporated in their principal country of operation except where stated.
Europe Location Subsidiary Sector Activity %
England Brentford GlaxoSmithKline Holdings Limited * Ph,CH hBrentford GlaxoSmithKline Services Unlimited * Ph,CH sBrentford GlaxoSmithKline Mercury Limited * Ph hBrentford GlaxoSmithKline Finance plc Ph,CH fBrentford GlaxoSmithKline Capital plc Ph,CH fBrentford SmithKline Beecham Limited Ph,CH d e h m p rBrentford Wellcome Limited Ph,CH hBrentford Glaxo Group Limited Ph hBrentford Glaxo Operations UK Limited Ph pBrentford GlaxoSmithKline Export Limited Ph eBrentford GlaxoSmithKline Research & Development Limited Ph d rBrentford GlaxoSmithKline UK Limited Ph m pBrentford Setfirst Limited Ph,CH hBrentford GlaxoSmithKline Trading Services Limited (i) (iv) Ph eBrentford ViiV Healthcare Limited Ph h 77Brentford ViiV Healthcare UK Limited Ph m s 77
Austria Vienna GlaxoSmithKline Pharma GmbH Ph mBelgium Wavre GlaxoSmithKline Pharmaceuticals S.A. Ph m
Rixensart GlaxoSmithKline Biologicals S.A. Ph d e m p rCzech Republic Prague GlaxoSmithKline s.r.o. Ph,CH mFrance Marly le Roi Groupe GlaxoSmithKline S.A.S. Ph h
Marly le Roi Laboratoire GlaxoSmithKline S.A.S. Ph m r dMarly le Roi Glaxo Wellcome Production S.A.S. Ph pMarly le Roi GlaxoSmithKline Sante Grand Public S.A.S. CH mMarly le Roi ViiV Healthcare S.A.S. Ph m 77St. Amand Les Eaux GlaxoSmithKline Biologicals S.A.S. Ph p
Germany Buehl GlaxoSmithKline Consumer Healthcare GmbH & Co. KG CH h m sMunich GlaxoSmithKline GmbH & Co. KG Ph d h m s
Greece Athens GlaxoSmithKline A.E.B.E Ph,CH mItaly Verona GlaxoSmithKline S.p.A. Ph d m
Milan GlaxoSmithKline Consumer Healthcare S.p.A. CH mNetherlands Zeist GlaxoSmithKline B.V. Ph mPoland Poznan GlaxoSmithKline Pharmaceuticals S.A. Ph p
Poznan GSK Services Sp.z o.o. Ph m sRepublic of Carrigaline SmithKline Beecham (Cork) Limited (i) Ph d p rIreland Dublin GlaxoSmithKline Consumer Healthcare (Ireland) Limited (i) CH m
Dublin GlaxoSmithKline (Ireland) Limited (i) Ph mDungarvan Stafford Miller (Ireland) Limited (i) CH pDungarvan GlaxoSmithKline Dungarvan Limited (i) CH pSligo Stiefel Laboratories (Ireland) Limited (i) Ph p
Romania Brasov Europharm Holding S.A. Ph,CH sBucharest GlaxoSmithKline (GSK) S.R.L. Ph d m s
Russian Moscow GlaxoSmithKline Trading ZAO Ph e mFederationSpain Madrid GlaxoSmithKline S.A. Ph mSwitzerland Muenchenbuchsee GlaxoSmithKline AG Ph m
USAUSA Research Triangle Park Stiefel Laboratories, Inc. Ph m p
Marietta Corixa Corporation Ph p rPhiladelphia GlaxoSmithKline LLC Ph,CH d e m p r sPittsburgh GlaxoSmithKline Consumer Healthcare, L.P. CH m p 88Pittsburgh Block Drug Company, Inc. CH mWilmington GlaxoSmithKline Holdings (Americas) Inc. Ph,CH hWilmington GlaxoSmithKline Capital Inc. Ph,CH fResearch Triangle Park ViiV Healthcare Company Ph m 77Rockville Human Genome Sciences, Inc. Ph p r

GSK Annual Report 2013 203
43 Principal Group companies continued
Americas Location Subsidiary Sector Activity %
Canada Mississauga GlaxoSmithKline Inc. Ph m pMississauga GlaxoSmithKline Consumer Healthcare Inc. CH mLaval ID Biomedical Corporation of Quebec Ph d e p r
Mexico Mexico City GlaxoSmithKline Mexico S.A. de C.V. Ph,CH e m p s
Asia PacificAustralia Boronia GlaxoSmithKline Australia Pty Ltd Ph,CH d e m p rChina Beijing GlaxoSmithKline (China) Investment Co. Ltd Ph,CH d h m r s
Hong Kong GlaxoSmithKline Limited Ph,CH mTianjin Sino-American Tianjin Smith Kline & French Laboratories Ltd CH e m p 55
India Mumbai GlaxoSmithKline Pharmaceuticals Limited Ph m p 51Gurgaon GlaxoSmithKline Consumer Healthcare Limited CH d e m p r s 72
Malaysia Selangor GlaxoSmithKline Consumer Healthcare Sdn Bhd CH mPakistan Karachi GlaxoSmithKline Pakistan Limited Ph,CH e m p r 83Philippines Makati GlaxoSmithKline Philippines Inc Ph,CH d e mSingapore Singapore Glaxo Wellcome Manufacturing Pte Ltd Ph d e p r s
Singapore GlaxoSmithKline Pte Ltd Ph,CH d e m sSouth Korea Seoul GlaxoSmithKline Korea Limited Ph ,CH m rThailand Bangkok GlaxoSmithKline (Thailand) Limited Ph,CH m
JapanJapan Tokyo GlaxoSmithKline K.K. Ph,CH d m p
Latin AmericaArgentina Buenos Aires GlaxoSmithKline Argentina S.A. Ph,CH e m p rBrazil Rio de Janeiro GlaxoSmithKline Brasil Limitada Ph,CH d e m pColombia Bogota GlaxoSmithKline Colombia S.A. Ph,CH mVenezuela Caracas GlaxoSmithKline Venezuela, C.A. Ph,CH m
Middle East & AfricaEgypt Cairo GlaxoSmithKline S.A.E Ph,CH e m p 91Nigeria Lagos GlaxoSmithKline Consumer Nigeria plc (ii) Ph,CH e m p 46South Africa Johannesburg GlaxoSmithKline South Africa (Pty) Limited Ph,CH d e m pTurkey Istanbul GlaxoSmithKline Ilaclari Sanayi ve Ticaret A.S. Ph,CH e m p
Middle East & Africa Location Associate Sector Activity %
South Africa Johannesburg Aspen Pharmacare Holdings Limited (iii) Ph,CH m p r 12
(i) Exempt from the provisions of section 7 of the Companies (Amendment) Act 1986 (Ireland).(ii) Consolidated as a subsidiary in accordance with section 1162 (4)(a) of the Companies Act 2006 on the grounds
of dominant influence. (iii) Equity accounted on the grounds of significant influence.(iv) Incorporated in Ireland.* Directly held wholly owned subsidiary of GlaxoSmithKline plc.
KeyBusiness sector: Ph Pharmaceuticals, CH Consumer HealthcareBusiness activity: d development, e exporting, f finance, h holding company, i insurance, m marketing, p production, r research,
s service
Full details of all Group subsidiaries and associates will be attached to the company’s Annual Return to be filed with the UK Registrar of Companies. Each of GlaxoSmithKline Capital Inc. and GlaxoSmithKline Capital plc is a wholly-owned finance subsidiary of the company, and the company has fully and unconditionally guaranteed the securities issued by each of GlaxoSmithKline Capital Inc. and GlaxoSmithKline Capital plc.

204 GSK Annual Report 2013
Financial statements Notes to the financial statements
44 Legal proceedingsThe Group is involved in significant legal and administrative proceedings, principally product liability, intellectual property, tax, anti-trust and governmental investigations, as well as related private litigation. The Group makes provision for these proceedings on a regular basis as summarised in Note 2, ‘Accounting principles and policies’ and Note 29, ‘Other provisions’. The Group may become involved in significant legal proceedings in respect of which it is not possible to make a reliable estimate of the expected financial effect, if any, that could result from ultimate resolution of the proceedings.
In these cases, appropriate disclosures about such cases would be included but no provision would be made.
With respect to each of the legal proceedings described below, other than those for which a provision has been made, the Group is unable to make a reliable estimate of the expected financial effect at this stage. The Group does not believe that information about the amount sought by the plaintiffs, if that is known, would be meaningful with respect to those legal proceedings. This is due to a number of factors, including, but not limited to, the stage of proceedings, the entitlement of parties to appeal a decision and clarity as to theories of liability, damages and governing law. Intellectual property claims include challenges to the validity and enforceability of the Group’s patents on various products or processes as well as assertions of non-infringement of those patents. A loss in any of these cases could result in loss of patent protection for the product at issue. The consequences of any such loss could be a significant decrease in sales of that product and could materially affect future results of operations for the Group.
Legal expenses incurred and provisions related to legal claims are charged to selling, general and administration costs. Provisions are made, after taking appropriate legal and other specialist advice, where an outflow of resources is considered probable and a reliable estimate can be made of the likely outcome of the dispute. For certain product liability claims, the Group will make a provision where there is sufficient history of claims made and settlements to enable management to make a reliable estimate of the provision required to cover unasserted claims. At 31 December 2013, the Group’s aggregate provision for legal and other disputes (not including tax matters described in Note 14, ‘Taxation’) was £0.6 billion. The ultimate liability for legal claims may vary from the amounts provided and is dependent upon the outcome of litigation proceedings, investigations and possible settlement negotiations.
The Group’s position could change over time, and, therefore, there can be no assurance that any losses that result from the outcome of any legal proceedings will not exceed by a material amount the amount of the provisions reported in the Group’s financial accounts. If this were to happen, it could have a material adverse impact on the results of operation of the Group in the reporting period in which the judgments are incurred or the settlements entered into. The most significant of these matters are described below.
Intellectual property
ArzerraOn 23 March 2010, Genentech and Biogen Idec filed suit against the Group in the United States District Court for the Southern District of California alleging that the Group’s sale of Arzerra (ofatumumab), which is approved by the US Food and Drug Administration (FDA) for treatment of refractory chronic lymphocytic leukaemia (CLL), induces and contributes to infringement of their patent that claims the treatment of CLL with an anti-CD-20 monoclonal antibody. The Group counterclaimed that the patent is invalid or not infringed.
On 18 October 2011, the District Court issued a ruling that construed the claims of the patent in a manner such that Arzerra would not infringe the patent. Genentech and Biogen Idec stipulated to a judgment of no infringement and filed an appeal of the claim construction issue to the United States Court of Appeals for the Federal Circuit on 5 December 2011. The appeal was heard on 8 November 2012 and the court affirmed the District Court’s claim construction giving effect to Genentech’ stipulation that the patent was not infringed. Genentech filed a request for rehearing en banc on 16 May 2013, which was denied on 15 July 2013, ending the case.
Avodart/JalynOn 29 November 2010, Banner Pharmacaps, Inc. (Banner) notified the Group that it had filed an Abbreviated New Drug Application (ANDA) to market a generic version of Avodart (dutasteride) in the USA. Banner’s notification contained a Paragraph IV certification alleging that two patents expiring in 2013 and one patent expiring in 2015 (the ‘467 patent) covering the compound dutasteride were invalid or not infringed by Banner’s proposed generic dutasteride product. The Group subsequently received similar notices from Anchen Pharmaceuticals (Anchen), Apotex (Apotex), Roxane Laboratories (Roxanne), Watson Laboratories, Inc (Watson), and Mylan Pharmaceuticals, Inc. (Mylan) each variously challenging either the ‘467 patent or all 3 patents.
On 29 December 2010, Anchen notified the Group that it had filed an ANDA for Jalyn with a Paragraph IV certification alleging that the ‘467 patent was invalid, unenforceable or not infringed. Jalyn, a combination of dutasteride and tamsulosin, is covered by the same three patents that cover Avodart. Subsequently, the Group received similar notices from Impax Laboratories, Inc. (Impax) and Watson challenging one or more of the patents covering Jalyn.
The Group filed suit against Anchen, Banner, Impax, Mylan, Roxanne and Watson in the United States District Court for the District of Delaware for infringement of the Avodart and Jalyn patents, as applicable, and the cases were consolidated for trial. On 31 August 2012, the Group filed a separate suit against Apotex in the same court for infringement of the ‘467 patent. This case was not consolidated with the original case against the other generic defendants. On 31 May 2013, the Court ordered that the Apotex case would be stayed pending the entry of judgment in the Banner et al case. On 17 January 2013, the Group and Anchen settled the litigation on terms that would allow Anchen to enter the market for Jalyn in the fourth quarter of 2015 or earlier under certain circumstances. The Group previously had settled an earlier patent challenge against Avodart by Teva Pharmaceuticals (Teva) on terms that will allow Teva to launch its generic dutasteride product in the fourth quarter of 2015 or earlier under certain circumstances. Teva’s generic dutasteride product was approved by the FDA on 21 December 2010.
A trial on the consolidated case against the generic defendants was held on 28 January 2013. On 13 August 2013, the District Court upheld the validity of the ‘467 patent. Banner, Impax, Mylan, Roxanne and Watson appealed the decision in favour of the Group to the Court of Appeals for the Federal Circuit on 27 August 2013. On 24 February 2014, the Federal Circuit entered a decision in favour of the Group affirming the decision of the District Court.

GSK Annual Report 2013 205
BenlystaIn September, 2012, the UK Court of Appeal refused an appeal by Eli Lilly and Company (Eli Lilly) asserting that Human Genome Sciences, Inc. (HGS) UK Patent No. EP0939804 for Benlysta was invalid on the grounds that it lacked the necessary information required to work the invention described in the claims which covered antibodies (the ‘antibody claim insufficiency argument’). The UK High Court and the UK Supreme Court previously had decided that the patent was valid on all other grounds. In 2013, the UK Supreme Court refused the Eli Lilly petition for a further appeal and, as a result, the UK litigation has now ended with the validity of the HGS patent being affirmed by the UK courts.
Eli Lilly separately had requested a declaration from the UK High Court that any Supplementary Protection Certificate (SPC) filed by HGS to extend its UK patent based upon any future Eli Lilly Marketing Authorisation (MA) for an anti-BLyS antibody will be invalid. That litigation is pending.
On 12 September 2013, the Court of Justice of the European Union (CJEU) heard arguments on the question of the meaning of “protected by a basic patent” and handed down its guidance on 12 December 2013. The CJEU did not answer the question whether Eli Lilly’s antibody is “protected” by the HGS patent, but confirmed that a functional definition of the product for which the SPC is sought is sufficient in principle if the claims of the patent relate “implicitly, but necessarily and specifically” to the active ingredient covered by the SPC. The UK High Court must now implement the guidance from the CJEU to decide the case. A hearing date is yet to be set. The outcome of this litigation will have no effect on the Group’s ability to market Benlysta.
Epzicom/TrizivirOn 30 November 2007, the Group’s affiliate, ViiV Healthcare, received notice that Teva Pharmaceuticals USA, Inc. (Teva) had filed an ANDA with a Paragraph IV certification for Epzicom (the combination of lamivudine and abacavir). The certification challenged only the patent covering the hemisulfate salt of abacavir, which expires in 2018. ViiV Healthcare did not sue Teva under this patent. On 27 June 2011, ViiV Healthcare received notice that Teva had amended its ANDA for Epzicom to contain a Paragraph IV certification for two additional patents listed in the Orange Book, alleging the patents were invalid, unenforceable or not infringed. The patents challenged in this new certification relate to a method of treating HIV using the combination (expiring in 2016), and a certain crystal form of lamivudine (expiring in 2016). On 5 August 2011, ViiV Healthcare filed suit against Teva under the combination patent in the United States District Court for the District of Delaware.
On 18 May 2011, ViiV Healthcare received notice that Lupin Ltd. (Lupin) had filed an ANDA containing a Paragraph IV certification for Trizivir (the triple combination of lamivudine, AZT and abacavir) alleging that three patents listed in the Orange Book for Trizivir were invalid, unenforceable or not infringed. These patents relate to a method of treating HIV using the triple combination (expiring in 2016), the hemisulfate salt of abacavir (expiring in 2018), and a certain crystal form of lamivudine (expiring in 2016). On 29 June 2011, ViiV Healthcare filed suit against Lupin under the patent covering the triple combination in the United States District Court for the District of Delaware. The District Court consolidated discovery in the Teva Epzicom case with ViiV Healthcare’s patent infringement suit against Lupin relating to Trizivir, as both cases involve the same patent covering the combination of lamivudine and abacavir.
On 17 December 2013, the United States District Court for the District of Delaware upheld the validity of the US patent with an expiry date in March 2016 which covers the combination of lamivudine and abacavir (Epzicom) and the triple combination of lamivudine, abacavir and zidovudine (Trizivir).
In a separate component to the decision, the judge ruled that the Lupin generic version of Trizivir did not infringe the patent. Before trial, Teva stipulated that its generic version of Epzicom would infringe the patent, and the District Court has enjoined Teva from launching its generic Epzicom product. The parties have appealed the judgements.
On 6 February 2014, ViiV Healthcare received notice that Lupin had filed an ANDA containing a Paragraph IV certification for Epzicom, alleging that the three patents listed in the Orange Book for Epzicom are either invalid, unenforceable or not infringed. These patents relate to a method of treating HIV using the double combination (expiring in 2016), the hemisulfate salt of abacavir (expiring in 2018), and a certain crystal form of lamivudine (expiring in 2016).
LexivaOn 23 April 2012, Ranbaxy Laboratories Limited (Ranbaxy) notified ViiV Healthcare that it had filed a Paragraph IV certification alleging that a patent claiming a polymorphic form of fosamprenavir calcium, the active ingredient in Lexiva, was invalid or not infringed. The patent expires in 2020. ViiV Healthcare did not sue under this patent.
On 30 July 2012, Mylan Pharmaceuticals, Inc. (Mylan) notified ViiV Healthcare that it had filed an ANDA for Lexiva with a Paragraph IV certification asserting that patents claiming (i) the active ingredient (expiring in 2018) and (ii) a polymorphic form of the active ingredient (expiring 2020), are invalid, unenforceable, or not infringed. Mylan is the second generic company to file an ANDA for Lexiva, but the first generic company to challenge the basic compound patent on the active ingredient. On 23 August 2012, ViiV Healthcare and its licensor, Vertex Pharmaceuticals Incorporated, filed a patent infringement suit against Mylan on the patent claiming the active ingredient (but not the patent claiming the polymorph) in the United States District Court for the District of Delaware. Mylan subsequently filed a declaratory judgment action against ViiV Healthcare alleging that the polymorph patent is invalid and not infringed. ViiV Healthcare stipulated to non-infringement of the patent claiming the polymorph and the parties filed a consent judgment on 20 December 2012 on the polymorph patent. Trial is scheduled for 17 May 2014 for infringement of the basic active ingredient patent for Lexiva.
On 18 October 2012, Ranbaxy filed a Petition for Inter Parties Review in the United States Patent & Trademark Office (USPTO) alleging that the basic compound patent covering the active ingredient is invalid. On 5 March 2013, the USPTO granted the petition. The Inter Parties Review proceeding was settled in October 2013 on terms that are confidential.
LovazaIn March 2009, the Group received notice that Teva Pharmaceuticals USA, Inc. (Teva), Par Pharmaceuticals, Inc. (Par), and Apotex Inc. (Apotex) had filed ANDAs with a Paragraph IV certification alleging that two patents covering Lovaza (omega-3-acid ethyl esters) are invalid, unenforceable, or not infringed. The patents expire in March 2013 and April 2017. The Group is the licensee under these patents and has marketing rights in the USA and Puerto Rico. Pronova BioPharma Norge AS (Pronova), the owner of the patents, sued Teva, Par and Apotex in the United States District Court for the District of Delaware. The Group was not a party to these suits.
On 30 March 2011, Pronova entered into an agreement with Apotex to settle their patent litigation in the USA related to Lovaza. The settlement grants Apotex a licence to enter the US market with a generic version of Lovaza in the first quarter of 2015. Other terms of the settlement are confidential.

206 GSK Annual Report 2013
Financial statements Notes to the financial statements
A trial involving Teva and Par was held in March and April 2011, and in May 2012, the District Court held the patent valid and infringed. On 13 September 2013, the Court of Appeals for the Federal Circuit ruled against Pronova in its patent litigation regarding Lovaza. Reversing the District Court’s ruling, the Court found the asserted claims of Pronova’s U.S. 5,656,667 patent invalid and remanded the case to the District Court with orders to enter judgment in favour of the ANDA filers. Because the only other patent in the litigation, U.S. 5,502,077, had expired earlier in 2013, the court found it unnecessary to reach any issues regarding that patent. On 15 October, Pronova filed a combined petition for panel rehearing and for rehearing en banc with the Court of Appeals for the Federal Circuit. The Court denied both petitions on 16 January 2014, thereby affirming the 13 September 2013 decision of the Federal Circuit Court.
Pronova and the Group also have received Paragraph IV notices from Endo Pharmaceuticals (Endo), Sandoz, Inc. (Sandoz), Strides Arcolab, Ltd. (Strides) and Trygg Pharma AS (Trygg) advising that they have submitted abbreviated applications to the FDA for a generic form of Lovaza. Pronova chose not to assert its patents against Endo, Sandoz, Strides and Trygg while awaiting the ruling in the litigation against Teva and Par in the Court of Appeals for the Federal Circuit. The Group is not aware that the FDA has approved any generic copies of Lovaza to date.
VeramystOn 9 November 2011, the Group received notice that Sandoz, Inc. had filed an ANDA with a Paragraph IV certification for Veramyst (fluticasone furoate) nasal spray, challenging the three patents listed in the Orange Book for Veramyst as invalid, unenforceable, or not infringed. All three patents expire in 2021. On 23 December 2011, the Group filed suit against Sandoz in the United States District Court for the District of Delaware on all three patents. A stay against FDA approval of Sandoz’s generic product was in place until the earlier of a court decision adverse to the Group or May 2014. Trial had been scheduled to begin on 2 December 2013, but on 28 August 2013, the Group and Sandoz settled the litigation on terms that would allow Sandoz to enter the market with a generic competitor to Veramyst in the third quarter of 2016 or earlier under certain circumstances.
Product liabilityPre-clinical and clinical trials are conducted during the development of potential products to determine the safety and efficacy of products for use by humans following approval by regulatory bodies. Notwithstanding these efforts, when drugs and vaccines are introduced into the marketplace, unanticipated safety issues may become, or be claimed by some to be, evident. The Group is currently a defendant in a number of product liability lawsuits related to the Group’s Pharmaceutical, Vaccine and Consumer Healthcare products. The most significant of those matters are described below. The Group has been able to make a reliable estimate of the expected financial effect of the matters discussed in this category and has included a provision for the matters below in the provision for legal and other disputes, as also noted in Note 29, ‘Other provisions’.
AvandiaThe Group has been named in product liability lawsuits on behalf of individuals asserting personal injury claims arising out of the use of Avandia. The federal cases filed against the Group are part of a multi-district litigation proceeding pending in the United States District Court for the Eastern District of Pennsylvania (the ‘MDL Court’). Cases have also been filed in a number of state courts.
As of February 2014, the Group has reached agreements to settle the substantial majority of federal and state cases pending in the US. Fourteen purported class actions on Avandia are pending in Canada. The Group has reached an agreement in principle to resolve the single purported consumer class action in Israel, which has now been approved by the Court. The Group has been notified of 43 individual claims in the UK. Lawyers representing claimants in the UK have made an application to the High Court for the overall litigation to be subject to a Group Litigation Order. The Court has listed the application for a hearing date of 6 June 2014.
There are a number of purported class actions seeking economic damages on behalf of third party payers and consumers asserting claims arising under various state and federal laws, including the Racketeer Influenced and Corrupt Organizations Act (RICO), state unfair trade practices and/or consumer protection laws. In addition, three subrogation actions initiated by United Health Group, Inc. and Humana Medical Plan (Humana) have been brought against the Group. One is a putative class action brought in the MDL Court by Humana, which concerns Medicare Advantage claims. Briefing in that action on threshold class certification issues remains pending. The other two are state court actions which concern non-Medicare Advantage claims. These actions are stayed until mid-June 2014 to determine whether a private lien resolution program will resolve these claims.
Paxil/Seroxat and Paxil CRThe Group has received numerous lawsuits and claims alleging that use of Paxil (paroxetine) has caused a variety of injuries. Most of these lawsuits in recent years have alleged that the use of Paxil during pregnancy resulted in the birth of a child with birth defects or health issues. Other lawsuits and claims have alleged that patients who took Paxil committed or attempted to commit suicide or acts of violence or that patients suffered symptoms on discontinuing treatment with Paxil.
• PregnancyThe Group has reached agreements to settle the substantial majority of the US claims relating to Paxil use during pregnancy as of February 2014, but a number of claims related to use during pregnancy are still pending, including several scheduled for trial in the Philadelphia state court Mass Tort Program (MTP). Other matters have been dismissed without payment. In the US, the United States Court of Appeals for the Third Circuit ruled in June 2013 that GlaxoSmithKline LLC is a Delaware citizen for purposes of diversity jurisdiction in the US federal courts. As a result of this ruling, the Group has or is seeking to remove to federal court numerous cases recently filed in the Philadelphia MTP and certain cases that were set for trial in the MTP. On 27 November 2013, in the Thomas/Swindle matter, the Pennsylvania Superior Court upheld a summary judgment in favour of the Group based on the expiration of the statute of limitations. On 27 December 2013, the plaintiffs in this case petitioned for allowance of appeal to the Pennsylvania Supreme Court. The Group plans to oppose the petition for allowance of appeal. Currently, there are no trials scheduled in 2014.
There are two proposed, and one certified, class actions in Canada. The Bartram action has been certified in British Columbia as a national class action and relates to cardiovascular defects. An appeal from that certification decision was dismissed in October 2013, and the parties will therefore proceed to commence discovery.

GSK Annual Report 2013 207
The Singh action in Alberta, also a proposed national class action, seeks to certify a class relating to birth defects generally. The certification motion is likely to be be scheduled for some time in 2014. There is also one inactive proposed national class action in British Columbia which has been held in abeyance while the other proceedings move forward through certification.
• Acts of violenceAs of February 2014, there were 10 pending matters, including two lawsuits on appeal (one pending in the United States Court of Appeals for the Ninth Circuit and the other pending in Florida’s Second District Court of Appeal) concerning allegations that patients who took Paxil committed or attempted to commit suicide or acts of violence.
• DiscontinuationIn the UK, in late 2010, public funding was withdrawn from the claimants who had received funding to pursue litigation alleging that Paxil/Seroxat had caused them to suffer from withdrawal reactions and dependency. The majority of the claimants discontinued their claims. In June 2013, the Group was informed that the Legal Aid Agency (LAA) (formerly the Legal Services Commission) is considering whether to discharge the public funding certificate following the recommendation of its Special Cases Review Panel that the case has poor prospects of success. The remaining claims have not been prosecuted pending the outcome of the LAA’s decision.
PoligripBeginning in 2005, a number of product liability lawsuits and claims were filed against the Group in both state and federal courts in the USA, including purported class actions, alleging that the zinc in Super Poligrip causes copper depletion and permanent neurologic injury. The federal cases were consolidated in the Denture Cream Adhesive multi-district litigation (MDL) in the United States District Court for the Southern District of Florida which was established in June 2009. Both the Group and Procter & Gamble were defendants in this litigation. Included in the MDL were four purported class actions asserting economic loss claims under state consumer protection laws and claims for medical monitoring. These original four putative class actions have now been dismissed. In 2013, a putative class action was filed in Puerto Rico, which was removed to federal court and transferred to the MDL where it remains pending as of February 2014. With two current exceptions (one state court case in Pennsylvania, and one state court case in small claims court in Tennessee), all of the state court cases were consolidated in the Philadelphia state court Mass Tort Program (MTP).
As of February 2014, the vast majority of individual cases previously pending in both the MDL and MTP have been dismissed, with fewer than ten active cases in the MDL and one active case in the MTP still pending against the Group which is scheduled for trial on 10 November 2014. One individual lawsuit, as well as five purported class actions asserting consumer fraud claims were also filed in Canada. In 2013, the individual lawsuit was resolved, and one of the class actions was dismissed, leaving four putative class actions that remain pending in Canada. There are some filed and unfiled claims in Turkey, the UK and elsewhere. The Group voluntarily withdrew all zinc-containing formulations of Super Poligrip from the market in early 2010.
Sales and marketing and regulationThe Group has been able to make a reliable estimate of the expected financial effect of the matters discussed in this category, and has included a provision for such matters in the provision for legal and other disputes, except as noted below. Matters for which the Group has made a provision are also noted in Note 29, ‘Other provisions’.
China investigationOn 27 June 2013, a number of the Group’s Pharmaceutical offices in China were visited by government authorities of the People’s Republic of China (PRC). On 11 July 2013, the Ministry of Public Security in China released a statement confirming an ongoing police investigation into alleged ‘serious economic crimes’ by GSK China. The PRC, acting through various government agencies, continues its investigation into alleged crimes and violations of law by GSK China’s operations. The Group takes these allegations seriously and is continuing to cooperate fully with the Chinese authorities in this investigation.
The Group has informed the US Department of Justice, the US Securities and Exchange Commission and the UK Serious Fraud Office regarding the investigation. It is not possible at this time to make a reliable estimate of the financial effect, if any, that could result from these matters.
‘Colorado investigation’On 2 July 2012, the Group announced that it had reached an agreement with the United States Government, multiple states and the District of Columbia to conclude the Group’s most significant ongoing United States federal government investigations, specifically, (i) the United States Department of Justice’s investigation into the Group’s sales and marketing practices relating to nine of its largest selling products, begun in February 2004; (ii) the Department of Justice’s investigation of possible inappropriate use of the nominal price exception under the Medicaid Rebate Program; and (iii) the Department of Justice’s investigation of the development and marketing of Avandia, for a settlement payment of $3 billion. The settlement resolved criminal and civil liabilities related to these investigations. The payment was covered by the Group’s existing provisions and funded through existing cash resources. To date, 44 states and the District of Columbia have agreed to join the federal settlement agreement and receive all or a portion of their share of the settlement payment under the agreement.

208 GSK Annual Report 2013
Financial statements Notes to the financial statements
The Group has been notified by a consortium of state attorneys general that they are investigating the conduct underlying the non-Avandia federal and state sales and marketing settlements to determine if the company violated state unfair and deceptive trade practices statutes. There are 45 states known to be participating in the investigation.
Avandia-related mattersAs noted above, on 2 July 2012, the Group reached agreement with the US Government, a number of states, and the District of Columbia to resolve the federal government’s Avandia investigation. The settlement resolved claims under federal/state Medicaid programs. On 15 November 2012, the Group agreed to pay $90 million to settle claims by 37 states and the District of Columbia under state consumer protection laws regarding the marketing and promotion of Avandia.
In 2013, the Group agreed to pay $229 million to resolve the individual lawsuits filed by the Attorneys General Offices of Kentucky, Louisiana, Maryland, Mississippi, New Mexico, South Carolina, Utah, and West Virginia asserting various statutory and common law claims relating to the development and marketing of Avandia and, with regard to the state of Louisiana, other of the Group’s products. These states had not participated in the federal government settlement.
The Group is also defending an action by the County of Santa Clara, California, which was brought under California’s consumer protection laws seeking civil penalties and restitution. Pre-trial activities are scheduled to occur through Q2 2014. If the case proceeds to trial, the MDL Court will send the case back to California federal court for a bench trial.
Two Native American groups (the Cherokee Nation in Oklahoma and the Mississippi Band of Choctaw Indians) have filed lawsuits in their respective tribal courts, alleging common law claims, including fraud, negligence, breach of warranty, and unjust enrichment. The Cherokee Nation matter relates to the sale and marketing of Avandia, whereas the Choctaw complaint relates to Avandia and other Group products.
Average wholesale priceA number of states through their respective Attorneys General, and most of the counties in New York State, filed civil lawsuits in state and federal courts against the Group and many other pharmaceutical companies claiming damages and restitution due to average wholesale price (AWP) and/or wholesale acquisition cost (WAC) price reporting for pharmaceutical products covered by the states’ Medicaid programmes. These cases alleged that the Group reported or caused to be reported false AWP and WAC prices, which, in turn, allegedly caused State Medicaid agencies to reimburse providers more money for covered medicines than the agencies intended. The states have sought recovery on behalf of the states as payers and, in some cases, on behalf of in-state patients as consumers. The Group has resolved AWP claims by state Medicaid programmes in almost all of the states through the Group’s settlement agreement with the federal government announced in September 2005 and in multiple additional settlements since then. Litigation concerning AWP issues is continuing with two states, Illinois and Wisconsin.
HIV division enquiryOn 26 July 2010, the Group received a subpoena from the Eastern District of New York’s US Attorney’s Office regarding sales and marketing practices for three HIV products, as well as educational programmes, grants or payments to physicians regarding any drug used to treat HIV-infected adults. On 5 September 2012, the Group was advised that the US Government had concluded its investigation and declined to intervene in a qui tam lawsuit filed in the United States District Court for the Eastern District of New York. The suit has been dismissed and the matter is concluded.
Cidra third-party payer litigationOn 25 July 2013, a number of major US healthcare insurers filed suit against the Group in Philadelphia, Pennsylvania County Court of Common Pleas seeking compensation for reimbursements they made for medicines manufactured at the Group’s former Cidra plant in Puerto Rico. These insurers claim that the Group knowingly and illegally marketed and sold adulterated drugs manufactured under conditions non-compliant with cGMP and that they, as third-party insurers, were unlawfully induced to pay for them.
The suit alleges both US federal and various state law causes of action. On 12 August 2013, the Group removed the case to the United States District Court for the Eastern District of Pennsylvania and has moved to dismiss the complaint. Oral argument on the motion to dismiss was held on 4 February 2013, and the motion is currently under consideration by the District Court. The manufacturing issues at the Group’s plant at Cidra were the subject of federal and state claims that the Group resolved with the US federal Government in 2010 and for which the Group has compliance obligations under a Corporate Integrity Agreement with the US Government.
Paxil/SeroxatIn 2004, the Group settled a lawsuit filed by the New York State Attorney General’s office alleging that the Group failed to disclose data on the use of Paxil in children and adolescents. In 2007 and 2008, the Group made class settlements of lawsuits brought by consumers and third-party payers, respectively, for economic damages allegedly resulting from prescriptions of Paxil to children and adolescents. The Group denied liability in these settlements. In 2010, plaintiffs voluntarily dismissed a similar purported class action filed on behalf of governmental entities that paid for prescriptions of Paxil to minors. There remains a similar purported class action in Canada seeking economic damages on behalf of individuals who purchased Paxil for use by patients under the age of 18. The certification application as part of this purported class action was adjourned in 2012, to permit the filing of further evidence, and is likely to resume in 2014.
SEC/DOJ FCPA enquiryThe US Securities and Exchange Commission (SEC) and the US Department of Justice (DOJ) initiated an industry-wide enquiry in 2010 into whether pharmaceutical companies may have engaged in violations of the US Foreign Corrupt Practices Act (FCPA) relating to the sale of pharmaceuticals, including in Argentina, Brazil, Canada, China, Germany, Italy, Poland, Russia and Saudi Arabia. The Group is one of the companies that have been asked to respond to this enquiry and is cooperating with the SEC and DOJ. The Group has informed the DOJ and SEC about the investigation of its China operations by the Chinese government that was initiated in 2013.
Anti-trust/competitionThe Group has been able to make a reliable estimate of the expected financial effect of the matters discussed in this category and has included a provision for such matters in the provision for legal and other disputes, except as noted below. Matters for which the Group has made a provision are also noted in Note 29, ‘Other provisions’.
GSK Annual Report 2013 209
EU sector enquiryIn 2008, the European Commission launched an enquiry to investigate possible anti-competitive conditions in the pharmaceutical sector. The Final Report of the Pharmaceutical Sector Inquiry was published on 8 July 2009. As announced in the Final Report, the Commission decided to continue monitoring patent settlement agreements between originator and generic companies relating to EU markets. As a result, the Group has provided input to the reports published in 2010, 2011, 2012 and 2013. On 3 February 2014 the Group received a questionnaire relating to patent settlements during 2013. The Group responded to the Commission on 17 February 2014. No provision has been made for this matter.
EU enquiry: Tyverb and CombivirOn 17 December 2012, the Group and ViiV Healthcare received a request for information from the European Commission regarding the application of ‘direct to pharmacy’ distribution of the Group’s product, Tyverb, and ViiV Healthcare’s product, Combivir. The Group and ViiV Healthcare have provided the requested information. No provision has been made for this matter.
UK Office of Fair Trading Competition Act investigationOn 12 August 2011, the UK Office of Fair Trading (OFT) launched a formal investigation of the Group and other pharmaceutical companies for potential infringement of the Competition Act. The investigation focuses on whether: (i) litigation settlements between the Group and potential suppliers of generic paroxetine formulations, entered between 2001 and 2003, had as their object or effect the prevention, restriction, or distortion of competition in the UK, and (ii) the Group has infringed its dominant position by making payments to potential suppliers of generic paroxetine with the aim of restricting the development of full generic competition in the UK. The Group terminated the agreements at issue in 2004. The OFT investigation covers issues that were also investigated by the European Commission in 2005 – 2006 in respect of paroxetine in the European Union, and also in 2008, as part of the European Commission Pharmaceutical Sector enquiry. On 2 March 2012, the Commission announced that it had formally concluded its enquiry with no further action. In March 2012, the OFT decided to focus its investigation on potential anti-competitive aspects of the paroxetine settlement agreements and dropped the investigation in relation to potential abuse of dominance. However, in February 2013, the OFT decided to re-open the dominance aspects of the matter.
The Group has cooperated with the OFT in its investigations since the outset. On 19 April 2013, the OFT issued its Statement of Objections (SO) setting out the decision that the OFT would propose to make and allowing the affected parties to make representations on the proposed decision. The OFT’s core “theory of harm” is that the transfer of value, from an originator company to a potential competitor, made in return for restrictions on the potential competitor entering the market, necessarily restricts competition because it delays true generic competition and the accompanying price reduction. This includes the situation where value is transferred in the context of settling patent litigation. In the SO, the OFT states that it would propose a fine on GSK, but no details were provided on how any fine might be calculated. On 7 August 2013, GSK submitted its response to the SO, rebutting the OFT’s arguments, and, on 18 October 2013, GSK presented its case to the OFT at an oral hearing. After the hearing, GSK also responded in writing to some follow-up questions. The OFT has indicated that it will decide how to proceed with this case in Q1 2014, with a final decision likely to be issued by October 2014. The OFT’s decision may be appealed to the Competition Appeal Tribunal. No provision has been made for this matter.
FlonasePurported direct and indirect purchaser class actions were filed in the United States District Court for the Eastern District of Pennsylvania alleging the Group illegally maintained monopoly power in the ‘market’ for Flonase and charged plaintiffs supracompetitive prices. Additionally, a suit was filed by Roxane Laboratories, Inc., a generic competitor, seeking lost profits from the Group’s alleged actions unlawfully delaying Roxane’s entry into the market. The predicate for all of these allegations was the filing by the Group of allegedly sham citizen petitions and subsequent litigation.
On 20 December 2012, the Group reached agreement to settle the litigation with the direct purchasers for a payment of $150 million and an agreement to settle with the indirect purchaser class and other indirect purchasers for a payment of $45 million.
The court approved the class action settlements in 2013, and this matter is concluded.
LamictalPurported direct and indirect purchaser class actions were filed in the United States District Court for the District of New Jersey alleging that the Group and Teva Pharmaceuticals unlawfully conspired to delay generic competition for Lamictal, resulting in their being overcharged. A separate count accuses the Group of monopolising the market. The District Court recently denied the motion of the purported direct purchaser class for reconsideration of the order granting GSK’s motion to dismiss in December 2012. The plaintiffs have filed a notice of appeal to the United States Court of Appeals for the Third Circuit. The Group also plans to move to have the purported indirect purchaser class dismissed following the outcome of the direct purchaser case.
Nevada vaccines antitrust litigationThe Vaccine Center, a for-profit vaccination centre in Las Vegas, Nevada, alleges that the Group, along with a vendor, engaged in price discrimination by providing lower-priced vaccine products to the Southern Nevada Health District (a “340B” entity which is entitled to lower-priced pharmaceutical products under a US federal healthcare program), allegedly creating a competitive disadvantage and resulting in antitrust injury to The Vaccine Center. The complaint alleges violation of the Sherman Act, Robinson-Patman Act, and a claim under Nevada state law. The Group has responded to the complaint. No trial date has yet been set.
Wellbutrin SRIn December 2004, January 2005 and February 2005, lawsuits, several of which purported to be class actions, were filed in the United States District Court for the Eastern District of Pennsylvania against the Group on behalf of direct and indirect purchasers of Wellbutrin SR. The complaints alleged violations of US anti-trust laws through sham litigation and fraud on the patent office by the Group in obtaining and enforcing patents covering Wellbutrin SR. The complaints followed the introduction of generic competition to Wellbutrin SR in April 2004, after district and appellate court rulings that a generic manufacturer did not infringe the Group’s patents.
On 21 November 2011, the District Court approved the Group’s settlement with the certified class of direct purchasers and the settlement has been concluded. On 11 January 2012, the Group reached agreement in principle to settle the claims of all the indirect purchasers for $21.5 million. The District Court approved the settlements in 2013, and this matter is concluded.

210 GSK Annual Report 2013
Financial statements Notes to the financial statements
Wellbutrin XLActions have been filed against Biovail Corporation (Biovail) and the Group in the United States District Court for the Eastern District of Pennsylvania by purported classes of direct and indirect purchasers who allege unlawful monopolisation and other anti-trust violations related to the enforcement of Biovail’s Wellbutrin XL patents and the filing, by Biovail, of citizen petitions. Both direct and indirect purchaser classes have been certified. The District Court granted the Group’s motion for partial summary judgment primarily on immunity grounds. On 7 November 2012, the District Court also granted the Group’s motion for a stay of all proceedings (except for a limited amount of ongoing discovery) in light of the US Supreme Court’s grant of a petition in the FTC v. Watson ’reverse payment’ patent litigation case.
On 19 December 2013, the District Court held a hearing in connection with the remaining issue in the case, the possible antitrust liability arising from the settlement of the underlying patent infringement litigation. The court recently ordered the parties to submit a plan for additional discovery and proceedings on this remaining issue.
Commercial and corporateWhere the Group is able to make a reliable estimate of the expected financial effect, if any, for the matters discussed in this category, it has included a provision in respect of such matters in the provision for legal and other disputes as set out in Note 29, ‘Other provisions’. No provision has been made for any of the following matters except as indicated below.
Securities/ERISA class actionsStiefelOn 6 July 2009, a class action suit brought on behalf of current and former employees of Stiefel Laboratories, Inc. (Stiefel) was filed in the United States District Court for the Southern District of Florida. The complaint alleges that Stiefel and its officers and directors violated US Employee Retirement Income Security Act (ERISA) and federal and state securities laws by inducing Stiefel employees to sell their shares in the employee stock plan back to Stiefel at a greatly undervalued price and without disclosing to employees that Stiefel was about to be sold to the Group. On 21 July 2011, the District Court denied plaintiffs’ motion for class certification. In October 2011, the District Court granted the defendants’ motions for summary judgment, dismissing all but one of the remaining plaintiffs in the litigation. Trial of claims of that one plaintiff, Timothy Finnerty, took place in May 2012 and resulted in a $1.5 million jury verdict in favour of Mr. Finnerty on his securities claims. The Group has appealed the verdict, and oral argument on the appeal is scheduled for 27 February 2014. Separately, the Group has settled Mr. Finnerty’s ERISA claims. Additionally, Stiefel won a complete defence verdict in the Fried case, tried in federal court in Florida in October 2013. The remaining case in Florida (Martinolich) has been stayed pending the outcome of the Finnerty appeal. In addition to Finnerty, two other matters are on appeal to the Eleventh Circuit: Bacon (in which summary judgment was granted in plaintiff’s favour) and MacKay (in which summary judgment was granted in Stiefel’s favour). Discovery continues in the Georgia and New York suits. All of these lawsuits involve claims similar to those brought in Finnerty.
In addition to the private litigant suits, on 12 December 2011, the US SEC filed a formal complaint against Stiefel and Charles Stiefel in the United States District Court for the District of Florida alleging that Stiefel and its principals violated federal securities laws by inducing Stiefel employees to sell their shares in the employee stock plan back to the company at a greatly undervalued price and without disclosing to employees that the company was about to be sold. This matter likewise has been stayed pending a ruling on the Finnerty appeal. The Group has made a provision for the Stiefel litigation.
Benlysta securities litigationOn 10 November 2011, a class action suit was filed in the United States District Court for the District of Maryland alleging that Human Genome Sciences, Inc. (HGS), certain of its individual officers and directors and the Group made statements about the clinical trials for Benlysta that failed to disclose suicides among trial participants, and that, by withholding this information, the defendants caused HGS’ stock to be artificially inflated, harming anyone who purchased HGS stock at the inflated price.
In November 2011, a second action was filed in the same federal court. The two cases have been combined. In May 2012, the Group and HGS filed motions to dismiss the suits. Oral argument was heard in September 2012. On 26 March 2013, the court ruled in favour of GSK and HGS on the motions. This matter is now concluded.
Environmental mattersThe Group has been notified of its potential responsibility relating to past operations and its past waste disposal practices at certain sites, primarily in the USA. Some of these matters are the subject of litigation, including proceedings initiated by the US federal or state governments for waste disposal, site remediation costs and tort actions brought by private parties.
The Group has been advised that it may be a responsible party at approximately 23 sites, of which 12 appear on the National Priority List created by the Comprehensive Environmental Response Compensation and Liability Act (Superfund). These proceedings seek to require the operators of hazardous waste facilities, transporters of waste to the sites and generators of hazardous waste disposed of at the sites to clean up the sites or to reimburse the US Government for cleanup costs. In most instances, the Group is involved as an alleged generator of hazardous waste.
Although Superfund provides that the defendants are jointly and severally liable for clean up costs, these proceedings are frequently resolved on the basis of the nature and quantity of waste disposed of by the generator at the site. The Group’s proportionate liability for cleanup costs has been substantially determined for about 19 of the sites referred to above.
The Group’s potential liability varies greatly from site to site. While the cost of investigation, study and remediation at such sites could, over time, be significant, the Group routinely accrues amounts related to its share of the liability for such matters.

GSK Annual Report 2013 211
Directors’ statement of responsibilities in relation to the company’s financial statementsThe Directors are responsible for preparing the parent company, GlaxoSmithKline plc, financial statements and the Remuneration Report in accordance with applicable law and regulations.
UK Company law requires the Directors to prepare financial statements for each financial year. Under that law the Directors have elected to prepare the parent company financial statements in accordance with United Kingdom Accounting Standards and applicable law (United Kingdom Generally Accepted Accounting Practice). Under company law the Directors must not approve the parent company financial statements unless they are satisfied that they give a true and fair view of the state of affairs of the company for that period.
In preparing those financial statements, the Directors are required to:
• select suitable accounting policies and then apply them consistently;
• make judgements and accounting estimates that are reasonable and prudent;
• state with regard to the parent company financial statements that applicable UK Accounting Standards have been followed, subject to any material departures disclosed and explained in the parent company financial statements.
The Directors are responsible for keeping adequate accounting records that are sufficient to show and explain the company’s transactions and disclose with reasonable accuracy at any time the financial position of the company and to enable them to ensure that the parent company financial statements and Remuneration Report comply with the Companies Act 2006. They are also responsible for safeguarding the assets of the company and hence for taking reasonable steps for the prevention and detection of fraud and other irregularities.
The parent company financial statements for the year ended 31 December 2013, comprising the balance sheet for the year ended 31 December 2013 and supporting notes, are set out on pages 213 to 216 of this report.
The responsibilities of the auditors in relation to the parent company financial statements are set out in the Independent Auditors’ report on page 212.
The financial statements for the year ended 31 December 2013 are included in the Annual Report, which is published in printed form and made available on our website. The Directors are responsible for the maintenance and integrity of the Annual Report on our website in accordance with UK legislation governing the preparation and dissemination of financial statements. Access to the website is available from outside the UK, where comparable legislation may be different.
The Strategic Report and risk sections of the Annual Report include a fair review of the development and performance of the business and the position of the company and the Group taken as a whole, together with a description of the principal risks and uncertainties that it faces.
Disclosure of information to auditorsThe Directors in office at the date of this Report have each confirmed that:
• so far as he or she is aware, there is no relevant audit information of which the company’s auditors are unaware; and
• he or she has taken all the steps that he or she ought to have taken as a Director to make himself or herself aware of any relevant audit information and to establish that the company’s auditors are aware of that information.
This confirmation is given and should be interpreted in accordance with the provisions of section 418 of the Companies Act 2006.
Going concern basisAfter making enquiries, the Directors have a reasonable expectation that the company has adequate resources to continue in operational existence for the foreseeable future. For this reason, they continue to adopt the going concern basis in preparing the financial statements.
The UK Corporate Governance CodeThe Board considers that GlaxoSmithKline plc applies the principles and provisions of the UK Corporate Governance Code maintained by the Financial Reporting Council, as described in the Corporate Governance section on pages 82 to 95, and has complied with its provisions. The Board further considers that the Annual Report, taken as a whole, is fair, balanced and understandable, and provides the information necessary for shareholders to assess the Group’s performance, business and strategy.
As required by the Financial Conduct Authority’s Listing Rules, the auditors have considered the Directors’ statement of compliance in relation to those points of the UK Corporate Governance Code which are specified for their review.
Sir Christopher GentChairman26 February 2014
Financial statements of GlaxoSmithKline plc prepared under UK GAAP
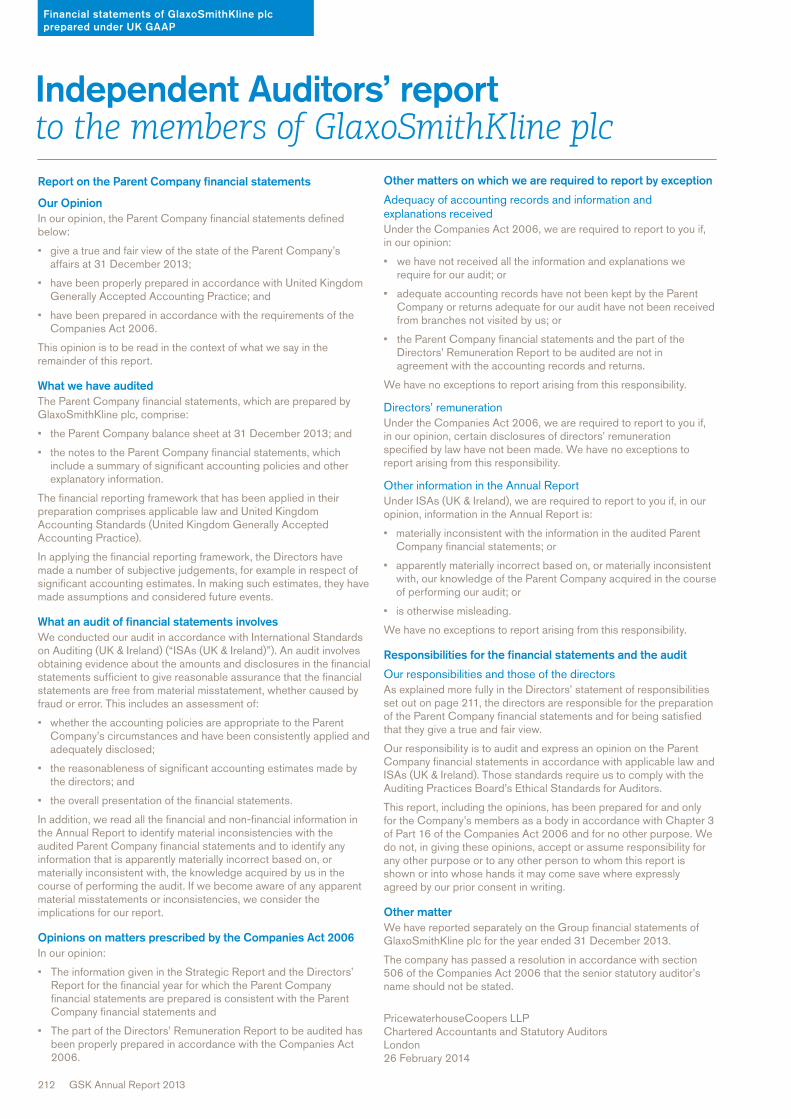
212 GSK Annual Report 2013
Financial statements of GlaxoSmithKline plc prepared under UK GAAP
Report on the Parent Company financial statements
Our OpinionIn our opinion, the Parent Company financial statements defined below:
• give a true and fair view of the state of the Parent Company’s affairs at 31 December 2013;
• have been properly prepared in accordance with United Kingdom Generally Accepted Accounting Practice; and
• have been prepared in accordance with the requirements of the Companies Act 2006.
This opinion is to be read in the context of what we say in the remainder of this report.
What we have auditedThe Parent Company financial statements, which are prepared by GlaxoSmithKline plc, comprise:
• the Parent Company balance sheet at 31 December 2013; and
• the notes to the Parent Company financial statements, which include a summary of significant accounting policies and other explanatory information.
The financial reporting framework that has been applied in their preparation comprises applicable law and United Kingdom Accounting Standards (United Kingdom Generally Accepted Accounting Practice).
In applying the financial reporting framework, the Directors have made a number of subjective judgements, for example in respect of significant accounting estimates. In making such estimates, they have made assumptions and considered future events.
What an audit of financial statements involvesWe conducted our audit in accordance with International Standards on Auditing (UK & Ireland) (“ISAs (UK & Ireland)”). An audit involves obtaining evidence about the amounts and disclosures in the financial statements sufficient to give reasonable assurance that the financial statements are free from material misstatement, whether caused by fraud or error. This includes an assessment of:
• whether the accounting policies are appropriate to the Parent Company’s circumstances and have been consistently applied and adequately disclosed;
• the reasonableness of significant accounting estimates made by the directors; and
• the overall presentation of the financial statements.
In addition, we read all the financial and non-financial information in the Annual Report to identify material inconsistencies with the audited Parent Company financial statements and to identify any information that is apparently materially incorrect based on, or materially inconsistent with, the knowledge acquired by us in the course of performing the audit. If we become aware of any apparent material misstatements or inconsistencies, we consider the implications for our report.
Opinions on matters prescribed by the Companies Act 2006 In our opinion:
• The information given in the Strategic Report and the Directors’ Report for the financial year for which the Parent Company financial statements are prepared is consistent with the Parent Company financial statements and
• The part of the Directors’ Remuneration Report to be audited has been properly prepared in accordance with the Companies Act 2006.
Other matters on which we are required to report by exception
Adequacy of accounting records and information and explanations receivedUnder the Companies Act 2006, we are required to report to you if, in our opinion:
• we have not received all the information and explanations we require for our audit; or
• adequate accounting records have not been kept by the Parent Company or returns adequate for our audit have not been received from branches not visited by us; or
• the Parent Company financial statements and the part of the Directors’ Remuneration Report to be audited are not in agreement with the accounting records and returns.
We have no exceptions to report arising from this responsibility.
Directors’ remuneration Under the Companies Act 2006, we are required to report to you if, in our opinion, certain disclosures of directors’ remuneration specified by law have not been made. We have no exceptions to report arising from this responsibility.
Other information in the Annual Report Under ISAs (UK & Ireland), we are required to report to you if, in our opinion, information in the Annual Report is:
• materially inconsistent with the information in the audited Parent Company financial statements; or
• apparently materially incorrect based on, or materially inconsistent with, our knowledge of the Parent Company acquired in the course of performing our audit; or
• is otherwise misleading.
We have no exceptions to report arising from this responsibility.
Responsibilities for the financial statements and the audit
Our responsibilities and those of the directorsAs explained more fully in the Directors’ statement of responsibilities set out on page 211, the directors are responsible for the preparation of the Parent Company financial statements and for being satisfied that they give a true and fair view.
Our responsibility is to audit and express an opinion on the Parent Company financial statements in accordance with applicable law and ISAs (UK & Ireland). Those standards require us to comply with the Auditing Practices Board’s Ethical Standards for Auditors.
This report, including the opinions, has been prepared for and only for the Company’s members as a body in accordance with Chapter 3 of Part 16 of the Companies Act 2006 and for no other purpose. We do not, in giving these opinions, accept or assume responsibility for any other purpose or to any other person to whom this report is shown or into whose hands it may come save where expressly agreed by our prior consent in writing.
Other matter We have reported separately on the Group financial statements of GlaxoSmithKline plc for the year ended 31 December 2013.
The company has passed a resolution in accordance with section 506 of the Companies Act 2006 that the senior statutory auditor’s name should not be stated.
PricewaterhouseCoopers LLPChartered Accountants and Statutory AuditorsLondon26 February 2014
Independent Auditors’ reportto the members of GlaxoSmithKline plc

GSK Annual Report 2013 213
Notes
2013 £m
2012 £m
Fixed assets – investments E 19,691 19,689
Debtors F 3,358 7,872Cash at bank 12 10Current assets 3,370 7,882
Creditors: amounts due within one year G (531) (406)Net current assets 2,839 7,476
Net assets 22,530 27,165
Capital and reservesCalled up share capital H 1,336 1,349Share premium account H 2,595 2,022Other reserves I 1,420 1,393Profit and loss account I 17,179 22,401
Equity shareholders’ funds 22,530 27,165
The financial statements on pages 213 to 216 were approved by the Board on 26 February 2014 and signed on its behalf by
Sir Christopher Gent Chairman
GlaxoSmithKline plc Registered number: 3888792
Company balance sheet – UK GAAP at 31 December 2013

214 GSK Annual Report 2013
Financial statements of GlaxoSmithKline plc prepared under UK GAAP
Notes to the company balance sheet – UK GAAP
A) Presentation of the financial statements
Description of businessGlaxoSmithKline plc is the parent company of GSK, a major global healthcare group which is engaged in the creation and discovery, development, manufacture and marketing of pharmaceutical products, including vaccines, over-the-counter (OTC) medicines and health-related consumer products.
Preparation of financial statementsThe financial statements, which are prepared on a going concern basis, are drawn up in accordance with UK Generally Accepted Accounting Practice (UK GAAP) and with UK accounting presentation as at 31 December 2013, with comparative figures as at 31 December 2012. Where appropriate, comparative figures are reclassified to ensure a consistent presentation with current year information.
As permitted by section 408 of the Companies Act 2006, the profit and loss account of the company is not presented in this Annual Report.
The company is included in the Group accounts of GlaxoSmithKline plc, which are publicly available. Advantage has been taken of the exemption provided by FRS 1 ‘Cash flow statements (revised 1996)’ not to prepare a cash flow statement and of the exemption provided by FRS 8 ‘Related party disclosures’ not to disclose any related party transactions within the Group.
Accounting convention and standardsThe balance sheet has been prepared using the historical cost convention and complies with applicable UK accounting standards.
Accounting principles and policiesThe preparation of the balance sheet in conformity with generally accepted accounting principles requires management to make estimates and assumptions that affect the reported amounts of assets and liabilities and disclosure of contingent assets and liabilities at the date of the balance sheet. Actual amounts could differ from those estimates.
The balance sheet has been prepared in accordance with the company’s accounting policies approved by the Board and described in Note B.
B) Accounting policies
Foreign currency transactions Foreign currency transactions are recorded at the exchange rate ruling on the date of transaction, or at the forward rate if hedged by a forward exchange contract. Foreign currency assets and liabilities are translated at rates of exchange ruling at the balance sheet date, or at the forward rate.
Dividends paid and receivedDividends paid and received are included in the accounts in the period in which the related dividends are actually paid or received.
ExpenditureExpenditure is recognised in respect of goods and services received when supplied in accordance with contractual terms. Provision is made when an obligation exists for a future liability in respect of a past event and where the amount of the obligation can be reliably estimated.
Investments in subsidiary companiesInvestments in subsidiary companies are held at cost less any provision for impairment.
Impairment of investmentsThe carrying value of investments are reviewed for impairment when there is an indication that the investment might be impaired. Any provision resulting from an impairment review is charged to the income statement in the year concerned.
Share based paymentsThe issuance by the company to its subsidiaries of a grant over the company’s shares, represents additional capital contributions by the company in its subsidiaries. An additional investment in subsidiaries results in a corresponding increase in shareholders’ equity. The additional capital contribution is based on the fair value of the grant issued, allocated over the underlying grant’s vesting period.
TaxationCurrent tax is provided at the amounts expected to be paid applying tax rates that have been enacted or substantially enacted by the balance sheet date.
The company accounts for taxation which is deferred or accelerated by reason of timing differences which have originated but not reversed by the balance sheet date. Deferred tax assets are only recognised to the extent that they are considered recoverable against future taxable profits.
Deferred tax is measured at the average tax rates that are expected to apply in the periods in which the timing differences are expected to reverse. Deferred tax liabilities and assets are not discounted.
Financial guaranteesLiabilities relating to guarantees issued by the company on behalf of its subsidiaries are initially recognised at fair value and amortised over the life of the guarantee.
C) Operating profitA fee of £10,299 (2012 – £10,132) relating to the audit of the company has been charged in operating profit.
D) DividendsThe directors declared four interim dividends resulting in a dividend for the year of 78 pence, a 4 pence increase on the dividend for 2012. For further details, see Note 16 to the Group financial. statements, ‘Dividends’.
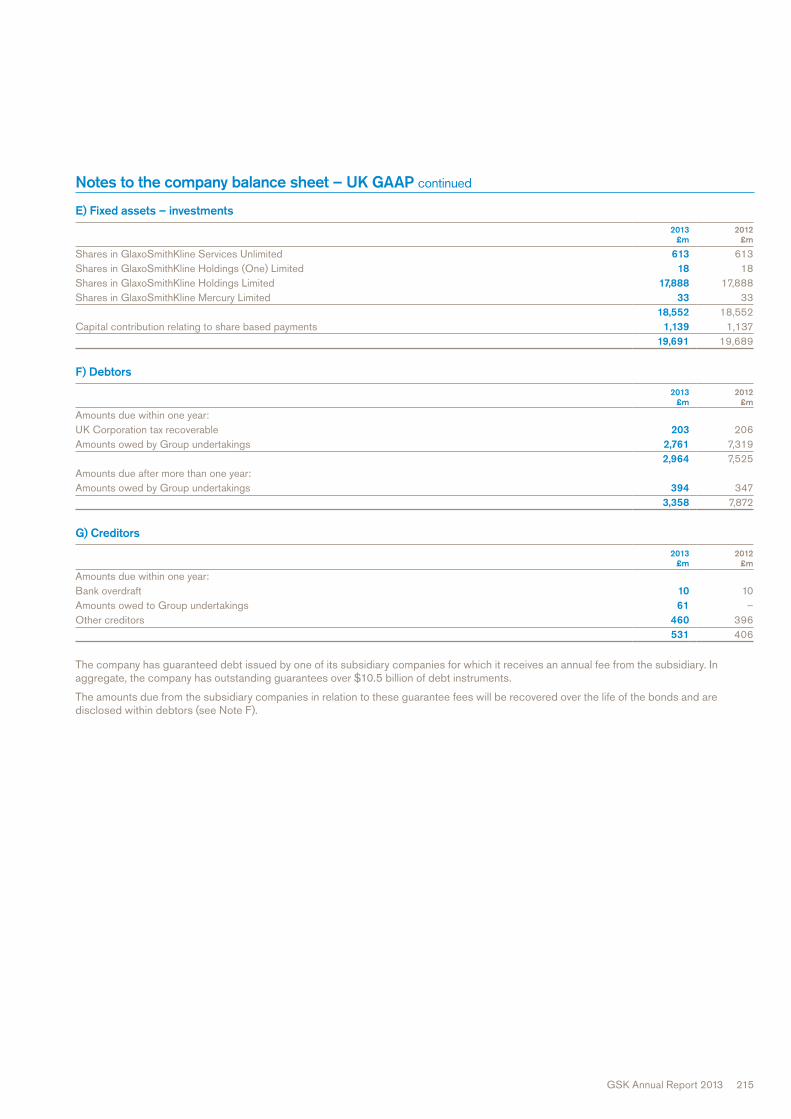
GSK Annual Report 2013 215
Notes to the company balance sheet – UK GAAP continued
E) Fixed assets – investments2013
£m2012
£m
Shares in GlaxoSmithKline Services Unlimited 613 613Shares in GlaxoSmithKline Holdings (One) Limited 18 18Shares in GlaxoSmithKline Holdings Limited 17,888 17,888Shares in GlaxoSmithKline Mercury Limited 33 33
18,552 18,552Capital contribution relating to share based payments 1,139 1,137
19,691 19,689
F) Debtors
2013 £m
2012 £m
Amounts due within one year:UK Corporation tax recoverable 203 206Amounts owed by Group undertakings 2,761 7,319
2,964 7,525Amounts due after more than one year:Amounts owed by Group undertakings 394 347
3,358 7,872
G) Creditors
2013 £m
2012 £m
Amounts due within one year:Bank overdraft 10 10Amounts owed to Group undertakings 61 –Other creditors 460 396
531 406
The company has guaranteed debt issued by one of its subsidiary companies for which it receives an annual fee from the subsidiary. In aggregate, the company has outstanding guarantees over $10.5 billion of debt instruments.
The amounts due from the subsidiary companies in relation to these guarantee fees will be recovered over the life of the bonds and are disclosed within debtors (see Note F).

216 GSK Annual Report 2013
Financial statements of GlaxoSmithKline plc prepared under UK GAAP
Notes to the company balance sheet – UK GAAP continued
H) Share capital and share premium account
Ordinary Shares of 25p each
Share premium
Number £m £m
Share capital authorisedAt 31 December 2012 10,000,000,000 2,500At 31 December 2013 10,000,000,000 2,500Share capital issued and fully paidAt 1 January 2012 5,550,203,098 1,387 1,673Issued under employee share schemes 28,045,821 7 349Share capital cancelled (180,652,950) (45) –At 31 December 2012 5,397,595,969 1,349 2,022Issued under employee share schemes 44,610,727 12 573Share capital cancelled (100,000,000) (25) –At 31 December 2013 5,342,206,696 1,336 2,595
31 December 2013 000
31 December 2012 000
Number of shares issuable under outstanding options 91,303 114,985Number of unissued shares not under option 4,566,351 4,487,419
At 31 December 2013, of the issued share capital, 63,613,528 shares were held in the ESOP Trusts, 487,433,663 shares were held as Treasury shares and 4,791,159,505 shares were in free issue. All issued shares are fully paid. The nominal, carrying and market values of the shares held in the ESOP Trusts are disclosed in Note 42, ‘Employee share schemes’.
A total of 92 million shares were purchased by the company during 2013 at a cost of £1,504 million and 100 million shares were cancelled.
The company expects to make further share repurchases of £1–2 billion during 2014. The exact amount and timing of further purchases and whether the shares will be held as Treasury shares or be cancelled will be determined by the company and is dependent on market conditions and other factors. No shares were purchased in the period 1 January 2014 to 5 February 2014.
I) Reserves
Other reserves
£m
Profit and loss account
£m
Total
£mAt 1 January 2012 1,339 18,689 20,028Profit attributable to shareholders – 10,019 10,019Dividends to shareholders – (3,814) (3,814)Shares purchased and cancelled or held as Treasury share 45 (2,493) (2,448)Capital contribution relating to share based payments 9 – 9At 31 December 2012 1,393 22,401 23,794Profit attributable to shareholders – (38) (38)Dividends to shareholders – (3,680) (3,680)Shares purchased and cancelled or held as Treasury share 25 (1,504) (1,479)Capital contribution relating to share based payments 2 – 2At 31 December 2013 1,420 17,179 18,599
The loss of GlaxoSmithKline plc for the year was £38 million (2012 – £10,019 million profit), which after dividends of £3,680 million (2012 – £3,814 million), gave a retained loss of £3,718 million (2012 – £6,205 million profit). After the cost of shares purchased and cancelled or held as Treasury shares of £1,504 million (2012 – £2,493), the profit and loss account reserve at 31 December 2013 stood at £17,179 million (2012 – £22,401 million), of which £4,096 million is unrealised (2012 – £4,096 million).

GSK Annual Report 2013 217
In this section
Quarterly trend 218Five year record 222Product development pipeline 225Products, competition and intellectual property 229Risk factors 232Share capital and share price 242Dividends 244Tax information for shareholders 244Annual General Meeting 2014 245US law and regulation 247Shareholder services and contacts 249Glossary of terms and index 251
Investor information

218 GSK Annual Report 2013
Investor information Financial record
Quarterly trendAn unaudited analysis of the Group results is provided by quarter in Sterling for the financial year 2013.
Income statement – total 12 months 2013 Q4 2013 Q3 2013 Q2 2013 Q1 2013
£m CER% £% £m CER% £% £m CER% £% £m CER% £% £m CER% £%
Turnover – Pharmaceuticals and Vaccines 21,318 1 – 5,688 6 3 5,197 – (1) 5,309 1 2 5,124 (2) (3) – Consumer Healthcare 5,187 2 – 1,218 – (4) 1,313 4 2 1,309 2 3 1,347 1 –Total turnover 26,505 1 – 6,906 5 2 6,510 1 – 6,618 2 2 6,471 (2) (3)Cost of sales (8,585) 8 8 (2,526) 26 25 (2,111) 1 1 (1,972) (3) (1) (1,976) 9 9Selling, general and administration (8,480) (3) (4) (2,200) 2 – (1,984) (14) (11) (2,216) (2) 1 (2,080) 3 (3)Research and development (3,923) (2) (1) (1,070) (6) (6) (900) (5) (4) (1,049) 12 14 (904) (7) (7)Royalty income 387 25 26 98 28 29 94 1 2 82 23 24 113 56 57Other operating income 1,124 1,233 (40) (25) (44)Operating profit 7,028 (1) (4) 2,441 36 27 1,569 1 (5) 1,438 (13) (16) 1,580 (26) (22)Net finance costs (706) (159) (181) (186) (180)Profit on disposal of interest in associates and joint ventures 282 253 – 29 –Share of after tax profits of associates and joint ventures 43 11 14 7 11Profit before taxation 6,647 4 1 2,546 57 47 1,402 1 (6) 1,288 (12) (16) 1,411 (29) (24)Taxation (1,019) (41) (392) (204) (382)Tax rate % 15.3% 1.6% 28.0% 15.8% 27.1%Profit after taxation for the period 5,628 24 20 2,505 >100 >100 1,010 (7) (14) 1,084 (14) (17) 1,029 (30) (25)Profit attributable to non-controlling interests 192 44 41 39 68Profit attributable to shareholders 5,436 2,461 969 1,045 961Basic earnings per share (pence) 112.5p 27 23 51.3p >100 >100 20.0p (4) (12) 21.5p (11) (14) 19.9p (30) (25)Diluted earnings per share (pence) 110.5p 50.4p 19.7p 21.2p 19.6p
Income statement – core
Total turnover 26,505 1 – 6,906 5 2 6,510 1 – 6,618 2 2 6,471 (2) (3)Cost of sales (7,549) 6 6 (2,006) 10 9 (1,878) 2 1 (1,818) 5 7 (1,847) 8 7Selling, general and administration (7,928 ) 1 – (2,005 ) 6 3 (1,876) (6 ) (4 ) (2,092 ) 3 6 (1,955 ) 2 (5 )Research and development (3,400) (3) (2) (905) 9 8 (791) (10) (9) (847) (6) (4) (857) (4) (4)Royalty income 387 25 26 98 28 29 94 1 2 82 23 24 113 56 57Operating profit 8,015 – (3) 2,088 (1) (8) 2,059 11 6 1,943 – (2) 1,925 (11) (6)Net finance costs (692) (155) (178) (183) (176)Share of after tax profits of associates and joint ventures 43 11 14 7 11Profit before taxation 7,366 – (2) 1,944 1 (7) 1,895 12 7 1,767 1 (2) 1,760 (12) (7)Taxation (1,695) (431) (446) (424) (394)Tax rate % 23.0% 22.2% 23.5% 24.0% 22.4%Profit after taxation for the period 5,671 2 (1) 1,513 1 (7) 1,449 13 8 1,343 3 – 1,366 (8) (3)Profit attributable to non-controlling interests 250 69 49 64 68Profit attributable to shareholders 5,421 1,444 1,400 1,279 1,298Adjusted earnings per share (pence) 112.2p 4 1 30.1p 1 (7) 28.9p 16 10 26.3p 4 1 26.9p (6) –
The calculation of core results is described on page 58.
Financial record

GSK Annual Report 2013 219
Quarterly trendAn unaudited analysis of the Group results is provided by quarter in Sterling for the financial year 2013.
Income statement – total 12 months 2013 Q4 2013 Q3 2013 Q2 2013 Q1 2013
£m CER% £% £m CER% £% £m CER% £% £m CER% £% £m CER% £%
Turnover – Pharmaceuticals and Vaccines 21,318 1 – 5,688 6 3 5,197 – (1) 5,309 1 2 5,124 (2) (3) – Consumer Healthcare 5,187 2 – 1,218 – (4) 1,313 4 2 1,309 2 3 1,347 1 –Total turnover 26,505 1 – 6,906 5 2 6,510 1 – 6,618 2 2 6,471 (2) (3)Cost of sales (8,585) 8 8 (2,526) 26 25 (2,111) 1 1 (1,972) (3) (1) (1,976) 9 9Selling, general and administration (8,480) (3) (4) (2,200) 2 – (1,984) (14) (11) (2,216) (2) 1 (2,080) 3 (3)Research and development (3,923) (2) (1) (1,070) (6) (6) (900) (5) (4) (1,049) 12 14 (904) (7) (7)Royalty income 387 25 26 98 28 29 94 1 2 82 23 24 113 56 57Other operating income 1,124 1,233 (40) (25) (44)Operating profit 7,028 (1) (4) 2,441 36 27 1,569 1 (5) 1,438 (13) (16) 1,580 (26) (22)Net finance costs (706) (159) (181) (186) (180)Profit on disposal of interest in associates and joint ventures 282 253 – 29 –Share of after tax profits of associates and joint ventures 43 11 14 7 11Profit before taxation 6,647 4 1 2,546 57 47 1,402 1 (6) 1,288 (12) (16) 1,411 (29) (24)Taxation (1,019) (41) (392) (204) (382)Tax rate % 15.3% 1.6% 28.0% 15.8% 27.1%Profit after taxation for the period 5,628 24 20 2,505 >100 >100 1,010 (7) (14) 1,084 (14) (17) 1,029 (30) (25)Profit attributable to non-controlling interests 192 44 41 39 68Profit attributable to shareholders 5,436 2,461 969 1,045 961Basic earnings per share (pence) 112.5p 27 23 51.3p >100 >100 20.0p (4) (12) 21.5p (11) (14) 19.9p (30) (25)Diluted earnings per share (pence) 110.5p 50.4p 19.7p 21.2p 19.6p
Income statement – core
Total turnover 26,505 1 – 6,906 5 2 6,510 1 – 6,618 2 2 6,471 (2) (3)Cost of sales (7,549) 6 6 (2,006) 10 9 (1,878) 2 1 (1,818) 5 7 (1,847) 8 7Selling, general and administration (7,928 ) 1 – (2,005 ) 6 3 (1,876) (6 ) (4 ) (2,092 ) 3 6 (1,955 ) 2 (5 )Research and development (3,400) (3) (2) (905) 9 8 (791) (10) (9) (847) (6) (4) (857) (4) (4)Royalty income 387 25 26 98 28 29 94 1 2 82 23 24 113 56 57Operating profit 8,015 – (3) 2,088 (1) (8) 2,059 11 6 1,943 – (2) 1,925 (11) (6)Net finance costs (692) (155) (178) (183) (176)Share of after tax profits of associates and joint ventures 43 11 14 7 11Profit before taxation 7,366 – (2) 1,944 1 (7) 1,895 12 7 1,767 1 (2) 1,760 (12) (7)Taxation (1,695) (431) (446) (424) (394)Tax rate % 23.0% 22.2% 23.5% 24.0% 22.4%Profit after taxation for the period 5,671 2 (1) 1,513 1 (7) 1,449 13 8 1,343 3 – 1,366 (8) (3)Profit attributable to non-controlling interests 250 69 49 64 68Profit attributable to shareholders 5,421 1,444 1,400 1,279 1,298Adjusted earnings per share (pence) 112.2p 4 1 30.1p 1 (7) 28.9p 16 10 26.3p 4 1 26.9p (6) –
The calculation of core results is described on page 58.

220 GSK Annual Report 2013
Investor information Financial record
Pharmaceuticals and Vaccines turnover by therapeutic area 2013
Total USA Europe EMAP Rest of World2012
Therapeutic area/major products
2013 (restated) Growth 2013 Growth 2013 Growth 2013 Growth 2013 Growth£m £m CER% £% £m CER% £% £m CER% £% £m CER% £% £m CER% £%
Respiratory 7,516 7,291 4 3 3,655 7 8 1,907 (3) – 877 4 2 1,077 6 (5)Avamys/Veramyst 249 246 5 1 42 (29) (29) 69 8 11 71 16 13 67 23 8 Flixonase/Flonase 110 133 (14) (17) 7 (50) (50) 31 (6) (3) 49 (14) (14) 23 (7) (23)Flixotide/Flovent 796 779 2 2 482 6 8 117 (7) (4) 58 7 5 139 (3) (10)Seretide/Advair 5,274 5,046 4 5 2,769 8 9 1,458 (2) 1 429 4 3 618 6 (5)Serevent 129 145 (10) (11) 51 (2) – 55 (17) (14) 4 33 33 19 (15) (30)Ventolin 642 631 2 2 291 4 5 127 (2) 1 171 2 – 53 (4) (7)Xyzal 137 129 26 6 – – – – – – 18 6 13 119 28 5 Zyrtec 76 81 4 (6) – – – – – – 41 17 14 35 (7) (22)Other 103 101 4 2 13 100 >100 50 (9) (6) 36 – (10) 4 >100 100 Anti-virals 667 753 (6) (11) 57 (2) – 66 (14) (11) 293 (20) (19) 251 14 (4)Hepsera 96 126 (21) (24) – – – – – – 70 (28) (26) 26 – (16)Valtrex 224 252 (2) (11) 45 26 29 29 (15) (12) 40 11 8 110 (10) (25)Zovirax 81 89 (4) (9) 1 (67) (67) 19 (10) (10) 35 3 – 26 (3) (13)Zeffix 182 243 (26) (25) 13 (13) (13) 12 (25) (25) 140 (28) (26) 17 (17) (29)Other 84 43 >100 95 (2) <(100) <(100) 6 25 50 8 60 60 72 >100 >100 Central nervous system 1,483 1,670 (8) (11) 440 (15) (14) 355 (11) (8) 341 7 4 347 (8) (22)Imigran/Imitrex 188 190 1 (1) 80 11 11 63 (7) (6) 7 – – 38 (5) (12)Lamictal 557 610 (7) (9) 276 (18) (17) 110 (4) (2) 78 8 4 93 21 2 Requip 125 164 (18) (24) 7 (63) (63) 52 (33) (32) 14 – – 52 15 (5)Seroxat/Paxil 285 374 (16) (24) – 100 100 53 (11) (7) 79 (4) (6) 153 (23) (35)Wellbutrin 97 84 14 15 16 33 33 51 11 16 30 7 7 – – – Other 231 248 (5) (7) 61 (21) (20) 26 (20) (13) 133 14 10 11 (38) (48)Cardiovascular and urogenital 2,239 2,431 (8) (8) 1,244 (16) (15) 533 2 6 281 (2) (4) 181 18 4 Arixtra 167 195 (15) (14) 50 (26) (26) 84 (12) (8) 28 – – 5 (13) (38)Avodart 857 790 10 8 312 (3) (2) 273 15 20 104 27 24 168 20 4 Coreg 131 133 (2) (2) 130 (2) (2) – – – – – – 1 – – Fraxiparine 221 233 (7) (5) – – – 138 (8) (5) 83 (6) (5) – (100) (100)Lovaza 584 607 (5) (4) 581 (5) (4) – – – – – – 3 – – Other 279 473 (42) (41) 171 (51) (50) 38 (8) (5) 66 (26) (29) 4 – – Metabolic 174 171 10 2 4 >100 >100 42 41 45 68 9 5 60 (20) (31)Other 174 171 10 2 4 >100 >100 42 41 45 68 9 5 60 (20) (31)Anti-bacterials 1,239 1,247 – (1) 27 30 35 393 (6) (2) 750 5 2 69 (15) (22)Augmentin 630 608 5 4 1 – – 203 (3) – 393 11 7 33 (5) (13)Other 609 639 (4) (5) 26 32 37 190 (9) (5) 357 (1) (3) 36 (22) (29)Oncology and emesis 969 798 22 21 380 17 18 339 28 32 149 18 14 101 27 12 Arzerra 75 60 23 25 46 18 21 27 29 29 – – – 2 100 100 Promacta 186 130 46 43 73 33 35 55 47 53 22 92 83 36 50 29 Tyverb/Tykerb 207 239 (13) (13) 55 (21) (19) 82 (9) (6) 47 (9) (13) 23 (10) (23)Votrient 331 183 80 81 144 56 58 130 91 97 37 77 68 20 >100 >100 Other 170 186 (9) (9) 62 (10) (11) 45 (9) (2) 43 2 – 20 (26) (26)Dermatology 770 850 (8) (9) 140 (40) (39) 170 5 8 397 6 2 63 (9) (19)Bactroban 98 124 (19) (21) 29 (45) (43) 24 (12) (8) 38 5 (3) 7 - (13)Duac 72 87 (17) (17) 15 (61) (61) 29 17 21 16 38 23 12 (8) - Other 600 639 (4) (6) 96 (32) (31) 117 7 9 343 5 2 44 (11) (23)Rare diseases 495 495 7 – 113 (4) (3) 129 1 5 48 2 – 205 17 (1)Flolan 147 135 21 16 – – – 82 10 12 11 22 22 54 40 20 Volibris 103 127 (16) (24) 25 (24) (24) 18 (26) (22) – – – 60 (9) (24)Other 245 233 12 5 88 4 5 29 – 7 37 (3) (5) 91 30 10 Immuno-inflammation 161 70 >100 >100 148 >100 >100 8 100 100 1 – – 4 >100 >100 Benlysta 146 70 >100 >100 134 >100 >100 8 100 100 1 – – 3 100 >100 Other 15 – – – 14 – – – – – – – – 1 – – Other pharmaceuticals 799 786 6 2 6 (74) (68) 175 (7) (2) 369 (3) (10) 249 48 37 Vaccines 3,420 3,325 2 3 978 17 18 1,049 3 7 1,124 1 2 269 (31) (35)Boostrix 288 238 19 21 183 23 24 65 19 23 20 25 25 20 (9) (9)Cervarix 172 270 (37) (36) 6 – – 61 11 15 92 23 23 13 (90) (90)Fluarix, FluLaval 251 200 25 26 146 65 66 35 (21) (19) 43 (2) (2) 27 8 8 Hepatitis 629 646 (4) (3) 263 (3) (1) 198 (3) 1 123 (2) (4) 45 (15) (18)Infanrix, Pediarix 862 775 9 11 271 23 24 398 2 6 132 11 10 61 3 – Rotarix 375 360 5 4 108 7 8 59 49 51 164 3 3 44 (21) (29)Synflorix 405 385 2 5 – – – 48 2 7 350 1 5 7 17 17 Other 438 451 (4) (3) 1 (100) – 185 2 6 200 (14) (13) 52 27 16
19,932 19,887 1 – 7,192 1 3 5,166 – 3 4,698 1 – 2,876 3 (9)ViiV Healthcare(HIV) 1,386 1,374 – 1
21,318 21,261 1 –
CER% represents growth at constant exchange rates. £% represents growth at actual exchange rates.

GSK Annual Report 2013 221
Pharmaceuticals and Vaccines turnover by therapeutic area 2012
Total USA Europe EMAP Rest of World2011
Therapeutic area/major products
2012 (restated) Growth 2012 Growth 2012 Growth 2012 Growth 2012 Growth£m £m CER% £% £m CER% £% £m CER% £% £m CER% £% £m CER% £%
Respiratory 7,291 7,298 1 – 3,388 1 3 1,906 (5) (10) 858 13 10 1,139 3 3 Avamys/Veramyst 246 241 5 2 59 (6) (5) 62 2 (5) 63 24 17 62 2 3 Flixonase/Flonase 133 138 (3) (4) 14 100 100 32 (11) (14) 57 14 16 30 (31) (33)Flixotide/Flovent 779 813 (4) (4) 448 (1) – 122 (15) (19) 55 8 6 154 (6) (6)Seretide/Advair 5,046 5,061 1 – 2,533 1 2 1,447 (4) (8) 417 12 10 649 3 4 Serevent 145 182 (19) (20) 51 (19) (18) 64 (22) (25) 3 – – 27 (13) (16)Ventolin 631 602 6 5 277 14 16 126 (6) (11) 171 10 7 57 (8) (8)Xyzal 129 64 100 >100 – – – – – – 16 – – 113 >100 >100 Zyrtec 81 96 (16) (16) – – – – – – 36 28 24 45 (34) (33)Other 101 101 6 – 6 (33) (33) 53 4 (5) 40 16 8 2 (100) (100)Anti-virals 753 842 (11) (11) 57 (42) (41) 74 (23) (27) 360 2 3 262 (12) (12)Hepsera 126 127 (2) (1) – – – – – – 95 (3) (1) 31 – – Valtrex 252 339 (25) (26) 35 (51) (51) 33 (27) (31) 37 – (3) 147 (19) (19)Zovirax 89 109 (16) (18) 3 (73) (73) 21 (19) (22) 35 (3) (5) 30 (9) (12)Zeffix 243 237 – 3 15 27 36 16 (29) (33) 188 3 7 24 (4) (8)Other 43 30 37 43 4 100 100 4 100 100 5 >100 >100 30 12 20 Central nervous system 1,670 1,721 (2) (3) 510 6 8 386 (15) (20) 329 8 6 445 (3) (2)Imigran/Imitrex 190 210 (8) (10) 72 (13) (12) 67 (4) (9) 7 – – 44 (6) (6)Lamictal 610 536 14 14 332 18 20 112 (9) (15) 75 7 6 91 58 60 Requip 164 218 (22) (25) 19 (55) (55) 76 (29) (33) 14 25 17 55 8 8 Seroxat/Paxil 374 435 (14) (14) (1) 100 67 57 (9) (14) 84 (5) (5) 234 (19) (18)Treximet 49 57 (14) (14) 49 (16) (14) – – – – – – – – – Wellbutrin 84 85 4 (1) 12 (25) (25) 44 4 (2) 28 26 22 – – – Other 199 180 13 11 27 >100 >100 30 (39) (41) 121 15 10 21 31 31 Cardiovascular and urogenital 2,431 2,454 – (1) 1,461 (5) (4) 504 1 (6) 292 18 16 174 23 23 Arixtra 195 276 (27) (29) 68 (54) (54) 91 – (6) 28 33 33 8 (27) (27)Avodart 790 748 7 6 317 (5) (4) 228 9 2 84 26 22 161 28 29 Coreg 133 155 (15) (14) 132 (15) (14) – – – – – – 1 – – Fraxiparine 233 234 4 – – – – 145 (4) (10) 87 26 24 1 (50) (50)Lovaza 607 569 5 7 604 5 7 – – – – – – 3 – 50 Vesicare 175 126 37 39 174 37 38 – – – 1 – – – – – Other 298 346 (13) (14) 166 (20) (18) 40 (17) (23) 92 1 1 – – – Metabolic 171 331 (47) (48) (12) – – 29 (49) (52) 65 10 3 89 (24) (24)Avandia products 6 123 (94) (95) (12) – – – – – 12 (33) (33) 6 (59) (65)Other 165 208 (18) (21) – – – 29 (52) (55) 53 27 18 83 (18) (17)Anti-bacterials 1,247 1,390 (7) (10) 20 (63) (63) 403 (17) (21) 735 5 2 89 (12) (11)Augmentin 608 641 (1) (5) 1 – – 202 (13) (19) 367 8 4 38 (10) (7)Other 639 749 (12) (15) 19 (65) (65) 201 (20) (24) 368 2 (1) 51 (14) (14)Oncology and emesis
798 683 19 17 321 18 20 256 11 4 131 48 42 90 15 15
Arzerra 60 44 36 36 38 23 23 21 83 75 – – – 1 (100) – Promacta 130 75 76 73 54 66 69 36 65 57 12 >100 >100 28 87 87 Tyverb/Tykerb 239 231 6 3 68 5 6 87 (5) (10) 54 36 29 30 7 7 Votrient 183 100 88 83 91 59 63 66 89 78 22 >100 >100 4 – – Other 186 233 (19) (20) 70 (18) (18) 46 (34) (39) 43 11 13 27 (21) (21)Dermatology 850 898 (2) (5) 228 (14) (13) 156 5 – 388 7 1 78 (19) (19)Bactroban 124 123 3 1 51 (2) – 26 – (7) 39 17 11 8 (11) (11)Duac 87 109 (19) (20) 38 (38) (37) 24 4 – 13 8 – 12 – – Other 639 666 – (4) 139 (9) (9) 106 6 1 336 6 1 58 (23) (23)Rare diseases 495 463 8 7 117 10 11 123 (6) (12) 48 20 17 207 16 16 Flolan 135 179 (25) (25) 33 (14) (11) 23 (42) (47) – – – 79 (21) (20)Volibris 127 97 35 31 – – – 73 12 6 9 80 80 45 96 96 Other 233 187 26 25 84 22 24 27 4 – 39 11 8 83 50 48 Immuno-inflammation 70 15 >100 >100 65 >100 >100 4 >100 >100 – – – 1 – –Benlysta 70 15 >100 >100 65 >100 >100 4 >100 >100 – – – 1 – –Other pharmaceuticals 786 908 (9) (13) 19 25 19 180 (23) (32) 408 (2) (7) 179 (7) (6)Vaccines 3,325 3,497 (2) (5) 826 – 1 980 (4) (10) 1,107 14 9 412 (29) (29)Boostrix 238 192 25 24 147 35 36 53 17 10 16 78 78 22 (19) (19)Cervarix 270 506 (46) (47) 6 (25) (25) 53 (2) (9) 75 (19) (20) 136 (61) (61)Fluarix, FluLaval 200 230 (11) (13) 88 (35) (33) 43 15 8 44 35 29 25 8 4 Hepatitis 646 688 (5) (6) 266 (10) (9) 197 (8) (13) 128 21 15 55 (11) (4)Infanrix, Pediarix 775 690 17 12 218 32 34 376 – (7) 120 85 76 61 9 9 Nimenrix 1 – – – – – – 1 – – – – – – – – Rotarix 360 300 21 20 100 (11) (9) 39 2 (5) 159 25 23 62 >100 >100 Synflorix 385 350 17 10 – – – 45 (8) (13) 334 22 14 6 – – Other 450 541 (13) (17) 1 – – 173 (18) (22) 231 (12) (16) 45 7 2
19,887 20,500 (1) (3) 7,000 (2) – 5,001 (7) (12) 4,721 10 6 3,165 (6) (5)ViiV Healthcare(HIV) 1,374 1,569 (10) (12)
21,261 22,069 (2) (4)
CER% represents growth at constant exchange rates. £% represents growth at actual exchange rates.

222 GSK Annual Report 2013
Investor information Financial record
Five year recordA record of financial performance is provided, analysed in accordance with current reporting practice. The information included in the Five year record is prepared in accordance with IFRS as adopted by the European Union and also with IFRS as issued by the International Accounting Standards Board.
Turnover by division
2013
£m
2012 (restated)
£m
2011 (restated)
£m
2010 (restated)
£m
2009 (restated)
£m
Pharmaceuticals 17,898 17,936 18,572 18,958 19,947 Vaccines 3,420 3,325 3,497 4,326 3,706 Pharmaceuticals and Vaccines 21,318 21,261 22,069 23,284 23,653 Consumer Healthcare 5,187 5,170 5,318 5,108 4,715
26,505 26,431 27,387 28,392 28,368
Group turnover by geographic region USA 8,730 8,476 8,696 9,346 10,316 Europe 7,511 7,326 8,276 9,097 9,702 EMAP 6,746 6,788 6,407 6,078 5,024 Japan 1,890 2,225 2,318 2,155 1,782 Other 1,628 1,616 1,690 1,716 1,544
26,505 26,431 27,387 28,392 28,368
Group turnover by segmentUSA 7,192 7,000 7,022 7,629 8,571 Europe 5,166 5,001 5,700 6,479 7,063 EMAP 4,698 4,721 4,441 4,347 3,615 Japan 1,657 1,969 2,082 1,959 1,605 ViiV Healthcare (HIV) 1,386 1,374 1,569 1,566 1,605 Other trading and unallocated pharmaceuticals 1,219 1,196 1,255 1,304 1,194 Pharmaceuticals and Vaccines 21,318 21,261 22,069 23,284 23,653 Consumer Healthcare 5,187 5,170 5,318 5,108 4,715
26,505 26,431 27,387 28,392 28,368
ViiV Healthcare turnover
Total USA Europe EMAP Rest of World2012
Therapeutic area/major products
2013 (restated) Growth 2013 Growth 2013 Growth 2013 Growth 2013 Growth£m £m CER% £% £m CER% £% £m CER% £% £m CER% £% £m CER% £%
Combivir 116 179 (36) (35) 35 46 48 39 (41) (39) 35 (56) (56) 7 (36) (42)Epivir 43 49 (10) (12) 10 25 27 16 (29) (26) 11 (5) (5) 6 (2) (22)Epzicom/Kivexa 763 665 14 15 269 9 10 328 11 15 78 38 37 88 22 12Selzentry 143 128 10 12 58 1 2 63 8 13 6 67 60 16 47 40Trizivir 97 107 (10) (9) 58 (6) (4) 32 (17) (14) 4 (26) (30) 3 1 (18)Other 224 246 (10) (9) 122 (5) (4) 48 (22) (19) 37 (7) (8) 17 (9) (10)
1,386 1,374 – 1 552 5 6 526 (3) – 171 (12) (14) 137 12 3
Total USA Europe EMAP Rest of World2011
Therapeutic area/major products
2012 (restated) Growth 2012 Growth 2012 Growth 2012 Growth 2012 Growth£m £m CER% £% £m CER% £% £m CER% £% £m CER% £% £m CER% £%
Combivir 179 322 (43) (44) 24 (81) (81) 64 (27) (31) 79 (2) (5) 12 (42) (37)Epivir 49 110 (54) (55) 8 (81) (81) 21 (31) (35) 12 (55) (56) 8 (23) (38)Epzicom/Kivexa 665 617 10 8 243 4 6 285 11 5 57 37 34 80 10 11 Lexiva 127 142 (9) (11) 68 (9) (8) 33 (20) (26) 19 25 21 7 (14) – Selzentry 128 110 20 16 57 25 26 56 16 9 4 9 2 11 30 10 Trizivir 107 126 (13) (15) 61 (11) (10) 37 (21) (25) 5 4 (1) 4 25 – Other 119 142 (16) (16) 59 (24) (24) 27 (10) (13) 22 5 5 11 (17) (8)
1,374 1,569 (10) (12) 520 (22) (21) 523 (3) (9) 198 3 – 133 (2) (3)

GSK Annual Report 2013 223
Five year record continued
Pharmaceuticals and Vaccines turnover by therapeutic area
2013
£m
2012 (restated)
£m
2011 (restated)
£m
2010 (restated)
£m
2009 (restated)
£m
Respiratory 7,516 7,291 7,298 7,238 6,977 Anti-virals 667 753 842 1,167 2,474 Central nervous system 1,483 1,670 1,721 1,753 1,870 Cardiovascular and urogenital 2,239 2,431 2,454 2,314 2,077 Metabolic 174 171 331 647 1,151 Anti-bacterials 1,239 1,247 1,390 1,396 1,457 Oncology and emesis 969 798 683 679 620 Dermatology 770 850 898 849 547 Rare diseases 495 495 463 408 364 Immuno-inflammation 161 70 15 – –Other pharmaceuticals 799 786 908 941 805 Vaccines 3,420 3,325 3,497 4,326 3,706 ViiV Healthcare (HIV) 1,386 1,374 1,569 1,566 1,605
21,318 21,261 22,069 23,284 23,653
Consumer Healthcare turnoverTotal wellness 1,935 2,057 2,310 2,217 2,172 Oral care 1,884 1,806 1,722 1,596 1,479 Nutrition 1,096 1,050 1,025 953 851 Skin health 272 257 261 342 213
5,187 5,170 5,318 5,108 4,715
Financial results – total
2013
£m
2012 (restated)
£m
2011 (restated)
£m
2010 (restated)
£m
2009 (restated)
£mTurnover 26,505 26,431 27,387 28,392 28,368Operating profit 7,028 7,300 7,734 3,715 8,408Profit before taxation 6,647 6,600 7,625 3,089 7,874Profit after taxation 5,628 4,678 5,405 1,806 5,657
pence pence pence pence pence
Basic earnings per share 112.5 91.6 103.6 31.2 108.9Diluted earnings per share 110.5 90.2 102.1 30.9 108.0
Financial results – core
2013
£m
2012 (restated)
£m
2011 (restated)
£mTurnover 26,505 26,431 27,387Operating profit 8,015 8,238 8,730Profit before taxation 7,366 7,543 8,038Profit after taxation 5,671 5,705 5,954
pence pence pence
Core earnings per share 112.2 111.4 114.5Core diluted earnings per share 110.2 109.7 112.9
2013 millions
2012 millions
2011 millions
2010 millions
2009 millions
Weighted average number of shares in issue: Basic 4,831 4,912 5,028 5,085 5,069 Diluted 4,919 4,989 5,099 5,128 5,108
%
% (restated)
% (restated)
% (restated)
% (restated)
Return on capital employed 91.4 84.9 82.3 30.2 82.9
Return on capital employed is calculated as total profit before taxation as a percentage of average net assets over the year.

224 GSK Annual Report 2013
Investor information Financial record
Balance sheet
2013
£m
2012 (restated)
£m
2011 (restated)
£m
2010 (restated)
£m
2009 (restated)
£mNon-current assets 26,859 27,789 24,921 26,207 25,307Current assets 15,227 13,692 16,167 16,036 17,570Total assets 42,086 41,481 41,088 42,243 42,877
Current liabilities (13,677) (13,815) (15,010) (12,794) (12,118)Non-current liabilities (20,597) (20,929) (17,264) (19,724) (20,041)Total liabilities (34,274) (34,744) (32,274) (32,518) (32,159)
Net assets 7,812 6,737 8,814 9,725 10,718
Shareholders’ equity 6,997 5,800 8,019 8,867 9,981Non-controlling interests 815 937 795 858 737Total equity 7,812 6,737 8,814 9,725 10,718
Number of employees
2013 2012 2011 2010 2009
USA 16,530 17,201 16,707 17,555 22,594Europe 38,367 38,788 38,696 39,910 42,048EMAP 37,747 36,738 35,080 31,992 28,327Japan 3,531 3,515 3,573 3,461 3,264Other 3,276 3,246 3,333 3,543 3,680
99,451 99,488 97,389 96,461 99,913
Manufacturing 31,502 31,369 30,664 30,611 31,162Selling 45,397 45,601 45,155 43,918 44,621Administration 10,232 9,607 8,883 8,850 9,405Research and development 12,320 12,911 12,687 13,082 14,725
99,451 99,488 97,389 96,461 99,913
The geographic distribution of employees in the table above is based on the location of GSK’s subsidiary companies. The number of employees is the number of permanent employed staff at the end of the financial period. It excludes those employees who are employed and managed by GSK on a contract basis.
Exchange ratesAs a guide to holders of ADS, the following tables set out, for the periods indicated, information on the exchange rate of US dollars for Sterling as reported by the Bank of England (4pm buying rate).
2013 2012 2011 2010 2009
Average 1.56 1.59 1.60 1.55 1.56
The average rate for the year is calculated as the average of the 4pm buying rates for each day of the year.
2014Feb
2014 Jan
2013 Dec
2013Nov
2013Oct
2013 Sep
High 1.67 1.66 1.65 1.64 1.62 1.62Low 1.63 1.63 1.62 1.59 1.59 1.55
The 4pm buying rate on 21 February 2014 was £1= US$1.67.
Five year record continued

GSK Annual Report 2013 225
Pharmaceuticals and Vaccines product development pipelineKey† In-licence or other alliance relationship with third partyS Month of first submissionA Month of first regulatory approval (for MAA, this is the first EU
approval letter)BLA Biological Licence ApplicationMAA Marketing Authorisation Application (Europe) NDA New Drug Application (USA)
Phase I Evaluation of clinical pharmacology, usually conducted in volunteersPhase II Determination of dose and initial evaluation of efficacy, conducted in a
small number of patientsPhase III Large comparative study (compound versus placebo and/or established
treatment) in patients to establish clinical benefit and safetyPO Month of EU Positive Opinion
MAA and NDA/BLA regulatory review milestones shown in the table below are those that have been achieved. Future filing dates are not included in this list.
Achieved regulatory review milestones
Compound Type Indication Phase MAA NDA/BLA
Respiratory2126458 phosphoinositide 3 kinase inhibitor idiopathic pulmonary fibrosis I2256294 soluble epoxide hydrolase inhibitor COPD I2269557 phosphoinositide 3 kinase inhibitor asthma & COPD I2793660 cathepsin C inhibitor bronchiectasis I2862277 tumour necrosis factor receptor-1 domain antibody acute lung injury Idanirixin (1325756) CXCR2 chemokine receptor antagonist COPD Ifluticasone furoate glucocorticoid agonist + long-acting beta2 agonist COPD I + vilanterol† + muscarinic acetylcholine antagonist + umeclidinium961081† muscarinic acetylcholine antagonist, beta2 agonist COPD II2245035 toll-like receptor 7 agonist asthma II2339345 sodium channel blocker cough II2586881† recombinant human angiotensin converting enzyme 2 acute lung injury IIfluticasone furoate glucocorticoid agonist + muscarinic acetylcholine asthma II + umeclidinium antagonistlosmapimod p38 kinase inhibitor (oral) COPD (also acute coronary syndrome) IImepolizumab IL5 monoclonal antibody nasal polyposis IImepolizumab IL5 monoclonal antibody severe asthma (also eosinophilic granulomatosis III
with polyangiitis)Relvar/Breo Ellipta long-acting beta2 agonist + glucocorticoid agonist COPD – mortality outcomes III (vilanterol† + fluticasone furoate)vilanterol† long-acting beta2 agonist COPD IIIfluticasone furoate glucocorticoid agonist asthma Submitted S: Oct13Incruse Ellipta* muscarinic acetylcholine antagonist COPD (also hyperhidrosis) Submitted PO: Feb14 S: Apr13 (umeclidinium)Anoro Ellipta muscarinic acetylcholine antagonist + long-acting COPD Approved PO: Feb14 A: Dec13 (umeclidinium beta2 agonist + vilanterol†)Relvar/Breo Ellipta long-acting beta2 agonist + glucocorticoid agonist asthma Approved A: Nov13 (vilanterol† + fluticasone furoate)Relvar/Breo Ellipta long-acting beta2 agonist + glucocorticoid agonist COPD Approved A: Nov13 A:May13 (vilanterol† + fluticasone furoate)
Paediatric VaccinesRSV recombinant respiratory syncytial virus prophylaxis I
(maternal immunisation)RSV recombinant viral vector respiratory syncytial virus prophylaxis IS. pneumoniae next recombinant – conjugated Streptococcus pneumoniae disease prophylaxis II generation†
MMR live attenuated measles, mumps, rubella prophylaxis III (US) A: Nov 97Mosquirix recombinant malaria prophylaxis (Plasmodium falciparum) III N/A (Malaria RTS,S)†
Nimenrix conjugated Neisseria meningitis groups A, C, W & Y Approved A: Apr12 (MenACWY-TT) disease prophylaxis (II, US)
Other VaccinesHIV† recombinant HIV disease prophylaxis INTHi† recombinant non-typeable Haemophilus influenzae prophylaxis IHepatitis C recombinant viral vector hepatitis C virus prophylaxis IIHIV† recombinant HIV disease immunotherapy IITuberculosis† recombinant tuberculosis prophylaxis IIZoster† recombinant Herpes Zoster prophylaxis IIIFlu (pre-) pandemic H5N1 inactivated split – monovalent (Quebec) pre-pandemic & pandemic influenza prophylaxis Approved N/A A: Nov13 Flu vaccine inactivated split – quadrivalent seasonal influenza prophylaxis Approved A: Feb13 A: Dec12
* The use of the brand name is not approved by any regulatory authorities
Pipeline, products and competition

226 GSK Annual Report 2013
Investor information Pipeline, products and competition
Pharmaceuticals and Vaccines product development pipeline continuedAchieved regulatory
review milestonesCompound Type Indication Phase MAA NDA/BLA
Antigen-Specific Cancer ImmunotherapeuticPRAME recombinant treatment of resectable non-small cell lung cancer II immunotherapeutic†
MAGE-A3 recombinant treatment of bladder cancer II immunotherapeutic†
WT1 immunotherapeutic recombinant treatment of breast cancer IIMAGE-A3 recombinant treatment of melanoma III immunotherapeutic†
MAGE-A3 recombinant treatment of non-small cell lung cancer III immunotherapeutic†
HIV (ViiV Healthcare)1265744 HIV integrase inhibitor (long-acting HIV infections II
parenteral formulation)dolutegravir + abacavir HIV integrase inhibitor + reverse HIV infections - fixed dose combination Submitted S:Oct13 S:Oct13 sulphate + lamivudine transcriptase inhibitors (fixed dose
combination)Tivicay (dolutegravir) HIV integrase inhibitor HIV infections Approved A: Jan14 A: Aug13
Oncology525762 bromodomain inhibitor NUT gene midline carcinoma I2141795 + trametinib† AKT protein kinase inhibitor cancer I
+ MEK1/2 inhibitor2256098 focal adhesion kinase inhibitor cancer I2636771 phosphatidylinositol 3-kinase inhibitor cancer I2849330 ErbB3 monoclonal antibody cancer I3052230† fibroblast growth factor ligand trap cancer Iafuresertib (2110183) AKT protein kinase inhibitor multiple myeloma IVotrient (pazopanib) multi-kinase angiogenesis inhibitor renal cell cancer I + MK-3475† + PD-1 monoclonal antibodyafuresertib (2110183) AKT protein kinase inhibitor ovarian cancer IIforetinib† mesenchymal-epithelial transition factor non-small cell lung cancer II
(C-met) kinase inhibitorMekinist (trametinib)† MEK1/2 inhibitor + BRAF protein kinase colorectal cancer II + Tafinlar (dabrafenib) inhibitor + human anti-EGFR + panitumumab† monoclonal antibodyRevolade/Promacta thrombopoietin receptor agonist acute myeloid leukaemia II (eltrombopag)†
Revolade/Promacta thrombopoietin receptor agonist aplastic anaemia II (eltrombopag)†
Revolade/Promacta thrombopoietin receptor agonist myelodysplastic syndromes II (eltrombopag)†
Tafinlar (dabrafenib) BRAF protein kinase inhibitor non-small cell lung cancer IIArzerra (ofatumumab)† CD20 human monoclonal antibody chronic lymphocytic leukaemia, use in relapsed patients IIIArzerra (ofatumumab)† CD20 human monoclonal antibody diffuse large B cell lymphoma (relapsed patients) IIIArzerra (ofatumumab)† CD20 human monoclonal antibody follicular lymphoma (refractory & relapsed patients) IIIMekinist (trametinib)† MEK1/2 inhibitor + BRAF protein kinase metastatic melanoma, adjuvant therapy III + Tafinlar (dabrafenib) inhibitorTyverb/Tykerb (lapatinib) human epidermal growth factor receptor-2 breast cancer, neo-adjuvant & adjuvant therapy III
(Her2) and epidermal growth factor receptor (EGFR) dual kinase inhibitor
Votrient (pazopanib) multi-kinase angiogenesis inhibitor renal cell cancer, adjuvant therapy IIIArzerra (ofatumumab)† CD20 human monoclonal antibody chronic lymphocytic leukaemia, first line therapy Submitted S: Oct13 S: Oct13Votrient (pazopanib) multi-kinase angiogenesis inhibitor ovarian cancer, maintenance therapy Submitted S: Aug13Mekinist (trametinib)† MEK1/2 inhibitor metastatic melanoma Approved S: Feb13 A: May13Mekinist (trametinib)† MEK1/2 inhibitor + BRAF protein kinase metastatic melanoma Approved S: Feb13 A:Jan14 + Tafinlar (dabrafenib) inhibitorRevolade/Promacta thrombopoietin receptor agonist hepatitis C induced thrombocytopaenia Approved A: Sep13 A: Nov12 (eltrombopag)†
Tafinlar (dabrafenib) BRAF protein kinase inhibitor metastatic melanoma Approved A:Aug13 A:May13Tyverb/Tykerb (lapatinib) Her2 and EGFR dual kinase inhibitor metastatic breast cancer, in combination with trastuzumab Approved A: Jul13

GSK Annual Report 2013 227
Achieved regulatory review milestones
Compound Type Indication Phase MAA NDA/BLA
Cardiovascular & Metabolic1278863 prolyl hydroxylase inhibitor (topical) wound healing I2881078 selective androgen receptor modulator heart failure I1278863 prolyl hydroxylase inhibitor anaemia associated with chronic renal disease II
& peri-operative risk reduction2330672 ileal bile acid transport inhibitor type 2 diabetes IIcamicinal motilin receptor agonist delayed gastric emptying IIlosmapimod p38 kinase inhibitor acute coronary syndrome (also COPD) IIretosiban oxytocin antagonist threatened pre-term labour IIdarapladib Lp-PLA2 inhibitor atherosclerosis (also diabetic macular oedema) IIIEperzan (albiglutide) GLP 1 agonist type 2 diabetes Submitted PO: Jan14 S: Jan13
Immuno-inflammation2586184† Janus kinase 1 (JAK1) inhibitor ulcerative colitis I2618960 IL7 receptor monoclonal antibody autoimmune disease I3117391† macrophage targeted histone deacetylase rheumatoid arthritis I
inhibitor2586184† Janus kinase 1 (JAK1) inhibitor systemic lupus erythematosus (also psoriasis) II3196165 (MOR103)† granulocyte macrophage colony- rheumatoid arthritis II
stimulating factor monoclonal antibodybelimumab B lymphocyte stimulator monoclonal transplant rejection (also myaesthenia gravis) II
antibody (i.v.)Benlysta (belimumab) B lymphocyte stimulator monoclonal systemic lupus erythematosus III
antibody (s.c.)Benlysta (belimumab) B lymphocyte stimulator monoclonal vasculitis III
antibody (i.v.)sirukumab† IL6 human monoclonal antibody (s.c.) rheumatoid arthritis III
Rare Diseases2398852† SAP monoclonal antibody amyloidosis I2696274† ex-vivo stem cell gene therapy metachromatic leukodystrophy II2696275† ex-vivo stem cell gene therapy Wiscott-Aldrich syndrome IIozanezumab neurite outgrowth inhibitor (NOGO-A) amyotrophic lateral sclerosis II
monoclonal antibody2696273† ex-vivo stem cell gene therapy adenosine deaminase severe combined immune III
deficiency (ADA-SCID)mepolizumab IL5 monoclonal antibody (s.c.) eosinophilic granulomatosis with polyangiitis III
(also severe asthma)Volibris (ambrisentan)† endothelin A antagonist chronic thromboembolic pulmonary hypertension III
Infectious Diseases2838232 antiviral maturation inhibitor HIV infections I2878175 NS5B polymerase inhibitor hepatitis C I1322322 polypeptide deformylase inhibitor bacterial infections II2140944 type 2 topoisomerase inhibitor bacterial infections IItafenoquine† 8-aminoquinoline Plasmodium vivax malaria IIRelenza i.v. (zanamivir)† neuraminidase inhibitor (i.v.) influenza III
Neurosciences2647544 Lp-PLA2 inhibitor Alzheimer's disease I239512 H3 receptor antagonist multiple sclerosis II249320 myelin-associated glycoprotein monoclonal stroke II
antibodybelimumab B lymphocyte stimulator monoclonal myaesthenia gravis (also transplant rejection) II
antibody (i.v.)ofatumumab† CD20 human monoclonal antibody (s.c.) multiple sclerosis (also pemphigus vulgaris) IIrilapladib Lp-PLA2 inhibitor Alzheimer's disease II
Pharmaceuticals and Vaccines product development pipeline continued

228 GSK Annual Report 2013
Investor information Pipeline, products and competition
Achieved regulatory review milestones
Compound Type Indication Phase MAA NDA/BLA
Ophthalmology933776 beta amyloid monoclonal antibody geographic retinal atrophy IIdarapladib Lp-PLA2 inhibitor diabetic macular oedema (also atherosclerosis) II
Dermatology1940029 stearoyl CoA desaturase 1 inhibitor (topical) acne vulgaris Iumeclidinium muscarinic acetylcholine antagonist (topical) hyperhidrosis (also COPD) I2586184† Janus kinase 1 (JAK1) inhibitor psoriasis (also lupus) II2894512† non-steroidal anti-inflammatory atopic dermatitis & psoriasis IIofatumumab† CD20 human monoclonal antibody (s.c.) pemphigus vulgaris (also multiple sclerosis) IIToctino (alitretinoin)† retinoic acid receptor modulator chronic hand eczema III N/ADuac low dose clindamycin/benzoyl peroxide gel acne vulgaris Approved A: Mar13 N/A
Brand names appearing in italics are trademarks either owned by and/or licensed to GlaxoSmithKline or associated companies.
Option-based alliances with third parties that include assets in phase I and phase II development:
Company Disease Area Phase
Cancer Research UK cancer IDynavax Technologies cutaneous & systemic lupus erythematosus IIISIS Pharmaceuticals transthyretin-mediated amyloidosis
hepatitis BII/III I
OncoMed Pharmaceuticals oncology I/II*Shionogi bacterial infection I
* Two assets
Pharmaceuticals and Vaccines product development pipeline continued

GSK Annual Report 2013 229
Major Patent expiry datesProducts Compounds Indication(s) competitor brands USA EU
Respiratory 2025 2025Anoro Ellipta umeclidinium bromide/ COPD Spiriva, Onbrez (NCE) (NCE)
vilanterol terfenatate 2016-2029 2016-2029(device) (device)
Avamys/Veramyst fluticasone furoate rhinitis Nasonex 20211 2023Flixotide/Flovent fluticasone propionate asthma/COPD Qvar, Singulair 2016 expired
(Diskus device) (Diskus device)2013-2025 2017(HFA-device/ (HFA-device/formulation) formulation)
Relvar/Breo fluticasone furoate/ asthma/COPD Symbicort, Foster, 2022 2022Ellipta vilanterol terfenatate (US – COPD only) Flutiform, Dulera (NCE) (NCE)
2016-2029 2016-2029(device) (device)
Seretide/Advair* salmeterol xinafoate/ asthma/COPD Symbicort, Foster, 2016 expiredfluticasone propionate Flutiform, Dulera (Diskus device) (Diskus device)
2013-2025 2017(HFA-device/ (HFA-device/formulation) formulation)
Serevent salmeterol xinafoate asthma/COPD Foradil, Spiriva, 2016 expiredOnbrez (Diskus device) (Diskus device)
2019(HFA-device/ formulation)
Ventolin HFA albuterol sulphate asthma/COPD generic companies 2015-2025 2012-2017(HFA-device/ (HFA-device/formulation) formulation)
Anti-viralsRelenza zanamivir influenza Tamiflu expired 2014Valtrex valaciclovir genital herpes, coldsores, Famvir expired expired
shinglesZeffix/Epivir-HBV lamivudine chronic hepatitis B Hepsera 2014 expired
(use) (use)Central nervous systemLamictal lamotrigine epilepsy, bipolar disorder Keppra, Dilantin expired expiredImigran/Imitrex sumatriptan migraine Zomig, Maxalt, Relpax expired expiredRequip XL ropinirole Parkinson’s disease Mirapex expired expiredSeroxat/Paxil paroxetine depression, various Effexor, Cymbalta, expired expired
anxiety disorders LexaproCardiovascular and urogenitalAvodart dutasteride benign prostatic hyperplasia Proscar, Flomax, 20151 2017
finasterideCoreg CR carvedilol phosphate mild-to-severe heart failure, Toprol XL 2016† NA
hypertension, left ventricular (formulation)dysfunction post MI
Lovaza omega-3 acid ethyl esters very high triglycerides Tricor expired NA
* See ’Risk factors’ on page 233 for details of uncertainty on the timing of follow-on competition. † Generic competition possible in 2014.1 See Note 44 to the financial statements, ‘Legal proceedings’.
Pharmaceutical products, competition and intellectual property

230 GSK Annual Report 2013
Investor information Pipeline, products and competition
Major Patent expiry datesProducts Compounds Indication(s) competitor brands USA EU
Anti-bacterialsAugmentin amoxicillin/clavulanate common bacterial generic products NA expired
potassium infectionsOncologyArzerra ofatumumab refractory chronic MabThera/Rituxan, 2030 2023
lymphocytic leukaemia ImbruvicaMekinist trametinib metastatic melanoma Yervoy, Zelboraf 2025 NAPromacta/ eltrombopag idiopathic thrombocytopenic Nplate, 2022 2025Revolade purpura, Hepatitis C MabThera/Rituxan
associated thrombocytopeniaTafinlar dabrafenib mesylate metastatic melanoma Yervoy, Zelboraf 2030 not yet grantedTykerb/Tyverb lapatanib advanced and metastatic Herceptin, 2020 2023
breast cancer in HER2 Kadcylapositive patients
Votrient pazopanib soft tissue sarcoma Yondelis, Sutent, 2023 2025metastatic renal cell Nexavar, Afinitorcarcinoma
Rare diseasesVolibris ambrisentan pulmonary hypertension Tracleer, Revatio NA 2020Immuno-inflammationBenlysta belimumab systemic lupus erythematosus 2023 2021VaccinesBoostrix diphtheria, tetanus, acellular booster vaccination Adacel 2017 2017
pertussisInfanrix/Pediarix diphtheria, tetanus, pertussis, diphtheria, tetanus, pertussis, Pentacel, Pediacel, 2017 2014
polio, hepatitis B, polio, hepatitis B Pentaxim, Pentavac, Haemophilus influenzae Haemophilus influenzae Hexaximtype B type B
Cervarix HPV 16 & 18 virus like human papilloma virus Gardasil (Silgard) 2020 2020particles (VLPs), AS04 type 16 and 18adjuvant (MPL + aluminiumhydroxide)
Fluarix split inactivated influenza seasonal influenza Vaxigrip, Mutagrip, 2022 2022virus subtypes A and Fluzone, Influvac, subtype B antigens Aggripal, Fluad,
Intenza, FlumistFluarix Tetra split inactivated influenza seasonal influenza Intenza, Flumist QIV, 2022 2022
virus subtypes A and Vaxigrip QIV, subtype B antigens Fluzone QIV,
Fluzone High DoseFluLaval split inactivated influenza seasonal influenza Vaxigrip, Mutagrip, none none
virus subtypes A and Fluzone, Influvac,subtype B antigens Aggripal, Fluad,
Intenza, FlumistPandemrix derived split inactivated A(H1N1)v2009 influenza Focetria, Celvapan, 2014 2014
influenza virus antigen, prophylaxisAS03 adjuvant
Prepandrix derived split inactivated pandemic H5N1 Aflunov, Vepacel 2014 2014influenza virus antigen, influenza prophylaxisAS03 adjuvant
Synflorix conjugated pneumococcal invasive pneumococcal Prevenar (Prevnar) NA 2021polysaccharide disease, pneumonia
acute otitis media
Pharmaceutical products, competition and intellectual property continued

GSK Annual Report 2013 231
Brand Products Application Markets Competition
Total wellnessPanadol tablets, caplets, infant drops paracetamol-based treatment global except USA Reckitt-Benckiser’s Nurofen
of headache and joint pain, fever, cold symptoms
NicoDerm, gum, patch, mini lozenge, treatment of nicotine global Novartis’ NicotinellNiQuitin CQ, original lozenge withdrawal as an aid to Johnson & Johnson’sand Nicabate. quitting smoking Nicorette in EuropeAlso Nicorette retailers’ own brands(US only)ENO effervescent and rapid relief antacid global Hypermarcas’ EstomazilTums chewable tablets Pfizer’s Gelusil
Sanofi’s RolaidsJohnson & Johnson’s Mylanta
Oral careSensodyne toothpastes, toothbrushes prevention of dental global Colgate-Palmolive’s
mouthwashes sensitivity Colgate Pro ReliefPolident denture adhesive, denture improve comfort of global Procter & Gamble’s FixodentPoligrip cleanser fitted dentures and to Reckitt-Benckiser’s KukidentCorega clean dentures and SteradentAquafresh toothpastes, toothbrushes prevention of caries, gum global Colgate-Palmolive’s Colgate
mouthwashes disease and bad breath Procter & Gamble’s Crestand Oral-B
Parodontax toothpastes, mouthwashes help stop bleeding gums global Colgate-Palmolives’sgum health Colgate Pro-Gum
NutritionHorlicks malted, milk-based drinks nutrition UK, Ireland, India Mondelez’s Bournvita
and foods Nestle’s MiloMaxinutrition sports nutrition, protein nutrition UK Myprotein
powder, bars Optimum NutritionSkin healthPhysiogel moisturising, creams, face and body care for dry, Germany, France, Italy, L’Oreal’s La Roche Posay
lotions and cleansers sensitive and irritated skin Poland, Spain Beiersdorf’s EucerinPierre Fabre’s Avene
Oilatum emollient bath and creams, soothing treatment for eczema UK, Poland, Reckitt-Benckiser’s E45shampoo and dry skin conditions other markets Sanofi’s Emolium
Consumer Healthcare products and competition
Major Patent expiry datesProducts Compounds Indication(s) competitor brands USA EU
HIVCombivir lamivudine and zidovudine HIV/AIDS Truvada, Atripla expired expired
Stribild (combination) (combination)Complera/Eviplera
Epivir lamivudine HIV/AIDS Truvada, Atripla expired expiredStribildComplera/Eviplera
Epzicom/Kivexa lamivudine and abacavir HIV/AIDS Truvada, Atripla 20161 2019Stribild (combination) (combination)Complera/Eviplera
Lexiva fosamprenavir HIV/AIDS Prezista, Kaletra, 20171 2019Reyataz
Selzentry maraviroc HIV/AIDS Isentress, Intelence, 2021 2022Prezista
Tivicay dolutegravir HIV/AIDS Isentress, Prezista 2027 2026Reyataz, Kaletra
Trizivir lamivudine, zidovudine HIV/AIDS Truvada, Atripla 20161,2 2016and abacavir Stribild (combination) (combination)
Complera/Eviplera2 Generic competition commenced in 2014
Pharmaceutical products, competition and intellectual property continued

232 GSK Annual Report 2013
Investor information Principal risks and uncertainties
Principal risks and uncertaintiesRisk factorsThe principal risks discussed below are the risks and uncertainties relevant to our business, financial condition and results of operations that may affect our performance and ability to achieve our objectives. The factors below are those that we believe could cause our actual results to differ materially from expected and historical results.
We operate on a global basis in an industry that is both highly competitive and highly regulated. Our competitors may make significant product innovations and technical advances and may intensify price competition. In light of this competitive environment, continued development of commercially viable new products and the development of additional uses for existing products are critical to our ability to maintain or increase overall sales.
Developing new pharmaceutical and vaccine products is a costly, lengthy and uncertain process, however, and a product candidate may fail at any stage, including after significant Group economic and human resources have been invested. Our competitors’ products or pricing strategies or any failure on our part to develop commercially successful products or to develop additional uses for existing products could materially and adversely affect our financial results.
We must also adapt to and comply with a broad range of laws and regulations. These requirements apply to research and development, manufacturing, testing, approval, distribution, sales and marketing of Pharmaceutical, Vaccine and Consumer Healthcare Products, and affect not only the cost of product development but also the time required to reach the market and the uncertainty of successfully doing so.
Moreover, as rules and regulations change, and governmental interpretation of those rules and regulations evolves, the nature of a particular risk may alter. Changes to certain regulatory regimes, such as the US healthcare system, may be substantial. Any change in, and any failure to comply with, applicable law and regulation could materially and adversely affect our financial results.
Similarly, our business exposes us to litigation and government investigations, including but not limited to product liability litigation, antitrust litigation and sales and marketing litigation. Litigation and government investigations, including related provisions we may make for unfavourable outcomes and increases in related costs such as insurance premiums, could materially and adversely affect our financial results. More detail on the status and various uncertainties involved in the significant unresolved disputes and potential litigation is set out in Note 44, ‘Legal proceedings,’ on page 204.
UK regulations require a discussion of mitigating activities a company takes to address principal risks and uncertainties. A summary of the mitigation activities accompanies each principal risk to represent the main actions we have taken to manage each of our principal risks. The principal risk factors and uncertainties are not listed in order of significance.
The Chief Medical Officer (CMO) is responsible for medical governance for the Group under a global policy. Under that policy, safeguarding human subjects in our clinical trials and patients who take our products is of paramount importance, and the CMO has the authoritative role for evaluating and addressing matters of human safety. Individual Medical Officers and the Group’s substantial Global Safety and Pharmacovigilance keep track of any adverse issues reported for our products during the course of clinical studies.
Once a Group product is approved for marketing, the Group has an extensive post-marketing surveillance and signal detection system. Information on possible side effects of medicines is received from several sources including unsolicited reports from health professionals and patients, regulatory authorities, medical and scientific literature and the media. It is our policy that employees are required to report immediately any issues relating to the safety or quality of its medicines. Each of our country managers is responsible for monitoring, exception tracking and training that helps assure the collection of safety information and reporting the information to the relevant central safety department, in accordance with Group policy and legal requirements.
Information that changes the benefit/risk profile of one of the Group’s medicines will result in certain actions to characterise, communicate and minimise the risk. Proposed actions are discussed with regulatory authorities and can include modifying the prescribing information, communications to physicians and other healthcare providers, restrictions on product prescribing/availability to help assure safe use, and sometimes carrying out further clinical trials. In certain cases, it may be appropriate to stop clinical trials or to withdraw the medicine from the market. The Group’s Global Safety Board (GSB), comprising senior physicians and representatives of supporting functions, is an integral component of the system. The GSB (including subsidiary boards dedicated to Consumer Healthcare Products and Vaccines) reviews the safety of investigational and marketed products across the Group and has the authority to stop a clinical trial if deemed possibly harmful to human volunteers.
In addition to the medical governance framework within the Group as described above, the Group uses several mechanisms to foster the early evaluation, mitigation, and resolution of disputes as they arise and of potential claims even before they arise. The goal of the programmes is to create a culture of early identification and evaluation of risks and claims (actual or potential), in order to minimise liability and litigation.
Risk definitionFailure to appropriately collect, review, follow up, or report adverse events from all potential sources. This could compromise our ability to conduct robust safety signal detection and interpretation and to ensure that appropriate decisions are taken with respect to the risk/benefit profile of our products, including the completeness and accuracy of product labels and the pursuit of additional studies/analyses, as appropriate.
Risk impactThe impacts of the risk include potential harm to patients, reputational damage, product liability claims or other litigation, governmental investigation, regulatory action such as fines, penalties or loss of product authorisation.
ContextPre-clinical and clinical trials are conducted during the development of investigational Pharmaceutical, Vaccine and Consumer Healthcare Products to determine the safety and efficacy of the products for use by humans. Notwithstanding the efforts we make to determine the safety of our products through appropriate pre-clinical and clinical trials, unanticipated side effects may become evident only when products are widely introduced into the marketplace. Questions may be raised not only by our ongoing safety surveillance and post-marketing studies but also by governmental agencies and third-parties who may analyse publicly available clinical trial results.
The Group is currently a defendant in a number of product liability lawsuits, including class actions, that involve significant claims for damages related to our products. Litigation, particularly in the US, is inherently unpredictable. Class actions that seek to sweep together all persons who were prescribed our products increase the potential liability. Claims for pain and suffering and punitive damages are frequently asserted in product liability actions and, if allowed, can represent potentially open-ended exposure and thus, could materially and adversely affect the Group’s financial results.
Mitigating activitiesWe have constructed a system of medical governance to help ensure the safety and efficacy of the Pharmaceuticals, Vaccines and Consumer Healthcare Products the Group produces.
Strategic priority: Deliver more products of value. Grow a diversified global company.Patient safety
GSK Annual Report 2013 233
We depend on certain key products for a significant portion of our sales. The timing and impact of entry in the USA and major markets in Europe for a ‘follow-on’ product to Seretide/Advair is uncertain. The US patent for compositions containing the combination of active substances in Seretide/Advair expired during 2010 although the US patent on a component of the Advair Diskus device continues until August 2016. We are not able to predict when a generic competitor to Seretide/Advair may enter the US market.
Generic drug manufacturers have also exhibited a readiness to market generic versions of many of our most important products prior to the expiration of our patents. Their efforts may involve challenges to the validity or enforceability of a patent or assertions that their generic product does not infringe our patents. As a result, we are and may continue to be involved in legal proceedings involving patent challenges, which may materially and adversely affect our financial results. Moreover, in the USA, it has become increasingly common for patent infringement actions to prompt claims that anti-trust laws have been violated during the prosecution of the patent or during litigation involving the defence of that patent. Such claims by direct and indirect purchasers and other payers are typically filed as class actions. The relief sought may include treble damages and restitution claims. Similarly, anti-trust claims may be brought by government entities or private parties following settlement of patent litigation, alleging that such settlements are anti-competitive and in violation of anti-trust laws. A successful anti-trust claim by a private party or government entity could materially and adversely affect our financial results.
The expiration dates for patents for our major products which may affect the dates on which generic versions of our products may be introduced are set out on pages 229-231. Legal proceedings involving patent challenges are set out in Note 44 to the financial statements, ‘Legal proceedings’.
Mitigating activitiesOur Global Patents group focuses on securing and protecting our patent rights. This global group maintains internal processes designed to help ensure successful procurement, enforcement and defence of our patents with the goal of maintaining exclusive rights in markets for our products.
The Global Patents group monitors new developments in international patent law to help ensure appropriate protection of our assets. Sometimes acting through trade associations, we work with local governments to seek to secure effective and balanced intellectual property protection designed to meet the needs of patients and payers while supporting long-term investment in innovation.
Risk definitionFailure to appropriately secure and protect intellectual property rights.
Risk impactAny loss of patent protection, including reducing the scope of patent rights or compulsory licensing (in which a government forces a manufacturer to license its patents for specific products to a competitor), could materially and adversely affect our financial results in those markets. Absence of adequate patent or data exclusivity protection could limit the opportunity to rely on such markets for future sales growth for our products, which could also materially and adversely affect our financial results.
ContextAs an innovative Pharmaceutical, Vaccine and Consumer Healthcare Products company, we seek to obtain appropriate intellectual property protection for our products. Our ability to obtain and enforce patents and other proprietary rights with regard to our products is critical to our business strategy and success. Pharmaceutical and Vaccine products are usually only protected from being copied by generic manufacturers during the period of exclusivity provided by an issued patent or related intellectual property rights such as Regulatory Data Protection or Orphan Drug status. Following expiration of certain intellectual property rights, a generic manufacturer may lawfully produce a generic version of the product but may face technological or regulatory barriers to marketing.
We operate in markets where intellectual property laws and patent offices are still developing and where governments may be unwilling to grant or enforce intellectual property rights in a fashion similar to more developed regions such as the EU, Japan and the USA. Some developing countries have reduced, or threatened to reduce, effective patent protection for Pharmaceutical products generally, or in particular therapeutic areas, to facilitate early competition within their markets from generic manufacturers.
We face competition from manufacturers of proprietary and generic pharmaceutical products in all of our major markets. Introduction of generic products, particularly in the USA where we have our highest turnover and margins, typically leads to a dramatic loss of sales and reduces our revenues and margins for our proprietary products. In 2013, we had 10 Pharmaceutical and Vaccine products with over £500 million in annual global sales. For certain of these products, there is generic competition in the USA and some markets in Europe. We may also experience an impact on sales of one of our products due to the expiry or loss of patent protection for a product marketed by a competitor in a similar product class or for treatment of a similar disease condition.
Strategic priority: Deliver more products of value. Grow a diversified global company.Intellectual property

234 GSK Annual Report 2013
Investor information Principal risks and uncertainties
We have adopted a single Quality Management System (QMS) that defines our quality standards and systems for our businesses associated with Pharmaceuticals, Vaccines and Consumer Healthcare Products and R&D investigational materials. The QMS has a broad scope, covering the end-to-end supply chain from starting materials to distributed product, and is applicable throughout the complete lifecycle of products from R&D to mature commercial supply.
The QMS is periodically updated based on experience, evolving regulatory agency expectations and requirements and improved scientific understanding to help ensure that operations comply with GMP requirements globally, and support the delivery of consistent and reliable products. A large network of quality and compliance professionals is aligned with each business unit to provide oversight and assist the delivery of quality performance and operational compliance. Management oversight of those activities is accomplished through a hierarchy of quality council meetings. Staff are trained to help ensure that standards, as well as expected behaviours based on our values, are followed.
We have implemented a risk-based approach to assessing and managing our third-party suppliers that provide materials used in finished products. Contract manufacturers making our products are expected to comply with standards identified by the Group and are audited to help provide assurance that expected standards are met.
The Chief Product Quality Officer oversees the activities of the GSK Quality Council which serves as a forum to escalate emerging risks, share experiences of handling quality issues from all of our businesses and help ensure that lessons learned are assessed and deployed globally. The preparation for and implementation of new legislation is regularly reviewed by the GSK Quality Council and advocacy and communication programmes are used to maintain awareness of the external environment and convey consistent messages across the Group. There is emphasis on quality performance metrics and a culture of ‘right first time’.
Risk definitionFailure to ensure product quality throughout manufacturing and distribution processes resulting in non-compliance with good manufacturing practice (GMP) and regulations.
Risk impactA failure to ensure product quality could have far reaching implications in terms of the health of patients and customers, product recalls, potential damage to our reputation, as well as regulatory, legal, and financial consequences, which could materially and adversely affect our financial results.
ContextPatients, consumers and healthcare professionals trust the quality of our products at the point of use. A failure to ensure product quality is an enterprise risk which is applicable across all of our business activities. Product quality may be influenced by many factors including product and process understanding, consistency of manufacturing components, compliance with GMP, accuracy of labelling, reliability and security of the supply chain, and the embodiment of an overarching quality culture. The internal and external environment continues to evolve as new products, new markets and new legislation are introduced, particularly around security of supply, good distribution practice and product standards.
Mitigating activitiesIn medicines development, scientists adopt the principles of quality by design for new products and devise control strategies to be deployed throughout the product lifecycle to help ensure consistency and reliability in their performance and supply.
Strategic priority: Deliver more products of value. Grow a diversified global company.Product quality

GSK Annual Report 2013 235
The failure of a small number of single-source, third-party suppliers or service providers to fulfil their contractual obligations in a timely manner or as a result of regulatory non-compliance or physical disruption of logistics and manufacturing sites may result in delays or service interruptions.
Mitigating activitiesOur supply chain model is designed to help ensure the supply, quality and security of our products globally. We closely monitor the delivery of our products to help ensure that our customers have the medicines, vaccines and products they need. Safety stocks and backup supply arrangements for high revenue and medically-critical products are in place, where practical, to help mitigate this risk. In addition, the standing of manufacturing external suppliers is routinely monitored in order to identify and manage supply base risks.
Where practical, dependencies on single sources of critical items are removed. During 2013, our reliance on single source components was reduced for several key products through qualification of alternative materials that will help improve supply chain robustness.
During 2013, our supply chain operating model was modified to strengthen the link between commercial forecasting and manufacturing. This action will over time decrease the risk associated with demand fluctuations impacting ability to supply or write-offs associated with product exceeding expiry dating. Under the new model, each node of the supply chain is being optimised to help ensure adequate safety stock while balancing working capital associated with the end-to-end supply chain.
Risk definitionFailure to deliver a continuous supply of compliant finished product.
Risk impactAny interruption of supply or exclusion from healthcare programmes could impact patient access to our products, expose us to litigation or regulatory action and materially and adversely affect our financial results. In particular, the incurring of fines or disgorgement as a result of noncompliance with manufacturing practice regulations could also materially and adversely affect the Group’s financial results and result in reputational damage.
ContextOur supply chain operations are subject to review and approval by various regulatory agencies that effectively provide our licence to operate. Failure by our manufacturing and distribution facilities or by suppliers of key services and materials could lead to litigation or regulatory action such as product recalls and seizures, interruption of supply, delays in the approval of new products, and revocation of our licence to operate pending resolution of manufacturing or logistics issues.
Materials and services provided by third-party suppliers are necessary for the commercial production of our products, including active pharmaceutical ingredients (API), antigens, intermediates, commodities and components necessary for the manufacture and packaging of many of our Pharmaceutical, Vaccine and Consumer Healthcare Products. Some of the third-party services procured, such as services provided by clinical research organisations to support development of key products, are important to the continuous operation of our businesses. Although we undertake business continuity planning, single sourcing of certain components, bulk API, finished products, and services creates a risk of failure of supply in the event of regulatory non-compliance or physical disruption at the manufacturing sites and to logistics.
Mitigating activitiesThe Group maintains a control environment designed to identify material errors in financial reporting and disclosure. The design and operating effectiveness of key financial reporting controls is periodically tested. This provides us with the assurance that controls over key financial reporting and disclosure processes have operated effectively.
We keep up-to-date with the latest developments in financial reporting requirements by working with our external auditor and other advisors to help ensure adherence to relevant reporting and disclosure requirements.
There is shared accountability for financial results across our businesses. Financial results are reviewed and approved by regional management and then reviewed with the Financial Controller and the Chief Financial Officer (CFO). This allows our Financial Controller and our CFO to assess the evolution of the business over time, and to evaluate performance to plan. Significant judgments are reviewed and confirmed by senior management.
Risk definitionFailure to report accurate financial information in compliance with accounting standards and applicable legislation.
Risk impactNon-compliance with existing or new financial reporting and disclosure requirements, or changes to the recognition of income and expenses, could expose us to litigation and regulatory action and could materially and adversely affect our financial results.
ContextNew or revised accounting standards, rules and interpretations issued from time to time by the International Accounting Standards Board could result in changes to the recognition of income and expense that may materially and adversely affect our financial results.
The Group is also required by the laws of various jurisdictions to publicly disclose its financial results, and regulators routinely review the financial statements of listed companies for compliance with accounting and regulatory requirements. The Group believes that it complies with the appropriate regulatory requirements concerning our financial statements and disclosures. However, should we be subject to an investigation into potential non-compliance with accounting and disclosure requirements there is potential for restatements of previously reported results and we could be subject to significant penalties.
Strategic priority: Simplify the operating model. Deliver more products of value.Supply chain continuity
Strategic priority: Simplify the operating model.Financial reporting and disclosure
236 GSK Annual Report 2013
Investor information Principal risks and uncertainties
Liquidity risk is managed by diversifying our liquidity sources using a range of facilities and by maintaining broad access to funding markets in order to meet anticipated future funding requirements. We also hold significant amounts of cash and investments which are invested in line with strict investment guidelines.
Interest rate risk is managed by limiting the amount of floating rate interest payments to a prescribed percentage of operating profit, and the mix of debt at fixed and floating interest rates is monitored regularly by the TMG.
Foreign currency transaction risk arising on internal and external trade flows is not generally hedged. Our internal trading transactions are matched centrally, and we manage inter-company payment terms to reduce foreign currency risk. Foreign currency cash flows can be hedged selectively under the management of Treasury and the TMG. Where possible, we manage the cash surpluses or borrowing requirements of subsidiary companies centrally. In order to reduce foreign currency translation exposure, we seek to denominate borrowings in the currencies of our principal assets and cash flows. The TMG reviews the ratio of borrowings to assets for the major currencies monthly.
Counterparty risk is managed by setting global counterparty limits for each of our banking and investment counterparties based on long-term credit ratings from Moody’s and Standard and Poor’s. Treasury’s usage of these limits is monitored daily by a Corporate Compliance Officer (CCO) who operates independently of Corporate Treasury. The CCO also monitors the credit rating of these counterparties and, when changes in ratings occur, notifies Treasury so that changes can be made to investment levels or to authority limits as appropriate.
We monitor government debate on tax policy in our key jurisdictions to deal proactively with any potential future changes in tax law. Tax risk is managed by a set of policies and procedures to help ensure consistency and compliance with tax legislation. We engage advisors and legal counsel to review tax legislation and applicability to our business.
We attempt to mitigate the risk of more aggressive tax authority audits by being as up to date as possible with our tax affairs and working proactively with tax authorities where possible. We have also moved to a more centralised and simplified intellectual property ownership and trading model. The model centralises our Pharmaceutical intellectual property into the UK, reducing the complexity of our inter-company arrangements enabling us to drive more bilateral Advance Pricing Agreements (APAs) between the UK and other jurisdictions where we operate. APAs give greater certainty to the application of transfer pricing and our direct tax affairs and hence reduce risks. Internal structures have been enhanced through a centralised team of dedicated specialists responsible for managing transactional tax reporting and compliance.
Risk definitionFailure to comply with tax law or significant losses due to treasury activities.
Risk impactChanges in tax laws or in their application with respect to matters such as transfer pricing, foreign dividends, controlled companies, R&D tax credits, taxation of intellectual property or a restriction in tax relief allowed on the interest on intra-group debt, could impact our effective tax rate. Significant losses may arise from Treasury activities through inconsistent application of Treasury policies, dealing or settlement errors, or counterparty defaults. Any such changes in tax laws or their application, failure to comply with tax law or significant losses due to treasury activities could materially and adversely affect our financial results.
ContextThe Group’s Treasury group deals in high value transactions, mostly foreign exchange and cash management transactions, on a daily basis.
The Group’s effective tax rate is driven by rates of tax in jurisdictions that are both higher and lower than the UK. In addition, many jurisdictions currently offer regimes that encourage innovation and investment in science by providing tax incentives, such as R&D tax credits and lower tax rates on income derived from patents. Furthermore, as an international business, we face risks associated with intra-group transfer pricing.
The tax charge included in our financial statements is our best estimate of tax liability pending audits by tax authorities. We submit tax returns according to statutory time limits and engage tax authorities to help ensure our tax affairs are current. In exceptional cases where matters cannot be settled by agreement with tax authorities, we may have to resolve disputes through formal appeals or other proceedings. As an international business, we are also subject to a range of other duties and taxes carrying similar types of risk.
There is an increased focus on the tax position of multinational businesses, as a consequence of the challenging economic environment and the priority placed by the G20 on addressing allegations of tax avoidance. We have seen some increase in audits as governments seek to raise revenues, both from corporate taxes and above the line taxes such as customs duties.
Mitigating activitiesTreasury does not operate as a profit centre and does not enter into financial derivative transactions for speculative purposes. All transactions in financial instruments are undertaken to manage the risks arising from underlying business activities. Treasury activities are governed by policies approved by the Board of Directors and compliance is regularly reviewed by the Treasury Management Group (TMG), which is chaired by the CFO.
Strategic priority: Simplify the operating model.Tax and treasury

GSK Annual Report 2013 237
Mitigating activitiesOur Code of Conduct, values and behaviours and commitment to zero tolerance are integral to how we mitigate this risk. The Group has an enterprise-wide ABAC programme designed to respond to the threat and risk of bribery and corruption. It builds on the Group’s values and existing standards to form a comprehensive and practical approach to compliance in this complex risk area.
Our ABAC programme is supported by: top-level commitment; a global policy and proportionate procedures (including a ‘Speak Up’ procedure); ongoing training and communications (including a confidential reporting line); ongoing risk assessment; monitoring and investigations; and third party due diligence including contracting requirements and monitoring and oversight. In addition, the programme mandates enhanced controls over interactions with government officials and when undertaking business development transactions. Programme governance is provided by the Group’s ABAC Oversight Committee which includes representation from key functional areas.
Additionally, we have a dedicated ABAC team responsible for driving the implementation and evolution of the programme in response to developments in the internal and external environment. This capability includes an ABAC investigations team empowered to review bribery and corruption allegations and make recommendations for remedial action and improvement. They are supported by a network of functional experts from our Legal, Compliance and Audit & Assurance groups.
We continually benchmark our ABAC programme and use external expertise to review and help improve elements of the programme.
Risk definitionFailure to foster a culture within the Group in which bribery and corruption are unacceptable; adopt measures and embed procedures to prevent bribery and corruption by employees, complementary workers and through third party interactions; investigate allegations of bribery and corruption and remediate issues identified; and comply with applicable anti-bribery and corruption (ABAC) legislation.
Risk impactFailure to comply with applicable local and international ABAC legislation could expose the Group and associated persons to governmental investigation, regulatory action and civil and criminal liability, as well as damage the Group’s reputation, shareholder value, and our licence to operate, all of which could materially and adversely affect our financial results.
ContextLike other large organisations, the Group faces the risk of fraud by members of staff. The nature, scale and geography of our international business activities increase the possibility of this bribery and corruption risk. Additionally, the healthcare industry is highly regulated, and some of our overseas markets, such as our operations in emerging markets, are more susceptible to bribery and corruption risks.
Strategic priority: Grow a diversified global company.Anti-bribery and corruption

238 GSK Annual Report 2013
Investor information Principal risks and uncertainties
Mitigating activitiesWe are committed to legitimate Scientific Engagement and the ethical and responsible commercialisation of medicines to support our mission to improve the quality of human life by enabling people to do more, feel better, and live longer. To accomplish this mission, we engage the healthcare community in various ways to advance our scientific knowledge as well as to provide important information about our medicines.
We have an obligation to learn from Scientific Engagement interactions and provide accurate and complete information through appropriate channels; in a careful, correct, non-promotional manner. Researchers, HCPs, healthcare organisations (HCOs) and other external experts that we engage should be fairly compensated for services and expertise provided. However, payments must not be excessive and must never be or be perceived to be an inducement or reward for prescribing our products.
Promotion of approved medicines helps ensure that HCPs globally have access to information they need, that patients have access to the medicines they need and that medicines are prescribed and used in a manner that provides the maximum healthcare benefit to patients. We are committed to communicating information related to our approved products in a responsible, legal, and ethical manner.
We have taken action at all levels of the Group to enhance and improve standards and procedures for Scientific Engagement and promotional interactions, based on our values of transparency, respect, integrity and patient focus. We have policies and standards governing promotional activities and Scientific Engagement undertaken by the Group or on its behalf. All of these activities we conduct worldwide must conform to high ethical, medical, and scientific standards. Where local standards differ from global standards, the more stringent of the two applies.
All promotional materials and activities must be reviewed and approved according to the Group’s standards, and conducted in accordance with local laws and regulations, to help ensure that these materials and activities fairly represent the products or services of the Group. When necessary, we have disciplined (up to and including termination) employees who have engaged in misconduct and have broadened our ability to claw back remuneration from senior management in the event of misconduct.
In recent years, we have taken several steps that we feel are industry leading in various areas of commercial practices and Scientific Engagement. Examples where the Group stance has been recognised as industry-leading include removing prescription-volume incentives from compensation of sales representatives in the US and global standards for Scientific Engagement.
Risk definitionFailure to engage in commercial and/or scientific activities that are consistent with the letter and spirit of legal, industry, or the Group’s requirements relating to marketing and communications about our medicines and associated therapeutic areas; appropriate interactions with healthcare professionals (HCPs) and patients; and legitimate and transparent transfer of value.
Risk impactFailure to comply with applicable laws, rules and regulations may result in governmental investigation, regulatory action and legal proceedings brought against the Group by governmental and private plaintiffs. Failure to provide accurate and complete information related to our products may result in incomplete awareness of the benefit:risk profile of our medicines and possibly suboptimal treatment of patients. Any of these consequences could materially and adversely affect our financial results. Any practices that are found to be misaligned with our values could also result in reputational damage and dilute trust established with key stakeholders.
ContextThe Group disseminates information about its products through both promotion and non-promotional Scientific Engagement. The latter is the interaction and exchange of information between the Group and partners and external communities in order to advance scientific and medical understanding including the appropriate development and use of our products; the management of disease; and patient care. It is distinct from promotional activities which may take place only after authorisation of a new product or indication, and must be conducted strictly in accordance with promotional laws, codes and the Group’s Policy.
There are legal, regulatory, financial and reputational risks for the Group if these activities are, or are perceived to be, exceeding their proper boundaries or inappropriately influencing HCPs. In 2012, we paid $3 billion to resolve government investigations in the USA focused in large part on promotional practices.
Commercial practices and scientific engagement Strategic priority: Deliver more products of value. Grow a diversified global company.

GSK Annual Report 2013 239
We are also committed to reporting the results of human subject research used to evaluate our products, regardless of whether the outcomes are perceived to be positive or negative. We believe this is fundamental to the advancement of medical science and helps to inform prescribers and patients about our products. Further, we are committed to making the data publicly available to enable valid scientific research. With respect to human biological samples, we are committed to managing these samples in a manner that respects the rights of research and clinical participants as well as meeting all applicable legal, regulatory and ethical obligations.
We implement controls to help ensure trials are conducted in accordance with the Good Clinical Practice (GCP) guidelines developed by the International Conference on Harmonisation, and based on the principles contained in the World Medical Association Declaration of Helsinki on the Ethical Principles for Medical Research Involving Human Subjects (2013).
We established an Office of Animal Welfare, Ethics and Strategy (OAWES), led by the Chief Animal Welfare, Ethics and Strategy, to help ensure the humane and responsible care of animals and increase the knowledge and application of non-animal alternatives for the Group. OAWES embeds a framework of animal welfare governance, explores opportunities for cross-industry data sharing, creates consistency and metrics for the 3Rs (replacement, refinement, and reduction of animals in research), and conducts quality assessments.
We report the results of our human subject research for our medicines and vaccines on our publicly accessible clinical study register website, on government-required repositories, and we submit human research results as manuscripts for publication in peer reviewed scientific journals. We have committed to expanding the register to include clinical study reports. During 2013, a system was introduced to allow researchers to request access to anonymised patient-level data from the Group’s clinical trials, subject to review for scientific validity by an independent panel and certain other conditions.
We have a Global Human Biological Samples Management (HBSM) governance framework in place to oversee the ethical and lawful acquisition and management of human biological samples. Our global HBSM network champions HBSM activities and provides an experienced group to support internal Sample Custodians on best practice.
Continuing to enhance our data integrity controls remains an important priority. During 2013, scientific data misrepresentation was discovered in relation to a 2010 Nature Medicine publication. We took immediate action to retract the publication. A full analysis of the incident of scientific data misrepresentation discovered in 2013 was undertaken and based on this analysis, improved controls are being implemented across R&D.
The Chief Regulatory Officer oversees the activities of the Regulatory Governance Board which includes promoting compliance with regulatory requirements and Group-wide standards, making regulatory services more efficient and agile, and further aligning regulatory capabilities with our international business needs at the enterprise and local levels.
Risk definitionFailure to protect and inform patients involved in human clinical trial research; conduct objective, ethical preclinical and clinical trials using sound scientific principles; guarantee the integrity of discovery, preclinical, and clinical development data; manage human biological samples according to established ethical standards and regulatory expectations; treat animals ethically and practice good animal welfare; appropriately disclose human subject research for medicinal products; and ensure the integrity of our regulatory filings and of the data that we publish.
Risk impactThe impacts of the risk include harm to patients, reputational damage, failure to obtain the necessary regulatory approvals for our products, governmental investigation, legal proceedings (product liability suits and claims for damages), and regulatory action such as fines, penalties or loss of product authorisation, which could materially and adversely affect our financial results.
ContextResearch relating to animals and humans can raise ethical concerns. While we attempt to proactively address this, animal studies remain a vital part of our research. In many cases, they are the only method that can be used to investigate the effects of a potential new medicine in a living body before it is tested in humans, which is generally mandated by regulators and ethically imperative. Animal research can also provide critical information about the causes of diseases and how they develop. Some countries require additional animal testing even when medicines have been approved for use elsewhere.
Clinical trials in healthy volunteers and patients are used to assess and demonstrate an investigational product’s efficacy and safety or further evaluate the product once it has been approved for marketing. We also work with human biological samples. These samples are fundamental to the discovery, development and safety monitoring of our products.
The integrity of our data is essential to success in all stages of the research data lifecycle: design, generation, recording and management, analysis, reporting and storage and retrieval. Our research data is governed by legislation and regulatory requirements.
Research data and supporting documents are core components at various stages of pipeline progression decision-making and also form the content of regulatory submissions. Poor data integrity can compromise our research efforts.
There are innate complexities and interdependencies required for regulatory filings, particularly given our global research and development footprint. Currently, rapid changes in submission requirements in developing countries are increasing the complexity of meeting regulatory requirements.
Mitigating activitiesWe proactively address ethical concerns raised by research relating to animals and humans by being transparent about our practices and regularly engaging with academics, scientists, regulators, policymakers, industry colleagues and other stakeholders to request advice or help ensure best practice. We are committed to acting ethically, providing for the animals’ health and well-being, reducing the number of animals and finding alternatives to the use of animals.
Strategic priorities: Deliver more products of value. Grow a diversified global company.Research practices

240 GSK Annual Report 2013
Investor information Principal risks and uncertainties
Mitigating activitiesManagement of EHSS risk is fundamental to our performance and reputation. We are committed to appropriately managing EHSS risk and have embedded its importance into our mission to improve the quality of human life by enabling people to do more, feel better, live longer.
We operate rigorous procedures that help us eliminate hazards where practicable and protect employees’ health and well-being, but the right culture is our essential starting point. Our employment practices are designed to create a work place culture in which all employees feel valued, respected, empowered and inspired to achieve our goals.
Through our continuing efforts to improve environmental sustainability we have reduced water consumption, hazardous waste, and energy consumption. We actively manage our environmental remediation obligations to help ensure practices are environmentally sustainable and compliant.
Our EHSS performance results are shared with the public each year in our Corporate Responsibility Report.
Risk definitionFailure to ethically manage environment, health and safety and sustainability (EHSS) consistent with the Group’s objectives, policies and relevant laws and regulations.
Risk impactFailure to manage EHSS risks could lead to significant harm to people, the environment and communities in which we operate, fines, failure to meet stakeholder expectations and regulatory requirements, litigation or regulatory action and could materially and adversely affect our financial results.
ContextThe Group is subject to health, safety and environmental laws of various jurisdictions. These laws impose actual and potential obligations to remediate contaminated sites. We have also been identified as a potentially responsible party under the US Comprehensive Environmental Response Compensation and Liability Act at a number of sites for remediation costs relating to our use or ownership of such sites.
Failure to manage these environmental risks properly could result in litigation, regulatory action and additional remedial costs that may materially and adversely affect our financial results. See Note 44 to the financial statements, ‘Legal proceedings’, for a discussion of the environmental related proceedings in which we are involved. We routinely accrue amounts related to our liabilities for such matters.
Mitigating activitiesThe Group has a global information protection policy that is supported through a dedicated programme of activity. To increase our focus on information security, the Group established the Office of the Chief Information Security Officer to provide strategy, direction, and oversight while enhancing our global information security capabilities.
We assess changes in our information protection risk environment through briefings by government agencies, subscription to commercial threat intelligence services and knowledge sharing with other Pharmaceutical and cross-industry companies.
We aim to use industry best practices as part of our information security policies, processes and technologies and invest in strategies that are commensurate with the changing nature of the security threat landscape.
We are also subject to various laws that govern the processing of Personally Identifiable Information (Pll). To help ensure compliance with cross-border PII transfer requirements, the Group’s Binding Corporate Rules (BCRs) have been approved by the UK Information Commissioner’s Office for human resource and research activities data. BCRs make it possible to transfer PII internationally between the Group’s entities without individual privacy agreements in each European Union country.
Risk definitionRisk to the Group’s business activity if critical or sensitive computer systems or information are not available when needed, are accessed by those not authorised, or are deliberately changed or corrupted.
Risk impactFailure to adequately protect critical and sensitive systems and information may result in our inability to maintain patent rights, loss of commercial or strategic advantage, damage to our reputation or business disruption including litigation or regulatory sanction and fines, which could materially and adversely affect our financial results.
ContextWe rely on critical and sensitive systems and data, such as corporate strategic plans, sensitive personally identifiable information, intellectual property, manufacturing systems and trade secrets. There is the potential that malicious or careless actions expose our computer systems or information to misuse or unauthorised disclosure.
Strategic priorities: Grow a diversified global company.Environment, health and safety and sustainability
Strategic priorities: Simplify the operating model.Information protection

GSK Annual Report 2013 241
Mitigating activitiesThe Group has in place crisis management and business continuity plans over all critical business operations. These plans include authorised response and recovery strategies, key areas of responsibility and clear communication plans. We have established a CCM governance board with representatives from across the Group to provide vital information to the CCM programme team regarding new threats, acquisitions or significant business or organisational changes.
A dedicated team of CCM experts supports the business. Their responsibilities include: Coordinating crisis management and business continuity training; facilitating exercises and monitoring to provide for global consistency and alignment; and centrally storing and monitoring plan updates for crisis management plans and business continuity plans supporting our critical business processes to help ensure an appropriate level of readiness and response capability is maintained. We also develop and maintain partnerships with external bodies like the Business Continuity Institute and the UN International Strategy for Disaster Risk Reduction which helps improve our business continuity initiatives in disaster prone areas.
We continually improve training programmes and tools based on learning from plan activations. For example, in-depth video case studies were created to share lessons learned from how we responded to the 2011 Japan Earthquake and the 2012 US super-storm Sandy. We regularly evaluate and introduce new tools to improve our CCM practices.
Risk definitionInability to recover and sustain critical operations following a disruption or to respond to a crisis incident in a timely manner regardless of cause.
Risk impactFailure to manage crisis and continuity management (CCM) effectively can lead to prolonged business disruption, greater damage to the Group’s assets, and risk of a medicine’s supply disruption to patients and could materially and adversely affect our financial results. Delays to R&D activities and delivery of our products to consumers and patients who rely on them could also expose us to litigation or regulatory action, materially and adversely affect our financial results and lead to reputational damage.
ContextPatients, consumers and healthcare professionals rely on our products being readily available when needed even in the event of a crisis. Our international operations, and those of our partners, maintain a vast global footprint exposing our people, facilities, operations and information technology to potential disruption resulting from a natural event (eg storm or earthquake), a man-made event (eg civil unrest, terrorism), or a global emergency (eg global public health emergency).
Strategic priorities: Deliver more products of value. Grow a diversified global company.Crisis and continuity management

242 GSK Annual Report 2013
Investor information Shareholder information
Share capital and controlDetails of our issued share capital and the number of shares held in Treasury as at 31 December 2013 can be found in Note 33 to the financial statements, ‘Share capital and share premium account’.
Our shares are listed on the London Stock Exchange and are also quoted on the New York Stock Exchange (NYSE) in the form of American Depositary Shares (ADS). Each ADS represents two Ordinary Shares. For details of listed debt and where it is listed refer to Note 32 to the financial statements, ‘Net debt’.
Holders of Ordinary Shares are entitled to receive dividends (when declared) and the company’s Annual Report, to attend and speak at general meetings of the company, to appoint proxies and to exercise voting rights.
There are no restrictions on the transfer, or limitations on the holding, of Ordinary Shares and no requirements to obtain approval prior to any transfers. No Ordinary Shares carry any special rights with regard to control of the company and there are no restrictions on voting rights. Major shareholders have the same voting rights per share as all other shareholders.
There are no known arrangements under which financial rights are held by a person other than the holder of the shares and no known agreements on restrictions on share transfers or on voting rights.
Shares acquired through our share schemes and plans rank equally with the other shares in issue and have no special rights. The trustees of our Employee Share Ownership Plan trusts have waived their rights to dividends on shares held by those trusts.
Exchange controls and other limitations affecting security holdersOther than certain economic sanctions, which may be in force from time to time, there are currently no applicable laws, decrees or regulations restricting the import or export of capital or affecting the remittance of dividends or other payments to holders of the company’s shares who are non-residents of the UK. Similarly, other than certain economic sanctions which may be in force from time to time, there are no limitations relating only to non-residents of the UK under English law or the company’s Articles of Association on the right to be a holder of, and to vote in respect of, the company’s shares.
Interests in voting rightsOther than as stated below, as far as we are aware, there are no persons with significant direct or indirect holdings in the company. Information provided to the company pursuant to the Financial Conduct Authority’s (FCA) Disclosure and Transparency Rules (DTRs) is published on a Regulatory Information Service and on the company’s website.
At 21 February 2014, the company had received notifications in accordance with the FCA’s DTRs of the following notifiable interests in the voting rights in the company’s issued share capital:
No. of
shares
*Percentage of issued
capital (%)
BlackRock, Inc. 289,405,229 5.96%Invesco Asset Management 178,053,354 3.66%Legal & General Group Plc 162,498,927 3.34%
* Percentage of Ordinary Shares in issue, excluding Treasury shares.
We have not acquired or disposed of any interests in our own shares during the period under review, other than in connection with our share buy-back programme.
Share buy-back programmeThe Board has been authorised to issue and allot Ordinary Shares under Article 9 of the company’s Articles of Association. The power under Article 9 and the authority for the company to make purchases of its own shares are subject to shareholder authorities which are sought on an annual basis at our Annual General Meeting (AGM). Any shares purchased by the company may be cancelled or held as Treasury shares.
During 2013, we continued our long-term buy-back programme and 92 million shares were purchased at a total cost of £1,504 million. No shares were purchased in the period 1 January 2014 to 5 February 2014. In the period 6 February 2014 to 21 February 2014 1.4 million shares were purchased at a cost of £22.4 million.
Our programme covers purchases of shares for cancellation or to be held as Treasury shares, in accordance with the authority renewed by shareholders at the AGM in May 2013, when the company was authorised to purchase a maximum of just under 491 million shares. Details of shares purchased, those cancelled, and those held as Treasury shares are disclosed in Note 33 to the financial statements ‘Share capital and share premium account’.
The exact amount and timing of any future purchases, and the extent to which repurchased shares will be held as Treasury shares rather than being cancelled, will be determined by the company and is dependent on market conditions and other factors.
Market capitalisationThe market capitalisation, based on shares in issue excluding Treasury shares, of GSK at 31 December 2013 was £78.24 billion. At that date, GSK was the fifth largest company by market capitalisation in the FTSE index.
Share price2013
£2012
£2011
£At 1 January 13.35 14.72 12.40At 31 December 16.12 13.35 14.72Increase/(decrease) 20.7% (9.3)% 18.7%High during the year 17.82 15.08 14.74Low during the year 13.35 13.18 11.28
The table above sets out the middle market closing prices. The company’s share price increased by 20.7% in 2013. This compares with an increase in the FTSE 100 index of 14.4% during the year. The share price on 21 February 2014 was £16.81.
15
14
13
12
9
UK£ US$
UK share price (UK£) US ADS price (US$)
01/01/11 31/12/11 31/12/12 31/12/13
11
10
16
17
18
30
35
40
45
50
55
60
65
70
75
Shareholder information

GSK Annual Report 2013 243
Nature of trading market The following tables set out, for the periods indicated, the high and low middle market closing quotations in pence for the shares on the London Stock Exchange, and the high and low closing prices in US dollars for the ADS on the NYSE.
Ordinary SharesPence per share
High Low
February 2014* 1691 1554January 2014 1663 1564December 2013 1620 1549November 2013 1665 1609October 2013 1644 1546September 2013 1672 1558Quarter ended 31 December 2013 1665 1546Quarter ended 30 September 2013 1753 1558Quarter ended 30 June 2013 1782 1520Quarter ended 31 March 2013 1539 1359Quarter ended 31 December 2012 1465 1318Quarter ended 30 September 2012 1508 1409Quarter ended 30 June 2012 1479 1392Quarter ended 31 March 2012 1497 1387Year ended 31 December 2011 1474 1312Year ended 31 December 2010 1340 1095Year ended 31 December 2009 1334 987
ADSUS dollars per ADS
High Low
February 2014* 56.66 50.90January 2014 54.95 51.54December 2013 53.39 51.05November 2013 53.68 51.94October 2013 52.63 49.31September 2013 51.96 50.17Quarter ended 31 December 2013 53.68 49.31Quarter ended 30 September 2013 52.96 50.17Quarter ended 30 June 2013 53.59 46.79Quarter ended 31 March 2013 46.91 43.93Quarter ended 31 December 2012 47.45 41.90Quarter ended 30 September 2012 47.23 44.26Quarter ended 30 June 2012 47.29 43.45Quarter ended 31 March 2012 46.35 43.73Year ended 31 December 2011 45.74 40.53Year ended 31 December 2010 42.97 32.34Year ended 31 December 2009 42.91 27.27
* to 21 February 2014
Number of accounts
% of total accounts
% of total shares
Number of shares
Holding of sharesUp to 1,000 101,131 71.15 0.69 37,275,6431,001 to 5,000 32,682 22.99 1.31 69,879,4545,001 to 100,000 7,184 5.05 1.93 102,952,396100,001 to 1,000,000 781 0.55 5.01 267,493,525Over 1,000,000 367 0.26 91.06 4,864,605,678
142,145 100.00 100.00 5,342,206,696Held byNominee companies 8,235 5.79 70.31 3,756,333,812Investment and trust companies 28 0.02 0.18 9,397,532Insurance companies 9 0.01 0.00 6,598Individuals and other corporate bodies 133,871 94.18 5.20 277,596,502BNY (Nominees) Limited 1 0.00 15.19 811,438,589Held as Treasury shares by GlaxoSmithKline 1 0.00 9.12 487,433,663
142,145 100.00 100.00 5,342,206,696
BNY Mellon is the Depositary for the company’s ADSs, which are listed on the NYSE. Ordinary shares representing the company’s ADR programme, which is managed by the Depositary, are registered in the name of BNY (Nominees) Limited. At 21 February 2014, BNY (Nominees) Limited held 812,080,863 Ordinary Shares representing 16.72% of the issued share capital (excluding Treasury shares) at that date.
At 21 February 2014, the number of holders of shares in the USA was 1,070 with holdings of 1,157,342 shares, and the number of registered holders of ADS was 27,411 with holdings of 406,040,431 ADS. Certain of these shares and ADS were held by brokers or other nominees. As a result, the number of holders of record or registered holders in the USA is not representative of the number of beneficial holders or of the residence of beneficial holders.
Analysis of shareholdings at 31 December 2013

244 GSK Annual Report 2013
Investor information Shareholder information
DividendsThe company pays dividends quarterly. It continues to return cash to shareholders through its dividend policy and ongoing long-term share buy-back programme. Dividends remain an essential component of total shareholder return and the company is committed to increasing its dividend over the long term. Details of the dividends declared, the amounts and the payment dates are given in Note 16 to the financial statements, ‘Dividends’.
Dividends per shareThe table below sets out the dividend per share and per ADS for the last five years. The dividend per ADS is translated into US dollars at applicable exchange rates.
Year Dividend pence US$
2013 78 2.472012 74 2.352011 70 2.252011 Supplemental* 5 0.162010 65 2.042009 61 1.99
* The 2011 supplemental dividend related to the disposal of certain non-core OTC brands in North America. This was paid with the fourth quarter ordinary dividend for 2011.
Dividend calendar
Quarter Ex-dividend date Record date Payment date
Q4 2013 19 February 2014 21 February 2014 10 April 2014Q1 2014 14 May 2014 16 May 2014 10 July 2014Q2 2014 6 August 2014 8 August 2014 2 October 2014Q3 2014 6 November 2014 7 November 2014 8 January 2015
Tax information for shareholdersA summary of certain UK tax and US federal income tax consequences for holders of shares and ADR who are citizens of the UK or the USA is set out below. It is not a complete analysis of all the possible tax consequences of the purchase, ownership or sale of these securities. It is intended only as a general guide. Holders are advised to consult their advisers with respect to the tax consequences of the purchase, ownership or sale of their shares or ADR and the consequences under state and local tax laws in the USA and the implications of the current UK/US tax conventions.
US holders of ADR generally will be treated as the owners of the underlying shares for the purposes of the current USA/UK double taxation conventions relating to income and gains (Income Tax Convention), estate and gift taxes (Estate and Gift Tax Convention), and for purposes of the Internal Revenue Code of 1986, as amended (the Code).
UK shareholdersThis summary only applies to a UK resident shareholder that holds shares as capital assets.
Taxation of dividendsUK resident shareholders will generally be subject to UK income tax on the full amount of dividends paid, grossed up for the amount of a tax credit. The tax credit may be set against the individual’s income tax liability in respect of the gross dividend, but is not repayable to shareholders with a tax liability of less than the associated tax credit. For the tax year 2010-11 and subsequent tax years, an additional rate of income tax on dividends was imposed for taxpayers whose income is above £150,000. UK resident shareholders that are corporation taxpayers should note that dividends are generally entitled to exemption from corporation tax.
Taxation of capital gainsUK shareholders may be liable for UK tax on gains on the disposal of shares or ADR. For disposals by individuals and subject to the availability of any exemption or relief such as the annual exempt amount, a taxable capital gain accruing on a disposal of shares or ADR will be taxed at 28% if, after all allowable deductions, such shareholder’s taxable income for the tax year exceeds the basic rate income tax limit. In other cases, a taxable capital gain accruing on a disposal of shares or ADR may be taxed at 18% or 28% or at a combination of both rates. Corporation taxpayers may be entitled to an indexation allowance which applies to reduce capital gains to the extent that such gains arise due to inflation. Indexation allowance may reduce a chargeable gain but will not create an allowable loss.
Inheritance taxIndividual shareholders may be liable to inheritance tax on the transfer of shares or ADR. Tax may be charged on the amount by which the value of the shareholder’s estate is reduced as a result of any transfer by way of gift or other disposal at less than full market value. If such a gift or other disposal were subject to both UK inheritance tax and US estate or gift tax, the Estate and Gift Tax Convention would generally provide for tax paid in the USA to be credited against tax payable in the UK.
Stamp dutyUK stamp duty or stamp duty reserve tax (SDRT) will, subject to certain exemptions, be payable on the transfer of shares at a rate of 0.5% of the consideration for the transfer.

GSK Annual Report 2013 245
US shareholdersThis summary only applies to a shareholder (who is a citizen or resident of the USA or a domestic corporation or a person that is otherwise subject to US federal income tax on a net income basis in respect of the shares or ADR) that holds shares or ADR as capital assets, is not resident in the UK for UK tax purposes and does not hold shares for the purposes of a trade, profession or vocation that is carried on in the UK through a branch or agency.
The summary also does not address the tax treatment of holders that are subject to special tax rules, such as banks, tax-exempt entities, insurance companies, dealers in securities or currencies, persons that hold shares or ADR as part of an integrated investment (including a ‘straddle’) comprised of a share or ADR and one or more other positions, and persons that own (directly or indirectly) 10% or more of the voting stock of the company.
Taxation of dividendsThe gross amount of dividends received is treated as foreign source dividend income for US tax purposes. It is not eligible for the dividend received deduction allowed to US corporations. Dividends on ADR are payable in US dollars; dividends on shares are payable in pounds Sterling. Dividends paid in pounds Sterling will be included in income in the US dollar amount calculated by reference to the exchange rate on the day the dividends are received by the holder. Subject to certain exceptions for short-term or hedged positions, an individual eligible US holder will be subject to US taxation at a maximum rate of 23.8% in respect of qualified dividends.
Taxation of capital gainsGenerally, US holders will not be subject to UK capital gains tax, but will be subject to US tax on capital gains realised on the sale or other disposal of shares or ADR. Such gains will be long-term capital gains (subject to reduced rates of taxation for individual holders) if the shares or ADR were held for more than one year.
Information reporting and backup withholdingDividends and payments of the proceeds on a sale of shares or ADR, paid within the USA or through certain US-related financial intermediaries are subject to information reporting and may be subject to backup withholding unless the US holder is a corporation or other exempt recipient or provides a taxpayer identification number and certifies that no loss of exemption has occurred. Non-US holders generally are not subject to information reporting or backup withholding, but may be required to provide a certification of their non-US status in connection with payments received. Any amounts withheld will be allowed as a refund or credit against a holder’s US federal income tax liability provided the required information is furnished to the Internal Revenue Service.
Estate and gift taxesUnder the Estate and Gift Tax Convention, a US shareholder is not generally subject to UK inheritance tax.
Stamp dutyUK stamp duty or SDRT will, subject to certain exemptions, be payable on any transfer of shares to the ADR custodian or depository at a rate of 1.5% of the amount of any consideration provided (if transferred on sale), or their value (if transferred for no consideration).
No SDRT would be payable on the transfer of, or agreement to transfer an ADR. No UK stamp duty should be payable on the transfer of an ADR provided that any instrument of transfer is executed and remains at all times outside the UK. Any stamp duty on the transfer of an ADR would be payable at a rate of 0.5% of the consideration for the transfer. Any sale of the underlying shares would, subject to certain exceptions, result in liability to UK stamp duty or, as the case may be, SDRT at a rate of 0.5%.
Annual General Meeting 20142.30pm (UK) on Wednesday, 7 May 2014 The Queen Elizabeth II Conference Centre, Broad Sanctuary, Westminster, London SW1P 3EE
The AGM is the company’s principal forum for communication with private shareholders. In addition to the formal business, there will be a presentation by the CEO on the performance of the Group and its future development. There will be an opportunity for questions to be asked to the Board. Chairmen of the Board’s Committees will take questions relating to those Committees.
Investors holding shares through a nominee service should arrange with that nominee service to be appointed as a proxy in respect of their shareholding in order to attend and vote at the meeting.
ADR holders wishing to attend the meeting must obtain a proxy from BNY Mellon. This will enable them to attend and vote on the business to be transacted. ADR holders may instruct BNY Mellon as to the way in which the shares represented by their ADR should be voted by completing and returning the voting card provided by the bank.
Documents on displayThe Articles of Association of the company and other documents referred to in this Annual Report are available for inspection at the company’s registered office and on our website and will be made available for inspection at the AGM.
246 GSK Annual Report 2013
Investor information Shareholder information
Financial reporting calendarPublication Date
Results announcements Quarter 1 April 2014 Quarter 2 July 2014 Quarter 3 October 2014 Preliminary/Quarter 4 February 2015Annual Report/Summary February/March 2015
Results announcementsResults announcements are issued to the London Stock Exchange and are available on its news service. They are also sent to the US Securities and Exchange Commission and the NYSE, issued to the media and made available on our website.
Financial reports The company publishes an Annual Report and, for the shareholder not needing the full detail of the Annual Report, a Summary. These documents are available on our website from the date of publication. The Summary is sent to all shareholders. Shareholders may elect to receive the Annual Report by contacting the registrar. Alternatively, shareholders may elect to receive notification by email of the publication of financial reports by registering on www.shareview.co.uk.
Copies of previous financial reports are available on our website. Printed copies can be obtained from our registrar in the UK and from the GSK Response Center in the USA, (see pages 249 and 250 for the contact details).
Donations to political organisations and political expenditureWith effect from 1 January 2009, to ensure a consistent approach to political contributions across the Group, we introduced a global policy to stop voluntarily all corporate political contributions.
In the period from 1 January 2009 to 31 December 2013, the Group did not make any political donations to EU or non-EU organisations.
Notwithstanding the introduction of this policy, in accordance with the Federal Election Campaign Act in the USA, we continue to support an employee-operated Political Action Committee (PAC) that facilitates voluntary political donations by eligible GSK employees.
The PAC is not controlled by GSK. Decisions on the amounts and recipients of contributions are made by participating employees exercising their legal right to pool their resources and make political contributions, which are subject to strict limitations. In 2013, a total of US$484,810 (US$565,630 in 2012) was donated to political organisations by the GSK employee PAC.
At the AGM in May 2001, shareholders first authorised the company to make donations to EU political organisations and to incur EU political expenditure, under the provisions of the Political Parties, Elections and Referendums Act 2000, of up to £100,000 each year. This authority has since been renewed annually. The Companies Act 2006 requires companies to continue to obtain shareholder approval before they can make donations to EU political organisations or incur EU political expenditure.
However, we do not make and do not intend to make donations to political parties or independent election candidates, nor do we make any donations to EU political organisations or incur EU political expenditure.
The definitions of political donations, political expenditure and political organisations used in the legislation are very wide. In particular, the definition of EU political organisations may extend to bodies such as those concerned with policy review, law reform, the representation of the business community and special interest groups such as those concerned with the environment, which the company and its subsidiaries might wish to support. As a result, the definitions may cover legitimate business activities not in the ordinary sense considered to be political donations or political expenditure.
Such activities are not designed to support any political party or independent election candidate. The authority which the Board has sought annually is a precautionary measure to ensure that the company and its subsidiaries do not inadvertently breach the legislation.
DirectorsOur Directors’ powers are determined by UK legislation and our Articles of Association, which are available on our website. The Articles may be amended by a special resolution of the members. The Directors may exercise all the company’s powers provided that the Articles or applicable legislation do not stipulate that any such powers must be exercised by the members.
The rules about the appointment and replacement of Directors are contained in our Articles. They provide that Directors may be appointed by an ordinary resolution of the members or by a resolution of the Directors, provided that, in the latter instance, a Director appointed in this way retires at the first AGM following his or her appointment.
Our Articles also provide that Directors should normally be subject to re-election at the AGM at intervals of three years or annually if they have held office for a continuous period of nine years or more. However, the Board agreed in 2011 that all Directors who wish to continue as members of the Board should seek re-election annually in accordance with the UK Corporate Governance Code. Members may remove a Director by passing an ordinary resolution of which special notice has been given, or by passing a special resolution.
A Director may automatically cease to be a Director if:
• he or she becomes bankrupt or compounds with his or her creditors generally
• he or she ceases to be a Director by virtue of the Companies Act or the Articles
• he or she is suffering from mental or physical ill health and the Board resolves that he or she shall cease to be a Director
• he or she has missed Directors’ meetings for a continuous period of six months without permission and the Board resolves that he or she shall cease to be a Director
• he or she is prohibited from being a Director by law
• he or she resigns
• he or she offers to resign and the Board accepts that offer
• all other Directors (being at least three in number) require him or her to resign.

GSK Annual Report 2013 247
Directors’ conflicts of interestAll Directors have a duty under the Companies Act 2006 to avoid a situation in which they have, or could have, a direct or indirect conflict of interest or possible conflict with the company. The duty applies, in particular, to the exploitation of any property, information or opportunity whether or not the company could take advantage of it. Our Articles provide a general power for the Board to authorise such conflicts.
The Nominations Committee has been authorised by the Board to grant and periodically, but in any event annually, to review any potential or actual conflict authorisations. Directors are not counted in the quorum for the authorisation of their own actual or potential conflicts. Authorisations granted are recorded by the Company Secretary in a register and are noted by the Board at its next meeting.
On an ongoing basis, the Directors are responsible for informing the Company Secretary of any new actual or potential conflicts that may arise or if there are any changes in circumstances that may affect an authorisation previously given. Even when provided with authorisation, a Director is not absolved from his or her statutory duty to promote the success of the company. If an actual conflict arises post-authorisation, the Board may choose to exclude the Director from receipt of the relevant information and participation in the debate, or suspend the Director from the Board, or, as a last resort, require the Director to resign.
The Nominations Committee reviewed the register of potential conflict authorisations in October 2013 and reported to the Board that the conflicts had been appropriately authorised and that the process for authorisation continues to operate effectively. Except as described in Note 35 to the financial statements, ‘Related party transactions’, during or at the end of the financial year no Director or connected person had any material interest in any contract of significance with a Group company.
Independent adviceThe Board recognises that there may be occasions when one or more of the Directors feel it is necessary to take independent legal and/or financial advice at the company’s expense. There is an agreed procedure, which is set out on our website, to enable them to do so.
Indemnification of DirectorsQualifying third party indemnity provisions (as defined in the Companies Act 2006) are in force for the benefit of Directors and former Directors who held office during 2013 and up to the signing of the Annual Report.
Change of control and essential contractsWe do not have contracts or other arrangements which individually are fundamental to the ability of the business to operate effectively, nor is the company party to any material agreements that would take effect, be altered, or terminate upon a change of control following a takeover bid. We do not have agreements with any Director that would provide compensation for loss of office or employment resulting from a takeover, except that provisions of the company’s share plans may cause options and awards granted under such plans to vest on a takeover. Details of the termination provisions in the company’s framework for contracts for Executive Directors are given on pages 122 and 123.
US law and regulationA number of provisions of US law and regulation apply to the company because our shares are quoted on the New York Stock Exchange (NYSE) in the form of ADS.
NYSE rulesIn general, the NYSE rules permit the company to follow UK corporate governance practices instead of those applied in the USA, provided that we explain any significant variations. This explanation is contained in our Form 20-F filing, which can be accessed from the Securities and Exchange Commission’s (SEC) EDGAR database or via our website. NYSE rules that came into effect in 2005 require us to file annual and interim written affirmations concerning the Audit & Risk Committee and our statement on significant differences in corporate governance.
Sarbanes-Oxley Act of 2002Following a number of corporate and accounting scandals in the USA, Congress passed the Sarbanes-Oxley Act of 2002. Sarbanes-Oxley is a wide-ranging piece of legislation concerned largely with financial reporting and corporate governance.
As recommended by the SEC, the company has established a Disclosure Committee. The Committee reports to the CEO, the CFO and to the Audit & Risk Committee. It is chaired by the Company Secretary and the members consist of senior managers from finance, legal, corporate communications and investor relations.
External legal counsel, the external auditors and internal experts are invited to attend its meetings periodically. It has responsibility for considering the materiality of information and, on a timely basis, determining the disclosure of that information. It has responsibility for the timely filing of reports with the SEC and the formal review of the Annual Report and Form 20-F. In 2013, the Committee met 10 times.
Sarbanes-Oxley requires that the Annual Report contains a statement as to whether a member of our Audit & Risk Committee (ARC) is an audit committee financial expert as defined by Sarbanes-Oxley. Such a statement for each of the relevant members of the ARC (Stacey Cartwright, Judy Lewent and Tom de Swaan) is included in the Audit & Risk Committee report on page 89. Additional disclosure requirements arise under section 302 and section 404 of Sarbanes-Oxley in respect of disclosure controls and procedures and internal control over financial reporting.

248 GSK Annual Report 2013
Investor information Shareholder information
Section 302: Corporate responsibility for financial reportsSarbanes-Oxley also introduced a requirement for the CEO and the CFO to complete formal certifications, confirming that:
• they have each reviewed the Annual Report and Form 20-F
• based on their knowledge, the Annual Report and Form 20-F contains no material misstatements or omissions
• based on their knowledge, the financial statements and other financial information fairly present, in all material respects, the financial condition, results of operations and cash flows as of the dates, and for the periods, presented in the Annual Report and Form 20-F
• they are responsible for establishing and maintaining disclosure controls and procedures that ensure that material information is made known to them, and have evaluated the effectiveness of these controls and procedures as at the year-end, the results of such evaluation being contained in the Annual Report and Form 20-F
• they are responsible for establishing and maintaining internal control over financial reporting that provides reasonable assurance regarding the reliability of financial reporting and the preparation of financial statements for external purposes in accordance with generally accepted accounting principles
• they have disclosed in the Annual Report and Form 20-F any changes in internal controls over financial reporting during the period covered by the Annual Report and Form 20-F that have materially affected, or are reasonably likely to affect materially, the company’s internal control over financial reporting, and they have disclosed, based on their most recent evaluation of internal control over financial reporting, to the external auditors and the ARC, all significant deficiencies and material weaknesses in the design or operation of internal controls over financial reporting which are reasonably likely to affect adversely the company’s ability to record, process, summarise and report financial information, and any fraud (regardless of materiality) involving persons that have a significant role in the company’s internal control over financial reporting.
The Group has carried out an evaluation under the supervision and with the participation of its management, including the CEO and CFO, of the effectiveness of the design and operation of the Group’s disclosure controls and procedures as at 31 December 2013.
There are inherent limitations to the effectiveness of any system of disclosure controls and procedures, including the possibility of human error and the circumvention or overriding of the controls and procedures. Accordingly, even effective disclosure controls and procedures can only provide reasonable assurance of achieving their control objectives.
The CEO and CFO expect to complete these certifications and report their conclusions on the effectiveness of disclosure controls and procedures in February 2014, following which the certificates will be filed with the SEC as part of the Group’s Form 20-F.
Section 404: Management’s annual report on internal control over financial reportingIn accordance with the requirements of section 404 of Sarbanes-Oxley, the following report is provided by management in respect of the company’s internal control over financial reporting (as defined in Rules 13a-15(f) and 15d-15(f) under the US Securities Exchange Act of 1934):
• management is responsible for establishing and maintaining adequate internal control over financial reporting for the Group. Internal control over financial reporting is designed to provide reasonable assurance regarding the reliability of financial reporting and the preparation of financial statements for external purposes in accordance with IFRS
• management conducted an evaluation of the effectiveness of internal control over financial reporting based on the framework, Internal Control – Integrated Framework (1992) issued by the Committee of Sponsoring Organisations of the Treadway Commission
• there have been no changes in the Group’s internal control over financial reporting during 2013 that have materially affected, or are reasonably likely to affect materially, the Group’s internal control over financial reporting
• management has assessed the effectiveness of internal control over financial reporting as at 31 December 2013 and its conclusion will be filed as part of the Group’s Form 20-F, and
PricewaterhouseCoopers LLP, which has audited the consolidated financial statements of the Group for the year ended 31 December 2013, has also assessed the effectiveness of the Group’s internal control over financial reporting under Auditing Standard No. 5 of the Public Company Accounting Oversight Board (United States). Their audit report will be filed with the Group’s Form 20-F.
Section 13(r) of the US Securities Exchange ActSection 13(r) of US Securities Exchange Act of 1934, as amended, requires issuers to make specific disclosure in their Annual Reports of certain types of dealings with Iran, including transactions or dealings with government-owned entities, as well as dealings with entities sanctioned for activities related to terrorism or proliferation of weapons of mass destruction, even when those activities are not prohibited by US law and do not involve US persons. The Group does not have a legal entity based in Iran, but it does export certain pharmaceutical and vaccine products from its Pharmaceuticals and Vaccines businesses to Iran, via sales by non-US entities, to two privately held Iranian distributors and a distributor in the UAE. The Group also does business, via non-US entities, in other jurisdictions targeted by sanctions laws, including Cuba, Syria, and Sudan. We do not believe that any of the Group’s direct dealings with Iran require specific disclosure under these requirements, and the Group’s policies limit sales to Iran to products of high medical/public health need (determined in part using criteria set by the World Health Organization). The Group has no direct knowledge of the identity of its distributors’ downstream customers, and it is possible that these customers include entities, such as government-owned hospitals and pharmacies, that are owned or controlled directly or indirectly by the Iranian government or by persons or entities sanctioned in connection with terrorism or proliferation activities. Because the Group has no direct knowledge of its distributors’ customers, it cannot establish the proportion of gross revenue or sales potentially attributable to entities affiliated with the Iranian government or parties sanctioned for disclosable activities. As a result, the Group is reporting the entire gross revenues (£11.3 million) and net profits (£4.2 million) from the Group’s sales to Iran in 2013.
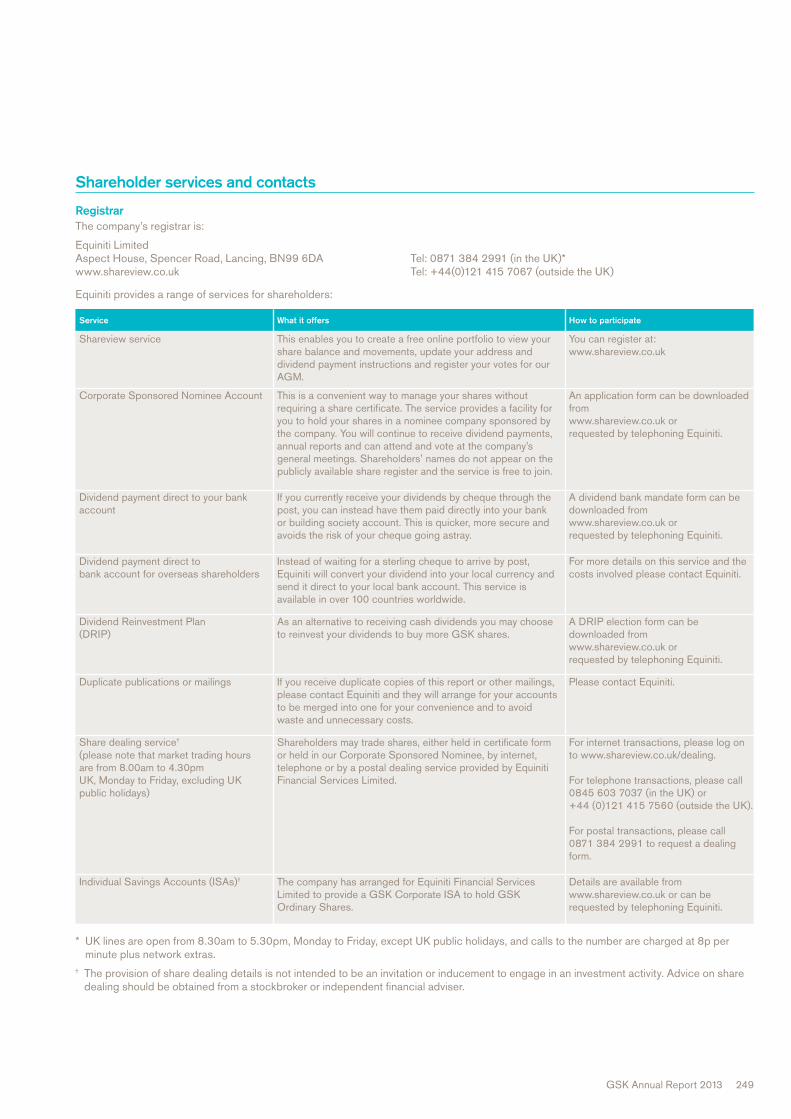
GSK Annual Report 2013 249
Shareholder services and contacts
RegistrarThe company’s registrar is:
Equiniti Limited Aspect House, Spencer Road, Lancing, BN99 6DA Tel: 0871 384 2991 (in the UK)*www.shareview.co.uk Tel: +44(0)121 415 7067 (outside the UK)
Equiniti provides a range of services for shareholders:
Service What it offers How to participate
Shareview service This enables you to create a free online portfolio to view your share balance and movements, update your address and dividend payment instructions and register your votes for our AGM.
You can register at:www.shareview.co.uk
Corporate Sponsored Nominee Account This is a convenient way to manage your shares without requiring a share certificate. The service provides a facility for you to hold your shares in a nominee company sponsored by the company. You will continue to receive dividend payments, annual reports and can attend and vote at the company’s general meetings. Shareholders’ names do not appear on the publicly available share register and the service is free to join.
An application form can be downloaded from www.shareview.co.uk or requested by telephoning Equiniti.
Dividend payment direct to your bank account
If you currently receive your dividends by cheque through the post, you can instead have them paid directly into your bank or building society account. This is quicker, more secure and avoids the risk of your cheque going astray.
A dividend bank mandate form can be downloaded from www.shareview.co.uk or requested by telephoning Equiniti.
Dividend payment direct to bank account for overseas shareholders
Instead of waiting for a sterling cheque to arrive by post, Equiniti will convert your dividend into your local currency and send it direct to your local bank account. This service is available in over 100 countries worldwide.
For more details on this service and the costs involved please contact Equiniti.
Dividend Reinvestment Plan (DRIP)
As an alternative to receiving cash dividends you may choose to reinvest your dividends to buy more GSK shares.
A DRIP election form can be downloaded from www.shareview.co.uk or requested by telephoning Equiniti.
Duplicate publications or mailings If you receive duplicate copies of this report or other mailings, please contact Equiniti and they will arrange for your accounts to be merged into one for your convenience and to avoid waste and unnecessary costs.
Please contact Equiniti.
Share dealing service†
(please note that market trading hours are from 8.00am to 4.30pm UK, Monday to Friday, excluding UK public holidays)
Shareholders may trade shares, either held in certificate form or held in our Corporate Sponsored Nominee, by internet, telephone or by a postal dealing service provided by Equiniti Financial Services Limited.
For internet transactions, please log on to www.shareview.co.uk/dealing.
For telephone transactions, please call 0845 603 7037 (in the UK) or +44 (0)121 415 7560 (outside the UK).
For postal transactions, please call 0871 384 2991 to request a dealing form.
Individual Savings Accounts (ISAs)† The company has arranged for Equiniti Financial Services Limited to provide a GSK Corporate ISA to hold GSK Ordinary Shares.
Details are available from www.shareview.co.uk or can be requested by telephoning Equiniti.
* UK lines are open from 8.30am to 5.30pm, Monday to Friday, except UK public holidays, and calls to the number are charged at 8p per minute plus network extras.
† The provision of share dealing details is not intended to be an invitation or inducement to engage in an investment activity. Advice on share dealing should be obtained from a stockbroker or independent financial adviser.

250 GSK Annual Report 2013
Investor information Shareholder information
ADR Depositary
The ADR programme is administered by:
BNY Mellon Shareowner Services PO Box 30170 College Station, TX 77842-3170
Overnight correspondence should be sent to: BNY Mellon Shareowner Services 211 Quality Circle, Suite 210 College Station, TX 77845www.bnymellon.com/shareownerTel: 1 877 353 1154 (US toll free) Tel: +1 201 680 6825 (outside the USA) email: [email protected]
The Depositary also provides Global BuyDIRECT†, a direct ADS purchase/sale and dividend reinvestment plan for ADR holders. For details of how to enrol please visit www.mbnymdr.com or call the above helpline number to obtain an enrolment pack.
Glaxo Wellcome and SmithKline Beecham Corporate PEPsThe Share Centre Limited Oxford House, Oxford Road, Aylesbury, Bucks HP21 8SZ Tel: +44 (0)1296 414 141
Donating shares to Save the ChildrenIn 2013, GSK embarked on an ambitious global partnership with Save the Children to share our expertise and resources with the aim of helping to save the lives of one million children.
The GSK and Save the Children partnership will focus in particular on:
• developing child-friendly medicines to reduce child mortality and new-born deaths
• widening vaccination coverage to reduce the number of child deaths in the hardest to reach communities
• researching new affordable nutritional products to help alleviate malnutrition in children
• increasing investment in the training, reach and scope of health workers in the poorest communities to help reduce child mortality
Shareholders with a small number of shares, the value of which makes it uneconomical to sell, may wish to consider donating them to Save the Children. Donated shares will be aggregated and sold by Save the Children who will use the funds raised to help them reach the above goal.†
To obtain a share donation form, please contact our registrar, Equiniti, who is managing the donation and sale of UK shares to Save the Children free of charge.
† The provision of share dealing details is not intended to be an invitation or inducement to engage in an investment activity. Advice on share dealing should be obtained from a stockbroker or independent financial adviser.
Share scam alertIf you receive an unsolicited telephone call offering to sell or buy your shares, please take extra care. The caller may be part of a highly organised financial scam.
If you are a UK shareholder, please contact the Financial Conduct Authority for further information on this, or other similar activities, on its consumer helpline:Tel: 0845 606 1234 (in the UK)Lines are open from 8.00am to 6.00pm, UK time, Monday to Friday, except UK public holidays.
Corporate Responsibility ReportWe are publishing our Corporate Responsibility Report 2013 online. This will outline GSK’s approach to, and performance in, our key corporate responsibility areas, Health for all, Our behaviour, Our people and Our planet.
InternetInformation about the company, including the share price, is available on our website at www.gsk.com. Information made available on the website does not constitute part of this Annual Report.
Contacts
GSK Response CenterTel: 1 888 825 5249 (US toll free)
Investor relationsInvestor relations may be contacted as follows:
UK980 Great West Road, Brentford Middlesex TW8 9GS Tel: +44 (0)20 8047 5000
USA Five Crescent Drive Philadelphia PA 19112 Tel: 1 888 825 5249 (US toll free) Tel: +1 215 751 4000 (outside the USA)

GSK Annual Report 2013 251
Glossary of terms
Terms used in the Annual Report US equivalent or brief description
Accelerated capital allowances Tax allowance in excess of depreciation arising from the purchase of fixed assets that delay the charging and payment of tax. The equivalent of tax depreciation.
American Depositary Receipt (ADR) Receipt evidencing title to an ADS. Each GlaxoSmithKline ADR represents two Ordinary Shares.
American Depositary Shares (ADS) Listed on the New York Stock Exchange; represents two Ordinary Shares.
Basic earnings per share Basic income per share.
Called up share capital Ordinary Shares, issued and fully paid.
CER growth Growth at constant exchange rates.
The company GlaxoSmithKline plc.
Corporate Integrity Agreement (CIA) In 2012, the company entered into a settlement with the US Federal Government related to past sales and marketing practices. As part of the settlement the company entered into a Corporate Integrity Agreement with the US Department of Health and Human Services, under which improvements are being built into its existing compliance programmes.
Currency swap An exchange of two currencies, coupled with a subsequent re-exchange of those currencies, at agreed exchange rates and dates.
Defined benefit plan Pension plan with specific employee benefits, often called ‘final salary scheme’.
Defined contribution plan Pension plan with specific contributions and a level of pension dependent upon the growth of the pension fund.
Derivative financial instrument A financial instrument that derives its value from the price or rate of some underlying item.
Diluted earnings per share Diluted income per share.
Employee Share Ownership Plan Trusts Trusts established by the Group to satisfy share-based employee incentive plans.
Equity Shareholders’ funds Shareholders’ equity.
Finance lease Capital lease.
Freehold Ownership with absolute rights in perpetuity.
Gearing ratio Net debt as a percentage of total equity.
The Group GlaxoSmithKline plc and its subsidiary undertakings.
GSK GlaxoSmithKline plc and its subsidiary undertakings.
Hedging The reduction of risk, normally in relation to foreign currency or interest rate movements, by making off-setting commitments.
Intangible fixed assets Assets without physical substance, such as computer software, brands, licences, patents, know-how and marketing rights purchased from outside parties.
Profit Income.
Profit attributable to shareholders Net income.
Share capital Ordinary Shares, capital stock or common stock issued and fully paid.
Share option Stock option.
Share premium account Additional paid-up capital or paid-in surplus (not distributable).
Shares in issue The number of shares outstanding.
Subsidiary An entity in which GlaxoSmithKline exercises control.
Treasury share Treasury stock.
Turnover Revenue.
UK Corporate Governance Code As required by the UK Listing Authority, the company has disclosed in the Annual Report how it has applied the best practice corporate governance provisions of the Financial Reporting Council’s UK Corporate Governance Code.

252 GSK Annual Report 2013
Investor information Index
Index
Accounting principles and policies 136Acquisitions and disposals 181Adjustments reconciling profit after tax to operating cash flows 179Annual General Meeting 245Assets held for sale 163Associates and joint ventures 151Board 76Cash and cash equivalents 163Chairman’s statement 2Chief Executive’s review 4Commitments 187Committee reports 88Competition 11Consolidated balance sheet 133Consolidated cash flow statement 135Consolidated income statement 132Consolidated statement of changes in equity 134Consolidated statement of comprehensive income 132Consumer Healthcare products and competition 11Contingent liabilities 174Corporate Executive Team 80 Corporate governance 82Critical accounting policies 67Directors and senior management 116Directors’ interests in shares 110Directors’ statement of responsibilities 128Dividends 154Donations to political organisations and political expenditure 246Earnings per share 154Employee costs 149Employee share schemes 198Employees 54Exchange rates 142Executive Director remuneration 97Finance expense 151Finance income 150Financial instruments and related disclosures 188Financial position and resources 69Financial review 58Financial statements of GlaxoSmithKline plc, prepared under UK GAAP 211Five year record 222Glossary of terms 251Goodwill 157Independent Auditors’ report 129Intellectual property and trademarks 157Inventories 162Investments in associates and joint ventures 161
Investor relations 250Key accounting judgements and estimates 140Key performance indicators 16Late-stage pipeline summary 43Legal proceedings 204Long-term Incentive plans 100Major restructuring costs 150Movements in equity 177Net debt 174New accounting requirements 142Non-Executive Directors’ fees 109Notes to the financial statements 136Operating profit 148Other intangible assets 159Other investments 162Other non-current assets 162Other non-current liabilities 173Other operating income 147Other provisions 172Outlook 15Pensions and other post-employment benefits 164Pharmaceutical products, competition and intellectual property 229Pipeline 225Presentation of the financial statements 136Principal Group companies 202Property, plant and equipment 155Quarterly trend 218Reconciliation of net cash flow to movement in net debt 180Registrar 249Related party transactions 179 Relations with shareholders 88Remuneration policy report 117Remuneration Report 96Research and development 32Responsible business 50Risk factors 232Segment information 143Segment reviews 22Share capital and control 242Share capital and share premium account 176Share price 242Shareholder information 242Strategy 14Taxation 152Taxation information for shareholders 244The Remuneration Committee 107Trade and other payables 164Trade and other receivables 163US law and regulation 247
Page Page
About GSK
GlaxoSmithKline plc was incorporated as an English public limited company on 6 December 1999. We were formed by a merger between Glaxo Wellcome plc and SmithKline Beecham plc. GSK acquired these two English companies on 27 December 2000 as part of the merger arrangements.
Our shares are listed on the London Stock Exchange and the New York Stock Exchange.
Notice regarding limitations on Director Liability under English Law
Under the UK Companies Act 2006, a safe harbour limits the liability of Directors in respect of statements in and omissions from the Directors’ Report (for which see page 95), the Strategic Report (pages 2 to 74) and the Remuneration Report (pages 96 to 126). Under English law the Directors would be liable to the company, but not to any third party, if one or more of these reports contained errors as a result of recklessness or knowing misstatement or dishonest concealment of a material fact, but would not otherwise be liable.
Website
GlaxoSmithKline’s website www.gsk.com gives additional information on the Group. Notwithstanding the references we make in this Annual Report to GlaxoSmithKline’s website, none of the information made available on the website constitutes part of this Annual Report or shall be deemed to be incorporated by reference herein.
Cautionary statement regarding forward-looking statements
The Group’s reports filed with or furnished to the US Securities and Exchange Commission (SEC), including this document and written information released, or oral statements made, to the public in the future by or on behalf of the Group, may contain forward-looking statements. Forward-looking statements give the Group’s current expectations or forecasts of future events. An investor can identify these statements by the fact that they do not relate strictly to historical or current facts. They use words such as ‘anticipate’, ‘estimate’, ‘expect’, ‘intend’, ‘will’, ‘project’, ‘plan’, ‘believe’ and other words and terms of similar meaning in connection with any discussion of future operating or financial performance. In particular, these include statements relating to future actions, prospective products or product approvals, future performance or results of current and anticipated products, sales efforts, expenses, the outcome of contingencies such as legal proceedings, and financial results. The Group undertakes no obligation to update any forward-looking statements, whether as a result of new information, future events or otherwise. Forward-looking statements involve inherent risks and uncertainties. The Group cautions investors that a number of important factors, including those in this document, could cause actual results to differ materially from those contained in any forward-looking statement. Such factors include, but are not limited to, those discussed under ‘Risk factors’ on pages 232-241 of this Annual Report.
A number of adjusted measures are used to report the performance of our business. These measures are defined on page 58.
Brand names
Brand names appearing in italics throughout this report are trademarks which in 2013 were either owned by and/or licensed to GlaxoSmithKline or associated companies, with the exception of NicoDerm, a trademark of Johnson & Johnson, Novartis, Sanofi or GlaxoSmithKline, Potiga, a trademark of Valeant, Prolia and Xgeva, trademarks of Amgen, Axentri, a trademark of Emcure Pharmaceuticals, Volibris, a trademark of Gilead, Xyzal, a trademark of UCB or GlaxoSmithKline and Zyrtec, a trademark of UCB or GlaxoSmithKline all of which are used in certain countries under licence by the Group.
Read more at www.gsk.com
Printing Printed at Pureprint Group, ISO 14001. FSC® certified and CarbonNeutral®.
Paper This Annual Report is printed on Amadeus 100 silk, a 100% recycled paper with full FSC certification. All pulps used are made from 100% de-inked, post-consumer waste and are elemental chlorine free. The manufacturing mill holds the ISO 14001 and EU Eco-label certificates for environmental management.

www.gsk.com
Here you will find downloadable PDFs of:• Annual Report 2013• Annual Summary 2013• Form 20-F• Corporate Responsibility Report 2013
Head Office and Registered Office GlaxoSmithKline plc 980 Great West Road Brentford, Middlesex TW8 9GS United Kingdom Tel: +44 (0)20 8047 5000Registered number: 3888792
You can also search for us here