ANNUAL REPORT 2011-12 - DHS
212
Department for Communities and Social Inclusion ANNUAL REPORT 2011-12
-
Upload
khangminh22 -
Category
Documents
-
view
3 -
download
0
Transcript of ANNUAL REPORT 2011-12 - DHS

Department for Communities and Social Inclusion
ANNUAL REPORT 2011-12

Department for Communities and Social Inclusion
Feedback on the Department for Communities and Social Inclusion Annual Report 2011-12 can be submitted via email to [email protected]. Comments provided will ensure that the requirements and expectations of stakeholders and members of the public are satisfied in the development of the annual report for the 2012-13 financial year. Office Address Riverside Centre North Terrace Adelaide SA 5000 Postal Address GPO Box 292 Adelaide SA 5001 Telephone (08) 8226 8800 © Government of South Australia, September 2012 ISSN 2200-8160 (Print) ISSN 2200-8179 (Online) The annual report is available from the website of the Department for Communities and Social Inclusion at www.dcsi.sa.gov.au. The information in this publication can be provided in an alternative format or another language on request. Please contact (08) 8413 8126. This annual report was prepared by Business Affairs of the Department for Communities and Social Inclusion.

Annual Report 2011-12 1
Letter of Transmittal
Hon Ian Hunter MLC Minister for Communities and Social Inclusion Minister for Social Housing Minister for Disabilities Minister for Youth Minister for Volunteers
Hon Gail Gago MLC Minister for the Status of Women
Hon Jennifer Rankine MP Minister for Multicultural Affairs
Dear Ministers
I am pleased to submit the annual report of the Department for Communities and Social Inclusion for the year ended 30 June 2012.
This report highlights the many achievements of the department during 2011-12 and has been prepared in accordance with the Public Sector Act 2009, Public Finance and Audit Act 1987, and other legislation as required.
Yours sincerely
Ms Joslene Mazel Chief Executive Department for Communities and Social Inclusion
30 September 2012

Department for Communities and Social Inclusion 2
Contents
Letter of Transmittal .....................................................................................................................................1
Chief Executive’s Report ............................................................................................................................4
About DCSI
Objective ......................................................................................................................................................8
Our Commitment .......................................................................................................................................8
Our Clients ..................................................................................................................................................8
Our Values ..................................................................................................................................................8
Organisational Structure .........................................................................................................................9
Five Year Strategic Plan 2009-2013 ................................................................................................ 11
Our Performance
Government’s Strategic Priorities ..................................................................................................... 14
South Australia’s Strategic Plan ........................................................................................................ 15
DCSI Scorecard...................................................................................................................................... 17
Social Housing ........................................................................................................................................ 19
Community and Home Support ......................................................................................................... 29
Communities and Partners.................................................................................................................. 44
Status of Women.................................................................................................................................... 70
Multicultural Services ............................................................................................................................ 76
Organisational Capability..................................................................................................................... 80
Aboriginal and Torres Strait Islander People................................................................................. 86
Our People
Workplace Statistics.............................................................................................................................. 87
Occupational Health, Safety and Welfare ...................................................................................... 94
Governance Arrangements
Governance Principles ......................................................................................................................... 99
Internal Governance Bodies .............................................................................................................100
Legislation ..............................................................................................................................................103
Boards, Committees and Trusts......................................................................................................104
Risk Management and Internal Audit.............................................................................................105
DCSI Client Feedback System ........................................................................................................106
Privacy.....................................................................................................................................................107
Information Sharing Guidelines .......................................................................................................107
Procurement ..........................................................................................................................................108

Annual Report 2011-12 3
Corporate Reporting
Reconciliation ........................................................................................................................................109
Carers Recognition Act 2005 ...........................................................................................................110
Disability Action Plan ..........................................................................................................................112
Julia Farr Services (Trusts) Act 2007 ............................................................................................115
Freedom of Information......................................................................................................................116
Regional Impact Assessment Statements ...................................................................................118
Greening of Government Operations Framework......................................................................118
Energy Efficiency Action Plan ..........................................................................................................122
Asbestos Management in Government Buildings......................................................................123
Urban Design Charter.........................................................................................................................123
Overseas Travel ...................................................................................................................................124
Fraud........................................................................................................................................................124
Whistleblowers......................................................................................................................................125
Financial Reporting
Account Payment Performance.......................................................................................................126
Contractual Obligations......................................................................................................................127
Consultants ............................................................................................................................................131
Financial Statements...............................................................................................................................132
Our Locations and Contact Details ...................................................................................................204
Acronyms .....................................................................................................................................................209

Department for Communities and Social Inclusion 4
Chief Executive’s Report The Department for Communities and Social Inclusion (DCSI), formerly the Department for Families and Communities, was created in October 2011 when the Hon Jay Weatherill MP was appointed Premier, and outlined a number of machinery of government reforms. The new portfolios to the department provide the opportunity to build on existing work and to contribute to the department’s focus on social inclusion and to strengthen community capacity and resilience. The department has responsibility to promote the wellbeing of certain population groups including Aboriginal people, youth, women, people with disability, volunteers, older South Australians and those from culturally and linguistically diverse communities. DCSI has policy, program and service delivery functions that make a practical contribution to securing a socially inclusive South Australia. The work of the department supports the achievement of the South Australian Government’s Strategic Priorities in particular: creating a vibrant city; safe communities, healthy neighbourhoods; an affordable place to live; every chance for every child; and realising the benefits of the mining boom for South Australians. The Office for the Ageing (Ageing Policy, Retirement Villages, Seniors Card and the Aged Care Assessment Program) has transferred to the Department for Health and Ageing while Families SA, excluding Youth Justice, has transferred to the new Department for Education and Child Development. Further changes to the department occurred in March 2012, with the establishment of the Urban Renewal Authority (URA), now referred to as Renewal SA. This brought together all agencies responsible for land and housing development and resulted in the transfer of 82 Housing SA staff members in April 2012. I look forward to working with Renewal SA to deliver on the State Government’s strategic priority, ‘an affordable place to live for everyone’. In June 2012, Housing SA and URA staff celebrated Australia’s largest, most successful and nationally significant, multi award winning urban renewal project, Westwood. The last allotment sale in March marked the end of the 12-year partnership between Housing SA and Urban Pacific Limited. More than 1900 households were moved during the project. The relocation process led by Housing SA staff over the project life has been a key factor in the project’s success. Housing SA has continued to achieve targets under the Nation Building – Economic Stimulus Plan with the practical completion of 1367 dwellings as at 30 June 2012, exceeding the milestone target of 1360 dwellings. Construction of the UNO Apartments development at 102 Waymouth Street also reached practical completion on 30 June 2012. Of the 146 residential apartments 30 will comprise a youth homelessness service, with St John’s Youth Services Incorporated awarded the tender to initially manage this service. This year has seen the development of exciting new directions to reform disability services which aims to generate a service delivery system that empowers people with disability with more choice, freedom and control.

Annual Report 2011-12 5
Significant funding has been allocated towards the launch and trial of the National Disability Insurance Scheme (NDIS). We will work closely with the Commonwealth Government in the implementation of the NDIS launch, noting that this will inform the move to a national insurance-based approach to disability care and support in the future. Ultimately our aim is to move disability service provision away from a welfare-based model to a rights-based system. These reforms will offer increased choice, dignity and control and will put the person with disability at the centre of service delivery and ultimately improve the quality of life of people living with disability. The disability blueprint, Strong Voices: a Blueprint to Enhance Life and Claim the Rights of People with Disability in South Australia 2010-2020, was released in October 2011. All recommendations were agreed to in principle and 17 of the 34 recommendations were immediately committed to in full or in part. The flagship announcement was the State Government’s commitment to universal individualised funding over time, and immediate expansion of individualised funding to all people receiving six or more hours of personal support per week. The disability blueprint reform aligns with South Australia’s commitments under the National Disability Strategy, the proposed NDIS and related National Injury Insurance Scheme. The review of the Disability Services Act 1993 is completed and the focus is now on the provisions that will be included in a new Disability Act. The Disability Services Act 1993 sets out funding, research and provision of disability services in accordance with certain principles and objectives. The updated Act will better reflect the United Nations Convention on the Rights of People with Disability and recent developments at the State and national level. Our service delivery staff are dedicated, professional and caring people supporting some of the most vulnerable members of our community. I am confident that together we can meet the challenges that lay ahead as we begin to roll out these major reforms. This year DCSI reviewed the department’s activities on the Anangu Pitjantjatjara Yankunytjatjara (APY) Lands and acted to strengthen the coordination of services. The development of a Vulnerable Youth Strategy for South Australia is a key action of youthconnect South Australia’s Youth Strategy 2010-2014. The strategy will identify and improve the systemic issues that contribute to young people’s vulnerability and assist in the identification of young people with multiple and complex needs. A consultation paper was developed and released to start wider discussions on this issue. Information obtained through the consultation process will contribute to drafting the framework for the vulnerable youth strategy. The State Volunteer Congress continues to be an important forum in identifying key issues for the ongoing development of volunteering in South Australia. The Office for Volunteers partnered with Volunteering SA&NT to deliver the largest State Volunteer Congress on 5 December 2011, with over 500 people registered to attend.

Department for Communities and Social Inclusion 6
audit. He will be missed.
During 2011-12, the Office for Women has continued to lead work on addressing the issue of violence against women through the expansion of the Family Safety Framework to other metropolitan and regional areas of South Australia. The Office also partnered with the Australian Hotels Association, United Voice, and Consumer and Business Services in the Violence Against Women Awareness and Prevention in the Hotel Industry Project which commenced in July 2011. It released A Right to Safety: The Next Phase of South Australia’s Women’s Safety Strategy 2011-2022, which builds on the reforms undertaken through the Women’s Safety Strategy and outlines the South Australian Government’s commitment to the National Plan to Reduce Violence against Women and their Children 2010-2022. Northern Connections and the Office for the Southern Suburbs continue to support the implementation of The 30-Year Plan for Greater Adelaide to promote economic development and job creation, in order to provide more opportunities for people to both live and work in the respective regions. Multicultural SA has also continued to increase awareness and understanding of diverse cultures to maintain the high rate of South Australians who believe cultural diversity is a positive influence in the community. This is achieved through the Showcasing Multiculturalism Program which encourages the participation of ethnic community organisations in events including the Christmas Pageant, the Australia Day Parade and ANZAC commemorations. In the coming year, the department will continue to work to improve the wellbeing of South Australians who may be vulnerable and disadvantaged, supported by additional funding provided in the 2012-13 State Budget. Additional funding includes: $106.1 million over five years from 2011-12 to address the growth in the number of people
with disability and their carers requiring accommodation support, community support, community access and respite services
$61.5 million over four years for housing for people with disability $21.6 million over four years to complete Stage 3 of the Strathmont Centre
Redevelopment and Community Living Placements Project $20 million over three years for a National Disability Insurance Scheme launch site in
South Australia, commencing in 2013-14 $1 million over two years to assist the disability sector respond to the implementation of
individualised funding $2.1 million over three years from 2011-12 for fire safety upgrades at the Highgate Park
facility $2.3 million over four years for the establishment of an expanded and integrated
independent mental health and disability Community Visitors’ Scheme $4.2 million over four years to assist lower income households reduce financial hardship
associated with rising utilities cost pressures. In August 2012, the State Government announced the establishment of a Community Safety Directorate to be led by Mr Tony Harrison, as Director General of Community Safety. The Directorate, a division within the department alongside the State Recovery Office, provides the opportunity to have emergency planning, management and recovery functions working side by side on a range of safety issues including fires and natural disasters, while building community resilience. In October 2011, we were saddened by the passing of Peter Agars who was a member of the South Australian Housing Trust Board Audit and Finance Committee and the DCSI Audit Committee. Peter’s contribution to the work of these two committees was characterised by integrity, compassion and intellectual analysis. He brought to the committees years of talent and experience and was generous in his sharing of contemporary perspectives on risk and

Annual Report 2011-12 7
I wish to take this opportunity to thank all staff for their contributions toward the department’s objectives and to Minister Hunter, Minister Gago and Minister Rankine for their leadership and unwavering commitment to our clients.
Ms Joslene Mazel Chief Executive Department for Communities and Social Inclusion September 2012

Department for Communities and Social Inclusion 8
About DCSI
Objective The Department for Coall South Australians, pa
mmunities and Social Inclusion (DCSI) is committed to ensuring that rticularly the most vulnerable and disadvantaged, have access to t protect and enhance the community’s wellbeing and provide
hen they need it.
committed to delivering better and more connected services to the vulnerable and disadvantaged in our community, to build engaged, socially inclusive, strong and vibrant communities. The work of the department will support the achievement of the South Australian Government Strategic Priorities.
Our Clients We connect clients to services in: accommodation and housing disability youth justice domiciliary care financial support and grants problem gambling disaster relief and recovery youth services volunteer services support for ethnic communities information and referral services for women.
Our Values Connected: We consider the big picture when dealing with small things. We connect with others, across boundaries, to get the best result. We share information, ideas and solutions. Ethical: We do the right thing, acting in accordance with our public sector, professional and personal codes: with integrity, fairness, respect and transparency. We are accountable for our actions. Brave: We are fearless and bold in tackling the hardest issues. We have the courage to explore beyond the horizon and discover new ways together. We also know that simple common sense may give us the answer. Respectful: We show our esteem for each other in how we work together, in an environment that facilitates safe, fair and equitable interaction.
high quality services thasupport to people w
Our Commitment The department is

Annual Report 2011-12 9
tructure
he Department for Communities and Social Inclusion (DCSI), formerly the Department for amilies and Communities, was established by Premier Weatherill on 21 October 2011 as art of a series of changes to government departments.
ment of DCSI, Social Inclusion was transferred into the new
artment on 1 January 2012 from the former Department
vernment, while the following units also transferred into the new om the Attorney-General’s Department:
12, Families SA, including the child protection and family support functions, new Department for Education and Child Development (DECD). Youth
ustice remains with DCSI. At this time responsibility for the Office for the Ageing (Ageing s Card and the Aged Care Assessment Program)
Health and Ageing.
reflects the highlights of the aforementioned units which transferred into f the 2011-12 financial year. The activities of Families SA and the Office
in the annual report of their new ‘parent’ agency.
lishment of the Urban Renewal Authority (URA), now al SA, was announced in Parliament by the Premier. Commencing on
brought together all of the South Australian agencies responsible for
rtain South Australian Housing Trust (SAHT) A in the defined redevelopment areas of Woodville West and River Street, A was also granted development access to a third approved redevelopment
pril 2012, 82 Housing SA staff members were transferred to the URA.
Organisational S TFp
s part of the establishAdepartment from the Department of the Premier and Cabinet, effective from 1 December 2011. The Office for the Southern Suburbs and the Office for the Northern Suburbs (Northern
onnections) transferred into the depCof Planning and Local Go
epartment at this time frd the Office for Women the Office for Youth the Office for Volunteers Multicultural SA. On 1 January 20transferred to theJPolicy, Retirement Villages, Seniortransferred to the Department for This annual reportDCSI for the whole ofor the Ageing are to be reported On 16 February 2012, the estabreferred to as Renew1 March 2012, the URAland and housing development.
iIn tially, approval was given for the transfer of ceassets to the URMarden. The URarea, Inner City Playford. An Inter-Ministerial Agreement is being negotiated to provide a set of principles by which the portfolios of Social Housing and Housing and Urban Development, including the SAHT Board, work together to deliver our Government’s objectives in housing affordability. Effective 23 A

Department for Communities and Social Inclusion 10
June 2012
Organisational Structure at 30
AN
HU
NT
ER
C
omm
uniti
es a
nr
for
Soc
ial H
ouni
ster
for
Dis
abi
inis
ter
for
You
tst
er fo
r V
olun
t
HO
Min
iste
r fo
r Min
iste
M M
N I
M
d S
o
ilit
Mh
ini
ee
LC
cial
Incl
usio
n si
ng
ies
rs
JO
SL
EN
E M
A
CH
IEF
EX
EC
U
ZE
L
TI
VE
Aus
tra
Tru
st
Sou
thH
ousi
nglia
n B
oard
Sou
th A
Affo
rdab
leustr
a
Tru
st B
oarlia
n H
ousi
ng
d
D
avid
Cau
dre
y E
xecu
tive
Dire
ctor
Dis
abili
ty, A
gein
g an
d C
arer
s C
omm
unity
and
Hom
e S
uppo
rt S
A
L
ynn
Yo
un
gxe
cutiv
e D
irec
D
isab
ility
and
Dom
icili
ary
Car
e S
ervi
ces
Com
mun
ity a
nd H
oS
uppo
rt S
A
Eto
r
me
S
ue
Wal
lace
Dir
ecto
r
Pol
icy
and
Com
mu
velo
pmen
for
Wom
en
for
V
olun
t
nity
t
You
th
eers
De
Off
ice
Offi
ceO
ffice
for
P
eter
Bu
ll
utiv
e D
irect
or
J
ustic
e, C
omm
unity
E
ngag
emen
t an
d sa
tiona
l Sup
Exe
c
You
th
Org
ani
port
Jo
e U
llian
ich
Exe
cutiv
e D
ire
Fin
anci
al S
ervi
ct
or
ces
Ro
nn
ie F
agg
ott
erD
irec
tor
Sta
te R
ecov
ery
So
ph
ia P
op
pe
Dir
ecto
r M
ultic
ultu
ral S
A
B
arb
arE
xecu
tiv
Soc
ial I
nclu
a W
eis
e D
irect
or
sion
N
GA
IL G
AG
O M
LC
r fo
r th
e f
Wom
en
HO
Sta
tus
oM
inis
te
H
ON
JE
NN
IFE
R R
AN
KIN
M
inis
ter
for
Mul
ticul
tura
l AfE
MP
fairs
Ex
ec
uti
ve
Le
ad
ers
hip
Te
am
(E
LT
)
Nor
ther
n C
onne
ctio
ns
ag
an-
ve D
ire
us
ing
S
Ph
ilip
FE
xecu
ti
Ho
Sc
hm
idt
ctor
A
Off
ice
for
the
Sou
ther
n S
ubur
bs

Annual Report 2011-12 11
ur Vision: a better life for South Australians
review of the department’s Strategic Plan is currently being undertake ing the hanges to government departments announced by Premier Weatherill 1 ctober 2011.
s previou epo n 1 January 2012, Families SA transferred to DECD and ther the Ag to the Department for Health and geing.
Five Year Strategic Plan 2009-2013 O A n
onfol 2
low Oc
A
A s
einly rg
rtedsfer
, ored
Office fo tran
HOUSING
Outcomes KPIs
Imh
proved affordability an sustainabilousing for rental and pr te ownersarkets
number of affordable home purchase and rental opportunities*
number of South Australians experiencing housing stress*
ity ohip
f
d iva
m
Improved Aboriginal housing outcome ove ng in Aboriginal households* s rcrowdi
Access to high needs housing number of high needs clients plac sing number of ‘rough sleepers’ in South Au
ed in houstralia*
Accelerate urb wa expand affordable housing options an and community rene l
Strategies
develop a Be se strategy to deliver housing for South Australians review Aboriginal housing outcomes develop innov ng models HomeSta i ntinue to develop tive products to reflect Housing SA develop housing solutions that assist depa l priorities.
st U
ana
tivnc
e fue
ndi co
rt F to inn
rtmovaenta
policies
FAMILIES
Outcomes IKP s
Families are p d and strengthened number of child protection notifications su porte
Children remain ely with their families number of children placed in alternative casaf re
Children and young people in our care have able and appropriate placements
umber of children a d young p le mergency accommodation
eop in interim en nst
Children and young people in our care have proved outcom
safety, health, d social development indicators education, anim es
Young people in ith the justice stem receive appropriate support in sponse to t g
second or subs justice sentence con
o
tact w
ndinsyre heir ffe
equent youth
Strategies
address the needs of families and children at risk early, by connecting them to d es and by working in par with the Department of Education and Children's ith SA Health (CYWHS) work intensively with families to prevent children’s placement in ernative cadevelop a range of suitable alternative care options further develop the model for alternative care to provide the best outcomes for children under the Guardianship t Minister develop a co
Cces
hil (D
re
ren’s CECS)
entrand w
tnership Servi
to a lt
of mprehensive strategy to address youth crime.
he
* a
KPI is derived from a target of South Australia’s Strategic Plan (SASP) for which the d lead gency or a key contributor.
epartment is the

Department for Communities and Social Inclusion 12
DISABILITY
Outcomes KPIs
Cs
hoices aligned to individual need to time spent in tupport active participation in the
community number of people with disabilities employed in the public
sector*
he community
Better housing outcomes in the community use of community-based accommodation* for people with disabilities
Improvements for people with disability through participation in reform under the
National Disability Agreement targets
National Disability Agreement
Strategies
develop develop
sustainable policy options to improve choices for people with disabilities a suite of accommodation models respond to individual needs
m nd non-
take short, medium and lonto ne n
which develop a comprehensive funds manage
government sectors under
ent system for disability services in the government a
g-term planning for Supported Residential Facilities develop State level plans to respond
n with the nonw ational initiatives
develop plans in collaboratio
-government sector to improve service quality.
AGEING
Outcomes KPIs
Transition of aged care services to new
ns
compliance with COAG timeframes arrangements as a result of Council of Australian Governments (COAG) decisio
Reform Home and Community Care (HACC) arrangements
compliance with COAG timeframes
Strategies
review future role and function of Domiciliary Care e for the Ageing. review future role and function of the Offic
* KPI is derived from a target of SASP for which the ntributor. department is the lead agency or a key co

Annual Report 2011-12 13
COMMUNITIES AND PARTNERS
Outcomes KPIs
State of the art contract management non-government organisations
for service and master level of compliance with DFCagreements
Solid relationships with communities and ernment organisations satisfied with their
other partners satisfied with relationship with DFC partners
non-govpartnership arrangements
Strengthened non-government organisatsector
ion the non-government sector
improved quality of service successful completion of agreements
strong relationships between DFC and
Improved family resilience improved safety outcomes for children
Strong and supported communities South Australians receiving government benefits* movement in Community Strength indicators
Carers are recognised and valued level of compliance with Carers Recognition Act 2005 requirements
Whole of DFC strategic plan for carers carers satisfaction
Strategies
strategically address the training needs of non-government organisation sector d develop a transparent and robust process to award funding
nts gthe a nisation sector per
disaster relief and recovery d alignment and targeting
nt a community engagement strategy a strategic plan for carers
elp services rds and committees.
improve contract management system anagreeme
develop stronger partnerships to strenAustralian best practice
maintain ability to support communities inthat ad
n nd support the non-government orga
coordinated anti-poverty strategy of existing programs
launch and impleme
resses poverty alleviation and improves
develop implement a reform agenda for problem gambling h develop stronger relationships with Ministerial Councils, boa
ORGANISATIONAL CAPABILITY
Outcomes KPIs
Sound leadership and governance assessment of Business Excellence Framework Category 1: Leadership
Effective resource management ratio of operational to administrative expenditure
Continuous quality improvement culture satisfaction of South Australians with government services
Employer of Choice recruitment and retention rates staff satisfaction
Strategies
finalise organisational structure and its leadership develop a master plan for asset rationalisation and investment for improved service outcomes review value for money training options for staff and non-government organisations continuously improve systems and processes deliver the Workforce Plan develop an integrated policy framework that recognises the diversity of our constituencies finalise concessions reform program provide and maintain a safe working environment.
* KPI is derived from a target of SASP for which the department is the lead agency or a key contributor. Whole-of-government target of SASP.

Department for Communities and Social Inclusion 14
Our Performance
Government’s Strategic Pr
io i
n
guide policy and decision making across government. The strategic priorities are:
rit es
The South Australian Government hasaction which will define the legislative a
identified seven strategic priorities for immediate ge da of the Government and budget processes, and
Strategic priorities How we wi gll et there
Creating a vibrant city laneMor ares and
ways al d outdoor dining; Safe and pedestrian-friendly streets.
e people choosing to live in the city centre; City squive with people of all ages; Public art, live music an
Safe communities, healthy neighbourhoods
alki ; Visibly safer neighbourhoods; Places to meet and be active; Strong social connections that
port.
Better w ng and cycling options
support older people; Convenient public trans
An affordable place to live
needs and income levels; Homes and neighbourhoods designedto conserve energy and water; Support to manage essential costs
Affordable homes to rent or buy that cater for range of family
. of living at times of financial hardship
Every chance for every child and pr
Practical information for all parents; Early intervention and support services to families in need
eschool offered by trained staff; High quality, affordable child care
; Schools as service hubs for families.
Growing advanced manufacturing
Highly-skilled workforce; Defence and Mining sectors drive hi-tech ufacturing; Business clusters; Capturing and applying
research and development; Build on defence and clean tech industries.
man
Realising the benefits of the mining boom for all
technology innovation; Adelaide and locations
Mining proje mining ojects; Fre a ing
forFuture Fund
cts progress to production; Local suppliers to pr e nd subsidised training aligned with jobs; Min
regional towns preferred fly in-fly out workers; Diverse mining workforce; .
Premium food and wine from our clean environment research, education
Strong reputation for clean and safe food production; Sustainable use of natural resources; Culinary tourism; Leadership in food
.
As stated by His Excellency Rear Admiral Kevin Scarce AC CSC RANR, Governor of South
second session of the 52nd Parliament, these priorities will be rprise;
viduals with a reciprocal responsibility to the community.
he seven strategic priorities have a strong interface with the visions of the revised South ets by
Australia, when opening thetackled through three approaches to government: a culture of innovation and entesustainability; and a respect for indi TAustralia’s Strategic Plan, and will directly assist in the achievement of the Plan’s targencouraging further action.

Annual Report 2011-12 15
gic Plan
he revised South Australia’s Strategic Plan (SASP) was launched on 8 September 2011 llowing an extensive community consultation process. The updated Plan incorporates 100
mmunity; Our Prosperity; Our Environment;
he department is the lead agency for the achievement of 14 SASP targets. The targets, eve South Australian Government and the ains ual report are identified in the following
table.
South Australia’s Strate Tfotargets which fit under the categories of; Our Co
ur Health; Our Education; and Our Ideas. O
Lead Targets
Ttheir alignment to the slocation of reporting ag
n strategic priorities of the t their progress in this ann
DCSI Lead SASP Targets Alignment to Seven Strategic Priorities
Page Reference
Target 5: Multiculturalism Creating a vibrant city 76 to 77
Target 7: Affordable housin g An affordable place to live 20 to 21
Target 8: Housing stress An affordable place to live 21
Target 9: Aboriginal housin e 21 to 22 g An affordable place to liv
Target 10: Homelessness An affordable place to live 22 to 23
Target 11: Housing for peodisabilities
ple with An affordable place to live 35
Target 16: Economic disad vantage Realising the benefits of the mining boom for all
55
Target 18: Violence againsSafe communities, healthy
70 to 71 t women neighbourhoods
Target 23: Social participation Safe communities, healthy neighbourhoods
55 to 56
Target 24: Volunteering Safe communities, healthy
61 to 62 neighbourhoods
Target 25: Suppdisability
ort for peourhoods
ple with a Safe communities, healthy neighbo
29 to 30
Target 29: Elections N/A 71 to 72
Target 30: Boards and committees N/A 72 to 73
Target 31: Chairs of boards and N/A 73
committees

Department for Communities and Social Inclusion 16
hroughout this report we also summarise how the department is contributing to the following
ion with government services (refer page 106) Target 50 – People with disability (refer pages 80 and 81) Target 52 – Women (refer pages 80 and 81)
Aboriginal employees (refer pages 80 and 81)
lians. Examples of actions undertaken by the department include the: implementation of the National Partnership Agr
outcomes of the Domiciliary Care Abo der Services Strategy
Action Committees (refer
l Women’s Gat
SASP is av g.au.
Whole-of-Government Targets
Twhole-of-government targets: Target 30 – Boards and committees (refer page 105) Target 31 – Chairs of boards and committees (refer page 105) Target 32 – Customer and client satisfact Target 53 – Target 61 – Energy efficiency – government buildings (refer pages 119 and 122). The department is also responsible for undertaking actions which contribute to the achievement of Target 6, which seeks to improve the overall wellbeing of Aboriginal South
ustraA eement on Remote Indigenous Housing
riginal and Torres Strait Islan(refer page 25)
(refer page 42) Aboriginal Youth Development Program and Aboriginal Youth
pages 46 and 47) Aboriginal Power Cup (refer page 60) annual State Aborigina hering (refer page 75). Further information regarding ailable from www.saplan.or

Annual Report 2011-12 17
ear Strategic Plan 2009-2013 through a number of key succinct summary of those KPIs on
ction of KPIs and ll continue in 2012-13.
DCSI Scorecard The department, as part of the strategic planning and reporting process, monitors its performance against the Five Yperformance indicators (KPIs). The scorecard provides a a single report.
hThe scorecard is regularly reviewed and updated. Many KPIsk around sele
ave been modified for reasons such as data quality or availability. Worimprovements in the quality of data have been ongoing and wi The following table summarises the KPIs at 30 June 2012.
KEY PERFORMANCE INDICATORS1
Housing 2009-10 2010-11 2011-12
Number of affordable home purchases and rental opportunities provided by Housing SA*
50 974 52 881 52 235
Number of South Australians assisted by Housing SA that are experiencing housing stress*
26 265 29 780 32 234
Percentage of affordable housing secured in 20.4% 15.4%
all new significant developments* 16.4%
Number of high needs clients placed in housing by Housing SA*
4 414 5 287 5 905
Percentage of Aboriginal occupied Housing SA dwellings identified as overcrowded*
6.1% 5.6% 4.4%
Disability 2009-10 2010-11 2011-12
Number of community members accessing the Independent Living Centre for information and advice regarding equipment and aids for functional independence
18 919 20 845 22 806
Number of group home places in South Australia*
1 037 1 124 1 306
Percentage of organisations on the Disability Services Provider Panel involved in an accredited quality program
n/a 65.5% 95%

Department for Communities and Social Inclusion 18
KEY PERFORMANCE INDICATORS1
Ageing 2009-10 2010-11 2011-12
Number of people accessing community care hrough Access2t HomeCare
2 683 3 598 7 752
Percentage of non-government agencies completing quality certification
100% 100% 100%
Communities and Partners 2009-10 2010-11 2011-12
Percentage of partners engaged in the DCSI Australian Service Excellence Standards
84% 76% 77%
Number of concessions provided to eligDCSI concessions clients
ible 1 422 418 1 434 842 1 488 161
Percentage of problem gamblers in South Australia accessing Gambling Help Services
n/a n/a 11%
Organisational Capability 2009-10 2010-11 2011-12
The percentage score on the Customer Satisfaction Measurement survey against SASP Target 32*
83%2 82% n/a
Percentage of complaints acknowledged withifive working days through the clien
n t feedback n/a n/a 85%
management process
The level of satisfaction reported by staff in the 62%3 64.4% n/a
staff survey
Staff retention rates 91% 90.3% 91.4%
Number of national qualifications issued to 1 071 933 775 DCSI staff through the College for Learning
and Development
Percentage of women in executive positions/total executives in DCSI*
57.8% 59.1% 66.7%
Percentage of employees with disability/temployees
otal in DCSI*
4.5% 4.2% 4.2%
* KPI is derived from a target of SASP for which the depn/a: data not available for this period 1 Machinery of Government changservices provided or number of sta
artment is the lead agency or a key contributor
es have had an effect on the data for some KPIs (ie changes in policies, type of ff). Therefore caution needs to be taken when analysing trends.
2008-09 data a
Source: DCSI Divisions and Business Units (unpublished)
2
3 2008 dat

Annual Report 2011-12 19
Social Housing
The focus of Housing SA is to develop and implement better housing and service responses high need, and to work with others to expand rove af
housing choices across the State. This encompasses the management of grants for housing in high need and supported accommodation grants fo rovision o ate rental
original and community managed housing, the regulation of community port services.
rategy, policy development and advice (including ing Trust (SAHT).
erformance Highlights
ovision of and accessible housing.
Objective
for people at risk or in and imp fordable
services to low income households, people assistance for people in crisis. This includes services, public, Ab
r the p f priv
housing and homelessness and sup Housing SA also provides housing stfinancial advice) to the South Australian Hous
P
South Australia’s Strategic Plan
SASP contains four housing related targets which contribute to the prThe revised affordable

Department for Communities and Social Inclusion 20
ousing
Target 7: Affordable h
arget 7 is a revised target that replaces the previous target T6.7, which sought to increase Taffordable home purchase and rental opportunities by five percentage points by 2014. The aim of the revised Target 7 is for South Australia to lead the nation over the period to 2020 in the proportion of homes sold or built that are affordable to low and moderate income households. This new target retains the intent of the original target, while recognising that there are many influences on the housing market. It also aligns to national reporting and will enable a comparison across jurisdictions. Homes are assessed as affordable by the National Affordable Housing Agreement (NAHA) when a household spends no more that 30 per cent of their gross income on mortgage payments. Low and moderate income households are those with equivalised disposable incomes (disposable household income adjusted for household size and composition) in the bottom three income quintiles.
Proportion of properties built or sold that are affordable for lowand moderate income South Australian households
(2009-10 baseline)
40
50
60
70
80
90
100
Pe
r c
en
t
30
0
10
20
2007-08 2008-09 2009-10 2010-11
NSW VIC QLD WA SA TAS ACT NT Data source: NAHA Performance Indicators Report
At 53.9 per cent, South Australia was the fifth ranked State or Territory for the proportio
omes built or sold that were affordable for low and moderate incn of
ome households in the s the Northern Territory with
was again ranked fifth in 2010-11, however, the proportion of omes built or sold that were affordable for low and moderate income households had
arison to the Northern Territory which was again the lead
hase and rental opportunities is reflected across all jurisdictions in Australia, as many of the drivers of affordability are influenced by Commonwealth Government policies associated with taxation, interest rates and international finance markets.
hbaseline year of 2009-10. The leading State or Territory wa93.5 per cent. South Australiahdecreased to 37.6 per cent, in compState or Territory with 76.7 per cent. The decline in affordable home purc

Annual Report 2011-12 21
strategies progressed to increase affordable housing options
During 2011-12, a number of available to South Australians. These include new social housing dwellings constructed through the Nation Building – Economic Stimulus Plan (NBESP) social housing initiative andthe National Partnership Agreement on Social Housing, homes funded through the National Rental Affordability Scheme (NRAS), and new dwellings constructed through the Woodville West, Westwood and Playford Alive Urban Renewal Projects.
Target 8: Housing stress
Target 8 is a revised target that replaces the previous target T6.8, which sought to halvnumber of South Australians expe
e the riencing housing stress by 2014. The aim of the revised
arget 8 is for South Australia to lead the nation over the period to 2020 in the proportion of
n of low income households in rental stress as those rental ouseholds in the bottom two income quintiles, based on equivalised disposable household
clude a sed
low
Tlow income households not experiencing housing stress. As with the affordable housing target, this target retains the intent of the original target but recognises the external influences on the housing market. The NAHA defines the proportiohincome (disposable household income adjusted for household size and composition) excluding Commonwealth Rent Assistance or other rent assistance, that spend more than 30 per cent of their income on rent. Factors influencing the level of housing stress intight private rental market and higher rents, fewer public housing vacancies and increaproperty values.
In the baseline year of 2009-10, South Australia had the second highest proportion ofincome rental households not experiencing rental stress at 71.4 per cent. In comparison, Tasmania was the leading State or Territory with 71.9 per cent.
Target 9: Aboriginal housing
There has been no change to the Aboriginal housing target in the revised Plan, with Target 9 identical to target T6.9 in the previous iteration of the Plan. Positive movement has made in reducing the number of overcrowded Aboriginal households in South Australia. In 2002, the baseline year for the target, there were 1344 overcrowded Aboriginal housewhich decreased to 1212 in 2008.
The key measure for the target has changed from the Proxy Occupancy Standard to the Canadian National Occupancy Standard, to align with the NAHA Performance Indicat
been
holds
rs eport.
Aboriginal Transitional Housing Outreach Services onal h,
oR Housing SA is implementing a range of strategies to reduce overcrowding in Aboriginal households, including the implementation of the National Partnership Agreement on RemoteIndigenous Housing. This ten year agreement, which forms part of the NAHA, focuses onreducing overcrowding, homelessness, poor housing conditions and severe housing shortages in remote Aboriginal communities across the State. Housing SA has also expanded transitional accommodation programs across key South
ustralian sites by implementing two A(ATHOS) at Coober Pedy and Adelaide. ATHOS is a homelessness response for transitiAboriginal people from regional and remote communities who are at risk of sleeping rougor contributing to overcrowding in existing tenancies.

Department for Communities and Social Inclusion 22
lurrara accommodated 502
lients.
The implementation of the two services in July and November 2011 respectively, add to existing Aboriginal Transitional Accommodation Centres at Port Augusta (Lakeview) andCeduna (Wangka Wilurrara). During 2011-12, Lakeview provided 276 occasions of accommodation to 209 clients and 469occasions of in-centre support to 181 clients, while Wangka Wic
Number of overcrowded Aboriginal households in South Australiausing the Canadian National Occupancy Standard
(2002 baseline)
1250
1500
old
s
0
1000h
250
500
750
Nu
mb
er o
f h
ou
se
Aboriginal households 1344 1327 1212
Baseline 100
2002 2003 2004 2005 2006 2007 2008
Data source: The 2002 data source is the 2002 National Aboriginal and Torres Strait Islander Social Survey
om August 2002 to April 2003 was the 2004-05 National Aboriginal and Torres Strait Islander Health
which collected information frThe 2005 data source Survey which collected information from August 2004 to July 2005 The 2008 data source is the NAHA Performance Indicators Report
Target 10: Homelessness
The homelessness target has been extended from 2010 to 2013, to align with the
he National Partnership Agreement on Homelessness has enabled substantial reforms to ross
l and
lence. The new omelessness sector also includes three specialist statewide gateway services that provide
list .
xpected to be publicly available in late
012.
homelessness target within the NAHA. The previous target aimed to halve the number of ‘rough sleepers’ in South Australia by 2010 and maintain thereafter. Tthe homelessness sector in South Australia, including a roll out of expanded services acthe State. The homelessness sector is now comprised of 76 specialist homelessness programs, delivered through 97 services throughout South Australia, with targeted regionaresponses that provide support for adults, families, children, young people, AboriginalTorres Strait Islander people and women escaping domestic viohintake, assessment and supported referrals to crisis accommodation, local regional speciahomelessness and domestic/Aboriginal family violence services and mainstream services The number of rough sleepers in South Australia decreased from 897 in the baseline year of2001, to 852 in 2006. Data from the 2011 Census is e2

Annual Report 2011-12 23
Rough sleepers in South Australia(2001 baseline)
0
100
200
300
400
500
600
700
Nu
mb
er o
f p
eop
le
800
900
1000
South Australia 693 897 852
Baseline 100
1996 2001 2006 2011 2014
Data source: ABS Census of Population and Housing
Nation Building –Economic Stimulus Plan
In 2009, South Australia was awarded $434.3 million in funding under the social housing component of the NBESP, for the construction of at least 1360 new social housing dwellings and the upgrade of at least 400 social housing dwellings. The upgrade component of the program was completed in 2010 with the upgrade of 503 properties. In August 20 wed South Australia to increase the new build tar 617 dwell ers within the community
housing sector 604 will be retained as public housing stock
n identified for sale to eligible buyers via the Property Locator and ieve
n of 1367 dwellings,
contribute to
location of SAHT tenants from within the Woodville West urban renewal project area.
ate addition to the program. Inclement weather delayed some external works, which are now scheduled for completion in early August 2012.
11, the identification of financial savings alloget to 1470 dwellings, to be distributed as follows: ings will be transferred to Preferred Growth Provid
249 properties have bee
through NRAS, or the general market. The sales proceeds will be reinvested to achadditional housing dwellings in subsequent years.
As at 30 June 2012, South Australia has achieved practical completiowhich exceeds the original milestone target of 1360 dwellings. A further 103 dwellings are under construction and are scheduled for completion by the end of September 2012.
National Partnership Agreement on Social Housing
Commencing on 1 January 2009, the National Partnership Agreement on Social Housing aimed to increase the supply of social housing through new construction, and to reducing homelessness and improving housing outcomes for homeless Australians. As at 30 June 2012, 120 properties have been completed with the remaining 20 under construction. This includes 37 properties either purchased or constructed to support the re The final project in Elizabeth East, in partnership with Anglicare SA Housing Incorporated, was a l

Department for Communities and Social Inclusion 24
tal
nd sing.
d on the ulation. had
leted and were either tenanted or available for rent.
ovision in South
Housing SA and the URA (now referred to
d
h series of
ore than 700 participants were involved in the consultations, from ordinary South
hese, along with what was heard during consultation, will inform the new Housing Strategy for South Australia.
National Rental Affordability Scheme
NRAS is a Commonwealth Government initiative that offers financial incentives to private investors and community housing organisations to build and rent dwellings to low and moderate income households at 20 per cent below market rates for ten years.
The aim of NRAS is to: increase the supply of affordable ren
dwellings reduce rental costs for low to moderate
income households encourage large scale investment a
innovative delivery of affordable hou South Australia’s target of new dwellings under NRAS is 3800, which is baseState’s proportion of the national popAs at 30 June 2012, 3791 incentives been approved in South Australia and of
Findon Family Housing Project
The Findon Family Housing project provides ten two-bedroom apartments over three storeys in the western suburb of Findon. It targets young families and children who are homeless or at risk of becoming homeless.
Construction of the apartments commenced in November 2010 and achieved practical completion on
29 February 2012.
Home’ and the Crisis
these, 1200 dwellings had been comp
The dwellings were transferred to a
Housing Strategy for South Australia
A new Housing Strategy for South Australia is being developed to outline the vision and directions for housing pr
Housing SA Regional Office which is working in conjunction with Centacare to provide tenant support services. All ten apartments are currently tenanted.
Australia over the next 30 years. The development of the Housing Strategy for
Funding for the project was provided through the Commonwealth
South Australia, which is a whole-of-government strategy, is jointly led by
Government Homelessness Initiative ‘A Place to CallAccommodation Program.
as Renewal SA), with a range of agencies across the Government contributing to its development.
The new Strategy will align with the directions of The 30-Year Plan for Greater Adelaide anwill outline directions to support three of the Government’s priorities. These are: maintaining our safe communities and healthy neighbourhoods creating a vibrant city; and an affordable place to live for everyone. The Housing Strategy for South Australia: Green Paper, released in September 2011, marked the commencement of a three month consultation period to seek public and stakeholder input into the development of the Strategy. Public consultation occurred througthe SASP website and social networking sites. Stakeholders were also invited to apolicy workshops and regional sessions. MAustralians in online forums to leaders in the housing industry including, community housingproviders, developers, real estate agents, not-for-profit support providers and local government. Forty submissions were also received and t

Annual Report 2011-12 25
mote Indigenous Housing
AHA, 08.
As at 30 June 2012, South Australia completed c uses, exceeding the 2011-12 new build t e 2011-12 h 39 e 2012. Upgr rties were completed across theYal Dur ed vKoo s and d L ases signed by the former Minister for Hou P, the formRec the Hon Grace Portolesi MP, the Chair of Aboriginal Lands Trust. On l Housi Dee l Corporatiowhi partment to commence ucommunity. On igned aCom ommema tenure
Access Pro
Dur ousing with ity serv dire ess ho broad sup t accestre gistration systemsreforming the needs assessment process to iden
ough multiple housing and community service organisations.
cess to the he Access Project, clients
ly subsidised social housing.
, me
he Noarlunga Central Affordable Housing Project involved 4.7 hectares of land within the iented
f the
National Partnership Agreement on Re
The National Partnership Agreement on Remote Indigenous Housing is one of three partnership agreements, with Homelessness and Social Housing, forming part of the Nagreed by the Council of Australian Governments (COAG) on 29 November 20
onstruction of 58 new hoarget of 54. Th
properties refurbished as at 30 Jun refurbishment target was also achieved wit
aded prope seven remote Aboriginal communitieata and Koonibba.
ing 2011-12, land tenure was securnibba and Raukkan, with Deedsing, the Hon Jennifer Rankine Monciliation,
s of Amata, Mimili, Pukatja, Pipalyatjara, Fregon,
ia a 40 year Deed in the communities of Yalata, Un er e
er Minister for Aboriginal Affairs and Chair of the respective community and the
ng, the Hon Ian Hunter MLC, also signed an securing land tenure in Point Pearce, pgrades and tenancy management in the
13 March 2012, the Minister for Sociad with the Point Pearce Aborigina
ch will enable the de
28 March 2012, Minister Hunter also smunity Council which will enable the c
nagement in the community, once land
lease agreement with the Dunjiba ncement of upgrades and tenancy issues have been resolved.
SA has undertaken extensive consultationice agencies and clients on the policyusing services and products. There is ss to a range of housing options, , establishing a single housing register, tify clients with high needs and providing
entry points thr
ject
ing the 12 months to 30 June 2012, H the broader housing sector, communctions that would make it easier to accport for its directions of improving clienamlining application and re
The Access Project, to be implemented in 2012-13, is a Housing SA reform project to integrate the public and community housing waiting lists, and to improve client acrange of social and affordable housing options available. Through t
ill be identified through an improved need assessmentwith high and complex needs wprocess in order for them to receive priority access to high Clients with affordability needs would be able to register for affordable housing productsincluding private rental assistance, NRAS, some community housing and affordable hoownership.
Inspire Noarlunga
TNoarlunga Regional Centre being developed over several stages as a community orsustainable development, with particular emphasis on a pedestrian friendly design, environmentally sensitive and affordable housing. Stage 1 of the project consisted oconstruction of 27 properties, 26 of which were sold during 2011-12.

Department for Communities and Social Inclusion 26
rly 2012-13. Stage 2 ix
d was completed in March 2012. Due to the
the
requirements for completion by 30 June
The Woodville West Urban Renewal Project aims to create by 2017 a new
and ment,
olds. The renewal will ultimately yield at least 425
e National ESP
tiations for a further 11 twenty-seven public housing tenants have
2 per cent of the site has been cleared.
The remaining property is under contract with settlement to occur in eaconsists of a further 34 house and land packages, with 22 sold as at 30 June 2012. Saffordable house and land packages were provided as part of this stage and were released to the market in December 2011 for purchase by eligible persons.
In March 2010, approval was given for funding from the NBESP to be utilised in the construction of 23 apartments at the gateway of the project in Stage 3. Construction commenced in July 2010 an
reallocation of NBESP funding, approval was also given for the construction of four homes within Stage 2 and 16 homes on balance of land in Stage 3. Construction started in August 2011 to meet NBESP
2012.
Woodville West Urban Renewal Project
neighbourhood of innovative mediumhigher density residential redevelopfor a diverse range of househ
dwellings. Of these 139 will be sold for affordable home ownership or rental, 69 retained for social housing, with the remainder sold to market purchasers. The project area contained 184 dwellings, ofwhich 143 were owned by the SAHT.
he Commonwealth Government is providing funding through the NBESP, thT
Partnership Agreement on Social Housing and the Housing Affordability Fund. The NBwill provide funds to construct 69 new social housing dwellings. South Australia has been granted $9.5 million by the Commonwealth Government through the Housing Affordability Fund for the provision of infrastructure upgrading in the project area that will assist in the delivery of affordable homes. On 23 April 2012, control of the overall project was transferred to the newly created URA. The project is well advanced in the process of preparing the project area for development.
eventeen private dwellings have been purchased and negoSproperties are progressing. One hundred and been relocated and 7
Inner City Youth Crisis Accommodation
The UNO Apartments development at 102 Waymouth Street provide a mixture of social, affordable and
ctical completion on 30 June 2012. Funding
ommodation Program funds.
comprise a youth homelessness hn’s Youth Services
general market housing outcomes, in addition to a new dedicated youth service facility. Construction commenced on site in October 2010, with the building reaching pra
for the development has been provided through the Commonwealth Government NBESP and uncommitted Crisis Acc The completed development incorporates 146 apartments over 17 levels. Of the 146 apartments, 30 will
service. St JoIncorporated has been awarded the tender to initially manage this service, which will become operational in 2012-13.

Annual Report 2011-12 27
e 1
Westwood Urban Renewal Project
The Westwood Urban Renewal Project WestwooSA fic Limited, in conjunction with the Port Adelaide Enfield Council and the ct, whthe Australia ancom Ove 5 outdate50 years old, were redeveloped. The majority of rep furthe d. Hou hous 20 The n $2dev rs. Thaddress the employment and training needs of th t com rship with localdev mber odel the pr
Pla
Pla , is a mren South the ty. Housingrenewal of all public housing assets in Smithfield(Precinct 2 and 3), and to assist in the facilitation
volvement, training and employment outcomes
.
o avoren Park, civil works for Lot 362 Peachey Road are
te and awaiting confirmation to sell or retain these dwellings
six affordable housing dwellings were completed and are on the market for sale.
Construction of Stage 1 commenced in February 2011, comprising 69 dwelling outcomes in the project area, all of which are funded through the NBESP (excluding civil works). Stagdwellings will be completed by end of July 2012 and it is anticipated that Stage 1 civil construction will be completed by October 2012.
d was a joint venture project between the
ich was finalised in March 2012, was one of d as a result, is particularly focused on
d houses, some of which were more than these properties were demolished and r 478 houses were substantially refurbishe
es and continues a new build program on
HT and Urban Paci City of Charles Sturt Council. The proje largest urban renewal projects inmunity development activities.
r the 12 year life of the project, 232
laced by 2345 residential allotments. A
sing SA retained half of the refurbishedper cent of the newly created allotments
Westwood project has funded more thaelopment programs over the last 12 yea
million to deliver community and economic e project provided local initiatives to e people living within the projec
businesses to support business f programs were facilitated and this has oject’s lifetime.
munity, and worked in partneelopment within the project area. A nuivered 424 employment outcomes over
yford Alive
yford Alive, which commenced in 2008ewal initiative being undertaken by the City of Playford and the communi
ajor urban regeneration and community Australian Government in partnership with SA’s contribution to the initiative is the Plains (Precinct 1) and Davoren Park of community engagement and for the local community and improved ways in
of providing key services to those in need. As at 30 June 2012, 59 public housing dwellings have been upgraded and 34 are underway,including renovations through Doorways to Construction and BoysTown Social Enterprises In Smithfield Plains, Stage 2A civil works are completed with the contractor for Stage 3A t
e appointed in July 2012. In Dbcompleted and landscaping of the reserve has commenced. As at 30 June 2012: 64 new allotments were created, with 50 allotments to be sold and 14 allotments retained
for new builds 28 new public housing dwellings were constructed and 18 were under construction eight new dwellings funded through the NBESP are comple

Department for Communities and Social Inclusion 28
s, security, landscaping, fencing and rossovers include requirements to create training and employment opportunities for local
t landscaping of a public housing dwelling was
ramework for the Allocation of Housing Responsibilities
nnounced in Parliament by the Premier. Commencing on 1 March 2012, the URA brought
itially, approval was given for the transfer of certain SAHT assets to the URA in the defined
ner granted
enous and homelessness ervices, specialist social housing, tenancy management and maintenance functions. Also,
ins the new build programs for public, Aboriginal and community housing
an affordable place to live for everyone, one of
All 28 newly constructed public housing dwellings have been handed over to the Housing SANorthern Region for allocation. Housing SA’s contracts for civil works, renovationcpeople. During 2011-12, works on fronundertaken by Housing SA clients in a training and employment program called ‘Blokes on the Block’. Another similar program ‘Beauties and Blokes on the Block’, was completed in March 2012, and provided job ready skills to long term unemployed men and women aged between 26 and 50.
F
In October 2011, Premier Weatherill announced the Government’s intention to create a single body with responsibility for all urban renewal projects across South Australia. On 16 February 2012, the establishment of the URA (now referred to as Renewal SA) was atogether South Australian agencies responsible for land and housing development. Inredevelopment areas of Woodville West and River Street, Marden. These assets were gazetted on 26 April 2012. Assets attached to a third approved redevelopment area, InCity Playford, were not gazetted as they were still tenanted, however, the URA wasdevelopment access. Housing SA retains responsibility for housing policy, remote IndigsHousing SA retaconstruction. Service delivery to clients remains unchanged. An Inter-Ministerial Agreement is being negotiated to provide a set of principles by which theportfolios of Social Housing and Housing and Urban Development, including the SAHT Board, work together to deliver the Government’s objectives in housing affordability. In 2012-13, the department will continue to work closely with Renewal SA to deliver on the
outh Australian Government’s objective ofSthe seven strategic priorities. We will also work in partnership with Renewal SA to implement strategies to achieve the SASP housing targets, including Target 7 which aims for South
ustralia to lead the nation over the period to 2020 in the proportion of homes sold or built Athat are affordable by low and moderate income households.

Annual Report 2011-12 29
Community and Home Support
erformance Highlights
South Australia’s Strategic Plan
In October 2009, the Phase One Self-Managed Funding Initiative commenced in South Australia, providing people with disability the opportunity of transferring their current disability support services into a self-managed funding arrangement. An independent evaluation of the trial was released in March 2012, which reported that the funding model was well received by participants and puts people with disability in control, enabling them to choose the services and support arrangements that best meet their individual needs and circumstances.
Disability, Ageing and Carers
Objective The role of the Disability, Ageing and Carers branch is to: lead disability and carers policy development and planning in South Australia provide a single port of call for older people, people with disability and their carers that
provides clear and easy access from intake through to service delivery arrange for funding to go to all service providers by the most effective and transparent
means.
P

Department for Communities and Social Inclusion 30
rget 25, which aims to triple the number of
ctively participating in the self-managed funding initiative at the baseline year of 2010-11,
he disability blueprint reform aligns with South Australia’s commitments under the National d National Disability Insurance Scheme (NDIS) and me.
y
Strategy has ensured that the with
at umber of recently developed State, national and international
ameworks. Completed during 2011-12, the review delivered eight recommendations, a oadening the strategy to guarantee further improvements in le with disability.
ions of the review are consistent with recommendations
The revised SASP includes a new target, Ta
eople with disability able to access self-managed funding by 2016. There were 50 people paequating to a target of 150 people by 2016. As at 30 June 2012, 71 people were working towards self-managed funding. A key recommendation of the disability blueprint Strong Voices: A Blueprint to Enhance Life and Claim the Rights of People with Disability in South Australia (2010-2020), was that individualised funding must be made available to all new clients of government disability services and those on the Unmet Demand List, from July 2012. The South Australian Government has committed to the immediate expansion of individualised funding, which will mean that everyone in receipt of six hours or more of specialist disability support per week through Disability Services will receive a personalised budget. This model will be implemented in three stages, so that participants can choose to take up the option of managing their personal budgets through direct payments by January 2014.
Strong Voices
The disability blueprint Strong Voices: A Blueprint to Enhance Life and Claim the Rights of People with Disability in South Australia (2010-2020), was publicly released on 19 October 2011. The initial response of the South Australian Government was to agree to all recommendations in principle, with 17 of the 34 recommendations immediately committed to in full or in part. The Government has now committed to 32 of the 34 recommendations in full or in part. Implementation of the disability reforms is being overseen by the across-government Chief Executives’ Disability Reform Committee, which is chaired by the DCSI Chief Executive. TDisability Strategy (NDS), the proposerelated National Injury Insurance Sche
Review of the Promoting Independence Strateg
Since its introduction in 2000, the Promoting Independencepublic sector has become progressively more accessible and inclusive for peopledisability. In March 2011, a review of the Promoting Independence Strategy commenced to ensure ththe Strategy reflects a nfrnumber of which related to braccess and inclusion for peop The key findings and recommendatfrom the Strong Voices: A Blueprint to Enhance Life and Claim the Rights of People withDisability in South Australia (2010-2020) report. Strong Voices recommends a more detailed range of systemic responses to the issues of access and inclusion and the barriers to full citizenship for people with lived experience of disability. As a result, the Promoting Independence Strategy has been replaced with the implementation of Access and Inclusion Plans.

Annual Report 2011-12 31
ery of
strategies is applied, to enable and encourage citizens from ll walks of life to access services and participate in community life.
tions
ct 1993 was ed in the Social Inclusion Board’s disability blueprint Strong Voices.
access to
, targeted consultations were undertaken with groups that were not ecessarily well represented in the community meetings such as Aboriginal people, people
12, pecifically focused on seeking the views of people with a lived experience of disability on
the proposed provisions in a new Act.
nd
of reform for the provision of government support for people with disability. During 011-12, South Australia worked with the Commonwealth, State and Territory Governments
National Carers Strategy
licy
Claim the Rights of People with Disability in South Australia (2010-2020) in October 2011, following the largest disability community engagement in South Australia.
Access and Inclusion Plans will be agency-based strategies that support improved delivservices to our diverse population. They will encompass all people, particularly those who are disadvantaged, isolated or vulnerable to exclusion. People with disability will have a particular focus in Access and Inclusion Plans, which will ensure the appropriate level of planning and implementation of a Development of Access and Inclusion Plans aligned to the Strong Voices report recommendations will occur during 2012-13.
Review of the Disability Services Act 1993
In 2010-11, the former Minister for Disability announced that a review of the Disability Services Act 1993 would be undertaken, to ensure that it better reflects the United NaConvention on the Rights of People with Disability and recent developments at the State and
ational level. A new Disability Act to replace the existing Disability Services Analso recommend A Steering Committee was convened to undertake the review. The Steering Committee agreed not to duplicate the consultation process of the former Social Inclusion Board in the development of the Strong Voices report. The Executive Officer for the Review hadthe submissions and attended community meetings between 17 August and 23 September 2010. In additionnfrom culturally and linguistically diverse backgrounds and young carers. A final consultation which commenced on 28 May 2012 and was to conclude on 6 July 20sthe provisions in a new Act. This commitment reflected an understanding that previous consultation had not provided an adequate process for the people who are fundamentally central to the Act, to express their views on
National and State Initiatives
The National Disability Agreement (NDA), which commenced between the Commonwealth,State and Territory Governments on 1 January 2009, provides the national framework akey areas 2on the review of the NDA, to accommodate changes stemming from the: National Health Reform Agreement National Partnerships Agreement on Transitioning Responsibilities for Aged Care and
Disability Services NDS COAG’s commitment to reform disability services in Australia, through a NDIS. South Australia also contributed to the outcomes of the Agreement by: launching the South Australian Disability Register in September 2011, which creates a
central resource of consumer feedback to inform the development of disability po releasing the Social Inclusion Board’s report Strong Voices: A Blueprint to Enhance Life
and

Department for Communities and Social Inclusion 32
d
outh Australia contributed to the development of the NDS Implementation Plan during is
d the Department of the Premier and Cabinet. he Commonwealth, State and Territory Governments are working together to outline the
of the Strategy in Laying the Groundwork
people ith disability and their carers, recognises that community engagement is one strategy for
r
etwork SA, with
e advantage of a register being that it provides an opportunity for all South Australians with
y.
2012-13, the department will focus its attention on implementation of the full Consumer lity. The new model of consumer engagement offers a
lity Advisory allahan, to consider a high-level systems view of
– a dynamic safeguarding scheme for South Australians with disability lso vulnerable to neglect and abuse, included the following:
r all‐of‐government policy in this area, the Minister commissions ntity
existing gaps. safeguarding as a
The NDS, which was signed by First Ministers at the COAG meeting on 13 February 2011, sets out a ten year plan for improving the lives of Australians with disability, their families ancarers. Community and Disability Services Ministers are responsible for driving the implementation of the Strategy, which outlines a clear plan to improve the wellbeing, participation, and inclusion of people with disability across a range of fronts. S2011-12 through the NDS Development Officials’ Working Group. South Australiarepresented on the working group by DCSI anTapproach to implementing actions over the life(2011-2014), the first of three implementation phases.
Consumer Engagement Strategy for Disability
The department launched its Consumer Engagement Strategy for Disability pilot during 2011-12. The pilot, which considered the various mechanisms for communicating withwencouraging active citizenship for the department’s clients who are receiving disability services. The project paper Consumer Engagement Strategy for Disability made recommendations fothe development of a ‘disability register’ for members of the community to provide independent advice on specific topics that concern people living with disability, their familiesand their carers. The register replaces the role of the Disability Advisory Ntha lived experience of disability to express their views on topics of particular interest to them. A pilot of the Disability Register was launched in September 2011 to test the new strategAn evaluation of the pilot in May 2012 recommended that the pilot move to a full launch. InEngagement Strategy for Disabimethod to measure consumer understanding of the most important issues for people living with disability.
Protecting Vulnerable People with Disabilities
In June 2010, the former Minister for Disability asked the Minister’s DisabiCouncil (MDAC), chaired by Dr Lorna Hsafeguarding vulnerable people with disability. The recommendations of the MDAC report Inclusion & Protection who are a Under her responsibility fo
an immediate detailed audit of the current system of safeguarding in order to ide
The current review of the Disability Services Act (SA) 1993 considersmajor component of its brief, especially looking at current Victorian legislation.

Annual Report 2011-12 33
ervices
ach with
ork will enable a clearer focus on trengthening and auditing requirements for non-government disability service providers. In
for non-government agencies will focus on on to
Community Care Program
he Home and Community Care (HACC) program funds basic maintenance and support
and
011-12. The $177.7 million was allocated to over 160 funded agencies.
011-12, compared with 98 100 in 2010-11.
Government, for easier access to community care services for frail older eople and their carers. This is achieved by trained staff conducting a telephone based
providing information and referral to
ss2HomeCare for the
Inc .
t) from country South Australia. Access2HomeCare made 17 478 referrals to service providers to enable people to access the services they required. People can receive more than one service and from more than one service provider.
While South Australia already has a range of measures in place to protect people with disability from abuse and neglect, a detailed audit of the current system of safeguarding has been undertaken to identify any gaps. The review of the South Australian Disability SAct 1993 is underway, and has examined safeguarding measures as part of its considerations. In December 2010, all Disability Ministers agreed to develop a national consistent approto protecting vulnerable people with disability. South Australia is co-leading this work Victoria to develop new Standards for Disability Services and a Quality and Safeguard Framework. The proposed national Quality and Safeguards Framewsthe first instance, the performance review process assessing the adequacy of procedures and arrangements in all funded agencies in relatiaccess to, and handling of, client monies, consent to restrictive practices and management of complaints.
Home and
Tservices for frail older people, younger people with disability and their carers. The services include personal care, domestic assistance, delivery of meals, home maintenance modifications, respite care, social support and transport. These services support independence and community connections. HACC program funding increased from $174.3 million in 2010-11 to $177.7 million in 2 Approximately 100 700 people were assisted by HACC services in South Australia during2
Access2HomeCare
Access2HomeCare operates a centralised free telephone service on behalf of the ommonwealthC
pscreening of eligibility for HACC services, and alsoHACC services. To further streamline entry to the community care service system, Access2HomeCare wasexpanded to cover all of metropolitan Adelaide in October 2011. Community and Home Support SA, through Disability, Ageing and Carers, now operates Acceentire metropolitan Adelaide region, and Country Health SA Local Health Network
orporated for the country areas of Lower North, Gawler, Barossa and Yorke Peninsula
Between 1 July 2011 and 30 June 2012, 17 178 people contacted Access2HomeCare, with 14 447 (84 per cent) of enquiries from metropolitan Adelaide and 2731 (16 per cen

Department for Communities and Social Inclusion 34
ions, do not in their homes and have access to social supports.
ral bury
and southern metropolitan (Onkaparinga).
addition to direct transport provision, the Community Passenger Networks responded to rrals, coordinated the changing of 5814
20
in the inner southern and eastern metropolitan gions, to determine the feasibility and requirements of Community Passenger Networks in
ty f the Productivity Commission’s report on
upport, and to commence work immediately on foundational reforms for posal represents a fundamental shift in the way disability services are
ty support
outh Australia, along with other jurisdictions and the Commonwealth overnment, has been participating in discussions about options for funding and governance
ndividuals
ervices sector.
t
get, released on 8 May 2012, contained
1 billion over four years for the first stage of a NDIS, while the 2012-13 South Australian budget provided $20 million over three years commencing 2013-14 for a NDIS launch in South Australia.
Community Passenger Networks
Community Passenger Networks coordinate, broker and provide transport services for eligible HACC clients and transport people who are disadvantaged. They ensure that people with disability in regional areas, who cannot access or use existing transport opt
ecome isolatedb Community Passenger Networks are funded by the department and the Department of Planning, Transport and Infrastructure (DPTI) through the HACC program, and cover 13 ruand two metropolitan regions. The metropolitan regions are northern metropolitan (Salis
nd Playford)a During 2011-12, Community Passenger Networks reported the transportation of 47 226 individual one-way passenger trips, 12 437 vehicle trips and the transportation of 9967 different clients. It must be noted that some Community Passenger Networks have not collected all the required data for the 2011-12 financial year, therefore the number of trips reported is less than the actual outcome. In3544 general transport enquiries and refeappointments on behalf of clients to fit in with existing available transport and brokered 85services to commercial public transport in which the Community Passenger Network had partially or wholly financially contributed towards that service. Negotiations have commenced with councilsrethose regions.
National Disability Insurance Scheme
On 19 August 2011, COAG agreed to establish a Select Council of Treasurers and Disabiliinisters to consider the recommendations oM
Disability Care and Sa NDIS. The NDIS proprovided as it will ensure that an appropriate level of funding is available for disabiliservices in a fair and equitable way. It will also enable people to make choices about how this support is provided. During 2011-12, SGof a NDIS, as well as its overall design. To assist in preparing for a NDIS, South Australia established a NDIS Taskforce to provide advice to the State Government on reforms necessary to establish a functional and efficient NDIS in South Australia. The Taskforce comprises key government and non-government sector officials, as well as invited iwith lived experience of disability and relevant expertise and knowledge of the disability s On 30 April 2012, the Prime Minister announced the first stage of a NDIS, commencing on1 July 2013. Approximately 10 000 people with significant and permanent disability will starto receive support under the scheme in two launch sites, rising to 20 000 people by July2014 in four launch sites. The Commonwealth Bud$

Annual Report 2011-12 35
ider for people with
rget which seeks to increase the number of people
s including the relocation of
he following graph, from 2003-04 to 2010-11 the annual average growth rate the number of people with disability in stable supported accommodation was 5.78 per cent.
the baseline year of 2003-04 to 4860 as at 30 June
Disability Services
Objective Disability Services is the South Australian Government’s service provdisability. The division is responsible for providing services across the State, including supported accommodation, service coordination for adults and children, families and carers, specialist services including allied health, therapy and community nursing and services for children including the early childhood program, the school age and youth program and child and youth specialist services.
Performance Highlights
South Australia’s Strategic Plan
Target 11 of the revised SASP is a new tawith disability in stable, supported community accommodation to 7000 by 2020. Stable supported community accommodation includes those people with disability supported to livein their homes as well as other forms of community based accommodation, excluding people accommodated in institutions or hostels. The achievement of this target is supported by various activitiethe remaining residents of the Strathmont Centre to community purpose built group homes and the Disability Housing Project, which will provide 137 new client accommodation places. As reflected in tinThis represents an increase from 3280 in 2011.
Number of people with a disability in stable supportedcommunity accommodation (2003-04 baseline)
6000
0
1000
2000
3000
4000
5000
Nu
mb
er o
f p
eop
le
South Australia 3280 3645 3453 3900 3903 4271 4441 4860
Baseline 7000.0
2003-04
2004-05
2005-06
2006-07
2007-08
2008-09
2009-10
2010-11
2011-12
2012-13
2013-14
Data source: Australian Institute of Health and Welfare, National Minimum Dataset

Department for Communities and Social Inclusion 36
nt Centre Residents
he Strathmont Centre Redevelopment and Community Living Project commenced in 2006, relocate the residents to community purpose built group homes. During 2011-12, a total of
were moved to eight houses at six sites, built under the Commonwealth
Life and Claim the Rights of People with 010-2020) recommended that priority action be taken to close ll people to transition into suitable and appropriate housing by
o later than April 2013. Funding to complete Stage 3 of the Strathmont Centre ing Placements Project was announced in the 2012-13
dents, and their families where
isability Housing Project
works programs to deliver efficiencies and more cost effective outcomes in all stages f the project.
on by
duled for
Relocation of Strathmo
Tto32 residentsGovernment’s NBESP. The 32 residents were relocated as part of Stage 2 of the project, which was completed in December 2011. As at 30 June 2012, there were 26 residents at the Strathmont Centre, compared to 249 in 2005.
he report Strong Voices: A Blueprint to EnhanceTDisability in South Australia (2the Strathmont Centre, with anRedevelopment and Community LivState Budget. A total of $21.6 million over four years has been provided which includes a capital grant to the SAHT for the Community Living Placements Project of $13.5 million (over three years) for the purchase of land and the construction of houses. Stage 3 will lead to the final 26 residents being assisted to move to supported community
ousing. The department is working with the remaining resihpossible, to identify individualised preferences for community living and to determine appropriate support and suitable housing options.
D
The Disability Housing Project, which has total Commonwealth Government capital funding of $30.45 million, is on track to deliver 61 new disability accessible homes, providing 137 new client accommodation places. These outcomes are being achieved by combining two capital o
Through economies of scale, the NBESP will deliver a total of 41 dwellings providing 90 new places, and the Supported Accommodation for People with Disability with Ageing Carers Program a total of 20 homes providing 47 new supported accommodation places.
As at 30 June 2012, the NBESP has delivered 33 purpose-built dwellings for people with disability across metropolitan Adelaide, Port Augusta and Mount Gambier. A further eight apartments are still under construction at Woodville West which are due for completi31 July 2012.
The Supported Accommodation for People with Disability with Ageing Carers Program has completed construction for 37 client places across metropolitan Adelaide, Loxton, and Yalata. A further ten client places are under construction in Minlaton which are schecompletion by the end of July 2012.

Annual Report 2011-12 37
ces through the Primary Health Care model which involves clients, eir family, general practitioner and other health providers to maximise clients’ health and
the complex ealth needs of Disability Services’
ccommodation sites of Highgate Park and
urses and doctors assess people with at the Centre
ith clients and their families
r
dolescent Transition to Adulthood
Leaving school is a significant time in the life of a young person with disability and their family. It is a time of great change, of leaving behind the familiar environment of school, beginning life as an adult and exploring new challenges and opportunities. To assist adolescents with disability, strategies have been implemented to support their transition to adulthood.
Primary Health Care Model
While clients with disability often have complex health needs, their ability to access appropriate health professionals is often overshadowed by their disability, such as their ability to communicate. Disability Services supports people with disability to access mainstream health servithwellbeing. Community nurses supporthaccommodation clients by assessing and planning health care in partnership with clients, their family, carers and health practitioners. The Centre for Disability Health also offers specialist holistic service for people with disability who have complex health needs. The Centre operates from three sites, with two based at the aStrathmont Centre. The third site, the North East Clinic, is located on the grounds of the Modbury Hospital. Ndisability either in their home,for Disability Health or may see a client in a place that is the most appropriate to make the best assessment, such as at school. The community nursing service and the Centre for Disability Health nurses and
octors work wdto access general practitioners, dental care, mental health care and other health services such as x-rays. During 2011-12, community nurses made 4398 visits to accommodation clients and undertook 5742 health interventions whilst visiting clients. In addition, community nurses (excluding continence nurse advisors) attended 381 medical appointments with clients, in collaboration with accommodation services staff, to advocate foclients with complex health needs.
A
Children’s Service Model
During 2011-12, the Child and Youth Services directorate was established to provide a dedicated focus on tneeds of children and young people with disability and their families, and the quality of services provided to them. The directorat
he
e has commenced
g ssist them in the care of
their children.
the diagnosis of their child’s
implementation of a revised service delivery model aimed at maximising developmental outcomes for children and young people, and strengtheninfamilies to a
Features of the revised service delivery model include: the establishment of a welcome
program which provides support and information to families following
disability targeted, evidence-based
therapeutic interventions with an increased focus on the use of group programs.

Department for Communities and Social Inclusion 38
vices developed the information sheet Leaving School and r
te,
ervices also developed a guide and presentation pack for Disability Services staff, and provide a best practice guide for staff involved
nd indeability, pa
bility Servetwo ber of choo
mmenced the development of a Community Living ving. ple to the and he p 2 to
is on target to be operational b
r supn lives, driven by the principle
part of red g g a l,
e
ps w
uring 2011-12, a review was undertaken of
c and tion staff from April to June 2012. Research on
d the development of a framework for disability services, to enhance the ustainability of the Person-Centred Active Support model was also undertaken.
ed data for eligible people with disability who are waiting of the assessment and service allocation
uals on a priority basis, according to the urgency of
. From
t website. South Australia is the only State to publish such comprehensive data garding people waiting for disability services.
During 2011-12, Disability Serplanning for the future, which provides important points to consider when planning fotransition and a brief overview about the range of post-school pathways and options available. The resource, which is available from the South Australian Government websiincludes links to websites that will provide more detailed information, including eligibility andreferral.
isability SDto raise awareness of transition planning in transition planning. It is important that there is a coordinated atargeted information for students with dispost-school pathways and options. Disaeducation sector and established transition ninformation sessions and expos about post-s In November 2011, Disability Services coInitiative entitled Next Steps – Community Liwith disability to move from the family home department will work with individuals, familiesperson to live a good life in their new place. T
6 participants and
pendent approach to the provision of rents and teachers about the range of
ices has worked in partnership with the rks across the State to provide a numl pathways.
The program is designed to support peoir own home in the community. The carers to plan what is required for therogram will provide for approximately 1y December 2012. 1
Human Rights Framework
Person Centred Active Support is a model foactively involved, and participate, in their owdecision-making, engagement, empowerma broader human rights and person-centprocess of continual listening and learninnow and into the future. Delivery of the modof choice-making, community presence and ppersonal competence and relationshi
porting people living with disability to be s of choice,
ent, inclusion and citizenship. The model isframework, and is an ongoing and evolvinbout what is important to, and for, the individual involves training staff at all levels in the areas articipation, supporting people to develop
ith others.
the content of Stage 1 (Foundations of an rights considerations in supporting people of being person centred. Stage 1 training
DInclusion), which has a strong focus on humliving with disability, and the value and ethieducation was delivered to 420 accommodahuman rights ans
Unmet Need
isability Services record unmet neDfor services. This information is collected as part process. Services are directed to individneed. Since December 2008 unmet need data was published and updated every six monthsJune 2011, the unmet need data has been published monthly on the South Australian Governmenre

Annual Report 2011-12 39
Disability Services Unmet Need as at 30 June 2012
UNMET NEED
Category 1
Category 2
Category 3
Category 4
Total All Categories
Services Provided2010–11
Total Total Total Total Total
Services Services Services Services Services Total
Services 1. Accommodation Support
Supported Accommodation Basic 63 88 57 35 243 Moderate 341 167 113 85 706 High 122 39 35 52 248 Intensive 17 2 2 2 23
Total Supported Accommodation 543 296 207 174 1 220 Total Supported Accommodation –
Unique Clients 543 296 207 174 1 220
Personal Support Basic 86 118 142 46 392 Moderate 96 84 53 15 248 High 133 42 35 16 226 Intensive 23 9 2 2 36
Total Personal Support 338 253 232 79 902 Total Personal Support – Unique
Clients 338 253 232 79 902
Total Accommodation Support 881 549 439 253 2 122 6 400 Total Accommodation Support –
Unique Clients 840 530 419 246 1 934 5 468
2. Community Support Therapy Services 177 489 162 30 858 Behavioural Intervention 24 52 15 7 98 Counselling 14 12 14 6 46 Parents with Disability 5 4 0 0 9
Total Community Support 220 557 191 43 1 011 24 504 Total Community Support – Unique
Clients 164 382 139 38 686 16 727
3. Community Access Learning and Life Skills Development 25 35 23 29 112 Recreation Holiday Programs 32 41 39 44 156 Day Options 45 25 12 10 92
Total Community Access 102 101 74 83 360 9 380 Total Community Access – Unique
Clients 91 88 61 65 301 6 719
4. Respite Own Home 68 41 23 5 137 Out Of Home/After School/School Holidays
211 118 39 22 390
Total Respite 279 159 62 27 527 2 194 Total Respite – Unique Clients 263 156 56 24 494 1 735
GRAND TOTAL 1 482 1 366 766 406 4 020 42 478 Total Unique Clients 1 190 1 028 595 330 2 763 21 822
1. Unique clients should not be summed across service types or categories as some clients may have an unmet need recorded for more than one service type and/or category. 2. ‘Services Provided’ are those provided under the National Disability Agreement (NDA), excluding employment services for the
-11 (latest available data) from the Disability Services National Minimum Data Set (NMDS). period 20103. Clients with an unmet need may also have received a service in 2010-11 or be currently receiving a service. Category 1 – Critical (Homelessness/immediate and high risk of harm to self or others) Category 2 – Evident (Risk of harm to self or others/risk of homelessness) Category 3 – Potential (Deteriorating health and/or ability of a client or carer) Category 4 – Non Urgent (Improvement in current situation)

Department for Communities and Social Inclusion 40
Domiciliary Care
ObDomiciliary Care works to increase peoples’ abilit care f emselv suppo pe
tly at home.
vailable to people living in etropol Adelai physical th ement alliativ ase ma ement d pers l carser upport for carers
nce Highlights
Performance Indica
As at 3 are h 206 active clients, including lliativerehabilitation and e clien ang client le has n an asethe proportion o age ears 50 p nt in 2 -11 pe
-11 and
jective y to or th es, rting ople
to live independen Aged care services are a m itan de and include
erapy, rehabilitation, d ia, p e, c.
nag an ona e vices, as well as respite and s
Performa
tors
0 June 2012, Domiciliary C ad 7 pa , quipment only ts. Ch es in profi see incre in
f clients over the of 80 y , from er ce 010 to 57.4 r cent in 2011-12, and a reduction in those living alone from 48 per cent to 43.3 per cent. Of the total active clients, 1316 (18.3 per cent) were from a culturally and linguistically diverse background. This is an increase from 1128 clients (17.7 per cent) in 2010
exceeds the HACC target of 17.5 per cent of total active clients.

Annual Report 2011-12 41
ere were 154 Aboriginal and Torres Strait Islander clients which of total active clients. While this is a small decrease from 2.2 per
ent as at 30 June 2011, it is above the HACC target of 1.5 per cent of total active clients.
ighly valued by staff. Supporting staff through consultation, communication and ollaboration were seen as critical factors in achieving good responses, and managers and
felt confident that this had been improved following the project initiatives.
nagers and external collaborators highlighted the wider
es ence sector and the abuse of older
eople sector. One area to be considered in the new plan is how to further develop ings between these two sectors.
n an ongoing portfolio role was established to consolidate and he Strategy.
ns for the
As at 30 June 2012, th
quates to 2.14 per cent ec Domiciliary Care delivered 417 247 hours of direct service during 2011-12, exceeding the target of 410 000 hours. As at 30 June 2012, an average of 6.3 hours of direct service per client per month has been provided. Personal care, domestic assistance, social support, centre based day care and case management were the top five service types provided for the year. Establishing new short term reablement services, increasing and realigning dementia services, implementing a client outcome measurement tool and improving home base respite services have been achieved during 2011-12.
Prevention of Abuse of Older People
The Response to the Abuse of Older People Strategy 2008-2010, provides Domiciliary Care staff with an ongoing framework to respond effectively to older people at risk of harm. The strategy is based on work in response to Our Actions to Prevent the Abuse of Older South Australians, an outcome of Improving with Age: Our Ageing Plan for South Australia. During 2011-12, a formal evaluation of the strategy was undertaken to assess its impact on: the ability to improve support to older clients experiencing abuse staff dealing with complex family situations the extent of reporting of elder abuse. The evaluation identified that knowledge, systems and resources to address abuse were hcsupervisors It was noted that ways to include brokerage staff in a team based response to abuse require further development. Senior maleadership role in the field taken by Domiciliary Care. The project presented an opportunity to observe and participate in discussions on differencand similarities that exist between the domestic violprelationships and understand As a result of the evaluatioextend implementation of t
DCSI Equipment Program
The statewide DCSI Equipment Program services the equipment and home modification eeds of clients of Disability Services, Novita Children’s Services and Minda Incorporated. n
Assessment and prescription is undertaken within the specialist services of Disability Services, Domiciliary Care and Novita Children’s Services. Domiciliary Equipment Service
ES) manages the supply and maintenance of all equipment and home modificatio(Dequipment program.

Department for Communities and Social Inclusion 42
d
quipment modifications and 635 home modifications were supplied to clients of Disability
quipment supply times (once a prescription was received at DES) were 4.2 days r stock items and 2.3 days for consumable items. Supply of customised items averaged
s for less than 6800 repairs for clients of isability Services and Novita. As at 30 June 2012, the Equipment Program had completed
der Services Strategy boriginal or Torres Strait Islander background.
e clients were of Aboriginal or Torres Strait Islander ackground, exceeding the HACC target of 1.5 per cent of total active clients.
g 2011-12
process, specifically to the cultural needs of Aboriginal and Torres Strait Islander clients
der
inter-agency collaboration with Aboriginal service providers to explore the dementia needs
ent of an
identification of Domiciliary Care’s OPS2 Paramedical Aide positions as a ‘target role’ for nal
e increased Aboriginal client representation on Domiciliary Care’s Consumer Advisory
proved engagement of Aboriginal clients and carers
g
The equipment program exceeded 2010-11 levels in equipment, home modifications anequipment modifications provided to people across all age groups for 2011-12. A total of 7349 items of equipment (including 2647 new items), 3137 consumable items, 1135 eServices and Novita. For clients of Domiciliary Care, 15 006 items of equipment (2987 newitems), 4768 consumable items, 35 equipment modifications and 2713 home modifications were supplied. Average efo42 days, with powered wheelchairs averaging 110 days. The target for repairs completed in 2011-12 waD6777 repairs, meeting the target. In the previous 12 months the Equipment Program extended its equipment services to also service clients of Minda Incorporated. As at 30 June 2012, 326 items of equipment and 114consumable items were supplied to Minda clients.
Aboriginal and Torres Strait Islander Services Strategy
When Domiciliary Care launched its Aboriginal and Torres Strait Islanin 2008-09, one per cent of all clients were of AAs at 30 June 2012, 2.14 per cent of activb Key outcomes of the Aboriginal and Torres Strait Islander Services Strategy durininclude: improving Domiciliary Care’s client service model following a comprehensive review
four Domiciliary Care Aboriginal Services Advisors completed Certificate 4 in HACC, to support an increased role in service coordination for Aboriginal and Torres Strait Islanclients
of the Aboriginal community, with a view to developing an Aboriginal-specific Dementia Day program which Domiciliary Care clients will be able to access
the facilitation of a Cultural Training Needs Survey to inform the further developmAboriginal cultural competency training program for staff
the DCSI Aboriginal Employment Pool, as a means of increasing the number of AborigiParamedical Aides in Domiciliary Car
Committee, to promote im
improved visibility of Domiciliary Care’s services amongst the wider Aboriginal community, through attendance at significant Aboriginal events such as Reconciliation Week and theNational Aborigines and Islanders Day Observance Committee (NAIDOC) Week, resultinin increased referrals to Domiciliary Care services.

Annual Report 2011-12 43
ssment and review.
n been developed to guide and inform
o
services.
site and multi-disciplinary Journal Club ave further promoted availability of information to staff on evidence based falls prevention.
Preventing Falls and Harm from Falls in Older People
In 2010, a detailed review was undertaken of Domiciliary Care’s knowledge and practice regarding falls prevention. The aim of the project was to achieve best practice in this important area of client safety in the home and community, in line with Domiciliary Care’s clinical governance framework. The project has resulted in the identification and implementation of a standardised and evidence based screening tool for use at the point of lient entry assec
During 2011-12, all common falls risk factors within the National Guidelines for Falls Prevention have been identified and a referral and management pathway for each has bee
stablished. A ‘Multi-Disciplinary falls referral matrix’ has eallied health staff and management. Allied health referral and assessment tools have alsbeen reviewed to ensure timely identification of falls risk factors, and that clinical management is aligned to the National Guidelines for Falls Prevention and with other ommunity and centre based fallsc
Falls Portfolio Holder roles have been established within each client services team to undertake ongoing education on falls prevention and to promote use of the Domiciliary Care alls clinical pathways. Establishment of a falls teamf
h The Client Incident Reporting System (RiskMan) has also assisted in the systematic review of falls related events, actions and outcomes on a quarterly basis. A set of client profiles and clinical reporting examples for falls events have been developed to promote staff reporting of falls.

Department for Communities and Social Inclusion 44
Communities and Partners
Community Connect
Objective Community Connect coordinates and promotes initiatives that improve service delivery of non-government community service agencies funded by the department and reports on funding provided to community organisations. It undertakes planning and management of grant programs to community organisations that provide services to help families and improve the quality of life of the community. These programs include Community Benefit SA, the Family and Community Development Program, Dame Roma Mitchell grants, Aboriginal Youth Development Program and Aboriginal Youth Action Committees. Community Connect provides quality and continuous improvement guidance and training to organisations through the Australian Service Excellence Standards.
Performance Highlights
Family and Community Development Program
The Family and Community Development Program is a State Government funded program for investing in a strong community services sector. The program, legislated under the Family and Community Services Act 1972, was established to ‘support, promote or extend any service, project or facility that will advance the welfare of children, youth or any other section of the community’.

Annual Report 2011-12 45
ted funding of approximately $9 million to non-authorities to provide a range of community-
ased services, including parenting skills classes, financial budget and family counselling,
rants to individuals bi-annually.
209 909 was granted to 155 applicants to provide development pportunities, contribute to health and wellbeing and assist the child or young person to
onal goals. This included $92 104 to children and young people with disability
d
haritable and Social Welfare Fund. Under the ct, the program receives $4 million per annum from gaming machine taxes for distribution in
le and social welfare organisations.
ity taged individuals, families and
During 2011-12, the department alloca
overnment organisations and local government gbyouth support, community engagement projects, home visiting services and mobile crèches. Currently 63 agencies are funded through 108 service agreements, with the majority concluding on 30 June 2012. Of these agencies, 97 per cent have achieved the agreed outcomes described in their service agreements. The Family and Community Development Program is undergoing a reform to align the program with the current community services environment and benefit individuals, families, communities and service providers. During the reform process, service agreements with funded agencies that have met their obligations have been extended to 30 June 2013.
Dame Roma Mitchell Trust Fund for Children and Young People
The Dame Roma Mitchell Trust Fund for Children and Young People was established in 2003 by the South Australian Council of Social Service and the South Australian Government to provide support to children and young people who are, or who have been in State care. Three deeds for the Trust Fund have been established: the original deed a deed for children and young people with a disability a deed to create the Dame Roma Mitchell Foundation for Children and Young People
which raises funds through donations, general fundraising and workplace-giving. Income from investments plus one tenth of the balance of the DRMTF capital may be made available for distribution annually. The department administers the fund and distributes g During 2011-12, a total of $oachieve persand $7535 through the Foundation. In September 2012, administration of the Dame Roma Mitchell Trust Fund will be transferreto DECD and the Minister for Education and Child Development will be responsible for the Trust Fund.
Community Benefit SA
The department administers the Community Benefit SA program, which was established under the Gaming Machines Act 1992 as the CAthe form of grants to charitab Grants are provided to organisations to improve the quality of life, wellbeing, communparticipation and life management skills of disadvancommunities in South Australia.

Department for Communities and Social Inclusion 46
t
.
orates a accredited community
and service delivery.
Quality improvement in non-government tions ensures that funded service
in he
department to achieve its objectives by
able providers in planning and governance, financial and contract management, risk
d
complaints and service outcomes.
s, the third version of the Quality Improvement Standards for the Health and ommunity Services Sector was officially launched in December 2011.
ers and e engagement for young Aboriginal people in recreational,
cultural and life skill development activities.
In December 2011, the program distributed funds totalling $664 140 for 120 equipmengrants to benefit community service organisations. In May 2012, community organisations were invited to submit grant applications and with the aim of approving a further $3.2 millionin the 2012 calendar year. During 2011-12, the program operations were also reviewed to assist in reducing red tape, improve access and simplify the application process for community service organisations
Australian Service Excellence Standards
The diverse and complex community services sector is supported in improving organisational quality and performance through the DCSI Australian Service Excellence Standards, which incorpset of internationally service standards that assist non-government organisations to improve their business systems, management practices
organisaproviders meet quality requirements withservice agreements. It also assists t
increasing the number of non-government organisations that are assessed as cap
management and occupational health safety and welfare, human resources ancultural diversity, customer satisfaction and
During 2011-12, 230 South Australian organisations funded by the department were engaged in the Australian Service Excellence Standards. Following an extensive review of the StandardC To assist in reducing the regulatory burden on non-government organisations, the department is also undertaking a process of mapping key Commonwealth Government community standards against the Australian Service Excellence Standards to identify gaps and reduce duplication.
Aboriginal Youth Development Program
The Aboriginal Youth Development Program employs community based youth workprovides funds to promote positiv
Aboriginal Youth Action Committees
Aboriginal Youth Action Committees act as a forum for engaging Aboriginal young people on relevant key issues through partnerships with schools, Aboriginal-led youth services and other regional networks. The Committees have contributed to the development of young Aboriginal leaders who are now
ent, arts and
Committees is provided to 17 rural,
ver, a 12 month extension has been
working in leadership roles within the education, governmcommunity sectors. Funding for Aboriginal Youth Action
remote and regional Aboriginal communities. All Service Agreements expire on 30 June 2012, howe
approved to accommodate the review of service agreements.

Annual Report 2011-12 47
ed
ence of the youth workers in delivering programs within their ommunities. Qualifications take two years of study to complete.
Certificate IV in Youth Work Diploma in Youth, and ssessment.
Dedicated funding is provided to support and provide youth workers with access to accredited and culturally appropriate Youth Worker training. Relationships Australia is fundby the department to provide training, which enhances the community development and youth work skills and confidc Youth workers are provided with a career pathway and undertake studies to achieve:
Certificate in Training and A

Department for Communities and Social Inclusion 48
t South Australians ith the
les, funerals and personal alert systems. Service planning for is also provided, including gambling help services funded
he department is also responsible for coordinating State disaster recovery and relief, and the registering and mobilising of volunteers for emergency recovery. This also includes ensuring a consistent approach to the management of volunteers engaged directly by the department or by organisations receiving departmental grants, and working to increase the number of volunteers.
Performance Highlights
Personal Alert Systems Rebate Scheme
The Personal Alert Systems Rebate Scheme was launched on 8 April 2011, to assist frail older South Australians who live alone and are at risk of falls or medical emergencies, to obtain a personal alert system. The Scheme provides a rebate of up to $380 to approved applicants aged 75 years or more for the purchase and installation of an approved personal alert system, and up to $250 per year to help pay for monitoring services. Personal alert systems are devices that enable people to call for help in an emergency, if they are unable to access or use a telephone. These systems generally consist of a lightweight pendant, worn on the wrist or around the neck that can be activated to alert someone of the emergency, such as a neighbour, relative, friend, or monitoring centre. As at 30 June 2012, the department had received 3503 applications since the commencement of the Scheme in April 2011.
Medical Heating and Cooling Concession
The South Australian Government’s Medical Heating and Cooling Concession, which commenced on 1 January 2012, is available to South Australians who are on a low income or pension and have a qualifying medical condition, such as multiple sclerosis or Parkinson’s disease, and require the use of air conditioning because they have a verified medical need for close control of environmental temperature due to an inability to self regulate body temperature. The concession is provided to eligible applicants, in addition to the current energy concession, to help with the higher costs of electricity or gas incurred because of the frequent need to use air conditioning in the home to regulate body temperature. It is also available to the eligible parents or guardians of a child who has a qualifying medical condition. In 2011-12, the concession payment was $158 per annum, paid quarterly. This increases to $165 per annum on 1 July 2012. In the first year, the concession is backdated to 1 July 2011 for eligible applicants.
Community Support Services
Objective ervices are provided by the department that directly or indirectly supporS
on low incomes and their communities; including a range of State concessions, help wcost of public transport, spectac
tionsproblem gambling interventhrough the Gamblers Rehabilitation Fund. T

Annual Report 2011-12 49
were received. Of these, 1276 were approved with assessed as not currently eligible for the
oncession. 176 applications were being validated or followed up with either the applicant or l practitioner for further details to support the application.
012, assistance was provided for 272 funerals, comprising 260 ‘after the event’ grants. Most support provides for cremations,
owever, burials are provided in limited circumstances, for example, if the deceased cannot ral/religious reasons. During 2011-12, 75 burials
t financial
ounselling and therapeutic services for people impacted by problem gambling. The Fund is ,
tional and
vide services re non-government organisations, government
ervice providers, as well as private suppliers that are used for information products and g help services continued to be provided
selling
lso offered to people who are, or are at risk of entering the criminal justice
d Aboriginal populations throughout South Australia. Additional funding was
As at 30 June 2012, 2548 applications
148 concessions paid, and 1096 applicants 1ctheir medica
Funeral Assistance Program
The Funeral Assistance Program provides financial help to eligible applicants to cover the cost of basic funeral expenses. The income, assets and liabilities of the deceased person and their immediate relatives are assessed in determining eligibility for assistance. Two types of financial assistance are provided: full contract assistance for the cost of a basic funeral where a private funeral director has
not already been contracted after-the-event payment of up to $625, directly to the funeral director, to assist with the
cost where a private funeral director has already been contracted. In the 12 months to 30 June 2‘full contract’ funerals and 12 hbe identified or if a burial is required for cultuand 185 cremations have received support through the Program.
Gamblers Rehabilitation Fund
The Gamblers Rehabilitation Fund was established under the Gaming Machines Act 1992 toprovide a statewide systematic approach to gambling counselling, specialiscadministered by the Office for Problem Gambling and has an annual budget of $5.9 millionwhich comprises $3.8 million from the State Government and $2.1 million from institumembers of the gaming industry – Australian Hotels Association, Licensed Clubs of SA the Skycity Adelaide Casino. Through the Gamblers Rehabilitation Fund, service providers are funded to profor problem gamblers. The service providers asadvertising services. During 2011-12, gamblinacross the 12 State regions, offering free and confidential gambling and financial counservices and referral to therapeutic services. Funding is also provided for special purpose services for culturally and linguistically diverse communities, including Aboriginal, Chinese, Vietnamese and Cambodian populations.
ervices are aSsystem. The Statewide Gambling Therapy Service provides therapeutic gambling help services, including Cognitive Behavioural and Expose Therapy. It delivers specialist therapeutic interventions to clients experiencing problem gambling, including culturally and linguistically iverse and
provided to the Service in 2011-12 to refine gambling assessment tools for use with Aboriginal people, to improve access to gambling help services.

Department for Communities and Social Inclusion 50
n
tate Recovery Office
s in partnership with Commonwealth, State and local
so State
ecovery Committee, in coordinating all recovery activity across the State.
to explore issues associated with urban earthquake recovery. Topics for discussion included
the telephone and via the ternet from members of the public sector in a successful exercise.
overy Office obtained funding to undertake the following
of vulnerable people; information on
erable
f the Business Continuity Coordination program, the State Recovery Office
During 2011-12, an additional $300 000 was also provided from the Gamblers RehabilitatioFund to Relationships Australia (SA) and Anglicare to trial four specialised financial gambling counsellors across South Australia which will be evaluated in 2013.
S
The State Recovery Office workgovernment agencies; non-government bodies; and communities to ensure the State’s disaster recovery plans and arrangements are ready to operate in a disaster. The Office alsupports the Assistant State Coordinator Recovery (if appointed) and/or Chair of theR During 2011-12, the State Recovery Office facilitated five multi-agency discussion exercises
‘Environment’ and ‘Infrastructure and Economy’. Identified issues requiring further work arebeing addressed. The State Recovery Office manages an online system to allocate volunteers who offer to lend a hand to help disaster affected communities in recovery operations. This system, known as VERIS (Volunteer Emergency Recovery Information System), is activated and promoted only when volunteers are needed. During October 2011, VERIS was tested in a mock bushfire exercise. Trained staff processed registrations overin The Stockport community has continued to be supported following the severe storm and flooding that affected the township in December 2010. In particular, the State Recovery Office assisted the Local Recovery Committee to complete community recovery projects identified by the community. Projects that were completed, utilising $100 000 allocated by theState Government, included an upgrade of the Stockport Institute, provision of a post office facility and a sporting facility upgrade.
uring 2011-12, the State RecDprojects: the development of the National Guidelines for Managing Donated Goods. The Guidelines
were launched on 27 April 2012 by the Hon Nicola Roxon MP, Attorney-General and Minister for Emergency Management, and the Hon Jennifer Rankine MP, Minister for Emergency Services. Funding was carried over into the 2011-12 financial year for editing, publishing, undertaking a national launch and disseminating the completed guidelines
a vulnerability project to provide a definitiongeographic locations of vulnerable people and hazard prone areas; a list of products, services, projects and/or programs provided to vulnerable people. The aim of the project was to make recommendations regarding identified gaps in service provision to vulnpeople.
s part oA
developed an Extreme Events Management Policy and an Extreme Events Plan for the department. These documents take an ‘all hazards’ approach and focus on services delivered by the department to clients. They provide an overarching framework for pre-existing plans for bushfire preparedness, extreme heat and pandemic influenza.

Annual Report 2011-12 51
ef and Recovery as ‘one-stop shops’ to provide direct assistance. The Community ice also gathers information about community needs and provides
s a
ervice for the mainder of 2011-12 while a transition program to Housing SA was implemented.
s from participating non- government agencies. Altogether over 200 eople participated in the mock recovery centre exercise.
provided Emergency Relief Centre
outage
r in the Adelaide metropolitan
Ca
To
present in relatively high
The focus to date has been on rural South Australian regions. Rollout of the project in the metropolitan area is now underway.
Community Services Functional Service
The Community Services Functional Service establishes and manages immediate relief and ecovery services for affected community members. Emergency Relir
Centres are established Services Functional Servan active referral service to promote the uptake of a wide range of recovery services. Aresult of the machinery of government changes, Families SA transferred to DECD on 1 January 2012. Families SA retained responsibility for the Community Services Functional Sre In October 2011, a major emergency management exercise was conducted by the Community Services Functional Service. Participants included 91 departmental staff and over 100 volunteerp In the 12 months to 30 June 2012, staff of the department: attended the Zone Emergency Centre
and community meetings associated with the Wilmington Bushfire in January 2012
services during the Wallaroo Silo fire in February 2012
were activated during the Wingfield industrial fire in March 2012
were activated in May 2012 to assist the community during the Whyalla gas
assisted the community following severe weathearea in June 2012.
rers Recognition Act 2005
further the intent of the Carers Recognition Act 2005, the Office for Carers has conducted promotional work such as the Gateways Project which provides information for carers and service providers at service points where carers can be
xpected toenumbers. The aim of this is to increase the awareness of the significant health impact for carers in undertaking this role, and to facilitate referral of carers to carer support services.
Volunteering
During 2011-12, the department was assisted by approximately 1450 volunteers in Disability Services,
activities, appointments and shopping.
Awards ceremony was held in
Services in South Australia for over 50 years.
Domiciliary Care, Housing SA and the Office for Women. Volunteers contributed many hours by transportingchildren and people with disability, supporting older people with social
The annual Volunteer Recognition
December 2011 at the Adelaide Zoo. The contribution made to the activities of the department by over 40 volunteers was recognised with the presentation of certificates and gifts. In addition, a special award was presented to Mr Dave McNally who has volunteered with Disability

Department for Communities and Social Inclusion 52
r in a national research project on young carers,
e le who
ing role were invited to attend, with the findings to be incorporated into the
Act 2005
The department was also a Research Partneled by Professor Bettina Cass of the University of New South Wales. The final report Young Carers: Social policy impacts of the caring responsibilities of children and young adults, was publicly released in December 2011 and is available from the website of the Social Policy Research Centre at the University of New South Wales. A forum to present the findings and implications for South Australia was conducted on 5 Jun2012. Government, non-government and organisations with an interest in young peop
ndertake the carudevelopment of a South Australian Carers Policy.
here is a legislative requirement to review the operation of the Carers RecognitionTafter five years. During 2011-12, the Office for Carers completed this review.

Annual Report 2011-12 53
n 23 September 2009, the South Australian Government announced that a new Youth Training Centre would be built at Goldsborough Road, Cavan, to replace the Magill Youth Training Centre. The new purpose-built secure facility will safely and securely accommodate 60 children and young people within an open-campus style environment. The new facility, which will reflect up-to-date national and international Juvenile Justice Conventions and Standards, aims to: provide a safe and secure environment for staff, visitors and residents prevent escape alert staff to emergency situations and incidents control and promote positive behaviour of young people prevent self harm and monitor residents at risk to themselves and others protect and keep the community safe. Site works commenced on the new Youth Training Centre at Goldsborough Road in January 2011. In the 12 months to 30 June 2012, structural steel works were completed to all buildings, with roofing, brickwork and wall cladding close to completion. The fit-out and furnishing of buildings commenced, while ongoing work was undertaken to complete the 5.5 metre perimeter precast wall with anti-climb drum on top. The development of an integrated commissioning plan to support the move into the new facility was also developed, with implementation of the plan commencing in April 2012. Construction of the new Youth Training Centre will be completed by the end of August 2012, which will be followed by a brief period of business transitioning before full operational commencement.
New Service Model at Youth Training Centres
The construction of the new Youth Training Centre provides an opportunity to develop a new philosophy and service model for South Australia’s juvenile custodial context. The New Directions Framework developed by Youth Justice introduces a new way of working with children and young people in detention. It lays the foundation for a new model of service delivery which emphasises that community safety is at the core of how we provide a through-care rehabilitation and reintegrative approach to custodial care.
Youth Justice
Objective outh Justice provides services to assist children and young people who have offended to Y
reduce the risk of re-offending, facilitate the restitution to victims and communities as appropriate and provide secure youth training facilities for young people who are detained.
Performance Highlights
New Youth Training Centre
O

Department for Communities and Social Inclusion 54
Directions Framework, a new model has also been developed to better d manage behaviour problems that will lead to improved support for both
taff and young people. This new behaviour management approach will be augmented by systems within the new Youth Training Centre. All security initiatives
ent continued to implement sustainment works at the Magill ure it remained operational until its closure. To ensure an
proved quality of life for residents and to resolve safety issues, only works relating to welfare issues were undertaken.
ders include those who are on supervised bail,
compared to 643 in 2010-11.
ner package in the Changing nced offenders.
ntervention for youth on community based orders. ngoing skills development opportunities were also provided to staff in all core requirements
uch as
es
g, and provision of opportunities make a contribution to the community.
will g youth leadership skills and enabling youth to recognise their
sponsibility to their community.
Alongside the New
entify, assess anidsstate of the art security will be unobtrusive with a main focus of guiding and proactively managing children and young people.
agill Youth Training Centre Sustainment Works M
During 2011-12, the departmYouth Training Centre, to ensimoccupational health safety and In the 12 months to 30 June 2012, works at the Magill Youth Training Centre included the upgrade of the ablutions area, installation of air-conditioning, improved lighting and a new bedroom monitoring system.
Community Based Orders
Young people on community based orprobation or parole. During 2011-12, the number of youth who had one or more community order starts was 655, During 2011-12, Youth Justice implemented a Train the TraiHabits and Reaching Targets (CHART) individual program, for use with senteThis is now the principal offence focused iOof their business area, as well as opportunities to access training in specialist areas sAboriginal mental health specific training. Following the machinery of government changes, Youth Adventure and Recreation Servicnow delivers services to youth involved in the criminal justice system and youth underGuardianship or care of the Minister. Programs for youth in the criminal justice system include social development and life skill enhancement traininto New programs, specifically for Aboriginal youth, are being developed. These programs focus on developinre

Annual Report 2011-12 55
munities we all want to live in, where everyone feels they belong. It forges munity to ensure that people are not
t
rtunity to shape and be part of our community.
ntage
Social Inclusion
Objective Social Inclusion focuses on harnessing the department’s efforts in diverse areas to achieve
e kind of comthstrong partnerships between government and the comoverlooked. Social Inclusion leads selected whole of department and whole of governmenwork where a collaborative effort is required to address significant social exclusion issues.
Performance Highlights
South Australia’s Strategic Plan
The revised SASP includes a modified target and a new target to create an inclusive State where everyone has the oppo
Target 16: Economic disadva
f
income share of the low income group in
ways to employment. This is being achieved
VET)
elivered by the Department of Further Education,
to training, er Skills for All, or directly to employment.
ocial and community support for vulnerable people, to enable increased access to income, is also provided through the Medical Heating and Cooling Concession Scheme and the Low Income Support component of the Family and Community Development Program.
Target 23: Social participation
Target 16 is a modified target which seeks to increase by two percentage points the share ototal household income earned by low income South Australians by 2020. Positive movement has been made against the target as theSouth Australia in 2009-10 was 10.5 per cent, compared to ten per cent recorded in 2007-08. The data source to measure progress against this target is the Australian Bureau of Statistics (ABS) publication Household Income and Income Distribution, Australia (Cat. No 6523.0), with low income being defined as persons in the second and third income deciles. Strategies being implemented to achieve Target 16 include increasing participation in vocational education and training and paththrough various programs including: the implementation of Skills for All, which commenced in 2011-12, with all South
Australians over 16 years of age on a prescribed vocational education and training (pathway eligible for a South Australian Government funded training subsidy to meet individual needs and industry demand
South Australia Works, which is being dEmployment, Science and Technology, which is delivering projects across all State Government regions, engaging over 10 000 participants who are disconnected from or facing disadvantage in the labour market. Participants progress onto pathways connecting to opportunities und
S
This is also a new target which aims to increase the proportion of South Australians participating in social, community and economic activities by 2020. The data source to measure progress against the target is the SASP Household Survey, with the 2012 Household Survey establishing the baseline data.

Department for Communities and Social Inclusion 56
71.5 per cent of survey respondents were considered to be f social and community activities.
ainst Target 23 is being achieved through various programs including:
y ,
Community Benefit SA which distributes small grants to support community activity and rojects, particularly amongst disadvantaged people and
communities ’s Youth Strategy 2010-2014 which focuses on the four
action of health and wellbeing, education, employment
ance Life and Claim the Rights of People with
d the
he report promotes the following six key areas of reform: creating accessible and inclusive and
Threp
th Australians
undtable of the social
igging Deep. Ongoing discussions have focused on ways of social
contact point, the Department for Manufacturing, Innovation, Trade, Resources and Energy (DMITRE) is now the lead agency for the mineral and energy sector to link with appropriate government services, as the sector pursues the achievement of social benefits for the South Australian community.
The survey found that
articipating in a range op Progress ag the Family and Community Development Program which was established under the
provisions of the Family and Community Services Act 1972, to ‘support, promote or extend any service, project or facility that will advance the welfare of children, youth or another section of the community’ and consists of five sub-programs: Families with ChildrenNeighbourhood Development, Young People, Low Income Support and Industry Supportand Development
community development p
the youthconnect South Australiainterconnected priority areas for and skill development, engagement and participation, and better connections which provide a strong foundation for young people to achieve positive life outcomes.
Strong Voices: A Blueprint to EnhDisability in South Australia (2010-2020)
In December 2009, the Premier referred to the Commissioner for Social Inclusion anSocial Inclusion Board the task to develop a blueprint for the way people with disability, their families and carers are supported in South Australia. Strong Voices: A Blueprint to Enhance Life and Claim the Rights of People with Disability in South Australia (2010-2020), was released on 19 October 2011. Tcommunities; providing choice, taking control; strengthening rights, protection, advocacysafeguards; investing early; diversifying housing choices; and shaping accessible and inclusive services.
e South Australian Government has committed to 32 of the 34 recommendations of the ort in full or in part.
Premier’s Mining Roundtable
In 2010, the Premier requested the Social Inclusion Board to provide advice on ways to ensure that disadvantaged South Australians share in the predicted economic benefits of mining in the State. In November 2010, Digging Deep – the social benefits of mining in South
ustralia was published. It highlighted the social benefits from mining for SouAand also recognised the mining sector’s contributions in delivering outcomes in areas such as Aboriginal employment, training and other corporate social responsibility initiatives.
n 22 September 2011, the Premier and the incoming Premier hosted a Mining RoOdinner for senior mining executives at Parliament House, to build on the success benefit initiatives published in Densuring that the flow-on benefits from South Australia’s mining industry improve theand economic wellbeing of communities. In response to a request from the mining sector for a single

Annual Report 2011-12 57
iversity of Adelaide, undertook e
r
Thpuwh
l
Adult Offending Reference
uring 2011-12, Social Inclusion, in conjunction with the UnDresearch to identify those factors which influence recidivism of female offenders. ThDepartment for Correctional Services supported the research with access to data, seniostaff and clinicians involved with women in correctional facilities.
e research report Rehabilitation or Recidivism: best practice for female offenders was blished in October 2011 and is available from the South Australian Policy Online website, ich is hosted by the University of Adelaide.
The issue of female offenders continues to be addressed by the Department for CorrectionaServices as part of its core responsibility.

Department for Communities and Social Inclusion 58
Office for Youth
Objective The role of the Office for Youth is to assist young people between the ages of 12 to 25 to successfully navigate the transition from adolescence to adulthood, and to support the youth sector to achieve positive outcomes for young people. This is achieved through the: development of resources to inform service delivery provision of opportunities through grants, programs and strategic initiatives provision of sound policy and support to the youth sector.
Performance Highlights
Vulnerable Youth Framework
The youthconnect South Australia’s Youth Strategy 2010-2014, proposed the development of a strategy to help ensure that vulnerable young South Australians receive the support and services they need to overcome the difficulties they face and realise their potential. The proposed Vulnerable Youth Framework will underpin all policy developments related to vulnerable young South Australians. It will become the mechanism by which efforts can be concentrated across government to create consistent responses and coordinated approaches, both locally and across the State.

Annual Report 2011-12 59
was developed to start wider discussions and to seek input and ideas youth sector organisations and the wider
ommunity, around the key elements for inclusion in the strategy. The paper was released
he Office for Youth worked with the ustralian Human Rights Commission to
Cyberbullying and the
ssment.
he project has a number of elements including a social media campaign and a competition them to develop short films around the impact of
outh g
60 YACs ar of a three year grant funding agreement
tended to provide greater stability for the YACs and to help strengthen the program. During the year approximately 900 young people participated and contributed to decision making within their local communities.
A consultation paper
om government departments, non-government frcfor consultation in June 2012 until late August 2012. It was distributed through the youth sector and was available on the Office for Youth’s website.
Safer Social Networking Education and Awareness Campaign
In 2010-11, the Office for Youth conducted the Safer Social Networking Education and Awareness Campaign to highlight the risks to young people online. As part of the campaign, during 2011-12 the Office for Youth: maintained the one-stop-shop Cyber
Safety Information Portal to provide young people and their parents/carers with a range of up-to-date information on cyber safety
gave evidence to the Commonwealth Government Joint Select Committee on Cyber Safety
partnered with the Australian Human Rights Commission to support the roll-out of the National Cyberbullying and the Bystander Project in South Australia.
Geared2Drive
During 2011-12, the Office for Youth provided $40 000 to the Service to Youth Council (SYC) for its Geared2Drive pilot initiative. This funding was provided to enable SYC to purchase two vehicles and customise them to dual control. Smiths Holden also joined the program as a sponsor, providing a third car for customisation. The SYC program supports disadvantaged young people to obtain their provisional driver’s licence. Each participant is partnered with a community mentor and receives 70 hours of supervised driving, in addition to five hours of supervised driving they undertake with a qualified driving instructor. Geared2Drive participants will also
he
TAsupport their
undertake training in safe driving, risk management, communication, and managing peer relationships, in order
imise the risks they face on t
Bystander Project. The project responded directly to a number of issues that were raised by young people through the
to minroads.
campaign including: education and awareness of what happens online; young
people being bullied and harassed online; nd a lack of support for young people who a
experience bullying and hara Tfor young people that will enablecyberbullying and portraying the positive consequences of bystander behaviour.
Youth Advisory Committees
Youth Advisory Committees (YACs) provide advice to local councils, organise National YWeek events and local community activities, and develop resources for young people. Durin2011-12, $180 000 was provided to 60 local councils as operational funding for theoperating across the State. This was the first yein

Department for Communities and Social Inclusion 60
al
2012-13, the Office for Youth will work in partnership with local councils and the Local for strengthening the YAC program. This will ls currently in operation to identify their relevance
tate local governments.
trategy 205 years.
ntation of the strategy.
Du awarded a ts in the ment anan s.
ll
87 ering total of 3
in resp g. Thr
and enco.
one a f school, with participants required rtificate of Education (SACE) units. In total, 274 participated in the program. As part of the
May 2012, students participated in a football ment workshops and cultural activities.
l Sports
raining Academy of DECD. In 2011, the Attorney-General’s Department committed to a ith the Port Adelaide Football Club. The Office for Youth
A statewide consultation was undertaken with young people and youth workers to inform thedevelopment of a strengthened YAC program. The consultation process included 12 regionforums and an online survey, with a total of 504 young people and youth workers participating. InGovernment Association to develop a plan include a review of the different YAC modeto delivering high quality advice to both the S
youthconnect Grants Program
youthconnect South Australia’s Youth Sfor young people aged between 12 and 2impleme
Government and
10-2014 is a whole-of-government strategy The youthconnect grants support the
total of $499 862 for a range of projecd participation, education, employment
ring 2011-12, 17 organisations were areas of health and wellbeing, engage
d skill development, and better connection
Duke of Edinburgh’s Award Scheme
The Duke of Edinburgh’s Award is an internationaung people age
l youth development program open to a
licenced operators involved in deliv632 young people participating in the
yo d 14 to 25 years. In the 12 months to 30 June 2012, there werethe Award across South Australia, with a
ward, including 1651 new participants. A
Aboriginal Power Cup
The Aboriginal Power Cup was developedTo Break the Cycle report on youth offendinengages young Aboriginal people at risk education and make positive life choices The 2012 program was conducted in terms to complete one of two South Australian Cestudents from 25 secondary education sites Aboriginal Power Cup carnival held in
urnament, career expo, skill develop
onse to key recommendations from theough sporting activities, the program urages them to continue with their
nd two o
to The Aboriginal Power Cup is an initiative of the Attorney-General’s Department in partnershipwith the Port Adelaide Football Club, SANTOS, and the South Australian AboriginaTthree year funding agreement wmanages the funding and contractual obligations of the program.

Annual Report 2011-12 61
Office for Volunteers
e d
hat improves the government’s capacity to
the
o measure volunteer participation. Surveys have been commissioned in 2006, 2008, 2010 and 2012 to ascertain numbers of volunteers and factors that identified groupings and their respective motivators. Progress is also measured using data collected through the SASP Household Survey.
Objective The Office for Volunteers provides services that enable the continued implementation of thAdvancing the Community Together partnership in order to build strong communities anmaintain volunteer rates in accordance with the SASP. The Office for Volunteers provides
oth innovative policy and strategic advice tbidentify, prioritise and respond appropriately to the needs of the volunteer community in South Australia and maintain programs that support and promote volunteering.
Performance Highlights
South Australia’s Strategic Plan
Target 24 of SASP seeks to maintain a high level of formal and informal volunteering in South Australia at 70 per cent participation or higher. To measure progress against the volunteer target, the Office for Volunteers worked with
BS to develop a questionnaire that would align statistically to previous ABS data collection Atools used t

Department for Communities and Social Inclusion 62
Volunteering rate in South Australia - formal and/or informal volunteering(2006 baseline)
0
10
20
30
40
50
60
70
80
90
100
Per
cen
t
Harrison Research Survey 75.0 73.0 69.0 71.0
SASP Household Survey 72.4 71.1 66.5 67.6
Baseline 50.0
2006 2007 2008 2009 2010 2011 2012
Data source: Harrison Research Survey of Volunteering and SASP Household Survey
The Volunteering in South Australia in 2012 survey, commissioned by the Office for Volunteers and conducted by Harrison Research, reports a combined formal and informal volunteering participation rate of 71 per cent of the population. In comparison the 2012 SASP Household Survey reports that 67.6 per cent of respondents had undertaken either formal or
the previous 12 months.
the Community Together Partnership
ng the Community Together partnership provides a framework for the
ment was
unched.
ree Volunteer Training Grants Program
teers developed a new delivery model for the free
raining providers, community
informal volunteering in
Advancing
The Advancirelationship between the State Government and the volunteer community and aims to increase consultation, promote volunteering and address issues that hinder volunteering inSouth Australia. The partnership was launched in 2003. In 2010 it was reviewed and in December 2011 arenewed and modernised Advancing the Community Together partnership agreela
F
During 2011-12, the Office for Voluntraining program which provides for a much broader geographical reach and greater accessibility. The revised Free Volunteer Training Grants program was opened for
pplication in February 2012 to volunteer resource centres, taorganisations and local governments. There was a positive response to the new approach and 27 organisations from across the State were provided funds through the program to deliver training to volunteers.

Annual Report 2011-12 63
Co
held in June, acknowlee valuable contribution made by
olunteers. A free event is hosted by the
roduced in collaboration with the Adelaide
eer Awards.
nniversary of the International Year of Volunteers was celebrated in 2011. Action support the celebration of the anniversary included:
d criteria to enable communities to apply for
ing,
nteer Training Pilot Program
he Job Seeker Ambulance Volunteer Training pilot program was established in July 2011 through a partnership between the Office for Volunteers, South Australia Works (Department of Further Education, Employment, Science and Technology, Regional Development Australia Yorke and Mid North, the SA Ambulance Service and Job Service Australia provider Employment Directions.
State Volunteer Congress
The State Volunteer Congress is held annually and is a contact mechanism between grassroots volunteers and key stakeholders in the volunteer community and government. It is also an important forum for identifying key themes relevant to the ongoing development of volunteering in South Australia.
The Office for Volunteers partnered with Volunteering SA&NT to deliver the largest State Volunteer Congress ever, with over 500 people registering to attend the five day program in December 2011. A highlight of the Congress was the launch by the Premier of the renewed Advancing the
mmunity Together partnership agreement.
Volunteers Day
The State Volunteers Day public holiday, dges and recognises
thvGovernment on this day to recognise volunteers from across the State. The event, held at the Adelaide Festival Centre, is extremely popular and is pCabaret Festival. For the 2012 event, 1850 tickets were distributed to people who registered to attend. A special feature of the Volunteers Day celebrations is the presentation of the South
ustralian Volunt
Youth Volunteer Scholarship Awards
The Youth Volunteer Scholarship Awards were created to actively encourage more young people to volunteer, recognising a need to have an appropriate plan of succession inageing population. The scholarships reward young SoAustralians, 25 years and under, who volunteer their time and talents to he
an
uth
lp
them with up to $3000 to assist them in pursuing study options with a
Scholarships were awarded to 24 young people –13 from metropolitan
laide and 11 from country areas.
others in the community by providing
university, TAFE SA or vocational college. In 2011, the Youth Volunteer
Ade
A
International Year of Volunteers
The tenth ato modification of the Volunteer Support Fun
funds to host celebrations and activities in honour of volunteering expansion of the State Volunteer Congress by four days to offer a range of free train
information sessions and an Adelaide Lord Mayoral reception launch of the renewed Advancing the Community Together partnership the commission of research on the economic contribution made by volunteers.
Job Seeker Ambulance Volu
T

Department for Communities and Social Inclusion 64
bined pre-employment training from Employment Directions and A
pilot was a success. Of the 12 who started the course, five
nd were nt. Of r amb Booleroo
ployment in Port Pirie.
The innovative program comCertificate II in Emergency Medical Service First Response training delivered by the SAmbulance Service. An evaluation of the pilot program, undertaken by the Office for Volunteers at its conclusionn November 2011, indicated theiparticipants completed all assessments athese five, four enrolled to become volunteeand Crystal Brook. One gained full-time em
awarded a certificate of attainmeulance officers in Peterborough,

Annual Report 2011-12 65
Performance Highlights
The 30-Year Plan for Greater Adelaide
The 30-Year Plan for Greater Adelaide, released in February 2010, sets out a vision for the growth and development of the Greater Adelaide region up to 2036. The Plan projects population growth for Northern Adelaide of 169 000 over 30 years, requiring some 67 600 additional dwellings and the creation of 79 000 net additional jobs. During 2011-12, Northern Connections supported the implementation of The 30-Year Plan for Greater Adelaide by: establishing the Northern Adelaide Regional Collaboration, with one of the three priority
areas for action being ‘Planning, Land Use and Infrastructure’ participating in the structure planning process for the many developments occurring
throughout the City of Playford and Light Regional Council participating on the Steering Committee of the Playford Alive project supporting work to examine the feasibility of urban renewal in some of the older parts of
Elizabeth supporting the development of the Invest Northern Adelaide website, which assists
businesses to determine prime business locations and opportunities in Northern Adelaide.
Regional Governance Structure
In July 2011, Northern Connections convened a meeting of Mayors and Chief Executives of five local councils from across the region, together with local Members of Parliament and business representatives to canvas interest in forming a regional structure. The need for an authoritative regional governance structure for Northern Adelaide was recommended in the Northern Adelaide Skills, Workforce and Employment Blueprint 2010 report, which was prepared on behalf of Northern Futures Incorporated to provide a set of clear regional priorities. There was considerable support for establishing regional collaboration, with three priority areas agreed on: business attraction, retention and economic development education, skills and workforce development planning, infrastructure and land use. Councils participating in the Northern Adelaide Regional Collaboration are the Cities of Playford and Salisbury, the Town of Gawler, the Light Regional Council and the District Council of Mallala. The Collaboration consists of: a Mayors’ and Ministers’ forum, which meets three times per year
Northern Connections
Objective Northern Connections (the Office for the Northern Suburbs) engages with local, State and Commonwealth Government agencies, the community, non-government and private sectors,to deliver better economic and social outcomes for the Northern Adelaide region. This is achieved by developing connections, partnerships and collaborations that are able to focus
sources and effort on existing needs and new opportunities. re

Department for Communities and Social Inclusion 66
on group which is charged with achieving the Collaboration’s p, which meets three times per year, includes relevant
State Government Chief Executives, State Managers of relevant Commonwealth ent departments, Chief Executives of the five Councils, Senior Managers of the
plans.
et and a work plan for each of the three priority areas has een developed.
y
t, Referral and
or,
gathering evidence about what makes young children thrive and mapping existing uplication or gaps
lia,
onnections has taken a lead role in coordinating efforts across organisations, cluding chairing a Playford Government Reference Group and participating both formally
pporting COAG’s Closing the n Adelaide. The strategy is expected to
ing life expectancy, education, health, year Northern Connections will chair the Local
iers ing
munities in accessing
a senior level implementati
vision. The membership of the grou
GovernmUniversity of Adelaide and UniSA, Chief Executives of Anglicare and Uniting Communities and a business representative
a Task Group for each of the three priority areas, which comprises regional level managers and senior officers from relevant agencies
an annual forum which reports to the region on the Collaboration’s progress and achievements and seeks input into revising its priorities and
Each of the groups has now mb
Development and Implementation of Regional Strategies
Northern Connections supports the development and implementation of regional strategies across education, training and employment, early childhood and other priorities identified bregional stakeholders. During 2011-12, the Director of Northern Connections has continued to chair the Northern Adelaide Early Childhood Development Steering Committee, which aims to improve outcomes for young children through better coordination and integration of effort across the region. Actions of the group, which is comprised of Senior Managers and Regional Directorsacross the three tiers of government, the non-government sector and other relevant organisations, include: trialling new initiatives, such as the Common Approach to Assessmen
Support (CAARS), in conjunction with the Australian Research Alliance for Children and Youth (ARACY) focusing o n particular suburbs where outcomes for young children are particularly poand leading work with stakeholders towards a more ‘joined up’ approach to improve these outcomes
services against this to identify d
commissioning work which provides a better evidence base for further action. In the 2011–12 Federal Budget, the Commonwealth Government announced a package of measures entitled Building Australia’s Future Workforce. As part of this, ten sites across Australia were selected to trial a number of place-based measures. Within South Austrathe City of Playford was chosen. To ensure the best possible outcomes from this trial, Northern Cinand informally in a variety of advisory capacities. Northern Connections has also played an important role in suGap Urban and Regional Strategy within Norther
includclose the gap in a number of target areas2 attainment and employment. The Director of 1
Solutions Group which is responsible for identifying (with the Aboriginal community) barrto closing the gap, and possible solutions to these. Northern Connections is also supportwork in partnership with The Australian Centre for Social Innovation (TACSI) and others to examine ways to more effectively support Aboriginal families and comservices in ways that properly meet their needs.

Annual Report 2011-12 67
Nogo ca
as the utures
State or national initiatives such as CAARS in conjunction with the ARACY partnering in research with organisations such as TACSI to understand the relationship
s for clients
ssisting disadvantaged young people.
Social and Economic Prosperity of the Region
rthern Connections works with a broad range of organisations spanning the three tiers of vernment, the not-for-profit and private sectors and the broader community, to identify andpitalise on opportunities to advance the social and economic prosperity of the region.
addition to the establishment of In the Northern Adelaide Regional Collaboration, Northern Connections has achieved this by:
leading and participating on local and regional level gr oups and committees, suchNorthern Adelaide Early Childhood Development Steering Committee, Northern FIncorporated, and the Innovative Community Action Network (ICAN)
encouraging new ways of working by bringing agencies together to develop coordinated solutions which meet a particular local need
the trial of new
between current service delivery mechanisms and outcome commissioning strategic work or contributing to locally developed initiatives such as the
Invest Northern Adelaide website and the implementation of Wheels in Motion, a driver mentoring program a

Department for Communities and Social Inclusion 68
opinit
0 rbs, to provide more
pportunities for people to both live and work in the south, is therefore an important element f implementing The 30-Year Plan for Greater Adelaide.
The main achievements associated with implementation of The 30-Year Plan for Greater Adelaide in Southern Adelaide during 2011-12 are associated with facilitating accommodation of targeted growth in residential population and jobs. These include: participation in planning forums for the Tonsley Park redevelopment and the improved
integration of the Tonsley Park, Flinders University and Sturt Triangle precincts participation in planning for the development of a transit-oriented development at
Noarlunga Centre liaison with stakeholders regarding the site clearance of the Port Stanvac site, in
preparation for a yet to be determined future use as employment land facilitating regional planning for sport and recreation facilities. The 30-Year Plan for Greater Adelaide notes the need to plan for a new cemetery in Southern Adelaide. The Office for the Southern Suburbs is facilitating the identification of a site for cemetery use.
Job Creation and Business Investment
The Office for the Southern Suburbs facilitates the development of conditions that support job creation and business investment, and supports initiatives that underpin the quality of education and skills development in the region. During 2011-12, the Office contributed to the work of the Southern Expressway Taskforce, facilitating supply opportunities for Southern Adelaide businesses and job opportunities for Southern Adelaide residents. The Office also liaised with all levels of education providers to strengthen the skills base of the region, to support growth in targeted industry sectors.
Office for the Southern Suburbs
Objective The Office for the Southern Suburbs provides advice on the economic development of the region and coordinates a whole-of-government approach to improve economic, social and environmental outcomes for communities in the Southern Suburbs. The Office closely engages with a range of stakeholders to promote collaboration, to identify issues and
portunities for the south, and to assist with the development and implementation of iatives.
Performance Highlights
The 30-Year Plan for Greater Adelaide
The 30-Year Plan for Greater Adelaide projects population growth for Southern Adelaide of 82 000 over 30 years, requiring some 40 500 additional dwellings and the creation of 43 00net additional jobs. Building the economy of the Southern Subuoo

Annual Report 2011-12 69
he Office for the Southern Suburbs collaborates with Local Government on strategic conomic development planning for Southern Adelaide. During 2011-12, the Office assisted
Adelaide Economic Development Board with the update of the Southern
outhern Adelaide Performance Indicators
n Suburbs Coordination Group, the Office for the Southern uburbs developed the Southern Adelaide Performance Indicators report, to monitor
provide insights into the effectiveness of
employment precincts and infrastructure development
It i June aded
Southern Suburbs’ website at www.oss.sa.gov.au.
Economic Development Plans
Tethe SouthernAdelaide Economic Development Plan 2011-21. Released in May 2012, the plan sets a target of creating 14 000 new jobs over the next ten years. The Office also led the preparation of an Investment Attraction Strategy for the region, in collaboration with Local Government.
S
At the request of the SoutherSdevelopment of the Southern Suburbs andinvestment and policies. The performance indicators, established in collaboration with the Southern Suburbs Coordination Group, Southern Adelaide Councils and Flinders University, relate to: economic performance businesses in Southern Adelaide population and workforce social development digital economy.
s intended that the Southern Adelaide Performance Indicators report, released in2012, will be updated annually to track progress over time. The report can be downlofrom the Office for the

Department for Communities and Social Inclusion 70
Status of Women
bjective The Office for Women’s role is the pursuit of the full and equal participation of women in the social and economic life of the State by providing innovative and balanced public policy advice to government. It also provides high quality statewide information and referral services through the Women’s Information Service (WIS) and provides executive support to the Premier’s Council for Women.
Performance Highlights
South Australia’s Strategic Plan
The revised SASP has multiple targets to work towards the inclusion of women as full and equal participants in the social, economic and political life of South Australia. The updated Plan also includes a target to reduce violence against women.
Target 18: Violence against women
O
This is a new target aligned to the National Plan to Reduce Violence against Women and their Children 2010-2022, which seeks to achieve a significant and sustained reduction in violence against women through to 2020. In 2005, the baseline year for the target, 36 000 South Australian women reported through an ABS survey that they had experienced physical or sexual violence in the previous 12 months. Updated data for Target 18 will be available in the next ABS Personal Safety Survey to be published in 2013, based on data collected in 2012.

Annual Report 2011-12 71
ds and coordinates strategies to reduce violence against women by ross government and the community. During 2011-12, the Office for
omen: led the implementation of the Family Safety Framework to the Sturt, Adelaide
The Office for Women lea
orking with partners acwWEastern, Limestone Coast, Berri, Murray Bridge and Port Lincoln policing areas; continued to lead the anti-violence community education program; and revised the Women’s Safety Strategy in line with the National Plan to Reduce Violence against Women and their Children 2010-2022.
Target 29: Elections
Target 29 is a new target which seeks to increase the percentage of women nominating to stand in local, State and Federal Government elections in South Australia to 50 per cent by 2014.
Proportion of female candidates in local government electionsin South Australia (2010 baseline)
10
15
20
25
30
35
40
45
50
Pe
r c
en
t
0
5
Female candidates 20.9 22.4 25.5 24.8 26.1 27.4 28.4
Baseline 40
1993 1995 1997 2000 2003 2006 2010 2014
Data source: Local Government Association of South Australia
Proportion of female candidates in State Government electionsin South Australia (2010 baseline)
45
Pe
r c
en
50
40
25
30
35
t
15
20
0
5
10
Female candidates 26.6 30.6 35.2 34.1 30.3
Baseline 40
1993 1997 2002 2006 2010 2014
Data source: Electoral Commission of South Australia

Department for Communities and Social Inclusion 72
Proportion of female candidates in Federal Government electionsin South Australia (2010 baseline)
45
50
0
5
10
15
35
40
20
25
Pe
r c
en
t 30
Female candidates 31.1 29.1
Baseline 40
2007 2010 2013 2014
Data source: Australian Electoral Commission
As illustrated in the above graphs, currently only baseline data is available for this target as no data is available beyond 2010.
Target 30: Boards and committees
Target 30 seeks to increase the number of women on all State Government boards and committees to 50 per cent on average by 2014, and maintain thereafter by ensuring that 50 per cent of women are appointed, on average, each quarter. The target date has been extended to 2014 in the revised Plan because despite significant progress, the target was not reached by the original date of 2008.
Percentage of women on State Government boards and committees(January 2004 baseline)
June 201245.6%
January 200433.6%
0
5
10
15
20
25
30
35
40
45
50
Dec
-03
Jun-
04
Dec
-04
Jun-
05
Dec
-05
Jun-
06
Dec
-06
Jun-
07
Dec
-07
Jun-
08
Dec
-08
Jun-
09
Dec
-09
Jun-
10
Dec
-10
Jun-
11
Dec
-11
Jun-
12
Dec
-12
Jun-
13
Dec
-13
Jun-
14
Dec
-14
Per
cen
t
Percentage of women members Baseline
Data source: Boards and Committees Information System, Department of the Premier and Cabinet

Annual Report 2011-12 73
ement
As reflected in the above graph, positive movement has been made against the achievof Target 30 with an increase in the percentage of women on government boards and committees from 33.6 per cent in January 2004 to 45.6 per cent as at 30 June 2012.
Target 31: Chairs of boards and committees
Target 31 seeks to increase the number of women chairing State Government boards and committees to 50 per cent by 2014. The target date has been extended to 2014 in the revised Plan as the target was not reached by the original date of 2010.
As reflected in the following graph, positive movement has been made against Target ease in the percentage of government boards that are chaired by women from
23.8 per cent at the baseline in April 2004 to 37.1 per cent as at 30 June 2012.
31,
with an incr
Percentage of State Government boards and committeeschaired by women (2004 baseline)
June 201237.1%
April 201223.8%
20P
0
5
10
15
Ma
r-04
ep-0
4
Ma
r-05
ep-0
5
Ma
r-06
ep-0
6
Ma
r-07
ep-0
7 08 08 09 09 10 10 11 11 12 12 13 13 14 14
25
40
45
50
55
S S S S Ma
r-
Sep
-
Ma
r-
Sep
-
Ma
r-
Sep
-
Ma
r-
Sep
-
Ma
r-
Sep
-
Ma
r-
Sep
-
Ma
r-
Sep
-
e
30
35
r c
en
t
Percentage chaired by women Baseline
Data source: Boards and Committees Information System, Department of the Premier and Cabinet
During 2011-12, the Office for Women undertook a number of initiatives towards achiTarget 30 and Target 31, including:
targeted recruitment of high level women from diverse backgrounds to the Premier’s Women’s Directory promotion of the Premier’s Women’s Directory for use by the not-for-profit and private sectors involvement in the Women influencing Defence and Resources Industries CommuniPractice, including through its Steering Committee speaking at Women in Treasury and CPA South Australia’s Women’s Group holding a board curriculum vitae workshop for women working in the defence and resources industries.
eving
ty of

Department for Communities and Social Inclusion 74
l al
with assistance through email or the internet.
need all number of
omen, to acting as a gateway to empower a much larger number of women to engage with
tep, the WIS stablished an online presence and is engaging women through its Facebook page.
men
online ed by
elp to
Govern ape
Safety
on early intervention a nt to
e National Plan to Reduce Violence against Women and their Children 2010-2022.
a Research Officer position in the Coroner’s Office, to research and
lishment of Violence Against Women Regional Collaborations to support and
nce against women.
work seeks to ensure that services to families most at risk of iolence are dealt with in a more structured and systematic way by agencies sharing
information about high risk families and take responsibility for supporting them to navigate the service system. The Framework includes Family Safety Meetings which are held at the local level and focus on individual high-risk cases. During 2011-12, Family Safety Meetings have been established in the Limestone Coast, Berri, Murray Bridge and Port Lincoln.
Women’s Information Service
The Women’s Information Service (WIS) is a free information and referral service for alomen in South Australia. A toll-free number is available for women residing in regionw
South Australia. During 2011-12, the service received 21 951 contacts provided either in person, over the telephone, In January 2011 the WIS commenced a strategic planning process which identified thefor the service to refocus its priority from providing direct services to a smwknowledge development and emerging technologies. During 2011-12, the WIS developed aDigital Engagement Strategy aimed at empowering women to access and contribute to newtechnologies and areas of knowledge, particularly Web 2.0 initiatives. As a first se
In May 2012, the WIS convened the Powerful users or digital losers? Re-imagining wonational summit to discuss women’s participation in online technologies. Fund
the Department of Further Education, Employment, Science and Technology, it brought together leaders from government, industry, academia and the community sector to discuss the barriers to women’s online participation and to explore possible projects that will hovercome these barriers.
Women’s Safety Strategy
The Women’s Safety Strategy, launched in 2005, outlines the South Australian ment’s vision to address the issue of violence against women, including both r
and sexual assault and family and domestic violence. It has a broad focus, from work focused on preventing violence through to community education to raise awareness about the level and complexity of issues relating to women’s safety.
In December 2011, A Right to Safety: The Next Phase of South Australia’s Women’s Strategy 2011-2022 was launched. It builds on the reforms undertaken through the Women’s Safety Strategy to improve legislation and services, and to strengthen community understanding of the effects of violence against women. It also has a stronger focus
nd prevention and outlines the South Australian Government’s commitmeth Key initiatives currently being undertaken through the Women’s Safety Strategy are: the Family Safety Framework an Anti-Violence Community Awareness Campaign
the establishment ofinvestigate domestic violence related deaths
the estabbring together service providers, advocates and interested organisations to develop regional approaches to respond to and prevent viole
Family Safety Framework
The Family Safety Framev

Annual Report 2011-12 75
ety Framework has also commenced in Alice Springs. This this
ge
July 2011, the Violence Against Women Awareness and Prevention in the Hotel Industry
It
tels Association Industrial Relations Subcommittee, Coles Group f Hotels and Hindley Street traders.
inst Women
omen’s Gathering to enable boriginal and Torres Strait Islander women to share their experiences and issues from their
o oked at what works and what does not work within communities, while focusing on the
er peoples.
Implementation of the Family Safis the first time Family Safety Meetings have been established in another jurisdiction andcollaborative work with the Northern Territory Government supports the National Plan to Reduce Violence against Women and their Children 2010-2022, which seeks to improve cross-jurisdiction mechanisms to protect women and children.
Anti-Violence Community Education Program
The Don’t Cross the Line Anti-Violence Community Awareness Campaign aims to chancommunity attitudes, increase awareness for workers who respond to perpetrators and victims, and encourage a culture of perpetrator accountability. The campaign includes grant funding primarily aimed at organisations which work with groups who are unlikely to be reached through a mainstream community education campaign. InProject commenced. The 12 month project was led by the Yarrow Place Rape and Sexual Assault Service, Women and Children’s Health Network and involved the Australian Hotels Association, United Voice, Consumer and Business Services and the Office for Women. focused on raising awareness of the issue in the hospitality industry and adding to student training for the hospitality industry. Training sessions were provided to a range of audiences including the Australian Hoo This project reflected the directions of the National Plan to Reduce Violence agaand their Children 2010-2022.
State Aboriginal Women’s Gathering
The Office for Women convenes the annual State Aboriginal WAcommunities, to meet and network with other Aboriginal women from across South Australia, and remain informed about key issues affecting them and their communities. The theme of the 2011 State Aboriginal Women’s Gathering was ‘Strong Cultures Inspires Strong Futures’ and focused on the contributions and achievements of women in the Aboriginal and Torres Strait Islander community in South Australia. The Gathering alslopositives and role modelling that will assist in ensuring a more sustainable future for Aboriginal and Torres Strait Island

Department for Communities and Social Inclusion 76
Multicultural Services
ommunity
s
Performance Highlights
South Australia’s Strategic Plan
Since 2007, SASP has included a multicultural target which focuses on the positive influence of multiculturalism in the community. The multiculturalism target of the revised SASP, Target 5, seeks to maintain the high rate of South Australians who believe cultural diversity is a positive influence in the community. This target has been modified in the updated Plan to ensure the high rate of acceptance is maintained. The data source to measure progress against Target 5 is the SASP Household Survey which is publicly available via the SASP website.
Objective Multicultural SA works with South Australia’s ethnic communities to promote ccapacity and community harmony. A key aspect of this work is supporting ethnic communities in their activities in the broader community. Multicultural SA also provides advice to the government on cultural, linguistic and religioudiversity matters and conducts in-depth community consultation sessions to ensure the government has a detailed understanding of the issues currently facing the ethnic communities of South Australia.

Annual Report 2011-12 77
raph, 85.9 per cent of respondents in the 2012 SASP iversity as a positive influence in the community. This is
own from 87.9 per cent in the 2010 survey and is also lower than the 2008 baseline of
As highlighted in the following g
ousehold Survey accept cultural dHd87.7 per cent. The percentage of South Australians who accept that cultural diversity has a positive influence in the community has, however, remained above 85 per cent since 2008.
Acceptance of cultural diversity as a positive influence in the community(2008 baseline)
0
20
40
60
80
100
Per
ce
nt
South Australia 87.7 89.4 87.9 85.9
Baseline 100.0
2008 2009 2010 2011 2012 2013 2014
Data source: SASP Household Survey
Survey was not conducted during 2011 due to the process to review and
range of new and continuing initiatives preserve and expand the values of harmony and f
wcasing designed to demonstrate the benefits of multiculturalism to
e wider community. This has been achieved through encouraging the participation of ethnic forming arts groups in iconic events, such as the Christmas arade and ANZAC commemorations.
er 2011 was the eighth pageant involving the ‘Christmas
n-
January 2012, more than 3000 people from 100 community associations, originating from
ised by Multicultural SA.
A Householdupdate the Plan.
Preserving and Expanding the Values of Harmony and Diversity
Adiversity that underpin the South Australian community, and contribute to the achievement oSASP Target 5. An important strategy for achieving community harmony is to increase awareness and understanding of diverse cultures. This is achieved through the ShoMulticulturalism Program which isthcommunity organisations’ per
ageant, the Australia Day PP The Christmas Pageant in NovembAround The World Float’. Nearly 80 people from six different ethnic backgrounds, including Armenian, Austrian, Bangladeshi, Lithuanian, Mexican, Rwandan, as well as the Africabackground Voice of Peace Choir, participated. In50 different ethnic backgrounds, participated in the Australia Day Parade in the city. On ANZAC Day Eve, a youth vigil was also held at the Adelaide War Memorial and included the participation of youths from 13 ethnic communities, organ

Department for Communities and Social Inclusion 78
d ed the Moon Lantern Parade in Elder Park. In September 2011, the City-Bay
un Run stage program featured nine multicultural performing groups from a variety of
om
Affairs Co
the
rns
e
or remain in the Riverland.
their assistance with the matters raised during this consultation.
ford Civic Centre on
with the SES.
rants
During 2011-12, Multicultural SA’s engagement with multicultural communities and theAdelaide Festival Centre also contributed to the success of the Moon Lantern Festival in September 2011. More than 20 000 people enjoyed performances and workshops, tastefood, and watchFbackgrounds, showcasing multiculturalism to more than 31 000 people.
C munity Consultations
The primary functions of the South Australian Multicultural and Ethnic Affairs Commission (SAMEAC), as outlined in Section 12 of the South Australian Multicultural and Ethnic
mmission Act 1980, are to: increase awareness and understanding of the ethnic diversity of the South Australian community and the implications of that diversity advise the Government and public authorities on, and assist them in, all matters relating to the advancement of multiculturalism and ethnic affairs.
On 4 and 5 November 2011, the SAMEAC held community consultations in Berri, in Riverland. Those attending included a broad cross section of the Riverland communityincluding members of the Italian, Greek, Sikh, Afghan, Croatian and Turkish communities. There were also representatives from Riverland local councils and service providers. Issues raised during the consultations included:
an increasing incidence of mental health concerns in migrant communities and conceregarding the waiting time for those seeking mental health services the Afghan community reported that some members of their community face difficulties learning English and sometimes difficulties obtaining an interpreter when needed several community members said that they are keen to attract and retain people in thRiverland, however, they are concerned that there are insufficient local incentives to settle
The Chair of the SAMEAC wrote to the South Australian Government and community
gencies seeking a The SAMEAC held its most recent community consultation at the Play23 May 2012, with approximately 80 local authorities, ethnic community leaders and serviceproviders attending. Issues raised included: some migrant communities are seeking assistance to identify available venues for
meeting as part of the Commonwealth Humanitarian Settlement Services program some refugees
find it difficult to access suitable and affordable housing the State Emergency Service (SES) is keen to improve communications with ethnic
communities and to involve migrants and refugees as volunteers Many of the issues raised during this consultation were addressed immediately by government and other service providers who attended the consultation.
ettlement Services for the Humanitarian EntS
Since late 2009, Multicultural SA has undertaken a project to improve the coordination of settlement services provided to humanitarian entrants in South Australia. The project has identified settlement issues and brought together stakeholders to develop a shared understanding of areas of responsibility in policy, funding and service provision.

Annual Report 2011-12 79
to
ulticultural SA prepared a major report on at the end of
e
tre
d
new cus on new and
standing with the Commonwealth
During 2011-12, the project established networks with service providers and processes ensure the ongoing coordination of settlement services. The project also consulted with humanitarian entrant communities to identify if they are receiving the support they require. Major areas that communities identified as impacting on successful settlement were language, education, employment, housing and access to information. Mthe progress of the project, as2011. On 31 January 2012, the Hon Jennifer Rankine MP, Minister for Multicultural Affairs, released the Progress Report and also launched a new tool, the Settlement Services Finder, which is part of the Multicultural SA website. The Settlement Services Finder is designed to maintain and
prove coordination and to help imhumanitarian entrants. In 2012-13, the South Australian Government will continue to participate in the development of a National Settlement Framework by the Select Council on Immigration and Settlement. This is one of
Councils established by the Prime thMinister to undertake tasks specified by COAG.
Interpreting and Translating Services
he Interpreting and Translating CenTprovides interpreting and translating services to a wide range of private, orporate and government clients. These c
services include face-to-face interpreting sessions, business interpreting, phone interpreting, translations and multilingual text overlay. In the 12 months to 30 June 2012, 34 608 interpreting and 2537 translating assignments were conducted by the Interpreting and Translating Centre. This is marginally lower than the outcomes in 2010-11 (34 921 interpreting and 2708 translating assignments) which is reflective of the market prioritising their requirement for language services during a perio
hen business and agencies have been required to make significant cost savings. w During 2011-12, the Interpreting and Translating Centre recruited approximately 87nterpreters and translators representing 25 languages, with a particular foiemerging languages including Swahili Tamil, Kurdish, Dari, Hazaragi, Pushtu and Persian. The Centre also implemented a Memorandum of UnderGovernment Translating and Interpreting Service for the provision of interpreters to the Department of Immigration and Citizenship Inverbrackie and Port Augusta Places of Alternative Detention.
Multicultural Grants Scheme
The Multicultural Grants Scheme is designed to build community capacity and provide the opportunity for culturally and linguistically diverse groups, irrespective of their size, to share their culture with others. This is achieved through the provision of funds to not-for-profit community organisations for projects designed to: increase understanding of the
culturally diverse community we live in
increase participation by South Australians of all backgrounds in the community
celebrate and value cultural diversity.
Over the 2011-12 financial year,
ly s,
funding was provided to approximate200 organisations for festivals, eventyouth programs, equipment, and cultural awareness programs.

Department for Communities and Social Inclusion 80
Organisational Capability
ent, thsustains , abilities lients. N and ndertaken during recruitment processes, with the yees addressed through the department’s College
nd Development.
n the luding Chief Executives) by 2014 and maintain thereafter
Objective Through workforce planning and managemretaining and developing a workforce that and backgrounds to effectively serve our cbackground screening assessments are ulearning and development needs of emplofor Learning a
e department is committed to attracting, the right mix of skills, experienceational criminal history checks
The department also undertakes and manages research which supports outcomes under theFive Year Strategic Plan 2009-2013.
Performance Highlights
South Australia’s Strategic Plan
All South Australian Government departments are required to contribute to the achievementof the following targets in the revised SASP: Target 50 – People with disability: increase by ten per cent the number of people with
disability employed in South Australia by 2020 Target 52 – Women: have women comprising half of the public sector employees i
executive levels (inc

Annual Report 2011-12 81
: increase the participation of Aboriginal people in the ad across all classifications and agencies, to two per
cent by 2014 and maintain or better those levels through to 2020.
isability Employment Community of Practice
y Employment Survey, in which individuals with disability and their nt,
ce has met several times to discuss the
hrough the endeavour of its members, is n action plan that identifies avenues for support and strategies employees with disability. It also aims to promote disability
cruitment across the department.
yment opportunity program to support red
for before they are openly advertised. The
Target 53 – Aboriginal employees
South Australian public sector, spre
The department employed 213 employees with disability as at 30 June 2012, based on the Commonwealth Disability Discrimination Act 1992 definition. The department promotes the employment of people with disability by raising awareness of managers and staff through online education programs and a range of information sheets, which include direction on how to access the Disability Employment Register, and adjustments and accommodations available for people with disability at work. Vacancies also continue to be promoted through Disability Works Australia to improve access for people with disability to short term vacancies; As at 30 June 2012, there were 45 executive positions in the department of which 30 were held by women. This equates to 66.7 per cent of all executive positions being held by women. The succession planning model, inclusive of executive level positions, resulted in two women successfully progressing to executive level positions in the previous 12 months. The College for Learning and Development also continues to provide a comprehensive range of programs to foster leadership and management skills amongst all employees. The department employed a total of 180 Aboriginal employees as at 30 June 2012, which equates to 3.6 per cent of all employees. During 2011-12, the department has continued to implement the Aboriginal Employment Strategy and maintained an Aboriginal Employment Pool to recruit to key roles across the divisions covering a range of classifications.
D
The results of a Disabilitmanagers were invited to provide feedback on the support they receive from the departmeprompted the establishment of a Disability Employment Communities of Practice. The group was formed to discuss the challenges identified in the survey and develop strategies designed to support employees with disability, as well as promote awareness in the workplace.
he Disability Employment Communities of PractiTfindings from the survey, formulate actions and invite guest speakers from Disability Works Australia and Multiple Solutions, to provide information about external sources of funding and upport. The group has been well attended and ts
working toward establishing adesigned to empower currentre
Aboriginal Employment Pool
The Aboriginal Employment Pool is an emploAboriginal employment, by providing opportunities for Aboriginal candidates to be conside
a range of targeted roles within the departmentprogram has been operating since early 2011 with processes continuously improved to achieve successful outcomes.

Department for Communities and Social Inclusion 82
ts forca e Officers, Project
fficers and Community Services roles. These initiatives have resulted in increased
uring 2011-12, ten Aboriginal candidates have been employed from the pool across the
A
line Managers’ Toolkit has been developed for managers
them r jobs effectively. Split into nine sections ranging from Managing People through to
o strengthen the department’s relationship with universities and help define entry level
role of ealth Science graduates within Disability Services and the department as a whole, which
for the discipline.
heir ered a
aduate contract in a business unit that aligns with their chosen career stream. ogether with Human Resources and the department’s College for Learning and
o
Actions to improve the program include streamlining of electronic applicant records, reques
re-application to ensure only those actively interested remain in the pool, and the tegorisation of role preference amongst candidates for Administrativ
Oefficiency and reduced administrative time. Ddepartment (including Families SA), either on contract or an ongoing basis. From this group,six remain working within the department and one in Families SA, across a variety of roles. total of 79 candidates were in the Aboriginal Employment Pool as at 30 June 2012.
Managers’ Toolkit
fter extensive consultation, an onAacross the department. The Toolkit, which was created in response to managers’ requests for additional support when making the transition into a supervisory role, aims to provide managers with a ‘one stop shop’ for easy access to tools and resources which enable o do theit
Systems and Frameworks, the Toolkit pulls together information from across the department’s intranet and presents this in a format that is both relevant and navigable.
Health Science Internship
Tcareer paths into the department, an internship has been negotiated with the University of Adelaide to begin in the 2012-13 financial year. A student who is currently studying a HealthScience degree will undertake a 12 week placement with Disability Services that focuses onpublic health. Part of the student’s work program will include exploring the potentialHwill facilitate the development of a career pathway
Graduate Recruitment and Development Program
With the increasing pressures of attracting and retaining skilled staff, the department’s graduate program continues to be an excellent source of quality candidates, utilising tdegree and developing their future potential on the job. Successful applicants are off12 month grTDevelopment, the business unit provides ongoing support and development opportunities tgrow the department’s future workforce. The program has been running since 2005 with over 150 graduates participating to date.

Annual Report 2011-12 83
e
hristine Wilson 2011 Premier’s NAIDOC Awards – Female Elder of the Year
Awards and Recognition
The work of staff members and the department was recognised during 2011-12 through thpresentation of the following external awards:
C
Housing SA Urban Development Institute of Australia (South Australia) – 2011 Awards for Excellence – High Density Housing Award for the Ifould Apartments
Housing SA Urban Development Institute of Australia (South Australia) – 2011 Awards for Excellence – Urban Renewal Award for the Westwood Urban Renewal Project
Housing SA Urban Development Institute of Australia (South Australia) – 2011 Awards for Excellence – Environmental Excellence Awardfor Lochiel Park
Housing SA Urban Development Institute of Australia (South Aus2011 Awards for Excellence – President's Award for its Soc
tralia) – ial
Housing Program
Housing SA – Quality and Technical Services Project Team
2011 Australasian Housing Institute Awards (South AustraliaLeading Innovation Award
) –
Housing SA – the Office of the Social Housing Coordinator and supporting Strategic
2011 Australasian Housing Institute Awards (South Australia) – Leading Practice Award
Project Team for Nation Building – Economic Stimulus Plan
Jane Fletcher, Housing SA
2011 Australasian Housing Institute Awards (South Australia) –Inspirational Colleague Award
Janet Haydon, Community Connect
Australian Organisation for Quality’s Shilkin Award
Jude Allen, Housing SA Outstanding Achievement Award 2011 Australasian Housing Institute Awards (South Australia) –
Ladder Project Partnership: Housing SA, Ladder and St John's Youth Services
2011 Australasian Housing Institute Awards (South Australia) – Leading Housing Solutions Award
Ronnie Faggotter, State Recovery Office
2011 South Australian Women’s Honour Roll

Department for Communities and Social Inclusion 84
evelopment
staff to deliver core services in high risk areas cluding youth justice, disability, ageing and housing. It is a fundamental part of the
kforce Plan and retain
Training Organ
include Certificate III in Gove n Disability, Certificate IV in Youth Justice and the Diploma of Child, Youth and Family Intervention.
ions were issue as many employees now have aseline qualification, and are engaging in higher level
lso delivers a olearning programs aimed at nagers and senior managers.
or Learning an s A, now part of
training in significant reports that have Parliamentary reporting requirements. These include y
rvices to Families SA, provided under a Memorandum of Administrative Agreement e services provided prior to their transfer to
proposed for the provision of services to Families SA until
ovides a centralised, comprehensive and consistent approach to the ployees and volunteers working with children and vulnerable adults. All
employees, contractors and volunteers engaged by the department are screened by the Unit, ides this serv
f volunteer car he service is also provided to rganisations.
er of screening applications is steadily increasing with the Unit currently processing an average of approximately
ingexecutive agency of the Commonwealth Governm
inal history information.
ing ap on and community added value of the service provided by the Screening Unit and as a result
n’s Protection Act 1993.
College for Learning and D
The College for Learning and Development is critical to the department meeting its strategic plan, legislative requirements and the ability ofindepartment’s Worcapacity to recruit
and associated strategies, and increases the department’s staff in key roles.
A Registered isation since September 2006, qualifications available to staff rnment, Certificate III i
775 qualificat d to staff during 2011-12. This is lower than the target of 850
a Certificate III in Government as a bqualifications that take longer to complete.
ne day induction program to new staff and a wide variety of both front line ma
The College a
The College ffor Families S
d Development also provides learning and development serviceDECD, supporting the implementation of recommendations for
Keeping Them Safe, the La The se
ton Report and the Mullighan Report.
(MOAA) until 30 June 2012, are consistent with thDECD. An MOAA has been31 December 2013.
Screening Unit
The Screening Unit prscreening of em
which also provassessment o
ice to 12 government agencies, including DECD for the ers approved by Families SA. T
approximately 700 non-government o The numb
5000 per month. In the 12 months to 30 June 2012, the Unit applications compared to 47 497 during 2010-11. CrimTrac, an
ent, is used by the Screening Unit for the processed 59 601 screen
provision of crim The increase in screenrecognition of the
plications is the result of organisati
of changes to the Childre

Annual Report 2011-12 85
he department’s research activities in 2011-12 have focused on supporting and informing
and evaluation activities. This xpenditure included studies commissioned by the department, such as evaluations of
ot program, and, with colleagues and stakeholders across Australia, the development of a new National
Homelessness building communities, including studies which explore issues for carers, older people,
ent’s 12. These are:
the evaluation of the Younger People in Residential Aged Care initiative of the Self-Managed Funding trial for people with disability
Research
The Research Unit coordinates and leads the department’s research effort and aims to: build and develop the evidence base which informs the department’s work effectively disseminate knowledge generated through research support the increased uptake of research knowledge in policy and practice. Tthe reform agendas and strategic priorities of the South Australian Government. Approximately $310 000 was invested in external researchestrategic initiatives, and projects developed and delivered collaboratively with Universities. This included partnerships which had attracted funding through the Australian Research Council (ARC) Linkage scheme. Key areas of activity have included: disability reform, including the evaluation of the Self-Managed Funding pil
Disability Research and Development Agenda, endorsed by Ministers nationally in November 2011
housing and homelessness, including the first stage evaluation of homelessness reforms in South Australia under the National Partnership Agreement on
volunteers and local communities in times of change.
Three major research reports were released and made publicly available on the departmwebsite during 2011- the evaluation the results of an ARC collaborative study exploring issues impacting on young carers.

Department for Communities and Social Inclusion 86
al and Torres Strait Islander People
with prove
e ongoing
ir
Aborigin The department’s vision to build a better life for South Australians includes working Aboriginal people, their families and communities to provide opportunities to im
ellbeing, build resilience and reduce disadvantage. The department recognises thwchallenge of developing effective responses to the complex needs of Aboriginal clients and communities, and has continued to work with Aboriginal communities and service
rganisations to enable localised and targeted services for Aboriginal people and theofamilies across a broad range of areas including disability and housing. Delivery of services to South Australia’s remote Aboriginal communities is one of the most challenging responsibilities for any agency. Improved service delivery to Anangu Pitjantjatjara Yankunytjatjara (APY) Lands communities continues to be a priority. The evelopment of a mentoring program to support And angu HACC workers on the APY Lands
d the Commonwealth Department of Education,
to
has been a joint project with TAFE anEmployment and Workplace Relations. The focus on improving service delivery through mentoring individuals and teams has proven to be an effective method of providing support
Anangu staff. All HACC workers have had the opportunity to attend a training workshop ich focuses on further developing the program and explores how to assess and meewh t
n clusive services in line with the
ff in providing
Hendon, Adelaide researched models of best practice relating to the delivery of Aboriginal dementia care
services continued to implement the department’s APY Lands Strategic Framework funded a 12 month project with the Statewide Gambling Therapy Service on adapting and
validating the Problem Gambling Service Index for use in Aboriginal communities supported the recruitment, retention and development of Aboriginal staff. The department has also continued to lead and support a range of initiatives and reforms initiated through National Partnership Agreements to address Aboriginal disadvantage, such as being the lead for the National Partnership Agreement on Remote Indigenous Housing, contributing to strategies to improve remote service delivery as part of the National Partnership on Remote Service Delivery, and improving outcomes for Aboriginal people living in urban and regional areas as part of the National Urban and Regional Service Delivery Strategy. These activities will be continued throughout the next 12 months to ensure the needs of Aboriginal people and their communities are reflected across all priority areas of the department, and in all new policy and service developments.
client needs, and have been supported through the mentoring program. Since the program began there has been a significant improvement in the retention rates of HACC staff. Over the past 12 months the department has undertaken a range of activities to strengthe
nd build the department’s capacity to provide culturally inaSouth Australian Government’s Cultural Inclusion Framework. The department has: supported the use of Aboriginal Impact Statements for significant departmental policies
and programs developed and promoted Aboriginal information and materials to assist sta
culturally inclusive services established Aboriginal Transitional Housing Outreach Services in Coober Pedy and

Annual Report 2011-12 87
Our People
Workplace Statistics The following data is provided from the South Australian Public Sector Workforce InformatioCollection (WIC) Department for Communities and Social Inclusion Annual Report 2011The data was extracted from the Complete Human Resource and Information System (CHRIS) and uploaded onto the Workforce Analysis and Comparison Ap
n -12.
plication (WACA) website. Data is based on all employees (including casuals) who were on the system as at 30 June 2012. It does not include unpaid staff reassigned to another South Australian Government agency. Employee numbers, gender and status
Persons 5060
Full-time equivalent (FTE) 4257.8
Number of persons separated from the agency during the 2011-12 financial year 900
Number of persons recruited to the agency during the 2011-12 financial year 1249
Number of persons on leave without pay at 30 June 2012 102
Employees by gender
Gender Persons FTEs
Male 32.2% 33.3%
Female 67.8% 66.7%
mNu yees by salary bracket ber of emplo
Salary bracket Male Female Total
$0 – $51 599 754 1626 2380
$51 600 – $65 699 401 819 1220
$65 700 – $84 099 333 750 1083
$84 100 – $106 199 122 205 327
$106 200 + 17 33 50
Total 1627 3433 5060
Note: Salary details relate to pre-tax income excluding super and FBT. Non-executive employees on salary e
efits ximation
uctures of the PS Act Administrative ervices Stream with consideration of the Operational, Professional, Technical and Executive Streams.
sacrifice arrangements are shown as pre-sacrifice values. Executive employees are shown as the value of thfinancial benefits component of their Total Remuneration Package Value excluding super. Non-financial benand allowances are excluded for all employees. The salary brackets have been constructed as an approfor the level of responsibility, and are based on the current remuneration strS

Department for Communities and Social Inclusion 88
in current position
Status of employees
FTEs Ongoing Short-Term
Contract Long-Term
Contract Other
(Casual) Total
Male 1246.8 102.3 24.8 45.2 1419.0
Female 2447.1 282.3 47.3 62.0 2838.8
Total 3694.0 384.6 72.1 107.2 4257.8
Persons Ongoing Short-Term
Contract Long-Term
Contract Other
(Casual) Total
Male 1374 108 26 119 1627
Female 2886 324 48 175 3433
Total 4260 432 74 294 5060
Executives
Number of executives by status in current position, gender and classification
Ongoing Term
Tenured Term
UntenuredOther
(Casual) Total
Classification Male Female Male Female Male Female Male Female Male % Female % Total
SAES1 0 0 0 0 11 28 0 0 11 24 28 62 39
SAES2 0 0 0 4 0 0 4 9 4 6 0 2 2
Total 0 0 0 0 15 30 0 0 15 33 30 67 45
Leave management
Average days leave per full tim ivalent employe equ ee
Leave Type 2008-09 2009-10 2010-11 2011-12
Sick Leave 10.7 11.6 11.7 12.4
Family Carer’s Leave 0.4 0.3 0.4 0.4
Miscellaneous Special Leave 1.5 1.6 1.6 1.8
Note: Data for 200
8-09, 2009-10 and 20 the former De ent for Families and C nities. 10-11 relates to partm ommu

Annual Report 2011-12 89
Aboriginal and/or Torres Strai pl
Workforce diversity
t Islander em oyees
Salary Bracket Aboriginal Employees
Total Employees
Percentage of Aboriginal Employees
SASP Target
$0 – $51 599 80 2380 3.4% 2%
$51 600 – $65 699 47 1220 3.9% 2%
$65 700 – $84 099 42 1083 3.9% 2%
$84 100 – $106 1 10 3 399 27 .1% 2%
$106 200 + 1 50 2% 2%
Total 180 5060 3.6% 2%
Number of employees by age bracket by gender
Age Bracket Male Female Total Percentage
of Total
2012 Workforce
Benchmark*
15 – 19 0 6 6 0.1% 5.6%
20 – 24 53 2 4.1% 9.9% 154 07
25 – 29 104 287 391 7.7% 10.6%
30 – 34 155 21 47 % 10.4% 3 6 9.4
35 – 39 185 368 553 10.9% 10.7%
40 – 44 201 18 61 % 11.7% 4 9 12.2
45 – 49 217 461 678 13.4% 11.4%
50 – 54 242 541 783 15.5% 11%
55 – 59 275 477 752 14.9% 9.2%
60 – 64 144 304 448 8.9% 5.6%
65 + 51 96 147 2.9% 4%
Total 1627 3433 5060 100% 100%
* Source: ABS Australian Demographic StatState, marital status – employed – tot
istics, 6291.0.55.001 Lal from F Supertable, South Australia at May 2012. Note: the
ercentages add up to 100.1 per cent due to rounding.
abour Force Status (ST LM8) by sex, age, eb78
p

Department for Communities and Social Inclusion 90
c diversity
Cultural and linguisti
Male Female Total Percentage of Agency
South Australian
Community*
Number of employees born overseas
508 858 1366 27% 20.3%
Number of employespeak language(s) o
es who ther e
16.6% than English at hom
279 453 732 14.5%
* Benchmarks from ABS Publication c Community Pr A) Cat No. 20 6 census.
lace Adaptation
otal number of employees with disabilities (according to the Commonwealth isability Discrimination Act 1992 definition)
Basi ofile (S 01.0, 200 Workp
TD
Male Female Total Percentage of
Agency
63 150 213 4.21%
Ty sability ( re specifiepes of di whe d)
Disability Male Female Total Percentage of Agency
Disability requiring workplace adaptation
63 150 213 4.21%
Physical 0 3 3 0.06%
Intellectual 0 0 0 0%
Sensory 0 2 2 0.04%
Psychological/psychiatric 1 1 2 0.04%
Voluntary flexible w y gender orking arrangements b
Arrangement Male Female Total
Purchased Leave 9 23 32
Flexitime 732 1537 2269
Compressed Weeks 17 79 96
Part-time 390 1342 1732
Job Share 8 60 68
Working from Home 8 31 39

Annual Report 2011-12 91
f birth, at 30 June 2012
Employee numbers by country o
Italy, 35
Philippines, 38
Germany, 33
Poland, 32
Liberia, 39
Ireland, 29
, 103 Not Stat
England, 473
Other, 419Australia, 3234
ountry of Birth is based on ASCC (Australian Standard Classification of Countries) that uniquely identifies the ountry of birth of an employee. The classification is based on the ABS Standard Australian Classification of
1269.0, July 1997).
staff speaking langua ther tha and th uages
30 June 2012
Kenya, 41
Vietnam, 29
New Zealand, 42
Scotland, 53
India ed, 460
CcCountries (SACC) at the 4-digit level (ABS Catalogue No.
Number of ges o n English e lang spoken, at
Other, 312tated, 2205
2123
Greek, 60
e, 31
antonese, 16
rin, 17
Polish, 30
French, 22
g (Filipino), 25
Spanish, 29
on ASCL (Australi Standard Classification nguages) that uniquel ntifies the t home of an emp ee. The classification i on the ABS Stand Australian
Classification of Languages (ASCL) at the 4-digit level, Second Edition (ABS Catalogue No. 1267.0, 1997).
Not SPunjabi, 16
English,
Italian, 83
Hindi, 34
Vietnames
C
Manda
German, 30
Tagalo
Swahili, 27
Main Language is based main language spoken a
an loy
of Las based
y ideard

Department for Communities and Social Inclusion 92
ion
Accredited training packages for staff by staff classificat
Classification Number* Classification Number* Administrative Services Officer (ASO1)
135 Operational Services (OPS1) 36
Administrative Services Officer (ASO2)
1 222 Operational Services (OPS2) 629
Administrative Services Officer (ASO3)
261 Operational Services (OPS3) 1 125
Administrative Services Officer (ASO4)
985 Operational Services (OPS4) 952
Administrative Services Officer (ASO5)
558 Operational Services (OPS5) 111
Administrative Services Officer (ASO6)
619 Operational Services (OPS6) 36
Administrative Services Officer (ASO7)
109 Operational Services (OPS7) 6
Administrative Services Officer (ASO8)
73 Operational Services (OPX1) 25
Allied Health Professional (AHP1)
2 078 Operational Services (OPX2) 2 104
Allied Health Professional (AHP2)
1 664 Operational Services (OPX3) 1 506
Allied Health Professional 452 Operational Services (OPX4) 92
(AHP3) Allied Health Professional (AHP4)
80 Operational Services (OPX5) 98
Disability Services Officer 1 779 Professional Officer (PO01) 66
(DIS01) Disability Services Officer (DIS02)
1 358 Professional Officer (PO02) 5
Disability Services Officer 83 Professional Officer (PO03) 6
(DIS03) Enrolled Nurse (EN01) 66 Registered Nurse (RN3A) 22 Enrolled Nurse (ENDP) 26 Registered Nurse (RN4A) 1 Health Ancillary (WHA2) 14 Registered Nurse (RN5A) 5
Registered Nurse/Midwife Health Ancillary (WHA3) 124 31
(RN01)
Health Ancillary (WHA4) 16 Registered Nurse/Midwife (RN2A)
6
Registered Nurse/Midwife Health Ancillary (WHA5) 170 2
(RN2C) Health Ancillary (WHA6) 16 SA Executive Services (SAES1) 9 Manager Administrative Services
8 Trainee (TRA1) 1 (MAS2) Manager Administrative Services (MAS3)
76 Total 18 846
* Each number represents a nationally accredited competency either completed or enrolled in during 2011-12 through the DCSI College for Learning and Development. These statistics include Families SA staff as services continued to be provided by the College through a Memorandum of Administrative Arrangement beyond 1 January 2012.

Annual Report 2011-12 93
individual
Performance development
Documented review of performance management
Percentage of Total Workf orce
Employees with a review within the pa onst 12 m ths 34.3%
Employees with a review older than 12 months 32.9%
Employees with no review 32.8%
Leadership and management trainin eng exp diture
Training and Development Total Cost ¹ Percentage of Total Salary Expenditure ²
Total training and development expenditure $5 141 000 1.19%
Total leadership and managemedevelopment expenditure
nt 0.14% $588 000
hrough the D e cludes for the full period on Families SA staff, as services contin ege throu
rrangement b Ja
or the period 1 July 2011 to 31 December 2011 – after this time Families SA
¹ This only includes expenditure texpenditure
CSI Colleg for Learning and Development and inued to be provided by the Coll gh a
Memorandum of Administrative A
eyond 1 nuary 2012.
² This only includes Families SA ftransitioned to DECD.

Department for Communities and Social Inclusion 94
Safety and Welfare
ds the Premier’s ero Harm Vision and underpins SASP Target 21, Greater
performance in response to the y relates to those d of the
and wellbeing
the Five Year Strategic Plan 2009-2013 incorporates a strategy to provide and maintain a
eviewed on an annual basis Safety and Welfare (OH ommial OHSW committees
stem has been reviewed and revised to tation a
irements leaders (claims an tion) to provide the required
nical expertise and specialist experience to the decision making
objectives to improve the
legislative compliance and meet critical processing dates the department has contracted an Occupational Physician, Psychologist and
Physiotherapist to assist with strategic interventions relating to new claims, treatment regimes, and intercede on ongoing and complex claims management
a multi-disciplinary early intervention project has been implemented to improve workplace safety and reduce the likelihood of multiple claims from the same employees
a Manual Handling Project has been implemented throughout Disability Services to address four critical areas; local procedures, equipment, corrective actions, risk training for managers/supervisors
an Employee Assistance Program (EAP) is provided to employees, immediate family members and volunteers, with access to Critical Incident Debriefing to workplaces through its contracted service provider.
2. Accountability for safety and wellbeing performance
the Chief Executive, Executive Directors and Senior Managers have performance or partnership plans in place that are reviewed annually
regular reports are provided to executive to enable the required monitoring and improvements to the health, safety and injury management performance
ongoing monitoring of the OHSW&IM system through regular reporting, inspection and internal auditing processes
relevant OHSW&IM Program Management Plan objectives are aligned with departmental and divisional risks
budget holders have the financial accountability for safety performance, and financial delegations are reviewed and disseminated on an annual basis.
Occupational Health, The Safety and Wellbeing in the Public Sector 2010-2015 strategy embeZ safety at work. The following information provides a summary of the department’s strategy. The information and data in this section onl ivisions department as at 30 June 2012.
Commitment to the management of safety1.
safe working environment
a Safety Commitment Statement is in place that is r the Occupational Health,
divisional strategic and locSW) Peak C
ttee is supported by
the department’s Injury Management (IM) syimprove the early intervention for rehabili nd return to work opportunities and ongoing case management requ
the IM team includes two team level of leadership, tech
d rehabilita
processes The OHSW & Injury Management Program Management Plan 2012-2014 includes three
key strategies to maintain performance and deliver theOccupational Health, Safety and Welfare and Injury Management (OHSW&IM) system
the Claims Review Tool has been created and implemented within IM to address

Annual Report 2011-12 95
risk management has been integrated into the business planning and decision making ed
l
nagement Framework, and quarterly reviews are undertaken of the OHSW&IM risk register
elihood of occupational
arly
t and OHSW Committees
rovided
reporting
r partnership plans and the Responsible Officer Report
on of the department’s
t tural rkCover
Injury Management.
3. Integrated risk management
processes through the Risk Assessment Facilitator Network – line managers are requirto effectively integrate the department’s Risk Management Framework into operationaand day to day activities
the OHSW&IM hazard and risk management processes and tools have been incorporated with the Risk Ma
risk assessments are conducted to prevent or minimise the likinjury, disease or illness
a claims management software application has been implemented to assist claims processes to ensure compliance with the legislative requirements
a risk-streaming process to assess (triage) and prioritise rehabilitation and return to worksupport
a dedicated managers’ Hotline is provided to support early intervention and improve ereturn to work opportunities.
4. Effective measurement and evaluation
the regular analysis of data, and provision of comprehensive reports to executive, managemen
an Integrated Incident Reporting System, overseen by an Executive Steering Group, has been implemented to monitor and record incidents
the OHSW&IM Program Management Plan 2012-2014 is implemented with regular monitoring, and progress reports against the performance measures and targets pto executive and OHSW Committees
an internal audit plan has been implemented that enables the assessment andof compliance levels against the OHSW&IM systems
workshops to review the OHSW&IM management system and identify new initiatives and performance improvement opportunities have been conducted
the OHSW&IM system compliance survey audits have been implemented against an annual schedule, which is designed to measure, monitor and report on performance against system requirements
mandated OHSW&IM training is monitored and reported to the Executive Leadership Team (ELT).
5. Relevant information from WorkCove
WorkCoverSA (WorkCover) Evaluators undertook an evaluatiOHSW&IM system against the WorkCover Performance Standards for Self-insured Employers during January to March 2012. The department has been verbally advised thathe OHSW&IM system is compliant and rated as Level 2 ‘Performing’ against the NaConsequences Model. Partnering arrangements have been established with the Wo
aluator and a schedule of ongoing meetings has been developed and endoEv rsed.
e department’s OHSW&IM PrTh ogram Management Plan 2012-2014 includes three OHSW&IM programs to drive identified priority areas by departmental risks, performance
tcomes and businessou needs. The programs are: Compliance and Performance Improvements Hazard and Risk Management

Department for Communities and Social Inclusion 96
key drivers for the department to achieve the required e
SW gic and local OHSW committees, that meet on
ittee
e online reference tool.
ed through structured arrangements and also r
industrial relations forum which includes
ace.
:
ing with the department
des
7
The aforementioned programs are
oW rkCover Performance Standards and are linked with the OHSW&IM policy objectives. ThELT and the DCSI Peak OHSW Committee monitor the implementation and progress of the plan.
6. Consultative arrangements
OHS&W committee structures are in place across the department, with the DCSI OHPeak Committee supported by divisional stratea regular basis. The DCSI OHS&W Committee structure includes: DCSI OHSW Peak Comm divisional OHSW strategic committees local workplace OHSW committees. OHSW committees assist with the consultative and communication processes and ensure the dissemination of information to employees. Consultation and communication on new or revised procedures and/or related processes and documents is addressed in accordance
ith the department’s e-referencw Registered employee associations are consultthrough an Industrial Liaison Committee with representation of major unions and seniodepartmental executives. Each division has an consultation with recognised employee representatives and executives about industrial matters, and those issues affecting staff and the workpl The department’s Workforce Health and Safety Unit consult with a number of external agencies and associations. These include WorkCoverSA SafeWork SA Self Insurance of South Australia (SISA) Crown Solicitor’s Office and the use of a dedicated solicitor work QBE Insurance PPC Worldwide (contracted EAP service provider) Sparke Helmore OHSW and IM consultants/experts Corporate Health Group. The department seeks professional advice on legislative matters/changes and also proviinformation in response to consultative processes initiated by State and national bodies
arding legislativereg reforms. Table 1: OHS Notices and Corrective Action taken (at 30 June 2012 for the 2011-12 financial year)
umber of notifiable occurrences pursuant to OHS&W Regulations Part 7 Division 6N
Number of notifiable injuries pursuant to OHS&W Regulations Part 7 Division 6 1
Number of notices served pursuant to OHS&W Act s35, s39 and s40 (default, improvement and prohibition notices)
1

Annual Report 2011-12 97
Table 2: Meeting Safety Performance Targets
Base:
2009-10 Performance: 12 months to
end of June 2012* Final
Target
Numbers
or Percentage
Actual Notional QuarterlyTarget**
Variation Numbers
or Percentage
1. Workplace Fatalities 0 0 0 0 0
2. New Workplace Injury 383
Claims 352 345 7 287
3. New Workplace Injury Claims Frequency Rate
60.37 53.23 54.33 -1.1 45.28
4. Lost Time Injury (LTI) Frequency Rate ***
30.42 35.23 27.38 7.85 22.82
5. New Psychological Injury Claims Frequency Rate
5.87 7.41 5.28 2.13 4.40
6. Rehabilitation and Return to Work:
6a. Early Assessment 40.73% 77.43% 8
within two days 0% -2.57% 80%
6b. Early Intervention within five days
98.36% 99.07% 90% 9.07% 90%
6c. LTI have ten business e
38.32% 40.23% 60% -19.77% 60% days or less lost tim
7. Claim Determination:
7a. New claims not yet
100% -24.51% 100% determined, assessed for
14.55% 75.49% provisional liability in seven days
7b. Claims determined in ten business days
77.98% 71.73% 75% -3.27% 75%
7c. Claims still to be determined after three months
5.7% 5.5% 3% 2.5% 3%
8. Income Maintenance Payments for Recent Injuries:
2010-11 Injuries (at 24 months development)
$2 005 108 $1 653 719 $351 389 pretwo
Below vio ye
average
usars
2011-12 Injuries (at 12 months development)
$1 115 032 $946 803 $168 229
Below previous two years average

Department for Communities and Social Inclusion 98
d 7c, performance is measured up to the previous
Based on cumulative reduction from basI Frequency Rate Injury Frequen the inju ry/disea ch
million hours worked. This freque alculated for d by the WorkCorporation.
rmula for LTI Frequency Rate (new claims):
Number of n -time injury/disease
* Except for Target 8, which is YTD. For Targets 5, 6c, 7b anuarter to allow reporting lag. q
** e at a constant qcy Rate is
ncy rate is c
uarterly figure. ry frequency rate for new lost-time inju
benchmarking and is use*** LTone
se for eaCover
Fo
ew cases of lost for year x 1 000 000 Nu er of hours w d in the yea
y gross workers co compared with
mb orke r
Table 3: Agenc mpensation expenditure for 2011-12¹
2010-11²
Expenditure 2011-12 2010-11 Variation Percentage
Change
Hospital $300 089 4 871 $135 2 82.01% $16 18
Income Maintenance $4 257 475 $3 951 108 $306 367 7.75%
Investigation $63 322 $45 929 $17 393 37.87%
Legal Expenses $295 420 509 $91 45.16% $203 911
Lump Sum $3 472 837 $2 241 618 $1 231 219 54.93%
Other $172 317 $89 291 $83 026 92.98%
Registered Medical $1 982 491 3 514 $248 14.36% $1 73 977
Rehabilitation $277 204 $136 870 97.53% $140 334
Travel $80 037 $72 342 $7 695 10.64%
Total Claims Expenditure 192 2 51 25 2$10 901 $8 64 6 $2 8 676 6.13%
¹ Before 3rd party recovery ² Information available from the Self In anag m (SIsurance M ement Syste MS)

Annual Report 2011-12 99
Governance Arrangements
Governance Principles The department is
. Ministerial Accountability
unter MLC n
er for Social Housing er for Disabilities
e Status of Wom
ister for Multicultural Affai
Accounta
vernance arrange those e an accochain between the Ministers and the Chief Executive, and between the Chief Executive
the Executive Leadership LT).
nd intractable problems for individuals, families and communities ries. Effective
governance arrangements are those that support seamless partnerships over time between the provider and the client, a continuum of care and support when needed by individuals and families, with no-one falling between the cracks.
Information on client needs, including unmet needs, determines the South Australian Government’s investment priorities and strategies for the allocation of funds. Good governance keeps service delivery policy, strategy and standards within the accountability chain from Minister to Chief Executive.
4. Voice of the Citizen
Effective governance arrangements are those that give a voice to clients, carers, advocates and other stakeholders. Governments are elected by the citizens, the electoral mandate being the most powerful determinant of government policies, but not the only one.
guided by the following seven governance principles.
1
Ministers are accountable to the community for the delivery of efficient and effective services that respond to the needs of the community. The department is responsible to the:
Hon Ian HMinister for Communities and Social InclusioMinistMinistMinister for Youth Minister for Volunteers
Hon Gail Gago MLC Minister for th en
Hon Jennifer Rankine MP Min rs
2. Chief Executive bility
Effective go ments are that ensur unimpeded untability
and Team (E
3. Citizen/Customer-Centred Services
The most complex arequire integrated responses and collaboration across functional bounda

Department for Communities and Social Inclusion 100
government sector is often well placed to deliver services that are in touch with special needs, are locally and community-based, that build individual and community capacity, encourage altruistic and philanthropic
y resources.
Effective governance arrangements are those that clearly define roles and responsibilities community sector
partners, including accountability for funding outcomes. They enable transfer of sharing between government and non-government
Commercial public enterprises that deliver social goods need to have the necessary level ter commercial enterprise and deliver a return on investment. In
ial practices will maximise value to unity without diminishing accountability.
ce arrangements are those that enable public enterprises to deliver on
ined by the Government, without undue interference and at arms length, but with transparency and disclosure protocols embedded to mitigate risk
interest.
. Procurement Flexibility
intaining, acquiring and developing assets such as exibility to accommodate capital projects that are often
large and require long lead times. Flexibility supports the capacity to pursue investment with the private sector.
g with responsibility for asset management, strategy and policy. Funding arrangements must be reportable and transparent, but not
cycles.
ov
Exe
he hief Executive, Executive irectors of each division and the Director, Policy and Community Development. Refer to the
age 10 for further details of current membership.
5. Community Sector Partnerships
In the provision of community services, the non-
endeavour and tap into communit
in funding arrangements between government departments and their
responsibility and greater riskpartners, as capacity to manage is developed.
6. Operating Commercially to Deliver Public Value
of independence to fosthese cases, the application of sound commercgovernment and to the comm
Effective governantheir mandate, as determ
and protect the public
7
Departments responsible for mahousing stock, require funding fl
opportunities, often in partnership
Effective governance arrangements are those that ensure that control of the asset is vested in the hands of the asset owner, alon
necessarily tied to annual capital budget
Internal Governance Bodies
he following corporate governance structures have scope that are departmental wide or Tc er substantial parts of our operations.
cutive Leadership Team
Executive Leadership Team (ELT) is made up of the CTDOrganisational Chart on p ELT is responsible for leading the implementation of the Five Year Strategic Plan 2009-2013, streamlining the key decision making processes and ensuring that the department has an integrated planning and reporting regime.

Annual Report 2011-12 101
mmittee
ensure probity, accountability and transparency in procurement eir implementation within worksites maintain an appropriate procurement authority from the State Procurement Board
and Organisational
g SA velopment
8 or above, for staff development purposes.
f
CS
Thequacon
er rogram Management Plan 2012-2014, nd related systems.
ief Executive or delegate, Chairs of Divisional ment representatives of divisional committees.
nology (ICT) Council is the main governance body advice for the Chief Executive on business technology . The ICT Council terms of reference include to:
rities to the Chief
Strategic Procurement and Grants Co
The Strategic Procurement and Grants Committee (SPGC), with executive support from the Procurement and Grants Unit, meets weekly to oversee procurement and grants operationsto: ensure the use of best practice processes
provide for ethical and fair treatment of participants manage agency interests in contractual arrangements ensure a strategic approach implement effective risk management develop policies and procedures and oversee th
consider individual grant funding requests. Membership comprises: Executive Director, Youth Justice, Community Engagement and Organisational Support
(Chair) Director, Community Connect, Youth Justice, Community Engagement
Support (Deputy Chair) Executive Director, Financial Services Director, Funds Management, Disability, Ageing and Carers, Community and Home Support SA Director, Corporate Services, Housin
Director, Policy and Community De one other staff member, ASO The Audit Response Committee and Grants Management Committee are sub-committees oSPGC.
D I Peak Occupational Health, Safety and Welfare Steering Committee
DCSI Peak Occupational Heath, Safety and Welfare Steering Committee meets rterly, or if an emergency meeting is required, in relation to legislative compliance, sultative mechanisms, and the strategic oversight of the department’s OHSW&IM formance and implementation of the OHSW&IM Pp
a Membership of the body includes the ChCommittees and employee and manage
Information and Communication Technology Council
he Information and Communication TechTthat meets monthly to develop strategy, programs and practice promote inter-divisional collaboration and the sharing of solutions, skills and experience to
improve the efficient and effective use of ICT develop a Business/ICT Strategy and give advice on ICT investment prio
Executive establish and maintain ICT technical governance covering information, applications,
infrastructure, standards and practices

Department for Communities and Social Inclusion 102
stakeholder, supplier and government ICT
and creating appropriate strategic responses,
f common interest.
ion Officer and extensive divisional
artment e to be resolved at the Divisional Industrial
ry Care Services, Community and Home
munity Connect, Youth Justice, Community Engagement and Organisational
nity Engagement and Organisational
Employee Associations:
blic Service Association Australian Nurses and Midwifery Association
nagement function and operations determine the internal audit program
embership of the body includes: ent and Organisational Support
t the
monitor, review and comment as necessary, on
performance, plans, policies and standards provide advice to the Chief Executive on changes required in whole-of-government ICT
plans and priorities identify opportunities for sharing resources
via collaborative working groups on matters of common interest set up and manage consultative working groups on ICT matters o Membership of the body includes the DCSI Chief Informatrepresentation.
Industrial Liaison Committee
The Industrial Liaison Committee meets monthide impact and issues that have not been abl
ly to address industrial issues with depwLiaison Forums. Membership includes:
Director , Human Resources (Chair) Executive Director, Financial Services (as required)
Executive Director, Disability and Domicilia Support SA
General Manager, Housing SA (for Executive Director, Housing SA) Director, Com
Support Director, Youth Justice, Youth Justice, Commu
Support
United Voice Pu
South Australian Salaried Medical Officers Association other employee associations as required.
Risk Management and Audit Committee
The DCSI Risk Management and Audit Committee meets six to seven times a year to: oversee the risk ma review internal audit and Auditor-General reports. M Executive Director, Youth Justice, Community Engagem Executive Director, Disability and Domiciliary Care Services, Community and Home
Support SA three external members, one of whom is the Chair. The Chief Executive is an attendee at Risk Management and Audit Committee meetings.
South Australian Housing Trust Board Finance and Audit Committee
The SAHT Board Finance and Audit Committee meets six to seven times a year to assisBoard regarding:

Annual Report 2011-12 103
ons
ty of financial information for inclusion of SAHT’s financial statements
planning and monitoring of Audit tasks.
t least two of those members being SAHT Board members.
are bound by the following Acts and Regulations administered by the
2005
Facilities Act 1992
Act 1991
lations 2001
ousing Act 1991 outh Australian Co-operative and Community Housing (Associated Land Owners)
tion
eneral) Regulations 2007 unity Housing (Housing Associations) Regulations
outh Australian Co-operative and Community Housing (Housing Co-operatives – 07
risk management
compliance with legal and regulatory obligati establishment and maintenance of the internal control framework reliability and integri provision of direct access by external and internal auditor at all times to the Committee
and Board audit, accounting and financial reporting obligations Membership of the body includes three independent members appointed by the Board, with a
Legislation The services we deliverdepartment at 30 June 2012:
Communities and Social Inclusion portfolio
Carers Recognition Act Rates and Land Tax Remission Act 1986 Rates and Land Tax Remission Regulations 2009 Supported Residential Supported Residential Facilities Regulations 2009
Social Housing portfolio
Housing Agreement Housing Improvement Act 1940 Housing Improvement (Section 60 statements) ReguHousing Improvement (Standards) Regulations 2007 South Australian Co-operative and Community HSRegulations 2002 South Australian Co-operative and Community Housing (Electoral Procedures) RevocaRegulations 2007 South Australian Co-operative and Community Housing (GSouth Australian Co-operative and Comm2010 SInvestment Shares) Regulations 20South Australian Housing Trust Act 1995 South Australian Housing Trust Regulations 2010
Disabilities portfolio
Disability Services Act 1993 ulia Farr Services (Trusts) Act 2007 J

Department for Communities and Social Inclusion 104
ssion Act 1980
mittees and Trusts
d Young People Board d Young People Board d Young People with a Disability Board
ies Act 1992 Assessor Panel acilities Advisory Committee.
nt
mmittee.
lio
olunteers portfolio
Group on Volunteering.
Premier’s Council for Women.
Volunteers portfolio
Volunteers Protection Act 2001 Volunteers Protection Regulations 2004
Multicultural Affairs portfolio
South Australian Multicultural and Ethnic Affairs Commi In addition to the above, the department is responsible for performing functions under a number of Acts and Regulations committed to Ministers outside of these portfolios.
Boards, Com Administrative support was provided to the following Boards, Committees and Trusts listed on the Boards and Committees Information System (BCIS) as at 30 June 2012:
Communities and Social Inclusion portfolio
re Fund Board Charitable and Social Welfa Community Protection Panel Dame Roma Mitchell Foundation for Children an
ildren an Dame Roma Mitchell Trust Fund for Ch Dame Roma Mitchell Trust Fund for Children an State Emergency Relief Fund Committee Supported Residential Facilit Supported Residential F
Social Housing portfolio
Housing Appeal Panel South Australian Affordable Housing Trust Board of Manageme South Australian Housing Trust Board of Management South Australian Housing Trust Board of Management Audit and Finance Sub-Co
Disabilities portfo
Minister’s Disability Advisory Council.
Youth portfolio
Duke of Edinburgh’s Award State Advisory Committee Minister’s Youth Council.
V
Ministerial Advisory
Status of Women portfolio

Annual Report 2011-12 105
ortfolio
and Ethnic Affairs Commission ic Affairs Commission Northern Regional Advisory
Committee and Ethnic Affairs Commission Riverland Regional Advisory
ast Regional Advisory Committee
mittee.
or more of the following criteria are required to y the Boards and Committees Unit of the
or non-statutory
cific desire for the Board to be listed on the
rnment boards
ted, on average, each quarter number of women chairing
nt by 2014.
ent of members of Boards and Committees recorded on BCIS for ided administrative support were women. Of those with a Chair,
t and Internal Audit
grated into decision making and business planning ctivities, with the Chief Executive accountable for the development and implementation of a
framework specific to the department’s business and organisation context. ed a network of Risk Assessment
s/business units, who provide advice and assistance on the entification, management and reporting of risks.
0:2009 provides the principles and nagement Policy and Framework has been
eveloped.
Multicultural Affairs p
South Australian Multicultural South Australian Multicultural and Ethn
South Australian MulticulturalCommittee
South Australian Multicultural and Ethnic Affairs Commission South E
South Australian Multicultural and Ethnic Affairs Commission Women’s Advisory Committee
South Australian Multicultural and Ethnic Affairs Commission Youth Advisory Com Boards, Committees and Trusts meeting onebe recorded on BCIS, which is administered bDepartment of the Premier and Cabinet: the Board is established by or under an Act of the Parliament of South Australia one or more members of the Board receives remuneration, whether statutory
the responsible Minister has expressed a spedatabase.
The revised SASP contains two targets in regards to South Australian Goveand committees. These are: Target 30 – Boards and committees: increase the number of women on all State
per cent on average by 2014, and maintain Government boards and committees to 50thereafter by ensuring that 50 per cent of women are appoin
Target 31 – Chairs of boards and committees: increase theState Government boards and committees to 50 per ce
At 30 June 2012, 69.4 per cwhich the department prov64.7 per cent were chaired by women.
Risk Managemen Risk management is established and intearisk managementThe Risk Management and Internal Audit Unit has developFacilitators located in divisionid The Australian/New Zealand Standard ISO 3100guidelines from which the department’s Risk Mad

Department for Communities and Social Inclusion 106
arry out the independent, objective analysis and assurance gement, internal control
uring 2011-12, the Client Feedback System was implemented, to support the consistent
Cli ol to
owledged within five working days and 80 per cent f complaints received are to be closed within 30 working days. In the past 12 months, 4 per cent of complaints have been acknowledged within five working days and 70 per cent f complaints have been closed within 30 working days.
e time to resolve and/or close
The internal audit function is to con the adequacy and effectiveness of the department’s risk manaand governance processes to add value and improve the operations of the department. This is undertaken in consultation with management. Internal auditors also undertake
vestigations iin nto allegations of fraud and corruption and matters raised by whistleblowers.
e internal auTh dit function is independent from the external audit function.
CD SI Client Feedback System Drecording, management and reporting of client feedback. As it contributes to gauging the general consensus of satisfaction with the department’s services, it is linked to SASP Target 32 which seeks to increase the satisfaction of South Australians with governmentservices by ten per cent by 2014, maintaining or exceeding that level of satisfaction thereafter.
eTh or the full year. In 2011-12, the department recorded 477 compliments, 68 comments/suggestions and 631 complaints.
Client Feedback System has been in place f
The core focus of the last 12 months has been embedding the Client Feedback System across the department. This has required extensive staff training and increasing client awareness of the system.
ents are able to provide feedback in person, online and in hard copy formats. Another tosupport clients in providing feedback has been the development of an ‘easy read’
brochure/form. In addition, an Aboriginal designed brochure/form for Aboriginal clients has been developed. A measure of the effectiveness of the Client Feedback System is the time it takes to acknowledge and respond to feedback. The KPIs to reflect these measures include that 75 per cent of client complaints are ackno8o
ver the next 12 months, work will progress on improving thOcomplaints; analysing issues raised through the feedback process; increasing the number of Aboriginal clients providing feedback; evaluating the effectiveness of the Client Feedback System and developing procedures to manage client feedback regarding funded agencies’ services.

Annual Report 2011-12 107
to privacy in g Offenders Act
993 and the Supported Residential Facilities Act 1992. These legislative requirements take recedence over the Code.
s not apply to South Australian Government epartments. However, the Privacy Amendment (Private Sector) Act 2000 regulates the
bility er
ach division of the department is responsible for ensuring that they comply with privacy
.
Guidelines
isations. They present a simple and clear process that guides good
nd procedures
education program.
The department has also collaborated with the Office of the Guardian for Children and Young People in monitoring the implementation of the Information Sharing Guidelines by relevant funded non-government organisations.
Privacy The department collects a large volume of information about clients, some of which is very sensitive in nature. All staff are bound by the Code of Fair Information Practice (the Code) which contains the Privacy Principles that guide the collection, use, disclosure and handling of personal information. In addition, there are legislative provisions relatingspecific areas of work or in specific circumstances, for example in the Youn1p The Commonwealth Privacy Act 1988 doedcollection, use and disclosure of information by private sector organisations (including non-government organisations) with a turnover of more than $3 million, related to a larger organisation, or providing health services and holding health information, including disainformation. Therefore, many of our partners and contracted services have obligations undthis Act. Eobligations and develop and enact appropriate policy and procedures. The Research Unit, Business Affairs, can provide advice to divisions on complex privacy matters
Information Sharing The Information Sharing Guidelines for Promoting the Safety and Wellbeing of Children, Young People and their Families were approved by Cabinet in October 2008, for implementation within all relevant South Australian Government agencies and non-government organpractice, embeds a consistent approach to information sharing and focuses on improved service coordination when responding to safety and wellbeing risks. Strategies undertaken in the past 12 months to embed the guidelines within DCSI professional practice include: a revised education program for all staff including the opportunity for revision referencing the guidelines within all relevant policies a incorporating the guidelines within the department’s Induction Program for all new
employees and other relevant programs, such as the Child Safe Environments program administered by the College for Learning and Development.
Ninety eight per cent of required staff have completed the compulsory Information Sharing Guidelines

Department for Communities and Social Inclusion 108
ent
is
the selection of products and services the department will: unless there are valid technical reasons for not doing so, consider energy efficient and
no
rtunity
ise suppliers who employ people with disability, Aboriginal and Torres Strait Islander people and others considered disadvantaged in the community.
een stablished to oversee procurement and grant funding activities.
he SPGC is responsible for ensuring transparent and accountable procurement and grant urement and grant funding activity, and for unding reform. The Committee also provides
e
Procurem The department is guided by the Procurement Approvals and Processes Policy towards procuring goods and services in alignment with State Procurement Board requirements. Thincludes the engagement of consultants and contractors. The Sustainable Procurement Policy also guides the department towards procuring socially and environmentally preferred products and services where price, performance, quality, and suitability are comparable. In
recycled/recyclable goods not purchase products known to involve the use of ozone depleting substances unless
practical alternative is available only procure products and services from organisations that comply with equal oppo
and disability services legislation consider suppliers that demonstrate socially responsible work practices recogn
The Chief Executive is responsible for the procurement and grant funding activities of the department. To assist the Chief Executive, a committee of skilled officers has be Tfunding practices, overseeing significant proc
rogressing strategic procurement and grant fpassurance to the Chief Executive that procurement delegates are following fair practices,obtaining best value and making defendable decisions. This is achieved by the Committesetting business rules and procedures, reviewing transactions worth $550 000 (GSTinclusive) and above and issuing directions to delegates.

Annual Report 2011-12 109
eporting
Corporate R
Reconciliation
Sta flects our commitment to the principles of the South Australian
ogram and service design.
le in addressing the disadvantage experienced by ralia. Our
lding outcomes for
boriginal and Torres Strait Islander people. Reconciliation enables us to deliver on the al
ur
as continued to: strengthen relationships between Aboriginal and non‐Aboriginal people improve respect for Aboriginal people, culture, land and history support opportunities for Aboriginal people, organisations and communities. To deliver on the Reconciliation Action Plan 2010-2013 and promote Reconciliation, the department: supported a number of major events to coincide with Reconciliation Week, and led and
participated in other events throughout the year worked to establish a dedicated NAIDOC Committee, to lead recognition of outstanding
Aboriginal staff and volunteers developed new relationships with private sector businesses and non-government
organisations with similar Reconciliation principles maintained, promoted and publicised Reconciliation through the department’s intranet
site, blogs and other media continued to promote the Cultural Inclusion Framework across the department supported the integration of Reconciliation principles and practices into divisional plans provided advice to senior leaders on Reconciliation matters continued to support local Reconciliation committees and local Reconciliation events to
ensure that there is a specific focus on developing local activities presented to non-government organisation forums and other government departments
regarding the department’s commitment to and focus on Reconciliation.
For the department, Reconciliation means working with our people, Aboriginal people and their communities to recognise Aboriginal people as the first Australians, with unique cultures, languages and spiritual relationships to the land and seas. The department’s
tement of Reconciliation reGovernment’s Cultural Inclusion Framework, including building a culturally competent workforce and culturally inclusive pr The department plays an important roAboriginal and Torres Strait Islander people and communities in South AustReconciliation agenda is about promoting knowledge about Aboriginal culture and uphothe values of unity, justice and equity, to enable our staff to deliver improved Adepartment’s Aboriginal Priorities Plan 2012-13 that describes our commitment to AboriginSouth Australians, in line with the Government’s Cultural Inclusion Framework and onational obligations. During 2011-12, the department’s Statement of Reconciliation was reviewed and updated and, following the machinery of government changes, the Reconciliation Committee membership was expanded. The Reconciliation Committee comprises non-Aboriginal and Aboriginal members, and plays an important role in promoting Reconciliation and providingleadership on behaviour and values to foster a culture of Reconciliation. The department’s Reconciliation Action Plan 2010-2013 h

Department for Communities and Social Inclusion 110
5
s an administrative unit of the South Australian public service that provides relevant ervices, the department is required to report annually on compliance with the Carers ecognition Act 2005 and the SA Carers Charter.
tment’s progress during 2011-12 against the principles
he department undertook a range of activities during the past 12 months to raise awareness
ations
rers Recognition Act 2005 in the current Youth Justice Business Plan velopment of a consultat
of the Carers ustomers and
stralian Government
stem to ensure consultation with carers, or persons or bodies that
op
005, and facilitating flexible work ce
ilities.
e Minister for Communities
Carers Recognition Act 200 AsR
he following summarises the deparTof the Carers Charter and Sections 6(1) and 6(2) of the Act.
There is a system to ensure all management, staff and volunteers have an awareness and understanding of the Carers Charter
Tof the Carers Charter amongst its employees and associates. Activities include the: presentation of Carer Recognition Awards to acknowledge businesses and organis
that provide outstanding responses to carers as customers or employees proposed revision of the Disability Services Act 1993 will reference the Carers
Recognition Act 2005 and require funded organisations to reflect the principles of the Carers Charter – this is significant as carers of clients of Disability Services are an integral part of the service support system
inclusion of the Ca2012-2013, which will include the de ion framework.
The Managers and Carers Working Together toolkit, a three-part multimedia packageproviding information on leave and flexible work arrangements currently available to departmental employees, will soon be shared with government departments through the South Australian Government exchange website. The frequently asked questions factsheet for carers, incorporates key areasCharter and lists support services available. This fact sheet is available to ccarers at Housing SA offices across the State and on the South Auwebsite.
There is a syrepresent carers, in the delivery of services and development of strategic and
erational plans, policies and programs
eTh d has systems in place, to ensure continued compliance
with the Australian Service Excellence Standards. These include policies and procedures to address compliance with the Carers Recognition Act 2
department is committed to, an
practices that meet business and service requirements, whilst allowing employees to balantheir work and caring responsib The Office for Carers meets with the carer service sector on a regular basis in various forums, including the Roundtable Forum which is attended by thand Social Inclusion. The purpose of the Roundtable is to share information, identify and consider issues for collaboration and discuss issues.

Annual Report 2011-12 111
g 2011-12 include a Young Carers Forum in June of the three-year study of young carers in
and
cus on maintaining
final project report cludes a Carer Practice Framework consisting of 12 Practice Principles that underpin how
C funded Carer Retreats program was
vice
ag nding on more
ngoing attendance in the Aboriginal Partnership Group d
boriginal artnership Plan which includes consulting with Aboriginal carers and raising awareness of
ards. The Standards require funded gencies to encompass services for care recipients and carers and report on quality,
vices. Interpreters are provided at these collaborative sessions which enable nkages between carers and staff to facilitate ongoing consultation and feedback.
ess g
to carers, “…..to the extent that the purpose volves carers or interaction with carers, you agree to consult carers, or those people or
ng and review processes, the provision of feedback and
ion on broader onsumer issues.
Additional consultations undertaken durin
012, with researchers reporting on the findings 2Australia, Young Carers: Social policy impacts of the caring responsibilities of childrenyoung adults, which was released in December 2011.
HACC project was undertaken during the previous 12 months, with a foAcarers’ physical health and wellbeing and their connection with communities of relevance, including employment. Extensive consultation informed the findings of the project with over
00 current and past carers and HACC funded agencies consulted. The4inservices and supports can be tailored towards the needs of individual carers. In August 2011, an internal review of the HACcompleted. As part of the review, HACC staff consulted with bodies that consult with and represent carers to gauge their perspective on how the retreat program can better meet the needs of carers. The resulting improved reporting template has been included in SerAgreements. In addition, due to the consultation and feedback from carers, HACC has
reed their carer support service providers can use a greater proportion of furespite expenses, making the program more flexible and subsequently available tocarers. The Aboriginal HACC team has had omeeting, which includes representatives from Carers SA, Aged Rights Advocacy Service anproviders of carer services for Aboriginal people. At present it is advancing the APthe needs of Aboriginal carers and their families. HACC funded service providers undertake a quality audit every three years to ensure compliance with Community Care Common Standaappropriate access, service delivery and service user rights and responsibilities. Disability Services staff attend specific parents and carers groups to provide information about serli Community Benefit SA guidelines for one-off grants place priority on projects that addrspecial needs groups, including carers. Carer recognition is promoted through fundinagreements by including a specific reference inorganisations that represent carers, in policy and program development and/or in strategic oroperational planning that is relevant to carers and those they care for”. The Domiciliary Care Consumer Participation Strategy promotes and supports a range of opportunities for clients and carers to influence the development and improvement of ervices through participation in plannis
through focus groups, surveys and informal feedback and participation on consultative advisory committees. Carers are also directly involved in the development and review of client service/care plans. A consumer participation role, established in 2004, recognises the need for a specific role to address the needs of Domiciliary Care clients and carers at trategic and policy levels, to enable effective engagement about and acts
c

Department for Communities and Social Inclusion 112
e
tcome of wide
ers
ired to reflect the intent of the Carers Recognition Act 2005. This is in addition to a
re
case sment for
for
lity access and
es to
h
A statewide carer support services search map is available on the Carers portal of the SouthAustralian Government website. Carers and service providers can identify their local servicby postcode. The Carers portal also has a specific section with information and referral options for general practitioners.
There is a system to ensure the principles of the Carers Charter are reflected in departmental practices
The Plan for South Australian Carers 2009 sets the vision and key priorities for the South
ustralian Government to support and respond to carers. The Plan was the ouAconsultation within the department and with the carer sector. A report on the Plan wasprepared during 2011-12. The department has developed systems and mechanisms to monitor and report on activity toensure that the principles of the Carers Charter are reflected in departmental practices. New HACC service agreements, funding services for carers of people with disability agedunder 65 (aged under 50 for Aboriginal people), include a statement stating service provid
re requastandard inclusion that service providers are ‘required to consult carers, or those people or organisations that represent carers, in policy and program development and/or in strategic or operational planning that is relevant to carers and those they care for’. Service agreements also detail that upon request, they must provide written evidence that they are meeting the requirements of the Carers Recognition Act 2005. Youth Justice conducts extensive assessments of all children and young people who asubject to a mandate, which includes an assessment of their personal and family circumstances, including carer responsibilities. Case planning may include referral to identified support agencies, including carer agencies or child protection, and ongoing
anagement is provided. Youth Justice has conducted a Cultural Linkages Assesmall Aboriginal clients, which further identifies the kinship arrangements, which may includecarer responsibilities, and provides case management support to those clients.
Disability Action Plan Government departments are required to report on progress against the six key outcomespeople with disability in Promoting Independence: Disability Action Plans for SA. This is the South Australian Government’s strategy to progressively improve disabi
clusion across all public sector and funded services. in
1. Portfolios and their agencies ensure accessibility of their facilities and servicpeople with disabilities, both as customers and employees
Housing SA builds a minimum of 75 per cent of all new social housing in accordance witHousing SA Guideline 2.3, Design Criteria for Adaptable Housing. House types whichmay not comply include steep sloping sites or two-storey constructions.

Annual Report 2011-12 113
perties at a cost of $3.7 million.
. Portfolios and their agencies ensure information about their services and
ations are made available in alternative formats on request. Requests for alternative formats are reviewed on a six-monthly basis to ensure the
uces printed and electronic publications which are accessible by people with disability. This includes producing easy to read feedback sheets and
ty.
and in the implementation of complaints and grievance mechanisms.
In July 2011, the Consumer Engagement Strategy for Disability was launched as a pilot ngage people living with disability, their families, opinion
gencies across the community. This addresses the
In the 12 months to 30 June 2012, a total of 3740 modifications were undertaken on 2840 properties at a cost of $3.85 million. This includes 115 modifications undertaken on 86 Aboriginal housing properties at a cost of $0.15 million, and 3625 modifications undertaken on 2754 SAHT pro
2programs is accessible and inclusive of people with disabilities
All departmental public
requirements of the Commonwealth Disability Discrimination Act 1992 and Equal Opportunity Act 1984 are complied with.
Disability Services prod
information sheets at no charge to people who are unable to access the department’s website.
3. Portfolios and their agencies deliver advice or services to people with disabilitieswith awareness and understanding of issues affecting people with disabilities. In doing so, agencies should report on the extent of the delivery of disability awareness training with staff using the South Australia Disability Awareness and Discrimination Training Framework
The programs of the College for Learning and Development are nationally accredited under the Australian Qualifications Framework. All qualification requirements include competency in working with people with disabili
All new staff are informed about the South Australia Disability Awareness and Discrimination Training Framework as part of their induction. Disability awareness training is provided to all staff on an ongoing basis through a combination of online learning programs and workshops.
4. Portfolios and their agencies provide opportunities for consultation with people with disabilities in decision making processes regarding service delivery
project to more effectively eleaders, interested individuals and arequirement of the department’s Disability Action Plan which requires consultation with people with disability regarding changes to service delivery.
As previously reported the project paper Consumer Engagement Strategy for Disabilitymade recommendations for the development of a ‘disability register’ for members of the community to provide independent advice on specific topics that concern people living with disability, their families and their carers. The pilot encouraged people who nominatedfor the register to identify the topic areas of their greatest interest and expertise relating to people living with disability, and their families. From this initial pilot, topics were selected for intensive community engagement.

Department for Communities and Social Inclusion 114
cy he
een implemented across the department to
nt. Based on client feedback received during the year, the department
asure the effectiveness of the current Client
. tunity
h the Equal Opportunity Act 1984. The Disability
6.
Disability
The project, known publicly as the South Australian Disability Register, is to become a central resource of feedback for policy makers, inform the development of disability poliand report to MDAC to assist in the development of policy recommendations to tMinister for Disabilities.
All funded organisations are required to endorse and promote the principles andpractices of the Commonwealth Disability Discrimination Act 1992 and to develop a Disability Action Plan. They may also be required to provide evidence of their organisation’s compliance with the Disability Discrimination Act 1992, including any progress in developing and implementing a Disability Action Plan.
The DCSI Client Feedback System has bsupport the consistent recording, management and reporting of client feedback. Community and Home Support SA provides referral packs which include a client feedback brochure/form to encourage clients and their families to provide feedback (compliments, complaints, comments/suggestions) on services provided by the departmedeveloped and distributed easy to read client feedback brochures/forms, and posters to increase client awareness of and participation with the feedback system.
The client feedback report produced by Riskman (DCSI’s Client Feedback System) provides information on areas for improvement and programs that are working well. The department will develop a survey to meFeedback System. This survey will be sent out to clients who have previously providedfeedback to the department.
5 Portfolio Chief Executives ensure that their portfolio has met the requirements of the Disability Discrimination Act 1992 (Commonwealth) and the Equal OpporAct 1984 (South Australia)
The Disability Action Plan is the department’s key strategy to ensure compliance witDisability Discrimination Act 1992 and the Action Plan Committee, which comprises representatives from across the department, is responsible for the promotion and implementation of the plan.
Portfolios report on how they are increasing the rate of employment of people withdisability in order to meet SASP Target 50: People with disability – Increase by tenper cent the number of people with a disability employed in South Australia by 2020 (baseline: 2009)
As at 30 June 2012, there were 213 employees (4.2 per cent of total employees) with disability employed in the department, based on the Commonwealth Discrimination Act 1992 definition.
The department recognises the importance of continuing to promote and support employment opportunities for people with disability and is implementing recruitment and retention strategies to improve future results.

Annual Report 2011-12 115
Inteemwit
S ith disa bility and el of sup high and
om s identified from the ur
straawa The ion on tance FunDis
ith bility m ion
for Thr e disa
nd d to educate employees about the impacts of disability and ow workplaces can support employees with disability to reach their potential.
Ju As
ro t to Section 9 of the Julia arr Services (Trusts) Act 2007 to include in its annual report specific information regarding
comCen In r st rep(a) he Fullarton campus
) with respect to the persons resident at a place other than the Fullarton campus, a broad
(c) the relocation of any person to
accommodation other than the Fullarton campus (ii) the number of people who returned to accommodation at the Fullarton campus, and
the circumstances of their return.
gration of the policy into planning processes and the strategies in place to ensure ployment practices and recruiting strategies do not discriminate against people h disabilities
In eptember 2011, as a way of understanding the challenges faced by employees w
bility and their managers, two surveys were developed (one for employees with disa one for managers of employees with disability) to gain feedback in relation to the levport provided and access to modifications. The response rates for both surveys were following the release of the survey report in late 2011, a Disability Employment munities of Practice was established to follow up on the challengeC
s veys. In addition, the Disability Employment Communities of Practice will work on tegies to support employees with disability and their managers and promote disability reness in the workplace.
department has updated the disability employment intranet page to include informatCommonwealth Government supported initiatives, such as the Employment Assisd and Disability Employment Service providers. Vacancies are promoted through the ability Employment Register prior to being advertised, to improve opportunities for people disability to secure short term vacancies. There are also links to the Disaw
E ployment Register and fact sheets detailing department support and contact informatemployees with disability and their managers.
ough the College for Learning and Development, the department has developed an onlinbility awareness course for employees and managers. The course contains information associated vignettes designea
h
lia Farr Services (Trusts) Act 2007
the administrative unit primarily responsible for assisting the Minister for Disabilities in the vision of disability services, the department is required pursuanp
Fthe number of residents at the Fullarton campus and the relocation of any residents to
munity housing. The Fullarton campus is the site previously known as the Julia Farr tre, and now known as Highgate Park.
egards to the residents of the Fullarton campus as at 30 June 2007, the department muort on the following as at 30 March of each year: the number of persons resident at t
(bdescription of the nature of their accommodation during the preceding period of 12 months: (i) the processes used to plan and implement
Department for Communities and Social Inclusion 116
k
onal, and health services. Family
tructure and Functions of the Department for Communities and Social Inclusion
l basis from offices around the State.
com rable, at risk of harm, or isolated, and to ithin South Australia. The work of the
dep to make ‘a better l r Strategic Plan 2009-2013. The dep connec
The direction of the department is also influenced by the work of advisory boards and committees listed on pages 104 and 105.
As at 30 March 2012: (a) 102 people with disability were resident at the Fullarton campus. (b) With respect to the people resident at a place other than the Fullarton campus, people
moved to a range of supported community accommodation. This includes four to five person group homes, clusters of units, and houses accommodating up to six residents. These purpose built and modified dwellings provide 24 hour, seven day a week accommodation support in community settings. Group homes and six person cluster sites are located in Mitchell Park, Felixstow, Fullarton, Clarence Gardens, Elizabeth East, ParHolme, Morphett Vale, Elizabeth Grove, Taperoo, Daw Park and Campbelltown.
(c) During the preceding 12 months:
(i) Community and Home Support SA, through the Community Transition Team, assisted people living at the Fullarton campus who wanted to return to the wider community, through the application of a Person Centred Planning process. This involved getting to know the person using the ‘My Story’ process and assisting them to identify locations and suitable types of supported community accommodation. The Community Transition Team then worked with other service providers to assist the person to relocate. Assistance included establishing access to local general practitioners and other community, recreatimembers were also, on occasions, involved in this planning.
(ii) All the people relocated from the Fullarton campus are living in supported community
accommodation and no one has returned.
Freedom of Information The Freedom of Information Act 1991 (FOI Act) provides members of the public with a legally enforceable right of access to information held by agencies, subject to specific exemptions. Under Section 9 of the FOI Act, South Australian Government agencies must publish an up-to-date information statement every 12 months. Information statements must be published inthe agency’s annual report, on a website maintained by the agency, or both.
S
The department’s organisational chart is on page 10 of this report. Services of the department are provided on both a regional and loca The functions of the department are based on a broad mandate to assist members of the
munity who, through circumstance, may be vulneconnect them with choices and opportunities w
artment is undertaken in partnership with a range of community organisations, ife for South Australians’ as set out in the Five Yea
artment works closely with people across South Australia to build sustainable, strong andted communities.

Annual Report 2011-12 117
artment for Communities and Social Inclusion Affecting the
ed to make a tangible
par
Pub
Thedev s. To onnect with the community, consultation may be undertaken in the planning, development
Thediscuss gs on legi
Types
The de inter ent,
hum gen papers, reports,
prop other documents such as client records (case notes, payment and debt records, and
housing maintenance work orders and invoices), internal policies and procedures, eral management and industrial circulars.
he Library and Information Service will assist with enquiries about departmental
delaide SA 5000
Oakden SA 5086
o
cial Inclusion PO Box 292
Functions of the DepPublic
he work of the department encompasses a range of services designTand positive difference to the wellbeing of all members of the community. Our work falls broadly into the areas of housing, family support, disability and ageing, community
tnerships, youth, women, volunteers and multicultural services.
lic Participation in Agency Policy Development
department regularly seeks external expertise and community opinion in the elopment of policy, including from statutory and non-statutory advisory committee
cand implementation of policy.
department consults with major interest groups and service providers, circulates ion papers, calls for submissions on particular topics, and convenes public meetin
slative reform and policy initiatives.
of Documents Held
partment holds a wide variety of documents that can be categorised principally as: nal administrative instructions for functions in the areas of financial manageman resources, property management and practice procedures eral publications including books, discussion and background
reviews, serial publications, pamphlets, posters, greetings and common phrases, surveys, guidelines, policies, programs, strategies, directories, evaluations, assessments and
osals
administrative circulars on gen Tpublications. It has two locations: Central Collection Plaza Level, Riverside Centre North Terrace
Disability Collection Strathmont Centre 696-710 Grand Junction Road
ATelephone: 8413 9028 Telephone: 8266 8556 Generally, the department’s publications are available without charge. Publications can als
e accessed online at www.dcsi.sa.gov.au. b
Access to Documents
Applications for access to documents and policies including purchase costs, or for amendment of personal records held by the department, should be addressed to: Senior FOI Officer Department for Communities and SoGAdelaide SA 5001 Telephone: 8413 9094

Department for Communities and Social Inclusion 118
d procedure documents. hese include but are not limited to, policies and procedures relating to:
ly
FOI
f a
ct Assessment State
ent Statements P t Assessment ared by departments prior ges to
n Government services as. This is to ensure nsidered in king.
ramework is an initiative of the South l impact of government operations. The
eved all of the GoGO Action Plan milestones within the specified
Applications made under the FOI Act for access to documents must be in writing and beaccompanied by the application fee of $29.50. A fee reduction may be granted in certain circumstances.
Departmental Policy Documents
The department maintains a substantial number of internal policy anT carers and volunteers ethics operational programs and service delivery finance governance human resources information communication technology occupational health, safety and welfare procurement records management risk management. Members of the public wishing to access internal policy documents are encouraged to appfor access under FOI.
Freedom of Information – Statistical Reporting
The Information Statement does not require reporting on FOI statistics, rather section 54AA of the FOI Act prescribes that each agency must furnish to the Minister administering the
t, such information as the Minister Ac requires by notice in the Government Gazette. The department’s annual statistics have been provided to State Records for the compilation owhole-of-government FOI statistical report. This information can be accessed at
ww.archives.sa.gov.au. w
Regional Impa ments
pact AssessmThe Regional Im olicy requires a Regional Impacnificant chanStatement to be prep to implementing sig
existing South Australiaat rural and regional issues are co
to rural and regional aregovernment decision math
During 2011-12, the department did not undertake any Regional Impact Assessment
tatements. S
Greening of Government Operations Framework The Greening of Government Operations (GoGO) F
ernment to reduce the environmentaAustralian Govdepartment has achitimeframe.

Annual Report 2011-12 119
perations’ Milestone 2: Allocated resources to set up governance and initiate internal review
iew of environmental impacts and determined priorities
agency implementation plan
ching performance goals/targets n plan
8: Undertaking ongoing measuring, monitoring, reporting and, continuous f performance.
ity areas to ensure that the South Australian ronmental performance.
anagement
to improve the energy efficiency of government buildings by 30 per
department is now on target to reach the 2020 energy efficiency provement target of 30 per cent.
he Print Consolidation Program has also continued to be implemented throughout all epartmental offices and sites. The Riverside Centre and offices at 44 Pirie Street and errace Towers are now fully managed under the Print Consolidation Program. There has
sed devices fail, they are not being e Centre has been reduced from
ity of Disability w also
enefits of the Print Consolidation Program include significant savings in regards to aintenance and IT support, and a reduction in the use and cost of consumables such as
ised multifunctional
The strategic milestones are: Milestone 1: Established Chief Executive ‘Statement of Commitment to greening of
government o Milestone 3: Completed initial rev
and allocated resources Milestone 4: Set performance goals/internal targets (informed by targets of South
an and/or other targets agreed by government)Australia’s Strategic Pl Milestone 5: Approved Milestone 6: Reported on status/progress in rea Milestone 7: Initiated agency implementatio Milestone
improvement o The GoGO Action Plan contains eight priorGovernment continuously improves its envi
Priority Area 1: Energy M
SASP Target 61 seeks cent by 2020, with a milestone of 25 per cent by 2014. During 2011-12, the department achieved a 28.9 per cent increase in energy efficiency throughout the portfolio from the 2000-01 baseline. The im Activities during the past 12 months to improve energy efficiency include: Greening DCSI undertaking employee engagement and branding initiatives to increase its
profile and influence achievement of SASP targets using the Online System for Comprehensive Activity Reporting (OSCAR) to track energy
usage. TdTbeen no increase in device numbers and where printer baeplaced. The total number of print devices in the Riversidr
312 in 2007 to 60 as at 30 June 2012, representing a reduction of 80.8 per cent. CO² emissions have been reduced by 86.93 tonnes per annum. The number of print devices at Highgate Park has been reduced from 95 to 64 (a 32.6 per ent reduction), reducing CO² emissions by 10.7 tonnes per annum. The majorc
Services and Housing SA sites in the metropolitan and regional South Australia are nomanaged under the Print Consolidation Program. Bmtoners. It has now become the standard to have access to a centralcolour print device while local printing has been virtually abolished. The department has also achieved a NABERS tenancy energy rating on the Riverside tenancy of 5.0. This has set a benchmark ‘score’ for energy efficiency that can be used to monitor the success of energy saving initiatives in the future.

Department for Communities and Social Inclusion 120
rvation and Wastewater Management
itted
nd the financial
nd sites throughout the department. The 3 Bin System s
aste provider SITA Environmental Solutions highlight
.73 per cent confidential paper – 6.21 per cent
ment is also continuing the recycling program with old fluorescent tubes. Over the ast six years approximately 5000 tubes have been diverted from landfill.
of
he paper usage in 2011-12 reflects the reduction in print and photocopying devices and the
o include all offices and sites, with the
Priority Area 2: Water Conse
While a baseline of water usage has been difficult to determine, the department is commworking with SA Water, fato cility managers, building management and staff to reduce water
consumption. Present and potential future water restrictions will also continue to be brought to the attention of staff to raise awareness. Water efficiency awareness is also part of the DCSI Greening Program. At present the department is unable to report on kilolitres of water usage aspend incurred.
Priority Area 3: Waste Management
The waste management system pioneered in the Riverside Centre tenancy has been plemented in all major offices aim
relies on separating wet waste to landfill, recycling milk cartons, bottles, plastics and canand recycling all photocopying paper, newspapers and cardboard, with no waste going toandfill. l Environmental reports supplied by the wthe breakdown of waste categories as follows: alternative fuels – 39 per cent paper only – 23.53 per cent paper and cardboard – 16.64 per cent food waste/organics recycling – 6 comingle containers – 4.76 per cent metal recycling – 2.92 per cent
electronic waste – 0.21 per cent. The departp In 2010-11, approximately 57 695 reams of A4 and A3 paper were purchased at a cost approximately $300 000. During the past 12 months 47 001 reams of A4 and A3 were purchased, equating to a saving of 10 694 reams of paper or approximately 18.5 per cent. The total cost of the 47 001 reams amounted to $214 480, which is a saving of $85 520 or approximately 28.5 per cent. Tuse of double sided printing which is now a standard throughout the department
Priority Area 4: Built Facilities (Green Building) Management
The DCSI Greening Program has been extended temphasis on lowering the carbon footprint through the installation of energy efficiencies, waste management systems, water efficiency awareness and print consolidation and print paper usage.

Annual Report 2011-12 121
strategic objectives,
nt of facilities n
ompliance with legislation nt Energy Efficiency Action Plan mented.
ing SA – 251 vehicles (26.8 per cent)
nkunytjatjara (NPY) Women’s Council – 19 vehicles (2 per
iative continued during 2011-12, focusing
he passenger fleet) of the passenger fleet)
(24.9 per cent of the passenger fleet).
es to decrease ehicle emissions by a further ten per cent by 2014-15, in line with new whole-of-government
ducts and services where price, performance, quality, and
riority Area 7: Human Resources Management
e supported through the
nd greening continues to be reflected in administrative policies, procedures nd departmental guidelines.
The DCSI Assets and Facilities Business Plan 2012-2013 identifies the direction and performance indicators the department will implement to achieve its outcomes. The Business Plan outlines the strategic directions and performance indicators to achieve a more sustainable and green department. These are: all future works comply with relevant standards, legislation and government policies,
procedures and instructions lower the carbon footpri develop green building strategies and a program of works and commence implementatio develop and follow sustainability principles and standards as outlined in SASP 100 per cent c compliance with the State Governme increase in ‘greening’ products imple
Priority Area 5: Travel and Fleet Management
The breakdown of the department’s 936 fleet of vehicles, as at 30 June 2012, is as follows: Disability Services – 320 vehicles (34.2 per cent) Hous Domiciliary Care – 241 vehicles (25.8 per cent) Youth Justice – 55 vehicles (5.9 per cent)
(5.3 per cent) DCSI Corporate – 50 vehicles a Ngaanyatjarra Pitjantjatjara Y
cent). The DCSI Greening of the Fleet Management initon the 630 passenger vehicles which includes: 71 Hybrid vehicles (11.3 per cent of t 203 LPG vehicles (32.2 per cent 157 high efficiency diesel vehicles The total number of low emission fuelled vehicles in the 630 passenger vehicle fleet is therefore 431 or 68.4 per cent. The department is now focusing on strategivtargets.
Priority Area 6: Green Procurement
The department is guided by the Sustainable Procurement Policy in procuring socially and nvironmentally preferred proe
suitability are comparable.
P
Sustainability and greening processes and principles continue to binclusion of a greening statement in Job and Person Specifications.
Priority Area 8: Government Administrative Policies and Guidelines
Sustainability aa

Department for Communities and Social Inclusion 122
nt changes, Families SA transferred to DECD with
ance in the data below due to the difficulty of
ivisions that are new to the department are included under DCSI Corporate for 2011-12.
Energy Efficiency Action Plan During 2011-12, the department achieved a 28.9 per cent increase in energy efficiency throughout the portfolio from the 2000-01 baseline. The department is now on target to reach the 2020 energy efficiency improvement target of 30 per cent.
As a result of the machinery of governmeeffect on 1 January 2012. Although the official transfer was on this date, the department continued to supply some services to Families SA until 30 June 2012. The performstatistics related to Families SA are includedexcluding this activity. D
Performance against Annual Energy Use Targets
Energy Use (GJ) Business Measure
MJ per FTE
Base Year 2000/2001: DCSI Corporate/Families SA 24 604 36Disability SA
930 648 672
Housing SA Domiciliary Care SA
7 063 027 766
Portfolio Total 69 437 852 4 712 14 736
7 121 784
1 509 1 781
656
2011-12: DCSI Corporate 12 778 302 Disability Services 24 337 041 Housing SA
omiciliary Care 9 960 615 3 655 581
984 485 D
Families SA Portfolio Total
12 936 014 63 667 553
1 845 6 075
10 480
756 2 005
Portfolio Target (for 2011
10 480 MJ per FTE (28.9% from base year) -12)
Final Portfolio Target (for 2020)
10 315 per FTE (30% from base year)
Notes: Energy use data will be expressed in gigajoules (GJ) and will be the sum of all fuel types used in each agency (ie electricity, natural gas,
bottled gas, etc.) for that period. This data will have been collected at a site level and aggregated up to agency level by the portfolio Reference Group member.
efore an optional extra that portfolios may wish to include
sent the structure of the portfolio in the given reporting period.
30 per cent energy efficiency improvement from the base year 2000-01.
Business measures are also known as normalisation factors. A key performance indicator for energy efficiency is energy intensity, ie the energy consumed per unit of a given business measure. Some typical business measures are the number of employees (FTEs) and the square metres of floor area of a building. The energy intensity therefore becomes the energy used per unit defined by the business measure such as MJ/m2 and MJ/FTE.
Many portfolios are pursuing a ‘triple bottom line’ reporting approach. It is therGreenhouse Gas Emissions (in CO2) as a means of quantifying a significant aspect of environmental performance. Greenhouse gas coefficients differ for fuel types. Please contact Energy Division, Department for Mining, Innovation, Trade, Resources and Energy to obtainthese coefficients for South Australia.
It is acknowledged that portfolio structures change over time. Therefore the Portfolio baseline will repre
To obtain a MJ figure multiply GJ by 1000.
The Portfolio target for the current year is based on an agreed methodology and can be obtained through the portfolio Reference Group member.
The Portfolio target in 2020 should equal a

Annual Report 2011-12 123
rnment Buildings
ent
alified asbestos removal ontractors. This includes work carried out for the decommissioning of the Magill Youth
nual mpiled
nt has modified and/or verified as correct the standard report rovided by DPTI from the Strategic Asset Management Information System (SAMIS) and
012.
Urban Design Charter
leade otion of goo n design through the ousing and Liveable Neighbourhoods design g es. The design g idelines ed design information for application across all ing SA building an
, with the aim o sustainable h g outcomes. The capture e knowledge and ur evelopment
of social and affordable rental housing, and provide guidance on the sha e and sing.
es have been produced for use by all pro nal service providers in g SA staff. Specific include project management, architectural
lanning, structural lectrical engineervices. They provid onsistent in ion in relatione designs, apartme tling an ce infrastructu nity housing, housing mod
sist all users to gai of requirements, are accessible through the department’s website at
csi.sa.gov.au.
o t Neighbourhood Renewal Design Guideline 3.1 and draft Attached
l SA)
Asbestos Management in Gove The department undertakes an annual asbestos inspection of sites through the Departmof Planning, Transport and Infrastructure (DPTI). Any works required as a result of the inspections are subsequently completed by licensed and pre-qucTraining Centre. The department is required to provide information that will enable the production of an anacross government report on asbestos management in government buildings, to be coby DPTI. The departmephas, in accordance with DPTI requirements, provided DPTI with relevant data as at 30 June2
Housing SA continues to be a r in the prom d urbaSustainable H uidelin uprovide detail Hous ddevelopment projects f achieving ousin yexisting corporat ban design philosophy for the d and acquisition pform of future hou
uidelinThe design g fessioaddition to Housin
n p disciplines
services, urba engineering, civil engineering, e ring and environmental selayouts and hous
e clear and cnt design, land ti
formatd servi
to site re, ame
targets, adaptable ifications and upgrades and environmental sustainability.
ines, which asThe guidelHousing SA
n a full appreciation and understanding
www.d H using SA urban design initiatives during 2011-12 include:
preparation of drafHouse Design Rows and Terraces Guideline 3.2
completion of all civil and public works for all stages of the Inspire project at Noarlunga Centre, including integration of NBESP funded apartment developments
master planned urban redevelopment at Woodville West, now transferred to the URA (now referred to as Renewa
Horizon Apartments at Beach Road, Christie Downs UNO residential apartments at 102 Waymouth Street.

Department for Communities and Social Inclusion 124
e
quirements of this standard, unless it forms part of a more extensive
Overseas Travel
The following table summarises overseas travel undertaken by employees of the departmentduring 2011-12. Overseas travel is defined in the Commissioner’s Public Sector Management Standard 3.2, Travel, which states that: ‘Travel within Australasia (includingvisits to New Zealand, Papua New Guinea and Australian Territories) is not subject to th
verseas travel reoitinerary encompassing other overseas destinations.’
Number of Employees
Destination Reason for Travel Total Cost to Department*
1 Malaysia To deliver a presentation at the 2 Annual Affordable Housing Projects Conference
$3 580
nd
1 United States To attend the Structured Decision Making Conference 2011
$6 153
1 United Kingdom To familiarise and understand self-managed funding for clients with disability
$13 701
1 United States and Can
Successful applicant for the 2011 Hugh Stretton Award – travel undertaken to research Indigenous housing authorities $12 321
ada in Hawaii, Vancouver, Chicago and Window Rock
1** Malaysia
Accompanying the Hon Jennifer Rankine MP, Minister for Multicultural Affairs, in capacity as the Chairman of the South Australian Multicultural and Ethnic Affairs Commission (SAMEAC)
$8 193
* Includes salary, on costs, travel, accommodation, conference fees. ** The Chairman of the SAMEAC is not an employee of the department; however, the cost of the trip wasby the department.
paid for
res made in
or entities associated with the epartment were investigated by Risk Management and Internal Audit and, where ecessary, reports were lodged with South Australia Police in accordance with the
department’s policy.
Fraud
The department’s Fraud and Corruption Policy reinforces a zero tolerance to fraud and similar inappropriate behaviour. In addition, the policy highlights that disclosugood faith and in accordance with the South Australian Whistleblower Protection Act 1993will be protected under the Act. Any instances of alleged dishonesty related to employeesdn

Annual Report 2011-12 125
ences of missing funds were referred by divisions to Risk al Audit for investigation. Of these transactions which totalled $1375,
200 with the remaining transaction for $400. There is
the
ial
Whistleblowers Pursu to Sec e Publi ficers havappointed by the department for the purposes of the Whistleblowers Protection Act 1993. During e year e 20 eived underWhistleblowers Protection Act 199 f investigations by the Director, Risk Management an
During 2011-12, 14 incid
anagement and InternM13 transactions were for less than $insufficient evidence to suggest employee dishonesty for any of these cases. Given the fraud detection and prevention policies, procedures and controls in place within department and that there was no evidence of material loss or employee dishonesty, it is unlikely that any undetected fraud would result in a material misstatement of the FinancStatements.
ant tion 7 of th c Sector Act 2009, four responsible of e been
th ending 30 Jun 12, there were two disclosures rec3. Both disclosures were the subject o
the
d Internal Audit.

Department for Communities and Social Inclusion 126
Financial Reporting The Communities and Social Inclusion portfolio is supported by: the Department for Communities and Social Inclusion the South Australian Housing Trust (SAHT). The information in this section relates only to the Department for Communities and Social
clusion. It covers account payment performance, contractual arrangements and use of e SAHT, refer to the South Australian
Report 2011-12 which is accessible at www.dcsi.sa.gov.au.
authority, unless there is a written iscount or a written agreement between the public authority and the creditor.
Account Payment Performance 2011-12
The following data includes all payments made through the department’s accounts payable system, excluding credit card and payroll payments.
Inconsultants. For similar information concerning thHousing Trust Annual
Account Payment Performance Treasurer’s Instruction 11, Payment of Creditors’ Accounts, requires all undisputed invoices or claims to be paid within 30 days of the date of the GST compliant invoice, or the date the GST compliant invoice is first received by the publicd
Number of accounts
paid
Percentage of accounts
paid (by number)
Value in $A of accounts paid
Percentage of accounts
paid (by value)
Paid by due date* 338 044 96.3% $1 408 616 611 98.4%
Paid late, but paid within 30 days of due date
11 554 3.3% $17 851 187 1.2%
Paid more than 30 days from due date
1 487 0.4% $5 675 731 0.4%
* Note: The due date is defined under section 11.7 of Treasurer’s Instruction 11 Payment of Creditors’ Accounts. As a result of the machinery of government changes, Families SA transferred to DECD with effect on 1 January 2012. Although the official transfer was on this date, the department continued to supply accounting services to Families SA until 30 June 2012. The performance statistics related to Families SA are included in the above data due to the difficulty of excluding this activity.

Annual Report 2011-12 127
10-11
annual report of the former Department for amilies and Communities for 2010-11 was incorrect, as it only reported data for June 2011 nd not the full financial year. The following table reflects the account payment performance
Account Payment Performance 20
he account payment performance data in the TFadata for the complete 2010-11 financial year.
Number of accounts
paid
Percentage of accounts
paid (by number)
Value in $A of accounts paid
Percentage of accounts
paid (by value)
Paid by due date* 318 136 96.4% $1 140 826 217 97.8%
Paid late, but paid within 30 days of due date
8 893 2.7% $18 660 204 1.6%
Paid more than 30 days rom due date
2 819 f
0.9% $6 952 578 0.6%
* Note: The due date is defined under section 11.7 of Treasurer’s Instruction 11 Payment of Creditors’ Accounts.
Contractual Obligations There were 41 contracts during 2011-12 with a value greater than $4 million (GST inclusive)which extended beyond a single year.
Organisation Description Duration of
arrangement Value
AAPT Voice car servicMMarch 2014
$13 200 000 riage es 23 24
arch 2009 to
Aboriginal Elders and Community Care
almeals, respite care, tran
Services Incorporatedcp
HACC o providlied he support,
sentre based day activity rogram ome assi
services
1 July30 June 2012
$5 300 705
services t e alth, social
port,
s and h st
2008 to
Aboriginal Prisoners Provides accommodation 1 July 2010 to
and Offenders upport Services
services 30 June 2013 $4 837 566
S
Anglicare SA
Provides a range of services including accommodation, respite and in-home support
1 July 2010 to 30 June 2013
$16 369 312
and access to the community
Autism SA services to
children with autism spectrum disorder
1 July 2010 to 30 June 2013
$7 572 821
Provides diagnostic and therapeutic

Department for Communities and Social Inclusion 128
Organisation Description Duration of
arrangement Value
Barkuma Incorporated
Provides in home accommodation support
1 July 2010 to 30 June 2013
$5 000 714
Bedford Industries Incorporated
n and day option program servi
1 July 2010 to 3
$6 181 189 Provides accommodatio
ces 30 June 201
Catholic Family Services (Centacare)
Provi odarespite nd aoption pr
ul30 J
des accomm services a
ogram
tion and day
1 J y 2010 to une 2013
$7 688 240
City of Playford traac
HACC services to provide social eals,
nsport, centre based day tivity p s and ho
ices
1 Ju30 Ju
$4 691 658 support, m
rogram me assist serv
ly 2008 to ne 2012
City of Port Adelaide Enfield
Parks Community Centre1 Octo30 September 2013
$9 359 708 ber 2007 to
City of Salisbury
Provides HACC services within the home plus centre based day care, transport and social support
1 July 2008 to 30 June 2012
$4 736 857
Community Provides a
Accommodation and ccommodation and 1 July 2010 to
$41 926 415 Respite Agency
respite services 30 June 2013
Community Lifestyles Inco
e of services including accommodation, in-home support, social support and assi ss the community
1 July 2010 to 30
$10 328 079 rporated
Provides a rang
stance to acceJune 2013
Community Living and Support Services 30 June 2013
$11 698 955 Provides respite, accommodation and day option program services
1 July 2010 to
Community Living Options
Provides accommodation and respite services
1 July 2010 to 30 June 2013
$9 468 555
Community Living Project
d rvices
1 July 2010 to 30 June 2013
$5 897 712 Provides accommodation anrespite se
COMREC Australia Pty Ltd
Provides day option program services
1 July 2010 to 30 June 2013
$4 535 821
Country Home Advocacy Project
rvices to provide 1 July 2008 to
$6 535 687 Incorporated
HACC sepersonal care, social support,transport, and home assist services
30 June 2012
Disability Living Incorporated
1 July 2010 to 30 June 2013
$5 153 306 Provides accommodation services

Annual Report 2011-12 129
Organisation Description Duration of
arrangement Value
EBL Disability $4 541 750
Services
Provides emergency/transitional accommodation support and centre based respite
1 July 2010 to 30 June 2013
Fulham Funerals Funeral services 1 July 2011 to 30 June 2014
$6 018 100
Guide Dogs Association of SA & NT
anagement, 1 July 2010 to 30 June 2013
$5 607 979
Provides case mlearning and life skills and information and referral services
Hills Community Options
am services 30 June 2013
$7 881 506 Provides accommodation andday option progr
1 July 2010 to
Individual Supported Accommodation Service
Provides accommodation services
1 July 2010 to 30 June 2013
$5 115 249
ISS Facility ServicAustralia Limited
es Cleaning services
31 May 2010 to30 May 2012
$4 558 841
Leveda Incorporated
Provides accommodation, respite, social support and assistance to access the community
1 July 2010 to 30 June 2013
$26 427 473
Life’s for Living
Provides a range of services including accommodation, in-home support, social support and assistance to access the community
1 July 2010 to 30 June 2013
$11 575 609
Lyreco Stationery 1 June 2007 to 1 September 2012
$4 162 500
Meals on Wheels (SA) Incorporated
e
HACC services to providemeal services through a community servicdevelopment model, that provides home delivered, nutritionally balanced meals through volunteers to HACC eligible clients across the State five days a week
1 July 2010 to 30 June 2012
$5 503 146
Minda Incorporated $119 429 442
Provides accommodation, respite, social support and assistance to access the community
1 July 2010 to 30 June 2013
Novita Children’s Services
ommunity support services, therapy and equipment to children 0-18 with physical, cognitive and neurological disability
1 July 2010 to 30 June 2013
$34 006 336
Provides c

Department for Communities and Social Inclusion 130
Organisation Description Duration of
arrangement Value
Novita ChildrenServices
’s vices to provide
re HACC serpersonal care, respite caand home assist services
1 July 2008 to 30 June 2012
$4 146 874
Orana Incorporated tion and 1 July 2010 to
$10 739 101 Provides accommodarespite services 30 June 2013
Royal DistrictService of SA Limited
Nursing
HACC services to provide
s tan
nursing services in client’s homes or in nursing servicelocated across metropoliAdelaide
1 July 2008 to 30 June 2012
$72 776 639
Royal District NursingService of SA Limited
$4 198 214
Provides accommodation support, information and referral and alternative methods of communicationservices
1 July 2010 to 30 June 2013
Royal Society for the Blind
n and
30 June 2013
$8 195 818
Provides accommodatiosupport, informationreferral and alternative methods of communication services
1 July 2010 to
SCOSA 1 July 2010 to 30 June 2013
$20 136 014 Provides learning and life skills programs for people withintellectual disability
The Paraplegic aQuadriplegic
nd
Association of South Australia
30 June 2013 $6 299 261
Provides accommodation services
1 July 2010 to
Uniting Communities
pported residential ity ily
1 July 2010 to 30 June 2013
$5 991 180
Provides sufacilities program, communaccess and alternative famaccommodation support placements
Uniting Communities
HACC services to provide centre based day activity programs, transport and respite care
1 July 2008 to 30 June 2012
$5 592 780
UnitingCare Wesley Port Adelaide
de 1 July 2008 to
$5 070 952 Incorporated
HACC services, to provicentre based day activity programs, meals, transport and counselling services
30 June 2012

Annual Report 2011-12 131
Consultants The following table deta ncies during 2011-12, and reflects the
in the .
ils expenditure on consulta audited financial statementsamount disclosed
Consultant Purpose of Consultancy Number Total
Value below $10 000
Various Various
Sub-total 15 $102 960
Value $10 000 to $50 0 00
John McGowan Associates
Review of security atTraining Centre
the Ca
van
Mandalay Enterprises or
ross selected
Auditing of Safeguarding Practices fVulnerable People acgovernment agencies
Deakin University
artment Justi
hologists can better contribute to the
J
To provide the depblueprint of how Youth psyc
with a ce
service delivery withinorganisations wider Youth ustice Unit
Urban and Regional Planning Service
velopment of an Age
Stage Two – DeFriendly Communities Program Framework
Sub-total 4 $144 949
Value above $50 000
KPMG Chartered Accountants
Projec Safeguards Mapping t
HOKJOK Consultants Responding to the neeeligible carers who arcaring role (relinquis
ds of HACC e no lo
hing ca nger in a
rers)
Sub-total 2 $181 300
Total 21 $429 209

Department for Communities and Social Inclusion 132
tatements
Financial S Financial StaDepartment
tements for th 2 for the for Communit
e year ended 30 June 201ies and Social Inclusion

Annual Report 2011-12 133
xecutive and Principal Finance Officer
Certified statement by the Chief E

Department for Communities and Social Inclusion 134

Annual Report 2011-12 135

Department for Communities and Social Inclusion 136
DEPARTMENT FOR COMMUNITIES AND SOCIAL INCLUSION
STATEMENT OF COMPREHENSIVE INCOME
for the year ended 30 June 2012
Note 2012 2011 $’000 $’000
Expenses Employee benefit expenses 5 432 680 462 601 Supplies and services 6 222 081 222 265 Depreciation and amortisation expense 7 4 722 5 455 Grants, subsidies and client payments 8 787 888 854 760 Other expenses 9 27 259 82 Total expenses 1 474 630 1 545 163
Income Revenue from rent, fees and charges 10 132 734 125 363 Commonwealth revenues 11 267 185 235 162 Interest revenues 12 31 54 Net gain/(loss) from disposal of non-current assets 13 628 (1) Other revenues 14 7 066 4 837 Total income 407 644 365 415
Net cost of providing services (1 066 986) (1 179 748)
Revenues from/(payments to) SA Government
SA Government appropriation 15.1 1 110 680 1 181 171 Grants from SA Government agencies 15.2 10 991 13 863 Payments to SA Government 15.3 (17 938) (396) Total revenues from/(payments to) SA Government 1 103 733 1 194 638
Net result 36 747 14 890
Other comprehensive income
Revaluation surplus (56 867) - Total other comprehensive income (56 867) -
Total comprehensive result (20 120) 14 890
Net result and comprehensive result are attributable to the SA Government as owner
The above statement should be read in conjunction with the accompanying notes

Annual Report 2011-12 137
ets
DEPARTMENT FOR COMMUNITIES AND SOCIAL INCLUSION
STATEMENT OF FINANCIAL POSITION
as at 30 June 2012
Note 2012 2011 $’000 $’000
Current ass Cash and cash equivalents 17 63 678 52 055 Receivables 18 35 256 39 650 Inventories 19 295 284 Total current assets 99 229 91 989
Non-ceceivables 18 15 070 17 319operty, plant and equipment 20 188 927 283 887
assets 272 0 325 7
urrent assets R Pr Capital works in progress 21 68 009 18 240 Intangible assets 22 - 6 309 Total non-current 06 55
Total 37 41assets 1 235 7 744
Current liabilities
23 mployee benefits 24 42 051 53 804
26 7 718 10 004
1
Payables 46 852 48 680 E Provisions Other current liabilities 27 785 752 Total current liabilities 97 406 13 240
Non-cyables 23 4 733 5 030
loyee benefits 24 wings 25 285
26 26 932 31 083ilities 27 5 41
98 50
urrent liabilities Pa Emp 50 800 56 694 Borro - Provisions Other non-current liab 4 778 5 Total non-current liabilities 87 243 7
Total liabilities 184 649 211 747
Net assets 186 586 205 997
quity Contributed capital 28 74 325 74 325 Retained earnings 28 54 315 16 859 Revaluation surplus 28 57 946 114 813
otal equity 186 586 205 997
E
T
Total equity is attributable to the SA Government as owner Unexpended funding commitments 16 Unrecognised contractual commitments 30 Contingent assets and liabilities 32
The above statement should be read in conjunction with the accompanying notes

Department for Communities and Social Inclusion 138
0 June 2012
Contr Revaluation ined Note Capital Surplus ings Total
$’000 $’000 $’000 $’000 Balan 43 799 115 54 1 233 1
DEPARTMENT FOR COMMUNITIES AND SOCIAL INCLUSION
STATEMENT OF CHANGES IN EQUITY
for the year ended 3
ibuted RetaEarn
ce at 30 June 2010 9 60 581
2010-11 - 14 890 14 Net result for - 890
etained earnings of increment realised on
gs - (736) 736
Total comprehensive result for 2010-11 - (736) 15 626 14 890
Transfer to rsale of land and buildin
-
Transactions with SA Government as owner tion received 30 526
Balan 28 74 325 114 8 16 859 Equity contribu - - 30 526ce at 30 June 2011 13 205 997
- 36 747 36 Net result for 2011-12 - 747
aluation of property, plant and
- (56 867 (
Total comprehensive result for 2011-12 - (56 867) 36 747 (20 120)
Gain/(loss) on revequipment during 2011-12
) - 56 867)
Transactions with SA Government as owner t assets received from an administrative restructure 31 - - (3 290)
nsferred as a result of an administrative 31 - - 3 999 3 999
Balan 28 74 325 57 94 54 315 1
Ne (3 290)
Net assets trarestructure ce at 30 June 2012 6 86 586
All cha table to the SA Government as owner
nges in equity are attribu
The above statement should be read in conjunction with the accompanying notes

Annual Report 2011-12 139
2011 ws ow ( s)
’000 Ca h ctivities Ca h o
66) (455 435 44) (2 (790 138) (876 532)
(62 909) ( 53)
(2 ) 98) (1
DEPARTMENT FOR COMMUNITIES AND SOCIAL INCLUSION
STATEMENT OF CASH FLOWS
for the year ended 30 June 2012
2012 Inflows Inflo (Outfl s) Outflow
Note $ $’000s flows from operating a s utflows
Employee benefit payments (415 4 )
Payments for supplies and services (215 2 21 661) Payments for grants and subsidies GST payments on purchases 54 615) GST paid to the ATO (2 1 (1 898) Other payments 6 788 -Cash used in operations (1 512 6 610 141)
Cash i nflows Fees and charges 432
267 568 234 779 31 080
red from the ATO 62 422 54 513 170
Cash generated from operations 469 703 409 729
134 114 018 Receipts from Commonwealth Interest received 54 GST receipts on receivables GST recove
2
1 527
Other receipts 3 4 838
Cash flows from SA Government Receipts from SA Government 1 110 680 1 181 171 Grants from SA Government agencies 10 991 13 863 Payments to SA Government (17 938) (396) Cash generated from SA Government 1 103 733 1 194 638
Net cash (used in)/provided by operating activities 33 60 738 (5 774)
Cash flows from investing activities
ash outflows Purchase of property, plant and equipment (including WIP) (49 770) (14 966) Purchase of intangibles - (757) Cash used in investing activities (49 770) (15 723)
C
Cash inflows Proceeds from sale of property, plant and equipment 710 1 512 Cash generated from investing activities 710 1 512
Net cash (used in) investing activities (49 060) (14 211)
Cash flows from financing activities
ash outflows Cash transferred as a result of restructuring activities (301) - Cash (used in) financing activities (301) -
C
Cash inflows Capital contributions from SA Government - 30 526 Proceeds from restructuring activities 246 - Cash generated from financing activities 246 30 526
Net cash (used in)/provided by financing activities (55) 30 526
Net increase in cash and cash equivalents 11 623 10 541
ash and cash equivalents at the beginning of the period 52 055 41 514
ash and cash equivalents at the end of the period 17 63 678 52 055
C
C
The above statement should be read in conjunction with the accompanying notes

Department for Communities and Social Inclusion 140
S AND SOCIAL INCLUSION
GGREGATED DISCLOSURES – EXPENSES AND INCOME
for the year ended 30 June 2012
Activities (refer note 4) Housing Families Disability Ageing Communities and Partners
Organi C
eneral/Not tributable
1 2 3 4 5
2012 2012 2012 2012 2 2012
DEPARTMENT FOR COMMUNITIE
DISA
sationalapability
GAt
Total
6
2
201 012 2012 $’0
Expenses 00 $’000 $’000 $’000 00 $ $’000
79 765 84 017 156 001 37 912 9 954 Su - 19 407 126 724 30 243 5 519 8 081
Deex
- 1 506 409 1 330 57 0 722
Grpa
417 872 62 473 155 653 133 425 13 624 1 888
Ot - - 26 783 25 - 1 - 259
To 497 637 167 403 465 570 202 935 29 154 1 630
$’0 ’000 $’000
Employee benefit expenses plies and services
65 031 40 18
- 432 680- 222p
preciation and amortisation pense
1 42 - 4
aynts, subsidies and client ments
4 84 - 787
her expenses 45 27
tal expenses 111 93 - 1 474
Income
Re and ch
82 423 323 15 802 4 832 953 1 734
Co 86 204 1 378 44 874 134 302 - 7 185 Int - - 2 27 - 2 - 31
Necu
- - (4) (50) - 2 - 628
Ot - 327 - 1 625 - 4 - 066
To 27 2 028 60 674 140 736 953 6 644
venues from rent, fees arges
s
28 40 - 132
me
monwealth revenuerest revenues
42 - 267
t gain from disposal of non-rrent assets
68
her revenues 5 11 7
tal income 168 6 34 62 - 407
Net cost of providing services (329 010) (165 375) (404 896) (62 199) (28 201) ) 986)(77 305 - (1 066
RevenGover
SA - - - - - 917 680
agencies 5 307 1 700 2 753 2 - 991
- - - - - - (17 938) (17 938)
6 144) (164 786) (399 589) (60 499) (25 448) (76 663) 899 876 36 747
un
es from/(payments to) SA ment
Government appropriation 192 866 814 1 110
Grants from SA Government
- 589 64 10
Payments to SA Government
(13Net result

Annual Report 2011-12 141
DEPARTMENT FOR FAMILIE S AND SOCIAL INCLUSION)
S AND COMMUNITIES (2012 DEPARTMENT FOR COMMUNITIE
DISAGGREGATED DISCLOSURES – EXPENSES AND INCOME
for the year ended 30 June 2011
Activities (refer note 4) Housing Families Disability Ageing Communities and Partners
Organisational Capability
General/Not Attributable
Total
1 2 3 4 5 6
2011 2011 2011 2011 2011 2011 2011 2011 $’000 $’000 $’000 $’000 $’000 $’000 $’000 $’000
Expenses Employee benefit expenses 78 037 1
55
1
37 458 143 004 42 180 9 195 52 727 - 462 601 Supplies and services 0 34 360 109 125 29 446 4 706 44 078 - 222 265
Depreciation and amortisation expense
- 1 328 415 1 272 35 2 405 - 5 455
Grants, subsidies and client payments
445 201 14 679 143 470 131 684 17 518 2 208 - 854 760
Other expenses - 1 56 37 - (12) - 82
Total expenses 523 788 287 826 396 070 204 619 31 454 101 406 - 1 545 163
Income
Revenues from rent, fees and charges
77 483 2 1
1 27
( (
1
1
898 14 477 3 155 204 26 146 - 125 363
Commonwealth revenues 13 849 1 915 3 122 115 978 5 23 - 235 162 Interest revenues - - 9 42 - 3 - 54
Net gain from disposal of non-current assets
- 4) 28) (39) - 70 - (1)
Other revenues - 391 0 3 795 - 641 - 4 837
Total income 191 332 5 200 17 590 122 931 479 26 883 - 365 415
Net cost of providing services (332 456) (282 626) (378 480) (81 688) (29 975) (74 523) - (1 179 748)
Revenues from/(payments to) SA Government
SA Government appropriation 185 042 - - - - - 996 129 1 181 171
Grants from SA Government agencies
- 2 1 070 6 291 1 900 2 417 185 - 13 863
Payments to SA Government - - - - - - (396) (396)
Net result (147 414) (280 556) (372 189) (79 788) (27 558) (73 338) 995 733 14 890

Department for Communities and Social Inclusion 142
Activities (refer note 4) Housing Families Disability Ageing Communities Organisational General/Not
Total
2012 2012 2012 2012 2012 2012 2012 2012
DEPARTMENT FOR COMMUNITIES AND SOCIAL INCLUSION
DISAGGREGATED DISCLOSURES – ASSETS AND LIABILITIES
as at 30 June 2012
and Partners 5
Capability 6
Attributable 1 2 3 4
* 3 67
50 32
6 64 1 2 5 4 1868 009
assets
To 60 77 64 17 6 2 58 111 114 00 371 2
$’000 $’000 $’000 $’000 $’000 $’000 $’000 $’000
Assets Cash and cash equivalents - - - - - - 6 8 63 678 Receivables * -
- -- -
51--
--
- 244 -
6 50 326295 Inventories
Property, plant and equipment - 0 772 770 7 615 89 3 181 - 8 927 Capital works in progress Intangible
- -
--
--
--
--
--
68 009--
tal assets - 2 821 15 9 434 4 35
Lia ities
ables * - - - - 51 585 51 58592 85
ngs 34 65
5 56 5 5
To 184 64 184
bil Pay - - Employee benefits * Borrowi
- - -
- --
--
--
- - -
1 92 851-
Provisions * - - - - - - 0 34 650 Other liabilities * - - - - - - 3 63
tal liabilities - - - - - - 9 649
DE NI T OR COMMU IAL INCLUSIO
SAGGREGA ED DISCLOSURES - ASSETS AND LIABILITIES
as at 30 June 11
) Housing Families Disabilit Ageing
Communand Partners
OrganisaCapability
al/Nottribu
Tot
2011 2011 2011 2011 2011 2011 2011 2011
PARTMENT FOR FAMILIES AND COMMU TIES (2012 DEPAR MENT F NITIES AND SOC N)
DI T
20
Activities (refer note 4 yities
tional Gener t
A tableal
1 2 3 4 5 6
$’000 $’000 $’000 $’000 $’000 $’000 $’000 $’000
Assets Cash and cash equivalents * - - - - - - 52 055 52 055 Receivables * - - - - - - 56 969 56 969 Inventories - - 44 - - 240 - 284 Property, plant and equipment - 115 749 99 809 15 761 1 643 50 925 - 283 887 Capital works in progress - 18 195 10 - - 35 - 18 240 Intangible assets - 6 309 - - - - - 6 309
Total assets - 140 253 99 863 15 761 1 643 51 200 109 024 417 744
Liabilities
Payables * - - - - - - 53 710 53 710 Employee benefits * - - - - - - 110 498 110 498 Borrowings - 285 - - - - - 285 Provisions * - - - - - - 41 087 41 087 Other liabilities * - - - - - - 6 167 6 167
Total liabilities - 285 - - - - 211 462 211 747
* The Department considers that the significant expenditure associated with accounting system modifications and other associated expenditure required to reliably capture these disaggregated asset and disaggregated liability information is not justifiable. The Department has therefore, chosen not to disclose these assets and liabilities by disaggregated activities.

Annual Report 2011-12 143
DEPARTMENT FOR COMMU
NOTES TO AND FORMING P
for the year ended 30 June 2012
1 Ob f rt
The Department for Communities and l Inclu the De ent) y the nt for ilies andCom unities) is com itted to ensurin all So stralians, particularly the mo nerable a advanta ave acce to high quali services that protect and en the ovide su peopl they eed
The ent to delive g better an more connected services to the v nerable and d dva n our c to build engaged, social The upport the hieve f th overnment Strategi Follo f machinery of governm t reforms hich were announced by the Premier, Hon Jay Weatherill MP on
011, the Department serves the inist m a al Inclusi nister f Hoinis r for Disabilities, Minister for Youth, Minister for Volunteers, the Minister for the Status of Women, and the Minister for
al Affairs.
The ponsibility for the de ry of specific programs to the public with respect to activities assign e Depa s Acts as delegated y the respective Ministers, to the Chief Execu e of the Depa ent. The functions as a service provider to the South A Trust. T financial affairs of the South
rust does not form part of the Department's fin
.1 Administered items
he Department administered certain revenues, expenses, assets and liabilities on behalf of other government agencies and on-government entities. They are not controlled by the Department and are consequently not recognised in the Department's
1.2 Administrative Restru
011-12
NITIES AND SOCIAL INCLUSION
ART OF THE FINANCIAL STATEMENTS
jectives and functions o the Depa ment
S ag that
oci s (uth Au
ion partm merl(for Departme Famnd dis
ged, hm m st vul
ss ty hance community’s wellbeing and pr pport to e whenn it.
Department has a commitm rin d ul isa ntaged iommunity, and ly inclusive, strong and vibrant communities.
work of the Department will s ac ment o e South Australian G c Priorities.
wing a number o en w22 October 2 M er for Co munities nd Soci on, Mi or Social using, M teMulticultur
Department has resr variou
live ed to th rtment unde , b tiv rtm
Department alsosing T
ustralian Housing heAustralian Hou ancial report.
1
Tnfinancial statements. They are regarded as significant and disclosed in a separate set of financial statements.
ctures
2
red OutTransfer Public Sector (ReorgaUnder the nisa b O ) 0 ua D r
Communities and Social Inclusion transferred responsibilities for Families SA to the Department for E cation and C ild Development. Assets and liabilities rel o the iness wer ferred the Depa t and inDepartment for Education and Child D men 1 Ja 012
e Public Sector (Reorganisation of Public Sector Operations) Notice 2011, from 1 January 2012 the Department for Com n transferred responsibil r Ag ng Polic Age Care Assessment Team (A the Depa lth and Ageing. Assets and liabilities relating to t ese busi ss units were ansferred out of the ent and i artment for Health and Ageing as at 1 January 20 Unde rganisation of Public Sector Operatio om 23 April 2012 the Department foCommunities and Social Inclusion transferred respo specified employees only, to the Urban Re al Author .
tion of Pu lic Sector perations Notice 2 11, from 1 Jan ry 2012 the epartment fodu h
ating t se bus units e trans out of rtmen to the evelop t as at nuary 2 .
Under th
munities and Social Inclusio ities fo ei y and CAT) tortment for Hea h ne tr Departmnto the Dep 12.
r the Public Sector (Reo ns) Notice 2012, fr r nsibilities for new ity
rans rred inT fe
Public Sector (Reorganisation of Public Sector Operations) Notice 2011, from 1 December 2011 Department of the inet transferred responsibilit for the S ial Inclus n Unit, the Department for Communities and Social
Inclu ilities relating to these business units were ransferre out of their respective department Depa ities and Social Incl as at 1 Decembe 011. Unde tor (Reorganisation of Public Sector Operation om 1 January 2012 the Attorne ral's
d responsibility for the Office for Women, Offi for Yout , Office for Volunteers and Multicultural SA to for Communities and Social lusion. Assets and li ilities re ting to these siness units w e tr d ou
f their respective department and into the Department for Communities and Social Inclusion as at 1 January 2012.
for the Southern Suburbs and Office for the Northern uburbs to the Department for Communities and Social Inclusion. Assets and liabilities relating to these business units were
ed out of their respective department and into the Department for Communities and Social Inclusion as at 1 January 2012. 2010-11
Under the Premier and Cab ies oc io to
sion. Assets and liabommun
t d and into the rtment for C usion r 2
r the Public Secrtment transferre
s) Notice 2011, fr y-GeneDepathe Department
ce hInc ab la bu er ansferre t
o Under the Public Sector (Reorganisation of Public Sector Operations) Notice 2011, from 1 January 2012 Department of Planning and Local Government transferred responsibilities for OfficeStransferr
There were no functions transferred in the 2010-11 financial year.

Department for Communities and Social Inclusion 144
State and Commonwealth Government sources.
he Department also receives amounts from other sources including rents, fees and charges.
ant Australian Accounting Standards
Funding for the Department Funding for the Department comes mainly from appropriation funding fromThese funds are applied to both controlled and administered activities. T
2 Summary of significant accounting policies
2.1 Statement of compliance
The financial statements are general purpose financial statements. The accounts have been prepared in accordance with: relev Treasurer's Instructions (TIs) and Accounting Policy Statements (APS) promulgated under the provision of the Public
Finance and Audit Act 1987 other mandatory professional reporting requirements in Australia.
arly adoption of accounting standardsE
Australian Accounting Standards and interpretations that have recently been issued or amended but are not yet effective havnot been adopted by the Department for the reporting period ending 30 June 2012. The Department has assessed the impacnew and amended standards and interpretations and considers that there will be no impact on the accounting policies or financial statements of the Department.
e t of
quired to
.
ccounting policies are selected and applied in a manner which ensures that the resulting financial information satisfies the bility, thereby ensuring that the substance of the underlying transactions or other events are
e accounting ote disclosures, that have been included in this financial report: and financial liabilities where the counterparty/transaction is with an entity within the
SA Government as at reporting date, classified according to their nature ses incurred as a result of engaging consultants (as reported in the Statement of Comprehensive Income)
ed voluntary separation package information
by the
rd or committee member is entitled to receive income
he financial statements have been prepared based on a twelve month period and presented in Australian currency.
y
ancial statements for the year ended 30 June 2012
he behalf
are
omparative information
ntation and classification of items in the financial statements are consistent with prior periods except where specific ired a change.
2.2 Basis of preparation
The preparation of the financial statements requires the use of certain accounting estimates, where management is reexercise its judgement in the process of applying the Department’s accounting policies. The areas involving a higher degree of judgements or where assumptions and estimates are significant to the financial statements are outlined in the applicable notes Aconcepts of relevance and reliareported. The preparation of the financial statements also requires compliance with accounting policy statements issued pursuant to ection 41 of the Public Finance and Audit Act 1987. In the interest of public accountability and transparency, ths
policy statements require the following n revenues, expenses, financial assets
expen employee target employees whose normal remuneration is equal to or greater than the base executive remuneration level (within $10 000
bandwidths) and the aggregate of the remuneration paid or payable or otherwise made available, directly or indirectlyDepartment to those employees; and
board/committee member and remuneration information, where a boafrom membership other than direct out of pocket reimbursement.
The Statement of Comprehensive Income, Statement of Financial Position and Statement of Changes in Equity have been prepared on an accrual basis and are in accordance with the historic cost convention, except for certain assets that were valued in accordance with the valuation policy applicable. The Statement of Cash Flows has been prepared on a cash basis. T The existence of the Department and the ongoing delivery of current programs and services is dependent on government policand on continuing appropriations by Parliament. The accounting policies set out below have been applied in preparing the finand the comparative information presented.
2.3 Reporting entity
The Department’s financial statements include both departmental and administered items. The Department’s financial atements include assets, liabilities, income and expenses controlled or incurred by the Department in its own right. Tst
Administered financial statements include assets, liabilities, income and expenses which the Department administers on of the SA Government, but does not control. A separate set of financial statements is produced as these administered items regarded as significant in respect to the Department’s operations.
2.4 C
The preseaccounting standards and/or accounting policy statements has requ

Annual Report 2011-12 145
ation of items in the financial statements have been amended, comparative figures have been
here the Department has applied an accounting policy retrospectively, such items are reclassified retrospectively in the
riginal financial statements for the preceding period.
income tax. The Department is liable for payroll tax, fringe benefits tax, goods and services tax
ised net of the amount of GST except: ,
he net amount of GST recoverable from, or payable to, the Australian Taxation Office is included as part of receivables or b ion.
ble ts
gencies are disclosed on a gross basis.
flow of economic
c
her event.
Where presentation or classificadjusted to conform to changes in presentation or classification in these financial statements unless impracticable. Wfinancial statements. The restated comparative amounts do not replace the o
2.5 Rounding
All amounts in the financial statements and accompanying notes have been rounded to the nearest thousand dollars ($’000).
2.6 Taxation
The Department is not subject to (GST) and the emergency services levy. Income, expenses and assets are recogn where the amount of GST incurred by the Department as a purchaser is not recoverable from the Australian Taxation Office
GST is recognised as part of the cost of acquisition of an asset or is part of an item of expenses where appropriate, receivables and payables are stated with the amount of GST included. Tpaya les in the Statement of Financial Posit Cash flows are included in the Statement of Cash Flows on a gross basis. The GST component of cash flows arising from investing and financing activities, which is recoverable from or payable to the Australian Taxation Office, is classified as part of operating cash flows. Unrecognised contractual commitments and contingencies are disclosed net of the amount of GST recoverable from, or payato the Australian Taxation Office. If GST is not payable to, or recoverable from the Australian Taxation Office, the commitmenand contin
2.7 Income
Income is recognised in the Department’s Statement of Comprehensive Income when and only when thebenefits has occurred and can be reliably measured.
Income has been aggregated according to its nature and has not been offset unless required or permitted by a specifiaccounting standard or where offsetting reflects the substance of the transaction or ot The notes to the financial statements disclose income where the counterparty/transaction is with an entity within the SA Government as at the reporting date, classified according to their nature. The following are specific recognition criteria: Fees and charges Revenues from fees and charges are derived from the provision of goods and services to other SA government agencies and to the public. This revenue is recognised upon delivery of the service to the clients or by reference to the stage of completion. Grant contributions received
rants that are received from other entities by the Department for gG eneral assistance or a particular purpose may be for capital ernment he
or recurrent purposes and the name of the category reflects the use of the grant. These entities may be other SA Govgencies or the Commonwealth Government. The grants given are usually subject to terms and conditions set out in ta
contract, correspondence, or by legislation. The contribution is recognised as an asset and income when the Department obtains control of the contribution or the right to receive the contribution. Resources received free of charge Resources received free of charge are recorded as revenue in the Statement of Comprehensive Income at their fair value.
ontributions of services are recognised onlyC when a fair value can be determined reliably and the services would be purchased if they had not been donated. Revenues from SA Government Appropriations are recognised as revenues when the Department obtains control over the funding. Control over appropriais normally obtained upon their receipt. Where money has been appropriated in the form of an equity contribut
tions
ion, the Treasurer has acquired a financial interest in the et assets of the Department and the contribution is recorded as contributed equity. n
Net gain on disposal of non-current assets Income from the disposal of non-current assets is recognised when control of the asset has passed to the buyer and determineby comparing proceeds with carrying amount. When revalued assets are sold, the r
d evaluation increments are transferred to
tained earnings. re

Department for Communities and Social Inclusion 146
r
gated according to their nature and have not been offset unless required or permitted by a specific
nts disclose expenses where the counterparty/transaction is with an entity within the SA reporting date, classified according to their nature.
he following are specific recognition criteria:
2.8 Expenses
xpenses are recognised in the Department's Statement of Comprehensive Income when and only when the flow oEconsumption or loss of future economic benefits has occurred and can be reliably measured.
xpenses have been aggreEaccounting standard or where offsetting reflects the substance of the transaction or other event. The notes to the financial statemeGovernment as at the T Employee benefit expenses Employee benefit expenses includes all costs related to employment including wages and salaries, non-monetary benefits and leave entitlements. These are recognised when incurred. Depreciation and amortisation of non-current assets All non-current assets, having a limited useful life, are systematically depreciated/amortised over their useful lives in a manner
t reflects the consumption of their service potential. Amortisation is used in relation to intangible asthwhile depreciation is applied to physical assets such as property, plant and equipment.
a sets such as software,
Depreciation method Useful life (years)
The useful lives, residual values and depreciation/amortisation method of all major assets held by the Department are reassessed on an annual basis. The value of leasehold improvements is amortised over the estimated useful life of each improvement, or the unexpired period of the relevant lease, whichever is shorter. Land and non-current assets held for sale are not depreciated. Depreciation/amortisation for non-current assets is determined as follows:
Class of asset
Buildings and Improvements Straight Line 4-50 years
Leasehold Improvements Straight Line Life of lease
3-10 years
3 -10 years
Computing Equipment Straight Line 3 years
Motor Vehicles Straight Line
Other Plant and Equipment Straight Line 2-15 years
Intangible Assets - computer software Straight Line
rants paidG
Grants that are paid to other entities by the Department for general assistance or a particular purpose, may be for capital or
d t has a present obligation to pay the contribution.
recurrent purposes and the name of the category reflects the use of the grant. These entities may be other SA Government agencies, Non-Government Organisations or the public. The grants given are usually subject to terms and conditions set out in he contract, correspondence, or by legislation. For contributions payable, the contribution will be recognised as a liability ant
expense when the Departmen Resources provided free of charge Resources provided free of charge are recorded as expenditure in the Statement of Comprehensive Income at their fair value and in the expense line items to which they relate.
ayments to SA GovernmentP Payments to SA Government include the return of surplus cash pursuant to the cash alignment policy.
cterised as either current or non-current in nature. The Department has a clearly identifiable re assets and liabilities that will be realised as part of the normal operating cycle will
ther event.
expected to be settled within twelve months and more than twelve months, the
ancial statements disclose financial assets where the counterparty/transaction is with an entity within the SA Government as at the reporting date, classified according to their nature.
2.9 Current and non-current classification
Assets and liabilities are charaoperating cycle of twelve months. Therefobe classified as current assets or current liabilities. All other assets and liabilities are classified as non-current.
.10 Assets 2
Assets have been classified according to their nature and have not been offset unless required or permitted by a specific accounting standard or where offsetting reflects the substance of the transaction or o Where an asset line item combines amountsDepartment has separately disclosed the amounts expected to be recovered after more than twelve months. The notes to the fin

Annual Report 2011-12 147
alents
Cash and cash equiv
call and d which
nt of Cash Flows comprise cash
ances with the appropriation
h is
Cash and cash equivalents as reported in the Statement of Financial Position includes cash on hand, deposits held atother short-term, highly liquid investments with maturities of three months or less that are readily converted to cash anare subject to insignificant risk of changes in value. Cash and cash equivalents in the Statemeand cash equivalents as defined above. Cash is measured at nominal value. n October 2003 the SA Government introduced a policy with respect to aligning agency cash balI
and expenditure authority. During the 2011-12 financial year the Department was required to transfer $17.9m of its cash balance to the Consolidated Account. During 2010-11 the Department was required to transfer $7.6m for Concessions whican Administered Item. Receivables Receivables include amounts
receivable from goods and services, prepayments and other accruals.
oice or otherwise in accordance with relevant contractual
Receivables arise in the normal course of selling goods and services to other government agencies and to the public. Receivables are due within 30 days after the issue of an invarrangements. Collectability of receivables is reviewed on an ongoing basis. An allowance for doubtful debts is raised when there is objective evidence that the Department will not be able to collect the debt. Debts that are known to be uncollectible, after all reasonableattempts have been made to collect the debt, are written off when identified. Inventories Inventories are stated at the lower of cost and their net realisable value. Inventories held for use by the Department are
n
measured at cost, with cost being allocated in accordance with the first-in, first-out method.
on-current asset acquisition and recognitioN tal cost involved with the acquisition. Non-current assets are tion.
at fair value in the Statement of Financial Position. here the assets are acquired at no or nominal value as part of a restructuring of administrative arrangements then the assets
he value recorded by the transferor prior to tr
t physica 0 000 or greater.
ely disclosed and heir carrying amount alue less costs to
complete as at re
Non-current assets are initially recorded at cost plus any incidensubsequently measured at fair value less accumulated deprecia Where assets are acquired at no value, or minimal value, they are recordedWare recorded at t ansfer. The Department capitalises all non-curren l assets with a value of $1 Assets held for sale are separatsell.
measured at the lower of t and fair v
Works in progress are projects in porting date. Revaluation of non-current assets n ccordance with APF III Asset AccountinI
(aa g Fram valued at written down current cost
r value); and revaluation of non-current assets or groups of assets is performed when its fair value at the time of
se, except to the extent that it offsets a previous revaluation increase for ly to the asset revaluation surplus to the extent of the credit
ny accumulated depreciation as at the revaluation date is eliminated against the gross carrying amounts of the assets and the s of the assets.
valuer engaged to perform the independent valuations was:
rior to 30 June 2012, the Department's land and buildings were revalued using the fair value methodology, as at 30 June 2009,
valuations were rried out by Martin Burns in 2010, 2011 to ensure the carrying amount of land and building assets were not materially different
ework, all non-current physical assets are proxy for fai
acquisition is greater than $1 million and estimated useful life is equal to or greater than three years. The Department revalues its land and buildings every three years. However, if at any time management considers that the carrying amount of the asset materially differs from the fair value, then the asset will be revalued regardless of when the last valuation took place. Non-current physical assets that are acquired between revaluations are held at cost until the next valuation, when they are revalued to fair value. Any revaluation increment is credited to the asset revaluation surplus, except to the extent that it reverses a revaluation decrease of the same asset class previously recognised as an expense, in which case the increase is recognised as income. Any revaluation decrease is recognised as an expenthe same asset class, in which case the decrease is debited directbalance existing in the revaluation surplus for that asset class. Anet amounts are restated to the revalued amount Upon disposal or derecognition, any revaluation surplus relating to that asset is transferred to retained earnings.
he Department's land and buildings were revalued as at 30 June 2012. T The professional Mr Fred Taormina, B.App.Sc. (Val.), A.A.P.I. Certified Practicing Valuer of Valcorp Pty Ltd Pbased on an independent valuation performed by Martin Burns - M.B.A., B.App.Sc. Property Resource Management, AAPI, CPV, Liquid Pacific Limited. The last site valuation performed by Martin Burns was at 30 June 2009. Desktop cafrom fair value.
Department for Communities and Social Inclusion 148
alue
Assets deemed to be at fair v
sset classes where written down cost is deemed to be fair value include:
For those classes of non-current assets where an independent revaluation has not been undertaken, the criteria which require revaluation within APF III Asset Accounting Framework have not been met. For these classes of non-current assets, written down cost is deemed to be at fair value as determined by APF III Asset Accounting Framework. A Leasehold Improvements Buildings and Improvements in Progress (WIP) Computing Equipment Motor Vehicles Other Plant and Equipment. Impairment All non-current assets are tested for an indication of impairment at each reporting date. Where there is an indication of impairment, the recoverable amount is estimated. An amount by which the asset's carrying amount exceeds the recoveamount is recorded as an impairment loss. An impairment loss is recognised immediately in the Statement of CompreIncome, unless
rable hensive
the asset has been revalued. For revalued assets an impairment loss is offset against the revaluation surplus for that same class of assets, to the extent that the impairment loss does not exceed the amount in the revaluation surplus for that class of asset. Intangibles An intangiblFollowing ini
e asset is an identifiable non-monetary asset without physical substance. Intangible assets are measured at cost.
or indefinite. The Department only has intangible assets
hen the expenditure meets the asset definition criteria
criteria outlined in AASB 138 Intangible Assets are
tial recognition, intangible assets are carried at cost less any accumulated amortisation and any accumulated impairment losses. The useful lives of intangible assets are assessed to be either finitewith finite lives. The amortisation period and the amortisation method for intangible assets is reviewed on an annual basis. The acquisition of or internal development of software is capitalised w(identifiability, control, and the existence of future economic benefits) and the asset recognition criteria (probability of future economic benefit and cost can be reliably measured) and when the amount of expenditure is greater than or equal to $10 000. All research and development costs that do not meet the capitalisationexpensed. Investment property The investment property is held to earn rentals and/or for capital appreciation. Investment properties are initially recognised atcost.
Costs incurred subsequent to initial acquisition are capitalised when it is probable that future economic benefits in excess
epartment.
t properties are revalued to fair value with changes in the fair value
part of
be settled after more than twelve months.
eir nature.
of the originally assessed performance of the asset will flow to the D Subsequent to initial recognition at cost, investmenrecognised as income or expense in the period that they arise. The properties are not depreciated and are not tested for impairment. Rental income from the leasing of investment properties is recognised in the Statement of Comprehensive Income as other income, on a straight line basis over the lease term. At 30 June 2012 there was only one investment property reported in the Administered financial statements.
.11 Liabilities 2
Liabilities have been classified according to their nature and have not been offset unless required or permitted by a specific accounting standard or where offsetting reflects the substance of the transaction or other event. Where a liability line item combines amounts expected to be settled within twelve months and more than twelve months, the Department has separately disclosed the amounts expected to The notes to the financial statements disclose financial liabilities where the counterparty/transaction is with an entity within the SA Government as at the reporting date, classified according to th Payables Payables include creditors, accrued expenses and employment on-costs.
reditors represent the amounts owing for goods and services received prior to the end of the reporting period that are unpaid d relating to normal operations of the Department.
ccrued expenses represent goods and services provided by other parties during the period that are unpaid at the end of the
porting date.
Cat the end of the reporting period. Creditors include all unpaid invoices receive Areporting period and where an invoice has not been processed or received. In previous years, the Department applied a materiality threshold of $5000 when determining which expenses to accrue. From the 2009-10 financial year, the Department has adopted a policy of accruing expenses of any value, for expenses incurred but not paid, as at re

Annual Report 2011-12 149
yable represents amounts which the Department has received from the Commonwealth
ll payables are measured at their nominal amount and are unsecured. Invoices are normally settled promptly in accordance invoice.
utions and payroll tax with respect to the outstanding liabilities for salaries and annual leave.
ons to several superannuation schemes operated by the SA Government. These contributions hey occur. There is no liability for payments to beneficiaries as the Department of Treasury
centrally recognises the superannuation liability in the whole of government financial statements. The only liability
The paid parental leave scheme paGovernment to forward onto eligible employees via the Department’s standard payroll processes. That is, the Department is acting as a conduit through which the payment to eligible employees is made on behalf of the Family Assistance Office. Awith TI 11 Payment of Creditors’ Accounts after the Department receives an Employment on-costs include superannuation contriband wages, long service leave
eTh Department makes contributire treated as an expense when ta
and Finance outstanding at balance date relates to any contributions due but not yet paid to the superannuation schemes. Employee benefits These benefits accrue for employees as a result of services provided up to the reporting date and remain unpaid. Long-term employee benefits are measured at present value and short-term employee benefits are measured at nominal amounts.
Sick leave No provision has been made for sick leave as all sick leave is non-vesting and the average sick leave taken in future years is
easured as the amount unpaid at the reporting date at remuneration rates expected to be paid
lity
ccordance with AASB 119 Employee Benefits. The following assumptions were made by the actuary when performing the
creases of 2.5% and thereafter 4% (2011: 2.5% for the first year and thereafter 4%) per annum based on the current enterprise bargaining agreement and short-term forecasts.
% (2011: 5.0%) per annum based on the gross 6 year (2011: 6 year) Commonwealth Government bonds
he liability for accrued salaries and wages is measured as the amount unpaid at the reporting date at remuneration rates
estimated to be less than the annual entitlement of sick leave. Annual leave
he liability for annual leave is mTat reporting date. The annual leave liability is expected to be paid within twelve months and is measured at the undiscounted nominal amount. In the unusual event where salary and wages and annual leave are payable later than 12 months, the liabi
ill be measured at present value. w Long service leave The liability for long service leave was determined through an actuarial assessment undertaken by Mercer (Australia) Pty Ltd, inaassessment: salary in
discounting of 2.7rate at 30 June 2012.
Accrued salaries and wages Tcurrent at reporting date. Borrowings The Department measures financial liabilities including borrowings/debt at historical cost, except for interest free loans
rovisions
(measured at the present value of expected repayments). P
Insurance participant in the State Government’s Insurance Program. The Department pays a premium to the South
f ed but not reported
dividual claim files.
aside for both the Public Liability Claims and laims activity, with allowance for prudential margins
responsible for the management of workers rehabilitation and compensation.
The Department is aAustralian Government Financing Authority, SAICORP a division of SAFA for professional indemnity insurance and general public liability insurance and is responsible for the payment of claim amounts up to an agreed amount (the deductible).
AICORP provides the balance of funding for claims in excess of the deductible. S The provision for Public Liability and Professional Indemnity Insurance represents liabilities for outstanding claims in respect o
cidents that have occurred. The liabilities include claims incurred and reported but not paid, claims incurrin(IBNR), claims incurred but not enough reserve (IBNER) and the anticipated costs of settling those claims. The claims liabilitiesare measured as the present values of the expected future payments. Claims incurred but not paid and claim settlement costs hat can be directly attributed to particular claims are assessed by reviewing int
In respect of IBNR and IBNER claims, an amount of $50 000 has been set
rofessional Indemnity Claims. These amounts are based upon historical cPand are reviewed annually. Public Liability and Professional Indemnity Claims relating to periods prior to the restructuring of the former Department of Human Services, effective 1 July 2004, are the responsibility of the Department of Health and Ageing. The provision for property claims represents outstanding payments for incurred damage to property. An allowance is also included for IBNER claims. This provision is based upon historical claims activity and with allowance for prudential margins and
reviewed annually. is Workers compensation The Department is an exempt employer under the Workers Rehabilitation and Compensation Act 1986. Under a scheme arrangement the Department is

Department for Communities and Social Inclusion 150
s ncial
he Department has reflected a workers compensation provision of $34.45 million (2011: $40.84 million), refer note 26.2.
he payment per claim incurred (PPCI) luation method. The assessment has been conducted in accordance with AASB 137 Provisions, Contingent Liabilities and
direct and indirect costs of settling those claims. The liability for outstanding aims is measured as the present value of the expected future payments reflecting the fact that all the claims do not have to be
The workers compensation liability recognised for the employees of the Department is based on an apportionment of an actuarial assessment of the whole-of-government workers compensation liability conducted by Taylor Fry Consulting Actuariebased on 30 April 2012 data. Taylor Fry Consulting Actuaries extrapolate this data to 30 June 2012. For the 2011-12 finayear t The actuarial assessment conducted by Taylor Fry Consulting Actuaries is based on tvaContingent Assets and the WorkCover Guidelines for Actuarial Assessments. The liability covers claims incurred but not yet paid, incurred but not reported and the anticipatedclpaid out in the immediate future. Leases The Department has not entered into any finance leases. The Department has entered into some operating leases.
s
basis hich is representative of the pattern of benefits derived from the leased assets.
Operating leaseIn respect of operating leases, the lessor retains substantially the entire risks and benefits incidental to the ownership of the leased items. Operating lease payments are recognised as an expense in the Statement of Comprehensive Income on a w Leases Incentives All incentives for the agreement of a new or renewed operating lease are recognised as an integral part of the net consideration
greed for the use of the leased asset. Incentives received to enter into operating leases are recognised as a liability.
ehold improvements are capitalised as an asset and depreciated over the remaining term of e lease or estimated useful life of the improvement whichever is shorter.
nre ingencies are disclosed net of the amount of GST recoverable from, or payable s
nd revised accounting standards and policies
he Australian Accounting Standards and interpretations that have recently been issued or amended but are not yet effective, en adopted by the Department for the period ending 30 June 2012. The Department has assessed the impact of the
ew and amended standards and interpretations and considers there will be no impact on the accounting policies or the a ents of the Department.
sses family support and child safety, alternative care for children and young people not able to be cared e management and support for young people under the Guardianship of the Minister, adoption and
a The aggregate benefits of lease incentives received by the Department in respect of operating leases have been recorded as a reduction of rental expenses over the lease term, on a straight line basis. Lease incentives in the form of leasth
2.12 Unrecognised contractual commitments and contingent assets and liabilities
Commitments include operating, capital and outsourcing arrangements arising from contractual or statutory sources and are disclosed at their nominal value. Contingent assets and contingent liabilities are not recognised in the Statement of Financial Position, but are disclosed by way of a note and, if quantifiable, are measured at nominal value. U cognised contractual commitments and contto the Australian Taxation Office. If GST is not recoverable from, or payable to the Australian Taxation Office, the commitmentor contingencies are disclosed on a gross basis.
3 New a
The Department did not voluntarily change any of its accounting policies during 2011-12. Thave not benfin ncial statem There were no error corrections in 2011-12.
4 Activities of the Department
In achieving its objectives the Department provides a range of services classified into the following activities for 2011-12 AgencyStatements, Budget Paper 4/Volume 2: Activity 1: Housing The focus of this program is to develop and implement better housing and service responses for people at risk or in high need,
nd to work with others to expand and improve affordable housing choices across the state. a This activity encompasses the management of grants for housing services to low income households, people in high need and supported accommodation assistance for people in crisis. This includes grants for the provision of private rental services, public, Aboriginal and community managed housing, and the regulation of community housing and homelessness and support ervices. The program also provides housing strategy, policy development and advice (including financial advice) to the Souths
Australian Housing Trust. Activity 2: Families
he program encompaTfor by their own families, caspost care services and youth justice services as directed by the Youth Court.

Annual Report 2011-12 151
tative
presentation of Aboriginal children and young people in care and protection and youth justice activities. This includes working
d to enhance their options and choices.
Ageing der South
ustralians, and to recognise and promote the important contribution older South Australians make in the community.
ational Capability
n and romoting sustainability.
stomers and partners to ensure effective service rovision. Social innovation and continuous improvement will be fostered and our infrastructure will support connected services.
The program also included the provision of emergency financial assistance, domestic violence assistance, poverty prevenprograms and recovery services for victims of disasters. Services are provided to Aboriginal children, young people, families and communities to strengthen capacity and reduce over rein partnership with Aboriginal communities to address family violence. Activity 3: Disability The objective of this program is to promote and develop opportunities for people with a disability to actively engage in the community; and to ensure delivery, both directly and through partnership with non-government organisations, of services to support people with a disability an Activity 4: To work with partners and directly in the community to ensure opportunities, services and support are available for olA Activity 5: Communities and Partners To build and maintain solid relationships with the non-government community services sector and other key partners of the portfolio to help develop and support South Australian families and communities. Activity 6: OrganisTo establish and maintain business practices that support the delivery of South Australia’s Strategic Plan as it affects the portfolio, including ensuring timely decision making, improving administrative efficiency, increasing customer satisfactiop To continue to build a capable, creative workforce that engages with our cup

Department for Communities and Social Inclusion 152
110
305 649 333 133941 4 042
11 1845 249
34 421 35 72118 735 19 932
5462 601
Employee benefit expenses 5
2012 20 $’000 $’00
alaries and wages STVSPs Long service leave 20 352 Annual leave 30 624 3Superannuation Workers compensation Payroll tax 19 758 20 775Other employee related expenses 2 200 2 56
otal employee benefit expenses 432 680 T Targeted voluntary separation packages (TVSPs): 2012
2011$’000 $’000
4 042
031
et cost to the Department (1 775) 2 956
Amount paid to these employees: TVSPs 941 Annual leave and long service leave paid during the reporting period 245 1 Recovery from the Department of Treasury and Finance* (2 961) (2 117)NNumber of employees that were paid TVSPs during the reporting period 9 44* Recovery exceeds expenses due to $2.009 million received for June 2011 in July. Remuneration of Employees
2012
No.
2011No.
The number of employees whose remuneration received or receivable falls within the following bands:
$130 700 - 133 699* - 3$134 000 - 143 999 6 13$144 000 - 153 999 8 12$154 000 - 163 999 11 10$164 000 - 173 999 3 10$174 000 - 183 999 4 2$184 000 - 193 999 2 4$194 000 - 203 999 3 4$204 000 - 213 999 - 4$214 000 - 223 999 2 1$224 000 - 233 999 1 -$244 000 - 253 999 2 3$254 000 - 263 999 - 1$264 000 - 273 999 - 1$274 000 - 283 999 1 -$284 000 - 293 999 - 1$324 000 - 333 999 - 1$344 000 - 353 999 1 -$384 000 - 393 999 - 1
Total number of employees 44 71 * This band has been included for the purposes of reporting comparative figures based on the executive base level remuneration rate for 2010-11.

Annual Report 2011-12 153
ived remuneration equal to or greater than the base executive remuneration level loyees reflects all costs of employment including salaries and w yments in lieu of
ave, superannuation contributions, fringe benefits tax and any other salary sacrifice benefits. The tot u ration receivby these employees for the year was $7.744 million (2011 $12.5 million).
ration of Employees who transferred into the Department under the Machinery of Gove rrangemenresentative of the employee’s remuneration for the full year of 2011-12. Depar mmunitiesgnises employee benefit expenditure for these employees from the date of transition. Expenses prior
d and recognised by the transferor department.
mployees whose remuneration received or receivable falls within the
$134 000 - 143 999 1
$154 000 - 163 999 2
4 000 - 223 999
The table includes all employees who receduring the year. Remuneration of emp ages, pale al rem ne ed
Remune rnment A ts This disclosure is rep
n recotment for Co and
Social Inclusio to the date were incurre 2012 The number of efollowing bands:
No.
$130 700 - 133 699* -
$144 000 - 153 999 2 2
$194 000 - 203 999 $21 1
Total number of employees 8 *This band has been included for the purposes of reporting comparative figures based on the execu vel remunera
Supplies and services
2012 $’000
2011
$’000
ccommodation and property related 3 3
97 720 85 6295 31 5 51
Clie 7 38 8 6Communication and computing 16 35 19 2Con taff 19 0 18 4Con 429 4Drug s 2 06 2 1Insu 1 32 1 36Inter ees 65 8Man 765 3 45Mino 9 43 8 50Moto 11 48 13 35Prin e and periodicals 2 97 3 65Seminars, courses and training 1 51 1 57Trav n 2 28 2 62Othe 12 83 11 73Tota ces (excluding audit fees) 221 78 221 97
tive base le tion rate for 2010-11.
6
A 0 177 649
4 856618Advertising and promotions
Brokerage care services Busi
ness services 0 0nt related expenses 2 34
2 60tractors and agency s 13 56sultants 64
8s and medical supplie 2 0rance 5 1preter and translator f 9aged payments 8r equipment 0 9r vehicles 9 9
ting, stationery, postag 8 57 3
el and accommodatio 4 8r administration 6 1l supplies and servi 3 0
Audi the Auditor-General’s Department relating to the audit of finan
298 29
298 2
t fees paid/payable tocial statements*
5
Total audit fees 95 Total supplies and services (including audit fees) 222 081 222 265

Department for Communities and Social Inclusion 154
7
1 301 710018
2 133 3 576onsultants -
181 31 1 415
ees 1 10Man 681 3 356Mino 876 814Moto 10 851 12 706Prin e and periodicals 539 68Seminars, courses and training 169 94
46 72 457 2 065
Supplies and services provided by entities within SA Government $’000 $’000Accommodation and property related 19 224 24 71Advertising and promotions 75 34
rokerage care services BBusiness services 5 297 5 5Client related expenses 88 16Communication and computing 3 374 4 999Contractors and agency staff C 32
3 Drugs and medical supplies Insurance Interpreter and tra
7 nslator f
aged payments r equipment r vehicles
ting, stationery, postag
Trav n ther administration
el and accommodatioOTotal supplies and services – SA Government (excluding audit fees) 48 464 60 258 Audit fees paid/payable to the Auditor-General’s Department relating to the audit of
298 295
au ment 298 financial statements* Total dit fees – SA Govern 295 Total supplies and services – SA Government (including audit fees) 48 762 60 553*There were no other services provided by the Auditor-General’s Department The number and dollar amount of consultancies paid/payable (included in supplies
ell within the following bands: 2
No $’000 No 15 12 4 9
0 2 18 3 nsultants engaged 21 24
012 2011and services) that f
$’000 Below $10 000 103 77Between $10 000 and $50 000 145 148Above $50 00 1 239Total paid/payable to the co 429 464
7 Depreciation and amortisation expense
2 012 2011 penseDepreciation ex $’000
1
1
$’000Buildings and improvements 538 1 757Computing equipment 104 155Motor vehicles 48 30ILEP equipment 032 867Other plant and equipment
otal depreciation expense 252
2 974 267
3 076T Amortisation expense
ements
1 35 1re 397
Leasehold improvomputer softwa
1 562817C
Total amortisation expense 1 748 2 379 Total depreciation and amortisation expense 4 722 5 455

Annual Report 2011-12 155
t payments by program $
Grants 14 13
eme ement (NAHA) 13 13
ent on Social Housing on Remote Indigenous Housing 4 1
t on the Nation Building & Jobs Plan 3 88
ime 192 18
ness 131 127 7
ts 36 65 4ment
550 1 77812 3
nt Grant) 1 1 784
1 288 -1 430
78 85
8 Grants, subsidies and client payments
2012 $’000
2011’000
Grants, subsidies and clien
Aboriginal Community Benefit 996 7 1
1 1901Disability Grants 25 112
Community Connect Grants h
965 840National Rental Affordability Sc
dable Housing Agre994
0 7 -
9 73National Affor 40 3
5National Partnership Agreem
rtnership Agreement 6 -
National Pa 5 465 0 70
9 3814 8National Partnership Agreemen
l Facility 9 55
Supported Residentiaeg
456 8 1565Tax Equivalents R
Funding 866 042
Social Inclusion 412 17
-16 1National Partnership Agreement on Homeless 062 88
Home and Community Care 841 9
364Alternative Care Support Paymen
ty Develop91 8
Family and Communi 9 754 8 930Stronger Families Safer Children – Early Intervention
lternative Care Grants 4 038
21 092 7 797
45 070A
Emergency Financial Assistance
Concessions 197 791Aged Care Grants
arks Community Centre (Local Governme 097 784
831P Strathmont Centre Devolution Grant -
- 7
4 357Disability Group Home Contribution ffice for Youth
O
Other Total Grants, Subsidies and Client Payments
7324 7607 888

Department for Communities and Social Inclusion 156
ant gram Paid/Payable within SA Government
3
ct Grants 799 cheme
t (NAHA) 130 139 73g
us Housing 45 4 19 38n
19 18
ment on Homelessness 17 16 18
ents
ution Grant n
h 952
Government 45 49
Gr s, Subsidies and Client Payments by Pro
Aboriginal Community Benefit Grants
2012 $’000
2011$’000
5 15Disability Grants 832 3 308Community Conne 739National Rental Affordability S 994 -National Affordable Housing Agreemen 740 5National Partnership Agreement on Social Housin 36 -National Partnership Agreement on Remote Indigeno 65 1National Partnership Agreement on the Nation Building & Jobs Pla 30 709 84 855Supported Residential Facility - 560Tax Equivalents Regime 2 866 5 042Social Inclusion Funding 362 -National Partnership Agree 062 8Home and Community Care 32 225 31 387Alternative Care Support Paym 267 1 316Alternative Care Grants - 301Emergency Financial Assistance 1 403Aged Care Grants 892 2 438Strathmont Centre Devol - 7Disability Group Home Contributio - 4 357Office for Yout 276 -Other 220Total Grants, Subsidies and Client Payments – SA 7 483 0 252
Client Payments by Recipient Type $’00sing Trust 41 449
A Health Units 35 357 35 398on-Government Organisations (NGOs) 8.1 267 065 274 569ocal Government 23 396 22 444
Universities 595 623Grant -Commonwealth & Other State/Territory Governments 879 575Concessions 1 197 791Children’s Payments and Emergency Financial Assistance* – Government 268 1 719Children’s Payments and Emergency Financial Assistance* – Non-Government 37 273 65 506Total Grants, Subsidies and Client Payments 787 888 854 760
Grants, Subsidies and $’000 0SA Hou 7 872 562SA Government Entities - Other 3 986 3 573SNL
*Small payments are made to numerous providers in accordance with the Departmental client payment policies.

Annual Report 2011-12 157
.1 Funding to Non-Government Organisations
3 3c 1 1
spite Agency Inc 1 112 15
ices aide Inc
33 33 33 133 093
Options Inc 2 2
oyal Society for the Blind of SA Inc 2 542 2 473eals on Wheels (SA) Inc 2 525 2 568
d NT Inc
roject Inc. 1 21 1
1
1 4881 249
dividual Supported Accommodation Services Inc 1 544 1 493Aboriginal Prisoners and Offenders Support Services Inc 1 481 1 435Disability Living Inc 1 452 1 403Catholic Diocese of Port Pirie 1 449 2 309Northern Carer’s Network Inc 1 410 1 339Carer Support & Respite Centre Inc 1 405 1 380Alzheimers Australia SA Inc 1 377 1 264Carers Association of SA Inc 1 326 1 275Key Assets SA Ltd 1 263 2 060Stanhope Healthcare Services (SA) Pty. Ltd. 1 166 1 128Lifestyle Assistance and Accommodation Service Inc 1 158 1 118Xlent Disability Services 1 148 1 032Masonic Homes Ltd 1 073 1 272Boandik Lodge Inc 1 010 1 061The Salvation Army (SA) Property Trust 921 1 698Seniors Information Service Inc 872 1 069Other 46 546 42 976Total funding to Non-Government Organisations 267 065 274 569
8
2012
$’000
2011$’000
Minda Incorporated Royal District Nursing Service of SA In
6 869
5 0838 725 032
9 8 33 370
87Community Accommodation & Re Anglicare SA Inc 767 640Novita Childrens Services Inc 11
9 444 792 10 78
6 4888
Leveda Inc Aged Care & Housing Group Inc 6 7
6 488 85 6 92
5 9667
Spastic Centres of SA Inc Resthaven Inc 4 839 4 621Centacare Catholic Family Serv 4 65
4 065 3 5
3 915 597
Uniting Care Wesley Adel Aboriginal Family Support Services Inc Helping Hand Aged Care Inc
33 650 929 7 12
3 2621
Community Living and Support Services Inc Orana Inc
3 565 2 318 394 3 057
Life’s for Living Inc 1 861Life Without Barriers 28
174 9 1
3 094 680
Uniting Care Wesley Port Adelaide Inc Community Lifestyles Inc
4 2 97
4 4092
Baptist Care SA Inc 06 709
8 Community Living 16
3748
Anglican Community Care Inc Autism Association of SA Inc
22 568
586 42 259
R M Hills Community Options Inc 2 453 1 959Country Home Advocacy Project Inc Guide Dogs Association of SA an
2 132 1 9642 066 1 916
Southern Junction Community Services Inc Bedford Group Inc
1 993 3 8311 920 1 846
Community Living P 1 872 1 658Barkuma Inc 749 868Italian Benevolent Foundation (SA) Inc 742 407EBL Disability Services Inc Uniting Care Wesley Port Pirie Inc
1 648 12 748 058
644 Paraquad SA (The Paraplegic & Quadriplegic Assoc of SA Inc) 1 604 1 541Comrec Australia Pty Ltd 1 599 1 326Aboriginal Elders and Community Care Services Inc 1 594
ustralian Red Cross Society 1 561 AIn
Payments to Non-SA Government Organisations, where total payments to an organisation are greater than $1.0m are individually disclosed above. Payments less than $1.0m are in Other. This excludes payments for Children’s Payments and Emergency Financial Assistance.

Department for Communities and Social Inclusion 158
Other expenses
onwealth *
2
9
2012
$’000
2011$’000
Bad and doubtful debts 451 82Donated assets 20 -Aged Care payments to CommOther
26 782 -6 -
Total other expenses 7 259 82 Other expenses paid/payable to entities within the SA Government
ent
$’000 $’000Bad and doubtful debts
rnm(24) 32
Total other expenses – SA Gove (24) 32 * Reimbursement to the Commonwealth in 2011-12 arising from the aged care funding reform for p with a disability w
commodated within the residential aged care sector.
nue from rent, fees and charges
8 7
1 11 1
1 1 13 12
ersons ho are under 65 and are being ac
10 Reve
2012
$’000
2011$’000
Employee services * 2 423 7 482Insurance recoveries 1 028 1 108Recoveries 8 904 8 230Business services Fees, fines and penalties **
7 037 2 016
5 256494
Rent 880 829Patient and client fees 0 446 1 964Total rent, fees and charges 2 734 5 363 2012 2011Rent, fees and charges received/receivab
* le from entities within SA Government
8 7
1 11 1
11 10
$’000 $’000Employee services 2 423 7 482Insurance recoveries 22 91Recoveries 2 983 1 698Business services 7 019 5 256Fees, fines and penalties ** 1 500 205Rent 588 677Total rent, fees and charges – SA Government 4 535 5 409 * Represents the recovery of costs for the provision of emplo** Includes fees from Multicultural SA, which was trans
yee related services to Housing SA. ferred to the Department effective 1 January 2012.

Annual Report 2011-12 159
s
ments: munity Care 127 0 109 42
1 45ability Reform Funding * 41 68
Remote Indigenous Housing 45 465 19 3813 8
ent 5 5 09 9 6
ther 5 087 5 3352
11 Commonwealth revenue
2012
$’000
2011$’000
National Partnership Pay Home & Com 07 7HACC Services for Veterans 1 500 5Dis 2 -Social Housing 36 -
Nation Building and Jobs Plan 0 709 4 855Aged Care Assessm 705 96Homelessness 994 13
OTotal Commonwealth revenues 267 185 235 16 * An increase in the Commonwealth contribution for specialist disability services to the over 65s arising from the aged care
2 Interest revenues
nds held nues
funding reform.
1
2012
$’000
2011$’000
Interest on fu 31 54Total interest reve 31 54
13 Net gain/(loss) from disposal of non-current assets
and and buildings roceeds from disposal
(sposal of land and buildings
2012
$’000
2011$’000
L P - 1 509Less net book value of assets disposed - 1 391)Net gain/(loss) from di - 118 Plant and equipmentProceeds from disp
disposed (nt
osal
Less net book value of assets10 3
(82) 122)Net gain/(loss) from disposal of plant and equipme (72) (119) Other assets
- -
Proceeds from disposal 700 et gain/(loss) from disposal of other assets 700 N
Total assets Total proceeds from disposal 710 1 512Less total value of assets disposed (82) (1 513)Total net gain/(loss) from disposal of assets 628 (1)

Department for Communities and Social Inclusion 160
3 897 -OtheTota
14 Other revenues
2012
$’000
2011$’000
Gain on revaluation of assets r 3 169 4 837l other revenues 7 066 4 837
Oth om entities within SA Government 20 201
OtheTota overnment
er Revenues received/receivable fr12
$’000
1$’000
r 1 570 702l other revenues – SA G 1 570 702
o) SA Government
2012 $’000
2011
$’000
ted Account pursuant to the Appropriation Act ral appropriation 90 98
epartment of Treasury and Finance – Contingency Funds 1 1 Reimbursement – Housing SA 192 8 185 0
priation 1 110 6 1 181 1
15 Revenues from/(payments t
15.1 SA Government appropriation
Appropriations from ConsolidaGeneD
2 800
5 3935 014 0 736
Tax Equivalent Regime 66 42Total SA Government appro 80 71
15.2 Grants from SA Government Agencies
nts ommunity Development Fund
7 323 9 583vernment agencies 10 99 1
State capital graC
268
8373 400 3 443
Other Total Grants from SA Go 1 3 863
15.3 Payments to SA Government
Return of surplus cash pursuant to cash alignment policy (17 938 - Consolidated Account (396)
overnment (17 9 (39
) Other payments to the - Total payments to SA G 38) 6) Total revenues from/(payments to) SA Government 1 103 1 19 733 4 638

Annual Report 2011-12 161
g commitments
artment is engaged in a variety of funding programs involving State and Commonwealth s who provide monie the Department on the premise that these funds are expended in a manner consistent with the t the ogram.
ent had outstanding funding commitments to the following progra
$’000 $’000
lth – ENU Bilateral funding
ational Partnership Agreement on Indigenous Economic Participation (Youth and il
360 360
roperty Related Works 257 -re Reforms 212 -
Conversion Program uilding Practical Inclusion and Participation Project
es-Project
tockport Community Recovery Project - 25- 247
Development Strategy after Disasters Project
Working Arrangements for Older South Australians
ommunity Protection Panel - 219- 294
14
16 Unexpended fundin
The Depto
ources s erms of pr
0 June 2012, the DepartmAs at 3
ms:
2012 2011 HACC – Commonwealth funding for under 65
nding 2 576 5 883
HACC Project FuSA Hea
1 460
-
Common Access Points 635 -436 -
NFam y Centre Programs) PCommon Arrangements – Community CaCommonwealth Dept for Health and Ageing CDEP 191 631B 175
113 -
194Magill Secure Care Sustainment Metropolitan Equipment Scheme HACC Project No. 1542-04
100 79
--Intervention Orders
CCIF – Funding for Independent Arts Foundation Office of the Ageing - Home & Community Care Program
50 -12 425
Eastern Collaboration & Western Linkag 12 -SSeniors Card Replacement Recovery Workforce - 27Management of Donated Goods - 30Flexible - 32DCSI Equipment Program - 1 252CCommunity Development Fund Adolescent Community Brokerage -
6 66 9
Total operating funding commitments 8 9 768 Domiciliary Care SA – Northern Office
tjara (APY) Lands avan Training Centre – Upgrade Jonal Drive 277 605avan Sustainment 210 -
Client Management Engine 170 27New Seniors Card – Production Equipment 76 8Strathmont Centre – Sustainment 41 -Cavan Youth Training Facility – Goldborough Road YTC 23 1 458Community Residential Care Facilities - 197Total capital funding commitments 2 649 3 259
1 072 324Family Wellbeing Centre
taff Accommodation – Anangu Pitjantjatjara Yankunytja500 280
-640S
CC
Total unexpended funding commitments 9 317 13 027

Department for Communities and Social Inclusion 162
11$’000
1 50 8520 339
ther Deposits otal cash and cash equivalents 6 5
17 Cash and cash equivalents
2012
$’000
20
Special Deposit Account with the Treasurer 62 94dvance Account 10A
O 637 864T 3 678 2 055 Cash deposits are recognised at their nominal amo
unts.
ble Gift Board (Previously Commissioners of Charitable Funds)
e Health Services Charitable Gifts Bill was introduced into the House of Assembly. The purpose of ate the existing Public Charities Funds Act 19 der hich the
ted in The South Australian Government Gaze as pr laimed by the ct (No 15 of 2011) came into operation on 1 July 2011. The Public Charities Funds Act 1935
ts were previously vested in the Commissioners on behalf of the former cil (IDSC) and Metropolitan Domiciliary Ca ); ceased as at
rd must, on the request of the Minister to whom the Family an omm rvices fer to that Minister funds held on behalf of the Minister.
ual Appropriation Excess Fund Account. The balance of these accordance with the Treasurer’s/Under Treasurer’s appro
201 2
1 21 596(
1 11
2 54 3 5
35 2 39 65
Health Services CharitaOther deposits include $0.559m (2011: $0.534m) held by the Board. On 24 November 2010, ththis Bill, passed on 5 May 2011, was to revise and upd 35, un wCommissioners of Charitable Funds operated. The Health Services Charitable Gifts Act 2011, as sta tte, w ocGovernor on 30 June 2011. The A was repealed. The arrangements whereby donations and bequesPublic Health Entities, Intellectual Disability Services Coun re (MDC30 June 2011. The Health Services Charitable Gifts Boa d C unity SeAct 1972 is committed, trans Deposits with the Treasurer Includes funds of $42.556m (2011: $8.335m) held in the Accr
neral use, ie funds can only be used in funds is not available for ge val.
18 Receivables
Current 2
$’000 8 546
011
$’000Debtors Less allowance for doubtful debts
recoverable (603) 2
183)30Employee related services 759 6
Overpaid salaries 192 225Sundry 136 229
38Grant receivables - 3Prepayments 153
0 81
1Goods and Services Tax receivable 73 3Total current receivables 56 0
Non-current Sundry
mployee related services recoverable 223
4 847 480
E 1 16 8391
Total non-current receivables 5 070 17 319 Total receivables 50 326 56 969

Annual Report 2011-12 163
e entities 2012
$’000
2011$’000
ebtors 1 1
otal receivables – SA Government 41 314 46 594
Rec ivables from SA Government
D 4 367 (37)
7 909(64)Less allowance for doubtful debts
services recoverable
Employee related Sundry
26 984 -
28 14569
Grant receivables repayments
- 383P - 152T Movement in allowance for doubtful debts
cognised when there is objective evidence that aThe allowance for doubtful debts (allowance for impairment loss) is receivable is impaired.
re An allowance for impairment loss has been recognised in “Other Expenses” in the Statement of Comprehensive Income for specific debtors and debtors assessed on a collective basis for which such evidence exists.
Movements in the allowance for doubtful debts (impairment loss) 2012
$’000
201$’000
arrying amou
1
nt at the beginning of the period 183 195-
82 off (21) (94)
CTransfer from administrative restructure 10 Increase/(decrease) in the allowance 431 Amounts writtenCarrying amount at the end of the period 603 183 Bad and doubtful debts The Department has recognised a bad and doubtful debt expense of $0.451m (2011: $0.0820m) in the Statement of Comprehensive Income. Interest rate and crediReceivables are raised f
t risk or all goods and services provided for which payment has not been received. Receivables are normally
thin 30 days. Trade receivables, prepayments and accrued revenues are non-interest bea
n recognised in the allowance for doubtful debts, it is not anticipated that counterparties o dis arge their receivables approximates net fair value due to being receivable on demand. There is no
sector debtors.
vables – please refer to note 29
financial instruments and risk exposure information – please refer to note 29
settled wi
ring.
Other tha will fail t ch obligations. The carrying amount ofconcentration of credit risk to non-public Maturity analysis of recei Categorisation of

Department for Communities and Social Inclusion 164
nominal amount
295 ntories held for distribution at no or nominal amount 29
19 Inventories
2012
$’000
2011$’000
Current - held for distribution at no ores held for distribution at cost:
Inventori Stores
ve284
Total current in 5 284 Total inventories 295 284
20 Property, plant and equipment
2012
$’000
2011$’000
5 670 7 010ite land at valuation (fair value) 118 036 211 715uildings and improvements at valuation (fair value) 63 476 58 982
(1 (1176 267
Land and buildings Vacant land at valuation (fair value) SBBuildings at cost (deemed fair value) -
0 714) 2 846
2 780)Less accumulated depreciation – buildings and improvements Total land and buildings 468 773
Leasehold improvements Leasehold improvements at cost (deemed fai
ess accumulated amortisation – leasehold imr value) 11 20provements (3 (9
otal leasehold improvements 7 651 11 385
190 539)
824439)L
T Plant and equipment Computing equipment at cost (deemed fair value) 710 997
computing equipment at cost (602) (766)8)
6 557
ent at cost (2 017) (2 251)4 808 4 729
Less accumulated depreciation – Motor vehicles at cost (deemed fair value) 410 26Less accumulated depreciation – motor vehicles at cost (267) (218
EP equipment at cost (deemed fair value) 7 879 ILLess accumulated depreciation – ILEP equipment at cost (4 551) (3 775)Other plant and equipment at cost (deemed fair value) 3 246 3 917Less accumulated depreciation – other plant and equipmTotal plant and equipment Total property, plant and equipment at valuation (fair value) 187 1
otal property, plant and equipment at cost (deemed fair value) 82 277 707
23 435 35 409Less total accumulated amortisation (3 539) (9 439)Less total accumulated depreciation (18 151) (19 790)Total property, plant and equipment 188 927 283 887
T
Valuation of land and buildings Refer note 2.9 above Impairment There were no indications of impairment of property, plant and equipment and infrastructure at 30 June 2012.

Annual Report 2011-12 165
nd, buildings and leasehold improvements
20.1 Reconciliation of la
wing table shows the movement of land, buildings and improvements, and leasehold improvements during 2011-12.
Buildings and lmprovements
eho Improvements
Total land, buildings
leasehold $’000 $’00 $
The follo
Vacant land Site land $’000 $’000
Leas ld and imp.
0 ’000Carrying amount at the beginning Purchases
of the year 7 010 211 715 49 048 279 158- - - 121
epreciation and amortisation for the year - - (1 538) (1 351) (2 889)uctures - (24 982) (11 892) (3 749) (40 623)
rough administrative restructures - - 72 220 ransfers from works in progress - - - 1 025
ent/decrement (1 340) (68 697) 17 067 (52 970)- - 5
2 5 670 118 036 52 762 7 651
11 385 121
DTransfer out through administrative restrTransfers in thT
2921 025
Net revaluation increm - Other Movements - 5Carrying amount at 30 June 201 184 119 The following table shows the movement of land, buildings and improvements, and leasehold improvements during 2010-11
Vacant land Site landBuildings and lmprovements
Leasehold Improvements
Tobuildings and
leasehold imp.$’000 $’000 $’000 $’00
.
tal land,
0 $’000Carrying amount at the beginning of the year 7 010 212 940 44 462 6 030 2
- 42 - 450 ssets received for nil consideration - - - 6 423 6 423
- (1 267) (78) (46) (1 391)- - (1 757) (3
- 6 421 90 7 010 211 715 49 048 279
70 442Purchases 492ADisposals Depreciation and amortisation for the year (1 562) 319)Transfers from works in progress - 6 511Carrying amount at 30 June 2011 11 385 158
20.2 Reconciliation of plant and equipment
The following table shows the movement of plant and equipment during 2011-12.
equipmentMotor
vehicles ILEP equipmentand
pme Total pl
equi$’000 $’000 $’000 $’000 $’000
Computing Other plant equi nt
ant and pment
Carrying amount at the beginning of the year 231 50 2 782 1 666
141 1 628 104 eration - - - (20)
- - (50) (32) ar (104) (48) (1 032) (252)
ransfer out through administrative restructures (101) - - (272) (373) restructures - - - 35 35
n progress 60 - - - 60ount at 30 June 2012 108 143 3 328 1 229 4 808
4 729Purchases 22 1 895Assets received/donated for nil consid (20)Disposals (82)Depreciation and amortisation for the ye (1 436)TTransfers in through administrativeTransfers from works iCarrying am
he following table shows the movement of plant and equipment during 2010-11. T
Computing equipment
Motor vehicles ILEP equipment
Other plant and equipment
Total plant and equipment
$’000 $’000 $’000 $’000 $’000Carrying amount at the beginning of the year 152 80 2 437 1 692 4 361Purchases 41 - 1 253 212 1 506Disposals - - (41) (39) (80)Depreciation and amortisation for the year (155) (30) (867) (267) (1 319)Transfers from works in progress 193 - - 68 261Carrying amount at 30 June 2011 231 50 2 782 1 666 4 729

Department for Communities and Social Inclusion 166
$’000 $’000
Property, plant and equipment in progress at cost (deemed fair value) 68 009 tangibles in progress at cost (deemed fair value)
Total capital works in progress
21 Capital works in progress
2012
2011
17 756484
18 240In -
68 009 Reconciliation of capital works in progress
works in progres 12. otal cap
(tructures
The following table shows the movement of capital s during 2011- T ital WIP $’000Carrying amount at the beginning of the year
18 24051 Purchases 603
Transfers to completed works 1 802)Transfer out through administrative res
t 30 June 2012 (32)
68 00Carrying amount a 9 The following table shows the movement of capital works in progres 11. Total capital WIP
000arrying amount at the beginning of the year 6 618
Purchases 19 094ransfers to completed works
arrying amount at 30 June 2011
s during 2010- $’C
TWIP adjustments
(7 571)99
1C 8 240
22 Intangible assets
2012
$’000
ue) - ware - (
-
2011
$’000
Computer software at cost (deemed fair val 7 830Less accumulated amortisation – computer soft 1 521)Total Intangible Assets 6 309 Reconciliation of intangible assets The following table shows the movement of intangible assets during 2011-12.
Total intangible assets
Carrying amount at the beginning of the year ransfer out through administrative restructures (
for the year
$’0006 309
T 6 618)Transfers from works in progress 706Amortisation (397)Carrying amount at 30 June 2012 - The following table shows the movement of intangible ass ring 201 . ntangible
6 3 (
mortisation for the year (817) 6 309
ets du 0-11 Total i assets $’000Carrying amount at the beginning of the year 69Disposals 42)Transfers from works in progress 799ACarrying amount at 30 June 2011 Impairment
here were no indications of impairment on intangible assets at 30 June 2012. T

Annual Report 2011-12 167
urrent 2
$
3366 2
ther 181 20346 852 48 680
23 Payables
C012
’000
2011$’000
Creditors 8 006 37 551Other accrued expenses 617Employee benefit on-costs 8 299 8 309OTotal current payables Non-current
4 733 urrent payables 4 733
Employee benefit on-costs 5 030Total non-c 5 030 Total payables 51 585 53 710
2012
$’000
2011
ayables to SA Government entities 18 765 1
ed expenses 60 10 935
SA Government Entities 29 760 28 5
$’000
PCreditors 6 283Other accru -Employee benefit on-costs 12 285Total Payables – 68 Interest rate and credit risk Creditors and accruals are raised for all amounts billed but unpaid. Sundry creditors are normally settled ithin 30 days.
mployment on-costs are settled when the respective employee benefit that they relate to is discha ll p ables are noThe carrying amount of payables approximates net fair value due to the amounts ayable on demand
truments and risk exposure information – refer to note 29.
wrged. AE
interest bearing. ay n-
being p . Maturity analysis of payables – refer to note 29.
ategorisation of financial insC

Department for Communities and Social Inclusion 168
its
benefits
24 Employee benef
Current 2012
$’000
2011$’000
Annual leave Long service leave
27 218 35 16795 662
171 13 033Accrued salaries and wages 5 604Total current employee 42 051 53 804 Non-current Long service le
ave
Total non-current employee b5 56 694
enefits 50 8000 800
56 694
Total employee benefits 110 49892 851 T(2
he total current and non-current employee liabilities (ie aggregate employee benefit plus related $50.3011: $62.113m) and $55.533m (2011: $61.724m) respectively.
ermined through an actuarial assessment undertaken er (Au ralia) Pty L and thereafter 4% (2011: 2.5%) per annum was used and a discoun 2.7% 011: 5.0%6 year (2011: 6 year) Commonwealth Government bonds rate at 30 Jun 12. T portion of 12 was assumed to be 40% (2011: 35%) in accordance with the fac ut in A S 5.24.
he significant decrease in bond yield, which is used as the rate to discount future long service leave cash flow, results in an crease in reported long service leave liability. This increase has been offset with the transfer of DCSI - Families SA employees
lt of a reorganisation of public sector operations. It is considered impracticable to estimate the net
2012 $’000
2011
$’000
- 285otal non-current borrowings – SA Government - 285
on-costs) for 2012 is 5m
for long service leave was detThe liability by Merc
t ratest td. A
) per salary inflation rate of 2.5%annum, based on the gros
of e 20
(2he pros
leave taken in service for 20 tor set o P Tintransferring to DECD as a resufinancial effect of the changes in assumptions in the current financial year for future years.
25 Borrowings
Non-current
Advance – Treasury Imprest Account T Total borrowings - 285

Annual Report 2011-12 169
26.1 on 26.2
1
26 Provisions
Current 2012
$’000
2011$’000
Insurance 89 109Workers compensati 7 629 9 895Total current provisions 7 718 0 004 Non-current
26.1 112 141on 26.2
Insurance Workers compensati 26 820 30 942Total non-current provisions 26 932 31 083 Total provisions 34 650 41 087 A liability has been reported to reflect unsettled workers compensation claims. The workers compensation provision is based on
6.1 Reconciliation of insurance
an actuarial assessment performed by the Public Sector Workforce Division of the Department of the Premier and Cabinet.
2
tal$’000
The following table shows the movement of insurance during 2011-12
Public liability
$’000 Property
$’000 To
Carrying amount as at 1 July 200 50 250Transfers out due to Restructure (FSA) (126) (13) (139)Increase to provision due to new claims 220 20 240Reduction due to payments (18) (10) (28)
et revision of estimates (116) (6) (122) June 2012 160 41 201
NCarrying amount at 30
The following table shows the movement of insurance during 2010Public liability
$’000Property
’000 T
$’
-11
$
otal000
Carrying amount as at 1 July 266 57 323Increase to provisio
eduction due to pan due to new claims 241 115 yments (26) (19) (45)
et revision of estimates (281) (103) (384)Carrying amount at 30 June 2011 200 50 250
356RN
26.2 Reconciliation of workers compensation
The following table shows the movement of workers compensation during 2011-12
2012
$’000
Carrying amount at beginning of financial year 40 837Transfers out due to Restructure – Families SA (11 479)Increase to provision due to revision of estimates 19 382Reduction due to payments (14 291)Carrying amount at 30 June 2012 34 449
The following table shows the movement of workers compensation during 2010-11
2011
$’000
Carrying amount at beginning of financial year 33 584Increase to provision due to revision of estimates 19 696Reduction due to payments (12 443)Carrying amount at 30 June 2011 40 837

Department for Communities and Social Inclusion 170
monies 116
otal other liabilities – current 785 752
27 Other liabilities
Current 2012
$’000
2011$’000
Unclaimed 115Unearned revenue 32 -Lease Incentive 637 637T Non-current Lease Incentive 4 778 5 415Total other liabilities – non-current 4 778 5 415 Total other liabilities 5 563 6 167 2012 2011
ther liabilities with SA Government entities $’000 OU
$’00032 -
ent 32 -nearned revenue
Total other liabilities – SA Governm
28 Equity
7 1
57 946 114186 586 20
2012
$’000
2011$’000
Contributed capital 74 32554 315
4 3256Retained earnings 859
Revaluation surplus 813Total equity 5 997
he asset revaluation surplus is usedTe
to record increments and decrements in the fair value of land dings and t and quipment to the extent th ings when an asset is
derecognised.
, buil planat they offset one another. Relevant amounts are transferred to retained earn

Annual Report 2011-12 171
ts/Financial risk management
orisation of financial instruments
Note Carryingamount
2012
Faivalue 2012
Carr ng am valu
2 $’000 $’000 $’000 $
ash and Cash Equivalents 17, 33 63 678 63 678 52 055 52 05518 46 253 46 253 53 456 53 456
ssets 109 931 109 9 105 511 10
29 Financial instrumen
29.1 Categ
r
yiount 2011
Faire
011Financial Assets ’000CReceivables Total Financial A 31 5 511 Financial Liabilities
23 51 585 51 5 53 710 5orrowings 25 - - 285otal Financial Liabilities 51 585 51 58 53 995 5
Payables 85 3 710B 285 T 5 3 995
bles and payables disclosed above excludes statutorThe value of receiva y receivables and payables such as GST input tax
hen there is the possibility of the Department’s debtors defaulting on their contract ing in ancial loss to the Department.
minimal concentration of credit risk to non public sector. The Department do gag n high riscial assets
analysis of financial assets
he following table discloses the ageing of financial assets, past due including impaired assets past due.
012 Overdue
for< 30 days
Overdue for30 – 60 days
Overdue for
> 60 days Total
Not Impaired $’000 $’000 $’000 $’000Receivables 1 883 555 542 2 980 Impaired Receivables - - 603 603 1 883 555 1 145 3 583
credit payable and recoverable.
29.2 Credit Risk
Credit risk arises w ual obligations resultfin The Department has es not en e i k hedging for its finan
29.3 Ageing
T Past due by
2
2011 Overdue
for< 30 days
Overdue for30 – 60 days
Overdue for
> 60 days Total
Not Impaired $’000 $’000 $’000 $’000Receivables 197 124 1 595 1 916 Impaired Receivables - - 183 183 197 124 1 778 2 099 The amount of receivables and payables disclosed above excludes statutory receivables and payables such as GST input tax credit payable and recoverable.

Department for Communities and Social Inclusion 172
Contractual Maturity Carryingamount
< 1 Year1 – 5
Y> 5 Years
inancial Assets $’000 $Equivalents 63 678 678
46 253 183 6 90109 931 861 6 9
29.4 Maturity analysis of financial assets and liabilities
2012 ears ’000
- FCash and Cash
$’00063
$’000-
Receivables 31 4 8 166Total Financial Assets 94 04 8 166 Financial Liabilities Payables 51 585 46 852 4 733 -
ities 51 585 46 852 4 733 -Total Financial Liabil
2011 Carryingamount
1 – 5 Yea
> 5
inancial Assets $’000 $’000 $’000 $’000-
53 456 36 137 8 058 9 261otal Financial Assets 105 511 88 192 8 058 9 261
< 1 Yearrs
Years
FCash and Cash Equivalents 52 055 52 055 - Receivables T Financial Liabilities Payables 53 710 48 680 5 030 -
285285
Borrowings 285 - - Total Financial Liabilities 53 995 48 680 5 030 Matu ty analysis of receivables and payables excludes statutorpayables.
ri y receivables and payables such as GST receivables and

Annual Report 2011-12 173
quidity risk arises where the Department is unable to meet its financial obligations as the he nt is funded principally from appropriation by the SA G t. The De ent of
ry and Finance to determine the cash flows associated wi program of d to enthrough the SA Government budgetary process t the expected cash flows. Th settle
days from the date of the invoice or the date the invoice is first received.
nt considers its liquidity risk is minimal based on pas ence and current assessment of risk.
he carrying amount of financial liabilities shown at note 29.1 represent the Department’s maximum exposure t financial
arket risk for the Department is primarily through interest rate risk. Exposure to interest rate risk may arise through interest including borrowings. The Department’s interest bearing liabilities a d through SAFA and an
ent in interest rates are monitored on a daily basis. Any e foreign man SAFA
analysis
nalysis has not been undertaken for the interest rate e Depart it has been ned that the nd loss or total equity from fluctuations in interest rates is immaterial.
contractual commitments
l commitments
2012 2$’000
l report, are as follows: ithin one year 5 678 55 998
capital commitments 5 678 55 998
29.5 Liquidity Risk
Li y are due to be settled. Tworks with t artmDepartme
Treasuovernmenth its Government
partment approved
he Depwork an sure
funding is provided to mee e Department s undisputed accounts within 30 The Departme t experi T oliabilities.
29.6 Market Risk
Mbearing liabilities,movem
re manage currency risks is
y . xposure to aged by
29.7 Sensitivity disclosure
A sensitivity a risk of th ment as determipossible impact on profit a
30 Unrecognised
30.1 Capita
$’000
Capital expenditure contracted at the reporting date, but not recognised as liabilities in he financia
011
tWTotal Included in capital expenditure commitments above is $0.510m (2011: $5.09m) which is the GST component of the capital expenditure commitments.
30.2 Operating lease commitments
Commitments in relation to operating leases contracted for at the reporting date but not recognised as liabilities in the financial report, are payable as follows:
2012 $’000
2011$’000
Within one year 11 274 18 014Later than one year but not later than five years 36 431 51 350Later than five years 30 351 39 692Total operating lease commitments 78 056 109 056 Included in the operating lease commitments above is $7.096m (2011: $9.91m) which is the GST component of the operating lease payments. The Department has many lease agreements. These leases are for administrative purposes and vary in length. Lease payments are monthly and predominantly paid in advance. Some lease agreements have renewal options for a determined period, exercisable by both the lessor and lessee.

Department for Communities and Social Inclusion 174
tions
31 Transferred func
Transferred functions for 2011-12
31.1 Transfers out of the Department
ote 1.2 Administrative Restructures details the transfers out of the Department. They were: N Families SA effective 1 January 2012. (FSA)
Aged Care Assessment Team effective 1 January 2012 (ACAT) Ageing and Policy effective 1 January 2012 (AGEING) Employees in relation to Urban Renewal Authority effective 1 April 2012. (URA)
nd liabilities were transferred out of the Department during 2011-12
$’000
301 - - - 301
The following assets a FSA ACAT AGEING URA Total $’000 $’000 $’000 $’000
urrent assets CCash Receivables 2 523 - - - 2 523Total current assets 2 824 - - - 2 824 Non urrent assets
-c
149 - - - 14940 996 - - - 40 996
apital works in progress 32 - - - 6 618 - - -
- - 47 795
Receivables Property, plant and equipment CIntangible assets
326 618
Total non-current assets 47 795 - Total assets 50 619 - - - 50 619 Current Liabilities Payables 10 843 58 26 107 11 034
mployee Benefits E 13 123 432 188 812 14 5552 866 - - - 2 866
curren 26 832 490 214 919 2Provisions Total t liabilities 8 455 Non-current Liabilities Payables 1 185
56 23 112 1 376
ts 13 568 642 26 1 277 285 - -
8 752 - - 23 790 698 28 1 389
Employee Benefi 3 15 750Borrowings - 285Provisions - 8 752Total non-current liabilities 6 26 163 Total liabilities 50 622 1 188 500 2 308 54 618 Total net assets transferred (3) (1 188) (500) (2 308) (3 999)

Annual Report 2011-12 175
31.2 Transfers in to the Department
ote 1.2 Administrative Restructures details the transfers into the Department. They were: ecember 2011. (SIU)
Office for Women effective 1 January 2012. (OFW) uary 2012. (OFV)
es and Social Inclusion in 2011-12.
ts Liabilities Net Assets$’ $’0
ocial Inclusion Unit 2 (246 191
94 262 (th 11 388
537 659 223 85
ffice for Southern Suburbs - 67 (67)1 111 4 401 (3 290)
N Social Inclusion Unit effective 1 D Office for Volunteers effective 1 Jan Office for Youth effective 1 January 2012. (OFY)
A) Multicultural SA effective 1 January 2012. (MS Office for Northern Suburbs effective 1 January 2012. (OFN)
OFS) Office for Southern Suburbs effective 1 January 2012. (
pO ening balance for asset and liabilities transferred to the Department for Communiti
Asse 000 00 $’000S - 749 2 749)
55Office for Women for Volunteers Office 168)
Office for You (377)Multicultural SA
ffice for Northern Suburbs (122)
138OOTotal Detailed restructure note per buCommunities and Social Inclusi
siness unit for assets, liabili ense and rev ues transferred to the Department for on in 2011-12.
s transferred in for Social Inclusion Unit as at 1 December 2011
SIU Total$’000
es 2 449 2 449
Benefits 1ties 2 6
ties, exp en
Assets and liabilitie
urrent Liabiliti$’000
CPayables Employee 77 177Total current liabili 26 2 626 Non-current Liabilities Payables 11 11
112 112current liabilities 1
Employee Benefits Total non- 23 123 Total liabilities 2 749 2 749 Total net assets transferred (2 749) (2 749) Expense and revenue for Social Inclusion Unit for 2011-201
DPC DCSI ov Dec –
$’000 $’000 $’000s
Employee Costs 916 673 1 589Grant payments 2 452 412 2 864Supplies and Services 144 684 828Other 8 - 8Total Expenses 3 520 1 769 5 289
2. Jul – N Jun Total Expense
Income Grants and subsidies revenue 250 250 500Other Recoveries - 1 1Total Income 250 251 501 Net cost of providing services (3 270) (1 518) (4 788)

Department for Communities and Social Inclusion 176
Office for Women as at 1 January 2012.
OFW Total$’000 $’000
246 246246 246
Assets and liabilities transferred in for Current assets Cash Total current assets Total assets 246 246 Current Liabilities Payables
mployee Benefits es
10 10E 69 69Total current liabiliti 79 79 Non-current Liabilities
ts 1
Payables 9 9Employee Benefi 103 103Total non-current liabilities 12 112 Total liabilities 191 191 Total net assets transferred 55 55 Expense and revenue for Office for Women for 2011-2012.
AGD DCSI Jul – Dec Jan – J
$’000
7237
159ther 141 - 141
1 030 1 327 2 357
un Total $’000 $’000Expenses Employee Costs Grant payments
775 1 49886 93
Supplies and Services 466 625OTotal Expenses Income Grants and subsidies revenue 110
ther Recoveries 1 157 158111
6 116OTotal Income 163 274 Net cost of providing services (919) (1 164) (2 083)

Annual Report 2011-12 177
2.
ets ty, plant and equipment
ets
Assets and liabilities transferred in for Office for Volunteers as at 1 January 201 OFV Total $’000 $’000Non-current ass Proper 94 94Total non-current ass 94 94 Total assets 94 94 Current Liabilities Payables 10 10Employee Benefits 67 67Total current liabilities 77 77 Non-current Liabilities Payables 1 15 5Employee Benefits 170 170Total non-current liabilities 185 185 Total liabilities 262 262 Total net assets transferred (1 (168) 68) Expense and revenue for Office for Volunteers for 2011-2012.
35 1 4
otal Expenses 702 601 1 303
AGD DCSI Jul – Dec Jan – Jun Total $’000 $’000 $’000Expenses Employee Costs 251 267 518Grant payments 0 49 99Supplies and Services 79 169 248Other 12 - 12Depreciation 10 16 26T Income Other Recoveries 6 16 22Total Income 6 16 22 Net cost of providing services (696) (585) (1 281)

Department for Communities and Social Inclusion 178
Assets and liabilities transferred in for Office for Youth as at 1 January 2012. OFY Total $’000 $’000Non-current assets Property, plant and equipment 11 11Total non-current assets 11 11 Total assets 11 11 Current Liabilities Payables 13 13Employee Benefits 90 90Total current liabilities 1 103 03 Non-current Liabilities Payables 24 24Employee Benefits 261 261Total non-current liabilities 285 285 Total liabilities 388 388 Total net assets transferred (377) (377) Expense and revenue for Office for Youth for 2011-2012. AGD DCSI Jul – Dec Jan – Jun Total $’000 $’000 $’000Expenses Employee Costs 762 785 1
1 1
1 2
547Grant payments 553 257 810Supplies and Services 87 366 453Other 97 - 97Depreciation 1 1 2Total Expenses 500 409 3 909 Income Grants and subsidies revenue 10 1
revenue 2ther Recoveries 39 190 229
0 - 00Commonwealth 9 - 29O Total Income 168 190 358 Net cost of providing services (1 332) (2 219) (3 551)

Annual Report 2011-12 179
5 55 5
Assets and liabilities transferred in for Multicultural SA as at 1 January 2012. MSA Total $’000 $’000Current assets Receivables 37 37Total current assets 37 37 Total assets 5 537 37 Current Liabilities Payables 26 26Employee Benefits 1 177 77Total current liabilities 203 203 Non-current Liabilities Payables 37 37Employee Benefits 419 419Total non-current liabilities 456 456 Total liabilities 659 659 Total net assets transferred (122) (122) Expense and revenue for Multicultural SA for 2011-2012. AGD DCSI Jul – Dec Jan – Jun Total $’000 $’000 $’000Expenses Employee Costs 2 2
3
es 2 70 3 53 6 23
154 039 4 193Grant payments 154 832 986Supplies and Services 33 659 992Other 67 - 67Total Expens 8 0 8 Income
charges 1 848 1 218 3 066
77 71 8 1 3
Fees and Grants and subsidies revenue 22 - 22Other Recoveries 2 1 73Total Income 72 989 861 Net cost of providing services (836) (1 541 (2 377))

Department for Communities and Social Inclusion 180
uary 2012.
Assets and liabilities transferred in for Office for Northern Suburbs as at 1 Jan OFN Total $’000 $’000Current assets Receivables 1 1Total current assets 1 1 Non-current assets
roperty, plant and equipment 222 222ssets 222 222
P Total non-current a Total assets 223 223 Current Liabilities
5 5Benefits
Payables Employee 35 35Provisions 6 6Total current liabilities 46 46 Non-current Liabilities
ayables 2 2
rovisions 19 1939 39
P Employee Benefits 18 18PTotal non-current liabilities Total liabilities 85 85 Total net assets transferred 138 138 Expense and revenue for Office for Northern Suburbs for 2011-2012.
D DJul – D Jan – Ju To
xpenses Costs 216 203 419
6 12
s
PLG CSI ec n tal $’000 $’000 $’000E Employee Grant payments - 88 88Supplies and Services 58 4 22Depreciation 0 - 20Total Expense 294 355 649 Income Appropriation from SA Government 238 - 238Grants and subsidies revenue - 56 56Other Recoveries - 17 17Total Income 238 73 311 Net cost of providing services (56) (282) (338)
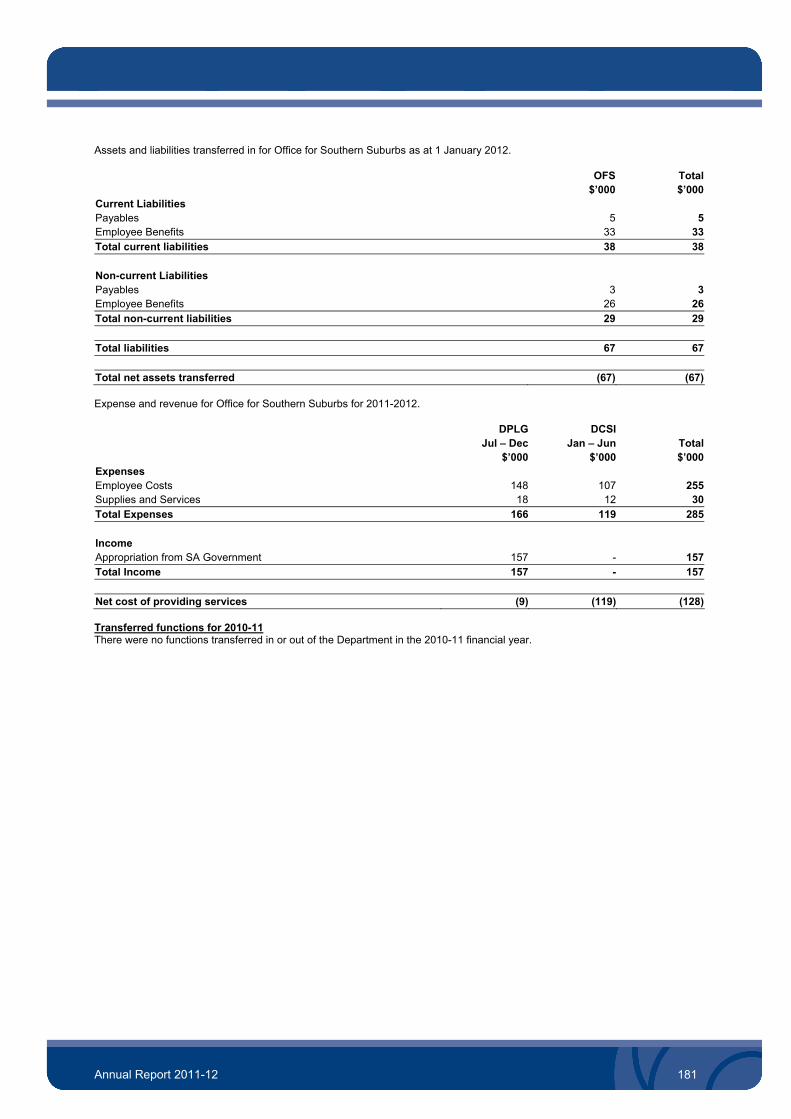
Annual Report 2011-12 181
3otal current liabilities 38 38
Assets and liabilities transferred in for Office for Southern Suburbs as at 1 January 2012. OFS Total $’000 $’000Current Liabilities Payables 5 5Employee Benefits 33 3T Non-current Liabilities Payables 3 3Employee Benefits 2 26
nt liabilities 6
Total non-curre 29 29 Total liabilities 67 67 Total net assets transferred ( (67) 67) Expense and revenue for Office for Southern Suburbs for 2011-2012.
DPLG DCSJul – Dec Jan – J Tot
$’000 $’ $’0
148 218
166 2
I un al 000 00Expenses Employee Costs
upplies and Services 107 12
5530S
Total Expenses 119 85 Income
ppropriation from SA Governm
- A ent 157157 - 157
157Total Income Net cost of providing services (128)(9) (119) Transferred functions for 2010-11
no functions transferred in or out of the Department in the 2010-11 financial y . There were ear

Department for Communities and Social Inclusion 182
he Department is not aware of any contingent assets or liabilities.
onciliation
2012 20$’000 $’0
d cash equivalents at the end of the reporting period:
63 678 52 05ial Position 63 678 52 0
32 Contingent assets and liabilities
T
33 Cash flow rec
11
econciliation of cash an00
R
of Cash Flows Statement 5Statement of Financ 55
Reconciliation of net cash provided by/(used in) operating activities to net cost
ices:
d by/(used in) operating activities 60 738 (5 7(1 110 680) (1 181 17
nt agencies (10 991) (13 17 938 396
(1 042 995) (1 200 412)
of providing servNet cash provide 74)Less SA Government appropriation Less grants from SA Governme
1)863)
Payments to SA Government Add/less non cash items
epreciation (2 (3mortisation (1 748) (
sets (20) -isposal of non-current assets 628
3 897 debts (451)
IP adjustment - 99ed in for administrative restructures 3 863 -
tructures (51 661)
ets and liabilities (6 192) 1 11
provisions 8 562 4 9714 480 5 740
ecrease/(increase) in employee benefits 17 647 842ecrease/(increase) in other liabilities (33) (1)et cost of providing services (1 066 986) (1 179 748)
D 974) 076)A 2 379)Donated AsGain/(loss) from d (1)Revaluation increments -Bad and doubtful (82)WTransferrTransferred out for administrative res -
hanges in ass
CIncrease/(decrease) in receivablesncrease/(decrease) in inventories
4 586(35)I
Decrease/(increase) in payables and Non-current assets accrued in payables DDN

Annual Report 2011-12 183
ittee members
that have been created to assist the Department in meeting objectives. In addition, there are committees that have been created by the Minister. Where any of the members are
are required under the Accounting Policy Frameworks issued by the Department of Treasury Fi
ll members of the Board/Committees, including those who may have resigned or their term had expired during the financial ar, are listed below:
lfare Fund Board (Community Benefit SA)
Member shworth, Letitia Member
mmittee *
Member Member Member
hna Chair anne Elizabeth Member
cola Member ber
Member dy) Member
mber ber
tewart, Nigel Member Member
Member Member Member Member Member
etzel, Diana Margaret Chair anning, Thomas (Thom) Member
Mazel, Joslene Member Rahman, Kiara Member Rozee, Emily Member Saunders, Nerida Michelle Member Schrapel, Simon Member Slee, Phillip Thomas Member Swan, David Member
Ministerial Advisory Board on Ageing **
Caudrey, David Ex Officio Coventry, Kenneth John Member Crowley, Rosemary Anne Chair Greethead, Patricia Lesley Member Hugo, Graeme John Member Lewis, Lawrence Member McEwen, Gerard Member Mickan, Patricia Kaye Member Rigney, Janice Dorothy Member Strathearn, Graham Robert Member Tripp, Marjorie Anne (Marj) Member Vukovich, Dana Member
34 Remuneration of board and comm
There are various committees, forums, groups, panels and councils itsremunerated, certain disclosures
nd nance. a Aye
Charitable and Social We
Andrews, Declan Jonathan ABirch, Christina Pauline Member Jones, Michelle Lee-Anne Member Storkey, Gary David Chair
Child Death and Serious Inju
yard, Roger William
ry Review Co
BCox, Daniel Davis, Angela Marie Eszenyi, DympGursansky, DiHarvey, Janine NiHasani, Michelle Mem
Member Hetzel, Diana Margaret Jennings, Barry John Miller, Sandra Anne (SanOsborn, Thomas Ian Member Papillo, Michelle MeShen, Dana Tung-choi MemSTiffin, Barbara Dorothy
Council for the Care of Children *
Bartley, Keith James Chapman, Barbara (Jane) Colmer, Kaye Cooper, Jane Mulcaster Edmonds, Angelique HM

Department for Communities and Social Inclusion 184
d Ex Officio aniels-Mayes, Sheelagh Member
th Chair alaitzidi, Evdokia Member impton, Kyra Member
l-Khafaji, Mohammad Co-Chairperson
h ha (Anu)
, Katrina Lea
eitz, Christine Member
nt and Audit Committee
July 2011, deceased 30 Oct 2011
on
Minister’s Disability Advisory Council
Abdi, Siyat Member Annear, Katharine Elisabeth Deputy Chair Beard, Jacqueline Elise Member Caudrey, DaviDGant, Silvana Member Hallahan, Lorna ElizabeKKLillecrap, Neil Member Mellis, Gaelle Member Oldfield, Wayne Member Taggart, Michael John Member
Minister’s Youth Council ***
AAttwood, Cassandra Member De Cure, Henry Member Elsayed, Sarah Member Fitzgerald, Pa Member ul Gillett, Emma Member Hanley, Kye Member Hensman, Lulu Member Kimm, Lauren Member Leong, Noby Member Lim, Nai Heak Co-Chairperson Manning, Thomas (Thom) Member
rances Morphett, Georgina F Member Moulds, Emma Jane Member Thompson, Michael Member Wallace, Ruth Member Whitington, Catherine Member
Premier’s Council for Women ***
Adair, Alison Frances Member Aston, Eunice Elizabeth Member
Rosalie Edwards, Anne Co-Chairperson Gould, Kate Je Co-Chairperson an Haebich, Elizabeth Anne Member Hagias-Tramontin, Ma Member riaHayes, Anne-Marie Member
Anne Hildyard, Katrine Member Jensen, Elizabet Member Mundkur, Anurad Member Romeo, Sonia Member Saunders, Nerida Member Michelle Silva, Miriam Member Stock, Louise Kathryn Member Webb-Dennis Member Z
Risk Manageme
Agars, Peter Member 1Bull, Peter Member Evans, Michael JB Member Lamshed, Geoff Member Patetsos, Mary ChairpersRantanen, Nicolle Member Sneddon, Yvonne Member Young, Lynn Member

Annual Report 2011-12 185
ic Affairs Commission ***
niela Valentina
hairperson on
r us
an
kalban, Malgorzata (Gosia) Member otino, Domenico Member
nd
ica Margaret
seph n Kay
na Nella
cilities Adviso
ember (Duke) ane)
cNamara, Mariann Rose Member Deputy Member (Petrys) Deputy Member (Nikolettos)
eth
ember (Whitington) ember (Wright)
p on Voluntee
ert
zett, Sabah Member Member
Edward sel Alice
y) on Lynette
an
Kennett
South Australian Multicultural and Ethn
Conesa, Da Member Dieu, Michelle (Swee Ming) Member Drapac, Vesna Member King, Branka Member Kritas, Stamatiki Deputy CLe, Hieu Van ChairpersMadan, Vikram MembeMasika, Joseph Juli Member Nowak, Teresa Member Ppiros, Peter Member Schueler, Norm Member Silva, Miriam Member Skaka, Sumeja Member ST
State Emergency Relief Fu
Chooi, Angela Member Faggotter, Veron Member Goldsworthy, Sherree Member Grear, Barry Jo Chair Lamont, Hele Member Nechvoglod, Rai Member
Supported Residential Fa ry Committee
Armstrong, Alister Lyndon Member rol Bouwens, (Sheila) Ca Deputy M
Chapman, Barbara (J Chair hn Duke, Kevin Jo Member
Fox, Shaunee Member itchin, Neville Member K
MMegaw, Anne Moat, Kirin Nikolettos, Paul Member Petrys, Debra Member Richardson, Penelope Member Ryan, Paula Elizab Member Whitington, Susan Member Whittaker, Jillian Yvonne Deputy MWigg, Carolyn Ann Deputy MWright, Helen Member
Ministerial Advisory Grou ring ***
a Cream, Claudi Member Feszczak, Michael Egb Member Gillett, Emma Member
ard Haren, John Ger Member eath, Georgia Member H
IzKatsambis, Con Larsen, Sophie Member Mitchell, David Member O’Dwyer, Li Member O’Loughlin, Evelyn Member Priccolo, Antonio (Ton ChairpersSutherland, Jan Member Thorley, Wayne Bri Member Weiser, Sonya Member Whitfield, Mark Member

Department for Communities and Social Inclusion 186
evelopment as at 1 January 2012 t 1 January 2012
DCSI from the ent as at 1 January 2012
ay or may not have atten mittee meeting during the financial year.
ived, or due to be receiva $0.160 million (2011: $0.120 million).
s whose income fro y falls within the following bands is:
2012 No. of Members
2011No. of Members
51 4196 512 2
149 94
* Finances transferred to the Department for Education and Child D** Finances transferred to the Department for Health and Ageing as a*** Finances transferred to Attorney-General’s Departm
d mDeputies liste ded a com Total income rece ble by Members was The number of Member m the entit
$0 $1 - $9 999 $10 000 - $19 999 Total In accordance with Department of the Premier and Cabinet Circular No.16, government employees did not receive any
r board, committee or forum duties during the financial year.
to super funds or otherwise in connection with the retirement of members were 0.010million).
o loans were m the reporting date, no outstanding loans exist with Members.
nless otherwise disclosed, transactions between related parties are on conditions no more favourable than those which it is ing with the related party at arm’s length in the same circumstances.
date
ernment announced it y Safety Directorate which will be a ent for Commun ocial Inclusion. The Directorate will provide strategic advice and high level
onal S mergency Services and Road Safety, and oversee the development and of policy. A Project Team h stablished to determine the best model for the authority.
tered items
penditures, assets and lia but not controlled by the Department have not been ancial statements. These red transactions and balances are regarded as significant in relation to the
cordance with APF II, General Purpose Financial Reporting Framework, dministered financi to the accounts have been prepared.
are Sector Rep
1997 (the Act) provides ing of aged care services. Persons who are approved provide aged care service n be eligible to receive subsidy payments in respect of the
re they provide to approved care recipients.
epare an audited General Purpose Financial Report (GPFR) for the nd Northgate.
r the regulated reflect an allocation of the Department’s Income, Expenses, , as recorded in the D regulated activities. The financial statements sing the Department ng policies described in Note 2.
arr Services (JFS) was a d provider of residential aged care (RAC) with 62 places licensed by the nt of Health and ffective 1 July 2007, the Governor proclaimed the dissolution of Julia Farr
ies vested in or held by Julia Farr Services were transferred or assigned to or vested in, the rtain assets held b er Julia Farr Services are subject to the terms and conditions of the Home
nd the Minister for Di been appointed as trustee. The trust assets are administered but not ent, hence they a d in the accounts of the Department.
sability Services C SC) was also an approved provider of residential aged care with 32 places nwealth Departmen and Ageing. On 29 June 2006 the Governor proclaimed to dissolve IDSC
s to the governan ments within the South Australian Government with respect to the sion of disability services. Effective 1 July 2006, the Board of IDSC dissolved and the assets and
bilities of IDSC were transferred, assigned or were vested in the Minister for Disability.
remuneration fo
epartment Benefits given by the D annuation $$0.010 million (2011:
During the financial year, n ade to Members. At Ureasonable to expect the entity would have adopted if deal
35 Events after balan
intends to establish a Communit
ce
On 13 August 2012 the GovepartmDirectorate of the D ities and S
ross Police, Correctico-ordination ac ervices, Eimplementation as been e
36 Adminis
The revenues, ex bilities tha fin
t were administeredincluded in the administeDepartment’s overall financial performance and in acseparate consolidated a al statements and notes
37 Residential Aged C orting
The Aged Care Act for the regulation and fundunder the Act to s (approved providers) caca In accordance with the Act, the Department must pr
are facilities provided at Hresidential aged c ighgate a The financial statements fo aged care services Assets and Lia epartment’s financial records, to the bilities
red uhave been prepa ’s accounti The former Julia F n approveCommonwealth Departme Ageing. EServices and all assets and liabilit
. CeMinister for Disability y the form afor Incurables Trust sability has
controlled by the Departm re not include The former Intellectual Di ouncil (IDlicensed by the t of HealthCommoin association with reform ce arrange
anagement of the provimlia

Annual Report 2011-12 187
A
Non- Highgate Northgate Residential
Aged Care
Disability SADisability
Ser
NAPS ID*: 1021 RACS ID**: 6402 6203
$’000 $’000 $’000 $’0
yee benefit expenses 4 269 3 374 5 037 432 6upplies and services 2 831 1 210 218 040 222 081
4 722787 888
- - 27 259 27 2594 630
ST TEMENT OF COMPREHENSIVE INCOME
for the year ended 30 June 2012
Residential Aged Care
vices SA
3051
Total
00Expenses Emplo 42 80SDepreciation and amortisation 1 143 4 578 Grants, subsidies and client payments - - 787 888
ther expenses OTotal expenses 7 101 4 727 1 462 802 1 47 Income Rent, fees and charges 1 154 720 130 860 132 734
185
er - - 7 066 7 066407 644
Commonwealth revenues 1 452 1 740 263 993 267 Interest revenues - - 31 31
et gain/(loss) from disposal of non-current assets - - 628 628NOth revenues Total income 2 606 2 460 402 578 Net cost of providing services (4 495) (2 267) (1 060 224) (1 066 986)
Revenues from/(payments to) SA Government
- - 1 110 680 1 110 68091
)33
SA Government appropriation Grants from SA Government agencies - - 10 991 10 9Payments to SA Government - - (17 938) (17 938Total revenues from/(payments to) SA Government - - 1 103 733 1 103 7 Net result (4 495) (2 267) 43 509 36 747 * National Approved Provider System (NAPS) ** Residential Aged Care Service (RACS)
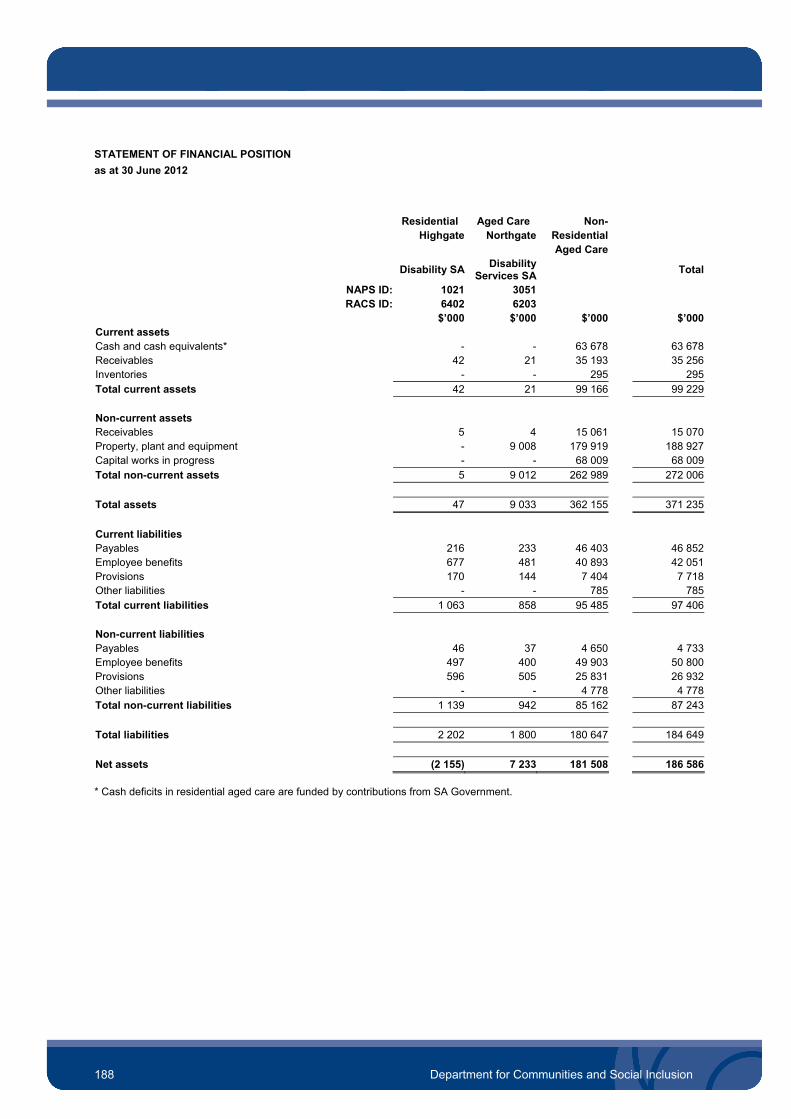
Department for Communities and Social Inclusion 188
ets
4 2
STATEMENT OF FINANCIAL POSITION
as at 30 June 2012
Residential Aged Care Non- Highgate Northgate Residential Aged Care
Disability SADisability
Services SA Total
NAPS ID: 1021 3051 RACS ID: 6402 6203 $’000 $’000 $’000 $’000Current ass Cash and cash equivalents* - - 63 678 63 678Receivables 42 21 35 193 35 256Inventories - - 295 295Total current assets 2 1 99 166 99 229 Non-current assets Receivables 5 4 15 061 15 070
nd equipment - 9 008 179 919 188 927
Property, plant a Capital works in progress - - 68 009 68 009Total non-current assets 5 9 012 262 989 272 006 Total assets 4 9 03 362 3717 3 155 235
Current liabilities
ayables 216 233 46 403 46 852
rovisions 170 144 7 404 7 718- - 785 785
1 06 85
P Employee benefits 677 481 40 893 42 051P Other liabilities Total current liabilities 3 8 95 485 97 406 Non-current liabilities Payables 4 3
mployee benefits 497 400 49 903 50 800
ther liabilities - - 4 778 4 7781 139 942 85 162 87 243
6 7 4 650 4 733E Provisions 596 505 25 831 26 932OTotal non-current liabilities Total liabilities 2 202 1 800 180 647 184 649 Net assets (2 155) 7 233 181 508 186 586
* Cash deficits in residential aged care are funded by contributions from SA Government.

Annual Report 2011-12 189
ME
0 June 2011
4 18 3 05 4 4
services 2 4 9 2 2 and amortisation 14 5 5
client payments 8 8et gain/(loss) from disposal of non-current assets - - 1 1
- - 82 82 6 60 4 14 1 5 1 5
STATEMENT OF COMPREHENSIVE INCO
for the year ended 3
Residential Aged Care Non- Highgate Northgate Residential Aged Care
Disability SADisability
Services SA Total
NAPS ID: 1021 3051 RACS ID: 6402 6203 $’000 $’000 $’000 $’000Expenses Employee benefit expenses 5 3 55 363 62 601Supplies and 22 49 18 894 22 265Depreciation 1 3 311 455Grants, subsidies and - - 54 760 54 760N Other expenses Total expenses 8 5 34 411 45 164 Income
1 17ommonwealth revenues 1 399 1 723 232 040 235 162
es ther revenues - - 4 837 4 837
2 577 2 437 360 402 365 416
Rent, fees and charges 8 714 123 471 125 363C Interest revenu - - 54 54O Total income Net cost of providing services (4 (1 (1 1 (1 1031) 708) 74 009) 79 748)
Revenues from/(payments to) SA Government
tion 1 1 1 1rants from SA Government agencies - - 13 863 13 863
ent - - (396 (396)nues from/(payments to) SA Government 1 19 1 19
SA Government appropria - - 81 171 81 171G Payments to SA Governm ) Total reve - - 4 638 4 638 Net result (4 (1 031) 708) 20 629 14 890

Department for Communities and Social Inclusion 190
N R
ets
2 1
STATEMENT OF FINANCIAL POSITION
as at 30 June 2011
Residential Aged Care Non- Highgate Northgate Residential Aged Care
Disability SADisability
Services SA Total
APS ID: 1021 3051 ACS ID: 6402 6203 $’000 $’000 $’000 $’000Current assCash and cash equivalents* - - 52 055 52 055Receivables 27 17 39 606 39 650Inventories - - 284 284Total current assets 7 7 91 945 91 989 Non-current assets
roperty, plant and equipment - 10 102 273 785 283 887
orks in progress - - 18 240 18 240 1
Receivables 7 5 17 307 17 319P Capital w Intangible assets - - 6 309 6 309Total non-current assets 7 0 107 315 641 325 755 Total assets 3 10 12 40 414 4 7 586 7 744
Current liabilities
mployee benefits 562 388 52 854 53 804
132 97 9 775 10 004 90 62 1 1
Payables 210 140 48 330 48 680E Provisions Other liabilities - - 752 752Total current liabilities 4 5 11 711 13 240 Non-current liabilities Payables 45 34 4 951 5 030
nefits orrowings - - 285 285
Provisions 413 305 30 365 31 083Other liabilities - - 5 415 5 415Total non-current liabilities 963 725 96 819 98 507
Employee be 505 386 55 803 56 694B
Total liabilities 1 867 1 350 208 530 211 747 Net assets (1 833) 8 774 199 056 205 997
* Cash deficits in residential aged care are funded by contributions from SA Government.

Annual Report 2011-12 191
SOCIAL INCLUSION
MINISTERED COMPREHENSIVE INCOME
r the year ended 30 June 2012
Note 2012 2011 $’000
dministered expenses Employee benefit expenses 294 Supplies and services 1 374 1 269Gain/(Loss) on revaluation of investment p 1 374
amortisation expense client payments A5 162 514 154 569ments A4 13
ministered expenses 179 1
DEPARTMENT FOR COMMUNITIES AND
STATEMENT OF AD
fo
$’000 A
246
roperty -
761 Depreciation and Grants, s
761 ubsidies and
Client Trust Fund pay 514 12 572 Total ad 831 69 417 Administered income
butions 10 354 10 616 rent, fees and charges 1 022 441
ts A4 1
inistered income 25 2
Grants and contri Revenue from Interest revenues Client Trust Fund receip
911 9263 270 13 008
Other Income 372 112 Total adm 929 5 103 Net cost of providing services (153 902) (144 314)
Revenues from/(pa SA Governm
yments to) SA Government ent appropriation 160 000 151 492
Government under Cash Alignment Policy A6 (8 ues from/(payments to) SA Gove ment 151 1
Payment to SA Total reven
060) (7 556)rn 940 43 936
Net result (1 962) (378)
Other comprehensive i Revaluation surp
ncome lus (4 016)
comprehensive income (4 -
Total other 016) - Total comprehensive result (5 978) (378) The above statement should be r
ead in conjunction wi the accompanyingth notes.

Department for Communities and Social Inclusion 192
ets 61 53
6 53 82
DEPARTMENT FOR COMMUNITIES AND SOCIAL INCLUSION
STATEMENT OF ADMINISTERED FINANCIAL POSITION
as at 30 June 2012
Note 2012 2011 $’000 $’000Administered current ass Cash and cash equivalents 676 220 Receivables 294 600 Total current assets 1 970 0 Admin
t A9.2
otal non-current assets 32 548 38 699
istered non-current assets Property, plant and equipmen A9.1 31 328 36 105 Investment property 1 220 2 594 T Total assets 94 518 92 519
Administered current liabilities
Payables
14 704 6 905 Overdraft 23 21 Total current liabilities 14 727 6 926 Total liabilities 14 727 6 926
Net assets 79 791 85 593
Admin
ained earnings 55 391aluation surplus 3
otal e uity 79 791 85 593
istered equity Ret Rev
53 60526 186
0 202
T q
The ab be read in conjunction with the accompanying notes. ove statement should

Annual Report 2011-12 193
0 June 2012
Asset Revaluation ai
Surplus Earnings Total$’000 $ 00
alanc 10 30 202 85N - ( 8)
DEPARTMENT FOR COMMUNITIES AND SOCIAL INCLUSION
STATEMENT OF ADMINISTERED CHANGES IN EQUITY
for the year ended 3
Ret ned ’0 $’000B e at 30 June 20 55 769 971 et result for 2010-11 37 (378)Total c mprehensive result for 2010-11 - (378) (378)o Balanc 30 202 e at 30 June 2011 55 391 85 593 N - (1 et result for 2011-12 962) (1 962) G roperty, plant and equipment during 2011-12 (4 016) -
otal c mprehensive result for 2011-12 (4 016) (5 978)ain/(loss) on revaluation of p (4 016)
T o (1 962) Transactions with SA Government as owner Net assets received from an administrative restructure - 76 176
26 186 79 7911
Balance at 30 June 2012 53 605
The ab ead in conjunction with the accompanying notes. ove statement should be r

Department for Communities and Social Inclusion 194
2012 2011 flow Inflows flow (Outfl Note $’000
g activities as
(7Employee benefit payments (292) (265)
0 267) (1ubsidies and client payments 4 311) (
3 514) ( (10) (177 955) (175
DEPARTMENT FOR COMMUNITIES AND SOCIAL INCLUSION
STATEMENT OF ADMINISTERED CASH FLOWS
for the year ended 30 June 2012
In s (Out s) ows) $’000Cash flows from operatin C h outflows Payments to SA Government (8 060) 556) Concessions (13 27 346) Payments of grants, s (2 26 191) Payments for supplies and services (1 501) (1 108) Client Trust Fund payments (1
12 572)
(2) Other payments Cash used in operations 040)Cash inflows Receipts from SA Government 151 492
1 025 330Grants and contributions 10 631 11 265Interest received 949 915
Client Trust Fund receipts 13 270 13 008 Other receipts 370 75 Cash generated from operations 186 245 177 085
160 000 Rent, fees and charges
Net cash provided by operating activities A11 8 290 2 045
Cash flows from financing activities Cash outflows Cash overdraft - 1 Cash used in financing activities - 1Cash inflows Cash from Administrative Restructure 166 - Cash generated from financing activities 166 -Cash provided by financing activities 166 1
Net increase in cash and cash equivalents 8 456 2 046Cash and cash equivalents at the beginning of the period 53 220 51 174Cash and cash equivalents at the end of the period A11 61 676 53 220 The above statement should be read in conjunction with the accompanying notes.

Annual Report 2011-12 195
S AND SOCIAL INCLUSION
DMINISTERED EXPENSES AND INCOME
for the year ended 30 June 2012
Gamblers
Rehabilitation
Community Benefit SA Program
Home for Incurables
Trust
Supported Residential Facilities Indemnity
Fund
Client Trust Accounts
Minister’s Salary
Concessions Community
Service State
Emergency Relief Fund
Duke of Edinburgh
st Total
2012 2012 2012 2012 20 2012 012 2012 2012
$’000 $’000 $’000 $’000 $’00 $’000 000 $’000 $’000
dminister expenses
Emplo e benefit expenses - 9 - - 279 - 6 294
853 162 315 - - - 42 1 374
- - 1 374 - - - - - - - 1 374
- - 761 - - - - - - - 761
5 814 775 414 - - 138 308 - 162 514
Client - - - - 13 5 - - - 13 514
Total 6 667 946 2 864 - 13 5 279 138 308 48 179 831
DEPARTMENT FOR COMMUNITIE
SCHEDULE OF A
Obligations Tru
12 2012 2 2012
0 $’000
$’ $’000
A ed
ye
ies
-
-
-
2
-
-Suppl and services
Revaluation of investment property
rtisation expense Depreciation and amo
Grants, subsidies and client payments
Trust Fund payments
- 203
-
17 -
- 14
administered expenses 14 205 17 -
Administer
Grants - - 277 - - 10 354
Reve 491 - - - 50 1 022
Intere - 369 1 5 - - - 911
Client - - - - 13 2 - - - 13 270
Other 310 - - 2 - - - 60 372
Total 6 179 4 151 860 3 13 7 277 5 - 3 110 25 929
ed income
and contributions 5 845 4 000
151
- 232 -
nue from rent, fees and charges -
st revenues 24
-
14
330
-
-
3
Trust Fund receipts 70 - -
income
administered income
-
84
-
62
Net cost of providing services (488) 3 205 (2 004) 3 2 (2) (137 643) (17 308) 3 62 (153 902)70
Revenues
SA G - - - - - 14 308 - - 160 000
PaymAlignm
- - - - - - - (8 060)
Total r ) SA Gover
- - - - - 134 6 308 - - 151 940
from/(payments to) SA Government
overnment appropriation - 2 692 17
ent to SA Government under Cash ent Policy
- (8 060) -
evenues from/(payments tonment
- 32 17
Net result (488) 3 205 (2 004) 3 2 (2) (3 0 - 3 62 (1 962)70 11)
DEPARTMENT FOR FAMILIES AND COMMUNITIES (2012 – DEPARTMENT FOR COMMUNITIES AND SOCI INCLUSION)
EDULE OF ADMINISTERED EXPENSES AND INCOME
for the year ended 30 June 2011
Gamblers Community Benefit SA
ogram
Home for Incurables
Trust
Supported Residential Facilities Indemnity
Fund
Client TrusAccounts
Minister’s Salary
Concessions State
Emergency Relief Fund
Du f Edinburgh
st Total
2011 2011 20 2011 2011 2011 2011 2011 2011
$’000 $’000 $’00 $’000 $’0 000 $’000 $’000 $’000
Em oyee benefit expenses - 7 1 - 238 - - - - 246
180 27 - - - - 1 269
- 761 - - - - - - - 761
402 - - 500 - 154 569
- - 12 5 - - - 12 572
1 191 - 1 238 500 - 169 417
AL
SCH
Rehabilitation
Pr
t
CommunityService
Obligations
ke o
Tru
2011 2011
00 $’000
11
$’0
Administered expenses
0 00
$’
pl -
Supplies and services 1 059
Depreciation and amortisation expense -
- 3
-
Grants, subsidies and client payments 5 394 3 795
Client Trust Fund payments - -
-
72
128 478
-
16 -
-
Total administered expenses 6 453 3 982 2 572 128 481 16 -
Administered income
Grants and contributions 5 845 4 000 - -
- 257 514 - - - 10 616
Revenue from rent, fees and charges 74 39 328 - - - - - - - 441
Interest revenues 28 - 380 1 514 - - - 3 - 926
Client Trust Fund receipts - - - - 13 008 - - - - - 13 008
Other income 110 - - 2 - - - - - - 112
Total administered income 6 057 4 039 708 3 13 522 257 514 - 3 - 25 103
Net cost of providing services (396) 57 (483) 3 950 19 (127 967) (16 500) 3 - (144 314)
Revenues from/(payments to) SA Government
SA Government appropriation - - - - - - 134 573 16 919 - - 151 492
Payment to SA Government under Cash Alignment Policy
- - - - - - (7 556) - - - (7 556)
Total revenues from/(payments to) SA Government
- - - - - - 127 017 16 919 - - 143 936
Net result (396) 57 (483) 3 950 19 (950) 419 3 - (378)

Department for Communities and Social Inclusion 196
DEPARTMENT FOR COMMUNITI
NOTES TO ADMINISTERED ITEMS
for the year ended 30 June 2012
1 Background
The revenues, expenditures, assets and liabilities that were administered but not controlled by the Department have not been ded in the fin cial statements of t part . These administered transactions and balance reg as
rtment ce and in accordance w F II, ral Purpose n amework, separate consolidated adminis d financial state ents and notes to the accounts have been
re
2
h pertaining to th iniste item the Departmen ontain n N umm f Significant c unting Policies for the Department.
3 stered Items
a tion o enefit SA Program o rust*
l Facilities Indemn und
oo s ta
gh Trust **
Effective 1 July 2007, the Minister for Disability became the trustee of the Home for Incurables Trust by virtue of the vesting of ssets and liabilities of the former Julia Farr Services. Separate financial information pertaining to the Home for Incurables Trust in Note A14. Unde
Gener Communities and Social Inclusion. A transferred into the Department for Communities and Social Inclusion as at 1 Januar
A4 Client Trust Accounts
he D partment for Communities l n ru li ac , c h Intellectual Disability Services Council Incorporated (IDSC) nd th r Julia Farr Services (JFS). The balance of t t
was $11.554m (20 11.28 ese amounts cannot be used by epar t to achieve , and accordingly are clud the c lled f ial st ents.
2012 $’000
’000
pen 4 10 334dd 13 522ess xpenses (13 514) (12 572)
une 11 554 11 284
ES AND SOCIAL INCLUSION
FINANCIAL STATEMENTS
A
inclu an he De’s overall fin
mentancial performan
s are Gene
ardedsignificant in relation to the Depa ith APFi ancial Reporting Fr tere mp pared.
A Accounting Policies
T e accounting policies e adm red s for t are c ed i ote 2 S ary oA co
A Programs of Admini
G mblers RehabilitaC mmunity BH me for Incurables TSupported Residentia
li t Trust Accountsity F
C enMinister’s Salary C ncessions C mmunity Service ObligationS te Emergency Relief Fund Duke of Edinbur * ais** r the Public Sector (Reorganisation of Public Sector Operations) Notice 2011, from 1 January 2012 the Attorney-
al’s Department transferred responsibility for the Administered Item – Duke of Edinburgh Trust to the Department forssets and liabilities relating to these business units were
y 2012.
T e and Socia Inclusio acts as ta
stee of ce forme
ent trust counts relating to lients of t e formerhe clien
trust accounts at 30 June 2012 11 $ 4m). Th the D tmenits own objectives not in ed in ontro inanc atem
2011
$
O ing Balance 1 July 11 28 A Receipts 13 784 L EClosing Balance 30 J
A5 es and client pay ts
am 5 814 394om
rust 4 402138 203 128 478
om ations 8 16 500ota lient Pay ts 162 514 154 569
Grants, subsidi men
G blers Rehabilitationunity Benefit SA Program
5C m 775 3 795Home for Incurables T 41 Conc ssions eC munity Service Oblig 17 30 T l Grants, Subsidies and C men Conc ssions
sewerage rates 34 859 28 815ouncil rates 32 951 32 834nergy 30 728 28 817ransport 31 758 30 729
Emergency services levy 6 909 6 551Other 998 732Total Concessions 138 203 128 478
eWater &CET

Annual Report 2011-12 197
2012 $’000
2011
$’000
oncessions (Cash Alignment Policy transfer) 8 060 7 556 Government 8 060 7 556
A6 Payments to SA Government
CTotal Payments to SA
A7 Consultancies
There were no consultants engaged in the 2010-11 and 2011-12 financial years.
A8 Unexpended funding commitments
he Department is engaged in a variety of funding programs involving State and Commonwealth sources who provide monies e that these funds are expended in a manner consistent with the terms of the program. As at
2012 $’000
2011
$’000
3 396 191782 969
of Highgate Building) 40 -4 218 1 160
Tto the Department on the premis30 June 2012, the Department had outstanding funding commitments to the following programs:
Community Benefits Program Gambler's Rehabilitation Fund
ire Upgrade Home for Incurables Trust (FTotal operating funding commitments Total unexpended funding commitments 4 218 1 160
A9 Property, plant and equipment
$’000 $’000
17 818 22 245 - (761)
105
A9.1 Property, plant and equipment
2012
2011
Land and buildings Site land (fair value) 13 510 14 621
uildings and improvements (fair value) BLess accumulated depreciation - buildings and improvements Total land and buildings 31 328 36 Reconciliation of Land and Buildings The following table shows the movement of land and buildings and improvements during 2011-12.
Site lands d ents Bu
Building anlmprovem
Total Land & ildings
$’000 $’000 $’000Carr ing amount at the beginning of the year
tion for the year y 14 621 21 484 36 105
- (761) (1 111) (
2 13 510 3
Depreciation and amortisa (761)Other movements – Revaluation
e 201(2 905) 4 016)
1Carrying amount at 30 Jun 17 818 328

Department for Communities and Social Inclusion 198
air Value at 30 June 786 925
A9.2 Investment property
2012
$’000
2011$’000
Investment building 925 925Revaluation decrement (139) -F
2012
$’000
2011$’000
1 669 1 669-
69
Investment land Revaluation decrement (1 235) Fair Value at 30 June 434 1 6 Total Investment Property at 30 June 1 220 2 594
A10 Transferred functions
-12
partment
Transferred functions for 2011 Transfer of Administered Item in to the De
nto the Department from Attorney-General’s Departmen ve January 2
n transfer the Department recognised the following assets and liabilities in 2011-12:
DET Total$’000 $’000
ash 166
14 180
* Duke of Edinburgh Trust (DET) transferred i
t effecti 1 012.
O Current assets C 166
14Receivables Total current assets 180
Total assets 180 180 Current Liabilities
mployee Benefits
4 otal current liabilities 4 4
E 4T Total liabilities 4 4 Total net assets transferred 176 176

Annual Report 2011-12 199
ributable to the Duke of Edinburgh Trust for 2011-12 were:
AGDJul – Dec – un
$’000 $ 00 $17 6 2 -
upplies and Services 81 42 123otal expenses 100 48
Total income and expenses att DCSI Total Jan JExpenses Employee Costs
’0 ’0002
23
Grant payments ST 148
- 50
85 60 85 10
Income Fees and charges 50Other Recoveries Total income
145195 1
Net cost of providing services (15) 62 47
A11 Cash flow reconciliation
2012 2011$’000 $’000
61 676 53 22061 676 53 220
Reconciliation of cash and cash equivalents – cash at year end as per:
Statement of Administered Cash Flows Statement of Administered Financial Position
Reconciliation of net cash provided by operating activities to net result:
d by operating activities 8 290
n cash items ortisation (761) (
y (1 374)
ets and liabilities ivables (306) (486)bles (7 799) (1 19
rative restructures (10) ities (2)
(1 962) (378)
Net cash provide 2 045
Add/Less no
Depreciation and amRevaluation of investment propert
761)-
hanges in assC(Decrease) in rece(Increase) in paya 5)Adjustment for administ(Increase) in other liabil
-2
Net result
A12 Administered continge
he Department has no administered
nt assets and liabilities
contingent assets and liabilities.
13 Supported Residential Facilities Indemnity Fund
2012 2011$’000 $’000
Opening Balance 1 July 34 31Add Receipts:
Fees – Councils ¹ 2 2Interest 1 1
Closing Balance 30 June 37 34
T
A
This note has been prepared to meet the requirements of section 56 (11) of the Supported Residential Facilities Act 1992 in reporting upon the operations of the Supported Residential Facilities Indemnity Fund. The note meets the specific requirements of the Act. ¹ Under the Supported Residential Facilities Act 1992, certain premises which provide residential accommodation are required to be licensed. That licence fee is payable to the local councils who monitor the residential accommodation. The Act requires the councils to remit 10 percent of fees collected for deposit in the Fund within 28 days after the end of the financial year in which the fees are received.

Department for Communities and Social Inclusion 200
s part of wide ranging reforms relating to the delivery of disability services by the Department, e 1 Jul Julia Fervices was dissolved and all assets and liabilities vested in or held by Julia Farr Services fe ned or
Minister for Disability. Certain assets held by the former Julia Farr Services to nd f the Home for Incurables Trust. The Original Trust was established in June 1879 a varied uprem
ber 1997.
a Farr Services was trustee of the Home for Incurables Trust and on disso n, the Boa f Julia Fa to resign as trustee of the Home for Incurables Trust. The Minister for Disabilit e trustee f e Home
he role of the Trust is “ …to apply property vested in it for the purpose of providing for persons whose ability to liveently is temporarily or permanently impaired or in jeopardy as a consequence of an acquire brain injury o
ogical condition or a physical condition resulting in disability including but not lim g in any e following services and facilities;
or them, in a variety of residential, centre and community based settings modation
service y support services
(iv) technical and personal support aids d recreational services
(vi) (vii) measures and services to enhance their quality of life;
s; and (c ary or in relation to the foregoing or by providing a se ices and
me.”
les Trust have been included in the administered ely disclosed in the following schedules in accordance with the governance
quirements of the Trust.
S Home for Incurables Trust fo
2012 2011 EES 315 2
sidies and client payments oss on revaluation of investment property 1 374 -
761 7612 864 1 191
A14 Home for Incurables Trust
A effectiv y 2007, arr Sve
were trans are subject
rred or assig the terms asted with the
conditions o nd was by the S e Court on 7 Novem The former Board of Juli lutio rd o rr Services resolvedncurables Trust.
y is th or th for I T independ d r degenerative neurol iting the foregoinway whatsoever, th
g f(a) by providin (i) accom (ii) nursing, medical, allied health and attendant care (iii) personal and communit (v) rehabilitation, respite an
out patient and day care services (b) by providing facilities for education research with respect to such person
) by providing any services and facilities ancillfacilities that may be appropriate from time to ti
dditional rv
The following Income, Expenses, Assets and Liabilities of the Home for Incurabitems financial statements, but are separatre
chedule of Income and Expenses –r the year ended 30 June 2012
$’000 $’000xpenses mployee benefit costs - 1upplies and services 7
Grants, sub 414 402LDepreciation and amortisation Total Expenses
Income
ental income terest
8 7
R 491 328In 369 380Total Income 60 08 N (2 00 (48et result 4) 3) Other comprehensive income
evaluation surplus (4 016) --
RTotal comprehensive income (4 016) Total comprehensive result (6 020) (483)

Annual Report 2011-12 201
d – Home for Incurables Trust
201100
ash and cash equivalents
sh equivalents 7 753 7 577
Sche ule of Assets and Liabilitiesas at 30 June 2012 2012 $’000 $’0Current assets C
Deposits with the Treasurer 238 441Deposits with SAFA 7 515 7 136
Total cash and caSAFA Interest Receivable -
Total current assets 7 753 32
7 609 Non-current assets
31 328 36 1051 220 2 594
32 548 38 699
Property, plant and equipment Investment property Total non-current assets
40 301 46 308
Total assets Current Liabilities
13 -a 13 -
Payables ot l Current Liabilities T
Tota 13 -l Liabilities Net assets 40 288 46 308 Schedule of Changes in Equity – Home for Incurables Trust
r the year ended 30 June 2012 Revaluation Surplus
Retained Earnings
Total
$’000 $’000 $’000alance at 30 June 2010 30 202 16 589 46 791et result for 2010-11 - 83)
fo
BN (4 (483)Total comprehensive result for 2010-11 - (483) (483)Balance at 30 June 2011 30 202 16 106 46 308Net result for 2011-12 - (2 04) (2 00 04)Gain/(loss) on revaluation of property, plant and equipment during 2011-12 (4 016) - (4
(4 016) (2 004) (6 0016)
20Total comprehensive result for 2011-12 )Balance at 30 June 2012 26 186 14 102 40 288

Department for Communities and Social Inclusion 202
0 June 2012
ows (Out ws)
In
(Outflows)$’000
C ctivities C
401 R 491 3
892
Schedule of Administered Cash Flows - Home for Incurables Trust for the year ended 3
2012 Inflflo$’000
2011flows
ash Flows from Operating Aash Inflows
Interest revenue 376ental revenue 28
Total Cash Inflows 704 Cash Outflows
-
payments otal Cash Outflows (430)
Employee payments (1)Supplies and services (302) (27)Grants, subsidies and client (414) (402)T (716) Net Cash Inflows from Operating Activities 176 274 Net Increase in cash 176 274Cash at the beginning of the reporting period 7 307 577 3Cash at the end of the reporting period 7 5777 753 Accounting
he accountPolicies ing policies pertaining to the administered items for the Department are contained in Not y of Significant
Cash and cash equivalents as reported in the Schedule of Assets and Liabilities – Home for Tr cash and, deposits held at call and other short-term, highly liquid investments with maturities of thre hs or less that are rea
e subject to insignificant risk of changes in value. Cash and cash equivalents in the SchedHome for Incurables Trust comprise cash and cash equivalents as abov
T e 2 SummarAccounting Policies for the Department. Cash and cash equivalents
Incurables ust includes on h e mont dily convertible to cash and which ar
s – ule of
Administered Cash Flow defined e. Cash is measured at nominal value.

Annual Report 2011-12 203
es Trust
roperty, plant and equipment
Reconciliation of Property Plant and Equipment - Home for Incurabl P
Land and buildings 13 510 14 621
value) 17 22d depreciation – buildings and improvements (
ings 31 36
2012
$’000
2011$’000
Site land (fair value) Buildings and improvements (fair 818 245Less accumulate - 761)Total land and build 328 105 Reconciliation of Land and Buildings – Home for Incurables Trust
s the movement of land and buildings and improvements for the HFI Trust d 1
Site landBui a d lmp e s
L
Buildi$’000 $’000 $’000
The following table show uring 20 1-12.
ldingsrovem
nnt
Totaland, ngs
Carrying amount at 1 July 2011 14 621 1 4 4 36
- (761) (1 111) 9 ) (
arrying amount at 30 June 2012 13 510 17 818 31 328
2 8 105Depreciation and amortisation for the year (761)Other movements – revaluations (2 05 4 016)C Investment Property – Home for Incurables Trust
2012
2011
00
-925
$’000 $’0Investment Building 925 925Revaluation decrement (139) Fair Value at 30 June 786
2012
$’000
2011$’000
Investment Land * 1 669 1 669Revaluation decrement (1 235) -Fair Value at 30 June 434 1 669 Total Investment Property at 30 June 2012 1 220 2 594 * The land valued was based on the foot print of the investment building not the surrounding land.

Department for Communities and Social Inclusion 204
Our Locations and Contact Details
Housing SA
Metropolitan Offices
20 Flinders Street
Elizabeth evel 1, Raleigh Chambers
Elizabeth City Centre SA 112
35 Sturt Road
Modbury 100 Reservoir Road
Noarlunga 1st Floor, Noarlunga House Ramsay Place Noarlunga Centre SA 5168 Telephone: 131 299 Port Adelaide 296 St Vincent Street
ne: 131 299
Salisbury1 Ann Street Salisbury SA 5108
The Parks Building s
2-46 Cowan SAngle Park SA 5010 T ne: 1
delaide A1Adelaide SA 5000 Modbury SA 5092 Telephone: 131 299 Telephone: 131 299 Telephone: 131 299
L
5Telephone: 131 299 Marion 2Sturt SA 5047
elephone: 131 299 Port Adelaide SA 5015 TelephoT
4, The Parknity Centre Commu
treet
elepho 31 299
Country Offices
n
A angu Pitjantjatjara
via
9 Vaughan Terrace erri SA 5343
Telephone: 131 299 Ceduna 22 McKenzie Street Ceduna SA 5690 Telephone: 131 299 Coober Pedy Lot 334 Hutchinson Street Coober Pedy SA 5723 Telephone: 131 299
Gawler Unit 1, 4 Seventh Street Gawler South SA 5118 Telephone: 131 299
mestone Coast Connected Service Centre
Mount Gambier SA 5290 Telephone: 131 299 Murray Bridge Mobilong House Seventh Street Murray Bridge SA 5253 Telephone: 131 299 Port Augusta 13 Mackay Street Port Augusta SA 5700 Telephone: 131 299
Port Linc10 Hallett Place Port Linc 606 Telephone: 131 Port Pirie76 Florence Street
e SA 5540 Telephone: 131 299 Whyalla 173 Nicolson Avenue Whyalla Norrie SA 5608 Telephone: 131 299
Yankunytjatjara Umuwa Office PMB 227 Umuwa
lice Springs NT 0872 ATelephone: 8954 8188 Li Berri 9 Elizabeth Street Port Piri2B
oln
oln SA 5299

Annual Report 2011-12 205
A
isability Services Central ffice
et 063
elephone: 8272 1988
isability Information
enquiries t outh
ustralia 1300 786 117
Library and Information Service – Disability Collection Strathmont Centre 696-710 Grand Junction
oad
: 8266 8556
Independent Living Centre and Continence Resource Centre 11 Blacks Road Gilles Plains SA 5086
elephone: 8266 5260 1300 885 886 ers only)
Adelaide
illes Plains SA 5086 elephone: 8366 7333
0
ide
Gilles Plains SA 5086 Telephone: 8366 7300
alisbury
SA 5108
60
outhern Adelaide Christies Beach 98 Beach Road Christies Beach SA 5165 Telephone: 8384 7299
aw Park
5041 8566
Disability Services – Community and Home Support S
DO103 Fisher Stre
ullarton SA 5FT DServices For assistance with and information aboudisability services in SATelephone:
ROakden SA 5086 Telephone
TTelephone: (SA/NT call
Metropolitan Offices
Central Gilles Plains 21 Blacks Road GT Regency Park 171 Days Road Regency Park SA 501Telephone: 8348 6000
Northern Adela Gilles Plains 31 Blacks Road
S46 Commercial Road SalisburyTelephone: 8282 5500 57 Park Terrace
alisbury SA 5108 STelephone: 8182 15
S
D180 Daws Road Daw Park SA Telephone: 8277
Residential Facilities
mfries Avenue
0
et
tre nction
ged Care Service A78-96 DuNorthgate SA 5076
0Telephone: 8266 80
ighgate Park H103 Fisher StreFullarton SA 5063 Telephone: 8272 1988
Strathmont Cen696-710 Grand JuRoad Oakden SA 5086
1 Telephone: 8266 851
Trinity Court 11-15 Heritage Court Oakden SA 5086 Telephone: 8261 6777

Department for Communities and Social Inclusion 206
Service
5223
elephone: 7424 7888
8100
Country Offices – Greater Adelaide
Angaston c/- Barossa and Area Community Health29 North Street Angaston SA 5353
elephone: 8521 4700 T Gawler Shop 32, Gawler Central Complex Level 2, Corner Murray andCowan Streets Gawler SA 5118
elephone: 8521 4700 T
Kangaroo Island 20 Dauncey Street Kingscote Kangaroo Island SATelephone: 8553 2270 Mount Barker 23 Mann Street
ount Barker SA 5251MT
Victor Harbor 10 Crozier Road Victor Harbor SA 5211 Telephone: 8555
Country Offices – Country North
et
on Street
adina 4a Draper Street Kadina SA 5554
elephone: 8821 0200
race 5700
or
0
Whyalla Hospital
eduna Cc/- Housing SA22 McKenzie StreCeduna SA 5690 Telephone: 8625 2129 Clare Office 1/17 LennClare SA 5453 Telephone: 8842 3744 K
T
ort Augusta P40 Flinders TerPort Augusta SATelephone: 8641 1600
ort Lincoln PSecond Flo10 Hallett Place
6Port Lincoln SA 560Telephone: 8688 3564
ort Pirie P76 Florence Street
4Port Pirie SA 55Telephone: 8638 4981
hyalla Wc/- Level 5, 20 Wood TerraceWhyalla SA 5600 Telephone: 8648 8686
Country Offices – Country South
tre
90
Berri 28 Kay Avenue Berri SA 5343
elephone: 8582 2400 T
Limestone Coast Connected Service Cen9 Elizabeth Street Mount Gambier SA 52Telephone: 8735 1800
Murray Bridge 6 Verdun Road Murray Bridge SA 5253Telephone: 8532 4503

Annual Report 2011-12 207
d Home Support SA
uiries
rals
ss2HomeCare
ad
3
iciliary Equipment Service 0 am to 5.0
d SA 5037
Telephone: 1300 295 786
lutions to 5.00 pm)
ne: 1300 296 812
ad Road
0
Avenue Junction
e
3 3
e
00
Domiciliary Care – Community an
Domiciliary Care Enq(8.30am to 5.00pm)
295 673 Telephone: 1300 Domiciliary Care Refer9.00 am to 5.00 pm) (
Via AcceTelephone: 1300 130 551 Central Administration Building 2, 300 Richmond Ro Netley SA 5037 Telephone: 1300 295 67
Dom(9.0 0 pm) Building 4
hmon300 RicNetley
Road
Therapy So
(9.00 amTelepho
Client Service Offices
Hampste207 Hampstead Northfield SA 5085
0Telephone: 8304 62
awson Lakes M1 First Mawson Lakes SA 5095
8549 Telephone: 8256
Noarlunga 3 James Clark Road Noarlunga SA 5168 Telephone: 8392 0000 Oakden 696-710 GrandRoad Oakden SA 5086 Telephone: 8256 8500
Park Holm670 Marion Road Park Holme SA 504Telephone: 1300 295 67 Woodvill19-21a Belmore Terrace
1 Woodville SA 501Telephone: 8440 67
Youth Justice
Youth Justice Directorate
delaide SA 5000 one: 8226 6009
Training
1 Jonal Drive and 6-56 Goldsborough Road
Cavan SA 5094 Telephone: 8169 1444
Community Youth Justice ram
Main North Road lair Athol SA 5084
00
ervices
6 Telephone: 8267 7101
Metropolitan Aboriginal outh and Families arks Community Centre -46 Cowan Street
5010 5733
HP Centre 108 North Terrace
Prog350
ATeleph Adelaide YouthCentre
2
BTelephone: 8269 83 Integrated Youth S108 Kermode Street North Adelaide SA 500
YP2Angle Park SA Telephone: 8243

Department for Communities and Social Inclusion 208
.au th.sa.gov.au
mail: [email protected] au
elephone: 8252 0544 [email protected]
ern Sub
elephone: 8303 0961 mail: [email protected] ebsite: www.officeforwomen.sa.gov.au
ulticultural SA
8226 1944 535
@sa.gov.aral.sa.g
ng C SA ne: 8226 1990 (Interpre
980 (Transla
slate.sa.gov. u
Office for Youth Telephone: 8413 8178 Email: [email protected]: www.officeforyou
Office for Volunteers Telephone: 1300 014 712 EWebsite: www.ofv.sa.gov.
Northern Connections TEmail: DCSI.NorthernCo
Office for the South urbs Telephone: 8207 0602 Website: www.oss.sa.gov.au
Office for Women
TEW
M Telephone: Toll Free: 1800 063Email: multiculturalsa u Website: www.multicultu ov.au Interpreting and TranslatiTelepho
entre (part of Multicultural )ting)
Telephone: 8226 1 ting) Email: [email protected] Website: www.tran a

Annual Report 2011-12 209
Acronyms
ABS Australian Bureau of Statistics
APY Anangu Pitjantjatjara Y
RACY Australian Research Alliance for Children and Youth
ankunytjatjara
search Council
itional Housing Outreach Service
CIS Boards and Committees Information System
Referral and Support
HART eaching Targets
Human Resource and Information System
CSI Department for Communities and Social Inclusion
Development
y Equipment Service
anufacturing, Innovation, Trade, Resources and Energy
PTI Department of Planning, Transport and Infrastructure
e Assistance Program
eadership Team
J Gigajoules
ing of Government Operations
Community Care
ommunity Action Network
ication Technology
Injury Management
dvisory Council
OAA Memorandum of Administrative Agreement
NAHA National Affordable Housing Agreement
A
ARC Australian Re
ATHOS Aboriginal Trans
B
CAARS Common Approach to Assessment,
Changing Habits and RC
CHRIS Complete
COAG Council of Australian Governments
D
DECD Department for Education and Child
DES Domiciliar
DMITRE Department for M
D
EAP Employe
ELT Executive L
FOI Freedom of Information
FTE Full-time Equivalent
G
GoGO Green
HACC Home and
ICAN Innovative C
ICT Information and Commun
IM
KPIs Key Performance Indicators
LTI Lost Time Injury
MDAC Minister’s Disability A
M

Department for Communities and Social Inclusion 210
al Aborigines and Islanders Day Observance Committee
BESP Nation Building – Economic Stimulus Plan
DA National Disability Agreement
heme
cheme
&IM Injury Management
C hnic Affairs Commission
I Innovation
S covery Information System
A nd Comparison Application
formation Collection
NAIDOC Nation
N
N
NDIS National Disability Insurance Sc
NDS National Disability Strategy
NPY Ngaanyatjarra Pitjantjatjara Yankunytjatjara
NRAS National Rental Affordability S
OHSW Occupational Health, Safety and Welfare
OHSW Occupational Health, Safety and Welfare and
OSCAR Online System for Comprehensive Activity Reporting
SACE South Australian Certificate of Education
SAHT South Australian Housing Trust
SAMEA South Australian Multicultural and Et
SAMIS Strategic Asset Management Information System
SASP South Australia’s Strategic Plan
SES State Emergency Services
SISA Self Insurance of South Australia
SPGC Strategic Procurement and Grants Committee
TACS The Australian Centre for Social
URA Urban Renewal Authority
VERI Volunteer Emergency Re
WAC Workforce Analysis a
WIC Workforce In
WIS Women’s Information Service
YACs Youth Advisory Committees