City of Melbourne Annual Report 2011-12
168
-
Upload
khangminh22 -
Category
Documents
-
view
3 -
download
0
Transcript of City of Melbourne Annual Report 2011-12

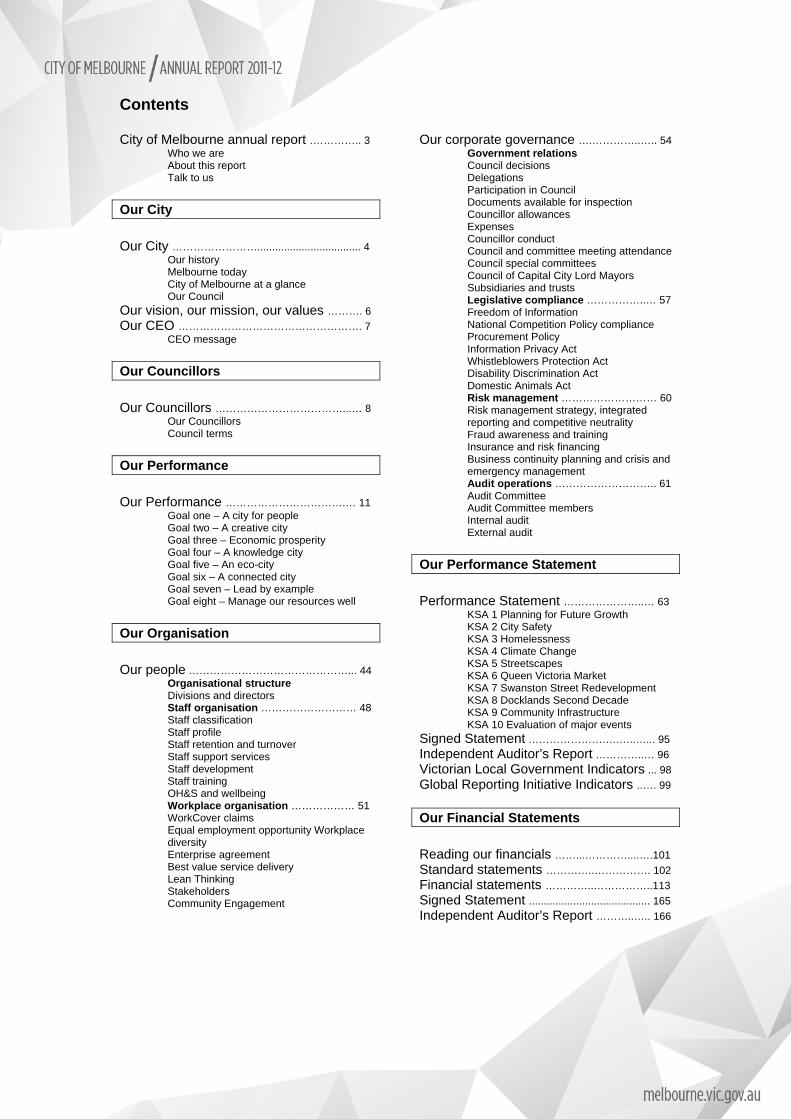
Contents City of Melbourne annual report .………….. 3
Who we are About this report Talk to us
Our City
Our City ……………………................................... 4
Our history Melbourne today City of Melbourne at a glance Our Council
Our vision, our mission, our values ………. 6 Our CEO ……………………………………………. 7 CEO message
Our Councillors
Our Councillors ………………………………...… 8
Our Councillors Council terms
Our Performance
Our Performance …………………………….… 11
Goal one – A city for people Goal two – A creative city Goal three – Economic prosperity Goal four – A knowledge city Goal five – An eco-city Goal six – A connected city Goal seven – Lead by example Goal eight – Manage our resources well
Our Organisation
Our people ………………………………………... 44
Organisational structure Divisions and directors Staff organisation ……………………… 48 Staff classification Staff profile Staff retention and turnover Staff support services Staff development Staff training OH&S and wellbeing Workplace organisation ……………… 51 WorkCover claims Equal employment opportunity Workplace diversity Enterprise agreement Best value service delivery Lean Thinking Stakeholders Community Engagement
Our corporate governance ….…………..….. 54 Government relations Council decisions Delegations Participation in Council Documents available for inspection Councillor allowances Expenses Councillor conduct Council and committee meeting attendance Council special committees Council of Capital City Lord Mayors Subsidiaries and trusts Legislative compliance ……………..… 57 Freedom of Information National Competition Policy compliance Procurement Policy Information Privacy Act Whistleblowers Protection Act Disability Discrimination Act Domestic Animals Act Risk management ……………………… 60 Risk management strategy, integrated reporting and competitive neutrality Fraud awareness and training Insurance and risk financing Business continuity planning and crisis and emergency management Audit operations ……………………….. 61 Audit Committee Audit Committee members Internal audit External audit
Our Performance Statement
Performance Statement …………………..… 63
KSA 1 Planning for Future Growth KSA 2 City Safety KSA 3 Homelessness KSA 4 Climate Change KSA 5 Streetscapes KSA 6 Queen Victoria Market KSA 7 Swanston Street Redevelopment KSA 8 Docklands Second Decade KSA 9 Community Infrastructure KSA 10 Evaluation of major events
Signed Statement ………………….….…..…... 95 Independent Auditor’s Report …………..… 96 Victorian Local Government Indicators ... 98 Global Reporting Initiative Indicators ..…. 99
Our Financial Statements
Reading our financials ……...…………....….101 Standard statements …………..……………. 102
Financial statements …………..……………..113 Signed Statement ......................................... 165
Independent Auditor’s Report ………..….. 166

City of Melbourne Annual report 2011-12 Welcome to the City of Melbourne’s annual report for 2011-12. This annual report will tell you how we performed during the financial year starting 1 July 2011 and ending 30 June 2012. Who we are Melbourne is the capital of Victoria and Australia’s second largest city. The City of Melbourne is officially known as the Melbourne City Council and is one of 79 city and shire councils in Victoria operating as a public statutory body incorporated under the Local Government Act 1989 (Vic). As a local government authority, the City of Melbourne strives to achieve our community’s vision of Melbourne as a bold, inspirational and sustainable city – a great place for people to live, work and visit. We protect and strengthen the city’s economic prosperity and ensure Melbourne is recognised as a knowledge city that supports innovation and technology. We demonstrate leadership in ecological and sustainable practices and endeavour to plan and build a connected city which is safe and easy to navigate, both now and into the future. About this report As a capital city local government we must lead by example in our performance and in our reporting. We are committed to open, clear communication and telling it like it is. This annual report documents the City of Melbourne’s performance over the 2011-12 financial year against the goals set out in our Council Plan 2009-13 and the 2011-12 Annual Plan and Budget. The report is designed to meet our obligations under Section 131 of the Local Government Act 1989 (Vic) and the requirements of the Global Reporting Initiative (GRI) framework for sustainability reporting. Talk to us If you’d like more information about any item in this report, we’d love to hear from you. Send your questions via email to [email protected] or mail to:
Corporate Planning and Learning City of Melbourne GPO Box 1603 Melbourne VIC 3001
Our website www.melbourne.vic.gov.au has more information about City of Melbourne activities, policies and plans for the future, or you can speak to a Customer Relations Officer on +61 3 9658 9658.
3

Our City Our history For more than 40,000 years the people of the Kulin Nation lived on and managed the land that is now known as the City of Melbourne. They included people of the Boonwurrung, Woiwurrung, Taungurung and Djadjawurrung tribes. In 1835 the city we know today was established by settlers from Tasmania and within two years the orderly grid of city streets, which make up the central business district, were laid out beside the course of the Yarra River. In 1842 Melbourne was incorporated as a town, with a Town Council elected to manage the town’s affairs. In 1851 gold was discovered in regional Victoria, marking a rapid change in Melbourne’s growth as it became the gateway to Victoria’s goldfields. The wealth generated in the rush poured into the city and laid the foundations stones of many of the city’s historic buildings, cementing Melbourne’s position as Marvellous Melbourne. Melbourne today Today Melbourne’s original city grid has become a major business centre and its office towers house the headquarters of some of Australia’s largest companies. The city has also become a home to more and more people, as the proximity to work, study, cultural pursuits and the exciting pulse of the city comes into focus. The central city is home to Melbourne's famed laneways, arcades and shopping precincts. World-class theatre, art galleries, museums and sporting facilities are all within easy reach, while the entrenched cafe culture and robust restaurant scene ensures there’s a suitable venue for every occasion. The city’s famous parks, gardens and public squares provide the perfect backdrop to Melbourne’s action packed events calendar: from food and fashion, through to sport, music and comedy. Together these elements combine to make our city a thriving, dynamic and cosmopolitan city – a great place to live, work and play. It is little wonder the City of Melbourne is consistently ranked amongst the world’s most liveable cities.
City of Melbourne at a glance
Area: 37.7 km2
Suburbs: 16
Parkland: 486ha
Residential pop: 100,611
Weekday pop: 788,000
Weekend visits: 548,000
Businesses: 16,000
Dwellings: 53,412
Workers: 428,709
Residential students: 32,470 (Higher Education Students)
Cultural backgrounds: 140
Languages: 116
4
Our Council The City of Melbourne’s Council consists of a lord mayor and deputy lord mayor and seven councillors. The Local Government Act 1989 (Vic) sets out the purposes and objectives of the Council and defines its functions and powers. Under the provision of the City of Melbourne Act 2001 (Vic):
Melbourne is not divided into wards the leadership team is elected separately from councillors the preferential voting system is used to elect the leadership team and proportional
representation is used to elect councillors. The role of the Council is to govern the municipality in service of the community. As such the Council:
acts as a representative government and considers community needs when making decisions
establishes strategic objectives for municipal services and monitors their achievement ensures the responsible and accountable management of the City of Melbourne’s
resources advocates local community interests to other communities and governments is a responsible partner in government, taking the needs of other communities into
account fosters community cohesion and encourages participation in civic life.
5

Our vision, our mission, our values Vision Melbourne is a bold, inspirational and sustainable city. Mission The City of Melbourne will strive to achieve the community’s vision of Melbourne as a bold, inspirational and sustainable city which: makes Melbourne great for people to live in and visit
achieves the creative potential of the city
protects and strengthens the city’s economic prosperity
makes Melbourne a recognised knowledge city that supports innovation and technology
demonstrates leadership in environmental sustainability
works vigorously for a connected city, which is safe and supports the efficient movement of people and freight
leads by example and manages resources well.
Values For City of Melbourne employees and Councillors to be the best at what they do and achieve the corporate vision and mission, their actions and decisions are guided by a set of five fundamental and unifying values: integrity, courage, accountability, respect and excellence.
Integrity – we take responsibility for our actions in an honest and transparent way.
Courage – we dare to create new and better ways of doing business.
Accountability – we take responsibility for decisions and actions to achieve agreed outcomes.
Respect – we consider and understand the perspective and contribution of others.
Excellence – we continuously improve our performance to achieve outstanding outcomes for Melbourne.
Realising our vision Our Council Plan 2009-2013 identifies eight goals to guide us towards our vision. Our aspirations for the city are reflected in the first six goals. Our municipality will become:
1. A city for people
2. A creative city
3. Economically prosperous
4. A knowledge city
5. An eco-city
6. A connected city
An additional two goals relate to our internal performance and give direction for the good governance and management of our organisation. The City of Melbourne will:
7. Lead by example
8. Manage our resources well
6

Our CEO Message from the CEO
It has been full-steam ahead over the past 12 months as the City of Melbourne has worked to bring the Council Plan 2009-13 to completion, finalising a four-year program to achieve the community’s vision to make Melbourne a bold, inspirational and sustainable city. While the past few years have involved research, preparation and engagement, 2011-12 can be characterised as a year of delivery. We embarked upon the biggest community infrastructure spend in our history. More than $107 million was invested in key projects, including the redevelopment of Swanston Street and the transformation of the Boyd community hub. The refurbishment of the Carlton Baths and Family Resource Centre is almost complete and plans are well underway for the Kathleen Syme Library and Community Centre. Homelessness is a key issue facing cities around the world and we have worked hard to respond to the needs of homeless people. In addition to hosting the Homelessness Summit, the city’s new affordable housing centre at Drill Hall was opened, providing accommodation, vital medical support and health services for this particularly vulnerable group of Melburnians. We are keeping an eye on the future and planning for Melbourne’s continued growth. New structure plans were launched for urban renewal areas at Arden-Macaulay and City North. We also unveiled our Transport Strategy 2012, with particular focus on enhancing public transport, cycling and walking networks across the city to provide an efficient alternative to driving. We are focusing on the sustainability of our city and making it more resilient to climate change. The Darling Street stormwater project has been completed, and we continue to invest in other stormwater projects across the city. Our draft Urban Forest Strategy and the city’s first Open Space Strategy aim to protect our public spaces and ensure that Melbourne’s green areas thrive into the future. Community engagement is integral to our core business and we have worked hard to nurture connections with all Melburnians. Staff from across all five divisions were involved in training and with the development and implementation of community engagement on a range of plans and projects. Communities participated in a number of key projects this year including the Swanston Street redevelopment, Docklands, future growth, the Transport Strategy, Urban Forest Strategy and the Kathleen Syme Library and Community Centre. We have also taken major strides to improve our service quality and organisational efficiency. Our Lean transformation continues with more than an $800,000 improvement to the bottom line (nearly $4 million since we started the Lean journey), and more than 6,000 hours of staff time made available for more service delivery in 2011-12 (more than 1200 days of productivity in the past two years). Staff completed a wide range of in-house Lean learning training, as well as City of Melbourne Education and Training programs. More than 1100 staff members attended workshops at an average of 15.22 training hours per employee. But our work is not finished and we look forward to the challenges ahead. We are committed to providing a city for people, while continuing to grow in a financially responsible way. I look forward to continue working with the community and the next Council to ensure Melbourne remains the world’s most liveable city. Dr Kathy Alexander Chief Executive Officer City of Melbourne Due to the Council election in October 2012 and the caretaker period required by the Local Government Act 1989 (Vic), there is no Lord Mayor’s message in the 2011-12 annual report.
7

Our Councillors The Melbourne City Council consists of a lord mayor and deputy lord mayor and seven councillors. In 2011-12 the community was represented by the office bearers listed below. Lord Mayor Robert Doyle First elected in 2008 The Lord Mayor is Chair of meetings of the Melbourne City Council and represents the City of Melbourne on the following advisory committees and external organisations:
Council of Capital City Lord Mayors
Shrine of Remembrance Trustees
Lord Mayor’s Charitable Foundation
Melbourne Arts Trust
Cancer Council of Victoria
Enterprise Melbourne Advisory Board
Deputy Lord Mayor Susan Riley Served as Deputy Lord Mayor, 2001-04 Re-elected in 2008 The Deputy Lord Mayor represents the City of Melbourne on the following advisory committees and external organisations:
Audit Committee, City of Melbourne
Inner South Metropolitan Mayors’ Forum
Major Projects Advisory Committee
Melbourne Awards Advisory Board Chair
Melbourne Arts Trust
Melbourne Retail Advisory Board 2009-12
Melbourne Spring Fashion Week Advisory Board (Deputy Chair)
Moomba Advisory Board
Police Community Consultative Committee – Central Activities District
Procurement Australia
Lady Mayoress’ Committee (Co-Chair)
Enterprise Melbourne Advisory Board
Councillor Carl Jetter First elected in 2004 Re-elected in 2008 Cr Jetter is Deputy Chair of the Future Melbourne (Economic Development and Knowledge City) Committee and currently represents the City of Melbourne on the following advisory committees and external organisations:
City Licensing Approvals Forum
District Precinct Program 2007-11
Melbourne Hospitality Advisory Board 2009-12
Moomba Advisory Board
Melbourne Business Precincts Program 2011-13
8

Councillor Jennifer Kanis First elected in 2008 Cr Kanis is Chair of the Future Melbourne (People and Creative City) Committee, Deputy Chair of the Future Melbourne (Planning) Committee and represents the City of Melbourne on the following advisory committees and external organisations:
Disability Advisory Committee
Family and Children’s Advisory Committee
Housing Choices Australia
Indigenous Advisory Panel
Melbourne Music Steering Committee
Melbourne Symphony Orchestra Board
Parks and Gardens Advisory Committee
Queen Victoria Market Advisory Group
Homelessness Advisory Committee Councillor Kevin Louey First elected in 2008 Cr Louey is Chair of the Future Melbourne (Connected City) Committee and Chair of the Future Melbourne (Economic Development and Knowledge City) Committee. He is also Co-Chair of the Docklands Co-ordination Committee. Cr Louey also represents the City of Melbourne on the following advisory committee:
Metropolitan Transport Forum
City Licensing Approvals Forum
Enterprise Melbourne Advisory Board
Melbourne Awards Advisory Board
Melbourne Hospitality Advisory Board
Melbourne Retail Advisory Board
Moomba Advisory Board
Councillor Cathy Oke First elected in 2008 Cr Oke is Chair of the Future Melbourne (Eco-City) Committee, Deputy Chair of the Future Melbourne (Connected City) Committee, Deputy Co-Chair of the Docklands Coordination Committee and represents the City of Melbourne on the following advisory committees and external organisations: Bicycle Reference Group
International Council for Local Environment Initiatives (ICLEI) Australia/New Zealand Oceania Board
ICLEI Executive Committee
Melbourne Music Steering Committee
Metropolitan Waste Management Group
Parks and Gardens Advisory Committee
Queen Victoria Market Strategic Advisory Group
Victorian Road Based Public Transport Advisory Council
Water Reference Group
Yarra Park Advisory Committee
9

Councillor Ken Ong First elected in 2008 Cr Ong is Chair of the Future Melbourne (Planning) Committee, Deputy Chair of the Future Melbourne (Finance and Governance) Committee and Deputy Chair of the Future Melbourne (People and Creative City) Committee. Cr Ong also represents the City of Melbourne on the following advisory committees and external organisations:
Committee for Melbourne
Litter Advocates Group
Major Projects Advisory Committee
Metropolitan Waste Management Group
Moomba Advisory Board
Melbourne Business Precincts Program 2011-13
Councillor Brian Shanahan OAM First elected in 2004 Re-elected in 2008 Cr Shanahan is Chair of the Future Melbourne (Finance and Governance) Committee, Deputy Chair of the Future Melbourne (Eco-City) Committee and currently represents the City of Melbourne on the following advisory committees and external organisations:
Association of Bayside Municipalities
Audit Committee, City of Melbourne
Melbourne Arts Trust
Victorian Local Governance Association
Councillor Jackie Watts First elected on countback in June 2011
Council terms The current Council was elected for a four-year term in November 2008. A vacancy was created on 24 June 2011 with the resignation of Cr Peter Clarke. Cr Jackie Watts was elected at the countback held on 19 July 2011. The next council election is scheduled for October 2012. Further information about local government elections is available from the Victorian Electoral Commission at www.vec.vic.gov.au.
For more on our corporate governance, please refer to page 54.
10

Our Performance This section includes highlights of activities aligning to each of the Council’s eight goals and details of our performance in 2011-12, measured against the objectives and indicators of our Council Plan.
Goal 1 – A city for people The City of Melbourne has an important role in making the municipality a great place to live and visit. The Council recognises it must address the needs of a growing population. We want people to come into the city to work, play and relax in streets and public spaces that are clean, inviting and alive. This goal includes providing relevant and affordable services and community infrastructure, and the need for safety in the city. We promote and encourage healthy people and communities and want to ensure our rich cultures are celebrated, embraced and connected to the community. Over the last year the city has flourished, cementing its reputation as one of the world’s most liveable cities. The following initiatives provide an overview of activities under this goal in 2011-12. Sustainable growth Melbourne is a city undergoing rapid growth. Just 15 years ago, 200,000 people worked in the municipality and by 2030 this figure is expected to grow to 550,000. The residential population has doubled over the last 10 years to almost 100,000, and by 2030 that number is forecast to double again as more people make the city their home. In 2030, more than 1.2 million workers, students, residents and visitors will inhabit the city each day. To ensure Melbourne remains one of the world’s most liveable cities, the City of Melbourne is planning for this long-term future growth now. The award winning Future Melbourne Community Plan (2008) is a comprehensive, multi-year city plan to direct the city’s growth. The City of Melbourne framed its Council Plan to take the first four-year step towards achieving the Future Melbourne goals. 2011-12 was the third year of the plan and several of its key components resulted in changes to the planning framework for the city. These included: a review of the Municipal Strategic Statement
a new Transport Strategy
a new Open Space Strategy
structure plans for the Arden-Macaulay and City North urban renewal areas
an amendment to the Energy, Water and Waste Efficiency Policy
an amendment to the Central City Heritage Review, to protect an additional 99 buildings in the city’s historical centre.
The City of Melbourne, in partnership with Places Victoria, undertook extensive community engagement activities to help understand the needs of the Docklands community and to inform decision-making in the future. The results of the consultation informed development of the Docklands Community and Place Plan to guide future growth of the Docklands precinct.
11
A cultural city A city for people is a city with a cultural heart, full of life and entertainment. Events play a vital role in increasing Melbourne’s reputation, driving visitation to the city and stimulating the local economy. The City of Melbourne cemented its position as the events capital of Australia in the 2011 Australian Event Awards, named as a finalist in three separate categories: Best New Event for 2010 Melbourne Music Week, Best Community Event for 2010 New Year’s Eve Family Festival, and Event Manager of the Year. This was the first time a single organisation received three finalist nominations. The 2010 Melbourne Music Week ultimately won the award for the Best New Event, showcasing how local government and industry can collaborate successfully. Four premier events staged entirely by the City of Melbourne are the mainstays of Melbourne’s event calendar. The Moomba Festival has been a Melbourne institution for more than 50 years and continues to captivate Melburnians of all ages. The New Year's Eve fireworks event grows every year and the addition of a family precinct in 2011 proved popular with patrons. Melbourne Music Week’s second year saw the event consolidate its place in Melbourne’s music scene, while Melbourne Spring Fashion Week continues to provide valuable support to the retail, design and fashion industry in Melbourne. The Triennial Sponsorship Program supports a diverse mix of major annual events with three years of funding. Triennial recipients in 2011-12 include the Australian Open, L’Oreal Melbourne Fashion Festival, Melbourne Food and Wine Festival, Melbourne Cup Carnival/Parade, and the Toyota AFL Grand Final Week/Parade. The Event Partnership Program helps organisations stage events throughout the city and enhances the quality and variety of events available. This annual program has two funding rounds a year and is available to enhance events, festivals and activities that contribute to the city’s vibrancy. Events supported in 2011-12 include Tropfest, the Fair Trade and Ethical Festival, the Indian Film Festival, the Victorian Dragon Boat Season, Melbourne Rebels, Melbourne Storm and The Age Run Melbourne. The combined cash and in-kind budget for the Triennial Sponsorship and Event Partnership programs was $4.6 million in 2011-12. To celebrate Melbourne’s status as a UNESCO City of Literature and the National Year of Reading 2012, the City of Melbourne unveiled the newly-named Literature Lane, just metres from the State Library. The previously unnamed lane joins AC/DC Lane and Dame Edna Place in the list of memorable Melbourne laneways. An inclusive city The City of Melbourne is committed to responding to the needs of all members of the community, from young to old, as well as those experiencing economic hardship and those at risk of, or experiencing, homelessness. In May 2012 the city hosted a Homelessness Summit bringing together experts in the field to discuss the reasons behind homelessness, obstacles to ending homelessness and potential partnerships and solutions. Thought-provoking speakers and the robust discussions at the summit provided rich sources of information and ideas to inform our work on homelessness. The City of Melbourne became the only capital city in Australia to permanently fly the Aboriginal flag at Town Hall, following an official flag raising ceremony during Reconciliation Week – an annual event to promote reconciliation between Indigenous and non-Indigenous people. The permanent flying of the Aboriginal flag at the Melbourne Town Hall (along with
12

the Australian, Victorian and City of Melbourne flags) was a deliverable under our current Reconciliation Action Plan. Community infrastructure across the municipality received a boost with the opening of the city’s new affordable housing centre Drill Hall in December 2011. The development brought the heritage-listed, Art Deco building back to life, with the help of the Myer Foundation and Housing Choices Australia, a community housing association with which the City of Melbourne is affiliated. Across the city, Southbank’s old JH Boyd Girls High School on City Road was transformed into the Boyd community hub, following a $10 million refurbishment. The new hub opened in June 2012 and retains much of the character of the old building, with the addition of a maternal and child health and family services centre, childcare and playgroup areas, a new library, art studios, meeting rooms and a social enterprise cafe. The City of Melbourne also acquired the Kathleen Syme Library and Community Centre in July 2011, which is set to become the first multi-use community hub of its kind in Carlton. A major community engagement strategy was conducted to understand community expectations for the centre. The design process for the new community centre and library is underway.
Community festivals came to the fore in 2011-12 with special days presented by the Anatolian, Antipodean, Malaysian and Thai communities, all showcasing colourful cultures through food, music and dance. These events were capped off by Viva Victoria, a free one day festival celebrating the state’s diversity during Victoria’s 10th Cultural Diversity Week, an event that continues to grow in reputation. People from Melbourne’s many different cultures also came together to work, share and learn in a safe and supportive environment at the Multicultural Hub, opposite the Queen Victoria Market. The Hub is owned by the City of Melbourne and managed by the Adult Multicultural Education Services (AMES), Victoria’s largest local provider of multicultural support services. More than 100 volunteers, speaking 35 different languages, have provided information, administrative and project support at the Hub.
May 2012 saw over 100 City of Melbourne volunteers arrive for morning tea at the Town Hall to celebrate Volunteer Week and to receive awards for their work. The contributions made by these volunteers include initiatives like the Friendly Visiting Program, which responds to social isolation and assists clients to become involved in and remain living in their community. The streetscaping around the Catholic Parish of St Mary's Star of the Sea in West Melbourne received a boost with extensive outdoor improvements. The removal of an old brick fence surrounding the church, new tree planting and a new footpath has opened up the area around the church for public open space. A healthy city The City of Melbourne is committed to providing a variety of facilities and services to keep residents and workers active. The City of Melbourne began a $10.4 million project to renew and upgrade the Carlton Baths and Family Resource Centre following significant community engagement and consultation. The project will create a state-of-the-art community centre and is an important element of community infrastructure for Carlton. The project includes construction of a larger purpose-built health club and group fitness room with dedicated gymnasium. The maternal and child health, parenting support and family counselling facilities will also increase with an additional playgroup area provided. Three of the City of Melbourne’s pools – the Kensington Community Recreation Centre, Melbourne City Baths and North Melbourne Recreation Centre – received Platinum Pool accreditation in 2011-12. The Life Saving Victoria’s Platinum Pools Program highlights
13
aquatic facilities that have achieved the highest standards regarding safety, continuous review and improvement in line with industry best practice. To gain accreditation, the facilities completed safety assessments, supervision audits and mystery guest visits on an annual basis. New digital clocks at the Tan Track were installed to enable runners and walkers to time their circuits. One clock is located at the start/end of the route and a second clock at the half-way point. The clocks were designed and installed by the City of Melbourne and funded by the Bennelong Foundation. The response from the running community has been very positive. The City of Melbourne resumed management of the South Yarra Senior Citizens Centre on 1 July 2011 and has revitalised the centre with a range of healthy and active ageing opportunities for local seniors. Initiatives such as the Well4Life Program encourage seniors to improve their nutrition, physical activity and social connections through active participation and peer support. Kensington’s Newmarket Reserve bowling green received a facelift in September 2011 with the installation of a new synthetic bowling surface to replace the old grass green. The $365,000 project means bowlers can now play year-round. A clean and welcoming city Rubbish collection is a major preoccupation of all city councils as they strive to keep their cities tidy. The City of Melbourne has gone a step further with the tidy message, encouraging business to take responsibility for the cleanliness of their immediate surrounds. The Love Your Laneway Chinatown program aims to promote and reward behaviour change in laneway cleanliness. Business advocates appointed in each Chinatown laneway distributed regular updates on new program initiatives to keep the laneways clean and tidy. The initiatives included: Recognition and appreciation – shopfront window stickers were provided to
demonstrate the City of Melbourne's appreciation for the good work done by advocates in helping clean up Chinatown’s laneways.
Line marking for permitted bin storage areas – line markings placed in Bullens Lane, Hughs Alley, Dean Alley and Heffernan Lane indicated permitted bin storage areas and advocates have been helping to place bins within this designated area.
Bin screens – a trial bin screen was installed in Smythe Lane off Cohen Place, near the Chinese Museum.
As part of the program, a Chinatown Laneway Improvement Plan was developed to implement the initiatives. The plan incorporated a mix of infrastructure improvements, urban design, waste management and laneway activation proposals. It also delivered a program of scheduled and as required works including laneway resurfacing, capacity-building work with laneway stakeholders and community activities such as the Chinatown Markets. Our actions were completed in 2011-12 and there have been positive improvements in the laneways. The City of Melbourne will continue to work with businesses and laneway advocates to identify issues like graffiti, illegally dumped waste, pot holes and other issues impacting the presentation and amenity of laneways.
14

Strategic indicators Name Indicator Target 2009-10 2010-11 2011-12
Community satisfaction rating for City of Melbourne-owned recreational facilities
% 75 78 76
Community satisfaction rating for health and human services
% 70 68 71
Community satisfaction with the overall performance of enforcement of bylaws
% 63 63 63
Community satisfaction for City of Melbourne on leading debate and taking action on crime and violence and antisocial behaviour in the municipality
% 85 54 59
Community satisfaction rating for overall performance of waste management
% 71 70 71
Community satisfaction rating for overall appearance of public areas
% 72 70 73
Participation rates at key events, festivals and programs conducted by the City of Melbourne
# 750,000 670,000 750,000 1,601,280*
Number of sporting groups using City of Melbourne parks
# 75 8 83 99
Percentage of visitors who feel safe in the central city
% 90 Survey held every 3 years
Survey held every 3 years
89
The number of people experiencing chronic homelessness as measured by Street Count results
# 70 75 101 105
In response to feedback from local councils, Local Government Victoria introduced methodological and content changes to the Community Satisfaction Survey in 2011-12. These included increasing the sample size from the previous minimum of 350 respondents per municipality up to 400 respondents and ensuring the sample reflects the demographic composition of a municipality. The survey also allows respondents to be ‘residents over 18 years of age’ instead of restricting respondents to ‘head of household’. For these reasons, direct comparison with previous Community Satisfaction Survey results is not possible. * The City of Melbourne adopted new crowd attendance technology in 2011-12, which has resulted in more reliable evidence-based calculations of event attendees.
15

Goal 2 – A creative city Creativity is one of our city's major strengths. To capitalise on and expand our reputation as a bold and inspirational city, it is important to ensure art is accessible to all. We continue to support and promote a diverse range of artists and to place art in the public realm for everyone to appreciate. Through this goal, the Council wants to achieve growth in creative enterprises and strengthen recognition of Melbourne as a creative city. Creativity is about more than just art and our aim is to get creative thinkers involved in decision-making for the city. The City of Melbourne has fostered the development of a creative city through a broad range of events ranging from large-scale international festivals, through to small local projects. The following activities provide a snapshot of works under the goal in 2011-12. Artistic Melbourne Interest in the City of Melbourne’s Creative Spaces – cheap rental space for artists – continues to grow with 132,000 visits to the Creative Spaces website in 2011. The City of Melbourne has now licensed the Creative Spaces website to the City of Sydney for a three year. This collaboration will hopefully create valuable national resources for the creative sector through shared financial support and endorsement. The addition of seven new studios, following the opening of Southbank’s Boyd community hub, means Creative Spaces now manages 80 artist studios, across three facilities, housing approximately 100 artists. The inaugural Melbourne Indigenous Arts Festival drew more than 92,000 visitors to the city in February 2012, raising the profile of Indigenous arts within the city. Highlights from the festival included musicians Dan Sultan, Troy Cassar-Daley and Casey Donovan, traditional Aboriginal dancers on the Birrarung Marr earth stage, Blak Nite Cinema screenings at ACMI and the 2011 Laneway Commissions showcasing the work of six Aboriginal and Torres Strait Islander artists. The First Friday Dance Club kicked into life in May and June 2012 and had people dancing in the street at Queensbridge Square in Southbank. The club encourages members of the public to join local professional dancers for an action-packed dance session, with a new theme each month. Approximately 900 people, of all ages and levels of experience, participated in the Swing and Bollywood inspired events. Musical Melbourne The second Melbourne Music Week saw over 16,000 people flock to the city for nine days of music, dancing and fun. The innovative program featured 170 acts in 70 cutting-edge events, staged at 40 unique locations across the city. From the German light installation and temporary outdoor performance space KUBIK in Birrarung Marr, to the rooftop of Melbourne Central and St Michael’s Church, Melburnians stepped out in force to enjoy the musical fiesta.
The Giant Theremin also made its debut in Melbourne Music Week. Controlled by movement rather than touch, the seven-metre tall, pyramid-like instrument was used to link the arts with a social and physically-healthy lifestyle. Created by renowned Melbourne-based artist, Robin Fox the Giant Theremin received an overwhelmingly positive response from pedestrians and visitors who interacted with the unusual instrument during its tenure on Northbank.
Melbourne’s refurbished Federation Bells were relaunched on Friday 13 April 2012 by the City of Melbourne and Arts Victoria, marking the conclusion of the bells’ capital upgrade project. Two progressive groups from Melbourne's music scene created new works for the bells to match the eerie theme of Friday 13th.
16

The City of Melbourne’s ‘Organ & ...’ series raised the profile of the Town Hall's spectacular Grand Organ by matching the instrument with other musical forces in a unique concert series. The guest list included visiting Italian organist Mario Duella, local keyboard hero Anthony Halliday and the musical corps of the Royal Australian Air Force.
Theatrical Melbourne The Arts House in North Melbourne is a City of Melbourne contemporary arts initiative presenting a curated program of contemporary art including performances, exhibitions, live art, installations and cultural events. The 2011-12 program featured over 25 performance seasons and installations from local, national and international companies, including partnerships with the Melbourne International Arts Festival and Next Wave festival. Culture Lab, the Arts House’s creative development program, ran throughout the year, providing artists and companies with the time and space to develop new work. Arts House also continued its successful Green Tix for Nix initiative, which offered four Saturday matinees free to patrons who travelled to the venue using environmentally-friendly transport. In May 2012, Berlin-based theatre makers Rimini Protokoll created a portrait of Melbourne on stage at Town Hall in the theatre spectacle 100% Melbourne. The performance revealed ‘who’ Melbourne is as a city by placing 100 everyday Melburnians, carefully chosen for their statistical representation, on a stage. Over 2000 people attended the three performances. Audiences overwhelmingly rated the work as a provoking, engaging and deeply human experience. Creative kids ArtPlay and Signal both provide space in the heart of the city where young people can be creative and express themselves in a safe and open environment. This year ArtPlay’s highlights included exploring baby art, partnering with the Melbourne Recital Centre for the first time in MusicPlay, hosting Icelandic band Amiina, performing at the MSO’s Beethoven Festival, and partnering with the Danish Arts Agency and Lego Education for the Green City of the Future program, which saw the Crown Prince and Princess of Denmark visit the centre. Signal continues to develop the creative potential of young people aged 13 to 20 through innovative programs. Young performers teamed up with the contemporary dance company Chunky Move to choreograph and stage a free production in August 2011. Signal’s creative arts program Evolution continued to illustrate the benefits unemployed and disengaged young people can derive from working creatively under the guidance of professional artists. The program featured in the Department of Human Services’ 2011 Good Practice Guide. Children at the City of Melbourne’s five childcare centres had the opportunity to work with an artist and create their own book as part of the Children’s Publishing Project. The exercise nurtured their creativity and literacy, while fostering a love of reading. One of the finished books, I Spy with my Little Eye, was published in English and Somali versions. Meanwhile children at the North Melbourne Children’s Centre got their hands dirty designing and building a new mosaic for the centre, in collaboration with students from the University of Melbourne. The mosaic was based on one of the children's favourite books, Isabella’s Garden by Glenda Millard, and has greatly enhanced the street presence of the centre.
17

Strategic indicators Name Indicator Target 2009-10 2010-11 2011-12
The number of new artist/arts organisations located within the municipality linked to the City of Melbourne's Housing of the Arts Strategy
# 50 78 75 100
18

Goal 3 – Economic prosperity The sustainability and resilience of our city's economy is critical to Melbourne’s future growth. This goal capitalises on our international profile as a sporting city and promotes our world-famous events to ensure people continue to visit the municipality. Our support of city businesses will emphasise small and medium businesses, draw on the diversity of our local economy and assist Melburnians to achieve prosperity through social enterprise. The Council works locally, nationally and globally to continue to strengthen the local economy. As a city we will be prepared and well positioned to meet the challenges of the global economy. The City of Melbourne works hard to build the economic prosperity of the city. The following activities are a collection of highlights from 2011-12. Business in the city Melbourne is well known for its fine cusine, thriving cafe culture, action-packed events calender and cosmopolitan community, making it a great city of business of all shapes and sizes. Business grants are just one way the City of Melbourne supports business in the municipality. Small business, social enterprise and micro business grants aim to increase business diversity in the city and support the implementation of innovative business ideas. Fifty-six grant applications were received in the March 2011 round, with many applicants hoping to emulate the success of previous grant recipients KoKo Black, the City Rooftop Cinema and KeepCup. We also help organisations stage business events in the city through the Business Events Sponsorship program. A total of $35,000 in funding was provided in two grant rounds. Four of the six events that received funding were staged in 2011-12, with the remaining two events scheduled for July 2012. The long-term commitment and contribution of small and family-run businesses to Melbourne was celebrated at the Lord Mayor’s Commendations. Sixty small business proprietors and five generational family businesses were honoured in a presentation ceremony held at the Melbourne Town Hall in May 2012. The City of Melbourne also acknowledged the people and business which have made the city what it is today at the Melbourne Awards in August 2011. Nine individuals, businesses and community groups were honoured in the 2011 Melbourne Awards. Businessman and philanthropist, Harold Mitchell AC, was named 2011 Melburnian of the Year – the city’s highest accolade. Enhance visitation to the city It’s the workers, visitors and tourists who give life to a city. As the events capital of Australia the City of Melbourne is well aware of the role events and entertainment play in bringing people into the municipality’s many shops, cafes, restaurants and businesses. As described in Goal 1 – A city for people (refer to page 12), the City of Melbourne is home to numerous events and activities, ranging from international sporting events and large-scale festivals to small community-focused events. Combined, these events attract millions of people to the municipality every year.
19

The City of Melbourne’s premier events include Moomba, New Year's Eve, Melbourne Music Week and Melbourne Spring Fashion Week.
The Moomba Festival has been a Melbourne institution for more than 50 years. In 2012 the event broke a record with over 1.2 million patrons attending and the festival is estimated to have injected $40 million into the local economy. The 2012 festival featured local artists from the Victorian Opera and African choir Jabula at the opening and closing concerts and celebrated our community and food culture with the parade theme ‘Melbourne is Delicious’. Moomba 2012 was highly acclaimed by audiences, media and contributors alike with $9 million worth of local, national and international media coverage and record crowds. New Year's Eve 2011 saw the introduction of a creative theme for the first time. 'Gold Melbourne' told the story of the city’s gold rush era through projections, lighting and entertainment, culminating in a midnight fireworks display to bring in 2012. The event continues to grow with $20 million injected into the local economy and 256,800 patrons attending in 2011 (a 16 per cent increase from 2010) with 48,100 of these patrons gathering at the Family Precinct in Yarra Park. Winner of the 2010 Australian Best New Event, at the Australian Event Awards, Melbourne Music Week returned for its second year in 2011. Showcasing 170 acts and attracting a crowd of over 16,000, the festival partnered with the local music industry to create a unique program staged in over 40 locations across the city, including live music venues, laneways, record shops, cinemas, cafes, bars and shops. A highlight of the festival was the critically-acclaimed Australian premiere of the German-designed, open-air installation/venue KUBIK in Birrarung Marr – a concept which has enjoyed successful incarnations in 22 cities across Europe. Now in its 17th year, Melbourne Spring Fashion Week (MSFW) continues to be the city’s most exciting consumer fashion event, with international ambassador Dannii Minogue, increasing the event’s coverage and reach in 2011. MSFW provides valuable support to the retail, design and fashion industry by making fashion more accessible. The program featured 227 events, attracted over 100,000 visitors and contributed over $1.7 million to Melbourne’s economy. The addition of an all-weather runway in the City Square provided a great stage for free lunchtime and evening activities. Visitors were also encouraged to go beyond the official program and explore the city’s many retail precincts, spending an average of $310 each, resulting in an injection of over $5 million into the city economy.
The City of Melbourne’s celebration events are a group of events that celebrate and promote the people, places and businesses that make Melbourne one of the world's most liveable cities. The Melbourne Celebrations events have enjoyed significant growth over the last year with the Melbourne Awards, Lord Mayor’s Commendations and the Women in Business luncheon enjoying sell-out success and increased entries. Melbourne celebration events include:
Melbourne Awards – The 2011 Melbourne Awards Program attracted 193 registrations, a 99 per cent increase on the previous year. Harold Mitchell was named the Melburnian of the Year at the gala dinner. Lord Mayor's Commendations – The Lord Mayor’s Commendations saw 60 small business and five multi-generational commendations presented at the ceremony in May 2011. The ceremony included a magnificent performance by international organist Gordan Stewart. Melbourne Women in Business luncheon – Once again the Women in Business luncheon was a sell-out with 480 people in attendance. Guest speakers included presentations by Jennifer Westacott, Elizabeth Chong and Amy McPartlan. Funds raised at this event supported the Women’s Ovarian Cancer Institute.
20

Event calendar summary
Event
Event date
Melbourne Spring Fashion Week 5-11 September 2011 Lord Mayor’s Commendations 17 October 2011 and 14 May 2012 Women in Business Luncheon 28 October 2011 Melbourne Music Week 18-26 November 2011 Docklands Winter Fireworks July 2011 Melbourne Awards 27 August 2011 Christmas in the city 4 – 25 December 2011 New Year's Eve 31 December 2011 Sunset Series 14-15 and 21-22 January Melbourne Indigenous Arts Festival 10-12 February 2011 Moomba Festival 9-12 March 2012
City of Melbourne Triennial Sponsorship recipients 2011-14
Event
Organisation Name Event date
ANZAC Day Returned and Services League – Victorian Branch
25 April 2012
Australia Day Department of Premier and Cabinet
26-29 January 2012
Australian Open Tennis Australia 16-29 January 2012
FCA Melbourne Chinese New Year Festival
Federation of Chinese Association Inc.
29 January 2012
Formula 1 Australian Grand Prix
Australian Grand Prix Corporation
15-18 March 2012
L’Oreal Melbourne Fashion Festival
L’Oreal Melbourne Fashion Festival
10-17 March 2012
Melbourne Cup Carnival/Parade
Victoria Racing Club 29 October to 5 November 2011
Melbourne Food and Wine Festival
Melbourne Food and Wine Events Limited
2-21 March 2012
Melbourne International Flower and Garden Show
IMG – Melbourne International Flower and Garden Show
28 March to 1 April 2012
Midsumma Festival Midsumma Festival Incorporated
15 January to 5 February 2012
Toyota AFL Grand Final Week/Parade
Australian Football League 19-24 September 2011
City of Melbourne Arts Sponsorship recipients 2011-2012
Event Event Date Melbourne International Film Festival (MIFF) 21 July to 7 August 2011 Melbourne Fringe Festival 21 September to 9 October 2011 Melbourne Festival 6-22 October 2011 Melbourne International Comedy Festival 28 March to 22 April 2012
21

Christmas in the city In 2011 the City of Melbourne added a new string of events and installations to the calendar, to establish Melbourne as the Christmas Capital. Thirty new large-scale decorations installed at strategic locations throughout the central city and surrounding suburbs encouraged city visits during the festive season. The new decorations were inspired by traditional Christmas carols and complemented the style and sophistication of Melbourne’s beautiful building facades and bustling shopping precincts. The City Square became Christmas Square, filled with an urban forest of living pine trees later replanted in local parks and gardens. Visitors were encouraged to tour the city with a Christmas decorations map, ensuring city businesses and attractions benefited from the passing pedestrian traffic. The Melbourne Town Hall’s City Gallery paid homage to a Christmas tradition, with an entire gingerbread village on display. The village was over 13 metres long and took four chefs from Epicure Catering and 30 hospitality students over two months to build. It featured prominent Melbourne landmarks such as the MCG, Town Hall and the Arts Centre spire. With over 34,000 visitors in December, the village was a huge hit and raised over $6000 for the Starlight Foundation ‘Make a wish’ program. Tourists in the city To improve navigation for new city visitors, the City of Melbourne conducted a signage and wayfinding project, which explored ways of building ‘common threads’ between tourism signage and popular road, public transport and pedestrian routes. The project was a collaboration between VicRoads, Tourism Victoria and Public Transport Victoria. Stage one of the project was completed in April 2012 and recommended participating agencies and councils adopt shared principles and policies for visitor signage, with an integrated approach to signage infrastructure. The City of Melbourne and Destination Melbourne teamed up with the Melbourne Convention and Visitors Bureau (MCVB) as well as the Melbourne Convention and Exhibition Centre to conduct a pilot initiative in May 2012 to encourage the convention centre’s business delegates to explore the municipality through a program of targeted campaigns. Research conducted by the MCVB found that international convention delegates spend (on average) five to six times that of international leisure tourists. The results of the City Yield pilot program were returned in June 2012 and will inform the development of new initiatives to target convention centre delegates. Connecting with other cities
The City of Melbourne led a business mission of 31 delegates from 20 businesses and organisations to China and Japan in October 2011. The Enterprise Melbourne mission met with the Mayor of Tianjin and the Mayor of Beijing to profile Melbourne’s capabilities in key industry sectors. Melbourne industry’s expertise in urban design, sustainability, education, training and biotechnology were showcased in Beijing, Guangzhou and our sister city Tianjin, to facilitate export and investment opportunities.
The mission resulted in eight Memoranda of Understanding (MoUs) and agreements being signed. These included a scientific and technological cooperation agreement relating to cancer diagnosis and treatment, and an agreement to promote, strengthen and expand cooperation in trade, economic, scientific, eco-city construction and environmental technology.
Nine delegates representing state and local governments and private enterprise participated in the Enterprise Melbourne Osaka 2011 Business Partner City mission in late October 2011. The City of Melbourne led a waste-management study tour and the delegation
22

investigated advances in waste management and particularly waste-to-energy technology. Presenting at forums and seminars, delegates highlighted Melbourne’s capabilities in urban design and sustainability to fellow delegates and the Kansai business community. The City of Melbourne took its turn as host when the Tianjin Commission of Commerce delegation visited Melbourne in March 2012. Led by the Director General of Tianjin Commission of Commerce, the delegation attended business seminars and networking functions. Over 70 local businesses had a chance to meet the delegation and discuss potential business opportunities. Senior Tianjin government officials participated in a 12-week management course in Melbourne as part of the Tianjin Government Leaders Training Program. Now in its 11th year the program is a partnership between the Tianjin Municipal Government, the City of Melbourne and RMIT University. It has enabled 262 Tianjin leaders to visit Melbourne to study. Twenty senior government officials and managers of state-owned enterprises took part in the June 2012 program. The RMIT course includes lectures, workshops, industry briefings, site visits, social activities and mentoring. The Tianjin leaders even spent an exciting Saturday at the MCG watching an ALF game between Richmond and Fremantle. Business support programs The City of Melbourne has developed a variety of business support programs to help foster and develop business opportunities within the municipality. The Melbourne Retail Strategy 2006-12 is a joint initiative of the City of Melbourne and the Victorian Government, with the aim of positioning Melbourne as Australia's leading retail city. Key initiatives included Look.Stop.Shop. an activation event which involved 29 retailers of all shapes and sizes creating unique window displays and installations responding to the theme ‘design that moves’ as part of the 2011 State of Design festival. The Look.Stop.Shop. initiative has continued as a powerful strategy to engage consumers to large and small retailers, through Premier Events including Melbourne Spring Fashion Week and Melbourne Music Week. The Melbourne Hospitality Strategy 2008-12 supports the city's thriving hospitality sector, which has an annual growth rate of 7.8 per cent. Helpful resources such as the Hospitality Toolkit launched in 2010 and made accessible in an online format in June 2012. The toolkit provides support to people interested in setting up a hospitality business in the municipality and is similar to the support provided by the more generic Small Business Toolkit. Through the Melbourne Business Precincts Program 2011-13 the City of Melbourne provides funding to eligible trader associations for retail development, including marketing initiatives, membership development, business-to-business activity, promotion and events to drive visitation to precinct areas. The program incorporates the municipality's five district areas: District South, District North, District Docklands, Central Districts and Cultural Districts (including Chinatown, the Greek precinct and Lygon Street). There are currently eight trader associations representing these district areas with a combined membership of over 750. The City of Melbourne’s funding commitment to the Melbourne Business Precincts program is $630,000 a year. Meanwhile the Music Strategy for Melbourne has sought to unearth opportunities for the city’s vibrant music industry since it was endorsed by the Council in 2010, with the fledgling Melbourne Music Week the most notable outcome of the strategy. An assessment was also conducted on the impact the music industry has on Melbourne's economy and a music industry business advisor was consulted to assist with developing music performance initiatives. The City of Melbourne also provided support to Music Victoria for an annual music guide in 2011 and has extended its support for an online guide in 2012.
23

Rates in the city Council rates payments are an important source of income for the City of Melbourne. However the Council always looks to minimise the financial impact on ratepayers. Melbourne’s reputation as an attractive place to live, work and invest was underscored with the announcement of a zero per cent rate rise in the 2012-13 Budget. The budget also contained a record $117 million investment in infrastructure and $364 million on community services, to ensure the City of Melbourne remains one of the world’s most liveable cities. Land use in the city During preparation of the City North and Arden-Macaulay Structure Plans the City of Melbourne identified approximately 280 hectares of under-utilised land suitable for intensive urban renewal. Amendments to the planning controls in these two areas have begun. Over the next 20 years these two areas will transform into vibrant, active neighbourhoods where it is projected an additional 42,000 jobs will be accommodated and an additional 20,000 dwellings constructed by 2031. Strategic indicators Name Indicator Target 2009-10 2010-11 2011-12
Community satisfaction rating for overall performance of economic development
% 72 68 66
Average number of daily visitors to Melbourne municipality on a typical weekday
Days 771,000 779,000 788,000 805,000
Number of visitor contacts at the Melbourne Visitor Centre
# 800,000 782,812 822,000 766,339
Number of businesses located in Melbourne municipality
# 17,000 16,905 16,920 17,340
Level of investment by recipients of Small Business Grants
$ 1,000,000 845,690 4,060,000 1,246,439
In response to feedback from local councils, Local Government Victoria introduced methodological and content changes to the Community Satisfaction Survey in 2011-12. These included increasing the sample size from the previous minimum of 350 respondents per municipality up to 400 respondents and ensuring the sample reflects the demographic composition of a municipality. The survey also allows respondents to be ‘residents over 18 years of age’ instead of restricting respondents to ‘head of household’. For these reasons, direct comparison with previous Community Satisfaction Survey results is not possible.
24

Goal 4 – A knowledge city Melbourne's appeal to the international education market and the city’s world-class research facilities are a sound basis for growing our potential and reputation as a knowledge city. The City of Melbourne’s work to position Melbourne as the city of choice for international students will continue. The city's international students have access to a wide range of services and facilities that make Melbourne a global leader in the provision of education. Enhancing our education sector, industry innovation, research, development, business and information technology capabilities will ensure Melbourne remains a world-renowned knowledge city. Melbourne is a thinking city and the City of Melbourne has worked hard to foster a collegiate atmosphere of knowledge exchange. The following examples illustrate some of our initiatives to promote Melbourne as a knowledge city. Student support Melbourne was ranked the best city in Australia for students to live and study in, according to the inaugural ranking of the world’s most student-friendly cities conducted by the QS World University Ranking Group. At an international level, Melbourne followed Paris, London and Boston in the league table of student-friendly cities.
The City of Melbourne’s International Student Welcome Desk program was recognised for its groundbreaking collaborative and inclusive work with an award for Best Practice and Innovation at the 2011 International Education Association of Australia (IEAA) Awards. The welcome desk, located at Melbourne Airport, is resourced by student volunteers who greet incoming students with a warm welcome and vital information on living and studying in Melbourne, including tips on getting around the city, places to visit, major cultural and sporting events, and practical information on employment, renting and consumer rights. The award recognised the value the program adds to improving the study experience of international students in Melbourne. The program is now a bi-annual event, to ensure students who start study mid-year don’t miss out.
The Lord Mayor’s Student Welcome marked the official welcome to the city for international students in March 2012. Around 1800 students assembled in the city square where they were treated to a variety of performances including hip hop dancing and Brazilian music, as they met and mingled with other students. Valuable information on living and studying in Melbourne was also available. International tertiary students currently studying in Melbourne can tap into the City of Melbourne’s International Student Leaders’ Program, EDGE, designed to enhance student leadership skills and assist with career management. The acronym EDGE identifies the four planned stages of the program: Experience, Develop, Generate and Execute. Knowledge building In the community sector, the Melbourne Conversations program continued to engage Melbourne’s broad constituents with a series of conversation events at the Toff In Town, on the second floor of Swanston Street’s historic Curtin House. The series presented topics of interest to a younger audience and is likely to be an ongoing initiative. One of the highlights from the curator series was Melbourne author Alice Pung in conversation with guests. Twenty events showcasing the strength and diversity of Melbourne’s knowledge sector were held during Melbourne Knowledge Week in 2011. Highlights included a Melbourne
25

Conversation on big data, a student placement showcase, the State of Australian Cities conference, discussions on lifelong learning and learning cities, and sessions for small to medium enterprises on commercialisation and collaborating with universities. The City of Melbourne also hosted a Virtual Government event with Chile, which saw almost 1000 people visit the Town Hall over three days in October 2011. The event included a two-way video conference with Chile involving senior Chilean parliamentarians and a mini-consulate created at the Town Hall for participants. Melbourne’s Chilean community appreciated the Town Hall was available for the event and enjoyed connecting with their Chilean roots. Strategic indicators Name Indicator Target 2009-10 2010-11 2011-12
International students studying in the city as a proportion of total tertiary students
% 15 21 22 17
Local students studying in the city as a proportion of total tertiary students
% 85 80 79 83
Number of primary, secondary and tertiary educational facilities in the city
# 385 385 379 361
26

Goal 5 – An eco city Where sustainability is concerned, Melbourne is a recognised leader. Future Melbourne's ambitious goals inspire us to improve the sustainability of the city's building stock, reduce carbon emissions in all areas of city life, develop ways to capture, store and deliver potable water within the municipality and protect our world-renowned parks and gardens. Managing and improving resources and promoting recycling is an increasingly important part of reducing our ecological footprint. We have an important role to play in working with our city to develop sustainable solutions and to plan and execute our preparedness for, and response to, a changing climate. We will work to ensure Melbourne is internationally recognised for our sustainability initiatives and as a leader in sustainable design. The City of Melbourne has risen to the challenge of a changing climate with a raft of creative and cutting edge solutions. The following highlights demonstrate the range of initiatives the City of Melbourne has developed to help make the transition to an ecologically sustainable city and mitigate the threats of climate change. Sustainable open spaces Trees are a defining part of Melbourne. We live in the world’s most liveable city and our parks, gardens, green spaces and tree-lined streets contribute enormously to this status. But the trees are now under threat. More than a decade of drought, severe water restrictions and periods of extreme heat, combined with an ageing tree stock, have put our trees under immense stress and many are now in a state of accelerated decline. Melbourne is expected to lose 27 per cent of its current tree population in the next decade and 44 per cent in the next 20 years. Combined with this loss, Melbourne’s urban forest is facing two significant future challenges: climate change and urban growth. The City of Melbourne’s draft Urban Forest Strategy seeks to manage this change and protect against future vulnerability by providing a robust strategic framework for the evolution and longevity of Melbourne's urban forest. The strategy aims to: adapt our city to climate change
mitigate the urban heat island effect
create healthier ecosystems
promote water-sensitive solutions
engage and involve the community.
The draft strategy was open to community consultation from November 2011 to March 2012. Beyond the city’s urban forest, Melbourne’s parks, gardens, public forecourts, squares, reserves and open spaces are also a defining part of our city and help make Melbourne the world’s most liveable city. In June 2012, the Council endorsed the city’s first Open Space Strategy. The strategy recognises the value of open space in improving community health and wellbeing and sets out significant new spaces to ensure all residents and workers are within walking distance of open space. The City of Melbourne consulted widely and the feedback received helped shape this remarkable and very important strategy. Approximately 3000 new trees were planted within the municipality up until 30 June 2012.
27

Sustainable commercial buildings The City of Melbourne’s 1200 Buildings program supports building owners, managers and facility managers to improve the energy and water efficiency and reduce waste to landfill of commercial buildings in the municipality of Melbourne. Our research shows that 180 buildings have committed to, or are in the process of, undertaking buildings retrofits. Many of these buildings have agreed to share the results publicly through the 1200 Buildings program. One of the most innovative aspects of the program is the access to Environmental Upgrade Finance, enabled through the City of Melbourne Act 2001. This mechanism was developed to encourage environmental retrofitting and to overcome the difficulty many building owners encounter with accessing capital to finance their environmental projects. This new form of finance enables private sector financiers to provide longer-term loans at lower interest rates to be repaid through a council charge on buildings being retrofitted for energy efficiency. The world's first commercial environment upgrade agreement was signed on 30 September 2011 when the City of Melbourne, the Sustainable Melbourne Fund and building owner Varga Brothers agreed to fund a $400,000 retrofit of 460 Collins Street that will reduce greenhouse gas emissions approximately 170 tonnes of CO2-e per year. In December 2011, two more significant Environment Upgrade Agreements were signed under the 1200 Buildings Program for 123 Queen Street and the Kings Technology Park (KTP) precinct. The $1.3 million retrofit of 123 Queen Street will include a tri-generation system to generate electricity, heating and cooling, as well as occupancy sensors and double glazing. The retrofit aims to cut CO2-e emissions by approximately 2500 tonnes per year. The KTP agreement will provide funding towards a $3.2 million retrofit of the business precinct at 100 Dorcas Street, South Melbourne. The upgrade of KTP will see four of the five precinct buildings fitted with new high-efficiency chillers, cooling towers, lighting system upgrades and heating and air conditioning units and controls. The retrofit aims to cut CO2-e emissions by more than 2600 tonnes per year. The 1200 Buildings program was singled out with two awards in 2012. The 2012 Energy Efficiency Visionary Award from Energy Efficiency Global in March 2012 recognised the 1200 Buildings program’s leadership. The program also received the Local Government award for Best Specific Environmental Initiative at the United Nations Association of Australia (UNAA) awards dinner in June 2012. The award was presented as part of the UNAA’s World Environment Day Awards and recognised innovative and outstanding environmental programs. To communicate the benefits of environmental building retrofit to the wider community, the City of Melbourne established the 1200 Buildings Public Art Commission. The winning entry by Arup, ‘The Green Transfer’, is due to be installed on the western facade of 490 Spencer Street in West Melbourne. The City of Melbourne has also partnered with the Victorian Government to promote the national tenant energy efficiency program CitySwitch Green Office. CitySwitch signatories are part of a national network of businesses combating rising energy bills by improving the energy efficiency of their day-to-day workplace operations. A training session on office energy efficiency was run by the City of Melbourne for Melbourne’s CitySwitch signatories in October 2011. Twenty program signatories attended the session and great feedback was received. The hands-on session provided training on energy-efficient office lighting, energy-efficient office equipment, behaviour change and how to conduct overnight energy audits. Work is also underway to evaluate the effectiveness of small changes to existing buildings. In February 2012 the City of Melbourne and Melbourne University released the findings of research into how and where white roofs can be used to help buildings absorb less heat and
28

stay cooler during hot days. The results followed the installation of a cool roof at the City of Melbourne’s ArtPlay facility in Birrarung Marr. Cool roofs not only help keep buildings cooler and reduce air conditioning energy use, they also help reduce the urban heat island effect, which causes Melbourne's central city temperatures to increase by up to 3-4 degrees Celsius above surrounding areas. North Melbourne’s Lady Huntingfield Children's Centre became the second childcare centre in Victoria to receive the coveted Early Childhood Sustainable Practices Accreditation. To achieve the accreditation, Lady Huntingfield had to meet sustainability requirements for water, waste, energy and biodiversity. Part of the improvements included constructing kitchen gardens and installing compost bins, a solar hot water system and rainwater tank as well as reducing the number of fridges, from nine down to five. The accreditation recognises the centre as a healthy, happy and environmentally-friendly place for children to grow and learn. Sustainable residential buildings The Higher Density Residential Efficiency Solutions project, know as Hi-RES, aims to understand how residents in apartment buildings can be helped to reduce their environmental impacts. Approximately 70 per cent of our residents live in apartments and each year they contribute:
22 per cent of the city’s water usage
9 per cent of greenhouse gas emissions
more than 14,000 tonnes of waste.
Those living in and owning apartments face unique challenges in sustainable living, so the City of Melbourne has created programs to work with apartment owners, residents and their professional managers to reduce water and energy use and better manage waste and recycling. In addition, the Hi-RES program has identified and developed solutions to support apartment buildings that need retrofitting to become more sustainable. The project identified information as critical in overcoming barriers to retrofitting Victoria’s existing apartment buildings. Two good practice guides were developed to help facility managers, owners and occupiers to understand what it means to own, live or work within a sustainable apartment building. Community engagement is therefore important for successfully implementing sustainable change. The City of Melbourne led development of the grant application for a national sustainability program for apartment owners, in partnership with the City of Sydney, Green Strata, Owners Corporation Network and Strata Community Australia. The program, Sustainable Strata, was successful in securing over $1 million from the Australian Government’s Energy Efficiency Information Grants program. A leader in sustainability The City of Melbourne was awarded the Leadership in Sustainability Prize at the Annual Australian Achievement in Architecture Awards in March 2011. The award recognises our ongoing work in the future form of cities, population growth and climate change and rewards the work of the City Design division, its director Rob Adams, and the work of the City Planning and Infrastructure division and its director Geoff Lawler. Notable examples of the City of Melbourne’s work in this area included the development of Council House 2, the Queen Victoria Market solar panel installation, the Total Watermark Strategy, the Zero Net Emissions by 2020 target, the Climate Change Adaptation Strategy, the Greenhouse Action Plan and the review of the Municipal Strategic Statement and development of numerous structure plans.
29

The City of Melbourne showcased the city as a leader in sustainability and highlighted the importance of collaboration between cities when we hosted the C40 Workshop on Sustainable Communities in March 2012. The C40 is a group of international cities working to reduce urban carbon emissions and to adapt to climate change. Some of the world’s leading experts on sustainability from 17 cities including Beijing, Copenhagen, London, and Sao Paulo came to Melbourne. The attendees discussed challenges facing their cities including growing populations, opportunities for economic growth and infrastructure and work-shopped new approaches to these challenges to help create a blueprint for sustainable urban development. The City of Melbourne will now lead a new C40 network on Sustainable Urban Development. To help educate and motivate residents to reduce their carbon footprints, the City of Melbourne staged an interactive Eco-City Forum in November 2011. Approximately 40 residents attended the forum and participated in activities including estimating the energy use of different household appliances, identifying places in the city that help them lower their carbon footprint and learning to understand an individual’s carbon footprint using the Australian Greenhouse Calculator. The City of Melbourne also ran an Eco-City Hub for the first time at the Sustainable Living Festival in February 2012. Eco-City programs, projects and strategies from the City of Melbourne were on show at the marquee and staff engaged with many visitors, residents and other exhibitors over the three-day weekend, capturing ideas, conducting interviews and collecting surveys and feedback on current projects out for public consultation. More than 30 members of the Carlton community gathered for the launch of the Carlton Eco-Neighbourhood project during Green Building Week. Through the project, residents in the new Carlton housing redevelopment learnt about the environmental features in their buildings and connected with their neighbours. The first stage of a larger Eco Carlton program, the Carlton Eco-Neighbourhood project is operated by the City of Melbourne in partnership with Environment Victoria and the Department of Human Services. Eco Carlton is part of the Carlton Community Plan, developed through the Opportunities for Carlton network. Water catchment and drought proofing In a world first, the City of Melbourne has introduced a cutting-edge, inroad stormwater harvest scheme to help save more than 20 million litres of water and safeguard trees and parks in the municipality. The completion of the $1.725 million Darling Street stormwater project in June 2012, ensures Darling Square, Powlett Reserve and several tree-lined median strips in East Melbourne thrive well into the future. The City of Melbourne has invested in a number of stormwater projects as part of our climate change adaptation program to ensure the survival of Melbourne’s heritage-listed parks, gardens and trees for generations to come. Drought proofing works in other areas of the municipality include water-saving plans for the Fitzroy Gardens depot area, Birrarung Marr, Alexandra Gardens and Queen Victoria Gardens. The stormwater-harvesting projects allow water which otherwise would be lost to be treated and re-used on the city’s parks and gardens. This re used water helps conserve drinking water, improves local amenity and limits the amount of run-off, which collects rubbish and pollution from the streets as it flows into creeks and rivers on its way to the sea. The City of Melbourne has also drought proofed the North Melbourne Recreation Centre through an innovative water harvest system that will potentially save up to 500,000 litres of drinking water each year. The system diverts backwash water destined for the sewers for use irrigating the lawns and gardens around the centre during periods of dry weather. Most of Melbourne’s decorative fountains were switched off in 2006 and 2007, at the height of level 3A water restrictions. Now, thanks to a $1 million investment from the City of Melbourne, many of the city’s fountains are running once again. This year has seen the
30
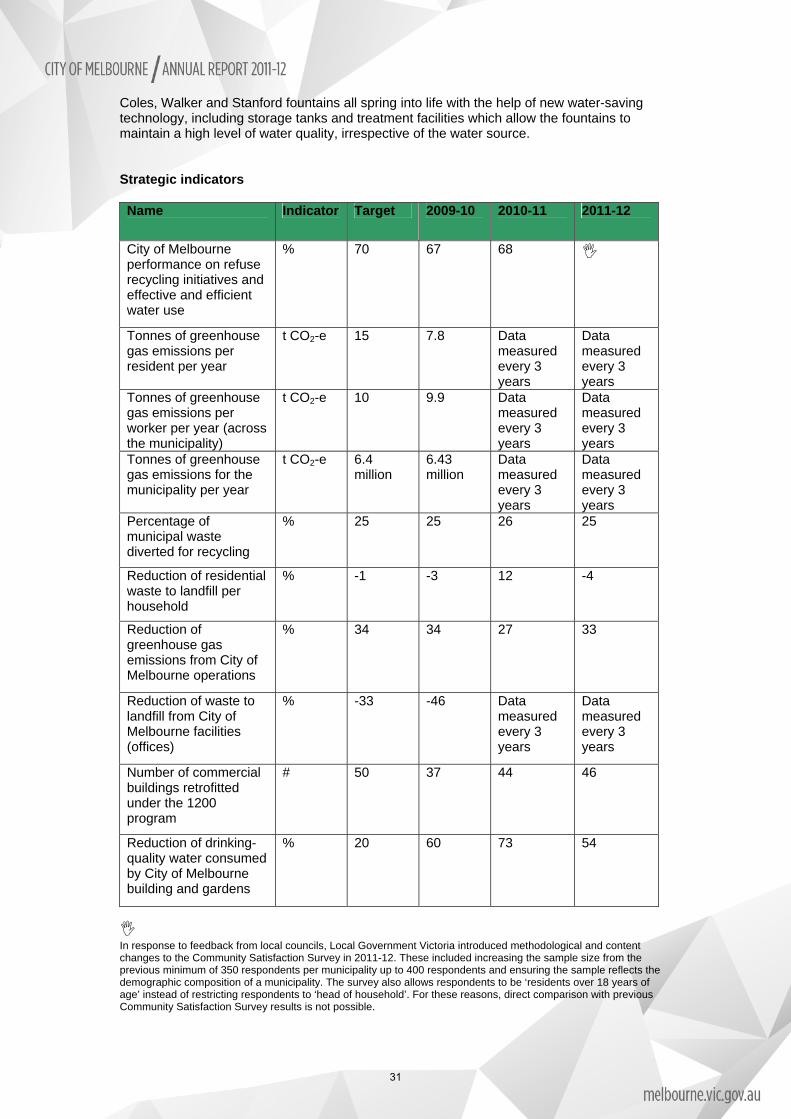
Coles, Walker and Stanford fountains all spring into life with the help of new water-saving technology, including storage tanks and treatment facilities which allow the fountains to maintain a high level of water quality, irrespective of the water source. Strategic indicators Name Indicator Target 2009-10 2010-11 2011-12
City of Melbourne performance on refuse recycling initiatives and effective and efficient water use
% 70 67 68
Tonnes of greenhouse gas emissions per resident per year
t CO2-e 15 7.8 Data measured every 3 years
Data measured every 3 years
Tonnes of greenhouse gas emissions per worker per year (across the municipality)
t CO2-e 10 9.9 Data measured every 3 years
Data measured every 3 years
Tonnes of greenhouse gas emissions for the municipality per year
t CO2-e 6.4 million
6.43 million
Data measured every 3 years
Data measured every 3 years
Percentage of municipal waste diverted for recycling
% 25 25 26 25
Reduction of residential waste to landfill per household
% -1 -3 12 -4
Reduction of greenhouse gas emissions from City of Melbourne operations
% 34 34 27 33
Reduction of waste to landfill from City of Melbourne facilities (offices)
% -33 -46 Data measured every 3 years
Data measured every 3 years
Number of commercial buildings retrofitted under the 1200 program
# 50 37 44 46
Reduction of drinking- quality water consumed by City of Melbourne building and gardens
% 20 60
73
54
In response to feedback from local councils, Local Government Victoria introduced methodological and content changes to the Community Satisfaction Survey in 2011-12. These included increasing the sample size from the previous minimum of 350 respondents per municipality up to 400 respondents and ensuring the sample reflects the demographic composition of a municipality. The survey also allows respondents to be ‘residents over 18 years of age’ instead of restricting respondents to ‘head of household’. For these reasons, direct comparison with previous Community Satisfaction Survey results is not possible.
31

City of Melbourne sustainability indicators The City of Melbourne consumes energy in the daily operation of its administration and buildings, community buildings such as childcare centres, public lighting and through the corporate fleet. We monitor the consumption of three major energy types: electricity, natural gas and fuel. City of Melbourne’s energy use by source Energy use by source
Base year 1996-97*
2007-08 2008-09 2009-10 2010-11 ** 2011-12 ***
Electricity (Vic grid)
76,070 56,532 70,725 57,635 61,878 58,443
Electricity (green power)
0 34,660 24,243 42,695 33,085 33,700
Electricity (Solar / CoGen)
144 109
Natural gas 14,626 18,157 19,276 21,079 17,612 19,950 Unleaded petrol
13,700 6,714 5,787 4,896 4,026 3,401
LPG fuel 0 431 477 511 354 4 Diesel 0 118 431 741 886 1,353 Ethanol 0 0 0 0 2 0 Total energy use (GJ)
104,396 116,612 120,589 127,561 117,986 116,960
% Renewable 20% 29.7% 20.1% 33.4% 28.2% 28.9% Notes * In 1996-97 a baseline was established which became our base year. An investigation of our historical records has resulted in changes to these figures from previously-reported results. ** Figures previously published for this year were estimates and adjustments have been made to reflect actual results available at the time of printing. *** Due to billing cycles these figures include estimated calculations based on current and seasonal trends.
City of Melbourne’s energy use by activity Energy use by source
Base year 1996-97*
2007-08 2008-09 2009-10 2010-11** 2011-12***
Administration – buildings
18,632 22,356 21,967 21,386 20,979 23,857
Administration – fleet
13,700 7,264 6,695 6,151 5,267 4,759
Commercial – buildings
2,754 3,434 3,094 5,057 4,238 5,005
Community use – buildings
21,688 23,977 26,016 30,707 28,020 27,485
Community use – public lighting
46,412 55,549 57,933 58,240 54,899 51,430
Community use – miscellaneous
1,230 4,033 4,884 6,019 4,583 4,425
Total energy use (GJ)
104,396 116,612 120,589 127,561 117,882 116,960
Notes * In 1996-97 a baseline was established which became our base year. An investigation of our historical records has resulted in changes to these figures from previously-reported results. ** Figures previously published for this year were estimates and adjustments have been made to reflect actual results available at the time of printing. *** Due to billing cycles these figures include estimated calculations based on current and seasonal trends.
32

Total direct and indirect greenhouse gas emissions Total emissions
Base year 1996-97*
2007-08 2008-09 2009-10 2010-11 ** 2011-12 ***
Emissions (t CO2-e)
31,165 20,638 25,339 21,074 22,049 20,977
Percentage from base year
-33.8% -18.7% -32.4% -29% -32.7
Percentage from previous year
5.8% 22.8% -20.7% 5% -5%
Notes * In 1996-97 a baseline was established which became our base year. An investigation of our historical records has resulted in changes to these figures from previously reported results. ** Figures previously published for this year were estimates and adjustments have been made to reflect actual results available at the time of printing. *** Due to billing cycles these figures include estimated calculations based on current and seasonal trends. City of Melbourne total water use Total COM water use
Base year 1999-2000*
2007-08 2008-09 2009-10 2010-11 ** 2011-12 ***
Potable (Ml) 1,544 520 607 623 390 715 Reclaimed (Ml)
0 87 73 90 65 90
Total water 1,544 607 680 713 455 806 Percentage from base year
-60.7% -56% -53.8% -70.5% -47.8%
Percentage from previous year
-19.2% 12% 17.4% -36.2% 77.1%
Percentage reclaimed
14.3% 10.7% 12.7% 14.3% 11.2%
Notes * In 1999-2000 a baseline was established which became our base year. ** Figures previously published for this year were estimates and adjustments have been made to reflect actual results available at the time of printing. *** Due to billing cycles these figures include estimated calculations based on current and seasonal trends.
Water use by activity Total COM water use
Base year 1999-2000*
2007-08 2008-09 200910 2010-11 ** 2011-12 ***
Administration – buildings
11 4 4 9 15 11
Commercial – buildings
1 2 6 4 4 4
Community use – buildings
70 45 41 47 43 94
Community use – open space
1,462 557 629 654 393 696
Total water (ML)
1,544 607 680 714 455 806
Notes * In 1999-2000 a baseline was established which became our base year. ** Figures previously published for this year were estimates and adjustments have been made to reflect actual results available at the time of printing. *** Due to billing cycles these figures include estimated calculations based on current and seasonal trends.
33
Goal 6 – A connected city In a connected city, people can move about easily to communicate and trade – locally, regionally and globally – without sacrificing essential social or ecological values. The Council will focus on advocating for safe, efficient and sustainable movement throughout the city and make sure Melbourne is accessible in the broader regional and global context. The easy movement of people and goods is essential for a high performance city. The following examples provide an overview of the work being done to increase connectivity in the municipality in 2011-12. Accessible streets Great streets make great cities and the redevelopment of Swanston Street will ensure Melbourne’s civic spine continues the renaissance that began in the mid-1990s with the redevelopment of the City Square and the creation of Federation Square. The $25.6 million redevelopment focuses on four locations: the City Square, the Bourke Street Mall, the State Library and RMIT. Each location includes the following design improvements:
universally-accessible tram stops
paving and kerb design to support safer cycling
new lighting
new street furniture
bluestone paving
garden beds.
The first new tram zone at the State Library/Melbourne Central was completed in November 2011. In preparation for its operation, the City of Melbourne engaged the peak bodies of all Swanston Street user groups to help devise a creative safety behaviour change program for the new road and tram stops. The first day of operation saw actors dressed as sports umpires patrolling the new tram stop to reward good behaviour and point out unsafe behaviour in an amusing and non-confrontational manner, which was well-received by users. The elimination of motor vehicles and the construction of a dedicated bicycle lane have provided an excellent environment for pedestrians, tram users and cyclists. The remainder of the Swanston Street redevelopment is due to be completed by the end of 2012. Transport for the future The City of Melbourne Transport Strategy 2012 was unanimously endorsed by the Council in May 2012, following a major review and update of the 2006 strategy. The new strategy’s key directions include significantly enhancing public transport, cycling and walking networks, greater integration of transport and land-use planning, optimising the efficiency of Melbourne’s road network and fostering innovative, low-impact delivery of freight in the city. The strategy aims to increase the number of people catching public transport, walking or cycling to visit the city from 50.9 per cent (2009 figure) to 80 per cent by 2030.
34

Parking modernisation New parking technology was introduced to the city in the first major upgrade in 30 years. The new technology offers a more consistent and accurate approach to parking enforcement to improve the steady turnover of bays and encourage people to comply with parking restrictions. One element of the new technology did not perform as planned and was withdrawn from service. The City of Melbourne also began a 12-month trial of pay-by-phone parking technology in a small section of Carlton in September 2011. Parking signs and meters were placed in the area to let motorists know that pay-by-phone parking was available and to give them quick and clear instructions on how to register and use the technology. Integrated bicycle networks An integrated, safe and accessible bicycle network will be created in the municipality with an extension of the city’s bicycle lanes and paths by 15 kilometres over 2012. The draft Bicycle Plan 2012-16 was out for public consultation in May 2012 and will build on the recent success of dedicated bike lanes in Albert Street and parts of Swanston Street, with the installation of new bike lanes on some of Melbourne’s arterial roads including La Trobe Street, Exhibition Street, Elizabeth Street and Princes Bridge as part of a $5.6 million project to improve the connections between people and places. The plan also recognises that investment is required for people to feel legitimate, safe and supported when they cycle. The goals of the draft Bicycle Plan are to:
plan and deliver a connected cycling network build high quality routes for local cycling trips increase participation in cycling make cycling safer introduce advances in cycling innovation.
Accessible pavements Walking plays a huge role in supporting Melbourne’s economy. It is the main travel mode for more than 63 per cent of all work trips within the municipality. Improving pedestrian mobility is one of several aims of the City of Melbourne’s new Transport Strategy which is planning for a transport network to handle projected growth in trips from 2.1 million to 3.3 million each weekday to, from and within the city by 2030. In preparation for this growth, pedestrian safety has been improved with capital works projects at numerous crossings in 2011-12. Works included constructing several centre-of-road pedestrian refuges, footpath widening, installing traffic signals and raised zebra pedestrian crossings as well as roundabout remodelling to reduce traffic speed. The City of Melbourne also secured the intermittent closure of several streets (to motor vehicles), which have become popular pedestrian thoroughfares at certain times of the day, including restrictions on the vehicles access to Southbank Promenade at Southgate Avenue. Walkers and runners also benefited from improvements to the Domain’s Tan Track with the installation of new digital time clocks as well as new lighting and the widening of the track between Anderson Street and the Observatory Gate.
35

Safe bridges The City of Melbourne looks after 12 main bridges in the municipality and has been working on the restoration of three of the oldest bridges in 2011-12. Barges on the Yarra River have been at work under Queens Bridge to strengthen the wrought iron structure that has supported the bridge since 1889. At Princes Bridge the historic balustrade, which was carefully stored away for years, was reinstated as part of the Hamer Hall redevelopment. Meanwhile restoration works at the Angliss Stock Bridge, which spans the Maribyrnong River in Kensington, will see the bridge revert to its original steel grey appearance, while maintaining access for pedestrians and cyclists. Strategic indicators Name Indicator Target 2009-10 2010-11 2011-12
Community satisfaction rating for overall performance of local roads and footpaths
% 68 68 65
City of Melbourne performance on promoting use of public transport
% 65 73 80
City of Melbourne performance on quality and coverage of bike and footpaths and convenience of walking around the central city
% 70 69 70
Community satisfaction rating for overall performance of traffic management and parking facilities
% 55 55 53
Mode share for public transport, motor bikes, walking and cycling of Victorian city users
% 43 48 48 Data not yet available
In response to feedback from local councils, Local Government Victoria introduced methodological and content changes to the Community Satisfaction Survey in 2011-12. These included increasing the sample size from the previous minimum of 350 respondents per municipality up to 400 respondents and ensuring the sample reflects the demographic composition of a municipality. The survey also allows respondents to be ‘residents over 18 years of age’ instead of restricting respondents to ‘head of household’. For these reasons, direct comparison with previous Community Satisfaction Survey results is not possible.
36

Goal 7 – Lead by example The Council is committed to ensuring the City of Melbourne remains highly regarded for its leadership, its strong relationships and its ability to achieve the best outcomes for the community. This includes excellence in governance and organisational practices. As the world’s most liveable city, the City of Melbourne actively and consciously strives for excellence in all its operations. The following highlights present a snapshot of work to help achieve this goal in 2011-12. Leading organisational practice The City of Melbourne was recognised as one of Australia’s top public sector employers in the Australian HR Awards 2011. The City of Melbourne was nominated as a finalist in the Employer of Choice (public sector and NFP) category. Similarly our commitment to occupational health, safety and wellbeing was recognised by the Institute of Public Administration Australia’s Leadership in the Public Sector Awards. The organisation was singled out as a finalist in the category Leading the Way in Health, Safety and Wellbeing 2011. The introduction of proactive injury management strategies at the City of Melbourne has seen a reduction of almost $600,000 on the organisation’s WorkSafe Insurance Premiums. Our insurance rates have also dropped considerably and our performance in this area is more than 80 per cent better than the industry average. With many City of Melbourne employees working in offices, staff were encouraged to be active by participating in the Global Corporate Challenge. Overall 364 employees took part, resulting in a total of 431,732,612 steps, which equates to walking around Earth 6.9 times and ranked the organisation 34 out of 611 Australian teams. The City of Melbourne’s participation enabled 364 local primary school children to get more active and healthy by participating in the Global Children’s Challenge, at no cost. The City of Melbourne was the first local government in Victoria to introduce electric vehicles into fleet operations in 2008 with the support of the Department of Transport and the Department of Innovation, Industry and Regional Development. At the time, the City of Melbourne supported the locally-developed Electric Blade technology and we have since trialed other electric vehicles. In 2011-12 two Nissan LEAF electric vehicles were added to the fleet as part of the Victorian Electric Vehicle Trial. Being available and accessible to the public is very important as a leading city council. The City of Melbourne’s overall customer satisfaction rating was 86 per cent for 2011-12 and 93 per cent of inquiries from the public were completed on time. In 2011-12, the public chose to contact us in a variety of ways, with the total number of customer contacts received distributed as follows:
273,317 by telephone
40,383 in person
12,153 via email/web
121,320 via SMS.
Leading program delivery The City of Melbourne acknowledges Indigenous Australians were the first people of this land and have striven to retain their culture and identity since non-Indigenous settlement. To
37

formalise this acknowledgment a Reconciliation Action Plan was developed to outline the strategic approach we will take to reconciliation from 2011 to 2014. This is the third action plan the City of Melbourne has entered into with Reconciliation Australia and it demonstrates our commitment to Aboriginal and Torres Strait Islander peoples. Leah Armstrong, CEO of Reconciliation Australia, commended the City of Melbourne for being a trailblazer for reconciliation. The action plan was launched at the opening night of the inaugural Melbourne Indigenous Arts Festival in February 2012. The plan is a positive acknowledgment of Aboriginal and Torres Strait Islander culture as a living, contemporary set of stories and beliefs. It was unanimously endorsed by the Council in 2011 and includes some significant initiatives. In the creative sphere, River Studios won the Australian Institute of Architects Award for best Small Project 2011 (VIC). The studios, which provide secure and affordable space for over 80 artists in a refurbished warehouse, were developed by the City of Melbourne in partnership with Arts Victoria and the owner of the building. The project used recycled and sustainable materials to produce novel and inventive solutions. Embracing new technology is importance to the City of Melbourne and on New Year's Eve, 50,000 people counted down to 2012 on a mobile device using the City of Melbourne's first mobile website or ‘msite’. The New Year's Eve msite was specifically designed for mobile device users (iPhone, iPad, android phones and tablets) and provided a user-friendly summary version of the traditional event website. The msite featured a countdown clock, real-time safety information, maps, transport information and highlights of planned activities throughout the evening. Continuing the technology theme, Melbourne Library Service was the first library in Australia to offer Freegal downloadable music. This innovative service gives patrons access to the Sony music catalogue with over 500,000 songs to download and keep. The provision of downloadable music through the library service reflects current trends in consumer behaviour and expectations. The Melbourne Library Service also offers cardless membership for members who only want to borrow e-resources. In 2011-12, over 17,000 new members signed up to the Melbourne Library Service. All aspects of the City of Melbourne’s family support and counselling service were examined in detail during a Department of Human Services regulatory audit. The City of Melbourne was highly commended for its excellent service provision and the high quality of practice standards and guidelines. The auditors were also impressed with the uptake of services from families from culturally and linguistically-diverse backgrounds and the cultural competence of staff. The integrated model was seen as a best practice model for families. A refurbished communal play space for children in Kensington’s JJ Holland Park received the Sustainable Interior Award at the 2012 Dulux Colour Awards. Known as The Venny, the sustainable, purpose-built clubhouse services children in the neighboring public housing estate and surrounding areas and was funded by the City of Melbourne and the Australian Government. Melbourne City Baths was awarded the Aquatics and Recreation Victoria's Facility Management Award 2012 in recognition of the Baths’ outstanding business management. World’s most liveable city Melbourne was named as the world’s most liveable city by the Economist Intelligence Unit’s Global Liveability Survey. Melbourne topped the 2011 survey with a score of 97.5 per cent, just ahead of Vienna and Vancouver. Cities are scored on political and social stability, crime rates and access to quality health care. The survey also measures the diversity and standard of cultural events and the natural environment, education (school and university) and the standard of infrastructure, including public transport.
38

Awards summary 2011-12 Award
Area Date
National Adaptation Champion (named one of three) National Climate Change Adaptation Research Facility
Climate Change
Jul 2011
Architecture Small Project Award Australian Institute of Architects' Victorian Architecture Awards
Creative Spaces, River Studios
Jul 2011
Employer of Choice, public and not-for-profit sectors (finalist) Australian HR Awards
City of Melbourne
Aug 2011
Holding Redlich Property Industry Award API Excellence in Property Awards (EIPA)
Transforming Australian Cities study
Aug 2011
Green Flag Award Parks Forum Green Flag Award scheme (pilot)
Fitzroy Gardens
Aug 2011
Best New Event, Melbourne Music Week (winner) Best Community Event, New Year’s Family Festival (finalist) Event Manager of the Year, Events Melbourne Team (finalist) Australian Event Awards
Melbourne Music Week 2010
Aug 2011
Employer of Choice Public Sector (finalist) Australian HR Awards
City of Melbourne
Sep 2011
Best Practice and Innovation 2011 International Education Association of Australia Awards
Student Welcome Desk
Oct 2011
Leading the Way in Health, Safety and Wellbeing (finalist) Leadership in the Public Sector Awards, Institute of Public Administration Australia
Health, Safety and Wellbeing
Feb 2012
Leadership in Sustainability Prize Annual Australian Achievement in Architecture Awards
City of Melbourne Sustainability
Mar 2012
2012 Visionary Award Energy Efficiency Global
Energy Efficiency leadership
Apr 2012
Best specific Environmental Initiative Local Government Award United Nations Association of Australia (UNAA) Awards
1200 Buildings program
Jun 2012
Facility Management Award 2012 Aquatics & Recreation Victoria
Melbourne City Baths
Jun 2012
Excellence in eGovernment Awards Geospatial (short-listed) 2012 Australian Government ICT Awards
Geospatial Maps
Jun 2012
39

Strategic indicators Name Indicator Target 2009-10 2010-11 2011-12
Community satisfaction rating for the City of Melbourne's engagement in decision-making on key local issues
% 59 62 59
Community satisfaction rating for overall performance generally of the City of Melbourne
% 70 68 68
Community satisfaction rating for the City of Melbourne s interaction and responsiveness in dealing with the public
% 73 73 72
In response to feedback from local councils, Local Government Victoria introduced methodological and content changes to the Community Satisfaction Survey in 2011-12. These included increasing the sample size from the previous minimum of 350 respondents per municipality up to 400 respondents and ensuring the sample reflects the demographic composition of a municipality. The survey also allows respondents to be ‘residents over 18 years of age’ instead of restricting respondents to ‘head of household’. For these reasons, direct comparison with previous Community Satisfaction Survey results is not possible.
40

Goal 8 – Manage our resources well Our programs and training will focus on attracting and retaining a highly-skilled workforce and all commitments we make will be supported from a diverse revenue base. We recognise that revenue will be impacted by global finances and will continue to monitor our corporate financial performance and strive to achieve efficiencies while maintaining high standards of service. The City of Melbourne proactively identifies and seeks to eliminate waste in all its operations. The following examples demonstrate how the organisation managed its resources in 2011-12. Efficient and effective services Lean Thinking is a world-renowned, continuous improvement methodology, developed in the manufacturing industry and aimed at improving service delivery from the perspective of the customer. The City of Melbourne is the first local government in Australia to undertake an organisational Lean transformation and the approach has two primary goals:
1. To ensure optimal use of resources (mostly people) so we can deliver more services, more value with what we have.
2. To review all processes and systems from a customer perspective, with a focus on delivering what is required by our customers and the community.
Through better alignment of people with processes and purpose, we have contributed more than $800,000 to the bottom line and freed up over 6000 hours of time in 2011-12, so staff could create more value for our community. Overall, nearly $4 million in total saved and 1200 days of feed up staff time since the introduction of Lean in 2009. Now in its fourth year at the City of Melbourne, the Lean Thinking program has had a stronger focus on building Lean capability across the organisation. All new starters received an introduction to Lean Thinking principals in their induction and an in-house Lean Learning Program was established to educate existing staff. All programs included applied learning so individuals and teams could improve processes within their own work areas. Over 70 employees from across the organisation graduated from the Lean Learning Program in 2011-12. Many more will continue on their Lean Learning journey in 2012-13. Notable outcomes from Lean Learning Program:
Waiting times for sports permit applications were reduced from six weeks to two weeks as a result of a process change.
Full syringe bins are emptied within target timeframes, after collaborative work with the service partner, contributing to safer facilities.
Payroll information is delivered to the bank with time to spare, following a process improvement review, reducing staff follow ups and satisfaction.
A review of the arts grant program led to applicants discovering the outcome of their application within 50 days, a reduction of 30 days, and the outcome of their expression of interest within 30 days, down from 120, allowing participants more time to plan for their project.
41

Large organisational change continues to be addressed through Lean Director Streams in which the CEO or directors work alongside team members to make existing organisational processes better, faster, cheaper and easier. In addition to bottom-line savings and staff-time release, over 100 examples of ‘wins’ have been recorded in which our processes have become better, faster, cheaper or easier. Twenty per cent of these wins have improved processes for the benefit of our customers and 40 per cent have made processes easier for staff. Where staff time has been released, value added services have been realised and backlog reduced. Notable outcomes for our community and staff: A significant redesign of aged care services resulted in the addition of 201 extra
assessments for clients in the municipality, with the same number of staff.
The contractor for internal building and equipment repairs and maintenance were able to reduce job resolution time by 60 per cent, following improvements to the maintenance request process, helping staff to get back to ‘business as usual’ as quickly as possible.
Nurses in the municipality’s maternal child health services have an additional 50 minutes a day each to spend with clients, following improvements to the referral and scheduling process.
A centralised booking systems now allows mothers to book a maternal health appointment on the first call, and the need to leave a message on voicemail has almost been eliminated, minimising rework and maximising service time.
The permit application process for weddings in parks (the most popular of all park permit requests), was simplified and better information made available online. This reduced customer enquiries, allowing staff to focus on processing permit applications.
Introducing online payments for childcare and events customers has improved payment flexibility.
A centralised waiting list for childcare has seen childcare space use in the municipality rise 5 per cent and process changes have resulted in places being filled 5 days faster, maximising the availability of childcare services.
Efficient financial management The City of Melbourne introduced a new financial forecasting module in August 2011, on time and on budget. The new software enabled management to report on a monthly basis a ‘rolling forecast’ of the projected full year financial performance of the organisation. As with any forecasts, the rolling forecast is a moving projection updated monthly to reflect the changes in the City of Melbourne’s operating environment. The forecast module has improved the transparency and timeliness of the City of Melbourne’s financial performance.
The organisation’s excellent economic management credentials were confirmed in May 2012, when international ratings agency Standard & Poor’s delivered a AAA/A-1+ report card on the City of Melbourne’s finances. The rating is the highest assigned by the agency and the City of Melbourne was the only Australian council to be receive the top rating. Standard and Poor’s said the City of Melbourne displayed excellent financial management and had a strong balance sheet, a predictable and supportive institutional framework, and strong budgetary flexibility and performance.
As a leading employer the City of Melbourne is keen to attract, develop and retain top talent within the organisation. To meet this challenge the City of Melbourne has partnered with CPA Australia to become the first city council in the country to join the CPA’s Recognised Employer Program. The partnership will make it easier for staff to acquire or maintain CPA status within the organisation.
42

Efficient internal management
The introduction of a swipe-card printer system in 2009 continues to see a reduction in the average number of sheets of paper used per month. Staff continue to save an average of 50 reams per month, or 600 reams per year, which equates to a reduction in our carbon footprint of 45,600 black balloons, or 2.28 tonnes of greenhouse gas (CO2-e) emissions. As a result the City of Melbourne is saving $7000 per year on paper costs, which translates to an average of $18,000 per year including printing costs. Strategic indicators Name Indicator Target 2009-10 2010-11 2011-12
Percentage of planned City of Melbourne works programs completed
% 90 91 94 91
Liquidity ratio is greater than 1.5
% 1.5 3 2.6 1.7
Maintain a positive underlying surplus
$M 3 15.5 17.7 4.4
Percentage of our customers satisfied with the overall customer experience when contacting the City of Melbourne
% 85 84 83 89
Staff retention rate % 90 90 92 89
Staff satisfaction rating # 5.5 5.6 5.5 5.5
Maintain Australian Standard 4801 accreditation*
% 100 100 100 100
* AS/NZS 4801 is the Australian Standard and New Zealand Standard for Occupational Health and Safety Management Systems. It is a Standard that requires five main components of OH&S Management that are implemented into a businesses activities to ensure all OH&S issues are effectively managed.
43

Our organisation
Our people
At the City of Melbourne, our staff are our most important asset. Happy, high-performing staff help us to deliver an exemplary level of service to our community. As a result, the wellbeing of our staff is one of our highest priorities.
Organisational structure The City of Melbourne is a public statutory body corporate under the Local Government Act 1989 (Vic). The City of Melbourne is based at the Melbourne Town Hall in Swanston Street from which it operates a range of facilities, services and administration functions at more than 30 other locations across Melbourne. While most City of Melbourne staff work in the central city, some staff members are located at other sites across the municipality. At 30 June 2012, the City of Melbourne employed 1345 people, consisting of:
941 full-time permanent
231 part-time permanent
118 maximum-term temporary
55 casual staff.
Lord Mayor and Deputy Lord Mayor
Councillors
Chief Executive Officer Kathy Alexander
(Governance Services)
(Corporate Planning and Lea(r)ning)
City Business
Martin Cutter
City Design
Rob Adams
City Planning
and Infrastructure Geoff Lawler
Community
Development
Linda Weatherson
Corporate Business
Mark Stoermer
Business and International
Capital Works
City Research
Arts and Culture
Business
Information Services
Corporate Affairs
and Strategic Marketing
Parks Services
Engineering
Services
Community Safety
and Wellbeing
Financial Services
Events Melbourne
Urban Design and
Docklands
Parking and
Traffic
Community
Services
Human
Resources
Tourism
Melbourne
Urban
Landscapes
Planning and
Building
Community
Strengthening
Legal Services
Strategic Planning
Customer Relations
Property Services
Sustainability
Health Services
Recreation Services
44

Divisions and directors The City of Melbourne has an organisational structure of five divisions, which sit under the Office of the CEO. Branches within each division perform specific functions, collaborate on projects and share their particular knowledge and expertise across the organisation. Office of the CEO – Dr Kathy Alexander, Chief Executive Officer The office of the CEO liaises with the offices of the Lord Mayor, Deputy Lord Mayor and Councillors, the Australian and Victorian governments and other major community and corporate stakeholders. The CEO also attends council meetings. Her functions and powers are principally determined by the Local Government Act and include:
establishing and maintaining organisational structures to implement the Melbourne City Council’s decisions
ensuring the Council’s decisions are implemented
managing the organisation’s day-to-day operations
providing advice to the Council
appointing, directing and terminating staff, and managing all other issues that relate to staff.
City Design – Rob Adams, Director The City Design division is responsible for developing strategic plans and urban design policy as well as delivering best practice in design, project management and parks services. The division has primary responsibility for the continued development in Docklands and the coordination and delivery of major projects and the capital works program. It also ensures the City of Melbourne maintains its reputation as a leader in the sustainable design and management of public spaces. Highlights of 2011-12 This year saw the largest delivery of capital works since the Commonwealth Games in 2006, with major work underway in the Swanston Street redevelopment, Fitzroy Gardens Water Storage, the Carlton Baths and Family Resource Centre and design of a new Docklands Library. It was rewarding to work with other divisions to deliver the Boyd community hub at Southbank, the restoration and structural repairs of the Kensington Town Hall facade and the streetscape improvements in sections of Flinders Lane and Elizabeth Street, as well as major asset renewal programs including roads, parks, footpaths and drains. It was also pleasing to see the completion of the Urban Forest Strategy, the Docklands Community and Place Plan and the Docklands Public Realm Plan, the endorsement of the Open Space Strategy and the establishment of the Exceptional Tree Register. Looking ahead There’s still a lot of work to do in Docklands. The completion of the Docklands Library and development of a new civic heart in the precinct will benefit everyone. Completing the water sensitive urban design for Fitzroy Gardens will also be a big project for the coming year. City Business – Martin Cutter, Director The City Business division focuses on supporting existing business and business development in Melbourne. The division contributes to positioning Melbourne as a world-class city in local, national and international markets through managing events, tourism services, international business relationships and marketing programs. The division works with a wide range of stakeholders including ratepayers, businesses, retailers, city visitors, tourists, sister cities, major sporting bodies and government departments.
45
Highlights of 2011-12 The continued growth in Melbourne premier events (Moomba, New Year’s Eve, Melbourne Spring Fashion Week, Melbourne Awards and Melbourne Music Week) saw strong attendances and exciting new concepts delivered, including staging the Moomba parade in St Kilda Road for the first time. Strategic marketing campaigns saw enhanced linkages to business activation throughout the year and a focus on traditional Christmas themes were successful, including the greening of Christmas Square that excited young and old. The relationship between business and the city was enhanced by the strong business engagement programs under the Enterprise Melbourne banner whilst tourism was given a major boost by the endorsement by Council of the free Melbourne Visitor Shuttle for a further five years. Looking ahead We need to continue to link all our activities to enhance Melbourne’s ‘brand’ and make it a place with which all stakeholders want to, and can, engage. A key focus will be on harnessing social media as a method of marketing and communicating across events, business interaction and destination marketing. City Planning and Infrastructure – Geoff Lawler, Director The City Planning and Infrastructure division advises the Council on research, city planning and the future sustainable development of Melbourne. It manages the City of Melbourne’s bridges and drainage, road infrastructure, as well as municipal services such as parking and traffic management, waste management and street cleaning. The division also administers local laws and regulations to develop, improve and protect the general amenity of the municipality. Highlights of 2011-12 We made substantial progress on the Council's major multi-year city planning initiative, Planning for Future Growth, as well as putting the finishing touches on the Council’s Municipal Strategic Statement. Bikes, roads and cars were at the forefront this year as we put together the Council's new Transport Strategy in collaboration with the Department of Transport, VicRoads, the Department of Planning and Community Development (DPCD) and the excellent research and growth projections of our own research team. Planning applications are always an important and emotional part of city life and I’m pleased we have established a good working relationship with the DPCD. In the sustainability realm our 1200 Buildings program was acknowledged with a United Nations Association of Australia award and with the officers of the Sustainable Melbourne Fund, we secured three Environmental Upgrade Agreements in a world first. The introduction of new parking technologies, including parking sensor and the pay-by-phone trial in Carlton, was successful in some areas, but not all, so looking ahead we plan to build on and refine the work we’ve begun to improve efficiency of on-street parking management. Looking ahead In addition to continuing to deliver and improve customer-focused planning and infrastructure services, we will lead the delivery of five key strategic initiatives for the Council in Planning for Future Growth, climate change adaptation and mitigation, streetscape enhancements, Knowledge Melbourne and a Connected Bike Network as well as two initiatives to review heritage planning in Kensington and outside the central city.
46

Community Development – Linda Weatherson, Director The Community Development division plans and provides high-quality, cost-effective and customer-focused services to the community. These include recreational services, health services, family and children’s services, aged care, library and customer relations services. The division addresses key social issues that affect city life, particularly in relation to city safety, public space and accessibility for all members of the community, and manages cultural programs and infrastructure, which enhance the city’s reputation as a liveable city. Highlights of 2011-12 We’re very pleased with the completion of the new Boyd community hub in Southbank. The historic JH Boyd Girls High School has been completely revamped to meet the growing needs of this popular residential area and now boasts a new library, maternal and child health services, play groups, art studios, community meeting spaces and a social enterprise cafe. The city’s affordable housing stock received a boost with the opening of the new Drill Hall development in North Melbourne, while the acquisition of the Kathleen Syme Library and Community Centre in Carlton marks the beginning of a comprehensive community engagement process to help map the direction of the development. Looking ahead In 2012-13 we’ll have the construction of the new Docklands Library to look forward to as well as new multi-purpose court facilities near the Docklands Hub. Lean methodology continues to play an important role in the organisation, helping us to better measure our performance and evaluate our outcomes. I look forward to continuing to embed Lean Thinking in the new financial year and beyond. Corporate Business – Mark Stoermer, Director The Corporate Business division is primarily responsible for providing support services to the organisation. These services include legal advice, human resource management, information technology systems, corporate planning, financial services, property services and management of the municipality’s financial assets. The division also plays a role in liaising with our wholly-owned subsidiaries which contribute to the City of Melbourne’s revenue. Highlights of 2011-12 Our property services branch launched a new mapping site CoMPASS to the public. People can now tap into City of Melbourne data on services and facts relating to places all over Melbourne. It’s a bit like Google Earth on steroids. CoMPASS, is a computer-based system that combines and integrates location-based information with the latest mapping, aerial and ground level imagery and geospatial information technology into a single system that can be accessed by council staff and registered users. We had an excellent outcome with the budget this year following the introduction of our new rolling forecast system, which enables us to respond quickly and adjust accordingly. As a largely internally-facing division we also worked hard to support the other externally-facing branches to ensure they are able deliver their services to the community. Looking ahead As the use of the internet continues to change and evolve we’re keen to drive the discussion about the digital economy and the role it will play in the future of the City of Melbourne. Similarly as technology underpins almost everything we do, the organisation will undergo a significant technology upgrade in 2012-13 to ensure we can continue to deliver an exemplary level of service to the community.
47

Staff organisation Staff classifications Classification 1 and 2: childcare workers, school crossing supervisors, fitness instructors,
information officers.
Classification 3: childcare workers, parking and traffic, office administrative support.
Classification 4: administrative support, environmental health, project officers, kindergarten teachers.
Classification 5 and 6: professionals, analysts, programmers, technical staff, maternal and child health nurses, immunisation nurses, event managers.
Classification 7: team leaders and professionals.
Executive: managers, directors and the CEO.
Staff profile The gender balance of staff is split 57 per cent female and 43 per cent male. Women hold 40 per cent of executive positions. Sixty per cent of female staff and 40 per cent of male staff are employed in medium-paying positions ranging from classifications 3 to 6. The following tables illustrates how employee gender is split across the eight classifications, how gender is spread across different age groups and the number of staff by years of service and gender.
Employee classification by gender at 30 June 2012
0
20
40
60
80
100
120
140
160
180
Cl 1 Cl 2 Cl 3 Cl 4 Cl 5 Cl 6 Cl 7 /Exec A Exec
FEMALE
MALE
Number of staff by age group and gender at 30 June 2012
0
50
100
150
200
250
18-24yrs 25-34yrs 35-44yrs 45-54yrs 55-64yrs 65 yrs +
FEMALE
MALE
48

Number of staff by years of service and gender at 30 June 2012
0
20
40
60
80
100
120
140
160
180
200
<1 yr 1yr - < 2yrs 2yrs ->5yrs
5yrs - <10yrs
10yrs - <15yrs
15yrs - <20yrs
20yrs - <25yrs
25yrs - <30yrs
30yrs - <35yrs
35yrs - <40yrs
>40yrs
FEMALE
MALE
Staff retention Improving staff retention rates is a high priority for the City of Melbourne. Voluntary staff turnover has decreased in the past two years. Staff turnover
Financial year
Positions advertised
Average applicants per
position
Staff turnover¹
Absenteeism²
2011-12 291 37 8.02% 2.54%2010-11 284 24 8.42% 2.89%2009-10 232 26 9.6% 2.8%2008-09 222 28 7.9% 2.7%2007-08 381 23 12.7% 3%2006-07 164 34 12.7% 3.1%
Note 1: Voluntary (resignations) turnover only Note 2: Total sick leave absences as a percentage of ordinary time available Staff support services A broad range of support services and initiatives are available for all staff, including career and personal counselling, podiatry, nutrition advice through a dietician and an on-site physiotherapy trial. In addition, during 2011-12 the City of Melbourne supported staff in returning to work from personal, or work-related illness, or injury, by providing:
in-house allied health professional services
access to specialists in occupational and environmental medicine
early intervention strategies such as ergonomic reviews and adjustment to the workplace and
the development of return-to-work plans.
Staff development We are committed to developing our people through a range of leadership development programs, study assistance and corporate learning programs. Our City of Melbourne Education and Training program offered 139 workshops in 2011-12, which were attended by 1128 members of staff. In addition, we supported 24 employees to commence further education through our study assistance program.
49
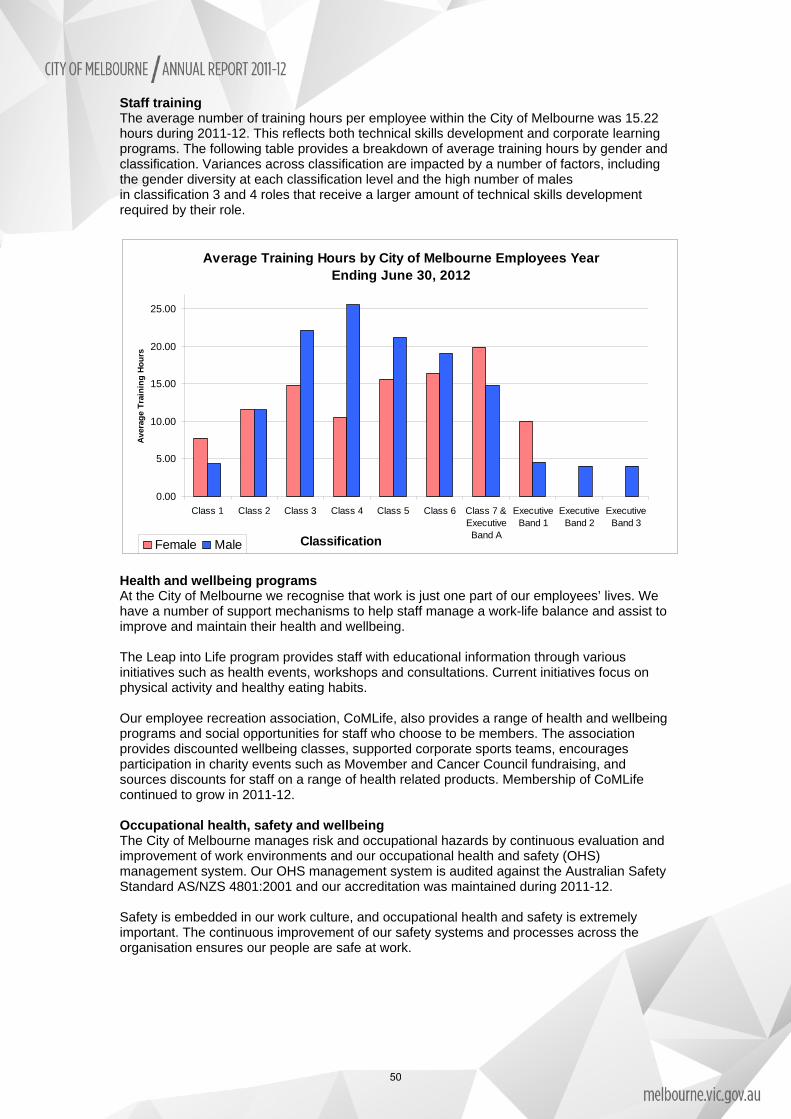
Staff training The average number of training hours per employee within the City of Melbourne was 15.22 hours during 2011-12. This reflects both technical skills development and corporate learning programs. The following table provides a breakdown of average training hours by gender and classification. Variances across classification are impacted by a number of factors, including the gender diversity at each classification level and the high number of males in classification 3 and 4 roles that receive a larger amount of technical skills development required by their role.
Average Training Hours by City of Melbourne Employees Year Ending June 30, 2012
0.00
5.00
10.00
15.00
20.00
25.00
Class 1 Class 2 Class 3 Class 4 Class 5 Class 6 Class 7 &ExecutiveBand A
ExecutiveBand 1
ExecutiveBand 2
ExecutiveBand 3
Classification
Ave
rag
e T
rain
ing
Ho
urs
Female Male
Health and wellbeing programs At the City of Melbourne we recognise that work is just one part of our employees’ lives. We have a number of support mechanisms to help staff manage a work-life balance and assist to improve and maintain their health and wellbeing. The Leap into Life program provides staff with educational information through various initiatives such as health events, workshops and consultations. Current initiatives focus on physical activity and healthy eating habits. Our employee recreation association, CoMLife, also provides a range of health and wellbeing programs and social opportunities for staff who choose to be members. The association provides discounted wellbeing classes, supported corporate sports teams, encourages participation in charity events such as Movember and Cancer Council fundraising, and sources discounts for staff on a range of health related products. Membership of CoMLife continued to grow in 2011-12. Occupational health, safety and wellbeing The City of Melbourne manages risk and occupational hazards by continuous evaluation and improvement of work environments and our occupational health and safety (OHS) management system. Our OHS management system is audited against the Australian Safety Standard AS/NZS 4801:2001 and our accreditation was maintained during 2011-12. Safety is embedded in our work culture, and occupational health and safety is extremely important. The continuous improvement of our safety systems and processes across the organisation ensures our people are safe at work.
50

Workplace organisation
WorkCover claims The City of Melbourne received 20 WorkCover claims in 2011. Our WorkCover premium is now at 0.80 per cent. This remains significantly lower than the local government sector rate of 1.73 per cent. The City of Melbourne has a proactive injury prevention strategy and adopts an early intervention approach to all work-related injuries and illnesses by focusing on sustainable return-to-work programs. WorkCover claims Financial year Standard claims Minor claims Premium incl
GST ($) Premium as % of
remuneration 2011-12 7 2 361,060.84 .352010-11 4 1 818,600.13 .80*2009-10 16 4 599,653 .642008-09 3 5 754,000 .652007-08 8 17 767,000 .882006-07 7 19 940,000 1.15
*Increased premium rate for this period was due to a Victorian WorkCover Authority increase in the industry rate.
Equal Opportunity, Discrimination and Harassment Policy The City of Melbourne is an equal opportunity employer and is committed to providing a work environment that is safe, supportive, free of discrimination, and where individuals treat each other with respect. Our Equal Opportunity, Discrimination and Harassment Policy was revised in 2012 to reflect the organisation’s commitment to preventing discrimination and harassment in the workplace.
Our network of contact officers are volunteers within the City of Melbourne who are trained to assist employees to identify options and resources to deal with workplace discrimination and harassment. Our equal opportunity commitment is supported by our Workforce Diversity Strategy and Action Plan and addresses requirements under Schedule 6 of the Local Government Act 1989 (Vic).
Workplace diversity Workplace diversity involves recognising the value of individual differences and treating everyone fairly and equally. In 2011 an organisational Workforce Diversity Strategy and Action Plan 2011-13 was drafted. From this strategy, a Workforce Diversity Steering Committee was established which meets quarterly to oversee delivery of this strategy and action plans.
In 2012 Human Resources, together with the Organisational Development team, began the development of a diversity leadership program to support people managers to build capability in this area.
Our Workforce Diversity Strategy and Action Plan includes principles, objectives and strategies to support diversity within the City of Melbourne. The strategy builds on our existing values: integrity, courage, accountability, respect and excellence.
In 2008, an Indigenous Traineeship for Aboriginals and Torres Strait Islanders was established. Each year, four to six trainees are recruited to work in different areas for 12 months. The traineeship provides participants with the opportunity to gain work experience and on-the-job skills at the City of Melbourne while obtaining a nationally-recognised certificate in Business Administration through APlus Apprentice and Trainee Services.
In addition, an integral part of the induction process for all new employees is a walk highlighting Melbourne’s Aboriginal heritage.
51
Enterprise agreement The City of Melbourne has a single enterprise agreement that covers approximately 90 per cent of employees. This agreement includes sustainability targets, work conditions and employee benefits. To maintain its position as a fair and flexible employer, the City of Melbourne monitors the operation and application of the agreement through a staff consultative committee that meets quarterly.
Best value service delivery The City of Melbourne reviews all existing services and adopts new service delivery models, in line with the Local Government Act in contrast to the previous requirements to use compulsory competitive tendering.
As a result the City of Melbourne takes the following principles into account when reviewing its services to ensure they are the best on offer to meet the needs of the community:
the need for services to deliver against agreed quality and cost standards
accessibility of services to those who need them
services being responsive to changing community needs
continuous improvement in the delivery of services
community consultation on services and activities and
regular annual reporting to the community on the Council's performance.
We are committed to the continuous improvement of our services and projects to ensure best value for the community. Community engagement and Lean Thinking programs ensure we apply best value principles in the services we operate and manage.
Lean Thinking Lean Thinking aims to deliver value to internal customers as well as external end users. In service industries, Lean Thinking means delivering the right service, in the right place, at the right time, provided by the right person and done right the first time. Value for the customer is increased by systematically removing waste from processes and the associated work. Value for the City of Melbourne is achieved by meeting the Council’s goal to manage the organisation’s resources well.
The City of Melbourne’s Lean improvement program has shifted in 2011-12 from delivering improvement projects, to building organisational capability to support front-line staff improve their own processes and deliver increased value to customers.
All new staff are introduced to the concepts of Lean Thinking and are taught how to integrate Lean improvements into their daily work. Many services and processes across the organisation have been reviewed and improved in 2011-12 with measures established for continuous improvement going forward. For more Lean highlights, please refer to page 41.
Stakeholders The City of Melbourne’s stakeholders include anyone with an interest in what we do and the services and programs we provide, such as:
Local community – residents, ratepayers, businesses and their community, workers, students, visitors, unions, the media, community groups and associations, the education sector, neighbouring communities and other local government authorities.
Working partners – other government bodies and agencies, our suppliers and consultants, the business community and others.
Global partners – city partners, investors, event organisers and others.
We work with stakeholders in many ways. Our community engagement framework guides the way we communicate and engage with our stakeholders, from how we conduct formal consultations on significant policies, programs and services, to specific issue advisory groups
52

and our daily interactions with those who use our services and facilities. These interactions provide an important insight into how we can continue to improve the quality of our services.
Community engagement Community engagement involves informing, consulting with and seeking the active participation of the community on issues that impact them. It is a formal process designed to seek out and facilitate the involvement of key stakeholders from a cross-section of the community so a range of ideas and opinions can be considered as part of the Council’s decision-making process.
The City of Melbourne has built a culture of community engagement that is integral to our core business and contributes to open and responsible government and an informed, engaged society. Engagement techniques are varied and tailored to support accessible and well-informed participation. Almost 200 employees took part in community engagement training in 2011-12, adding to the total training figure of 385. This education process has enabled staff members from across the organisation to take a hands on approach to community engagement, from plan development through to implementation.
This year we engaged our community in a number of projects and programs. Some of these include:
Docklands Community Garden, Public Realm Plan, library and community space
Planning for Future Growth projects
Swanston Street redevelopment
Streetscapes
Kathleen Syme Library and Community Centre
Melbourne Transport Strategy
Draft Bicycle Plan including La Trobe Street Bicycle Lane options
Love your Laneways, laneway improvement plan
Open Space Strategy
Princes Park Masterplan
Returning parkland to Royal Park
Open Space improvement works in the parks and gardens
Urban Forest Strategy
Food Policy
GIS online mapping system
Street Gardens Guidelines.
53

Our corporate governance
Relationship with other tiers of government Statutory responsibility for local government lies with each Australian state or territory. An Act of each state parliament specifies local government powers, duties and functions. In Victoria, the legal basis for councils is established under the Constitution Act 1975 (Vic) and the Local Government Act 1989 (Vic).
Council decisions Councillors make decisions at council meetings and delegated committee meetings. Committee meeting decisions are subject to a ‘referral notice process’ meaning that where fewer than five committee members vote in favour of a motion, members have the option of referring the matter to the next council meeting for decisions.
Delegations Melbourne City Council’s powers under the Local Government Act or any other Act may be delegated to a council committee, to a City of Melbourne officer including the Chief Executive Officer (CEO) or sub-delegated to a City of Melbourne officer by the CEO. Staff members are accountable to the CEO. The Council and its committees provide policy and staff members make decisions in accordance with that policy. The exercise of delegation is subject to the Council’s Delegations Policy.
Participation in the Council The City of Melbourne welcomes community and stakeholder attendance and participation at Council and committee meetings. Members of the public can make submissions to the Council or a committee on matters listed on meeting agendas. A register of public submissions made under section 223 of the Local Government Act is available for viewing at the City of Melbourne’s offices. Records of meetings, meeting dates and times and information on how to interact with the Council is available on the City of Melbourne website at www.melbourne.vic.gov.au. Documents available for inspection The Local Government Act requires the City of Melbourne to keep certain statutory registers and documents, which can be viewed on request, or in certain cases, on application. Available documents include:
Council and committee meeting agendas and minutes
list of special committees established or abolished
agreements to establish regional libraries
lists of contracts valued at $150,000 or more, which the Council entered into outside the competitive process, except section 186(5) contracts
names of councillors and City of Melbourne officers required to submit a return of interest and the date returns were submitted
details of interstate and overseas travel by Councillors and City of Melbourne officers
details of senior officers’ total salary packages
details of all property, finance and operating leases involving land, buildings, plant, computer equipment, or vehicles entered into by the City of Melbourne (as lessor/lessee)
list of donations and grants made by the City of Melbourne
list of organisations the City of Melbourne is a member of and details of membership fees
mayoral and councillor allowances
register of authorised officers
register of delegations
Whistleblowers Protection Act 2001 (Vic) procedures
submissions received under section 223 of the Local Government Act
election campaign donation returns.
54

Councillor allowances Councillors are paid an allowance set by the Victorian Government. This allowance is paid in recognition of the demands placed on councillors in carrying out their civic and statutory duties, and for their work on policy development, as spokespeople on community matters and as representatives of the Melbourne City Council and Melbourne, in Australia and overseas. The allowances are:
Lord Mayor – $160,050
Deputy Lord Mayor – $65,470
Councillors – $36,360.
Expenses Councillors incur expenses in the course of fulfilling their roles. Expenditure is regulated by the Councillor Expenses and Resources Guidelines, as endorsed by the Finance and Governance Committee and consistent with section 75 of the Local Government Act. Councillor expenses are reported in detail every quarter on the City of Melbourne website. Councillor conduct The City of Melbourne’s Councillor Code of Conduct outlines the role of the Council and provides an overview of councillors’ responsibilities in accordance with the Local Government Act. The code includes guidelines for rules of conduct, decision-making and use of City of Melbourne resources. It also includes procedures for disclosure of interests and conflicts of interest that go beyond legislative requirements. There were no known breaches of the code by Councillors in 2011-12. Council and committee meeting attendance 1 July 2011 to 30 June 2012
Nu
mb
er o
f m
eeti
ng
s
LM R
ober
t Doy
le
DLM
Sus
an R
iley
Cr
Car
l Jet
ter
Cr
Jenn
ifer
Kan
is
Cr
Kev
in L
ouey
Cr
Cat
hy O
ke
Cr
Ken
Ong
Cr
Bria
n S
hana
han
Cr
Jack
ie W
atts
Melbourne City Council meetings 14 13 14 10 11 12 13 14 11 14
Committee meetings
Future Melbourne 22 20 22 19 17 19 22 21 18 19
Inner Melbourne Action Plan 4 .. .. .. .. .. .. 4 .. ..
Docklands Coordination 3 .. .. .. .. 3 * .. .. ..
.. Not a member * Alternate member In most cases, absence from committee and council meetings is as a result of Councillors being required to represent the city on other council business.
55

Council special committees As well as council meetings, Melbourne City Council has three special committees:
1. Future Melbourne Committee (meets twice monthly) This committee has delegated powers, duties and functions directly relating to, or ancillary to, all aspects of the City of Melbourne’s activities. The Future Melbourne Committee’s terms of reference are grouped into six themes or portfolios:
planning
connected city
eco-city
economic development and knowledge city
people and creative city
finance and governance.
All Councillors participate in the Future Melbourne Committee.
2. Docklands Coordination Committee (meets quarterly) This committee manages coordination between the City of Melbourne and VicUrban (now Places Victoria) to ensure an open public discussion in this developing area. The committee, which includes senior representatives from the City of Melbourne and Places Victoria, meets quarterly to monitor place management services within the coordination area.
3. Inner Melbourne Action Plan Implementation Committee (meets quarterly) This committee has delegated powers, duties and functions directly relating to, or ancillary to, overseeing implementation of the Inner Melbourne Action Plan (IMAP) in accordance with the agreed three-year implementation program. The committee comprises representatives from the local governments of Melbourne, Port Phillip, Stonnington and Yarra.
Council of Capital City Lord Mayors The Lord Mayor is a member of the Council of Capital City Lord Mayors, which comprises the lord mayors of all capital cities and the ACT’s Minister for Territory and Municipal Services. It coordinates and represents the special interests of Australia’s state and territory capital cities and their relations with other spheres of government. Subsidiaries and trusts The City of Melbourne has two wholly-owned subsidiaries:
CityWide Service Solutions Pty Ltd – a company established to provide contract services on a competitive basis to local government and other public and private sector clients.
Queen Victoria Market Pty Ltd – a company established to manage and develop the Queen Victoria Market.
The City of Melbourne has an interest in other entities including:
Sustainable Melbourne Fund – the City of Melbourne holds all units in this trust, a strategic trust established to support and promote sustainable development.
Regent Management Company Limited – shared with the Victorian Government, the City of Melbourne has a 50 per cent interest in this company, established to manage the historic Regent Theatre in Collins Street, Melbourne
MAPS Group Limited trading as Procurement Australia – the City of Melbourne is majority shareholder of this company.
56
Legislative compliance
Freedom of information The Freedom of Information Act 1982 (Vic) gives any individual or organisation the right to access information held by the City of Melbourne unless that information is deemed exempt under the Act. In 2011-12 the City of Melbourne received 58 valid applications seeking documents about building and planning matters, tenders and contracts, parking infringements and the costs and activities of councillors and officers. The number of requests received was an increase on the 42 valid applications received in the previous financial year. There were four requests for internal review in 2011-12 (three decisions were upheld and one decision was varied). No appeals were lodged with the Victorian Civil and Administrative Tribunal (VCAT) in 2011-12. The Act specifies a 45-day statutory time limit to process requests. The average processing time for requests was 39 days. National Competition Policy compliance The City of Melbourne complied with the requirements of the National Competition Policy Principles in 2011-12, which covers compliance in trade practices, local laws and competitive neutrality.
Procurement Policy In accordance with the Local Government Act 1989 (Vic) the City of Melbourne has developed a procurement policy encompassing the principles, processes and procedures applied to the purchases of all goods, services and works by the organisation. The City of Melbourne’s procurement policy states that in procuring goods, works and services under a contractual arrangement, the City of Melbourne will:
support its corporate strategy, aims and objectives
ensure it achieves best value outcomes in terms of time, cost and value
establish and put in place appropriate performance measures
commit to achieving sustainability objectives
provide effective and efficient commercial arrangements.
The policy uses a sustainable approach to procurement to reduce the social, financial and environmental impact of the procurement cycle. As a result the City of Melbourne seeks to procure environmentally-preferred products and services and seeks to do business with contractors and providers with similar sustainability objectives and policies. Whenever practicable and relevant, the City of Melbourne gives preference to the supply of goods, machinery or material manufactured or produced in Australia or New Zealand, and works collaboratively with suppliers to achieve these objectives. The organisation has a procurement and corporate contract management system that prescribes best practice methodologies in its contract management and processes and it adheres to this at all times.
57
Information Privacy Act Standards set out by the Information Privacy Act 2000 (Vic) and the City of Melbourne’s Privacy Policy Statement control how we manage personal information. Privacy compliance is included in our staff induction program. We have a dedicated privacy officer within our Governance Services Branch to assist staff and members of the public with privacy-related queries or issues. The City of Melbourne received one privacy complaint from a member of the public during 2011-12. The matter was successfully dealt with by the work area.
Whistleblowers Protection Act Complaints about the improper conduct of any City of Melbourne officer can be made confidentially, under the Whistleblowers Protection Act 2001 (Vic), to the Victorian Ombudsman, or to any one of the following officers appointed to receive disclosures:
Keith Williamson, Manager Governance Services
Linda Weatherson, Director Community Development
Mark Stoermer, Director Corporate Business
Jane Sharwood, Manager Business and International.
During 2011-12:
one protected disclosure was made to the Council
one protected disclosure was referred to the Ombudsman for determination as to whether it was a public interest disclosure
no protected disclosure matters were referred to the Council by the Ombudsman for investigation
no protected disclosures were referred by the Council to the Ombudsman for investigation
no investigation of protected disclosures was taken over by the Ombudsman from the Council
no requests were made under section 74 of the Act to the Ombudsman to investigate disclosed matters
the Council did not decline to investigate any disclosed matters
the investigation of the one public interest disclosure matter was not completed.
Disability Discrimination Act The City of Melbourne is committed to ensuring equity of access in all in planning, community support and service delivery functions in accordance with the Disability Discrimination Act 1992 (Cth). Our Disability Action Plan 2010-13 includes designated actions for implementation across25 branches of the City of Melbourne. This collective approach ensures the City of Melbourne upholds and promotes the right of all community members to equity of access as stipulated in Disability Discrimination Act, Disability Act 2006 (Vic), Charter of Human Rights and Responsibilities Act 2006 (Vic) and the United Nations Convention on the Rights of Persons with a Disability ratified by Australia in July 2008. Over the past financial year, specific actions and tasks were implemented to improve access across the municipality. Key achievements in 2011-12 include:
Disability awareness training across the organisation for approximately 140 staff.
Establishment of a new three-cubicle toilet (male, female, accessible toilet) at Birrarung Marr.
Shrine Reserve public toilets, full refurbishment of an existing block with one toilet for full access.
58

Submissions advocating: endorsement of the National Disability Insurance Scheme, stronger action statements to the draft State Disability Plan, and importance of equity of access to toilets during a public transport review of access to public toilets at train stations.
Planning for the development of the $15 million Northbank promenade with full access.
Ongoing support and resourcing of the Council’s Disability Advisory Committee.
Redevelopment of Swanston Street ensuring improved disability access.
All new footpaths and refurbished paths address full accessibility requirements, with $800,000 of upgrades in capital works to ensure full compliance and the installation of new tactile ground-surface indicators.
Redevelopment of the Boyd community hub to ensure the site is fully compliant.
Domestic Animals Act The City of Melbourne prepares a Domestic Animal Management Plan every four years, in line with the Domestic Animals Act 1994 (Vic).
The plan is prepared in consultation with Victoria’s Department of Primary Industries (DPI) and provides the City of Melbourne with a framework to guide decision-making on services and programs relating to domestic animals and an action plan to identify priorities.
While the next plan was due on 12 November 2012, an extension was made available to all councils by the Bureau of Animal Welfare and the DPI until 30 June 2013, to allow for the council elections in October 2012. Actions from the current Domestic Animal Management Plan 2008-11 continue into the fourth year while the preparation of the 2013-16 plan is underway.
In 2011-12 the City of Melbourne implemented the newly-amended legislation relating to dangerous and restricted dog breeds. Reports of dangerous dogs received by the Victorian Government’s new hotline are forwarded to the City of Melbourne for immediate response and action. The City of Melbourne also reviewed its contracted animal services for legislative compliance, including the requirements of the Victorian Ombudsman’s Office with respect to the authorisation of contracted officers under the Act, and to ensure the services were in line with ‘best value’ service standards and those of other local governments.
Since implementing the plan, the City of Melbourne has increased internal understanding and awareness of our obligations in the promotion of responsible pet ownership.
59

Risk management
The City of Melbourne manages its risks to maximise opportunities and minimise losses. Risk management planning is an organisation-wide exercise, covering the top strategic risks plus operational and project risks. It is also part of the daily business activities of individual branches and contractors.
The organisation has a risk management framework in place, which is integrated with our corporate and business planning system.
Risk management strategy, integrated reporting and competitive neutrality In 2011-12 the second year of the risk management strategy for 2010-13 was implemented. The risk exposures were revised for all City of Melbourne branches, with updated details recorded in the risk module of the organisation’s integrated corporate business planning software. Integrated quarterly and annual reporting of risks was undertaken, and the CEO and directors undertook a major review of the top strategic risks. These top risks were reported to the Audit Committee throughout the year, along with the high operational risks. The risk and audit modules in the City of Melbourne’s business planning software was used, with the risk data applied to the design of our new three-year internal audit program. The review of the City of Melbourne’s businesses in relation to competitive neutrality also continued as scheduled. Fraud awareness and training As an enhancement of the corporate induction process for all new staff to the City of Melbourne, a new online training and awareness module for fraud and improper conduct was launched in 2011-12. It aims to ensure that expectations in this area are understood by staff at the beginning of their work at City of Melbourne. In addition, online fraud and improper conduct refresher training was assigned to all current staff to maintain the very high level of awareness and understanding in this area. A new online module was also launched for an introduction to risk management for new staff. A range of other face-to-face training courses were conducted in 2011-12, such as an introduction to risk management, event risk management and other specialist risk sessions for work areas. Insurance and risk financing While the number of claims received by the City of Melbourne from members of the public in 2011-12 remained similar compared with the previous year, the number was higher than the long-term average, a common trend emerging across local government. This included a number of claimants being represented by a lawyer. Staff continued to review this trend and put in place active measures to manage the increase, investigate the reasons behind the trend, identify any additional preventative measures and implement strategies to manage the cost of any claims. The five-year major insurable risk profiling review was finalised to assess the adequacy of our insurance and risk financing coverage and identify any gaps associated with new or altered business processes and services. A number of adopted recommendations from the review were implemented during 2011-12. The overall cost of insurances to the City of Melbourne increased only marginally and within expectations during 2011-12. In part, this reflects the organisation’s proactive approach to managing identified risks. Business continuity planning and crisis and emergency management In 2011-12 the City of Melbourne updated the Corporate Business Continuity Plan, the Municipal Emergency Management Plan, all branch business continuity recovery plans, the Information Technology Disaster Recovery Plan and the Crisis Management Manual. A functional exercise was run by the City of Melbourne to test and practise emergency management and business continuity plans, processes and procedures. The exercise provided operational training to staff in the process involved in responding to an adverse weather emergency and used the City of Melbourne web-based emergency management system.
60

Audit operations Audit Committee In line with good governance practices and in accordance with section 139 of the Local Government Act 1989 (Vic), the City of Melbourne has operated an Audit Committee since 1996. The committee oversees the activities of the City of Melbourne’s external and internal auditors and gives independent advice to the Future Melbourne Committee on appropriate accounting, auditing, internal control, business risk management, compliance and reporting systems, processes and practices within the organisation. The Audit Committee met five times during 2011-12. The committee considered many issues including:
information technology security systems
occupational health and safety
the City of Melbourne’s business continuity planning procedures
the City of Melbourne’s risk profile and legislative compliance frameworks
statement of annual accounts and performance report for the Council, and reports on its wholly-owned subsidiaries
governance responsibilities applicable to associated entities and trusts the City of Melbourne has either an indirect interest or stake in
legal action reports
procurement process compliance
contract management procedures
Community Development Regulatory and Accreditation framework
Customer Service Charter implementation
councillor and employee expenses.
Audit Committee members The City of Melbourne Audit Committee comprises two Council representatives and three independent members. The Council representatives for 2011-12 were Deputy Lord Mayor Susan Riley and Chair Future Melbourne (Finance and Governance) Committee, Councillor Brian Shanahan. The independent members are:
Richard Moore – Chair Appointed to the Audit Committee in July 2009 Qualifications:
Risk Advisor Consultant with Grant Thornton Australia
Former partner at PricewaterhouseCoopers (23 years)
Group Manager, Audit for the ANZ Banking Group (5 years)
Extensive consulting and management experience in risk management and internal control.
Theresa Glab Appointed to the Audit Committee in September 2008 Qualifications:
Consultant and advisor at Considered Compliance Services
Former partner at Moore Stephens, Melbourne
Masters in Accountancy
Certified Practicing Accountant
61

John Stewart Appointed to the Audit Committee in May 2010 Qualifications:
Director of BDO Kendalls (1986–2008) Board member of the Executive of BDO Kendalls (6 years) Chairman of the Audit Committee of Harness Racing Victoria Chairman of the Finance and Audit/Risk Committee of Ritchies Stores Pty Ltd.
Internal audit The internal audit service helps the City of Melbourne, its management and the management of its subsidiary companies perform their responsibilities. The internal audit service helps us maintain an organisational environment with strong, relevant and effective internal controls. The City of Melbourne's internal auditor reports to the Audit Committee. The service has been contracted to Deloitte Touche Tohmatsu since July 2009.
A strong internal control environment ensures our systems contribute effectively to management of operations. Services provided by the internal audit service include:
risk assessment
development and management of an audit program
conducting audits and reviews
reporting audit opinions, findings and recommendations
presenting, discussing and providing advice on key issues.
External audit The Victorian Auditor-General is responsible for the external audit of the City of Melbourne and its subsidiary companies. Our external audit focuses on three key areas:
strategic planning
detailed audit system testing
review of financial statements.
62

Our Performance Statement Each year the City of Melbourne conducts a thorough planning process to identify its Key Strategic Activities (KSAs), which are published in the Council’s Annual Plan and Budget. This Performance Statement provides a description the KSAs which were funded by the 2011-12 Annual Plan and Budget, in accordance with section 127 of the Local Government Act 1989 (Vic). The City of Melbourne has adopted the framework from the Victorian Auditor General’s Office Better Practice Guide to prepare the KSAs for this report. In doing so, we developed cost, time, quality and quantity measures and targets for the KSAs. Depending on the nature of the KSA, some of these elements were found to be more relevant and material than others so not all KSAs have measures and targets for all four elements. Rating scale For the 2011-12 Performance Statement we have used a rating scale consistent with the methodology used to monitor performance of KSAs throughout the year. This is based on a ‘percentage complete’ result against targets set at the beginning of the year and published in the 2011-12 Annual Plan and Budget. This year we have continued to use “percentage complete” as we believe it gives stakeholders a very specific indication of the actual result. However in recognition of the importance of a clear statement of achievement, we have applied the following scale to the Performance Statement:
100% Complete – Achieved 90–99% Complete – Substantially Achieved 80–89% Complete – Partially Achieved Less than 80% Complete – Not Achieved.
The method for determining percentage complete is based initially on the professional judgement of the responsible officer who weighs up what has been achieved against what was planned. A rigorous process of review then occurs where the percentage complete determined by the responsible officer is reviewed first by the appropriate Manager and then the responsible Director. The final determination of percentage complete is jointly reviewed by the CEO and Directors each month. External factors impacting on achievement of KSAs The City of Melbourne’s ability to implement KSAs can be affected by external matters outside its control. While in most cases KSA measures are established to focus on our specific role, this is not practical in all cases, especially where an external reader needs to understand the full context of the KSA. The following Performance Statement outlines the City of Melbourne's achievement against the 10 KSAs for 2011-12:
KSA 1 Planning for Future Growth 65 KSA 2 City Safety 69 KSA 3 Homelessness 73 KSA 4 Climate Change Adaptation and Mitigation 75 KSA 5 Streetscapes 80 KSA 6 Queen Victoria Market 82 KSA 7 Swanston Street Redevelopment 83 KSA 8 Docklands Second Decade 85 KSA 9 Community Infrastructure 87 KSA 10 Evaluation of City of Melbourne-funded major events 91
63

KSA 1 Planning for Future Growth Goal: 1 A city for the people
Outcome: 1.8 A well planned city with a vision of the future
Objective: 1.8.1 Establish a robust planning scheme that facilitates sustainable growth and development and protects heritage
Measure Target Actual Comments
Cost – Operational $793,000 $708,242 $84,758 underspent Underspend in postage, advertising and document reproduction was due to central city (Hoddle Grid) C188, C196 City North area, C190 Arden-Macaulay area, and C209 open space contributions not being exhibited.
Time – Report to Council on the independent Panel's assessment of the Municipal Strategic Statement (MSS) and Southbank Planning Scheme Amendment C171.
30/04/2012 90% 85%
Substantially Achieved MSS (C162) – Post panel reporting not achieved by target date but achieved by end of financial year, reported to 5 June 2012 Future Melbourne Committee (FMC). The final draft was reported to the 5 June FMC. FMC resolved that it be made available to the public for 28 days and on 7 August FMC adopted the Municipal Strategic Statement (MSS). It now will be sent to the Minister for agreement and if he agrees the MSS will be gazetted and become part of the Melbourne Planning Scheme. Partially Achieved Southbank Planning Scheme Amendment (C171) – Post panel reporting not achieved by target date due to panel appointment and their hearings being three months later than estimated. On 7 August Future Melbourne Committee agreed to make the amendment publicly available for a 14-day period following which the 4 September FMC will consider adopting the revised amendment and seeking the Minister’s approval.
Time – Exhibit Melbourne Planning Scheme amendments to implement plans that were developed in the previous year for the: Central city (Hoddle Grid), City North area, Arden-Macaulay area, heat island effect, energy, water and waste efficiency, central city heritage and open space contributions.
30/06/2012 63%
Not Achieved Central City (Hoddle Grid) Built Form Review (C188) Department of Planning and Community Development indicated that there were industry concerns with some of the provisions in C188. Council officers have since been in discussions with stakeholders. C188 has been further delayed due to consideration of the outcomes of Southbank Planning Scheme Amendment C171 which will have direct implications for the provisions in C188. The change in the timing was endorsed by Committee at the 8 May 2012 meeting. The revisions to C188 will likely require Council to abandon the current amendment, adopt the revised amendment and again seek the Ministers authorisation to exhibit. A report will go to the 4 December Future Melbourne Committee and following this
64

Goal: 1 A city for the people
Outcome: 1.8 A well planned city with a vision of the future
Objective: 1.8.1 Establish a robust planning scheme that facilitates sustainable growth and development and protects heritage
Measure Target Actual Comments
90% 90% 45% 100%
exhibition could commence in early 2013 pending the Minister’s authorisation. Substantially Achieved City North zoning and built form (C196) Not fully achieved due to delay in completion of the Structure Plan and the Council requirement for further consultation. The 28 February 2012 Council meeting resolved to request the Minister to grant authorisation for Planning Scheme Amendment C196 City North. Authorisation was received on 5 June so exhibition was not able to commence before 30 June 2012. Substantially Achieved Arden-Macaulay zoning and built form (C190) Not fully achieved due to delay in completion of the Structure Plan and the Council requirement for further consultation. The 28 February 2012 Council meeting resolved to request the Minister to grant authorisation for Planning Scheme Amendment C190 Arden-Macaulay. Authorisation was received on 5 June so exhibition was not able to commence before 30 June 2012. Not Achieved Urban heat island effect
Urban heat island study completed. The study identified that mitigation strategies are more relevant to building construction than to planning considerations. Officers are meeting with industry stakeholders (such as the Royal Australian Institute of Architects and Master Builders Association of Victoria) about the issues and options within the development sector for educational and promotional programs to encourage the industry to implement solutions. The recommendations of the study will also be implemented through the Urban Forest Strategy, public works and construction standards. Achieved
65

Goal: 1 A city for the people
Outcome: 1.8 A well planned city with a vision of the future
Objective: 1.8.1 Establish a robust planning scheme that facilitates sustainable growth and development and protects heritage
Measure Target Actual Comments
100% 85%
Energy, Water and Waste (C187) – Was authorised by the Minister for Planning. Exhibition commenced 29 March 2012 and closed 11 May. Achieved Central City Heritage (C186) – The 6 December Future Melbourne Committee (FMC) considered report from exhibition and revisions to C186 and requested the Minister appoint a panel. Panel hearing was from 26 March to 20 April. The panel’s report has been received and a report on the panel’s report will go to FMC on 4 September along with a recommended final version of the amendment for committee to consider for adoption. Partially Achieved Open Space Contribution (C209) Delayed due to delays in the completion and adoption of the Open Space Strategy. Following the initial consultation the 12 June Future Melbourne Committee requested further consultation on the Open Space Strategy to 29 June 2012. On 31 July Council adopted the Open Space Strategy and resolved to seek authorisation from the Minister for Planning to exhibit Amendment C209 Public Open Space Contributions. Exhibition is unlikely to commence until 2013.
Time – Develop and report to Council, plans for the future MSS urban renewal areas for the provision of community services, community infrastructure, civil infrastructure, and open space.
30/06/2012 100% Achieved
These plans were incorporated in the structure plans adopted by Council in Feb 2012.The first phase of implementation of these plans will be through a planning scheme amendment to set in place developer contributions plans (DCPs).
The Civil Engineering Infrastructure Plan was completed for Arden-Macaulay, Southbank and City North structure plans, which includes detailed cost estimates for all streetscapes and upgrades of existing civil infrastructure proposed in the various structure plans.
Time – Prepare an analysis of employee, visitor and resident demographic profiling 2030 scenarios.
30/12/2011 100% Achieved Completed on budget and according to stakeholder needs.
66

Goal: 1 A city for the people
Outcome: 1.8 A well planned city with a vision of the future
Objective: 1.8.1 Establish a robust planning scheme that facilitates sustainable growth and development and protects heritage
Measure Target Actual Comments
Quantity – Averaged proportion of deliverables completed on time and on budget.
80% 46% Not Achieved See above for explanatory notes. (13 sub-deliverables – six completed on time).
67

KSA 2 City Safety Goal: 1 A city for people
Outcome: 1.3 Residents and visitors feel safe Objective: 1.3.1 Work towards a safer city through partnerships with other agencies
Measure Target Actual Comments
Cost – Capital $620,000 $305,260 Council on 25 October 2011 resolved to implement a six-month trial of a mega taxi rank in Queen Street in lieu of the previously agreed two ranks. Consequently, there is a savings of approximately $320,000 in the capital budget.
Cost – Operational $615,000 $631,242 Overspend due to provision of additional security and traffic management staff to ensure taxi ranks operated safely.
Time – Install the fifth and sixth enhanced taxi ranks in the CBD in Collins Street (between Russell and Swanston streets) and Bourke Street (between Russell and Swanston streets), subject to usage surveys results.
30/06/2012 100% Achieved A mega taxi rank was installed on 2 December 2011. The fifth and sixth ranks were not commissioned as approved by Council on 25 October 2011.
Time – Install an on-street public toilet to support enhanced taxi ranks.
30/06/2012 100% Achieved The on-street toilet was installed on time and is in operation. The toilet was commissioned on 23 May 2012.
Time – Complete an audit of quantitative and qualitative data sets relevant to community safety.
30/06/2012 100% Achieved Parts A (quantitative) and B (qualitative) were provided to City of Melbourne Community Safety and Wellbeing branch and incorporated into the draft final report which comprises these two components.
Time – Engage with stakeholder groups present in the city late at night (including the finance and hospitality sector, students, public transport workers, taxi drivers etc) to determine their safety and amenity needs.
1/03/2012 100% Achieved The final draft of the qualitative research (Part B) and (Part A) quantitative Dusk to Dawn research project is complete and has been provided to Community Safety and Wellbeing for review. Community stakeholders were engaged in this project, providing observations and insights to shape the final recommendations.
Time – Provide funding for and deliver the actions contained in the 2011-12 Late Night Activation Plan.
30/06/2012 100% Achieved Feasibility study: night markets within the CBD The budget of $14,400 plus GST was fully expended, and report delivered to City of Melbourne with recommendations to be reviewed by KSA 2, 2012-2013 Project Working Group. Feasibility study: late night dance in the CBD The budget of $10,800 plus GST was fully expended and the report delivered
68

Goal: 1 A city for people
Outcome: 1.3 Residents and visitors feel safe Objective: 1.3.1 Work towards a safer city through partnerships with other agencies
Measure Target Actual Comments
to City of Melbourne with recommendations to be reviewed by KSA 2, 2012-13 Project Working Group. Melbourne Visitor Centre trial of late night opening The centre trialled extended operating hours in January 2012 to for an additional two hours per day from 6pm to 8pm daily. The trial concluded that this service was not viable. Operating costs came in under projected budget – $4869 rather than $13,065. Arts Grants (Council approved) Triennial Funding $100,000 expended through the 2012-2014 Triennial Program. Funds were spread across eight organisations for late night programming. Arts Grants (Council approved ) Annual Funding $100,000 through the annual Arts Grants Program. Funds were allocated to seven projects in the late night category. Note: Due to the cancellation of one of these projects, a proposal presented to the Lord Mayor by NGV for late night/24hour opening hours and associated activities was funded $30,000. These activities will take place during the Winter Masterpieces “Napoleon” exhibition in July and October 2012. Expended through the KSA budget
$12,000 was allocated to Signal for three events however only a total of $9808 was expended, leaving $2192 unexpended.
$5000 was allocated and spent for the Gothic themed Federation Bells event.
Recreation Services completed feasibility studies Later night operations for Riverslide Skate Park. The full amount of $10,500 was expended. The recommendation is to trial this operation on Thursday nights. Midnight Basketball feasibility report for the CBD cost $9000 ex GST, greater than listed amount of $5000. The report determined that the central city is not
69
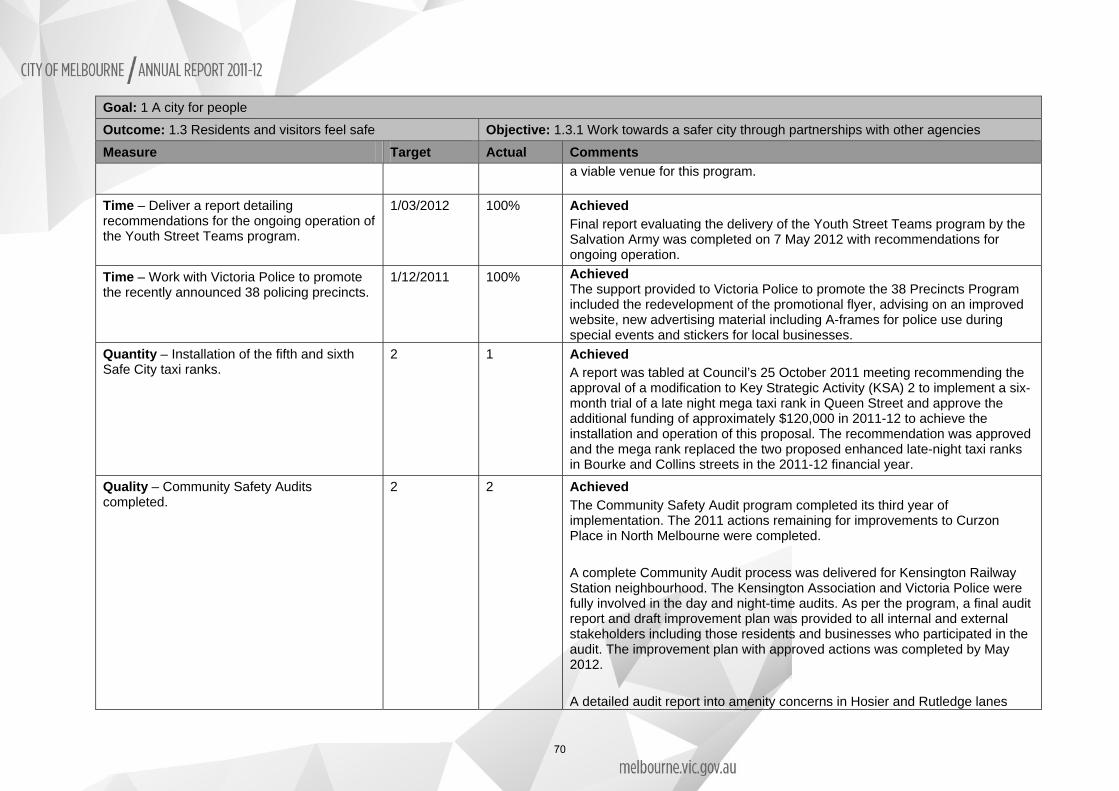
Goal: 1 A city for people
Outcome: 1.3 Residents and visitors feel safe Objective: 1.3.1 Work towards a safer city through partnerships with other agencies
Measure Target Actual Comments
a viable venue for this program.
Time – Deliver a report detailing recommendations for the ongoing operation of the Youth Street Teams program.
1/03/2012 100% Achieved Final report evaluating the delivery of the Youth Street Teams program by the Salvation Army was completed on 7 May 2012 with recommendations for ongoing operation.
Time – Work with Victoria Police to promote the recently announced 38 policing precincts.
1/12/2011 100% Achieved The support provided to Victoria Police to promote the 38 Precincts Program included the redevelopment of the promotional flyer, advising on an improved website, new advertising material including A-frames for police use during special events and stickers for local businesses.
Quantity – Installation of the fifth and sixth Safe City taxi ranks.
2 1 Achieved A report was tabled at Council’s 25 October 2011 meeting recommending the approval of a modification to Key Strategic Activity (KSA) 2 to implement a six-month trial of a late night mega taxi rank in Queen Street and approve the additional funding of approximately $120,000 in 2011-12 to achieve the installation and operation of this proposal. The recommendation was approved and the mega rank replaced the two proposed enhanced late-night taxi ranks in Bourke and Collins streets in the 2011-12 financial year.
Quality – Community Safety Audits completed.
2 2 Achieved The Community Safety Audit program completed its third year of implementation. The 2011 actions remaining for improvements to Curzon Place in North Melbourne were completed. A complete Community Audit process was delivered for Kensington Railway Station neighbourhood. The Kensington Association and Victoria Police were fully involved in the day and night-time audits. As per the program, a final audit report and draft improvement plan was provided to all internal and external stakeholders including those residents and businesses who participated in the audit. The improvement plan with approved actions was completed by May 2012. A detailed audit report into amenity concerns in Hosier and Rutledge lanes
70

Goal: 1 A city for people
Outcome: 1.3 Residents and visitors feel safe Objective: 1.3.1 Work towards a safer city through partnerships with other agencies
Measure Target Actual Comments
was completed in 2010. With recent community safety concerns emerging, this report has provided the basis for a renewed community safety process. A meeting of internal and external stakeholders including Victoria Police took place to develop an action plan. In response to a letter to Council and media by Friends of Royal Park group and local residents, a community safety audit was conducted for the walking path between the Royal Park Railway Station and the golf course car park in Old Poplar Road. The audit involved Victoria Police and representatives of City of Melbourne, City Issues, Parks Planning and Engineering Infrastructure teams. Local residents who use the path were key participants. A final audit report was produced recommending solar LED lighting to be installed that is energy efficient and has minimal impact on vegetation. Crime prevention through environmental design training was provided for City of Melbourne staff. This training provides the basis of the Community Safety Audit methodology.
71

KSA 3 Homelessness Goal: 1 A city for the people
Outcome: 1.4 Diverse, harmonious, caring communities Objective: 1.4.3 Support and develop sustainable pathways out of homelessness
Measure Target Actual Comments
Cost – Operational $236,800 $229,438
Variance $7,362 – Small variance of less than 5 per cent to target.
Cost – Capital Works $180,000 $352,014 Council initially allocated $180,000 in the 2011-12 budget and then a further $195,000 was allocated by Council on 30 August for project completion.
Cost – Annual funding contribution to the ‘Where the Heart is’ Festival.
$20,000 $20,000
‘Where the Heart is’ festival held 23 March 2012.
Time – Establish a Homelessness Advisory Committee.
1/03/2012 100% Achieved Homelessness Advisory Committee established with inaugural meeting held 12 December 2011.
Time – Documented agreement between Council and Doutta Galla Health Service regarding provision of health services for people experiencing homelessness.
30/06/2012 100% Achieved Sub-Lease Melbourne Affordable Housing and Melbourne City Council and Doutta Galla Community Health Service. Melbourne City Council and Doutta Galla Community Health Service: Central City Community Health Service (CCCHS) Service Agreement.
Time – Minor building works to provide Community Health Centre at the Drill Hall.
30/06/2012 100% Achieved Opened on 31 May 2012.
Time – Work with the Salvation Army to deliver project documentation and design for 69 Bourke Street.
30/04/2012 40% Not Achieved Project progressing however there have been delays with the Salvation Army’s planning.
Time – Deliver StreetCount research report and improved data analysis and reporting system.
30/06/2012 100% Achieved StreetCount2012 Report and StreetCount2012 Analysis of Volunteer Evaluation Data delivered on 28 June 2012.
Time – Deliver materials, promotion and training for annual StreetCount project.
30/6/2012 100% Achieved Materials, promotion and volunteer training for StreetCount2012 delivered on 30 May 2012.
Time – Deliver a report detailing how women experience homelessness throughout the
1/03/2012
100% Achieved Homelessness and Women in the City of Melbourne Report completed 20
72

Goal: 1 A city for the people
Outcome: 1.4 Diverse, harmonious, caring communities Objective: 1.4.3 Support and develop sustainable pathways out of homelessness
Measure Target Actual Comments
municipality. February 2012.
Time – Conduct a Homelessness Summit. 31/05/2012 100% Achieved Homelessness Summit held 31 May 2012 with 125 attendees.
Time – Deliver a report addressing the topic of people living in rooming houses.
1/03/2012 100% Achieved Rooming House Residents in the City of Melbourne Needs and Characteristics Report completed on 20 March 2012.
Quantity – Increase number of cafes. 12 10 Cafes 80%
Partially Achieved Total cafe numbers did not reach target but increases achieved in number of central city cafes, number of cafes open on weekends and open late on weekdays.
Quantity – Increase number of cafe meals participants.
70 82 Achieved Target exceeded. However, variations occurred throughout the year.
Quality – The percentage of street count data migrated to SPSS for analysis.
100% 100% Achieved All StreetCount data migrated to SPSS and analysed.
73

KSA 4 Climate Change Adaptation and Mitigation Goal: 5 An eco-city
Outcome: 5.2 Melbourne is better adapted to climate change Objective: 5.2.1 Influence the municipality to adapt to climate change
Measure Target Actual Comments
Cost – Capital Works $9,392,000 ($2,801,000 subject to external funding)
$4,730,576 The $4.7 million underspend is largely due to the major delays in the Fitzroy Gardens stormwater harvesting and depot project. There was a partial collapse of the excavation following heavy rain. Amended design and rectification work was required and has delayed completion to early October 2012. The underspend is also due to minor delays in the tree planting in the Yarra River corridor, stormwater harvesting design documentation and flood mitigation drainage works.
Cost – Operational $430,000 ($1,500 subject to external funding)
$638,573 Additional expenditure on grants and contributions can be accounted for by a $100,000 payment of the residual 2010-11 Department of Planning and Community Development grant funding to Sustainable Melbourne Fund to start the 1200 Buildings Environmental Upgrade Finance. Additional expenditure in professional services was due to recommendations received from the market research report delivered in January 2012. Additional expenditure on stakeholder and community forums and communication materials (including videos) ensured that the KSA deliverables for community engagement were met. A communications professional was also contracted due to a lack of capacity within the Communications and Strategic Marketing team. Research: A number of research projects were undertaken under the heading of KSA 4. However, not all of the costs associated with the ‘approved research projects’ were included in the original KSA budget and workplan. This has given rise to an unfavourable variance of $97,000. This variance primarily relates to the research work on the economic impact of the urban heat island effect and climate change communication.
Time – Installation of the Fitzroy Gardens stormwater harvesting project including depot, tank and landscaping.
30/06/2012 72% Not Achieved A revised landscape plan was required by Heritage Victoria before approval was provided. Formal approval of the landscape plan will be required from Council later in 2012. The works were delayed by the partial collapse of the excavation, following heavy rain. Time was lost for amended design work and required rectification work. Expected completion date for the tank is now early October 2012.
74

Goal: 5 An eco-city
Outcome: 5.2 Melbourne is better adapted to climate change Objective: 5.2.1 Influence the municipality to adapt to climate change
Measure Target Actual Comments
Time – Completion of the irrigation and soil re-charge system associated with the Darling Street stormwater harvesting project.
30/06/2012 100%
Achieved All physical works associated with the tank and road are complete (kerb and channel, re-sheeting, trees, filter beds, line marking). Irrigation connection to Darling Square and Powlett Reserve as well as the construction for pump housing is complete. The system has been commissioned and is under the defects liability period. The monitoring program with the University of Melbourne has begun and will run for 24 months. A completion event was held on 5 June with Councillor Oke.
Time – Tree replacement as required in Alexandra Park and the Yarra River corridor.
30/06/2012 90% Substantially Achieved Planting areas were defined as between Punt Road and Morrell Bridge. Between Swan Street and Punt Road 144 trees were planted. Adjacent to Morrell Bridge, 34 trees, several groundcovers (at a ratio of 4 per square metre) and shrubs (spaced 1 per square metre) were ordered for the winter planting season and will be planted by September 2012. Further identified planting sites included Batman Park, Linlithgow Avenue Folly and Engineers Lawn. Heritage Victoria advised Council of its intention to formally nominate the Domain Parklands for the Victorian Heritage Register. Council advised Heritage Victoria of all proposed works, including plantings. This impacted on planting timelines. Subsurface investigations and analysis was undertaken on the lower terrace of Birrarung Marr and recommendations for new soil profiles, drainage and tree species selection were made to guide replacement of the aging and unhealthy elm and fig trees. A draft masterplan was completed for the corridor between Punt Road Bridge and Morrell Bridge.
Time – Complete the design and documentation for landscape adaptation projects for Burston Reserve, Queensberry Street and Linlithgow Avenue.
30/06/2012 100% Achieved Burston Reserve concept design was completed and a contract awarded. Queensberry Street tree island concept designs and external consultation were completed. Linilthgow Avenue concept designs were completed and sent to Heritage Victoria.
75

Goal: 5 An eco-city
Outcome: 5.2 Melbourne is better adapted to climate change Objective: 5.2.1 Influence the municipality to adapt to climate change
Measure Target Actual Comments
Time – Finalise design documentation for the tender of the Birrarung Marr and Queen Victoria Gardens stormwater harvesting project.
30/06/2012 95%
Substantially Achieved Birrarung Marr stormwater harvesting: Concept for scheme was amended at the start of the year as the location and method of water capture had to be changed when concerns were raised with the original tank location. A structural, civil and landscape design plan was completed and a tender package developed. This package went for tender on 23 June 2012 and is currently under evaluation. Alexandra and Queen Victoria Gardens: The concept for this scheme was redesigned due to latent ground conditions. The scheme concept underwent intensive investigation and resulted in a several month delay in the start of design work for the scheme. A revised concept has been developed and design work is now well progressed with a tender package to be completed by August 2012.
Time – Implement flood mitigation upgrades to the drainage infrastructure in Flinders and Wells streets and complete hydraulic analysis of Swanston Street and Flinders Street intersections.
30/06/2012 95% Substantially Achieved Project 1: Wells Street drainage works suspended due to presence of contaminated soil. Councillor briefing paper issued. Project 2: Flinders Street / Market Street drain was completed in May 2012. Project 3: Flinders Street (King Street to Spencer Street) drain was complete by June 2012. Project 4: Swanston Street drain hydraulic analysis was completed in March 2012.
Time – Establish a baseline to assess community awareness and participation in climate change adaptation and mitigation and the ‘Eco City’ programs by completing a community needs assessment; developing a community engagement and communications process and trialling a sustainable living and behavioural change program within the Carlton precinct.
30/06/2012 100%
Achieved 1. Research undertaken established a baseline for community awareness and engagement. 2. A community strategy was developed to capture identified needs and to commence a process. 3. Sustainable living programs were trialled in Carlton (Eco Carlton Business and Eco Carlton – Housing and Collaborative Consumption). 4. Eco Carlton activities included CarrotMob, Garage Sale Trail and the Sustainable Living Festival.
76

Goal: 5 An eco-city
Outcome: 5.2 Melbourne is better adapted to climate change Objective: 5.2.1 Influence the municipality to adapt to climate change
Measure Target Actual Comments
Time – Provide a report on the opportunities and impact of a carbon price on the City of Melbourne's operations including recommended actions to reduce the impact.
30/03/2012 100% Achieved Research into the carbon price impacts on the City of Melbourne and Council operations were undertaken. A summary of the carbon price impacts were included as part of the Executive Summary for the Annual Plan and Budget Report at the 26 June council meeting.
Time – Increase participation by commercial building owners and tenants in the 1200 Buildings program and CitySwitch program.
30/06/2012 100% Achieved Participation in both programs increased as a result of events and targeted engagement activities.
Time – Work with the Sustainable Melbourne Fund to deliver at least four Environmental Upgrade Finance agreements for the 1200 Buildings program.
30/06/2012 75% Not Achieved Three agreements were delivered. Commitment was gained from financiers for the fourth agreement to be signed in September 2012.
Time – Demonstrate the feasibility of district energy systems through the development of energy demand and opportunities map.
30/06/2012 55% Not Achieved Work was undertaken towards delivering an energy demand and opportunities map across the four councils. The project was not completed as the project inception phase took longer than anticipated. The project scope and grant agreement were finalised between the parties. Council stakeholders were engaged and relevant data collection was commenced. Complexities in data collection across the four councils in part contributed to the delay in undertaking the mapping project. Significant progress has been made in this area and work is continuing with the GIS Team and with other councils to provide the relevant data. Developing relationships with relevant utilities also commenced and is ongoing. The CSIRO and the City of Melbourne, on behalf of the IMAP councils, have entered into a funding agreement and are committed to completing the energy map project in the 2012-13 financial year.
Time – Identify and test potential solutions that facilitate the retrofit of higher density residential homes to achieve energy and water efficiency and climate proofing.
30/06/2012 100% Achieved Over $1 million in funding was secured to build and deliver a national engagement program. Council and directors were briefed. An illustrative communication tool was also developed.
Time – Monitor and report on implementation of year one of the climate change adaptation risk register.
30/06/2012 100% Achieved All appropriate climate change adaptation risks are included in the corporate risk register. Quarterly risks reports are produced.
77

Goal: 5 An eco-city
Outcome: 5.2 Melbourne is better adapted to climate change Objective: 5.2.1 Influence the municipality to adapt to climate change
Measure Target Actual Comments
Quality – Percentage increase in building owner and tenant awareness of energy and water efficiency retrofit processes and opportunities.
10% 15% Achieved Market research undertaken and event surveys confirm an increase in awareness as a result of engagement with building owners and tenants.
78

KSA 5 Streetscapes Goal: 1 A city for the people
Outcome: 1.6 High quality public spaces Objective: 1.6.1 Provide a range of high quality and welcoming public spaces
Measure Target Actual Comments
Cost – Capital Works $1,500,000 $1,504,508 Capital budget account 11ES013N ($1 million) fully expended. Capital budget account 11ES213R ($500,000) fully expended.
Cost – Operational $102,500 $118,200 Expenditure exceeded due to additional project management resources required to complete the project. Additional was expenditure absorbed within Engineering Services 2011-12 operating budget.
Time – Deliver approved streetscape works in Elizabeth Street and Flinders Lane.
30/06/2012 90% Substantially Achieved The Flinders Lane streetscape project was delivered in accordance with the schedule of works. Final close out of all remediation works will be achieved in conjunction with the Australand Development at 357 Collins Street. Skylights and lighting works were installed on the east side of Elizabeth Street by 30 June 2012. However, skylights and electrical works to the west side were delayed due to CitiPower supply works. The works were completed in late July 2012. Minor variations to time have been communicated.
Time – Undertake negotiations with VicRoads and Department of Transport to support implementation of concepts to improve pedestrian amenity and east-west public transport movements in King Street.
30/06/2012 90% Substantially Achieved The delay of this deliverable was reported to the Council's Future Melbourne Committee on 8 May 2012. In subsequent meetings with VicRoads, it was agreed in principle that VicRoads would initiate a trial to adjust the King Street traffic signals during weekday off peak times which will enable the assessment on improvements to pedestrian safety and east / west public transport movements in King Street.
Time – Develop concept plans and alternatives for two sites identified in rolling program (initially developed in 2010-11) for planned implementation in 2012-13.
30/06/2012 90% Substantially Achieved Two streetscape improvement proposals were recommended by the Streetscape Coordination Committee for inclusion in the draft 2012-13 capital works program budget. The capital works panel reviewed the 2012-13 project bid proposals in February. $2.65 million funding was approved by Council in June 2012. Elizabeth Street concept plan Due to uncertainties with private developments, a concept plan for Collins
79

Goal: 1 A city for the people
Outcome: 1.6 High quality public spaces Objective: 1.6.1 Provide a range of high quality and welcoming public spaces
Measure Target Actual Comments
Street has not been finalised.
Quantity – Number of streetscape improvement projects by 30 June 2012.
2 1 Achieved The scope of the Flinders Lane street lighting component was amended as detailed in a briefing paper on 26 March 2012. The Flinders Lane streetscape project was delivered by 30 June 2012. Substantially Achieved Skylights and lighting works were installed on the east side of Elizabeth Street by 30 June 2012. However, skylights and electrical works to the west side were delayed due to CitiPower supply works. The works were completed in late July 2012.
80

KSA 6 Queen Victoria Market Goal: 3 Economic Prosperity
Outcome: 3.1 A sustainable and resilient city economy Objective: 3.1.1 Implement strategies to support a thriving and diverse economy
Measure Target Actual Comments
Cost – Capital $750,000 $600,000 Expenditure for Franklin Street is on hold pending outcomes of discussions with State Government.
Cost – Operational $400,000 $388,533 Achieved within budget.
Time – Community consultation on long term vision for Queen Victoria Market (QVM).
30/06/2012 0% Not Achieved On hold pending discussions with State Government. No community engagement program will commence until State Government has been consulted.
Time – Documentation of improvements to trader’s facilities.
30/06/2012 30% Not Achieved Research undertaken to identify trader’s requirements for improvement, process in place to commence engagement with traders to develop brief for projects.
Time – Ongoing upgrade of Queen Street, Victoria Street and Franklin Street.
30/06/2012 90% Substantially Achieved Preliminary design complete, awaiting confirmation to progress. Victoria Street (Peel to Queen Streets):
roadway works for new bluestone kerb and channel works footpath works Victoria Street (Cobden to Peel streets) kerb and channel works.
Franklin Street: Expenditure for Franklin Street is on hold pending outcomes of
the business case discussions with State Government.
Time – Reach agreement with all stakeholders regarding the phased implementation of the long term vision for QVM and commence implementation
30/06/2012
35% Not Achieved Project awaiting confirmation of discussions with State Government, in the meantime working with QVM board and management to refine proposals, commencement of engagement with traders.
Quantity – Percentage completion of budgeted streetscape upgrade works as prioritised in long term strategy.
100% 90% Substantially Achieved Complete as prioritised.
81

KSA 7 Swanston Street Redevelopment Goal: 6 A connected city
Outcome: 6.1 Movement of people and goods within the municipality is efficient , integrated and safe, with more people choosing sustainable forms of transport
Objective: 6.1.2 Integrate public transport with cycling and walking as the preferred mode of travel to the city
Measure Target Actual Comments
Cost – Capital $14,700,000 ($7 million external funding)
$17,260,286 Due to latent conditions and other unexpected site activities an accelerated program of works was put in place to recover lost time in an attempt to meet original project timelines. This has resulted in higher expenditure during 2011-12 than planned. However, the estimated overall cost of the project is unchanged at $25.6 million. The higher expenditure in 2011-12 will be offset by lower expenditure in 2012-13 than originally planned.
Time – Completion of the construction of stage one of the Swanston Street Redevelopment at State Library, between La Trobe Street and Little Lonsdale Street.
30/11/2011 100% Achieved
Time – Tender and award the works for stage two of the Swanston Street Redevelopment.
30/11/2011 100% Achieved 2Construct Pty Ltd was awarded the contract for stage two works 11 October 2011.
Time – Implement formal road closures for stage two of the Swanston Street redevelopment.
28/02/2012 100% Achieved Council approved the recommendation to the closure of Swanston Street between Franklin Street and A'Beckett Street, Little Bourke Street and Bourke Street, and Collins Street and Flinders Lane to all vehicles excluding trams, bicycles and authorised vehicles as part of stage two of the Swanston Street redevelopment on 21 December 2012.
Time – Construction of two tram stops along Swanston Street at City Square and Bourke Street and the commencement of construction of a tram stop at Franklin Street.
30/06/2012 90% Substantially Achieved Construction of Bourke Street stop was completed by 30 June 2012 and officially opened by Yarra Trams for tram usage on Tuesday 3 July with Practical Completion issued on 4 July. City Square stop completion date was revised to 31 July 2012 due to latent conditions on site. Franklin Street stop construction commenced 5 May 2012.
Time – Implementation of traffic changes to Swanston Street, from Flinders Lane to Little
30/06/2012 100% Achieved Councillors were advised of the intended changes to traffic management and
82

Goal: 6 A connected city
Outcome: 6.1 Movement of people and goods within the municipality is efficient , integrated and safe, with more people choosing sustainable forms of transport
Objective: 6.1.2 Integrate public transport with cycling and walking as the preferred mode of travel to the city
Measure Target Actual Comments
Lonsdale Street. access arrangements associated with the commencement of stage two of the Swanston Street Redevelopment. The changes were implemented by the manager of Engineering Services under delegation.
Quantity – Number of tram stops completed. 3 2 Substantially Achieved Two tram stops were completed – State Library and Bourke Street. Due to latent conditions on site, the revised completion date for the City Square (Collins Street) stop is 31 July 2012.
83

KSA 8 Docklands Second Decade Goal: 1 A city for the people
Outcome: 1.8 A well planned city with a vision of the future Objective: 1.8.2 Facilitate quality urban development and sustainable growth in Docklands
Measure Target Actual Comments
Cost – Capital $500,000 $247,288 There were delays in capital projects for Docklands which has affected expenditure: 1. The multi-purpose court was delayed as additional risk assessments
had to be completed to meet gas regulator requirements on Harbour Esplanade.
2. Garden Shelter was delayed due to change of design scope. The new design scope included working with Melbourne University Architecture students (Design Studio) to generate new and innovative ideas with a design studio.
Both projects are progressing. However, timeframes have been revised and will now be delivered as follows: multi-purpose court in November 2012 and Garden Shelter by December 2012. The remaining funding will be carried forward to ensure completion of these projects.
Cost – Operational $537,730 $190,577 Due to delay in the launch of Docklands Second Decade (D2), there has been limited expenditure (see below).
Time – Following the adoption of the D2 Vision, Strategic Directions and Actions, prepare and deliver the Deliver Docklands Strategic Plan and submit to the Minister for Planning for incorporation into the Melbourne Planning Scheme.
30/06/2012 95% Substantially Achieved
Due to the timing for the transition of VicUrban to Places Victoria (PV), the adoption of the D2 was delayed.
Once established, PV and City of Melbourne agreed that the D2 Plan should be titled Docklands Community and Place Plan (DCPP). The DCPP would be a more appropriate mechanism to spatially define social, economic and environmental needs for existing and future communities in Docklands rather than the Strategic Plan.
The DCPP was finalised by 30 June 2012 and following discussions between the Office of the Minister for Planning, Places Victoria and City of Melbourne it was agreed to release the document on 15 July 2012.
Time – Verify the timing and commence the delivery of actions as identified in the D2 vision for Year 1 (2011-12).
30/06/2012 100% Achieved Project list formalised and commenced (see project status below).
84
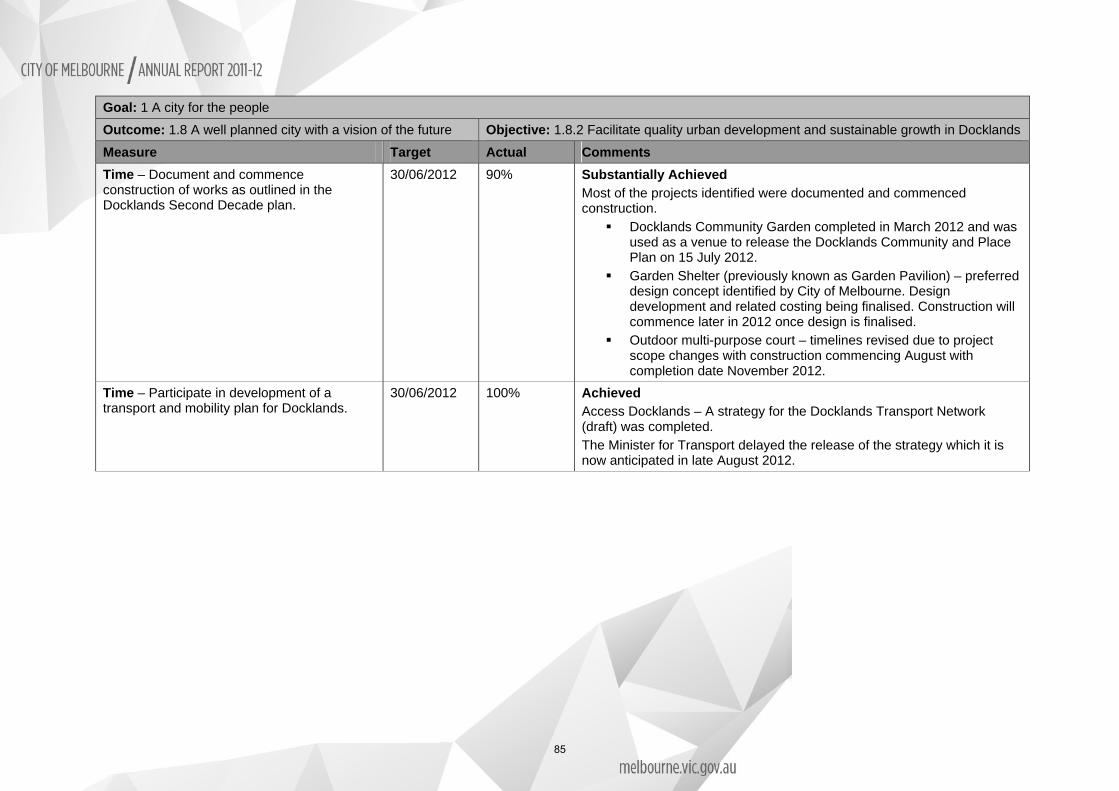
Goal: 1 A city for the people
Outcome: 1.8 A well planned city with a vision of the future Objective: 1.8.2 Facilitate quality urban development and sustainable growth in Docklands
Measure Target Actual Comments
Time – Document and commence construction of works as outlined in the Docklands Second Decade plan.
30/06/2012 90% Substantially Achieved Most of the projects identified were documented and commenced construction.
Docklands Community Garden completed in March 2012 and was used as a venue to release the Docklands Community and Place Plan on 15 July 2012.
Garden Shelter (previously known as Garden Pavilion) – preferred design concept identified by City of Melbourne. Design development and related costing being finalised. Construction will commence later in 2012 once design is finalised.
Outdoor multi-purpose court – timelines revised due to project scope changes with construction commencing August with completion date November 2012.
Time – Participate in development of a transport and mobility plan for Docklands.
30/06/2012 100% Achieved Access Docklands – A strategy for the Docklands Transport Network (draft) was completed. The Minister for Transport delayed the release of the strategy which it is now anticipated in late August 2012.
85

KSA 9 Community Infrastructure Goal: 1 A city for the people
Outcome: 1.7 Improved access to relevant and affordable community services
Objective: 1.7.4 Establish and improve community infrastructure in all neighbourhoods
Measure Target Actual Comments
Cost – Capital $22,794,560 ($2 million external)
$16,214,599
Underspend as a result of delays in Holland Park and Kensington Town Hall as well as Council resolution not to proceed with police pod. Actual excludes $5 million purchase of Kathleen Syme Centre. NB. Target of $22.795 million does not include capital carry forward.
Cost – Payment to Housing Choices Australia on practical completion of works to the Drill Hall Community Centre.
$650,000 $650,000
Payment made to Melbourne Affordable Housing on 1 September 2011 for $650,000.00 plus GST. Supplier payment history report details payment.
Time – Completion of Boyd community hub heritage building, including landscaping works facing City Road.
31/03/2012 100% Achieved Practical completion certificate issued 17 May 2012. The building contract included three extensions of time to the contactor as follows: 1. Extension of time 007 – Summary of EOTs one to seven.
2. Extension of time 008 – Landscape Levels not correct.
3. Extension of time 009 – Revised Practical Completion.
Time – Opening of Boyd Library and Community Centre.
30/06/2012
100% Achieved The library and community centre at Boyd was operational from 29 June 2012. The community began using the library and community centre on Monday 2 July 2012, with the official open day event taking place on 7 July 2012. Induction day program.
Website notification of library opening and user numbers for first week of operation.
Time – Construction commenced on Docklands Library and Community Centre.
30/06/2012
Tripartite Agreement 14/06/2012 Develop-
Substantially Achieved Tripartite Agreement between City of Melbourne, Lend Lease Development and Places Victoria executed on 14 June 2012 to guarantee project funding following protracted negotiations. Development Agreement between Lend Lease and City of Melbourne was executed on 13 July 2012. It includes the design and construction work. Design work has been continuing whilst the Development Agreement was being negotiated. Commencement of construction delayed due to late
86

Goal: 1 A city for the people
Outcome: 1.7 Improved access to relevant and affordable community services
Objective: 1.7.4 Establish and improve community infrastructure in all neighbourhoods
Measure Target Actual Comments
ment Agreement 13/07/2012 90%
requirement of the developer to change the procurement arrangements to a Development Agreement from a design and construct contract. This necessitated approx three months of legal agreement development and agreement to the detailed scope of work.
Time – Building works on the Carlton Baths/Family Resource Centre Redevelopment 55 per cent complete.
30/06/2012 100% Achieved Construction contract let to Built Pty Ltd on 17 October 2011 for $7,644,960. Progress payment claim dated 30 June 2012 for $$1,504,572. Value of work completed in the contract is $5,694,338 in respect to the contract amount as varied of $9,824,769, which is 57.9 per cent.
Time – Completion of building fabric repairs on the Kensington Town Hall, including works to ensure ground floor disability compliance and renewal of services infrastructure.
30/06/2012
Contract A: 18/06/2012 Contract B: Estimated 15/06/2013 70%
Not Achieved Components of the deliverable are delayed and will be completed in 2012-13. Fabric repairs and major structural works were completed on 21 June 2012. The work required to provide DDA compliant access to the building and upgrade the building services is very different to the fabric and structural repairs which had a heritage focus. There was also insufficient funding hence these works were tendered in May 2012 so that a contract could be let early in 2012-13 using the additional $800,000 provided in the 2012-13 Council Works program. Construction is expected to be completed by June 2013. Council was notified of changes to this project as part of the report on variations to the 2011-12 KSAs on 8 May 2012
Time – Minor building works within the Multicultural Hub to ensure access to playgroup and Community Services space provided in the Drill Hall redevelopment.
30/11/2011 100% Achieved Practical completion awarded 12 April 2012. It was agreed that commencement of the project would be delayed to accommodate activities pre-booked for the rooms by the tenant (AMES), and cause least disruption to users.
Time – Purchase, design and documentation of the Kathleen Syme Centre in Carlton.
30/06/2012 Purchase: Estimated 30/09/2012
Substantially Achieved Settlement of Kathleen Syme Centre was originally anticipated to occur in the 2011-12. However, due to circumstances beyond the control of City of Melbourne this has not occurred. The contracting for the separation of building services from the balance of the former Royal Women’s Hospital
87

Goal: 1 A city for the people
Outcome: 1.7 Improved access to relevant and affordable community services
Objective: 1.7.4 Establish and improve community infrastructure in all neighbourhoods
Measure Target Actual Comments
Design and document: Estimated 30/11/2012 90%
site, in order to be able to create a 'free standing' building and title to transfer to City of Melbourne has been handled wholly by the State Government. The contract of sale stipulates that settlement will take place 30 days after notification that works are complete. Advice received from the Victorian Government Solicitors Office states that settlement is unlikely to take place until September, with work scheduled for completion in August. Building design has advanced in parallel with the above process, following community consultation and resultant Council resolution.
Time – Completion of refurbishment works on sports pavilion at JJ Holland Park.
30/06/2012 40%
Not Achieved Project delayed by financial collapse of the contractor Core Properties Pty Ltd. Contract has been terminated on 27 June 2012 and tenders will be called following revisions to the project drawings. Expected completion is in June 2013.
Time – Delivery on site of police pod at Queensberry Square.
30/03/2012 Not delivered
Not Achieved Council resolved on 13 December 2011 not to construct a police pod at Queensbridge Square. An agreement was entered into with Victoria Police to provide a police presence at peak times namely Friday and Saturday nights in place of the police pod.
Time – Upgrade works completed at North Melbourne (Buncle St) Community Centre.
30/06/2012 100% Achieved Practical Completion awarded 19 June 2012.
Time – Completion of new Maternal and Child Health consulting suite at Abbotsford Street, North Melbourne.
30/06/2012 100% Achieved Practical Completion awarded 9 May 2012.
Time – Provide additional public space at North Melbourne Library.
30/03/2012 100% Achieved Practical Completion awarded 20 April 2012. Delay to project due to lead times for specialist lighting from Belgium.
Time – Upgrade environmental sustainable systems at East Melbourne Library.
30/06/2012 85% Partially Achieved Quotations for the work were sought in May 2012. However, there were no acceptable quotations received. Negotiations have continued to find a suitable technical response and have now been finalised. The work will be
88

Goal: 1 A city for the people
Outcome: 1.7 Improved access to relevant and affordable community services
Objective: 1.7.4 Establish and improve community infrastructure in all neighbourhoods
Measure Target Actual Comments
carried out by end of August 2012.
Time – Completion of upgrade works at ArtPlay.
30/06/2012 85% Partially Achieved White roof separate contract reached practical completion on 21 December 2011. Balance of work delayed by late building surveyor requirement for additional geotechnical testing. Expected completion is end August 2012 for combined additional scope of works at ArtPlay.
Quality – Percentage of projects programmed for completion achieve certificate of occupancy compliance and are fit for purpose.
100% 50% Not Achieved Eight projects have been included because they have been in the construction phase. Four have been completed, whilst four have not achieved the target. Of the four that are incomplete two are expected to be complete by end August whilst the Holland Park Pavilion will be re-tendered and will be complete in late 2012-13.
89

KSA 10 - Evaluation of City of Melbourne funded major events Goal: 8 Manage our resources well
Outcome: 8.5 Timely and accurate financial and corporate reports
Objective: 8.5.1 Monitor and evaluate our performance to drive ongoing improvement and increased efficiency
Measure Target Actual Comments
Cost – Operational $277,500 $268,914 The operational delivery of the KSA 10 was $268,914. The summary KSA 10 report expenditure of $15,000 will be incurred in the 2012-13 financial year.
Time – Complete an evaluation of 2011 Moomba.
1/09/2011 100% Achieved Triple bottom evaluation for Moomba 2011 was delivered on time and on budget. Baseline data was established for the premier event and includes customer satisfaction, economic impact and crowd attendance figures.
Time – Complete an evaluation of New Year’s Eve (NYE).
1/06/2012 100% Achieved Triple bottom evaluation for NYE 2011 was delivered on time and on budget. Baseline data was established for the premier event and includes customer satisfaction, economic impact and crowd attendance figures.
Time – Complete an evaluation of Melbourne Spring Fashion Week (MSFW).
1/02/2012 100% Achieved Triple bottom evaluation for MSFW 2011 was delivered on time and on budget. Baseline data was established for the premier event and includes customer satisfaction, economic impact and crowd attendance figures.
Time – Complete an evaluation of Melbourne Music (MMW).
1/05/2012 100% Achieved Triple bottom evaluation for MMW 2011 was delivered on time and on budget. Baseline data was established for the premier event and includes customer satisfaction, economic impact and crowd attendance figures.
90
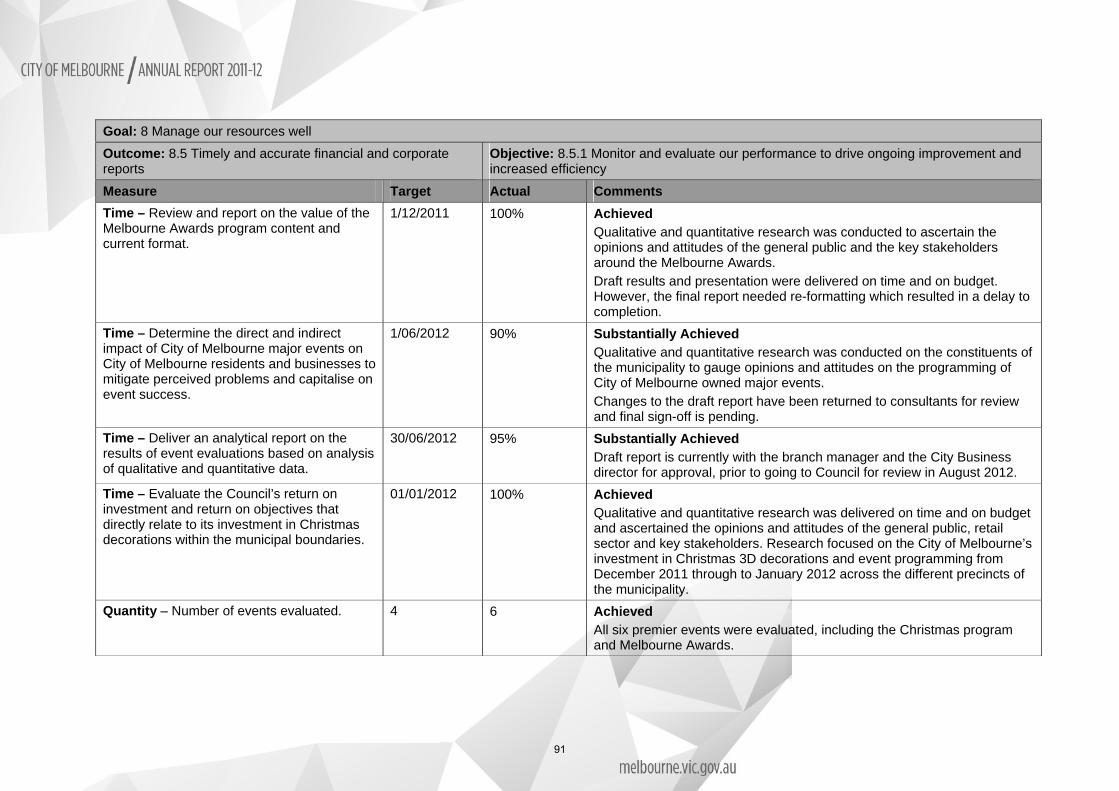
Goal: 8 Manage our resources well
Outcome: 8.5 Timely and accurate financial and corporate reports
Objective: 8.5.1 Monitor and evaluate our performance to drive ongoing improvement and increased efficiency
Measure Target Actual Comments
Time – Review and report on the value of the Melbourne Awards program content and current format.
1/12/2011 100% Achieved Qualitative and quantitative research was conducted to ascertain the opinions and attitudes of the general public and the key stakeholders around the Melbourne Awards. Draft results and presentation were delivered on time and on budget. However, the final report needed re-formatting which resulted in a delay to completion.
Time – Determine the direct and indirect impact of City of Melbourne major events on City of Melbourne residents and businesses to mitigate perceived problems and capitalise on event success.
1/06/2012 90% Substantially Achieved Qualitative and quantitative research was conducted on the constituents of the municipality to gauge opinions and attitudes on the programming of City of Melbourne owned major events. Changes to the draft report have been returned to consultants for review and final sign-off is pending.
Time – Deliver an analytical report on the results of event evaluations based on analysis of qualitative and quantitative data.
30/06/2012 95% Substantially Achieved Draft report is currently with the branch manager and the City Business director for approval, prior to going to Council for review in August 2012.
Time – Evaluate the Council’s return on investment and return on objectives that directly relate to its investment in Christmas decorations within the municipal boundaries.
01/01/2012 100% Achieved Qualitative and quantitative research was delivered on time and on budget and ascertained the opinions and attitudes of the general public, retail sector and key stakeholders. Research focused on the City of Melbourne’s investment in Christmas 3D decorations and event programming from December 2011 through to January 2012 across the different precincts of the municipality.
Quantity – Number of events evaluated. 4 6 Achieved All six premier events were evaluated, including the Christmas program and Melbourne Awards.
91

Goal: 8 Manage our resources well
Outcome: 8.5 Timely and accurate financial and corporate reports
Objective: 8.5.1 Monitor and evaluate our performance to drive ongoing improvement and increased efficiency
Measure Target Actual Comments
Quality – New Year’s Eve 2011: Percentage of attendees rating satisfaction at eight or more out of ten.
67%
61% Substantially Achieved 560 New Year’s Eve event attendees responded to a post event online survey resulting in reliable and robust quantitative data. Customer satisfaction rating was down by 6 per cent from the 2010 event evaluation.
Quality – New Year’s Eve 2011: Value of direct economic impact of NYE on the City of Melbourne.
$16 million
$20.7 million (in-scope)
Achieved In-scope expenditure (defined as new money coming into the municipality) was established by: applying Victorian State Government methodologies and standards to major event economic impact calculations and using two data collection tools: post event attendee surveys and crowd attendance methodologies. Data is quantitative and auditable. New Year’s Eve economic impact was up $8.4 million on the same 2010 indicator. This result was largely due to the increase in calculated crowd attendance from 216,000 (2010) to 256,000 in 2011 across City of Melbourne event precincts and a rise in event attendee spend.
Quality – New Year’s Eve 2011: Average spend per attendee.
$60.05 $87 (in-scope) Achieved Spend data was established using quantitative results from the post event attendee survey and indicate that there was an increase of $27 per event attendee spend on the 2010 attendee spend. Highest spend appears to be related to food and beverage items, similar to 2010.
Quality – Melbourne Spring Fashion Week 2011: Percentage of attendees rating satisfied or very satisfied by overall event.
81.1% 82% Achieved 541 MSFW event attendees responded to a post event survey resulting in reliable and robust quantitative data.
92

Goal: 8 Manage our resources well
Outcome: 8.5 Timely and accurate financial and corporate reports
Objective: 8.5.1 Monitor and evaluate our performance to drive ongoing improvement and increased efficiency
Measure Target Actual Comments
Attendee satisfaction results were established using triple bottom line post event online attendee surveys. 2011 results were comparable to 2010 indicators.
Quality – Melbourne Spring Fashion Week 2011: Value of direct economic impact of Melbourne Spring Fashion Week on the City of Melbourne.
$1.6 million
$5 Million Achieved In-scope expenditure (new money coming into the municipality) was established using two data collection tools: post event attendee surveys and crowd attendance methodologies. Data is quantitative and auditable. The significant increase in economic impact was due to the rise in average spending per event attendee and the improved, auditable triple bottom line data collection processes.
Quality – Melbourne Spring Fashion Week 2011: Average spend per attendee.
$139.64
$293 Achieved Quantitative data indicates that there was a significant increase in the average attendee spend between the 2010 and 2011 event results. The shifts in results are due in part to the improved data collection and calculation methodologies used to establish event spend patterns and the calculation of patrons attending the MSFW free public events.
Quality – Melbourne Spring Fashion Week 2011: Number of event attendees at official City of Melbourne non-ticketed events.
20,037
13,553 Not Achieved Time lapse cameras and thermal pedestrian counting systems at the City Square MSFW event marquee established that there were:
8479 primary event attendees (entering the event marquee for the primary purpose of watching the MSFW event)
5074 secondary event attendees (incidentally observing or taking part in the event from outside the MSFW event marquee).
Quality – Moomba 2011: Percentage of attendees rating event experience four out of
52% 61% Achieved
93
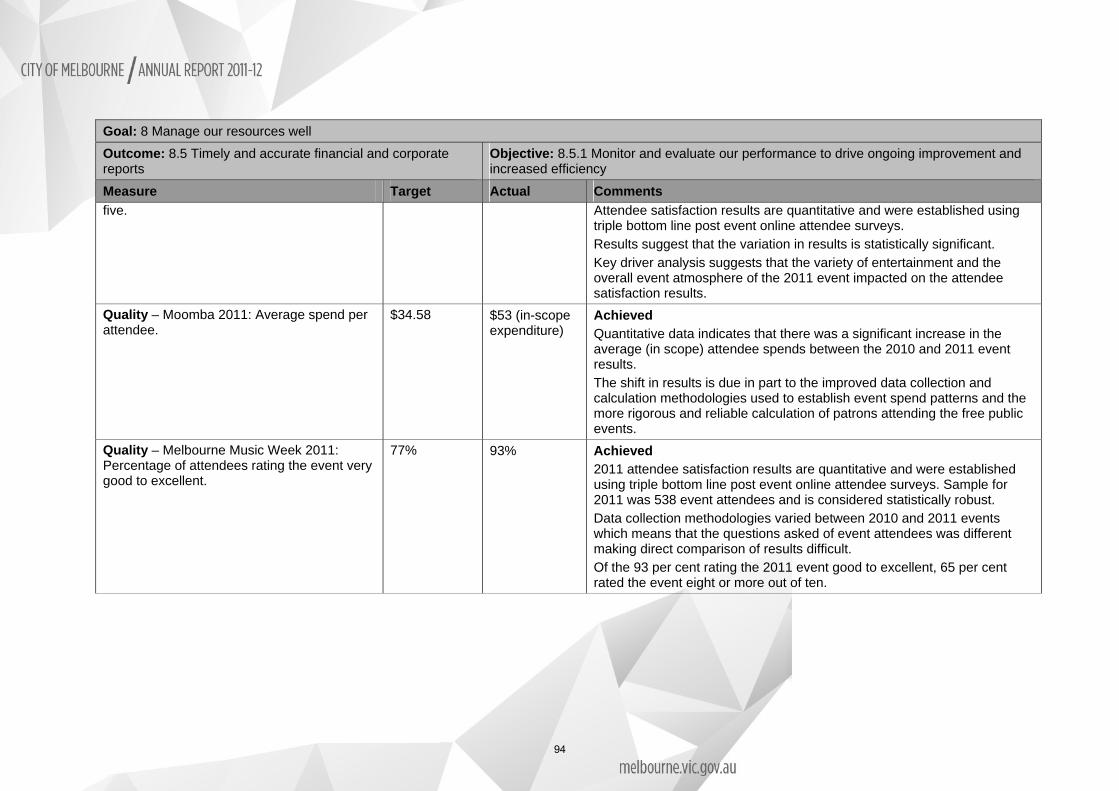
Goal: 8 Manage our resources well
Outcome: 8.5 Timely and accurate financial and corporate reports
Objective: 8.5.1 Monitor and evaluate our performance to drive ongoing improvement and increased efficiency
Measure Target Actual Comments
five. Attendee satisfaction results are quantitative and were established using triple bottom line post event online attendee surveys. Results suggest that the variation in results is statistically significant. Key driver analysis suggests that the variety of entertainment and the overall event atmosphere of the 2011 event impacted on the attendee satisfaction results.
Quality – Moomba 2011: Average spend per attendee.
$34.58
$53 (in-scope expenditure)
Achieved Quantitative data indicates that there was a significant increase in the average (in scope) attendee spends between the 2010 and 2011 event results. The shift in results is due in part to the improved data collection and calculation methodologies used to establish event spend patterns and the more rigorous and reliable calculation of patrons attending the free public events.
Quality – Melbourne Music Week 2011: Percentage of attendees rating the event very good to excellent.
77% 93% Achieved 2011 attendee satisfaction results are quantitative and were established using triple bottom line post event online attendee surveys. Sample for 2011 was 538 event attendees and is considered statistically robust. Data collection methodologies varied between 2010 and 2011 events which means that the questions asked of event attendees was different making direct comparison of results difficult. Of the 93 per cent rating the 2011 event good to excellent, 65 per cent rated the event eight or more out of ten.
94
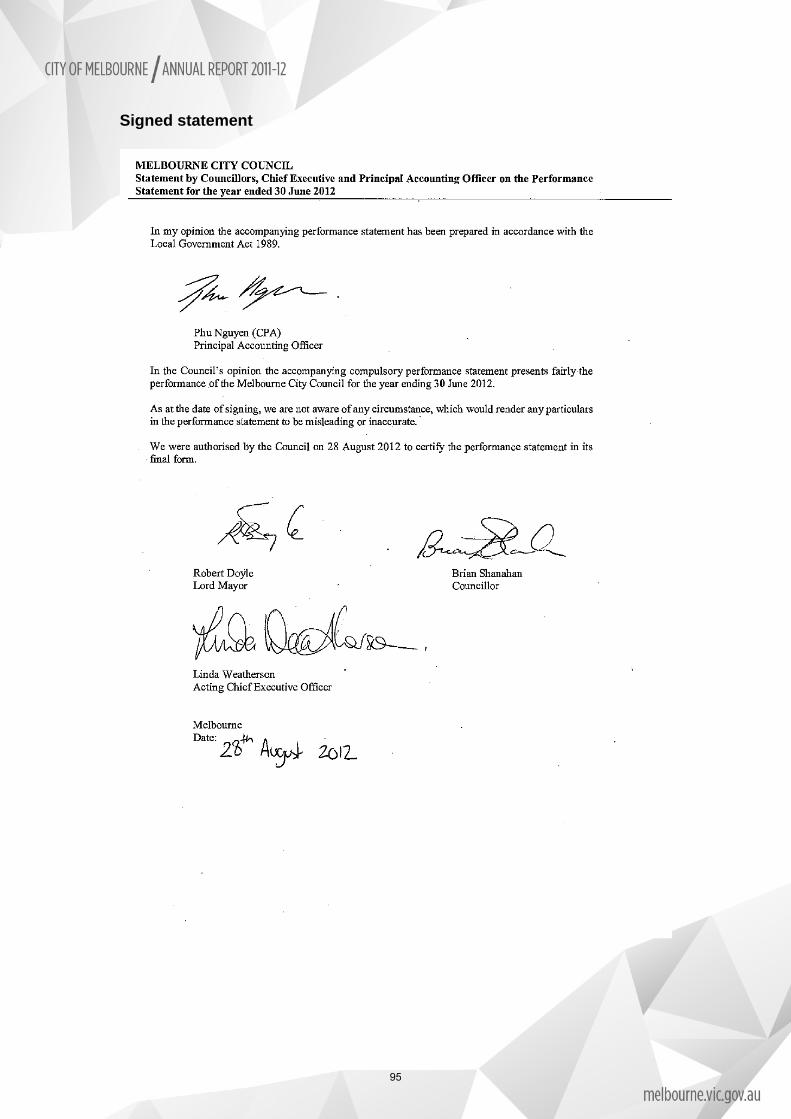
Signed statement
95

Independent Auditor’s Report
96

97

Victorian local government indicators
Indicator 2007-08 2008-09 2009-10 2010-11 2011-12
Overall performance Community satisfaction rating for overall performance generally of council
68 66 68 68 66
Advocacy Community satisfaction rating for the council's advocacy and community representation on key local issues
62 61 64 61 55
Engagement Community satisfaction rating for the council's engagement in decision-making on key local issues
59 59 62 59 56
All rates Average rates and charges per assessment (all rates)
$2265 $2318 $2457 $2412 $2353
Residential rates Average rates and charges per residential assessment
$877 $939 $968 $950 $939
Operating costs Average operating expenditure per assessment
$3993 $4333 $4214 $4227 $4130
Capital expenditure Average capital expenditure per assessment
$909 $1060 $863 $839 $1206
Infrastructure Renewal gap
67% 70% 76% 73% 97%
Renewal and maintenance gap 71% 72% 79% 77% 97%
Debts Average liabilities per assessment
$1184 $989 $817 $1039 $1174
Operating result Operating results per assessment*
$1357 $340 $(360) $474 $364
In response to feedback from local councils, Local Government Victoria introduced methodological and content changes to the Community Satisfaction Survey in 2011-12. These included increasing the sample size from the previous minimum of 350 respondents per municipality up to 400 respondents and ensuring the sample reflects the demographic composition of a municipality. The survey also allows respondents to be ‘residents over 18 years of age’ instead of restricting respondents to ‘head of household’. For these reasons, direct comparison with the previous Community Satisfaction Survey results is not possible. * Note: This represents the operating results per assessment as per the subtotal profit/loss for the period.
98

Global Reporting Initiative discussion and indicators The Global Reporting Initiative (GRI) is a network-based organisation that produces a comprehensive sustainability reporting framework widely used around the world. The City of Melbourne has included GRI sustainability indicators as part of its performance measures since 2004-05.
The GRI’s principles of inclusiveness, relevance, sustainability context and completeness define the content of this report.
It is important to note the GRI is a global framework that does not assume reporting organisations have an established reporting process. The City of Melbourne’s annual report contents are substantially determined by the requirements of the Local Government Act 1989 (Vic). Like most local governments, the City of Melbourne has a long history of reporting financial as well as non-financial performance to stakeholders. Many disclosures required as part of the GRI are also specified under the Act.
GRI Version G3.0 and G3.1 The City of Melbourne uses Version G3.0 of the framework, which sets out the principles and indicators that organisations can use to measure and report their economic, environmental, and social performance.
The GRI has an updated version of its framework, Version G3.1, and we support the new directions taken in this framework with its increased emphasis on human rights, local community impacts and gender. The City of Melbourne has elected to continue working with G3.0 for the 2011-12 annual report and we aim to adopt the G3.1 framework for the next report. The transition to G3.1 will coincide with a deeper analysis of our sustainability reporting priorities.
Reading the GRI index The GRI appears in this annual report as a list of indicators, each with a page reference to demonstrate where in the annual report the relevant data can be located. GRI application level ‘Application levels’ were introduced with the release of GRI’s G3 guidelines in October 2006. The application level system provides organisations with a pathway towards continuous improvement of their sustainability reporting. The levels are intended to motivate reporters to enhance the quality of their reporting over time.
The application levels indicate the extent to which the G3/G3.1 guidelines have been applied in sustainability reporting. They communicate which part of the reporting framework has been addressed – which set of disclosures – varying with the different levels. The levels do not give an opinion on the sustainability performance of the reporting organisation, the quality of the report, or on formal compliance with the G3 or G3.1 guidelines.
This report was prepared to meet the requirements of application level B under the GRI’s sustainability reporting guidelines, maintaining the standard of reporting and disclosure of previous years. To achieve a ‘plus’ rating (ie B+) organisations must seek external assurance by GRI approved means. Given the level and cost of audit currently in place for the annual report as a whole, the City of Melbourne has chosen not to pursue further external verification of the data at this stage.
The application level table below lists the requirements for each application level. The City of Melbourne has prepared its GRI report to meet ‘B’ level requirements. More information about the GRI is available at www.globalreporting.org
99
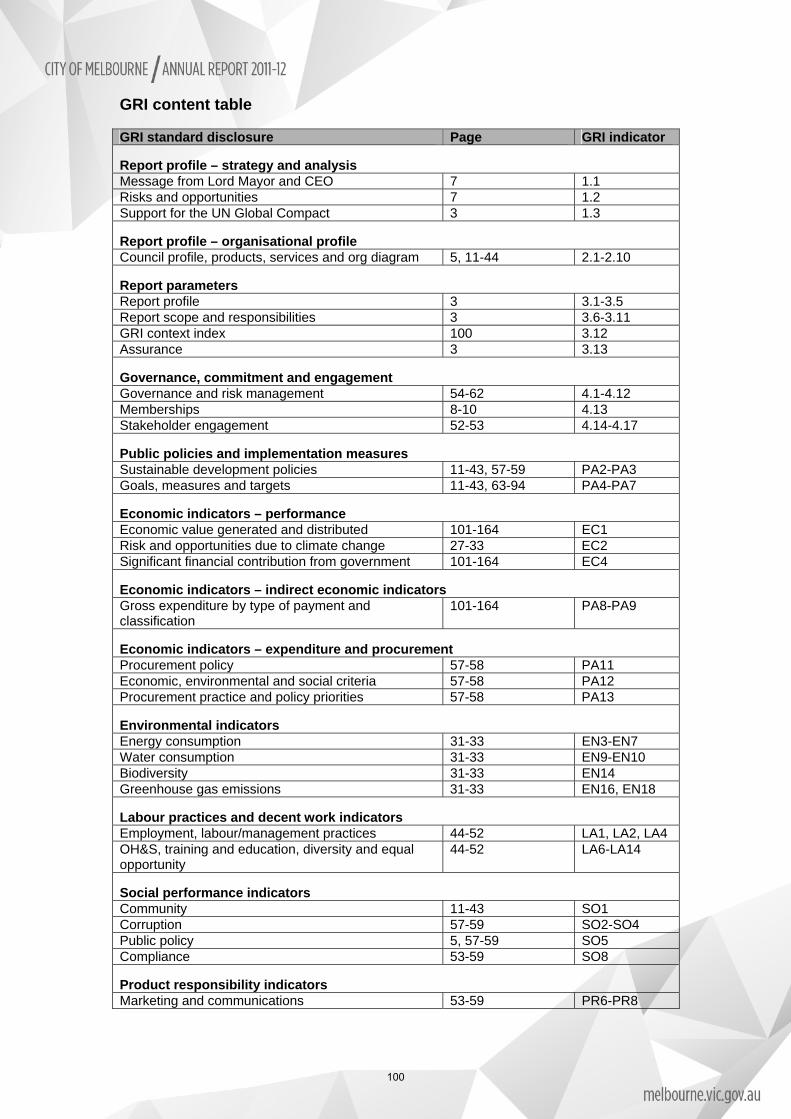
GRI content table GRI standard disclosure Page GRI indicator Report profile – strategy and analysis Message from Lord Mayor and CEO 7 1.1 Risks and opportunities 7 1.2 Support for the UN Global Compact 3 1.3 Report profile – organisational profile Council profile, products, services and org diagram 5, 11-44 2.1-2.10 Report parameters Report profile 3 3.1-3.5 Report scope and responsibilities 3 3.6-3.11 GRI context index 100 3.12 Assurance 3 3.13
Governance, commitment and engagement Governance and risk management 54-62 4.1-4.12 Memberships 8-10 4.13 Stakeholder engagement 52-53 4.14-4.17 Public policies and implementation measures Sustainable development policies 11-43, 57-59 PA2-PA3 Goals, measures and targets 11-43, 63-94 PA4-PA7 Economic indicators – performance Economic value generated and distributed 101-164 EC1 Risk and opportunities due to climate change 27-33 EC2 Significant financial contribution from government 101-164 EC4 Economic indicators – indirect economic indicators Gross expenditure by type of payment and classification
101-164 PA8-PA9
Economic indicators – expenditure and procurement Procurement policy 57-58 PA11 Economic, environmental and social criteria 57-58 PA12 Procurement practice and policy priorities 57-58 PA13
Environmental indicators Energy consumption 31-33 EN3-EN7 Water consumption 31-33 EN9-EN10 Biodiversity 31-33 EN14 Greenhouse gas emissions 31-33 EN16, EN18 Labour practices and decent work indicators Employment, labour/management practices 44-52 LA1, LA2, LA4 OH&S, training and education, diversity and equal opportunity
44-52 LA6-LA14
Social performance indicators Community 11-43 SO1 Corruption 57-59 SO2-SO4 Public policy 5, 57-59 SO5 Compliance 53-59 SO8 Product responsibility indicators Marketing and communications 53-59 PR6-PR8
100

Our Financial Statements Reading our financials Our financial statements provide an insight into the City of Melbourne’s financial health. Our financial statements show:
how the City of Melbourne and its subsidiaries performed during the year the value of assets held by the City of Melbourne, and the ability of the City of Melbourne to pay its debts.
What’s in the financial statements? The financial statements consist of four financial reports, explanatory notes supporting the reports and endorsement from the Melbourne City Council and the Victorian Auditor-General. The four financial reports are:
Income statement Balance sheet Statement of cash flows Statement of changes in equity
The explanatory notes detail the City of Melbourne’s accounting policies and the make-up of values contained in the statements. How are the financial statements audited? These financial statements are prepared in accordance with the Local Government Act (1989) and the Australian Accounting Standards. They are audited by the Victorian Auditor-General, approved in principle by the City of Melbourne’s Audit Committee and by Melbourne City Council. These auditing measures ensure the information provided is correct. The City of Melbourne has received a clear audit of its financial statements for 2011-12.
101

Standard Statements
For
City of Melbourne
Annual Report 2011-12
Budget v Actual
102
Note 1. Significant accounting policies
The significant policies, which have been adopted in the preparation of these Standard Statements, are:
(a) Basis of preparation The Standard Statements of the Council are special purpose financial reports that consist of a Standard Income Statement, Standard Balance Sheet, Standard Cash Flow Statement and Standard Statement of Capital Works. These special purpose financial reports have been prepared in accordance with the Local Government Act 1989 and the Local Government (Finance and Reporting) Regulations 2004. These special purpose financial reports do not form part of Council's general purpose financial reports.
103

CITY OF MELBOURNE Standard Statements For the year ended 30 June 2012 Standard statement of income
Actuals Budget2011/12 2011/12
$'000's $'000's $'000's % Ref
Revenues Rates 199,557 199,133 424 0% Grants and Subsidies - Operating 10,998 10,532 466 4% - Capital and Asset Contributions 16,712 18,413 (1,701) (9%) Parking Fees 40,043 39,197 846 2% Parking Fines 37,389 49,698 (12,309) (25%) 1 Sundry Fees & Charges 19,232 18,864 369 2% Property Rental and Hire 14,807 6,988 7,819 112% 2 Sales & Recoveries 5,838 2,526 3,312 131% 3 Finance Income 9,563 7,642 1,921 25% 4 Intercompany Revenue 15,707 16,503 (796) (5%)Total Revenue 369,846 369,496 350 0%
Expenditure Employee Cost 119,938 113,335 (6,603) (6%) Materials and Services 139,778 140,951 1,173 1% Financial and Insurance Cost 9,605 12,245 2,640 22% 5 Grants and Contributions 15,915 13,689 (2,226) (16%) 6 Government Taxes & Levies 4,196 3,928 (268) (7%) Depreciation and amortisation 50,529 52,448 1,919 4% Maintenance Costs 10,312 10,301 (11) (0%)Total Expenditure 350,273 346,897 (3,376) (1%)
Net gain (loss) on asset disposal 140 4 136 3400% 7Contributed assets 11,182 - 11,182 100% 8Result from Oridinary Activities 30,895 22,603 8,292 37%
Contributed assets (11,182) - (11,182) 100%Gain on Investment Revaluation (8,045) - (8,045) 100%Defined superannuation fund liability 9,812 - 9,812 100%Less Capital Contributions (16,712) (18,413) 1,701 (9%)Underlying Surplus/(Deficit) 4,768 4,190 578 14%
Variance
104

CITY OF MELBOURNE Standard Statements For the year ended 30 June 2012 Standard statement of income - comparison report
Ref. Item Commentary
1 Parking Fines The number of parking infringements issued was lower than budgeted. This is partially offset by lower finance cost (Refer to Ref 5 below).
2 Property Rental and Hire
The revaluation of Council’s investment properties has resulted in a non cash extraordinary gain ($8.01 million).
3 Sales and Recoveries Additional recoveries received in relation to: Property services and valuation related cost recoveries ($0.69
million); Enterprise Melbourne recoveries ($0.22 million); State government recoveries for various projects; and Grants in Kind revenue ($2.03 million, fully offset from Grant in
Kind payments, refer to Ref 6 below).
4 Finance Income Due to higher investment interest revenue generated through higher cash balances and higher interest revenue on overdue rates.
5 Financial and Insurance Cost
Primarily due to less doubtful parking infringement provision in line with lower parking infringements being issued ($2.26 million) (Refer to Ref 1 above).
6 Grants and Contributions (Expense)
Primarily due to additional Grants in Kind payments ($2.03 million, fully offset by additional Grants in Kind revenue, see Ref 2 above).
7 Net gain/(loss) on asset disposal
Minor variance due to the gain on sale of Council laneways.
8
Contributed assets Primarily due to contributed infrastructure assets from Docklands ($9.05 million).
105
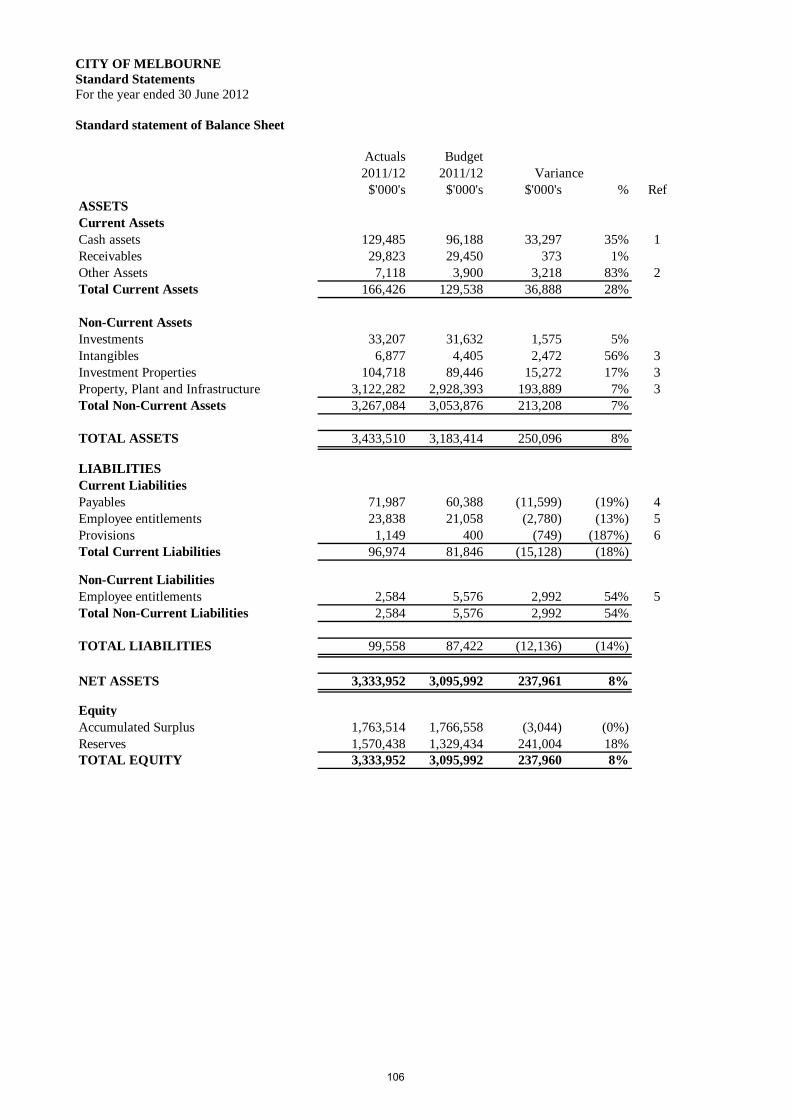
CITY OF MELBOURNE Standard Statements For the year ended 30 June 2012 Standard statement of Balance Sheet
Actuals Budget2011/12 2011/12
$'000's $'000's $'000's % RefASSETSCurrent AssetsCash assets 129,485 96,188 33,297 35% 1Receivables 29,823 29,450 373 1%Other Assets 7,118 3,900 3,218 83% 2Total Current Assets 166,426 129,538 36,888 28%
Non-Current AssetsInvestments 33,207 31,632 1,575 5%Intangibles 6,877 4,405 2,472 56% 3Investment Properties 104,718 89,446 15,272 17% 3Property, Plant and Infrastructure 3,122,282 2,928,393 193,889 7% 3Total Non-Current Assets 3,267,084 3,053,876 213,208 7%
TOTAL ASSETS 3,433,510 3,183,414 250,096 8%
LIABILITIESCurrent LiabilitiesPayables 71,987 60,388 (11,599) (19%) 4Employee entitlements 23,838 21,058 (2,780) (13%) 5Provisions 1,149 400 (749) (187%) 6Total Current Liabilities 96,974 81,846 (15,128) (18%)
Non-Current LiabilitiesEmployee entitlements 2,584 5,576 2,992 54% 5Total Non-Current Liabilities 2,584 5,576 2,992 54%
TOTAL LIABILITIES 99,558 87,422 (12,136) (14%)
NET ASSETS 3,333,952 3,095,992 237,961 8%
EquityAccumulated Surplus 1,763,514 1,766,558 (3,044) (0%)Reserves 1,570,438 1,329,434 241,004 18%TOTAL EQUITY 3,333,952 3,095,992 237,960 8%
Variance
106
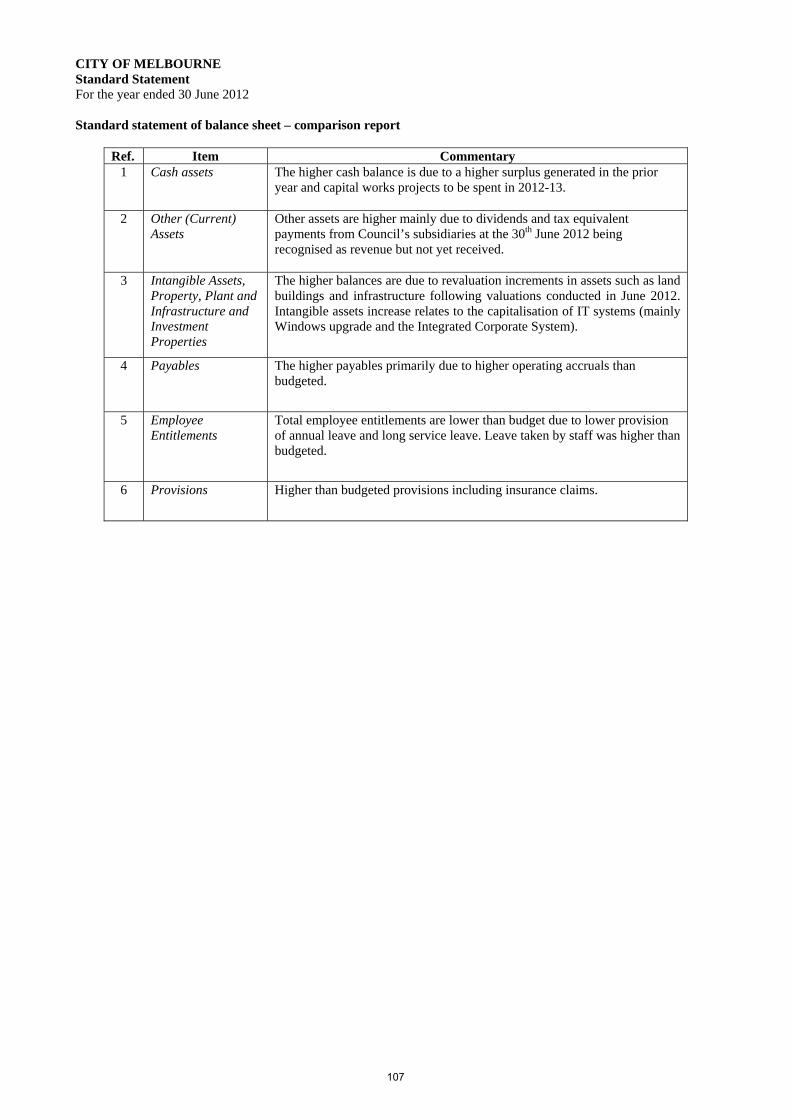
CITY OF MELBOURNE Standard Statement For the year ended 30 June 2012 Standard statement of balance sheet – comparison report
Ref. Item Commentary 1 Cash assets The higher cash balance is due to a higher surplus generated in the prior
year and capital works projects to be spent in 2012-13.
2 Other (Current) Assets
Other assets are higher mainly due to dividends and tax equivalent payments from Council’s subsidiaries at the 30th June 2012 being recognised as revenue but not yet received.
3 Intangible Assets, Property, Plant and Infrastructure and Investment Properties
The higher balances are due to revaluation increments in assets such as land buildings and infrastructure following valuations conducted in June 2012. Intangible assets increase relates to the capitalisation of IT systems (mainly Windows upgrade and the Integrated Corporate System).
4 Payables The higher payables primarily due to higher operating accruals than budgeted.
5 Employee
Entitlements Total employee entitlements are lower than budget due to lower provision of annual leave and long service leave. Leave taken by staff was higher than budgeted.
6 Provisions Higher than budgeted provisions including insurance claims.
107

CITY OF MELBOURNE Standard Statement For the year ended 30 June 2012 Standard statement of cash flows (reconciliation)
Actuals Budget2011/12 2011/12
$'000's $'000's $'000's % Ref
Net Surplus/(deficit) from operations 30,895 22,599 8,296 37%
Add back: Depreciation and amortisation 50,529 52,448 (1,919) (4%) Increase in Investment (8,045) - (8,045) (100%) 1 Loss/(Profit) on sale of assets (140) - (140) (100%) 2 Contributed assets (11,182) - (11,182) (100%) 3Surplus before non cash items 62,057 75,047 (12,990) (17%)
Net movement in working capital
Net movement in working capital 20,737 4,500 16,237 361% 4
Funds available for investing activities 82 794 79 547 3,247 4%
Capital Capital expenditure (102,266) (111,755) 9,489 (8%) Proceeds from sale of assets 1,900 576 1,324 230% 5 Docklands Deficit (4,283) (2,500) (1,783) (100%) 6 Investment in Sustainable Melbourne Fund (246) - (246) (100%) 7Cash inflow / (outflow) (22,101) (34,132) 12,031 35%
Bank Account (Opening Balance) 151,586 130,320 21,266 16%Bank Account (Closing Balance) 129,485 96,188 33,297 35%
Variance
108

CITY OF MELBOURNE Standard Statement For the year ended 30 June 2012 Standard statement of cash flows (reconciliation)
Ref. Item Commentary 1 Increase in Investment
The revaluation of Council’s investment properties has resulted in a non cash extraordinary gain ($8.011 million).
2 Loss/(Profit) on sale of
assets Minor variance due to the gain on sale of Council laneways.
3 Contributed assets Primarily due to contributed infrastructure assets from Docklands ($9.05 million).
4 Net movement in working capital
The net movement in working capital reflects an increase in creditors due to a higher level of accrued expenditure not yet paid.
5 Proceeds from Sale of Assets
Higher than budgeted proceeds from the sale of Council’s assets.
6 Docklands Deficit The Council resolved to fully pay the Docklands accumulated deficit this financial year.
7 Investment in Melbourne Sustainable Fund
Annual distribution from the Sustainable Melbourne Fund which has been re-invested
109

CITY OF MELBOURNE Standard Statement For the year ended 30 June 2012 Standard Statement of Cashflow
Actuals Budget2011/12 2011/12
$'000's $'000's $'000's %Cash Inflows/(Outflows) from Operating ActivitiesReceipts
Rates, Fees and Charges 312,489 295,249 17,240 6%Grants and Other Contributions 29,149 28,945 204 1%Interest received 9,279 7,642 1,637 21%Dividends Received - Subsidiaries 5,120 - 5,120 100%Tax Equivalents - Subsidiaries 5,750 - 5,750 100%Other (including Sales & Recoveries) 19,956 33,293 (13,337) (40%)
Payments Employee Cost (111,497) (109,028) (2,469) (2%) Materials and Services (183,521) (166,809) (16,712) (10%) Other costs (5,786) (12,245) 6,459 53%
Net Cash Provided by Operating Activities 80,939 77,047 3,892 5%
Cash Inflows/(Outflows) from Investing ActivitiesProceeds from sale of property, plant and equipment 1,900 576 1,324 230%
(Payments) Receipts for Property, Infrastructure, Plant and Equipment
(102,266) (111,755) 9,489 8%
Sustainble Melbourne Fund payment (246) - (246) (100%)Net Cash Used by Investing Activities (100,612) (111,179) 10,567 (10%)
Cash Inflows/(Outflows) from Financing Activities Finance costs (2,428) - (2,428) (100%)Net Cash Used by Financing Activities (2,428) - (2,428) (100%)
Net Increase/(decrease) in Cash Held (22,101) (34,132) 12,031 35%
Cash at beginning of the financial year 151,586 130,320 21,266 16%
Cash at end of the financial year 129,485 96,188 33,297 35%
Variance
110

CITY OF MELBOURNE Standard Statement For the year ended 30 June 2012 Standard statement of capital works
Actuals Budget2011/12 2011/12
$'000's $'000's $'000's % Ref
Council WorksMaintenance 10,352 10,301 51 0%Capital Works 104,413 97,265 7,148 7%
Carried Forward Capital 15,299 19,689 (4,390) (22%)Capital Works Expenditure 130,064 127,255 2,809 2% 1
Variance
111

CITY OF MELBOURNE Standard Statement For the year ended 30 June 2012 Capital Works – comparison report
Ref. Item Commentary 1 Capital Expenditure The value of capital and maintenance works completed for 2011-12 is
$114.77 million. A carry forward of $15.30 million into 2012-13 is required to complete the programs. The major projects within the carry forward are $2.90 million in respect to the Fitzroy Gardens Stormwater Harvesting and new Depot and $1.80 million for the Holland Park Sports Pavilion construction works.
112

Melbourne City Council
Financial Report
For the year ended 30 June 2012
Prepared in accordance with the Local Government Act 1989, Local Government (Finance and Reporting) Regulations 2004, and applicable Australian Accounting Standards. ABN: 55 370 219 287
CONTENTS Financial Report Statement of Comprehensive Income Statement of Financial Position Statement of Changes in Equity Statement of Cash Flows Notes to and Forming Part of the Financial Report Note 1 Significant Accounting Policies Note 2 Operating result attributable to functions/activities Revenues Note 3 Revenues Expenses Note 4 Expenses Assets Note 5 Trade and Other Receivables Note 6 Inventories Note 7 Other current assets Note 8 Other financial assets Note 9 Property, plant, equipment & infrastructure Note 10 Intangible assets Note 11 Investment Property Liabilities Note 12 Trade and Other Payables Note 13 Employee benefits Note 14 Provisions Equity Note 15 Reserves Other Disclosures Note 16 Gain/(Loss) on sale of fixed and intangible assets Note 17 Cash Flow Information Note 18 Leases and Commitments Note 19 Contingent Assets and Liabilities Note 20 Superannuation Note 21 Related Party Transactions Note 22 Financial instruments Note 23 Financial ratios Note 24 Events occurring after balance date Note 25 Business Combinations Statement by Councillors, Chief Executive Officer and Principal Accounting Officer Auditor-General’s Report on the Financial Report
113
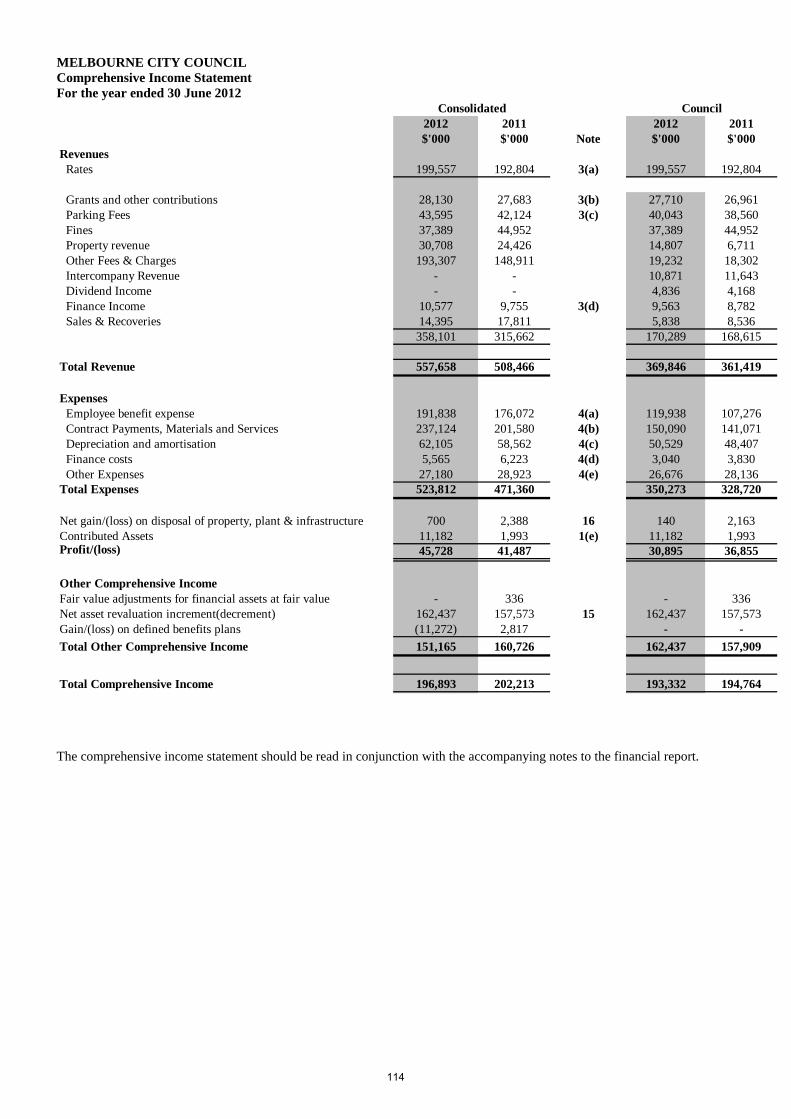
MELBOURNE CITY COUNCIL Comprehensive Income Statement For the year ended 30 June 2012
2012 2011 2012 2011$'000 $'000 Note $'000 $'000
Revenues Rates 199,557 192,804 3(a) 199,557 192,804
Grants and other contributions 28,130 27,683 3(b) 27,710 26,961 Parking Fees 43,595 42,124 3(c) 40,043 38,560 Fines 37,389 44,952 37,389 44,952 Property revenue 30,708 24,426 14,807 6,711 Other Fees & Charges 193,307 148,911 19,232 18,302 Intercompany Revenue - - 10,871 11,643 Dividend Income - - 4,836 4,168 Finance Income 10,577 9,755 3(d) 9,563 8,782 Sales & Recoveries 14,395 17,811 5,838 8,536
358,101 315,662 170,289 168,615
Total Revenue 557,658 508,466 369,846 361,419
Expenses Employee benefit expense 191,838 176,072 4(a) 119,938 107,276 Contract Payments, Materials and Services 237,124 201,580 4(b) 150,090 141,071 Depreciation and amortisation 62,105 58,562 4(c) 50,529 48,407 Finance costs 5,565 6,223 4(d) 3,040 3,830 Other Expenses 27,180 28,923 4(e) 26,676 28,136Total Expenses 523,812 471,360 350,273 328,720
Net gain/(loss) on disposal of property, plant & infrastructure 700 2,388 16 140 2,163Contributed Assets 11,182 1,993 1(e) 11,182 1,993Profit/(loss) 45,728 41,487 30,895 36,855
Other Comprehensive IncomeFair value adjustments for financial assets at fair value - 336 - 336Net asset revaluation increment(decrement) 162,437 157,573 15 162,437 157,573Gain/(loss) on defined benefits plans (11,272) 2,817 - -
Total Other Comprehensive Income 151,165 160,726 162,437 157,909
Total Comprehensive Income 196,893 202,213 193,332 194,764
Consolidated Council
The comprehensive income statement should be read in conjunction with the accompanying notes to the financial report.
114

MELBOURNE CITY COUNCIL Balance Sheet As at 30 June 2012
2012 2011 2012 2011$'000 $'000 Note $'000 $'000
ASSETSCurrent AssetsCash and Cash Equivalents 148,496 168,974 17(b) 129,485 151,586Trade and Other Receivables 56,396 53,296 5 29,823 25,171
Accrued Income 6,931 7,086 2,296 3,176Inventories 436 407 6 - -Other Assets 1,196 1,153 7 4,822 6,263Total Current Assets 213,455 230,916 166,426 186,196
Non-Current AssetsOther Financial Assets 3,026 3,026 8 33,207 32,961Intangible Assets 28,255 24,491 10 6,877 6,777Property, Plant and Infrastructure 3,193,567 2,958,790 9 3,122,282 2,898,022Investment Property 104,718 97,434 11 104,718 97,434Total Non-Current Assets 3,329,566 3,083,741 3,267,084 3,035,194
TOTAL ASSETS 3,543,021 3,314,657 3,433,510 3,221,390
LIABILITIESCurrent LiabilitiesTrade and Other Payables 94,078 75,486 12 62,175 49,768Net Liability of City of Melbourne's Defined Benefits Superannuation Fund 9,812 - 20 9,812 -Employee Benefits 35,321 32,835 13(a) 23,838 22,852Provisions 1,471 1,600 14(a) 1,149 1,336Total Current Liabilities 140,682 109,921 96,974 73,956
Non-Current LiabilitiesTrade and Other Payables - 4,282 12(a) - 4,282Employee Benefits 4,930 4,654 13(b) 2,584 2,532Interest Bearing Liabilities 10,500 7,000 22 - -Net Liability of City of Melbourne's Defined Benefits Superannuation Fund 9,349 7,887 20 - -Total Non-Current Liabilities 24,779 23,823 2,584 6,814
TOTAL LIABILITIES 165,461 133,744 99,558 80,770
NET ASSETS 3,377,560 3,180,913 3,333,952 3,140,620
EquityAccumulated Surplus 1,800,477 1,769,664 1,763,514 1,736,016Reserves 1,577,083 1,411,249 15 1,570,438 1,404,604TOTAL EQUITY 3,377,560 3,180,913 3,333,952 3,140,620
Consolidated Council
The balance sheet should be read in conjunction with the accompanying notes to the financial report.
115

MELBOURNE CITY COUNCIL Statement of Changes in Equity (Consolidated) For the year ended 30 June 2012
2012 2011 2012 2011 2012 2011 2012 2011Note $'000 $'000 $'000 $'000 $'000 $'000 $'000 $'000
Balance at beginning of the financial year 3,180,913 2,978,700 1,769,664 1,720,781 1,407,584 1,255,716 3,665 2,203
Surplus/(deficit) for the year 45,728 41,487 45,728 41,487 - - - -
Actuarial gain/(expense) - City of Melbourne's Defined Benefits Superannuation Fund (11,272) 2,817 (11,272) 2,817 - - - -Asset Revaluation 15(i) 162,437 157,573 - - 162,437 157,573 - -Investments Revaluation Reserve 15(iv) - 336 - - - - - 336Total Comprehensive Income 196,893 202,213 34,456 44,304 162,437 157,573 - 336Sustainable Melbourne Fund (246) - (246) - - - - -Reserve for Public Open Space 15(iii) - - (3,397) (1,126) - - 3,397 1,126Trfs from Asset Revaluation Reserve to Acc Surplus 15(i) - - - 5,705 - (5,705) - -Balance at the end of the financial year 3,377,560 3,180,913 1,800,477 1,769,664 1,570,021 1,407,584 7,062 3,665
Other Reserves
Reserve
Total Equity Accumulated Surplus Asset Revaluation
The statement of changes in equity (Consolidated) should be read in conjunction with the accompanying notes to the financial report.
MELBOURNE CITY COUNCIL Statement of Changes in Equity (Council) For the year ended 30 June 2012
Other Reserves
2012 2011 2012 2011 2012 2011 2012 2011Note $'000 $'000 $'000 $'000 $'000 $'000 $'000 $'000
Balance at beginning of the financial year 3,140,620 2,945,856 1,736,016 1,699,096 1,400,939 1,244,557 3,665 2,203
Surplus/(deficit) for the year 30,895 36,855 30,895 36,855 - - - -Asset Revaluation 15(ii) 162,437 157,573 - - 162,437 157,573 - -Reserve for Public Open Space 15(iii) - - (3,397) (1,126) - - 3,397 1,126Trfs from Asset Revaluation reserve to Acc Surplus 15(ii) - - - 1,191 - (1,191) - -Investments Revaluation Reserve 15(iv) - 336 - - - - - 336Total Comprehensive Income 193,332 194,764 27,498 36,920 162,437 156,382 3,397 1,462
Balance at the end of the financial year 3,333,952 3,140,620 1,763,514 1,736,016 1,563,376 1,400,939 7,062 3,665
Total Equity Accumulated Surplus Asset RevaluationReserve
The statement of changes in equity (Council) should be read in conjunction with the accompanying notes to the financial report.
116

MELBOURNE CITY COUNCIL Statement of Cash Flows For the year ended 30 June 2012
2012 2011 2012 2011$'000 $'000 Note $'000 $'000
Cash Flows from Operating Activities
Receipts Rates, Fees and Charges (inclusive of GST) 519,257 453,094 312,489 306,506 Grants and Other Contributions (inclusive of GST) 29,612 29,493 29,149 28,699 Interest 10,294 9,670 9,279 8,697 Dividends Received 284 85 5,120 4,253 Tax equivalents - - 5,750 5,837 GST Net refund 12,479 6,133 15,446 10,646 Other (including Sales & Recoveries) (inclusive of GST) 15,959 8,709 4,510 4,023
Payments Employee benefit payments (166,768) (169,430) (111,497) (107,253) Materials and Services (inclusive of GST) (296,513) (221,743) (183,521) (161,227) Other (inclusive of GST) (6,376) (4,475) (5,786) (3,883)Net Cash provided by Operating Activities 118,228 111,536 17(a) 80,939 96,298
Cash Flows from Investing Activities
Proceeds from sale of property, infrastructure, plant and equipment 2,461 3,082 1,900 3,082 Purchase of investments (2,537) (7,862) 25 - - Payments for property, infrastructure, plant and equipment (136,926) (68,428) (102,266) (62,847)
Investment in Sustainable Melbourne Fund - - (246) (41)Net Cash used by Investing Activities (137,002) (73,208) (100,612) (59,806)
Cash Flows from Financing Activities
Proceeds/(Repayments) of borrowings 3,500 6,000 - - Finance costs (5,204) (5,123) (2,428) (2,471)Net Cash used by Financing Activities (1,704) 877 (2,428) (2,471)
Net Increase/(decrease) in cash and cash equivalents (20,478) 39,205 (22,101) 34,021
Cash and cash equivalents at beginning of the financial year 168,974 129,769 151,586 117,565
Cash and cash equivalents at end of the financial year 148,496 168,974 17(b) 129,485 151,586
Consolidated Council
The statement of cash flows should be read in conjunction with the accompanying notes to the financial report.
117

MELBOURNE CITY COUNCIL Notes to the financial statements For the year ended 30 June 2012
Reporting Entity The financial statements are for the entity The Melbourne City Council (the "Council") and controlled entities. The Council is a body corporate, domiciled in Australia, constituted pursuant to the Local Government Act 1989 to provide for the peace and good government of its municipal district. The Town Hall is located at 90-120 Swanston Street, Melbourne VIC 3000. The purpose of the Council is to: - promote the social, economic and environmental viability and sustainability of the municipal district; - ensure that resources are used efficiently and effectively Principles to best meet the need of the local community; - to improve the overall quality of life of the people in the local community; - to promote appropriate business and employment opportunities; - to ensure that services and facilities provided by the Council are accessible and equitable; - to ensure the equitable imposition of rates and charges; - to ensure transparency and accountability in Council's decision making. The Council's external auditors, advisers and bankers are: External Auditor - Victorian Auditor-General's Office Internal Auditor - Deloitte Touché Tohmatsu Solicitors - Hunt & Hunt, King & Wood Mallesons, Ashurst, Maddocks Bankers - Westpac Banking Corporation The Council's website is: www.melbourne.vic.gov.au The consolidated financial statements of the Council as at and for the year ended 30 June 2012 comprise the Council and its subsidiaries and the Council's interest in associated and jointly controlled entities.
Note 1. Significant accounting policies
The significant policies, which have been adopted in the preparation of this Financial Report, are: (a) Basis of preparation These financial statements are general purpose financial statements which have been prepared in accordance with Australian Accounting Standards and Interpretations issued by the Australian Accounting Standards Board and the Local Government Act (Vic) 1989, including the requirements of the Local Government (Finance and Reporting) Regulations (Vic) 2004. The Melbourne City Council and Sustainable Melbourne Fund are not-for-profit entities and CityWide Service Solutions Pty Ltd and its subsidiaries, Queen Victoria Market Pty Ltd and Melbourne Wholesale Fish Market Pty Ltd are for-profit entities for the purpose of preparing the financial statements.
The financial statements have been prepared an accrual basis and on the historical cost basis except for the following: - investment property is measured at fair value; - land & buildings are measured at fair value; and - available-for-sale financial assets measured at fair value. The functional and presentation currency of the Council and consolidated entity is Australian Dollars. (b) Principles of Consolidation The consolidated results in the financial report include all funds through which the Melbourne City Council controls resources to carry on its functions. In the process of reporting on the Melbourne City Council as a consolidated unit, all intra and inter entity balances and transactions have been eliminated.
In the Council's financial statements, investments in subsidiaries are carried at cost. CityWide Service Solutions Pty Ltd and its subsidiaries, Queen Victoria Market Pty Ltd are wholly owned subsidiaries of the Council incorporated in Australia and are included in the consolidated financial report. The Sustainable Melbourne Fund Trust is wholly controlled trust of the Council and is included in the consolidated financial report. Melbourne Wholesale Fish Market Pty Ltd has ceased trading at 30 June 2011 and is in the process of an orderly windup and is included in the consolidated financial report. 118
MELBOURNE CITY COUNCIL
Notes to the financial statements For the year ended 30 June 2012
Note 1. Significant accounting policies (continued)
(c) Business combinations (subsequent to 1 July 2010) Acquisitions of businesses are accounted for using the acquisition method. The consideration transferred in a business combination is measured at fair value which is calculated as the sum of the acquisition-date fair values of assets transferred to the Consolidated Entity, liabilities incurred by the Consolidated Entity to the former owners and the equity instruments issued by the Consolidated Entity in exchange for control of the acquiree.
Acquisition-related costs are recognised in profit or loss as incurred.
At the acquisition date, the identifiable assets acquired and the liabilities assumed are recognised at their fair value at the acquisition date, except that:
- deferred tax assets or liabilities and liabilities or assets related to employee benefit arrangements are recognised and measured in accordance with AASB 112 ‘Income Taxes’ and AASB 119 ‘Employee Benefits’ respectively;
- assets (or disposal groups) that are classified as held for sale in accordance with AASB 5 ‘Noncurrent Assets Held for Sale and Discontinued Operations’ are measured in accordance with that Standard.
Goodwill is measured as the excess of the sum of the consideration transferred, the amount of any non-controlling interests in the acquiree, and the fair value of the acquirer's previously held equity interest in the acquiree (if any) over the net of the acquisition-date amounts of the identifiable assets acquired and the liabilities assumed.
Where the consideration transferred by the Consolidated Entity in a business combination includes assets or liabilities resulting from a contingent consideration arrangement, the contingent consideration is measured at its acquisition-date fair value. Changes in the fair value of the contingent consideration that qualify as measurement period adjustments are adjusted retrospectively, with corresponding adjustments against goodwill. Measurement period adjustments are adjustments that arise from additional information obtained during the ‘measurement period’ (which cannot exceed one year from the acquisition date) about facts and circumstances that existed at the acquisition date.
The subsequent accounting for changes in the fair value of contingent consideration that do not qualify as measurement period adjustments depends on how the contingent consideration is classified. Contingent consideration that is classified as equity is not remeasured at subsequent reporting dates and its subsequent settlement is accounted for within equity. Contingent consideration that is classified as an asset or liability is remeasured at subsequent reporting dates in accordance with AASB 139, or AASB 137 ‘Provisions, Contingent Liabilities and Contingent Assets’, as appropriate, with the corresponding gain or loss being recognised in profit or loss.
(d) Taxation Melbourne City Council is exempt from the payment of income tax and capital gains tax. Payments for Fringe Benefits Tax and Goods and Services Tax (GST) are made in accordance with the relevant legislation. Payments for payroll tax are only made by the trading entities controlled by the Melbourne City Council.
The wholly owned subsidiaries are subject to the Melbourne City Council’s tax equivalent policy. Where the subsidiary is exempt from certain taxes it pays an equivalent of the tax to Melbourne City Council.
Revenues, expenses and assets are recognised net of the amount of GST, except where the amount of GST incurred is not recoverable from the Australian Taxation Office. In these circumstances the GST is recognised as part of the cost of acquisition of the asset or as part of an item of the expense.
Cash flows are presented in the cash flow statement on a gross basis, except for the GST component of investing and financing activities.
119

MELBOURNE CITY COUNCIL
Notes to the financial statements For the year ended 30 June 2012
Note 1. Significant accounting policies (continued)
(e) Fees, Fines, Charges, Rates, Grants, and Other Contributions Fees and charges are recognised as revenue when services are provided or the cash is received, which ever occurs first.
Fines are recognised as revenue when the penalty is imposed.
Rates, grants, and other contributions are recognised as revenues when Melbourne City Council obtains control over the related assets. Control over assets acquired from rates is obtained at the commencement of the rating period or, where earlier, upon receipt of the rates. Control over granted assets is normally obtained upon their receipt or upon prior written notification that a grant has been secured. Where contributions recognised as revenues during the financial year were obtained on the condition that they be expended in a particular manner or used over a particular year, and those conditions were undischarged as at the reporting date, the nature of any amounts pertaining to those undischarged conditions are disclosed in Note 3(e). That note also discloses the amount of contributions recognised as revenues in previous financial years, which were expended in respect of Melbourne City Council’s operations during the current financial year.
Tax equivalents and dividends from subsidiaries are recognised as income when received or amounts have been declared at the respective subsidiary companies board meeting. Revenue arising from service contracts is recognised by reference to the stage of completion of the contract, unless the outcome of the contract cannot be reliably estimated. The stage of completion is determined by reference to the proportion that costs incurred to date bear to the estimated total costs of the contract. Administrative overheads are not included in the costs of the contract for this purpose. Where the outcome of a contract cannot be reliably estimated, contract costs are recognised as an expense as incurred, and where it is probable that the costs will be recovered, revenue is recognised to the extent of costs incurred.
(f) Intangibles (i) Goodwill Where an entity or operation is acquired, the identifiable net assets acquired are measured at fair value. Fair value is defined in note 1(l)(ii). The excess of the fair value of the cost of acquisition over the fair value of the identifiable net assets acquired is brought to account as goodwill. Goodwill is not amortised, but tested for impairment annually.
(ii) Software
Software, that is not an integral part of the related hardware, is classified as intangibles, recorded at cost and amortised on a straight line basis over a 5 year period.
Goodwill Software
Useful lives Indefinite Finite
Method used Not depreciated or revalued 5 Years – straight line
Internally generated/ acquired Acquired Acquired
Impairment test/ recoverable amount test
Reviewed annually for indication of impairment
Amortised method reviewed at each financial year-end; Reviewed annually for indication of impairment
120
MELBOURNE CITY COUNCIL Notes to the financial statements
For the year ended 30 June 2012
Note 1. Significant accounting policies (continued)
(g) Employee benefits Wages, Salaries, Annual and Long Service Leave Liabilities for employees’ entitlements to wages and salaries, annual leave, and other employee benefits which are expected to be paid or settled within 12 months of balance date are accrued at nominal amounts calculated on the basis of 2011/12 wage and salary rates and payroll based on costs in accordance with AASB 119 ‘Employee Benefits’. Liabilities for other Employee benefits which are not expected to be paid or settled within 12 months of balance date are accrued as per AASB 119 at the present values of future amounts expected to be paid based on 4% per annum projected weighted average increase in wage and salary rates and payroll based on costs over an average period of five years. Present values are calculated using the government guaranteed securities rates with similar maturity terms.
Superannuation - defined contribution plans A defined benefit contribution plan is a post-employment benefit plan under which an entity pays fixed contributions into a separate entity and will have no legal or constructive obligation to pay further amounts. Obligations for contributions to defined contribution plans are recognised as an employee benefits expenses in profit or loss in the periods during which the services are rendered by employees.
Superannuation - defined benefits plans A defined benefit plan is a post-employment benefit plan other than a defined contribution plan. The Council's net obligation in respect of defined benefits pension plans is calculated separately for each plan by estimating the amount of future benefit that employees have earned in return for their service in the current and prior periods; that benefit is discounted to determine its present value. Any unrecognised past service costs and the fair value of any plan assets are deducted. The discount rate is the yield at the reporting date on Government bonds that have maturity dates approximating the terms of the Council's obligations.
The calculation is performed periodically by a qualified actuary using the projected unit credit method. When the calculation results in a benefit to the Council, the recognised asset is limited to the total of any unrecognised past service costs and the present value of the economic benefits available in the form of any future refunds from the plan or reduction in future contributions to the plan. In order to calculate the present value of economic benefits, consideration is given to any minimum funding requirements that apply to any plan in the Council. An economic benefit is available to the Council if it is realisable during the life of the plan, or on settlement of the plan liabilities. When the benefits of a plan are improved, the portion of the increased benefit related to past service by employees is recognised in the profit or loss on a straight-line basis over the average period until the benefits become vested. To the extent that the benefits vest immediately, the expense is recognised immediately in profit or loss.
The Council recognises all actuarial gains and losses arising from defined benefits plans in other comprehensive income and all expenses relating to defined benefit plans in employee benefits expense in profit or loss.
The Council recognises gains and losses on the curtailment or settlement of a defined benefit plan when the curtailment or settlement occurs. The gain or loss on curtailment comprises any resulting change in the fair value of plan assets, change in the present value of defined benefit obligation and any related actuarial gains and losses and past service cost that had not previously been recognised.
However, where the Council participates in multi-employer defined benefits plans for which sufficient information is not available to use defined benefits accounting as set out above, it accounts for contributions to those plans as if they were defined contributions plans.
Details of these arrangements are set out in Note 20.
121

MELBOURNE CITY COUNCIL
Notes to the financial statements For the year ended 30 June 2012
Note 1. Significant accounting policies (continued)
(h) Depreciation Depreciation measures the service potential of buildings, infrastructure assets, plant and equipment consumed during the year. Interest in trees, land and artworks are not depreciated as they are considered to have either unlimited useful lives or to be self generating assets. Depreciation is recognised on a straight-line basis over the useful lives of the assets to the economic entity. Depreciation rates are reviewed each financial year. The depreciation periods for the major classes of assets are shown below represent the maximum useful life.
2011/12 2010/11 Buildings 50 Years 50 Years Roads & laneways - Seal 20 Years 20 Years Roads & laneways - Substructure 90 Years 90 Years Heritage Assets 100 Years 100 Years Promenades and Wharves 100 Years 100 Years Footpaths 50 Years 50 Years Kerb & channel 50 Years 50 Years Bridges 94 Years 94 Years Drains 185 Years 185 Years Plant & equipment 20 Years 20 Years Furniture & fittings 10 Years 10 Years Irrigation systems 20 Years 20 Years Parks & gardens infrastructure 50 Years 50 Years Statues, sculptures & artworks 100 Years 100 Years Other structures 50 Years 50 Years
Assets are depreciated from the date of acquisition or, in respect of internally constructed assets, from the time an asset is completed and held ready for use.
(i) Cash and Cash Equivalents For purposes of the balance sheet, cash and cash equivalents includes short term deposits, bank bills, transferrable certificates of deposit and fixed interest securities which are readily convertible to cash on hand and are subject to an insignificant risk of changes in value, net of bank overdrafts. Short-term deposits are stated at cost. Fixed interest securities are valued at net fair value. Interest is recognised when earned. (j) Receivables and Payables Trade and other receivables are initially recognised at fair value and subsequently at recoverable amount. They are classified as current assets except where the maturity is greater than 12 months after the reporting period date, in which case they are classified as non-current. Trade and other payables are recognised for amounts to be paid in the future for goods and services received, whether or not billed to the consolidated entity. Trade and other payables are recognised initially at fair value and subsequently at amortised cost.
(k) Impairment of financial assets A financial asset not carried at fair value through profit or loss is assessed at each reporting date to determine whether there is objective evidence that it is impaired. A financial asset is impaired if objective evidence indicates that a loss event has occurred after the initial recognition of the asset, and that loss event had a negative effect on the estimated future cash flows of that asset that can be reliably measured. Objective evidence that financial assets are impaired can include indications of significant financial difficulties, debtor bankruptcy, financial reorganisation or default in payment. In addition, for an equity security, a significant or prolonged decline in its fair value below its cost is objective evidence of impairment. Trade and other receivables All individually significant receivables are assessed for specific impairment. All individually significant receivables and those that are not individually significant are then assessed for impairment on a collective basis, by grouping those with similar risk characteristics. An impairment loss in respect of a financial asset measured at amortised costs is calculated as the difference between its carrying amount and the present value of the estimated future cash flows discounted at the asset's original effective interest rate. Losses are recognised in profit or loss and reflected in an allowance account against receivables. When a subsequent event (e.g. repayment) causes the amount of the impairment loss to decrease, the decrease in impairment loss is reversed through profit or loss.
122

MELBOURNE CITY COUNCIL
Notes to the financial statements For the year ended 30 June 2012
Note 1. Significant accounting policies (continued)
No allowance for impairment is made for rate debtors because the debts are collectable against the property. Available-for-sale financial assets Impairment losses on available-for-sale financial assets are recognised by reclassifying the losses accumulated in the fair value reserve in equity, to profit or loss. The cumulative loss that is recognised from equity to profit or loss is the difference between the acquisition cost and the current fair value, less any impairment loss previously recognised in profit or loss. Any subsequent recovery in the fair value of an impaired available-for-sale equity security is recognised in other comprehensive income.
(l) Property, Plant, Equipment & Infrastructure
(i) Capital and Recurrent Expenditure As a general rule, material expenditure incurred in the purchase or development of assets is capital expenditure. Expenditure necessarily incurred in either maintaining the operational capacity of the non-current asset or ensuring that the original life estimate of the asset is achieved, is considered maintenance expenditure and is treated as an expense as incurred. Items of a capital nature with a total value of less than $2,000 are treated as an expense.
(ii) Acquisition
Acquisitions of assets are initially recorded at cost. Cost is determined as the fair value of the assets given as consideration plus costs incidental to their acquisition, including architectural and engineering fees and all other establishment costs. The Council’s policy is to capitalise and depreciate individual capital expenditure over $2,000. Fair value means the amount for which an asset could be exchanged between a knowledgeable willing buyer and a knowledgeable willing seller in an arm’s length transaction.
(iii) Construction Work in Progress The cost of property, plant, equipment & infrastructure constructed by Melbourne City Council includes the cost of materials and direct labour and an appropriate proportion of overheads.
(iv) Leases
Melbourne City Council does not currently use any finance lease arrangements. In respect of operating leases, where the lessor effectively retains substantially the entire risks and benefits incidental to ownership of the leased property, the payments are charged to expense over the lease term.
(v) Asset Revaluation All asset values not valued at cost were reviewed and where necessary valued as at 30 June 2012. The net increase in the Asset Revaluation Reserve in 2011/12 was $162.437 million ($157.573 million 2010/11) for the Council and an increase of $162.437 million ($157.573 million 2010/11) for the economic entity, (refer to note 15).
Revaluation increments are credited directly to the asset revaluation reserve, except that, to the extent that an increment reverses a revaluation decrement in respect of that class of asset previously recognised as an expense, the increment is recognised as revenue. Revaluation decrements are recognised immediately as expenses, except that, to the extent that an increment balance exists in the asset revaluation reserve in respect of the same class of assets, they are debited directly to the asset revaluation reserve. Revaluation increments and decrements are offset against one another within a class of non-current assets, but not otherwise.
(vi) Heritage Assets The maximum life for depreciation of Heritage assets is 100 years.
(vii) Valuation All land and buildings are valued at fair value, being market value assuming the highest and best use permitted by the relevant land use planning provisions or existing public use whichever is the greater. Freehold land reserved for public open space is valued at a discount, being 20% of market value. All improvements on Crown Land are valued on the basis of fair value, being either market value or written down replacement cost for special purpose buildings. Infrastructure assets are valued at fair value, being replacement cost less accumulated depreciation.
123

CITY COUNCIL MELBOURNE
Notes to the financial statements For the year ended 30 June 2012
Note 1. Significant accounting policies (continued)
(viii) Impairment At each reporting date, the Council reviews the carrying value of its assets to determine whether there is any indication that these assets have been impaired. If such an indication exists, the recoverable amount of the asset, being the higher of the asset’s fair value less costs to sell and value in use, is compared to the assets carrying value. Any shortfall of the assets carrying value over its recoverable amount is expensed to the comprehensive income statement.
(m) Non-Cash Donations Non-cash donations in excess of $2,000 value are recognised as revenue.
(n) Rounding Unless otherwise stated, amounts in the Financial Report are rounded to the nearest thousand dollars.
(o) Web site costs Costs in relation to web sites controlled by the Melbourne City Council are charged as expenses in the period in which they are incurred unless they relate to the acquisition of an asset, in which case they are capitalised and amortised over their period of expected benefit. (p) Allocation between current & non-current With the exception of employee entitlements, the determination of whether an asset or liability is current or non-current, consideration is given to the time when each asset or liability is expected to be realised or paid. The asset or liability is classified as current if it is expected to be turned over within the next twelve months, being the Council’s operational cycle. For employee entitlements, long service leave entitlements for employees with over 7 years service and all annual leave entitlements is classified as current. Long service leave entitlements for employees with less than 7 years service is classified as non current. Long service leave expected to be taken in the next twelve months is recorded at nominal value and long service leave not expected to be taken over the next twelve months is recorded at present value. (q) Investment property Investment property is held to generate long-term rental yields. All tenant leases are entered into at an arms length basis. Investment property is carried at fair value, being market value assuming the highest and best use permitted by the relevant land use planning provisions or existing public use whichever is the greater. Any changes to fair value are recorded in the comprehensive income statement. Investment properties are not depreciated.
(r) Interest-bearing liabilities All loans and borrowings are initially recognised at fair value, net of transaction costs incurred. Borrowings are subsequently measured at amortised cost. Any difference between the proceeds (net of transaction costs) and the redemption amount is recognised over the life of the instrument using the effective interest rate method. Borrowings are derecognised from the Balance Sheet when the obligation specified in the contract has been discharged, cancelled or expires. The difference between the carrying amount of the borrowing derecognised and the consideration paid is recognised as other income or finance costs. Borrowings are classified as current liabilities unless the consolidated entity has the unconditional right to defer settlement of the liability for at least 12 months after the reporting date.
124
MELBOURNE CITY COUNCIL
Notes to the financial statements For the year ended 30 June 2012
Note 1. Significant accounting policies (continued)
(s) Pending Accounting Standards The following Australian Accounting Standards have been issued or amended and are applicable to the Council but are not yet effective. They have not been adopted in preparation of the financial statements at reporting date.
Standard / Interpretation Summary Applicable for annual reporting periods beginning or ending on
Impact on Local Government financial statements
AASB 9: Financial Instruments and AASB 2009–11: Amendments to Australian Accounting Standards arising from AASB 9 [AASB 1, 3, 4, 5, 7, 101, 102, 108, 112, 118, 121, 127,
These standards are applicable retrospectively and amend the classification and measurement of financial assets. Council has not yet determined the potential impact on the financial statements.
Applicable for annual reporting periods commencing on or after 1 January 2013.
These changes are expected to provide some simplification in the accounting for and disclosure of financial instruments
131, 132, 136, 139, 1023 & 1038 and Interpretations 10 & 12]
* simplifying the classifications of financial assets into those carried at amortised cost and those carried at fair value;
* removing the tainting rules associated with held-to-maturity assets;
* simplifying the requirements for embedded derivatives;
* removing the requirements to separate and fair value embedded derivatives for financial assets carried at amortised cost;
* allowing an irrevocable election on initial recognition to present gains and losses on investments in equity instruments that are not held for trading in other comprehensive income. Dividends in respect of these investments that are a return on investment can be recognised in profit or loss and there is no impairment or recycling on disposal of the instrument; and
* reclassifying financial assets where there is a change in an entity’s business model as they are initially classified based on:
a. the objective of the entity’s business model for managing the financial assets; and
b. the characteristics of the contractual cash flows.
(t) Critical accounting judgements and key sources of estimation uncertainty In application of the Council's policies, Council is required to make judgements, estimates and assumptions about carrying values of certain assets and liabilities that are not readily apparent from other sources. The estimates and associated assumptions are based on historical experience and other factors that are considered to be relevant. Actual results may differ from these estimates. The estimates and underlying assumptions are reviewed on an ongoing basis. Revisions to accounting estimates are recognised in the period of the revision and future periods if the revision affects both current and future periods. Information about critical assumptions and estimation uncertainties that have a significant risk of resulting in a material adjustment within the next financial year are included in the following notes: Note 9 - Property, plant & equipment and infrastructure (fair value measurement) Note 10 - Intangible assets (goodwill impairment assessment) Note 11 - Investment property (fair value measurement) Note 20 - Defined benefits superannuation funds (measurement of plan assets and liabilities)
125
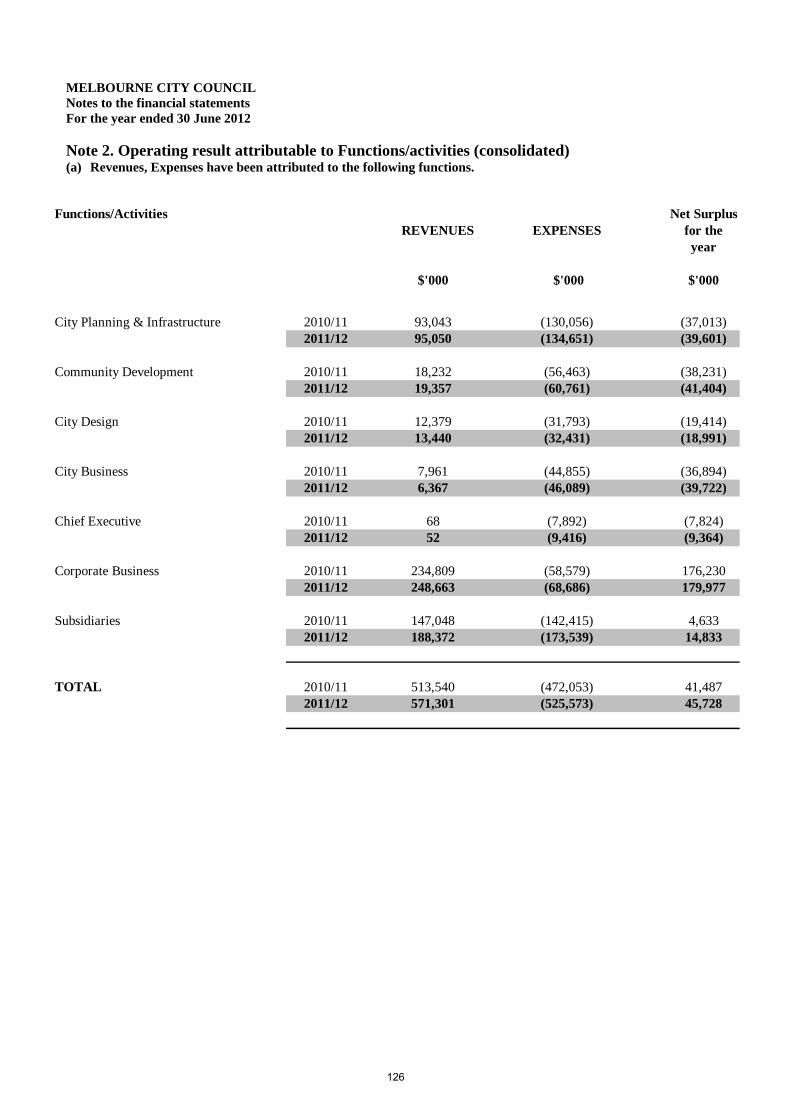
MELBOURNE CITY COUNCIL Notes to the financial statements For the year ended 30 June 2012 Note 2. Operating result attributable to Functions/activities (consolidated) (a) Revenues, Expenses have been attributed to the following functions.
Functions/Activities Net SurplusREVENUES EXPENSES for the
year
$'000 $'000 $'000
City Planning & Infrastructure 2010/11 93,043 (130,056) (37,013)2011/12 95,050 (134,651) (39,601)
Community Development 2010/11 18,232 (56,463) (38,231)2011/12 19,357 (60,761) (41,404)
City Design 2010/11 12,379 (31,793) (19,414)2011/12 13,440 (32,431) (18,991)
City Business 2010/11 7,961 (44,855) (36,894)2011/12 6,367 (46,089) (39,722)
Chief Executive 2010/11 68 (7,892) (7,824)2011/12 52 (9,416) (9,364)
Corporate Business 2010/11 234,809 (58,579) 176,2302011/12 248,663 (68,686) 179,977
Subsidiaries 2010/11 147,048 (142,415) 4,6332011/12 188,372 (173,539) 14,833
TOTAL 2010/11 513,540 (472,053) 41,4872011/12 571,301 (525,573) 45,728
126

MELBOURNE CITY COUNCIL Notes to the financial statements For the year ended 30 June 2012
Note 2. Operating result attributable to Functions/activities (consolidated) (continued)
(b) A brief description of the goal of each function is as follows:
City Planning & Infrastructure Advises the Council on city planning for the sustainable development of Melbourne through research, policy development, program and infrastructure delivery and planning. Community Development Provides a range of services, specific programs and recreation services for residents and visitors, contributing to building strong local communities that are inclusive and supportive. This, with the delivery of cultural programs and the management of the City’s cultural infrastructure, enhances the City of Melbourne’s reputation as a safe, attractive, liveable and accessible city. The Division is also responsible for providing a direct customer liaison, information and advocacy service and driving the organisation's approach to the delivery of high quality customer service. City Design Responsible on behalf of the Council for providing urban design policy, advice, design, project management and management of parks and reserves. City Business Provides leadership in events management, communications and marketing, promoting tourism within the city and providing guidance to business and international interaction. Chief Executive To ensure a well-managed and leading organisation through the delivery of effective and accountable governance and business processes.
Corporate Business To provide a range of quality support functions to the Council. This assists the Council in providing the highest standard of services to the city. Subsidiaries include the following entities: CityWide Service Solutions Pty Ltd and its controlled entities Sterling Group Services Pty Ltd and AWD Earthmoving Pty Ltd. To meet the contract service needs of local government, other governments, and private and public sector corporations by providing a comprehensive range of quality, physical services at competitive rates.
Queen Victoria Market Pty Ltd To ensure that the Market maintains and enhances an industry reputation as Australia’s foremost traditional market, whilst meeting world’s best practice standards.
Melbourne Wholesale Fish Market Pty Ltd The Melbourne Wholesale Fish Market Pty Ltd ceased operating the market on 30 June 2011. Sustainable Melbourne Fund Trust The Sustainable Melbourne Fund (SMF) is a self sustaining fund set up by Melbourne City Council which invests funds in projects with environmental benefits to the City. The projects may extend beyond the boundaries of Melbourne City Council to the broader state of Victoria, reflecting the position of Melbourne as the capital city of Victoria. These entities support Melbourne City Council in providing services to the community. Significant Interests: Melbourne City Council has a majority ownership of the MAPS Group Ltd through its holdings, however due to the structure of the company Melbourne City Council does not have a majority of voting rights. Melbourne City Council and the State Government hold 50% shareholding in Regent Management Company Pty Ltd. The Company was incorporated to oversee the reconstruction of the Regent Theatre, operate as landlord of the Regent Theatre and to enter into a refurbishment agreement for the restoration and lease of the theatre.
127

MELBOURNE CITY COUNCIL Notes to the financial statements For the year ended 30 June 2012
Note 3. Revenues
(a) Rates
2012 2011 2012 2011$'000 $'000 $'000 $'000
General Rates Residential 60,138 55,602 60,138 55,602 Commercial and Retail 137,294 131,994 137,294 131,994Cultural & Recreational Land Rates 370 364 370 364Supplementary Rates 2,612 5,348 2,612 5,348Objections/Exemptions (857) (504) (857) (504)
199,557 192,804 199,557 192,804
Consolidated Council
Melbourne City Council uses ‘net annual value’ as the basis of valuation of all properties within the municipal district. The net annual value of a property approximates the annual net rental for a commercial property and five per cent of the capital improved value for a residential property. The date of the general valuation of land for rating purposes within the municipal district was 1 January 2010 and the valuation first applied to the rating period commencing 1 July 2010. The valuation for rating purposes is performed on a two year cycle.
(b) Grants and other Contributions were received in respect of the following:
2012 2011 2012 2011$'000 $'000 $'000 $'000
State GrantsRoads Corporation 120 114 120 114Appropriation - Vic Grants Commission 2,473 1,863 2,473 1,863Tobacco Act Reform Grants 36 35 36 35School Crossing Supervisor 75 74 75 74Pre School Services 252 214 252 214Support Services for Families 365 179 365 179Maternal & Child Health 406 373 406 373Immunisation 60 52 60 52Home & Community Services Grant 2,366 2,203 2,366 2,203Flexible Respite Options Program 44 35 44 35Libraries Grant 747 717 747 717Arts Grant 110 10 110 10Disability Services Grant 108 104 108 104Other 1,327 2,795 907 2,073
8,489 8,768 8,069 8,046
CouncilConsolidated
128

MELBOURNE CITY COUNCIL Notes to the financial statements For the year ended 30 June 2012 Note 3. Revenues
(b) Grants and other contributions continued:
2012 2011 2012 2011$'000 $'000 $'000 $'000
Federal GrantsFederal Grant - Aged & Disability 155 170 155 170Special Needs Subsidy Scheme 13 50 13 50Federal Grant - Immunisation Register 25 24 25 24Federal Grant- Other 139 120 139 120
332 364 332 364Capital GrantsCapital Grants 8,887 8,498 8,887 8,498Parking Levy Capital Grant 5,000 4,850 5,000 4,850Public Open Space Contributions 2,825 2,213 2,825 2,213
16,712 15,561 16,712 15,561Total OtherOther Contributions 150 412 150 412Child Care Benefit 1,347 1,110 1,347 1,110Sponsorships 1,100 1,468 1,100 1,468
2,597 2,990 2,597 2,990Total Grants & Other Contributions 28,130 27,683 27,710 26,961
Consolidated Council
(c) Parking Fees
2012 2011 2012 2011$'000 $'000 $'000 $'000
On street parking 33,521 31,977 33,521 31,966Off street parking 8,681 8,408 5,129 4,855Tow away fees 1,393 1,739 1,393 1,739
43,595 42,124 40,043 38,560
Consolidated Council
(d) Finance Income
2012 2011 2012 2011$'000 $'000 $'000 $'000
Interest received from Investments 9,035 8,732 8,576 7,879 Interest due from Overdue Rates 688 783 688 783 Other 854 240 299 120
10,577 9,755 9,563 8,782
Consolidated Council
129

MELBOURNE CITY COUNCIL Notes to the financial statements For the year ended 30 June 2012
Note 3. Revenues
(e) Conditions over contributions
2012 2011 2012 2011$'000 $'000 $'000 $'000
Grants recognised as revenues during the financial yearand which were obtained on the condition that they beexpended in a specific manner that had not occurred at balance date were:
Grants for capital works 666 4,214 666 4,214Grants for other purposes 824 1,872 824 1,872
1,490 6,086 1,490 6,086Deduct(i) Grants which were recognised as revenues in a prior year and which were expended during the current yearin the manner specified by the grantor were:
Grants for capital works 4,214 158 4,214 158Grants for other purposes 1,872 1,729 1,872 1,729
6,086 1,887 6,086 1,887
Net increase/(decrease) in restricted assets resulting from grant revenues for the financial year (4,596) 4,199 (4,596) 4,199
Consolidated Council
Note 4. Expenses
2012 2011 2012 2011$'000 $'000 $'000 $'000
(a) Employee benefit expenseWages and Salaries 155,281 142,771 89,764 86,204Annual Leave and Long Service Leave 17,460 17,336 11,190 11,918Fringe Benefits 2,076 1,552 566 504WorkCover 2,264 2,187 413 886Superannuation 14,757 12,226 18,005 7,764
191,838 176,072 119,938 107,276
2012 2011 2012 2011$'000 $'000 $'000 $'000
(b) Contract Payments, Materials and ServicesContract Payments 135,669 112,609 109,891 101,851Other Materials and Services 100,737 88,282 39,825 38,810Auditors Remuneration * 718 689 374 410
237,124 201,580 150,090 141,071
* See (i) for Auditors remuneration in actual dollars.
2012 2011 2012 2011$ $ $ $
(i) Auditors' Remuneration Audit Services - Victoria Auditor Generals Office 211,000 216,000 114,000 109,000 Audit Services - Other Audits 189,992 45,597 3,300 45,106 Audit Services - Internal 317,184 427,369 256,578 256,140
718,176 688,966 373,878 410,246
Consolidated Council
Consolidated Council
Consolidated Council
130
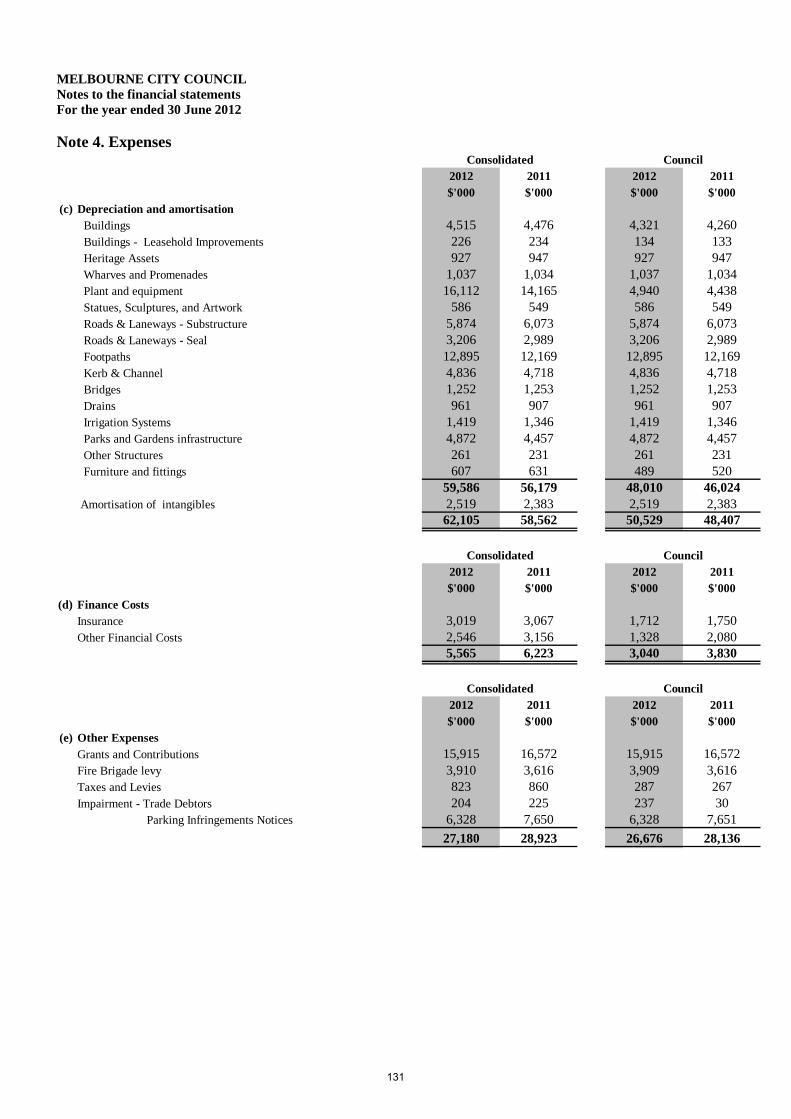
MELBOURNE CITY COUNCIL Notes to the financial statements For the year ended 30 June 2012 Note 4. Expenses
2012 2011 2012 2011$'000 $'000 $'000 $'000
(c) Depreciation and amortisation Buildings 4,515 4,476 4,321 4,260 Buildings - Leasehold Improvements 226 234 134 133 Heritage Assets 927 947 927 947 Wharves and Promenades 1,037 1,034 1,037 1,034 Plant and equipment 16,112 14,165 4,940 4,438 Statues, Sculptures, and Artwork 586 549 586 549 Roads & Laneways - Substructure 5,874 6,073 5,874 6,073 Roads & Laneways - Seal 3,206 2,989 3,206 2,989 Footpaths 12,895 12,169 12,895 12,169 Kerb & Channel 4,836 4,718 4,836 4,718 Bridges 1,252 1,253 1,252 1,253 Drains 961 907 961 907 Irrigation Systems 1,419 1,346 1,419 1,346 Parks and Gardens infrastructure 4,872 4,457 4,872 4,457 Other Structures 261 231 261 231 Furniture and fittings 607 631 489 520
59,586 56,179 48,010 46,024 Amortisation of intangibles 2,519 2,383 2,519 2,383
62,105 58,562 50,529 48,407
2012 2011 2012 2011$'000 $'000 $'000 $'000
(d) Finance Costs Insurance 3,019 3,067 1,712 1,750Other Financial Costs 2,546 3,156 1,328 2,080
5,565 6,223 3,040 3,830
2012 2011 2012 2011$'000 $'000 $'000 $'000
(e) Other ExpensesGrants and Contributions 15,915 16,572 15,915 16,572Fire Brigade levy 3,910 3,616 3,909 3,616Taxes and Levies 823 860 287 267Impairment - Trade Debtors 204 225 237 30 Parking Infringements Notices 6,328 7,650 6,328 7,651
27,180 28,923 26,676 28,136
Consolidated Council
Consolidated Council
Consolidated Council
131

MELBOURNE CITY COUNCIL Notes to the financial statements For the year ended 30 June 2012 Note 5. Trade and other receivables
2012 2011 2012 2011$'000 $'000 $'000 $'000
CurrentRates 2,717 2,239 2,717 2,239Parking Infringement Debtors 27,288 27,870 27,288 27,870Provision for Doubtful Debts - Parking Infringement (16,039) (15,557) (16,039) (15,557)Trade Debtors 33,925 35,933 9,509 6,396Provision for Doubtful Debts - Trade Debtors (440) (924) (207) (448)GST Receivable 8,945 3,735 6,555 4,671
56,396 53,296 29,823 25,171
Consolidated Council
Trade debtors are unsecured and have credit terms of 30 days from the date of invoice.
2012 2011 2012 2011Trade Debtors $'000 $'000 $'000 $'000Ageing of past due but not impaired60-90 days 251 215 142 12490-120 days 260 147 153 57120+ days 620 747 349 429Total 1,131 1,109 644 610
This disclosure relates only to Trade Debtors. Rates and Parking Infringement Debtors are not financial instruments and are therefore not included.
Consolidated Council
2012 2011 2012 2011$'000 $'000 $'000 $'000
Provision for doubtful debtsProvision for Doubtful Debts - Parking Infringement 16,039 15,557 16,039 15,557Provision for Doubtful Debts - Trade Debtors 440 924 207 448Total 16,479 16,481 16,246 16,005
2012 2011 2012 2011$'000 $'000 $'000 $'000
Movement in doubtful debts - Parking InfringementBalance at the beginning of the year 15,557 15,593 15,557 15,593New provisions recognised 6,328 7,651 6,328 7,651Amounts written off as uncollectible (5,846) (7,687) (5,846) (7,687)Balance at the end of the year 16,039 15,557 16,039 15,557
Movement in doubtful debts - Trade DebtorsBalance at the beginning of the year 924 704 448 418New provisions recognised 125 336 118 64Doubtful debt recovery (355) - (247) -Amounts written off as uncollectible (254) (116) (112) (34)Balance at the end of the year 440 924 207 448
Consolidated Council
132

MELBOURNE CITY COUNCIL Notes to the financial statements For the year ended 30 June 2012 Note 6. Inventories
2012 2011 2012 2011$'000 $'000 $'000 $'000
Stores and Raw Materials 441 412 - -Provision for Obsolete Stock (5) (5) - -
436 407 - -
Consolidated Council
Note 7. Other Assets
2012 2011 2012 2011$'000 $'000 $'000 $'000
Prepayments 1,196 1,153 282 241Tax equivalents & Dividends - - 4,540 6,022
1,196 1,153 4,822 6,263
CouncilConsolidated
Note 8. Other financial assets
NON-CURRENT
2012 2011 2012 2011
$'000 $'000 $'000 $'000
Interests in Controlled Entities:
CityWide Service Solutions Pty Ltd - - 18,406 18,406
Queen Victoria Market Pty Ltd - - 200 200Melbourne Wholesale Fish Market Pty Ltd - - 5,000 5,000
Investment in Sustainable Melbourne Fund - - 6,575 6,329
- - 30,181 29,935
Other Investments
Regent Management Company Pty Ltd * 2,776 2,776 2,776 2,776
MAPS Group Ltd (Procurement Australia) 250 250 250 250
3,026 3,026 3,026 3,026
3,026 3,026 33,207 32,961
Consolidated Council
* Reflects a 50% shareholding . A valuation was performed in 1994 and an adjustment made to reflect fair value. Council expects to undertake a valuation of the Regent Management Company in the near future.
133

MELBOURNE CITY COUNCIL Notes to the financial statements For the year ended 30 June 2012 Note 9. Property, plant, equipment and infrastructure
2012 2011 2012 2011$’000 $’000 $’000 $’000
Land - FreeholdAt Council's valuation (i) 193,173 168,833 193,173 168,833At Independent valuation - - - -At cost 16,105 16,105 - -
209,278 184,938 193,173 168,833Land - Other ControlledAt Council's valuation (i) 1,386,501 1,308,530 1,386,501 1,308,530
Land - Under RoadsAt Council's deemed cost (i) 12,920 11,380 12,920 11,380
Buildings on Freehold LandAt Council's valuation (i) 67,534 70,350 63,663 66,470At cost 603 578 - -Accumulated depreciation (1,610) (1,425) - -
66,527 69,503 63,663 66,470Buildings on Other Controlled LandAt Council's valuation (i) 43,022 37,958 43,022 37,958
Buildings - Leasehold ImprovementsAt cost 4,658 4,552 2,269 2,269Accumulated depreciation (2,555) (2,329) (701) (567)
2,103 2,223 1,568 1,702Heritage BuildingsAt Council's valuation (i) 95,578 88,956 95,578 88,956
Promenades and WharvesAt Council's valuation (ii) 62,552 63,561 62,552 63,561
Plant and EquipmentAt cost 153,261 135,420 46,337 43,850Accumulated depreciation (83,681) (74,372) (27,242) (23,542)
69,580 61,048 19,095 20,308Furniture and FittingsAt cost 5,827 6,007 4,572 4,986Accumulated depreciation (3,377) (3,302) (2,637) (2,568)
2,450 2,705 1,935 2,418Statues, Sculptures and ArtworksAt cost 52,390 51,060 52,390 51,060Accumulated depreciation (4,880) (4,294) (4,880) (4,294)
47,510 46,766 47,510 46,766Roads & Laneways SubstructureAt Council's valuation (ii) 442,006 436,907 442,006 436,907
Roads & Laneways - Seal At Council's valuation (ii) 35,118 30,182 35,118 30,182
FootpathsAt Council's valuation (ii) 141,893 131,897 141,893 131,897
Kerb & ChannelAt Council's valuation (ii) 137,673 114,808 137,673 114,808
Consolidated Council
134

MELBOURNE CITY COUNCIL Notes to the financial statements For the year ended 30 June 2012 Note 9. Property, plant, equipment and infrastructure (cont):
2012 2011 2012 2011$’000 $’000 $’000 $’000
Consolidated Council
BridgesAt Council's valuation (ii) 85,186 84,805 85,186 84,805
DrainsAt Council's valuation (ii) 100,060 80,531 100,060 80,531
IrrigationAt Council's valuation (iii) 21,049 18,801 21,049 18,801Accumulated depreciation (2,765) (1,346) (2,765) (1,346)
18,284 17,455 18,284 17,455Parks and Gardens InfrastructureAt Council's valuation (iv) 71,287 66,490 71,287 66,490
TreesAt Council's valuation (v) 38,934 34,133 38,934 34,133
Other StructuresAt cost 5,317 3,946 5,317 3,946Accumulated depreciation-cost (1,621) (1,367) (1,621) (1,367)
3,696 2,579 3,696 2,579Works in ProgressAt cost 121,409 81,435 120,628 81,353
Total Property, Plant, Equipment and Infrastructure 3,193,567 2,958,790 3,122,282 2,898,022
The basis of valuation is included under note 1(l) in the financial report and have been conducted as follows: (i) Valuations of Council Land and Buildings were determined by David Slicer (Senior Valuer) Melbourne City Council.
All land and buildings are valued at fair value, being market value assuming the highest and best use permitted by the relevant land use planning provisions or existing public use whichever is the greater. Freehold land reserved for public open space is valued at a discount, being 20% of market value. All improvements on Crown Land are valued on the basis of fair value, being either market value or written down replacement cost for special purpose buildings.
(ii) Valuations of Infrastructure Assets (Roads & Laneways, Footpaths, Kerb & Channel, Bridges and Drains) were determined by Michael Norton (Principal Engineer) Melbourne City Council.
Infrastructure Assets and Park Assets are valued at fair value being replacement cost less accumulated depreciation, taking into account the asset condition and their remaining lives.
(iii) Valuation of Parks and Gardens Infrastructure were determined by Eugene Stackpole (Asset Management Officer) and
David Slicer (Senior Valuer) Melbourne City Council.
(iv) Valuations of Trees were determined by Ian Shears (Manager Urban Landscapes) Melbourne City Council. Trees are valued at replacement cost which is arrived at from current on ground costs, current tree prices, tree planting works and maintenance through the establishment period of the tree.
All the above valuations were completed as at 30 June 2012 for Council. Valuations for 30 June 2012 are at fair value. Unless otherwise stated the carrying value of each class of asset measured at fair value at balance date materially reflects their fair value at that date.
135

MELBOURNE CITY COUNCIL Notes to the financial statements For the year ended 30 June 2012 Note 9. Property, plant, equipment and infrastructure (continued)
(a) Consolidated30 June 2012 Carrying CarryingAsset Classes amount at Revaluations Additions Disposals Depreciation amount at
30 June 2011 30 June 2012$’000 $’000 $’000 $’000 $’000 $’000
Land - Freehold 184,938 25,515 - (1,175) - 209,278Land - Other Controlled 1,308,530 73,137 4,834 - - 1,386,501Buildings on Freehold Land 69,503 (4,133) 4,446 (618) (2,671) 66,527Buildings on Other Controlled Land 37,958 3,894 3,326 (312) (1,844) 43,022Buildings - Leasehold Improvements 2,223 - 106 - (226) 2,103Heritage Assets 88,956 3,343 4,206 - (927) 95,578Promenades and Wharves 63,561 28 - - (1,037) 62,552Plant and Equipment 61,048 - 25,628 (984) (16,112) 69,580Furniture and Fittings 2,705 - 365 (13) (607) 2,450Statues, Sculptures and Artworks 46,766 - 1,330 - (586) 47,510Roads & Laneways - Substructure 436,907 8,066 2,971 (64) (5,874) 442,006Roads & Laneways - Seal 30,182 (1,291) 9,438 (5) (3,206) 35,118Land Under Roads 11,380 - 1,540 - - 12,920Footpaths 131,897 5,608 17,285 (2) (12,895) 141,893Kerb & Channel 114,808 24,178 3,551 (28) (4,836) 137,673Bridges 84,805 (178) 1,811 - (1,252) 85,186Drains 80,531 16,678 3,812 - (961) 100,060Irrigation 17,455 - 2,248 - (1,419) 18,284Parks and Gardens Infrastructure 66,490 4,042 5,706 (79) (4,872) 71,287Trees 34,133 3,550 1,251 - - 38,934Other Structures 2,579 - 1,381 (3) (261) 3,696Works in Progress* 81,435 - 39,974 - - 121,409
2,958,790 162,437 135,209 (3,283) (59,586) 3,193,567
* Works in progress addition figure is a net amount consisting of $103.00 million additional works in progress and $63.03 million of assets capitalised during the financial year 2011/12.
(a) Consolidated30 June 2011 Carrying CarryingAsset Classes amount at Revaluations Additions Disposals Depreciation amount at
30 June 2010 30 June 2011$’000 $’000 $’000 $’000 $’000 $’000
Land - Freehold 177,317 15,371 - (7,750) - 184,938Land - Other Controlled 1,181,149 124,791 2,590 - - 1,308,530Buildings on Freehold Land 68,742 (782) 4,183 - (2,640) 69,503Buildings on Other Controlled Land 33,756 (393) 6,430 - (1,835) 37,958Buildings - Leasehold Improvements 2,341 - 117 - (235) 2,223Heritage Assets 91,026 (5,602) 4,479 - (947) 88,956Promenades and Wharves 64,574 20 - - (1,033) 63,561Plant and Equipment 58,642 - 17,656 (1,083) (14,167) 61,048Furniture and Fittings 3,174 - 164 - (633) 2,705Statues, Sculptures and Artworks 45,818 - 1,497 - (549) 46,766Roads & Laneways - Substructure 440,203 2,776 165 (165) (6,072) 436,907Roads & Laneways - Seal 26,267 (797) 7,704 (3) (2,989) 30,182Land Under Roads 10,770 - 610 - - 11,380Footpaths 121,724 12,891 9,456 (5) (12,169) 131,897Kerb & Channel 111,319 5,702 2,536 (32) (4,717) 114,808Bridges 86,015 42 - - (1,252) 84,805Drains 75,489 4,145 1,803 - (906) 80,531Irrigation 17,071 - 1,730 - (1,346) 17,455Parks and Gardens Infrastructure 62,735 172 8,040 - (4,457) 66,490Trees 33,566 (763) 1,330 - - 34,133Other Structures 2,525 - 286 - (232) 2,579Works in Progress 77,545 - 3,890 - - 81,435
2,791,768 157,573 74,666 (9,038) (56,179) 2,958,790 136

MELBOURNE CITY COUNCIL Notes to the financial statements For the year ended 30 June 2012 Note 9. Property, plant, equipment and infrastructure (continued)
(b) Council30 June 2012 Carrying CarryingAsset Classes amount at Revaluations Additions Disposals Depreciation amount at
30 June 2011 30 June 2012$’000 $’000 $’000 $’000 $’000 $’000
Land - Freehold 168,833 25,515 - (1,175) - 193,173Land - Other Controlled 1,308,530 73,137 4,834 - - 1,386,501Buildings on Freehold Land 66,470 (4,133) 4,420 (617) (2,477) 63,663Buildings on Other Controlled Land 37,958 3,894 3,326 (312) (1,844) 43,022Buildings - Leasehold Improvements 1,702 - - - (134) 1,568Heritage Assets 88,956 3,343 4,206 - (927) 95,578Promenades and Wharves 63,561 28 - - (1,037) 62,552Plant and Equipment 20,308 - 4,368 (641) (4,940) 19,095Furniture and Fittings 2,418 - 19 (13) (489) 1,935Statues, Sculptures and Artworks 46,766 - 1,330 - (586) 47,510Roads & Laneways - Substructure 436,907 8,066 2,971 (64) (5,874) 442,006Roads & Laneways - Seal 30,182 (1,291) 9,438 (5) (3,206) 35,118Land Under Roads 11,380 - 1,540 - - 12,920Footpaths 131,897 5,608 17,285 (2) (12,895) 141,893Kerb & Channel 114,808 24,178 3,551 (28) (4,836) 137,673Bridges 84,805 (178) 1,811 - (1,252) 85,186Drains 80,531 16,678 3,812 - (961) 100,060Irrigation 17,455 - 2,248 - (1,419) 18,284Parks and Gardens Infrastructure 66,490 4,042 5,706 (79) (4,872) 71,287Trees 34,133 3,550 1,251 - - 38,934Other Structures 2,579 - 1,381 (3) (261) 3,696Works in Progress* 81,353 - 39,275 - - 120,628
2,898,022 162,437 112,772 (2,939) (48,010) 3,122,282
* Works in progress addition figure is a net amount consisting of $102.30 million additional works in progress and $63.03 million of assets capitalised during the financial year 2011/12.
(b) Council30 June 2011 Carrying CarryingAsset Classes amount at Revaluations Additions Disposals Depreciation amount at
30 June 2010 30 June 2011$’000 $’000 $’000 $’000 $’000 $’000
Land - Freehold 153,462 15,371 - - - 168,833Land - Other Controlled 1,181,149 124,791 2,590 - - 1,308,530Buildings on Freehold Land 65,496 (782) 4,180 - (2,424) 66,470Buildings on Other Controlled Land 33,756 (393) 6,430 - (1,835) 37,958Buildings - Leasehold Improvements 1,835 - - - (133) 1,702Heritage Assets 91,026 (5,602) 4,479 - (947) 88,956Promenades and Wharves 64,575 20 - - (1,034) 63,561Plant and Equipment 20,580 - 4,883 (714) (4,441) 20,308Furniture and Fittings 2,832 - 106 - (520) 2,418Statues, Sculptures and Artworks 45,818 - 1,497 - (549) 46,766Roads & Laneways - Substructure 440,203 2,776 165 (165) (6,072) 436,907Roads & Laneways - Seal 26,270 (797) 7,701 (3) (2,989) 30,182Land Under Roads 10,770 - 610 - - 11,380Footpaths 121,724 12,891 9,456 (5) (12,169) 131,897Kerb & Channel 111,319 5,702 2,536 (32) (4,717) 114,808Bridges 86,016 42 - - (1,253) 84,805Drains 75,489 4,145 1,803 - (906) 80,531Irrigation 17,071 - 1,730 - (1,346) 17,455Parks and Gardens Infrastructure 62,733 172 8,042 - (4,457) 66,490Trees 33,566 (763) 1,330 - - 34,133Other Structures 2,525 - 286 - (232) 2,579Works in Progress 77,104 - 4,249 - - 81,353
2,725,319 157,573 62,073 (919) (46,024) 2,898,022
137

MELBOURNE CITY COUNCIL Notes to the financial statements For the year ended 30 June 2012 Note 10. Intangible assets (a) Consolidated Carrying Carrying CarryingAsset Classes amount at Additions Disposals Amortisation amount at Additions Disposals Amortisation amount at
30 June 2010 30 June 2011 30 June 2012$’000 $’000 $’000 $’000 $’000 $’000 $’000 $’000 $’000
GoodwillNet Book value 9,851 7,863 - - 17,714 3,664 - - 21,378
Licence Agreement - - - - - - - - -
Computer SoftwareCost 16,862 4,755 - - 21,617 2,619 - - 24,236Accumulated amortisation (12,457) - - (2,383) (14,840) - - (2,519) (17,359)Net Book value 4,405 4,755 - (2,383) 6,777 2,619 - (2,519) 6,877
14,256 12,618 - (2,383) 24,491 6,283 - (2,519) 28,255
(b) Council Carrying Carrying CarryingAsset Classes amount at Additions Disposals Amortisation amount at Additions Disposals Amortisation amount at
30 June 2010 30 June 2011 30 June 2012$’000 $’000 $’000 $’000 $’000 $’000 $’000 $’000 $’000
Licence Agreement - - - - - - - - -
Computer SoftwareCost 16,862 4,755 - - 21,617 2,619 - - 24,236Accumulated amortisation (12,457) - - (2,383) (14,840) - - (2,519) (17,359)Net Book value 4,405 4,755 - (2,383) 6,777 2,619 - (2,519) 6,877
4,405 4,755 - (2,383) 6,777 2,619 - (2,519) 6,877
Intangible assets, excluding goodwill, are amortised over 5 years.
138

MELBOURNE CITY COUNCIL Notes to the financial statements For the year ended 30 June 2012 Note 10. Intangible assets (Cont)
Intangible assets2012 2011$'000 $'000
21,378 17,714Goodwill has been reviewed for impairment for the year ending 30 June 2012.
Goodwill$000
2011Cost 9,852Accumulated amortisation and impairment -Opening Balance 9,852Acquisition of Subsidiary 7,862Balance at 30 June 2011 17,714
2012Cost 17,714Accumulated amortisation andimpairment -Opening Balance 17,714Fair value adjustment on acquisition of a subsidiary (Note 25) 6Acquisition of Subsidiary (Note 25) 3,658Balance at 30 June 2012 21,378
2012 2011$'000 $'000
Asset Maintenance Services 8,714 8,714Arboriculture NSW 1,138 1,138Open Space NSW 7,868 7,862Infrastructure services 3,658 -
21,378 17,714
The recoverable amount of each cash-generating unit has been determined based on its value in use, and was determined bydiscounting the future cash flows to be generated from the continuing use of the cash-generating unit. The recoverable amountof each unit was determined to be in excess of the carrying value for each cash-generating unit, and therefore no impairmentshave been recognised.
Goodwill on Acquisition
Impairment testing for cash-generating units containing goodwillFor the purposes of impairment testing, Goodwill is allocated to councils subsidiaries consolidated entity's operating divisions.The aggregate carrying amounts of Goodwill allocated to each cash-generating unit are as follows:
139

MELBOURNE CITY COUNCIL Notes to the financial statements For the year ended 30 June 2012 Note 10. Intangible assets (Cont)
EBITDADiscount rate growth rate
% %2012 3.04% 3.00%
2011 5.21% 2.75%
Key assumptions used in the discounted cash flow projectionsThe key assumptions used in the calculation of recoverable amounts are discount rates, and EBITDA growth. Theseassumptions are as follows:
The company has modelled a 40% - 50% reduction in EBITDA in each CGU. In each case, the value in use wouldnot be lower than the carrying amount, and therefore no impairment charge would arise.
The Arboriculture NSW CGU has contracts going to tender in 2012/2013 financial year. There would be animpairment charge if existing contracts are not re-won and new work is not won within the CGU. The companyhas a strong history of re-winning contracts as they come up for renewal.
The discount rate used is a pre-tax measure based on the risk-free rate for 10-year bonds issued by the Australiangovernment.
Each CGU has five years of cash flows included in its discounted cash flow models. The long-term compoundannual growth rate in EBITDA is estimated by management using past experience and expectations for the future.
Budgeted EBITDA growth is expressed as the compound annual growth rates in the initial five years of the plans used for impairment testing and has been based on past experience and expectations for the future.
Sensitivity to change in assumptions
140

MELBOURNE CITY COUNCIL Notes to the financial statements For the year ended 30 June 2012 Note 11. Investment property
2012 2011 2012 2011$’000 $’000 $’000 $’000
(a) Amounts recognised in Income Statement for Investment Properties
Property Rental 10,002 9,686 10,002 9,686
Operating Expenses for rental generating properties 1,005 980 1,005 980Operating Expenses for non rental generating properties 6,983 6,623 6,983 6,623
(b) Reconciliation of carrying amountsLandCarrying amount at beginning of period 32,101 32,101 32,101 32,101Net gain/(loss) from fair value adjustment 10,458 - 10,458 -Reclassified (1,385) - (1,385) -Carrying amount at end of period 41,174 32,101 41,174 32,101
BuildingsCarrying amount at beginning of period 65,333 64,795 65,333 64,795Net gain/(loss) from fair value adjustment (2,447) - (2,447) -Additions 903 538 903 538Reclassified (245) - (245) -Carrying amount at end of period 63,544 65,333 63,544 65,333
Total Investment Properties 104,718 97,434 104,718 97,434
The principal assumptions underlying the valuer's estimation of fair value include those related to the amount of contractual rentals, void periods, maintenance and capital expenditure requirements, and appropriate discount rates. The expected future market rentals are based on current market rentals for similar properties in the same location and condition.
CouncilConsolidated
Investment properties comprise a number of commercial properties that are leased to third parties. Council's leasing profile comprises of largely crown land. Others in the portfolio include freehold or lease commitments. Council has a significant number of leases varying from monthly overholding to short term to long term. The rental amounts are either fixed term, annual CPI reviews or Market reviews.
The investment valuations have been determined by David Slicer (Senior Valuer) Melbourne City Council. The determination of fair value was based on the capitalisation of net rental income. The capitalisation of net rental income projections are based on each property's net market income, which is assumed to be a level annuity in perpetuity, and a capitalisation rate derived from analysis of market evidence. Reversals associated with short-term leasing risks/costs, incentives and capital expenditure may be deducted from the capitalised net income amount.
141

MELBOURNE CITY COUNCIL Notes to the financial statements For the year ended 30 June 2012 Note 12. Trade and other payables
2012 2011 2012 2011$'000 $'000 $'000 $'000
CurrentTrade Creditors General 27,107 20,642 13,550 13,185Docklands Payable - 2,500 - 2,500Deposits and retention amounts 3,865 3,765 2,054 1,833Accruals 59,521 45,835 45,604 32,057Income in Advance 3,585 2,744 967 193
94,078 75,486 62,175 49,768
Consolidated Council
Trade creditors are unsecured, not subject to interest charges and are normally settled within 30 days from the date of invoice.
Note 12(a) Trade and other payables (Non-Current)
2012 2011 2012 2011$'000 $'000 $'000 $'000
Non-CurrentDocklands Payable - 4,282 - 4,282
- 4,282 - 4,282
Consolidated Council
Note 13. Employee benefits
2012 2011 2012 2011$'000 $'000 $'000 $'000
(a) CurrentLong Service Leave 20,822 18,803 15,233 14,261Annual Leave 14,499 13,865 8,605 8,591Other - 167 - -
35,321 32,835 23,838 22,852(b) Non-Current
Long Service Leave 4,930 4,654 2,584 2,5324,930 4,654 2,584 2,532
Total Employee Benefits 40,251 37,489 26,422 25,384
Consolidated Council
142

MELBOURNE CITY COUNCIL Notes to the financial statements For the year ended 30 June 2012 Note 14. Provisions
2012 2011 2012 2011$'000 $'000 $'000 $'000
(a) CurrentInsurance claims 519 706 519 706Other 952 894 630 630
1,471 1,600 1,149 1,336
(b) Reconciliation of movementsInsurance ClaimsBalance at the beginning of the financial year 706 551 706 551Additional provisions - 266 - 266Amounts used (187) (111) (187) (111)Balance at the end of the financial year 519 706 519 706
OtherBalance at the beginning of the financial year 894 959 630 765Additional provisions 81 17 - -Amounts used (23) (82) - (135)Balance at the end of the financial year 952 894 630 630
CouncilConsolidated
Note 15. Reserves
2012 2011 2012 2011$'000 $'000 $'000 $'000
CompositionAsset Revaluation 1,570,021 1,407,584 1,563,376 1,400,939Reserve for Public Open Space 7,062 3,665 7,062 3,665
1,577,083 1,411,249 1,570,438 1,404,604
The asset revaluation reserve records the revaluations of the Council's property, plant and equipment which is carried at fair value.The reserve for public open space records amounts of accumulated surpluses set aside for the development of public spaces in the City.
CouncilConsolidated
143

MELBOURNE CITY COUNCIL Notes to the financial statements For the year ended 30 June 2012 Note 15. Reserves (continued)
(i) Movement in Reserves -Asset Revaluation Reserve
Consolidated Carrying Transfer Carrying Carryingamount at Increment to Accum amount at Increment amount at
2010 (decrement) Surplus 2011 (decrement) 2012$’000 $’000 $’000 $’000 $’000 $’000
Land 805,500 140,162 (4,514) 941,148 98,652 1,039,800Buildings 46,381 (6,777) - 39,604 3,104 42,708Roads & Laneways 144,954 1,979 - 146,933 6,775 153,708Footpaths 61,441 12,891 - 74,332 5,608 79,940Kerb & Channel 89,848 5,702 - 95,550 24,178 119,728Bridges 22,280 42 - 22,322 (178) 22,144Drains 7,268 4,145 - 11,413 16,678 28,091Promenades and Wharves 2,787 20 - 2,807 28 2,835Parks and Gardens Infrastructure 44,524 172 - 44,696 4,042 48,738Trees 10,517 (763) - 9,754 3,550 13,304Other structures 206 - - 206 - 206P&G Irrigation 6,769 - - 6,769 - 6,769Plant & Equipment 547 - (547) - - -Computer Equipment 635 - (635) - - -Furniture & Fittings 9 - (9) - - -Artworks 5,404 - - 5,404 - 5,404Revaln Res - CityWide Service Solutions Pty Ltd 6,646 - - 6,646 - 6,646 1,255,716 157,573 (5,705) 1,407,584 162,437 1,570,021
(ii) Movement in Reserves -Asset Revaluation Reserve
Council Carrying Transfer Carrying Carryingamount at Increment to Accum amount at Increment amount at
2010 (decrement) Surplus 2011 (decrement) 2012$’000 $’000 $’000 $’000 $’000 $’000
Land 800,986 140,162 - 941,148 98,652 1,039,800Buildings 46,381 (6,777) - 39,604 3,104 42,708Roads & Laneways 144,954 1,979 - 146,933 6,775 153,708Footpaths 61,441 12,891 - 74,332 5,608 79,940Kerb & Channel 89,848 5,702 - 95,550 24,178 119,728Bridges 22,281 42 - 22,323 (178) 22,145Drains 7,267 4,145 - 11,412 16,678 28,090Promenades and Wharves 2,787 20 - 2,807 28 2,835Parks and Gardens Infrastructure 44,525 172 - 44,697 4,042 48,739Trees 10,517 (763) - 9,754 3,550 13,304Other structures 206 - - 206 - 206P&G Irrigation 6,769 - - 6,769 - 6,769Plant & Equipment 547 - (547) - - -Computer Equipment 635 - (635) - - -Furniture & Fittings 9 - (9) - - -Artworks 5,404 - - 5,404 - 5,404
1,244,557 157,573 (1,191) 1,400,939 162,437 1,563,376
144

MELBOURNE CITY COUNCIL Notes to the financial statements For the year ended 30 June 2012 Note 15. Reserves (continued)
(iii) Movements in Reserves - Reserve for Public Open Space
2012 2011 2012 2011$'000 $'000 $'000 $'000
Balance at the beginning of the financial year 3,665 2,539 3,665 2,539Transfers to accumulated reserves 3,539 2,186 3,539 2,186Transfers from accumulated reserves (142) (1,060) (142) (1,060)Balance at the end of the financial year 7,062 3,665 7,062 3,665
Consolidated Council
(iv) Movements in Reserves - Investments Revaluation Reserve 2012 2011 2012 2011
$'000 $'000 $'000 $'000
Balance at the beginning of the financial year - (336) - (336)Transfers to accumulated reserves - 336 - 336Balance at the end of the financial year - - - -
CouncilConsolidated
Note 16. Gains/ (loss) on sale of fixed and intangible assets
2012 2011 2012 2011$'000 $'000 $'000 $'000
Land & Buildings & InfrastructureProceeds from Sales 1,383 - 1,383 -Carrying amount of assets sold (1,107) - (1,107) -Gain/(Loss) on Sale 276 - 276 -
Plant, Equipment Proceeds from Sales 1,417 3,389 518 3,082Carrying amount of assets sold/disposed (993) (1,001) (654) (919)Gain/(Loss) on Sale 424 2,388 (136) 2,163
Total Proceeds from Sale of Assets 2,803 3,389 1,901 3,082Total Carrying amount of Assets Sold (2,103) (1,001) (1,761) (919)Total Gain/(Loss) on Sale 700 2,388 140 2,163
Consolidated Council
145

MELBOURNE CITY COUNCIL Notes to the financial statements For the year ended 30 June 2012 Note 17. Cash flow information
(a) Reconciliation from net cash provided by operating activities to surplus(deficit)
2012 2011 2012 2011
$'000 $'000 $'000 $'000
Profit/(loss) for the year 45,728 41,487 30,895 36,855
Adjustments for:Depreciation and amortisation 62,105 58,562 50,529 48,407Investment Properties (8,045) - (8,045) -(Gain)/Loss on sale of property, plant and equipment (700) (2,388) (140) (2,163)Finance costs from financing activities 5,204 5,123 2,428 2,471Contributed assets (11,182) (1,993) (11,182) (1,993)
Changes in assets and liabilities in relation to operating activities:(Increase)/Decrease in Trade and other Receivables (3,100) (16,153) (4,652) (3,990)(Increase)/Decrease in Other Assets (43) (260) 1,441 (1,617)(Increase)/Decrease in Inventories (29) 71 - -(Increase)/Decrease in Accrued Income 155 (3,214) 880 (415)Increase/(Decrease) in Trade and Other Payables 14,504 26,690 8,174 16,681Increase/(Decrease) in Superannuation Liability 11,274 (453) 9,812 -Increase/(Decrease) in Employee Benefits 2,486 3,974 986 2,042Increase/(Decrease) in Provisions (129) 90 (187) 20Net cash provided by operating activities 118,228 111,536 80,939 96,298
CouncilConsolidated
(b) Cash and Cash Equivalents
2012 2011 2012 2011$'000 $'000 $'000 $'000
Cash on hand 79 78 45 46Cash at bank 5,253 4,225 1,936 (107)Bank Bills, Transferrable Certificates of Deposit 143,164 164,671 127,504 151,647Cash and Cash Equivalents 148,496 168,974 129,485 151,586
Cash at the end of the financial year as shown in the balance sheet and the statement of cash flows comprises:
(c) Restriction on Investments
2012 2011 2012 2011
$'000 $'000 $'000 $'000Long Service Leave 25,752 23,457 17,817 16,793Reserve Funds 7,062 3,665 7,062 3,665
32,814 27,122 24,879 20,458
Council has cash and cash equivalents (note 17b) that are subject to restrictions. As at the reporting date, Council had legislative restrictions in relation to employee entitlements (Long Service Leave) and reserve funds (Recreational Lands Reserves).
City of Melbourne invests cash at call which is available for withdrawal on demand. It also invests in term deposits and transferable certificates of deposit for fixed periods. Interest rates on these instruments are fixed for a specific period and the funds are not withdrawn until maturity.
146
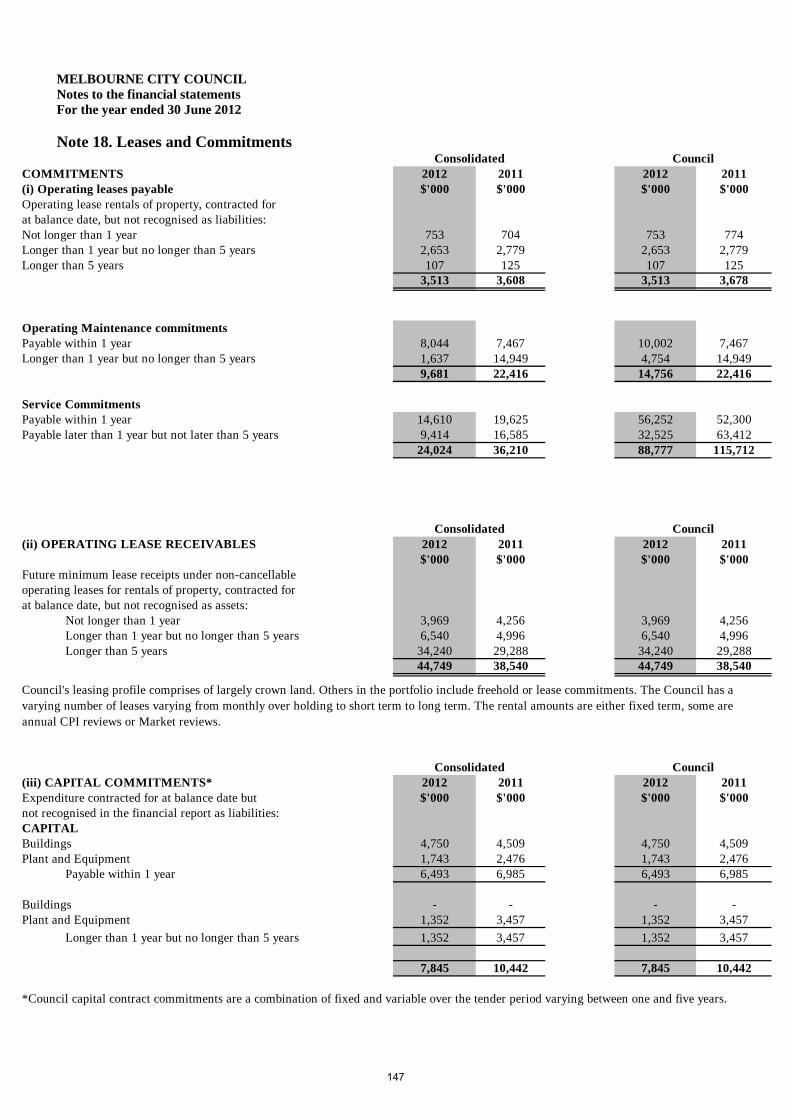
MELBOURNE CITY COUNCIL Notes to the financial statements For the year ended 30 June 2012 Note 18. Leases and Commitments
COMMITMENTS 2012 2011 2012 2011(i) Operating leases payable $'000 $'000 $'000 $'000Operating lease rentals of property, contracted forat balance date, but not recognised as liabilities:Not longer than 1 year 753 704 753 774
2,653 2,779 2,653 2,779Longer than 5 years 107 125 107 125
3,513 3,608 3,513 3,678
Operating Maintenance commitments8,044 7,467 10,002 7,4671,637 14,949 4,754 14,9499,681 22,416 14,756 22,416
Service Commitments14,610 19,625 56,252 52,300
Payable later than 1 year but not later than 5 years 9,414 16,585 32,525 63,41224,024 36,210 88,777 115,712
2012 2011 2012 2011$'000 $'000 $'000 $'000
Future minimum lease receipts under non-cancellableoperating leases for rentals of property, contracted forat balance date, but not recognised as assets:
Not longer than 1 year 3,969 4,256 3,969 4,2566,540 4,996 6,540 4,996
Longer than 5 years 34,240 29,288 34,240 29,28844,749 38,540 44,749 38,540
(iii) CAPITAL COMMITMENTS* 2012 2011 2012 2011Expenditure contracted for at balance date but $'000 $'000 $'000 $'000not recognised in the financial report as liabilities:CAPITALBuildings 4,750 4,509 4,750 4,509Plant and Equipment 1,743 2,476 1,743 2,476
6,493 6,985 6,493 6,985
Buildings - - - -Plant and Equipment 1,352 3,457 1,352 3,457
1,352 3,457 1,352 3,457
7,845 10,442 7,845 10,442
CouncilConsolidated
CouncilConsolidated
Council
Payable within 1 year
Payable within 1 year
Longer than 1 year but no longer than 5 years
(ii) OPERATING LEASE RECEIVABLES
Longer than 1 year but no longer than 5 years
Council's leasing profile comprises of largely crown land. Others in the portfolio include freehold or lease commitments. The Council has a varying number of leases varying from monthly over holding to short term to long term. The rental amounts are either fixed term, some are annual CPI reviews or Market reviews.
*Council capital contract commitments are a combination of fixed and variable over the tender period varying between one and five years.
Longer than 1 year but no longer than 5 years
Payable within 1 year
Consolidated
Longer than 1 year but no longer than 5 years
147
MELBOURNE CITY COUNCIL Notes to the financial statements For the year ended 30 June 2012 Note 19. Contingent Assets and Liabilities
(a) Contingent Liabilities
Melbourne City Council and the State Government of Victoria have indemnified, in equal shares, Regent Management Company Pty Ltd against any liability, loss or expense incurred or suffered by the Company. Over the financial year, no calls on this indemnity were made. Melbourne City Council, as a once-off arrangement, agrees to act as guarantor for Fencing Victoria’s loan of $222,000 for their capital contribution towards the State High Performance Centre, which will be completed as part of the Arden Street redevelopment. Over the financial year, no calls on this indemnity were made.
148

MELBOURNE CITY COUNCIL Notes to the financial statements For the year ended 30 June 2012 Note 20. Defined Benefits Superannuation Funds
Council made contributions to the following funds:
2012$'000
2011$'000
209 183
1,400 -1,609 183
Net Investment Return 7.50% p.a.Salary Inflation 4.25% p.a.Price Inflation 2.75% p.a.
The Local Authorities Superannuation Fund latest 31 December 2011 actuarial investigation identified an unfunded liability of $406 million, excluding the contributions tax in the defined benefit fund of which Council is a member. Council was made aware of the expected short fall through the year and was informed formally of their share of the short fall on 2 August 2012 which amounted to $1.2 million, plus contributions tax of $0.2 million. Council has accounted for this short fall in the Comprehensive Income Statement and in the Balance Sheet liabilities.
The City of Melbourne and controlled entities makes contributions to two defined benefits plans that provide pension benefits for employees upon retirement, as set out below:
- 9.25% of members' salaries (same as previous year); and
- the difference between resignation and retrenchment benefits paid to any retrenched employees, plus contribution tax (same as previous year).
The Fund surplus or deficit (i.e. the difference between fund assets and liabilities) is calculated differently for funding purposes (i.e. calculating requiredcontributions) and for the calculation of accrued benefits as required in AAS 25 to provide the values needed for the AASB 119 disclosure in the council's financial statements. AAS 25 requires that the present value of the defined benefit liability be calculated based on benefits that have accrued in respect ofmembership of the plan up to the measurement date, with no allowance for future benefits that may accrue.
Local Authorities Superannuation Fund ("LASF") Defined Benefit Plan
The LASF's Defined Benefit Plan is a multi-employer sponsored plan. As the Plan's assets and liabilities are pooled and are not allocated by employer,the Actuary is unable to reliably allocate benefit liabilities, assets and costs between employers. As provided under paragraph 30 of AASB 119 EmployeeBenefits , The City of Melbourne does not use defined benefit accounting for these contributions, and instead accounts for these as if the fund was adefined contributions fund.
The City of Melbourne makes employer contributions to the defined benefit category of the LASF at rates determined by the Trustee on the advice of thefund's actuary. On the basis of the results of the most recent full actuarial investigation conducted by the fund's actuary as at 31 December 2011, the Cityof Melbourne makes the following contributions:-
The financial assumptions used to calculate the Accrued Benefits for the defined benefit category of the LASF were:
Defined benefit fundsEmployer contributions to Local Authorities Superannuation Funds (Vision Super)
Employer contributions payable to the Local Authorities Superannuation (Vision Super) at reporting date.
149

MELBOURNE CITY COUNCIL Notes to the financial statements For the year ended 30 June 2012 Note 20 Defined Benefits Superannuation Funds (continued)
2012$'000
2011$'000
Amount included in 'superannuation expense - contribution funds' in profit or loss in respect of the CMSSP (4) 272
2012$'000
2011$'000
Present value of plan assets (52,812) (57,412)Present value of obligations 69,099 64,116Contributions tax 2,874 1,183(Surplus)/deficit in the plan 19,161 7,887
Plan assets comprise:Equity securities 23,332 24,272Government bonds - -Debt instruments 4,197 8,012Property 7,556 7,907Other 17,727 17,221
52,812 57,412
Movements in the present value of the defined benefit obligations:Defined benefit obligation at 1 July 64,116 64,956Current service cost 2,403 2,470Interest cost 2,756 2,728Benefits paid by the plan (6,854) (4,767)Actuarial (gain)/loss in other comprehensiveincome 6,678 (1,271)Defined benefit obligation at 30 June 69,099 64,116
Melbourne City Council Superannuation Sub Plan ("CMSSP")
The CMSSP is a multi-employer sponsored plan where the majority of members are employees of the Cityof Melbourne and its subsidiaries. As the Plan's assets and liabilities are pooled and are not allocated byemployer, the Actuary is unable to reliably allocate benefit liabilities, assets and costs between the City ofMelbourne and its subsidiaries. As provided under paragraph 30 of AASB 119 Employee Benefits , theCouncil (parent entity) does not use defined benefit accounting for these contributions in its separatefinancial statements, and instead accounts for these as if the fund was a defined contributions fund.However, as the majority of the members in CMSSP are employees of the consolidated entity, the fund isaccounted for as a defined benefits plan at the consolidated level.
Consolidated
Council
150
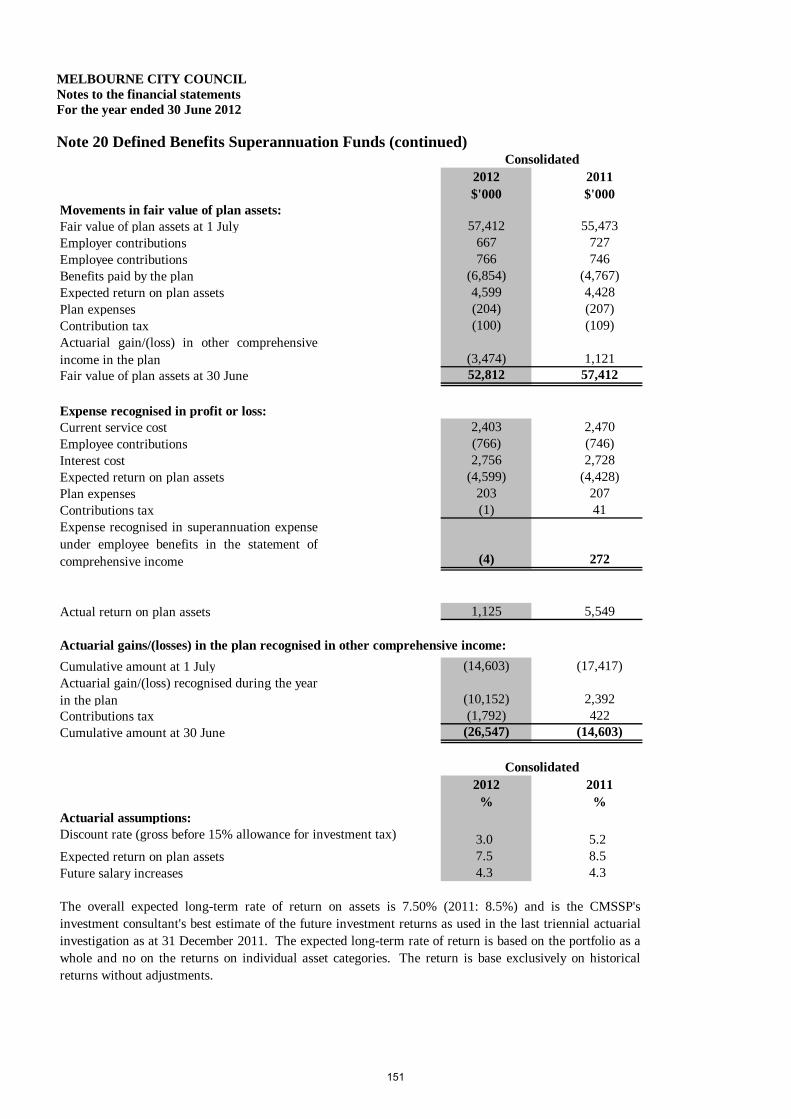
MELBOURNE CITY COUNCIL Notes to the financial statements For the year ended 30 June 2012 Note 20 Defined Benefits Superannuation Funds (continued)
2012$'000
2011$'000
Movements in fair value of plan assets:Fair value of plan assets at 1 July 57,412 55,473Employer contributions 667 727Employee contributions 766 746Benefits paid by the plan (6,854) (4,767)Expected return on plan assets 4,599 4,428Plan expenses (204) (207)Contribution tax (100) (109)Actuarial gain/(loss) in other comprehensiveincome in the plan (3,474) 1,121Fair value of plan assets at 30 June 52,812 57,412
Expense recognised in profit or loss:Current service cost 2,403 2,470Employee contributions (766) (746)Interest cost 2,756 2,728Expected return on plan assets (4,599) (4,428)Plan expenses 203 207Contributions tax (1) 41Expense recognised in superannuation expenseunder employee benefits in the statement ofcomprehensive income (4) 272
Actual return on plan assets 1,125 5,549
Cumulative amount at 1 July (14,603) (17,417)Actuarial gain/(loss) recognised during the yearin the plan (10,152) 2,392Contributions tax (1,792) 422Cumulative amount at 30 June (26,547) (14,603)
2012%
2011%
Actuarial assumptions:
3.0 5.2Expected return on plan assets 7.5 8.5Future salary increases 4.3 4.3
The overall expected long-term rate of return on assets is 7.50% (2011: 8.5%) and is the CMSSP'sinvestment consultant's best estimate of the future investment returns as used in the last triennial actuarialinvestigation as at 31 December 2011. The expected long-term rate of return is based on the portfolio as awhole and no on the returns on individual asset categories. The return is base exclusively on historicalreturns without adjustments.
Actuarial gains/(losses) in the plan recognised in other comprehensive income:
Consolidated
Discount rate (gross before 15% allowance for investment tax)
Consolidated
151

MELBOURNE CITY COUNCIL Notes to the financial statements For the year ended 30 June 2012 Note 20 Defined Benefits Superannuation Funds (continued)
2012 2011 2010 2009 2008Historical information:Present value of the defined benefits obligation 69,099 64,116 64,956 63,551 63,120Contributions tax 2,874 1,183 1,674 1,553 (568)Fair value of plan assets 52,812 57,412 55,473 54,750 66,337(Surplus)/deficit in the plan 19,161 7,887 11,157 10,354 (3,785)
A liability of $19.2 million has been incurred in the consolidated entity of City of Melbourne for the City of Melbourne defined benefit plan based on accounting treatment specified in AASB 119. For the purposes of AASB 119 the consolidated liability is calculated using the long term government bond rate of 3.04%. This can be and is different to the investment rate of 7.5% used for calculating a call on Council. The difference in assumption does not change the funding call amount that Council has been advised. Based on actuarial investigation conducted on City Of Melbourne defined benefit plan as at 31 December 2011 it was determined that a funding shortfall existed and payable to the fund.
The consolidated entity expects $797,056 in contributions to be paid to the CMSSP for the year ending 30 June 2013 ( for year ended 30 June 2012: $766,400).
2012$'000
2011$'000
2012$'000
2011$'000
Current 9,812 - 9,812 -Non-Current 9,349 7,887 - -
19,161 7,887 9,812 0
Net Liability of City of Melbourne Defined Benefits Superannuation Plan
CouncilConsolidated
152

MELBOURNE CITY COUNCIL Notes to the financial statements For the year ended 30 June 2012 Note 21. Related party transactions
Lord Mayor Robert Doyle Cathy OkeDeputy Lord Mayor Susan Riley Brian ShanahanCarl Jetter Ken OngKevin Louey Jackie Watts (elected 19 July 2011)Jennifer Kanis Peter Clarke (retired 7 July 2011)
Chief Executive OfficerKathy Alexander
(b) Remuneration of Responsible Persons in bands of $ 20,0002012 2011
Income Range No. No.$0,000 - $19,999 1 -$20,000 - $39,999 1 -$40,000 - $59,999 3 7$60,000 - $79,999 3 -$100,000 - $119,999 - 1$120,000 - $139,999 1 -$160,000 - $179,999 1 1$380,000 - $399,999 1 1
11 10
2012 2011$'000 $'000
1,051 1,016
(c) Senior Officers' RemunerationThe number of Senior Officers, other than the Responsible Persons, whose total remuneration exceeded$127,000 during the financial year, are shown below in their relevant income bands:
2012 2011Income Range $'000 $'000$127,000 - $139,999 14 15$140,000 - $159,999 14 18$160,000 - $179,999 13 10$180,000 - $199,999 7 4$200,000 - $219,999 2 4$240,000 - $259,999 - 2$260,000 - $279,999 1 1$280,000 - $299,999 1 1$300,000 - $319,999 2 2$320,000 - $339,999 - 1$340,000 - $359,999 1 -
55 58
2012 2011$'000 $'000
9,461 9,920
(a) Names of persons holding the position of a Responsible Person at the Melbourne City Council during the financial year were:Councillors
Total Remuneration for the financial year for Responsible Persons included above, amounted to:
Total Remuneration for the financial year for Senior Officers included above, amounted to:
153

MELBOURNE CITY COUNCIL Notes to the financial statements For the year ended 30 June 2012 Note 21. Related party transactions (continued)
(d) No retirement benefits were paid by the Council in connection with the retirement of Responsible Persons during the
financial year or in the previous financial year. (e) Other Transactions
Other related party transactions requiring disclosure this financial year have been considered and there are no matters to report. There were no matters to report in the previous financial year.
(f) Wholly-Owned Group
Melbourne City Council is the ultimate parent entity in the wholly-owned group. Transactions with the controlled entities, Citywide Service Solutions Pty Ltd and its subsidiaries, Queen Victoria Market Pty Ltd, Melbourne Wholesale Fish Market Pty Ltd and Sustainable Melbourne Fund Trust during the year comprised of the following: provision of accounting and administration services, property rental, contract sales, purchases of raw materials and plant and equipment and in accordance with the Tax Equivalence Policy, the receipt of payments which included tax equivalents for income tax, and payroll tax where applicable. These transactions were made on normal commercial terms and conditions and at market rates. All subsidiaries are established and are resident in Australia.
154

MELBOURNE CITY COUNCIL Notes to the financial statements For the year ended 30 June 2012 Note 22. Financial Instruments Accounting Policy, terms and conditions
Financial Instruments
Note Accounting Policy Terms and Conditions
Interest is recognised as it accrues.Investments and bills are valued at cost.Investments are held to maximise interest returnsof surplus cash.Fixed interest securities are valued at fair value.
Sundry Debtors 5 Receivables are carried at nominal amounts dueless any provision for doubtful debts. A provisionfor doubtful debts is recognised when collection infull is no longer probable. Collectability of overdueaccounts is assessed on an ongoing basis.
Trade debtors are unsecured. Credit terms are based on30 days from date of invoice.
Investments for the Council include all whollyowned subsidiaries, wholly controlled trust of theCouncil and associated entities.Investments the consolidated entity includesinterests in other entities and associated entities.
The bank o/draft is secured with a 1st ranking fixed andfloating charge.The Bill Acceptance/Discount facility is secured with a1st ranking fixed and floating charge.The weighted average interest rate for borrowings is4.38% in 2011-12, compared with 3.83% in 2010-11.
COUNCIL: The Melbourne City Council has noborrowings.No defaults or breaches of any loan/debt facilityarrangements involving Council or its consolidatedgroup occurred during the financial year ended 30 June2012.
Borrowings are carried at their principal amounts,which represent the present value of future cashflows associated with the servicing of debt. Interestis recognised as an expense as it is incurred.
COUNCIL: On call deposits returned a floating interestrate of 3.50% (4.35% in 2010/2011).
17 COUNCIL: Transferrable Certificates of depositprovided return of 5.45% (6.38% in 2010/2011)excluding unrealised gains/losses
7 Investments in other entities are valued at historicalcost.
17 Cash on hand, cash at bank and money market callaccount are valued at face value.
Financial Assets
Bank Bills, Negotiable and Transferrable Certificates of Deposits and Fixed Interest
Liabilities are recognised for amounts to be paid inthe future for goods and services provided toCouncil as at balance date whether or not invoiceshave been received.
Investments
Financial LiabilitiesTrade Creditors are unsecured, not subject to interestcharges and are normally settled within 30 days fromdate of invoice.
Cash and cash equivalents
Borrowings
Trade and other payables
12
155

MELBOURNE CITY COUNCIL Notes to the financial statements For the year ended 30 June 2012 Note 22. Financial Instruments (continued) (a) Interest rate risk
(i) The consolidated entity's exposure to interest rate risk, repricing maturities and effective weighted average interest rates on financial instruments at balance date is set out below:
2012 2011 2012 2011 2012 2011 2012 2011 2012 2011% % $ '000 $ '000 $ '000 $ '000 $ '000 $ '000 $ '000 $ '000
Financial AssetsCash 3.21% 4.29% 5,253 4,225 - - 79 78 5,332 4,303Short term deposits 5.42% 6.09% - - 128,164 160,671 - - 128,164 160,671Bank Bills & TCD's 5.45% 6.38% 15,000 4,000 - - - - 15,000 4,000Sundry debtors - - - - 33,485 35,009 33,485 35,009Investment in unlisted entities - - - - 3,026 3,026 3,026 3,026Total Financial Assets 20,253 8,225 128,164 160,671 36,590 38,113 185,007 207,009
Financial LiabilitiesTrade creditors - - - - 27,107 23,142 27,107 23,142Deposits & retentions - - - - 3,865 3,765 3,865 3,765Borrowings 4.83% 3.83% 10,500 7,000 - - - - 10,500 7,000Total Financial Liabilities 10,500 7,000 - - 30,972 26,907 41,472 33,907
Net financial assets/(liabilities) 9,753 1,225 128,164 160,671 5,618 11,206 143,535 173,102
Totalbearing1 year or lessrate % Interest rate
Average Fixed InterestRate Maturities
Weighted
Floating
(ii) The Council's exposure to interest rate risk, repricing maturities and effective weighted average interest rates on financial instruments at balance date is set out below:
Non interest Interest
156
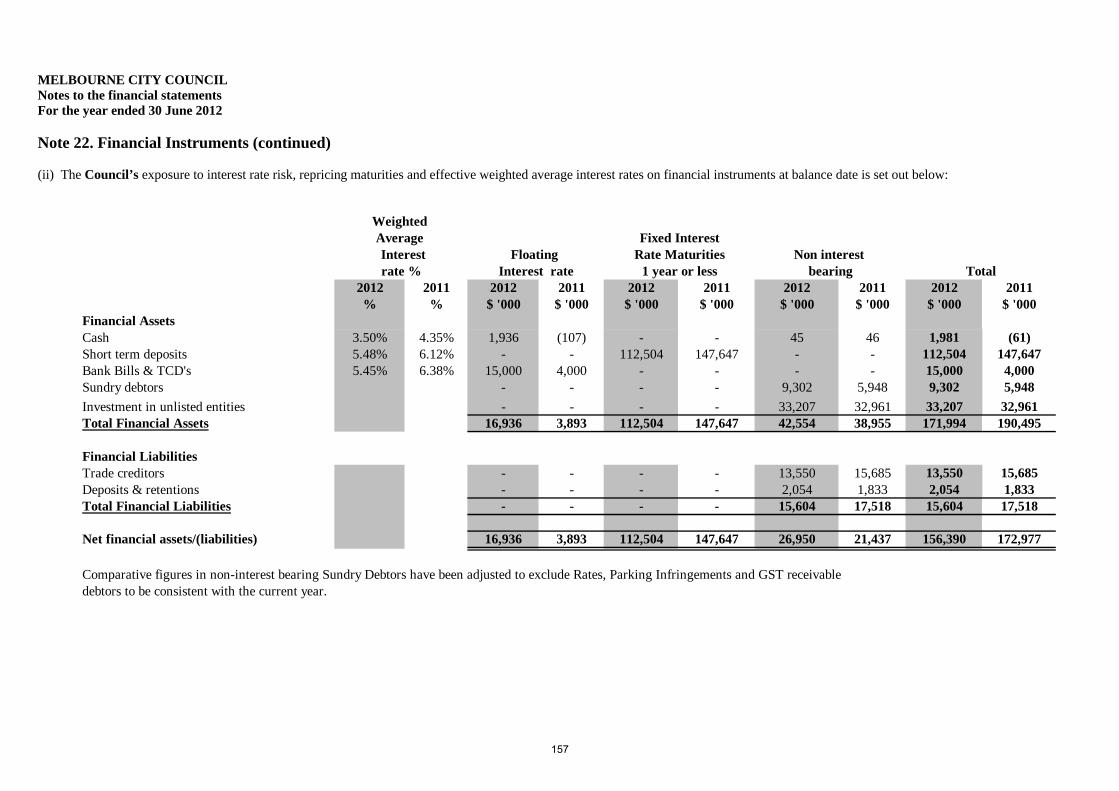
MELBOURNE CITY COUNCIL Notes to the financial statements For the year ended 30 June 2012 Note 22. Financial Instruments (continued) (ii) The Council’s exposure to interest rate risk, repricing maturities and effective weighted average interest rates on financial instruments at balance date is set out below:
2012 2011 2012 2011 2012 2011 2012 2011 2012 2011% % $ '000 $ '000 $ '000 $ '000 $ '000 $ '000 $ '000 $ '000
Financial AssetsCash 3.50% 4.35% 1,936 (107) - - 45 46 1,981 (61)Short term deposits 5.48% 6.12% - - 112,504 147,647 - - 112,504 147,647Bank Bills & TCD's 5.45% 6.38% 15,000 4,000 - - - - 15,000 4,000Sundry debtors - - - - 9,302 5,948 9,302 5,948
Investment in unlisted entities - - - - 33,207 32,961 33,207 32,961Total Financial Assets 16,936 3,893 112,504 147,647 42,554 38,955 171,994 190,495
Financial LiabilitiesTrade creditors - - - - 13,550 15,685 13,550 15,685Deposits & retentions - - - - 2,054 1,833 2,054 1,833Total Financial Liabilities - - - - 15,604 17,518 15,604 17,518
Net financial assets/(liabilities) 16,936 3,893 112,504 147,647 26,950 21,437 156,390 172,977
rate % Interest rate 1 year or less bearing Total Interest Floating Rate Maturities Non interest Average Fixed Interest
Comparative figures in non-interest bearing Sundry Debtors have been adjusted to exclude Rates, Parking Infringements and GST receivable debtors to be consistent with the current year.
Weighted
157

MELBOURNE CITY COUNCIL Notes to the financial statements For the year ended 30 June 2012 Note 22. Financial Instruments (continued) (b) Reconciliation of net financial assets to net assets
2012 2011 2012 2011$ '000 $ '000 Note $ '000 $ '000
Net financial assets as above 143,535 173,102 156,390 172,977
Non financial assets and liabilities: Inventories 436 407 6 - - Intangible Assets 28,255 24,491 10 6,877 6,777 Other assets 28,321 24,287 24,922 26,423 Rate debtors 2,717 2,239 2,717 2,239 Property, Infrastructure, Plant & Equipment 3,193,567 2,958,790 9 3,122,282 2,898,022 Investment Properties 104,718 97,434 104,718 97,434 Net Assets/(Liabilities) Defined Super Fund (19,161) (7,887) (9,812) - Accruals (59,521) (45,835) 12 (45,604) (32,057) Income in advance (3,585) (2,744) 12 (967) (193) Employee Entitlements (40,251) (37,489) 13 (26,422) (25,384) Provisions (1,471) (1,600) 14 (1,149) (1,336) Non Current Payables - (4,282) 12a - (4,282)Net assets per Balance Sheet 3,377,560 3,180,913 3,333,952 3,140,620
CouncilConsolidated
Note: Refer to note 5 page 18 for detail on Trade Debtors, Provisions and Bad Debts. (c) Net fair values The carrying amounts of all financial assets and liabilities are a reasonable approximation of their fair value due to the short-term to their maturity
158

MELBOURNE CITY COUNCIL Notes to the financial statements For the year ended 30 June 2012
Note 22. Financial Instruments (continued) (d) Credit Risk Exposures The credit risk on financial assets of the economic entity which have been recognised in the Balance Sheet is generally the carrying amount, net of any provisions for doubtful debts. (e) Risks and mitigation The risks associated with Council’s main financial instruments and Council’s policies for minimising these risks are detailed below. Market risk Market risk is the risk that the fair value or future cash flows of our financial instruments will fluctuate because of changes in market prices. The Council's exposures to market risk are primarily through interest rate risk with only insignificant exposure to other price risks and no exposure to foreign currency risk. Components of market risk to which we are exposed are discussed below. Interest rate risk Interest rate risk refers to the risk that the value of a financial instrument or cash flows associated with the instrument will fluctuate due to changes in market interest rates. Interest rate risk arises from interest bearing financial assets and liabilities that we use. Non derivative interest bearing assets are predominantly short term liquid assets. Our interest rate liability risk is limited to our subsidiary company’s Citywide Service Solutions Pty Ltd borrowings. Council has no direct borrowings. Our subsidiary company Citywide Service Solutions Pty Ltd has a borrowing and overdraft facility which has been arranged with a major Australian bank. Our subsidiary company manages the interest rate risk by: - ensuring access to diverse sources of funding; - an ongoing review or borrowing levels; and - having a limit imposed on the maximum borrowing amount allowed by Council. Investment of surplus funds is made with approved financial institutions under the Local Government Act 1989. We manage interest rate risk by adopting an investment policy that ensures: - conformity with State and Federal regulations and standards, - adequate safety, - appropriate liquidity, - diversification by credit rating, financial institution and investment product, - monitoring of return on investment, - benchmarking of returns and comparison with budget. Maturity will be staggered to provide for interest rate variations and to minimise interest rate risk. Credit risk Credit risk is the risk that a contracting entity will not complete its obligations under a financial instrument and cause us to make a financial loss. We have exposure to credit risk on all financial assets included in our balance sheet. To help manage this risk: - Melbourne City Council have a policy for establishing credit limits for the entities we deal with; - Melbourne City Council may require collateral where appropriate; and - Melbourne City Council only invests surplus funds with financial institutions which have a recognised credit rating specified in our Treasury policy. Trade and other receivables consist of a large number of customers, spread across the consumer, business and government sectors. Credit risk associated with the Council's financial assets is minimal because the main debtor is the Victorian Government and other Councils. Apart from the Victorian Government and Councils we do not have any significant credit risk exposure to a single customer or groups of customers. Ongoing credit evaluation is performed on the financial condition of our customers and, where appropriate, an allowance for doubtful debts is raised. The aging of receivables has been disclosed in Note 5. (f) Borrowings With respect to borrowings at Citywide Service Solutions Pty Ltd the following should be noted. The bank overdraft facility is a secured facility. In February 2012 the Bill Acceptance and Discount Facility was increased. This facility is also a secured facility. There is a 1st ranking fixed and floating charge. The bank facilities may be drawn at any time and may be terminated by the bank subject to default under the loan agreement. Subject to the continuance of satisfactory covenant achievement, the bank facilities may be drawn at any time. The facilities expire on the 30 September 2013. 159

MELBOURNE CITY COUNCIL Notes to the financial statements For the year ended 30 June 2012 Note 22. Financial Instruments (continued) Melbourne City Council may also be subject to credit risk for transactions which are not included in the balance sheet, such as when we provide a guarantee for another party. Details of our contingent liabilities are disclosed in note 19. Liquidity risk Liquidity risk includes the risk that, as a result of our operational liquidity requirements: - Melbourne City Council will not have sufficient funds to settle a transaction on the date; - Melbourne City Council will be forced to sell financial assets at a value which is less than what they are worth; or - Melbourne City Council may be unable to settle or recover financial assets at all. To help reduce these risks Melbourne City Council: - have a liquidity policy which targets a minimum and average level of cash and cash equivalents to be maintained; - have a liquidity portfolio structure that requires surplus funds to be invested within various bands of liquid instruments; - monitor budget to actual performance on a regular basis; and - Council has no direct borrowings The Consolidated Entity’s exposure to liquidity risk is deemed insignificant given our high levels of cash and cash equivalents and Citywide Service Solutions Pty Ltd borrowings and our current assessment of risk. The table below lists the contractual maturities for Financial Liabilities. These amounts represent undiscounted gross payments including both principal and interest amounts. Consolidated
2012 6 mths 6-12 1-2 2-5 >5 Contracted Carryingor less months years years years Cash Flow Amount
$'000 $'000 $'000 $'000 $'000 $'000 $'000Trade and other payables 94,078 - - - - 94,078 94,078Trust funds and deposits 2,603 - - - - 2,603 2,603Interest-bearing loans and borrowings
- 10,500 - - - 10,500 10,500
Total financial liabilities 96,681 10,500 - - - 107,181 107,181
Consolidated2011 6 mths 6-12 1-2 2-5 >5 Contracted Carrying
or less months years years years Cash Flow Amount$'000 $'000 $'000 $'000 $'000 $'000 $'000
Trade and other payables 72,986 2,500 - - - 75,486 75,486Trust funds and deposits 2,513 - 4,283 - - 6,796 6,796Interest-bearing loans and borrowings
- 7,000 - - - 7,000 7,000
Total financial liabilities 75,499 9,500 4,283 - - 89,282 89,282
160

MELBOURNE CITY COUNCIL Notes to the financial statements For the year ended 30 June 2012 Note 22. Financial Instruments (continued) Council
2012 6 mths 6-12 1-2 2-5 >5 Contracted Carryingor less months years years years Cash Flow Amount
$'000 $'000 $'000 $'000 $'000 $'000 $'000Trade and other payables 62,175 - - - - 62,175 62,175Trust funds and deposits 1,325 - - - - 1,325 1,325Interest-bearing loans and borrowings
- - - - - - -
Total financial liabilities 63,500 - - - - 63,500 63,500
Council2011 6 mths 6-12 1-2 2-5 >5 Contracted Carrying
or less months years years years Cash Flow Amount$'000 $'000 $'000 $'000 $'000 $'000 $'000
Trade and other payables 47,268 2,500 - - - 49,768 49,768Trust funds and deposits 1,058 - 4,283 - - 5,341 5,341Interest-bearing loans and borrowings
- - - - - - -
Total financial liabilities 48,326 2,500 4,283 - - 55,109 55,109 (f) Sensitivity disclosure analysis
-200 basis points +100 basis points2012 Profit Equity Profit Equity$'000 $'000 $'000 $'000 $'000
ConsolidatedFinancial Assets
148,496 (2,970) (2,970) 1,485 1,485Financial liabilities:
10,500 (210) (210) 105 105
CouncilFinancial Assets
129,485 (2,590) (2,590) 1,295 1,295
+1%
Taking into account past performance, future expectations, economic forecasts, and management's knowledge and experience of the financial markets, the Council believes the following movements are 'reasonably possible' over the next 12 months.
- A parallel shift of + 1% and -2% in market interest rates (AUD) from year end rates.
The table below discloses the impact on net operating result and equity for each category of financial instruments held by the Council at year end, if the above movements were to occur.
Interest rate risk
Interest-bearing loans and borrowings
Cash and cash equivalents
-2 %
Cash and cash equivalents
161

MELBOURNE CITY COUNCIL Notes to the financial statements For the year ended 30 June 2012 Note 23. Financial ratios
2012 2011 2010 2012 2011 2010
(a) Debt Servicing Ratio
Debt servicing cost 630 0.11% 0.13% 0.09% 0 0.00% 0 0
Total revenue 557,658 369,846
To identify the capacity of the Council to service its outstanding debt.
(b) Debt Commitment Ratio
Debt servicing and redemption costs 10,500 5.26% 3.63% 0.55% 0 0.00% 0 0
Rate revenue 199,557 199,557
To identify Council's debt redemption strategy.
(c) Revenue Ratio
Rate revenue 199,557 35.78% 38% 40% 199,557 53.96% 53% 53%
Total revenue 557,658 369,846
To identify Council's dependence on rates.
(d) Debt Exposure Ratio
Total indebtedness 165,461 4.67% 4% 3% 99,558 2.90% 3% 2%Total realisable assets 3,543,021 3,433,510
To identify Council's exposure to debt.
(e) Working Capital Ratio
Current assets 213,455 151.73% 210% 227% 166,426 171.62% 252% 294%Current liabilities 140,682 96,974
For every dollar of current liabilities, Council has $1.54 of current assets as at 30 June 2012.
Consolidated Council
To assess Council's ability to meet current commitments.
Council's ability to meet its Debt servicing cost is extremely strong. When rounded the ratio of revenue to debt is less than 1%
Council's ability to meet its Debt commitment is extremely strong. When rounded the ratio of rate revenue to debt is less than 6.0%
162

MELBOURNE CITY COUNCIL Notes to the financial statements For the year ended 30 June 2012 Note 23. Financial ratios (continued) Definitions
To assess Council's ability to meet current commitments.
For every dollar of current liabilities, Council has $1.52 of current assets as at 30th June 2012. Current assets Total current assets as shown in the Balance Sheet. Current liabilities Total current liabilities as shown in the Balance Sheet. Debt redemption Includes the principal component of repayments on loans and financial leases and capital
items purchased on vendor terms. Debt servicing costs Includes interest and charges on loans, overdrafts and interest on payments for capital items
purchased on vendor terms. Rate revenue Includes revenue from general rates, municipal charges, special rates, special charges,
service rates and service charges. Total indebtedness Total liabilities, both current and non-current, as shown in the Balance Sheet. Total realisable assets Total current assets and total realisable non-current assets. Total revenue Total revenue as shown in the Income Statement.
Note 24. Events occurring after balance date: There are no events that have occurred after balance date that need to be reflected in the Financial Statements.
Note 25. Business Combinations:
(i) Current year
Principal activity - InfrastructureProportion of
shares acquiredConsideration
transferred
Date of acquisition - 31 May 2012 % $'000
AWD Earthmoving Pty Ltd 100 6,243
Details of the preliminary fair value assessment of the assets and liabilities acquired and goodwill are as follows:
Purchase consideration
Cash paid 3,000
Contingent consideration (a) 1,500
Acquisition Value 4,500
Cash payable in consideration of working capital 1,743
Consideration 6,243
Less fair value of net identifiable assets acquired (2,585)
Goodwill 3,658
AWD Earthmoving Pty Ltd was acquired for $4.5m so as to continue the expansion of the Group's Infrastructure activities.
(a) Under the contingent consideration arrangement, Citywide Service Solutions Pty Ltd is required to pay the vendors up to $1.5m for the year ending 30 June 2015. The directors consider it probable that the payment will be made. The amount has been accrued as at the acquisition date.Goodwill arose in the acquisition of AWD Earthmoving Pty Ltd as it includes amounts in relation to revenue growth, future market development and expected synergies with the Group. These benefits are not separately recognised from goodwill because they do not meet the recognition criteria for identifiable intangible assets.None of the goodwill arising on these acquisitions is expected to be deductible for tax purposes.
163

MELBOURNE CITY COUNCIL Notes to the financial statements For the year ended 30 June 2012 Note 25. Business Combinations continued:
Assets and liabilities acquired at 31 May 2012Acquiree's
carrying amountPreliminary fair
value$'000 $'000
Cash & cash equivalents 464 464
Trade and other receivables 2,127 2,127
Deferred income tax equivalent assets 2 2
Plant and Equipment 265 642
Trade and other payables (347) (347)
Current tax equivalent liabilities (296) (296)
Provisions (7) (7)
Net assets acquired 2,208 2,585
Purchase consideration - cash outflow$'000
Consideration paid in cash 3,000
Less: cash and cash equivalent balances acquired (464)
Outflow of cash - Investing activities 2,536
Acquisition related costs
Revenue and profit contribution
(ii) Previous corresponding year
Summary of acquisitions
Sterling Group Services Pty Ltd
At the date of acquisition, the acquired entity's principal activities was the maintenance of Open space areas.During the current financial year the contingent consideration of $1.0m crystallised, became due and payable and settled.There have been no further preliminary value adjustments to these amounts in the current period.
Had the business combination been effected at 1 July 2011, the revenue of the Citywide Service Solutions Pty Ltd from continuing operations would have been $248,437,000, and the profit would have been $10,398,000. The directors of Citywide Service Solutions Pty Ltd consider these 'pro-forma' numbers represent an approximate measure of the performance of the combined group on an annualised basis and to provide a reference point for comparison in future periods.
On 1 January 2011, Citywide Service Solutions Pty Ltd acquired 100% of Sterling Group Services Pty Ltd for a total consideration of $12.065m inclusive of a contingent consideration of $1.0m. Details of the fair values of the assets and liabilities acquired and the goodwill arising are disclosed in the 2011 Citywide Service Solutions Pty Ltd Annual Report.
The receivables acquired (which comprised of trade receivables $436,000, other receivables of $1,681,000 and other current assets of $10,000) had a fair value of $2,127,000. The trade receivables had a gross contractual value of $436,000. For the receivables, the best estimate at acquisition date, was that all of the contracted cash flows would be collected.
Acquisition related costs of $83,000 have been excluded from the consideration transferred and have been recognised as an expense in the year in the Consolidated Statement of Comprehensive Income.
Included in Councils subsidiary profit for the year is $88,000 derived from AWD Earthmoving Pty Ltd. Revenue for the year includes $231,000 derived from AWD Earthmoving Pty Ltd. The revenue derived for the one months trading by AWD Earthmoving Pty Ltd related to Citywide Service Solutions Pty Ltd , and the revenue and profit were eliminated for Citywide Service Solutions Pty Ltd's purposes.
164

165
166
167

melbourne.vic.gov.au