Annual Report 2010 - AnnualReports.com
228
Annual Report 2010
-
Upload
khangminh22 -
Category
Documents
-
view
0 -
download
0
Transcript of Annual Report 2010 - AnnualReports.com

Annual Report 2010Validus H
oldings, Ltd. Annual R
eport 2010
www.validusholdings.com

Validus Group offers a broad range of innovative insurance and reinsurance solutions, with a particular emphasis on short-tail lines of business.
The paper in this report comprises of 100% (FSC) recycled fibres sourced entirely from post consumer waste.
Designed and produced by The College www.thecollege.uk.com
01
Annual Report 2010 Validus
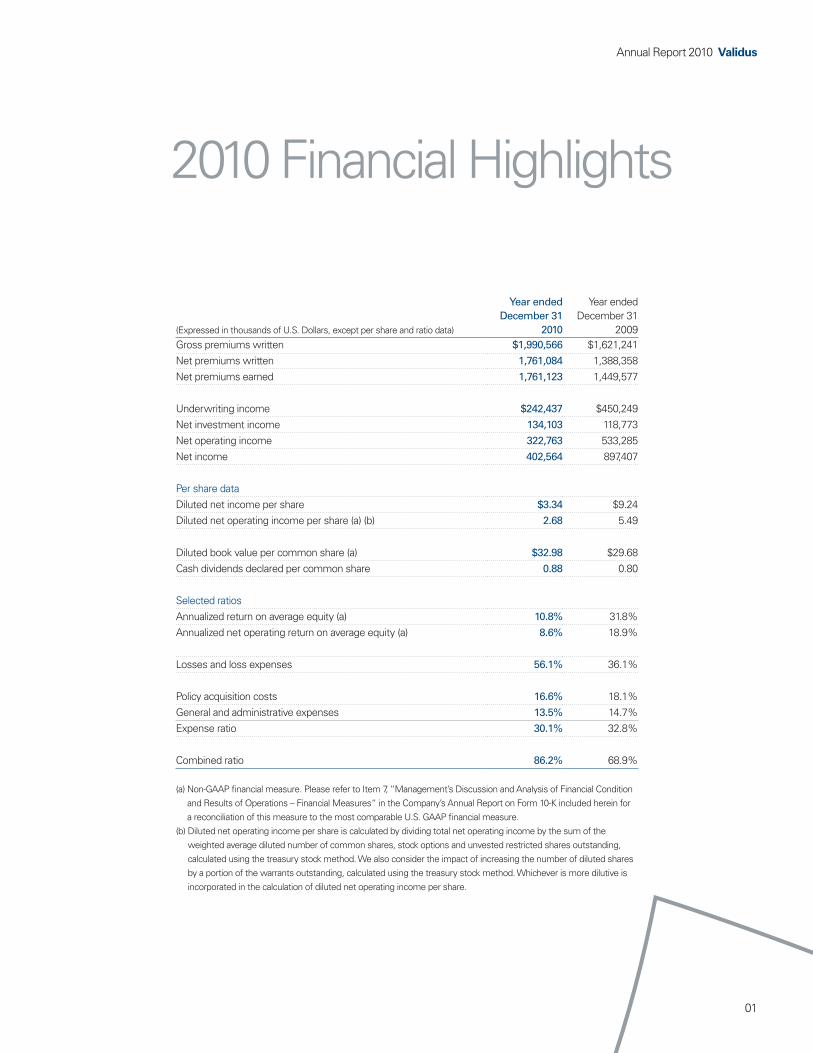
2010 Financial Highlights
(Expressed in thousands of U.S. Dollars, except per share and ratio data)
Year endedDecember 31
2010
Year endedDecember 31
2009Gross premiums written $1,990,566 $1,621,241Net premiums written 1,761,084 1,388,358Net premiums earned 1,761,123 1,449,577
Underwriting income $242,437 $450,249Net investment income 134,103 118,773Net operating income 322,763 533,285Net income 402,564 897,407
Per share dataDiluted net income per share $3.34 $9.24 Diluted net operating income per share (a) (b) 2.68 5.49
Diluted book value per common share (a) $32.98 $29.68Cash dividends declared per common share 0.88 0.80
Selected ratiosAnnualized return on average equity (a) 10.8% 31.8%Annualized net operating return on average equity (a) 8.6% 18.9%
Losses and loss expenses 56.1% 36.1%
Policy acquisition costs 16.6% 18.1%General and administrative expenses 13.5% 14.7%Expense ratio 30.1% 32.8%
Combined ratio 86.2% 68.9% (a) Non-GAAP financial measure. Please refer to Item 7, “Management’s Discussion and Analysis of Financial Condition
and Results of Operations – Financial Measures“ in the Company’s Annual Report on Form 10-K included herein for a reconciliation of this measure to the most comparable U.S. GAAP financial measure.
(b) Diluted net operating income per share is calculated by dividing total net operating income by the sum of the weighted average diluted number of common shares, stock options and unvested restricted shares outstanding, calculated using the treasury stock method. We also consider the impact of increasing the number of diluted shares by a portion of the warrants outstanding, calculated using the treasury stock method. Whichever is more dilutive is incorporated in the calculation of diluted net operating income per share.

Bold decisions...
Our progress is made by making bold decisions that are strategic, informed and timely.
Validus Annual Report 2010
02
03
Annual Report 2010 Validus
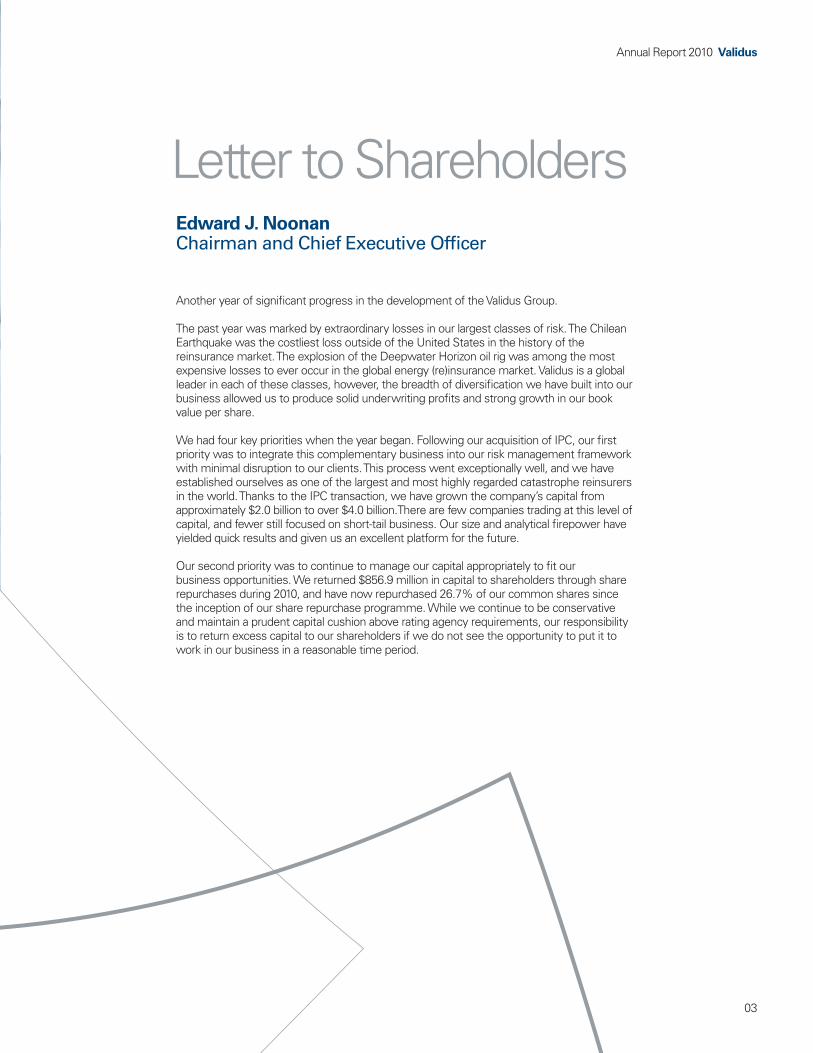
Edward J. NoonanChairman and Chief Executive Officer
Letter to Shareholders
Another year of significant progress in the development of the Validus Group. The past year was marked by extraordinary losses in our largest classes of risk. The Chilean Earthquake was the costliest loss outside of the United States in the history of the reinsurance market. The explosion of the Deepwater Horizon oil rig was among the most expensive losses to ever occur in the global energy (re)insurance market. Validus is a global leader in each of these classes, however, the breadth of diversification we have built into our business allowed us to produce solid underwriting profits and strong growth in our book value per share.
We had four key priorities when the year began. Following our acquisition of IPC, our first priority was to integrate this complementary business into our risk management framework with minimal disruption to our clients. This process went exceptionally well, and we have established ourselves as one of the largest and most highly regarded catastrophe reinsurers in the world. Thanks to the IPC transaction, we have grown the company’s capital from approximately $2.0 billion to over $4.0 billion.There are few companies trading at this level of capital, and fewer still focused on short-tail business. Our size and analytical firepower have yielded quick results and given us an excellent platform for the future. Our second priority was to continue to manage our capital appropriately to fit our business opportunities. We returned $856.9 million in capital to shareholders through share repurchases during 2010, and have now repurchased 26.7% of our common shares since the inception of our share repurchase programme. While we continue to be conservative and maintain a prudent capital cushion above rating agency requirements, our responsibility is to return excess capital to our shareholders if we do not see the opportunity to put it to work in our business in a reasonable time period.

04
Validus Annual Report 2010
Letter to Shareholders (continued)
The third priority in 2010 was managing our underwriting operations in an increasingly competitive market. While rates continue to be broadly adequate in the classes we underwrite, risk selection and the willingness to walk away from risks that do not meet our return criteria become more important in this environment. We performed very well on this challenge during the year and are facing a similar environment in 2011.
Our fourth priority was to develop our long term strategic positioning. We have expanded our business, particularly in the growth markets of Asia and Latin America. Outside North America and Europe we now have offices in Santiago, Dubai and Singapore. The U.S primary insurance market continues to be excessively competitive and consequently we remain significantly underweight in this territory. We hold the view that the U.S is now unprofitable, and we expect to see opportunities begin to emerge over the next two years as the market moves to a corrective phase. We are completely comfortable sitting on the sidelines until we can reasonably foresee the chance to take risk profitably. Our strengthsAt Validus our key strength is our discipline to put growth in shareholder value above all other goals. We use our pre-eminent risk management expertise to ensure risks are managed accordingly. We now have a global business allowing us to diversify our risk taking by product and territory. This diversification helps us to manage and reduce volatility, as we did in 2010. Fundamentally, our success comes from the knowledge and expertise of our underwriters, actuaries, risk analysts, and claims teams. We give our frontline underwriters the best possible analytic technology to respond to market opportunities and manage risk. We have made a significant investment in our geoscience research and risk analysis team in Waterloo, Canada. This gives us a competitive advantage through superior data and insight which we provide to our underwriters in real time. This makes us more valuable to intermediaries and allows us to take on risk with transparency and clarity.
05
Annual Report 2010 Validus
Letter to Shareholders (continued)
Our greatest strength is our ability to attract extraordinarily talented people from all over the world to help us build our business. We are in a knowledge business, and the competition for talent is intense. We have developed an outstanding group of deeply talented professionals. Most importantly, we have been able to retain this talented group and harness them toward providing risk management solutions for our clients and for our company. Jeff Consolino took over from George Reeth as President of Validus Holdings, Ltd. on November 15, 2010. Jeff will continue to serve as the Chief Financial Officer of Validus, the position he has held since 2006. Jeff has been an outstanding leader and valued partner in guiding our successful growth and development over the past five years. I would like to thank George for his leadership and dedication to Validus since the company’s formation in 2005. Our broad success would not have been possible were it not for George, and we wish him well in what will no doubt be successful future endeavors. We have had a very successful first five years as a company. We now have the scale and scope of operations to participate in any classes of business that hold opportunity. We are well positioned for the future, and I can’t wait to see what we can accomplish over the next five years.
Edward J. NoonanChairman and Chief Executive Officer

Five Year Financial Review2010 marks the fifth year of operations for Validus – five years of remarkable growth for the Company and its shareholders.
2006 2007 2008 2009 2010
$540.8
$988.6
$1,362.5
$1,621.2
$1,990.6
Gross Premium Written (Dollars in millions)
2006 2007 2008 2009 2010
$53.1
$897.4
$402.6
Cumulative Net Income (Dollars in millions)
$183.1
$403.0
Validus Annual Report 2010
06
07
Annual Report 2010 Validus
Five Year Financial Review(continued)
2005 20072006 2008 2009 2010
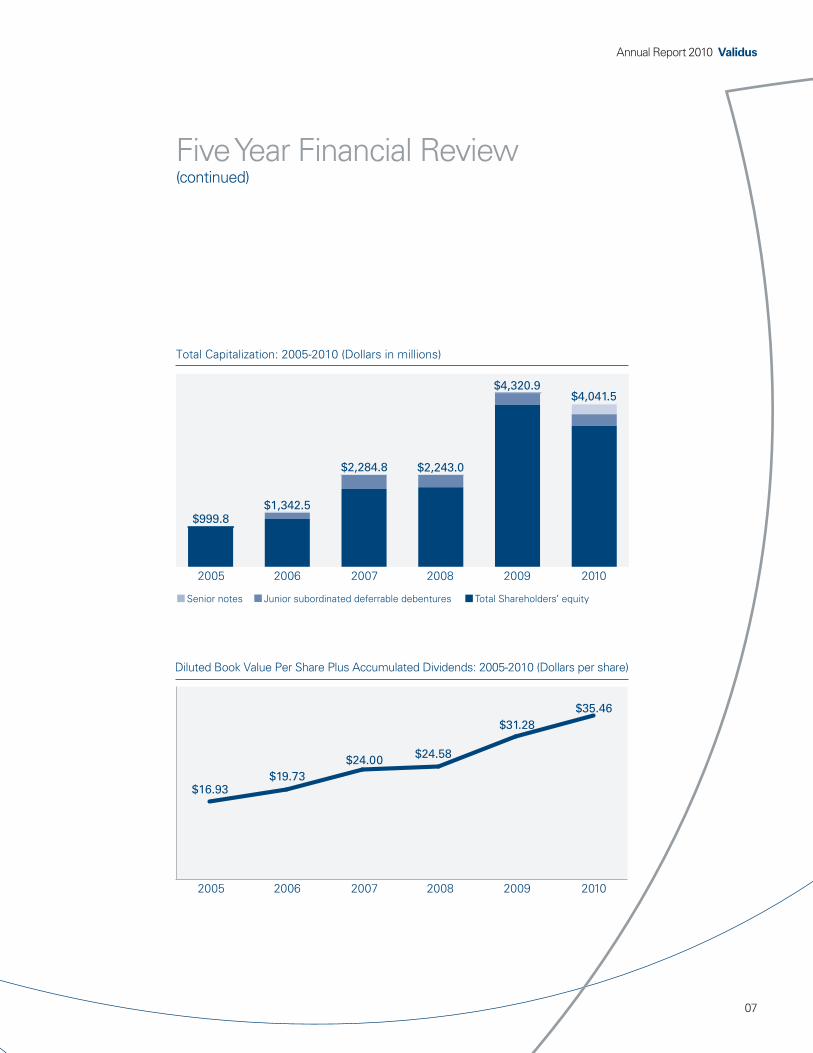
$2,243.0
$4,320.9$4,041.5
Total Capitalization: 2005-2010 (Dollars in millions)
$1,342.5$999.8
$2,284.8
Senior notes Total Shareholders’ equityJunior subordinated deferrable debentures
2005 2006
Diluted Book Value Per Share Plus Accumulated Dividends: 2005-2010 (Dollars per share)
2007 2008 2009 2010
$16.93$19.73
$24.00 $24.58
$31.28$35.46

Bold decisions...
We raised substantial capital in response to significant business opportunities. In 2010, we have been just as aggressive returning it.
Our primary financial objective is to grow diluted book value per share plus accumulated dividends at a superior rate for our shareholders. Capital management and our conservative balance sheet, along with strong operating performance, have permitted an enviable growth record for our shareholders.
08
Validus Annual Report 2010
09
Annual Report 2010 Validus
Capital Management
Jeff Consolino President and Chief Financial Officer
Capital management philosophyWe intend to actively manage our capital by evaluating the returns available in the short-tail insurance and reinsurance lines, assessing returns in complementary lines of business and, where appropriate and subject to applicable law, rating agency and other considerations, returning excess capital to shareholders.
Capital formation – 2005 through 2007Since our formation in October 2005, our principal operating objective has been to utilize our capital efficiently by underwriting short-tail insurance and reinsurance contracts with superior risk and return characteristics. We aim to underwrite as much attractively priced business as is available and manage all forms of capital accordingly. In the hard market for catastrophe-exposed lines of reinsurance that existed commencing at the time of our formation, we: – Raised in excess of $1.0 billion in common equity from private investors in our initial 2005
capitalization; – Augmented this capital in 2006 with collateralized retrocessional reinsurance agreements
through a “sidecar” relationship with a newly-formed Bermuda reinsurance company Petrel Re Limited;
– Made prudent use of financial leverage through the placement of $150.0 million of junior subordinated deferrable debentures due 2036 in June 2006 and an additional $200.0 million of junior subordinated deferrable debentures due 2037 in 2007; and
– Completed an initial public offering of our common stock, raising net proceeds of $310.7 million in 2007.

10
Validus Annual Report 2010
AcquisitionsWe have used our capital to make two transformational acquisitions, each consistent with our business strategy. – In July 2007, we acquired all of the outstanding shares of Talbot Holdings Ltd. (“Talbot”).
Talbot is a leading underwriter of a wide range of marine and energy, war, political violence, commercial property, financial institutions, contingency, accident & health and treaty classes of business with a wide geographical spread and is a prominent leader in the war and political violence classes. The Talbot Group underwrites at Lloyd’s of London (“Lloyd’s”) through Syndicate 1183.
– In September 2009, we acquired IPC Holdings Ltd. (“IPC”). The primary lines in which IPC conducted business were property catastrophe reinsurance and, to a limited extent, property-per-risk excess, aviation (including satellite) and other short-tail reinsurance on a worldwide basis. The acquisition of IPC was undertaken to gain a strategic advantage in the then current reinsurance market and increase the company’s capital base.
Protecting our capitalOur balance sheet has been a source of strength for the company. We invest over $5.7 billion in our investment portfolio and in our investment activities we prioritize liquidity and preservation of value first, ahead of total return. We take the turbulent investment market conditions of 2008 as evidence of the wisdom of our approach, as we were able to grow our shareholders equity in that year.
DividendsDividends are an important component of total returns to shareholders. In February 2010, we increased our annual divided by 10% from $0.80 to $0.88 per common share and common share equivalent. A shareholder who has held our shares since our July 2007 IPO has received by December 31, 2010 $2.48 in dividends to complement the $13.09 increase in diluted book value per share over that period. In total, the company has returned $252.1 million to our owners through dividends.
In February 2011, our Board again approved an increase in our quarterly cash dividend to an annual rate of $1.00 per common share and common share equivalent, an increase of 13.6%.
Capital Management (continued)
11
Annual Report 2010 Validus
Returning capital to shareholdersIn November 2009, we determined that we had excess capital after an evaluation of our capital needs, financial condition, revenues, business prospects, cash flows and strategies. We considered a range of possible alternative uses for our excess capital, including retaining all of the capital to provide for future growth or an increased capital cushion, an increase in the ordinary common share dividend, a special dividend payable to all shareholders, open market share repurchases, a tender offer to all shareholders, acquisitions, or a combination of the preceding uses. After determining that repurchase of our shares would be the most desirable use of our excess capital we announced our first ever share repurchase program.
Since we commenced repurchasing our shares in late 2009, we have repurchased an aggregate of 35.0 million shares, returning $947.2 million to our shareholders in the process and retiring 26.7% of the shares outstanding prior to the commencement of our share buying activities. Our share repurchase activities have added $1.41 to diluted book value per common share for the period ended December 31, 2010.
Coupled with our dividends, we have returned $1.19 billion to our shareholders – more than the amount we raised back in 2005 in response to market needs in the aftermath of Hurricanes Katrina, Rita and Wilma. As of December 31, 2010, our consolidated capitalization stands at over $4.0 billion.
Capital Management (continued)
“ Coupled with our dividends, we have returned $1.19 billion to our shareholders.“

Bold decisions...
We integrated IPC to make us a world leader in catastrophe reinsurance.
Validus Re is a global provider of short-tail lines of reinsurance including property, marine and specialty. Headquartered in Bermuda, we have offices in Europe, Latin America and Asia.
12
Validus Annual Report 2010

13
Annual Report 2010 Validus
Conan M. WardChief Executive Officer, Validus Re
A key feature of the year was the rapid integration of IPC, now branded Validus Re. We have grown our capital base, kept our key customers, integrated our systems and tested the scalability of our platform. We are now one of the world’s leading catastrophe reinsurers. This was a major success for the Validus Re team, and we are grateful to our clients and brokers for their support in what was a seamless process.
Financial performanceValidus Re’s gross premiums written for the year ended December 31, 2010 were $1,101.2 million, representing 50.7% of Validus Group’s total writings (after inter-segment eliminations). This was an increase of $333.2 million or 43.4% compared to 2009 gross premiums written of $768.1 million.
Gross premiums written for the year ended December 31, 2010 included $790.6 million of property premiums, $227.1 million of marine premiums and $83.5 million of specialty premiums.
Net premiums earned for the year ended December 31, 2010 were $1,051.2 million compared to $795.6 million for the year ended December 31, 2009, an increase of $255.7 million, or 32.1%.
The loss ratio for the year ended December 31, 2010 was 57.2% compared to 23.5% for the year ended December 31, 2009, an increase of 33.7 percentage points. The loss ratio for the year ended December 31, 2010 included losses from notable loss events, which represented 40.7 percentage points of the loss ratio.
The combined ratio for 2010 was 77.5% compared to 48.7% for 2009, an increase of 28.8 percentage points.

14
Validus Annual Report 2010
Validus Re (continued)
Underwriting income for the year ended December 31, 2010 was $236.2 million compared to $408.1 million for the year ended December 31, 2009, a decrease of $171.9 million or 42.1%.
Net income for the year ended December 31, 2010 was $416.5 million compared to $574.7 million for the year ended December 31, 2009, a decrease of $158.2 million or 27.5%. This was a good performance, particularly given the unusually high loss activity in the year, notably the Chilean earthquake and the Deepwater Horizon offshore oil platform incident.
Our strategyOur mission within the group is to provide superior long term returns by delivering customer-focused and appropriately-priced reinsurance solutions using an efficient, cost-effective, and dynamic operating platform. To accomplish this mission we put our customers first. Broker and client satisfaction are the keys to our long term success.
Reinsurance is fundamentally a promise to pay claims in the future, often after very large loss events. The 2010 Chilean Earthquake was one of the most devastating in history. Validus Re distinguished itself through rapid and efficient claims payment, which has enhanced our reputation and reaffirmed our value to our Latin American clients.
We have continued to strengthen our customer relationships, identify new opportunities and extend our global reach. Today we are one of the largest catastrophe reinsurers serving the U.S and Europe and, through our local offices, increasingly in Latin America and Asia. Risk management is the essence of our business and the combined expertise of our underwriters and geophysical science research team using our VCAPS system have distinguished Validus Re as a responsive, creative partner for our customers. This level of analytical insight is also the cornerstone of protecting us from unexpected risk.
Our analytics team in Waterloo, Canada, form our research and development arm to help us better assess catastrophic risk around the globe. Further, they have been a key differentiator for us and provide vital applications and modelling used in our everyday encounters with customers.
Marine and specialty lines complement our property catastrophe reinsurance business. Our regional customers look for a broader product offering and we adapt accordingly, offering multi-line, “bouquet” products. We are able to expand our products where our expertise can add value and command appropriate pricing.

15
Annual Report 2010 Validus
Validus Re (continued)
“ Broker and client satisfaction are the keys to our long term success.”
Our cultureAt Validus Re we are mission-orientated and client-focused. Our business is based on a relatively small number of deeply expert staff, and as a result we are one of the most cost-efficient reinsurers in our competitive space.
Our current structure and teams can manage an increased volume of transactions because we have a very scalable platform. Our underwriters help us focus our resources most appropriately so that we can deliver our products quickly and accurately to our clients.Our management team is organized in a simple and accountable way.
Global footprintOur reinsurance activity is a global enterprise and we recognize that our footprint is not yet complete. We see good opportunities in Latin America. The Asian market is competitive but we have been making steady progress in the region including establishing a Singapore branch. We also have a representative office in Hamburg, which serves as our base for continental Europe.
OutlookWe are well positioned for the future, particularly given the successful integration of IPC. Although we continue to see a robust competitive environment, we are optimistic, particularly given our capacity to maintain excellent customer relationships and deliver valuable solutions to our clients.

Bold decisions...
We take on risk only when and where it is profitable for us to do so.
Operating in the Lloyd’s insurance market through Syndicate 1183, Talbot underwrites a broad range of insurance and reinsurance classes of business and has offices in London and Singapore and representative offices in New York, Chile, Dubai and Miami.
16
Validus Annual Report 2010
17
Annual Report 2010 Validus
C. N. Rupert AtkinChief Executive Officer, Talbot
This was another good year for Talbot as we continue to build our business. Talbot recorded an excellent performance, particularly given the economic environment and the significant catastrophe losses during the year.
Financial performanceTalbot’s gross premiums written for the year ended December 31, 2010 were $981.1 million, representing 49.3% of Validus Group’s total writings. This was an increase of 6.6% compared to 2009 gross premiums written of $919.9 million.
Gross premiums written for the year ended December 31, 2010 included $314.8 million of property premiums, $315.1 million of marine premiums and $351.2 million of specialty premiums.
Net premiums earned for the year ended December 31, 2010 were $709.9 million compared to $654.0 million for the year ended December 31, 2009, an increase of $55.9 million, or 8.5%.
The loss ratio for 2010 was 54.4% compared to 51.5% for the year ended December 31, 2009, an increase of 2.9 percentage points. The loss ratio for the year ended December 31, 2010 included losses from notable loss events which represented 15.3 percentage points of the loss ratio.
The combined ratio for 2010 was 91.7% compared to 88.7% for 2009, an increase of 3.0 percentage points.
Underwriting income for the year ended December 31, 2010 was $59.2 million compared to $73.5 million for the year ended December 31, 2009, a decrease of $14.3 million or 19.5%.
Net income for the year ended December 31, 2010 was $107.1 million compared to $102.2 million for the year ended December 31, 2009, an increase of $4.9 million or 4.8%.
Our strategyOur mission within the group is to achieve attractive returns on capital over the cycle while maintaining a disciplined underwriting approach within the Syndicate’s risk appetite.We aim to allocate capital to the right places at the right time.

Validus Annual Report 2010
Talbot (continued)
We have developed an increasingly diversified portfolio of largely short-tail classes of business across property, marine, aviation and specialty lines with some longer tail exposure in our marine, energy liability and financial institution business.
In common with Validus Re, we avoid building topline growth through discounted pricing and take on business only when and where there is an expectation of appropriate profit.
Our cultureTalbot attracts high quality business by providing brokers and clients with excellent service. This was very much in evidence when we responded quickly with an efficient claims service following the Chilean earthquake.
We place particular importance on attracting and retaining high caliber employees. We try to treat our people well and promote openness and teamwork. We also encourage internal promotion, which motivates people to develop their careers within Talbot. Consequently, we have a very loyal staff.
Global diversificationTalbot uses Lloyd’s security to attract new business and operates underwriting platforms in selected major insurance markets.
We established our Singapore platform in 2007 and set up Validus Reaseguros in Miami in 2008 to operate as a coverholder for Syndicate 1183.
18

19
Annual Report 2010 Validus
Talbot (continued)
“ Talbot attracts high quality business by providing brokers and clients with excellent service.”
In 2009, we formed our Global Technical Lines (GTL) division to serve clients in the onshore energy and complex property sector. The GTL division acts as a coverholder for Syndicate 1183 and its underwriters are based in New York, London and Singapore.
We are now also growing our business in Dubai through Underwriting Risk Services Middle East, our joint venture with Abu Dhabi National Insurance Company.
OutlookWe will continue to maintain a balanced and well-spread portfolio and manage our capital and risk profile prudently.
The new regulatory environment, in particular Solvency II, will require additional resources but will give us a respected and stable platform from which to trade.
The Talbot teams around the world strive to operate in a controlled, disciplined manner and aim to continue to deliver attractive returns on capital.

Validus Annual Report 2010
20
Validus Annual Report 2010

Annual Report 2010 Validus
We have invested substantial resources to ensure that we are at the leading edge of risk analytics. Validus Research is at the heart of this effort and is dedicated to catastrophe research, risk modeling, and the development of analytical tools. These products offer our operating companies’ underwriters, actuaries and management an industry-leading platform for risk assessment and selection. Real-time monitoring of our portfolio, a consistent view of risk measures across the globe, and a rigorous approach to model and data quality truly set us apart from our competition in the market.
Bold decisions...
We developed our real-time risk analysis to set us apart from the competition.
21
Annual Report 2010 Validus

22

23
Form 10-K


UNITED STATES SECURITIES AND EXCHANGE COMMISSIONWashington, D.C. 20549
Form 10-KANNUAL REPORT PURSUANT TO SECTION 13 OR 15(d) OF
THE SECURITIES EXCHANGE ACT OF 1934For the fiscal year ended December 31, 2010
Commission file number 001-33606
VALIDUS HOLDINGS, LTD.(Exact name of registrant as specified in its charter)
BERMUDA 98-0501001(State or other jurisdiction ofincorporation or organization)
(I.R.S. EmployerIdentification No.)
29 Richmond Road, Pembroke, Bermuda HM 08(Address of principal executive offices and zip code)
(441) 278-9000(Registrant’s telephone number, including area code)
Securities registered pursuant to Section 12(b) of the Act:
Title of Each Class: Name of Each Exchange on Which Registered:
Common Shares, $0.175 par value per share New York Stock ExchangeSecurities registered pursuant to Section 12(g) of the Act:
None
Indicate by check mark if the registrant is a well-known seasoned issuer, as defined in Rule 405 of the Securities Act. Yes ¥ No n
Indicate by check mark if the registrant is not required to file reports pursuant to Section 13 or Section 15(d) of theAct. Yes n No ¥
Indicate by check mark whether the registrant: (1) has filed all reports required to be filed by Section 13 or 15(d) of the SecuritiesExchange Act of 1934 during the preceding 12 months (or for such shorter period that the registrant was required to file such reports), and(2) has been subject to such filing requirements for the past 90 days. Yes ¥ No n
Indicate by check mark whether the registrant has submitted electronically and posted on its corporate Web site, if any, everyInteractive Data File required to be submitted and posted pursuant to Rule 405 of Regulation S-T during the preceding 12 months (or forsuch shorter period that the registrant was required to submit and post such files). Yes ¥ No n
Indicate by check mark if disclosure of delinquent filers pursuant to Item 405 of Regulation S-K is not contained herein, and will notbe contained, to the best of registrant’s knowledge, in definitive proxy or information statements incorporated by reference in Part III ofthis Form 10-K or any amendment to this Form 10-K. n
Indicate by check mark whether the registrant is a large accelerated filer, an accelerated filer, a non-accelerated filer, or a smallerreporting company. See the definitions of “large accelerated filer,” “accelerated filer” and “smaller reporting company” in Rule 12b-2 ofthe Exchange Act. (Check one):
Large accelerated filer ¥ Accelerated filer n Non-accelerated filer n Smaller reporting company n
(Do not check if a smaller reporting company)
Indicate by check mark whether the registrant is a shell company (as defined in Rule 12b-2 of the Exchange Act). Yes n No ¥
The aggregate market value of the voting and non-voting common equity held by non-affiliates of the registrant as of June 30, 2010was $1,797.4 million computed upon the basis of the closing sales price of the Common Shares on June 30, 2010. For the purposes of thiscomputation, shares held by directors and officers of the registrant have been excluded. Such exclusion is not intended, nor shall it bedeemed, to be an admission that such persons are affiliates of the registrant.
As of February 16, 2011, there were 97,944,724 outstanding Common Shares, $0.175 par value per share, of the registrant.
DOCUMENTS INCORPORATED BY REFERENCE
Part III incorporates information from certain portions of the registrant’s definitive proxy statement to be filed with the Securitiesand Exchange Commission within 120 days after the fiscal year ended December 31, 2010.
PART I . . . . . . . . . . . . . . . . . . . . . . . . . . . . . . . . . . . . . . . . . . . . . . . . . . . . . . . . . . . . . . . . . . . . . . . . . 2
Item 1. Business . . . . . . . . . . . . . . . . . . . . . . . . . . . . . . . . . . . . . . . . . . . . . . . . . . . . . . . . . . . . . . 2
Item 1A. Risk Factors . . . . . . . . . . . . . . . . . . . . . . . . . . . . . . . . . . . . . . . . . . . . . . . . . . . . . . . . . . . 21
Item 1B. Unresolved Staff Comments . . . . . . . . . . . . . . . . . . . . . . . . . . . . . . . . . . . . . . . . . . . . . . . 38
Item 2. Properties . . . . . . . . . . . . . . . . . . . . . . . . . . . . . . . . . . . . . . . . . . . . . . . . . . . . . . . . . . . . . 38
Item 3. Legal Proceedings . . . . . . . . . . . . . . . . . . . . . . . . . . . . . . . . . . . . . . . . . . . . . . . . . . . . . . 38
PART II . . . . . . . . . . . . . . . . . . . . . . . . . . . . . . . . . . . . . . . . . . . . . . . . . . . . . . . . . . . . . . . . . . . . . . . . 40Item 5. Market for Registrants Common Equity, Related Shareholder Matters and Issuer Purchases
of Equity Securities . . . . . . . . . . . . . . . . . . . . . . . . . . . . . . . . . . . . . . . . . . . . . . . . . . . . . 40Item 6. Selected Financial Data . . . . . . . . . . . . . . . . . . . . . . . . . . . . . . . . . . . . . . . . . . . . . . . . . . 43
Item 7. Management’s Discussion and Analysis of Financial Condition and Results ofOperations . . . . . . . . . . . . . . . . . . . . . . . . . . . . . . . . . . . . . . . . . . . . . . . . . . . . . . . . . . . . 47
Item 7A. Quantitative and Qualitative Disclosures About Market Risk . . . . . . . . . . . . . . . . . . . . . . . 115
Item 8. Financial Statements and Supplementary Data . . . . . . . . . . . . . . . . . . . . . . . . . . . . . . . . . . 117
Item 9. Changes in and Disagreements with Accountants on Accounting and FinancialDisclosure . . . . . . . . . . . . . . . . . . . . . . . . . . . . . . . . . . . . . . . . . . . . . . . . . . . . . . . . . . . . 117
Item 9A. Controls and Procedures . . . . . . . . . . . . . . . . . . . . . . . . . . . . . . . . . . . . . . . . . . . . . . . . . . 117
Item 9B. Other Information . . . . . . . . . . . . . . . . . . . . . . . . . . . . . . . . . . . . . . . . . . . . . . . . . . . . . . . 117
PART III. . . . . . . . . . . . . . . . . . . . . . . . . . . . . . . . . . . . . . . . . . . . . . . . . . . . . . . . . . . . . . . . . . . . . . . . 117
Item 10. Directors, Executive Officers and Corporate Governance . . . . . . . . . . . . . . . . . . . . . . . . . . 117
Item 11. Executive Compensation . . . . . . . . . . . . . . . . . . . . . . . . . . . . . . . . . . . . . . . . . . . . . . . . . . 118
Item 12. Security Ownership of Certain Beneficial Owners and Management and RelatedShareholder Matters . . . . . . . . . . . . . . . . . . . . . . . . . . . . . . . . . . . . . . . . . . . . . . . . . . . . . 118
Item 13. Certain Relationships and Related Transactions, and Director Independence . . . . . . . . . . . . 118
Item 14. Principal Accountant Fees and Services . . . . . . . . . . . . . . . . . . . . . . . . . . . . . . . . . . . . . . . 118
PART IV . . . . . . . . . . . . . . . . . . . . . . . . . . . . . . . . . . . . . . . . . . . . . . . . . . . . . . . . . . . . . . . . . . . . . . . 118
Item 15. Exhibits and Financial Statement Schedules. . . . . . . . . . . . . . . . . . . . . . . . . . . . . . . . . . . . 118
Signatures . . . . . . . . . . . . . . . . . . . . . . . . . . . . . . . . . . . . . . . . . . . . . . . . . . . . . . . . . . . . . . . . . . . . . 123
Index to Consolidated Financial Statements and Financial Statements Schedules . . . . . . . . . . . . . . . . . 125
This Annual Report on Form 10-K contains “Forward-Looking Statements” as defined in the PrivateSecurities Litigation Reform Act of 1995. A non-exclusive list of the important factors that could cause actualresults to differ materially from those in such Forward-Looking Statements is set forth herein under the caption“Management’s Discussion and Analysis of Financial Condition and Results of Operations — Cautionary NoteRegarding Forward-Looking Statements.”
PART I
All amounts presented in this part are in U.S. dollars except as otherwise noted.
Item 1. Business
Overview
Validus Holdings, Ltd. (the “Company”) was incorporated under the laws of Bermuda on October 19, 2005.Our initial investor, which we refer to as our founding investor, is Aquiline Capital Partners LLC, a private equityfirm dedicated to investing in financial services companies. Other sponsoring investors included private equityfunds managed by Goldman Sachs Capital Partners, Vestar Capital Partners, New Mountain Capital and MerrillLynch Global Private Equity. The Company conducts its operations worldwide through two wholly-ownedsubsidiaries, Validus Reinsurance, Ltd. (“Validus Re”) and Talbot Holdings Ltd. (“Talbot”). The Company,through its subsidiaries, provides reinsurance coverage in the Property, Marine and Specialty lines markets,effective January 1, 2006, and insurance coverage in the same markets effective July 2, 2007.
We seek to establish ourselves as a leader in the global insurance and reinsurance markets. Our principaloperating objective is to use our capital efficiently by underwriting primarily short-tail insurance and reinsurancecontracts with superior risk and return characteristics. Our primary underwriting objective is to construct a portfolioof short-tail insurance and reinsurance contracts which maximize our return on equity subject to prudent riskconstraints on the amount of capital we expose to any single extreme event. We manage our risks through a varietyof means, including contract terms, portfolio selection, diversification criteria, including geographic diversificationcriteria, and proprietary and commercially available third-party vendor models.
Since our formation in 2005, we have been able to achieve substantial success in the development of ourbusiness. Selected examples of our accomplishments are as follows:
• Raising approximately $1.0 billion of initial equity capital in December 2005 and underwriting $217.4 mil-lion in gross premiums written for the January 2006 renewal season;
• At the time of the Company’s formation an executive management team was assembled with an average of20 years of industry experience and senior expertise spanning multiple aspects of the global insurance andreinsurance business;
• Building a risk analytics staff comprised of over 40 experts, many of whom have PhDs and Masters degreesin related fields;
• Developing Validus Capital Allocation and Pricing System (“VCAPS”), a proprietary computer-basedsystem for modeling, pricing, allocating capital and analyzing catastrophe-exposed risks;
• Acquiring all of the outstanding shares of Talbot Holdings Ltd. on July 2, 2007;
• Completing an initial public offering (“IPO”) on July 30, 2007;
• Acquiring all of the outstanding shares of IPC Holdings Ltd. (“IPC”) on September 4, 2009; and
• Commencing in November of 2009, repurchasing $941.2 million or 34.8 million shares of the Company’scommon stock, representing 35.5% of the outstanding common stock at December 31, 2010.
2
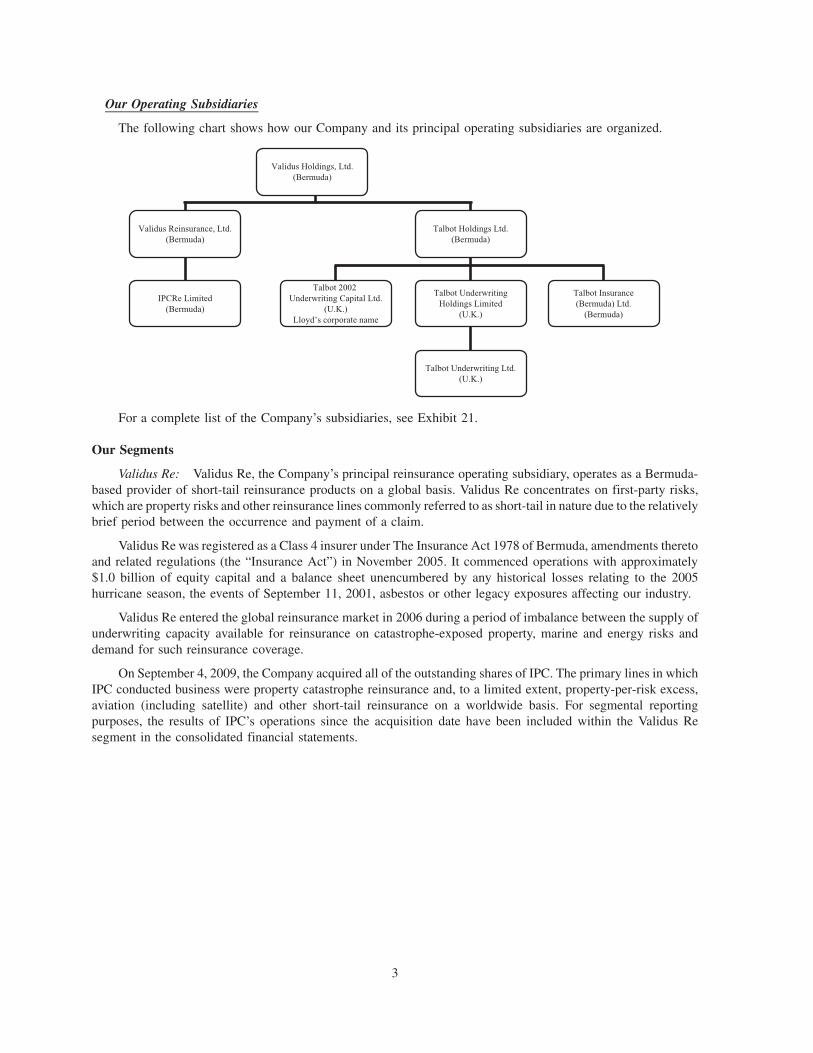
Our Operating Subsidiaries
The following chart shows how our Company and its principal operating subsidiaries are organized.
Validus Holdings, Ltd.(Bermuda)
Validus Reinsurance, Ltd.(Bermuda)
Talbot Holdings Ltd.(Bermuda)
Talbot UnderwritingHoldings Limited
(U.K.)
Talbot 2002 Underwriting Capital Ltd.
(U.K.)Lloyd’s corporate name
Talbot Underwriting Ltd.(U.K.)
Talbot Insurance(Bermuda) Ltd.
(Bermuda)
IPCRe Limited(Bermuda)
For a complete list of the Company’s subsidiaries, see Exhibit 21.
Our Segments
Validus Re: Validus Re, the Company’s principal reinsurance operating subsidiary, operates as a Bermuda-based provider of short-tail reinsurance products on a global basis. Validus Re concentrates on first-party risks,which are property risks and other reinsurance lines commonly referred to as short-tail in nature due to the relativelybrief period between the occurrence and payment of a claim.
Validus Re was registered as a Class 4 insurer under The Insurance Act 1978 of Bermuda, amendments theretoand related regulations (the “Insurance Act”) in November 2005. It commenced operations with approximately$1.0 billion of equity capital and a balance sheet unencumbered by any historical losses relating to the 2005hurricane season, the events of September 11, 2001, asbestos or other legacy exposures affecting our industry.
Validus Re entered the global reinsurance market in 2006 during a period of imbalance between the supply ofunderwriting capacity available for reinsurance on catastrophe-exposed property, marine and energy risks anddemand for such reinsurance coverage.
On September 4, 2009, the Company acquired all of the outstanding shares of IPC. The primary lines in whichIPC conducted business were property catastrophe reinsurance and, to a limited extent, property-per-risk excess,aviation (including satellite) and other short-tail reinsurance on a worldwide basis. For segmental reportingpurposes, the results of IPC’s operations since the acquisition date have been included within the Validus Resegment in the consolidated financial statements.
3
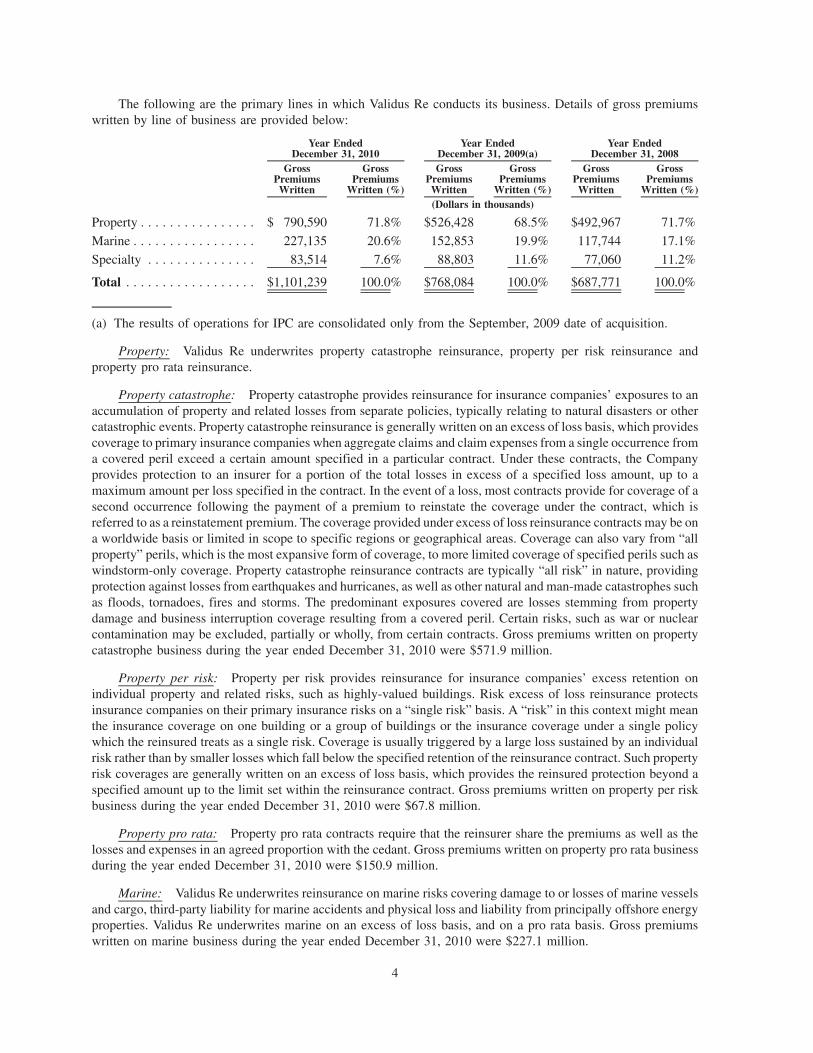
The following are the primary lines in which Validus Re conducts its business. Details of gross premiumswritten by line of business are provided below:
GrossPremiumsWritten
GrossPremiums
Written (%)
GrossPremiumsWritten
GrossPremiums
Written (%)
GrossPremiumsWritten
GrossPremiums
Written (%)
Year EndedDecember 31, 2010
Year EndedDecember 31, 2009(a)
Year EndedDecember 31, 2008
(Dollars in thousands)
Property . . . . . . . . . . . . . . . . $ 790,590 71.8% $526,428 68.5% $492,967 71.7%
Marine . . . . . . . . . . . . . . . . . 227,135 20.6% 152,853 19.9% 117,744 17.1%
Specialty . . . . . . . . . . . . . . . 83,514 7.6% 88,803 11.6% 77,060 11.2%
Total . . . . . . . . . . . . . . . . . . $1,101,239 100.0% $768,084 100.0% $687,771 100.0%
(a) The results of operations for IPC are consolidated only from the September, 2009 date of acquisition.
Property: Validus Re underwrites property catastrophe reinsurance, property per risk reinsurance andproperty pro rata reinsurance.
Property catastrophe: Property catastrophe provides reinsurance for insurance companies’ exposures to anaccumulation of property and related losses from separate policies, typically relating to natural disasters or othercatastrophic events. Property catastrophe reinsurance is generally written on an excess of loss basis, which providescoverage to primary insurance companies when aggregate claims and claim expenses from a single occurrence froma covered peril exceed a certain amount specified in a particular contract. Under these contracts, the Companyprovides protection to an insurer for a portion of the total losses in excess of a specified loss amount, up to amaximum amount per loss specified in the contract. In the event of a loss, most contracts provide for coverage of asecond occurrence following the payment of a premium to reinstate the coverage under the contract, which isreferred to as a reinstatement premium. The coverage provided under excess of loss reinsurance contracts may be ona worldwide basis or limited in scope to specific regions or geographical areas. Coverage can also vary from “allproperty” perils, which is the most expansive form of coverage, to more limited coverage of specified perils such aswindstorm-only coverage. Property catastrophe reinsurance contracts are typically “all risk” in nature, providingprotection against losses from earthquakes and hurricanes, as well as other natural and man-made catastrophes suchas floods, tornadoes, fires and storms. The predominant exposures covered are losses stemming from propertydamage and business interruption coverage resulting from a covered peril. Certain risks, such as war or nuclearcontamination may be excluded, partially or wholly, from certain contracts. Gross premiums written on propertycatastrophe business during the year ended December 31, 2010 were $571.9 million.
Property per risk: Property per risk provides reinsurance for insurance companies’ excess retention onindividual property and related risks, such as highly-valued buildings. Risk excess of loss reinsurance protectsinsurance companies on their primary insurance risks on a “single risk” basis. A “risk” in this context might meanthe insurance coverage on one building or a group of buildings or the insurance coverage under a single policywhich the reinsured treats as a single risk. Coverage is usually triggered by a large loss sustained by an individualrisk rather than by smaller losses which fall below the specified retention of the reinsurance contract. Such propertyrisk coverages are generally written on an excess of loss basis, which provides the reinsured protection beyond aspecified amount up to the limit set within the reinsurance contract. Gross premiums written on property per riskbusiness during the year ended December 31, 2010 were $67.8 million.
Property pro rata: Property pro rata contracts require that the reinsurer share the premiums as well as thelosses and expenses in an agreed proportion with the cedant. Gross premiums written on property pro rata businessduring the year ended December 31, 2010 were $150.9 million.
Marine: Validus Re underwrites reinsurance on marine risks covering damage to or losses of marine vesselsand cargo, third-party liability for marine accidents and physical loss and liability from principally offshore energyproperties. Validus Re underwrites marine on an excess of loss basis, and on a pro rata basis. Gross premiumswritten on marine business during the year ended December 31, 2010 were $227.1 million.
4

Specialty: Validus Re underwrites other lines of business depending on an evaluation of pricing and marketconditions, which include aerospace and aviation, agriculture, terrorism, life and accident & health, financial lines,nuclear, workers’ compensation catastrophe and crisis management. The Company seeks to underwrite otherspecialty lines with very limited exposure correlation with its property, marine and energy portfolios. With theexception of the aerospace line of business, which has a meaningful portion of its gross premiums written volume ona proportional basis, the Company’s other specialty lines are written on an excess of loss basis. Gross premiumswritten on specialty business during the year ended December 31, 2010 were $83.5 million.
Talbot: On July 2, 2007, the Company acquired all of the outstanding shares of Talbot. Talbot is the Bermudaparent of a specialty insurance group primarily operating within the Lloyd’s of London (“Lloyd’s”) insurancemarket through Syndicate 1183. The acquisition of Talbot provides the Company with significant benefits in termsof product line and geographic diversification as well as offering the Company broader access to underwritingexpertise. Similar to Validus Re, Talbot writes primarily short-tail lines of business but, as a complement to ValidusRe, focuses mostly on insurance, as opposed to reinsurance risks, and on specialty lines where Validus Re currentlyhas limited or no presence (e.g., war, financial institutions, contingency, accident and health). In addition, Talbotprovides the Company with access to the Lloyd’s marketplace where Validus Re does not operate. As a London-based insurer, Talbot also writes the majority of its premiums on risks outside the United States. Talbot’s team ofunderwriters have, in many cases, spent most of their careers writing niche, short-tail business and bring theirexpertise to bear on expanding the Company’s short-tail insurance franchise.
The Company has expanded and diversified its business through Syndicate 1183’s access to Lloyd’s licenseagreements with regulators around the world. Underwriting Risk Services, Inc., Underwriting Risk Services(Middle East) Ltd., Validus Reaseguros, Inc., Validus Re Chile S.A. and Talbot Risk Services Pte Ltd, act asapproved Lloyd’s coverholders for Syndicate 1183.
The following are the primary lines in which Talbot conducts its business. Details of gross premiums written byline of business are provided below:
GrossPremiumsWritten
GrossPremiums
Written (%)
GrossPremiumsWritten
GrossPremiums
Written (%)
GrossPremiumsWritten
GrossPremiums
Written (%)
Year EndedDecember 31, 2010
Year EndedDecember 31, 2009
Year EndedDecember 31, 2008
(Dollars in thousands)
Property . . . . . . . . . . . . . . . . . $314,769 32.1% $269,583 29.3% $152,143 21.4%
Marine . . . . . . . . . . . . . . . . . . 315,102 32.1% 307,385 33.4% 287,696 40.6%
Specialty . . . . . . . . . . . . . . . . . 351,202 35.8% 342,938 37.3% 269,157 38.0%
Total . . . . . . . . . . . . . . . . . . . $981,073 100.0% $919,906 100.0% $708,996 100.0%
Property: The main sub-classes within property are international and North American direct and facultativecontracts, onshore energy, lineslips and binding authorities together with a book of business written on a treatyreinsurance basis. The business written is mostly commercial and industrial insurance though there is a modestpersonal lines component. The business is short-tail with premiums for reinsurance and, direct and facultativebusiness, substantially earned within 12 months and premiums for lineslips and binding authorities substantiallyearned within 12 months of the expiry of the contract. Gross premiums written on property business during the yearended December 31, 2010 was $314.8 million, including $88.5 million of treaty reinsurance.
Marine: The main types of business within marine are hull, cargo, energy, marine and energy liabilities,yachts and marinas and other treaty. Hull consists primarily of ocean going vessels and cargo and covers worldwiderisks. Energy covers a variety of oil and gas industry risks. The marine and energy liability account provides coverfor protection and indemnity clubs and a wide range of companies operating in the marine and energy sector. Yachtand marina policies are primarily written through Underwriting Risk Services Ltd., an underwriting agency that is asubsidiary of Talbot. Each of the sub-classes within marine has a different profile of contracts written — some, suchas energy, derive up to 41.7% of their business through writing facultative contracts while others, such as cargo, onlyderive 15.8% of their business from this method. Each of the sub-classes also has a different geographical riskallocation. Most business written is short-tail enabling a quicker and more accurate picture of expected profitability
5
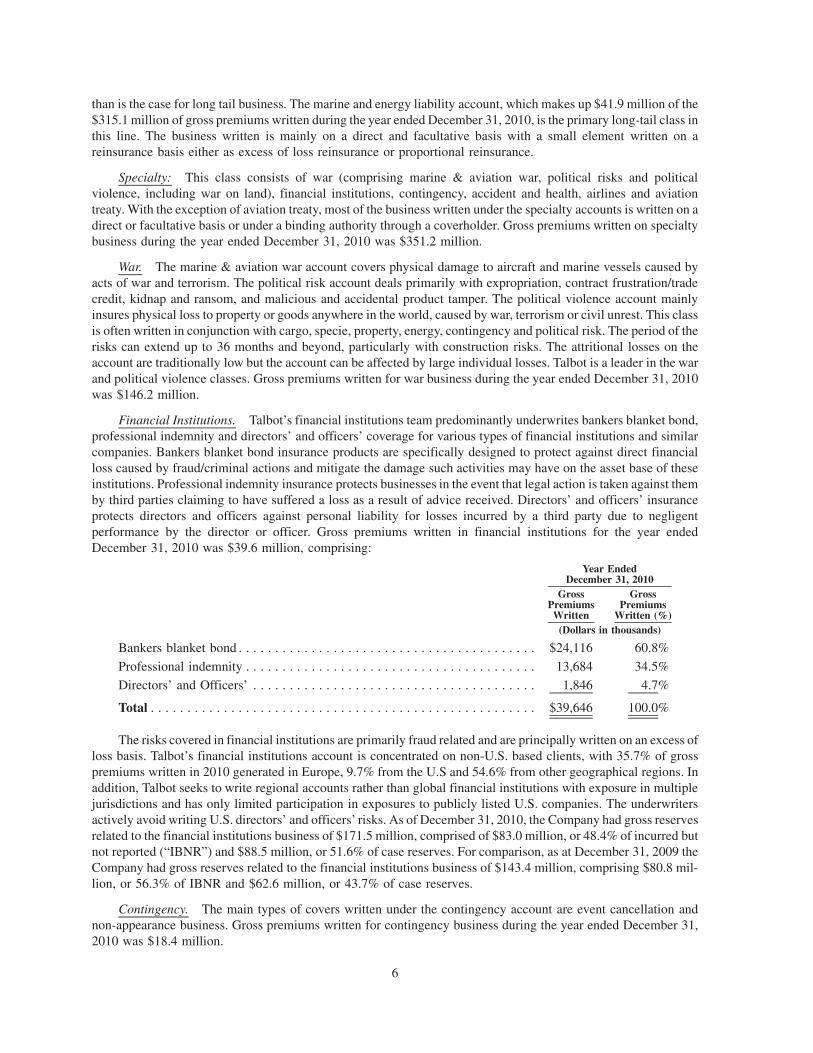
than is the case for long tail business. The marine and energy liability account, which makes up $41.9 million of the$315.1 million of gross premiums written during the year ended December 31, 2010, is the primary long-tail class inthis line. The business written is mainly on a direct and facultative basis with a small element written on areinsurance basis either as excess of loss reinsurance or proportional reinsurance.
Specialty: This class consists of war (comprising marine & aviation war, political risks and politicalviolence, including war on land), financial institutions, contingency, accident and health, airlines and aviationtreaty. With the exception of aviation treaty, most of the business written under the specialty accounts is written on adirect or facultative basis or under a binding authority through a coverholder. Gross premiums written on specialtybusiness during the year ended December 31, 2010 was $351.2 million.
War. The marine & aviation war account covers physical damage to aircraft and marine vessels caused byacts of war and terrorism. The political risk account deals primarily with expropriation, contract frustration/tradecredit, kidnap and ransom, and malicious and accidental product tamper. The political violence account mainlyinsures physical loss to property or goods anywhere in the world, caused by war, terrorism or civil unrest. This classis often written in conjunction with cargo, specie, property, energy, contingency and political risk. The period of therisks can extend up to 36 months and beyond, particularly with construction risks. The attritional losses on theaccount are traditionally low but the account can be affected by large individual losses. Talbot is a leader in the warand political violence classes. Gross premiums written for war business during the year ended December 31, 2010was $146.2 million.
Financial Institutions. Talbot’s financial institutions team predominantly underwrites bankers blanket bond,professional indemnity and directors’ and officers’ coverage for various types of financial institutions and similarcompanies. Bankers blanket bond insurance products are specifically designed to protect against direct financialloss caused by fraud/criminal actions and mitigate the damage such activities may have on the asset base of theseinstitutions. Professional indemnity insurance protects businesses in the event that legal action is taken against themby third parties claiming to have suffered a loss as a result of advice received. Directors’ and officers’ insuranceprotects directors and officers against personal liability for losses incurred by a third party due to negligentperformance by the director or officer. Gross premiums written in financial institutions for the year endedDecember 31, 2010 was $39.6 million, comprising:
GrossPremiumsWritten
GrossPremiums
Written (%)
Year EndedDecember 31, 2010
(Dollars in thousands)
Bankers blanket bond . . . . . . . . . . . . . . . . . . . . . . . . . . . . . . . . . . . . . . . . . $24,116 60.8%
Professional indemnity . . . . . . . . . . . . . . . . . . . . . . . . . . . . . . . . . . . . . . . . 13,684 34.5%
Directors’ and Officers’ . . . . . . . . . . . . . . . . . . . . . . . . . . . . . . . . . . . . . . . 1,846 4.7%
Total . . . . . . . . . . . . . . . . . . . . . . . . . . . . . . . . . . . . . . . . . . . . . . . . . . . . . $39,646 100.0%
The risks covered in financial institutions are primarily fraud related and are principally written on an excess ofloss basis. Talbot’s financial institutions account is concentrated on non-U.S. based clients, with 35.7% of grosspremiums written in 2010 generated in Europe, 9.7% from the U.S and 54.6% from other geographical regions. Inaddition, Talbot seeks to write regional accounts rather than global financial institutions with exposure in multiplejurisdictions and has only limited participation in exposures to publicly listed U.S. companies. The underwritersactively avoid writing U.S. directors’ and officers’ risks. As of December 31, 2010, the Company had gross reservesrelated to the financial institutions business of $171.5 million, comprised of $83.0 million, or 48.4% of incurred butnot reported (“IBNR”) and $88.5 million, or 51.6% of case reserves. For comparison, as at December 31, 2009 theCompany had gross reserves related to the financial institutions business of $143.4 million, comprising $80.8 mil-lion, or 56.3% of IBNR and $62.6 million, or 43.7% of case reserves.
Contingency. The main types of covers written under the contingency account are event cancellation andnon-appearance business. Gross premiums written for contingency business during the year ended December 31,2010 was $18.4 million.
6

Accident and Health. The accident and health account provides insurance in respect of individuals in boththeir personal and business activity together with corporations where they have an insurable interest relating todeath or disability of employees or those under contract. Gross premiums written for accident and health businessduring the year ended December 31, 2010 was $19.7 million.
Aviation. The aviation account insures major airlines, general aviation, aviation hull war and satellites. Thecoverage includes excess of loss treaty with medium to high attachment points. Gross premiums written for theaviation business during the year ended December 31, 2010 was $113.8 million.
Underwriting and Risk Management
We underwrite and manage risk by paying close attention to risk selection and analysis. Through a detailedexamination of contract terms, diversification criteria, contract experience and exposure, we aim to outperform ourpeers. We strive to provide our experienced underwriters with technically sound and objective information. Webelieve a strong working relationship between the underwriting, catastrophe modeling and actuarial disciplines iscritical to long-term success and solid decision-making.
A principal focus of the Company is to develop and apply sophisticated computer models and other analyticaltools to assess the risks and aggregation of the risks that we underwrite and to optimize our portfolio of contracts. Inparticular, we devote a substantial amount of our efforts to the optimization of our catastrophe risk profile. Inaddition to using Probable Maximum Loss (“PML”) and other risk metrics that measure the maximum amount ofloss expected from our portfolio over various return periods or measured probabilistically, our approach to riskcontrol imposes a limit on our net maximum potential loss for any single event in any one risk zone, which reducesthe risks inherent in probabilistic modeling. Further, we recognize that the reliability and credibility of the models iscontingent upon the accuracy, reliability and quality of the data that is used in modeling efforts.
The Company has chartered a Group Risk Management Committee (the “GRMC”) chaired by its Chief RiskOfficer and composed of senior management of the Company. The GRMC was established as part of the Company’simplementation of enterprise risk management. The GRMC is responsible for monitoring and managing risks inclose coordination with risk management committees and personnel within our operating subsidiaries. The GRMCmeets monthly to review and discuss key risks, make decisions to manage those risks and oversee implementation ofthose decisions. The GRMC also has oversight over the risk management of the organization, ensuring theavailability of appropriate risk management resources.
Underwriting
All of the Company’s underwriters are subject to a set of underwriting guidelines that are established by theChief Executive Officers of Validus Re and Talbot. These guidelines are then subject to review and approval by theRisk Committee of our Board of Directors. Underwriters are also issued letters of authority that specifically addressthe limits of their underwriting authority and their referral criteria. The Company’s current underwriting guidelinesand letters of authority include:
• lines of business that a particular underwriter is authorized to write;
• exposure limits by line of business;
• contractual exposures and limits requiring mandatory referrals to the Chief Executive Officer at Validus Reand the Chief Executive Officer at Talbot; and
• level of analysis to be performed by lines of business.
In general, our underwriting approach is to:
• seek high quality clients who have demonstrated superior performance over an extended period;
• evaluate our clients’ exposures and make adjustments where their exposure is not adequately reflected;
• apply the comprehensive knowledge and experience of our entire underwriting team to make progressiveand cohesive decisions about the business they underwrite;
7
• employ our well-founded and carefully maintained market contacts within the group to enhance our robustdistribution capabilities; and
• refer submissions to the Chief Underwriting Officer at Validus Re, the Chief Executive Officer at Talbot,Chief Executive Officer at Validus Re and the Risk Committee of our Board of Directors according to ourunderwriting guidelines.
The underwriting guidelines are subject to waiver or change by the Chief Executive Officer at Validus Re or theChief Executive Officer at Talbot subject to their authority as overseen by their respective Risk Committees.
Our underwriters have the responsibility to analyze all submissions and determine if the related potentialexposures meet with both the Company’s risk profile line size and aggregate limitations. In order to ensurecompliance, we run underwriting reports and conduct periodic audits. Further, our treaty reinsurance operation hasthe authority limits of individual underwriters built into VCAPS while Talbot maintains separate complianceprocedures to ensure that the appropriate policies and guidelines are followed.
Validus Re: We have established a referral process whereby business exceeding set exposure or premiumlimits is referred to the Chief Executive Officer for review. As the reviewer of such potential business, the ChiefExecutive Officer has the ability to determine if the business meets the Company’s overall desired risk profile. TheChief Executive Officer has defined underwriting authority for each underwriter, and risks outside of this authoritymust be referred to the Chief Executive Officer. The Risk Committee of our Board of Directors reviews business thatis outside the authority of the Chief Executive Officer.
Talbot: Our risk review and control processes have been designed to ensure that all written risks comply withunderwriting and risk control strategies. The various types of review are sequential in timing and emphasize theapplication of an appropriate level of scrutiny. A workflow system automates the referral of risks to relevantreviewers. These reviews are monitored and reports prepared on a regular basis.
Collectively, the various peer review procedures serve numerous objectives, including:
• Validating that underwriting decisions are in accordance with risk appetite, authorities, agreed businessplans and standards for type, quality and profitability of risk;
• Providing an experienced and suitably qualified second review of individual risks;
• Ensuring that risks identified as higher risks undergo the highest level of technical underwriting review;
• Elevating technical underwriting queries and/or need for remedial actions on a timely basis; and
• Improving database accuracy and coding for subsequent management reporting.
The principal elements of the underwriting review process are as follows:
Underwriter Review: The underwriting team must evidence data entry review by confirming review andagreement on the workflow system within a specified number of working days of entry being completed by thecontracted third party.
Peer Review: The majority of risks are peer reviewed by a peer review underwriter within a specified numberof working days of data entry being completed. There is an agreed matrix of peer review underwriters who areauthorized to peer review. Endorsements that increase identified exposures are also subject to the current peerreview procedures.
Class of business review: Risks written into a class by an underwriter other than the nominated classunderwriter are subsequently forwarded to, and reviewed by, the nominated class underwriter.
Exceptions review: Risks that exceed a set of pre-determined criteria will also be referred to the ActiveUnderwriter or the Underwriting Risk Officer for review. Such risks are discussed by the underwriters at regularunderwriting meetings in the presence of at least one of the above. In certain circumstances, some risks may bereferred to the Insurance Management Committee or the Talbot Underwriting Ltd (“TUL”) Board for final approval.These reviews also commonly include reports of risks renewed where there has been a large loss ratio in the recentpast.
8

Insurance Management Committee: At its regular meetings, the Committee reviews a range of keyperformance indicators including: premium income written versus plan; movements in syndicate cash andinvestments; and aggregate exposures in a number of accounts. The Committee also reviews claim movementsover a financial threshold.
Expert Review Subcommittee (“ERC”): The ERC is a committee that meets regularly to review theunderwriting activities of Syndicate 1183 and other related activities to provide assurance that the underwritingrisks assumed are within the parameters of the business plan. This is achieved with the help of eight external expertreviewers who report their findings to the ERC.
The expert reviewers obtain and review a sample of risks underwritten in each class and report their findings tothe quarterly meetings of the ERC. Findings range from general comments on approach and processes to specificpoints in respect of individual risks.
Risk Management
A pivotal factor in determining whether to found and fund the Company was the opportunity for differentiationbased upon superior risk management expertise; specifically, managing catastrophe risk and optimizing ourportfolio to generate attractive returns on capital while controlling our exposure to risk, and assembling amanagement team with the experience and expertise to do so. The Company’s proprietary models are currentwith emerging scientific trends. This has enabled the Company to gain a competitive advantage over thosereinsurers who rely exclusively on commercial models for pricing and portfolio management. The Company hasmade a significant investment in expertise in the risk modeling area to capitalize on this opportunity. The Companyhas assembled an experienced group of professional experts who operate in an environment designed to allow themto use their expertise as a competitive advantage. While the Company uses both proprietary and commercialprobabilistic models, risk is ultimately subject to absolute aggregate limitations based on risk levels determined bythe Risk Committee of our Board of Directors.
Vendor Models: The Company has global licenses for all three major vendor models (RMS, AIR andEQECAT) to assess the adequacy of risk pricing and to monitor our overall exposure to risk in correlated geographiczones. The Company models property exposures that could potentially lead to an over-aggregation of property risks(i.e., catastrophe-exposed business) using the vendor models. The vendor models enable us to aggregate exposuresby correlated event loss scenarios, which are probability-weighted. This enables the generation of exceedanceprobability curves for the portfolio and major geographic areas. Once exposures are modeled using one of thevendor models, the two other models are used as a reasonability check and validation of the loss scenariosdeveloped and reported by the first. The three commercial models each have unique strengths and weaknesses. It isnecessary to impose changes to frequency and severity ahead of changes made by the model vendors.
The Company’s review of market practice revealed a number of areas where quantitative expertise can be usedto improve the reliability of the vendor model outputs:
• Ceding companies may often report insufficient data and many reinsurers may not be sufficiently critical intheir analysis of this data. The Company generally scrutinizes data for anomalies that may indicateinsufficient data quality. These circumstances are addressed by either declining the program or, if thevariances are manageable, by modifying the model output and pricing to reflect insufficient data quality;
• Prior to making overall adjustments for changes in climate variables, other variables are carefully examined(for example, demand surge, storm surge, and secondary uncertainty); and
• Pricing individual contracts frequently requires further adjustments to the three vendor models. Examplesinclude bias in damage curves for commercial structures and occupancies and frequency of specific perils.
In addition, many risks, such as second-event covers, aggregate excess of loss, or attritional loss componentscannot be fully evaluated using the vendor models. In order to better evaluate and price these risks, the Company hasdeveloped proprietary analytical tools, such as VCAPS and other models and data sets.
9
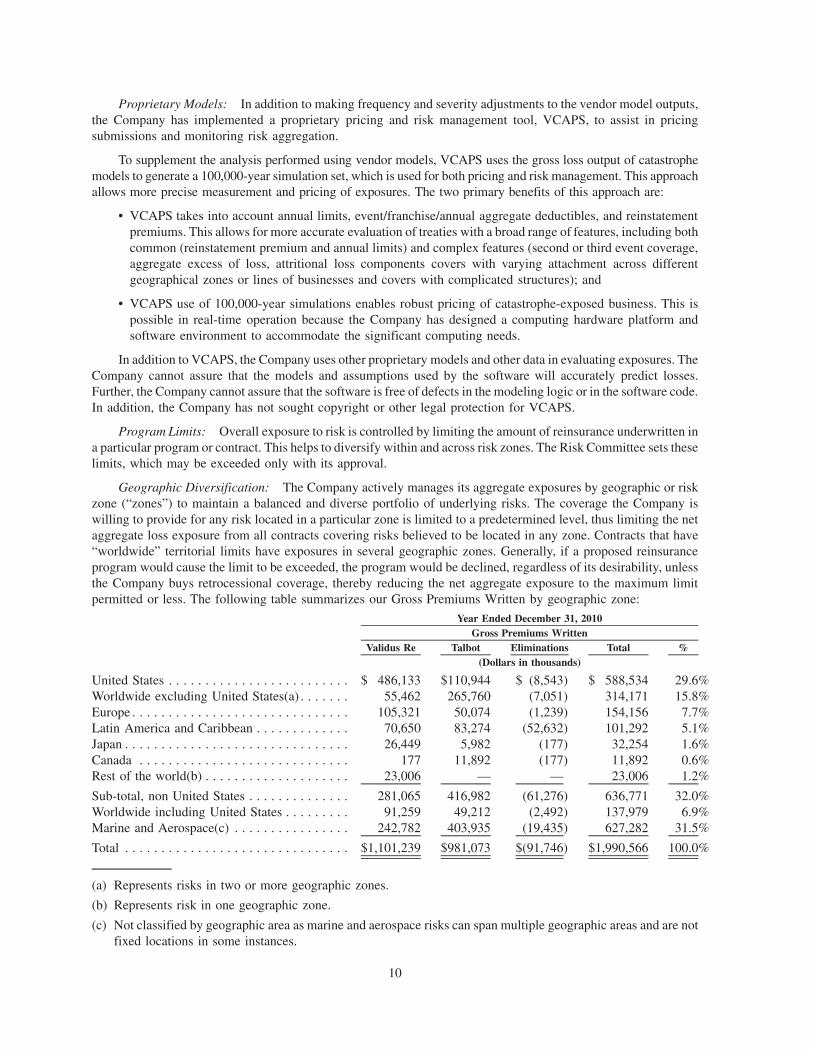
Proprietary Models: In addition to making frequency and severity adjustments to the vendor model outputs,the Company has implemented a proprietary pricing and risk management tool, VCAPS, to assist in pricingsubmissions and monitoring risk aggregation.
To supplement the analysis performed using vendor models, VCAPS uses the gross loss output of catastrophemodels to generate a 100,000-year simulation set, which is used for both pricing and risk management. This approachallows more precise measurement and pricing of exposures. The two primary benefits of this approach are:
• VCAPS takes into account annual limits, event/franchise/annual aggregate deductibles, and reinstatementpremiums. This allows for more accurate evaluation of treaties with a broad range of features, including bothcommon (reinstatement premium and annual limits) and complex features (second or third event coverage,aggregate excess of loss, attritional loss components covers with varying attachment across differentgeographical zones or lines of businesses and covers with complicated structures); and
• VCAPS use of 100,000-year simulations enables robust pricing of catastrophe-exposed business. This ispossible in real-time operation because the Company has designed a computing hardware platform andsoftware environment to accommodate the significant computing needs.
In addition to VCAPS, the Company uses other proprietary models and other data in evaluating exposures. TheCompany cannot assure that the models and assumptions used by the software will accurately predict losses.Further, the Company cannot assure that the software is free of defects in the modeling logic or in the software code.In addition, the Company has not sought copyright or other legal protection for VCAPS.
Program Limits: Overall exposure to risk is controlled by limiting the amount of reinsurance underwritten ina particular program or contract. This helps to diversify within and across risk zones. The Risk Committee sets theselimits, which may be exceeded only with its approval.
Geographic Diversification: The Company actively manages its aggregate exposures by geographic or riskzone (“zones”) to maintain a balanced and diverse portfolio of underlying risks. The coverage the Company iswilling to provide for any risk located in a particular zone is limited to a predetermined level, thus limiting the netaggregate loss exposure from all contracts covering risks believed to be located in any zone. Contracts that have“worldwide” territorial limits have exposures in several geographic zones. Generally, if a proposed reinsuranceprogram would cause the limit to be exceeded, the program would be declined, regardless of its desirability, unlessthe Company buys retrocessional coverage, thereby reducing the net aggregate exposure to the maximum limitpermitted or less. The following table summarizes our Gross Premiums Written by geographic zone:
Validus Re Talbot Eliminations Total %Gross Premiums Written
Year Ended December 31, 2010
(Dollars in thousands)
United States . . . . . . . . . . . . . . . . . . . . . . . . . $ 486,133 $110,944 $ (8,543) $ 588,534 29.6%Worldwide excluding United States(a) . . . . . . . 55,462 265,760 (7,051) 314,171 15.8%Europe . . . . . . . . . . . . . . . . . . . . . . . . . . . . . . 105,321 50,074 (1,239) 154,156 7.7%Latin America and Caribbean . . . . . . . . . . . . . 70,650 83,274 (52,632) 101,292 5.1%Japan . . . . . . . . . . . . . . . . . . . . . . . . . . . . . . . 26,449 5,982 (177) 32,254 1.6%Canada . . . . . . . . . . . . . . . . . . . . . . . . . . . . . 177 11,892 (177) 11,892 0.6%Rest of the world(b) . . . . . . . . . . . . . . . . . . . . 23,006 — — 23,006 1.2%
Sub-total, non United States . . . . . . . . . . . . . . 281,065 416,982 (61,276) 636,771 32.0%Worldwide including United States . . . . . . . . . 91,259 49,212 (2,492) 137,979 6.9%Marine and Aerospace(c) . . . . . . . . . . . . . . . . 242,782 403,935 (19,435) 627,282 31.5%
Total . . . . . . . . . . . . . . . . . . . . . . . . . . . . . . . $1,101,239 $981,073 $(91,746) $1,990,566 100.0%
(a) Represents risks in two or more geographic zones.
(b) Represents risk in one geographic zone.
(c) Not classified by geographic area as marine and aerospace risks can span multiple geographic areas and are notfixed locations in some instances.
10

The effectiveness of geographic zone limits in managing risk exposure depends on the degree to which anactual event is confined to the zone in question and on the Company’s ability to determine the actual location of therisks believed to be covered under a particular reinsurance program. Accordingly, there can be no assurance that riskexposure in any particular zone will not exceed that zone’s limits. Further control over diversification is achievedthrough guidelines covering the types and amount of business written in product classes and lines within a class.
Within Talbot, the TUL Board is responsible for creating the environment and structures for risk managementto operate effectively. The Talbot Chief Executive is responsible for ensuring the risk management process isimplemented.
The TUL Board has several committees responsible for monitoring risk. The TUL Board approves the riskappetite as part of the syndicate business plan process which sets targets for premium volume, pricing, line sizes,aggregate exposures and retention by class of business.
The TUL Executive Committee is responsible for establishing and maintaining a comprehensive risk registerand key controls for TUL. It is responsible for formulating a risk appetite consistent with the Company’s riskappetite, for approval by the TUL Board.
The key focuses of each committee are as follows:
• The TUL Executive Committee manages key risks with regard to strategy and reserves;
• The Talbot Insurance Management Committee manages insurance risks;
• Operational Risk Committee manages risk related to people, processes, systems and external events; and
• Financial Risk Committee manages credit risk associated with investments and reinsurance counterparties,capital markets risk and liquidity risk.
Performance against underwriting targets is measured regularly throughout the year. Risks written are subjectto peer review, an internal quality control process. Pricing is controlled by the monitoring of rate movements and thecomparison of technical prices to actual prices for certain classes of business. Controls over aggregation of claimsexposures vary by class of business. They include limiting coastal risks, monitoring aggregation by county/region/blast zones and applying line size limits in all cases. Catastrophe modeling software and techniques are used tomodel expected loss outcomes for Lloyd’s Realistic Disaster Scenario returns and in-house catastrophe eventscenarios. Reserves are reviewed for adequacy on a quarterly basis. The syndicate also purchases reinsurance, withan appropriate number of reinstatements, to arrive at an acceptable net retained risk.
Validus Re Retrocession: Validus Re monitors the opportunity to purchase retrocessional coverage on acontinual basis and employs the VCAPS modeling system to evaluate the effectiveness of risk mitigation andexposure management relative to the cost. This coverage may be purchased on an indemnity basis as well as on anindex basis (e.g., industry loss warranties (“ILWs”)). Validus Re also considers alternative retrocessional structures,including collateralized quota share (“sidecar”) and capital markets products.
When Validus Re buys retrocessional coverage on an indemnity basis, payment is for an agreed upon portion ofthe losses actually suffered. In contrast, when Validus Re buys an ILW cover, which is a reinsurance contract inwhich the payout is dependent on both the insured loss of the policy purchaser and the measure of the industry-wideloss, payment is made only if both Validus Re and the industry suffer a loss, as reported by one of a number ofindependent agencies, in excess of specified threshold amounts. With an ILW, Validus Re bears the risk of sufferinga loss while receiving no payment under the ILW if the industry loss was less than the specified threshold amount.
Validus Re may use capital markets instruments for risk management in the future (e.g., catastrophe bonds,sidecar facilities and other forms of risk securitization) where the pricing and terms are attractive.
Talbot Ceded Reinsurance: Talbot enters into reinsurance agreements in order to mitigate its accumulationof loss, reduce its liability on individual risks and enable it to underwrite policies with higher limits. The ceding ofthe insurance does not legally discharge Talbot from its primary liability for the full amount of the policies, andTalbot is required to pay the loss and bear collection risk if the reinsurer fails to meet its obligations under thereinsurance agreement.
11

The following describes the Talbot Group’s process in the purchase and authorization of treaty reinsurancepolicies only. It does not cover the purchase of facultative business because these premiums are not significant.
The reinsurance program is reviewed by the reinsurance purchasing team on an on-going basis in line with themain business planning process. This process incorporates advice and analytical work from our brokers, actuarialand capital modeling teams.
The review and modification is based upon the following:
• budgeted underwriting for the coming year;
• loss experience from prior years;
• loss information from the coming year’s individual capital assessment calculations;
• changes to risk limits and aggregation limits expected and any other changes to Talbot’s risk tolerance;
• scenario planning;
• changes to capital requirements; and
• Realistic Disaster Scenarios (“RDSs”) prescribed by Lloyd’s.
The main type of reinsurance purchased is losses occurring; however, for a few lines of business, where thetiming of the loss event is less easily verified or where such cover is available, risk attaching policies are purchased.
The type, quantity and cost of cover of the proposed reinsurance program is discussed and reviewed by theChief Executive Officer of the Talbot group, and ultimately authorized by the TUL Board.
Once this has occurred, the reinsurance program is purchased in the months prior to the beginning of thecovered period. All reinsurance contracts arranged are authorized for purchase by the Talbot Chief ExecutiveOfficer. Slips are developed prior to inception to ensure the best possible cover is achieved. After purchase, covernotes are reviewed by the relevant class underwriters and presentations made to all underwriting staff to ensure theyare aware of the boundaries of the cover.
Distribution
Although we conduct some business on a direct basis with our treaty and facultative reinsurance clients, mostof our business is derived through insurance and reinsurance intermediaries (“brokers”), who access business fromclients and coverholders. We are able to attract business through our recognized lead capability in most classes weunderwrite, particularly in classes where such lead ability is rare.
Currently, our largest broker relationships, as measured by gross premiums written, are with Aon BenfieldGroup Ltd., Marsh & McLennan Companies, Inc./Guy Carpenter & Co., and Willis Group Holdings Ltd. Thefollowing table sets forth the Company’s gross premiums written by broker:
Validus Re Talbot Eliminations Total %Gross Premiums Written
Year Ended December 31, 2010
(Dollars in thousands)
Name of BrokerMarsh Inc./Guy Carpenter & Co. . . . . . . . . . . $ 378,368 $141,927 $(13,272) $ 507,023 25.5%
Aon Benfield Group Ltd. . . . . . . . . . . . . . . . . 318,372 145,635 (13,619) 450,388 22.6%
Willis Group Holdings Ltd. . . . . . . . . . . . . . . 212,358 142,304 (13,308) 341,354 17.1%
Sub-total . . . . . . . . . . . . . . . . . . . . . . . . . . . . 909,098 429,866 (40,199) 1,298,765 65.2%
All Others . . . . . . . . . . . . . . . . . . . . . . . . . . . 192,141 551,207 (51,547) 691,801 34.8%
Total . . . . . . . . . . . . . . . . . . . . . . . . . . . . . . . $1,101,239 $981,073 $(91,746) $1,990,566 100.0%
12

Reserve for losses and loss expenses
For insurance and reinsurance companies, a significant judgment made by management is the estimation of thereserve for losses and loss expenses. The Company establishes its reserve for losses and loss expenses to cover theestimated incurred liability for both reported and unreported claims.
The following tables show certain information with respect to the Company’s reserves:
Gross Case Reserves Gross IBNR
Total GrossReserve for Loss
and Loss Expenses
As at December 31, 2010
(Dollars in thousands)
Property . . . . . . . . . . . . . . . . . . . . . . . . . . . . . $ 506,506 $ 397,941 $ 904,447
Marine . . . . . . . . . . . . . . . . . . . . . . . . . . . . . . 317,469 322,259 639,728
Specialty . . . . . . . . . . . . . . . . . . . . . . . . . . . . 211,906 279,892 491,798
Total . . . . . . . . . . . . . . . . . . . . . . . . . . . . . . . $1,035,881 $1,000,092 $2,035,973
Net Case Reserves Net IBNR
Total NetReserve for Loss
and Loss Expenses
As at December 31, 2010
(Dollars in thousands)
Property . . . . . . . . . . . . . . . . . . . . . . . . . . . . . . . . $458,087 $358,895 $ 816,982
Marine . . . . . . . . . . . . . . . . . . . . . . . . . . . . . . . . . 275,877 261,390 537,267
Specialty . . . . . . . . . . . . . . . . . . . . . . . . . . . . . . . 165,302 233,288 398,590
Total . . . . . . . . . . . . . . . . . . . . . . . . . . . . . . . . . . $899,266 $853,573 $1,752,839
Loss reserves are established due to the significant periods of time that may lapse between the occurrence,reporting and payment of a loss. To recognize liabilities for unpaid losses and loss expenses, the Company estimatesfuture amounts needed to pay claims and related expenses with respect to insured events. The Company’s reservingpractices and the establishment of any particular reserve reflects management’s judgment concerning soundfinancial practice and does not represent any admission of liability with respect to any claim. Unpaid losses and lossexpense reserves are established for reported claims (“case reserves”) and IBNR claims.
The nature of the Company’s high excess of loss liability and catastrophe business can result in loss paymentsthat are both irregular and significant. Such loss payments are part of the normal course of business for theCompany. Adjustments to reserves for individual years can also be irregular and significant. Conditions and trendsthat have affected development of liabilities in the past may not necessarily occur in the future. Accordingly, it isinappropriate to extrapolate future redundancies or deficiencies based upon historical experience. See Part I,Item 1A, “Risk Factors” and Part II, Item 7, “Management’s Discussion and Analysis of Financial Condition andResults of Operations — Cautionary Note Regarding Forward-Looking Statements.”
The tables below present the development of the Company’s unpaid losses and loss expense reserves on both anet and gross basis. The cumulative redundancy (deficiency) calculated on a net basis differs from that calculated ona gross basis. As different reinsurance programs cover different underwriting years, net and gross loss experiencewill not develop proportionately. The top line of the tables shows the estimated liability, net and gross of reinsurancerecoveries, as at the year end balance sheet date for each of the indicated years. This represents the estimatedamounts of losses and loss expenses, including IBNR, arising in the current and all prior years that are unpaid at theyear end balance sheet date of the indicated year. The tables also show the re-estimated amount of the previouslyrecorded reserve liability based on experience as of the year end balance sheet date of each succeeding year. Theestimate changes as more information becomes known about the frequency and severity of claims for individualyears. The cumulative redundancy (deficiency) represents the aggregate change with respect to that liabilityoriginally estimated. The lower portion of each table also reflects the cumulative paid losses relating to thesereserves. Conditions and trends that have affected development of liabilities in the past may not necessarily occur inthe future. Accordingly, it is not appropriate to extrapolate redundancies or deficiencies into the future, based on the
13
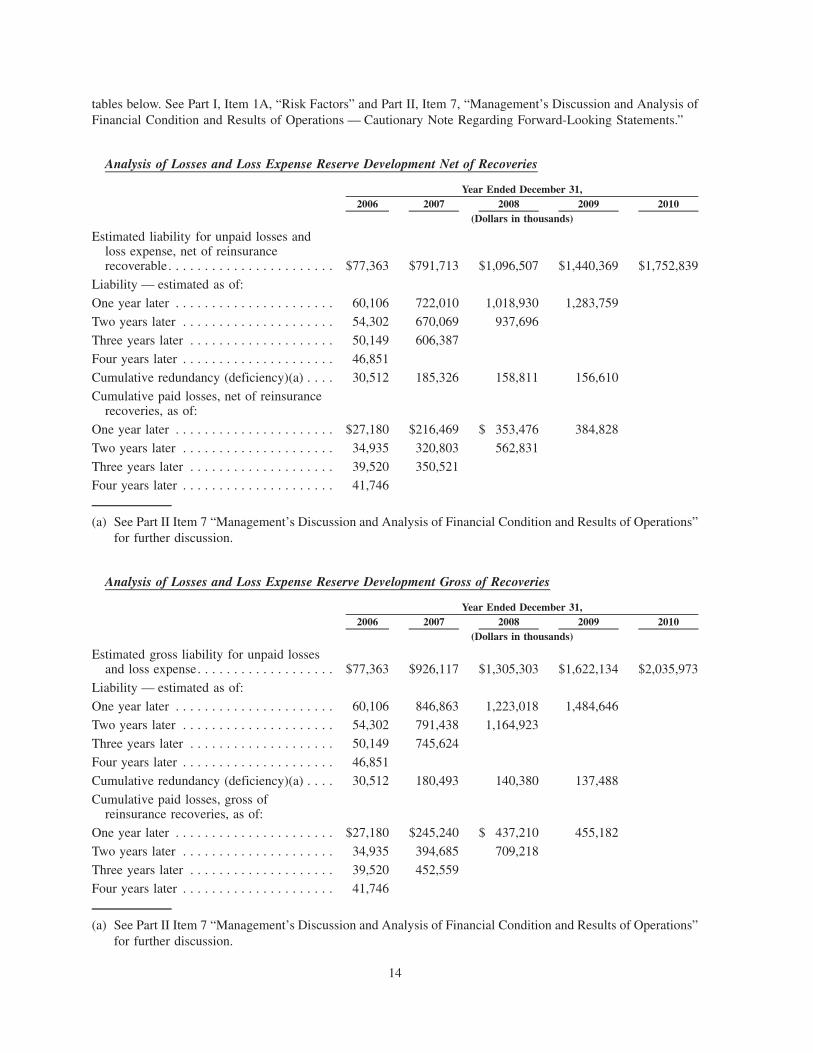
tables below. See Part I, Item 1A, “Risk Factors” and Part II, Item 7, “Management’s Discussion and Analysis ofFinancial Condition and Results of Operations — Cautionary Note Regarding Forward-Looking Statements.”
Analysis of Losses and Loss Expense Reserve Development Net of Recoveries
2006 2007 2008 2009 2010Year Ended December 31,
(Dollars in thousands)
Estimated liability for unpaid losses andloss expense, net of reinsurancerecoverable. . . . . . . . . . . . . . . . . . . . . . . $77,363 $791,713 $1,096,507 $1,440,369 $1,752,839
Liability — estimated as of:
One year later . . . . . . . . . . . . . . . . . . . . . . 60,106 722,010 1,018,930 1,283,759
Two years later . . . . . . . . . . . . . . . . . . . . . 54,302 670,069 937,696
Three years later . . . . . . . . . . . . . . . . . . . . 50,149 606,387
Four years later . . . . . . . . . . . . . . . . . . . . . 46,851
Cumulative redundancy (deficiency)(a) . . . . 30,512 185,326 158,811 156,610
Cumulative paid losses, net of reinsurancerecoveries, as of:
One year later . . . . . . . . . . . . . . . . . . . . . . $27,180 $216,469 $ 353,476 384,828
Two years later . . . . . . . . . . . . . . . . . . . . . 34,935 320,803 562,831
Three years later . . . . . . . . . . . . . . . . . . . . 39,520 350,521
Four years later . . . . . . . . . . . . . . . . . . . . . 41,746
(a) See Part II Item 7 “Management’s Discussion and Analysis of Financial Condition and Results of Operations”for further discussion.
Analysis of Losses and Loss Expense Reserve Development Gross of Recoveries
2006 2007 2008 2009 2010Year Ended December 31,
(Dollars in thousands)
Estimated gross liability for unpaid lossesand loss expense. . . . . . . . . . . . . . . . . . . $77,363 $926,117 $1,305,303 $1,622,134 $2,035,973
Liability — estimated as of:
One year later . . . . . . . . . . . . . . . . . . . . . . 60,106 846,863 1,223,018 1,484,646
Two years later . . . . . . . . . . . . . . . . . . . . . 54,302 791,438 1,164,923
Three years later . . . . . . . . . . . . . . . . . . . . 50,149 745,624
Four years later . . . . . . . . . . . . . . . . . . . . . 46,851
Cumulative redundancy (deficiency)(a) . . . . 30,512 180,493 140,380 137,488
Cumulative paid losses, gross ofreinsurance recoveries, as of:
One year later . . . . . . . . . . . . . . . . . . . . . . $27,180 $245,240 $ 437,210 455,182
Two years later . . . . . . . . . . . . . . . . . . . . . 34,935 394,685 709,218
Three years later . . . . . . . . . . . . . . . . . . . . 39,520 452,559
Four years later . . . . . . . . . . . . . . . . . . . . . 41,746
(a) See Part II Item 7 “Management’s Discussion and Analysis of Financial Condition and Results of Operations”for further discussion.
14
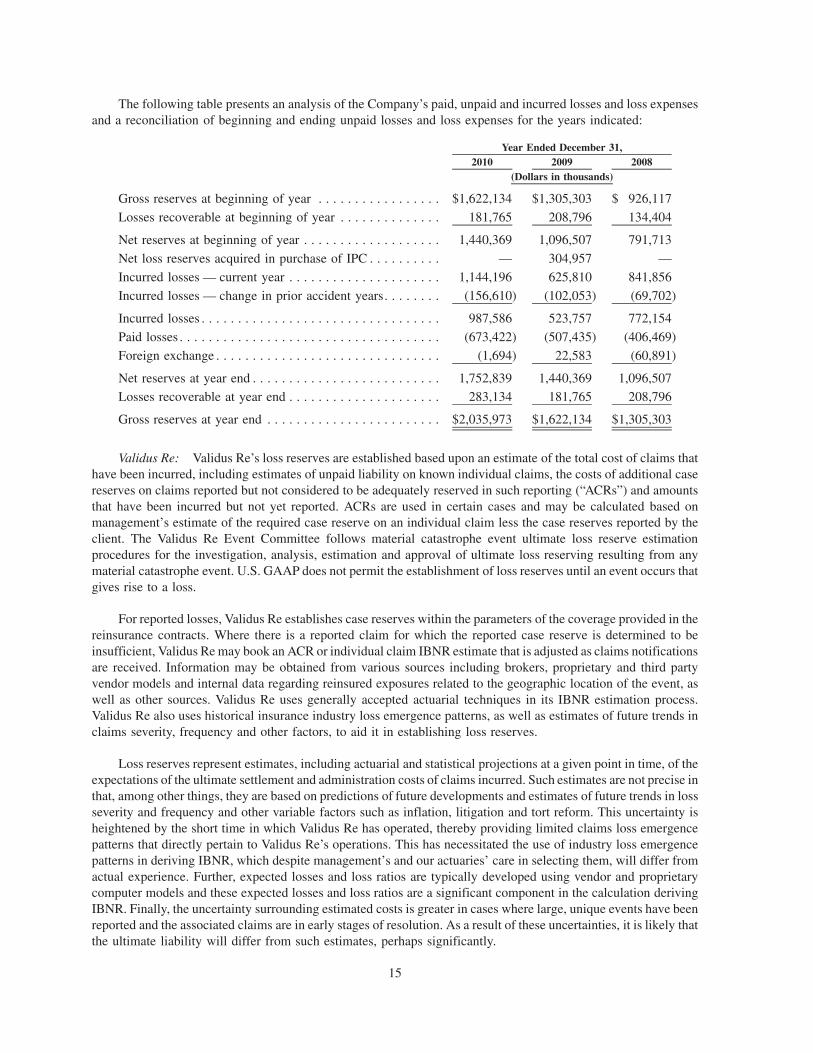
The following table presents an analysis of the Company’s paid, unpaid and incurred losses and loss expensesand a reconciliation of beginning and ending unpaid losses and loss expenses for the years indicated:
2010 2009 2008Year Ended December 31,
(Dollars in thousands)
Gross reserves at beginning of year . . . . . . . . . . . . . . . . . $1,622,134 $1,305,303 $ 926,117
Losses recoverable at beginning of year . . . . . . . . . . . . . . 181,765 208,796 134,404
Net reserves at beginning of year . . . . . . . . . . . . . . . . . . . 1,440,369 1,096,507 791,713
Net loss reserves acquired in purchase of IPC . . . . . . . . . . — 304,957 —
Incurred losses — current year . . . . . . . . . . . . . . . . . . . . . 1,144,196 625,810 841,856
Incurred losses — change in prior accident years. . . . . . . . (156,610) (102,053) (69,702)
Incurred losses . . . . . . . . . . . . . . . . . . . . . . . . . . . . . . . . . 987,586 523,757 772,154
Paid losses . . . . . . . . . . . . . . . . . . . . . . . . . . . . . . . . . . . . (673,422) (507,435) (406,469)
Foreign exchange . . . . . . . . . . . . . . . . . . . . . . . . . . . . . . . (1,694) 22,583 (60,891)
Net reserves at year end . . . . . . . . . . . . . . . . . . . . . . . . . . 1,752,839 1,440,369 1,096,507Losses recoverable at year end . . . . . . . . . . . . . . . . . . . . . 283,134 181,765 208,796
Gross reserves at year end . . . . . . . . . . . . . . . . . . . . . . . . $2,035,973 $1,622,134 $1,305,303
Validus Re: Validus Re’s loss reserves are established based upon an estimate of the total cost of claims thathave been incurred, including estimates of unpaid liability on known individual claims, the costs of additional casereserves on claims reported but not considered to be adequately reserved in such reporting (“ACRs”) and amountsthat have been incurred but not yet reported. ACRs are used in certain cases and may be calculated based onmanagement’s estimate of the required case reserve on an individual claim less the case reserves reported by theclient. The Validus Re Event Committee follows material catastrophe event ultimate loss reserve estimationprocedures for the investigation, analysis, estimation and approval of ultimate loss reserving resulting from anymaterial catastrophe event. U.S. GAAP does not permit the establishment of loss reserves until an event occurs thatgives rise to a loss.
For reported losses, Validus Re establishes case reserves within the parameters of the coverage provided in thereinsurance contracts. Where there is a reported claim for which the reported case reserve is determined to beinsufficient, Validus Re may book an ACR or individual claim IBNR estimate that is adjusted as claims notificationsare received. Information may be obtained from various sources including brokers, proprietary and third partyvendor models and internal data regarding reinsured exposures related to the geographic location of the event, aswell as other sources. Validus Re uses generally accepted actuarial techniques in its IBNR estimation process.Validus Re also uses historical insurance industry loss emergence patterns, as well as estimates of future trends inclaims severity, frequency and other factors, to aid it in establishing loss reserves.
Loss reserves represent estimates, including actuarial and statistical projections at a given point in time, of theexpectations of the ultimate settlement and administration costs of claims incurred. Such estimates are not precise inthat, among other things, they are based on predictions of future developments and estimates of future trends in lossseverity and frequency and other variable factors such as inflation, litigation and tort reform. This uncertainty isheightened by the short time in which Validus Re has operated, thereby providing limited claims loss emergencepatterns that directly pertain to Validus Re’s operations. This has necessitated the use of industry loss emergencepatterns in deriving IBNR, which despite management’s and our actuaries’ care in selecting them, will differ fromactual experience. Further, expected losses and loss ratios are typically developed using vendor and proprietarycomputer models and these expected losses and loss ratios are a significant component in the calculation derivingIBNR. Finally, the uncertainty surrounding estimated costs is greater in cases where large, unique events have beenreported and the associated claims are in early stages of resolution. As a result of these uncertainties, it is likely thatthe ultimate liability will differ from such estimates, perhaps significantly.
15
Loss reserves are reviewed regularly and adjustments to reserves, if any, will be recorded in earnings in theperiod in which they are determined. Even after such adjustments, the ultimate liability may exceed or be less thanthe revised estimates.
Talbot: Talbot’s loss reserves are established based upon an estimate of the total cost of claims that have beenincurred, including case reserves and IBNR. Talbot uses generally accepted actuarial techniques in its IBNRestimation process. ACRs are not generally used.
Talbot performs internal assessments of liabilities on a quarterly basis. Talbot’s loss reserving process involvesthe assessment of actuarial estimates of gross ultimate losses on both an ultimate basis (i.e., ignoring the periodduring which premium earns) and an earned basis, split by underwriting year and class of business, and generallyalso between attritional, large and catastrophe losses. These estimates are made using a variety of generallyaccepted actuarial projection methodologies, as well as additional qualitative consideration of future trends infrequency, severity and other factors. The gross estimates are used to estimate ceded reinsurance recoveries, whichare in turn used to calculate net ultimate losses and ultimate losses as the difference between gross and ceded. Thesefigures are subsequently used by Talbot’s management to help it assess its best estimate of gross and net ultimatelosses.
As with Validus Re, Talbot’s loss reserves represent estimates, including actuarial and statistical projections ata given point in time, of the expectations of the ultimate settlement and administration costs of claims incurred.Such estimates are not precise in that, among other things, they are based on predictions of future developments andestimates of future trends in loss severity and frequency and other variable factors such as inflation, litigation andtort reform. The uncertainty surrounding estimated costs is also greater in cases where large, unique events havebeen reported and the associated claims are in the early stages of resolution. As a result of these uncertainties, it islikely that the ultimate liability will differ from such estimates, perhaps significantly.
Talbot’s loss reserves are reviewed regularly and adjustments to reserves, if any, will be recorded in earnings inthe period in which they are determined. Even after such adjustments, the ultimate liability may exceed or be lessthan the revised estimates. See Part I, Item 1A, “Risk Factors” and Part II, Item 7, “Management’s Discussion andAnalysis of Financial Condition and Results of Operations — Cautionary Note Regarding Forward-LookingStatements.”
Claims Management
Claims management includes the receipt of initial loss notifications, generation of appropriate responses toclaim reports, identification and handling of coverage issues, determination of whether further investigation isrequired and, where appropriate retention of legal representation, establishment of case reserves, approval of losspayments and notification to reinsurers.
Validus Re: The role of our claims department is to investigate, evaluate and pay claims efficiently. Ourclaims director has implemented claims handling guidelines, and reporting and control procedures. The primaryobjectives of the claims department are to ensure that each claim is addressed, evaluated, processed andappropriately documented in a timely and efficient manner and information relevant to the management of theclaim is retained.
Talbot: Where Talbot is the lead syndicate on business written, the claims adjusters will deal with the brokerrepresenting the insured. This may involve appointing attorneys, loss adjusters or other experts. The central Lloyd’smarket claims bureau will respond on behalf of syndicates other than the leading syndicate.
Where Talbot is not the lead underwriter on syndicate business, the case reserves are established by the leadunderwriter in conjunction with third party/bureau input who then advise regarding movements in loss reserves toall syndicates participating on the risk. Material claims and claims movements are subject to review by Talbot.
16
Investments
The Company manages its investment portfolio on a consolidated basis. As we provide short-tail insurance andreinsurance coverage, we could become liable to pay substantial claims on short notice. Accordingly, we follow aconservative investment strategy designed to emphasize the preservation of invested assets and provide sufficientliquidity for the prompt payment of claims. Our Board of Directors, led by our Finance Committee, oversees ourinvestment strategy, and in consultation with BlackRock Financial Management, Inc., Goldman Sachs AssetManagement, Conning, Inc. and Pinebridge Investments Europe Ltd., our portfolio advisors, has establishedinvestment guidelines for us. The investment guidelines dictate the portfolio’s overall objective, benchmarkportfolio, eligible securities, duration, use of derivatives, inclusion of foreign securities, diversification require-ments and average portfolio rating. Management and the Finance Committee periodically review these guidelines inlight of our investment goals and consequently they may change at any time.
Substantially all of the fixed maturity investments held at December 31, 2010 were publicly traded. AtDecember 31, 2010, the average duration of the Company’s fixed maturity portfolio was 2.27 years (December 31,2009: 2.24 years). Management emphasizes capital preservation for the portfolio and maintains a significantallocation of short-term investments. At December 31, 2010, the average rating of the portfolio was AA+(December 31, 2009 AA+). At December 31, 2010, the total fixed maturity portfolio was $4,823.9 million(December 31, 2009: $4,869.4 million), of which $2,946.5 million (December 31, 2009: $3,287.9 million) wererated AAA.
Please refer to our Current Report on Form 8-K furnished to the Securities and Exchange Commission (the“SEC”) on February 10, 2011 for additional disclosure with respect to the composition of our investment portfolio.
Competition
The insurance and reinsurance industries are highly competitive. We compete with major U.S., Bermuda,European and other international insurers and reinsurers and certain underwriting syndicates and insurers. Weencounter competition in all of our classes of business but there is less competition in those of our lines where we area specialist underwriter. The Company competes with insurance and reinsurance providers such as:
• ACE Tempest Re, Aspen Insurance Holdings Limited, Allied World Assurance Company Holdings Limited,Alterra Capital Holdings, Ltd., Arch Capital Group Limited, Axis Capital Holdings Limited, EnduranceSpecialty Holdings Limited, Everest Re Group Limited, Flagstone Reinsurance Holdings Group Limited,Munich Re, PartnerRe Ltd., Platinum Underwriters Holdings Ltd., Renaissance Reinsurance Holdings Ltd.,Swiss Re and XL Re;
• Amlin plc, Catlin Group Limited, Hiscox and others in the Lloyd’s market;
• Direct insurers who compete with Lloyd’s on a worldwide basis;
• Various capital markets participants who access insurance and reinsurance business in securitized form,through special purpose entities or derivative transactions; and
• Government-sponsored insurers and reinsurers.
Competition varies depending on the type of business being insured or reinsured and whether the Company isin a leading or following position. Competition in the types of business that the Company underwrites is based onmany factors, including:
• Premiums charged and other terms and conditions offered;
• Services provided;
• Financial ratings assigned by independent rating agencies;
• Speed of claims payment;
• Reputation;
• Perceived financial strength; and
• The experience of the underwriter in the line of insurance or reinsurance written.
17

Increased competition could result in fewer submissions, lower premium rates, lower share of allocated cover,and less favorable policy terms, which could adversely impact the Company’s growth and profitability. Capitalmarket participants have created alternative products such as catastrophe bonds that are intended to compete withreinsurance products. The Company is unable to predict the extent to which these new, proposed or potentialinitiatives may affect the demand for products or the risks that may be available to consider underwriting.
Regulation
United States
Talbot operates primarily within the Lloyd’s insurance market through Syndicate 1183, and Lloyd’s operationsare subject to regulation in the United States in addition to being regulated in the United Kingdom, as discussedbelow. The Lloyd’s of London market is licensed to engage in insurance business in Illinois, Kentucky and theU.S. Virgin Islands and operates as an eligible excess and surplus lines insurer in all states and territories exceptKentucky and the U.S. Virgin Islands. Lloyd’s is also an accredited reinsurer in all states and territories of the UnitedStates. Lloyd’s maintains various trust funds in the state of New York to protect its United States business and istherefore subject to regulation by the New York Insurance Department, which acts as the domiciliary department forLloyd’s U.S. trust funds. There are deposit trust funds in other states to support Lloyd’s reinsurance and excess andsurplus lines insurance business.
Talbot is subject to a Closing Agreement between Lloyd’s and the U.S. Internal Revenue Service pursuant towhich Talbot is subject to U.S. federal income tax to the extent its income is attributable to U.S. agents who haveauthority to bind Talbot. Specifically, U.S. federal income tax is imposed on 35% of its income attributable toU.S. binding authorities (70% for Illinois or Kentucky business).
We currently conduct our business in a manner such that we expect that Validus Re will not be subject toinsurance and/or reinsurance licensing requirements or regulations in the United States. Although we do notcurrently intend for Validus Re to engage in activities which would require it to comply with insurance andreinsurance licensing requirements in the United States, should we choose to engage in activities that would requireValidus Re to become licensed in the United States, we cannot assure you that we will be able to do so or to do so in atimely manner. Furthermore, the laws and regulations applicable to direct insurers could indirectly affect us, such ascollateral requirements in various U.S. states to enable such insurers to receive credit for reinsurance ceded to us.
In addition, the insurance and reinsurance regulatory framework of Bermuda and the insurance of U.S. risk bycompanies based in Bermuda and not licensed or authorized in the United States recently has become the subject ofincreased scrutiny in many jurisdictions, including the United States. We are not able to predict the future impact ofchanges in the laws and regulation to which we are or may become subject on the Company’s financial condition orresults of operations.
United Kingdom
The financial services industry in the UK is regulated by the Financial Services Authority (“FSA”). The FSA isan independent non-governmental body, given statutory powers by the Financial Services and Markets Act 2000.Although accountable to treasury ministers and through them to Parliament, it is funded entirely by the firms itregulates. The FSA has wide ranging powers in relation to rule-making, investigation and enforcement to enable itto meet its four statutory objectives, which are summarized as one overall aim: “to promote efficient, orderly andfair markets and to help retail consumers achieve a fair deal.”
In relation to insurance business, the FSA regulates insurers, insurance intermediaries and Lloyd’s itself. TheFSA and Lloyd’s have common objectives in ensuring that Lloyd’s market is appropriately regulated and, tominimize duplication, the FSA has agreed arrangements with Lloyd’s for co-operation on supervision andenforcement.
Talbot’s underwriting activities are therefore regulated by the FSA as well as being subject to the Lloyd’s“franchise”. Both FSA and Lloyd’s have powers to remove their respective authorization to manage Lloyd’ssyndicates. Lloyd’s approves annually Syndicate 1183’s business plan and any subsequent material changes, and the
18

amount of capital required to support that plan. Lloyd’s may require changes to any business plan presented to it oradditional capital to be provided to support the underwriting (known as Funds as Lloyd’s).
In addition, Talbot’s intermediary company, Underwriting Risk Services Ltd. is regulated by the FSA as aninsurance intermediary.
In November 2007 Talbot established Talbot Risk Services Pte Ltd in Singapore to source business in the FarEast under the Lloyd’s Asia Scheme. The Lloyds Asia Scheme was established by the Monetary Authority ofSingapore to encourage members of Lloyd’s to expand insurance activities in Asia.
An EU directive covering the capital adequacy, risk management and regulatory reporting for insurers, knownas Solvency II was adopted by the European Parliament in April 2009. Based on a recent EU directive, we expectthat insurers and reinsurers within the EEA will need to be compliant with Solvency II by January 1, 2013. Insurersand reinsurers are undertaking a significant amount of work to ensure that they meet the new requirements and thismay divert finite resources from other operational roles. Final Solvency II guidelines have been published and theCompany and Talbot’s implementation plans are well underway.
Bermuda
The Insurance Act 1978 regulates the Company’s operating subsidiaries in Bermuda, and it provides that noperson may carry on any insurance business in or from within Bermuda unless registered as an insurer by theBermuda Monetary Authority (the “BMA”) under the Insurance Act. Insurance as well as reinsurance is regulatedunder the Insurance Act.
The Insurance Act imposes on Bermuda insurance companies solvency and liquidity standards, certainrestrictions on the declaration and payment of dividends and distributions, certain restrictions on the reduction ofstatutory capital, auditing and reporting requirements, and grants the BMA powers to supervise, investigate andintervene in the affairs of insurance companies. Significant requirements include the appointment of an independentauditor, the appointment of a loss reserve specialist and the filing of an Annual Statutory Financial Return with theBMA. The Supervisor of Insurance is the chief administrative officer under the Insurance Act.
Under the Bermuda Companies Act 1981, as amended, a Bermuda company may not declare or pay a dividendor make a distribution out of contributed surplus if there are reasonable grounds for believing that: (a) the companyis, or would after the payment be, unable to pay its liabilities as they become due; or (b) the realizable value of thecompany’s assets would thereby be less than the aggregate of its liabilities and its issued share capital and sharepremium accounts.
Effective for statutory filings for the year ended December 31, 2008, the BMA introduced a risk-based capitalmodel, or Bermuda Solvency Capital Requirement (“BSCR”), as a tool to assist the BMA in measuring risk anddetermining appropriate capitalization. In 2009, the BMA launched its Bermuda Insurance Solvency Framework,which is designed to enable Bermuda to achieve “equivalence” with Solvency II. The impact of this initiative iscurrently being monitored by the Company.
19
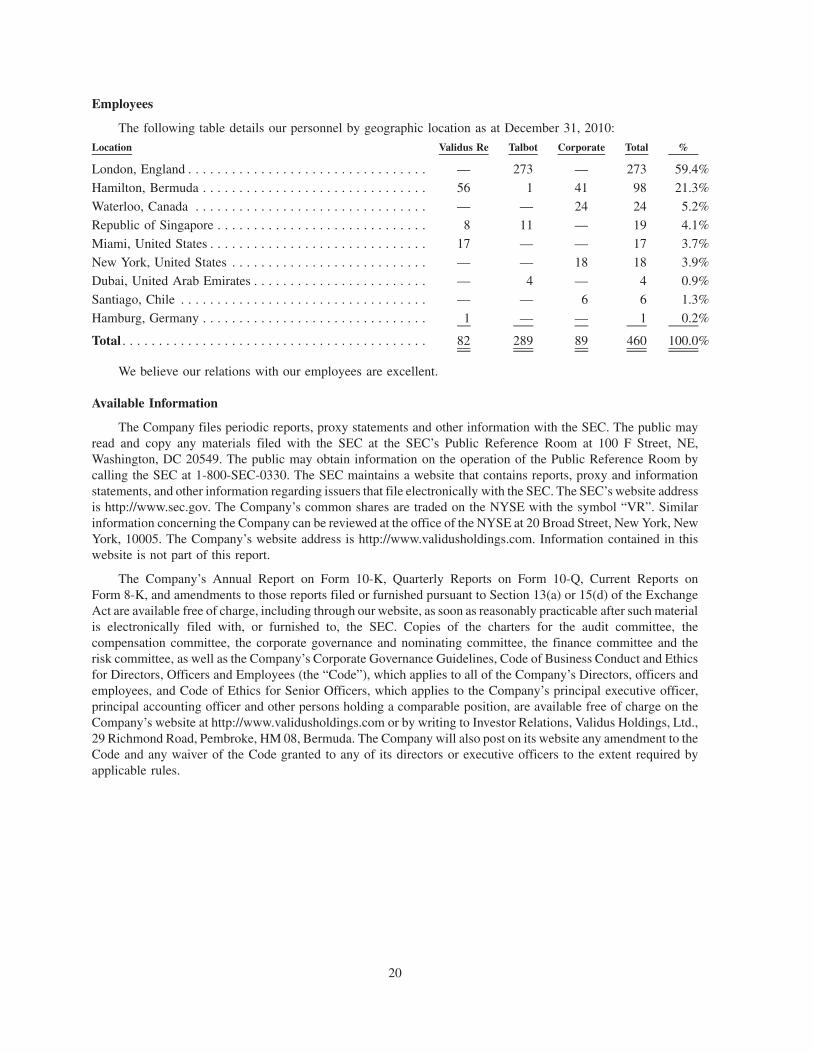
Employees
The following table details our personnel by geographic location as at December 31, 2010:
Location Validus Re Talbot Corporate Total %
London, England . . . . . . . . . . . . . . . . . . . . . . . . . . . . . . . . . — 273 — 273 59.4%
Hamilton, Bermuda . . . . . . . . . . . . . . . . . . . . . . . . . . . . . . . 56 1 41 98 21.3%
Waterloo, Canada . . . . . . . . . . . . . . . . . . . . . . . . . . . . . . . . — — 24 24 5.2%
Republic of Singapore . . . . . . . . . . . . . . . . . . . . . . . . . . . . . 8 11 — 19 4.1%
Miami, United States . . . . . . . . . . . . . . . . . . . . . . . . . . . . . . 17 — — 17 3.7%
New York, United States . . . . . . . . . . . . . . . . . . . . . . . . . . . — — 18 18 3.9%Dubai, United Arab Emirates . . . . . . . . . . . . . . . . . . . . . . . . — 4 — 4 0.9%
Santiago, Chile . . . . . . . . . . . . . . . . . . . . . . . . . . . . . . . . . . — — 6 6 1.3%
Hamburg, Germany . . . . . . . . . . . . . . . . . . . . . . . . . . . . . . . 1 — — 1 0.2%
Total . . . . . . . . . . . . . . . . . . . . . . . . . . . . . . . . . . . . . . . . . . 82 289 89 460 100.0%
We believe our relations with our employees are excellent.
Available Information
The Company files periodic reports, proxy statements and other information with the SEC. The public mayread and copy any materials filed with the SEC at the SEC’s Public Reference Room at 100 F Street, NE,Washington, DC 20549. The public may obtain information on the operation of the Public Reference Room bycalling the SEC at 1-800-SEC-0330. The SEC maintains a website that contains reports, proxy and informationstatements, and other information regarding issuers that file electronically with the SEC. The SEC’s website addressis http://www.sec.gov. The Company’s common shares are traded on the NYSE with the symbol “VR”. Similarinformation concerning the Company can be reviewed at the office of the NYSE at 20 Broad Street, New York, NewYork, 10005. The Company’s website address is http://www.validusholdings.com. Information contained in thiswebsite is not part of this report.
The Company’s Annual Report on Form 10-K, Quarterly Reports on Form 10-Q, Current Reports onForm 8-K, and amendments to those reports filed or furnished pursuant to Section 13(a) or 15(d) of the ExchangeAct are available free of charge, including through our website, as soon as reasonably practicable after such materialis electronically filed with, or furnished to, the SEC. Copies of the charters for the audit committee, thecompensation committee, the corporate governance and nominating committee, the finance committee and therisk committee, as well as the Company’s Corporate Governance Guidelines, Code of Business Conduct and Ethicsfor Directors, Officers and Employees (the “Code”), which applies to all of the Company’s Directors, officers andemployees, and Code of Ethics for Senior Officers, which applies to the Company’s principal executive officer,principal accounting officer and other persons holding a comparable position, are available free of charge on theCompany’s website at http://www.validusholdings.com or by writing to Investor Relations, Validus Holdings, Ltd.,29 Richmond Road, Pembroke, HM 08, Bermuda. The Company will also post on its website any amendment to theCode and any waiver of the Code granted to any of its directors or executive officers to the extent required byapplicable rules.
20
Item 1A. Risk Factors
Risks Related to Our Company
Claims on policies written under our short-tail insurance lines that arise from unpredictable and severecatastrophic events could adversely affect our financial condition or results of operations.
Substantially all of our gross premiums written to date are in short-tail lines, many of which have the potentialto accumulate, which means we could become liable for a significant amount of losses in a brief period. The short-tail policies we write expose us to claims arising out of unpredictable natural and other catastrophic events, whetherarising from natural causes such as hurricanes, windstorms, tsunamis, severe winter weather, earthquakes andfloods, or man-made causes such as fires, explosions, acts of terrorism, war or political unrest. Many observersbelieve that the Atlantic basin is in the active phase of a multi-decade cycle in which conditions in the ocean andatmosphere, including warmer-than-average sea-surface temperatures and low wind shear, enhance hurricaneactivity. This increase in the number and intensity of tropical storms and hurricanes can span multiple decades(approximately 20 to 30 years). These conditions may translate to a greater potential for hurricanes to make landfallin the U.S. at higher intensities over the next five years. In addition, climate change may be causing changes inglobal temperatures, which may in the future increase the frequency and severity of natural catastrophes and thelosses resulting therefrom. Although the frequency and severity of catastrophes are inherently unpredictable, we usestate-of-science understanding of climate change and other climate signals for pricing and risk aggregation.
The extent of losses from catastrophes is a function of both the number and severity of the insured events andthe total amount of insured exposure in the areas affected. Increases in the value and concentrations of insuredproperty, the effects of inflation and changes in cyclical weather patterns may increase the severity of claims fromnatural catastrophic events in the future. Similarly, changes in global political and economic conditions mayincrease both the frequency and severity of man-made catastrophic events in the future. Claims from catastrophicevents could reduce our earnings and cause substantial volatility in our results of operations for any fiscal quarter oryear, which could adversely affect our financial condition, possibly to the extent of eliminating our shareholders’equity. Our ability to write new reinsurance policies could also be affected as a result of corresponding reductions inour capital.
Underwriting is inherently a matter of judgment, involving important assumptions about matters that areunpredictable and beyond our control, and for which historical experience and probability analysis may not providesufficient guidance. One or more catastrophic or other events could result in claims that substantially exceed ourexpectations and which would become due in a short period of time, which could materially adversely affect ourfinancial condition, liquidity or results of operations.
Emerging claim and coverage issues could adversely affect our business.
As industry practices and legal, judicial, social and other environmental conditions change, unexpected andunintended issues related to claims and coverage may emerge. These issues may adversely affect our business byeither extending coverage beyond our underwriting intent or by increasing the number or size of claims. In someinstances, these changes may not become apparent until sometime after we have issued insurance or reinsurancecontracts that are affected by the changes. For example, a (re)insurance contract might limit the amount that can berecovered as a result of flooding. However, if the flood damage was caused by an event that also caused extensivewind damage, the quantification of the two types of damage is often a matter of judgment. Similarly, one geographiczone could be affected by more than one catastrophic event. In this case, the amount recoverable from an insurer orreinsurer may in part be determined by the judgmental allocation of damage between the storms. Given themagnitude of the amounts at stake involved with a catastrophic event, these types of issues occasionally necessitatejudicial resolution. In addition, our actual losses may vary materially from our current estimate of the loss based ona number of factors, including receipt of additional information from insureds or brokers, the attribution of losses tocoverages that had not previously been considered as exposed and inflation in repair costs due to additional demandfor labor and materials. As a result, the full extent of liability under an insurance or reinsurance contract may not beknown for many years after such contract is issued and a loss occurs. Our exposure to this uncertainty is greater inour longer tail lines (marine and energy liabilities and financial institutions).
21
We depend on ratings from third party rating agencies. Our financial strength rating could be reviseddownward, which could affect our standing among brokers and customers, cause our premiums andearnings to decrease and limit our ability to pay dividends on our common shares.
Third-party rating agencies assess and rate the financial strength of insurers and reinsurers based upon criteriaestablished by the rating agencies, which criteria are subject to change. The financial strength ratings assigned byrating agencies to insurance and reinsurance companies represent independent opinions of financial strength andability to meet policyholder obligations and are not directed toward the protection of investors. Ratings havebecome an increasingly important factor in establishing the competitive position of insurance and reinsurancecompanies. Insurers and intermediaries use these ratings as one measure by which to assess the financial strengthand quality of insurers and reinsurers. These ratings are often a key factor in the decision by an insured orintermediary of whether to place business with a particular insurance or reinsurance provider. These ratings are notan evaluation directed toward the protection of investors or a recommendation to buy, sell or hold our commonshares.
If our financial strength rating is reduced from current levels, our competitive position in the reinsuranceindustry would suffer, and it would be more difficult for us to market our products. A downgrade could result in asignificant reduction in the number of reinsurance contracts we write and in a substantial loss of business as ourcustomers and brokers that place such business, move to other competitors with higher financial strength ratings.The substantial majority of reinsurance contracts issued through reinsurance brokers contain provisions permittingthe ceding company to cancel such contracts in the event of a downgrade of the reinsurer by A.M. Best below “A�”(Excellent).
We cannot predict in advance the extent to which this cancellation right would be exercised, if at all, or whateffect any such cancellations would have on our financial condition or future operations, but such effect could bematerial and adverse. Consequently, substantially all of Validus Re’s business could be affected by a downgrade ofour A.M. Best rating.
The indenture governing our Junior Subordinated Deferrable Debentures would restrict us from declaring orpaying dividends on our common shares if we are downgraded by A.M. Best to a financial strength rating of “B”(Fair) or below or if A.M. Best withdraws its financial strength rating on any of our material insurance subsidiaries.A downgrade of the Company’s A.M. Best financial strength rating below “B++” (Fair) would also constitute anevent of default under our credit facilities. Either of these events could, among other things, reduce the Company’sfinancial flexibility.
If the Company’s risk management and loss limitation methods fail to adequately manage exposure tolosses from catastrophic events, our financial condition and results of operations could be adverselyaffected.
Validus Re manages exposure to catastrophic losses by analyzing the probability and severity of the occurrenceof catastrophic events and the impact of such events on our overall (re)insurance and investment portfolio. ValidusRe uses various tools to analyze and manage the reinsurance exposures assumed from insureds and cedingcompanies and risks from a catastrophic event that could have an adverse effect on the investment portfolio.VCAPS, a proprietary risk modeling software, enables Validus Re to assess the adequacy of reinsurance risk pricingand to monitor the overall exposure to insurance and reinsurance risk in correlated geographic zones. Validus Recannot assure the models and assumptions used by the software will accurately predict losses. Further, Validus Recannot assure that it is free of defects in the modeling logic or in the software code. In addition, Validus Re has notsought copyright or other legal protection for VCAPS.
In addition, much of the information that Validus Re enters into the risk modeling software is based on third-party data that we cannot assure to be reliable, as well as estimates and assumptions that are dependent on manyvariables, such as assumptions about building material and labor demand surge, storm surge, the expenses ofsettling claims (known as loss adjustment expenses), insurance-to-value and storm intensity. Accordingly, if theestimates and assumptions that are entered into the proprietary risk model are incorrect, or if the proprietary riskmodel proves to be an inaccurate forecasting tool, the losses Validus Re might incur from an actual catastrophe
22

could be materially higher than its expectation of losses generated from modeled catastrophe scenarios, and itsfinancial condition and results of operations could be adversely affected.
A modeled outcome of net loss from a single event also relies in significant part on the reinsurance andretrocessional arrangements in place, or expected to be in place at the time of the analysis, and may change duringthe year. Modeled outcomes assume that the reinsurance in place responds as expected with minimal reinsurancefailure or dispute. Reinsurance and retrocessional coverage is purchased to protect the inwards exposure in line withthe Company’s risk appetite, but it is possible for there to be a mismatch or gap in cover which could result in higherthan modeled losses to Validus Re. In addition, many parts of the reinsurance program are purchased with limitedreinstatements and, therefore, the number of claims or events which may be recovered from second or subsequentevents is limited. It should also be noted that renewal dates of the reinsurance and retrocessional program do notnecessarily coincide with those of the inwards business written. Where inwards business is not protected by risksattaching reinsurance and retrocessional programs, the programs could expire resulting in an increase in thepossible net loss retained by Validus Re and as such, could have a material adverse effect on our financial conditionand results of operations.
Validus Re also seeks to limit loss exposure through loss limitation provisions in its policies, such aslimitations on the amount of losses that can be claimed under a policy, limitations or exclusions from coverage andprovisions relating to choice of forum, which are intended to assure that their policies are legally interpreted asintended. Validus Re cannot assure that these contractual provisions will be enforceable in the manner expected orthat disputes relating to coverage will be resolved in its favor. If the loss limitation provisions in the policies are notenforceable or disputes arise concerning the application of such provisions, the losses it might incur from acatastrophic event could be materially higher than expectation and its financial condition and results of operationscould be adversely affected.
The insurance and reinsurance business is historically cyclical, and we expect to experience periods withexcess underwriting capacity and unfavorable premium rates and policy terms and conditions, whichcould materially adversely affect our financial condition and results of operations.
The insurance and reinsurance industry has historically been cyclical. Insurers and reinsurers have experiencedsignificant fluctuations in operating results due to competition, frequency of occurrence or severity of catastrophicevents, levels of underwriting capacity, underwriting results of primary insurers, general economic conditions andother factors. The supply of insurance and reinsurance is related to prevailing prices, the level of insured losses andthe level of industry surplus which, in turn, may fluctuate, including in response to changes in rates of return oninvestments being earned in the reinsurance industry.
The insurance and reinsurance pricing cycle has historically been a market phenomenon, driven by supply anddemand rather than by the actual cost of coverage. The upward phase of a cycle is often triggered when a majorevent forces insurers and reinsurers to make large claim payments, thereby drawing down capital. This, combinedwith increased demand for insurance against the risk associated with the event, pushes prices upwards. Over time,insurers’ and reinsurers’ capital is replenished with the higher revenues. At the same time, new entrants flock to theindustry seeking a part of the profitable business. This combination prompts a slide in prices — the downwardcycle — until a major insured event restarts the upward phase. As a result, the insurance and reinsurance businesshas been characterized by periods of intense competition on price and policy terms due to excessive underwritingcapacity, which is the percentage of surplus or the dollar amount of exposure that a reinsurer is willing to place atrisk, as well as periods when shortages of capacity result in favorable premium rates and policy terms andconditions.
Premium levels may be adversely affected by a number of factors which fluctuate and may contribute to pricedeclines generally in the reinsurance industry. For example, as premium levels for many products increasedsubsequent to the significant natural catastrophes of 2004 and 2005, the supply of reinsurance increased, either as aresult of capital provided by new entrants or by the commitment of additional capital by existing reinsurers.Increases in the supply of insurance and reinsurance may have consequences for the reinsurance industry generallyand for us including fewer contracts written, lower premium rates, increased expenses for customer acquisition andretention, and less favorable policy terms and conditions. As a consequence, the Company may experience greater
23
competition on most insurance and reinsurance lines. This could adversely affect the rates we receive for ourreinsurance and our gross premiums written.
The cyclical trends in the industry and the industry’s profitability can also be affected significantly by volatileand unpredictable developments, such as natural disasters (such as catastrophic hurricanes, windstorms, tornados,earthquakes and floods), courts granting large awards for certain damages, fluctuations in interest rates, changes inthe investment environment that affect market prices of investments and inflationary pressures that may tend toaffect the size of losses experienced by insureds and primary insurance companies. We expect to experience theeffects of cyclicality, which could materially adversely affect our financial condition and results of operations.
Competition for business in our industry is intense, and if we are unable to compete effectively, we maynot be able to retain market share and our business may be materially adversely affected.
The insurance and reinsurance industries are highly competitive. We face intense competition, based upon(among other things) global capacity, product breadth, reputation and experience with respect to particular lines ofbusiness, relationships with (re)insurance intermediaries, quality of service, capital and perceived financial strength(including independent rating agencies’ ratings), innovation and price. We compete with major global insurance andreinsurance companies and underwriting syndicates, many of which have extensive experience in (re)insurance andmay have greater financial, marketing and employee resources available to them than us. Other financialinstitutions, such as banks and hedge funds, now offer products and services similar to our products and servicesthrough alternative capital markets products that are structured to provide protections similar to those provided byreinsurers. These products, such as catastrophe-linked bonds, compete with our products. In the future, under-writing capacity will continue to enter the market from these identified competitors and perhaps other sources. Afterthe events of September 11, 2001, and then again following the three major hurricanes of 2005 (Katrina, Rita andWilma), new capital flowed into Bermuda, and much of these new proceeds went to a variety of Bermuda-basedstart-up companies. Since markets have softened and capital has increased, market conditions have become lessfavorable. Increased competition could result in fewer submissions and lower rates, which could have an adverseeffect on our growth and profitability. If we are unable to compete effectively against these competitors, we may notbe able to retain market share.
Insureds have been retaining a greater proportion of their risk portfolios than previously, and industrial andcommercial companies have been increasingly relying upon their own subsidiary insurance companies, known ascaptive insurance companies, self-insurance pools, risk retention groups, mutual insurance companies and othermechanisms for funding their risks, rather than risk transferring insurance. This has put downward pressure oninsurance premiums.
If we underestimate our reserve for losses and loss expenses, our financial condition and results ofoperations could be adversely affected.
Our success depends on our ability to accurately assess the risks associated with the businesses and propertiesthat we insure/reinsure. If unpredictable catastrophic events occur, or if we fail to adequately manage our exposureto losses or fail to adequately estimate our reserve requirements, our actual losses and loss expenses may deviate,perhaps substantially, from our reserve estimates.
We estimate the risks associated with our outstanding obligations, including the risk embedded within ourunearned premiums. To do this, we establish reserves for losses and loss expenses (or loss reserves), which areliabilities that we record to reflect the estimated costs of claim payment and the related expenses that we willultimately be required to pay in respect of premiums written and include case reserves and incurred but not reported(“IBNR”) reserves. However, under U.S. GAAP, we are not permitted to establish reserves for losses until an eventwhich gives rise to a claim occurs. As a result, only reserves applicable to losses incurred up to the reporting date maybe set aside on our financial statements, with no allowance for the provision of loss reserves to account for possibleother future losses. Case reserves are reserves established with respect to specific individual reported claims. IBNRreserves are reserves for estimated losses that we have incurred but that have not yet been reported to us.
Our reserve estimates do not represent an exact calculation of liability. Rather, they are estimates of what weexpect the ultimate settlement and administration of claims will cost. These estimates are based upon actuarial and
24
statistical projections and on our assessment of currently available data, predictions of future developments andestimates of future trends and other variable factors such as inflation. Establishing an appropriate level of our lossreserve estimates is an inherently uncertain process. It is likely that the ultimate liability will be greater or less thanthese estimates and that, at times, this variance will be material. Our reserve estimates are regularly refined asexperience develops and claims are reported and settled. Establishing an appropriate level for our reserve estimatesis an inherently uncertain process. In addition, as we operate largely through intermediaries, reserving for ourbusiness can involve added uncertainty arising from our dependence on information from ceding companies which,in addition to the risk of receiving inaccurate information involves an inherent time lag between reportinginformation from the primary insurer to us. Additionally, ceding companies employ differing reserving practiceswhich add further uncertainty to the establishment of our reserves. Moreover, these uncertainties are greater forreinsurers like us than for reinsurers with a longer operating history, because we do not yet have an established losshistory. The lack of historical information for the Company has necessitated the use of industry loss emergencepatterns in deriving IBNR. Loss emergence patterns are development patterns used to project current reported orpaid loss amounts to their ultimate settlement value or amount. Further, expected losses and loss ratios are typicallydeveloped using vendor and proprietary computer models and these expected loss ratios are a material component inthe calculation deriving IBNR. Actual loss ratios will deviate from expected loss ratios and ultimate loss ratios willbe greater or less than expected loss ratios. Because of these uncertainties, it is possible that our estimates forreserves at any given time could prove inadequate.
To the extent we determine that actual losses and loss adjustment expenses from events which have occurredexceed our expectations and the loss reserves reflected in our financial statements, we will be required to reflectthese changes in the current reporting period. This could cause a sudden and material increase in our liabilities and areduction in our profitability, including operating losses and reduction of capital, which could materially restrict ourability to write new business and adversely affect our financial condition and results of operations and potentiallyour A.M. Best rating.
The preparation of our financial statements will require us to make many estimates and judgments, whichare even more difficult than those made in a mature company, and which, if inaccurate, could causevolatility in our results.
Our consolidated financial statements have been prepared in accordance with U.S. GAAP. Managementbelieves the item that requires the most subjective and complex estimates is the reserve for losses and loss expenses.Due to the Company’s relatively short operating history, loss experience is limited and reliable evidence of changesin trends of numbers of claims incurred, average settlement amounts, numbers of claims outstanding and averagelosses per claim will necessarily take many years to develop. Following a major catastrophic event, the possibility offuture litigation or legislative change that may affect interpretation of policy terms further increases the degree ofuncertainty in the reserving process. The uncertainties inherent in the reserving process, together with the potentialfor unforeseen developments, including changes in laws and the prevailing interpretation of policy terms, may resultin losses and loss expenses materially different than the reserves initially established. Changes to prior year reserveswill affect current underwriting results by increasing net income if the prior year reserves prove to be redundant orby decreasing net income if the prior year reserves prove to be insufficient. We expect volatility in results in periodsin which significant loss events occur because U.S. GAAP does not permit insurers or reinsurers to reserve for lossevents until they have occurred and are expected to give rise to a claim. As a result, we are not allowed to recordcontingency reserves to account for expected future losses. We anticipate that claims arising from future events willrequire the establishment of substantial reserves from time to time.
We rely on key personnel and the loss of their services may adversely affect us. The Bermuda location ofour head office may be an impediment to attracting and retaining experienced personnel.
Various aspects of our business depend on the services and skills of key personnel of the Company. We believethere are only a limited number of available qualified executives in the business lines in which we compete. We relysubstantially upon the services of Edward J. Noonan, Chairman of our Board of Directors and Chief ExecutiveOfficer; Joseph E. (Jeff) Consolino, President and Chief Financial Officer; C.N. Rupert Atkin, Chief ExecutiveOfficer of the Talbot Group; Michael E.A. Carpenter, Chairman of the Talbot Group; C. Jerome Dill, Executive Vice
25
President and General Counsel; Stuart W. Mercer, Executive Vice President; Jonathan P. Ritz, Executive VicePresident, Business Operations; Julian G. Ross, Chief Risk Officer; and Conan M. Ward, Executive Vice Presidentof the Company and Chief Executive Officer of Validus Reinsurance, Ltd., among other key employees. The loss ofany of their services or the services of other members of our management team or any difficulty in attracting andretaining other talented personnel could impede the further implementation of our business strategy, reduce ourrevenues and decrease our operational effectiveness. Although we have an employment agreement with each of theabove named executives, there is a possibility that these employment agreements may not be enforceable in theevent any of these employees leave. The employment agreements for each of the above-named executives providethat the terms of the agreement will continue for a defined period after either party giving notice of termination, andwill terminate immediately upon the Company giving notice of termination for cause. We do not currently maintainkey man life insurance policies with respect to them or any of our other employees.
The operating location of our head office and our Validus Re subsidiary may be an impediment to attractingand retaining experienced personnel. Under Bermuda law, non-Bermudians (other than spouses of Bermudians)may not engage in any gainful occupation in Bermuda without an appropriate governmental work permit. Oursuccess may depend in part on the continued services of key employees in Bermuda. Awork permit may be grantedor renewed upon demonstrating that, after proper public advertisement, no Bermudian (or spouse of a Bermudian ora holder of a permanent resident’s certificate or holder of a working resident’s certificate) is available who meets theminimum standards reasonably required by the employer. The Bermuda government’s policy places a six-year termlimit on individuals with work permits, subject to certain exemptions for key employees. A work permit is issuedwith an expiry date (up to five years) and no assurances can be given that any work permit will be issued or, if issued,renewed upon the expiration of the relevant term. If work permits are not obtained, or are not renewed, for ourprincipal employees, we would lose their services, which could materially affect our business. Work permits arecurrently required for 44 of our Bermuda employees, all of whom have obtained three- or five-year work permits.
Certain of our directors and officers may have conflicts of interest with us.
Entities affiliated with some of our directors have sponsored or invested in, and may in the future sponsor orinvest in, other entities engaged in or intending to engage in insurance and reinsurance underwriting, some of whichcompete with us. They have also entered into, or may in the future enter into, agreements with companies thatcompete with us.
We have a policy in place applicable to each of our directors and officers which provides for the resolution ofpotential conflicts of interest. However, we may not be in a position to influence any party’s decision to engage inactivities that would give rise to a conflict of interest, and they may take actions that are not in our shareholders’ bestinterests.
We may require additional capital or credit in the future, which may not be available or only available onunfavorable terms.
We monitor our capital adequacy on a regular basis. The capital requirements of our business depend on manyfactors, including our premiums written, loss reserves, investment portfolio composition and risk exposures, as wellas satisfying regulatory and rating agency capital requirements. Our ability to underwrite is largely dependent uponthe quality of our claims paying and financial strength ratings as evaluated by independent rating agencies. To theextent that our existing capital is insufficient to fund our future operating requirements and/or cover claim losses,we may need to raise additional funds through financings or limit our growth. Any equity or debt financing, ifavailable at all, may be on terms that are unfavorable to us. In the case of equity financings, dilution to ourshareholders could result, and, in any case, such securities may have rights, preferences and privileges that aresenior to those of our outstanding securities. In addition, the capital and credit markets have been experiencingextreme volatility and disruption for more than one year. In some cases, the markets have exerted downwardpressure on the availability of liquidity and credit capacity for certain issuers. If we are not able to obtain adequatecapital, our business, results of operations and financial condition could be adversely affected.
In addition, as an alien insurer and reinsurer (not licensed in the U.S.), we are required to post collateralsecurity with respect to any (re)insurance liabilities that we assume from insureds or ceding insurers domiciled in
26

the U.S. in order for U.S. ceding companies to obtain full statutory and regulatory credit for our reinsurance. Otherjurisdictions may have similar collateral requirements. Under applicable statutory provisions, these securityarrangements may be in the form of letters of credit, insurance or reinsurance trusts maintained by trustees orfunds-withheld arrangements where assets are held by the ceding company. We intend to satisfy such statutoryrequirements by maintaining the trust fund requirements for Talbot’s underwriting at Lloyd’s and by providing toprimary insurers letters of credit issued under our credit facilities. To the extent that we are required to postadditional security in the future, we may require additional letter of credit capacity and there can be no assurancethat we will be able to obtain such additional capacity or arrange for other types of security on commerciallyacceptable terms or on terms as favorable as under our current letter of credit facilities. Our inability to providecollateral satisfying the statutory and regulatory guidelines applicable to insureds and primary insurers would havea material adverse effect on our ability to provide (re)insurance to third parties and negatively affect our financialposition and results of operations.
Security arrangements may subject our assets to security interests and/or require that a portion of our assets bepledged to, or otherwise held by, third parties. Although the investment income derived from our assets while held intrust typically accrues to our benefit, the investment of these assets is governed by the investment regulations of thestate of domicile of the ceding insurer and therefore the investment returns on these assets may not be as high as theyotherwise would be.
Loss of business from one or more major brokers could adversely affect us.
We market our insurance and reinsurance on a worldwide basis primarily through brokers, and we depend on asmall number of brokers for a large portion of our revenues. For the year ended December 31, 2010, our businesswas primarily sourced from the following brokers: Marsh Inc./Guy Carpenter & Co. 25.5%, Aon Benfield GroupLtd. 22.6% and Willis Group Holdings Ltd. 17.1%. These three brokers provided a total of 65.2% of our grosspremiums written for the year ended December 31, 2010. Loss of all or a substantial portion of the businessprovided by one or more of these brokers could adversely affect our business.
We assume a degree of credit risk associated with substantially all of our brokers.
In accordance with industry practice, we frequently pay amounts owed on claims under our policies to brokersand the brokers, in turn, pay these amounts over to the ceding insurers and reinsurers that have reinsured a portion oftheir liabilities with us. In some jurisdictions, if a broker fails to make such a payment, we might remain liable to theceding insurer or reinsurer for the deficiency notwithstanding the broker’s obligation to make such payment.Conversely, in certain jurisdictions, when the ceding insurer or reinsurer pays premiums for these policies toreinsurance brokers for payment to us, these premiums are considered to have been paid and the ceding insurer orreinsurer will no longer be liable to us for these premiums, whether or not we have actually received them.Consequently, we assume a degree of credit risk associated with substantially all of our brokers.
Our utilization of brokers, managing general agents and other third parties to support our businessexposes us to operational and financial risks
Talbot’s business at Lloyd’s relies upon brokers, managing general agents and other third parties to produceand service a proportion of its operations. In these arrangements, we typically grant the third party the right to bindus to new and renewal policies, subject to underwriting guidelines we provide and other contractual restrictions andobligations. Should these third parties issue policies that contravene these guidelines, restrictions or obligations, wecould nonetheless be deemed liable for such policies. Although we would intend to resist claims that exceed orexpand on our underwriting intention, it is possible that we would not prevail in such an action, or that our managinggeneral agent would be unable adequately to indemnify us for their contractual breach.
We also rely on managing general agents, third party administrators or other third parties we retain, to collectpremiums and to pay valid claims. We could also be exposed to their or their producer’s operational risk, including, butnot limited to, contract wording errors, technological and staffing deficiencies and inadequate disaster recovery plans.We could also be exposed to potential liabilities relating to the claims practices of the third party administrators we have
27

retained to manage the claims activity on this business. Although we have implemented monitoring and other oversightprotocols, we cannot assure you that these measures will be sufficient to mitigate all of these exposures.
Our success depends on our ability to establish and maintain effective operating procedures and internalcontrols. Failure to detect control issues and any instances of fraud could adversely affect us.
Our success is dependent upon our ability to establish and maintain operating procedures and internal controls(including the timely and successful implementation of information technology systems and programs) to effectivelysupport our business and our regulatory and reporting requirements. We may not be successful in such efforts. Evenwhen implemented, as a result of the inherent limitations in all control systems, no evaluation of controls can providefull assurance that all control issues and instances of fraud, if any, within the Company will be detected.
We may be unable to purchase reinsurance or retrocessional reinsurance in the future, and if we do suc-cessfully purchase reinsurance or retrocessional reinsurance, we may be unable to collect on claims sub-mitted under such policies, which could adversely affect our business, financial condition and results ofoperations.
We purchase reinsurance and retrocessional reinsurance in order that we may offer insureds and cedantsgreater capacity, and to mitigate the effect of large and multiple losses on our financial condition. Reinsurance is atransaction whereby an insurer or reinsurer cedes to a reinsurer all or part of the insurance it has written orreinsurance it has assumed. A reinsurer’s or retrocessional reinsurer’s insolvency or inability or refusal to maketimely payments under the terms of its reinsurance agreement with us could have an adverse effect on us because weremain liable to our client. From time to time, market conditions have limited, and in some cases have prevented,insurers and reinsurers from obtaining the types and amounts of reinsurance or retrocessional reinsurance that theyconsider adequate for their business needs. Accordingly, we may not be able to obtain our desired amounts ofreinsurance or retrocessional reinsurance or negotiate terms that we deem appropriate or acceptable or obtainreinsurance or retrocessional reinsurance from entities with satisfactory creditworthiness.
Our investment portfolio may suffer reduced returns or losses which could adversely affect our results ofoperations and financial condition. Any increase in interest rates or volatility in the fixed income marketscould result in significant unrealized losses in the fair value of our investment portfolio which wouldreduce our net income.
Our operating results depend in part on the performance of our investment portfolio, which currently consistsof fixed maturity securities, as well as the ability of our investment managers to effectively implement ourinvestment strategy. Our Board of Directors, led by our Finance Committee, oversees our investment strategy, and inconsultation with our portfolio advisors, has established investment guidelines. The investment guidelines dictatethe portfolio’s overall objective, benchmark portfolio, eligible securities, duration, limitations on the use ofderivatives and inclusion of foreign securities, diversification requirements and average portfolio rating. Man-agement and the Finance Committee periodically review these guidelines in light of our investment goals andconsequently they may change at any time.
The investment return, including net investment income, net realized gains (losses) on investments, netunrealized (losses) gains on investments, on our invested assets was $212.6 million, or 4.2% for the year endedDecember 31, 2010. While we follow a conservative investment strategy designed to emphasize the preservation ofinvested assets and to provide sufficient liquidity for the prompt payment of claims, we will nevertheless be subjectto market-wide risks including illiquidity and pricing uncertainty and fluctuations, as well as to risks inherent inparticular securities. Our investment performance may vary substantially over time, and we cannot assure that wewill achieve our investment objectives. See “Business — Investments.”
Investment results will also be affected by general economic conditions, market volatility, interest ratefluctuations, liquidity and credit risks beyond our control. In addition, our need for liquidity may result ininvestment returns below our expectations. Also, with respect to certain of our investments, we are subject toprepayment or reinvestment risk. In particular, our fixed income portfolio is subject to reinvestment risk, and as atDecember 31, 2010, 13.4% of our fixed income portfolio is comprised of mortgage backed and asset backed
28

securities which are subject to prepayment risk. Although we attempt to manage the risks of investing in a changinginterest rate environment, a significant increase in interest rates could result in significant losses, realized orunrealized, in the fair value of our investment portfolio and, consequently, could have an adverse affect on ourresults of operations.
Our operating results may be adversely affected by currency fluctuations.
Our functional currency is the U.S. dollar. Many of our companies maintain both assets and liabilities in localcurrencies. Therefore, we are exposed to foreign exchange risk on the assets denominated in those foreigncurrencies. Foreign exchange risk is reviewed as part of our risk management process. Locally required capitallevels may be invested in home currencies in order to satisfy regulatory requirements and to support local insuranceoperations. The principal currencies creating foreign exchange risk are the British pound sterling and the Euro. Asof December 31, 2010, $545.2 million, or 7.7% of our total assets and $638.3 million, or 18.0% of our totalliabilities were held in foreign currencies. As of December 31, 2010, $87.0 million, or 2.4% of our total netliabilities held in foreign currencies was non-monetary items which do not require revaluation at each reportingdate. We look to manage our foreign currency exposure through the use of currency derivatives as well as matchingof our major foreign denominated assets and liabilities. However, there is no guarantee that we will effectivelymitigate our exposure to foreign exchange losses. Please refer to Part II, Item 7A “Quantitative and QualitativeDisclosures About Market Risk” for further discussion of foreign currency risk.
Risks Related to Acquisitions and New Ventures
Any future acquisitions or new ventures may expose us to operational risks.
We may in the future make strategic acquisitions, either of other companies or selected books of business, orgrow our business organically. Any future acquisitions or new ventures may expose us to operational challenges andrisks, including:
• integrating financial and operational reporting systems;
• establishing satisfactory budgetary and other financial controls;
• funding increased capital needs and overhead expenses;
• obtaining management personnel required for expanded operations;
• funding cash flow shortages that may occur if anticipated sales and revenues are not realized or are delayed,whether by general economic or market conditions or unforeseen internal difficulties;
• the value of assets related to acquisitions or new ventures may be lower than expected or may diminish due tocredit defaults or changes in interest rates and liabilities assumed may be greater than expected;
• the assets and liabilities related to acquisitions or new ventures may be subject to foreign currency exchangerate fluctuation; and
• financial exposures in the event that the sellers of the entities we acquire are unable or unwilling to meet theirindemnification, reinsurance and other obligations to us.
Our failure to manage successfully these operational challenges and risks may adversely impact our results ofoperations.
Risks Relating to Lloyd’s and Other U.K. Regulatory Matters
The regulation of Lloyd’s members and of Lloyd’s by the U.K. Financial Services Authority (“FSA”) andunder European Directives and other local laws may result in intervention that could have a significantnegative impact on Talbot.
Talbot operates in a regulated jurisdiction. Its underwriting activities are regulated by the FSA and franchisedby Lloyd’s. The FSA has substantial powers of intervention in relation to the Lloyd’s managing agents (such asTalbot Underwriting Ltd.) which it regulates, including the power to remove their authorization to manage Lloyd’s
29

syndicates. In addition, the Lloyd’s Franchise Board requires annual approval of Syndicate 1183’s business plan,including a maximum underwriting capacity, and may require changes to any business plan presented to it oradditional capital to be provided to support underwriting (known as Funds at Lloyd’s or “FAL”). An adversedetermination in any of these cases could lead to a change in business strategy which may have an adverse effect onTalbot’s financial condition and operating results.
An EU directive covering the capital adequacy, risk management and regulatory reporting for insurers, knownas Solvency II was adopted by the European Parliament in April 2009. The proposed Solvency II insurance directiveis currently expected to come into force on January 1, 2013. Insurers and reinsurers are undertaking a significantamount of work to ensure that they meet the new requirements and this may divert resources from other operationalroles. Final Solvency II guidelines have been published and the Company and Talbot’s implementation plans arewell underway. There can be no assurance that future legislation will not have an adverse effect on Talbot or theCompany.
Additionally, Lloyd’s worldwide insurance and reinsurance business is subject to local regulation. Changes insuch regulation may have an adverse effect on Lloyd’s generally and on Talbot.
The future structure of U.K. financial regulation
The U.K. Government has set out proposals to replace the current system of financial regulation, which itbelieves has weaknesses, with a new regulatory framework. The key weakness it identified was that no singleinstitution has the responsibility, authority and tools to monitor the financial system as a whole, and respondaccordingly. That power will be given to the Bank of England. The Government will create a new Financial PolicyCommittee (FPC) within the Bank, which will look at the wider economic and financial risks to the stability of thesystem.
In addition, the Financial Services Authority (FSA) will cease to exist in its current form, and the Governmentwill create two new focused financial regulators:
• A new Prudential Regulation Authority (PRA) will be responsible for the day-to-day supervision of financialinstitutions that are subject to significant prudential regulation. It will adopt a more judgment-focusedapproach to regulation so that business models can be challenged, risks identified and action taken topreserve financial stability.
• An independent consumer protection and markets authority (CPMA) will take a tough approach toregulating how firms conduct their business. It will have a strong mandate for promoting confidenceand transparency in financial services and to give greater protection for consumers of financial services.
The consultation on the proposed reforms closed in October 2010 and the Government will present moredetailed policy and legislative proposals for further consultation early in 2011. The Government intends tointroduce legislation to implement its proposals in mid-2011 and the passage of legislation is expected to takeapproximately one year. The new regulatory framework is anticipated to be in place by the end of 2012.
Lloyd’s is keeping abreast of these developments and lobbying on behalf of the market when necessary. It islikely that Lloyd’s itself and managing agency businesses will come under the day-to-day supervision of the PRA indue course. We are unable to determine the impact, if any, the change in U.K. financial regulation will have onTalbot’s financial condition and results of operations.
Should Lloyd’s Council decide additional levies are required to support the central fund, this couldadversely affect Talbot.
The central fund, which is funded by annual contributions and loans from Lloyd’s members, acts as apolicyholders’ protection fund to make payments where any Lloyd’s member has failed to pay, or is unable to pay,valid claims. The Lloyd’s Council may resolve to make payments from the central fund for the advancement andprotection of policyholders, which could lead to additional or special contributions being payable by Lloyd’smembers, including Talbot. This, in turn, could adversely affect Talbot and the Company
30

Lloyd’s 1992 and prior liabilities.
Lloyd’s currently has a number of contingent liabilities in respect of risks under certain policies allocated to1992 or prior years of account.
Notwithstanding the “firebreak” introduced when Lloyd’s implemented the Reconstruction and Renewal Planin 1996 and the phase II completion which was effective June 30, 2009 which, as a result Equitas and relevantpolicyholders now benefit from $7.0 billion of reinsurance cover provided under this arrangement Lloyd’smembers, including Talbot subsidiaries, remain indirectly exposed in a number of ways to 1992 and prior businessthen reinsured by Equitas, including through the application of overseas deposits and the central fund.
The statutory transfer of 1992 and prior non-life business from Names to Equitas Insurance Limited, relievedthe members and former members concerned from those liabilities under U.K. law and the law of every other statewithin the EEA, however, if the limit of retrocessional cover from National Indemnity Company in respect of thatbusiness proves to be insufficient and as a consequence Equitas is unable to pay the 1992 and prior liabilities in full,Lloyd’s will be liable to meet any shortfall arising in respect of certain policies. The central fund, which Lloyd’s canreplenish, subject to its Bye-laws, by issuing calls on current underwriting members of Lloyd’s (which will includeTalbot subsidiaries), may be applied for these purposes. Lloyd’s also has contingent liabilities under indemnities inrespect of claims against certain persons.
The failure of Lloyd’s to satisfy the FSA’s annual solvency test could result in limitations on managingagents’ ability, including Talbot’s ability to underwrite or to commence legal proceedings against Lloyd’s.
The FSA requires Lloyd’s to satisfy an annual solvency test. The solvency requirement in essence measureswhether Lloyd’s has sufficient assets in the aggregate to meet all outstanding liabilities of its members, both currentand in run-off. If Lloyd’s fails to satisfy the test in any year, the FSA may require Lloyd’s to cease trading and/or itsmembers to cease or reduce underwriting. In the event of Lloyd’s failing to meet any solvency requirement, eitherthe Society of Lloyd’s or the FSA may apply to the court for a Lloyd’s Market Reorganisation Order (“LMRO”). Onthe making of an order a “reorganisation controller” is appointed, and for its duration, a moratorium is imposedpreventing any proceedings or legal process from being commenced or continued against any party that is thesubject of such an order, which, if made, would apply to the market as a whole, including members, formermembers, managing agents, members’ agents, Lloyd’s brokers, approved run-off companies and managing generalagents unless individual parties are specifically excluded.
A downgrade in Lloyd’s ratings would have an adverse effect on Syndicate 1183’s standing amongbrokers and customers and cause its premiums and earnings to decrease.
The ability of Lloyd’s syndicates to trade in certain classes of business at current levels is dependent on themaintenance of a satisfactory credit rating issued by an accredited rating agency. The financial security of theLloyd’s market is regularly assessed by three independent rating agencies, A.M. Best, Standard & Poor’s and FitchRatings. Syndicate 1183 benefits from Lloyd’s current ratings and would be adversely affected if the current ratingswere downgraded from their present levels.
An increase in the charges paid by Talbot to participate in the Lloyd’s market could adversely affectTalbot’s financial and operating results.
Lloyd’s imposes a number of charges on businesses operating in the Lloyd’s market, including, for example,annual subscriptions and central fund contributions for members and policy signing charges. The basis and amountsof charges may be varied by Lloyd’s and could adversely affect Talbot and the Company.
An increase in the level or type of deposits required by U.S. Situs Trust Deeds to be maintained by Lloyd’ssyndicates could result in Syndicate 1183 being required to make a cash call which could adversely affectTalbot’s financial performance.
The U.S. Situs Trust Deeds require syndicates transacting certain types of business in the United States tomaintain minimum deposits as protection for U.S. policyholders. These deposits represent the syndicates’ estimates
31
of unpaid claims liabilities (less premiums receivable) relating to this business, adjusted for provisions for potentialbad debt on premiums earned but not received and for any anticipated profit on unearned premiums. No credit isgenerally allowed for potential reinsurance recoveries. The New York Insurance Department and the U.S. NationalAssociation of Insurance Commissioners currently require funding of 30% of gross liabilities in relation toinsurance business classified as “Surplus Lines.” The “Credit for Reinsurance” trust fund is usually required to befunded at 100% of gross liabilities. The funds contained within the deposits are not ordinarily available to meettrading expenses. U.S. regulators may increase the level of funding required or change the requirements as to thenature of funding. Accordingly, in the event of a major claim arising in the United States, for example from a majorcatastrophe, syndicates participating in such U.S. business may be required to make cash calls on their members tomeet claims payments and deposit funding obligations. This could adversely affect Talbot.
Risks Related to Taxation
We may be subject to U.S. tax.
We are organized under the laws of Bermuda and presently intend to structure our activities to minimize therisk that we would be considered engaged in a U.S. trade or business. No definitive standards, however, are providedby the Internal Revenue Code of 1986, as amended (the “Code”), U.S. Treasury regulations or court decisionsregarding activities that constitute the conduct of a U.S. trade or business. Because that determination is essentiallyfactual, we cannot assure that the Internal Revenue Service (the “IRS”) will not contend that we are engaged in aU.S. trade or business. If we were found to be so engaged, we would be subject to U.S. corporate income and branchprofits tax on our earnings that are effectively connected to such U.S. trade or business.
If Validus Re is entitled to the benefits of the income tax treaty between the U.S. and Bermuda (the “BermudaTreaty”), it would not be subject to U.S. income tax on any income protected by the Bermuda Treaty unless thatincome is attributable to a permanent establishment in the U.S. The Bermuda Treaty clearly applies to premiumincome, but may be construed as not protecting other income such as investment income. If Validus Re were foundto be engaged in a trade or business in the U.S. and were entitled to the benefits of the Bermuda Treaty in general,but the Bermuda Treaty was found not to protect investment income, a portion of Validus Re’s investment incomecould be subject to U.S. tax.
U.S. persons who hold common shares may be subject to U.S. income taxation at ordinary income rateson our undistributed earnings and profits.
Controlled Foreign Corporation Status: The Company should not be a controlled foreign corporation (“CFC”)because its organizational documents provide that if the common shares owned, directly, indirectly or by attribution,by any person would otherwise represent more than 9.09% of the aggregate voting power of all the Company’scommon shares, the voting rights attached to those common shares will be reduced so that such person may notexercise and is not attributed more than 9.09% of the total voting power of the common shares. We cannot assure,however, that the provisions of the Organizational Documents will operate as intended and that the Company willnot be considered a CFC. If the Company were considered a CFC, any shareholder that is a U.S. person that ownsdirectly, indirectly or by attribution, 10% or more of the voting power of the Company may be subject to currentU.S. income taxation at ordinary income tax rates on all or a portion of the Company’s undistributed earnings andprofits attributable to Validus Re’s insurance and reinsurance income, including underwriting and investmentincome. Any gain realized on sale of common shares by such shareholder may also be taxed as a dividend to theextent of the Company’s earnings and profits attributed to such shares during the period that the shareholder held theshares and while the Company was a CFC (with certain adjustments).
Related Person Insurance Income: If the related person insurance income (“RPII”) of any of the Company’snon-U.S. insurance subsidiaries were to equal or exceed 20% of that subsidiary’s gross insurance income in anytaxable year, and U.S. persons were treated as owning 25% or more of the subsidiary’s stock, by vote or value, aU.S. person who directly or indirectly owns any common shares on the last day of such taxable year on which the25% threshold is met would be required to include in income for U.S. federal income tax purposes that person’sratable share of that subsidiary’s RPII for the taxable year. The amount to be included in income is determined as ifthe RPII were distributed proportionately to U.S. shareholders on that date, regardless of whether that income is
32
distributed. The amount of RPII to be included in income is limited by such shareholder’s share of the subsidiary’scurrent-year earnings and profits, and possibly reduced by the shareholder’s share of prior year deficits in earningsand profits. The amount of RPII earned by a subsidiary will depend on several factors, including the identity ofpersons directly or indirectly insured or reinsured by that subsidiary. Although we do not believe that the 20%threshold will be met for our non-U.S. insurance subsidiaries, some of the factors that might affect that deter-mination in any period may be beyond our control. Consequently, we cannot assure that we will not exceed the RPIIthreshold in any taxable year.
If a U.S. person disposes of shares in a non-U.S. insurance corporation that had RPII (even if the 20% thresholdwas not met) and the 25% threshold is met at any time during the five-year period ending on the date of disposition,and the U.S. person owned any shares at such time, any gain from the disposition will generally be treated as adividend to the extent of the holder’s share of the corporation’s undistributed earnings and profits that wereaccumulated during the period that the holder owned the shares (possibly whether or not those earnings and profitsare attributable to RPII). In addition, the shareholder will be required to comply with specified reportingrequirements, regardless of the amount of shares owned. We believe that those rules should not apply to adisposition of common shares because the Company is not itself directly engaged in the insurance business. Wecannot assure, however, that the IRS will not successfully assert that those rules apply to a disposition of commonshares.
U.S. persons who hold common shares will be subject to adverse tax consequences if the Company isconsidered a passive foreign investment company for U.S. federal income tax purposes.
If the Company is considered a passive foreign investment company (“PFIC”) for U.S. federal income taxpurposes, a U.S. holder who owns common shares will be subject to adverse tax consequences, including a greatertax liability than might otherwise apply and an interest charge on certain taxes that are deferred as a result of theCompany’s non-U.S. status. We currently do not expect that the Company will be a PFIC for U.S. federal income taxpurposes in the current taxable year or the foreseeable future because, through Validus Re, Talbot 2002 Under-writing Capital Ltd. and Talbot Underwriting Ltd., it intends to be predominantly engaged in the active conduct of aglobal insurance and reinsurance business. We cannot assure you, however, that the Company will not be deemed tobe a PFIC by the IRS. No regulations currently exist regarding the application of the PFIC provisions to an insurancecompany.
Changes in U.S. tax laws may be retroactive and could subject a U.S. holder of common shares to otheradverse tax consequences.
The tax treatment of non-U.S. companies and their U.S. and non-U.S. insurance and reinsurance subsidiarieshas been the subject of Congressional discussion and legislative proposals in the U.S. We cannot assure that futurelegislative action will not increase the amount of U.S. tax payable by us.
In addition, the U.S. federal income tax laws and interpretations, including those regarding whether a companyis engaged in a U.S. trade or business or is a PFIC, or whether U.S. holders would be required to include “subpart Fincome” or RPII in their gross income, are subject to change, possibly on a retroactive basis. No regulationsregarding the application of the PFIC rules to insurance companies are currently in effect, and the regulationsregarding RPII are still in proposed form. New regulations or pronouncements interpreting or clarifying such rulesmay be forthcoming. We cannot be certain if, when, or in what form, such regulations or pronouncements may beprovided, and whether such guidance will have a retroactive effect.
The Obama administration’s proposed budget for Fiscal Year 2012 could subject a U.S. holder of ourcommon shares to adverse tax consequences.
Under current U.S. law, non-corporate U.S. holders of our common shares generally are taxed on dividends at acapital gains tax rate of 15% rather than ordinary income tax rates. The Obama administration’s proposed budget forfiscal year 2012 contains a proposal that would extend the current 0% and 15% tax rates for qualified dividends andlong-term net capital gains permanently for middleclass taxpayers. The proposal would apply a 20% rate onqualified dividends that would otherwise be taxed at a 36% or 39.6% income tax rate. This is the same rate as will
33

apply to net long-term capital gains for upper-income taxpayers under current law after 2012. This proposal wouldbe effective for taxable years beginning after December 31, 2012. If this proposal becomes law, certain individualU.S. shareholders would no longer benefit from the current tax rate of 15% on dividend paid by us.
The Obama administration’s proposed budget for Fiscal Year 2012 could disallow a deduction forpremiums paid for reinsurance.
Insurance companies are generally allowed a deduction for premiums paid for reinsurance. The proposedbudget for fiscal year 2012 contains a proposal that would deny U.S. (re)insurance companies a deduction forcertain reinsurance premiums paid to affiliated foreign reinsurance companies with respect to U.S. risks insured orreinsured by the U.S. company or its U.S. affiliates. The U.S. (re)insurance company would not be allowed adeduction to the extent that the foreign reinsurers are not subject to U.S. income tax with respect to premiumsreceived. Furthermore, the U.S. (re)insurance company would exclude both ceding commissions and any relatedreinsurance recoveries from income. The current proposal would only apply to policies issued in tax yearsbeginning after December 31, 2011. Based on information currently available to us, it is uncertain whether thislegislation will adversely impact us.
We may become subject to taxes in Bermuda after March 28, 2016, which may have a material adverseeffect on our results of operations.
Under current Bermuda law, we are not subject to tax on income or capital gains. We have received from theMinister of Finance under The Exempted Undertaking Tax Protection Act 1966, as amended, an assurance that, inthe event that Bermuda enacts legislation imposing tax computed on profits, income, any capital asset, gain orappreciation, or any tax in the nature of estate duty or inheritance, then the imposition of any such tax shall not beapplicable to us or to any of our operations or shares, debentures or other obligations, until March 28, 2016. Wecould be subject to taxes in Bermuda after that date. This assurance is subject to the proviso that it is not to beconstrued to prevent the application of any tax or duty to such persons as are ordinarily resident in Bermuda or toprevent the application of any tax payable in accordance with the provisions of the Land Tax Act 1967 or otherwisepayable in relation to any property leased to us. We and Validus Re each pay annual Bermuda government fees;Validus Re pays annual insurance license fees. In addition, all entities employing individuals in Bermuda arerequired to pay a payroll tax and there are other sundry taxes payable, directly or indirectly, to the Bermudagovernment. During the 2010 Speech From the Throne, the Bermuda government noted that they would bring a billto extend the tax protection regime to 2035.
Our non-U.K. companies may be subject to U.K. tax.
We intend to operate in such a manner that none of our non-U.K. companies would be resident in the U.K. fortax purposes. A company incorporated outside the U.K. will be resident in the U.K. if its business is centrallymanaged and controlled from the U.K.. Because the concept of central management and control is not defined instatute but derives from case law and the determination of residence is subjective, the U.K. Inland Revenue mightcontend successfully that one or more of our companies is resident in the U.K.
Furthermore, we intend to operate in such a manner that none of our non-U.K. companies carry on a tradewholly or partly in the U.K.. Case law has held that whether or not a trade is being carried on is a matter of fact andemphasis is placed on where operations take place from which the profits in substance arise. This judgment issubjective, U.K. Inland Revenue might contend successfully that one or more of our non-U.K. companies, isconducting business in the U.K. Some of our companies will benefit from treaty protection. In those situations, ataxable presence is only created when the non-U.K. company trades in the U.K. through a permanent establishment.
On July 1, 2010, the U.K. government published the Finance Bill 2010 (effective April 1, 2011), which reducedthe U.K. corporate income tax rate from 28% to 27%. In addition, the government also announced its intent tocontinue reducing the corporate income tax rate from 27% to 24%, through a series of future legislative enactments.The effect of a change in an enacted tax law should be recognized through an adjustment to income from continuingoperations in the period that legislation is enacted.
34

Risks Related to Laws and Regulations Applicable to Us
If we become subject to insurance statutes and regulations in addition to the statutes and regulations thatcurrently apply to us, there could be a significant and negative impact on our business.
We currently conduct our business in a manner such that we expect the Company will not be subject toinsurance and/or reinsurance licensing requirements or regulations in any jurisdiction other than Bermuda, inlimited circumstances, the United States, and, with respect to Talbot, the U.K. and jurisdictions to which Lloyds issubject. See “Business — Regulation — United States and Bermuda.” Although we do not currently intend toengage in activities which would require us to comply with insurance and reinsurance licensing requirements ofother jurisdictions, should we choose to engage in activities that would require us to become licensed in suchjurisdictions, we cannot assure that we will be able to do so or to do so in a timely manner. Furthermore, the laws andregulations applicable to direct insurers could indirectly affect us, such as collateral requirements in variousU.S. states to enable such insurers to receive credit for reinsurance ceded to us.
The insurance and reinsurance regulatory framework of Bermuda and the insurance of U.S. risk by companiesbased in Bermuda that are not licensed or authorized in the U.S. have recently become subject to increased scrutinyin many jurisdictions, including the United States. In the past, there have been U.S. Congressional and otherinitiatives in the United States regarding increased supervision and regulation of the insurance industry, includingproposals to supervise and regulate offshore reinsurers. Government regulators are generally concerned with theprotection of policyholders rather than other constituencies, such as our shareholders. We are not able to predict thefuture impact on our operations of changes in the laws and regulations to which we are or may become subject.
Risks Related to Ownership of Our Common Shares
Because we are a holding company and substantially all of our operations are conducted by our mainoperating subsidiaries, Validus Re and Talbot, our ability to meet any ongoing cash requirements and topay dividends will depend on our ability to obtain cash dividends or other cash payments or obtain loansfrom Validus Re and Talbot.
We conduct substantially all of our operations through subsidiaries. Our ability to meet our ongoing cashrequirements, including any debt service payments or other expenses, and pay dividends on our common shares inthe future, will depend on our ability to obtain cash dividends or other cash payments or obtain loans from thesesubsidiaries and as a result will depend on the financial condition of these subsidiaries. The inability of thesesubsidiaries to pay dividends in an amount sufficient to enable us to meet our cash requirements could have amaterial adverse effect on us and the value of our common shares. Each of these subsidiaries is a separate anddistinct legal entity that has no obligation to pay any dividends or to lend or advance us funds and may be restrictedfrom doing so by contract, including other financing arrangements, charter provisions or applicable legal andregulatory requirements or rating agency constraints. The payment of dividends by these subsidiaries to us is limitedunder Bermuda law and regulations. The Insurance Act provides that our Bermuda subsidiaries may not declare orpay in any financial year dividends of more than 25% of its total statutory capital and surplus (as shown on itsstatutory balance sheet in relation to the previous financial year) unless it files an affidavit with the BMA at leastseven days prior to the payment signed by at least two directors and such subsidiary’s principal representative,stating that in their opinion such subsidiaries will continue to satisfy the required margins following declaration ofthose dividends, though there is no additional requirement for BMA approval. In addition, before reducing its totalstatutory capital by 15% or more (as set out in its previous years’ statutory financial statements) each of thesesubsidiaries must make application to the BMA for permission to do so, such application to consist of an affidavitsigned by at least two directors and such subsidiary’s principal representative stating that in their opinion theproposed reduction in capital will not cause such subsidiaries to fail to meet its relevant margins, and such otherinformation as the BMA may require. At December 31, 2010, the excesses of statutory capital and surplus aboveminimum solvency margins for Validus Re and Talbot Insurance (Bermuda), Ltd., a Talbot subsidiary, were$4,345.3 million and $417.4 million, respectively. These amounts are available for distribution as dividendpayments to the Company, subject to approval of the BMA. The BMA’s approval is required for distributions greaterthan 25% of total statutory capital and surplus.
35

The timing and amount of any cash dividends on our common shares are at the discretion of our Board ofDirectors and will depend upon our results of operations and cash flows, our financial position and capitalrequirements, general business conditions, legal, tax, regulatory, rating agency and contractual constraints orrestrictions and any other factors that our Board of Directors deems relevant. In addition, the indenture governingour Junior Subordinated Deferrable Debentures would restrict us from declaring or paying dividends on ourcommon shares if we are downgraded by A.M. Best to a financial strength rating of “B” (Fair) or below or ifA.M. Best withdraws its financial strength rating on any of our material insurance subsidiaries.
Future sales of our common shares and grants of restricted shares may affect the market price of ourcommon shares and the future exercise of options and warrants may result in immediate and substantialdilution of the common shares.
As of February 16, 2011 (but without giving effect to unvested restricted shares), we had 97,944,724 commonshares outstanding and 7,934,860 shares issuable upon exercise of outstanding warrants. Approximately 31,279,146 ofthese outstanding shares were subject to the volume limitations and other conditions of Rule 144 under the Securities Actof 1933, as amended, which we refer to as the “Securities Act.” Furthermore, certain of our sponsoring shareholders andtheir transferees have the right to require us to register these common shares under the Securities Act for sale to thepublic, either in an independent offering pursuant to a demand registration or in conjunction with a public offering,subject to a “lock-up” agreement of no more than 90 days. Following any registration of this type, the common shares towhich the registration relates will be freely transferable. In addition, we have filed one or more registration statements onForm S-8 under the Securities Act to register common shares issued or reserved for issuance under our 2005 Long TermIncentive Plan (the “Plan”). The number of common shares that have been reserved for issuance under the Plan is equal to13,126,896 of which 7,595,957 shares remain outstanding as of December 31, 2010. We cannot predict what effect, ifany, future sales of our common shares, or the availability of common shares for future sale, will have on the market priceof our common shares. Sales of substantial amounts of our common shares in the public market, or the perception thatsales of this type could occur, could depress the market price of our common shares and may make it more difficult forour shareholders to sell their common shares at a time and price that they deem appropriate.
Our Bye-laws authorize our Board of Directors to issue one or more series of common shares and preferred shareswithout stockholder approval. Specifically, we have an authorized share capital of 571,428,571 shares ($0.175 par valueper share), which can consist of common shares and/or preference shares, as determined by our Board of Directors. TheBoard of Directors has the right to issue the remaining shares without obtaining any approval from our stockholders andto fix the rights, preferences, privileges and restrictions thereof, including dividend rights, conversion rights, votingrights, terms of redemption, liquidation preferences and the number of shares constituting any series or designation ofsuch series. Any issuance of our preferred stock could adversely affect the voting power of the holders of our commonshares and could have the effect of delaying, deferring, or preventing the payment of any dividends (including anyliquidating dividends) and any change in control of us. If a significant number of either common or preferred shares areissued, it may cause the market price of our common shares to decline.
Our classified board structure may prevent a change in our control.
Our board of directors is divided into three classes of directors. Each year one class of directors is elected bythe shareholders for a three year term. The staggered terms of our directors may reduce the possibility of a tenderoffer or an attempt at a change in control, even though a tender offer or change in control might be in the best interestof our shareholders.
There are provisions in our Bye-laws that reduce the voting rights of voting common shares that are heldby a person or group to the extent that such person or group holds more than 9.09% of the aggregatevoting power of all common shares entitled to vote on a matter.
In general, and except as provided below, shareholders have one vote for each voting common share held bythem and are entitled to vote at all meetings of shareholders. However, if, and for so long as, the common shares of ashareholder, including any votes conferred by “controlled shares” (as defined below), would otherwise representmore than 9.09% of the aggregate voting power of all common shares entitled to vote on a matter, including anelection of directors, the votes conferred by such shares will be reduced by whatever amount is necessary such that,after giving effect to any such reduction (and any other reductions in voting power required by our Bye-laws), the
36
votes conferred by such shares represent 9.09% of the aggregate voting power of all common shares entitled to voteon such matter. “Controlled shares” include, among other things, all shares that a person is deemed to own directly,indirectly or constructively (within the meaning of Section 958 of the Code, or Section 13(d)(3) of the Securities andExchange Act of 1934, as amended (the “Exchange Act”)). At December 31, 2010, there were 85,964,077 votingcommon shares, of which 7,814,135 voting common shares would confer votes that represent 9.09% of theaggregate voting power of all common shares entitled to vote generally at an election of directors. An investor whodoes not hold, and is not deemed under the provisions of our Bye-laws to own, any of our common shares maytherefore purchase up to such amount without being subject to voting cutback provisions in our Bye-laws.
In addition, we have the authority under our Bye-laws to request information from any shareholder for thepurpose of determining ownership of controlled shares by such shareholder.
There are regulatory limitations on the ownership and transfer of our common shares which could resultin the delay or denial of any transfers shareholders might seek to make.
The BMA must approve all issuances and transfers of securities of a Bermuda exempt company. We havereceived permission from the BMA to issue our common shares, and for the free transferability of our commonshares as long as the common shares are listed on the New York Stock Exchange or other appointed exchange, to andamong persons who are residents and non-residents of Bermuda for exchange control purposes. Any other transfersremain subject to approval by the BMA and such approval may be denied or delayed.
A shareholder of our company may have greater difficulties in protecting its interests than as ashareholder of a U.S. corporation.
The Companies Act 1981 (the “Companies Act”), which applies to us, differs in material respects from lawsgenerally applicable to U.S. corporations and their shareholders. Taken together with the provisions of our Bye-laws, some of these differences may result in a shareholder having greater difficulties in protecting its interests as ashareholder of our company than it would have as a shareholder of a U.S. corporation. This affects, among otherthings, the circumstances under which transactions involving an interested director are voidable, whether aninterested director can be held accountable for any benefit realized in a transaction with our company, whatapprovals are required for business combinations by our company with a large shareholder or a wholly ownedsubsidiary, what rights a shareholder may have as a shareholder to enforce specified provisions of the CompaniesAct or our Bye-laws, and the circumstances under which we may indemnify our directors and officers.
We are a Bermuda company and it may be difficult for our shareholders to enforce judgments against usor against our directors and executive officers.
We were incorporated under the laws of Bermuda and our business is based in Bermuda. In addition, certain ofour directors and officers reside outside the United States, and a portion of our assets and the assets of such personsmay be located in jurisdictions outside the United States. As such, it may be difficult or impossible to effect serviceof process within the United States upon us or those persons, or to recover against us or them on judgments ofU.S. courts, including judgments predicated upon the civil liability provisions of the U.S. federal securities laws.Further, no claim may be brought in Bermuda against us or our directors and officers in the first instance forviolation of U.S. federal securities laws because these laws have no extraterritorial application under Bermuda lawand do not have force of law in Bermuda; however, a Bermuda court may impose civil liability, including thepossibility of monetary damages, on us or our directors and officers if the facts alleged in a complaint constitute orgive rise to a cause of action under Bermuda law. Currently, of our executive officers, Joseph E. (Jeff) Consolino, C.Jerome Dill and Conan Ward reside in Bermuda, Edward Noonan and Stuart Mercer maintain residences in bothBermuda and the United States and Rupert Atkin, Michael Carpenter and Julian Ross reside in the United Kingdom.Of our directors, Edward Noonan maintains residences in both Bermuda and the United States, Jean-Marie Nessiresides in France and the remainder reside in the United States.
We have been advised by Bermuda counsel, that there is doubt as to whether the courts of Bermuda wouldenforce judgments of U.S. courts obtained in actions against us or our directors and officers, as well as the expertsnamed herein, predicated upon the civil liability provisions of the U.S. federal securities laws, or original actions
37

brought in Bermuda against us or such persons predicated solely upon U.S. federal securities laws. Further, we havebeen advised by Bermuda counsel that there is no treaty in effect between the United States and Bermuda providingfor the enforcement of judgments of U.S. courts in civil and commercial matters, and there are grounds upon whichBermuda courts may decline to enforce the judgments of U.S. courts. Some remedies available under the laws ofU.S. jurisdictions, including some remedies available under the U.S. federal securities laws, may not be allowed inBermuda courts as contrary to public policy in Bermuda. Because judgments of U.S. courts are not automaticallyenforceable in Bermuda, it may be difficult for our shareholders to recover against us based upon such judgments.
Item 1B. Unresolved Staff Comments
None.
Item 2. Properties
The Company does not own any real property. The Company and its subsidiaries currently occupy office spaceas described below. We believe our current facilities and the leaseholds with respect thereto are sufficient for us toconduct our operations.
Legal Entity Location Expiration Date
Validus Holdings, Ltd. Pembroke, Bermuda August 31, 2011Validus Re Hamilton, Bermuda August 31, 2011Validus Re Hamburg, Germany July 1, 2011Validus Research Inc. Waterloo, Canada March 31, 2015Validus Reaseguros, Inc. Miami, Florida, USA April 1, 2018Validus Services, Inc. New York, New York, USA November 8, 2015Underwriting Risk Services, Inc. New York, New York, USA November 8, 2015Talbot London, England June 22, 2019Validus Reinsurance, Ltd. Republic of Singapore December 14, 2011Talbot Republic of Singapore December 14, 2011Underwriting Services (Middle East) Ltd. Dubai, United Arab Emirates July 31, 2012Validus Re Chile S.A. Santiago, Chile May 1, 2014
Item 3. Legal Proceedings
Similar to the rest of the insurance and reinsurance industry, we are subject to litigation and arbitration in theordinary course of business.
Executive Officers of the Company
The following table provides information regarding our executive officers and key employees as of Febru-ary 18, 2011:
Name Age Position
Edward J. Noonan . . . . . . . . . . . . . . . . . 52 Chairman of the Board of Directors and Chief ExecutiveOfficer of the Validus Group
Joseph E. (Jeff) Consolino . . . . . . . . . . . 44 President and Chief Financial Officer
C.N. Rupert Atkin . . . . . . . . . . . . . . . . . 52 Chief Executive Officer of the Talbot Group
Michael E.A. Carpenter . . . . . . . . . . . . . 61 Chairman of the Talbot Group
C. Jerome Dill . . . . . . . . . . . . . . . . . . . . 50 Executive Vice President and General Counsel
Stuart W. Mercer . . . . . . . . . . . . . . . . . . 51 Executive Vice President
Jonathan P. Ritz. . . . . . . . . . . . . . . . . . . 43 Executive Vice President, Business Operations
Julian G. Ross . . . . . . . . . . . . . . . . . . . . 45 Executive Vice President and Chief Risk Officer
Conan M. Ward . . . . . . . . . . . . . . . . . . . 43 Executive Vice President and Chief Executive Officer of theValidus Reinsurance Group
38
Edward J. Noonan has been chairman of our Board and the chief executive officer of the Company since itsformation. Mr. Noonan has 30 years of experience in the insurance and reinsurance industry, serving most recentlyas the acting chief executive officer of United America Indemnity Ltd. (Nasdaq: INDM) from February 2005through October 2005 and as a member of the Board of Directors from December 2003 to May 2007. Mr. Noonanserved as president and chief executive officer of American Re-Insurance Company from 1997 to 2002, havingjoined American Re in 1983. Mr. Noonan also served as chairman of Inter-Ocean Reinsurance Holdings ofHamilton, Bermuda from 1997 to 2002. Mr. Noonan is also a director of Central Mutual Insurance Company and AllAmerican Insurance Company, both of which are property and casualty companies based in Ohio.
Joseph E. (Jeff) Consolino was appointed President of the Company on November 15, 2010 and continues toserve as the Company’s Chief Financial Officer, a position that he has held since March 2006. Prior to joining theCompany, Mr. Consolino served as a managing director in Merrill Lynch’s investment banking division. He servesas a Director of National Interstate Corporation, a property and casualty company based in Ohio and of AmWINSGroup, Inc., a wholesale insurance broker based in North Carolina.
C. N. Rupert Atkin began his career at the Alexander Howden Group in 1980 before moving to CatlinUnderwriting Agencies in 1984. After six years at Catlin he left to join Talbot, then Venton Underwriting Ltd,heading up the marine classes of business within Syndicate 376. In 1995 Syndicate 1183 was constituted withMr. Atkin as the Active Underwriter. In 2000 Syndicate 1183 was merged back into Syndicate 376. The syndicatewas reconstituted once again following the management led buyout of the Talbot group in November 2001.Following the sale of Talbot to Validus in the summer of 2007 Mr. Atkin was appointed as Chief Executive Officerof Talbot. Mr. Atkin is also a director of 1384 Capital Ltd, a company incorporated in England & Wales andsupporting the underwriting of the Talbot Group’s syndicate for the 2005, 2006 and 2007 years of account.Mr. Atkin was appointed to the Council of Lloyd’s in 2007.
Michael E. A. Carpenter joined Talbot in June 2001 as the chief executive officer. Following the sale of Talbotto Validus in the summer of 2007 Mr. Carpenter was appointed as Chairman. Mr. Carpenter is also a director of 1384Capital Ltd, a company incorporated in England & Wales and supporting the underwriting of the Talbot Group’ssyndicate for the 2005, 2006 and 2007 years of account.
C. Jerome Dill has been executive vice president and general counsel of the Company since April 1, 2007.Prior to joining the Company, Mr. Dill was a partner with the law firm of Appleby Hunter Bailhache, which hejoined in 1986. Mr. Dill serves on the Board of Directors of Bermuda Commercial Bank.
Stuart W. Mercer has been executive vice president of the Company since its formation. Mr. Mercer has over20 years of experience in the financial industry focusing on structured derivatives, energy finance and reinsurance.Previously, Mr. Mercer was a senior advisor to DTE Energy Trading.
Jonathan P. Ritz serves as Executive Vice President, Business Operations of the Company. Mr. Ritz has over20 years of experience in the (re)insurance and brokerage industries. Most recently, Mr. Ritz served as chiefoperating officer of IFG Companies — Burlington Insurance Group. Prior to IFG, Mr. Ritz served as chief operatingofficer of the specialty lines division of ICAT Holdings LLC. From 2007 to 2008, Mr. Ritz was a managing directorat Guy Carpenter and from 1997 to 2007 he held various positions with United America Insurance Group includingchief operating officer and senior vice president of ceded reinsurance.
Julian G. Ross has been the chief risk officer of the Company since January 2010. Mr. Ross joined the Talbotgroup in June 1997 as the Group Actuary. He qualified as a Fellow of the Institute of Actuaries in 1993 havinggraduated from Merton College, Oxford, with a MA (Oxon) in mathematics in 1998. At Talbot, Julian hasresponsibility to the Board for the Risk team, which includes risk management, exposure management and capitalmodeling. Outside of Talbot, Julian was the Chairman of the Lloyd’s Market Association Committee of Actuaries inthe Lloyd’s Market for 2006/2007, having previously been the Deputy Chairman for 2005/2006, and before that amember since 1997. He was also a member of the Lloyd’s Market Association Finance Committee for 2006/2007.
Conan M. Ward has been chief executive officer of Validus Reinsurance, Ltd. since July of 2009. Prior to thattime, Mr. Ward served as executive vice president and chief underwriting officer of the Company since January2006. Mr. Ward has over 16 years of insurance industry experience. Mr. Ward was executive vice president of theGlobal Reinsurance division of Axis Capital Holdings, Ltd. from November 2001 until November 2005, where he
39
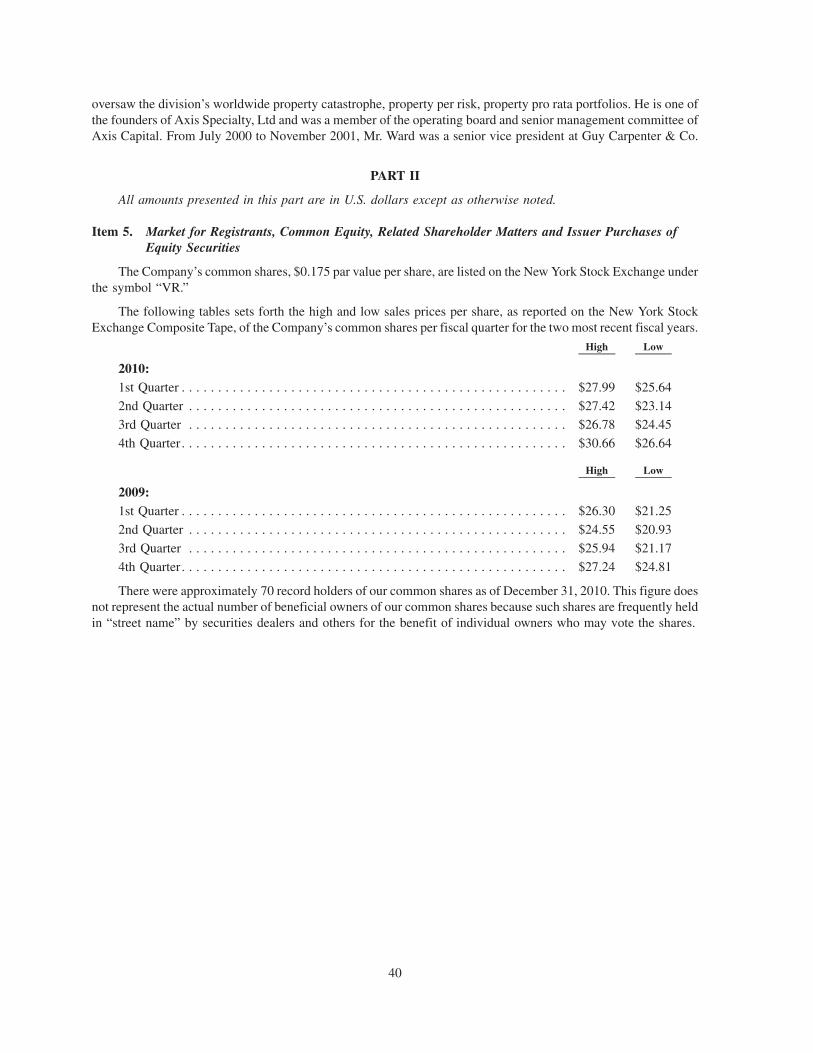
oversaw the division’s worldwide property catastrophe, property per risk, property pro rata portfolios. He is one ofthe founders of Axis Specialty, Ltd and was a member of the operating board and senior management committee ofAxis Capital. From July 2000 to November 2001, Mr. Ward was a senior vice president at Guy Carpenter & Co.
PART II
All amounts presented in this part are in U.S. dollars except as otherwise noted.
Item 5. Market for Registrants, Common Equity, Related Shareholder Matters and Issuer Purchases ofEquity Securities
The Company’s common shares, $0.175 par value per share, are listed on the New York Stock Exchange underthe symbol “VR.”
The following tables sets forth the high and low sales prices per share, as reported on the New York StockExchange Composite Tape, of the Company’s common shares per fiscal quarter for the two most recent fiscal years.
High Low
2010:1st Quarter . . . . . . . . . . . . . . . . . . . . . . . . . . . . . . . . . . . . . . . . . . . . . . . . . . . . . $27.99 $25.64
2nd Quarter . . . . . . . . . . . . . . . . . . . . . . . . . . . . . . . . . . . . . . . . . . . . . . . . . . . . $27.42 $23.14
3rd Quarter . . . . . . . . . . . . . . . . . . . . . . . . . . . . . . . . . . . . . . . . . . . . . . . . . . . . $26.78 $24.45
4th Quarter . . . . . . . . . . . . . . . . . . . . . . . . . . . . . . . . . . . . . . . . . . . . . . . . . . . . . $30.66 $26.64
High Low
2009:1st Quarter . . . . . . . . . . . . . . . . . . . . . . . . . . . . . . . . . . . . . . . . . . . . . . . . . . . . . $26.30 $21.25
2nd Quarter . . . . . . . . . . . . . . . . . . . . . . . . . . . . . . . . . . . . . . . . . . . . . . . . . . . . $24.55 $20.93
3rd Quarter . . . . . . . . . . . . . . . . . . . . . . . . . . . . . . . . . . . . . . . . . . . . . . . . . . . . $25.94 $21.17
4th Quarter . . . . . . . . . . . . . . . . . . . . . . . . . . . . . . . . . . . . . . . . . . . . . . . . . . . . . $27.24 $24.81
There were approximately 70 record holders of our common shares as of December 31, 2010. This figure doesnot represent the actual number of beneficial owners of our common shares because such shares are frequently heldin “street name” by securities dealers and others for the benefit of individual owners who may vote the shares.
40

Performance Graph
Set forth below is a line graph comparing the percentage change in the cumulative total shareholder return,assuming the reinvestment of dividends, over the period from the Company’s IPO on July 25, 2007, throughDecember 31, 2010 as compared to the cumulative total return of the S&P 500 Stock Index and the cumulative totalreturn of an index of the Company’s peer group. The peer group index is comprised of the following companies*:Allied World Assurance Company Holdings, AG., Arch Capital Group Ltd., Argo Group International Holdings,Ltd., Aspen Insurance Holdings Limited, Axis Capital Holdings Limited, Endurance Specialty Holdings Ltd.,Everest Re Group, Ltd., Flagstone Reinsurance Holdings SA, Montpelier Re Holdings Ltd., PartnerRe Ltd.,Platinum Underwriters Holdings Ltd., RenaissanceRe Holdings Ltd., and Transatlantic Holdings, Inc.
Validus Holdings, Ltd.
07/25/07 12/31/07 06/30/08 12/31/08 06/30/09 12/31/09 06/30/10 12/31/10
160
140
120
100
80
60
40
Ind
ex V
alu
e
S&P 500 VR Peer Group Index*
Dividend Policy
On February 9, 2011, the Company announced that its Board of Directors had increased the Company’s annualdividend by 13.6% from $0.88 to $1.00 per common share and per common share equivalent for which eachoutstanding warrant is exercisable. The first quarterly cash dividend of $0.25 per common share and $0.25 percommon share equivalent is payable on March 31, 2011 to holders of record on March 15, 2011.
On February 17, 2010, the Company announced that its Board of Directors had increased the Company’sannual dividend by 10% from $0.80 to $0.88 per common share and per common share equivalent for which eachoutstanding warrant is exercisable. During 2010, the Company paid quarterly cash dividends of $0.22 per eachcommon share and $0.22 per common share equivalent, for which each outstanding warrant is exercisable, onMarch 31, June 30, September 30 and December 31 to holders of record on March 15, June 15, September 15 andDecember 15, 2010, respectively. The timing and amount of any future cash dividends, however, will be at thediscretion of our Board of Directors and will depend upon our results of operations and cash flows, our financialposition and capital requirements, general business conditions, legal, tax, regulatory, rating agency and contractualconstraints or restrictions and any other factors that our Board of Directors deems relevant.
We are a holding company and have no direct operations. Our ability to pay dividends depends, in part, on theability of Validus Re and Talbot to pay dividends to us. Each of the subsidiaries is subject to significant regulatoryrestrictions limiting its ability to declare and pay dividends. The Insurance Act provides that these subsidiaries maynot declare or pay in any financial year dividends of more than 25% of its total statutory capital and surplus (asshown on its statutory balance sheet in relation to the previous financial year) unless it files an affidavit with the
41

BMA at least seven days prior to the payment signed by at least two directors and such subsidiary’s principalrepresentative, stating that in their opinion such subsidiaries will continue to satisfy the required margins followingdeclaration of those dividends, though there is no additional requirement for BMA approval. In addition, beforereducing its total statutory capital by 15% or more (as set out in its previous years’ statutory financial statements)each of these subsidiaries must make application to the BMA for permission to do so, such application to consist ofan affidavit signed by at least two directors and such subsidiary’s principal representative stating that in theiropinion the proposed reduction in capital will not cause such subsidiary to fail to meet its relevant margins, and suchother information as the BMA may require. At December 31, 2010, the excesses of statutory capital and surplusabove minimum solvency margins for Validus Re and Talbot Insurance (Bermuda), Ltd., a Talbot subsidiary, were$4,345.3 million and $417.4 million, respectively. These amounts are available for distribution as dividendpayments to the Company, subject to approval of the BMA. The BMA’s approval is required for distributions greaterthan 25% of total statutory capital and surplus.
Talbot manages Syndicate 1183 (the “Syndicate”) at Lloyd’s. Lloyd’s requires Talbot to hold cash andinvestments in trust for the benefit of policyholders either as Syndicate trust funds or as Funds at Lloyd’s (“FAL”).Talbot may not distribute funds from the Syndicate into its corporate member’s trust accounts unless, firstly, they arerepresented by audited profits and, secondly, the Syndicate has adequate future cash flow to service its policy-holders. Talbot’s corporate member may not distribute funds to Talbot’s unregulated bank or investment accountsunless they are represented by a surplus of cash and investments over the FAL requirement. Additionally, U.K.company law prohibits Talbot’s corporate name from declaring a dividend to the Company unless it has “profitsavailable for distribution”. The determination of whether a company has profits available for distribution is based onits accumulated realized profits less its accumulated realized losses. While the U.K. insurance regulatory laws donot impose statutory restrictions on a corporate name’s ability to declare a dividend, the U.K. Financial ServicesAuthority’s (“FSA”) rules require maintenance of each insurance company’s solvency margin within itsjurisdiction.
In addition, the indenture governing our Junior Subordinated Deferrable Debentures would restrict us fromdeclaring or paying dividends on our common shares if we are downgraded by A.M. Best to a financial strengthrating of “B” (Fair) or below or if A.M. Best withdraws its financial strength rating on any of our material insurancesubsidiaries. On September 9, 2009, A.M. Best affirmed our financial strength rating of A- (Excellent) with a stableoutlook. See “Business — Regulation — Bermuda,” “Risk Factors — Risks Related to Ownership of Our CommonShares — Because we are a holding company and substantially all of our operations are conducted by our mainoperating subsidiaries, Validus Re and Talbot, our ability to meet any ongoing cash requirements and to paydividends will depend on our ability to obtain cash dividends or other cash payments or obtain loans from ValidusRe and Talbot,” “Risk Factors — Risks Related to Our Company — We depend on ratings by A.M. Best Company.Our financial strength rating could be revised downward, which could affect our standing among brokers andcustomers, cause our premiums and earnings to decrease and limit our ability to pay dividends on our commonshares.”
Share Repurchase Program
In November 2009, the Board of Directors of the Company authorized an initial $400.0 million sharerepurchase program. On February 17, 2010, the Board of Directors of the Company authorized the Company toreturn up to $750.0 million to shareholders. This amount was in addition to, and in excess of, the $135.5 million ofcommon shares purchased by the Company through February 17, 2010 under its previously authorized $400.0 mil-lion share repurchase program. On May 6, 2010, the Board of Directors authorized a self tender offer pursuant towhich the Company has repurchased $300.0 million in common shares. On November 4, 2010, the Companyannounced that its Board of Directors had approved share repurchase transactions aggregating $300.0 million.These repurchases were effected by a tender offer which the Company commenced on Monday November 8, 2010,for up to 7,945,400 of its common shares at a price of $30.00 per share. In addition, the Company entered intoseparate repurchase agreements with funds affiliated with or managed by each of Aquiline Capital Partners LLC,New Mountain Capital, LLC and Vestar Capital Partners to purchase 2,054,600 common shares in the aggregate atthe same price per share as the tender offer, for an aggregate purchase price of approximately $61.6 million, subjectto completion of the tender offer. The tender offer and share repurchases were part of the Company’s ongoing
42

program to return capital to shareholders through share repurchases or other means. As a result of these transactions,the Company repurchased an aggregate of 10.0 million common shares. This amount was in addition to the$929.2 million of common shares purchased by the Company through December 23, 2010 under its previouslyauthorized share repurchase program. On December 20, 2010, the Board of Directors authorized the Company toreturn up to $400.0 million to shareholders.
The Company expects the purchases under its share repurchase program to be made from time to time in theopen market or in privately negotiated transactions. The timing, form and amount of the share repurchases under theprogram will depend on a variety of factors, including market conditions, the Company’s capital position relative tointernal and rating agency targets, legal requirements and other factors. The repurchase program may be modified,extended or terminated by the Board of Directors at any time.
Effect of shareRepurchases:
As at December 31,2009 (Cumulative)
March 31,2010
June 30,2010
September 30,2010
December 31,2010
Share Repurchase Activity by Quarter
Aggregate purchase price(a). . $ 84,243 $ 128,278 $ 316,084 $ 62,443 $ 350,122Shares repurchased . . . . . . . . 3,156,871 4,826,600 12,615,123 2,471,673 11,766,618Average price(a) . . . . . . . . . . $ 26.69 $ 26.58 $ 25.06 $ 25.26 $ 29.76Estimated net accretive
(dilutive) impact on:Diluted BV per common
share(b) . . . . . . . . . . . . . . . $ 0.10 $ 0.66 $ 1.00 $ 1.41Diluted EPS — Quarter(c) . . . $ — $ 0.07 $ 0.30 $ 0.15
Effect of shareRepurchases:
As at December 31,2010 (Cumulative)
January 31,2011
February 9,2011
As at February 9,2011
Cumulative to DateEffect
Share Repurchase Activity Post Year End
Aggregate purchaseprice(a) . . . . . . . . . . . . $ 941,170 $ 6,000 $— $ 6,000 $ 947,170
Shares repurchased . . . . . 34,836,885 195,100 — 195,100 35,031,985Average price(a) . . . . . . . $ 27.02 $ 30.75 $— $ 30.75 $ 27.04
(a) Share transactions are on a trade date basis through February 9, 2011 and are inclusive of commissions. Averageshare price is rounded to two decimal places.
(b) As the average price per share repurchased during the periods 2009 and 2010 was lower than the book value percommon share, the repurchase of shares increased the ending book value per share.
(c) The estimated impact on diluted earnings per share was calculated by comparing reported results versus i) netincome per share plus an estimate of lost net investment income on the cumulative share repurchases divided byii) weighted average diluted shares outstanding excluding the weighted average impact of cumulative sharerepurchases. The impact of cumulative share repurchases was accretive to diluted earnings per share.
Share repurchases includes repurchases by the Company of shares, from time to time, from employees in orderto facilitate the payment of withholding taxes on restricted shares. We purchased these shares at their fair marketvalue, as determined by reference to the closing price of our common shares on the day the restricted shares vestedor the stock appreciation rights were exercised.
Item 6. Selected Financial Data
The summary consolidated statement of operations data for the years ended December 31, 2010, December 31,2009, December 31, 2008, December 31, 2007 and December 31, 2006 and the summary consolidated balance sheetdata as of December 31, 2010, December 31, 2009, December 31, 2008, December 31, 2007 and December 31, 2006are derived from our audited consolidated financial statements. The Company was formed on October 19, 2005 andcompleted the acquisitions of Talbot and IPC on July 2, 2007 and September 4, 2009, respectively. Talbot is includedin the Company’s consolidated results only for the six months ended December 31, 2007 and subsequent fiscal yearends. Talbot is not included in consolidated results for the year ended December 31, 2006. IPC is included in the
43

Company’s consolidated results only for the four months ended December 31, 2009. IPC is not included inconsolidated results for the years ended December 31, 2006, December 31, 2007, and December 31, 2008.
You should read the following summary consolidated financial information together with the other infor-mation contained in this Annual Report on Form 10-K, including “Management’s Discussion and Analysis ofFinancial Condition and Results of Operations” and the consolidated financial statements and related notesincluded elsewhere herein.
2010 2009 2008 2007 2006Year Ended December 31,
(Dollars in thousands, except share and per share amounts)
RevenuesGross premiums written . . . . . . . . . . . . . . . . . . . . . . . . . . . $ 1,990,566 $ 1,621,241 $ 1,362,484 $ 988,637 $ 540,789Reinsurance premiums ceded . . . . . . . . . . . . . . . . . . . . . . . (229,482) (232,883) (124,160) (70,210) (63,696)
Net premiums written . . . . . . . . . . . . . . . . . . . . . . . . . . . . 1,761,084 1,388,358 1,238,324 918,427 477,093Change in unearned premiums . . . . . . . . . . . . . . . . . . . . . . 39 61,219 18,194 (60,348) (170,579)
Net premiums earned . . . . . . . . . . . . . . . . . . . . . . . . . . . . 1,761,123 1,449,577 1,256,518 858,079 306,514Gain on bargain purchase, net of espenses(a) . . . . . . . . . . . . . — 287,099 — — —Net investment income . . . . . . . . . . . . . . . . . . . . . . . . . . . 134,103 118,773 139,528 112,324 58,021Realized gain on repurchase of debentures . . . . . . . . . . . . . . . — 4,444 8,752 — —Net realized (losses) gains on investments . . . . . . . . . . . . . . . 32,498 (11,543) (1,591) 1,608 (1,102)Net unrealized gains (losses) on investments(b) . . . . . . . . . . . 45,952 84,796 (79,707) 12,364 —Other income . . . . . . . . . . . . . . . . . . . . . . . . . . . . . . . . . 5,219 4,634 5,264 3,301 —Foreign exchange (losses) gains . . . . . . . . . . . . . . . . . . . . . . 1,351 (674) (49,397) 6,696 2,157
Total revenues . . . . . . . . . . . . . . . . . . . . . . . . . . . . . . . . 1,980,246 1,937,106 1,279,367 994,372 365,590ExpensesLosses and loss expenses . . . . . . . . . . . . . . . . . . . . . . . . . . 987,586 523,757 772,154 283,993 91,323Policy acquisition costs . . . . . . . . . . . . . . . . . . . . . . . . . . . 292,899 262,966 234,951 134,277 36,072General and administrative expenses(c) . . . . . . . . . . . . . . . . . 209,290 185,568 123,948 100,765 38,354Share compensation expenses . . . . . . . . . . . . . . . . . . . . . . . 28,911 27,037 27,097 16,189 7,878Finance expenses . . . . . . . . . . . . . . . . . . . . . . . . . . . . . . . 55,870 44,130 57,318 51,754 8,789Fair value of warrants issued . . . . . . . . . . . . . . . . . . . . . . . — — — 2,893 77
Total expenses . . . . . . . . . . . . . . . . . . . . . . . . . . . . . . . . 1,574,556 1,043,458 1,215,468 589,871 182,493
Net income (loss) before taxes . . . . . . . . . . . . . . . . . . . . . . 405,690 893,648 63,899 404,501 183,097Tax benefit (expense) . . . . . . . . . . . . . . . . . . . . . . . . . . . . (3,126) 3,759 (10,788) (1,505) —
Net income (loss). . . . . . . . . . . . . . . . . . . . . . . . . . . . . . . 402,564 897,407 53,111 402,996 183,097
Comprehensive incomeUnrealized (losses) gains arising during the period(b). . . . . . . . — — — — (332)Foreign currency translation adjustments . . . . . . . . . . . . . . . . (604) 3,007 (7,809) (49) —Adjustment for reclassification of gains (losses) realized in
income . . . . . . . . . . . . . . . . . . . . . . . . . . . . . . . . . . . . — — — — 1,102
Comprehensive income (loss) . . . . . . . . . . . . . . . . . . . . . . $ 401,960 $ 900,414 $ 45,302 $ 402,947 $ 183,867
Earnings per share(d)Weighted average number of common shares and common share
equivalents outstandingBasic . . . . . . . . . . . . . . . . . . . . . . . . . . . . . . . . . . . . . . . 116,018,364 93,697,194 74,677,903 65,068,093 58,477,130Diluted . . . . . . . . . . . . . . . . . . . . . . . . . . . . . . . . . . . . . . 120,630,945 97,168,409 75,819,413 67,786,673 58,874,567Basic earnings per share . . . . . . . . . . . . . . . . . . . . . . . . . . $ 3.41 $ 9.51 $ 0.62 $ 6.19 $ 3.13
Diluted earnings per share . . . . . . . . . . . . . . . . . . . . . . . . . $ 3.34 $ 9.24 $ 0.61 $ 5.95 $ 3.11
Cash dividends declared per share . . . . . . . . . . . . . . . . . . . . $ 0.88 $ 0.80 $ 0.80 $ — $ —
Selected financial ratiosLosses and loss expenses(e) . . . . . . . . . . . . . . . . . . . . . . . . 56.1% 36.1% 61.5% 33.1% 29.8%Policy acquisition cost(f) . . . . . . . . . . . . . . . . . . . . . . . . . . 16.6% 18.1% 18.7% 15.6% 11.8%General and administrative expense(g) . . . . . . . . . . . . . . . . . 13.5% 14.7% 12.0% 13.3% 15.1%
Expense ratio(h) . . . . . . . . . . . . . . . . . . . . . . . . . . . . . . . . 30.1% 32.8% 30.7% 28.9% 26.9%
Combined ratio(i) . . . . . . . . . . . . . . . . . . . . . . . . . . . . . . . 86.2% 68.9% 92.2% 62.0% 56.7%
Return on average equity(j) . . . . . . . . . . . . . . . . . . . . . . . . 10.8% 31.8% 2.7% 26.9% 17.0%
44
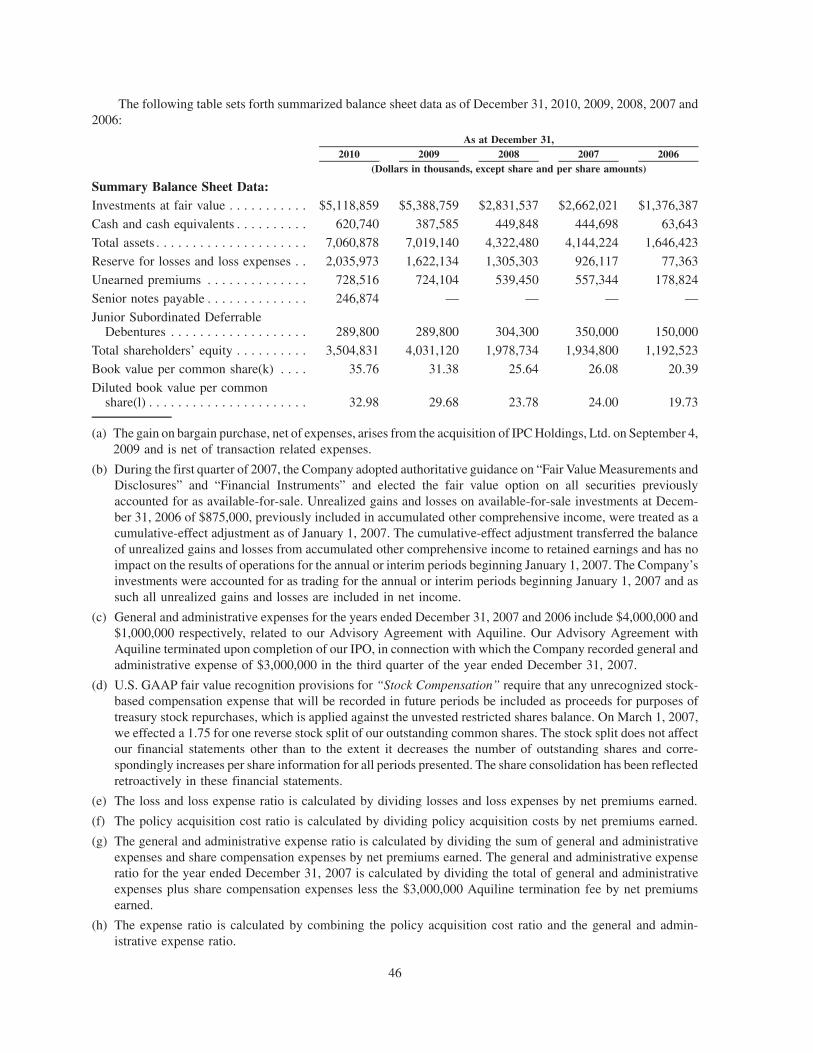
The following table sets forth summarized balance sheet data as of December 31, 2010, 2009, 2008, 2007 and2006:
2010 2009 2008 2007 2006As at December 31,
(Dollars in thousands, except share and per share amounts)
Summary Balance Sheet Data:Investments at fair value . . . . . . . . . . . $5,118,859 $5,388,759 $2,831,537 $2,662,021 $1,376,387
Cash and cash equivalents . . . . . . . . . . 620,740 387,585 449,848 444,698 63,643
Total assets . . . . . . . . . . . . . . . . . . . . . 7,060,878 7,019,140 4,322,480 4,144,224 1,646,423
Reserve for losses and loss expenses . . 2,035,973 1,622,134 1,305,303 926,117 77,363
Unearned premiums . . . . . . . . . . . . . . 728,516 724,104 539,450 557,344 178,824
Senior notes payable . . . . . . . . . . . . . . 246,874 — — — —
Junior Subordinated DeferrableDebentures . . . . . . . . . . . . . . . . . . . 289,800 289,800 304,300 350,000 150,000
Total shareholders’ equity . . . . . . . . . . 3,504,831 4,031,120 1,978,734 1,934,800 1,192,523
Book value per common share(k) . . . . 35.76 31.38 25.64 26.08 20.39
Diluted book value per commonshare(l) . . . . . . . . . . . . . . . . . . . . . . 32.98 29.68 23.78 24.00 19.73
(a) The gain on bargain purchase, net of expenses, arises from the acquisition of IPC Holdings, Ltd. on September 4,2009 and is net of transaction related expenses.
(b) During the first quarter of 2007, the Company adopted authoritative guidance on “Fair Value Measurements andDisclosures” and “Financial Instruments” and elected the fair value option on all securities previouslyaccounted for as available-for-sale. Unrealized gains and losses on available-for-sale investments at Decem-ber 31, 2006 of $875,000, previously included in accumulated other comprehensive income, were treated as acumulative-effect adjustment as of January 1, 2007. The cumulative-effect adjustment transferred the balanceof unrealized gains and losses from accumulated other comprehensive income to retained earnings and has noimpact on the results of operations for the annual or interim periods beginning January 1, 2007. The Company’sinvestments were accounted for as trading for the annual or interim periods beginning January 1, 2007 and assuch all unrealized gains and losses are included in net income.
(c) General and administrative expenses for the years ended December 31, 2007 and 2006 include $4,000,000 and$1,000,000 respectively, related to our Advisory Agreement with Aquiline. Our Advisory Agreement withAquiline terminated upon completion of our IPO, in connection with which the Company recorded general andadministrative expense of $3,000,000 in the third quarter of the year ended December 31, 2007.
(d) U.S. GAAP fair value recognition provisions for “Stock Compensation” require that any unrecognized stock-based compensation expense that will be recorded in future periods be included as proceeds for purposes oftreasury stock repurchases, which is applied against the unvested restricted shares balance. On March 1, 2007,we effected a 1.75 for one reverse stock split of our outstanding common shares. The stock split does not affectour financial statements other than to the extent it decreases the number of outstanding shares and corre-spondingly increases per share information for all periods presented. The share consolidation has been reflectedretroactively in these financial statements.
(e) The loss and loss expense ratio is calculated by dividing losses and loss expenses by net premiums earned.
(f) The policy acquisition cost ratio is calculated by dividing policy acquisition costs by net premiums earned.
(g) The general and administrative expense ratio is calculated by dividing the sum of general and administrativeexpenses and share compensation expenses by net premiums earned. The general and administrative expenseratio for the year ended December 31, 2007 is calculated by dividing the total of general and administrativeexpenses plus share compensation expenses less the $3,000,000 Aquiline termination fee by net premiumsearned.
(h) The expense ratio is calculated by combining the policy acquisition cost ratio and the general and admin-istrative expense ratio.
46
(i) The combined ratio is calculated by combining the loss ratio, the policy acquisition cost ratio and the generaland administrative expense ratio.
(j) Return on average equity is calculated by dividing the net income for the period by the average shareholders’equity during the period. Quarterly average shareholders’ equity is the annualized average of the beginning andending shareholders’ equity balances. Annual average shareholders’ equity is the average of the beginning,ending and intervening quarter end shareholders’ equity balances.
(k) Book value per common share is defined as total shareholders’ equity divided by the number of common sharesoutstanding as at the end of the period, giving no effect to dilutive securities.
(l) Diluted book value per common share is calculated based on total shareholders’ equity plus the assumedproceeds from the exercise of outstanding options and warrants, divided by the sum of common shares,unvested restricted shares, options and warrants outstanding (assuming their exercise).
Item 7. Management’s Discussion and Analysis of Financial Condition and Results of Operations
The following is a discussion and analysis of the Company’s consolidated results of operations for the threemonths ended December 31, 2010 and 2009 and for years ended December 31, 2010, 2009 and 2008 and theCompany’s consolidated financial condition, liquidity and capital resources at December 31, 2010 and 2009. TheCompany completed the acquisition of IPC on September 4, 2009. IPC is included in the Company’s consolidatedresults only for the four months ended December 31, 2009. This discussion and analysis pertains to the results of theCompany inclusive of IPC from the date of acquisition. This discussion and analysis should be read in conjunctionwith the Company’s audited consolidated financial statements and related notes thereto included elsewhere withinthis filing.
For a variety of reasons, the Company’s historical financial results may not accurately indicate futureperformance. See “Cautionary Note Regarding Forward-Looking Statements.” The Risk Factors set forth inItem 1A above present a discussion of important factors that could cause actual results to differ materially from theresults described in or implied by the forward-looking statements contained herein.
Executive Overview
The Company underwrites from two distinct global operating subsidiaries, Validus Re and Talbot. Validus Re,the Company’s principal reinsurance operating subsidiary, operates as a Bermuda-based provider of short-tailreinsurance products on a global basis and incorporates historical IPC business. Talbot, the Company’s principalinsurance operating subsidiary, operates through its two underwriting platforms: Talbot Underwriting Ltd, whichmanages Syndicate 1183 at Lloyd’s of London (“Lloyd’s”) which writes short-tail insurance products on aworldwide basis and Underwriting Risk Services Ltd, which is an underwriting agency writing primarily yachts andonshore energy business on behalf of the Talbot syndicate and others.
The Company’s strategy is to concentrate primarily on short-tail risks, which is an area where managementbelieves current prices and terms provide an attractive risk adjusted return and the management team has provenexpertise. The Company’s profitability in any given period is based upon premium and investment revenues less netlosses and loss expenses, acquisition expenses and operating expenses. Financial results in the insurance andreinsurance industry are influenced by the frequency and/or severity of claims and losses, including as a result ofcatastrophic events, changes in interest rates, financial markets and general economic conditions, the supply ofinsurance and reinsurance capacity and changes in legal, regulatory and judicial environments.
On September 4, 2009, the Company acquired all of the outstanding shares of IPC (the “IPC Acquisition”).Pursuant to an Amalgamation Agreement dated July 9, 2009 among IPC, Validus Holdings, Ltd and Validus, Ltd.(the “Amalgamation Agreement”), the Company acquired all of IPC’s outstanding common shares in exchange forthe Company’s common shares and cash. IPC’s operations focused on short-tail lines of reinsurance. The primarylines in which IPC conducted business were property catastrophe reinsurance and, to a limited extent, proper-ty-per-risk excess, aviation (including satellite) and other short-tail reinsurance on a worldwide basis. Theacquisition of IPC was undertaken to increase the Company’s capital base and gain a strategic advantage inthe then current reinsurance market, where capital and capacity had been depleted. This acquisition allowed theCompany to become a leading Bermuda carrier in the short-tail reinsurance and insurance market that facilitates
47
stronger relationships with major reinsurance intermediaries. For segmental reporting purposes, the results of IPC’soperations since the acquisition date have been included within the Validus Re segment in the consolidated financialstatements.
Written premiums are a function of the number and type of contracts written and the prevailing market prices.Renewal dates for reinsurance business tend to be concentrated at the beginning of quarters, with the timing ofpremiums written varying by line of business. Most property catastrophe business incepts January 1, April 1, June 1and July 1 with an annual policy, while most insurance and specialty lines renewals are more evenly spreadthroughout the year. Written premiums are generally highest in the first quarter and lowest during the fourth quarterof the year. Gross premiums written for pro rata programs are initially recorded as estimates and are then adjusted asactual results become known. Pro rata reinsurance is a type of reinsurance whereby the reinsurer indemnifies thepolicyholder against a predetermined portion of losses in return for a proportional share of the direct premiums.Premiums are then generally earned over a 24 month period and paid in monthly or quarterly installments.
The following are the primary lines in which the Company conducts business:
Property: Validus Re underwrites property catastrophe reinsurance, property per risk reinsurance andproperty pro rata reinsurance. Property catastrophe includes reinsurance for insurance companies’ exposuresto an accumulation of property and related losses from separate policies, typically relating to natural disastersor other catastrophic events. Property per risk provides reinsurance for insurance companies’ excess retentionon individual property and related risks, such as highly-valued buildings. In property pro rata contracts thereinsurer shares the premiums as well as the losses and expenses in an agreed proportion with the cedant.Talbot primarily writes direct and facultative property insurance, lineslips and binding authorities and propertytreaty. The business written is principally commercial and industrial insurance. The business is short-tail withpremiums generally earned within one year and claims generally paid within two years.
Marine: The Company underwrites insurance and reinsurance on marine risks covering damage to orlosses of marine vessels or cargo, yachts and marinas, third-party liability for marine accidents and physicalloss and liability from principally offshore energy properties. Talbot primarily underwrites marine insuranceon a direct and facultative basis. Validus Re underwrites marine reinsurance on an excess of loss basis, and to alesser extent, on a pro rata basis.
Specialty: The Company underwrites other specialty lines with very limited exposure correlation withits property, marine and energy portfolios. Validus Re underwrites other lines of business depending on anevaluation of pricing and market conditions, which include aerospace, terrorism, life and accident & health andworkers’ compensation catastrophe. With the exception of the aerospace line of business, which has ameaningful portion of its gross premiums written volume on a proportional basis, Validus Re’s other specialtylines are primarily written on an excess of loss basis. Talbot underwrites war, political risks, political violence,financial institutions, contingency, accident and health, and aviation. Most of the Talbot specialty business iswritten on a direct or facultative basis or through a binding authority or coverholder.
Income from the Company’s investment portfolio primarily comprises interest income on fixed maturityinvestments net of investment expenses and net realized/unrealized gains/losses on investments. A significantportion of the Company’s contracts provide short-tail coverage for damages resulting mainly from natural and man-made catastrophes, which means that the Company could become liable for a significant amount of losses on shortnotice. Accordingly, the Company has structured its investment portfolio to preserve capital and maintain a highlevel of liquidity, which means that the large majority of the Company’s investment portfolio consists of short-termfixed maturity investments. The Company’s fixed income investments are classified as trading. Under U.S. GAAP,these securities are carried at fair value, and unrealized gains and losses are included in net income in theCompany’s consolidated statements of operations and comprehensive income.
The Company’s expenses consist primarily of losses and loss expenses, acquisition costs, general andadministrative expenses, and finance expenses related to debentures, senior notes and our credit facilities.
Losses and loss expenses are a function of the amount and type of insurance and reinsurance contracts writtenand of the loss experience of the underlying risks. Reserves for losses and loss expense include a component foroutstanding case reserves for claims which have been reported and a component for losses incurred but not reported.
48

The uncertainties inherent in the reserving process, together with the potential for unforeseen developments, mayresult in losses and loss expenses materially different than the reserve initially established. Changes to prior yearloss reserves will affect current underwriting results by increasing net income if a portion of the prior year reservesprove to be redundant or decreasing net income if the prior year reserves prove to be insufficient. Adjustmentsresulting from new information will be reflected in income in the period in which they become known. TheCompany’s ability to estimate losses and loss expenses accurately, and the resulting impact on contract pricing, is acritical factor in determining profitability.
Since most of the lines of business underwritten have large aggregate exposures to natural and man-madecatastrophes, the Company expects that claims experience will often be the result of irregular and significant events.The occurrence of claims from catastrophic events is likely to result in substantial volatility in, and could potentiallyhave a material adverse effect on, the Company’s financial condition, results of operations, and ability to write newbusiness. The business written by Talbot helps to mitigate these risks by providing us with significant benefits interms of product line and geographic diversification.
Acquisition costs consist principally of brokerage expenses and commissions which are driven by contractterms on reinsurance contracts written, and are normally a specific percentage of premiums. Under certaincontracts, cedants may also receive profit commissions which will vary depending on the loss experience on thecontract. Acquisition costs are presented net of commissions or fees received on any ceded premium.
General and administrative expenses are generally comprised of expenses which do not vary with the amountof premiums written or losses incurred. Applicable expenses include salaries and benefits, professional fees, officeexpenses, risk management, and stock compensation expenses. Stock compensation expenses include costs relatedto the Company’s long-term incentive plan, under which restricted stock are granted to certain employees.
Business Outlook and Trends
We underwrite global specialty property insurance and reinsurance and have large aggregate exposures tonatural and man-made disasters. The occurrence of claims from catastrophic events results in substantial volatility,and can have material adverse effects on the Company’s financial condition and results and ability to write newbusiness. This volatility affects results for the period in which the loss occurs because U.S. accounting principles donot permit reinsurers to reserve for such catastrophic events until they occur. Catastrophic events of significantmagnitude historically have been relatively infrequent, although management believes the property catastrophereinsurance market has experienced a higher level of worldwide catastrophic losses in terms of both frequency andseverity in the period from 1992 to the present. We also expect that increases in the values and concentrations ofinsured property will increase the severity of such occurrences in the future. The Company seeks to reflect thesetrends when pricing contracts.
Property and other reinsurance premiums have historically risen in the aftermath of significant catastrophiclosses. As loss reserves are established, industry surplus is depleted and the industry’s capacity to write newbusiness diminishes. At the same time, management believes that there is a heightened awareness of exposure tonatural catastrophes on the part of cedants, rating agencies and catastrophe modeling firms, resulting in an increasein the demand for reinsurance protection.
The global property and casualty insurance and reinsurance industry has historically been highly cyclical. TheCompany was formed in October 2005 in response to the supply/demand imbalance resulting from the largeindustry losses in 2004 and 2005. In the aggregate, the Company observed substantial increases in premium rates in2006 compared to 2005 levels. During the years ended December 31, 2007 and 2008, the Company experiencedincreased competition in most lines of business. Capital provided by new entrants or by the commitment ofadditional capital by existing insurers and reinsurers increased the supply of insurance and reinsurance whichresulted in a softening of rates in most lines. However, during 2008, the insurance and reinsurance industry incurredmaterial losses and capital declines due to Hurricanes Ike and Gustav and the global financial crisis. In the wake ofthese events, the January 2009 renewal season saw decreased competition and increased premium rates due torelatively scarce capital and increased demand. During 2009, the Company observed reinsurance demand stabi-lization and industry capital recovery from investment portfolio gains. In 2009, there were few notable large lossesaffecting the worldwide (re)insurance industry and no major hurricanes making landfall in the United States.
49
The January 2010 renewal period saw business being withdrawn from the market, notably catastrophe excessof loss, resulting in the Company writing less business in these lines and reducing the Company’s aggregate lossexposure. Despite the elevated level of catastrophe activity during the first quarter of 2010, principally the Chileanearthquake which stands among the most costly industry losses in history outside of the United States, the Companycontinued to see increased competition and decreased premium rates in most classes of business. During the yearended December 31, 2010, Validus Re experienced rate decreases in most classes of business with the exception ofoffshore energy and Latin America. The Talbot segment also experienced pricing pressure in most classes ofbusiness, the exceptions being the offshore energy, financial institutions and political risk lines. These linesexperienced favorable renewal terms and conditions following recent losses.
Claims activity during the three months ended December 31, 2010 remained relatively benign, though theQueensland floods in Australia remain a potentially significant market event, as rain continued to hit Queenslandwith flood waters still rising. The business written in the three months ended December 31, 2010 saw a similarpattern with pricing pressure across much of the Talbot sector, the exception being the Offshore Energy account andthe Energy Liability account that saw rises following the Deepwater Horizon event in the Gulf of Mexico.
During the January 2011 renewal season, the Validus Re segment underwrote $525.3 million in grosspremiums written, a decrease of 8.5% from the prior period. This renewal data does not include Talbot’s operationsas its business is distributed relatively evenly throughout the year.
During the January 2011 renewal season, Validus Re increased gross premiums written on the U.S. Cat XOLlines and decreased gross premiums written in the proportional lines. In addition, Validus Re decreased grosspremiums written in the International Property lines as market conditions dictated. In the aftermath of 2010’sDeepwater Horizon loss, Validus Re saw additional opportunities and rate increases in the marine lines. Within thespecialty lines, Validus Re increased gross premiums written in the terrorism lines among other sub-classes.
Financial Measures
The Company believes the following financial indicators are important in evaluating performance andmeasuring the overall growth in value generated for shareholders:
Annualized return on average equity represents the level of net income available to shareholders generatedfrom the average shareholders’ equity during the period. Annualized return on average equity is calculated bydividing the net income for the period by the average shareholders’ equity during the period. Average shareholders’equity is the average of the beginning, ending and intervening quarter end shareholders’ equity balances. TheCompany’s objective is to generate superior returns on capital that appropriately reward shareholders for the risksassumed and to grow revenue only when returns meet or exceed internal requirements. Details of annualized returnon average equity are provided below.
2010 2009 2008 2010 2009 2008
Three Months EndedDecember 31,
Year EndedDecember 31,
Annualized return on average equity . . . . . . . . . . . . . . . . . . . . . . 11.3% 16.6% 7.7% 10.8% 31.8% 2.7%
The decrease in annualized return on average equity were driven primarily by a decrease in net income for thethree months and year ended December 31, 2010. Net income for the three months ended December 31, 2010decreased by $63.1 million, or 38.1% compared to the three months ended December 31, 2009 due primarily torealized and unrealized losses on fixed income securities caused by rising interest rates. Net income for the yearended December 31, 2010 decreased by $494.8 million, or 55.1% compared to the year ended December 31, 2009due primarily to the gain on bargain purchase of IPC in 2009 and increased notable losses for the year endedDecember 31, 2010.
Diluted book value per common share is considered by management to be an appropriate measure of ourreturns to common shareholders, as we believe growth in our book value on a diluted basis ultimately translates intogrowth of our stock price. Diluted book value per common share increased by $3.30, or 11.1%, from $29.68 atDecember 31, 2009 to $32.98 at December 31, 2010. The increase was substantially due to earnings generated in theyear ended December 31, 2010, partially offset by dividend payments totaling $0.88 per share and per share
50
equivalent in the period. Diluted book value per common share is a Non-GAAP financial measure. The mostcomparable U.S. GAAP financial measure is book value per common share. Diluted book value per common shareis calculated based on total shareholders’ equity plus the assumed proceeds from the exercise of outstanding optionsand warrants, divided by the sum of common shares, unvested restricted shares, options and warrants outstanding(assuming their exercise). A reconciliation of diluted book value per common share to book value per commonshare is presented below in the section entitled “Non-GAAP Financial Measures.”
Cash dividends per common share are an integral part of the value created for shareholders. The Companydeclared quarterly cash dividends of $0.22 per common share and common share equivalent in each of the fourquarters of 2010. On February 9, 2011, the Company announced a quarterly cash dividend of $0.25 per commonshare and $0.25 per common share equivalent for which each outstanding warrant is exercisable, payable onMarch 31, 2011 to holders of record on March 15, 2011.
Underwriting income measures the performance of the Company’s core underwriting function, excludingrevenues and expenses such as net investment income (loss), other income, finance expenses, net realized andunrealized gains (losses) on investments, foreign exchange gains (losses) and gain on bargain purchase, net ofexpenses. The Company believes the reporting of underwriting income enhances the understanding of our results byhighlighting the underlying profitability of the Company’s core insurance and reinsurance operations. Underwritingincome for the three months ended December 31, 2010 and 2009 was $139.7 million and $153.6 million,respectively. Underwriting income for the year ended December 31, 2010 and 2009 was $242.4 million and$450.2 million, respectively. Underwriting income is a Non-GAAP financial measure as described in detail andreconciled in the section below entitled “Underwriting Income.”
Critical Accounting Policies and Estimates
The Company’s consolidated financial statements have been prepared in accordance with U.S. GAAP. Thepreparation of financial statements in accordance with U.S. GAAP requires management to make estimates andassumptions that affect reported and disclosed amounts of assets and liabilities, as well as disclosure of contingentassets and liabilities as at the balance sheet date and the reported amounts of revenues and expenses during thereporting period. Management believes the following accounting policies are critical to the Company’s financialreporting as the application of these policies requires management to make significant judgments. Managementbelieves the items that require the most subjective and complex estimates are (1) reserve for losses and lossexpenses, (2) premiums, (3) reinsurance premiums ceded and reinsurance recoverable, and (4) investmentvaluation.
Reserve for Losses and Loss Expenses. For insurance and reinsurance companies, a significant judgmentmade by management is the estimation of the reserve for losses and loss expenses. The Company establishes itsreserve for losses and loss expenses to cover the estimated remaining liability incurred for both reported claims(“case reserves”) and unreported amounts (“incurred but not reported” or “IBNR reserves”). For insurance andreinsurance business, the IBNR reserves include provision for loss incidents that have occurred but have not yetbeen reported to the Company as well as for future variation in case reserves (where the claim has been reported butthe ultimate cost is not yet known). Within the reinsurance business, the portion of total IBNR related to futurevariation on known claims is calculated at the individual claim level in some instances (an additional case reserve orindividual claim IBNR). Within the insurance business, the provision for future variation in current case reserves isgenerally calculated using actuarial estimates of total IBNR, while individual claim IBNR amounts are sometimescalculated for larger claims. During 2010, given the complexity and severity of notable loss events in the year, anexplicit reserve for development on 2010 notable loss events was included within the Company’s IBNR reservingprocess. As uncertainties surrounding initial notable loss events develop, it is expected that the reserve will beallocated to specific notable loss events.
Loss reserve estimates for insurance and reinsurance business are not precise in that they deal with the inherentuncertainty in the outcome of insurance and reinsurance claims made on the Company, many of which have not yetbeen reported to the Company. Estimating loss reserves requires management to make assumptions, both explicitand implicit, regarding future paid and reported loss development patterns, frequency and severity trends, claimssettlement practices, potential changes in the legal environment and other factors. These estimates and judgments
51
are based on numerous factors, and may be revised over time as additional experience or other data becomesavailable, as new or improved methodologies are developed or as current laws change.
As predominantly a broker market insurer and reinsurer, the Company must rely on loss information reportedto us by brokers from clients, where such information is often incomplete or changing. The quality and type ofinformation received varies by client and by the nature of the business, insurance or reinsurance.
In the insurance business, for risks that the Company leads, the Company receives from brokers details ofpotential claims, on the basis of which the Company’s loss adjusters make estimates of the likely ultimate outcomeof the claims. In determining these reserves, the Company takes into account a number of factors including the factsand circumstances of the individual claim, the nature of the coverage and historical information about its experienceon similar types of claims. For insurance business where another company is the lead, the case reserves areestablished by the lead underwriter and validated centrally by the Lloyd’s market claims bureau, with a samplereviewed by the Company. The sum of the individual claim estimates for lead and follow business constitutes thecase reserves.
For reinsurance business, the Company typically receives from brokers details of paid losses and estimatedcase reserves recorded by the ceding company. In addition to this, the ceding company’s estimated provision forIBNR losses is sometimes also available, although this in itself introduces additional uncertainty owing to thediffering and typically unknown reserving practices of ceding companies.
There will also be a time lag between a loss occurring and it being reported, first by the original claimant to itsinsurer, via the insurance broker, and for reinsurance business, subsequently from the insurer to the reinsurer via thereinsurance broker.
The Company writes a mix of predominantly short-tail business, both insurance and reinsurance. Thecombination of low claim frequency and high claim severity that is characteristic of much of this short-tailbusiness makes the available data more volatile and less reliable for predicting ultimate losses. For example, inproperty lines, there can be additional uncertainty in loss estimation related to large catastrophe events, whethernatural or man-made. With winds events, such as hurricanes, the damage assessment process may take more than ayear. The cost of claims is also subject to volatility due to supply shortages for construction materials and labor. Inthe case of earthquakes, the damage assessment process may take longer as buildings are discovered to havestructural weaknesses not initially detected.
The Company also writes longer tail insurance lines of business, predominantly financial institutions($39.6 million of gross premiums written on a claims made basis) and marine and energy liabilities ($41.9 millionof gross premiums substantially written on a losses occurring basis) for the year ended December 31, 2010. Theselonger tail lines represent 8.3% of Talbot’s gross premiums written for the year ended December 31, 2010. Formarine and energy liability, the time from the occurrence of a claim to its first report to the Company can be years.For both marine and energy liability and financial institutions, the subsequent time between reporting of a claim andits settlement can be years. In these intervening periods between occurrence, reporting and settlement, additionalfacts regarding individual claims and trends often will become known and current laws and case law may change,affecting the ultimate value of the claim.
Taken together, these issues add considerable uncertainty to the process of estimating ultimate losses, henceloss reserves, and this uncertainty is increased for reinsurance business compared with insurance business due to theadditional parties in the chain of reporting from the original claimant to the reinsurer.
As a result of the uncertainties described above, the Company must estimate IBNR reserves, which consist of aprovision for future development on known loss events, as well as a provision for claims which have occurred butwhich have not yet been reported to us by clients. Because of the degree of reliance that is necessarily placed onbrokers and (re)insured companies for claims reporting, the associated time lag, the low frequency/high severitynature of much of the business underwritten, the rapidly emerging and changing nature of facts and circumstancessurrounding large events and, for reinsurance business, the varying reserving practices among ceding companies asdescribed above, reserve estimates are highly dependent on management’s judgment and are subject to uncertainty.
52
The Company strives to take account of these uncertainties in the judgments and assumptions made whenestablishing loss reserves, but it is not possible to eliminate the uncertainties. As a result, there is a risk that theCompany’s actual losses may be higher or lower than the reserves booked.
For the Company’s insurance business written by Talbot, where a longer reserving history exists, the Companyexamines the development of its own historical paid and incurred losses to identify trends, which it thenincorporates into the reserving process where it deems appropriate.
For the Company’s reinsurance business, especially that written by Validus Re where the Company relies moreheavily on information provided by clients in order to assist it in estimating reserves, the Company performs certainprocesses in order to help assess the completeness and accuracy of such information as follows:
1. In addition to information received from clients on reported claims, the Company also uses infor-mation on the patterns of client loss reporting and loss settlements from previous events in order to estimate theCompany’s ultimate liability related to these events;
2. The Company uses reinsurance industry information in order to perform consistency checks on thedata provided by ceding companies and to identify trends in loss reporting and settlement activity. Where itdeems appropriate, the Company incorporates such information in establishing reinsurance reserves; and
3. For both insurance and reinsurance business, the Company supplements the loss information receivedfrom clients with loss estimates developed by market share techniques and third party catastrophe modelswhen such information is available.
Although there is normally a lag in receiving reinsurance data from cedants, the Company currently has nobacklog related to the processing of assumed reinsurance information. The Company actively manages itsrelationships with brokers and clients and considers existing disputes with counterparties to be in the normalcourse of business.
As described above, the reserve for losses and loss expenses includes both a component for outstanding casereserves for claims which have been reported and a component for IBNR reserves. IBNR reserves are the differencebetween ultimate losses and reported losses, where reported losses are the sum of paid losses and outstanding casereserves. Ultimate losses are estimated by management using various actuarial methods, including exposure-basedand loss-based methods, as well as other qualitative assessments regarding claim trends.
The Company uses a reserving methodology that establishes a point estimate for ultimate losses. The pointestimate represents management’s best estimate of ultimate losses and loss expenses. The Company does not selecta range as part of its loss reserving process. The extent of reliance on management judgment in the reserving processdiffers depending on the circumstances surrounding the estimations, including the volume and credibility of data,the perceived relevance of historical data to future conditions, the stability or lack of stability in the Company’soperational processes for handling losses (including claims practices and systems) and other factors. The Companyreviews its reserving assumptions and methodologies on a quarterly basis. Two of the most critical assumptions inestablishing reserves are loss emergence patterns and expected (or “prior”) loss ratios. Loss emergence patterns arecritical to the reserving process as they can be one key indicator of the ultimate liability. A pattern of reported lossemergence different from expectations may indicate a change in the loss climate and may thus influence theestimate of future payments that should be reflected in reserves. Expected loss ratios are a primary component in theCompany’s calculation of estimated ultimate losses for business at an early stage in its development.
Loss emergence patterns for the business written by Talbot are generally derived from Talbot’s own historicloss development triangulations, supplemented in some instances by Lloyd’s market data. For the business writtenby Validus Re, where its own historic loss development triangulations are currently more limited, greater use ismade of market data including reinsurance industry data available from organizations such as statistical bureaus andconsulting firms, where appropriate. Expected loss ratios are estimated in a variety of ways, largely dependent uponthe data available. Wherever it deems appropriate, management incorporates the Company’s own loss experience inestablishing initial expected loss ratios and reserves. This is particularly true for the business written by Talbotwhere a longer reserving history exists and expected losses and loss ratios consider, among other things, rateincreases and changes in terms and conditions that have been observed in the market. For reinsurance business,
53
expected losses and loss ratios are typically developed using vendor and proprietary computer models. Theinformation used in these models is collected by underwriters and actuaries during the initial pricing of the business.
The Company has catastrophe event ultimate loss reserve estimation procedures for the investigation, analysis,and estimation of ultimate losses resulting from large catastrophe events. The determination regarding which eventsfollow these procedures is made by members of senior management from relevant departments within theCompany. The procedures are designed to facilitate the communication of information between various relevantfunctions and provide an efficient approach to determining the estimated loss for the event.
In developing estimates for large catastrophe events, the Company considers various sources of informationincluding; specific loss estimates reported by our cedants and policyholders, ceding company and overall industryloss estimates reported by our brokers and by claims reporting services, proprietary and third party vendor modelsand internal data regarding insured or reinsured exposures related to the geographical location of the event. Use ofthese various sources enables management to estimate the ultimate loss for known events with a higher degree ofaccuracy and timeliness than if the Company relied solely on one data source. Generally, catastrophe event ultimateloss estimates are established without regard to whether we may subsequently contest any claim resulting from theevent. Indicated ultimate loss estimates for catastrophe events are compiled by a committee of management, andthese indicated ultimate losses are incorporated into the process of selecting management’s best estimate ofreserves.
As with large catastrophe events, the Company separately estimates ultimate losses for certain large claimsusing a number of methods, including estimation based on vendor models, analyses of specific industry occurrencesand facts, as well as information from cedants and policyholders on individual contract involvements.
Management’s loss estimates are subject to annual corroborative review by independent actuaries usinggenerally accepted actuarial techniques and other analytical and qualitative methods.
The Company’s three lines of business, property, marine and specialty, are exposed to event-related risks thatare generally reported and paid within three years of the event except for financial institutions and energy andmarine liability. The Company estimates that 83.6% of its current reserves will be paid within three years. TheCompany writes longer tail business in its financial institutions marine and energy liabilities lines. Factorscontributing to uncertainty in reserving for these lines include longer duration of loss development patterns,difficulty applying older loss experience to newer years, and the possibility of future litigation. The Companyconsiders these factors when reserving for longer tail lines.
As described above, for all lines of business, the Company’s reserve for losses and loss adjustment expensesand loss reserves recoverable consist of three categories: (1) case reserves, (2) in certain circumstances, additionalcase reserves (ACR), and (3) IBNR reserves. For both Talbot and Validus Re, IBNR is established separately forlarge or catastrophe losses and smaller “attritional” losses. The reserves and recoverables for attritional and large orcatastrophe losses are established on an annual and interim basis as follows:
1. Case reserves: Case reserves generally are analyzed and established by each segment’s claimsdepartment on all lines, making use of third party input where appropriate (including, for the reinsurancebusiness, reports of losses from the ceding companies). For insurance business where Talbot is not the leadunderwriter on the business, the case reserves are established by the lead underwriter and validated by centralLloyd’s market claims bureau, with a sample reviewed by Talbot.
2. ACR reserves: ACRs are established for Validus Re business by our claims department in cases wherewe believe the case reserves reported by the cedant require adjustment. ACRs supplement case reserves basedon information obtained through ceding company audits or other sources. ACRs are not generally used atTalbot as claim volumes are generally greater and thus the potential for future variation in case reserveestimates on known claims often can be analyzed at an aggregate level using historical data.
3. IBNR reserves:
a. Large or catastrophe events — IBNR reserves are established for all lines based on the eachsegment’s estimates for known loss events for which not all claims have been reported to the Company. Inestablishing such IBNR reserves, the Company accumulates loss information from modeling agencies,
54
where possible, publicly available sources and information contained in client reports and estimates. Theloss information is applied to the Company’s book of in-force contracts to establish an estimate of theCompany’s ultimate exposure to the loss event. For some large loss events, the Company estimates anultimate loss expectation for the individual event. Paid losses, case reserves and any additional casereserves are deducted from the ultimate loss to ascertain the IBNR estimate for individual large claims orcatastrophe events. The size of event for which the Company establishes a separate ultimate loss estimatemay vary based on an assessment of the materiality of the event, as well as on other factors. During 2010,given the complexity and severity of notable loss events in the year, an explicit reserve for development on2010 notable loss events was included within the Company’s IBNR reserving process. As uncertaintiessurrounding initial notable loss events develop, it is expected that the reserve will be allocated to specificnotable loss events.
b. Attritional losses — IBNR reserves are established using some combination of the actuarialmethods described above, including the Chain Ladder method, the Generalized Cape Cod method and theBornhuetter-Ferguson method. In situations where limited historic development data is available and/orthe year being analyzed is more recent (less mature), the expected loss method and the Bornhuetter-Ferguson method are more commonly used. Under all methods used at both Validus Re and Talbot, anultimate loss amount is established. Paid losses, case reserves and any additional case reserves are thendeducted from the ultimate loss to ascertain the attritional IBNR reserves.
For all sources of IBNR, net reserves are estimated by first estimating gross IBNR reserves, then estimatingreinsurance recoverables on IBNR.
The Company’s reserving methodology was not changed materially in the year ended December 31, 2010 fromthe methodology used in the year ended December 31, 2009 for either Validus Re or Talbot. Management’s bestestimate of the gross reserve for losses and loss expenses and loss reserves recoverable at December 31, 2010 were$2,036.0 million and $283.1 million, respectively. The following table sets forth a breakdown between gross casereserves and gross IBNR by segment at December 31, 2010.
Gross CaseReserves
GrossIBNR
Total GrossReserve forLosses and
Loss Expenses
As at December 31, 2010
(Dollars in thousands)
Validus Re . . . . . . . . . . . . . . . . . . . . . . . . . . . . . . . . . . . $ 523,388 $ 474,777 $ 998,165
Talbot . . . . . . . . . . . . . . . . . . . . . . . . . . . . . . . . . . . . . . 601,760 589,788 1,191,548
Eliminations . . . . . . . . . . . . . . . . . . . . . . . . . . . . . . . . . . (89,267) (64,473) (153,740)
Total . . . . . . . . . . . . . . . . . . . . . . . . . . . . . . . . . . . . . . . $1,035,881 $1,000,092 $2,035,973
Management’s best estimate of the gross reserve for losses and loss expenses and loss reserves recoverable atDecember 31, 2009 were $1,622.1 and $181.8 million, respectively. The following table sets forth a breakdownbetween gross case reserves and gross IBNR by segment at December 31, 2009.
Gross CaseReserves
GrossIBNR
Total GrossReserve forLosses and
Loss Expenses
As at December 31, 2009
(Dollars in thousands)
Validus Re . . . . . . . . . . . . . . . . . . . . . . . . . . . . . . . . . . . . . $397,133 $345,377 $ 742,510
Talbot . . . . . . . . . . . . . . . . . . . . . . . . . . . . . . . . . . . . . . . . . 440,881 463,105 903,986
Eliminations . . . . . . . . . . . . . . . . . . . . . . . . . . . . . . . . . . . . (6,689) (17,673) (24,362)
Total . . . . . . . . . . . . . . . . . . . . . . . . . . . . . . . . . . . . . . . . . $831,325 $790,809 $1,622,134
55
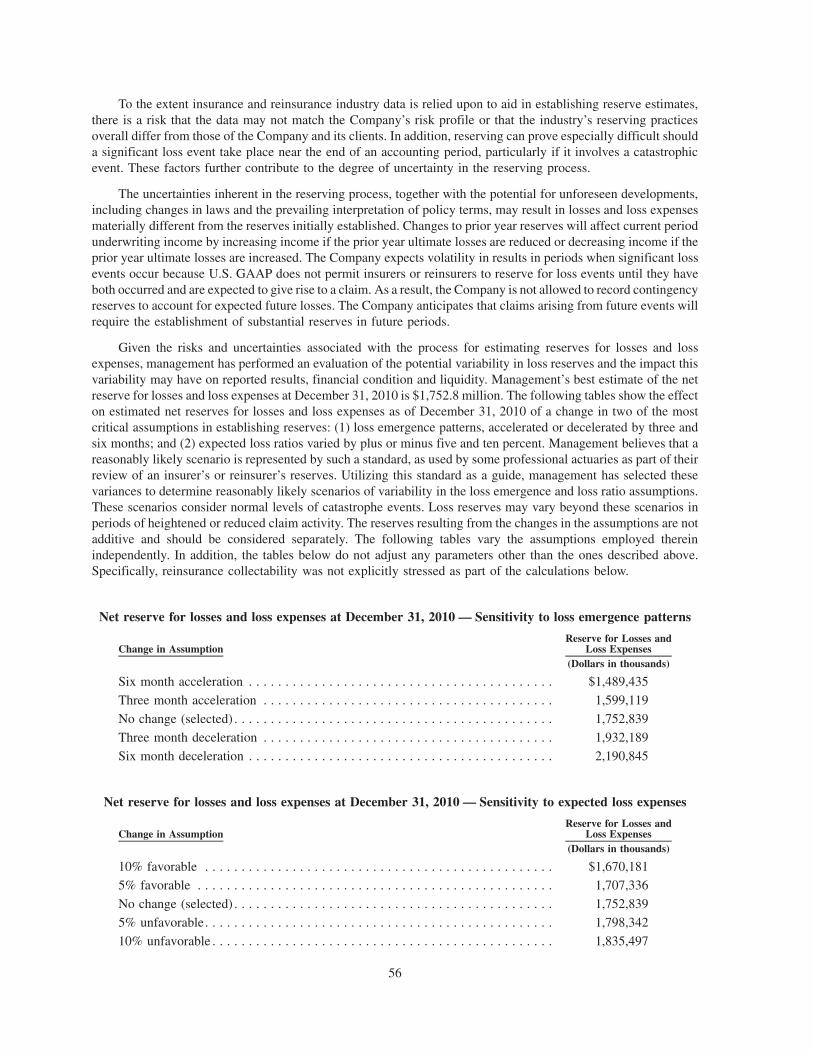
To the extent insurance and reinsurance industry data is relied upon to aid in establishing reserve estimates,there is a risk that the data may not match the Company’s risk profile or that the industry’s reserving practicesoverall differ from those of the Company and its clients. In addition, reserving can prove especially difficult shoulda significant loss event take place near the end of an accounting period, particularly if it involves a catastrophicevent. These factors further contribute to the degree of uncertainty in the reserving process.
The uncertainties inherent in the reserving process, together with the potential for unforeseen developments,including changes in laws and the prevailing interpretation of policy terms, may result in losses and loss expensesmaterially different from the reserves initially established. Changes to prior year reserves will affect current periodunderwriting income by increasing income if the prior year ultimate losses are reduced or decreasing income if theprior year ultimate losses are increased. The Company expects volatility in results in periods when significant lossevents occur because U.S. GAAP does not permit insurers or reinsurers to reserve for loss events until they haveboth occurred and are expected to give rise to a claim. As a result, the Company is not allowed to record contingencyreserves to account for expected future losses. The Company anticipates that claims arising from future events willrequire the establishment of substantial reserves in future periods.
Given the risks and uncertainties associated with the process for estimating reserves for losses and lossexpenses, management has performed an evaluation of the potential variability in loss reserves and the impact thisvariability may have on reported results, financial condition and liquidity. Management’s best estimate of the netreserve for losses and loss expenses at December 31, 2010 is $1,752.8 million. The following tables show the effecton estimated net reserves for losses and loss expenses as of December 31, 2010 of a change in two of the mostcritical assumptions in establishing reserves: (1) loss emergence patterns, accelerated or decelerated by three andsix months; and (2) expected loss ratios varied by plus or minus five and ten percent. Management believes that areasonably likely scenario is represented by such a standard, as used by some professional actuaries as part of theirreview of an insurer’s or reinsurer’s reserves. Utilizing this standard as a guide, management has selected thesevariances to determine reasonably likely scenarios of variability in the loss emergence and loss ratio assumptions.These scenarios consider normal levels of catastrophe events. Loss reserves may vary beyond these scenarios inperiods of heightened or reduced claim activity. The reserves resulting from the changes in the assumptions are notadditive and should be considered separately. The following tables vary the assumptions employed thereinindependently. In addition, the tables below do not adjust any parameters other than the ones described above.Specifically, reinsurance collectability was not explicitly stressed as part of the calculations below.
Net reserve for losses and loss expenses at December 31, 2010 — Sensitivity to loss emergence patterns
Change in AssumptionReserve for Losses and
Loss Expenses(Dollars in thousands)
Six month acceleration . . . . . . . . . . . . . . . . . . . . . . . . . . . . . . . . . . . . . . . . . . $1,489,435
Three month acceleration . . . . . . . . . . . . . . . . . . . . . . . . . . . . . . . . . . . . . . . . 1,599,119
No change (selected) . . . . . . . . . . . . . . . . . . . . . . . . . . . . . . . . . . . . . . . . . . . . 1,752,839
Three month deceleration . . . . . . . . . . . . . . . . . . . . . . . . . . . . . . . . . . . . . . . . 1,932,189
Six month deceleration . . . . . . . . . . . . . . . . . . . . . . . . . . . . . . . . . . . . . . . . . . 2,190,845
Net reserve for losses and loss expenses at December 31, 2010 — Sensitivity to expected loss expenses
Change in AssumptionReserve for Losses and
Loss Expenses(Dollars in thousands)
10% favorable . . . . . . . . . . . . . . . . . . . . . . . . . . . . . . . . . . . . . . . . . . . . . . . . $1,670,181
5% favorable . . . . . . . . . . . . . . . . . . . . . . . . . . . . . . . . . . . . . . . . . . . . . . . . . 1,707,336
No change (selected) . . . . . . . . . . . . . . . . . . . . . . . . . . . . . . . . . . . . . . . . . . . . 1,752,839
5% unfavorable. . . . . . . . . . . . . . . . . . . . . . . . . . . . . . . . . . . . . . . . . . . . . . . . 1,798,342
10% unfavorable . . . . . . . . . . . . . . . . . . . . . . . . . . . . . . . . . . . . . . . . . . . . . . . 1,835,497
56

The most significant variance in the above scenarios, six month deceleration in loss emergence patterns, wouldhave the effect of increasing losses and loss expenses by $438.0 million.
Management believes that the reserve for losses and loss expenses is sufficient to cover expected claimsincurred before the evaluation date on the basis of the methodologies and judgments used to support its estimates.However, there can be no assurance that actual payments will not vary significantly from total reserves. The reservefor losses and loss expenses and the methodology of estimating such reserve are regularly reviewed and updated asnew information becomes known. Any resulting adjustments are reflected in income in the period in which theybecome known.
Premiums. For insurance business, written premium estimates are determined from the business planestimates of premiums by class, the aggregate of underwriters’ estimates on a policy-by-policy basis, andprojections of ultimate premiums using generally accepted actuarial methods. In particular, direct insurancepremiums are recognized in accordance with the type of contract written.
The majority of our insurance premium is accepted on a direct open market or facultative basis. We receive apremium which is identified in the policy and recorded as unearned premium on the inception date of the contract.This premium will typically adjust only if the underlying insured values adjust. We actively monitor underlyinginsured values and record adjustment premiums in the period in which amounts are reasonably determinable.
For business written on a facultative basis, although a premium estimate is not contractually stated for theamount of business to be written under any particular facility, an initial estimate of the expected premium written isreceived from the coverholder via the broker. Our estimate of premium is derived by reference to one or more of thefollowing: the historical premium volume experienced by any facility; historical premium volume of similarfacilities; the estimates provided by the broker; and industry information on the underlying business. We activelymonitor the development of actual reported premium against the estimates made; where actual reported premiumsdeviate from the estimate, we carry out an analysis to determine the cause and may, if necessary, adjust the estimatedpremiums. In the year ended December 31, 2010, premiums written on a facultative basis accounted forapproximately $337.8 million of total gross premiums written at Talbot.
For contracts written on a losses occurring basis or claims made basis, premium income is generally earnedproportionately over the expected risk period, usually 12 months. For all other contracts, comprising contractswritten on a risks attaching basis, premiums are generally earned over a 24 month period due to the fact that some ofthe underlying exposures may attach towards the end of the contract, and such underlying exposures generally havea 12 month coverage period. The portion of the premium related to the unexpired portion of the policy at the end ofany reporting period is presented on the consolidated balance sheet as unearned premiums.
GrossWritten
Premiums
GrossWritten
Premiums (%)
GrossWritten
Premiums
GrossWritten
Premiums (%)
GrossWritten
Premiums
GrossWritten
Premiums (%)
Year EndedDecember 31, 2010
Year EndedDecember 31, 2009(a)
Year EndedDecember 31, 2008
(Dollars in thousands)
Proportional . . . . . . $ 260,149 13.1% $ 180,752 11.1% $ 179,530 13.2%
Non-proportional . . 1,730,417 86.9% 1,440,489 88.9% 1,182,954 86.8%
Total . . . . . . . . . . . $1,990,566 100.0% $1,621,241 100.0% $1,362,484 100.0%
(a) The results of operations for IPC are consolidated only from the September 2009 date of acquisition. No pre-acquisition results of operations for IPC are presented in the analysis above.
For reinsurance business where the assumed reinsurance premium is written on an excess of loss or on a prorata basis, reinsurance contracts are generally written prior to the time the underlying direct policies are written bycedants and accordingly cedants must estimate such premiums when purchasing reinsurance coverage. For excessof loss contracts, the deposit premium is defined in the contract. The deposit premium is based on the client’sestimated premiums, and this estimate is the amount recorded as written premium in the period the risk incepts. Inthe majority of cases, these contracts are adjustable at the end of the contract period to reflect the changes inunderlying risks during the contract period. Subsequent adjustments, based on reports by the clients of actual
57

premium, are recorded in the period in which the cedant reports are received, which would normally be reportedwithin six months to one year subsequent to the expiration of the contract. For pro rata reinsurance contracts, anestimate of written premium is recorded in the period in which the risk incepts. The written premiums estimate isbased on the pro rata cession percentage, on information provided by ceding companies and on management’sjudgment. Management critically evaluates the information provided by ceding companies based on experiencewith the cedant, broker and the underlying book of business.
Throughout the term of the policy, periodic review of the estimated premium takes place based on the latestinformation available, which may include actual reported premium to date, the latest premium estimates asprovided by cedants and brokers, historical experience, management’s professional judgment, information obtainedduring the underwriting renewal process, as well as an assessment of relevant economic conditions. If necessary,subsequent adjustments are recorded at the time of review.
Reporting of actual premiums ceded by the ceding company may be on a one to three month lag and may leadto revised estimates significantly different from the original figure.
On a quarterly basis, the Company evaluates the appropriateness of these premium estimates based on thelatest information available, which may include actual reported premium to date, the latest premium estimates asprovided by cedants and brokers, historical experience, management’s professional judgment, information obtainedduring the underwriting renewal process, as well as an assessment of relevant economic conditions. As theCompany’s reinsurance lines have a short operating history, we have limited past history that reflects how ourpremium estimates will develop. Furthermore, past experience may not be indicative of how future premiumestimates develop. The Company believes that reasonably likely changes in assumptions made in the estimationprocess would not have a significant impact on gross premiums written as recorded.
Where contract terms on excess of loss contracts require the mandatory reinstatement of coverage after aclient’s loss, the mandatory reinstatement premiums are recorded as written and earned premiums when the lossevent occurs.
Management includes an assessment of the creditworthiness of cedants in the review process above, primarilybased on market knowledge, reports from rating agencies, the timeliness of cedants’ payments and the status ofcurrent balances owing. Based on this assessment, management believes that as at December 31, 2010 no provisionfor doubtful accounts is necessary for receivables from cedants.
Reinsurance Premiums Ceded and Reinsurance Recoverables. As discussed in Item 1 “Business — RiskManagement,” the Company primarily uses ceded reinsurance for risk mitigation purposes. Talbot purchasesreinsurance on an excess of loss and a proportional basis together with a relatively small amount of facultativereinsurance and ILWs. Validus Re purchases reinsurance on an excess of loss and a proportional basis together withILW coverage.
For excess of loss business, the amount of premium payable is usually contractually documented at inceptionand management judgment is only necessary in respect of any loss-related elements of the premium, for examplereinstatement or adjustment premiums, and loss-related commissions. The full premium is recorded at inceptionand if the contract is purchased on a “losses occurring during” basis, the premium is earned on a straight line basisover the life of the contract. If the policy is purchased on a “risks attaching during” basis, the premium is earned inline with the inwards gross premiums to which the risk attaching relates. After the contract has expired, a No ClaimsBonus may be received for certain policies, and this is recorded as a reinsurance premium adjustment in the periodin which it can be reasonably determined.
Reinsurance receivable and reinsurance recoverable balances include amounts owed to us in respect of paidand unpaid ceded losses and loss expenses, respectively. The balances are presented net of a reserve for non-recoverability. As at December 31, 2010, reinsurance recoverable balances were $283.1 million and paid lossesrecoverable balances were $28.0 million. In establishing our reinsurance recoverable balances, significant judg-ment is exercised by management in determining the amount of unpaid losses and loss expenses to be ceded as wellas our ability to cede losses and loss expenses under our reinsurance contracts.
58
Our ceded unpaid losses and loss expense consists of two elements, those for reported losses and those forlosses incurred but not reported (“IBNR”). Ceded amounts for IBNR are developed as part of our loss reservingprocess. Consequently, the estimation of ceded unpaid losses and loss expenses is subject to similar risks anduncertainties in the estimation of gross IBNR (see “Reserve for Losses and Loss Expenses”). As at December 31,2010, ceded IBNR recoverable balances were $146.5 million.
Although our reinsurance receivable and reinsurance recoverable balances are derived from our determinationof contractual provisions, the recoverability of such amounts may ultimately differ due to the potential for areinsurer to become financially impaired or insolvent or for a contractual dispute over contract language orcoverage. Consequently, we review our reinsurance recoverable balances on a regular basis to determine if there is aneed to establish a provision for non-recoverability. In performing this review, we use judgment in assessing thecredit worthiness of our reinsurers and the contractual provisions of our reinsurance agreements. As at December 31,2010, we had a provision for non-recoverability of $5.7 million. In the event that the credit worthiness of ourreinsurers were to deteriorate, actual uncollectible amounts could be significantly greater than our provision fornon-recoverability.
The Company uses a default analysis to estimate uncollectible reinsurance. The primary components of thedefault analysis are reinsurance recoverable balances by reinsurer and default factors used to determine the portionof a reinsurer’s balance deemed to be uncollectible. Default factors require considerable judgment and aredetermined using the current rating, or rating equivalent, of each reinsurer as well as other key considerationsand assumptions.
At December 31, 2010, the use of different assumptions within the model could have an effect on the provisionfor uncollectible reinsurance reflected in the Company’s consolidated financial statements. To the extent thecreditworthiness of the Company’s reinsurers was to deteriorate due to an adverse event affecting the reinsuranceindustry, such as a large number of major catastrophes, actual uncollectible amounts could be significantly greaterthan the Company’s provision.
Investment Valuation. Consistent with U.S. GAAP, the Company recognizes fixed maturity and short-terminvestments at their fair value in the consolidated balance sheets. Fair value is defined as the price that would bereceived to sell an asset or paid to transfer a liability in an orderly transaction between market participants at themeasurement date. U.S. GAAP also established a three level valuation hierarchy for disclosure of fair valuemeasurements. The valuation hierarchy is based upon whether the inputs to the valuation of an asset or liability areobservable or unobservable in the market at the measurement date, with quoted market prices being the highest level(“Level 1”) and unobservable inputs being the lowest level (“Level 3”). Generally, the degree of judgment used inmeasuring the fair value of financial instruments inversely correlates with the availability of observable inputs. Allof the Company’s fixed maturity and short-term investment fair value measurements have either quoted marketprices or other observable inputs.
The Company’s external investment accounting service provider receives prices from independent pricingsources to measure the fair values of its fixed maturity investments. These independent pricing sources areprioritized with respect to reliability to ensure that only the highest priority pricing inputs are used. The independentpricing sources are received via automated feeds from indices, pricing and broker-dealers services. Pricing is alsoobtained from other external investment managers. This information is applied consistently across all portfolios.The Company’s external investment accounting service provider confirms and documents all prices received frombroker-dealers on a daily basis for quality control and audit purposes.
In addition to internal controls, management relies on the effectiveness of the valuation controls in place at theCompany’s external investment accounting service provider (supported by a SAS 70 Type II Report) in conjunctionwith regular discussion and analysis of the investment portfolio’s structure and performance. To date, managementhas not noted any issues or discrepancies related to investment valuation. The Company’s investment custodianperforms independent monthly valuations of the investment portfolio using available market prices. Managementobtains this information from the Company’s investment custodian’s internet-based reporting system and comparesit to valuations received from the Company’s external investment accounting service provider.
59

Other investments consist of an investment in a fund of hedge funds and a deferred compensation trust. Thefund investment manager provides monthly reported net asset values (“NAV”) with a one-month delay in itsvaluation. As a result, the fund investment manager’s November 30, 2010 NAV was used as a partial basis for fairvalue measurement in the Company’s December 31, 2010 balance sheet. The fund investment manager’s NAV relieson an estimate of the performance of the fund based on the month end positions from the underlying third-partyfunds. The Company utilizes the fund investment manager’s primarily market approach estimated NAV thatincorporates relevant valuation sources on a timelier basis. As this valuation technique incorporates both observableand significant unobservable inputs, the fund of hedge funds is classified as a Level 3 asset. To determine thereasonableness of the estimated NAV, the Company assesses the variance between the estimated NAV and the one-month delayed fund investment manager’s NAV. These variances are recorded in the following reporting period.During the fourth quarter of 2009, a majority of the fund of hedge funds was redeemed. The remaining portion is aside pocket of $12.9 million at December 31, 2010. While a redemption request has been submitted, the timing ofreceipt of proceeds on the side pocket is indeterminable
Refer to Item 7A. “Quantitative and Qualitative Disclosures About Market Risk” for further discussion ofinterest rate risk and a sensitivity analysis of the impact of interest rate variances on the valuation of the Company’sfixed maturity and short-term investments.
Segment Reporting
Management has determined that the Company operates in two reportable segments. The two segments are itssignificant operating subsidiaries, Validus Re and Talbot. For segmental reporting purposes, the results of IPC’soperations since the acquisition date have been included within the Validus Re segment in the consolidated financialstatements.
Results of Operations
The Company commenced operations on December 16, 2005. On September 4, 2009, the Company acquiredall of the outstanding shares of IPC. The Company’s fiscal year ends on December 31. Financial statements areprepared in accordance with U.S. GAAP and relevant SEC guidance.
60

The following table presents results of operations for the three and twelve months ended December 31, 2010and 2009:
2010 2009 2010 2009(a)Pro Forma
2009(c) 2008
Three Months EndedDecember 31, Year Ended December 31,
(Dollars in thousands)
Gross premiums written . . . . . . . . . . . . . $258,731 $255,289 $1,990,566 $1,621,241 2,008,578 $1,362,484Reinsurance premiums ceded . . . . . . . . . (35,376) (30,393) (229,482) (232,883) (239,412) (124,160)
Net premiums written . . . . . . . . . . . . . . 223,355 224,896 1,761,084 1,388,358 1,769,166 1,238,324Change in unearned premiums . . . . . . . . 209,456 203,005 39 61,219 (57,338) 18,194
Net premiums earned . . . . . . . . . . . . . . 432,811 427,901 1,761,123 1,449,577 1,711,828 1,256,518Losses and loss expenses . . . . . . . . . . . . 155,225 133,020 987,586 523,757 556,550 772,154Policy acquisition costs . . . . . . . . . . . . . 75,523 72,843 292,899 262,966 289,600 234,951General and administrative expenses . . . . 54,511 60,253 209,290 185,568 209,510 123,948Share compensation expenses . . . . . . . . . 7,871 8,189 28,911 27,037 33,751 27,097
Total underwriting deductions . . . . . . . . 293,130 274,305 1,518,686 999,328 1,089,411 1,158,150Underwriting income(b) . . . . . . . . . . . . . 139,681 153,596 242,437 450,249 622,417 98,368Net investment income . . . . . . . . . . . . . 30,962 35,506 134,103 118,773 163,944 139,528Other income . . . . . . . . . . . . . . . . . . . . 552 1,759 5,219 4,634 4,603 5,264Finance expenses . . . . . . . . . . . . . . . . . (13,786) (14,398) (55,870) (44,130) (44,513) (57,318)
Operating income before taxes(b) . . . . . . 157,409 176,463 325,889 529,526 746,451 185,842Tax (expense) benefit . . . . . . . . . . . . . . (1,058) 458 (3,126) 3,759 3,759 (10,788)
Net operating income(b) . . . . . . . . . . . . 156,351 176,921 322,763 533,285 750,210 175,054Gain on bargain purchase, net of
expenses . . . . . . . . . . . . . . . . . . . . . . — — — 287,099 — —Realized gain on repurchase of
debentures. . . . . . . . . . . . . . . . . . . . . — 4,444 — 4,444 4,444 8,752Net realized (losses) gains on
investments . . . . . . . . . . . . . . . . . . . . (14,399) 9,099 32,498 (11,543) (4,717) (1,591)Net unrealized (losses) gains on
investments . . . . . . . . . . . . . . . . . . . . (42,689) (25,043) 45,952 84,796 189,789 (79,707)Foreign exchange gains (losses) . . . . . . . 3,424 338 1,351 (674) 4,294 (49,397)
Net income . . . . . . . . . . . . . . . . . . . . . . $102,687 $165,759 $ 402,564 $ 897,407 944,020 $ 53,111
Selected ratios:Net premiums written / Gross premiums
written . . . . . . . . . . . . . . . . . . . . . . . 86.3% 88.1% 88.5% 85.6% 88.1% 90.9%Losses and loss expenses . . . . . . . . . . . . 35.9% 31.1% 56.1% 36.1% 32.5% 61.5%Policy acquisition costs . . . . . . . . . . . . . 17.4% 17.0% 16.6% 18.1% 16.9% 18.7%General and administrative expenses(d) . . 14.4% 16.0% 13.5% 14.7% 14.2% 12.0%
Expense ratio . . . . . . . . . . . . . . . . . . . . 31.8% 33.0% 30.1% 32.8% 31.1% 30.7%
Combined ratio . . . . . . . . . . . . . . . . . . . 67.7% 64.1% 86.2% 68.9% 63.6% 92.2%
(a) The results of operations for IPC are consolidated only from the September 2009 date of acquisition.
(b) Non-GAAP Financial Measures. In presenting the Company’s results, management has included and discussedunderwriting income and operating income that are not calculated under standards or rules that comprise U.S.GAAP. Such measures are referred to as non-GAAP. Non-GAAP measures may be defined or calculateddifferently by other companies. These measures should not be viewed as a substitute for those determined inaccordance with U.S. GAAP. Reconciliations of these measures to the most comparable U.S. GAAP financialmeasure, are presented in the section below entitled “Underwriting Income.”
(c) Pro Forma combined Validus Holdings, Ltd. and IPC Holdings Ltd. income statement for the year endedDecember 31, 2009.
(d) The general and administrative ratio includes share compensation expenses.
61
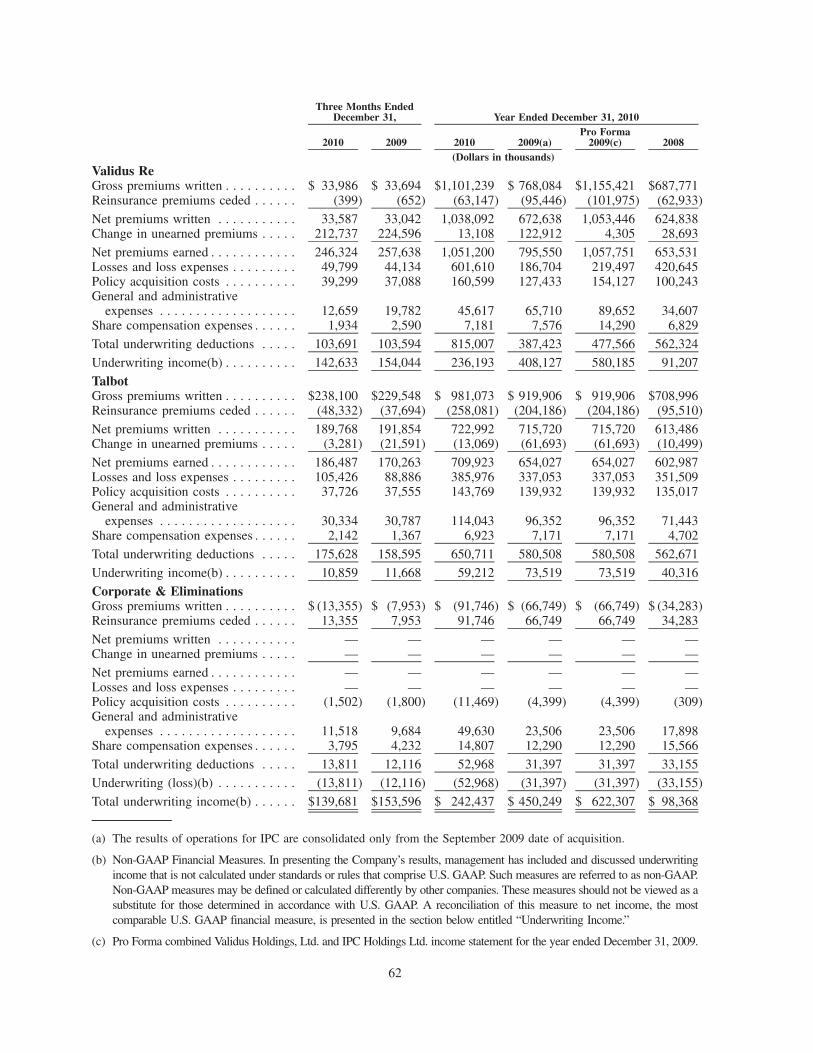
2010 2009 2010 2009(a)Pro Forma
2009(c) 2008
Three Months EndedDecember 31, Year Ended December 31, 2010
(Dollars in thousands)Validus ReGross premiums written . . . . . . . . . . $ 33,986 $ 33,694 $1,101,239 $ 768,084 $1,155,421 $687,771Reinsurance premiums ceded . . . . . . (399) (652) (63,147) (95,446) (101,975) (62,933)
Net premiums written . . . . . . . . . . . 33,587 33,042 1,038,092 672,638 1,053,446 624,838Change in unearned premiums . . . . . 212,737 224,596 13,108 122,912 4,305 28,693
Net premiums earned . . . . . . . . . . . . 246,324 257,638 1,051,200 795,550 1,057,751 653,531Losses and loss expenses . . . . . . . . . 49,799 44,134 601,610 186,704 219,497 420,645Policy acquisition costs . . . . . . . . . . 39,299 37,088 160,599 127,433 154,127 100,243General and administrative
expenses . . . . . . . . . . . . . . . . . . . 12,659 19,782 45,617 65,710 89,652 34,607Share compensation expenses . . . . . . 1,934 2,590 7,181 7,576 14,290 6,829
Total underwriting deductions . . . . . 103,691 103,594 815,007 387,423 477,566 562,324
Underwriting income(b) . . . . . . . . . . 142,633 154,044 236,193 408,127 580,185 91,207
TalbotGross premiums written . . . . . . . . . . $238,100 $229,548 $ 981,073 $ 919,906 $ 919,906 $708,996Reinsurance premiums ceded . . . . . . (48,332) (37,694) (258,081) (204,186) (204,186) (95,510)
Net premiums written . . . . . . . . . . . 189,768 191,854 722,992 715,720 715,720 613,486Change in unearned premiums . . . . . (3,281) (21,591) (13,069) (61,693) (61,693) (10,499)
Net premiums earned . . . . . . . . . . . . 186,487 170,263 709,923 654,027 654,027 602,987Losses and loss expenses . . . . . . . . . 105,426 88,886 385,976 337,053 337,053 351,509Policy acquisition costs . . . . . . . . . . 37,726 37,555 143,769 139,932 139,932 135,017General and administrative
expenses . . . . . . . . . . . . . . . . . . . 30,334 30,787 114,043 96,352 96,352 71,443Share compensation expenses . . . . . . 2,142 1,367 6,923 7,171 7,171 4,702
Total underwriting deductions . . . . . 175,628 158,595 650,711 580,508 580,508 562,671
Underwriting income(b) . . . . . . . . . . 10,859 11,668 59,212 73,519 73,519 40,316
Corporate & EliminationsGross premiums written . . . . . . . . . . $ (13,355) $ (7,953) $ (91,746) $ (66,749) $ (66,749) $ (34,283)Reinsurance premiums ceded . . . . . . 13,355 7,953 91,746 66,749 66,749 34,283
Net premiums written . . . . . . . . . . . — — — — — —Change in unearned premiums . . . . . — — — — — —
Net premiums earned . . . . . . . . . . . . — — — — — —Losses and loss expenses . . . . . . . . . — — — — — —Policy acquisition costs . . . . . . . . . . (1,502) (1,800) (11,469) (4,399) (4,399) (309)General and administrative
expenses . . . . . . . . . . . . . . . . . . . 11,518 9,684 49,630 23,506 23,506 17,898Share compensation expenses . . . . . . 3,795 4,232 14,807 12,290 12,290 15,566
Total underwriting deductions . . . . . 13,811 12,116 52,968 31,397 31,397 33,155
Underwriting (loss)(b) . . . . . . . . . . . (13,811) (12,116) (52,968) (31,397) (31,397) (33,155)
Total underwriting income(b) . . . . . . $139,681 $153,596 $ 242,437 $ 450,249 $ 622,307 $ 98,368
(a) The results of operations for IPC are consolidated only from the September 2009 date of acquisition.
(b) Non-GAAP Financial Measures. In presenting the Company’s results, management has included and discussed underwritingincome that is not calculated under standards or rules that comprise U.S. GAAP. Such measures are referred to as non-GAAP.Non-GAAP measures may be defined or calculated differently by other companies. These measures should not be viewed as asubstitute for those determined in accordance with U.S. GAAP. A reconciliation of this measure to net income, the mostcomparable U.S. GAAP financial measure, is presented in the section below entitled “Underwriting Income.”
(c) Pro Forma combined Validus Holdings, Ltd. and IPC Holdings Ltd. income statement for the year ended December 31, 2009.
62

Three Months Ended December 31, 2010 compared to Three Months Ended December 31, 2009
Net income for the three months ended December 31, 2010 was $102.7 million compared to net income of$165.8 million for the three months ended December 31, 2009, a decrease of $63.1 million or 38.1%. The primaryfactors driving the decrease in net income were:
• Increase in net realized and unrealized losses on investments of $23.5 million and $17.6 million,respectively;
• Decrease in underwriting income of $13.9 million due primarily to a $22.2 million increase in losses and lossexpenses, partially offset by an increase in net premiums earned of $4.9 million and a $6.1 million decreasein general and administrative expenses and share compensation expenses; and
• Decrease in net investment income of $4.5 million.
The above items were partially offset by the following factor:
• A favorable movement in foreign exchange of $3.1 million.
The change in net income for the three months ended December 31, 2010 of $63.1 million as compared to thethree months ended December 31, 2009 is described in the following table:
Validus Re TalbotCorporate andEliminations Total(a)
Three Months Ended December 31, 2010Increase (Decrease) Over the Three Months Ended
December 31, 2009
(Dollars in thousands)
Notable losses — net loss and loss expenses(a) . . . . . . . . . $(22,572) $(23,469) $ — $(46,041)
Notable losses — net reinstatement premiums(a) . . . . . . . . 1,901 (3,813) — (1,912)
Other underwriting income (loss) . . . . . . . . . . . . . . . . . . . 9,260 26,473 (1,695) 34,038
Underwriting income (loss)(b) . . . . . . . . . . . . . . . . . . . . . (11,411) (809) (1,695) (13,915)
Net investment income . . . . . . . . . . . . . . . . . . . . . . . . . . . (3,858) (196) (490) (4,544)
Other income . . . . . . . . . . . . . . . . . . . . . . . . . . . . . . . . . . (1,350) 1,667 (1,524) (1,207)
Finance expenses . . . . . . . . . . . . . . . . . . . . . . . . . . . . . . . (1,025) 7,037 (5,400) 612
(17,644) 7,699 (9,109) (19,054)
Taxes. . . . . . . . . . . . . . . . . . . . . . . . . . . . . . . . . . . . . . . . 66 (1,489) (93) (1,516)
(17,578) 6,210 (9,202) (20,570)
Realized gain on repurchase of debentures . . . . . . . . . . . . — — (4,444) (4,444)
Net realized gains on investments . . . . . . . . . . . . . . . . . . . (25,656) 2,158 — (23,498)
Net unrealized (losses) on investments . . . . . . . . . . . . . . . (7,637) (10,009) — (17,646)
Net foreign exchange gains . . . . . . . . . . . . . . . . . . . . . . . 2,667 235 184 3,086
Net income (loss) . . . . . . . . . . . . . . . . . . . . . . . . . . . . . . $(48,204) $ (1,406) $(13,462) $(63,072)
(a) Notable losses for the three months ended December 31, 2010 include: the Queensland floods, a politicalviolence loss, satellite failure and financial institutions loss. Excludes the reserve for potential development on2010 notable loss events.
(b) Non-GAAP Financial Measures. In presenting the Company’s results, management has included and discussedunderwriting income (loss) that is not calculated under standards or rules that comprise U.S. GAAP. Such
63

measures are referred to as non-GAAP. Non-GAAP measures may be defined or calculated differently by othercompanies. These measures should not be viewed as a substitute for those determined in accordance with U.S.GAAP. A reconciliation of this measure to net income, the most comparable U.S. GAAP financial measure, ispresented in the section below entitled “Underwriting Income.”
Gross Premiums Written
Gross premiums written for the three months ended December 31, 2010 were $258.7 million compared to$255.3 million for the three months ended December 31, 2009, an increase of $3.4 million or 1.3%. The marinelines increased by $10.9 million, while the property and specialty lines decreased by $2.2 million and $5.3 million,respectively. Details of gross premiums written by line of business are provided below.
Gross PremiumsWritten
Gross PremiumsWritten (%)
Gross PremiumsWritten
Gross PremiumsWritten (%) % Change
Three Months EndedDecember 31, 2010
Three Months EndedDecember 31, 2009
(Dollars in thousands)
Property . . . . . . . . . . . . . . . $ 63,253 24.4% $ 65,453 25.6% (3.4)%
Marine . . . . . . . . . . . . . . . . 71,555 27.7% 60,659 23.8% 18.0%Specialty . . . . . . . . . . . . . . . 123,923 47.9% 129,177 50.6% (4.1)%
Total . . . . . . . . . . . . . . . . . . $258,731 100.0% $255,289 100.0% 1.3%
Validus Re. Validus Re gross premiums written for the three months ended December 31, 2010 were$34.0 million compared to $33.7 million for the three months ended December 31, 2009, an increase of $0.3 millionor 0.9%. Details of Validus Re gross premiums written by line of business are provided below.
Gross PremiumsWritten
Gross PremiumsWritten (%)
Gross PremiumsWritten
Gross PremiumsWritten (%) % Change
Three Months EndedDecember 31, 2010
Three Months EndedDecember 31, 2009
(Dollars in thousands)
Property . . . . . . . . . . . . . . . $17,301 50.9% $21,204 62.9% (18.4)%
Marine . . . . . . . . . . . . . . . . 4,244 12.5% (1,060) (3.1)% 500.4%
Specialty . . . . . . . . . . . . . . . 12,441 36.6% 13,550 40.2% (8.2)%
Total . . . . . . . . . . . . . . . . . . $33,986 100.0% $33,694 100.0% 0.9%
During the three months ended December 31, 2010, Validus Re increased lines on renewing business resultingin additional gross premiums written of $10.7 million offset by a $13.9 million reduction in premium from newbusiness.
The decrease in gross premiums written in the property lines of $3.9 million was primarily due to a$7.9 million decrease in new business, a $5.0 million decrease in premium adjustments in the Singapore branch,partially offset by a $3.6 million increase in renewing business. The increase in gross premiums written of$5.3 million in the marine lines was primarily due to a $3.0 million increase in premium adjustments and a$1.8 million increase in reinstatement premiums.
Gross premiums written under the quota share, surplus treaty and excess of loss contracts between Validus Reand Talbot increased by $5.4 million compared to the three months ended December 31, 2009. These reinsuranceagreements with Talbot are eliminated upon consolidation.
Talbot. Talbot gross premiums written for the three months ended December 31, 2010 were $238.1 millioncompared to $229.5 million for the three months ended December 31, 2009, an increase of $8.6 million or 3.7%. The$238.1 million of gross premiums written translated at 2009 rates of exchange would have been $235.7 million during thethree months ended December 31, 2010. Details of Talbot gross premiums written by line of business are provided below.
64
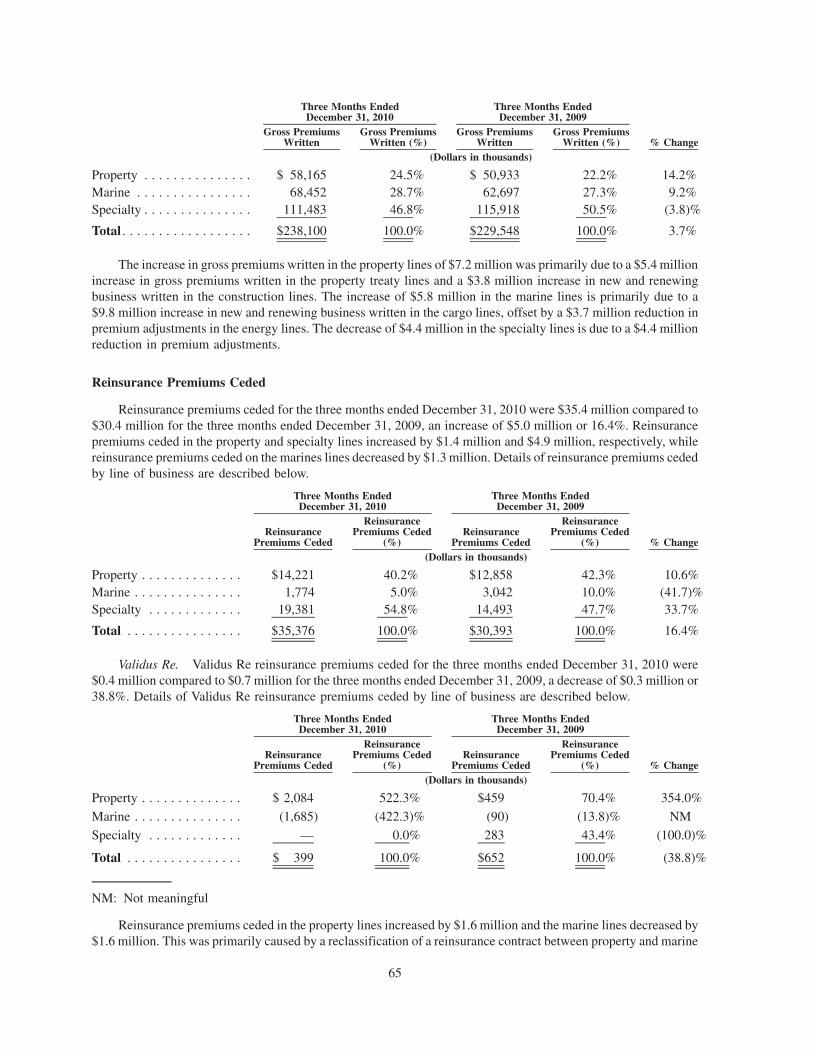
Gross PremiumsWritten
Gross PremiumsWritten (%)
Gross PremiumsWritten
Gross PremiumsWritten (%) % Change
Three Months EndedDecember 31, 2010
Three Months EndedDecember 31, 2009
(Dollars in thousands)
Property . . . . . . . . . . . . . . . $ 58,165 24.5% $ 50,933 22.2% 14.2%Marine . . . . . . . . . . . . . . . . 68,452 28.7% 62,697 27.3% 9.2%Specialty . . . . . . . . . . . . . . . 111,483 46.8% 115,918 50.5% (3.8)%
Total . . . . . . . . . . . . . . . . . . $238,100 100.0% $229,548 100.0% 3.7%
The increase in gross premiums written in the property lines of $7.2 million was primarily due to a $5.4 millionincrease in gross premiums written in the property treaty lines and a $3.8 million increase in new and renewingbusiness written in the construction lines. The increase of $5.8 million in the marine lines is primarily due to a$9.8 million increase in new and renewing business written in the cargo lines, offset by a $3.7 million reduction inpremium adjustments in the energy lines. The decrease of $4.4 million in the specialty lines is due to a $4.4 millionreduction in premium adjustments.
Reinsurance Premiums Ceded
Reinsurance premiums ceded for the three months ended December 31, 2010 were $35.4 million compared to$30.4 million for the three months ended December 31, 2009, an increase of $5.0 million or 16.4%. Reinsurancepremiums ceded in the property and specialty lines increased by $1.4 million and $4.9 million, respectively, whilereinsurance premiums ceded on the marines lines decreased by $1.3 million. Details of reinsurance premiums cededby line of business are described below.
ReinsurancePremiums Ceded
ReinsurancePremiums Ceded
(%)Reinsurance
Premiums Ceded
ReinsurancePremiums Ceded
(%) % Change
Three Months EndedDecember 31, 2010
Three Months EndedDecember 31, 2009
(Dollars in thousands)
Property . . . . . . . . . . . . . . $14,221 40.2% $12,858 42.3% 10.6%Marine . . . . . . . . . . . . . . . 1,774 5.0% 3,042 10.0% (41.7)%Specialty . . . . . . . . . . . . . 19,381 54.8% 14,493 47.7% 33.7%
Total . . . . . . . . . . . . . . . . $35,376 100.0% $30,393 100.0% 16.4%
Validus Re. Validus Re reinsurance premiums ceded for the three months ended December 31, 2010 were$0.4 million compared to $0.7 million for the three months ended December 31, 2009, a decrease of $0.3 million or38.8%. Details of Validus Re reinsurance premiums ceded by line of business are described below.
ReinsurancePremiums Ceded
ReinsurancePremiums Ceded
(%)Reinsurance
Premiums Ceded
ReinsurancePremiums Ceded
(%) % Change
Three Months EndedDecember 31, 2010
Three Months EndedDecember 31, 2009
(Dollars in thousands)
Property . . . . . . . . . . . . . . $ 2,084 522.3% $459 70.4% 354.0%
Marine . . . . . . . . . . . . . . . (1,685) (422.3)% (90) (13.8)% NM
Specialty . . . . . . . . . . . . . — 0.0% 283 43.4% (100.0)%
Total . . . . . . . . . . . . . . . . $ 399 100.0% $652 100.0% (38.8)%
NM: Not meaningful
Reinsurance premiums ceded in the property lines increased by $1.6 million and the marine lines decreased by$1.6 million. This was primarily caused by a reclassification of a reinsurance contract between property and marine
65
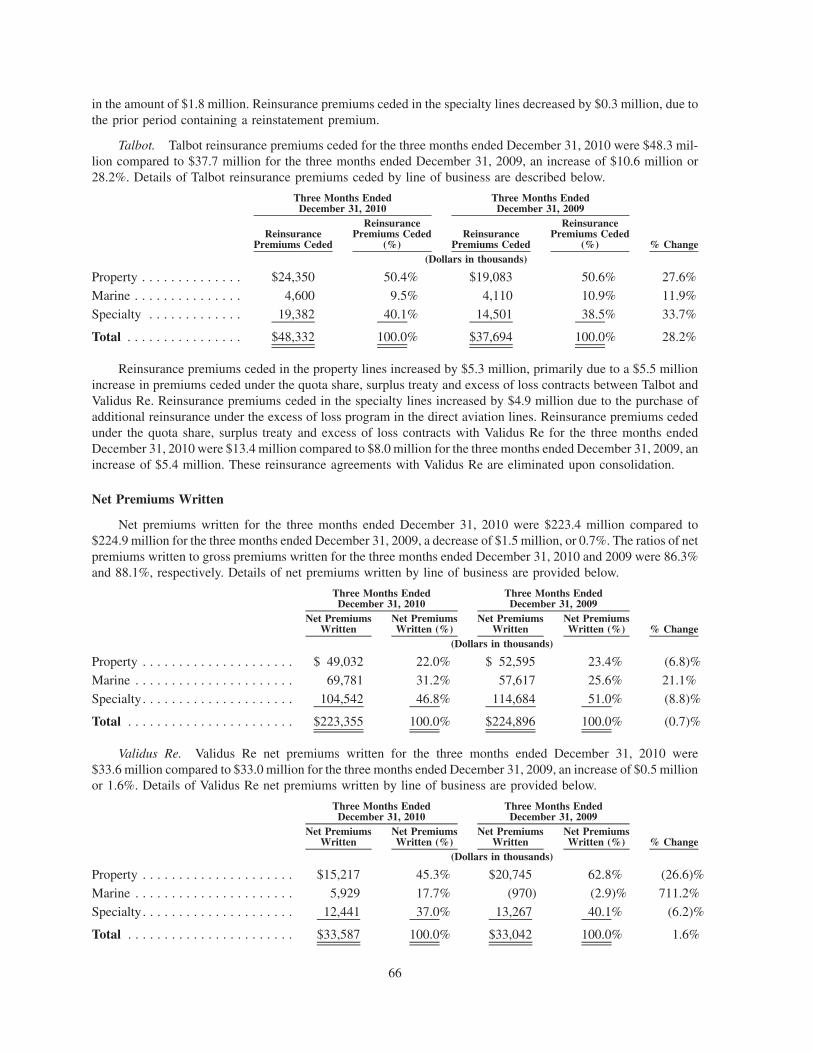
in the amount of $1.8 million. Reinsurance premiums ceded in the specialty lines decreased by $0.3 million, due tothe prior period containing a reinstatement premium.
Talbot. Talbot reinsurance premiums ceded for the three months ended December 31, 2010 were $48.3 mil-lion compared to $37.7 million for the three months ended December 31, 2009, an increase of $10.6 million or28.2%. Details of Talbot reinsurance premiums ceded by line of business are described below.
ReinsurancePremiums Ceded
ReinsurancePremiums Ceded
(%)Reinsurance
Premiums Ceded
ReinsurancePremiums Ceded
(%) % Change
Three Months EndedDecember 31, 2010
Three Months EndedDecember 31, 2009
(Dollars in thousands)
Property . . . . . . . . . . . . . . $24,350 50.4% $19,083 50.6% 27.6%
Marine . . . . . . . . . . . . . . . 4,600 9.5% 4,110 10.9% 11.9%
Specialty . . . . . . . . . . . . . 19,382 40.1% 14,501 38.5% 33.7%
Total . . . . . . . . . . . . . . . . $48,332 100.0% $37,694 100.0% 28.2%
Reinsurance premiums ceded in the property lines increased by $5.3 million, primarily due to a $5.5 millionincrease in premiums ceded under the quota share, surplus treaty and excess of loss contracts between Talbot andValidus Re. Reinsurance premiums ceded in the specialty lines increased by $4.9 million due to the purchase ofadditional reinsurance under the excess of loss program in the direct aviation lines. Reinsurance premiums cededunder the quota share, surplus treaty and excess of loss contracts with Validus Re for the three months endedDecember 31, 2010 were $13.4 million compared to $8.0 million for the three months ended December 31, 2009, anincrease of $5.4 million. These reinsurance agreements with Validus Re are eliminated upon consolidation.
Net Premiums Written
Net premiums written for the three months ended December 31, 2010 were $223.4 million compared to$224.9 million for the three months ended December 31, 2009, a decrease of $1.5 million, or 0.7%. The ratios of netpremiums written to gross premiums written for the three months ended December 31, 2010 and 2009 were 86.3%and 88.1%, respectively. Details of net premiums written by line of business are provided below.
Net PremiumsWritten
Net PremiumsWritten (%)
Net PremiumsWritten
Net PremiumsWritten (%) % Change
Three Months EndedDecember 31, 2010
Three Months EndedDecember 31, 2009
(Dollars in thousands)
Property . . . . . . . . . . . . . . . . . . . . . $ 49,032 22.0% $ 52,595 23.4% (6.8)%
Marine . . . . . . . . . . . . . . . . . . . . . . 69,781 31.2% 57,617 25.6% 21.1%
Specialty . . . . . . . . . . . . . . . . . . . . . 104,542 46.8% 114,684 51.0% (8.8)%
Total . . . . . . . . . . . . . . . . . . . . . . . $223,355 100.0% $224,896 100.0% (0.7)%
Validus Re. Validus Re net premiums written for the three months ended December 31, 2010 were$33.6 million compared to $33.0 million for the three months ended December 31, 2009, an increase of $0.5 millionor 1.6%. Details of Validus Re net premiums written by line of business are provided below.
Net PremiumsWritten
Net PremiumsWritten (%)
Net PremiumsWritten
Net PremiumsWritten (%) % Change
Three Months EndedDecember 31, 2010
Three Months EndedDecember 31, 2009
(Dollars in thousands)
Property . . . . . . . . . . . . . . . . . . . . . $15,217 45.3% $20,745 62.8% (26.6)%
Marine . . . . . . . . . . . . . . . . . . . . . . 5,929 17.7% (970) (2.9)% 711.2%
Specialty . . . . . . . . . . . . . . . . . . . . . 12,441 37.0% 13,267 40.1% (6.2)%
Total . . . . . . . . . . . . . . . . . . . . . . . $33,587 100.0% $33,042 100.0% 1.6%
66

The increase in Validus Re net premiums written was driven by the factors highlighted above in respect ofgross premiums written and reinsurance premiums ceded. The ratios of net premiums written to gross premiumswritten were 98.8% and 98.1% for the three months ended December 31, 2010 and 2009, respectively.
Talbot. Talbot net premiums written for the three months ended December 31, 2010 were $189.8 millioncompared to $191.9 million for the three months ended December 31, 2009, a decrease of $2.1 million or 1.1%.Details of Talbot net premiums written by line of business are provided below.
Net PremiumsWritten
Net PremiumsWritten (%)
Net PremiumsWritten
Net PremiumsWritten (%) % Change
Three Months EndedDecember 31, 2010
Three Months EndedDecember 31, 2009
(Dollars in thousands)
Property . . . . . . . . . . . . . . . . . . . . . $ 33,815 17.9% $ 31,850 16.6% 6.2%
Marine . . . . . . . . . . . . . . . . . . . . . . 63,852 33.6% 58,587 30.5% 9.0%
Specialty . . . . . . . . . . . . . . . . . . . . . 92,101 48.5% 101,417 52.9% (9.2)%
Total . . . . . . . . . . . . . . . . . . . . . . . $189,768 100.0% $191,854 100.0% (1.1)%
The decrease in net premiums written was driven by the factors highlighted above in respect of gross premiumswritten and reinsurance premiums ceded, in particular the lower net premium resulting from increased cededpremiums during the three months ended December 31, 2010. The ratios of net premiums written to gross premiumswritten for the three months ended December 31, 2010 and 2009 were 79.7% and 83.6%, respectively, reflecting theincreased ceded premiums.
Change in Unearned Premiums
Change in unearned premiums for the three months ended December 31, 2010 was $209.5 million compared to$203.0 million for the three months ended December 31, 2009, an increase of $6.5 million or 3.2%.
Net Change inUnearnedPremiums
Net Change inUnearnedPremiums % Change
Three Months EndedDecember 31, 2010
Three Months EndedDecember 31, 2009
(Dollars in thousands)
Change in gross unearned premium . . . . . . . . $226,720 $238,460 (4.9)%
Change in prepaid reinsurance premium . . . . . (17,264) (35,455) (51.3)%
Net change in unearned premium . . . . . . . . $209,456 $203,005 3.2%
Validus Re. Validus Re’s net change in unearned premiums for the three months ended December 31, 2010were $212.7 million compared to $224.6 million for the three months ended December 31, 2009, a decrease of$11.9 million or 5.3%.
Net Change inUnearnedPremiums
Net Change inUnearnedPremiums % Change
Three Months EndedDecember 31, 2010
Three Months EndedDecember 31, 2009
(Dollars in thousands)
Change in gross unearned premium . . . . . . . . $219,981 $251,205 (12.4)%
Change in prepaid reinsurance premium . . . . . (7,244) (26,609) (72.8)%
Net change in unearned premium . . . . . . . . $212,737 $224,596 (5.3)%
Talbot. The Talbot net change in unearned premiums for the three months ended December 31, 2010 was($3.3) million compared to ($21.6) million for the three months ended December 31, 2009, an increase of$18.3 million, or 84.8%.
67
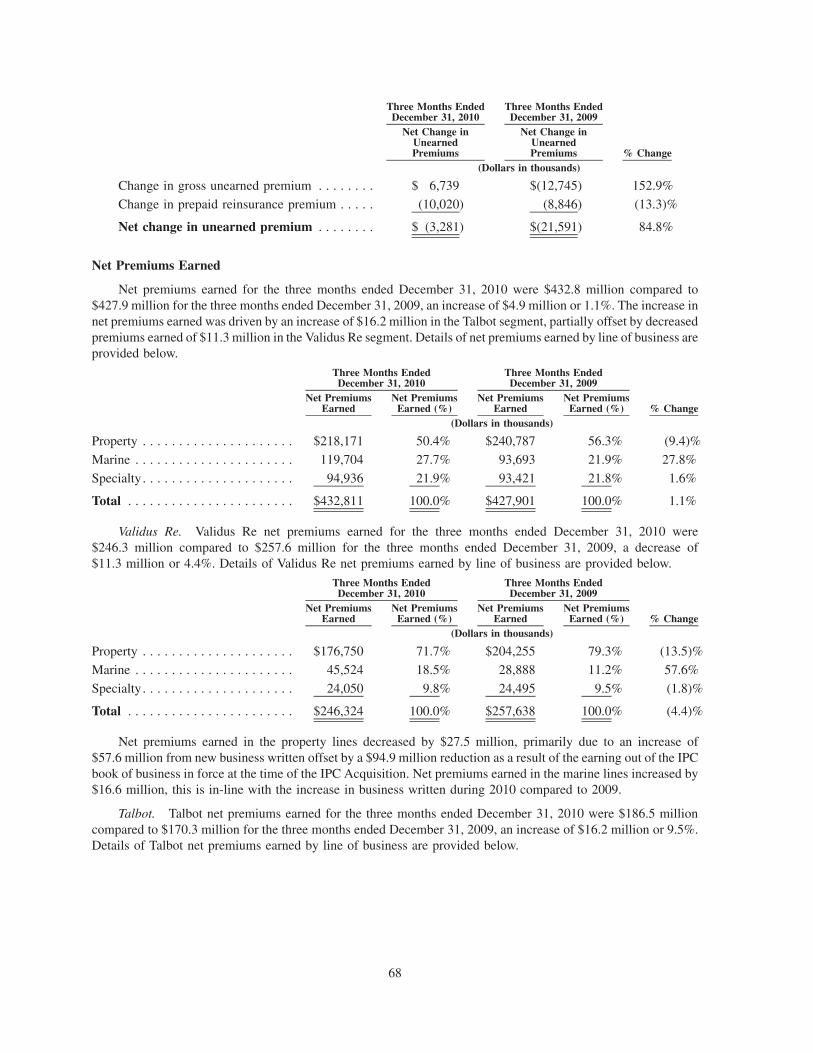
Net Change inUnearnedPremiums
Net Change inUnearnedPremiums % Change
Three Months EndedDecember 31, 2010
Three Months EndedDecember 31, 2009
(Dollars in thousands)
Change in gross unearned premium . . . . . . . . $ 6,739 $(12,745) 152.9%
Change in prepaid reinsurance premium . . . . . (10,020) (8,846) (13.3)%
Net change in unearned premium . . . . . . . . $ (3,281) $(21,591) 84.8%
Net Premiums Earned
Net premiums earned for the three months ended December 31, 2010 were $432.8 million compared to$427.9 million for the three months ended December 31, 2009, an increase of $4.9 million or 1.1%. The increase innet premiums earned was driven by an increase of $16.2 million in the Talbot segment, partially offset by decreasedpremiums earned of $11.3 million in the Validus Re segment. Details of net premiums earned by line of business areprovided below.
Net PremiumsEarned
Net PremiumsEarned (%)
Net PremiumsEarned
Net PremiumsEarned (%) % Change
Three Months EndedDecember 31, 2010
Three Months EndedDecember 31, 2009
(Dollars in thousands)
Property . . . . . . . . . . . . . . . . . . . . . $218,171 50.4% $240,787 56.3% (9.4)%
Marine . . . . . . . . . . . . . . . . . . . . . . 119,704 27.7% 93,693 21.9% 27.8%
Specialty . . . . . . . . . . . . . . . . . . . . . 94,936 21.9% 93,421 21.8% 1.6%
Total . . . . . . . . . . . . . . . . . . . . . . . $432,811 100.0% $427,901 100.0% 1.1%
Validus Re. Validus Re net premiums earned for the three months ended December 31, 2010 were$246.3 million compared to $257.6 million for the three months ended December 31, 2009, a decrease of$11.3 million or 4.4%. Details of Validus Re net premiums earned by line of business are provided below.
Net PremiumsEarned
Net PremiumsEarned (%)
Net PremiumsEarned
Net PremiumsEarned (%) % Change
Three Months EndedDecember 31, 2010
Three Months EndedDecember 31, 2009
(Dollars in thousands)
Property . . . . . . . . . . . . . . . . . . . . . $176,750 71.7% $204,255 79.3% (13.5)%
Marine . . . . . . . . . . . . . . . . . . . . . . 45,524 18.5% 28,888 11.2% 57.6%
Specialty . . . . . . . . . . . . . . . . . . . . . 24,050 9.8% 24,495 9.5% (1.8)%
Total . . . . . . . . . . . . . . . . . . . . . . . $246,324 100.0% $257,638 100.0% (4.4)%
Net premiums earned in the property lines decreased by $27.5 million, primarily due to an increase of$57.6 million from new business written offset by a $94.9 million reduction as a result of the earning out of the IPCbook of business in force at the time of the IPC Acquisition. Net premiums earned in the marine lines increased by$16.6 million, this is in-line with the increase in business written during 2010 compared to 2009.
Talbot. Talbot net premiums earned for the three months ended December 31, 2010 were $186.5 millioncompared to $170.3 million for the three months ended December 31, 2009, an increase of $16.2 million or 9.5%.Details of Talbot net premiums earned by line of business are provided below.
68
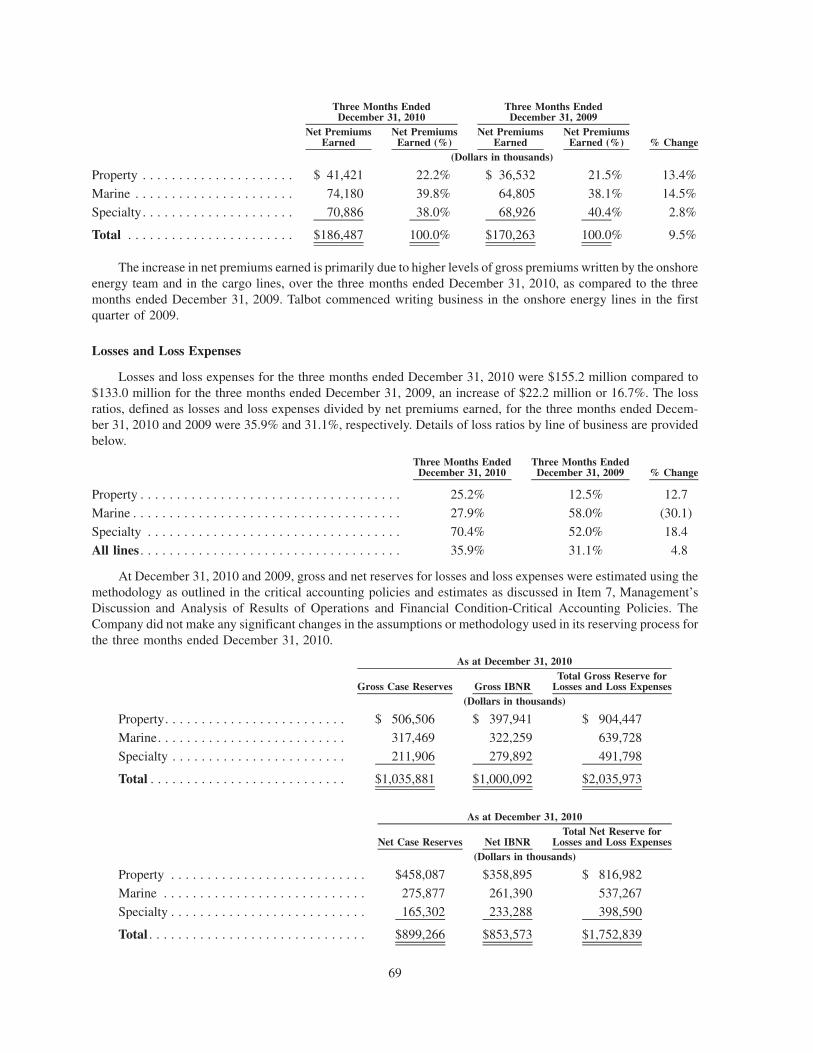
Net PremiumsEarned
Net PremiumsEarned (%)
Net PremiumsEarned
Net PremiumsEarned (%) % Change
Three Months EndedDecember 31, 2010
Three Months EndedDecember 31, 2009
(Dollars in thousands)
Property . . . . . . . . . . . . . . . . . . . . . $ 41,421 22.2% $ 36,532 21.5% 13.4%
Marine . . . . . . . . . . . . . . . . . . . . . . 74,180 39.8% 64,805 38.1% 14.5%
Specialty . . . . . . . . . . . . . . . . . . . . . 70,886 38.0% 68,926 40.4% 2.8%
Total . . . . . . . . . . . . . . . . . . . . . . . $186,487 100.0% $170,263 100.0% 9.5%
The increase in net premiums earned is primarily due to higher levels of gross premiums written by the onshoreenergy team and in the cargo lines, over the three months ended December 31, 2010, as compared to the threemonths ended December 31, 2009. Talbot commenced writing business in the onshore energy lines in the firstquarter of 2009.
Losses and Loss Expenses
Losses and loss expenses for the three months ended December 31, 2010 were $155.2 million compared to$133.0 million for the three months ended December 31, 2009, an increase of $22.2 million or 16.7%. The lossratios, defined as losses and loss expenses divided by net premiums earned, for the three months ended Decem-ber 31, 2010 and 2009 were 35.9% and 31.1%, respectively. Details of loss ratios by line of business are providedbelow.
Three Months EndedDecember 31, 2010
Three Months EndedDecember 31, 2009 % Change
Property . . . . . . . . . . . . . . . . . . . . . . . . . . . . . . . . . . . . 25.2% 12.5% 12.7
Marine . . . . . . . . . . . . . . . . . . . . . . . . . . . . . . . . . . . . . 27.9% 58.0% (30.1)
Specialty . . . . . . . . . . . . . . . . . . . . . . . . . . . . . . . . . . . 70.4% 52.0% 18.4
All lines . . . . . . . . . . . . . . . . . . . . . . . . . . . . . . . . . . . . 35.9% 31.1% 4.8
At December 31, 2010 and 2009, gross and net reserves for losses and loss expenses were estimated using themethodology as outlined in the critical accounting policies and estimates as discussed in Item 7, Management’sDiscussion and Analysis of Results of Operations and Financial Condition-Critical Accounting Policies. TheCompany did not make any significant changes in the assumptions or methodology used in its reserving process forthe three months ended December 31, 2010.
Gross Case Reserves Gross IBNRTotal Gross Reserve for
Losses and Loss Expenses
As at December 31, 2010
(Dollars in thousands)
Property. . . . . . . . . . . . . . . . . . . . . . . . . $ 506,506 $ 397,941 $ 904,447
Marine. . . . . . . . . . . . . . . . . . . . . . . . . . 317,469 322,259 639,728
Specialty . . . . . . . . . . . . . . . . . . . . . . . . 211,906 279,892 491,798
Total . . . . . . . . . . . . . . . . . . . . . . . . . . . $1,035,881 $1,000,092 $2,035,973
Net Case Reserves Net IBNRTotal Net Reserve for
Losses and Loss Expenses
As at December 31, 2010
(Dollars in thousands)
Property . . . . . . . . . . . . . . . . . . . . . . . . . . . $458,087 $358,895 $ 816,982
Marine . . . . . . . . . . . . . . . . . . . . . . . . . . . . 275,877 261,390 537,267
Specialty . . . . . . . . . . . . . . . . . . . . . . . . . . . 165,302 233,288 398,590
Total . . . . . . . . . . . . . . . . . . . . . . . . . . . . . . $899,266 $853,573 $1,752,839
69

The following table sets forth a reconciliation of gross and net reserves for losses and loss expenses by segmentfor the three months ended December 31, 2010:
Validus Re Talbot Eliminations TotalThree Months Ended December 31, 2010
(Dollars in thousands)
Gross reserves at period beginning . . . . . . . . . . . . . . . $1,035,227 $1,153,943 $(168,325) $2,020,845
Losses recoverable . . . . . . . . . . . . . . . . . . . . . . . . . . (81,368) (355,778) 168,325 (268,821)
Net reserves at period beginning . . . . . . . . . . . . . . . . 953,859 798,165 — 1,752,024
Incurred losses- current year . . . . . . . . . . . . . . . . . . . 71,864 113,926 — 185,790
Change in prior accident years . . . . . . . . . . . . . . . . . . (22,065) (8,500) — (30,565)
Incurred losses . . . . . . . . . . . . . . . . . . . . . . . . . . . . . 49,799 105,426 — 155,225
Foreign exchange . . . . . . . . . . . . . . . . . . . . . . . . . . . 2,140 (3,058) — (918)
Paid losses . . . . . . . . . . . . . . . . . . . . . . . . . . . . . . . . (87,852) (65,640) — (153,492)
Net reserves at period end . . . . . . . . . . . . . . . . . . . . . 917,946 834,893 — 1,752,839
Losses recoverable . . . . . . . . . . . . . . . . . . . . . . . . . . 80,219 356,655 (153,740) 283,134
Gross reserves at period end . . . . . . . . . . . . . . . . . . . 998,165 1,191,548 (153,740) 2,035,973
The amount of recorded reserves represents management’s best estimate of expected losses and loss expenseson premiums earned. Favorable loss development on prior years totaled $30.6 million. Of this, $22.1 million relatedto the Validus Re segment and $8.5 million related to the Talbot segment. Favorable loss reserve developmentbenefited the Company’s loss ratio by 7.1 percentage points for the three months ended December 31, 2010. For thethree months ended December 31, 2010, the Company incurred losses of $51.8 million from the notable loss eventsdescribed below, which represented 12.0 percentage points of the loss ratio, excluding reserve for potentialdevelopment on 2010 notable loss events, as described below. Net of $(1.6) million of reinstatement premiums, theeffect of these events on net income was $53.4 million. For the three months ended December 31, 2009, theCompany incurred losses of $5.7 million from the notable loss events described below, which represented1.3 percentage points of the loss ratio. The Company’s loss ratio, excluding prior year development and notableloss events for the three months ended December 31, 2010 and 2009 were 32.3% and 41.2%, respectively.
Management of insurance and reinsurance companies use significant judgment in the estimation of reservesfor losses and loss expenses. Given the magnitude of recent loss events and other uncertainties inherent in lossestimation, meaningful uncertainty remains regarding the estimation of recent notable loss events. The Company’sactual ultimate net loss may vary materially from estimates. Validus Re ultimate losses for notable loss events areestimated through detailed review of contracts which are identified by the Company as potentially exposed to thespecific notable loss event. However, there can be no assurance that the ultimate loss amount estimated for a specificcontract will be accurate, or that all contracts with exposure to a specific notable loss event will be identified in atimely manner. Potential losses in excess of the estimated ultimate loss assigned to a contract on the basis of aspecific review, or loss amounts from contracts not specifically included in the detailed review are reserved for inthe reserve for potential development on notable loss events. During the three months ended December 31, 2010, theCompany reduced the reserve for potential development on 2010 notable loss events by $16.6 million fordevelopment on the New Zealand Earthquake.
70
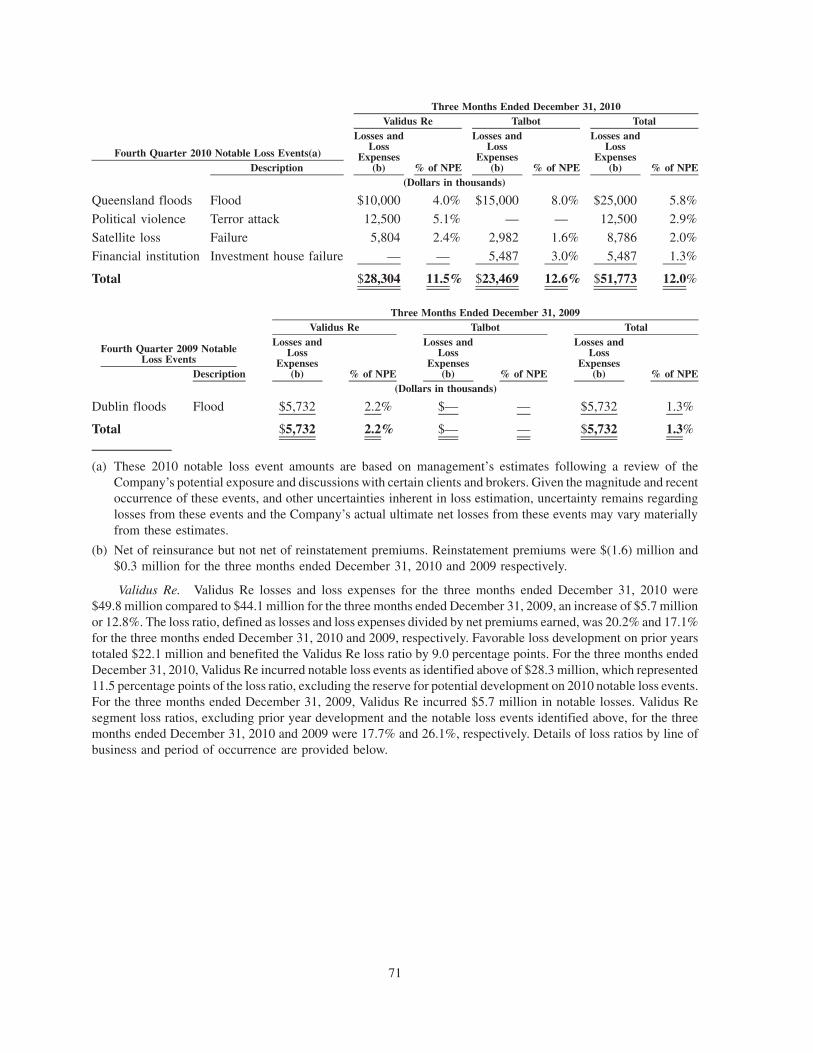
Description
Losses andLoss
Expenses(b) % of NPE
Losses andLoss
Expenses(b) % of NPE
Losses andLoss
Expenses(b) % of NPE
Validus Re Talbot
Fourth Quarter 2010 Notable Loss Events(a)
TotalThree Months Ended December 31, 2010
(Dollars in thousands)
Queensland floods Flood $10,000 4.0% $15,000 8.0% $25,000 5.8%
Political violence Terror attack 12,500 5.1% — — 12,500 2.9%Satellite loss Failure 5,804 2.4% 2,982 1.6% 8,786 2.0%
Financial institution Investment house failure — — 5,487 3.0% 5,487 1.3%
Total $28,304 11.5% $23,469 12.6% $51,773 12.0%
Description
Losses andLoss
Expenses(b) % of NPE
Losses andLoss
Expenses(b) % of NPE
Losses andLoss
Expenses(b) % of NPE
Validus Re Talbot Total
Fourth Quarter 2009 NotableLoss Events
Three Months Ended December 31, 2009
(Dollars in thousands)
Dublin floods Flood $5,732 2.2% $— — $5,732 1.3%
Total $5,732 2.2% $— — $5,732 1.3%
(a) These 2010 notable loss event amounts are based on management’s estimates following a review of theCompany’s potential exposure and discussions with certain clients and brokers. Given the magnitude and recentoccurrence of these events, and other uncertainties inherent in loss estimation, uncertainty remains regardinglosses from these events and the Company’s actual ultimate net losses from these events may vary materiallyfrom these estimates.
(b) Net of reinsurance but not net of reinstatement premiums. Reinstatement premiums were $(1.6) million and$0.3 million for the three months ended December 31, 2010 and 2009 respectively.
Validus Re. Validus Re losses and loss expenses for the three months ended December 31, 2010 were$49.8 million compared to $44.1 million for the three months ended December 31, 2009, an increase of $5.7 millionor 12.8%. The loss ratio, defined as losses and loss expenses divided by net premiums earned, was 20.2% and 17.1%for the three months ended December 31, 2010 and 2009, respectively. Favorable loss development on prior yearstotaled $22.1 million and benefited the Validus Re loss ratio by 9.0 percentage points. For the three months endedDecember 31, 2010, Validus Re incurred notable loss events as identified above of $28.3 million, which represented11.5 percentage points of the loss ratio, excluding the reserve for potential development on 2010 notable loss events.For the three months ended December 31, 2009, Validus Re incurred $5.7 million in notable losses. Validus Resegment loss ratios, excluding prior year development and the notable loss events identified above, for the threemonths ended December 31, 2010 and 2009 were 17.7% and 26.1%, respectively. Details of loss ratios by line ofbusiness and period of occurrence are provided below.
71
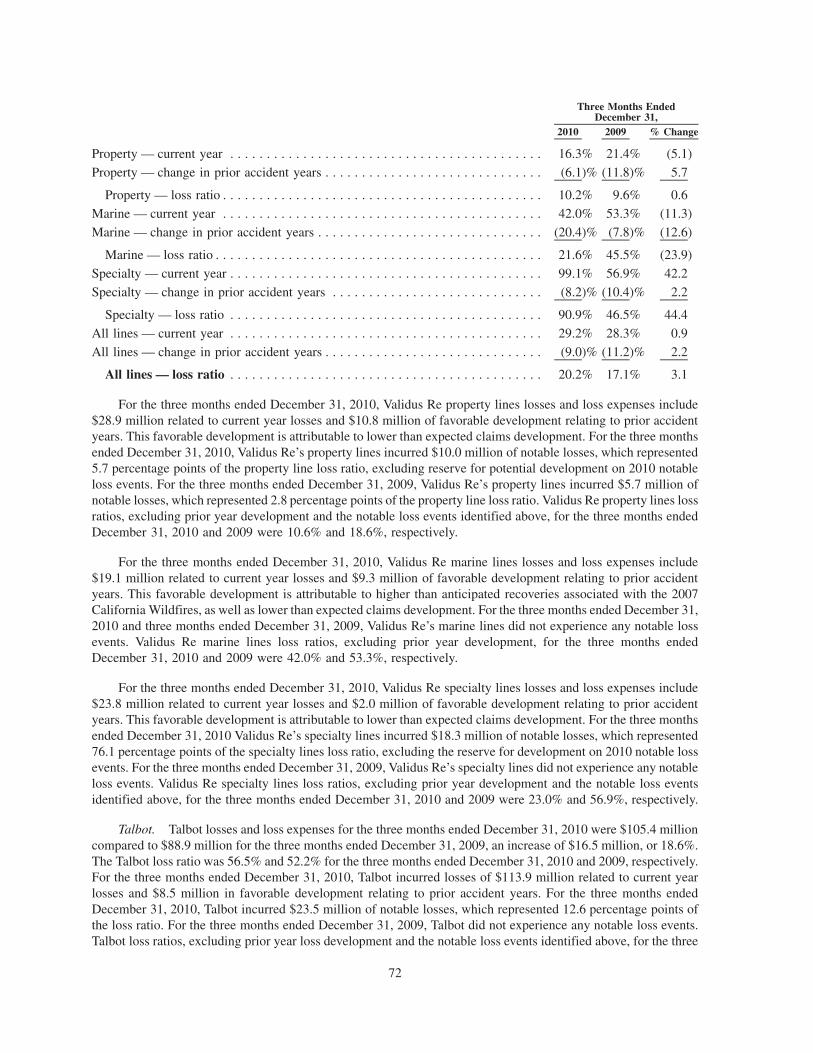
2010 2009 % Change
Three Months EndedDecember 31,
Property — current year . . . . . . . . . . . . . . . . . . . . . . . . . . . . . . . . . . . . . . . . . . . 16.3% 21.4% (5.1)
Property — change in prior accident years . . . . . . . . . . . . . . . . . . . . . . . . . . . . . . (6.1)% (11.8)% 5.7
Property — loss ratio . . . . . . . . . . . . . . . . . . . . . . . . . . . . . . . . . . . . . . . . . . . . 10.2% 9.6% 0.6
Marine — current year . . . . . . . . . . . . . . . . . . . . . . . . . . . . . . . . . . . . . . . . . . . . 42.0% 53.3% (11.3)
Marine — change in prior accident years . . . . . . . . . . . . . . . . . . . . . . . . . . . . . . . (20.4)% (7.8)% (12.6)
Marine — loss ratio . . . . . . . . . . . . . . . . . . . . . . . . . . . . . . . . . . . . . . . . . . . . . 21.6% 45.5% (23.9)
Specialty — current year . . . . . . . . . . . . . . . . . . . . . . . . . . . . . . . . . . . . . . . . . . . 99.1% 56.9% 42.2
Specialty — change in prior accident years . . . . . . . . . . . . . . . . . . . . . . . . . . . . . (8.2)% (10.4)% 2.2
Specialty — loss ratio . . . . . . . . . . . . . . . . . . . . . . . . . . . . . . . . . . . . . . . . . . . 90.9% 46.5% 44.4
All lines — current year . . . . . . . . . . . . . . . . . . . . . . . . . . . . . . . . . . . . . . . . . . . 29.2% 28.3% 0.9
All lines — change in prior accident years . . . . . . . . . . . . . . . . . . . . . . . . . . . . . . (9.0)% (11.2)% 2.2
All lines — loss ratio . . . . . . . . . . . . . . . . . . . . . . . . . . . . . . . . . . . . . . . . . . . 20.2% 17.1% 3.1
For the three months ended December 31, 2010, Validus Re property lines losses and loss expenses include$28.9 million related to current year losses and $10.8 million of favorable development relating to prior accidentyears. This favorable development is attributable to lower than expected claims development. For the three monthsended December 31, 2010, Validus Re’s property lines incurred $10.0 million of notable losses, which represented5.7 percentage points of the property line loss ratio, excluding reserve for potential development on 2010 notableloss events. For the three months ended December 31, 2009, Validus Re’s property lines incurred $5.7 million ofnotable losses, which represented 2.8 percentage points of the property line loss ratio. Validus Re property lines lossratios, excluding prior year development and the notable loss events identified above, for the three months endedDecember 31, 2010 and 2009 were 10.6% and 18.6%, respectively.
For the three months ended December 31, 2010, Validus Re marine lines losses and loss expenses include$19.1 million related to current year losses and $9.3 million of favorable development relating to prior accidentyears. This favorable development is attributable to higher than anticipated recoveries associated with the 2007California Wildfires, as well as lower than expected claims development. For the three months ended December 31,2010 and three months ended December 31, 2009, Validus Re’s marine lines did not experience any notable lossevents. Validus Re marine lines loss ratios, excluding prior year development, for the three months endedDecember 31, 2010 and 2009 were 42.0% and 53.3%, respectively.
For the three months ended December 31, 2010, Validus Re specialty lines losses and loss expenses include$23.8 million related to current year losses and $2.0 million of favorable development relating to prior accidentyears. This favorable development is attributable to lower than expected claims development. For the three monthsended December 31, 2010 Validus Re’s specialty lines incurred $18.3 million of notable losses, which represented76.1 percentage points of the specialty lines loss ratio, excluding the reserve for development on 2010 notable lossevents. For the three months ended December 31, 2009, Validus Re’s specialty lines did not experience any notableloss events. Validus Re specialty lines loss ratios, excluding prior year development and the notable loss eventsidentified above, for the three months ended December 31, 2010 and 2009 were 23.0% and 56.9%, respectively.
Talbot. Talbot losses and loss expenses for the three months ended December 31, 2010 were $105.4 millioncompared to $88.9 million for the three months ended December 31, 2009, an increase of $16.5 million, or 18.6%.The Talbot loss ratio was 56.5% and 52.2% for the three months ended December 31, 2010 and 2009, respectively.For the three months ended December 31, 2010, Talbot incurred losses of $113.9 million related to current yearlosses and $8.5 million in favorable development relating to prior accident years. For the three months endedDecember 31, 2010, Talbot incurred $23.5 million of notable losses, which represented 12.6 percentage points ofthe loss ratio. For the three months ended December 31, 2009, Talbot did not experience any notable loss events.Talbot loss ratios, excluding prior year loss development and the notable loss events identified above, for the three
72
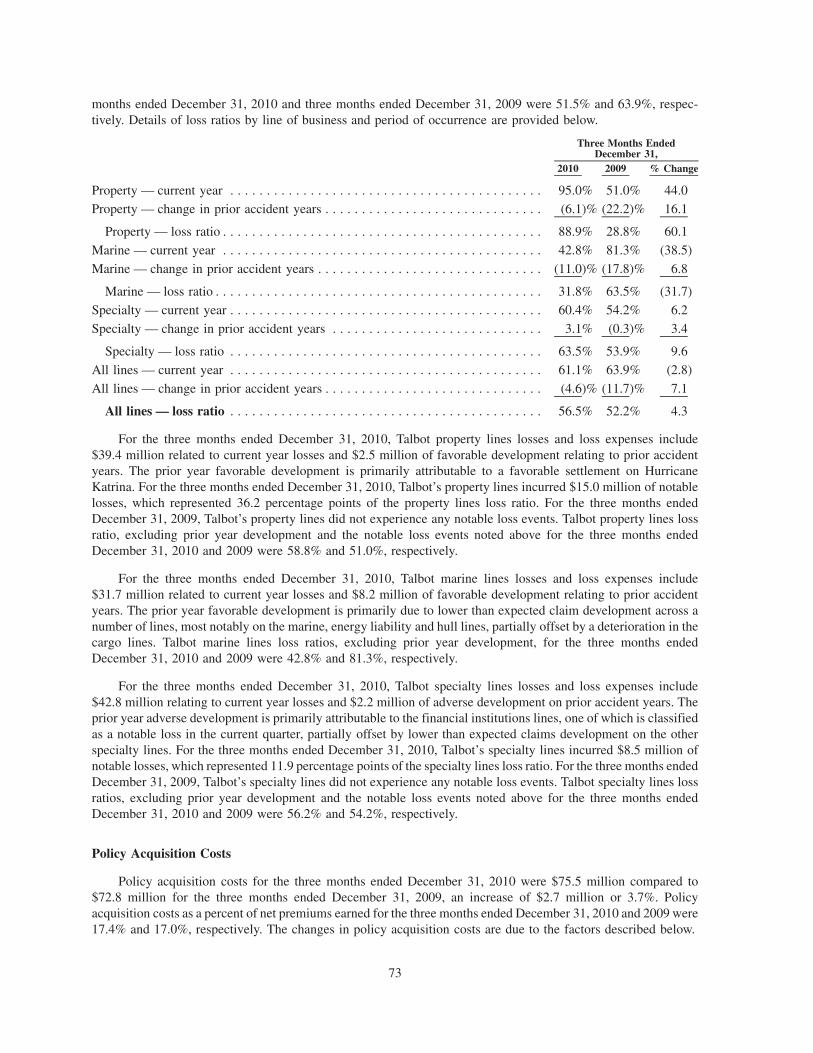
months ended December 31, 2010 and three months ended December 31, 2009 were 51.5% and 63.9%, respec-tively. Details of loss ratios by line of business and period of occurrence are provided below.
2010 2009 % Change
Three Months EndedDecember 31,
Property — current year . . . . . . . . . . . . . . . . . . . . . . . . . . . . . . . . . . . . . . . . . . . 95.0% 51.0% 44.0Property — change in prior accident years . . . . . . . . . . . . . . . . . . . . . . . . . . . . . . (6.1)% (22.2)% 16.1
Property — loss ratio . . . . . . . . . . . . . . . . . . . . . . . . . . . . . . . . . . . . . . . . . . . . 88.9% 28.8% 60.1
Marine — current year . . . . . . . . . . . . . . . . . . . . . . . . . . . . . . . . . . . . . . . . . . . . 42.8% 81.3% (38.5)
Marine — change in prior accident years . . . . . . . . . . . . . . . . . . . . . . . . . . . . . . . (11.0)% (17.8)% 6.8
Marine — loss ratio . . . . . . . . . . . . . . . . . . . . . . . . . . . . . . . . . . . . . . . . . . . . . 31.8% 63.5% (31.7)
Specialty — current year . . . . . . . . . . . . . . . . . . . . . . . . . . . . . . . . . . . . . . . . . . . 60.4% 54.2% 6.2
Specialty — change in prior accident years . . . . . . . . . . . . . . . . . . . . . . . . . . . . . 3.1% (0.3)% 3.4
Specialty — loss ratio . . . . . . . . . . . . . . . . . . . . . . . . . . . . . . . . . . . . . . . . . . . 63.5% 53.9% 9.6
All lines — current year . . . . . . . . . . . . . . . . . . . . . . . . . . . . . . . . . . . . . . . . . . . 61.1% 63.9% (2.8)
All lines — change in prior accident years . . . . . . . . . . . . . . . . . . . . . . . . . . . . . . (4.6)% (11.7)% 7.1
All lines — loss ratio . . . . . . . . . . . . . . . . . . . . . . . . . . . . . . . . . . . . . . . . . . . 56.5% 52.2% 4.3
For the three months ended December 31, 2010, Talbot property lines losses and loss expenses include$39.4 million related to current year losses and $2.5 million of favorable development relating to prior accidentyears. The prior year favorable development is primarily attributable to a favorable settlement on HurricaneKatrina. For the three months ended December 31, 2010, Talbot’s property lines incurred $15.0 million of notablelosses, which represented 36.2 percentage points of the property lines loss ratio. For the three months endedDecember 31, 2009, Talbot’s property lines did not experience any notable loss events. Talbot property lines lossratio, excluding prior year development and the notable loss events noted above for the three months endedDecember 31, 2010 and 2009 were 58.8% and 51.0%, respectively.
For the three months ended December 31, 2010, Talbot marine lines losses and loss expenses include$31.7 million related to current year losses and $8.2 million of favorable development relating to prior accidentyears. The prior year favorable development is primarily due to lower than expected claim development across anumber of lines, most notably on the marine, energy liability and hull lines, partially offset by a deterioration in thecargo lines. Talbot marine lines loss ratios, excluding prior year development, for the three months endedDecember 31, 2010 and 2009 were 42.8% and 81.3%, respectively.
For the three months ended December 31, 2010, Talbot specialty lines losses and loss expenses include$42.8 million relating to current year losses and $2.2 million of adverse development on prior accident years. Theprior year adverse development is primarily attributable to the financial institutions lines, one of which is classifiedas a notable loss in the current quarter, partially offset by lower than expected claims development on the otherspecialty lines. For the three months ended December 31, 2010, Talbot’s specialty lines incurred $8.5 million ofnotable losses, which represented 11.9 percentage points of the specialty lines loss ratio. For the three months endedDecember 31, 2009, Talbot’s specialty lines did not experience any notable loss events. Talbot specialty lines lossratios, excluding prior year development and the notable loss events noted above for the three months endedDecember 31, 2010 and 2009 were 56.2% and 54.2%, respectively.
Policy Acquisition Costs
Policy acquisition costs for the three months ended December 31, 2010 were $75.5 million compared to$72.8 million for the three months ended December 31, 2009, an increase of $2.7 million or 3.7%. Policyacquisition costs as a percent of net premiums earned for the three months ended December 31, 2010 and 2009 were17.4% and 17.0%, respectively. The changes in policy acquisition costs are due to the factors described below.
73
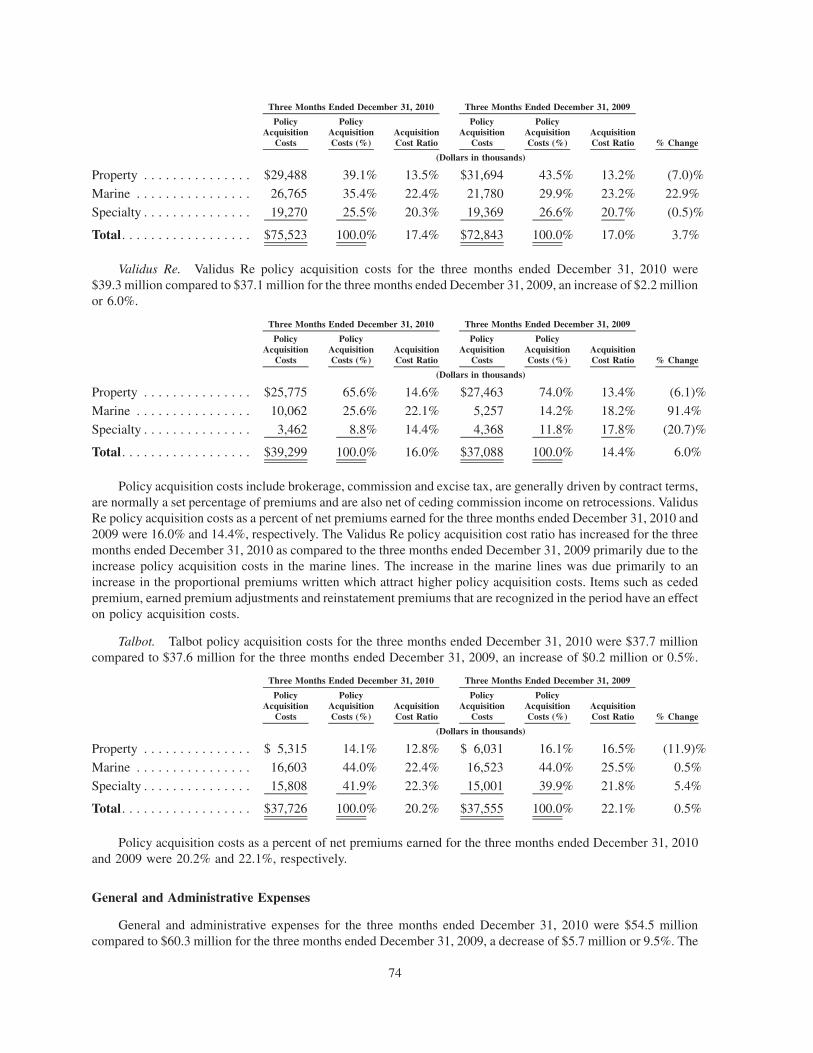
PolicyAcquisition
Costs
PolicyAcquisitionCosts (%)
AcquisitionCost Ratio
PolicyAcquisition
Costs
PolicyAcquisitionCosts (%)
AcquisitionCost Ratio % Change
Three Months Ended December 31, 2010 Three Months Ended December 31, 2009
(Dollars in thousands)
Property . . . . . . . . . . . . . . . $29,488 39.1% 13.5% $31,694 43.5% 13.2% (7.0)%
Marine . . . . . . . . . . . . . . . . 26,765 35.4% 22.4% 21,780 29.9% 23.2% 22.9%
Specialty . . . . . . . . . . . . . . . 19,270 25.5% 20.3% 19,369 26.6% 20.7% (0.5)%
Total. . . . . . . . . . . . . . . . . . $75,523 100.0% 17.4% $72,843 100.0% 17.0% 3.7%
Validus Re. Validus Re policy acquisition costs for the three months ended December 31, 2010 were$39.3 million compared to $37.1 million for the three months ended December 31, 2009, an increase of $2.2 millionor 6.0%.
PolicyAcquisition
Costs
PolicyAcquisitionCosts (%)
AcquisitionCost Ratio
PolicyAcquisition
Costs
PolicyAcquisitionCosts (%)
AcquisitionCost Ratio % Change
(Dollars in thousands)
Three Months Ended December 31, 2010 Three Months Ended December 31, 2009
Property . . . . . . . . . . . . . . . $25,775 65.6% 14.6% $27,463 74.0% 13.4% (6.1)%
Marine . . . . . . . . . . . . . . . . 10,062 25.6% 22.1% 5,257 14.2% 18.2% 91.4%
Specialty . . . . . . . . . . . . . . . 3,462 8.8% 14.4% 4,368 11.8% 17.8% (20.7)%
Total. . . . . . . . . . . . . . . . . . $39,299 100.0% 16.0% $37,088 100.0% 14.4% 6.0%
Policy acquisition costs include brokerage, commission and excise tax, are generally driven by contract terms,are normally a set percentage of premiums and are also net of ceding commission income on retrocessions. ValidusRe policy acquisition costs as a percent of net premiums earned for the three months ended December 31, 2010 and2009 were 16.0% and 14.4%, respectively. The Validus Re policy acquisition cost ratio has increased for the threemonths ended December 31, 2010 as compared to the three months ended December 31, 2009 primarily due to theincrease policy acquisition costs in the marine lines. The increase in the marine lines was due primarily to anincrease in the proportional premiums written which attract higher policy acquisition costs. Items such as cededpremium, earned premium adjustments and reinstatement premiums that are recognized in the period have an effecton policy acquisition costs.
Talbot. Talbot policy acquisition costs for the three months ended December 31, 2010 were $37.7 millioncompared to $37.6 million for the three months ended December 31, 2009, an increase of $0.2 million or 0.5%.
PolicyAcquisition
Costs
PolicyAcquisitionCosts (%)
AcquisitionCost Ratio
PolicyAcquisition
Costs
PolicyAcquisitionCosts (%)
AcquisitionCost Ratio % Change
Three Months Ended December 31, 2010 Three Months Ended December 31, 2009
(Dollars in thousands)
Property . . . . . . . . . . . . . . . $ 5,315 14.1% 12.8% $ 6,031 16.1% 16.5% (11.9)%
Marine . . . . . . . . . . . . . . . . 16,603 44.0% 22.4% 16,523 44.0% 25.5% 0.5%
Specialty . . . . . . . . . . . . . . . 15,808 41.9% 22.3% 15,001 39.9% 21.8% 5.4%
Total. . . . . . . . . . . . . . . . . . $37,726 100.0% 20.2% $37,555 100.0% 22.1% 0.5%
Policy acquisition costs as a percent of net premiums earned for the three months ended December 31, 2010and 2009 were 20.2% and 22.1%, respectively.
General and Administrative Expenses
General and administrative expenses for the three months ended December 31, 2010 were $54.5 millioncompared to $60.3 million for the three months ended December 31, 2009, a decrease of $5.7 million or 9.5%. The
74

decrease was a result of increased expenses in the Corporate segment, offset by a decreases in the Validus Resegment and Talbot segments.
General andAdministrative
Expenses
General andAdministrativeExpenses (%)
General andAdministrative
Expenses
General andAdministrativeExpenses (%) % Change
Three Months EndedDecember 31, 2010
Three Months EndedDecember 31, 2009
(Dollars in thousands)
Validus Re . . . . . . . . . . . . . . . . . . $12,659 23.3% $19,782 32.8% (36.0)%
Talbot . . . . . . . . . . . . . . . . . . . . . 30,334 55.6% 30,787 51.1% (1.5)%
Corporate & Eliminations . . . . . . . 11,518 21.1% 9,684 16.1% 18.9%
Total . . . . . . . . . . . . . . . . . . . . . . $54,511 100.0% $60,253 100.0% (9.5)%
General and administrative expenses of $54.5 million in the three months ended December 31, 2010 represents12.3 percentage points of the expense ratio. Share compensation expense is discussed in the following section.
Validus Re. Validus Re general and administrative expenses for the three months ended December 31, 2010were $12.7 million compared to $19.8 million for the three months ended December 31, 2009, a decrease of$7.1 million or 36.0%. General and administrative expenses have decreased primarily as a result of a decrease insalaries and benefits driven by the reallocation of staff, starting in the first quarter of 2010, into the Corporatesegment from the Validus Re segment compared to the three months ended December 31, 2009. In addition, therewas a reduction of performance bonus accrual during the quarter and a reduction in employee severance costsrelating to the IPC Acquisition compared to the prior year. General and administrative expenses include salaries andbenefits, professional fees, rent and office expenses. Validus Re’s general and administrative expenses as a percentof net premiums earned for the three months ended December 31, 2010 and 2009 were 5.1% and 7.7%, respectively.
Talbot. Talbot general and administrative expenses for the three months ended December 31, 2010 were$30.3 million compared to $30.8 million for the three months ended December 31, 2009, a decrease of $0.5 millionor 1.5%. Talbot’s general and administrative expenses as a percent of net premiums earned for the three monthsended December 31, 2010 and 2009 were 16.3% and 18.1%, respectively.
Corporate & Eliminations. Corporate general and administrative expenses for the three months endedDecember 31, 2010 were $11.5 million compared to $9.7 million for the three months ended December 31, 2009, anincrease of $1.8 million or 18.9%. During the first quarter of 2010, to better align the Company’s operating andreporting structure with its current strategy, there was a change in segment structure. This change was to allocatecertain ‘non-core underwriting’ expenses, predominantly general and administration and stock compensationexpenses to the Corporate segment. Prior periods have not been restated as the change is immaterial to theConsolidated Financial Statements. Corporate general and administrative expenses include executive and boardexpenses, internal and external audit expenses and other costs relating to the Company as a whole. In addition,general and administrative expenses have increased as a result of an increase in staff from 62 at December 31, 2009,on a comparative basis to 89 at December 31, 2010.
75
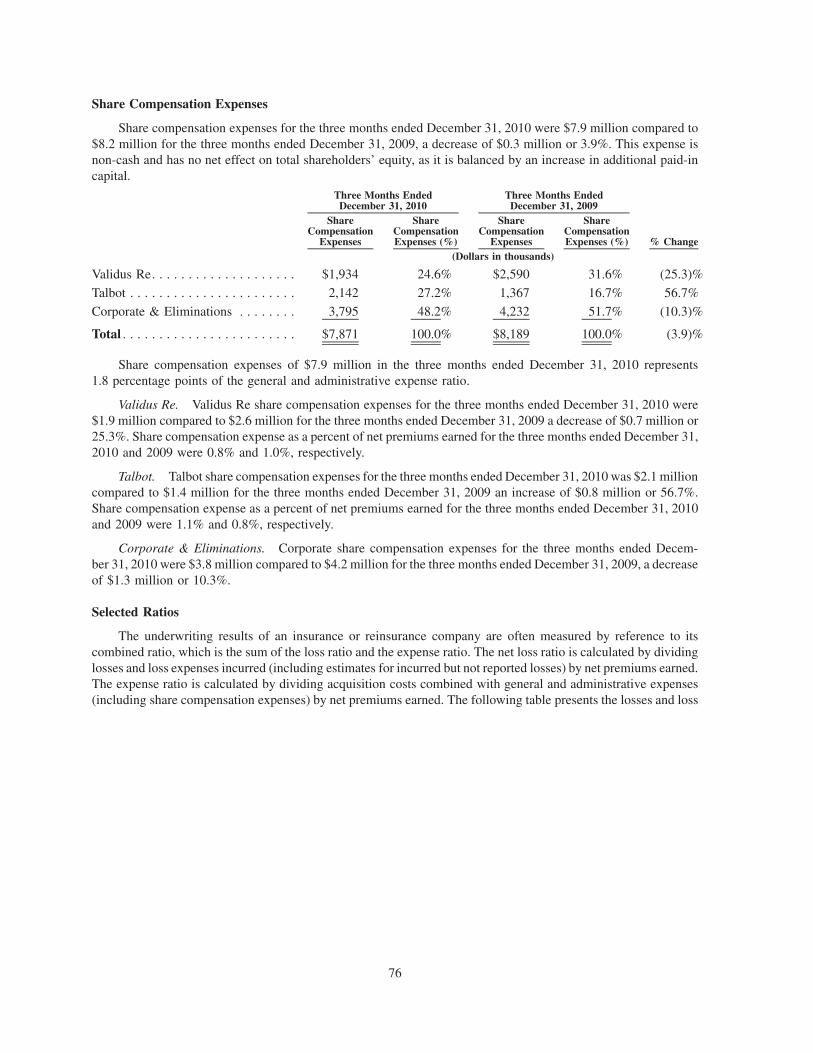
Share Compensation Expenses
Share compensation expenses for the three months ended December 31, 2010 were $7.9 million compared to$8.2 million for the three months ended December 31, 2009, a decrease of $0.3 million or 3.9%. This expense isnon-cash and has no net effect on total shareholders’ equity, as it is balanced by an increase in additional paid-incapital.
ShareCompensation
Expenses
ShareCompensationExpenses (%)
ShareCompensation
Expenses
ShareCompensationExpenses (%) % Change
Three Months EndedDecember 31, 2010
Three Months EndedDecember 31, 2009
(Dollars in thousands)
Validus Re. . . . . . . . . . . . . . . . . . . . $1,934 24.6% $2,590 31.6% (25.3)%
Talbot . . . . . . . . . . . . . . . . . . . . . . . 2,142 27.2% 1,367 16.7% 56.7%
Corporate & Eliminations . . . . . . . . 3,795 48.2% 4,232 51.7% (10.3)%
Total . . . . . . . . . . . . . . . . . . . . . . . . $7,871 100.0% $8,189 100.0% (3.9)%
Share compensation expenses of $7.9 million in the three months ended December 31, 2010 represents1.8 percentage points of the general and administrative expense ratio.
Validus Re. Validus Re share compensation expenses for the three months ended December 31, 2010 were$1.9 million compared to $2.6 million for the three months ended December 31, 2009 a decrease of $0.7 million or25.3%. Share compensation expense as a percent of net premiums earned for the three months ended December 31,2010 and 2009 were 0.8% and 1.0%, respectively.
Talbot. Talbot share compensation expenses for the three months ended December 31, 2010 was $2.1 millioncompared to $1.4 million for the three months ended December 31, 2009 an increase of $0.8 million or 56.7%.Share compensation expense as a percent of net premiums earned for the three months ended December 31, 2010and 2009 were 1.1% and 0.8%, respectively.
Corporate & Eliminations. Corporate share compensation expenses for the three months ended Decem-ber 31, 2010 were $3.8 million compared to $4.2 million for the three months ended December 31, 2009, a decreaseof $1.3 million or 10.3%.
Selected Ratios
The underwriting results of an insurance or reinsurance company are often measured by reference to itscombined ratio, which is the sum of the loss ratio and the expense ratio. The net loss ratio is calculated by dividinglosses and loss expenses incurred (including estimates for incurred but not reported losses) by net premiums earned.The expense ratio is calculated by dividing acquisition costs combined with general and administrative expenses(including share compensation expenses) by net premiums earned. The following table presents the losses and loss
76
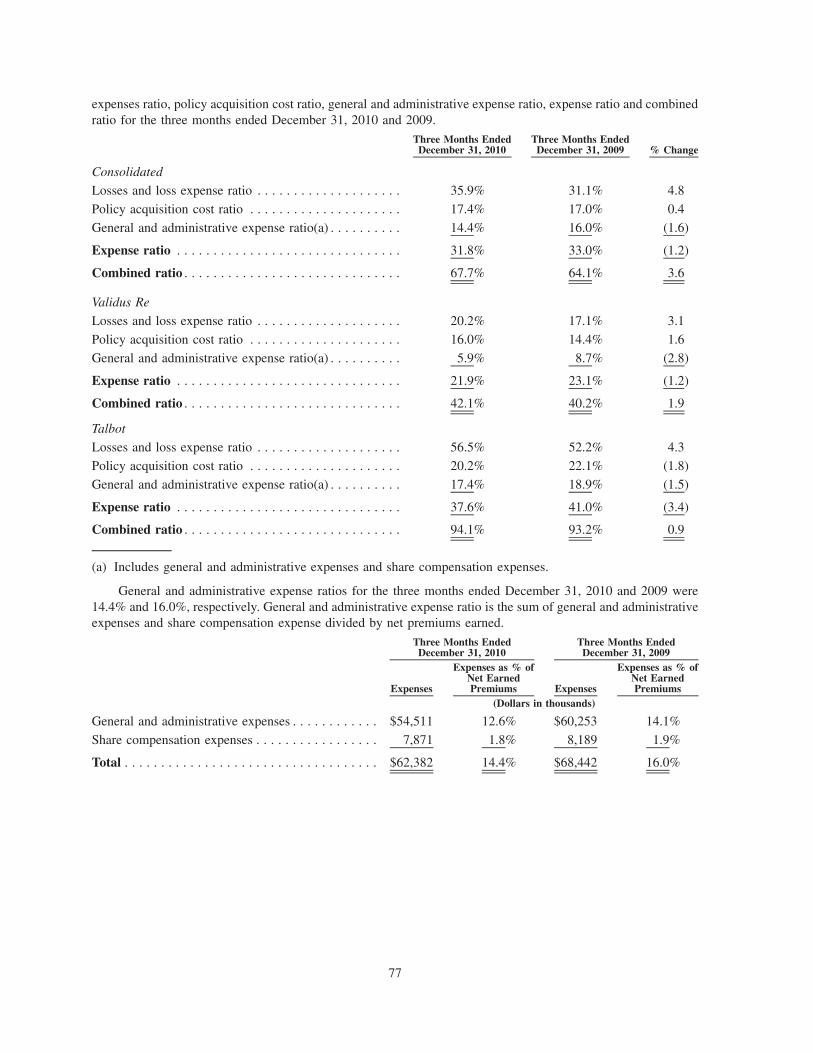
expenses ratio, policy acquisition cost ratio, general and administrative expense ratio, expense ratio and combinedratio for the three months ended December 31, 2010 and 2009.
Three Months EndedDecember 31, 2010
Three Months EndedDecember 31, 2009 % Change
Consolidated
Losses and loss expense ratio . . . . . . . . . . . . . . . . . . . . 35.9% 31.1% 4.8
Policy acquisition cost ratio . . . . . . . . . . . . . . . . . . . . . 17.4% 17.0% 0.4
General and administrative expense ratio(a) . . . . . . . . . . 14.4% 16.0% (1.6)
Expense ratio . . . . . . . . . . . . . . . . . . . . . . . . . . . . . . . 31.8% 33.0% (1.2)
Combined ratio . . . . . . . . . . . . . . . . . . . . . . . . . . . . . . 67.7% 64.1% 3.6
Validus Re
Losses and loss expense ratio . . . . . . . . . . . . . . . . . . . . 20.2% 17.1% 3.1
Policy acquisition cost ratio . . . . . . . . . . . . . . . . . . . . . 16.0% 14.4% 1.6
General and administrative expense ratio(a) . . . . . . . . . . 5.9% 8.7% (2.8)
Expense ratio . . . . . . . . . . . . . . . . . . . . . . . . . . . . . . . 21.9% 23.1% (1.2)
Combined ratio . . . . . . . . . . . . . . . . . . . . . . . . . . . . . . 42.1% 40.2% 1.9
Talbot
Losses and loss expense ratio . . . . . . . . . . . . . . . . . . . . 56.5% 52.2% 4.3
Policy acquisition cost ratio . . . . . . . . . . . . . . . . . . . . . 20.2% 22.1% (1.8)
General and administrative expense ratio(a) . . . . . . . . . . 17.4% 18.9% (1.5)
Expense ratio . . . . . . . . . . . . . . . . . . . . . . . . . . . . . . . 37.6% 41.0% (3.4)
Combined ratio . . . . . . . . . . . . . . . . . . . . . . . . . . . . . . 94.1% 93.2% 0.9
(a) Includes general and administrative expenses and share compensation expenses.
General and administrative expense ratios for the three months ended December 31, 2010 and 2009 were14.4% and 16.0%, respectively. General and administrative expense ratio is the sum of general and administrativeexpenses and share compensation expense divided by net premiums earned.
Expenses
Expenses as % ofNet EarnedPremiums Expenses
Expenses as % ofNet EarnedPremiums
Three Months EndedDecember 31, 2010
Three Months EndedDecember 31, 2009
(Dollars in thousands)
General and administrative expenses . . . . . . . . . . . . $54,511 12.6% $60,253 14.1%
Share compensation expenses . . . . . . . . . . . . . . . . . 7,871 1.8% 8,189 1.9%
Total . . . . . . . . . . . . . . . . . . . . . . . . . . . . . . . . . . . $62,382 14.4% $68,442 16.0%
77
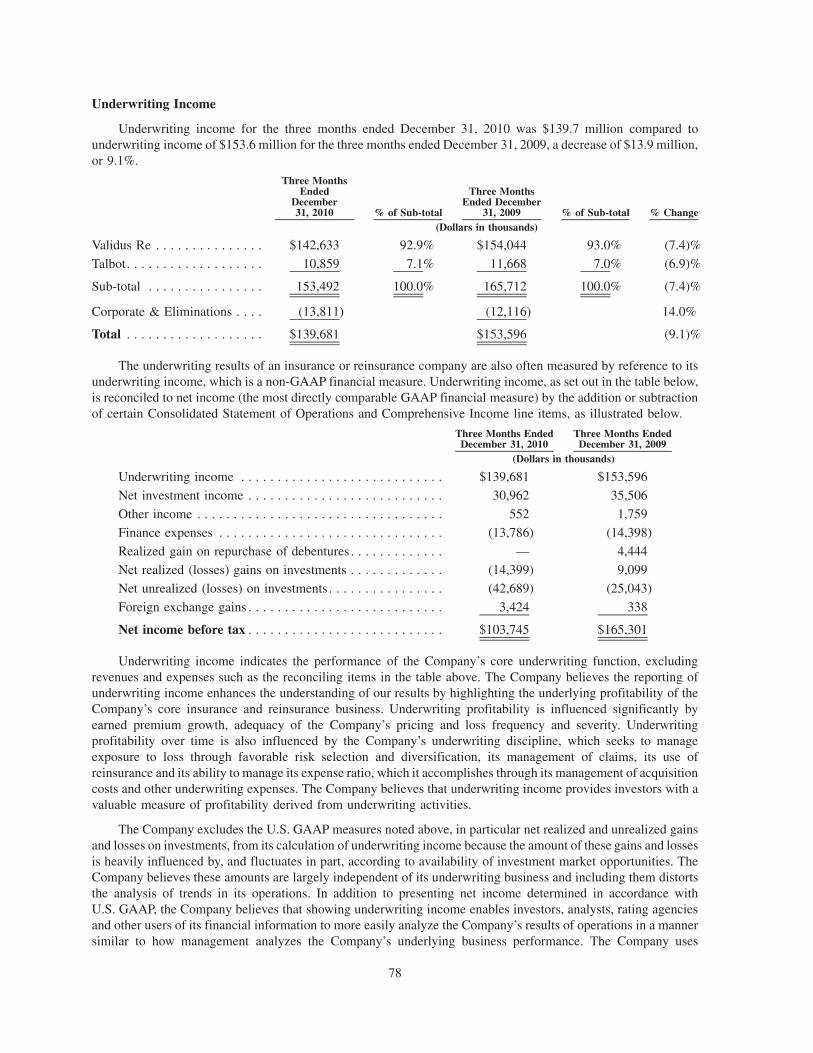
Underwriting Income
Underwriting income for the three months ended December 31, 2010 was $139.7 million compared tounderwriting income of $153.6 million for the three months ended December 31, 2009, a decrease of $13.9 million,or 9.1%.
Three MonthsEnded
December31, 2010 % of Sub-total
Three MonthsEnded December
31, 2009 % of Sub-total % Change(Dollars in thousands)
Validus Re . . . . . . . . . . . . . . . $142,633 92.9% $154,044 93.0% (7.4)%
Talbot. . . . . . . . . . . . . . . . . . . 10,859 7.1% 11,668 7.0% (6.9)%
Sub-total . . . . . . . . . . . . . . . . 153,492 100.0% 165,712 100.0% (7.4)%
Corporate & Eliminations . . . . (13,811) (12,116) 14.0%
Total . . . . . . . . . . . . . . . . . . . $139,681 $153,596 (9.1)%
The underwriting results of an insurance or reinsurance company are also often measured by reference to itsunderwriting income, which is a non-GAAP financial measure. Underwriting income, as set out in the table below,is reconciled to net income (the most directly comparable GAAP financial measure) by the addition or subtractionof certain Consolidated Statement of Operations and Comprehensive Income line items, as illustrated below.
Three Months EndedDecember 31, 2010
Three Months EndedDecember 31, 2009
(Dollars in thousands)
Underwriting income . . . . . . . . . . . . . . . . . . . . . . . . . . . . $139,681 $153,596
Net investment income . . . . . . . . . . . . . . . . . . . . . . . . . . . 30,962 35,506
Other income . . . . . . . . . . . . . . . . . . . . . . . . . . . . . . . . . . 552 1,759
Finance expenses . . . . . . . . . . . . . . . . . . . . . . . . . . . . . . . (13,786) (14,398)
Realized gain on repurchase of debentures . . . . . . . . . . . . . — 4,444Net realized (losses) gains on investments . . . . . . . . . . . . . (14,399) 9,099
Net unrealized (losses) on investments . . . . . . . . . . . . . . . . (42,689) (25,043)
Foreign exchange gains . . . . . . . . . . . . . . . . . . . . . . . . . . . 3,424 338
Net income before tax . . . . . . . . . . . . . . . . . . . . . . . . . . . $103,745 $165,301
Underwriting income indicates the performance of the Company’s core underwriting function, excludingrevenues and expenses such as the reconciling items in the table above. The Company believes the reporting ofunderwriting income enhances the understanding of our results by highlighting the underlying profitability of theCompany’s core insurance and reinsurance business. Underwriting profitability is influenced significantly byearned premium growth, adequacy of the Company’s pricing and loss frequency and severity. Underwritingprofitability over time is also influenced by the Company’s underwriting discipline, which seeks to manageexposure to loss through favorable risk selection and diversification, its management of claims, its use ofreinsurance and its ability to manage its expense ratio, which it accomplishes through its management of acquisitioncosts and other underwriting expenses. The Company believes that underwriting income provides investors with avaluable measure of profitability derived from underwriting activities.
The Company excludes the U.S. GAAP measures noted above, in particular net realized and unrealized gainsand losses on investments, from its calculation of underwriting income because the amount of these gains and lossesis heavily influenced by, and fluctuates in part, according to availability of investment market opportunities. TheCompany believes these amounts are largely independent of its underwriting business and including them distortsthe analysis of trends in its operations. In addition to presenting net income determined in accordance withU.S. GAAP, the Company believes that showing underwriting income enables investors, analysts, rating agenciesand other users of its financial information to more easily analyze the Company’s results of operations in a mannersimilar to how management analyzes the Company’s underlying business performance. The Company uses
78
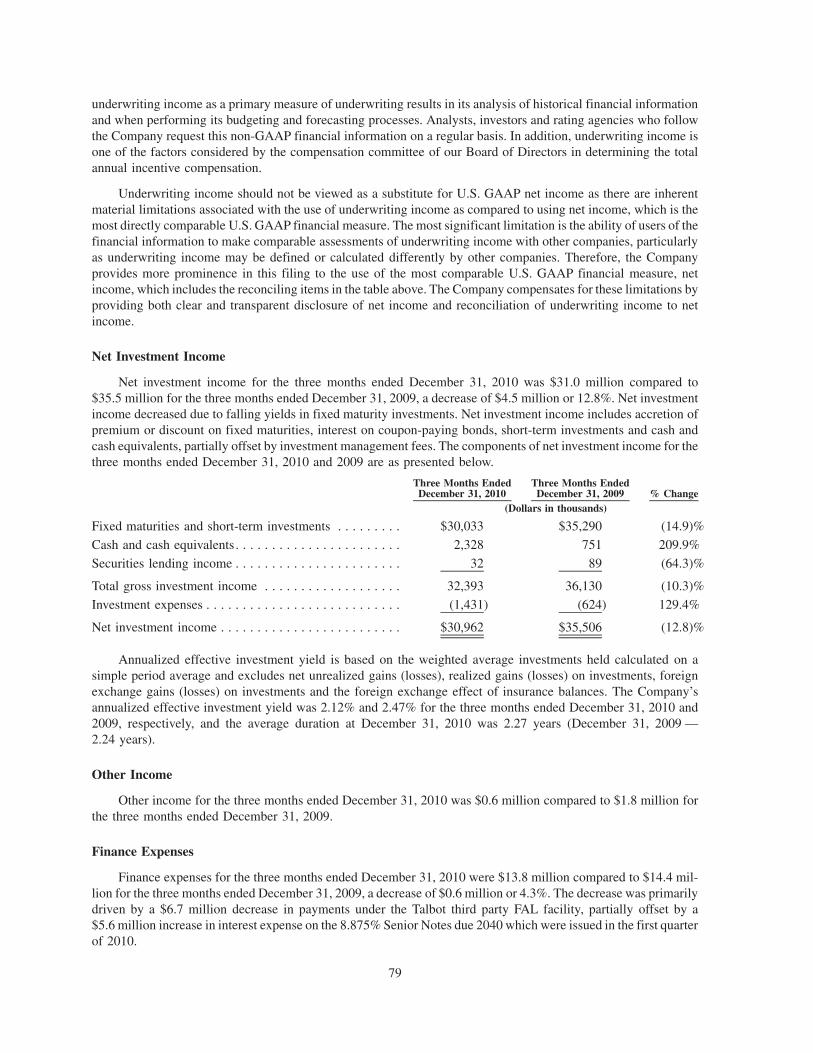
underwriting income as a primary measure of underwriting results in its analysis of historical financial informationand when performing its budgeting and forecasting processes. Analysts, investors and rating agencies who followthe Company request this non-GAAP financial information on a regular basis. In addition, underwriting income isone of the factors considered by the compensation committee of our Board of Directors in determining the totalannual incentive compensation.
Underwriting income should not be viewed as a substitute for U.S. GAAP net income as there are inherentmaterial limitations associated with the use of underwriting income as compared to using net income, which is themost directly comparable U.S. GAAP financial measure. The most significant limitation is the ability of users of thefinancial information to make comparable assessments of underwriting income with other companies, particularlyas underwriting income may be defined or calculated differently by other companies. Therefore, the Companyprovides more prominence in this filing to the use of the most comparable U.S. GAAP financial measure, netincome, which includes the reconciling items in the table above. The Company compensates for these limitations byproviding both clear and transparent disclosure of net income and reconciliation of underwriting income to netincome.
Net Investment Income
Net investment income for the three months ended December 31, 2010 was $31.0 million compared to$35.5 million for the three months ended December 31, 2009, a decrease of $4.5 million or 12.8%. Net investmentincome decreased due to falling yields in fixed maturity investments. Net investment income includes accretion ofpremium or discount on fixed maturities, interest on coupon-paying bonds, short-term investments and cash andcash equivalents, partially offset by investment management fees. The components of net investment income for thethree months ended December 31, 2010 and 2009 are as presented below.
Three Months EndedDecember 31, 2010
Three Months EndedDecember 31, 2009 % Change
(Dollars in thousands)
Fixed maturities and short-term investments . . . . . . . . . $30,033 $35,290 (14.9)%
Cash and cash equivalents. . . . . . . . . . . . . . . . . . . . . . . 2,328 751 209.9%
Securities lending income . . . . . . . . . . . . . . . . . . . . . . . 32 89 (64.3)%
Total gross investment income . . . . . . . . . . . . . . . . . . . 32,393 36,130 (10.3)%
Investment expenses . . . . . . . . . . . . . . . . . . . . . . . . . . . (1,431) (624) 129.4%
Net investment income . . . . . . . . . . . . . . . . . . . . . . . . . $30,962 $35,506 (12.8)%
Annualized effective investment yield is based on the weighted average investments held calculated on asimple period average and excludes net unrealized gains (losses), realized gains (losses) on investments, foreignexchange gains (losses) on investments and the foreign exchange effect of insurance balances. The Company’sannualized effective investment yield was 2.12% and 2.47% for the three months ended December 31, 2010 and2009, respectively, and the average duration at December 31, 2010 was 2.27 years (December 31, 2009 —2.24 years).
Other Income
Other income for the three months ended December 31, 2010 was $0.6 million compared to $1.8 million forthe three months ended December 31, 2009.
Finance Expenses
Finance expenses for the three months ended December 31, 2010 were $13.8 million compared to $14.4 mil-lion for the three months ended December 31, 2009, a decrease of $0.6 million or 4.3%. The decrease was primarilydriven by a $6.7 million decrease in payments under the Talbot third party FAL facility, partially offset by a$5.6 million increase in interest expense on the 8.875% Senior Notes due 2040 which were issued in the first quarterof 2010.
79

Finance expenses also include the amortization of debt offering costs and discounts, and fees related to ourcredit facilities.
2010 2009 % Change
Three Months EndedDecember 31,
(Dollars in thousands)
9.069% Junior Subordinated Deferrable Debentures. . . . . . . . . . . . $ 3,589 $ 3,589 0.0%
8.480% Junior Subordinated Deferrable Debentures. . . . . . . . . . . . 3,028 2,688 12.6%
8.875% Senior Notes due 2040 . . . . . . . . . . . . . . . . . . . . . . . . . . . 5,598 — NM
Credit facilities . . . . . . . . . . . . . . . . . . . . . . . . . . . . . . . . . . . . . . 1,571 1,084 44.9%
Talbot FAL facility. . . . . . . . . . . . . . . . . . . . . . . . . . . . . . . . . . . . — 375 NM
Talbot third party FAL facility . . . . . . . . . . . . . . . . . . . . . . . . . . . — 6,662 NM
Finance expenses . . . . . . . . . . . . . . . . . . . . . . . . . . . . . . . . . . . . $13,786 $14,398 (4.3)%
NM: Not Meaningful
Capital in Lloyd’s entities, whether personal or corporate, is required to be set annually for the prospective yearand held by Lloyd’s in trust (“Funds at Lloyd’s” or “FAL”). In underwriting years up to and including 2007, Talbot’sFAL has been provided both by Talbot and by third parties, thereafter Talbot’s FAL has been provided exclusivelyby the Company. Because the third party FAL providers remain “on risk” until each year of account that theirsupport closes (normally after three years). Talbot must retain third party FAL even if a third party FAL provider hasceased to support the active underwriting year. This is achieved by placing such FAL in escrow outside Lloyd’s.Thus, the total FAL facility available to the Company is the total FAL for active and prior underwriting years,although the Company can only apply specific FAL against losses incurred by an underwriting year that such FAL iscontracted to support. As of December 31, 2009, the 2007 year of account, which was the last year of accountsupported by the Talbot third party FAL facility, closed and all third party FAL was returned to its providers.
For each year of account up to and including the 2007 year of account, between 30% and 40% of an amountequivalent to each underwriting years’ profit is payable to Talbot third party FAL providers. However, some of thesecosts are fixed. The FAL finance charges relate to total syndicate profit (underwriting income, investment incomeand realized and unrealized capital gains and losses). There are no third party FAL finance charges related to the2008, 2009 and 2010 years of account as there were no third party FAL providers in those periods.
Third party FAL finance charges for the three months ended December 31, 2010 were $nil compared to$6.7 million for the three months ended December 31, 2009. This decrease was due to the closure of all third partysupported years of account and the final settlement, in 2010, of all remaining liabilities.
Tax Expense (Benefit)
Tax expense for the three months ended December 31, 2010 was $1.1 million compared to a benefit of($0.5) million for the three months ended December 31, 2009, an increase of $1.5 million or 331.0%.
Realized Gain on Repurchase of Debentures
On December 1, 2009, the Company repurchased from an unaffiliated financial institution $14.5 millionprincipal amount of its 8.480% Junior Subordinated Deferrable Debentures due 2037 at an aggregate price of$9.9 million plus accrued and unpaid interest of $0.3 million. The repurchase resulted in the recognition of arealized gain of $4.4 million for the three months ended December 31, 2009.
Net Realized (Losses) Gains on Investments
Net realized losses on investments for the three months ended December 31, 2010 were ($14.4) millioncompared to gains of $9.1 million for the three months ended December 31, 2009, a decrease of $23.5 million or258.2%.
80
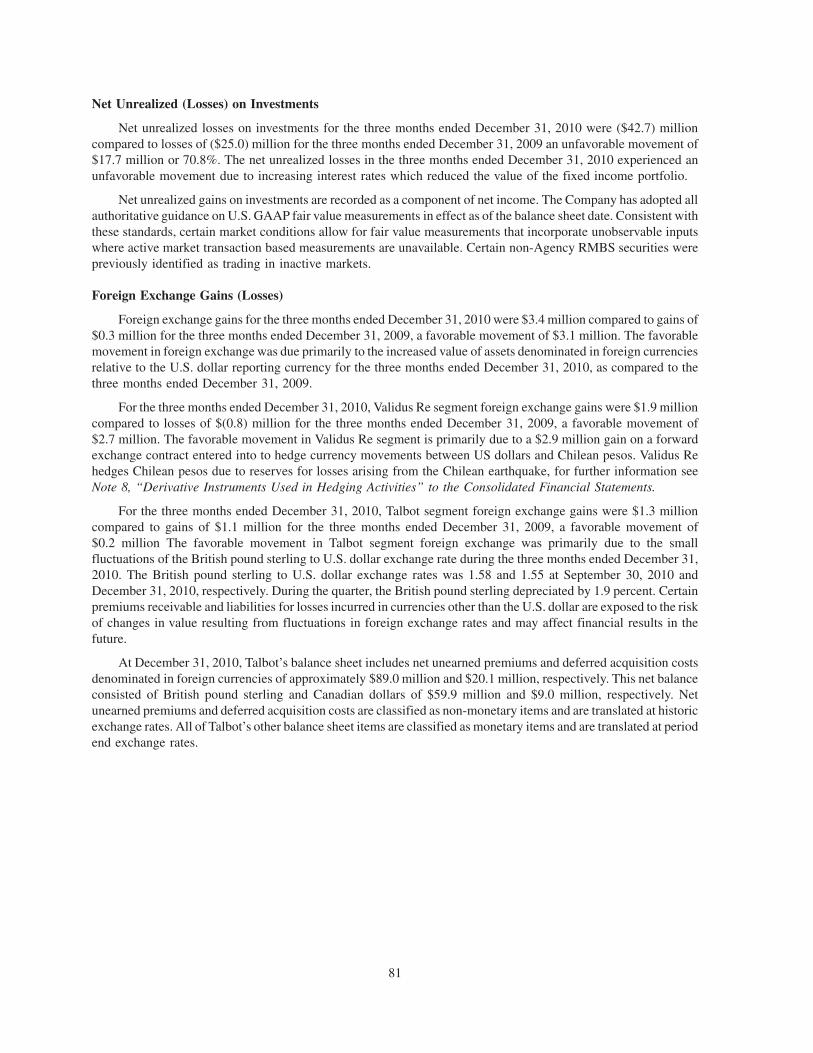
Net Unrealized (Losses) on Investments
Net unrealized losses on investments for the three months ended December 31, 2010 were ($42.7) millioncompared to losses of ($25.0) million for the three months ended December 31, 2009 an unfavorable movement of$17.7 million or 70.8%. The net unrealized losses in the three months ended December 31, 2010 experienced anunfavorable movement due to increasing interest rates which reduced the value of the fixed income portfolio.
Net unrealized gains on investments are recorded as a component of net income. The Company has adopted allauthoritative guidance on U.S. GAAP fair value measurements in effect as of the balance sheet date. Consistent withthese standards, certain market conditions allow for fair value measurements that incorporate unobservable inputswhere active market transaction based measurements are unavailable. Certain non-Agency RMBS securities werepreviously identified as trading in inactive markets.
Foreign Exchange Gains (Losses)
Foreign exchange gains for the three months ended December 31, 2010 were $3.4 million compared to gains of$0.3 million for the three months ended December 31, 2009, a favorable movement of $3.1 million. The favorablemovement in foreign exchange was due primarily to the increased value of assets denominated in foreign currenciesrelative to the U.S. dollar reporting currency for the three months ended December 31, 2010, as compared to thethree months ended December 31, 2009.
For the three months ended December 31, 2010, Validus Re segment foreign exchange gains were $1.9 millioncompared to losses of $(0.8) million for the three months ended December 31, 2009, a favorable movement of$2.7 million. The favorable movement in Validus Re segment is primarily due to a $2.9 million gain on a forwardexchange contract entered into to hedge currency movements between US dollars and Chilean pesos. Validus Rehedges Chilean pesos due to reserves for losses arising from the Chilean earthquake, for further information seeNote 8, “Derivative Instruments Used in Hedging Activities” to the Consolidated Financial Statements.
For the three months ended December 31, 2010, Talbot segment foreign exchange gains were $1.3 millioncompared to gains of $1.1 million for the three months ended December 31, 2009, a favorable movement of$0.2 million The favorable movement in Talbot segment foreign exchange was primarily due to the smallfluctuations of the British pound sterling to U.S. dollar exchange rate during the three months ended December 31,2010. The British pound sterling to U.S. dollar exchange rates was 1.58 and 1.55 at September 30, 2010 andDecember 31, 2010, respectively. During the quarter, the British pound sterling depreciated by 1.9 percent. Certainpremiums receivable and liabilities for losses incurred in currencies other than the U.S. dollar are exposed to the riskof changes in value resulting from fluctuations in foreign exchange rates and may affect financial results in thefuture.
At December 31, 2010, Talbot’s balance sheet includes net unearned premiums and deferred acquisition costsdenominated in foreign currencies of approximately $89.0 million and $20.1 million, respectively. This net balanceconsisted of British pound sterling and Canadian dollars of $59.9 million and $9.0 million, respectively. Netunearned premiums and deferred acquisition costs are classified as non-monetary items and are translated at historicexchange rates. All of Talbot’s other balance sheet items are classified as monetary items and are translated at periodend exchange rates.
81

The following table presents results of operations for the three and twelve months ended December 31, 2010and 2009:
2010 2009 2010 2009(a)Pro Forma 2009
(c) 2008
Three Months EndedDecember 31,
Year Ended December 31,
(Dollars in thousands)
Gross premiums written . . . . . . . . . . . . . $258,731 $255,289 $1,990,566 $1,621,241 2,008,578 $1,362,484Reinsurance premiums ceded . . . . . . . . . (35,376) (30,393) (229,482) (232,883) (239,412) (124,160)
Net premiums written . . . . . . . . . . . . . . 223,355 224,896 1,761,084 1,388,358 1,769,166 1,238,324Change in unearned premiums . . . . . . . . 209,456 203,005 39 61,219 (57,338) 18,194
Net premiums earned . . . . . . . . . . . . . . . 432,811 427,901 1,761,123 1,449,577 1,711,828 1,256,518Losses and loss expenses . . . . . . . . . . . . 155,225 133,020 987,586 523,757 556,550 772,154Policy acquisition costs . . . . . . . . . . . . . 75,523 72,843 292,899 262,966 289,600 234,951General and administrative expenses . . . . 54,511 60,253 209,290 185,568 209,510 123,948Share compensation expenses . . . . . . . . . 7,871 8,189 28,911 27,037 33,751 27,097
Total underwriting deductions . . . . . . . . . 293,130 274,305 1,518,686 999,328 1,089,411 1,158,150Underwriting income(b) . . . . . . . . . . . . . 139,681 153,596 242,437 450,249 622,417 98,368Net investment income . . . . . . . . . . . . . . 30,962 35,506 134,103 118,773 163,944 139,528Other income . . . . . . . . . . . . . . . . . . . . 552 1,759 5,219 4,634 4,603 5,264Finance expenses . . . . . . . . . . . . . . . . . . (13,786) (14,398) (55,870) (44,130) (44,513) (57,318)
Operating income before taxes(b) . . . . . . 157,409 176,463 325,889 529,526 746,451 185,842Tax (expense) benefit . . . . . . . . . . . . . . . (1,058) 458 (3,126) 3,759 3,759 (10,788)
Net operating income(b) . . . . . . . . . . . . . 156,351 176,921 322,763 533,285 750,210 175,054Gain on bargain purchase, net of
expenses . . . . . . . . . . . . . . . . . . . . . . — — — 287,099 — —Realized gain on repurchase of
debentures . . . . . . . . . . . . . . . . . . . . . — 4,444 — 4,444 4,444 8,752Net realized (losses) gains on
investments . . . . . . . . . . . . . . . . . . . . (14,399) 9,099 32,498 (11,543) (4,717) (1,591)Net unrealized (losses) gains on
investments . . . . . . . . . . . . . . . . . . . . (42,689) (25,043) 45,952 84,796 189,789 (79,707)Foreign exchange gains (losses) . . . . . . . 3,424 338 1,351 (674) 4,294 (49,397)
Net income . . . . . . . . . . . . . . . . . . . . . . $102,687 $165,759 $ 402,564 $ 897,407 944,020 $ 53,111
Selected ratios:Net premiums written / Gross premiums
written . . . . . . . . . . . . . . . . . . . . . . . 86.3% 88.1% 88.5% 85.6% 88.1% 90.9%Losses and loss expenses . . . . . . . . . . . . 35.9% 31.1% 56.1% 36.1% 32.5% 61.5%Policy acquisition costs . . . . . . . . . . . . . 17.4% 17.0% 16.6% 18.1% 16.9% 18.7%General and administrative expenses(d) . . 14.4% 16.0% 13.5% 14.7% 14.2% 12.0%
Expense ratio . . . . . . . . . . . . . . . . . . . . 31.8% 33.0% 30.1% 32.8% 31.1% 30.7%
Combined ratio . . . . . . . . . . . . . . . . . . . 67.7% 64.1% 86.2% 68.9% 63.6% 92.2%
(a) The results of operations for IPC are consolidated only from the September 2009 date of acquisition.
(b) Non-GAAP Financial Measures. In presenting the Company’s results, management has included and discussedunderwriting income and operating income that are not calculated under standards or rules that comprise U.S.GAAP. Such measures are referred to as non-GAAP. Non-GAAP measures may be defined or calculateddifferently by other companies. These measures should not be viewed as a substitute for those determined inaccordance with U.S. GAAP. Reconciliations of these measures to the most comparable U.S. GAAP financialmeasure, are presented in the section below entitled “Underwriting Income.”
(c) Pro Forma combined Validus Holdings, Ltd. and IPC Holdings Ltd. income statement for the year endedDecember 31, 2009.
(d) The general and administrative ratio includes share compensation expenses.
82

2010 2009 2010 2009(a)Pro Forma 2009
(c) 2008
Three Months EndedDecember 31,
Year Ended December 31, 2010
(Dollars in thousands)
Validus ReGross premiums written . . . . . . . . . . . . . . . $ 33,986 $ 33,694 $1,101,239 $ 768,084 $1,155,421 $687,771Reinsurance premiums ceded . . . . . . . . . . . (399) (652) (63,147) (95,446) (101,975) (62,933)
Net premiums written . . . . . . . . . . . . . . . . 33,587 33,042 1,038,092 672,638 1,053,446 624,838Change in unearned premiums . . . . . . . . . . 212,737 224,596 13,108 122,912 4,305 28,693
Net premiums earned . . . . . . . . . . . . . . . . . 246,324 257,638 1,051,200 795,550 1,057,751 653,531Losses and loss expenses . . . . . . . . . . . . . . 49,799 44,134 601,610 186,704 219,497 420,645Policy acquisition costs . . . . . . . . . . . . . . . 39,299 37,088 160,599 127,433 154,127 100,243General and administrative expenses . . . . . . 12,659 19,782 45,617 65,710 89,652 34,607Share compensation expenses . . . . . . . . . . . 1,934 2,590 7,181 7,576 14,290 6,829
Total underwriting deductions . . . . . . . . . . . 103,691 103,594 815,007 387,423 477,566 562,324
Underwriting income(b) . . . . . . . . . . . . . . . 142,633 154,044 236,193 408,127 580,185 91,207
TalbotGross premiums written . . . . . . . . . . . . . . . $238,100 $229,548 $ 981,073 $ 919,906 $ 919,906 $708,996Reinsurance premiums ceded . . . . . . . . . . . (48,332) (37,694) (258,081) (204,186) (204,186) (95,510)
Net premiums written . . . . . . . . . . . . . . . . 189,768 191,854 722,992 715,720 715,720 613,486Change in unearned premiums . . . . . . . . . . (3,281) (21,591) (13,069) (61,693) (61,693) (10,499)
Net premiums earned . . . . . . . . . . . . . . . . . 186,487 170,263 709,923 654,027 654,027 602,987Losses and loss expenses . . . . . . . . . . . . . . 105,426 88,886 385,976 337,053 337,053 351,509Policy acquisition costs . . . . . . . . . . . . . . . 37,726 37,555 143,769 139,932 139,932 135,017General and administrative expenses . . . . . . 30,334 30,787 114,043 96,352 96,352 71,443Share compensation expenses . . . . . . . . . . . 2,142 1,367 6,923 7,171 7,171 4,702
Total underwriting deductions . . . . . . . . . . . 175,628 158,595 650,711 580,508 580,508 562,671
Underwriting income(b) . . . . . . . . . . . . . . . 10,859 11,668 59,212 73,519 73,519 40,316
Corporate & EliminationsGross premiums written . . . . . . . . . . . . . . . $ (13,355) $ (7,953) $ (91,746) $ (66,749) $ (66,749) $ (34,283)Reinsurance premiums ceded . . . . . . . . . . . 13,355 7,953 91,746 66,749 66,749 34,283
Net premiums written . . . . . . . . . . . . . . . . — — — — — —Change in unearned premiums . . . . . . . . . . — — — — — —
Net premiums earned . . . . . . . . . . . . . . . . . — — — — — —Losses and loss expenses . . . . . . . . . . . . . . — — — — — —Policy acquisition costs . . . . . . . . . . . . . . . (1,502) (1,800) (11,469) (4,399) (4,399) (309)General and administrative expenses . . . . . . 11,518 9,684 49,630 23,506 23,506 17,898Share compensation expenses . . . . . . . . . . . 3,795 4,232 14,807 12,290 12,290 15,566
Total underwriting deductions . . . . . . . . . . . 13,811 12,116 52,968 31,397 31,397 33,155
Underwriting (loss)(b) . . . . . . . . . . . . . . . . (13,811) (12,116) (52,968) (31,397) (31,397) (33,155)
Total underwriting income(b) . . . . . . . . . . . $139,681 $153,596 $ 242,437 $ 450,249 $ 622,307 $ 98,368
(a) The results of operations for IPC are consolidated only from the September 2009 date of acquisition.
(b) Non-GAAP Financial Measures. In presenting the Company’s results, management has included and discussedunderwriting income that is not calculated under standards or rules that comprise U.S. GAAP. Such measuresare referred to as non-GAAP. Non-GAAP measures may be defined or calculated differently by othercompanies. These measures should not be viewed as a substitute for those determined in accordance withU.S. GAAP. A reconciliation of this measure to net income, the most comparable U.S. GAAP financialmeasure, is presented in the section below entitled “Underwriting Income.”
(c) Pro Forma combined Validus Holdings, Ltd. and IPC Holdings Ltd. income statement for the year endedDecember 31, 2009.
83

Year Ended December 31, 2010 compared to year ended December 31, 2009
Net income for the year ended December 31, 2010 was $402.6 million compared to net income of$897.4 million for the year ended December 31, 2009, a decrease of $494.8 million. The primary factors drivingthe decrease in net income were:
• Decrease in the gain on bargain purchase, net of expenses of $287.1 million relating to the IPC Acquisition;
• Decrease in underwriting income of $207.8 million due primarily to increased notable loss events. For theyear ended December 31, 2010, the Company incurred a $463.8 million increase in losses and loss expensesover the year ended December 31, 2009. This was partially offset by a $311.5 million increase in netpremiums earned primarily relating to the IPC Acquisition;
• Decrease in unrealized gains on investments of $38.8 million; and
• Increase in finance expenses of $11.7 million.
The items above were partially offset by the following factor:
• Increase in net investment income and net realized gains on investments of $15.3 million and $44.0 million,respectively.
The change in net income for the year ended December 31, 2010 of $494.8 million is described in the following table:
Validus Re Talbot
Corporate andOther Reconciling
Items Total
Year Ended December 31, 2010(Decrease) Increase Over the Year Ended December 31, 2009(a)
(Dollars in thousands)
Notable losses — net losses and loss expenses(b) . . . $(402,320) $(101,631) $ — $(503,951)
Notable losses — net reinstatement premiums(b) . . . 28,722 (9,037) — 19,685
Other underwriting income (loss) . . . . . . . . . . . . . . 201,664 96,361 (21,571) 276,454
Underwriting income(c) . . . . . . . . . . . . . . . . . . . . . (171,934) (14,307) (21,571) (207,812)
Net investment income . . . . . . . . . . . . . . . . . . . . . . 18,995 (827) (2,838) 15,330
Other income . . . . . . . . . . . . . . . . . . . . . . . . . . . . . (938) 7,577 (6,054) 585
Finance expenses . . . . . . . . . . . . . . . . . . . . . . . . . . (3,697) 11,585 (19,628) (11,740)
(157,574) 4,028 (50,091) (203,637)
Taxes . . . . . . . . . . . . . . . . . . . . . . . . . . . . . . . . . . . (12) (6,652) (221) (6,885)
(157,586) (2,624) (50,312) (210,522)
Gain on bargain purchase, net of expenses. . . . . . . . — — (287,099) (287,099)
Realized gain on repurchase of debentures. . . . . . . . — — (4,444) (4,444)
Net realized gains on investments . . . . . . . . . . . . . . 29,065 14,976 — 44,041
Net unrealized (losses) gains on investments . . . . . . (29,933) (8,911) — (38,844)
Foreign exchange gains (losses) . . . . . . . . . . . . . . . 221 1,415 389 2,025
Net income . . . . . . . . . . . . . . . . . . . . . . . . . . . . . . $(158,233) $ 4,856 $(341,466) $(494,843)
(a) The results of operations for IPC are consolidated only from the September 2009 date of acquisition.
(b) Notable losses for the year ended December 31, 2010 include: the Chilean earthquake, Melbourne hailstorm,windstorm Xynthia, Deepwater Horizon, Aban Pearl, Bangkok riots, Perth hailstorm, New Zealand earthquake,Oklahoma windstorm, two Political risk losses, Hurricane Karl, Queensland floods, a Political violence loss, aSatellite failure and a Financial institutions loss. Excludes reserve for potential development on 2010 notableloss events.
84
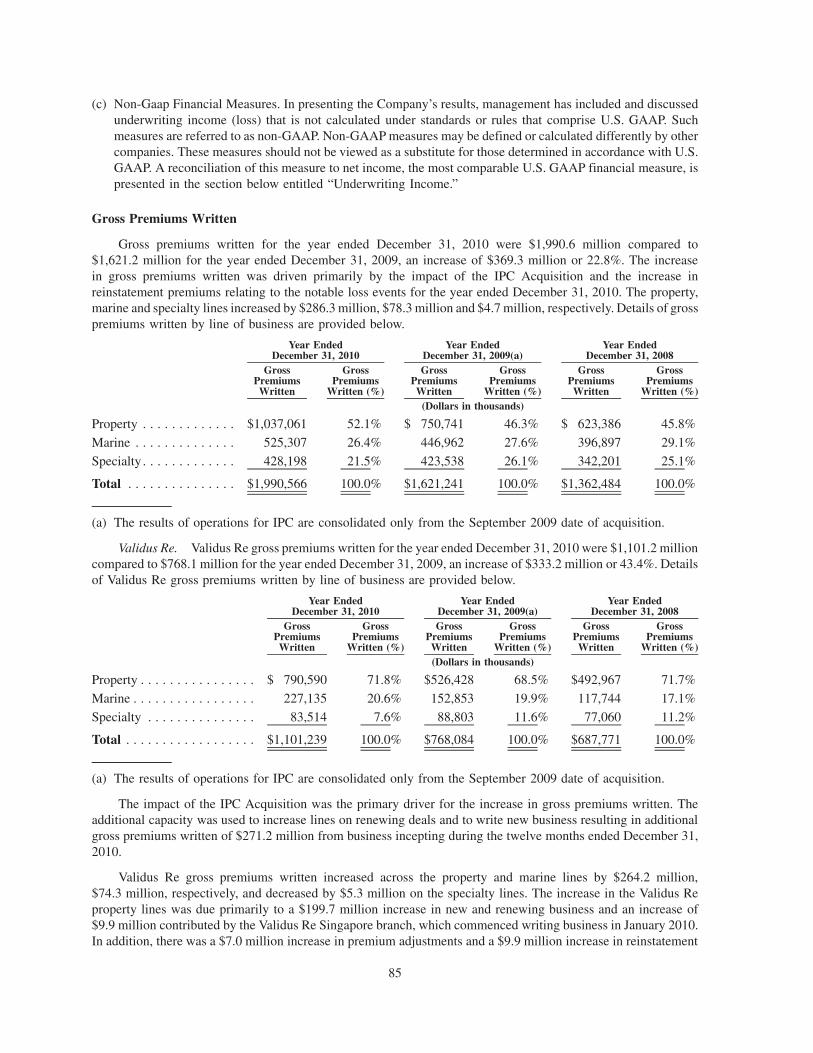
(c) Non-Gaap Financial Measures. In presenting the Company’s results, management has included and discussedunderwriting income (loss) that is not calculated under standards or rules that comprise U.S. GAAP. Suchmeasures are referred to as non-GAAP. Non-GAAP measures may be defined or calculated differently by othercompanies. These measures should not be viewed as a substitute for those determined in accordance with U.S.GAAP. A reconciliation of this measure to net income, the most comparable U.S. GAAP financial measure, ispresented in the section below entitled “Underwriting Income.”
Gross Premiums Written
Gross premiums written for the year ended December 31, 2010 were $1,990.6 million compared to$1,621.2 million for the year ended December 31, 2009, an increase of $369.3 million or 22.8%. The increasein gross premiums written was driven primarily by the impact of the IPC Acquisition and the increase inreinstatement premiums relating to the notable loss events for the year ended December 31, 2010. The property,marine and specialty lines increased by $286.3 million, $78.3 million and $4.7 million, respectively. Details of grosspremiums written by line of business are provided below.
GrossPremiumsWritten
GrossPremiums
Written (%)
GrossPremiumsWritten
GrossPremiums
Written (%)
GrossPremiumsWritten
GrossPremiums
Written (%)
Year EndedDecember 31, 2010
Year EndedDecember 31, 2009(a)
Year EndedDecember 31, 2008
(Dollars in thousands)
Property . . . . . . . . . . . . . $1,037,061 52.1% $ 750,741 46.3% $ 623,386 45.8%
Marine . . . . . . . . . . . . . . 525,307 26.4% 446,962 27.6% 396,897 29.1%
Specialty . . . . . . . . . . . . . 428,198 21.5% 423,538 26.1% 342,201 25.1%
Total . . . . . . . . . . . . . . . $1,990,566 100.0% $1,621,241 100.0% $1,362,484 100.0%
(a) The results of operations for IPC are consolidated only from the September 2009 date of acquisition.
Validus Re. Validus Re gross premiums written for the year ended December 31, 2010 were $1,101.2 millioncompared to $768.1 million for the year ended December 31, 2009, an increase of $333.2 million or 43.4%. Detailsof Validus Re gross premiums written by line of business are provided below.
GrossPremiumsWritten
GrossPremiums
Written (%)
GrossPremiumsWritten
GrossPremiums
Written (%)
GrossPremiumsWritten
GrossPremiums
Written (%)
Year EndedDecember 31, 2010
Year EndedDecember 31, 2009(a)
Year EndedDecember 31, 2008
(Dollars in thousands)
Property . . . . . . . . . . . . . . . . $ 790,590 71.8% $526,428 68.5% $492,967 71.7%
Marine . . . . . . . . . . . . . . . . . 227,135 20.6% 152,853 19.9% 117,744 17.1%
Specialty . . . . . . . . . . . . . . . 83,514 7.6% 88,803 11.6% 77,060 11.2%
Total . . . . . . . . . . . . . . . . . . $1,101,239 100.0% $768,084 100.0% $687,771 100.0%
(a) The results of operations for IPC are consolidated only from the September 2009 date of acquisition.
The impact of the IPC Acquisition was the primary driver for the increase in gross premiums written. Theadditional capacity was used to increase lines on renewing deals and to write new business resulting in additionalgross premiums written of $271.2 million from business incepting during the twelve months ended December 31,2010.
Validus Re gross premiums written increased across the property and marine lines by $264.2 million,$74.3 million, respectively, and decreased by $5.3 million on the specialty lines. The increase in the Validus Reproperty lines was due primarily to a $199.7 million increase in new and renewing business and an increase of$9.9 million contributed by the Validus Re Singapore branch, which commenced writing business in January 2010.In addition, there was a $7.0 million increase in premium adjustments and a $9.9 million increase in reinstatement
85

premiums relating to the notable loss events for the year ended December 31, 2010 as compared to year endedDecember 31, 2009. The increase in gross premiums written in the Validus Re marine lines was due primarily to a$68.8 million increase in new and renewing business, as described above. In addition, there was a $13.9 millionincrease in reinstatement premiums relating to the notable loss events, offset by a $12.3 million reduction inpremium adjustments for the year ended December 31, 2010. The decrease in gross premiums written in the ValidusRe specialty lines was due primarily to a $6.1 million decrease in premium adjustments, partially offset by a$2.1 million increase in new and renewing business.
Gross premiums written under the quota share, surplus treaty and excess of loss contracts with Talbot increasedby $23.0 million and $3.6 million in the property and marine lines respectively and decreased by $1.7 million in thespecialty lines, for the year ended December 31, 2010. These reinsurance agreements with Talbot are eliminatedupon consolidation.
Talbot. Talbot gross premiums written for the year ended December 31, 2010 were $981.1 million comparedto $919.9 million for the year ended December 31, 2009, an increase of $61.2 million or 6.6%. The $981.1 millionof gross premiums written translated at fourth quarter 2009 rates of exchange would have been $980.8 million forthe year ended December 31, 2010, a decrease of $0.3 million. Details of Talbot gross premiums written by line ofbusiness are provided below.
GrossPremiumsWritten
GrossPremiums
Written (%)
GrossPremiumsWritten
GrossPremiums
Written (%)
GrossPremiumsWritten
GrossPremiums
Written (%)
Year EndedDecember 31, 2010
Year EndedDecember 31, 2009
Year EndedDecember 31, 2008
(Dollars in thousands)
Property . . . . . . . . . . . . . . . . . $314,769 32.1% $269,583 29.3% $152,143 21.5%
Marine . . . . . . . . . . . . . . . . . . 315,102 32.1% 307,385 33.4% 287,696 40.5%
Specialty . . . . . . . . . . . . . . . . . 351,202 35.8% 342,938 37.3% 269,157 38.0%
Total . . . . . . . . . . . . . . . . . . . $981,073 100.0% $919,906 100.0% $708,996 100.0%
Talbot gross premiums written increased across the property, marine and specialty lines by $45.2 million,$7.7 million and $8.3 million, respectively. The increase in the Talbot property line was due primarily to theaddition of the onshore energy team which commenced writing business in the first quarter of 2009, and contributeda $26.2 million increase in premiums written over the year ended December 31, 2009. New business on the propertytreaty lines contributed $16.0 million and an increase in premiums written in the construction lines contributed$6.2 million. In addition, there was a $6.2 million increase in reinstatement premiums on 2010 notable losses. Thiswas offset by an $11.0 million decrease in the direct property lines. The increase in the Talbot marine lines of$7.7 million was due primarily to a $10.2 million increase in the treaty lines, $8.6 million increase in the cargo lines,offset by a $6.9 million decrease in energy lines. The increase in the Talbot specialty lines of $8.3 million was dueprimarily to a $14.3 million increase in gross premiums written by the new aviation team, offset by a $6.0 milliondecrease in other specialty lines.
Reinsurance Premiums Ceded
Reinsurance premiums ceded for the year ended December 31, 2010 were $229.5 million compared to$232.9 million for the year ended December 31, 2009, a decrease of $3.4 million, or 1.5%. Reinsurance premiumsceded on the property lines decreased by $26.6 million and increased by $7.6 million and $15.6 million, on the
86

marine and specialty lines, respectively. Details of reinsurance premiums ceded by line of business are providedbelow.
ReinsurancePremiums
Ceded
ReinsurancePremiumsCeded (%)
ReinsurancePremiums
Ceded
ReinsurancePremiumsCeded (%)
ReinsurancePremiums
Ceded
ReinsurancePremiumsCeded (%)
Year EndedDecember 31, 2010
Year EndedDecember 31, 2009(a)
Year EndedDecember 31, 2008
(Dollars in thousands)
Property . . . . . . . . . . . . . . . $123,383 53.7% $149,979 64.4% $ 46,360 37.4%
Marine . . . . . . . . . . . . . . . . 38,701 16.9% 31,140 13.4% 39,406 31.7%
Specialty . . . . . . . . . . . . . . 67,398 29.4% 51,764 22.2% 38,394 30.9%
Total . . . . . . . . . . . . . . . . . $229,482 100.0% $232,883 100.0% $124,160 100.0%
(a) The results of operations for IPC are consolidated only from the September 2009 date of acquisition.
Validus Re. Validus Re reinsurance premiums ceded for the year ended December 31, 2010 were $63.1 mil-lion compared to $95.4 million for the year ended December 31, 2009, a decrease of $32.3 million, or 33.8%.Details of Validus Re reinsurance premiums ceded by line of business are provided below.
ReinsurancePremiums
Ceded
ReinsurancePremiumsCeded (%)
ReinsurancePremiums
Ceded
ReinsurancePremiumsCeded (%)
ReinsurancePremiums
Ceded
ReinsurancePremiumsCeded (%)
Year EndedDecember 31, 2010
Year EndedDecember 31, 2009(a)
Year EndedDecember 31, 2008
(Dollars in thousands)
Property . . . . . . . . . . . . . . . $45,536 72.2% $80,475 84.3% $34,712 55.2%
Marine . . . . . . . . . . . . . . . . 17,643 27.9% 13,120 13.7% 27,652 43.9%
Specialty . . . . . . . . . . . . . . (32) (0.1)% 1,851 2.0% 569 0.9%
Total . . . . . . . . . . . . . . . . . $63,147 100.0% $95,446 100.0% $62,933 100.0%
(a) The results of operations for IPC are consolidated only from the September 2009 date of acquisition.
Reinsurance premiums ceded in the Validus Re property line decreased by $34.9 million for the year endedDecember 31, 2010, primarily due to the purchase of $34.0 million in catastrophe retrocessional coverage in thethird quarter of 2009 for IPC’s U.S. property exposures which was not renewed in 2010. Reinsurance premiumsceded on the Validus Re marine lines increased by $4.5 million due primarily to the purchase of additional industryloss warranties following notable loss events in the year and reinstatement premiums.
Talbot. Talbot reinsurance premiums ceded for the year ended December 31, 2010 were $258.1 millioncompared to $204.2 million for the year ended December 31, 2009, an increase of $53.9 million or 26.4%. Details ofTalbot reinsurance premiums ceded by line of business are provided below.
ReinsurancePremiums
Ceded
ReinsurancePremiumsCeded (%)
ReinsurancePremiums
Ceded
ReinsurancePremiumsCeded (%)
ReinsurancePremiums
Ceded
ReinsurancePremiumsCeded (%)
Year EndedDecember 31, 2010
Year EndedDecember 31, 2009(a)
Year EndedDecember 31, 2008
(Dollars in thousands)
Property . . . . . . . . . . . . . . . $146,145 56.6% $114,774 56.2% $33,372 34.9%
Marine . . . . . . . . . . . . . . . . 37,988 14.7% 31,296 15.3% 20,297 21.3%
Specialty . . . . . . . . . . . . . . 73,948 28.7% 58,116 28.5% 41,841 43.8%
Total . . . . . . . . . . . . . . . . . $258,081 100.0% $204,186 100.0% $95,510 100.0%
Reinsurance premiums ceded in the Talbot property lines increased by $31.4 million for the year endedDecember 31, 2010. The increase was primarily due to a $8.4 million increase in premiums ceded in the onshoreenergy lines, a $17.3 million increase in premiums ceded under the property quota share and surplus lines treaty of
87

which $6.2 million related to reinstatement premiums following the Chilean earthquake and Deepwater Horizon.Reinsurance premiums ceded in the Talbot marine lines increased by $6.7 million for the year ended December 31,2010 primarily due to $5.1 million in additional quota share cessions over the year ended December 31, 2009.Reinsurance premiums ceded in the Talbot specialty lines increased by $15.8 million for the year endedDecember 31, 2010 primarily due to an increase in excess of loss cessions relating to the aviation, political riskand financial institutions lines.
Talbot reinsurance premiums ceded under the quota share, surplus treaty and excess of loss contracts withValidus Re for the year ended December 31, 2010 increased by $25.0 million as compared to the year endedDecember 31, 2009. The increase was primarily due to increased business written in the onshore energy lines.Reinsurance premiums ceded in the property and marine lines under the quota share, surplus treaty and excess ofloss contracts with Validus Re increased by $23.0 million and $3.6 million, respectively, compared to the year endedDecember 31, 2009. These reinsurance contracts are eliminated upon consolidation.
Net Premiums Written
Net premiums written for the year ended December 31, 2010 were $1,761.1 million compared to $1,388.4 mil-lion for the year ended December 31, 2009, an increase of $372.7 million, or 26.8%. The ratios of net premiumswritten to gross premiums written for the year ended December 31, 2010 and 2009 were 88.5% and 85.6%,respectively. Details of net premiums written by line of business are provided below.
Net PremiumsWritten
Net PremiumsWritten (%)
Net PremiumsWritten
Net PremiumsWritten (%)
Net PremiumsWritten
Net PremiumsWritten (%)
Year EndedDecember 31, 2010
Year EndedDecember 31, 2009(a)
Year EndedDecember 31, 2008
(Dollars in thousands)
Property . . . . . . . $ 913,678 51.9% $ 600,762 43.2% $ 577,026 46.6%
Marine . . . . . . . . 486,606 27.6% 415,822 30.0% 357,491 28.9%
Specialty . . . . . . 360,800 20.5% 371,774 26.8% 303,807 24.5%
Total . . . . . . . . . $1,761,084 100.0% $1,388,358 100.0% $1,238,324 100.0%
(a) The results of operations for IPC are consolidated only from the September 2009 date of acquisition.
Validus Re. Validus Re net premiums written for the year ended December 31, 2010 were $1,038.1 millioncompared to $672.6 million for the year ended December 31, 2009, an increase of $365.5 million or 54.3%. Detailsof Validus Re net premiums written by line of business are provided below.
Net PremiumsWritten
Net PremiumsWritten (%)
Net PremiumsWritten
Net PremiumsWritten (%)
Net PremiumsWritten
Net PremiumsWritten (%)
Year EndedDecember 31, 2010
Year EndedDecember 31, 2009(a)
Year EndedDecember 31, 2008
(Dollars in thousands)
Property . . . . . . . $ 745,054 71.8% $445,953 66.3% $458,255 73.4%
Marine . . . . . . . . 209,492 20.2% 139,733 20.8% 90,092 14.4%
Specialty . . . . . . 83,546 8.0% 86,952 12.9% 76,491 12.2%
Total . . . . . . . . . $1,038,092 100.0% $672,638 100.0% $624,838 100.0%
(a) The results of operations for IPC are consolidated only from the September 2009 date of acquisition.
The increase in Validus Re net premiums written was primarily driven by the impact of the IPC Acquisitionhighlighted above in respect of gross premiums written and reinsurance premiums ceded. The ratios of netpremiums written to gross premiums written were 94.3% and 87.6% for the year ended December 31, 2010 and2009, respectively. The increase in the ratio of net premiums written to gross premiums written reflects the specificdecrease in reinsurance premiums ceded relating to the third quarter 2009 purchase of the $34.0 million retro-cessional coverage following the IPC Acquisition.
88
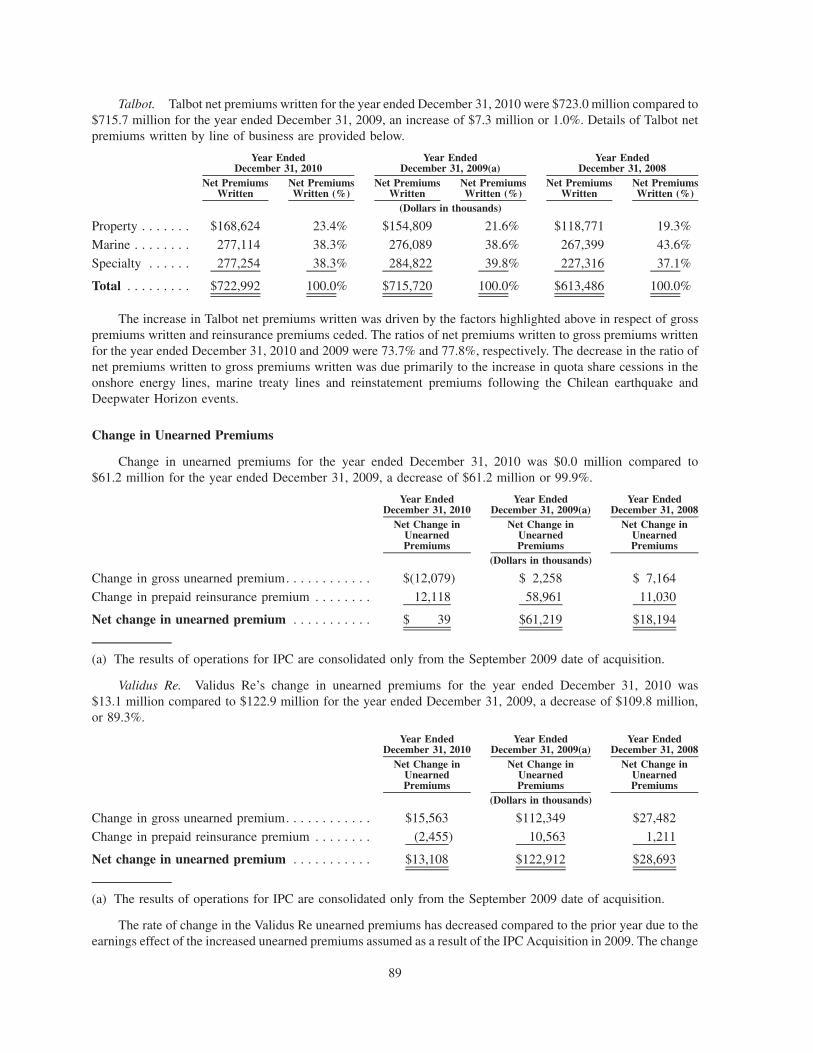
Talbot. Talbot net premiums written for the year ended December 31, 2010 were $723.0 million compared to$715.7 million for the year ended December 31, 2009, an increase of $7.3 million or 1.0%. Details of Talbot netpremiums written by line of business are provided below.
Net PremiumsWritten
Net PremiumsWritten (%)
Net PremiumsWritten
Net PremiumsWritten (%)
Net PremiumsWritten
Net PremiumsWritten (%)
Year EndedDecember 31, 2010
Year EndedDecember 31, 2009(a)
Year EndedDecember 31, 2008
(Dollars in thousands)
Property . . . . . . . $168,624 23.4% $154,809 21.6% $118,771 19.3%
Marine . . . . . . . . 277,114 38.3% 276,089 38.6% 267,399 43.6%
Specialty . . . . . . 277,254 38.3% 284,822 39.8% 227,316 37.1%
Total . . . . . . . . . $722,992 100.0% $715,720 100.0% $613,486 100.0%
The increase in Talbot net premiums written was driven by the factors highlighted above in respect of grosspremiums written and reinsurance premiums ceded. The ratios of net premiums written to gross premiums writtenfor the year ended December 31, 2010 and 2009 were 73.7% and 77.8%, respectively. The decrease in the ratio ofnet premiums written to gross premiums written was due primarily to the increase in quota share cessions in theonshore energy lines, marine treaty lines and reinstatement premiums following the Chilean earthquake andDeepwater Horizon events.
Change in Unearned Premiums
Change in unearned premiums for the year ended December 31, 2010 was $0.0 million compared to$61.2 million for the year ended December 31, 2009, a decrease of $61.2 million or 99.9%.
Net Change inUnearnedPremiums
Net Change inUnearnedPremiums
Net Change inUnearnedPremiums
Year EndedDecember 31, 2010
Year EndedDecember 31, 2009(a)
Year EndedDecember 31, 2008
(Dollars in thousands)
Change in gross unearned premium. . . . . . . . . . . . $(12,079) $ 2,258 $ 7,164
Change in prepaid reinsurance premium . . . . . . . . 12,118 58,961 11,030
Net change in unearned premium . . . . . . . . . . . $ 39 $61,219 $18,194
(a) The results of operations for IPC are consolidated only from the September 2009 date of acquisition.
Validus Re. Validus Re’s change in unearned premiums for the year ended December 31, 2010 was$13.1 million compared to $122.9 million for the year ended December 31, 2009, a decrease of $109.8 million,or 89.3%.
Net Change inUnearnedPremiums
Net Change inUnearnedPremiums
Net Change inUnearnedPremiums
Year EndedDecember 31, 2010
Year EndedDecember 31, 2009(a)
Year EndedDecember 31, 2008
(Dollars in thousands)
Change in gross unearned premium. . . . . . . . . . . . $15,563 $112,349 $27,482
Change in prepaid reinsurance premium . . . . . . . . (2,455) 10,563 1,211
Net change in unearned premium . . . . . . . . . . . $13,108 $122,912 $28,693
(a) The results of operations for IPC are consolidated only from the September 2009 date of acquisition.
The rate of change in the Validus Re unearned premiums has decreased compared to the prior year due to theearnings effect of the increased unearned premiums assumed as a result of the IPC Acquisition in 2009. The change
89

in prepaid reinsurance is reflective of the lower level of ceded reinsurance, due to additional retrocessional coveragebeing placed in the three months ended September 30, 2009 as a result of the IPC Acquisition.
Talbot. The Talbot change in unearned premiums for the year ended December 31, 2010 was ($13.1) millioncompared to ($61.7) million for the year ended December 31, 2009, an increase of $48.6 million, or 78.8%.
Net Change inUnearnedPremiums
Net Change inUnearnedPremiums
Net Change inUnearnedPremiums
Year EndedDecember 31, 2010
Year EndedDecember 31, 2009
Year EndedDecember 31, 2008
(Dollars in thousands)
Change in gross unearned premium . . . . . . . . . . . . . $(27,642) $(110,091) (20,318)
Change in prepaid reinsurance premium . . . . . . . . . . 14,573 48,398 9,819
Net change in unearned premium . . . . . . . . . . . . . $(13,069) $ (61,693) (10,499)
Talbot’s change in gross unearned premiums and prepaid reinsurance reflects the decrease in the growth rate ofgross premiums written and reinsurance premium ceded.
Net Premiums Earned
Net premiums earned for the year ended December 31, 2010 were $1,761.1 million compared to $1,449.6 mil-lion for the year ended December 31, 2009, an increase of $311.5 million or 21.5%. The increase in net premiumsearned was driven by increased premiums earned in the Validus Re segment of $255.7 million and increasedpremiums earned in the Talbot segment of $55.9 million. Details of net premiums earned by line of business areprovided below.
Net PremiumsEarned
Net PremiumsEarned (%)
Net PremiumsEarned
Net PremiumsEarned (%)
Net PremiumsEarned
Net PremiumsEarned (%)
Year EndedDecember 31, 2010
Year EndedDecember 31, 2009(a)
Year EndedDecember 31, 2008
(Dollars in thousands)
Property . . . . . . . $ 923,370 52.4% $ 712,662 49.2% $ 598,407 47.7%
Marine . . . . . . . . 445,426 25.3% 397,061 27.4% 367,449 29.2%
Specialty . . . . . . 392,327 22.3% 339,854 23.4% 290,662 23.1%
Total . . . . . . . . . $1,761,123 100.0% $1,449,577 100.0% $1,256,518 100.0%
(a) The results of operations for IPC are consolidated only from the September 2009 date of acquisition.
Validus Re. Validus Re net premiums earned for the year ended December 31, 2010 were $1,051.2 millioncompared to $795.6 million for the year ended December 31, 2009, an increase of $255.7 million or 32.1%. Theincrease in Validus Re net premiums earned was primarily due to the IPC Acquisition. Details of Validus Re netpremiums earned by line of business are provided below.
Net PremiumsEarned
Net PremiumsEarned (%)
Net PremiumsEarned
Net PremiumsEarned (%)
Net PremiumsEarned
Net PremiumsEarned (%)
Year EndedDecember 31, 2010
Year EndedDecember 31, 2009(a)
Year EndedDecember 31, 2008
(Dollars in thousands)
Property . . . . . . . $ 765,665 72.8% $578,452 72.7% $478,523 73.2%
Marine . . . . . . . . 176,601 16.8% 123,273 15.5% 104,479 16.0%
Specialty . . . . . . 108,934 10.4% 93,825 11.8% 70,529 10.8%
Total . . . . . . . . . $1,051,200 100.0% $795,550 100.0% $653,531 100.0%
(a) The results of operations for IPC are consolidated only from the September 2009 date of acquisition.
90
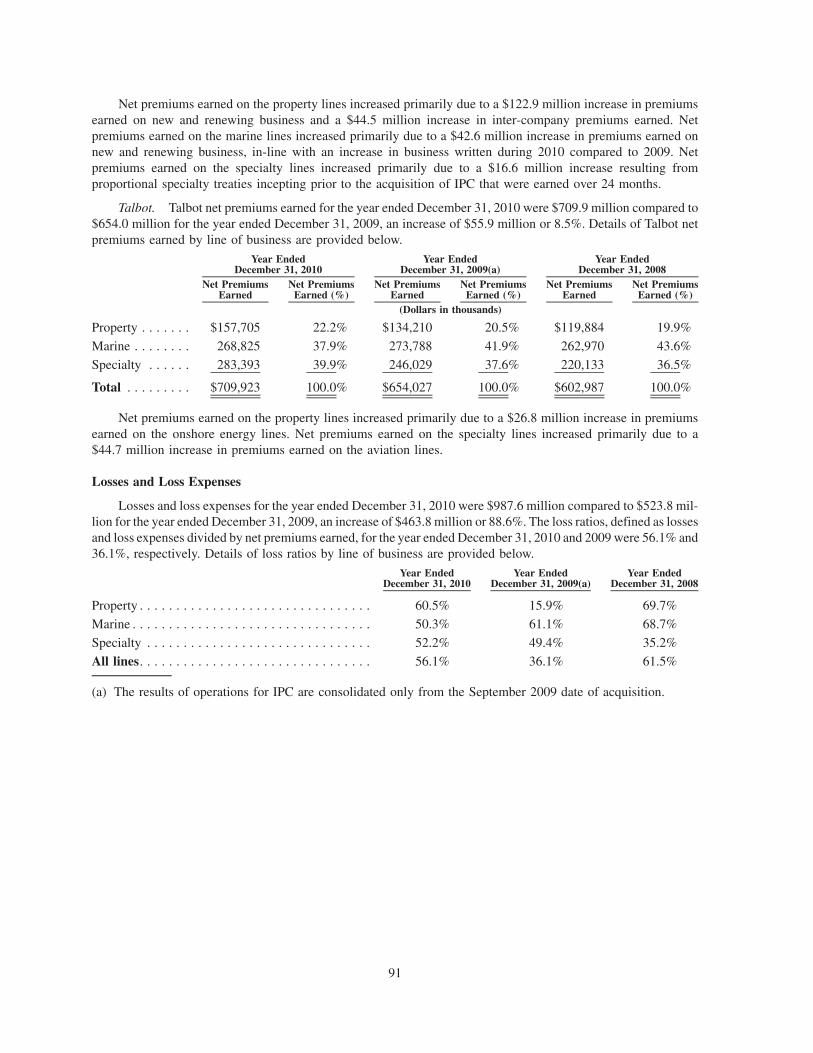
Net premiums earned on the property lines increased primarily due to a $122.9 million increase in premiumsearned on new and renewing business and a $44.5 million increase in inter-company premiums earned. Netpremiums earned on the marine lines increased primarily due to a $42.6 million increase in premiums earned onnew and renewing business, in-line with an increase in business written during 2010 compared to 2009. Netpremiums earned on the specialty lines increased primarily due to a $16.6 million increase resulting fromproportional specialty treaties incepting prior to the acquisition of IPC that were earned over 24 months.
Talbot. Talbot net premiums earned for the year ended December 31, 2010 were $709.9 million compared to$654.0 million for the year ended December 31, 2009, an increase of $55.9 million or 8.5%. Details of Talbot netpremiums earned by line of business are provided below.
Net PremiumsEarned
Net PremiumsEarned (%)
Net PremiumsEarned
Net PremiumsEarned (%)
Net PremiumsEarned
Net PremiumsEarned (%)
Year EndedDecember 31, 2010
Year EndedDecember 31, 2009(a)
Year EndedDecember 31, 2008
(Dollars in thousands)
Property . . . . . . . $157,705 22.2% $134,210 20.5% $119,884 19.9%
Marine . . . . . . . . 268,825 37.9% 273,788 41.9% 262,970 43.6%
Specialty . . . . . . 283,393 39.9% 246,029 37.6% 220,133 36.5%
Total . . . . . . . . . $709,923 100.0% $654,027 100.0% $602,987 100.0%
Net premiums earned on the property lines increased primarily due to a $26.8 million increase in premiumsearned on the onshore energy lines. Net premiums earned on the specialty lines increased primarily due to a$44.7 million increase in premiums earned on the aviation lines.
Losses and Loss Expenses
Losses and loss expenses for the year ended December 31, 2010 were $987.6 million compared to $523.8 mil-lion for the year ended December 31, 2009, an increase of $463.8 million or 88.6%. The loss ratios, defined as lossesand loss expenses divided by net premiums earned, for the year ended December 31, 2010 and 2009 were 56.1% and36.1%, respectively. Details of loss ratios by line of business are provided below.
Year EndedDecember 31, 2010
Year EndedDecember 31, 2009(a)
Year EndedDecember 31, 2008
Property . . . . . . . . . . . . . . . . . . . . . . . . . . . . . . . . 60.5% 15.9% 69.7%
Marine . . . . . . . . . . . . . . . . . . . . . . . . . . . . . . . . . 50.3% 61.1% 68.7%
Specialty . . . . . . . . . . . . . . . . . . . . . . . . . . . . . . . 52.2% 49.4% 35.2%
All lines. . . . . . . . . . . . . . . . . . . . . . . . . . . . . . . . 56.1% 36.1% 61.5%
(a) The results of operations for IPC are consolidated only from the September 2009 date of acquisition.
91

At December 31, 2010 and 2009, gross and net reserves for losses and loss expenses were estimated using themethodology as outlined in the critical accounting policies and estimates as discussed in Item 7, Management’sDiscussion and Analysis of Results of Operations and Financial Condition — Critical Accounting Policies. TheCompany did not make any significant changes in the assumptions or methodology used in its reserving process forthe year ended December 31, 2010.
Gross Case Reserves Gross IBNRTotal Gross Reserve for
Losses and Loss Expenses
As at December 31, 2010
(Dollars in thousands)
Property . . . . . . . . . . . . . . . . . . . . . . . . . . . . . . . . $ 506,506 $ 397,941 $ 904,447
Marine . . . . . . . . . . . . . . . . . . . . . . . . . . . . . . . . . 317,469 322,259 639,728
Specialty . . . . . . . . . . . . . . . . . . . . . . . . . . . . . . . 211,906 279,892 491,798
Total . . . . . . . . . . . . . . . . . . . . . . . . . . . . . . . . . . $1,035,881 $1,000,092 $2,035,973
Net Case Reserves Net IBNRTotal Net Reserve for
Losses and Loss Expenses
As at December 31, 2010
(Dollars in thousands)
Property . . . . . . . . . . . . . . . . . . . . . . . . . . . . . . . . . . . $458,087 $358,895 $ 816,982
Marine . . . . . . . . . . . . . . . . . . . . . . . . . . . . . . . . . . . . 275,877 261,390 537,267
Specialty . . . . . . . . . . . . . . . . . . . . . . . . . . . . . . . . . . 165,302 233,288 398,590
Total . . . . . . . . . . . . . . . . . . . . . . . . . . . . . . . . . . . . . $899,266 $853,573 $1,752,839
The following table sets forth a reconciliation of gross and net reserves for losses and loss expenses by segmentfor the year ended December 31, 2010.
Validus Re Talbot Eliminations TotalYear Ended December 31, 2010
(Dollars in thousands)
Gross reserves at period beginning . . . . . . . . . . . . . . . $ 742,510 $ 903,986 $ (24,362) $1,622,134
Losses recoverable . . . . . . . . . . . . . . . . . . . . . . . . . . . (49,808) (156,319) 24,362 (181,765)
Net reserves at period beginning . . . . . . . . . . . . . . . . . 692,702 747,667 — 1,440,369
Incurred losses- current year . . . . . . . . . . . . . . . . . . . . 672,227 471,969 — 1,144,196
Change in prior accident years . . . . . . . . . . . . . . . . . . (70,617) (85,993) — (156,610)
Incurred losses . . . . . . . . . . . . . . . . . . . . . . . . . . . . . . 601,610 385,976 — 987,586
Foreign exchange . . . . . . . . . . . . . . . . . . . . . . . . . . . . 2,908 (4,602) — (1,694)
Paid losses . . . . . . . . . . . . . . . . . . . . . . . . . . . . . . . . . (379,274) (294,148) — (673,422)
Net reserves at period end . . . . . . . . . . . . . . . . . . . . . . 917,946 834,893 — 1,752,839
Losses recoverable . . . . . . . . . . . . . . . . . . . . . . . . . . . 80,219 356,655 (153,740) 283,134
Gross reserves at period end . . . . . . . . . . . . . . . . . . . . $ 998,165 $1,191,548 $(153,740) $2,035,973
The amount of recorded reserves represents management’s best estimate of expected losses and loss expenseson premiums earned. Favorable loss reserve development on prior years totaled $156.6 million. Of this $70.6 millionrelated to the Validus Re segment and $86.0 million related to the Talbot segment. This favorable loss reservedevelopment benefited the Company’s loss ratio by 8.9 percentage points for the year ended December 31, 2010.For the year ended December 31, 2010, the Company incurred $536.2 million of notable losses, excluding reservefor potential development on 2010 notable loss events, which represented 30.4 percentage points of the loss ratio.Net of $21.1 million in reinstatement premiums, the effect of these events on net income was $515.1 million. For theyear ended December 31, 2009, the Company incurred $32.2 million of notable losses which represented
92

2.2 percentage points of the loss ratio. The Company’s loss ratios, excluding prior year development and notableloss events for the year ended December 31, 2010 and 2009 were 34.9% and 40.9%, respectively.
Management of insurance and reinsurance companies use significant judgment in the estimation of reservesfor losses and loss expenses. Given the magnitude of recent loss events and other uncertainties inherent in lossestimation, meaningful uncertainty remains regarding the estimation of recent notable loss events. The Company’sactual ultimate net loss may vary materially from estimates. Validus Re ultimate losses for notable loss events areestimated through detailed review of contracts which are identified by the Company as potentially exposed to thespecific notable loss event. However, there can be no assurance that the ultimate loss amount estimated for a specificcontract will be accurate, or that all contracts with exposure to a specific notable loss event will be identified in atimely manner. Potential losses in excess of the estimated ultimate loss assigned to a contract on the basis of aspecific review, or loss amounts from contracts not specifically included in the detailed review are reserved for inthe reserve for potential development on notable loss events. In the first quarter of 2010, the Company incurred$19.2 million for a reserve for potential development on 2010 notable loss events, which in the second quarter of2010 was allocated to development on the Chilean Earthquake. In the second quarter of 2010, the Company made aprovision for losses and loss expenses of $20.0 million in the reserve for development on 2010 notable loss events.In the third quarter of 2010, the reserve was increased by an additional provision of $30.0 million. In the fourthquarter of 2010, no further provisions were made and the Company allocated $16.6 million of the reserve forpotential development on 2010 notable loss events to development on the New Zealand Earthquake. Therefore, as atDecember 31, 2010, the reserve for potential development on 2010 notable loss events is $33.4 million.
Validus Re. Validus Re losses and loss expenses for the year ended December 31, 2010 were $601.6 millioncompared to $186.7 million for the year ended December 31, 2009, an increase of $414.9 million or 222.2%. TheValidus Re loss ratio, defined as losses and loss expenses divided by net premiums earned, was 57.2% and 23.5% forthe year ended December 31, 2010 and 2009, respectively. For the year ended December 31, 2010, Validus Reincurred $427.8 million of notable losses, which represented 40.7 percentage points of the Validus Re segment lossratio, excluding reserve for potential development on 2010 notable loss events. For the year ended December 31,2009, Validus Re incurred $25.5 million of notable losses, which represented 3.2 percentage points of the ValidusRe segment loss ratio. Validus Re segment loss ratios, excluding prior year development and loss events identifiedabove, for the year ended December 31, 2010 and 2009 were 23.2% and 27.0%, respectively.
2010 2009(a) 2008Year Ended December 31,
Property — current year . . . . . . . . . . . . . . . . . . . . . . . . . . . . . . . . . . . . . . . . . . . . . . 63.3% 24.0% 65.8%
Property — change in prior accident years . . . . . . . . . . . . . . . . . . . . . . . . . . . . . . . . . (6.5)% (11.3)% (3.7)%
Property — loss ratio . . . . . . . . . . . . . . . . . . . . . . . . . . . . . . . . . . . . . . . . . . . . . . 56.8% 12.7% 62.1%
Marine — current year . . . . . . . . . . . . . . . . . . . . . . . . . . . . . . . . . . . . . . . . . . . . . . . 79.8% 49.1% 90.5%
Marine — change in prior accident years . . . . . . . . . . . . . . . . . . . . . . . . . . . . . . . . . . (10.0)% 15.9% 3.9%
Marine — loss ratio . . . . . . . . . . . . . . . . . . . . . . . . . . . . . . . . . . . . . . . . . . . . . . . 69.8% 65.0% 94.4%
Specialty — current year . . . . . . . . . . . . . . . . . . . . . . . . . . . . . . . . . . . . . . . . . . . . . . 42.9% 43.2% 37.1%
Specialty — change in prior accident years . . . . . . . . . . . . . . . . . . . . . . . . . . . . . . . . (2.9)% (8.0)% (2.3)%
Specialty — loss ratio . . . . . . . . . . . . . . . . . . . . . . . . . . . . . . . . . . . . . . . . . . . . . . 40.0% 35.2% 34.8%
All lines — current year . . . . . . . . . . . . . . . . . . . . . . . . . . . . . . . . . . . . . . . . . . . . . . 63.9% 30.2% 66.7%
All lines — change in prior accident years. . . . . . . . . . . . . . . . . . . . . . . . . . . . . . . . . (6.7)% (6.7)% (2.3)%
All lines — loss ratio . . . . . . . . . . . . . . . . . . . . . . . . . . . . . . . . . . . . . . . . . . . . . . 57.2% 23.5% 64.4%
(a) The results of operations for IPC are consolidated only from the September 2009 date of acquisition.
For the year ended December 31, 2010, the Validus Re property lines losses and loss expenses include$484.6 million related to current year losses and $49.8 million of favorable development relating to prior accidentyears. This favorable development is attributable to lower than expected claims development. For the year endedDecember 31, 2010, Validus Re’s property lines incurred $350.7 million of notable losses, excluding the reserve for
93
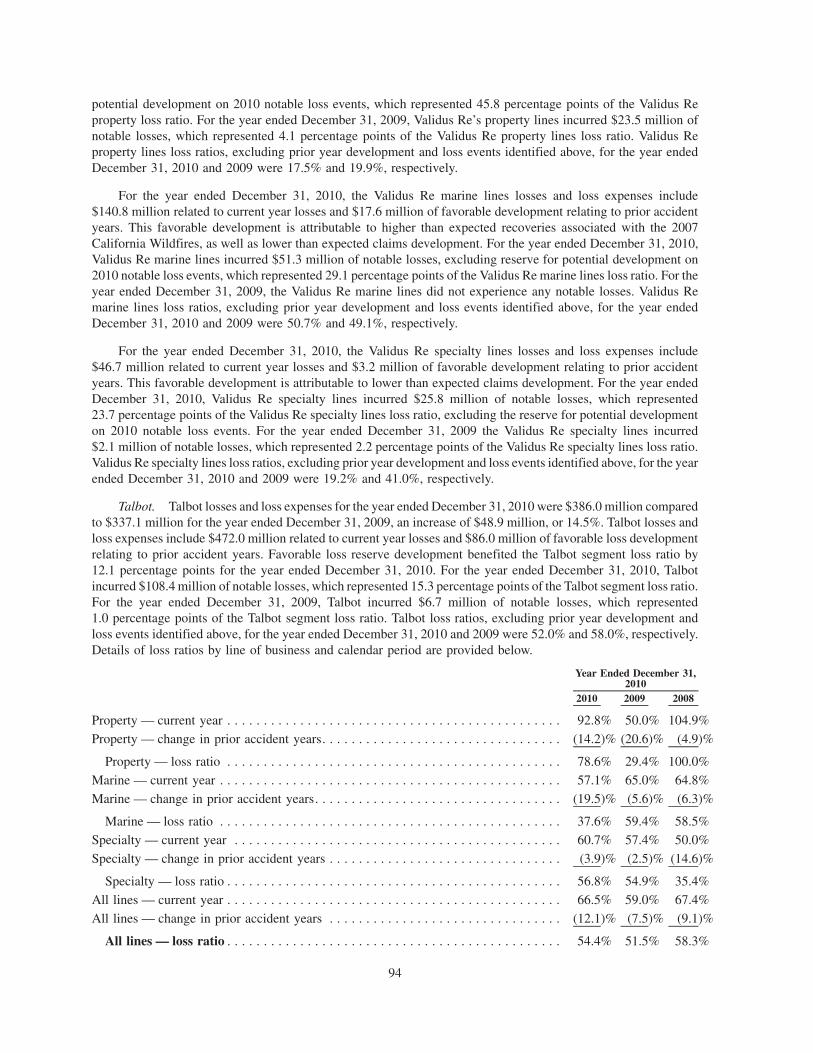
potential development on 2010 notable loss events, which represented 45.8 percentage points of the Validus Reproperty loss ratio. For the year ended December 31, 2009, Validus Re’s property lines incurred $23.5 million ofnotable losses, which represented 4.1 percentage points of the Validus Re property lines loss ratio. Validus Reproperty lines loss ratios, excluding prior year development and loss events identified above, for the year endedDecember 31, 2010 and 2009 were 17.5% and 19.9%, respectively.
For the year ended December 31, 2010, the Validus Re marine lines losses and loss expenses include$140.8 million related to current year losses and $17.6 million of favorable development relating to prior accidentyears. This favorable development is attributable to higher than expected recoveries associated with the 2007California Wildfires, as well as lower than expected claims development. For the year ended December 31, 2010,Validus Re marine lines incurred $51.3 million of notable losses, excluding reserve for potential development on2010 notable loss events, which represented 29.1 percentage points of the Validus Re marine lines loss ratio. For theyear ended December 31, 2009, the Validus Re marine lines did not experience any notable losses. Validus Remarine lines loss ratios, excluding prior year development and loss events identified above, for the year endedDecember 31, 2010 and 2009 were 50.7% and 49.1%, respectively.
For the year ended December 31, 2010, the Validus Re specialty lines losses and loss expenses include$46.7 million related to current year losses and $3.2 million of favorable development relating to prior accidentyears. This favorable development is attributable to lower than expected claims development. For the year endedDecember 31, 2010, Validus Re specialty lines incurred $25.8 million of notable losses, which represented23.7 percentage points of the Validus Re specialty lines loss ratio, excluding the reserve for potential developmenton 2010 notable loss events. For the year ended December 31, 2009 the Validus Re specialty lines incurred$2.1 million of notable losses, which represented 2.2 percentage points of the Validus Re specialty lines loss ratio.Validus Re specialty lines loss ratios, excluding prior year development and loss events identified above, for the yearended December 31, 2010 and 2009 were 19.2% and 41.0%, respectively.
Talbot. Talbot losses and loss expenses for the year ended December 31, 2010 were $386.0 million comparedto $337.1 million for the year ended December 31, 2009, an increase of $48.9 million, or 14.5%. Talbot losses andloss expenses include $472.0 million related to current year losses and $86.0 million of favorable loss developmentrelating to prior accident years. Favorable loss reserve development benefited the Talbot segment loss ratio by12.1 percentage points for the year ended December 31, 2010. For the year ended December 31, 2010, Talbotincurred $108.4 million of notable losses, which represented 15.3 percentage points of the Talbot segment loss ratio.For the year ended December 31, 2009, Talbot incurred $6.7 million of notable losses, which represented1.0 percentage points of the Talbot segment loss ratio. Talbot loss ratios, excluding prior year development andloss events identified above, for the year ended December 31, 2010 and 2009 were 52.0% and 58.0%, respectively.Details of loss ratios by line of business and calendar period are provided below.
2010 2009 2008
Year Ended December 31,2010
Property — current year . . . . . . . . . . . . . . . . . . . . . . . . . . . . . . . . . . . . . . . . . . . . . . 92.8% 50.0% 104.9%
Property — change in prior accident years. . . . . . . . . . . . . . . . . . . . . . . . . . . . . . . . . (14.2)% (20.6)% (4.9)%
Property — loss ratio . . . . . . . . . . . . . . . . . . . . . . . . . . . . . . . . . . . . . . . . . . . . . . 78.6% 29.4% 100.0%
Marine — current year . . . . . . . . . . . . . . . . . . . . . . . . . . . . . . . . . . . . . . . . . . . . . . . 57.1% 65.0% 64.8%
Marine — change in prior accident years. . . . . . . . . . . . . . . . . . . . . . . . . . . . . . . . . . (19.5)% (5.6)% (6.3)%
Marine — loss ratio . . . . . . . . . . . . . . . . . . . . . . . . . . . . . . . . . . . . . . . . . . . . . . . 37.6% 59.4% 58.5%
Specialty — current year . . . . . . . . . . . . . . . . . . . . . . . . . . . . . . . . . . . . . . . . . . . . . 60.7% 57.4% 50.0%
Specialty — change in prior accident years . . . . . . . . . . . . . . . . . . . . . . . . . . . . . . . . (3.9)% (2.5)% (14.6)%
Specialty — loss ratio . . . . . . . . . . . . . . . . . . . . . . . . . . . . . . . . . . . . . . . . . . . . . . 56.8% 54.9% 35.4%
All lines — current year . . . . . . . . . . . . . . . . . . . . . . . . . . . . . . . . . . . . . . . . . . . . . . 66.5% 59.0% 67.4%
All lines — change in prior accident years . . . . . . . . . . . . . . . . . . . . . . . . . . . . . . . . (12.1)% (7.5)% (9.1)%
All lines — loss ratio . . . . . . . . . . . . . . . . . . . . . . . . . . . . . . . . . . . . . . . . . . . . . . 54.4% 51.5% 58.3%
94

For the year ended December 31, 2010, the Talbot property lines losses and loss expenses include $146.3 mil-lion related to current year losses and $22.5 million of favorable loss development relating to prior accident years.The prior year favorable development is primarily due lower than expected claim development on the propertyfacultative and binder lines, together with favorable development on hurricanes Katrina and Ike. For the year endedDecember 31, 2010, the Talbot property lines incurred $71.4 million of notable losses, which represented45.3 percentage points of the Talbot property lines loss ratio. For the year ended December 31, 2009, the Talbotproperty lines incurred $0.3 million of notable losses, which represented 0.2 percentage points of the Talbotproperty lines loss ratio. Talbot property lines loss ratio, excluding prior year development and the loss eventsidentified above, for the year ended December 31, 2010 and 2009 were 47.5% and 49.8%, respectively.
For the year ended December 31, 2010, the Talbot marine lines losses and loss expenses include $153.4 millionrelated to current year losses and $52.4 million of favorable development relating to prior accident years. The prioryear favorable development is due to lower than expected attritional loss development across a number of lines, inparticular on the hull and energy lines. For the year ended December 31, 2010, the Talbot marine lines incurred$17.6 million of notable losses, which represented 6.6 percentage points of the Talbot marine lines loss ratio. For theyear ended December 31, 2009, the Talbot marine lines did not experience any notable loss events. Talbot marinelines loss ratios, excluding prior year development and the loss events identified above, for the year endedDecember 31, 2010 and 2009 were 50.5% and 65.0%, respectively.
For the year ended December 31, 2010, the Talbot specialty lines losses and loss expenses include $172.2 mil-lion relating to current year losses and $11.1 million of favorable development on prior accident years. The prioryear favorable development is primarily due to lower than expected claims across most of the specialty sub-classes,partially offset by one notable loss on the financial institutions lines. For the year ended December 31, 2010, Talbotincurred $19.3 million of notable losses, which represented 6.8 percentage points of the Talbot specialty lines lossratio. For the year ended December 31, 2009, the Talbot specialty lines incurred $6.4 million of notable losses,which represented 2.6 percentage points of the Talbot loss ratio. Talbot specialty lines loss ratios, excluding prioryear development and the loss events identified above, for the year ended December 31, 2010 and 2009 were 55.8%and 54.8%, respectively.
Policy Acquisition Costs
Policy acquisition costs for the year ended December 31, 2010 were $292.9 million compared to $263.0 millionfor the year ended December 31, 2009, an increase of $29.9 million or 11.4%. Policy acquisition costs as a percentof net premiums earned for the year ended December 31, 2010 and 2009 were 16.6% and 18.1%, respectively.Details of policy acquisition costs by line of business are provided below.
PolicyAcquisition
Costs
PolicyAcquisitionCosts (%)
AcquisitionCostRatio
PolicyAcquisition
Costs
PolicyAcquisitionCosts (%)
AcquisitionCostRatio
PolicyAcquisition
Costs
PolicyAcquisitionCosts (%)
AcquisitionCostRatio
Year EndedDecember 31, 2010
Year EndedDecember 31, 2009(a)
Year EndedDecember 31, 2008
(Dollars in thousands)
Property . . . $119,894 40.9% 13.0% $104,912 39.9% 14.7% $ 97,345 41.3% 16.3%
Marine . . . . 92,271 31.5% 20.7% 86,295 32.8% 21.7% 74,372 31.7% 20.2%
Specialty . . 80,734 27.6% 20.6% 71,759 27.3% 21.1% 63,234 26.9% 21.8%
Total . . . . . $292,899 100.0% 16.6% $262,966 100.0% 18.1% $234,951 100.0% 18.7%
(a) The results of operations for IPC are consolidated only from the September 2009 date of acquisition.
Validus Re. Validus Re policy acquisition costs for the year ended December 31, 2010 were $160.6 millioncompared to $127.4 million for the year ended December 31, 2009, an increase of $33.2 million or 26.0%. Details ofValidus Re policy acquisition costs by line of business are provided below.
95
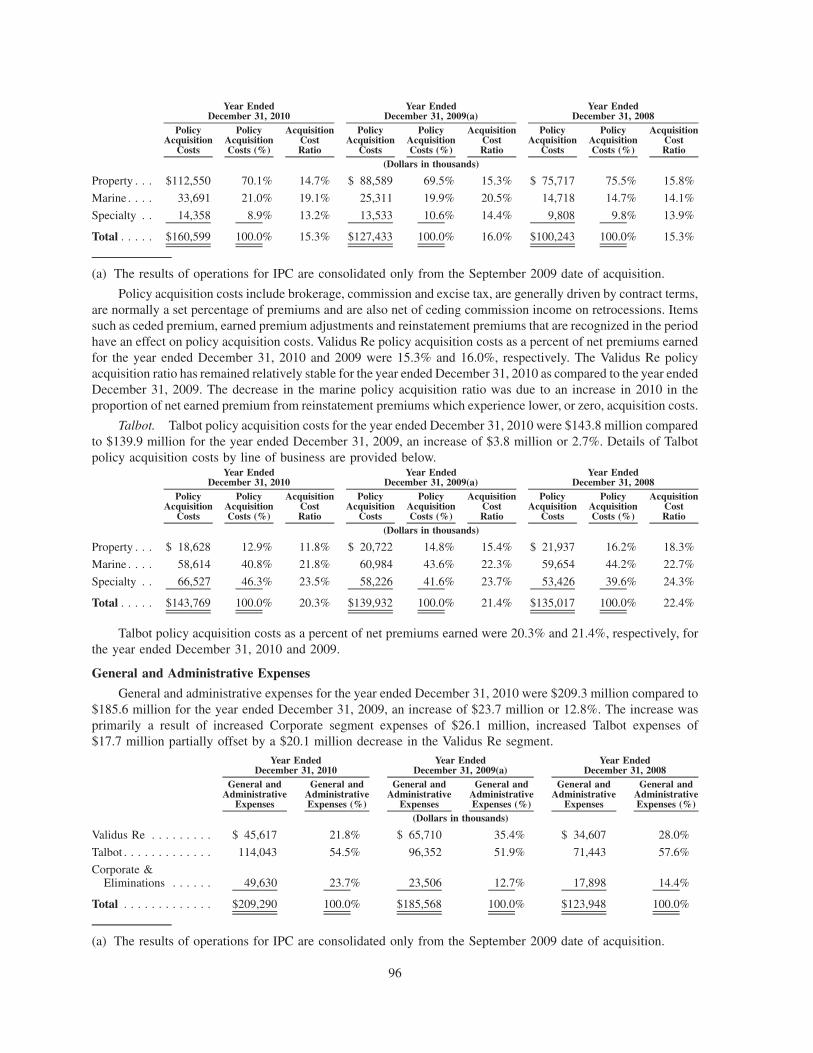
PolicyAcquisition
Costs
PolicyAcquisitionCosts (%)
AcquisitionCostRatio
PolicyAcquisition
Costs
PolicyAcquisitionCosts (%)
AcquisitionCostRatio
PolicyAcquisition
Costs
PolicyAcquisitionCosts (%)
AcquisitionCostRatio
Year EndedDecember 31, 2010
Year EndedDecember 31, 2009(a)
Year EndedDecember 31, 2008
(Dollars in thousands)
Property . . . $112,550 70.1% 14.7% $ 88,589 69.5% 15.3% $ 75,717 75.5% 15.8%
Marine . . . . 33,691 21.0% 19.1% 25,311 19.9% 20.5% 14,718 14.7% 14.1%
Specialty . . 14,358 8.9% 13.2% 13,533 10.6% 14.4% 9,808 9.8% 13.9%
Total . . . . . $160,599 100.0% 15.3% $127,433 100.0% 16.0% $100,243 100.0% 15.3%
(a) The results of operations for IPC are consolidated only from the September 2009 date of acquisition.
Policy acquisition costs include brokerage, commission and excise tax, are generally driven by contract terms,are normally a set percentage of premiums and are also net of ceding commission income on retrocessions. Itemssuch as ceded premium, earned premium adjustments and reinstatement premiums that are recognized in the periodhave an effect on policy acquisition costs. Validus Re policy acquisition costs as a percent of net premiums earnedfor the year ended December 31, 2010 and 2009 were 15.3% and 16.0%, respectively. The Validus Re policyacquisition ratio has remained relatively stable for the year ended December 31, 2010 as compared to the year endedDecember 31, 2009. The decrease in the marine policy acquisition ratio was due to an increase in 2010 in theproportion of net earned premium from reinstatement premiums which experience lower, or zero, acquisition costs.
Talbot. Talbot policy acquisition costs for the year ended December 31, 2010 were $143.8 million comparedto $139.9 million for the year ended December 31, 2009, an increase of $3.8 million or 2.7%. Details of Talbotpolicy acquisition costs by line of business are provided below.
PolicyAcquisition
Costs
PolicyAcquisitionCosts (%)
AcquisitionCostRatio
PolicyAcquisition
Costs
PolicyAcquisitionCosts (%)
AcquisitionCostRatio
PolicyAcquisition
Costs
PolicyAcquisitionCosts (%)
AcquisitionCostRatio
Year EndedDecember 31, 2010
Year EndedDecember 31, 2009(a)
Year EndedDecember 31, 2008
(Dollars in thousands)
Property . . . $ 18,628 12.9% 11.8% $ 20,722 14.8% 15.4% $ 21,937 16.2% 18.3%
Marine . . . . 58,614 40.8% 21.8% 60,984 43.6% 22.3% 59,654 44.2% 22.7%
Specialty . . 66,527 46.3% 23.5% 58,226 41.6% 23.7% 53,426 39.6% 24.3%
Total . . . . . $143,769 100.0% 20.3% $139,932 100.0% 21.4% $135,017 100.0% 22.4%
Talbot policy acquisition costs as a percent of net premiums earned were 20.3% and 21.4%, respectively, forthe year ended December 31, 2010 and 2009.
General and Administrative Expenses
General and administrative expenses for the year ended December 31, 2010 were $209.3 million compared to$185.6 million for the year ended December 31, 2009, an increase of $23.7 million or 12.8%. The increase wasprimarily a result of increased Corporate segment expenses of $26.1 million, increased Talbot expenses of$17.7 million partially offset by a $20.1 million decrease in the Validus Re segment.
General andAdministrative
Expenses
General andAdministrativeExpenses (%)
General andAdministrative
Expenses
General andAdministrativeExpenses (%)
General andAdministrative
Expenses
General andAdministrativeExpenses (%)
Year EndedDecember 31, 2010
Year EndedDecember 31, 2009(a)
Year EndedDecember 31, 2008
(Dollars in thousands)
Validus Re . . . . . . . . . $ 45,617 21.8% $ 65,710 35.4% $ 34,607 28.0%
Talbot . . . . . . . . . . . . . 114,043 54.5% 96,352 51.9% 71,443 57.6%
Corporate &Eliminations . . . . . . 49,630 23.7% 23,506 12.7% 17,898 14.4%
Total . . . . . . . . . . . . . $209,290 100.0% $185,568 100.0% $123,948 100.0%
(a) The results of operations for IPC are consolidated only from the September 2009 date of acquisition.
96
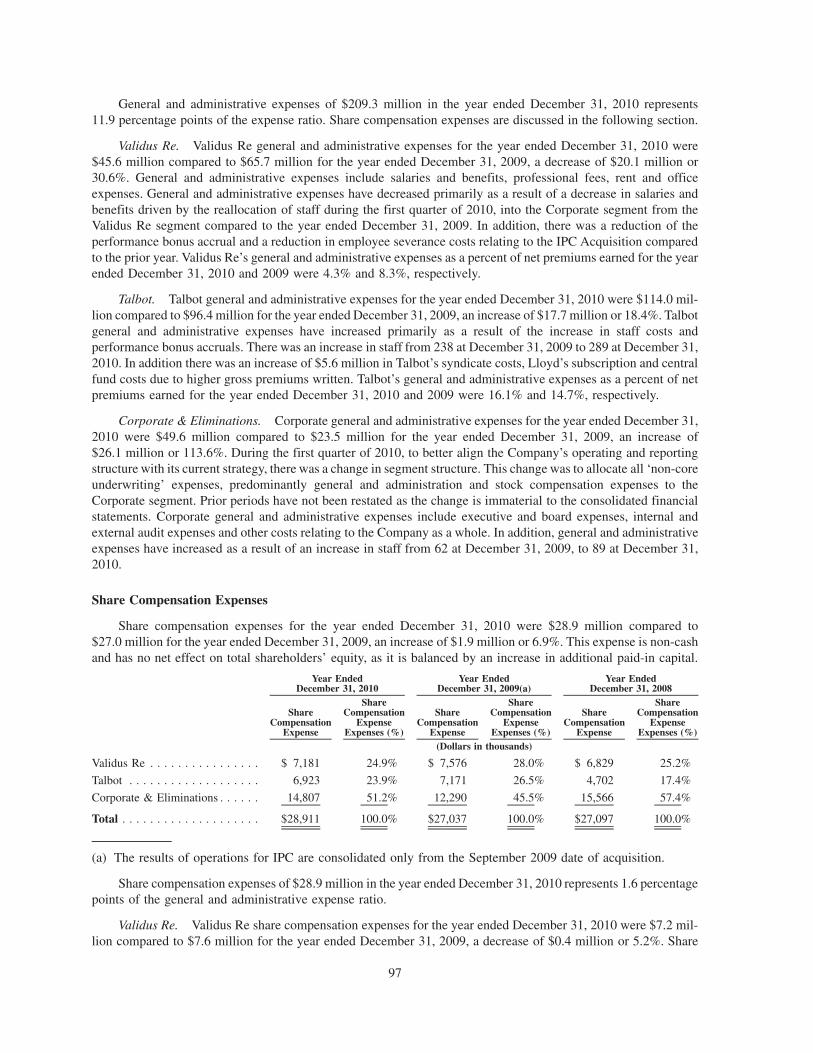
General and administrative expenses of $209.3 million in the year ended December 31, 2010 represents11.9 percentage points of the expense ratio. Share compensation expenses are discussed in the following section.
Validus Re. Validus Re general and administrative expenses for the year ended December 31, 2010 were$45.6 million compared to $65.7 million for the year ended December 31, 2009, a decrease of $20.1 million or30.6%. General and administrative expenses include salaries and benefits, professional fees, rent and officeexpenses. General and administrative expenses have decreased primarily as a result of a decrease in salaries andbenefits driven by the reallocation of staff during the first quarter of 2010, into the Corporate segment from theValidus Re segment compared to the year ended December 31, 2009. In addition, there was a reduction of theperformance bonus accrual and a reduction in employee severance costs relating to the IPC Acquisition comparedto the prior year. Validus Re’s general and administrative expenses as a percent of net premiums earned for the yearended December 31, 2010 and 2009 were 4.3% and 8.3%, respectively.
Talbot. Talbot general and administrative expenses for the year ended December 31, 2010 were $114.0 mil-lion compared to $96.4 million for the year ended December 31, 2009, an increase of $17.7 million or 18.4%. Talbotgeneral and administrative expenses have increased primarily as a result of the increase in staff costs andperformance bonus accruals. There was an increase in staff from 238 at December 31, 2009 to 289 at December 31,2010. In addition there was an increase of $5.6 million in Talbot’s syndicate costs, Lloyd’s subscription and centralfund costs due to higher gross premiums written. Talbot’s general and administrative expenses as a percent of netpremiums earned for the year ended December 31, 2010 and 2009 were 16.1% and 14.7%, respectively.
Corporate & Eliminations. Corporate general and administrative expenses for the year ended December 31,2010 were $49.6 million compared to $23.5 million for the year ended December 31, 2009, an increase of$26.1 million or 113.6%. During the first quarter of 2010, to better align the Company’s operating and reportingstructure with its current strategy, there was a change in segment structure. This change was to allocate all ‘non-coreunderwriting’ expenses, predominantly general and administration and stock compensation expenses to theCorporate segment. Prior periods have not been restated as the change is immaterial to the consolidated financialstatements. Corporate general and administrative expenses include executive and board expenses, internal andexternal audit expenses and other costs relating to the Company as a whole. In addition, general and administrativeexpenses have increased as a result of an increase in staff from 62 at December 31, 2009, to 89 at December 31,2010.
Share Compensation Expenses
Share compensation expenses for the year ended December 31, 2010 were $28.9 million compared to$27.0 million for the year ended December 31, 2009, an increase of $1.9 million or 6.9%. This expense is non-cashand has no net effect on total shareholders’ equity, as it is balanced by an increase in additional paid-in capital.
ShareCompensation
Expense
ShareCompensation
ExpenseExpenses (%)
ShareCompensation
Expense
ShareCompensation
ExpenseExpenses (%)
ShareCompensation
Expense
ShareCompensation
ExpenseExpenses (%)
Year EndedDecember 31, 2010
Year EndedDecember 31, 2009(a)
Year EndedDecember 31, 2008
(Dollars in thousands)
Validus Re . . . . . . . . . . . . . . . . $ 7,181 24.9% $ 7,576 28.0% $ 6,829 25.2%
Talbot . . . . . . . . . . . . . . . . . . . 6,923 23.9% 7,171 26.5% 4,702 17.4%
Corporate & Eliminations . . . . . . 14,807 51.2% 12,290 45.5% 15,566 57.4%
Total . . . . . . . . . . . . . . . . . . . . $28,911 100.0% $27,037 100.0% $27,097 100.0%
(a) The results of operations for IPC are consolidated only from the September 2009 date of acquisition.
Share compensation expenses of $28.9 million in the year ended December 31, 2010 represents 1.6 percentagepoints of the general and administrative expense ratio.
Validus Re. Validus Re share compensation expenses for the year ended December 31, 2010 were $7.2 mil-lion compared to $7.6 million for the year ended December 31, 2009, a decrease of $0.4 million or 5.2%. Share
97

compensation expenses as a percent of net premiums earned for the year ended December 31, 2010 and 2009 were0.7% and 1.0%, respectively.
Talbot. Talbot share compensation expenses for the year ended December 31, 2010 were $6.9 millioncompared to $7.2 million for the year ended December 31, 2009 a decrease of $0.2 million or 3.5%. Sharecompensation expenses as a percent of net premiums earned for the year ended December 31, 2010 and 2009 were1.0% and 1.1%, respectively.
Corporate & Eliminations. Corporate share compensation expenses for the year ended December 31, 2010were $14.8 million compared to $12.3 million for the year ended December 31, 2009, an increase of $2.5 million or20.5%, primarily due to the change in allocation of corporate expenses referred to above.
Selected Ratios
The underwriting results of an insurance or reinsurance company are often measured by reference to itscombined ratio, which is the sum of the loss ratio and the expense ratio. The loss ratio is calculated by dividinglosses and loss expenses incurred (including estimates for incurred but not reported losses) by net premiums earned.The expense ratio is calculated by dividing acquisition costs combined with general and administrative expenses bynet premiums earned. The following table presents the losses and loss expenses ratio, policy acquisition cost ratio,general and administrative expense ratio, expense ratio and combined ratio for the years ended December 31, 2010,2009 and 2008.
Year EndedDecember 31, 2010
Year EndedDecember 31, 2009(a)
Year EndedDecember 31, 2008
Losses and loss expenses ratio . . . . . . . . . . . . . . . 56.1% 36.1% 61.5%
Policy acquisition costs ratio . . . . . . . . . . . . . . . . . 16.6% 18.1% 18.7%
General and administrative expenses ratio(b) . . . . . 13.5% 14.7% 12.0%
Expense ratio . . . . . . . . . . . . . . . . . . . . . . . . . . . 30.1% 32.8% 30.7%
Combined ratio . . . . . . . . . . . . . . . . . . . . . . . . . . 86.2% 68.9% 92.2%
Validus Re
Losses and loss expenses ratio . . . . . . . . . . . . . . . 57.2% 23.5% 64.4%Policy acquisition costs ratio . . . . . . . . . . . . . . . . . 15.3% 16.0% 15.3%
General and administrative expenses ratio(b) . . . . . 5.0% 9.2% 6.3%
Expense ratio . . . . . . . . . . . . . . . . . . . . . . . . . . . 20.3% 25.2% 21.6%
Combined ratio . . . . . . . . . . . . . . . . . . . . . . . . . . 77.5% 48.7% 86.0%
Talbot
Losses and loss expenses ratio . . . . . . . . . . . . . . . 54.4% 51.5% 58.3%
Policy acquisition costs ratio . . . . . . . . . . . . . . . . . 20.3% 21.4% 22.4%
General and administrative expenses ratio(b) . . . . . 17.0% 15.8% 12.6%
Expense ratio . . . . . . . . . . . . . . . . . . . . . . . . . . . 37.3% 37.2% 35.0%
Combined ratio . . . . . . . . . . . . . . . . . . . . . . . . . . 91.7% 88.7% 93.3%
(a) The results of operations for IPC are consolidated only from the September 2009 date of acquisition.
(b) Includes general and administrative expenses and share compensation expenses.
General and administrative expense ratios for the year ended December 31, 2010 and 2009 were 13.5% and14.7%, respectively. General and administrative expense ratio is the sum of general and administrative expenses andshare compensation expense divided by net premiums earned.
98

Expenses
Expenses as% of NetEarned
Premiums Expenses
Expenses as% of NetEarned
Premiums Expenses
Expenses as% of NetEarned
Premiums
Year EndedDecember 31, 2010
Year EndedDecember 31, 2009(a)
Year EndedDecember 31, 2008
(Dollars in thousands)
General and administrativeexpenses . . . . . . . . . . . . . . . . $209,290 11.9% $185,568 12.8% $123,948 9.8%
Share compensation expenses. . . 28,911 1.6% 27,037 1.9% 27,097 2.2%
Total. . . . . . . . . . . . . . . . . . . . . $238,201 13.5% $212,605 14.7% $151,045 12.0%
(a) The results of operations for IPC are consolidated only from the September 2009 date of acquisition.
Underwriting Income
Underwriting income for the year ended December 31, 2010 was $242.4 million compared to $450.2 millionfor the year ended December 31, 2009, a decrease of $207.8 million or 46.2%.
Year EndedDecember 31,
2010% of Sub-
Total
Year EndedDecember 31,
2009(a)% of Sub-
Total
Year EndedDecember 31,
2008% of Sub-
Total(Dollars in thousands)
Validus Re . . . . . . . . . . . . . . $236,193 80.0% $408,127 84.7% $ 91,207 69.3%
Talbot . . . . . . . . . . . . . . . . . 59,212 20.0% 73,519 15.3% 40,316 30.7%
Sub total . . . . . . . . . . . . . . . 295,405 100.0% 481,646 100.0% 131,523 100.0%
Corporate & Eliminations . . . (52,968) (31,397) (33,155)
Total . . . . . . . . . . . . . . . . . . $242,437 $450,249 $ 98,368
(a) The results of operations for IPC are consolidated only from the September 2009 date of acquisition.
The underwriting results of an insurance or reinsurance company are also often measured by reference to itsunderwriting income, which is a non-GAAP measure as previously defined. Underwriting income, as set out in the tablebelow, is reconciled to net income (the most directly comparable GAAP financial measure) by the addition orsubtraction of net investment income, other income, finance expenses, transaction expenses, realized gain onrepurchase of debentures, net realized and unrealized gains (losses) on investments and foreign exchange gains (losses).
Year EndedDecember 31, 2010
Year EndedDecember 31, 2009
(a)Year Ended
December 31, 2008(Dollars in thousands)
Underwriting income . . . . . . . . . . . . . . . . . . . . . . . $242,437 $450,249 $ 98,368
Net investment income. . . . . . . . . . . . . . . . . . . . . . . 134,103 118,773 139,528
Other income. . . . . . . . . . . . . . . . . . . . . . . . . . . . . . 5,219 4,634 5,264
Finance expenses . . . . . . . . . . . . . . . . . . . . . . . . . . . (55,870) (44,130) (57,318)
Gain on bargain purchase, net of expenses . . . . . . . . — 287,099 —
Realized gain on repurchase of debentures . . . . . . . . — 4,444 8,752
Net realized gains (losses) on investments . . . . . . . . 32,498 (11,543) (1,591)
Net unrealized gains (losses) on investments . . . . . . . 45,952 84,796 (79,707)
Foreign exchange gains (losses) . . . . . . . . . . . . . . . . 1,351 (674) (49,397)
Net income before taxes . . . . . . . . . . . . . . . . . . . . . $405,690 $893,648 $ 63,899
(a) The results of operations for IPC are consolidated only from the September 2009 date of acquisition.
99
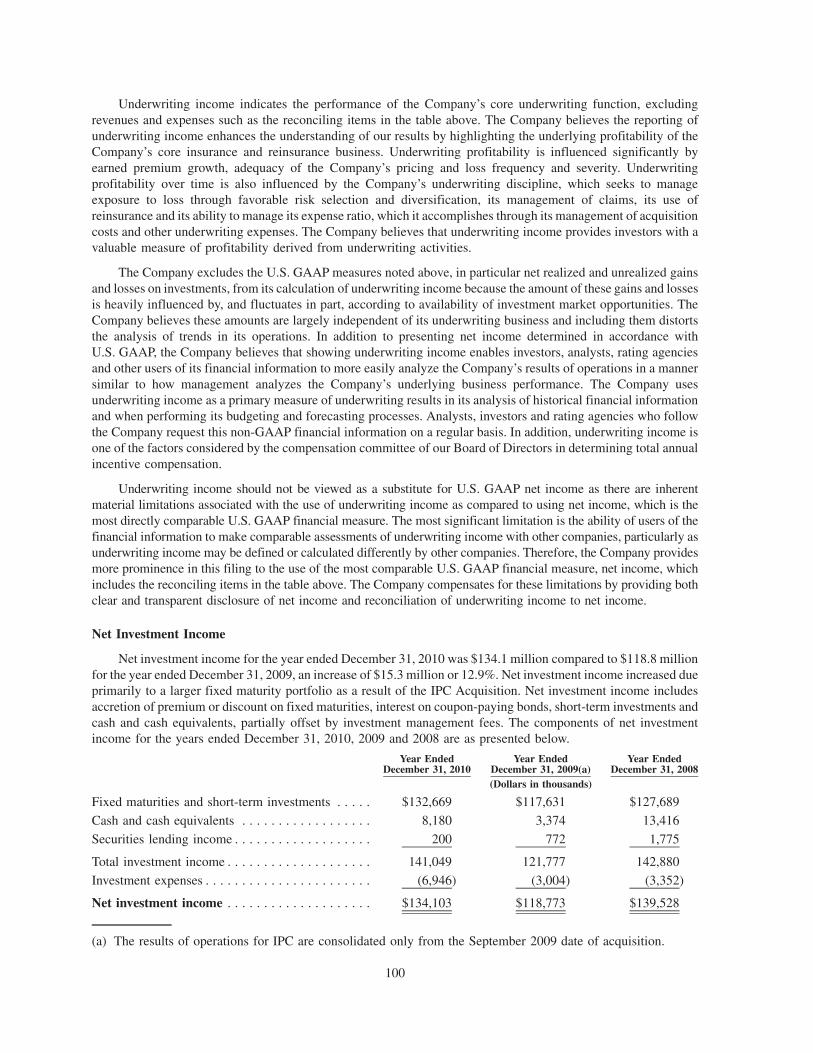
Underwriting income indicates the performance of the Company’s core underwriting function, excludingrevenues and expenses such as the reconciling items in the table above. The Company believes the reporting ofunderwriting income enhances the understanding of our results by highlighting the underlying profitability of theCompany’s core insurance and reinsurance business. Underwriting profitability is influenced significantly byearned premium growth, adequacy of the Company’s pricing and loss frequency and severity. Underwritingprofitability over time is also influenced by the Company’s underwriting discipline, which seeks to manageexposure to loss through favorable risk selection and diversification, its management of claims, its use ofreinsurance and its ability to manage its expense ratio, which it accomplishes through its management of acquisitioncosts and other underwriting expenses. The Company believes that underwriting income provides investors with avaluable measure of profitability derived from underwriting activities.
The Company excludes the U.S. GAAP measures noted above, in particular net realized and unrealized gainsand losses on investments, from its calculation of underwriting income because the amount of these gains and lossesis heavily influenced by, and fluctuates in part, according to availability of investment market opportunities. TheCompany believes these amounts are largely independent of its underwriting business and including them distortsthe analysis of trends in its operations. In addition to presenting net income determined in accordance withU.S. GAAP, the Company believes that showing underwriting income enables investors, analysts, rating agenciesand other users of its financial information to more easily analyze the Company’s results of operations in a mannersimilar to how management analyzes the Company’s underlying business performance. The Company usesunderwriting income as a primary measure of underwriting results in its analysis of historical financial informationand when performing its budgeting and forecasting processes. Analysts, investors and rating agencies who followthe Company request this non-GAAP financial information on a regular basis. In addition, underwriting income isone of the factors considered by the compensation committee of our Board of Directors in determining total annualincentive compensation.
Underwriting income should not be viewed as a substitute for U.S. GAAP net income as there are inherentmaterial limitations associated with the use of underwriting income as compared to using net income, which is themost directly comparable U.S. GAAP financial measure. The most significant limitation is the ability of users of thefinancial information to make comparable assessments of underwriting income with other companies, particularly asunderwriting income may be defined or calculated differently by other companies. Therefore, the Company providesmore prominence in this filing to the use of the most comparable U.S. GAAP financial measure, net income, whichincludes the reconciling items in the table above. The Company compensates for these limitations by providing bothclear and transparent disclosure of net income and reconciliation of underwriting income to net income.
Net Investment Income
Net investment income for the year ended December 31, 2010 was $134.1 million compared to $118.8 millionfor the year ended December 31, 2009, an increase of $15.3 million or 12.9%. Net investment income increased dueprimarily to a larger fixed maturity portfolio as a result of the IPC Acquisition. Net investment income includesaccretion of premium or discount on fixed maturities, interest on coupon-paying bonds, short-term investments andcash and cash equivalents, partially offset by investment management fees. The components of net investmentincome for the years ended December 31, 2010, 2009 and 2008 are as presented below.
Year EndedDecember 31, 2010
Year EndedDecember 31, 2009(a)
Year EndedDecember 31, 2008
(Dollars in thousands)
Fixed maturities and short-term investments . . . . . $132,669 $117,631 $127,689
Cash and cash equivalents . . . . . . . . . . . . . . . . . . 8,180 3,374 13,416
Securities lending income . . . . . . . . . . . . . . . . . . . 200 772 1,775
Total investment income . . . . . . . . . . . . . . . . . . . . 141,049 121,777 142,880
Investment expenses . . . . . . . . . . . . . . . . . . . . . . . (6,946) (3,004) (3,352)
Net investment income . . . . . . . . . . . . . . . . . . . . $134,103 $118,773 $139,528
(a) The results of operations for IPC are consolidated only from the September 2009 date of acquisition.
100
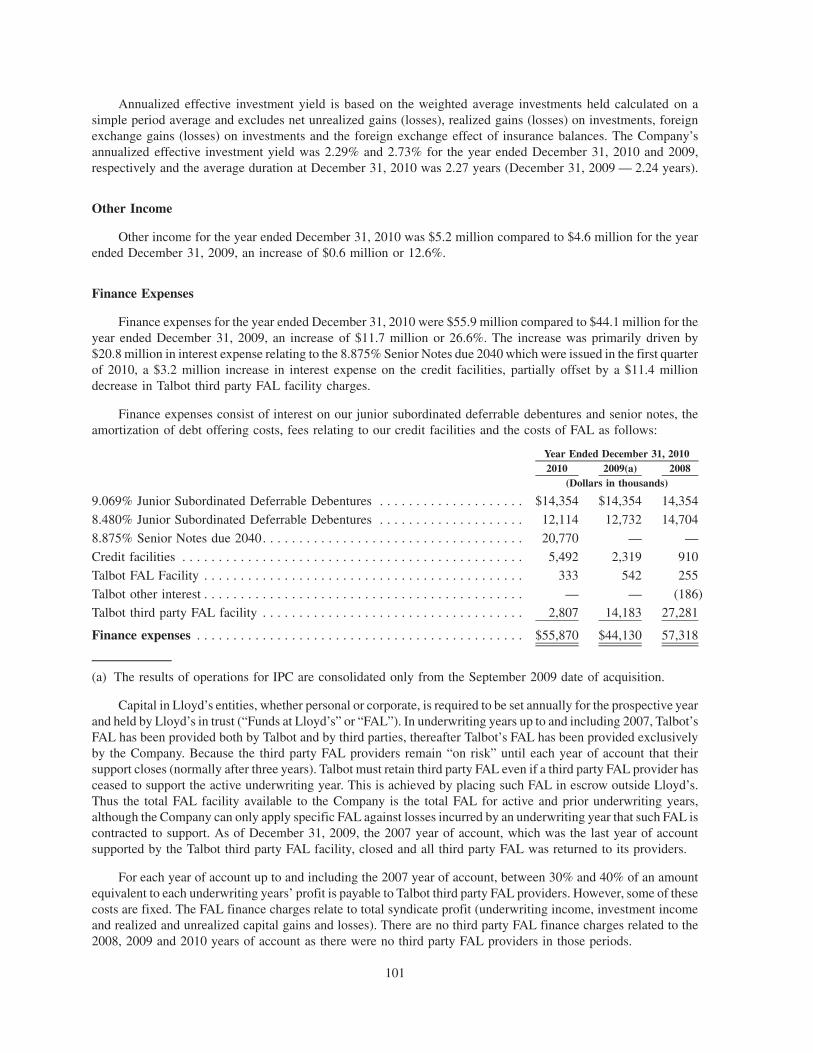
Annualized effective investment yield is based on the weighted average investments held calculated on asimple period average and excludes net unrealized gains (losses), realized gains (losses) on investments, foreignexchange gains (losses) on investments and the foreign exchange effect of insurance balances. The Company’sannualized effective investment yield was 2.29% and 2.73% for the year ended December 31, 2010 and 2009,respectively and the average duration at December 31, 2010 was 2.27 years (December 31, 2009 — 2.24 years).
Other Income
Other income for the year ended December 31, 2010 was $5.2 million compared to $4.6 million for the yearended December 31, 2009, an increase of $0.6 million or 12.6%.
Finance Expenses
Finance expenses for the year ended December 31, 2010 were $55.9 million compared to $44.1 million for theyear ended December 31, 2009, an increase of $11.7 million or 26.6%. The increase was primarily driven by$20.8 million in interest expense relating to the 8.875% Senior Notes due 2040 which were issued in the first quarterof 2010, a $3.2 million increase in interest expense on the credit facilities, partially offset by a $11.4 milliondecrease in Talbot third party FAL facility charges.
Finance expenses consist of interest on our junior subordinated deferrable debentures and senior notes, theamortization of debt offering costs, fees relating to our credit facilities and the costs of FAL as follows:
2010 2009(a) 2008Year Ended December 31, 2010
(Dollars in thousands)
9.069% Junior Subordinated Deferrable Debentures . . . . . . . . . . . . . . . . . . . . $14,354 $14,354 14,354
8.480% Junior Subordinated Deferrable Debentures . . . . . . . . . . . . . . . . . . . . 12,114 12,732 14,704
8.875% Senior Notes due 2040. . . . . . . . . . . . . . . . . . . . . . . . . . . . . . . . . . . . 20,770 — —
Credit facilities . . . . . . . . . . . . . . . . . . . . . . . . . . . . . . . . . . . . . . . . . . . . . . . 5,492 2,319 910
Talbot FAL Facility . . . . . . . . . . . . . . . . . . . . . . . . . . . . . . . . . . . . . . . . . . . . 333 542 255
Talbot other interest . . . . . . . . . . . . . . . . . . . . . . . . . . . . . . . . . . . . . . . . . . . . — — (186)Talbot third party FAL facility . . . . . . . . . . . . . . . . . . . . . . . . . . . . . . . . . . . . 2,807 14,183 27,281
Finance expenses . . . . . . . . . . . . . . . . . . . . . . . . . . . . . . . . . . . . . . . . . . . . . $55,870 $44,130 57,318
(a) The results of operations for IPC are consolidated only from the September 2009 date of acquisition.
Capital in Lloyd’s entities, whether personal or corporate, is required to be set annually for the prospective yearand held by Lloyd’s in trust (“Funds at Lloyd’s” or “FAL”). In underwriting years up to and including 2007, Talbot’sFAL has been provided both by Talbot and by third parties, thereafter Talbot’s FAL has been provided exclusivelyby the Company. Because the third party FAL providers remain “on risk” until each year of account that theirsupport closes (normally after three years). Talbot must retain third party FAL even if a third party FAL provider hasceased to support the active underwriting year. This is achieved by placing such FAL in escrow outside Lloyd’s.Thus the total FAL facility available to the Company is the total FAL for active and prior underwriting years,although the Company can only apply specific FAL against losses incurred by an underwriting year that such FAL iscontracted to support. As of December 31, 2009, the 2007 year of account, which was the last year of accountsupported by the Talbot third party FAL facility, closed and all third party FAL was returned to its providers.
For each year of account up to and including the 2007 year of account, between 30% and 40% of an amountequivalent to each underwriting years’ profit is payable to Talbot third party FAL providers. However, some of thesecosts are fixed. The FAL finance charges relate to total syndicate profit (underwriting income, investment incomeand realized and unrealized capital gains and losses). There are no third party FAL finance charges related to the2008, 2009 and 2010 years of account as there were no third party FAL providers in those periods.
101
FAL finance charges are based on syndicate profit but include fixed elements. Third party FAL finance chargesfor the year ended December 31, 2010 were $2.8 million compared to $14.2 million for the year ended December 31,2009, a decrease of $11.4 million. This decrease was due to the closure of all third party supported years of accountand the final settlement in 2010, of all remaining liabilities.
Tax (Expense) Benefit
Tax expense for the year ended December 31, 2010 was $3.1 million compared to a benefit of ($3.8) million forthe year ended December 31, 2009, a change of $6.9 million or 183.2%. For the twelve months ended December 31,2010, the Talbot tax expense increased primarily due to the increase in profit commission within the Talbot segmentcompared to the year ended December 31, 2009. This was partially offset by an additional accrual of performancebonus and the effect of a reduced U.K corporate tax rate from 28% to 27% on deferred tax balances in the Talbotsegment. The tax benefit for the year ended December 31, 2009 was primarily due to an $8.7 million adjustment tothe U.K. tax basis of net unearned premiums and deferred acquisition costs, $3.7 million of U.K. tax credits onperformance bonus and share compensation offset by ($8.3) million of U.K tax expenses on profit commissions andmanaging agency fees within the Talbot segment.
Gain on Bargain Purchase, Net of Expenses
On September 4, 2009, the Company acquired all of the outstanding shares of IPC from a group of institutionaland other investors. Pursuant to the Amalgamation Agreement, the Company acquired all of IPC’s outstandingcommon shares in exchange for the Company’s common shares and cash. The purchase price paid by the Companywas $1,746.2 million for net assets acquired of $2,076.9 million. The Company expensed as incurred $29.4 millionof transaction expenses, $21.7 million for amortization of intangibles and $14.1 million of termination expensesrelated to the acquisition for the year ended December 31, 2009, resulting in a gain on bargain purchase of$287.1 million for the year ended December 31, 2009. Transaction expenses are comprised of primarily legal,corporate advisory, IPC employee termination benefits and audit related services.
Realized Gain on Repurchase of Debentures
On December 1, 2009, the Company repurchased from an unaffiliated financial institution $14.5 millionprincipal amount of its 8.480% Junior Subordinated Deferrable Debentures due 2037 at an aggregate price of$9.9 million plus accrued and unpaid interest of $0.3 million. The repurchase resulted in the recognition of arealized gain of $4.4 million for the year ended December 31, 2009.
Net Realized Gains (Losses) on Investments
Net realized gains on investments for the year ended December 31, 2010 were $32.5 million compared tolosses of ($11.5) million for the year ended December 31, 2009, an increase of $44.0 million or 381.5%.
Net Unrealized Gains on Investments
Net unrealized gains on investments for the year ended December 31, 2010 were $46.0 million compared togains of $84.8 million for the year ended December 31, 2009, a decrease of $38.8 million or 45.8%.
Net unrealized gains on investments are recorded as a component of net income. The Company has adopted allauthoritative guidance on U.S. GAAP fair value measurements in effect as of the balance sheet date.
Net unrealized gains on investments are recorded as a component of net income. The Company has adopted allauthoritative guidance on U.S. GAAP fair value measurements in effect as of the balance sheet date. Consistent withthese standards, certain market conditions allow for fair value measurements that incorporate unobservable inputswhere active market transaction based measurements are unavailable. Certain non-Agency RMBS securities werepreviously identified as trading in inactive markets. During the three months ended September 30, 2010,management, with assistance from external investment advisors, determined that market activity had increasedsubstantially for the identified non-Agency RMBS securities. Further details are provided in the Investments sectionbelow.
102
Foreign Exchange Gains (Losses)
Foreign exchange gains for the year ended December 31, 2010 were $1.4 million compared to losses of($0.7) million for the year ended December 31, 2009, a favorable movement of $2.0 million. The favorablemovement in foreign exchange was due primarily to the increased value of assets denominated in foreign currenciesrelative to the U.S. dollar reporting currency for the year ended December 31, 2010, as compared to the year endedDecember 31, 2009.
For the year ended December 31, 2010, the Validus Re segment foreign exchange losses were ($1.2) millioncompared to losses of ($1.4) million for the year ended December 31, 2009, a favorable movement of $0.2 million.The favorable movement in Validus Re foreign exchange was due to a $2.9 million gain on a forward exchangecontract entered into to hedge currency movements between US dollars and Chilean pesos, offset by a the net longposition on premium receivable assets denominated in Euro and British pound sterling. The Euro to U.S. dollarexchange rates were 1.43 and 1.33 at December 31, 2009 and December 31, 2010, respectively. The British poundsterling to U.S. dollar exchange rates were 1.59 and 1.55 at December 31, 2009 and December 31, 2010,respectively. During the year ended December 31, 2010, the Euro depreciated by 7.0 percent, while the Britishpound sterling depreciated by 2.5 percent.
For the year ended December 31, 2010, the Talbot segment foreign exchange gains were $2.1 millioncompared to gains of $0.7 million for the year ended December 31, 2009, a favorable movement of $1.4 million.The favorable movement in Talbot foreign exchange was due primarily to revaluation of syndicate overseas depositsheld in Lloyd’s. The Euro to U.S. dollar exchange rates were 1.43 and 1.33 at December 31, 2009 and December 31,2010, respectively. The British pound sterling to U.S. dollar exchange rates were 1.59 and 1.55 at December 31,2009 and December 31, 2010, respectively. Certain premiums receivable and liabilities for losses incurred incurrencies other than the U.S. dollar are exposed to the risk of changes in value resulting from fluctuations in foreignexchange rates and may affect financial results in the future.
At December 31, 2010, Talbot’s balance sheet includes net unearned premiums and deferred acquisition costsdenominated in foreign currencies of approximately $89.0 million and $20.1 million, respectively. The net balanceconsisted of British pounds sterling and Canadian dollars of $59.9 million and $9.0 million, respectively. Netunearned premiums and deferred acquisition costs are classified as non-monetary items and are translated at historicexchange rates. All of Talbot’s other balance sheet items are classified as monetary items and are translated at periodend exchange rates.
103
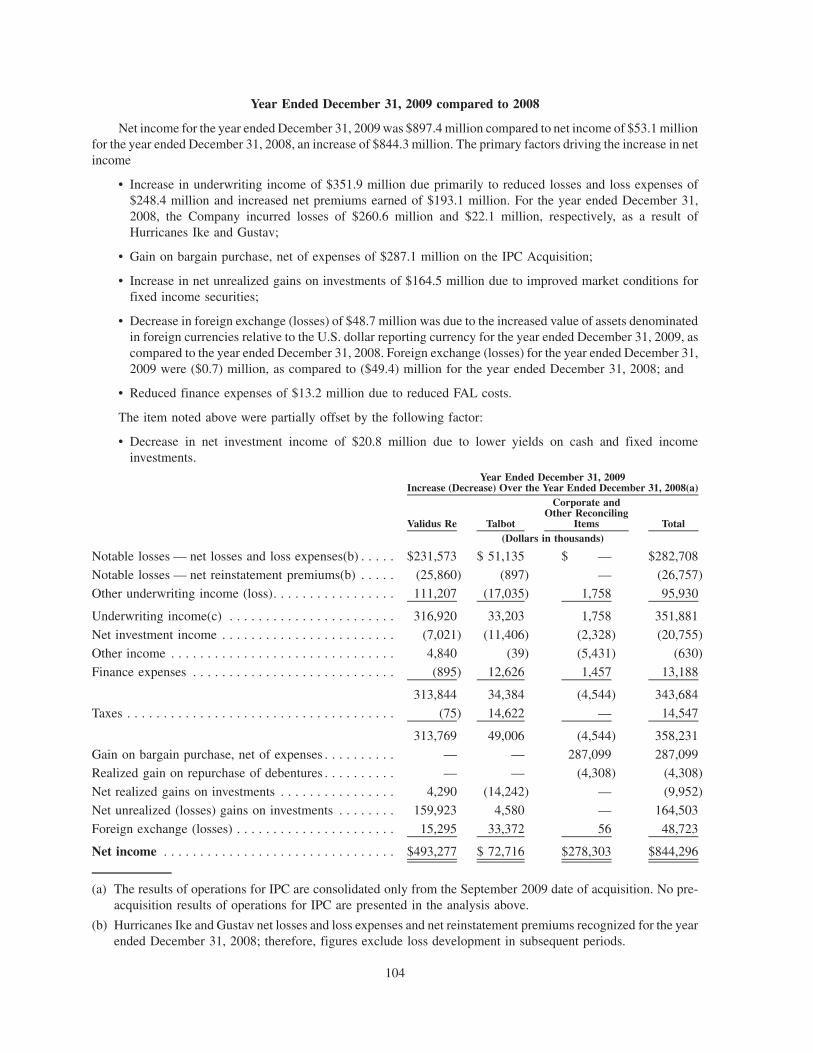
Year Ended December 31, 2009 compared to 2008
Net income for the year ended December 31, 2009 was $897.4 million compared to net income of $53.1 millionfor the year ended December 31, 2008, an increase of $844.3 million. The primary factors driving the increase in netincome
• Increase in underwriting income of $351.9 million due primarily to reduced losses and loss expenses of$248.4 million and increased net premiums earned of $193.1 million. For the year ended December 31,2008, the Company incurred losses of $260.6 million and $22.1 million, respectively, as a result ofHurricanes Ike and Gustav;
• Gain on bargain purchase, net of expenses of $287.1 million on the IPC Acquisition;
• Increase in net unrealized gains on investments of $164.5 million due to improved market conditions forfixed income securities;
• Decrease in foreign exchange (losses) of $48.7 million was due to the increased value of assets denominatedin foreign currencies relative to the U.S. dollar reporting currency for the year ended December 31, 2009, ascompared to the year ended December 31, 2008. Foreign exchange (losses) for the year ended December 31,2009 were ($0.7) million, as compared to ($49.4) million for the year ended December 31, 2008; and
• Reduced finance expenses of $13.2 million due to reduced FAL costs.
The item noted above were partially offset by the following factor:
• Decrease in net investment income of $20.8 million due to lower yields on cash and fixed incomeinvestments.
Validus Re Talbot
Corporate andOther Reconciling
Items Total
Year Ended December 31, 2009Increase (Decrease) Over the Year Ended December 31, 2008(a)
(Dollars in thousands)
Notable losses — net losses and loss expenses(b) . . . . . $231,573 $ 51,135 $ — $282,708
Notable losses — net reinstatement premiums(b) . . . . . (25,860) (897) — (26,757)
Other underwriting income (loss). . . . . . . . . . . . . . . . . 111,207 (17,035) 1,758 95,930
Underwriting income(c) . . . . . . . . . . . . . . . . . . . . . . . 316,920 33,203 1,758 351,881
Net investment income . . . . . . . . . . . . . . . . . . . . . . . . (7,021) (11,406) (2,328) (20,755)
Other income . . . . . . . . . . . . . . . . . . . . . . . . . . . . . . . 4,840 (39) (5,431) (630)
Finance expenses . . . . . . . . . . . . . . . . . . . . . . . . . . . . (895) 12,626 1,457 13,188
313,844 34,384 (4,544) 343,684
Taxes . . . . . . . . . . . . . . . . . . . . . . . . . . . . . . . . . . . . . (75) 14,622 — 14,547
313,769 49,006 (4,544) 358,231
Gain on bargain purchase, net of expenses . . . . . . . . . . — — 287,099 287,099Realized gain on repurchase of debentures . . . . . . . . . . — — (4,308) (4,308)
Net realized gains on investments . . . . . . . . . . . . . . . . 4,290 (14,242) — (9,952)
Net unrealized (losses) gains on investments . . . . . . . . 159,923 4,580 — 164,503
Foreign exchange (losses) . . . . . . . . . . . . . . . . . . . . . . 15,295 33,372 56 48,723
Net income . . . . . . . . . . . . . . . . . . . . . . . . . . . . . . . . $493,277 $ 72,716 $278,303 $844,296
(a) The results of operations for IPC are consolidated only from the September 2009 date of acquisition. No pre-acquisition results of operations for IPC are presented in the analysis above.
(b) Hurricanes Ike and Gustav net losses and loss expenses and net reinstatement premiums recognized for the yearended December 31, 2008; therefore, figures exclude loss development in subsequent periods.
104

(c) Non-GAAP Financial Measures. In presenting the Company’s results, management has included and discussedunderwriting income (loss) that is not calculated under standards or rules that comprise U.S. GAAP. Suchmeasures are referred to as non-GAAP. Non-GAAP measures may be defined or calculated differently by othercompanies. These measures should not be viewed as a substitute for those determined in accordance with U.S.GAAP. A reconciliation of this measure to net income, the most comparable U.S. GAAP financial measure, ispresented in the section below entitled “Underwriting Income.”
Other Non-GAAP Financial Measures
In presenting the Company’s results, management has included and discussed certain schedules containing netoperating income, underwriting income (loss), annualized return on average equity and diluted book value percommon share that are not calculated under standards or rules that comprise U.S. GAAP. Such measures are referredto as non-GAAP. Non-GAAP measures may be defined or calculated differently by other companies. Thesemeasures should not be viewed as a substitute for those determined in accordance with U.S. GAAP. The calculationof annualized return on average equity is discussed in the section above entitled “Financial Measures.” Areconciliation of underwriting income to net income, the most comparable U.S. GAAP financial measure, ispresented above in the section entitled “Underwriting Income.” A reconciliation of diluted book value per share tobook value per share, the most comparable U.S. GAAP financial measure, is presented below. Operating income iscalculated based on net income (loss) excluding net realized gains (losses), net unrealized gains (losses) oninvestments, gains (losses) arising from translation of non-US$ denominated balances and non-recurring items. Areconciliation of operating income to net income, the most comparable U.S. GAAP financial measure, is embeddedin the table presenting results of operations for the year ended December 31, 2010 and 2009 in the section aboveentitled “Results of Operations.” Realized gains (losses) from the sale of investments are driven by the timing of thedisposition of investments, not by our operating performance. Gains (losses) arising from translation of non-US$denominated balances are unrelated to our underlying business.
The following tables present reconciliations of diluted book value per share to book value per share, the mostcomparable U.S. GAAP financial measure, at December 31, 2010 and December 31, 2009.
Equity Amount Shares Exercise PriceBook Value per
Share
As at December 31, 2010
Book value per common shareTotal shareholders’ equity . . . . . . . . . . . . . . . . $3,504,831 98,001,226 $35.76
Diluted book value per common shareTotal shareholders’ equity . . . . . . . . . . . . . . . . 3,504,831 98,001,226
Assumed exercise of outstanding warrants . . . . 139,272 7,934,860 $17.55
Assumed exercise of outstanding stockoptions . . . . . . . . . . . . . . . . . . . . . . . . . . . . 54,997 2,723,684 $20.19
Unvested restricted shares . . . . . . . . . . . . . . . . — 3,496,096
Diluted book value per common share . . . . . $3,699,100 112,155,866 $32.98
105

Equity Amount Shares Exercise PriceBook Value per
Share
As at December 31, 2009
Book value per common shareTotal shareholders’ equity . . . . . . . . . . . . . . . . $4,031,120 128,459,478 $31.38
Diluted book value per common shareTotal shareholders’ equity . . . . . . . . . . . . . . . . 4,031,120 128,459,478
Assumed exercise of outstanding warrants . . . . 139,576 7,952,138 $17.55
Assumed exercise of outstanding stockoptions . . . . . . . . . . . . . . . . . . . . . . . . . . . . 65,159 3,278,015 $19.88
Unvested restricted shares . . . . . . . . . . . . . . . . — 3,020,651
Diluted book value per common share . . . . . $4,235,855 142,710,282 $29.68
Financial Condition and Liquidity
Validus Holdings, Ltd. is a holding company and conducts no operations of its own. The Company reliesprimarily on cash dividends and other permitted payments from Validus Re and Talbot to pay finance expenses andother holding company expenses. There are restrictions on the payment of dividends from Validus Re and Talbot tothe Company. Please refer to Part II, Item 5, “Market for Registrants, Common Equity, Related Shareholder Mattersand Issuer Purchases of Equity Securities” for further discussion of the Company’s dividend policy.
Three main sources provide cash flows for the Company: operating activities, investing activities andfinancing activities. Cash flow from operating activities is derived primarily from the net receipt of premiumsless claims and expenses related to underwriting activities. Cash flow from investing activities is derived primarilyfrom the receipt of net proceeds on the Company’s investment portfolio. Cash flow from financing activities isderived primarily from the issuance of common shares and debentures payable. The movement in net cash providedby operating activities, net cash provided by (used in) investing activities, net cash (used in) provided by financingactivities and the effect of foreign currency rate changes on cash and cash equivalents for the year endedDecember 31, 2010, 2009 and 2008 is described in the following table.
2010 2009(a) 2008Year Ended December 31,
(Dollars in thousands)
Net cash provided by operating activities . . . . . . . . . . . . . . . . . . . . . . . $ 630,001 $ 555,116 $ 485,983
Net cash provided by (used in) investing activities . . . . . . . . . . . . . . . . 378,426 (442,633) (269,810)
Net cash (used in) financing activities . . . . . . . . . . . . . . . . . . . . . . . . . (774,842) (187,067) (162,334)
Effect of foreign currency rate changes on cash and cash equivalents . . (430) 12,321 (48,689)
Net increase (decrease) in cash . . . . . . . . . . . . . . . . . . . . . . . . . . . . . $ 233,155 $ (62,263) $ 5,150
(a) The results of operations for IPC are consolidated only from the September 2009 date of acquisition.
During the year ended December 31, 2010, net cash provided by operating activities of $630.0 million was drivenprimarily by increased levels of underwriting net premiums written arising from the impact of the IPC Acquisition inlate 2009. A significant portion of the 2010 incurred losses have yet to be paid as of December 31, 2010, whichresulted in cash provided from operating activities for the period being higher than net income for the period. Net cashprovided by investing activities of $378.4 million was driven primarily by the net sales of short term securities of$208.3 million and a decrease in securities lending collateral of $67.0 million. The decrease in securities lendingcollateral was due to the winding down of the securities lending program beginning in the third quarter of 2010. Netcash used in financing activities of $774.8 million was driven primarily by the purchase of $856.9 million of commonshares under the Company’s share repurchase program and the payment of $105.7 million in quarterly dividends,partially offset by the issuance $246.8 million of 8.875% Senior Notes due 2040.
106
During the year ended December 31, 2009, net cash provided by operating activities was driven primarily bynet income of $897.4 million. Cash provided by operating activities, as compared to the year ended December 31,2008, was affected by the relative movement in change in reserves for losses and loss expenses for the year endedDecember 31, 2009, due primarily to the settlement of 2008 loss reserves. Net cash used in investing activities wasdriven primarily by the proceeds on sales of investments to finance the IPC Acquisition and the investment ofoperating surpluses. Net cash used in financing activities was driven primarily by share repurchases of $84.2 millionand aggregate quarterly dividend payments of $78.5 million. The decrease in the effect of foreign currency ratechanges in cash and cash equivalents is due to relatively stable major currency exchange rates for the year endedDecember 31, 2009 compared to the year ended December 31, 2008.
As at December 31, 2010, the Company’s portfolio was composed of fixed income investments, short-term andother investments amounting to $5,118.9 million or 89.2% of total cash and investments. Details of the Company’sdebt and financing arrangements at December 31, 2010 are provided below.
Maturity Date /Term
In Use/Outstanding
(Dollars in thousands)
9.069% Junior Subordinated Deferrable Debentures . . . . . . . . . . . . . . . . . . June 15, 2036 $150,000
8.480% Junior Subordinated Deferrable Debentures . . . . . . . . . . . . . . . . . . June 15, 2037 139,800
8.875% Senior Notes due 2040 . . . . . . . . . . . . . . . . . . . . . . . . . . . . . . . . . January 26, 2040 250,000
$340,000 syndicated unsecured letter of credit facility . . . . . . . . . . . . . . . . March 12, 2013 —$60,000 bilateral unsecured letter of credit facility . . . . . . . . . . . . . . . . . . . March 12, 2013 —
$500,000 secured letter of credit facility . . . . . . . . . . . . . . . . . . . . . . . . . . March 12, 2012 268,944
Talbot FAL facility . . . . . . . . . . . . . . . . . . . . . . . . . . . . . . . . . . . . . . . . . . April 13, 2011 25,000
IPC Bi-Lateral Facility . . . . . . . . . . . . . . . . . . . . . . . . . . . . . . . . . . . . . . . December 31, 2010 68,063
Total . . . . . . . . . . . . . . . . . . . . . . . . . . . . . . . . . . . . . . . . . . . . . . . . . . . . $901,807
Capital Resources
Shareholders’ equity at December 31, 2010 was $3,504.8 million.
On February 9, 2011, the Company announced that its Board of Directors (the “Board”) had increased theCompany’s annual dividend by 13.6% from $0.88 to $1.00 per common share and common share equivalent forwhich each outstanding warrant is exercisable.
On February 9, 2011, the Company announced a quarterly cash dividend of $0.25 per common share and $0.25per common share equivalent for which each outstanding warrant is exercisable, payable on March 31, 2011 toholders of record on March 15, 2011. During 2010, the Company paid quarterly cash dividends of $0.22 per eachcommon share and $0.22 per common share equivalent for which each outstanding warrant is exercisable onMarch 31, June 30 and September 30 to holders of record on March 15, June 15 and September 15, 2010respectively.
The timing and amount of any future cash dividends, however, will be at the discretion of the Board and willdepend upon our results of operations and cash flows, our financial position and capital requirements, generalbusiness conditions, legal, tax, regulatory, rating agency and contractual constraints or restrictions and any otherfactors that the Board deems relevant.
The Company may from time to time repurchase its securities, including common shares, Junior SubordinatedDeferrable Debentures and Senior Notes. In November 2009, the Board of Directors of the Company authorized aninitial $400.0 million share repurchase program. On February 17, 2010, the Board of Directors of the Companyauthorized the Company to return up to $750.0 million to shareholders. This amount is in addition to, and in excessof, the $135.5 million of common shares purchased by the Company through February 17, 2010 under its previouslyauthorized $400.0 million share repurchase program. On May 6, 2010, the Board of Directors authorized a selftender offer pursuant to which the Company has repurchased $300.0 million in common shares. On November 4,2010, the Board of Directors authorized a self tender offer pursuant to which the Company has repurchased
107

$300.0 million in common shares. In addition, the Board of Directors authorized separate repurchase agreementswith funds affiliated with or managed by each of Aquiline Capital Partners LLC, New Mountain Capital LLC, andVestar Capital Partners pursuant to which the Company has repurchased $61.6 million in common shares. OnDecember 20, 2010, the Board of Directors authorized the Company to return up to $400.0 million to shareholders.This amount is in addition to the $929.2 million of common shares purchased by the Company throughDecember 23, 2010 under its previously authorized share repurchase program.
The Company expects the purchases under its share repurchase program to be made from time to time in theopen market or in privately negotiated transactions. The timing, form and amount of the share repurchases under theprogram will depend on a variety of factors, including market conditions, the Company’s capital position relative tointernal and rating agency targets, legal requirements and other factors. The repurchase program may be modified,extended or terminated by the Board of Directors at any time.
On November 4, 2010, the Company announced that its Board of Directors had approved share repurchasetransactions aggregating $300.0 million. These repurchases were effected by a tender offer which the Company Forthe period November 4, 2009 through February 9, 2011 the Company repurchased 35.0 million shares at a cost of$947.2 million under the share repurchase program.
On August 7, 2008, the Company filed a shelf registration statement on Form S-3 (No. 333-152856) with theU.S Securities Exchange Committee in which we may offer from time to time common shares, preference shares,depository shares representing common shares or preference shares, senior or subordinated debt securities, warrantsto purchase common shares, preference shares and debt securities, share purchase contracts, share purchase unitsand units which may consist of any combination of the securities listed above. In addition, the shelf registrationstatement will provide for secondary sales of common shares sold by the Company’s shareholders. The registrationstatement is intended to provide the Company with additional flexibility to access capital markets for generalcorporate purposes, subject to market conditions and the Company’s capital needs.
The Company’s contractual obligations and commitments as at December 31, 2010 are set out below:
TotalLess Than
1 Year 1-3 Years 3-5 YearsMore Than
5 Years
Payment Due by Period
(Dollars in thousands)
Reserve for losses and loss expenses(a) . . . . $2,035,973 $1,014,779 $687,468 $254,252 79,474
Senior Notes(b) . . . . . . . . . . . . . . . . . . . . . 654,531 22,187 44,374 44,374 543,596
Junior Subordinated Deferrable Debentures(including interest payments)(c) . . . . . . . 314,384 168,657 145,727 — —
Operating lease obligations . . . . . . . . . . . . . 26,149 2,168 5,673 7,728 10,580
Total . . . . . . . . . . . . . . . . . . . . . . . . . . . . . $3,031,037 $1,207,791 $883,242 $306,354 $633,650
(a) The reserve for losses and loss expenses represents an estimate, including actuarial and statistical projections ata given point in time of an insurer’s or reinsurer’s expectations of the ultimate settlement and administrationcosts of claims incurred. As a result, it is likely that the ultimate liability will differ from such estimates, perhapssignificantly. Such estimates are not precise in that, among other things, they are based on predictions of futuredevelopments and estimates of future trends in loss severity and frequency and other variable factors such asinflation, litigation and tort reform. This uncertainty is heightened by the short time in which the Company hasoperated, thereby providing limited claims loss emergence patterns specifically for the Company. The lack ofhistorical information for the Company has necessitated the use of industry loss emergence patterns in derivingIBNR. Further, expected losses and loss ratios are typically developed using vendor and proprietary computermodels and these expected loss ratios are a material component in the calculation deriving IBNR. Actual lossratios will deviate from expected loss ratios and ultimate loss ratios will be greater or less than expected lossratios. During the loss settlement period, it often becomes necessary to refine and adjust the estimates ofliability on a claim either upward or downward. Even after such adjustments, ultimate liability will exceed or beless than the revised estimates. The actual payment of the reserve for losses and loss expenses will differ fromestimated payouts.
108

(b) The 8.875% Senior Notes mature on January 26, 2040.
(c) The 9.069% Junior Subordinated Deferrable Debentures and the 8.480% Junior Subordinated DeferrableDebentures mature on June 15, 2036 and June 15, 2037, respectively.
The following table details the capital resources of the Company’s more significant subsidiaries on anunconsolidated basis:
Capital atDecember 31, 2010
(Dollars inthousands)
Validus Reinsurance, Ltd. (consolidated), excluding IPCRe, Ltd. . . . . . . . . . . . . . . . . . . . . . $3,107,749IPCRe, Ltd . . . . . . . . . . . . . . . . . . . . . . . . . . . . . . . . . . . . . . . . . . . . . . . . . . . . . . . . . . . . . 306,659Total Validus Reinsurance, Ltd. (consolidated) . . . . . . . . . . . . . . . . . . . . . . . . . . . . . . . . . 3,414,408Talbot Holdings, Ltd . . . . . . . . . . . . . . . . . . . . . . . . . . . . . . . . . . . . . . . . . . . . . . . . . . . . . . 719,267Other subsidiaries, net . . . . . . . . . . . . . . . . . . . . . . . . . . . . . . . . . . . . . . . . . . . . . . . . . . . . 8,647
Total consolidated capitalization . . . . . . . . . . . . . . . . . . . . . . . . . . . . . . . . . . . . . . . . . . . . 4,142,322Other, net . . . . . . . . . . . . . . . . . . . . . . . . . . . . . . . . . . . . . . . . . . . . . . . . . . . . . . . . . . . . . . (40,617)Senior notes payable . . . . . . . . . . . . . . . . . . . . . . . . . . . . . . . . . . . . . . . . . . . . . . . . . . . . . . (246,874)Debentures payable. . . . . . . . . . . . . . . . . . . . . . . . . . . . . . . . . . . . . . . . . . . . . . . . . . . . . . . (350,000)
Total shareholders’ equity . . . . . . . . . . . . . . . . . . . . . . . . . . . . . . . . . . . . . . . . . . . . . . . . $3,504,831
Ratings
The following table summarizes the financial strength ratings of the Company and its principal reinsurance andinsurance subsidiaries from internationally recognized rating agencies as of February 18, 2011:
A.M. Best(a) S&P(b) Moody’s(c) Fitch(d)
Validus Holdings, Ltd.Issuer credit rating . . . . . . . . . . . . . . . . . . . . . . . . . . . . . . . . . . bbb- BBB Baa2 BBB+Senior debt . . . . . . . . . . . . . . . . . . . . . . . . . . . . . . . . . . . . . . . . bbb- BBB — BBBSubordinated debt . . . . . . . . . . . . . . . . . . . . . . . . . . . . . . . . . . . bb+ BBB- — BB+Preferred stock . . . . . . . . . . . . . . . . . . . . . . . . . . . . . . . . . . . . . bb BB+ — —Outlook on ratings . . . . . . . . . . . . . . . . . . . . . . . . . . . . . . . . . . Positive Stable Stable StableValidus Reinsurance, Ltd.Financial strength rating . . . . . . . . . . . . . . . . . . . . . . . . . . . . . . A- A- A3 A-Issuer credit rating . . . . . . . . . . . . . . . . . . . . . . . . . . . . . . . . . . a- — — —Outlook on ratings . . . . . . . . . . . . . . . . . . . . . . . . . . . . . . . . . . Positive Stable Stable StableIPCRe Ltd.Financial strength rating . . . . . . . . . . . . . . . . . . . . . . . . . . . . . . A- — — —Issuer credit rating . . . . . . . . . . . . . . . . . . . . . . . . . . . . . . . . . . a- — — —Outlook on rating . . . . . . . . . . . . . . . . . . . . . . . . . . . . . . . . . . . Stable — — —Validus Re Europe Ltd.Financial strength rating . . . . . . . . . . . . . . . . . . . . . . . . . . . . . . A- — — —Issuer credit rating . . . . . . . . . . . . . . . . . . . . . . . . . . . . . . . . . . a- — — —Outlook on rating . . . . . . . . . . . . . . . . . . . . . . . . . . . . . . . . . . . Stable — — —TalbotFinancial strength rating applicable to all Lloyds syndicates . . . . A A+ — A+
(a) The A.M. Best ratings were most recently affirmed on November 3, 2010
(b) The S&P ratings were upgraded to the levels noted above on August 24, 2010
(c) All Moody’s ratings were most recently referred to in a November 16, 2010 Credit opinion on the ValidusHoldings, Ltd.
(d) All Fitch ratings were most recently affirmed on January 10, 2011
109
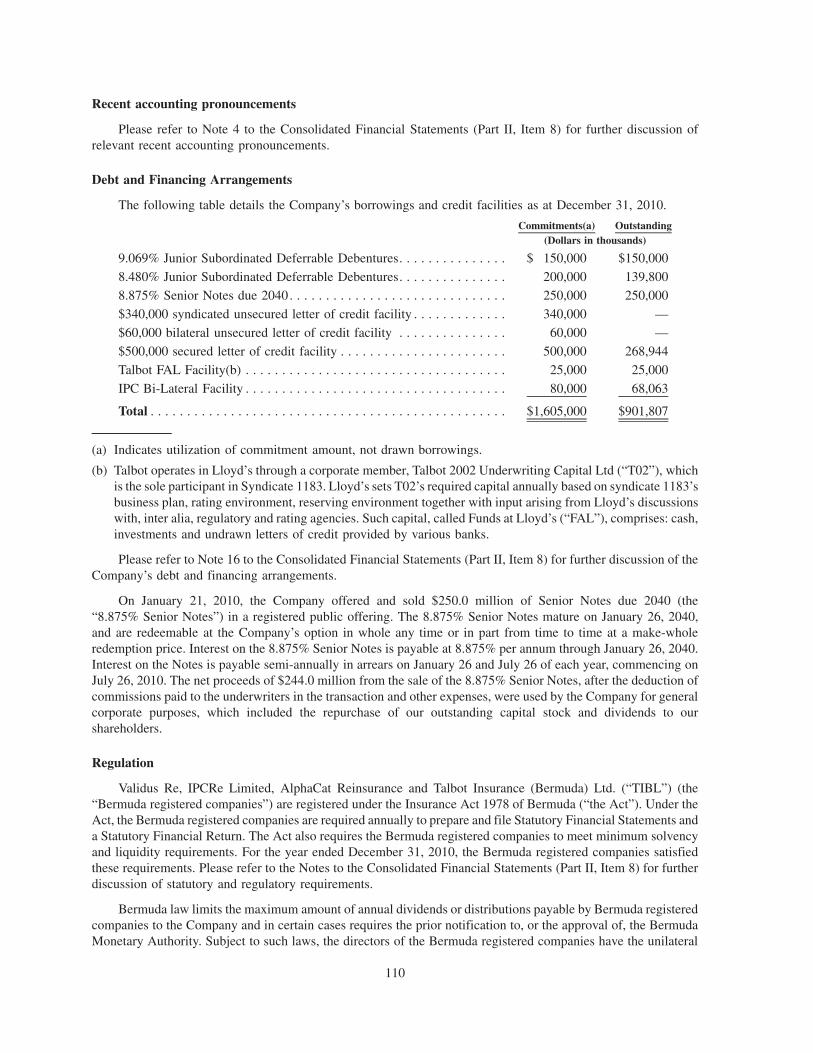
Recent accounting pronouncements
Please refer to Note 4 to the Consolidated Financial Statements (Part II, Item 8) for further discussion ofrelevant recent accounting pronouncements.
Debt and Financing Arrangements
The following table details the Company’s borrowings and credit facilities as at December 31, 2010.
Commitments(a) Outstanding(Dollars in thousands)
9.069% Junior Subordinated Deferrable Debentures. . . . . . . . . . . . . . . $ 150,000 $150,000
8.480% Junior Subordinated Deferrable Debentures. . . . . . . . . . . . . . . 200,000 139,800
8.875% Senior Notes due 2040. . . . . . . . . . . . . . . . . . . . . . . . . . . . . . 250,000 250,000
$340,000 syndicated unsecured letter of credit facility . . . . . . . . . . . . . 340,000 —
$60,000 bilateral unsecured letter of credit facility . . . . . . . . . . . . . . . 60,000 —
$500,000 secured letter of credit facility . . . . . . . . . . . . . . . . . . . . . . . 500,000 268,944
Talbot FAL Facility(b) . . . . . . . . . . . . . . . . . . . . . . . . . . . . . . . . . . . . 25,000 25,000
IPC Bi-Lateral Facility . . . . . . . . . . . . . . . . . . . . . . . . . . . . . . . . . . . . 80,000 68,063
Total . . . . . . . . . . . . . . . . . . . . . . . . . . . . . . . . . . . . . . . . . . . . . . . . . $1,605,000 $901,807
(a) Indicates utilization of commitment amount, not drawn borrowings.
(b) Talbot operates in Lloyd’s through a corporate member, Talbot 2002 Underwriting Capital Ltd (“T02”), whichis the sole participant in Syndicate 1183. Lloyd’s sets T02’s required capital annually based on syndicate 1183’sbusiness plan, rating environment, reserving environment together with input arising from Lloyd’s discussionswith, inter alia, regulatory and rating agencies. Such capital, called Funds at Lloyd’s (“FAL”), comprises: cash,investments and undrawn letters of credit provided by various banks.
Please refer to Note 16 to the Consolidated Financial Statements (Part II, Item 8) for further discussion of theCompany’s debt and financing arrangements.
On January 21, 2010, the Company offered and sold $250.0 million of Senior Notes due 2040 (the“8.875% Senior Notes”) in a registered public offering. The 8.875% Senior Notes mature on January 26, 2040,and are redeemable at the Company’s option in whole any time or in part from time to time at a make-wholeredemption price. Interest on the 8.875% Senior Notes is payable at 8.875% per annum through January 26, 2040.Interest on the Notes is payable semi-annually in arrears on January 26 and July 26 of each year, commencing onJuly 26, 2010. The net proceeds of $244.0 million from the sale of the 8.875% Senior Notes, after the deduction ofcommissions paid to the underwriters in the transaction and other expenses, were used by the Company for generalcorporate purposes, which included the repurchase of our outstanding capital stock and dividends to ourshareholders.
Regulation
Validus Re, IPCRe Limited, AlphaCat Reinsurance and Talbot Insurance (Bermuda) Ltd. (“TIBL”) (the“Bermuda registered companies”) are registered under the Insurance Act 1978 of Bermuda (“the Act”). Under theAct, the Bermuda registered companies are required annually to prepare and file Statutory Financial Statements anda Statutory Financial Return. The Act also requires the Bermuda registered companies to meet minimum solvencyand liquidity requirements. For the year ended December 31, 2010, the Bermuda registered companies satisfiedthese requirements. Please refer to the Notes to the Consolidated Financial Statements (Part II, Item 8) for furtherdiscussion of statutory and regulatory requirements.
Bermuda law limits the maximum amount of annual dividends or distributions payable by Bermuda registeredcompanies to the Company and in certain cases requires the prior notification to, or the approval of, the BermudaMonetary Authority. Subject to such laws, the directors of the Bermuda registered companies have the unilateral
110
authority to declare or not declare dividends to the Company. There is no assurance that dividends will be declaredor paid in the future.
Talbot’s underwriting activities are regulated by the Financial Services Authority (“FSA”). The FSA hassubstantial powers of intervention in relation to the Lloyd’s managing agents which it regulates including the powerto remove their authorization to manage Lloyd’s syndicates. In addition, Talbot’s managing agent operates under theLloyd’s “franchise.” Lloyd’s approves annually Syndicate 1183’s business plan and any subsequent materialchanges, and the amount of capital required to support that plan. Lloyd’s may require changes to any business planpresented to it or additional capital to be provided to support the underwriting (known as Funds at Lloyd’s).
The UK Government has set out proposals to replace the current system of financial regulation, which itbelieves has weaknesses, with a new regulatory framework. The key weakness it identified was that no singleinstitution has the responsibility, authority and tools to monitor the financial system as a whole, and respondaccordingly. That power will be given to the Bank of England. The Government will create a new Financial PolicyCommittee (FPC) within the Bank, which will look at the wider economic and financial risks to the stability of thesystem.
In addition, the FSA will cease to exist in its current form, and the Government will create two new focusedfinancial regulators:
• A new Prudential Regulation Authority (PRA) which will be responsible for the day-to-day supervision offinancial institutions that are subject to significant prudential regulation. The PRA will adopt a morejudgment-focused approach to regulation so that business models can be challenged, risks identified andaction taken to preserve financial stability.
• An independent consumer protection and markets authority (CPMA) which will take a tough approach toregulating how firms conduct their business. The CPMA will have a strong mandate for promotingconfidence and transparency in financial services and to give greater protection for consumers of financialservices.
The consultation on the proposed reforms closed in October 2010 and the UK Government will present moredetailed policy and legislative proposals for further consultation early in 2011. The UK Government intends tointroduce legislation to implement its proposals in mid-2011 and the passage of legislation is expected to takeapproximately one year. The new regulatory framework is anticipated to be in place by the end of 2012.
Lloyd’s is keeping abreast of these developments and lobbying on behalf of the Market when necessary. It islikely that Lloyd’s itself and managing agency businesses will come under the day-to-day supervision of the PRA indue course.
Off-Balance Sheet Arrangements
The Company is not party to any off-balance sheet transaction, agreement or other contractual arrangement asdefined by Item 303(a) (4) of Regulation S-K to which an entity unconsolidated with the Company is a party thatmanagement believes is reasonably likely to have a current or future effect on its financial condition, revenues orexpenses, results of operations, liquidity, capital expenditures or capital resources that the Company believes ismaterial to investors.
Investments
A significant portion of (re)insurance contracts written by the Company provide short-tail reinsurancecoverage for losses resulting mainly from natural and man-made catastrophes, which could result in a significantamount of losses on short notice. Accordingly, the Company’s investment portfolio is structured to providesignificant liquidity and preserve capital, which means the investment portfolio contains a significant amount ofrelatively short-term fixed maturity investments, such as U.S. government securities, U.S. government-sponsoredenterprises securities, corporate debt securities and mortgage-backed and asset-backed securities.
Substantially all of the fixed maturity investments held at December 31, 2010 were publicly traded. AtDecember 31, 2010, the average duration of the Company’s fixed maturity portfolio was 2.27 years (December 31,
111

2009: 2.24 years) and the average rating of the portfolio was AA+ (December 31, 2009: AA+). At December 31,2010, the total fixed maturity portfolio was $4,823.9 million (December 31, 2009: $4,869.4 million), of which$2,946.5 million (December 31, 2009: $3,287.9 million) were rated AAA.
On September 4, 2009, as part of the IPC Acquisition, the Company assumed IPC’s investment portfoliocontaining $1,820.9 million of corporate bonds, $112.9 million of agency residential mortgage-backed securities,$234.7 million of equity mutual funds, $114.8 million fund of hedge funds and $11.0 million of equity mutual fundscontained within a deferred compensation trust. On September 9, 2009, the Company realized a gain of $4.5 millionon the disposition of $234.7 million of equity mutual funds. A redemption request for the fund of hedge funds hasbeen submitted for value as at October 31, 2009. The redemption amounted to $89.4 million and the company hasreceived full proceeds. As of December 31, 2010, the Company held a fund of hedge fund side pocket of$12.9 million. While a redemption request has been submitted, the timing of receipt of proceeds on the side pocketis indeterminable.
With the exception of the bank loan portfolio, the Company’s investment guidelines require that investmentsbe rated BBB- or higher at the time of purchase. The Company reports the ratings of its investment portfoliosecurities at the lower of Moody’s or Standard & Poor’s rating for each investment security and, as a result, theCompany’s investment portfolio now has $38.1 million of non-agency mortgage backed securities rated less thaninvestment grade. The other components of less than investment grade securities held by the Company atDecember 31, 2010 were $58.7 million of catastrophe bonds, $52.6 million of bank loans and $2.1 million ofcorporate bonds.
Cash and cash equivalents and investments held by Talbot of $1,489.2 million at December 31, 2010 were heldin trust for the benefit of cedants and policyholders and to facilitate the accreditation as an alien insurer/reinsurer bycertain regulators (December 31, 2009: $1,408.1 million). Total cash and cash equivalents and investments in Talbotwere $1,592.1 million at December 31, 2010 (December 31, 2009: $1,420.4 million).
As of December 31, 2010, the Company had approximately $1.6 million of asset-backed securities withsub-prime collateral (December 31, 2009: $4.2 million) and $9.9 million of Alt-A RMBS (December 31, 2009:$82.3 million).
Goodwill and Intangible Assets
The Company has performed an impairment analysis of its carried goodwill and indefinite lived intangibleassets as required by U.S. GAAP. The analysis included a comparison of the Company’s market capitalization tobook value ratio. Management has also evaluated the fair value of Talbot relative to its book value on the followingbasis:
1) Gross premium written for 2009 and 2010;
2) Internal demand for and valuation of syndicate capacity, and utilization of Lloyd’s licenses; and
3) External demand for syndicate capacity.
Reporting units are consistent with the segmental basis. Based on its analysis, management has concluded thatan impairment valuation is not required against the carried goodwill and indefinite lived intangible assets.
Cash Flows
During the year ended December 31, 2010 and 2009, the Company generated net cash from operating activitiesof $630.0 million and $551.1 million, respectively. Cash flows from operations generally represent premiumscollected, investment earnings realized and investment gains realized less losses and loss expenses paid andunderwriting and other expenses paid. Cash flows from operations may differ substantially from net income.
As of December 31, 2010 and December 31, 2009, the Company had cash and cash equivalents of$620.7 million and $387.6 million, respectively.
The Company has written certain (re)insurance business that has loss experience generally characterized ashaving low frequency and high severity. This results in volatility in both results and operational cash flows. The
112
potential for large claims or a series of claims under one or more reinsurance contracts means that substantial andunpredictable payments may be required within relatively short periods of time. As a result, cash flows fromoperating activities may fluctuate, perhaps significantly, between individual quarters and years. Managementbelieves the Company’s unused credit facility amounts and highly liquid investment portfolio are sufficient tosupport any potential operating cash flow deficiencies. Please refer to the table detailing the Company’s borrowingsand credit facilities as at December 31, 2010, presented above.
In addition to relying on premiums received and investment income from the investment portfolio, theCompany intends to meet these cash flow demands by carrying a substantial amount of short and medium terminvestments that would mature, or possibly be sold, prior to the settlement of expected liabilities. The Companycannot provide assurance, however, that it will successfully match the structure of its investments with its liabilitiesdue to uncertainty related to the timing and severity of loss events.
CAUTIONARY NOTE REGARDING FORWARD-LOOKING STATEMENTS
The Private Securities Litigation Reform Act of 1995 (“PSLRA”) provides a “safe harbor” for forward-lookingstatements. Any prospectus, prospectus supplement, the Company’s Annual Report to shareholders, any proxystatement, any other Form 10-K, Form 10-Q or Form 8-K of the Company or any other written or oral statementsmade by or on behalf of the Company may include forward-looking statements that reflect the Company’s currentviews with respect to future events and financial performance. Such statements include forward-looking statementsboth with respect to the Company in general, and to the insurance and reinsurance sectors in particular. Statementsthat include the words “expect”, “intend”, “plan”, “believe”, “project”, “anticipate”, “will”, “may”, and similarstatements of a future or forward-looking nature identify forward-looking statements for purposes of the PSLRA orotherwise. All forward-looking statements address matters that involve risks and uncertainties. Accordingly, thereare or will be important factors that could cause actual results to differ materially from those indicated in suchstatements and, therefore, you should not place undue reliance on any such statement.
We believe that these factors include, but are not limited to, the following:
• unpredictability and severity of catastrophic events;
• our ability to obtain and maintain ratings, which may affect by our ability to raise additional equity or debtfinancings, as well as other factors described herein;
• adequacy of the Company’s risk management and loss limitation methods;
• cyclicality of demand and pricing in the insurance and reinsurance markets;
• the Company’s ability to implement its business strategy during “soft” as well as “hard” markets;
• adequacy of the Company’s loss reserves;
• continued availability of capital and financing;
• the Company’s ability to identify, hire and retain, on a timely and unimpeded basis and on anticipatedeconomic and other terms, experienced and capable senior management, as well as underwriters, claimsprofessionals and support staff;
• acceptance of our business strategy, security and financial condition by rating agencies and regulators, aswell as by brokers and (re)insureds;
• competition, including increased competition, on the basis of pricing, capacity, coverage terms or otherfactors;
• potential loss of business from one or more major insurance or reinsurance brokers;
• the Company’s ability to implement, successfully and on a timely basis, complex infrastructure, distributioncapabilities, systems, procedures and internal controls, and to develop accurate actuarial data to support thebusiness and regulatory and reporting requirements;
113
• general economic and market conditions (including inflation, volatility in the credit and capital markets,interest rates and foreign currency exchange rates) and conditions specific to the insurance and reinsurancemarkets in which we operate;
• the integration of businesses we may acquire or new business ventures, including overseas offices, we maystart;
• accuracy of those estimates and judgments used in the preparation of our financial statements, including thoserelated to revenue recognition, insurance and other reserves, reinsurance recoverables, investment valuations,intangible assets, bad debts, taxes, contingencies, litigation and any determination to use the deposit method ofaccounting, which, for a relatively new insurance and reinsurance company like our company, are even moredifficult to make than those made in a mature company because of limited historical information;
• the effect on the Company’s investment portfolio of changing financial market conditions includinginflation, interest rates, liquidity and other factors;
• acts of terrorism, political unrest, outbreak of war and other hostilities or other non-forecasted andunpredictable events;
• availability and cost of reinsurance and retrocession coverage;
• the failure of reinsurers, retrocessionaires, producers or others to meet their obligations to us;
• the timing of loss payments being faster or the receipt of reinsurance recoverables being slower thananticipated by us;
• changes in domestic or foreign laws or regulations, or their interpretations;
• changes in accounting principles or the application of such principles by regulators;
• statutory or regulatory or rating agency developments, including as to tax policy and reinsurance and otherregulatory matters such as the adoption of proposed legislation that would affect Bermuda-headquarteredcompanies and/or Bermuda-based insurers or reinsurers; and
• the other factors set forth herein under Part I Item 1A “Risk Factors” and under Part II Item 7 “Management’sDiscussion and Analysis of Financial Condition and Results of Operations” and the other sections of thisAnnual Report on Form 10-K for the year ended December 31, 2010, as well as the risk and other factors setforth in the Company’s other filings with the SEC, as well as management’s response to any of theaforementioned factors.
In addition, other general factors could affect our results, including: (a) developments in the world’s financialand capital markets and our access to such markets; (b) changes in regulations or tax laws applicable to us,including, without limitation, any such changes resulting from the recent investigations relating to the insuranceindustry and any attendant litigation; and (c) the effects of business disruption or economic contraction due toterrorism or other hostilities.
The foregoing review of important factors should not be construed as exhaustive and should be read in conjunctionwith the other cautionary statements that are included herein or elsewhere. Any forward-looking statements made in thisreport are qualified by these cautionary statements, and there can be no assurance that the actual results or developmentsanticipated by us will be realized or, even if substantially realized, that they will have the expected consequences to, oreffects on, us or our business or operations. We undertake no obligation to update publicly or revise any forward-lookingstatement, whether as a result of new information, future developments or otherwise.
114

ITEM 7A. Quantitative And Qualitative Disclosures About Market Risk
We are principally exposed to five types of market risk:
• interest rate risk;
• foreign currency risk;
• credit risk;
• liquidity risk; and
• inflation risk.
Interest Rate Risk: The Company’s fixed maturity portfolio is exposed to interest rate risk. Fluctuations ininterest rates have a direct impact on the market valuation of these investments. As interest rates rise, the marketvalue of the Company’s fixed maturity portfolio falls and the Company has the risk that cash outflows will have tobe funded by selling assets, which will be trading at depreciated values. As interest rates decline, the market value ofthe Company’s fixed income portfolio increases and the Company has reinvestment risk, as funds reinvested willearn less than is necessary to match anticipated liabilities. We manage interest rate risk by selecting investmentswith characteristics such as duration, yield, currency and liquidity tailored to the anticipated cash outflowcharacteristics of the insurance and reinsurance liabilities the Company assumes.
As at December 31, 2010, the impact on the Company’s fixed maturity and short-term investments from animmediate 100 basis point increase in market interest rates (based on U.S. treasury yield) would have resulted in anestimated decrease in market value of 2.3%, or approximately $118.7 million. As at December 31, 2010, the impacton the Company’s fixed maturity portfolio from an immediate 100 basis point decrease in market interest rateswould have resulted in an estimated increase in market value of 2.0% or approximately $103.8 million.
As at December 31, 2009, the impact on the Company’s fixed maturity and short-term investments from animmediate 100 basis point increase in market interest rates would have resulted in an estimated decrease in marketvalue of 2.3%, or approximately $123.8 million. As at December 31, 2009, the impact on the Company’s fixedmaturity portfolio from an immediate 100 basis point decrease in market interest rates would have resulted in anestimated increase in market value of 2.1% or approximately $111.9 million.
As at December 31, 2010, the Company held $644.4 million (December 31, 2009: $768.6 million), or 13.4%(December 31, 2009: 15.8%), of the Company’s fixed maturity portfolio in asset-backed and mortgage-backedsecurities. These assets are exposed to prepayment risk, which occurs when holders of underlying loans increase thefrequency with which they prepay the outstanding principal before the maturity date and refinance at a lowerinterest rate cost. The adverse impact of prepayment is more evident in a declining interest rate environment. As aresult, the Company will be exposed to reinvestment risk, as cash flows received by the Company will beaccelerated and will be reinvested at the prevailing interest rates.
Foreign Currency Risk: Certain of the Company’s reinsurance contracts provide that ultimate losses may bepayable in foreign currencies depending on the country of original loss. Foreign currency exchange rate risk existsto the extent that there is an increase in the exchange rate of the foreign currency in which losses are ultimatelyowed. Therefore, we manage our foreign currency risk by seeking to match our liabilities under insurance andreinsurance policies that are payable in foreign currencies with cash and investments that are denominated in suchcurrencies. As of December 31, 2010, $545.2 million, or 7.7% of our total assets and $638.3 million, or 18.0% of ourtotal liabilities were held in foreign currencies. As of December 31, 2010, $87.0 million, or 2.4% of our totalliabilities held in foreign currencies was non-monetary items which do not require revaluation at each reportingdate. As of December 31, 2009, $405.4 million, or 5.8% of our total assets and $413.9 million, or 13.9% of our totalliabilities were held in foreign currencies. As of December 31, 2009, $81.2 million, or 2.7% of our total liabilitiesheld in foreign currencies were non-monetary items which do not require revaluation at each reporting date. Whennecessary, we may also use derivatives to economically hedge un-matched foreign currency exposures, specificallyforward contracts. Foreign currency forward contracts do not eliminate fluctuations in the value of our assets andliabilities denominated in foreign currencies but rather allow us to establish a rate of exchange for a future point intime. For further information on the accounting treatment of our foreign currency derivatives, refer to Item 8, Note 8
115
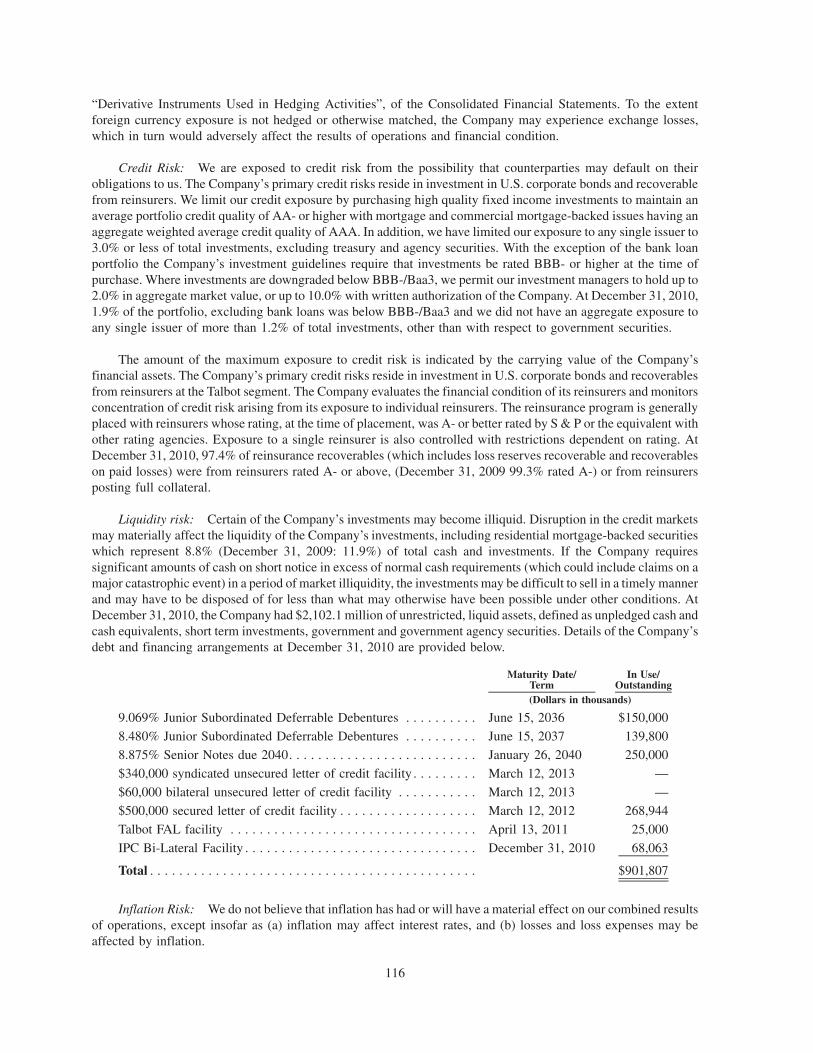
“Derivative Instruments Used in Hedging Activities”, of the Consolidated Financial Statements. To the extentforeign currency exposure is not hedged or otherwise matched, the Company may experience exchange losses,which in turn would adversely affect the results of operations and financial condition.
Credit Risk: We are exposed to credit risk from the possibility that counterparties may default on theirobligations to us. The Company’s primary credit risks reside in investment in U.S. corporate bonds and recoverablefrom reinsurers. We limit our credit exposure by purchasing high quality fixed income investments to maintain anaverage portfolio credit quality of AA- or higher with mortgage and commercial mortgage-backed issues having anaggregate weighted average credit quality of AAA. In addition, we have limited our exposure to any single issuer to3.0% or less of total investments, excluding treasury and agency securities. With the exception of the bank loanportfolio the Company’s investment guidelines require that investments be rated BBB- or higher at the time ofpurchase. Where investments are downgraded below BBB-/Baa3, we permit our investment managers to hold up to2.0% in aggregate market value, or up to 10.0% with written authorization of the Company. At December 31, 2010,1.9% of the portfolio, excluding bank loans was below BBB-/Baa3 and we did not have an aggregate exposure toany single issuer of more than 1.2% of total investments, other than with respect to government securities.
The amount of the maximum exposure to credit risk is indicated by the carrying value of the Company’sfinancial assets. The Company’s primary credit risks reside in investment in U.S. corporate bonds and recoverablesfrom reinsurers at the Talbot segment. The Company evaluates the financial condition of its reinsurers and monitorsconcentration of credit risk arising from its exposure to individual reinsurers. The reinsurance program is generallyplaced with reinsurers whose rating, at the time of placement, was A- or better rated by S & P or the equivalent withother rating agencies. Exposure to a single reinsurer is also controlled with restrictions dependent on rating. AtDecember 31, 2010, 97.4% of reinsurance recoverables (which includes loss reserves recoverable and recoverableson paid losses) were from reinsurers rated A- or above, (December 31, 2009 99.3% rated A-) or from reinsurersposting full collateral.
Liquidity risk: Certain of the Company’s investments may become illiquid. Disruption in the credit marketsmay materially affect the liquidity of the Company’s investments, including residential mortgage-backed securitieswhich represent 8.8% (December 31, 2009: 11.9%) of total cash and investments. If the Company requiressignificant amounts of cash on short notice in excess of normal cash requirements (which could include claims on amajor catastrophic event) in a period of market illiquidity, the investments may be difficult to sell in a timely mannerand may have to be disposed of for less than what may otherwise have been possible under other conditions. AtDecember 31, 2010, the Company had $2,102.1 million of unrestricted, liquid assets, defined as unpledged cash andcash equivalents, short term investments, government and government agency securities. Details of the Company’sdebt and financing arrangements at December 31, 2010 are provided below.
Maturity Date/Term
In Use/Outstanding
(Dollars in thousands)
9.069% Junior Subordinated Deferrable Debentures . . . . . . . . . . June 15, 2036 $150,000
8.480% Junior Subordinated Deferrable Debentures . . . . . . . . . . June 15, 2037 139,800
8.875% Senior Notes due 2040. . . . . . . . . . . . . . . . . . . . . . . . . . January 26, 2040 250,000
$340,000 syndicated unsecured letter of credit facility . . . . . . . . . March 12, 2013 —
$60,000 bilateral unsecured letter of credit facility . . . . . . . . . . . March 12, 2013 —
$500,000 secured letter of credit facility . . . . . . . . . . . . . . . . . . . March 12, 2012 268,944
Talbot FAL facility . . . . . . . . . . . . . . . . . . . . . . . . . . . . . . . . . . April 13, 2011 25,000
IPC Bi-Lateral Facility . . . . . . . . . . . . . . . . . . . . . . . . . . . . . . . . December 31, 2010 68,063
Total . . . . . . . . . . . . . . . . . . . . . . . . . . . . . . . . . . . . . . . . . . . . . $901,807
Inflation Risk: We do not believe that inflation has had or will have a material effect on our combined resultsof operations, except insofar as (a) inflation may affect interest rates, and (b) losses and loss expenses may beaffected by inflation.
116

Item 8. Financial Statements and Supplementary Data
Reference is made to Item 15 (a) of this Report for the Consolidated Financial Statements of Validus Holdings,Ltd. and the Notes thereto, as well as the Schedules to the Consolidated Financial Statements.
Item 9. Changes in and Disagreements with Accountants on Accounting and Financial Disclosure
None.
Item 9A. Controls and Procedures
Conclusion Regarding the Effectiveness of Disclosure Controls and Procedures
The Company carried out an evaluation, under the supervision and with the participation of the Company’smanagement, including the Chief Executive Officer and Chief Financial Officer, of the effectiveness of disclosurecontrols and procedures pursuant to Rules 13a-15 and 15d-15 promulgated under the Securities Exchange Act of1934, as amended, as of the end of the period covered by this report. Based on that evaluation, the Chief ExecutiveOfficer and Chief Financial Officer concluded that the disclosure controls and procedures are effective to providereasonable assurance that all material information relating to the Company required to be filed in this report hasbeen made known to them in a timely fashion.
Management’s Report on Internal Control Over Financial Reporting
The Company’s management is responsible for establishing and maintaining adequate internal control overfinancial reporting as defined in Rules 13a-15(f) and 15d-15(f) of the Securities Exchange Act of 1934, as amended.
The Company’s internal control over financial reporting was designed to provide reasonable assuranceregarding the reliability of financial reporting and the preparation of financial statements for external purposes inaccordance with generally accepted accounting principles.
The Company’s management assessed the effectiveness of the Company’s internal control over financialreporting as of December 31, 2010. In making this assessment, it used the criteria set forth by the Committee ofSponsoring Organizations of the Treadway Commission (COSO) in Internal Control-Integrated Framework (the“Framework”). Based on its assessment, management concluded that, as of December 31, 2010, the Company’sinternal control over financial reporting was effective based on the Framework criteria.
The effectiveness of the Company’s internal control over financial reporting as of December 31, 2010 has beenaudited by PricewaterhouseCoopers, an independent registered public accounting firm, as stated in their reportincluded in this filing.
Changes in Internal Control Over Financial Reporting
There have been no changes in internal control over financial reporting identified in connection with theCompany’s evaluation required pursuant to Rules 13a-15 and 15d-15 promulgated under the Securities ExchangeAct of 1934, as amended, that occurred during the most recent fiscal quarter that have materially affected, or arereasonably likely to materially affect, the Company’s internal control over financial reporting.
Item 9B. Other Information
None.
PART III
Item 10. Directors, Executive Officers and Corporate Governance
Certain of the information required by this item relating to the executive officers of the Company may be foundstarting at page 38. The balance of the information required by this item is omitted because a definitive proxystatement that involves the election of directors will be filed with the Securities and Exchange Commission not later
117

than 120 days after the close of the fiscal year pursuant to Regulation 14A, which proxy statement is incorporatedherein by reference.
Item 11. Executive Compensation
This item is omitted because a definitive proxy statement that involves the election of directors will be filedwith the Securities and Exchange Commission not later than 120 days after the close of the fiscal year pursuant toRegulation 14A, which proxy statement is incorporated herein by reference.
Item 12. Security Ownership of Certain Beneficial Owners and Management and Related ShareholderMatters
Equity Compensation Plan Information
The following table displays certain information regarding our equity compensation plan at December 31,2010:
Number of Securities tobe Issued Upon Exercise ofOutstanding Options and
Restricted Stock
Weighted-AverageExercise Price of
Outstanding Options
Number of SecuritiesRemaining Availablefor Future Issuance
Under EquityCompensation Plans
(Dollars in thousands)
2005 Amended and Restated Long-TermIncentive Plan . . . . . . . . . . . . . . . . . . . . 5,530,939 $20.19 $7,595,957
Director Stock Compensation Plan . . . . . . 4,727 — 52,416
The balance of the information required by this item is omitted because a definitive proxy statement thatinvolves the election of directors will be filed with the Securities and Exchange Commission not later than 120 daysafter the close of the fiscal year pursuant to Regulation 14A, which proxy statement is incorporated herein byreference.
Item 13. Certain Relationships and Related Transactions, and Director Independence
This item is omitted because a definitive proxy statement that involves the election of directors will be filedwith the Securities and Exchange Commission not later than 120 days after the close of the fiscal year pursuant toRegulation 14A, which proxy statement is incorporated herein by reference.
Item 14. Principal Accountant Fees and Services
This item is omitted because a definitive proxy statement that involves the election of directors will be filedwith the Securities and Exchange Commission not later than 120 days after the close of the fiscal year pursuant toRegulation 14A, which proxy statement is incorporated herein by reference.
PART IV
Item 15. Exhibits and Financial Statement Schedules
Financial Statements, Financial Statement Schedules and Exhibits.
a) Financial Statements and Financial Statement Schedules are included as pages F-1 to F-64.
b) The exhibits numbers followed by an asterisk (*) indicate exhibits physically filed with this Annual Reporton Form 10-K. All other exhibit numbers indicate exhibits filed by incorporation by reference.
118

EXHIBITSExhibitNumber Description of Document
3.1 Memorandum of Association dated October 10, 2005 (Incorporated by Reference from S-1 SEC FileNo. 333-139989)
3.2 Amended and Restated Bye-laws (Incorporated by Reference from S-1 SEC File No. 333-139989)
4.1 Specimen Common Share Certificate (Incorporated by Reference from S-1 SEC FileNo. 333-139989)
4.2 Certificate of Deposit of Memorandum of Increase of Share Capital dated October 28, 2005(Incorporated by Reference from S-1 SEC File No. 333-139989)
4.3 Form of Warrant (Incorporated by Reference from S-1 SEC File No. 333-139989)
4.4 Form of Amendment to Warrants dated as of December 21, 2007 (Incorporated by Reference from8-K filed with the SEC on December 1, 2007)
4.5 9.069% Junior Subordinated Deferrable Debentures Indenture dated as of June 15, 2006(Incorporated by Reference from S-1 SEC File No. 333-139989)
4.6 Form of 9.069% Junior Subordinated Deferrable Debentures (Included in Exhibit 10.8 hereto)(Incorporated by Reference from S-1 SEC File No. 333-139989)
4.7 First Supplemental Indenture to the above Indenture dated as of September 15, 2006 (Incorporated byReference from S-1 SEC File No. 333-139989)
4.8 8.480% Junior Subordinated Deferrable Debentures Indenture dated as of June 29, 2007(Incorporated by Reference from S-1 SEC File No. 333-139989)
4.9 Form 8.480% Junior Subordinated Deferrable Debentures (Included in Exhibit 10.8 hereto)(Incorporated by Reference from S-1 SEC File No. 333-139989)
4.10 Senior Note Indenture, by and between Validus Holdings, Ltd. and The Bank of New York Mellon,dated January 26, 2010 (Incorporated by reference to the Company’s Current Report on Form 8-Kfiled with the SEC on January 26, 2010)
4.11 8.875% Senior Notes Supplemental Indenture, by and between Validus Holdings, Ltd. and The Bankof New York Mellon, dated January 26, 2010 (Incorporated by reference to the Company’s CurrentReport on Form 8-K filed with the SEC on January 26, 2010)
4.12 Form of 8.875% Senior Note (Included in Exhibit 4.9 hereto) (Incorporated by reference to theCompany’s Current Report on Form 8-K filed with the SEC on January 26, 2010)
10.1 Shareholders’ Agreement dated as of December 12, 2005 among Validus Holdings, Ltd. and theShareholders Named Therein (Incorporated by Reference from S-1 SEC File No. 333-139989)
10.2 Repurchase Agreement, entered into as of November 4, 2010, by and between Validus Holdings, Ltd.and the Aquiline Capital Partners LLC entities listed on Schedule A thereto (Incorporated byreference from the Company’s Current Report on Form 8-K filed with the SEC on November 5, 2010)
10.3 Repurchase Agreement, entered into as of November 4, 2010, by and between Validus Holdings, Ltd.and the New Mountain Capital, LLC entities listed on Schedule A thereto (Incorporated by referencefrom the Company’s Current Report on Form 8-K filed with the SEC on November 5, 2010)
10.4 Repurchase Agreement, entered into as of November 4, 2010, by and between Validus Holdings, Ltd.and the Vestar Capital Partners entities listed on Schedule A thereto (Incorporated by reference fromthe Company’s Current Report on Form 8-K filed with the SEC on November 5, 2010)
10.5 Five-Year Secured Letter of Credit Facility Agreement (Incorporated by Reference from S-1 SECFile No. 333-139989)
10.6 Three-Year Unsecured Letter of Credit Facility Agreement (Incorporated by Reference from S-1SEC File No. 333-139989)
10.7 First Amendment to each of the Three-Year Unsecured Letter of Credit Facility Agreement and theFive-Year Secured Letter of Credit Facility Agreement (Incorporated by Reference from 8-K filedwith the SEC on October 26, 2007)
119
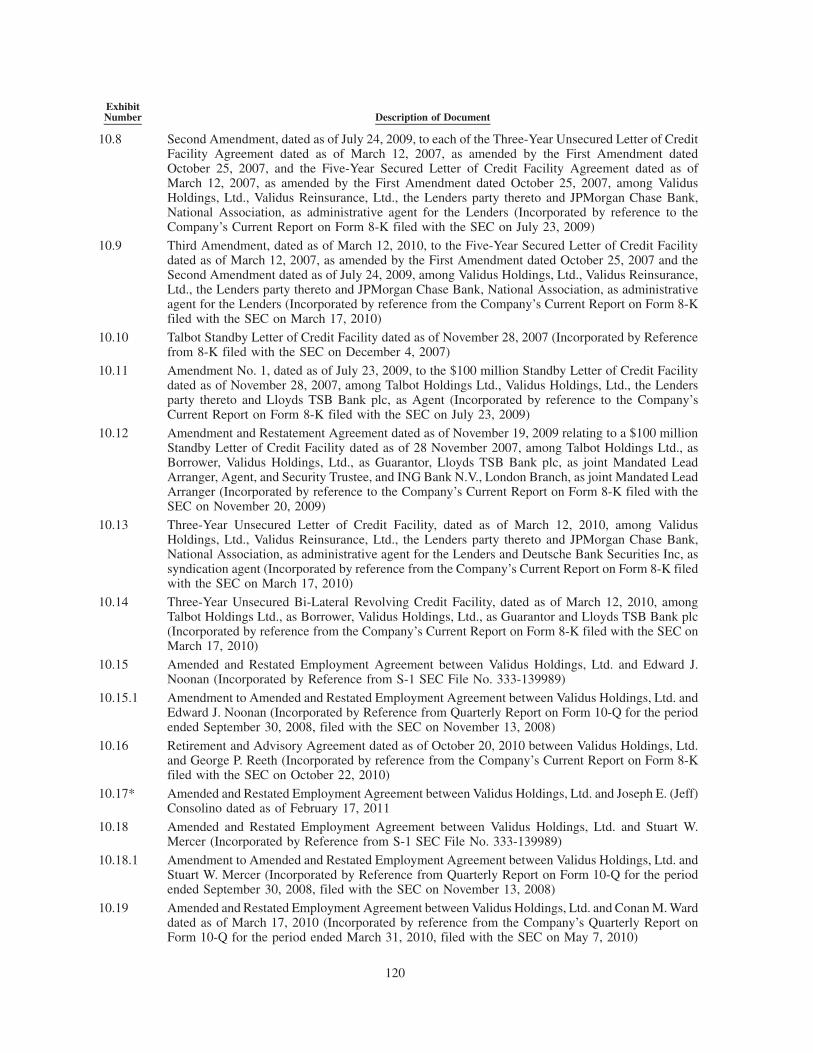
ExhibitNumber Description of Document
10.8 Second Amendment, dated as of July 24, 2009, to each of the Three-Year Unsecured Letter of CreditFacility Agreement dated as of March 12, 2007, as amended by the First Amendment datedOctober 25, 2007, and the Five-Year Secured Letter of Credit Facility Agreement dated as ofMarch 12, 2007, as amended by the First Amendment dated October 25, 2007, among ValidusHoldings, Ltd., Validus Reinsurance, Ltd., the Lenders party thereto and JPMorgan Chase Bank,National Association, as administrative agent for the Lenders (Incorporated by reference to theCompany’s Current Report on Form 8-K filed with the SEC on July 23, 2009)
10.9 Third Amendment, dated as of March 12, 2010, to the Five-Year Secured Letter of Credit Facilitydated as of March 12, 2007, as amended by the First Amendment dated October 25, 2007 and theSecond Amendment dated as of July 24, 2009, among Validus Holdings, Ltd., Validus Reinsurance,Ltd., the Lenders party thereto and JPMorgan Chase Bank, National Association, as administrativeagent for the Lenders (Incorporated by reference from the Company’s Current Report on Form 8-Kfiled with the SEC on March 17, 2010)
10.10 Talbot Standby Letter of Credit Facility dated as of November 28, 2007 (Incorporated by Referencefrom 8-K filed with the SEC on December 4, 2007)
10.11 Amendment No. 1, dated as of July 23, 2009, to the $100 million Standby Letter of Credit Facilitydated as of November 28, 2007, among Talbot Holdings Ltd., Validus Holdings, Ltd., the Lendersparty thereto and Lloyds TSB Bank plc, as Agent (Incorporated by reference to the Company’sCurrent Report on Form 8-K filed with the SEC on July 23, 2009)
10.12 Amendment and Restatement Agreement dated as of November 19, 2009 relating to a $100 millionStandby Letter of Credit Facility dated as of 28 November 2007, among Talbot Holdings Ltd., asBorrower, Validus Holdings, Ltd., as Guarantor, Lloyds TSB Bank plc, as joint Mandated LeadArranger, Agent, and Security Trustee, and ING Bank N.V., London Branch, as joint Mandated LeadArranger (Incorporated by reference to the Company’s Current Report on Form 8-K filed with theSEC on November 20, 2009)
10.13 Three-Year Unsecured Letter of Credit Facility, dated as of March 12, 2010, among ValidusHoldings, Ltd., Validus Reinsurance, Ltd., the Lenders party thereto and JPMorgan Chase Bank,National Association, as administrative agent for the Lenders and Deutsche Bank Securities Inc, assyndication agent (Incorporated by reference from the Company’s Current Report on Form 8-K filedwith the SEC on March 17, 2010)
10.14 Three-Year Unsecured Bi-Lateral Revolving Credit Facility, dated as of March 12, 2010, amongTalbot Holdings Ltd., as Borrower, Validus Holdings, Ltd., as Guarantor and Lloyds TSB Bank plc(Incorporated by reference from the Company’s Current Report on Form 8-K filed with the SEC onMarch 17, 2010)
10.15 Amended and Restated Employment Agreement between Validus Holdings, Ltd. and Edward J.Noonan (Incorporated by Reference from S-1 SEC File No. 333-139989)
10.15.1 Amendment to Amended and Restated Employment Agreement between Validus Holdings, Ltd. andEdward J. Noonan (Incorporated by Reference from Quarterly Report on Form 10-Q for the periodended September 30, 2008, filed with the SEC on November 13, 2008)
10.16 Retirement and Advisory Agreement dated as of October 20, 2010 between Validus Holdings, Ltd.and George P. Reeth (Incorporated by reference from the Company’s Current Report on Form 8-Kfiled with the SEC on October 22, 2010)
10.17* Amended and Restated Employment Agreement between Validus Holdings, Ltd. and Joseph E. (Jeff)Consolino dated as of February 17, 2011
10.18 Amended and Restated Employment Agreement between Validus Holdings, Ltd. and Stuart W.Mercer (Incorporated by Reference from S-1 SEC File No. 333-139989)
10.18.1 Amendment to Amended and Restated Employment Agreement between Validus Holdings, Ltd. andStuart W. Mercer (Incorporated by Reference from Quarterly Report on Form 10-Q for the periodended September 30, 2008, filed with the SEC on November 13, 2008)
10.19 Amended and Restated Employment Agreement between Validus Holdings, Ltd. and Conan M. Warddated as of March 17, 2010 (Incorporated by reference from the Company’s Quarterly Report onForm 10-Q for the period ended March 31, 2010, filed with the SEC on May 7, 2010)
120
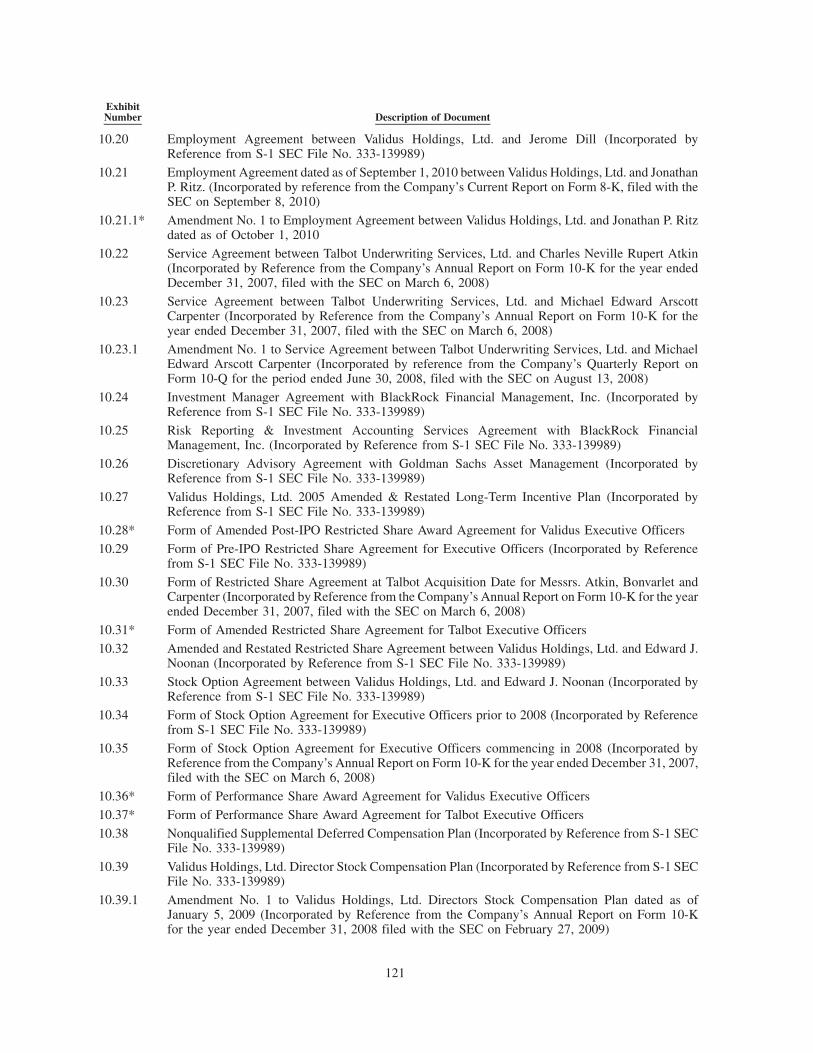
ExhibitNumber Description of Document
10.20 Employment Agreement between Validus Holdings, Ltd. and Jerome Dill (Incorporated byReference from S-1 SEC File No. 333-139989)
10.21 Employment Agreement dated as of September 1, 2010 between Validus Holdings, Ltd. and JonathanP. Ritz. (Incorporated by reference from the Company’s Current Report on Form 8-K, filed with theSEC on September 8, 2010)
10.21.1* Amendment No. 1 to Employment Agreement between Validus Holdings, Ltd. and Jonathan P. Ritzdated as of October 1, 2010
10.22 Service Agreement between Talbot Underwriting Services, Ltd. and Charles Neville Rupert Atkin(Incorporated by Reference from the Company’s Annual Report on Form 10-K for the year endedDecember 31, 2007, filed with the SEC on March 6, 2008)
10.23 Service Agreement between Talbot Underwriting Services, Ltd. and Michael Edward ArscottCarpenter (Incorporated by Reference from the Company’s Annual Report on Form 10-K for theyear ended December 31, 2007, filed with the SEC on March 6, 2008)
10.23.1 Amendment No. 1 to Service Agreement between Talbot Underwriting Services, Ltd. and MichaelEdward Arscott Carpenter (Incorporated by reference from the Company’s Quarterly Report onForm 10-Q for the period ended June 30, 2008, filed with the SEC on August 13, 2008)
10.24 Investment Manager Agreement with BlackRock Financial Management, Inc. (Incorporated byReference from S-1 SEC File No. 333-139989)
10.25 Risk Reporting & Investment Accounting Services Agreement with BlackRock FinancialManagement, Inc. (Incorporated by Reference from S-1 SEC File No. 333-139989)
10.26 Discretionary Advisory Agreement with Goldman Sachs Asset Management (Incorporated byReference from S-1 SEC File No. 333-139989)
10.27 Validus Holdings, Ltd. 2005 Amended & Restated Long-Term Incentive Plan (Incorporated byReference from S-1 SEC File No. 333-139989)
10.28* Form of Amended Post-IPO Restricted Share Award Agreement for Validus Executive Officers
10.29 Form of Pre-IPO Restricted Share Agreement for Executive Officers (Incorporated by Referencefrom S-1 SEC File No. 333-139989)
10.30 Form of Restricted Share Agreement at Talbot Acquisition Date for Messrs. Atkin, Bonvarlet andCarpenter (Incorporated by Reference from the Company’s Annual Report on Form 10-K for the yearended December 31, 2007, filed with the SEC on March 6, 2008)
10.31* Form of Amended Restricted Share Agreement for Talbot Executive Officers
10.32 Amended and Restated Restricted Share Agreement between Validus Holdings, Ltd. and Edward J.Noonan (Incorporated by Reference from S-1 SEC File No. 333-139989)
10.33 Stock Option Agreement between Validus Holdings, Ltd. and Edward J. Noonan (Incorporated byReference from S-1 SEC File No. 333-139989)
10.34 Form of Stock Option Agreement for Executive Officers prior to 2008 (Incorporated by Referencefrom S-1 SEC File No. 333-139989)
10.35 Form of Stock Option Agreement for Executive Officers commencing in 2008 (Incorporated byReference from the Company’s Annual Report on Form 10-K for the year ended December 31, 2007,filed with the SEC on March 6, 2008)
10.36* Form of Performance Share Award Agreement for Validus Executive Officers
10.37* Form of Performance Share Award Agreement for Talbot Executive Officers
10.38 Nonqualified Supplemental Deferred Compensation Plan (Incorporated by Reference from S-1 SECFile No. 333-139989)
10.39 Validus Holdings, Ltd. Director Stock Compensation Plan (Incorporated by Reference from S-1 SECFile No. 333-139989)
10.39.1 Amendment No. 1 to Validus Holdings, Ltd. Directors Stock Compensation Plan dated as ofJanuary 5, 2009 (Incorporated by Reference from the Company’s Annual Report on Form 10-Kfor the year ended December 31, 2008 filed with the SEC on February 27, 2009)
121

ExhibitNumber Description of Document
10.40 Share Sale Agreement between Validus Holdings, Ltd. and the Shareholders of Talbot Holdings Ltd.(Incorporated by Reference from S-1 SEC File No. 333-139989)
10.41 Agreement to Provide Information between Validus Holdings, Ltd. and Talbot Holdings Ltd.(Incorporated by Reference from S-1 SEC File No. 333-139989)
10.42 Agreement and Plan of Amalgamation, dated as of July 9, 2009, among IPC Holdings, Ltd., ValidusHoldings, Ltd. and Validus Ltd. (Incorporated by reference to the Company’s Current Report onForm 8-K filed with the SEC on July 9, 2009)
21* Subsidiaries of the Registrant
23* Consent of PricewaterhouseCoopers
24 Power of attorney (Incorporated by Reference from signature page)
31* Rule 13a-14(a)/15d-14(a) Certifications
32* Section 1350 Certification
101.1 INS* XBRL Instance Document
101.SCH* XBRL Taxonomy Extension Schema Document
101.CAL* XBRL Taxonomy Calculation Linkbase Document
101.LAB* XBRL Taxonomy Extension Label Linkbase Document
101.PRE* XBRL Taxonomy Extension Presentation Linkbase Document
101.DEF* XBRL Taxonomy Extension Definition Linkbase Document
* Filed herewith
122
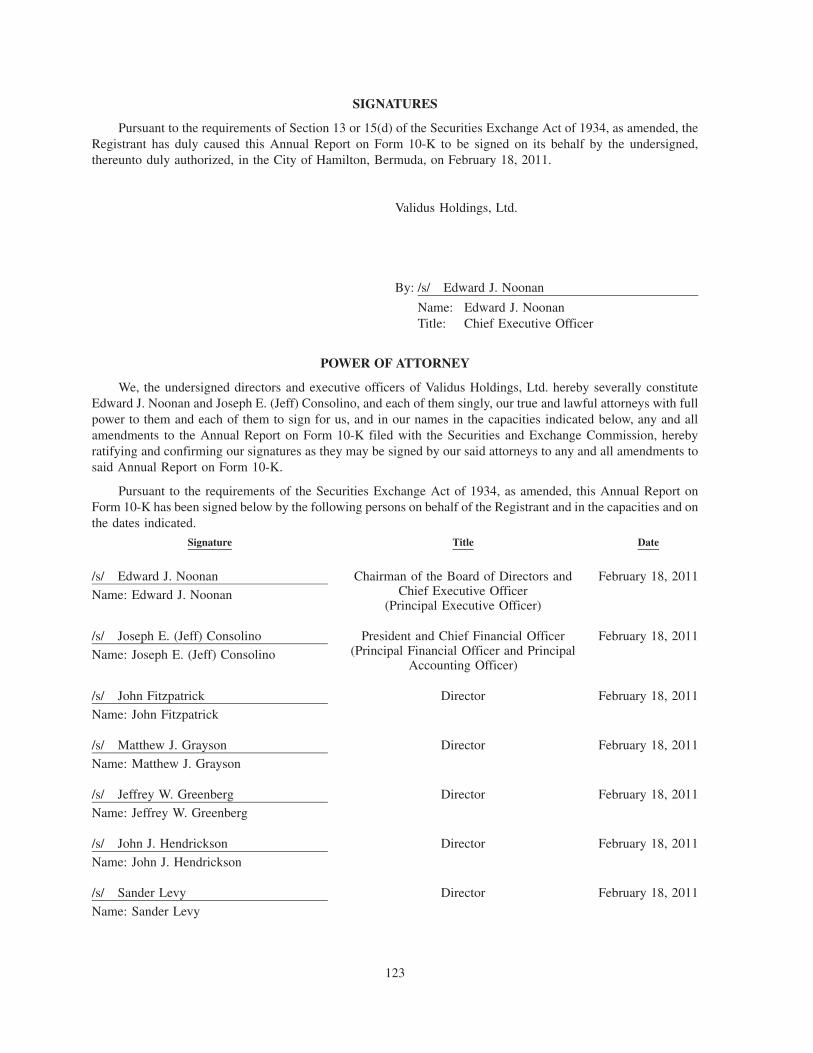
SIGNATURES
Pursuant to the requirements of Section 13 or 15(d) of the Securities Exchange Act of 1934, as amended, theRegistrant has duly caused this Annual Report on Form 10-K to be signed on its behalf by the undersigned,thereunto duly authorized, in the City of Hamilton, Bermuda, on February 18, 2011.
Validus Holdings, Ltd.
By: /s/ Edward J. Noonan
Name: Edward J. NoonanTitle: Chief Executive Officer
POWER OF ATTORNEY
We, the undersigned directors and executive officers of Validus Holdings, Ltd. hereby severally constituteEdward J. Noonan and Joseph E. (Jeff) Consolino, and each of them singly, our true and lawful attorneys with fullpower to them and each of them to sign for us, and in our names in the capacities indicated below, any and allamendments to the Annual Report on Form 10-K filed with the Securities and Exchange Commission, herebyratifying and confirming our signatures as they may be signed by our said attorneys to any and all amendments tosaid Annual Report on Form 10-K.
Pursuant to the requirements of the Securities Exchange Act of 1934, as amended, this Annual Report onForm 10-K has been signed below by the following persons on behalf of the Registrant and in the capacities and onthe dates indicated.
Signature Title Date
/s/ Edward J. Noonan
Name: Edward J. Noonan
Chairman of the Board of Directors andChief Executive Officer
(Principal Executive Officer)
February 18, 2011
/s/ Joseph E. (Jeff) Consolino
Name: Joseph E. (Jeff) Consolino
President and Chief Financial Officer(Principal Financial Officer and Principal
Accounting Officer)
February 18, 2011
/s/ John Fitzpatrick
Name: John Fitzpatrick
Director February 18, 2011
/s/ Matthew J. Grayson
Name: Matthew J. Grayson
Director February 18, 2011
/s/ Jeffrey W. GreenbergName: Jeffrey W. Greenberg
Director February 18, 2011
/s/ John J. Hendrickson
Name: John J. Hendrickson
Director February 18, 2011
/s/ Sander Levy
Name: Sander Levy
Director February 18, 2011
123

Signature Title Date
/s/ Jean-Marie Nessi
Name: Jean-Marie Nessi
Director February 18, 2011
/s/ Mandakini Puri
Name: Mandakini Puri
Director February 18, 2011
/s/ Christopher E. Watson
Name: Christopher E. Watson
Director February 18, 2011
124

INDEX TO CONSOLIDATED FINANCIAL STATEMENTSAND FINANCIAL STATEMENT SCHEDULES
Page No.
Consolidated Financial StatementsReport of Independent Registered Public Accounting Firm . . . . . . . . . . . . . . . . . . . . . . . . . . . . . . . . 126
Consolidated Balance Sheets as at December 31, 2010 and 2009 . . . . . . . . . . . . . . . . . . . . . . . . . . . F-1
Consolidated Statements of Operations and Comprehensive Income (Loss) for the Years EndedDecember 31, 2010, 2009 and 2008 . . . . . . . . . . . . . . . . . . . . . . . . . . . . . . . . . . . . . . . . . . . . . . . F-2
Consolidated Statements of Shareholders’ Equity for the Years Ended December 31, 2010, 2009 and2008 . . . . . . . . . . . . . . . . . . . . . . . . . . . . . . . . . . . . . . . . . . . . . . . . . . . . . . . . . . . . . . . . . . . . . . F-3
Consolidated Statements of Cash Flows for the Years Ended December 31, 2010, 2009 and 2008 . . . F-4
Notes to Consolidated Financial Statements . . . . . . . . . . . . . . . . . . . . . . . . . . . . . . . . . . . . . . . . . . . F-5
Financial Statement Schedules:I. Summary of Investments Other than Investments in Related Parties . . . . . . . . . . . . . . . . . . . . . . . . F-58
II. Condensed Financial Information (Parent Only) . . . . . . . . . . . . . . . . . . . . . . . . . . . . . . . . . . . . . . F-59
III. Supplementary Insurance Information . . . . . . . . . . . . . . . . . . . . . . . . . . . . . . . . . . . . . . . . . . . . . F-62
IV. Supplementary Reinsurance Information . . . . . . . . . . . . . . . . . . . . . . . . . . . . . . . . . . . . . . . . . . . F-63
VI. Supplementary Information Concerning Property/Casualty (Re)insurance Information . . . . . . . . . F-64
Schedules other than those listed are omitted for the reason that they are not required, are not applicable or thatequivalent information has been included in the financial statements, notes thereto, or elsewhere herein.
125
Report of Independent Registered Public Accounting Firm
To the Board of Directors and Shareholders of Validus Holdings, Ltd.
In our opinion, the consolidated financial statements listed in the accompanying index present fairly, in allmaterial respects, the financial position of Validus Holdings, Ltd. and its subsidiaries at December 31, 2010 andDecember 31, 2009, and the results of their operations and their cash flows for each of the three years in the periodended December 31, 2010 in conformity with accounting principles generally accepted in the United States ofAmerica. In addition, in our opinion, the financial statement schedules listed in the accompanying index presentfairly, in all material respects, the information set forth therein when read in conjunction with the relatedconsolidated financial statements. Also in our opinion, the Company maintained, in all material respects, effectiveinternal control over financial reporting as of December 31, 2010, based on criteria established in InternalControl — Integrated Framework issued by the Committee of Sponsoring Organizations of the Treadway Com-mission (COSO). The Company’s management is responsible for these financial statements and financial statementschedules, for maintaining effective internal control over financial reporting and for its assessment of theeffectiveness of internal control over financial reporting, included in Management’s Report on Internal Controlover Financial Reporting. Our responsibility is to express opinions on these financial statements, on the financialstatement schedules, and on the Company’s internal control over financial reporting based on our integrated audits.We conducted our audits in accordance with the standards of the Public Company Accounting Oversight Board(United States). Those standards require that we plan and perform the audits to obtain reasonable assurance aboutwhether the financial statements are free of material misstatement and whether effective internal control overfinancial reporting was maintained in all material respects. Our audits of the financial statements includedexamining, on a test basis, evidence supporting the amounts and disclosures in the financial statements, assessingthe accounting principles used and significant estimates made by management, and evaluating the overall financialstatement presentation. Our audit of internal control over financial reporting included obtaining an understanding ofinternal control over financial reporting, assessing the risk that a material weakness exists, and testing andevaluating the design and operating effectiveness of internal control based on the assessed risk. Our audits alsoincluded performing such other procedures as we considered necessary in the circumstances. We believe that ouraudits provide a reasonable basis for our opinions.
A company’s internal control over financial reporting is a process designed to provide reasonable assuranceregarding the reliability of financial reporting and the preparation of financial statements for external purposes inaccordance with generally accepted accounting principles. A company’s internal control over financial reportingincludes those policies and procedures that (i) pertain to the maintenance of records that, in reasonable detail,accurately and fairly reflect the transactions and dispositions of the assets of the company; (ii) provide reasonableassurance that transactions are recorded as necessary to permit preparation of financial statements in accordancewith generally accepted accounting principles, and that receipts and expenditures of the company are being madeonly in accordance with authorizations of management and directors of the company; and (iii) provide reasonableassurance regarding prevention or timely detection of unauthorized acquisition, use, or disposition of the company’sassets that could have a material effect on the financial statements.
Because of its inherent limitations, internal control over financial reporting may not prevent or detectmisstatements. Also, projections of any evaluation of effectiveness to future periods are subject to the risk thatcontrols may become inadequate because of changes in conditions, or that the degree of compliance with thepolicies or procedures may deteriorate.
/s/ PricewaterhouseCoopers
PricewaterhouseCoopers
Hamilton, BermudaFebruary 18, 2011
126
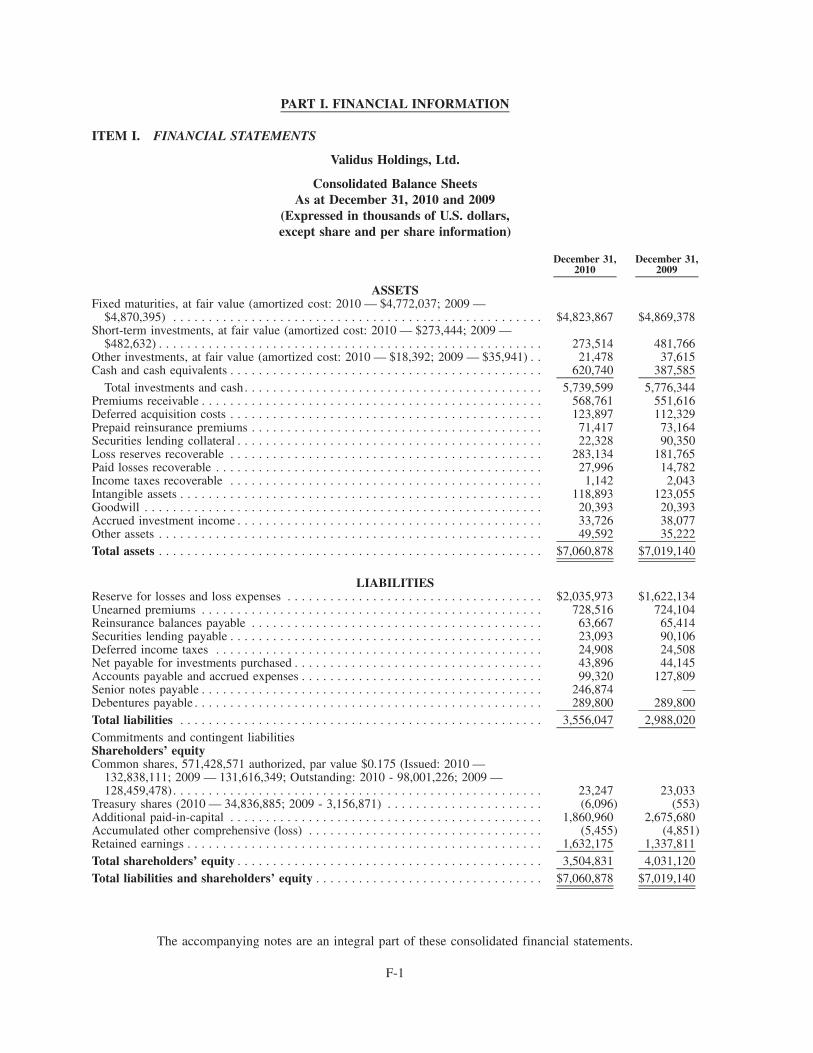
PART I. FINANCIAL INFORMATION
ITEM I. FINANCIAL STATEMENTS
Validus Holdings, Ltd.
Consolidated Balance SheetsAs at December 31, 2010 and 2009
(Expressed in thousands of U.S. dollars,except share and per share information)
December 31,2010
December 31,2009
ASSETSFixed maturities, at fair value (amortized cost: 2010 — $4,772,037; 2009 —
$4,870,395) . . . . . . . . . . . . . . . . . . . . . . . . . . . . . . . . . . . . . . . . . . . . . . . . . . . . $4,823,867 $4,869,378Short-term investments, at fair value (amortized cost: 2010 — $273,444; 2009 —
$482,632) . . . . . . . . . . . . . . . . . . . . . . . . . . . . . . . . . . . . . . . . . . . . . . . . . . . . . . 273,514 481,766Other investments, at fair value (amortized cost: 2010 — $18,392; 2009 — $35,941) . . 21,478 37,615Cash and cash equivalents . . . . . . . . . . . . . . . . . . . . . . . . . . . . . . . . . . . . . . . . . . . . 620,740 387,585
Total investments and cash. . . . . . . . . . . . . . . . . . . . . . . . . . . . . . . . . . . . . . . . . . 5,739,599 5,776,344Premiums receivable . . . . . . . . . . . . . . . . . . . . . . . . . . . . . . . . . . . . . . . . . . . . . . . . 568,761 551,616Deferred acquisition costs . . . . . . . . . . . . . . . . . . . . . . . . . . . . . . . . . . . . . . . . . . . . 123,897 112,329Prepaid reinsurance premiums . . . . . . . . . . . . . . . . . . . . . . . . . . . . . . . . . . . . . . . . . 71,417 73,164Securities lending collateral . . . . . . . . . . . . . . . . . . . . . . . . . . . . . . . . . . . . . . . . . . . 22,328 90,350Loss reserves recoverable . . . . . . . . . . . . . . . . . . . . . . . . . . . . . . . . . . . . . . . . . . . . 283,134 181,765Paid losses recoverable . . . . . . . . . . . . . . . . . . . . . . . . . . . . . . . . . . . . . . . . . . . . . . 27,996 14,782Income taxes recoverable . . . . . . . . . . . . . . . . . . . . . . . . . . . . . . . . . . . . . . . . . . . . 1,142 2,043Intangible assets . . . . . . . . . . . . . . . . . . . . . . . . . . . . . . . . . . . . . . . . . . . . . . . . . . . 118,893 123,055Goodwill . . . . . . . . . . . . . . . . . . . . . . . . . . . . . . . . . . . . . . . . . . . . . . . . . . . . . . . . 20,393 20,393Accrued investment income . . . . . . . . . . . . . . . . . . . . . . . . . . . . . . . . . . . . . . . . . . . 33,726 38,077Other assets . . . . . . . . . . . . . . . . . . . . . . . . . . . . . . . . . . . . . . . . . . . . . . . . . . . . . . 49,592 35,222Total assets . . . . . . . . . . . . . . . . . . . . . . . . . . . . . . . . . . . . . . . . . . . . . . . . . . . . . . $7,060,878 $7,019,140
LIABILITIESReserve for losses and loss expenses . . . . . . . . . . . . . . . . . . . . . . . . . . . . . . . . . . . . $2,035,973 $1,622,134Unearned premiums . . . . . . . . . . . . . . . . . . . . . . . . . . . . . . . . . . . . . . . . . . . . . . . . 728,516 724,104Reinsurance balances payable . . . . . . . . . . . . . . . . . . . . . . . . . . . . . . . . . . . . . . . . . 63,667 65,414Securities lending payable . . . . . . . . . . . . . . . . . . . . . . . . . . . . . . . . . . . . . . . . . . . . 23,093 90,106Deferred income taxes . . . . . . . . . . . . . . . . . . . . . . . . . . . . . . . . . . . . . . . . . . . . . . 24,908 24,508Net payable for investments purchased . . . . . . . . . . . . . . . . . . . . . . . . . . . . . . . . . . . 43,896 44,145Accounts payable and accrued expenses . . . . . . . . . . . . . . . . . . . . . . . . . . . . . . . . . . 99,320 127,809Senior notes payable . . . . . . . . . . . . . . . . . . . . . . . . . . . . . . . . . . . . . . . . . . . . . . . . 246,874 —Debentures payable . . . . . . . . . . . . . . . . . . . . . . . . . . . . . . . . . . . . . . . . . . . . . . . . . 289,800 289,800Total liabilities . . . . . . . . . . . . . . . . . . . . . . . . . . . . . . . . . . . . . . . . . . . . . . . . . . . 3,556,047 2,988,020Commitments and contingent liabilitiesShareholders’ equityCommon shares, 571,428,571 authorized, par value $0.175 (Issued: 2010 —
132,838,111; 2009 — 131,616,349; Outstanding: 2010 - 98,001,226; 2009 —128,459,478). . . . . . . . . . . . . . . . . . . . . . . . . . . . . . . . . . . . . . . . . . . . . . . . . . . . 23,247 23,033
Treasury shares (2010 — 34,836,885; 2009 - 3,156,871) . . . . . . . . . . . . . . . . . . . . . . (6,096) (553)Additional paid-in-capital . . . . . . . . . . . . . . . . . . . . . . . . . . . . . . . . . . . . . . . . . . . . 1,860,960 2,675,680Accumulated other comprehensive (loss) . . . . . . . . . . . . . . . . . . . . . . . . . . . . . . . . . (5,455) (4,851)Retained earnings . . . . . . . . . . . . . . . . . . . . . . . . . . . . . . . . . . . . . . . . . . . . . . . . . . 1,632,175 1,337,811Total shareholders’ equity . . . . . . . . . . . . . . . . . . . . . . . . . . . . . . . . . . . . . . . . . . . 3,504,831 4,031,120Total liabilities and shareholders’ equity . . . . . . . . . . . . . . . . . . . . . . . . . . . . . . . . $7,060,878 $7,019,140
The accompanying notes are an integral part of these consolidated financial statements.
F-1
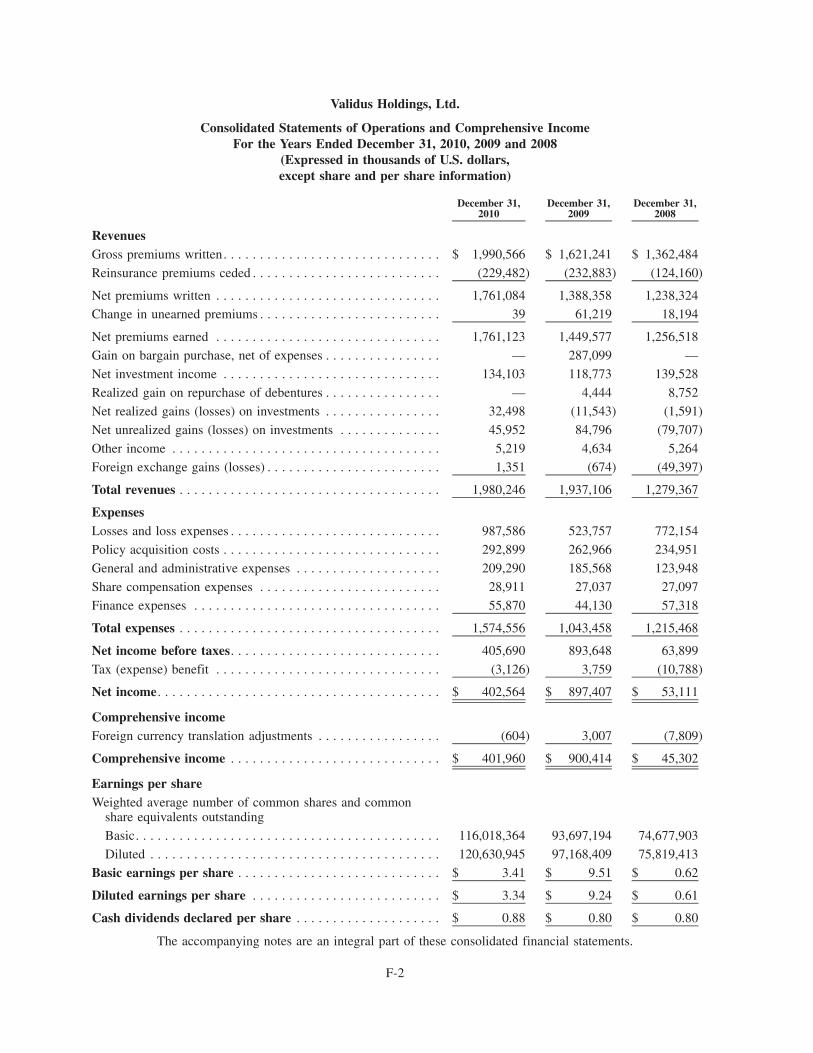
Validus Holdings, Ltd.
Consolidated Statements of Operations and Comprehensive IncomeFor the Years Ended December 31, 2010, 2009 and 2008
(Expressed in thousands of U.S. dollars,except share and per share information)
December 31,2010
December 31,2009
December 31,2008
RevenuesGross premiums written. . . . . . . . . . . . . . . . . . . . . . . . . . . . . . $ 1,990,566 $ 1,621,241 $ 1,362,484
Reinsurance premiums ceded . . . . . . . . . . . . . . . . . . . . . . . . . . (229,482) (232,883) (124,160)
Net premiums written . . . . . . . . . . . . . . . . . . . . . . . . . . . . . . . 1,761,084 1,388,358 1,238,324Change in unearned premiums . . . . . . . . . . . . . . . . . . . . . . . . . 39 61,219 18,194
Net premiums earned . . . . . . . . . . . . . . . . . . . . . . . . . . . . . . . 1,761,123 1,449,577 1,256,518
Gain on bargain purchase, net of expenses . . . . . . . . . . . . . . . . — 287,099 —
Net investment income . . . . . . . . . . . . . . . . . . . . . . . . . . . . . . 134,103 118,773 139,528
Realized gain on repurchase of debentures . . . . . . . . . . . . . . . . — 4,444 8,752
Net realized gains (losses) on investments . . . . . . . . . . . . . . . . 32,498 (11,543) (1,591)
Net unrealized gains (losses) on investments . . . . . . . . . . . . . . 45,952 84,796 (79,707)
Other income . . . . . . . . . . . . . . . . . . . . . . . . . . . . . . . . . . . . . 5,219 4,634 5,264
Foreign exchange gains (losses) . . . . . . . . . . . . . . . . . . . . . . . . 1,351 (674) (49,397)
Total revenues . . . . . . . . . . . . . . . . . . . . . . . . . . . . . . . . . . . . 1,980,246 1,937,106 1,279,367
ExpensesLosses and loss expenses . . . . . . . . . . . . . . . . . . . . . . . . . . . . . 987,586 523,757 772,154
Policy acquisition costs . . . . . . . . . . . . . . . . . . . . . . . . . . . . . . 292,899 262,966 234,951
General and administrative expenses . . . . . . . . . . . . . . . . . . . . 209,290 185,568 123,948
Share compensation expenses . . . . . . . . . . . . . . . . . . . . . . . . . 28,911 27,037 27,097
Finance expenses . . . . . . . . . . . . . . . . . . . . . . . . . . . . . . . . . . 55,870 44,130 57,318
Total expenses . . . . . . . . . . . . . . . . . . . . . . . . . . . . . . . . . . . . 1,574,556 1,043,458 1,215,468
Net income before taxes. . . . . . . . . . . . . . . . . . . . . . . . . . . . . 405,690 893,648 63,899
Tax (expense) benefit . . . . . . . . . . . . . . . . . . . . . . . . . . . . . . . (3,126) 3,759 (10,788)
Net income. . . . . . . . . . . . . . . . . . . . . . . . . . . . . . . . . . . . . . . $ 402,564 $ 897,407 $ 53,111
Comprehensive incomeForeign currency translation adjustments . . . . . . . . . . . . . . . . . (604) 3,007 (7,809)
Comprehensive income . . . . . . . . . . . . . . . . . . . . . . . . . . . . . $ 401,960 $ 900,414 $ 45,302
Earnings per shareWeighted average number of common shares and common
share equivalents outstanding
Basic. . . . . . . . . . . . . . . . . . . . . . . . . . . . . . . . . . . . . . . . . . 116,018,364 93,697,194 74,677,903
Diluted . . . . . . . . . . . . . . . . . . . . . . . . . . . . . . . . . . . . . . . . 120,630,945 97,168,409 75,819,413
Basic earnings per share . . . . . . . . . . . . . . . . . . . . . . . . . . . . $ 3.41 $ 9.51 $ 0.62
Diluted earnings per share . . . . . . . . . . . . . . . . . . . . . . . . . . $ 3.34 $ 9.24 $ 0.61
Cash dividends declared per share . . . . . . . . . . . . . . . . . . . . $ 0.88 $ 0.80 $ 0.80
The accompanying notes are an integral part of these consolidated financial statements.
F-2
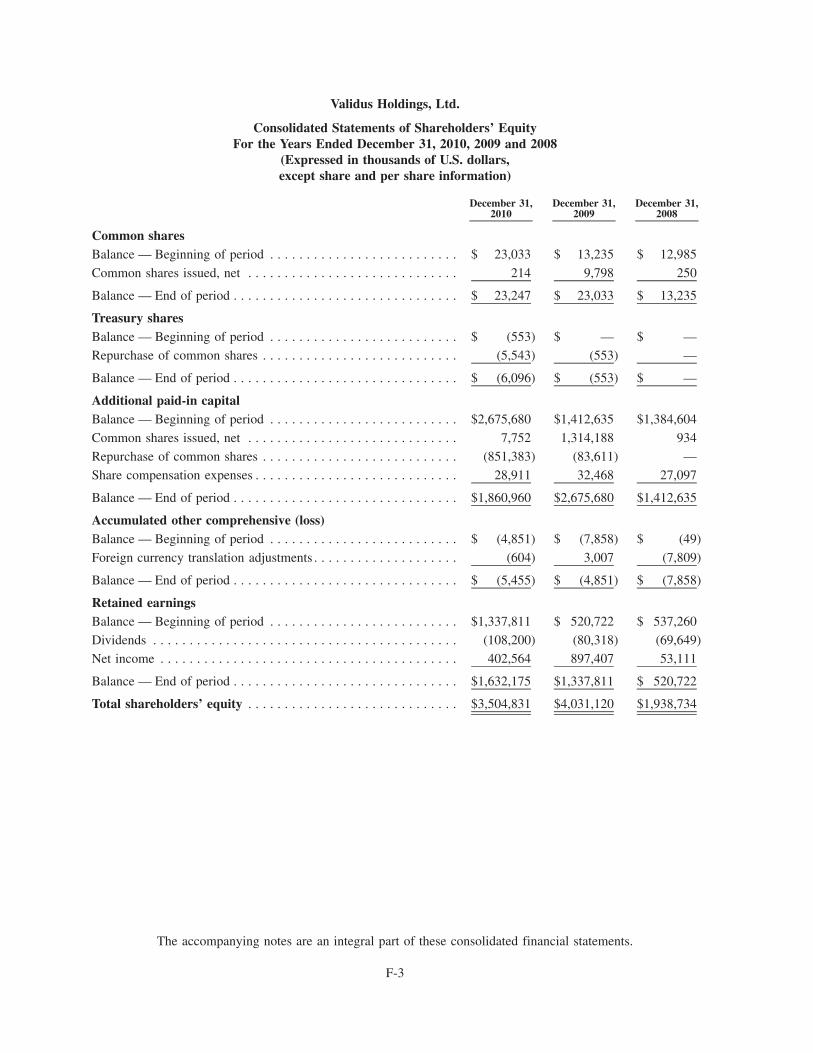
Validus Holdings, Ltd.
Consolidated Statements of Shareholders’ EquityFor the Years Ended December 31, 2010, 2009 and 2008
(Expressed in thousands of U.S. dollars,except share and per share information)
December 31,2010
December 31,2009
December 31,2008
Common sharesBalance — Beginning of period . . . . . . . . . . . . . . . . . . . . . . . . . . $ 23,033 $ 13,235 $ 12,985
Common shares issued, net . . . . . . . . . . . . . . . . . . . . . . . . . . . . . 214 9,798 250
Balance — End of period . . . . . . . . . . . . . . . . . . . . . . . . . . . . . . . $ 23,247 $ 23,033 $ 13,235
Treasury sharesBalance — Beginning of period . . . . . . . . . . . . . . . . . . . . . . . . . . $ (553) $ — $ —
Repurchase of common shares . . . . . . . . . . . . . . . . . . . . . . . . . . . (5,543) (553) —
Balance — End of period . . . . . . . . . . . . . . . . . . . . . . . . . . . . . . . $ (6,096) $ (553) $ —
Additional paid-in capitalBalance — Beginning of period . . . . . . . . . . . . . . . . . . . . . . . . . . $2,675,680 $1,412,635 $1,384,604
Common shares issued, net . . . . . . . . . . . . . . . . . . . . . . . . . . . . . 7,752 1,314,188 934
Repurchase of common shares . . . . . . . . . . . . . . . . . . . . . . . . . . . (851,383) (83,611) —
Share compensation expenses . . . . . . . . . . . . . . . . . . . . . . . . . . . . 28,911 32,468 27,097
Balance — End of period . . . . . . . . . . . . . . . . . . . . . . . . . . . . . . . $1,860,960 $2,675,680 $1,412,635
Accumulated other comprehensive (loss)Balance — Beginning of period . . . . . . . . . . . . . . . . . . . . . . . . . . $ (4,851) $ (7,858) $ (49)
Foreign currency translation adjustments . . . . . . . . . . . . . . . . . . . . (604) 3,007 (7,809)
Balance — End of period . . . . . . . . . . . . . . . . . . . . . . . . . . . . . . . $ (5,455) $ (4,851) $ (7,858)
Retained earningsBalance — Beginning of period . . . . . . . . . . . . . . . . . . . . . . . . . . $1,337,811 $ 520,722 $ 537,260
Dividends . . . . . . . . . . . . . . . . . . . . . . . . . . . . . . . . . . . . . . . . . . (108,200) (80,318) (69,649)Net income . . . . . . . . . . . . . . . . . . . . . . . . . . . . . . . . . . . . . . . . . 402,564 897,407 53,111
Balance — End of period . . . . . . . . . . . . . . . . . . . . . . . . . . . . . . . $1,632,175 $1,337,811 $ 520,722
Total shareholders’ equity . . . . . . . . . . . . . . . . . . . . . . . . . . . . . $3,504,831 $4,031,120 $1,938,734
The accompanying notes are an integral part of these consolidated financial statements.
F-3
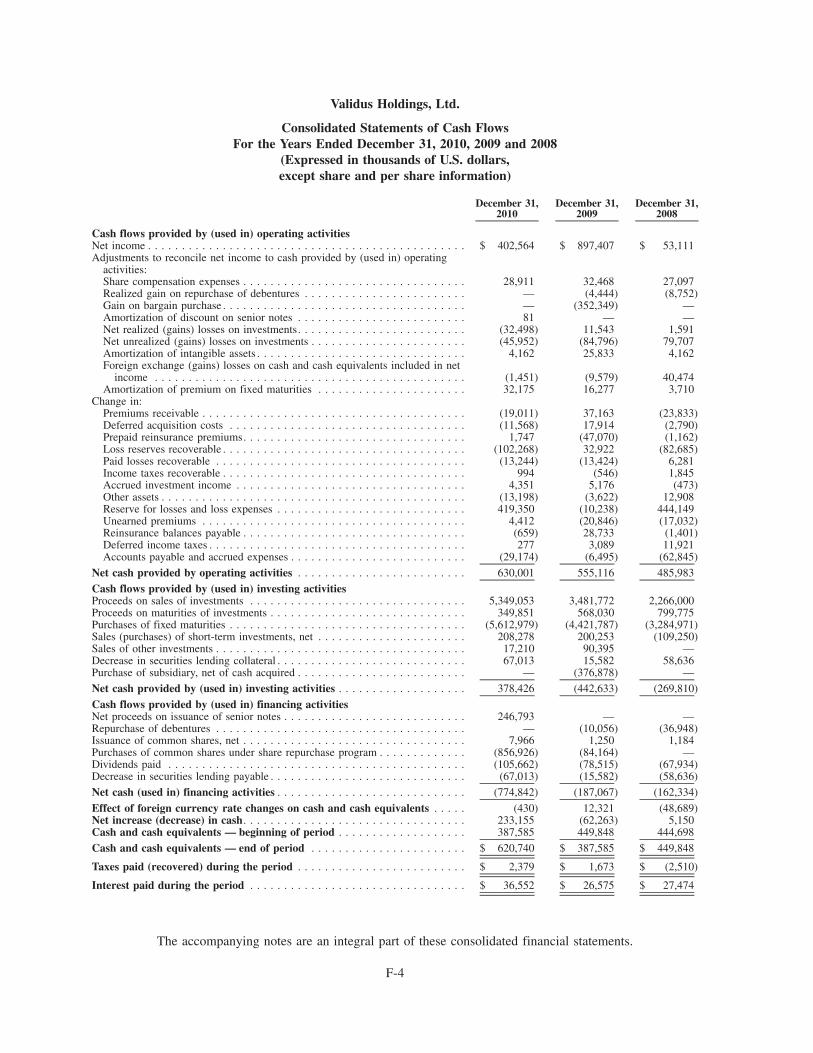
Validus Holdings, Ltd.
Consolidated Statements of Cash FlowsFor the Years Ended December 31, 2010, 2009 and 2008
(Expressed in thousands of U.S. dollars,except share and per share information)
December 31,2010
December 31,2009
December 31,2008
Cash flows provided by (used in) operating activitiesNet income . . . . . . . . . . . . . . . . . . . . . . . . . . . . . . . . . . . . . . . . . . . . . . . $ 402,564 $ 897,407 $ 53,111Adjustments to reconcile net income to cash provided by (used in) operating
activities:Share compensation expenses . . . . . . . . . . . . . . . . . . . . . . . . . . . . . . . . . 28,911 32,468 27,097Realized gain on repurchase of debentures . . . . . . . . . . . . . . . . . . . . . . . . — (4,444) (8,752)Gain on bargain purchase . . . . . . . . . . . . . . . . . . . . . . . . . . . . . . . . . . . . — (352,349) —Amortization of discount on senior notes . . . . . . . . . . . . . . . . . . . . . . . . . 81 — —Net realized (gains) losses on investments. . . . . . . . . . . . . . . . . . . . . . . . . (32,498) 11,543 1,591Net unrealized (gains) losses on investments . . . . . . . . . . . . . . . . . . . . . . . (45,952) (84,796) 79,707Amortization of intangible assets . . . . . . . . . . . . . . . . . . . . . . . . . . . . . . . 4,162 25,833 4,162Foreign exchange (gains) losses on cash and cash equivalents included in net
income . . . . . . . . . . . . . . . . . . . . . . . . . . . . . . . . . . . . . . . . . . . . . . (1,451) (9,579) 40,474Amortization of premium on fixed maturities . . . . . . . . . . . . . . . . . . . . . . 32,175 16,277 3,710
Change in:Premiums receivable . . . . . . . . . . . . . . . . . . . . . . . . . . . . . . . . . . . . . . . (19,011) 37,163 (23,833)Deferred acquisition costs . . . . . . . . . . . . . . . . . . . . . . . . . . . . . . . . . . . (11,568) 17,914 (2,790)Prepaid reinsurance premiums. . . . . . . . . . . . . . . . . . . . . . . . . . . . . . . . . 1,747 (47,070) (1,162)Loss reserves recoverable . . . . . . . . . . . . . . . . . . . . . . . . . . . . . . . . . . . . (102,268) 32,922 (82,685)Paid losses recoverable . . . . . . . . . . . . . . . . . . . . . . . . . . . . . . . . . . . . . (13,244) (13,424) 6,281Income taxes recoverable . . . . . . . . . . . . . . . . . . . . . . . . . . . . . . . . . . . . 994 (546) 1,845Accrued investment income . . . . . . . . . . . . . . . . . . . . . . . . . . . . . . . . . . 4,351 5,176 (473)Other assets . . . . . . . . . . . . . . . . . . . . . . . . . . . . . . . . . . . . . . . . . . . . . (13,198) (3,622) 12,908Reserve for losses and loss expenses . . . . . . . . . . . . . . . . . . . . . . . . . . . . 419,350 (10,238) 444,149Unearned premiums . . . . . . . . . . . . . . . . . . . . . . . . . . . . . . . . . . . . . . . 4,412 (20,846) (17,032)Reinsurance balances payable . . . . . . . . . . . . . . . . . . . . . . . . . . . . . . . . . (659) 28,733 (1,401)Deferred income taxes . . . . . . . . . . . . . . . . . . . . . . . . . . . . . . . . . . . . . . 277 3,089 11,921Accounts payable and accrued expenses . . . . . . . . . . . . . . . . . . . . . . . . . . (29,174) (6,495) (62,845)
Net cash provided by operating activities . . . . . . . . . . . . . . . . . . . . . . . . . 630,001 555,116 485,983
Cash flows provided by (used in) investing activitiesProceeds on sales of investments . . . . . . . . . . . . . . . . . . . . . . . . . . . . . . . . 5,349,053 3,481,772 2,266,000Proceeds on maturities of investments . . . . . . . . . . . . . . . . . . . . . . . . . . . . . 349,851 568,030 799,775Purchases of fixed maturities . . . . . . . . . . . . . . . . . . . . . . . . . . . . . . . . . . . (5,612,979) (4,421,787) (3,284,971)Sales (purchases) of short-term investments, net . . . . . . . . . . . . . . . . . . . . . . 208,278 200,253 (109,250)Sales of other investments . . . . . . . . . . . . . . . . . . . . . . . . . . . . . . . . . . . . . 17,210 90,395 —Decrease in securities lending collateral . . . . . . . . . . . . . . . . . . . . . . . . . . . . 67,013 15,582 58,636Purchase of subsidiary, net of cash acquired . . . . . . . . . . . . . . . . . . . . . . . . . — (376,878) —
Net cash provided by (used in) investing activities . . . . . . . . . . . . . . . . . . . 378,426 (442,633) (269,810)
Cash flows provided by (used in) financing activitiesNet proceeds on issuance of senior notes . . . . . . . . . . . . . . . . . . . . . . . . . . . 246,793 — —Repurchase of debentures . . . . . . . . . . . . . . . . . . . . . . . . . . . . . . . . . . . . . — (10,056) (36,948)Issuance of common shares, net . . . . . . . . . . . . . . . . . . . . . . . . . . . . . . . . . 7,966 1,250 1,184Purchases of common shares under share repurchase program . . . . . . . . . . . . . (856,926) (84,164) —Dividends paid . . . . . . . . . . . . . . . . . . . . . . . . . . . . . . . . . . . . . . . . . . . . (105,662) (78,515) (67,934)Decrease in securities lending payable . . . . . . . . . . . . . . . . . . . . . . . . . . . . . (67,013) (15,582) (58,636)
Net cash (used in) financing activities . . . . . . . . . . . . . . . . . . . . . . . . . . . . (774,842) (187,067) (162,334)
Effect of foreign currency rate changes on cash and cash equivalents . . . . . (430) 12,321 (48,689)Net increase (decrease) in cash. . . . . . . . . . . . . . . . . . . . . . . . . . . . . . . . . 233,155 (62,263) 5,150Cash and cash equivalents — beginning of period . . . . . . . . . . . . . . . . . . . 387,585 449,848 444,698
Cash and cash equivalents — end of period . . . . . . . . . . . . . . . . . . . . . . . $ 620,740 $ 387,585 $ 449,848
Taxes paid (recovered) during the period . . . . . . . . . . . . . . . . . . . . . . . . . $ 2,379 $ 1,673 $ (2,510)
Interest paid during the period . . . . . . . . . . . . . . . . . . . . . . . . . . . . . . . . $ 36,552 $ 26,575 $ 27,474
The accompanying notes are an integral part of these consolidated financial statements.
F-4

Validus Holdings, Ltd.
Notes to Consolidated Financial Statements(Expressed in thousands of U.S. dollars, except share and per share information)
1. Nature of the business
Validus Holdings, Ltd. (the “Company”) was incorporated under the laws of Bermuda on October 19, 2005.The Company conducts its operations worldwide through two wholly-owned subsidiaries, Validus Reinsurance,Ltd. (“Validus Re”) and Talbot Holdings Ltd. (“Talbot”). Validus Re is registered as a Class 4 insurer under TheInsurance Act 1978 of Bermuda, amendments thereto and related regulations (“The Act”). On July 2, 2007, theCompany acquired all of the outstanding shares of Talbot from a group of institutional and other investors, andTalbot employees, management, former employees and trusts on behalf of certain employees and their families.Talbot is the Bermuda parent of a specialty insurance group primarily operating within the Lloyd’s of London(“Lloyd’s”) insurance market through Syndicate 1183. The Company, through its subsidiaries, provides reinsurancecoverage in the Property, Marine and Specialty lines markets, effective January 1, 2006, and insurance coverage inthe same markets effective July 2, 2007.
On July 30, 2007, the Company completed its initial public offering (“IPO”), selling 15,244,888 commonshares at a price of $22.00 per share. The net proceeds to the Company from the IPO were approximately $310,731,after deducting the underwriters’ discount and fees. On August 27, 2007, the Company issued an additional 453,933common shares at a price of $22.00 per share pursuant to the underwriters’ option to purchase additional commonshares; the net proceeds to the Company were approximately $9,349 and total IPO proceeds inclusive of theunderwriters’ option to purchase additional common shares were $320,080.
On September 4, 2009, pursuant to an Amalgamation Agreement, the Company acquired all of IPC Holdings,Ltd. (“IPC”) outstanding common shares in exchange for 0.9727 Company common shares and $7.50 cash per IPCcommon share (the “IPC Acquisition”). IPC’s operations were focused on short-tail lines of reinsurance. Theprimary lines in which IPC conducted business were property catastrophe reinsurance and, to a limited extent,property-per-risk excess, aviation (including satellite) and other short-tail reinsurance on a worldwide basis. Theacquisition of IPC was undertaken to gain a strategic advantage in the then current reinsurance market and increasethe Company’s capital base.
2. Basis of preparation and consolidation
These consolidated financial statements include Validus Holdings, Ltd. and its wholly and majority ownedsubsidiaries (together, the “Company”) and have been prepared in accordance with generally accepted accountingprinciples in the United States of America (“U.S. GAAP”). Certain amounts in prior periods have been reclassifiedto conform to current period presentation. All significant intercompany accounts and transactions have beeneliminated. The preparation of financial statements in conformity with U.S. GAAP requires management to makeestimates and assumptions that affect the reported amounts of assets and liabilities and disclosure of contingentassets and liabilities at the date of the financial statements and the reported amounts of revenues and expensesduring the reporting period. Actual results could differ from these estimates. The major estimates reflected in theCompany’s consolidated financial statements include the reserve for losses and loss expenses, premium estimatesfor business written on a line slip or proportional basis, the valuation of goodwill and intangible assets, reinsurancerecoverable balances including the provision for unrecoverable reinsurance recoverable balances and investmentvaluation. The term “ASC” used in these notes refers to Accounting Standard Codifications issued by the UnitedStates Financial Accounting Standards Board (“FASB”).
The consolidated financial statements include the results of operations and cash flows of IPC Holdings Ltd.(“IPC”), since the date of acquisition on September 4, 2009 and not any prior periods (including for comparativepurposes), except with respect to “Supplemental Pro Forma Information” included in Note 5.
3. Significant accounting policies
The following is a summary of significant accounting policies adopted by the Company.
F-5
a) Premiums
Insurance premiums written are recorded in accordance with the terms of underlying policies. Reinsurancepremiums written are recorded at the inception of the policy and are estimated based on information received frombrokers, ceding companies and reinsureds, and any subsequent differences arising on such estimates will berecorded in the periods in which they are determined. Premiums written are earned on a pro-rata basis over the termof the policy. For contracts and policies written on a losses occurring basis, the risk period is generally the same asthe contract or policy terms. For contracts written on a policies attaching basis, the risk period is based on the termsof the underlying contracts and policies and is generally assumed to be 24 months. The portion of the premiumswritten applicable to the unexpired terms of the underlying contracts and policies in force are recorded as unearnedpremiums. Mandatory reinstatement premiums are recorded at the time a loss event occurs.
b) Policy acquisition costs
Policy acquisition costs are costs that vary with, and are directly related to, the production of new and renewalbusiness, and consist principally of commissions and brokerage expenses. Acquisition costs are shown net ofcommissions earned on reinsurance ceded. These costs are deferred and amortized over the periods in which therelated premiums are earned. Deferred acquisition costs are limited to their estimated realizable value based on therelated unearned premiums and anticipated claims expenses. The realizable value of the Company’s deferredacquisition costs is determined without consideration of investment income. Policy acquisition costs also includeprofit commission. Profit commissions are recognized when earned.
c) Reserve for losses and loss expenses
The reserve for losses and loss expenses includes reserves for unpaid reported losses and for losses incurred butnot reported (“IBNR”). The reserve for unpaid reported losses and loss expenses is established by managementbased on reports from brokers, ceding companies and insureds and represents the estimated ultimate cost of eventsor conditions that have been reported to, or specifically identified by the Company. The reserve for incurred but notreported losses and loss expenses is established by management based on actuarially determined estimates ofultimate losses and loss expenses. Inherent in the estimate of ultimate losses and loss expenses are expected trendsin claim severity and frequency and other factors which may vary significantly as claims are settled. Accordingly,ultimate losses and loss expenses may differ materially from the amounts recorded in the consolidated financialstatements. These estimates are reviewed regularly and, as experience develops and new information becomesknown, the reserves are adjusted as necessary. Such adjustments, if any, will be recorded in earnings in the period inwhich they become known. Prior period development arises from changes to loss estimates recognized in thecurrent year that relate to loss reserves established in previous calendar years.
d) Reinsurance
In the normal course of business, the Company seeks to reduce the potential amount of loss arising from claimsevents by reinsuring certain levels of risk assumed in various areas of exposure with other insurers or reinsurers. Theaccounting for reinsurance ceded depends on the method of reinsurance. If the policy is on a “losses occurringduring” basis, reinsurance premiums ceded are expensed (and any commissions thereon are earned) on a pro-ratabasis over the period the reinsurance coverage is provided. If the policy is a “risks attaching during” policy,reinsurance premiums ceded are expensed (and any commissions thereon are earned) in line with the grosspremiums earned to which the risk attaching policy relates. Prepaid reinsurance premiums represent the portion ofpremiums ceded applicable to the unexpired term of policies in force. Mandatory reinstatement premiums ceded arerecorded and expensed at the time a loss event occurs. Reinsurance recoverables are based on contracts in force. Themethod for determining the reinsurance recoverable on unpaid loss and loss expenses involves actuarial estimates ofunpaid losses and loss expenses as well as a determination of the Company’s ability to cede unpaid losses and loss
F-6
Validus Holdings, Ltd.
Notes to Consolidated Financial Statements — (Continued)(Expressed in thousands of U.S. dollars, except share and per share information)

expenses under its reinsurance treaties. The use of different assumptions could have a material effect on theprovision for uncollectible reinsurance. To the extent the creditworthiness of the Company’s reinsurers was todeteriorate due to adverse event affecting the reinsurance industry, such as a large number of major catastrophes,actual uncollectible amounts could be significantly greater than the Company’s provision. Amounts recoverablefrom reinsurers are estimated in a manner consistent with the underlying liabilities.
e) Investments
Fair value is defined as the price received to transfer an asset or paid to transfer a liability in an orderlytransaction between market participants at the measurement date reflecting the highest and best use valuationconcepts. The guidance for “Fair Value Measurement and Disclosure” provides a framework for measuring fairvalue by creating a hierarchy of fair value measurements that distinguishes market data between observableindependent market inputs and unobservable market assumptions by the reporting entity. The guidance furtherexpands disclosures about such fair value measurements. The guidance applies broadly to most existing accountingpronouncements that require or permit fair value measurements (including both financial and non-financial assetsand liabilities) but does not require any new fair value measurements. The Company has adopted all authoritativeguidance in effect as of the balance sheet date regarding certain market conditions that allow for fair valuemeasurements that incorporate unobservable inputs where active market transaction based measurements areunavailable.
Short-term investments comprise investments with a remaining maturity of less than 90 days at time ofpurchase and money market funds held at the Company’s investment managers.
All investment transactions are recorded on a first-in-first-out basis and realized gains and losses on the sale ofinvestments are determined on the basis of amortized cost. Interest on fixed maturity securities is recorded in netinvestment income when earned and is adjusted for any amortization of premium or discount.
For mortgage-backed securities, and any other holdings for which there is a prepayment risk, prepaymentassumptions are evaluated and revised as necessary. Any adjustments required due to the resultant change ineffective yields and maturities are recognized retrospectively. Prepayment fees or call premiums that are onlypayable to the Company when a security is called prior to its maturity, are earned when received and reflected in netinvestment income.
f) Derivative instruments
The Company uses derivative instruments in the form of foreign currency forward exchange contracts tomanage foreign currency risk. A foreign currency forward exchange contract involves an obligation to purchase orsell a specified amount of a specified currency at a future date at a price set at the time of the contract. Foreigncurrency forward exchange contracts will not eliminate fluctuations in the value of our assets and liabilitiesdenominated in foreign currencies but rather allow the Company to establish a rate of exchange for a future point intime. The foreign currency forward exchange contracts are recorded as derivatives at fair value with changesrecorded as a net foreign exchange gain or loss in the Company’s statement of operations.
To qualify for hedge accounting treatment, a derivative must be highly effective in mitigating the designatedchanges in value or cash flow of the hedged item. The Company formally documents all relationships betweendesignated hedging instruments and hedged items, as well as its risk management objective and strategy forundertaking various hedge transactions. The documentation process includes linking derivatives to specific assetsor liabilities on the balance sheet. The Company also formally assesses, both at the hedge’s inception and on anongoing basis, whether the derivatives that are used in hedging transactions are highly effective in offsettingchanges in fair values or cash flows of hedged items. The Company assesses the effectiveness of its designated
F-7
Validus Holdings, Ltd.
Notes to Consolidated Financial Statements — (Continued)(Expressed in thousands of U.S. dollars, except share and per share information)

hedges on an individual currency basis. If the ratio obtained with this method is within the range of 80% to 125%,the Company considers the hedge effective.
The Company discontinues hedge accounting prospectively when it is determined that the derivative is nolonger highly effective in offsetting changes in the fair value or cash flows of a hedged item; the derivative is de-designated as a hedging instrument; or the derivative expires or is sold, terminated or exercised. To the extent thatthe Company discontinues hedge accounting, because, based on management’s assessment, the derivative no longerqualifies as an effective hedge, the derivative will continue to be carried in the Consolidated Balance Sheets at itsfair value, with changes in its fair value recognized in current period net income through accumulated othercomprehensive income (loss).
g) Cash and cash equivalents
The Company considers time deposits and money market funds with an original maturity of 30 days or less asequivalent to cash.
h) Foreign exchange
The U.S. Dollar is the functional currency of the Company and the majority of the subsidiaries. For thesecompanies, monetary assets and liabilities denominated in foreign currencies are revalued at the exchange rates ineffect at the balance sheet date and revenues and expenses denominated in foreign currencies are translated at theprevailing exchange rate on the transaction date with the resulting foreign exchange gains and losses included inearnings.
Assets and liabilities of subsidiaries whose functional currency is not the U.S. dollar are translated at prevailingyear end exchange rates. Revenue and expenses of such foreign operations are translated at average exchange ratesduring the year. The net effect of translation differences between functional and reporting currencies in foreignoperations, net of applicable deferred income taxes, are included in “accumulated other comprehensive income(loss).”
i) Stock plans
The Company accounts for its share plans in accordance with the U.S. GAAP fair value recognition provisionsfor “Stock Compensation.” Accordingly, the Company recognizes the compensation expense for stock optiongrants, restricted share grants and performance share awards based on the fair value of the award on the date of grantover the requisite service period.
j) Warrants
The Company has accounted for certain warrant contracts issued to our sponsoring investors in conjunctionwith the capitalization of the Company, and which may be settled by the Company using either the physicalsettlement or net-share settlement methods, in accordance with U.S. GAAP guidance for “Derivatives andHedging.” Accordingly, the fair value of these warrants has been recorded in equity as an addition to additionalpaid-in capital.
k) Earnings per share
Basic earnings per common share is calculated by dividing net income available to common shareholders bythe weighted average number of common shares outstanding. Diluted earnings per common share are based on theweighted average number of common shares and share equivalents excluding any anti-dilutive effects of warrantsand options.
F-8
Validus Holdings, Ltd.
Notes to Consolidated Financial Statements — (Continued)(Expressed in thousands of U.S. dollars, except share and per share information)
l) Income taxes and uncertain tax provisions
Deferred tax assets and liabilities are recorded in accordance with U.S. GAAP “Income Taxes” guidance.Consistent with this guidance, the Company records deferred income taxes which reflect the tax effect of thetemporary differences between the carrying amounts of assets and liabilities for financial reporting purposes andtheir respective tax bases.
The Company is not subject to any income, withholding or capital gains taxes under current Bermuda law. TheCompany has operations in subsidiary form in various other jurisdictions around the world, including but not limitedto the U.K., U.S. and Canada that are subject to relevant taxes in those jurisdictions.
The Company recognizes the tax benefits of uncertain tax positions only where the position is “more likelythan not” to be sustained assuming examination by tax authorities. The Company did not recognize any resultingliabilities for unrecognized tax benefits.
m) Business combinations
On September 4, 2009, the Company acquired all of the outstanding shares of IPC. The transaction wasaccounted for as an acquisition method business combination. Accordingly, the purchase price was allocated toassets and liabilities based on their estimated fair value at the acquisition date. The consideration for the net assetsacquired was concluded upon prior to the assessment of the fair value of the net assets at the acquisition date.Therefore, the excess of the value of the net assets acquired over the purchase price was recorded as gain on bargainpurchase and is shown as a separate component of revenues in the Company’s Consolidated Statements ofOperations and Comprehensive Income for year ended December 31, 2009. IPC’s accounting policies have beenconformed to those of the Company.
n) Goodwill and other intangible assets
The Company accounts for goodwill and other intangible assets recognized in business combinations inaccordance with U.S. GAAP guidance. A purchase price paid that is in excess of net assets (“goodwill”) arisingfrom a business combination is recorded as an asset, and is not amortized. Goodwill is deemed to have an indefinitelife and is not amortized, but tested at least annually for impairment. Where the total fair value of net assets acquiredexceeds consideration paid (“negative goodwill”), the acquirer will record a gain as a result of the bargain purchase,to be recognized through the income statement at the close of the transaction.
Intangible assets with a finite life are amortized over the estimated useful life of the asset. Intangible assetswith an indefinite useful life are not amortized. Syndicate capacity is deemed to have an indefinite life. Intangibleassets with definite lives are amortized on a straight line basis over the estimated useful lives. Trademark andDistribution Network are deemed to have definite lives and are therefore amortized. Refer also to Note 5 “Businesscombinations.”
Goodwill and intangible assets are tested for impairment on an annual basis or more frequently if events orchanges in circumstances indicate that the carrying amount may not be recoverable. Such events or circumstancesmay include an economic downturn in a geographic market or change in the assessment of future operations. Thegoodwill impairment test has two steps. The first step identifies potential impairments by comparing the fair valueof a reporting unit with its book value, including goodwill. Reporting units are consistent with the segmental basis.If the carrying value exceeds the fair value, the second step calculates the possible impairment loss by comparingthe implied fair value of goodwill with the carrying amount. If the implied goodwill is less than the carrying amount,a write-down would be recorded. The measurement of fair values in reporting units is determined on a number offactors and assumptions including ranges of future discounted earnings, forecast revenue and operating expensesand effective tax rates.
F-9
Validus Holdings, Ltd.
Notes to Consolidated Financial Statements — (Continued)(Expressed in thousands of U.S. dollars, except share and per share information)
If the goodwill or intangible asset is impaired, it is written down to its realizable value with a correspondingexpense reflected in the consolidated statements of operations.
o) Other investments
Other investments consist of an investment in a fund of hedge funds and a deferred compensation trust. Allinvestment transactions are recorded on a first-in-first-out basis and realized gains and losses on the sale ofinvestments are determined on the basis of amortized cost. Other investments are carried at fair value with interestand dividend income, income distributions and realized and unrealized gains and losses included in net investmentincome. The fair value of other investments is generally established on the basis of the net valuation criteriaestablished by the managers of the investments. These net valuations are determined based upon the valuationcriteria established by the governing documents of such investments. In addition, due to a lag in reporting, some ofthe Company’s fund managers, fund administrators, or both, are unable to provide final fund valuations as of theCompany’s current reporting date. In these circumstances, the Company estimates the fair value of these funds bystarting with the prior month’s fund valuation, adjusting these valuations for capital calls, redemptions ordistributions and the impact of changes in foreign currency exchange rates, and then estimating the return forthe current period. In circumstances in which the Company estimates the return for the current period, it uses allcredible information available. This principally includes preliminary estimates reported by its fund managers,obtaining the valuation of underlying portfolio investments where such underlying investments are publicly tradedand therefore have a readily observable price, using information that is available to the Company with respect to theunderlying investments, reviewing various indices for similar investments or asset classes, as well as estimatingreturns based on the results of similar types of investments for which the Company has reported results, or othervaluation methods, as necessary. Actual final fund valuations may differ, perhaps materially so, from theCompany’s estimates and these differences are recorded in the period they become known as a change in estimate.
4. Recent accounting pronouncements
In June 2009, the FASB issued authoritative guidance on accounting for “Transfers and Servicing” (ASC 860).This update addresses practices that have developed that are not consistent with the original intent and keyrequirements and concerns that derecognized financial assets and related obligations should continue to be reportedin the transferors’ financial statements. This update is effective for financial asset transfers in the interim and annualperiods beginning after November 15, 2009. The adoption of this guidance has not had a material impact on theCompany’s consolidated financial statements.
In June 2009, the FASB issued authoritative guidance which amends the “Consolidation” guidance that appliesto Variable Interest Entities (“VIEs”) (ASC 810). This update amends the guidance for the identification of VIEsand their primary beneficiaries and the financial statement disclosures required. This update is effective for interimand annual periods beginning after November 15, 2009. The adoption of this update has not had a material impacton the Company’s consolidated financial statements.
In January 2010, the FASB issued authoritative guidance on “Fair Value Measurements and Disclosures” (ASC820). This update requires additional disclosures regarding (1) significant transfers in and out of Levels 1 and 2 and thereasons that such transfers were made; (2) inputs and valuation techniques used to measure fair value for financialassets and liabilities that fall in either Level 2 or Level 3; (3) the activity within Level 3 fair value measurements,including information on a gross basis for purchases, sales, issuances, and settlements; and (4) disaggregation offinancial assets and liabilities measured at fair value into classes of financial assets and liabilities. This guidance iseffective for interim and annual reporting periods beginning after December 15, 2009, except for Level 3 recon-ciliation disclosures which are effective for interim and annual periods beginning after December 15, 2010. Theadoption of this update has not had a material impact on the Company’s consolidated financial statements.
F-10
Validus Holdings, Ltd.
Notes to Consolidated Financial Statements — (Continued)(Expressed in thousands of U.S. dollars, except share and per share information)

In February 2010, the FASB issued authoritative guidance which amends the “Subsequent Events” guidance (ASC855). The guidance requires SEC filers to evaluate subsequent events through the date the financial statements are issued,and also exempts SEC filers from disclosing the date through which subsequent events have been evaluated. This updatewas effective immediately for financial statements that are (1) issued or available to be issued or (2) revised. The adoptionof this update has not had a material impact on the Company’s consolidated financial statements.
In March 2010, the FASB issued authoritative guidance which clarifies the “Embedded Derivatives” guidance(ASC 815). All entities that enter into contracts containing an embedded credit derivative feature related to thetransfer of credit risk that is not only in the form of subordination of one financial instrument to another will beaffected by the amendments. The amendments in this update are effective for interim periods beginning afterJune 15, 2010. As the Company has not entered into contracts containing an embedded credit derivative featurerelated to the transfer of credit risk that is not only in the form of subordination of one financial instrument toanother, the adoption of this update did not impact the Company’s consolidated financial statements.
In April 2010, the FASB issued authoritative guidance which clarifies the “Stock Compensation” guidance(ASC 718). This guidance clarifies the accounting for certain employee share-based payment awards. Awards withan exercise price denominated in the currency of a market in which a substantial portion of the entity’s equitysecurities trades would not be considered to contain a condition that is not a market, performance or servicecondition. Therefore, an entity would not classify such an award as a liability if it otherwise qualifies as equity. Thisaccounting guidance is effective for accounting periods beginning after December 15, 2010, with earlier applicationpermitted. The adoption of this update did not impact the Company’s consolidated financial statements.
In October 2010, the FASB issued Accounting Standards Update No. 2010-26, “Accounting for CostsAssociated with Acquiring or Renewing Insurance Contracts” (“ASU 2010-26”). The objective of ASU2010-26 is to address diversity in practice regarding the interpretation of which costs relating to the acquisitionof new or renewal insurance contracts qualify for deferral. ASU 2010-26 is effective for interim and annual periodsbeginning after December 15, 2011 and may be applied prospectively or retrospectively. The Company has assessedthe impact of this guidance and has concluded that it does not have an impact on the Company’s consolidatedfinancial statements. The Company early adopted this update effective January 1, 2011.
5. Business combination
On September 4, 2009, pursuant to an amalgamation agreement, the Company acquired all of the outstandingcommon shares of IPC in exchange for 0.9727 Company common shares and $7.50 cash per IPC common share. IPC’soperations were focused on short-tail lines of reinsurance. The primary lines in which IPC conducted business wereproperty catastrophe reinsurance and, to a limited extent, property-per-risk excess, aviation (including satellite) and othershort-tail reinsurance on a worldwide basis. The IPC Acquisition was undertaken to gain a strategic advantage in the thencurrent reinsurance market where capacity had been depleted and to increase the Company’s capital base.
The aggregate purchase price paid by the Company was $1,746,224 for adjusted tangible net assets acquired of$2,076,902. During 2009, the global financial crisis and related market illiquidity led to several publicly tradedcompanies trading at substantial discounts. This was the primary factor responsible for a purchase price less than thebook value of IPC’s net assets, and the recognition of a bargain purchase gain on acquisition.
The estimates of fair values for tangible assets acquired and liabilities assumed were determined by managementbased on various market and income analyses and asset appraisals. Significant judgment was required to arrive at theseestimates of fair value and changes to assumptions used could have led to materially different results.
An adjustment of $50,000 was made to IPC’s net assets acquired in respect of the termination fee (the “MaxTermination Fee”) paid under the Agreement and Plan of Amalgamation among Max Capital Group Ltd. (“Max”),IPC and IPC Limited. The Max Termination Fee was advanced to IPC by the Company on July 9, 2009, but wasrepayable in certain circumstances.
F-11
Validus Holdings, Ltd.
Notes to Consolidated Financial Statements — (Continued)(Expressed in thousands of U.S. dollars, except share and per share information)

In addition, at closing, the Company recorded a $21,671 intangible asset for the acquired IPC customerrelationships. This intangible asset was related to the acquired broker distribution network and was fair valued usinga variation of the income approach. Under this approach, the Company estimated the present value of expectedfuture cash flows to an assumed hypothetical market participant resulting from the existing IPC customerrelationships, considering attrition, and discounting at a weighted average cost of capital.
The composition of purchase price and fair value of net assets acquired is summarized as follows:
Total allocable purchase priceIPC shares outstanding at September 4, 2009 . . . . . . . . . . . . . . . . . . 56,110,096Exchange ratio . . . . . . . . . . . . . . . . . . . . . . . . . . . . . . . . . . . . . . . . . 0.9727Validus common shares issued . . . . . . . . . . . . . . . . . . . . . . . . . . . . . 54,578,268Validus closing share price on September 4, 2009 . . . . . . . . . . . . . . . $ 24.10Total value of Validus shares to be issued . . . . . . . . . . . . . . . . . . . . . $ 1,315,337Total cash consideration paid at $7.50 per IPC share . . . . . . . . . . . . . 420,826Share compensation awards issued to IPC employees pursuant to the
Amalgamation Agreement and earned prior to the Amalgamation. . 10,061
Total allocable purchase price . . . . . . . . . . . . . . . . . . . . . . . . . . . . 1,746,224Tangible Assets Acquired
Cash and investments . . . . . . . . . . . . . . . . . . . . . . . . . . . . . . . . . . . . $2,463,374Receivables(a) . . . . . . . . . . . . . . . . . . . . . . . . . . . . . . . . . . . . . . . . . 202,278
Tangible Assets Acquired . . . . . . . . . . . . . . . . . . . . . . . . . . . . . . . . 2,665,652Liabilities Acquired
Net loss reserves and paid losses recoverable . . . . . . . . . . . . . . . . . . $ 304,957Unearned premiums, net of expenses . . . . . . . . . . . . . . . . . . . . . . . . 180,370Other liabilities . . . . . . . . . . . . . . . . . . . . . . . . . . . . . . . . . . . . . . . . 53,423
Liabilities acquired. . . . . . . . . . . . . . . . . . . . . . . . . . . . . . . . . . . . . . . 538,750
Net tangible assets acquired, at fair value . . . . . . . . . . . . . . . . . . . . . 2,126,902Max Termination Fee . . . . . . . . . . . . . . . . . . . . . . . . . . . . . . . . . . . . (50,000)
Net tangible assets acquired, at fair value, adjusted. . . . . . . . . . . . 2,076,902
Bargain purchase gain before establishment of intangible assets . . . . 330,678Intangible asset — customer relationships . . . . . . . . . . . . . . . . . . . . . 21,671
Bargain purchase gain on acquisition of IPC . . . . . . . . . . . . . . . . . . . $ 352,349
(a) The fair value of receivables approximates the gross contractual amounts receivable.
The Company also incurred transaction and termination expenses related to the IPC Acquisition. Transactionexpenses included legal, corporate advisory, and audit related services. Termination expenses included severancecosts and accelerated share compensation costs in connection with certain IPC employment contracts that have beenterminated. Finally, the customer relationships intangible asset has been fully amortized as it was not expected tosignificantly contribute to the Company’s future cash flows beyond December 31, 2009. The gain on bargain
F-12
Validus Holdings, Ltd.
Notes to Consolidated Financial Statements — (Continued)(Expressed in thousands of U.S. dollars, except share and per share information)
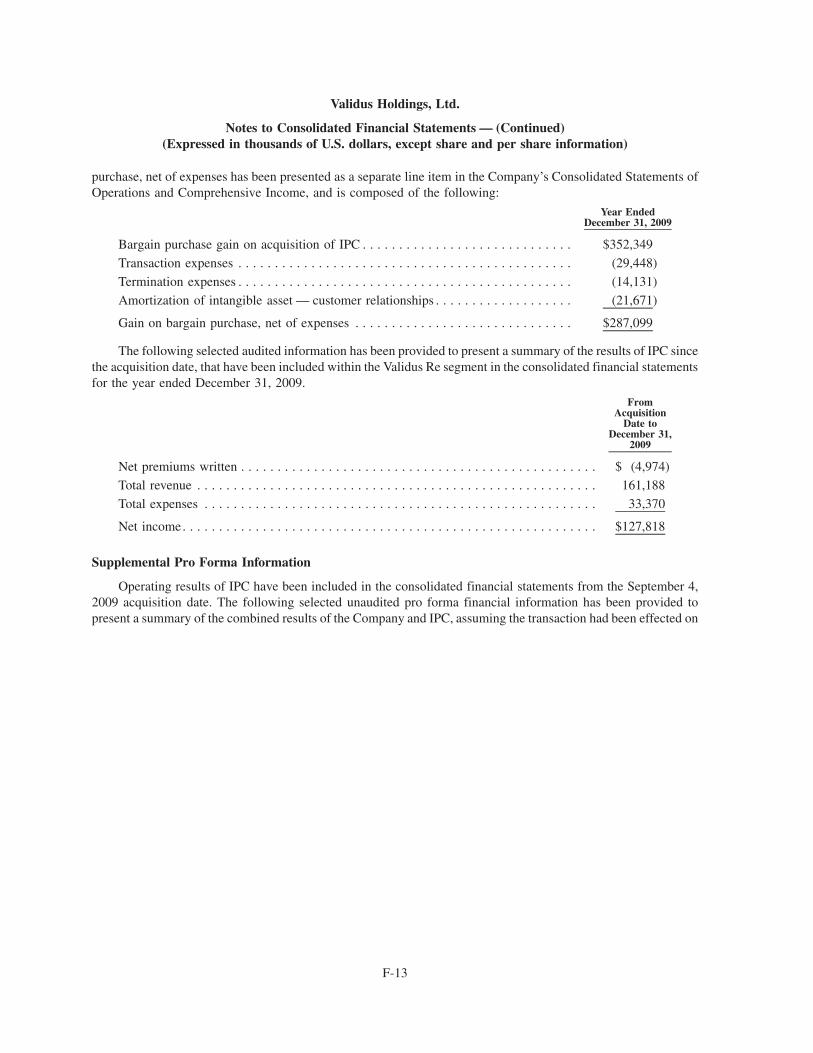
purchase, net of expenses has been presented as a separate line item in the Company’s Consolidated Statements ofOperations and Comprehensive Income, and is composed of the following:
Year EndedDecember 31, 2009
Bargain purchase gain on acquisition of IPC . . . . . . . . . . . . . . . . . . . . . . . . . . . . . $352,349
Transaction expenses . . . . . . . . . . . . . . . . . . . . . . . . . . . . . . . . . . . . . . . . . . . . . . (29,448)
Termination expenses . . . . . . . . . . . . . . . . . . . . . . . . . . . . . . . . . . . . . . . . . . . . . . (14,131)
Amortization of intangible asset — customer relationships . . . . . . . . . . . . . . . . . . . (21,671)
Gain on bargain purchase, net of expenses . . . . . . . . . . . . . . . . . . . . . . . . . . . . . . $287,099
The following selected audited information has been provided to present a summary of the results of IPC sincethe acquisition date, that have been included within the Validus Re segment in the consolidated financial statementsfor the year ended December 31, 2009.
FromAcquisition
Date toDecember 31,
2009
Net premiums written . . . . . . . . . . . . . . . . . . . . . . . . . . . . . . . . . . . . . . . . . . . . . . . . . $ (4,974)
Total revenue . . . . . . . . . . . . . . . . . . . . . . . . . . . . . . . . . . . . . . . . . . . . . . . . . . . . . . . 161,188
Total expenses . . . . . . . . . . . . . . . . . . . . . . . . . . . . . . . . . . . . . . . . . . . . . . . . . . . . . . 33,370
Net income. . . . . . . . . . . . . . . . . . . . . . . . . . . . . . . . . . . . . . . . . . . . . . . . . . . . . . . . . $127,818
Supplemental Pro Forma Information
Operating results of IPC have been included in the consolidated financial statements from the September 4,2009 acquisition date. The following selected unaudited pro forma financial information has been provided topresent a summary of the combined results of the Company and IPC, assuming the transaction had been effected on
F-13
Validus Holdings, Ltd.
Notes to Consolidated Financial Statements — (Continued)(Expressed in thousands of U.S. dollars, except share and per share information)
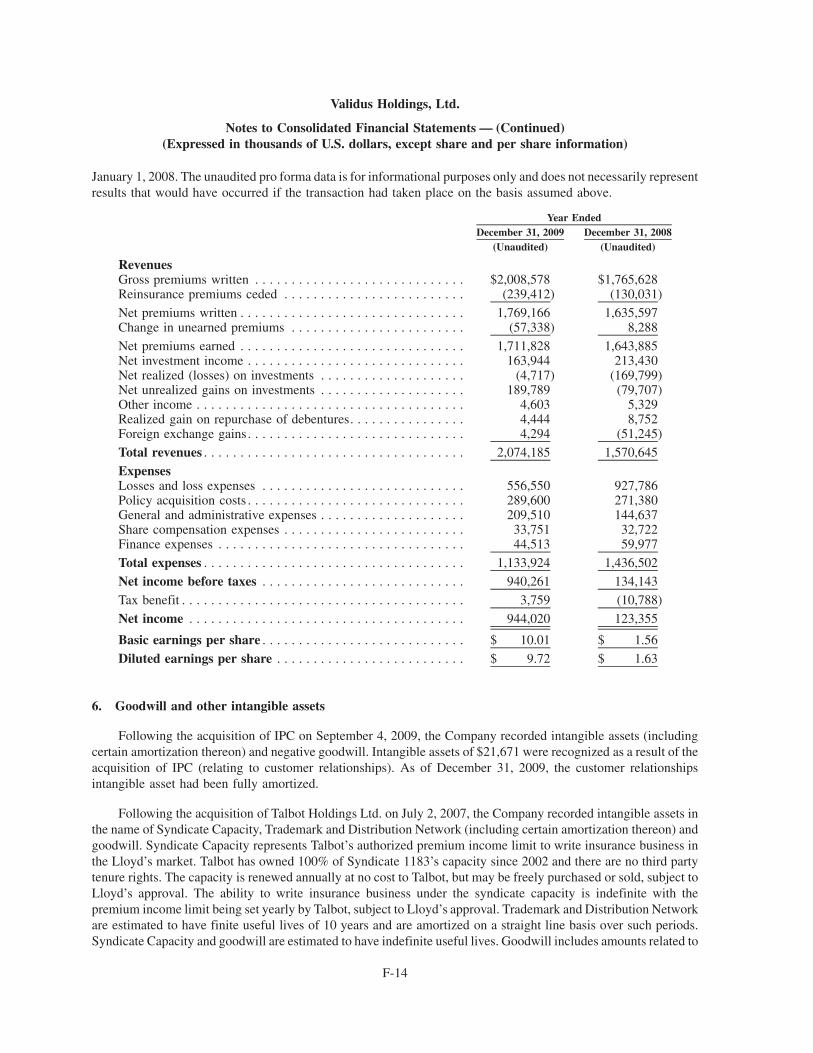
January 1, 2008. The unaudited pro forma data is for informational purposes only and does not necessarily representresults that would have occurred if the transaction had taken place on the basis assumed above.
December 31, 2009 December 31, 2008Year Ended
(Unaudited) (Unaudited)
RevenuesGross premiums written . . . . . . . . . . . . . . . . . . . . . . . . . . . . . $2,008,578 $1,765,628Reinsurance premiums ceded . . . . . . . . . . . . . . . . . . . . . . . . . (239,412) (130,031)
Net premiums written . . . . . . . . . . . . . . . . . . . . . . . . . . . . . . . 1,769,166 1,635,597Change in unearned premiums . . . . . . . . . . . . . . . . . . . . . . . . (57,338) 8,288
Net premiums earned . . . . . . . . . . . . . . . . . . . . . . . . . . . . . . . 1,711,828 1,643,885Net investment income . . . . . . . . . . . . . . . . . . . . . . . . . . . . . . 163,944 213,430Net realized (losses) on investments . . . . . . . . . . . . . . . . . . . . (4,717) (169,799)Net unrealized gains on investments . . . . . . . . . . . . . . . . . . . . 189,789 (79,707)Other income . . . . . . . . . . . . . . . . . . . . . . . . . . . . . . . . . . . . . 4,603 5,329Realized gain on repurchase of debentures. . . . . . . . . . . . . . . . 4,444 8,752Foreign exchange gains. . . . . . . . . . . . . . . . . . . . . . . . . . . . . . 4,294 (51,245)
Total revenues . . . . . . . . . . . . . . . . . . . . . . . . . . . . . . . . . . . . 2,074,185 1,570,645
ExpensesLosses and loss expenses . . . . . . . . . . . . . . . . . . . . . . . . . . . . 556,550 927,786Policy acquisition costs . . . . . . . . . . . . . . . . . . . . . . . . . . . . . . 289,600 271,380General and administrative expenses . . . . . . . . . . . . . . . . . . . . 209,510 144,637Share compensation expenses . . . . . . . . . . . . . . . . . . . . . . . . . 33,751 32,722Finance expenses . . . . . . . . . . . . . . . . . . . . . . . . . . . . . . . . . . 44,513 59,977
Total expenses . . . . . . . . . . . . . . . . . . . . . . . . . . . . . . . . . . . . 1,133,924 1,436,502
Net income before taxes . . . . . . . . . . . . . . . . . . . . . . . . . . . . 940,261 134,143
Tax benefit . . . . . . . . . . . . . . . . . . . . . . . . . . . . . . . . . . . . . . . 3,759 (10,788)
Net income . . . . . . . . . . . . . . . . . . . . . . . . . . . . . . . . . . . . . . 944,020 123,355
Basic earnings per share . . . . . . . . . . . . . . . . . . . . . . . . . . . . $ 10.01 $ 1.56
Diluted earnings per share . . . . . . . . . . . . . . . . . . . . . . . . . . $ 9.72 $ 1.63
6. Goodwill and other intangible assets
Following the acquisition of IPC on September 4, 2009, the Company recorded intangible assets (includingcertain amortization thereon) and negative goodwill. Intangible assets of $21,671 were recognized as a result of theacquisition of IPC (relating to customer relationships). As of December 31, 2009, the customer relationshipsintangible asset had been fully amortized.
Following the acquisition of Talbot Holdings Ltd. on July 2, 2007, the Company recorded intangible assets inthe name of Syndicate Capacity, Trademark and Distribution Network (including certain amortization thereon) andgoodwill. Syndicate Capacity represents Talbot’s authorized premium income limit to write insurance business inthe Lloyd’s market. Talbot has owned 100% of Syndicate 1183’s capacity since 2002 and there are no third partytenure rights. The capacity is renewed annually at no cost to Talbot, but may be freely purchased or sold, subject toLloyd’s approval. The ability to write insurance business under the syndicate capacity is indefinite with thepremium income limit being set yearly by Talbot, subject to Lloyd’s approval. Trademark and Distribution Networkare estimated to have finite useful lives of 10 years and are amortized on a straight line basis over such periods.Syndicate Capacity and goodwill are estimated to have indefinite useful lives. Goodwill includes amounts related to
F-14
Validus Holdings, Ltd.
Notes to Consolidated Financial Statements — (Continued)(Expressed in thousands of U.S. dollars, except share and per share information)

the value of the workforce. The goodwill and intangibles are recorded entirely in the Company’s Talbot segment.The following table shows an analysis of goodwill and other intangible assets included in the Talbot segment:
Goodwill
Intangible AssetsWith an
Indefinite Life
Intangible AssetsWith a
Finite Life Total
Balance at December 31, 2009 . . . . . . . . $20,393 $91,843 $31,212 $143,448
Accumulated amortization . . . . . . . . . . . . — — (4,162) (4,162)
Balance at December 31, 2010 . . . . . . . . $20,393 $91,843 $27,050 $139,286
Balance at December 31, 2008 . . . . . . . . $20,393 $91,843 $35,374 $147,610
Accumulated amortization . . . . . . . . . . . . — — (4,162) (4,162)
Balance at December 31, 2009 . . . . . . . . $20,393 $91,843 $31,212 $143,448
The estimated remaining amortization expense for the Trademark and Distribution network is as follows:
2011 . . . . . . . . . . . . . . . . . . . . . . . . . . . . . . . . . . . . . . . . . . . . . . . . . . . . . . . . . . . . . . . . $ 4,162
2012 . . . . . . . . . . . . . . . . . . . . . . . . . . . . . . . . . . . . . . . . . . . . . . . . . . . . . . . . . . . . . . . . 4,162
2013 . . . . . . . . . . . . . . . . . . . . . . . . . . . . . . . . . . . . . . . . . . . . . . . . . . . . . . . . . . . . . . . . 4,162
2014 . . . . . . . . . . . . . . . . . . . . . . . . . . . . . . . . . . . . . . . . . . . . . . . . . . . . . . . . . . . . . . . . 4,162
2015 and there after . . . . . . . . . . . . . . . . . . . . . . . . . . . . . . . . . . . . . . . . . . . . . . . . . . . . . 10,402
$27,050
As described in “Significant accounting policies”, the annual impairment test was performed and neithergoodwill nor the intangible assets were deemed to be impaired.
7. Investments
The Company’s investments in fixed maturities are classified as trading and carried at fair value, with relatednet unrealized gains or losses included in earnings. The Company has adopted all authoritative guidance in effect asof the balance sheet date regarding certain market conditions that allow for fair value measurements that incorporateunobservable inputs where active market transaction based measurements are unavailable.
(a) Classification within the fair value hierarchy
Under U.S. GAAP, a company must determine the appropriate level in the fair value hierarchy for each fairvalue measurement. The fair value hierarchy prioritizes the inputs, which refer broadly to assumptions marketparticipants would use in pricing an asset or liability, into three levels. It gives the highest priority to quoted prices(unadjusted) in active markets for identical assets or liabilities and the lowest priority to unobservable inputs. Thelevel in the fair value hierarchy within which a fair value measurement in its entirety falls is determined based on thelowest level input that is significant to the fair value measurement in its entirety.
Level 1 inputs are quoted prices (unadjusted) in active markets for identical assets or liabilities that thereporting entity has the ability to access at the measurement date. Level 2 inputs are inputs other than quoted priceswithin Level 1 that are observable for the asset or liability, either directly or indirectly. A significant adjustment to aLevel 2 input could result in the Level 2 measurement becoming a Level 3 measurement. Level 3 inputs areunobservable inputs for the asset or liability.
Level 1 primarily consists of financial instruments whose value is based on quoted market prices or alternativeindices including overnight repos and commercial paper. Level 2 includes financial instruments that are valued
F-15
Validus Holdings, Ltd.
Notes to Consolidated Financial Statements — (Continued)(Expressed in thousands of U.S. dollars, except share and per share information)

through independent external sources using models or other valuation methodologies. These models are primarilyindustry-standard models that consider various assumptions, including time value, yield curve, prepayment speeds,default rates, loss severity, current market and contractual prices for the underlying financial instruments, as well asother relevant economic measures. Substantially all of these assumptions are observable in the marketplace, can bederived from observable data or are supported by observable levels at which transactions are executed in themarketplace. The Company performs internal procedures on the valuations received from independent externalsources. Financial instruments in this category include U.S. and U.K. Treasuries, sovereign debt, corporate debt,catastrophe bonds, U.S. agency and non-agency mortgage, asset-backed securities and bank loans. Level 3 includesfinancial instruments that are valued using market approach and income approach valuation techniques. Thesemodels incorporate both observable and unobservable inputs. A hedge fund is the only financial instrument in thiscategory as at December 31, 2010.
The Company’s external investment advisors had noted illiquidity and dislocation in the non-Agency RMBSmarket for the period September 30, 2008 through to June 30, 2010. During this period, the Company identifiedcertain non-Agency RMBS securities in its portfolio trading in inactive markets (“identified RMBS securities”). Inorder to gauge market activity for the identified RMBS securities, the Company, with assistance from externalinvestment advisors, reviewed the pricing sources for each security in the portfolio. The Company utilized variouspricing vendors to obtain market pricing information for investment securities.
Consistent with U.S. GAAP, market approach fair value measurements for securities trading in inactivemarkets are not determinative. In weighing the fair value measurements resulting from market approach and incomeapproach valuation techniques, the Company previously placed less reliance on the market approach fair valuemeasurements. The income approach valuation technique determines the fair value of each security on the basis ofcontractual cash flows, discounted using a risk-adjusted discount rate. As the income approach valuation techniqueincorporates both observable and significant unobservable inputs, the securities were included as Level 3 assets withrespect to the fair value hierarchy. The foundation for the income approach was the amount and timing of futurecash flows.
During the three month period ended September 30, 2010, the Company, with assistance from externalinvestment advisors, determined that market activity had increased for the identified RMBS securities. Therefore, amarket approach valuation technique was adopted for the identified RMBS securities. Because the market approachincorporates observable inputs, the identified RMBS securities were classified as Level 2 with respect to the fairvalue hierarchy at September 30, 2010. During the three months ended December 31, 2010, the Company liquidatedsubstantially all of the identified RMBS securities which had previously been classified as Level 3 securities.
Other investments consist of an investment in a fund of hedge funds and a deferred compensation trust held inmutual funds. During the fourth quarter of 2009, a majority of the fund of hedge funds was redeemed. Theremaining portion is a side pocket valued at $12,892 at December 31, 2010. While a redemption request has beensubmitted, the timing of receipt of proceeds on the side pocket is unknown. The fund investment manager providesmonthly reported net asset values (“NAV”) with a one-month delay in its valuation. As a result, the fund investmentmanager’s November 30, 2010 NAV was used as a partial basis for fair value measurement in the Company’sDecember 31, 2010 balance sheet. The fund investment manager’s NAV relies on an estimate of the performance ofthe fund based on the month end positions from the underlying third-party funds. The Company utilizes the fundinvestment manager’s primary market approach estimated NAV that incorporates relevant valuation sources on atimely basis. As this valuation technique incorporates both observable and significant unobservable inputs, the fundof hedge funds is classified as a Level 3 asset. To determine the reasonableness of the estimated NAV, the Companyassesses the variance between the estimated NAV and the one-month delayed fund investment manager’s NAV.Immaterial variances are recorded in the following reporting period.
F-16
Validus Holdings, Ltd.
Notes to Consolidated Financial Statements — (Continued)(Expressed in thousands of U.S. dollars, except share and per share information)

At December 31, 2010, the Company’s investments were allocated between Levels 1, 2 and 3 as follows:
Level 1 Level 2 Level 3 Total
U.S. Government and Government Agency. . . . . $ — $1,677,166 $ — $1,677,166
Non-U.S. Government and GovernmentAgency . . . . . . . . . . . . . . . . . . . . . . . . . . . . . — 554,199 — 554,199
States, municipalities, political subdivision . . . . . — 26,285 — 26,285
Agency residential mortgage-backed securities . . — 445,859 — 445,859
Non-Agency residential mortgage-backedsecurities . . . . . . . . . . . . . . . . . . . . . . . . . . . . — 56,470 — 56,470
U.S. corporate . . . . . . . . . . . . . . . . . . . . . . . . . . — 1,308,406 — 1,308,406
Non-U.S. corporate . . . . . . . . . . . . . . . . . . . . . . — 502,067 — 502,067
Bank loans . . . . . . . . . . . . . . . . . . . . . . . . . . . . — 52,566 — 52,566
Catastrophe bonds . . . . . . . . . . . . . . . . . . . . . . . — 58,737 — 58,737
Asset-backed securities . . . . . . . . . . . . . . . . . . . — 123,569 — 123,569
Commercial mortgage-backed securities . . . . . . . — 18,543 — 18,543
Total fixed maturities . . . . . . . . . . . . . . . . . . . . . — 4,823,867 — 4,823,867
Short-term investments . . . . . . . . . . . . . . . . . . . 259,261 14,253 — 273,514
Hedge fund . . . . . . . . . . . . . . . . . . . . . . . . . . . . — — 12,892 12,892
Mutual funds . . . . . . . . . . . . . . . . . . . . . . . . . . . — 8,586 — 8,586
Total . . . . . . . . . . . . . . . . . . . . . . . . . . . . . . . . $259,261 $4,846,706 $12,892 $5,118,859
F-17
Validus Holdings, Ltd.
Notes to Consolidated Financial Statements — (Continued)(Expressed in thousands of U.S. dollars, except share and per share information)
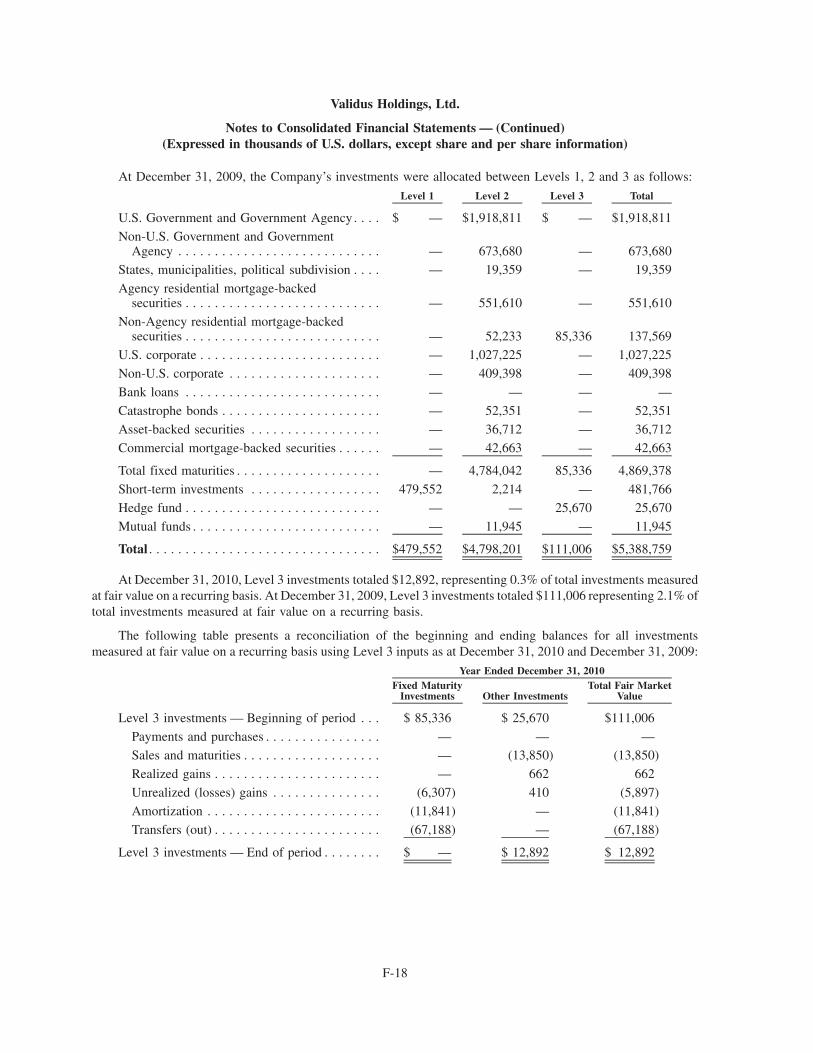
At December 31, 2009, the Company’s investments were allocated between Levels 1, 2 and 3 as follows:
Level 1 Level 2 Level 3 Total
U.S. Government and Government Agency . . . . $ — $1,918,811 $ — $1,918,811
Non-U.S. Government and GovernmentAgency . . . . . . . . . . . . . . . . . . . . . . . . . . . . — 673,680 — 673,680
States, municipalities, political subdivision . . . . — 19,359 — 19,359
Agency residential mortgage-backedsecurities . . . . . . . . . . . . . . . . . . . . . . . . . . . — 551,610 — 551,610
Non-Agency residential mortgage-backedsecurities . . . . . . . . . . . . . . . . . . . . . . . . . . . — 52,233 85,336 137,569
U.S. corporate . . . . . . . . . . . . . . . . . . . . . . . . . — 1,027,225 — 1,027,225
Non-U.S. corporate . . . . . . . . . . . . . . . . . . . . . — 409,398 — 409,398
Bank loans . . . . . . . . . . . . . . . . . . . . . . . . . . . — — — —
Catastrophe bonds . . . . . . . . . . . . . . . . . . . . . . — 52,351 — 52,351
Asset-backed securities . . . . . . . . . . . . . . . . . . — 36,712 — 36,712
Commercial mortgage-backed securities . . . . . . — 42,663 — 42,663
Total fixed maturities . . . . . . . . . . . . . . . . . . . . — 4,784,042 85,336 4,869,378
Short-term investments . . . . . . . . . . . . . . . . . . 479,552 2,214 — 481,766
Hedge fund . . . . . . . . . . . . . . . . . . . . . . . . . . . — — 25,670 25,670
Mutual funds . . . . . . . . . . . . . . . . . . . . . . . . . . — 11,945 — 11,945
Total . . . . . . . . . . . . . . . . . . . . . . . . . . . . . . . . $479,552 $4,798,201 $111,006 $5,388,759
At December 31, 2010, Level 3 investments totaled $12,892, representing 0.3% of total investments measuredat fair value on a recurring basis. At December 31, 2009, Level 3 investments totaled $111,006 representing 2.1% oftotal investments measured at fair value on a recurring basis.
The following table presents a reconciliation of the beginning and ending balances for all investmentsmeasured at fair value on a recurring basis using Level 3 inputs as at December 31, 2010 and December 31, 2009:
Fixed MaturityInvestments Other Investments
Total Fair MarketValue
Year Ended December 31, 2010
Level 3 investments — Beginning of period . . . $ 85,336 $ 25,670 $111,006
Payments and purchases . . . . . . . . . . . . . . . . — — —
Sales and maturities . . . . . . . . . . . . . . . . . . . — (13,850) (13,850)
Realized gains . . . . . . . . . . . . . . . . . . . . . . . — 662 662
Unrealized (losses) gains . . . . . . . . . . . . . . . (6,307) 410 (5,897)
Amortization . . . . . . . . . . . . . . . . . . . . . . . . (11,841) — (11,841)
Transfers (out) . . . . . . . . . . . . . . . . . . . . . . . (67,188) — (67,188)
Level 3 investments — End of period . . . . . . . . $ — $ 12,892 $ 12,892
F-18
Validus Holdings, Ltd.
Notes to Consolidated Financial Statements — (Continued)(Expressed in thousands of U.S. dollars, except share and per share information)

Fixed MaturityInvestments Other Investments
Total Fair MarketValue
Year Ended December 31, 2009
Level 3 investments — Beginning of period . . . $111,318 $ — $111,318
Payments and purchases . . . . . . . . . . . . . . . . — 115,351 115,351
Sales and maturities . . . . . . . . . . . . . . . . . . . (822) (92,004) (92,826)
Realized (losses) gains . . . . . . . . . . . . . . . . . (1,284) 1,609 325
Unrealized (losses) gains . . . . . . . . . . . . . . . (7,329) 714 (6,615)
Amortization . . . . . . . . . . . . . . . . . . . . . . . . (16,547) — (16,547)
Transfers (out) . . . . . . . . . . . . . . . . . . . . . . . — — —
Level 3 investments — End of period . . . . . . . . $ 85,336 $ 25,670 $111,006
(b) Net investment income
Net investment income was derived from the following sources:
December 31,2010
December 31,2009
December 31,2008
Years Ended
Fixed maturities and short-term investments . . . . . . . . . . $132,669 $117,631 $127,689
Cash and cash equivalents . . . . . . . . . . . . . . . . . . . . . . . 8,180 3,374 13,416
Securities lending income . . . . . . . . . . . . . . . . . . . . . . . 200 772 1,775
Total gross investment income . . . . . . . . . . . . . . . . . . . . 141,049 121,777 142,880
Investment expenses . . . . . . . . . . . . . . . . . . . . . . . . . . . (6,946) (3,004) (3,352)
Net investment income . . . . . . . . . . . . . . . . . . . . . . . . . $134,103 $118,773 $139,528
(c) Fixed maturity and short-term investments
The following represents an analysis of net realized gains (losses) and the change in net unrealized (losses)gains on investments:
December 31,2010
December 31,2009
December 31,2008
Years Ended
Fixed maturities, short-term and other investments andcash equivalents
Gross realized gains . . . . . . . . . . . . . . . . . . . . . . . . . . $ 76,920 $ 33,063 $ 24,520
Gross realized (losses) . . . . . . . . . . . . . . . . . . . . . . . . (44,422) (44,606) (26,111)
Net realized gains (losses) on investments . . . . . . . . . . . 32,498 (11,543) (1,591)
Net unrealized (losses) gains on securities lending . . . . . (1,009) 6,978 (6,734)
Change in net unrealized gains (losses) on investments . . 46,961 77,818 (72,973)
Total net realized gains (losses) and change in netunrealized gains (losses) on investments . . . . . . . . . . $ 78,450 $ 73,253 $(81,298)
F-19
Validus Holdings, Ltd.
Notes to Consolidated Financial Statements — (Continued)(Expressed in thousands of U.S. dollars, except share and per share information)
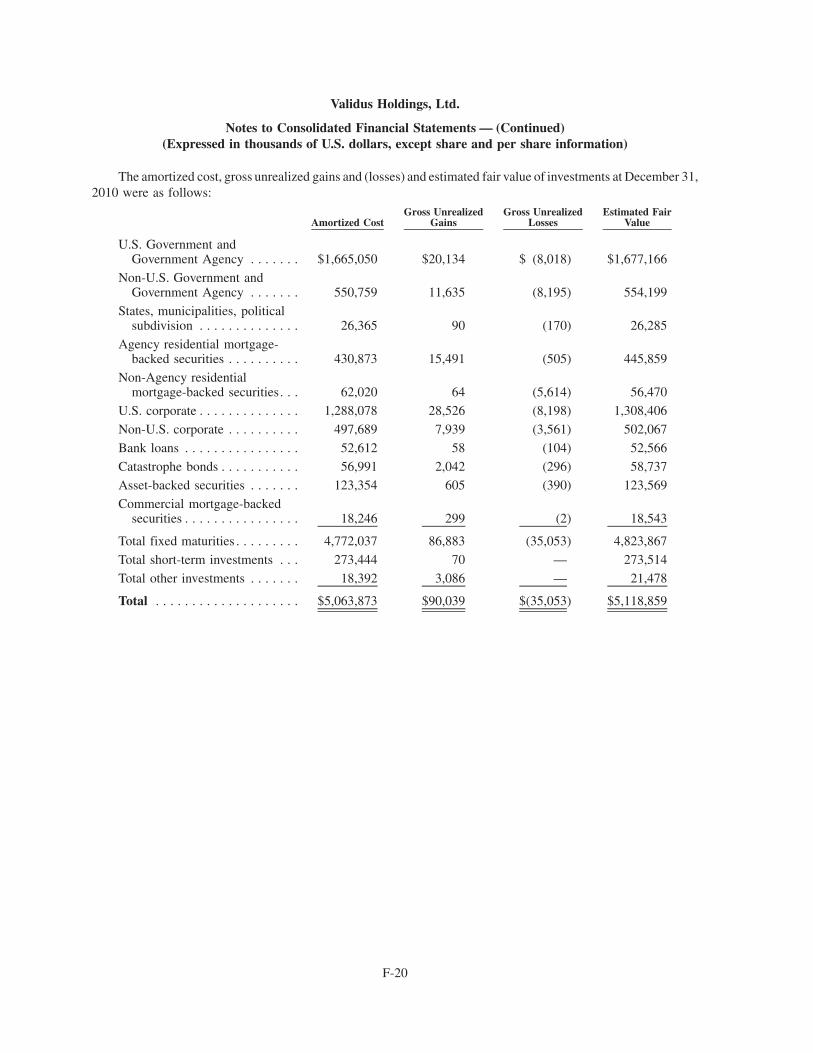
The amortized cost, gross unrealized gains and (losses) and estimated fair value of investments at December 31,2010 were as follows:
Amortized CostGross Unrealized
GainsGross Unrealized
LossesEstimated Fair
Value
U.S. Government andGovernment Agency . . . . . . . $1,665,050 $20,134 $ (8,018) $1,677,166
Non-U.S. Government andGovernment Agency . . . . . . . 550,759 11,635 (8,195) 554,199
States, municipalities, politicalsubdivision . . . . . . . . . . . . . . 26,365 90 (170) 26,285
Agency residential mortgage-backed securities . . . . . . . . . . 430,873 15,491 (505) 445,859
Non-Agency residentialmortgage-backed securities. . . 62,020 64 (5,614) 56,470
U.S. corporate . . . . . . . . . . . . . . 1,288,078 28,526 (8,198) 1,308,406
Non-U.S. corporate . . . . . . . . . . 497,689 7,939 (3,561) 502,067
Bank loans . . . . . . . . . . . . . . . . 52,612 58 (104) 52,566
Catastrophe bonds . . . . . . . . . . . 56,991 2,042 (296) 58,737
Asset-backed securities . . . . . . . 123,354 605 (390) 123,569
Commercial mortgage-backedsecurities . . . . . . . . . . . . . . . . 18,246 299 (2) 18,543
Total fixed maturities . . . . . . . . . 4,772,037 86,883 (35,053) 4,823,867
Total short-term investments . . . 273,444 70 — 273,514
Total other investments . . . . . . . 18,392 3,086 — 21,478
Total . . . . . . . . . . . . . . . . . . . . $5,063,873 $90,039 $(35,053) $5,118,859
F-20
Validus Holdings, Ltd.
Notes to Consolidated Financial Statements — (Continued)(Expressed in thousands of U.S. dollars, except share and per share information)
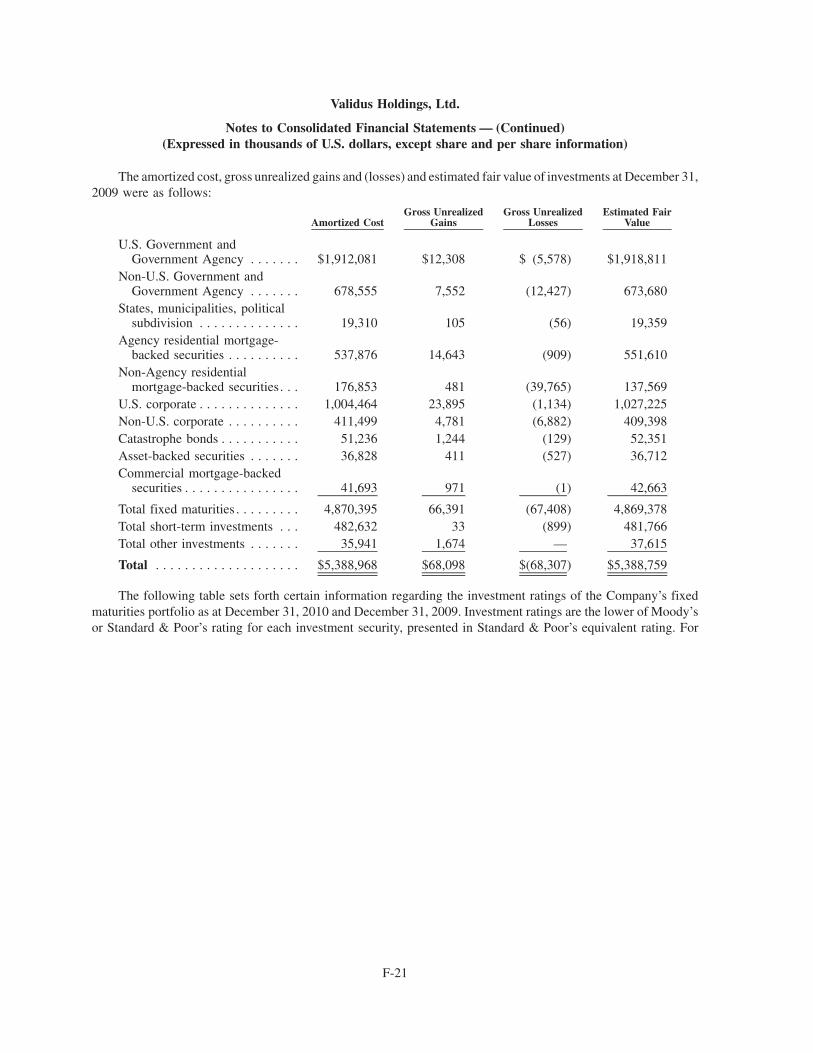
The amortized cost, gross unrealized gains and (losses) and estimated fair value of investments at December 31,2009 were as follows:
Amortized CostGross Unrealized
GainsGross Unrealized
LossesEstimated Fair
Value
U.S. Government andGovernment Agency . . . . . . . $1,912,081 $12,308 $ (5,578) $1,918,811
Non-U.S. Government andGovernment Agency . . . . . . . 678,555 7,552 (12,427) 673,680
States, municipalities, politicalsubdivision . . . . . . . . . . . . . . 19,310 105 (56) 19,359
Agency residential mortgage-backed securities . . . . . . . . . . 537,876 14,643 (909) 551,610
Non-Agency residentialmortgage-backed securities. . . 176,853 481 (39,765) 137,569
U.S. corporate . . . . . . . . . . . . . . 1,004,464 23,895 (1,134) 1,027,225Non-U.S. corporate . . . . . . . . . . 411,499 4,781 (6,882) 409,398Catastrophe bonds . . . . . . . . . . . 51,236 1,244 (129) 52,351Asset-backed securities . . . . . . . 36,828 411 (527) 36,712Commercial mortgage-backed
securities . . . . . . . . . . . . . . . . 41,693 971 (1) 42,663
Total fixed maturities . . . . . . . . . 4,870,395 66,391 (67,408) 4,869,378Total short-term investments . . . 482,632 33 (899) 481,766Total other investments . . . . . . . 35,941 1,674 — 37,615
Total . . . . . . . . . . . . . . . . . . . . $5,388,968 $68,098 $(68,307) $5,388,759
The following table sets forth certain information regarding the investment ratings of the Company’s fixedmaturities portfolio as at December 31, 2010 and December 31, 2009. Investment ratings are the lower of Moody’sor Standard & Poor’s rating for each investment security, presented in Standard & Poor’s equivalent rating. For
F-21
Validus Holdings, Ltd.
Notes to Consolidated Financial Statements — (Continued)(Expressed in thousands of U.S. dollars, except share and per share information)
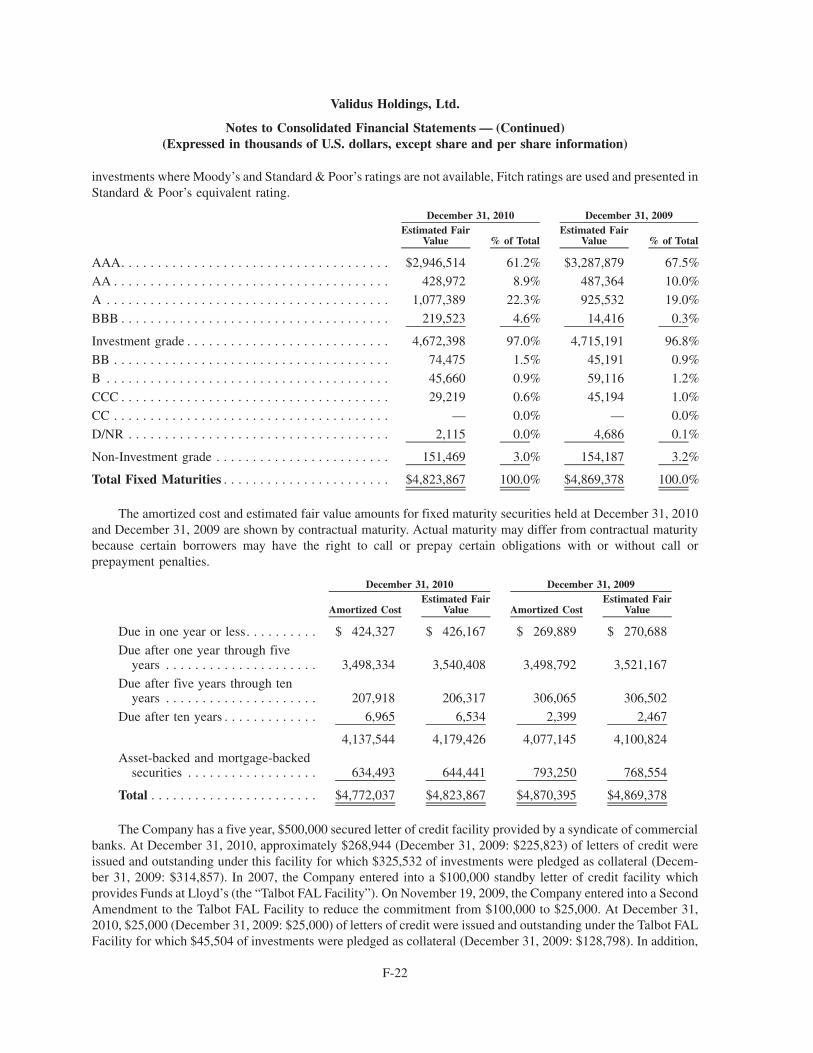
investments where Moody’s and Standard & Poor’s ratings are not available, Fitch ratings are used and presented inStandard & Poor’s equivalent rating.
Estimated FairValue % of Total
Estimated FairValue % of Total
December 31, 2010 December 31, 2009
AAA. . . . . . . . . . . . . . . . . . . . . . . . . . . . . . . . . . . . . $2,946,514 61.2% $3,287,879 67.5%AA . . . . . . . . . . . . . . . . . . . . . . . . . . . . . . . . . . . . . . 428,972 8.9% 487,364 10.0%
A . . . . . . . . . . . . . . . . . . . . . . . . . . . . . . . . . . . . . . . 1,077,389 22.3% 925,532 19.0%
BBB . . . . . . . . . . . . . . . . . . . . . . . . . . . . . . . . . . . . . 219,523 4.6% 14,416 0.3%
Investment grade . . . . . . . . . . . . . . . . . . . . . . . . . . . . 4,672,398 97.0% 4,715,191 96.8%
BB . . . . . . . . . . . . . . . . . . . . . . . . . . . . . . . . . . . . . . 74,475 1.5% 45,191 0.9%
B . . . . . . . . . . . . . . . . . . . . . . . . . . . . . . . . . . . . . . . 45,660 0.9% 59,116 1.2%
CCC . . . . . . . . . . . . . . . . . . . . . . . . . . . . . . . . . . . . . 29,219 0.6% 45,194 1.0%
CC . . . . . . . . . . . . . . . . . . . . . . . . . . . . . . . . . . . . . . — 0.0% — 0.0%
D/NR . . . . . . . . . . . . . . . . . . . . . . . . . . . . . . . . . . . . 2,115 0.0% 4,686 0.1%
Non-Investment grade . . . . . . . . . . . . . . . . . . . . . . . . 151,469 3.0% 154,187 3.2%
Total Fixed Maturities . . . . . . . . . . . . . . . . . . . . . . . $4,823,867 100.0% $4,869,378 100.0%
The amortized cost and estimated fair value amounts for fixed maturity securities held at December 31, 2010and December 31, 2009 are shown by contractual maturity. Actual maturity may differ from contractual maturitybecause certain borrowers may have the right to call or prepay certain obligations with or without call orprepayment penalties.
Amortized CostEstimated Fair
Value Amortized CostEstimated Fair
Value
December 31, 2010 December 31, 2009
Due in one year or less. . . . . . . . . . $ 424,327 $ 426,167 $ 269,889 $ 270,688
Due after one year through fiveyears . . . . . . . . . . . . . . . . . . . . . 3,498,334 3,540,408 3,498,792 3,521,167
Due after five years through tenyears . . . . . . . . . . . . . . . . . . . . . 207,918 206,317 306,065 306,502
Due after ten years . . . . . . . . . . . . . 6,965 6,534 2,399 2,467
4,137,544 4,179,426 4,077,145 4,100,824
Asset-backed and mortgage-backedsecurities . . . . . . . . . . . . . . . . . . 634,493 644,441 793,250 768,554
Total . . . . . . . . . . . . . . . . . . . . . . . $4,772,037 $4,823,867 $4,870,395 $4,869,378
The Company has a five year, $500,000 secured letter of credit facility provided by a syndicate of commercialbanks. At December 31, 2010, approximately $268,944 (December 31, 2009: $225,823) of letters of credit wereissued and outstanding under this facility for which $325,532 of investments were pledged as collateral (Decem-ber 31, 2009: $314,857). In 2007, the Company entered into a $100,000 standby letter of credit facility whichprovides Funds at Lloyd’s (the “Talbot FAL Facility”). On November 19, 2009, the Company entered into a SecondAmendment to the Talbot FAL Facility to reduce the commitment from $100,000 to $25,000. At December 31,2010, $25,000 (December 31, 2009: $25,000) of letters of credit were issued and outstanding under the Talbot FALFacility for which $45,504 of investments were pledged as collateral (December 31, 2009: $128,798). In addition,
F-22
Validus Holdings, Ltd.
Notes to Consolidated Financial Statements — (Continued)(Expressed in thousands of U.S. dollars, except share and per share information)

$1,729,631 of investments were held in trust at December 31, 2010 (December 31, 2009: $1,517,249). Of those,$1,489,243 were held in trust for the benefit of Talbot’s cedants and policyholders, and to facilitate the accreditationof Talbot as an alien insurer/reinsurer by certain regulators (December 31, 2009: $1,408,084).
The Company assumed two letters of credit facilities as part of the IPC Acquisition. A Credit Facility betweenIPC, IPCRe Limited, the Lenders party thereto and Wachovia Bank, National Association (the “IPC SyndicatedFacility”) and a Letters of Credit Master Agreement between Citibank N.A. and IPCRe Limited (the “IPC Bi-Lateral Facility”). At March 31, 2010, the IPC Syndicated Facility was closed. At December 31, 2010, the IPC Bi-Lateral Facility had $68,063 (December 31, 2009: $96,047) letters of credit issued and outstanding for which$105,310 (December 31, 2009: $219,004) of investments were held in an associated collateral account.
(d) Securities lending
The Company participates in a securities lending program whereby certain securities from its portfolio areloaned to third parties for short periods of time through a lending agent. The Company retains all economic interestin the securities it lends and receives a fee from the borrower for the temporary use of the securities. Collateral in theform of cash, government securities and letters of credit is required at a rate of 102% of the market value of theloaned securities and is held by a third party. As at December 31, 2010, the Company had $22,566 (December 31,2009: $88,146) in securities on loan. During the year ended December 31, 2010, the Company recorded a $1,009unrealized loss on this collateral in its Statements of Operations (December 31, 2009: unrealized gain $6,978).
Securities lending collateral reinvested includes corporate floating rate securities and overnight repo with anaverage reset period of 17.6 days (December 31, 2009: 26.1 days). As at December 31, 2010, the securities lendingcollateral reinvested by the Company in connection with its securities lending program was allocated betweenLevels 1, 2 and 3 as follows:
Level 1 Level 2 Level 3 Total
Corporate . . . . . . . . . . . . . . . . . . . . . . . . . . . . . . . . . . . . . $ — $ 229 $— $ 229
Agency. . . . . . . . . . . . . . . . . . . . . . . . . . . . . . . . . . . . . . . — — — —
Asset-backed securities . . . . . . . . . . . . . . . . . . . . . . . . . . . — 5,005 — 5,005
Short-term investments . . . . . . . . . . . . . . . . . . . . . . . . . . . 2,644 14,450 — 17,094
Total . . . . . . . . . . . . . . . . . . . . . . . . . . . . . . . . . . . . . . . . $2,644 $19,684 $— $22,328
As at December 31, 2009, the securities lending collateral reinvested by the Company in connection with itssecurities program was allocated between Levels 1, 2 and 3 as follows:
Level 1 Level 2 Level 3 Total
Corporate . . . . . . . . . . . . . . . . . . . . . . . . . . . . . . . . . . . . . $ — $14,123 $— $14,123
Agency . . . . . . . . . . . . . . . . . . . . . . . . . . . . . . . . . . . . . . . — 9,363 — 9,363
Asset-backed securities . . . . . . . . . . . . . . . . . . . . . . . . . . . — 6,153 — 6,153
Short-term investments . . . . . . . . . . . . . . . . . . . . . . . . . . . 730 59,981 — 60,711
Total . . . . . . . . . . . . . . . . . . . . . . . . . . . . . . . . . . . . . . . . . $730 $89,620 $— $90,350
The following table sets forth certain information regarding the investment ratings of the Company’s securitieslending collateral reinvested as at December 31, 2010 and December 31, 2009. Investment ratings are the lower ofMoody’s or Standard & Poor’s rating for each investment security, presented in Standard & Poor’s equivalent rating.
F-23
Validus Holdings, Ltd.
Notes to Consolidated Financial Statements — (Continued)(Expressed in thousands of U.S. dollars, except share and per share information)

For investments where Moody’s and Standard & Poor’s ratings are not available, Fitch ratings are used andpresented in Standard & Poor’s equivalent rating.
Estimated FairValue % of Total
Estimated FairValue % of Total
December 31, 2010 December 31, 2009
AAA. . . . . . . . . . . . . . . . . . . . . . . . . . . . . . . . . . . . . $ 5,454 24.4% $33,501 37.1%
AA+ . . . . . . . . . . . . . . . . . . . . . . . . . . . . . . . . . . . . . 11,003 49.3% 12,011 13.3%
AA . . . . . . . . . . . . . . . . . . . . . . . . . . . . . . . . . . . . . . — 0.0% 4,998 5.5%
AA- . . . . . . . . . . . . . . . . . . . . . . . . . . . . . . . . . . . . . 2,998 13.5% 19,910 22.0%
A+ . . . . . . . . . . . . . . . . . . . . . . . . . . . . . . . . . . . . . . — 0.0% 9,999 11.1%
A . . . . . . . . . . . . . . . . . . . . . . . . . . . . . . . . . . . . . . . — 0.0% 9,006 10.0%
NR . . . . . . . . . . . . . . . . . . . . . . . . . . . . . . . . . . . . . . 229 1.0% 195 0.2%
19,684 88.2% 89,620 99.2%
NR- Short-term investments(1) . . . . . . . . . . . . . . . . . 2,644 11.8% 730 0.8%
Total . . . . . . . . . . . . . . . . . . . . . . . . . . . . . . . . . . . . $22,328 100.0% $90,350 100.0%
(1) This amount relates to short-term investments and is therefore not a rated security.
The amortized cost and estimated fair value amounts for securities lending collateral reinvested by theCompany at December 31, 2010 and December 31, 2009 are shown by contractual maturity below. Actual maturitymay differ from contractual maturity because certain borrowers may have the right to call or prepay certainobligations with or without call or prepayment penalties.
Amortized CostEstimated Fair
Value Amortized CostEstimated Fair
Value
December 31, 2010 December 31, 2009
Due in one year or less. . . . . . . . . . $17,094 $17,095 $68,895 $70,074
Due after one year through fiveyears . . . . . . . . . . . . . . . . . . . . . 6,000 5,233 21,211 20,276
Total . . . . . . . . . . . . . . . . . . . . . . . $23,094 $22,328 $90,106 $90,350
8. Derivative Instruments Used in Hedging Activities
The Company enters into derivative instruments for risk management purposes, specifically to economicallyhedge unmatched foreign currency exposures. During the year, the Company entered into a foreign currencyforward exchange contract to mitigate the foreign currency exposure of unpaid losses denominated in Chilean Pesos(CLP). The following table summarizes information on the location and amount of the derivative fair value on theconsolidated balance sheet at December 31, 2010:
Derivatives Designated asHedging Instruments: Notional Amount
Balance SheetLocation Fair Value
Balance SheetLocation Fair Value
Asset Derivatives Liability Derivatives
Foreign exchange contract . . $75,000 Other assets $2,905 Other liabilities $—
There were no derivatives on the balance sheet at December 31, 2009.
F-24
Validus Holdings, Ltd.
Notes to Consolidated Financial Statements — (Continued)(Expressed in thousands of U.S. dollars, except share and per share information)

(a) Classification within the fair value hierarchy
As described in Note 7 “Investments”, under U.S. GAAP, a company must determine the appropriate level inthe fair value hierarchy for each fair value measurement. We estimate the fair value for this asset derivative using avaluation obtained from an independent external source. The assumptions used within the valuation are observablein the marketplace, can be derived from observable data or are supported by observable levels at which transactionsare executed in the marketplace. Accordingly, we classified this derivative within Level 2 of the fair value hierarchy.
(b) Derivative instruments designated as a fair value hedge
The Company designates its derivative instrument as a fair value hedge and formally and contemporaneouslydocuments all relationships between the hedging instruments and hedged items and links the hedging derivative tospecific assets and liabilities. The Company assesses the effectiveness of the hedge, both at inception and on an on-going basis and determines whether the hedge is highly effective in offsetting changes in fair value of the linkedhedged item.
The following table provides the total impact on earnings relating to the derivative instrument formallydesignated as a fair value hedge along with the impact of the related hedged item for the year end December 31,2010:
Derivatives designatedas fair value hedges andrelated hedged item:
Location of Gain(Loss) Recognized in
Income
Amount of Gain(Loss) Recognized in
Income onDerivative
Amount of Gain (Loss)on Hedged Item
Recognized in IncomeAttributable to Risk
Being Hedged
Amount of Gain (Loss)Recognized in Income
on Derivative(Ineffective Portion)
Year Ended December 31, 2010
Foreign exchange . . Foreign exchangegain (loss)
$2,905 $(2,905) $—
9. Premiums receivable
Premiums receivable are composed of premiums in the course of collection, net of commissions andbrokerage, and premiums accrued but unbilled, net of commissions and brokerage. The following is a breakdownof the components of receivables at December 31, 2010 and 2009:
Premiumsin Course
of Collection
PremiumsAccrued
But Unbilled Total
Balance as at December 31, 2009 . . . . . . . . . . . . . . . . . . . . $ 243,930 $307,686 $551,616
Change during 2010 . . . . . . . . . . . . . . . . . . . . . . . . . . . . . . (125,588) 142,733 17,145
Balance as at December 31, 2010 . . . . . . . . . . . . . . . . . . . . 118,342 450,419 568,761
Balance as at December 31, 2008 . . . . . . . . . . . . . . . . . . . . 160,455 247,804 408,259
Change during 2009 . . . . . . . . . . . . . . . . . . . . . . . . . . . . . . 83,475 59,882 143,357
Balance as at December 31, 2009 . . . . . . . . . . . . . . . . . . . . 243,930 307,686 551,616
10. Reserve for losses and loss expenses
Reserves for losses and loss expenses are based in part upon the estimation of case losses reported frombrokers, insureds and ceding companies. The Company also uses statistical and actuarial methods to estimateultimate expected losses and loss expenses. The period of time from the occurrence of a loss, the reporting of a lossto the Company and the settlement of the Company’s liability may be several months or years. During this period,additional facts and trends may be revealed. As these factors become apparent, case reserves will be adjusted,
F-25
Validus Holdings, Ltd.
Notes to Consolidated Financial Statements — (Continued)(Expressed in thousands of U.S. dollars, except share and per share information)
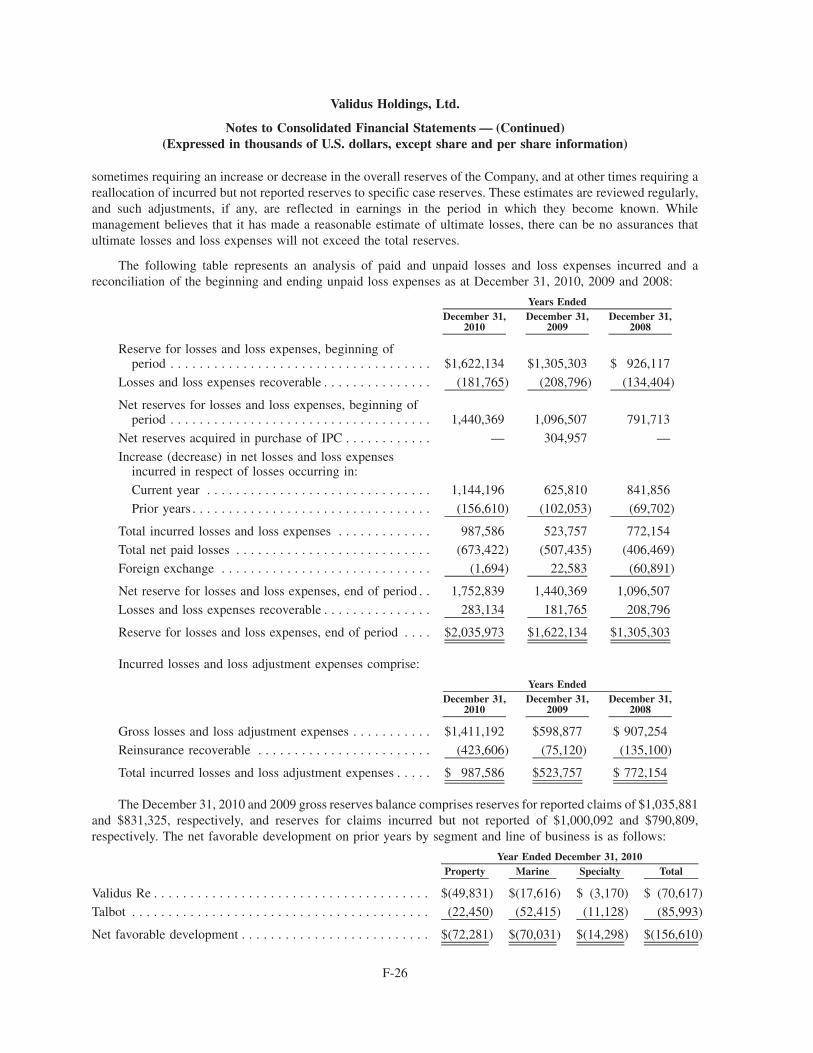
sometimes requiring an increase or decrease in the overall reserves of the Company, and at other times requiring areallocation of incurred but not reported reserves to specific case reserves. These estimates are reviewed regularly,and such adjustments, if any, are reflected in earnings in the period in which they become known. Whilemanagement believes that it has made a reasonable estimate of ultimate losses, there can be no assurances thatultimate losses and loss expenses will not exceed the total reserves.
The following table represents an analysis of paid and unpaid losses and loss expenses incurred and areconciliation of the beginning and ending unpaid loss expenses as at December 31, 2010, 2009 and 2008:
December 31,2010
December 31,2009
December 31,2008
Years Ended
Reserve for losses and loss expenses, beginning ofperiod . . . . . . . . . . . . . . . . . . . . . . . . . . . . . . . . . . . . $1,622,134 $1,305,303 $ 926,117
Losses and loss expenses recoverable . . . . . . . . . . . . . . . (181,765) (208,796) (134,404)
Net reserves for losses and loss expenses, beginning ofperiod . . . . . . . . . . . . . . . . . . . . . . . . . . . . . . . . . . . . 1,440,369 1,096,507 791,713
Net reserves acquired in purchase of IPC . . . . . . . . . . . . — 304,957 —
Increase (decrease) in net losses and loss expensesincurred in respect of losses occurring in:
Current year . . . . . . . . . . . . . . . . . . . . . . . . . . . . . . . 1,144,196 625,810 841,856
Prior years . . . . . . . . . . . . . . . . . . . . . . . . . . . . . . . . . (156,610) (102,053) (69,702)
Total incurred losses and loss expenses . . . . . . . . . . . . . 987,586 523,757 772,154
Total net paid losses . . . . . . . . . . . . . . . . . . . . . . . . . . . (673,422) (507,435) (406,469)
Foreign exchange . . . . . . . . . . . . . . . . . . . . . . . . . . . . . (1,694) 22,583 (60,891)
Net reserve for losses and loss expenses, end of period . . 1,752,839 1,440,369 1,096,507
Losses and loss expenses recoverable . . . . . . . . . . . . . . . 283,134 181,765 208,796
Reserve for losses and loss expenses, end of period . . . . $2,035,973 $1,622,134 $1,305,303
Incurred losses and loss adjustment expenses comprise:
December 31,2010
December 31,2009
December 31,2008
Years Ended
Gross losses and loss adjustment expenses . . . . . . . . . . . $1,411,192 $598,877 $ 907,254
Reinsurance recoverable . . . . . . . . . . . . . . . . . . . . . . . . (423,606) (75,120) (135,100)
Total incurred losses and loss adjustment expenses . . . . . $ 987,586 $523,757 $ 772,154
The December 31, 2010 and 2009 gross reserves balance comprises reserves for reported claims of $1,035,881and $831,325, respectively, and reserves for claims incurred but not reported of $1,000,092 and $790,809,respectively. The net favorable development on prior years by segment and line of business is as follows:
Property Marine Specialty TotalYear Ended December 31, 2010
Validus Re . . . . . . . . . . . . . . . . . . . . . . . . . . . . . . . . . . . . . . $(49,831) $(17,616) $ (3,170) $ (70,617)
Talbot . . . . . . . . . . . . . . . . . . . . . . . . . . . . . . . . . . . . . . . . . (22,450) (52,415) (11,128) (85,993)
Net favorable development . . . . . . . . . . . . . . . . . . . . . . . . . . $(72,281) $(70,031) $(14,298) $(156,610)
F-26
Validus Holdings, Ltd.
Notes to Consolidated Financial Statements — (Continued)(Expressed in thousands of U.S. dollars, except share and per share information)
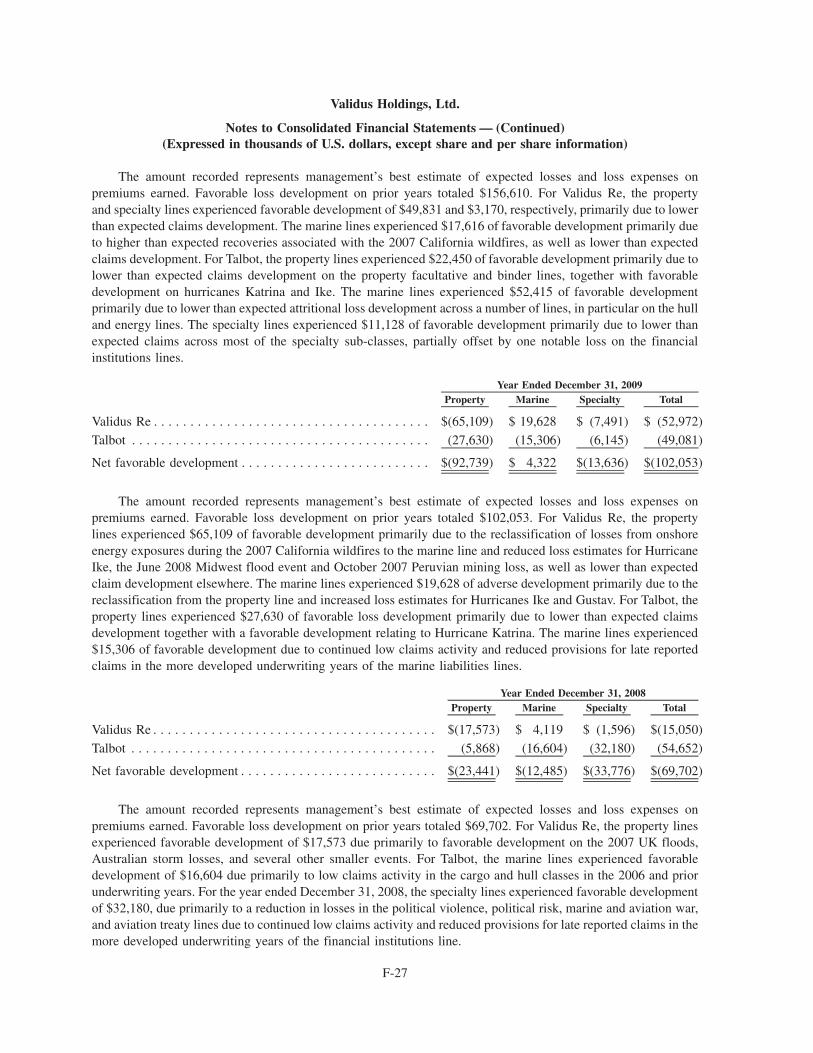
The amount recorded represents management’s best estimate of expected losses and loss expenses onpremiums earned. Favorable loss development on prior years totaled $156,610. For Validus Re, the propertyand specialty lines experienced favorable development of $49,831 and $3,170, respectively, primarily due to lowerthan expected claims development. The marine lines experienced $17,616 of favorable development primarily dueto higher than expected recoveries associated with the 2007 California wildfires, as well as lower than expectedclaims development. For Talbot, the property lines experienced $22,450 of favorable development primarily due tolower than expected claims development on the property facultative and binder lines, together with favorabledevelopment on hurricanes Katrina and Ike. The marine lines experienced $52,415 of favorable developmentprimarily due to lower than expected attritional loss development across a number of lines, in particular on the hulland energy lines. The specialty lines experienced $11,128 of favorable development primarily due to lower thanexpected claims across most of the specialty sub-classes, partially offset by one notable loss on the financialinstitutions lines.
Property Marine Specialty TotalYear Ended December 31, 2009
Validus Re . . . . . . . . . . . . . . . . . . . . . . . . . . . . . . . . . . . . . . $(65,109) $ 19,628 $ (7,491) $ (52,972)
Talbot . . . . . . . . . . . . . . . . . . . . . . . . . . . . . . . . . . . . . . . . . (27,630) (15,306) (6,145) (49,081)
Net favorable development . . . . . . . . . . . . . . . . . . . . . . . . . . $(92,739) $ 4,322 $(13,636) $(102,053)
The amount recorded represents management’s best estimate of expected losses and loss expenses onpremiums earned. Favorable loss development on prior years totaled $102,053. For Validus Re, the propertylines experienced $65,109 of favorable development primarily due to the reclassification of losses from onshoreenergy exposures during the 2007 California wildfires to the marine line and reduced loss estimates for HurricaneIke, the June 2008 Midwest flood event and October 2007 Peruvian mining loss, as well as lower than expectedclaim development elsewhere. The marine lines experienced $19,628 of adverse development primarily due to thereclassification from the property line and increased loss estimates for Hurricanes Ike and Gustav. For Talbot, theproperty lines experienced $27,630 of favorable loss development primarily due to lower than expected claimsdevelopment together with a favorable development relating to Hurricane Katrina. The marine lines experienced$15,306 of favorable development due to continued low claims activity and reduced provisions for late reportedclaims in the more developed underwriting years of the marine liabilities lines.
Property Marine Specialty TotalYear Ended December 31, 2008
Validus Re . . . . . . . . . . . . . . . . . . . . . . . . . . . . . . . . . . . . . . . $(17,573) $ 4,119 $ (1,596) $(15,050)
Talbot . . . . . . . . . . . . . . . . . . . . . . . . . . . . . . . . . . . . . . . . . . (5,868) (16,604) (32,180) (54,652)
Net favorable development . . . . . . . . . . . . . . . . . . . . . . . . . . . $(23,441) $(12,485) $(33,776) $(69,702)
The amount recorded represents management’s best estimate of expected losses and loss expenses onpremiums earned. Favorable loss development on prior years totaled $69,702. For Validus Re, the property linesexperienced favorable development of $17,573 due primarily to favorable development on the 2007 UK floods,Australian storm losses, and several other smaller events. For Talbot, the marine lines experienced favorabledevelopment of $16,604 due primarily to low claims activity in the cargo and hull classes in the 2006 and priorunderwriting years. For the year ended December 31, 2008, the specialty lines experienced favorable developmentof $32,180, due primarily to a reduction in losses in the political violence, political risk, marine and aviation war,and aviation treaty lines due to continued low claims activity and reduced provisions for late reported claims in themore developed underwriting years of the financial institutions line.
F-27
Validus Holdings, Ltd.
Notes to Consolidated Financial Statements — (Continued)(Expressed in thousands of U.S. dollars, except share and per share information)

11. Accounts payable and accrued expenses
The following are components of accounts payable and accrued expenses:
December 31,2010
December 31,2009
Amounts due to third party funds at Lloyd’s providers . . . . . . . . . . . . . . . . . . . . . $ — $ 17,746
Amounts due to brokers . . . . . . . . . . . . . . . . . . . . . . . . . . . . . . . . . . . . . . . . . . . 21,524 12,963
Trade and compensation payables . . . . . . . . . . . . . . . . . . . . . . . . . . . . . . . . . . . . 77,796 97,100
Total . . . . . . . . . . . . . . . . . . . . . . . . . . . . . . . . . . . . . . . . . . . . . . . . . . . . . . . . . $99,320 $127,809
12. Reinsurance
The Company enters into reinsurance and retrocession agreements in order to mitigate its accumulation of loss,reduce its liability on individual risks, enable it to underwrite policies with higher limits, and increase its aggregatecapacity. The cession of insurance and reinsurance does not legally discharge the Company from its primaryliability for the full amount of the policies, and the Company is required to pay the loss and bear collection risk if thereinsurer fails to meet its obligations under the reinsurance or retrocession agreement. Amounts recoverable fromreinsurers are estimated in a manner consistent with the underlying liabilities.
a) Effects of reinsurance on premiums written and earned
The effects of reinsurance on premiums written and earned for the years ended December 31, 2010, 2009 and2008 are as follows:
Written Earned Written Earned Elimination Written EarnedValidus Re Talbot Total
Year Ended December 31, 2010
Direct . . . . . $ — $ — $ 460,337 $ 450,348 $ — $ 460,337 $ 450,348
Assumed . . . 1,101,239 1,127,249 520,736 503,021 (91,746) 1,530,229 1,630,270
Ceded . . . . . (63,147) (76,049) (258,081) (243,446) 91,746 (229,482) (319,495)
Total . . . . . . $1,038,092 $1,051,200 $ 722,992 $ 709,923 $ — $1,761,084 $1,761,123
Written Earned Written Earned Elimination Written EarnedValidus Re Talbot Total
Year Ended December 31, 2009
Direct . . . . . . . . $ — $ — $ 459,771 $ 427,280 $ — $ 459,771 $ 427,280
Assumed . . . . . . 768,084 880,434 460,135 382,535 (66,749) 1,161,470 1,262,969
Ceded . . . . . . . . (95,446) (84,884) (204,186) (155,788) 66,749 (232,883) (240,672)
Total . . . . . . . . . $672,638 $795,550 $ 715,720 $ 654,027 $ — $1,388,358 $1,449,577
F-28
Validus Holdings, Ltd.
Notes to Consolidated Financial Statements — (Continued)(Expressed in thousands of U.S. dollars, except share and per share information)

Written Earned Written Earned Elimination Written EarnedValidus Re Talbot Total
Year Ended December 31, 2008
Direct . . . . . . . . . $ — $ — $393,003 $389,389 $ — $ 393,003 $ 389,389
Assumed . . . . . . . 687,771 715,253 315,993 299,291 (34,283) 969,481 1,014,544
Ceded . . . . . . . . . (62,933) (61,722) (95,510) (85,693) 34,283 (124,160) (147,415)
Total . . . . . . . . . . $624,838 $653,531 $613,486 $602,987 $ — $1,238,324 $1,256,518
b) Credit risk
The Company evaluates the financial condition of its reinsurers and monitors concentration of credit riskarising from its exposure to individual reinsurers. The reinsurance program is generally placed with reinsurerswhose rating, at the time of placement, was A- or better rated by Standard & Poor’s or the equivalent with otherrating agencies. Exposure to a single reinsurer is also controlled with restrictions dependent on rating. AtDecember 31, 2010, 97.4% of reinsurance recoverables (which includes loss reserves recoverable and recoverableson paid losses) were from reinsurers rated A- or better and included $146,519 of IBNR recoverable (December 31,2009: $99,587). Reinsurance recoverables by reinsurer are as follows:
ReinsuranceRecoverable % of Total
ReinsuranceRecoverable % of Total
December 31, 2010 December 31, 2009
Top 10 reinsurers . . . . . . . . . . . . . . . . . . . . . . . . . . . . . . . $222,420 71.5% 170,810 86.9%
Other reinsurers’ balances H $1 million . . . . . . . . . . . . . . 80,221 25.8% 19,818 10.1%
Other reinsurers’ balances G $1 million . . . . . . . . . . . . . . 8,489 2.7% 5,919 3.0%
Total . . . . . . . . . . . . . . . . . . . . . . . . . . . . . . . . . . . . . . . . $311,130 100.0% 196,547 100.0%
Top 10 Reinsurers RatingReinsuranceRecoverable % of Total
December 31, 2010
Lloyd’s Syndicates . . . . . . . . . . . . . . . . . . . . . . . . . . . . . . . . . . . . . . . . . . . A+ $ 60,716 27.2%
Hannover Re . . . . . . . . . . . . . . . . . . . . . . . . . . . . . . . . . . . . . . . . . . . . . . . AA- 32,392 14.6%
Fully collateralized reinsurers . . . . . . . . . . . . . . . . . . . . . . . . . . . . . . . . . . . NR 23,750 10.7%
Montpelier Re . . . . . . . . . . . . . . . . . . . . . . . . . . . . . . . . . . . . . . . . . . . . . . A- 20,000 9.0%
Munich Re. . . . . . . . . . . . . . . . . . . . . . . . . . . . . . . . . . . . . . . . . . . . . . . . . AA- 17,411 7.8%
Everest Re . . . . . . . . . . . . . . . . . . . . . . . . . . . . . . . . . . . . . . . . . . . . . . . . . A+ 16,611 7.5%
Allianz . . . . . . . . . . . . . . . . . . . . . . . . . . . . . . . . . . . . . . . . . . . . . . . . . . . AA 14,184 6.4%
Transatlantic Re . . . . . . . . . . . . . . . . . . . . . . . . . . . . . . . . . . . . . . . . . . . . . A+ 13,758 6.2%
Tokio Millennium Re . . . . . . . . . . . . . . . . . . . . . . . . . . . . . . . . . . . . . . . . . AA 11,980 5.4%
Platinum Re . . . . . . . . . . . . . . . . . . . . . . . . . . . . . . . . . . . . . . . . . . . . . . . . A 11,618 5.2%
Total . . . . . . . . . . . . . . . . . . . . . . . . . . . . . . . . . . . . . . . . . . . . . . . . . . . . . $222,420 100.0%
F-29
Validus Holdings, Ltd.
Notes to Consolidated Financial Statements — (Continued)(Expressed in thousands of U.S. dollars, except share and per share information)
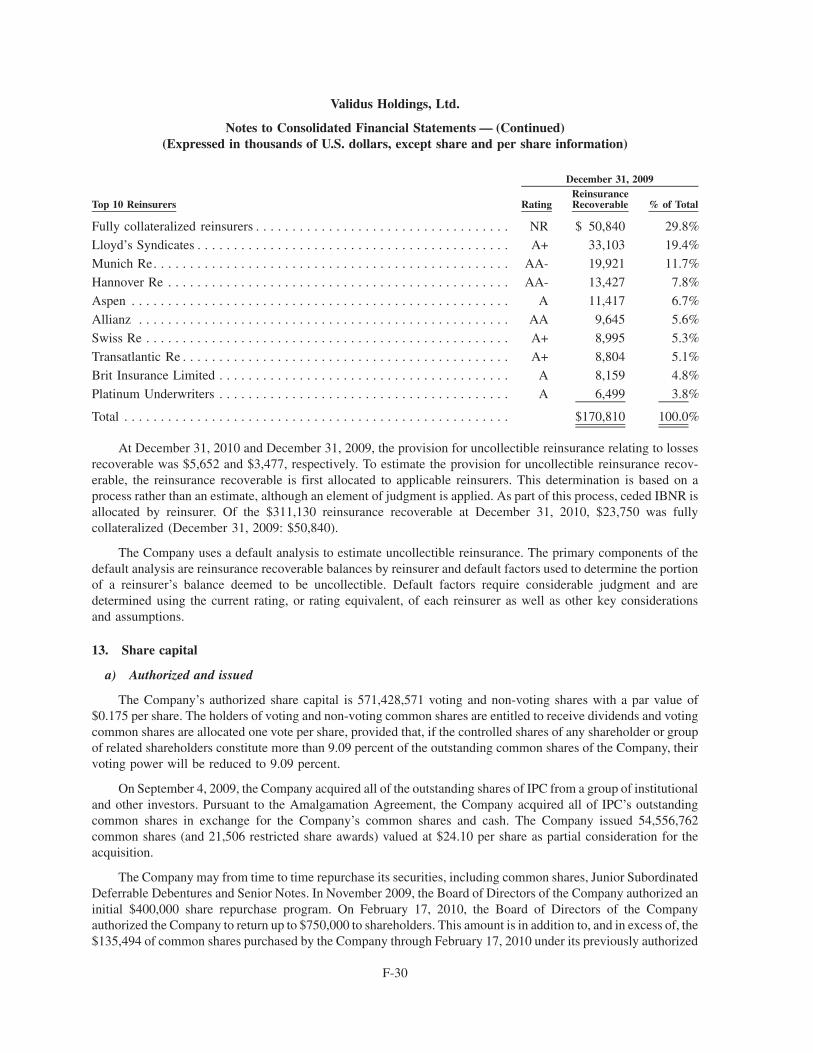
Top 10 Reinsurers RatingReinsuranceRecoverable % of Total
December 31, 2009
Fully collateralized reinsurers . . . . . . . . . . . . . . . . . . . . . . . . . . . . . . . . . . . NR $ 50,840 29.8%
Lloyd’s Syndicates . . . . . . . . . . . . . . . . . . . . . . . . . . . . . . . . . . . . . . . . . . . A+ 33,103 19.4%
Munich Re. . . . . . . . . . . . . . . . . . . . . . . . . . . . . . . . . . . . . . . . . . . . . . . . . AA- 19,921 11.7%
Hannover Re . . . . . . . . . . . . . . . . . . . . . . . . . . . . . . . . . . . . . . . . . . . . . . . AA- 13,427 7.8%
Aspen . . . . . . . . . . . . . . . . . . . . . . . . . . . . . . . . . . . . . . . . . . . . . . . . . . . . A 11,417 6.7%
Allianz . . . . . . . . . . . . . . . . . . . . . . . . . . . . . . . . . . . . . . . . . . . . . . . . . . . AA 9,645 5.6%
Swiss Re . . . . . . . . . . . . . . . . . . . . . . . . . . . . . . . . . . . . . . . . . . . . . . . . . . A+ 8,995 5.3%
Transatlantic Re . . . . . . . . . . . . . . . . . . . . . . . . . . . . . . . . . . . . . . . . . . . . . A+ 8,804 5.1%
Brit Insurance Limited . . . . . . . . . . . . . . . . . . . . . . . . . . . . . . . . . . . . . . . . A 8,159 4.8%
Platinum Underwriters . . . . . . . . . . . . . . . . . . . . . . . . . . . . . . . . . . . . . . . . A 6,499 3.8%
Total . . . . . . . . . . . . . . . . . . . . . . . . . . . . . . . . . . . . . . . . . . . . . . . . . . . . . $170,810 100.0%
At December 31, 2010 and December 31, 2009, the provision for uncollectible reinsurance relating to lossesrecoverable was $5,652 and $3,477, respectively. To estimate the provision for uncollectible reinsurance recov-erable, the reinsurance recoverable is first allocated to applicable reinsurers. This determination is based on aprocess rather than an estimate, although an element of judgment is applied. As part of this process, ceded IBNR isallocated by reinsurer. Of the $311,130 reinsurance recoverable at December 31, 2010, $23,750 was fullycollateralized (December 31, 2009: $50,840).
The Company uses a default analysis to estimate uncollectible reinsurance. The primary components of thedefault analysis are reinsurance recoverable balances by reinsurer and default factors used to determine the portionof a reinsurer’s balance deemed to be uncollectible. Default factors require considerable judgment and aredetermined using the current rating, or rating equivalent, of each reinsurer as well as other key considerationsand assumptions.
13. Share capital
a) Authorized and issued
The Company’s authorized share capital is 571,428,571 voting and non-voting shares with a par value of$0.175 per share. The holders of voting and non-voting common shares are entitled to receive dividends and votingcommon shares are allocated one vote per share, provided that, if the controlled shares of any shareholder or groupof related shareholders constitute more than 9.09 percent of the outstanding common shares of the Company, theirvoting power will be reduced to 9.09 percent.
On September 4, 2009, the Company acquired all of the outstanding shares of IPC from a group of institutionaland other investors. Pursuant to the Amalgamation Agreement, the Company acquired all of IPC’s outstandingcommon shares in exchange for the Company’s common shares and cash. The Company issued 54,556,762common shares (and 21,506 restricted share awards) valued at $24.10 per share as partial consideration for theacquisition.
The Company may from time to time repurchase its securities, including common shares, Junior SubordinatedDeferrable Debentures and Senior Notes. In November 2009, the Board of Directors of the Company authorized aninitial $400,000 share repurchase program. On February 17, 2010, the Board of Directors of the Companyauthorized the Company to return up to $750,000 to shareholders. This amount is in addition to, and in excess of, the$135,494 of common shares purchased by the Company through February 17, 2010 under its previously authorized
F-30
Validus Holdings, Ltd.
Notes to Consolidated Financial Statements — (Continued)(Expressed in thousands of U.S. dollars, except share and per share information)

$400,000 share repurchase program. On May 6, 2010, the Board of Directors authorized a self tender offer pursuantto which the Company has repurchased $300,000 in common shares. On November 4, 2010, the Board of Directorsauthorized a self tender offer pursuant to which the Company has repurchased $300,000 in common shares. Inaddition, the Board of Directors authorized separate repurchase agreements with funds affiliated with or managedby each of Aquiline Capital Partners LLC, New Mountain Capital LLC, and Vestar Capital Partners pursuant towhich the Company has repurchased $61,638 in common shares. On December 20, 2010, the Board of Directorsauthorized the Company to return up to $400,000 to shareholders. This amount is in addition to the $929,173 ofcommon shares purchased by the Company through December 23, 2010 under its previously authorized sharerepurchase program.
The Company expects the purchases under its share repurchase program to be made from time to time in theopen market or in privately negotiated transactions. The timing, form and amount of the share repurchases under theprogram will depend on a variety of factors, including market conditions, the Company’s capital position relative tointernal and rating agency targets, legal requirements and other factors. The repurchase program may be modified,extended or terminated by the Board of Directors at any time.
The following table is a summary of the common shares issued and outstanding:
Common Shares
Common shares issued, December 31, 2009 . . . . . . . . . . . . . . . . . . . . . . . . . . . . . . . 131,616,349
Restricted share awards vested, net of shares withheld . . . . . . . . . . . . . . . . . . . . . . . 405,055
Restricted share units vested, net of shares withheld . . . . . . . . . . . . . . . . . . . . . . . . . 57,192
Employee seller shares vested . . . . . . . . . . . . . . . . . . . . . . . . . . . . . . . . . . . . . . . . . 203,544
Options exercised . . . . . . . . . . . . . . . . . . . . . . . . . . . . . . . . . . . . . . . . . . . . . . . . . . 550,014
Warrants exercised . . . . . . . . . . . . . . . . . . . . . . . . . . . . . . . . . . . . . . . . . . . . . . . . . 5,957
Common shares issued, December 31, 2010 . . . . . . . . . . . . . . . . . . . . . . . . . . . . . . . 132,838,111
Shares repurchased, December 31, 2010. . . . . . . . . . . . . . . . . . . . . . . . . . . . . . . . . . (34,836,885)
Common shares outstanding, December 31, 2010 . . . . . . . . . . . . . . . . . . . . . . . . . . . 98,001,226
Common Shares
Common shares issued and outstanding, December 31, 2008 . . . . . . . . . . . . . . . . . . 75,624,697
IPC acquisition issuance . . . . . . . . . . . . . . . . . . . . . . . . . . . . . . . . . . . . . . . . . . . . . 54,556,762
Restricted share awards vested, net of shares withheld . . . . . . . . . . . . . . . . . . . . . . . 423,746
Restricted share units vested, net of shares withheld . . . . . . . . . . . . . . . . . . . . . . . . . 360,383
Employee seller shares vested . . . . . . . . . . . . . . . . . . . . . . . . . . . . . . . . . . . . . . . . . 248,085
Options exercised . . . . . . . . . . . . . . . . . . . . . . . . . . . . . . . . . . . . . . . . . . . . . . . . . . 164,834
Warrants exercised . . . . . . . . . . . . . . . . . . . . . . . . . . . . . . . . . . . . . . . . . . . . . . . . . 237,842
Common shares issued, December 31, 2009 . . . . . . . . . . . . . . . . . . . . . . . . . . . . . . . 131,616,349
Shares repurchased, December 31, 2009. . . . . . . . . . . . . . . . . . . . . . . . . . . . . . . . . . (3,156,871)
Common shares outstanding, December 31, 2009 . . . . . . . . . . . . . . . . . . . . . . . . . . . 128,459,478
b) Warrants
In consideration for the founder’s and sponsoring investors’ commitments, the Company had issued as atDecember 31, 2010 warrants to the founding shareholder and sponsoring investors to purchase, in the aggregate, upto 7,934,860 (December 31, 2009: 7,952,138) common shares. Of those issued, 2,090,815 (December 31, 2009:
F-31
Validus Holdings, Ltd.
Notes to Consolidated Financial Statements — (Continued)(Expressed in thousands of U.S. dollars, except share and per share information)

2,090,815) of the warrants are to purchase non-voting common shares. No further warrants are anticipated to beissued.
During the year ended December 31, 2010, 17,278 (2009: 728,010) warrants were exercised which resulted inthe net share issuance of 5,957 (2009: 237,842) common shares.
c) Deferred share units
Under the terms of the Company’s Director Stock Compensation Plan, non-management directors may elect toreceive their director fees in deferred share units rather than cash. The number of share units distributed in case ofelection under the plan is equal to the amount of the annual retainer fee otherwise payable to the director on suchpayment date divided by 100% of the fair market value of a share on such payment date. Additional deferred shareunits are issued in lieu of dividends that accrue on these deferred share units. The total outstanding deferred shareunits at December 31, 2010 were 4,727 (December 31, 2009: 4,577).
d) Dividends
On February 17, 2010, the Company announced a quarterly cash dividend of $0.22 (2009: $0.20) per commonshare and $0.22 per common share equivalent for which each outstanding warrant is then exercisable, payable onMarch 31, 2010 to holders of record on March 15, 2010.
On May 5, 2010, the Company announced a quarterly cash dividend of $0.22 (2009: $0.20) per common shareand $0.22 per common share equivalent for which each outstanding warrant is then exercisable, payable on June 30,2010 to holders of record on June 15, 2010.
On August 4, 2010, the Company announced a quarterly cash dividend of $0.22 (2009: $0.20) per commonshare and $0.22 per common share equivalent for which each outstanding warrant is then exercisable, payable onSeptember 30, 2010 to holders of record on September 15, 2010.
On November 3, 2010, the Company announced a quarterly cash dividend of $0.22 (2009: $0.20) per commonshare and $0.22 per common share equivalent for which each outstanding warrant is then exercisable, payable onDecember 31, 2010 to holders of record on December 15, 2010.
14. Retirement plans
The Company provides pension benefits to eligible employees through various plans which are managedexternally and sponsored by the Company. All pension plans are structured as defined contribution retirement plans.The Company’s contributions are expensed as incurred. The Company’s expenses for its defined contributionretirement plans for the years ended December 31, 2010, 2009 and 2008 were $5,505, $5,606 and $4,732,respectively.
15. Stock plans
a) Long Term Incentive Plan and Short Term Incentive Plan
The Company’s Long Term Incentive Plan (“LTIP”) provides for grants to employees of options, stockappreciation rights (“SARs”), restricted shares, restricted share units, performance shares, dividend equivalents orother share-based awards. In addition, the Company may issue restricted share awards or restricted share units inconnection with awards issued under its annual Short Term Incentive Plan (“STIP”). The total number of sharesreserved for issuance under the LTIP and STIP are 13,126,896 shares of which 7,595,957 shares are remaining. TheLTIP and STIP are administered by the Compensation Committee of the Board of Directors. No SARs have beengranted to date. Grant prices are established at the fair market value of the Company’s common shares at the date ofgrant.
F-32
Validus Holdings, Ltd.
Notes to Consolidated Financial Statements — (Continued)(Expressed in thousands of U.S. dollars, except share and per share information)
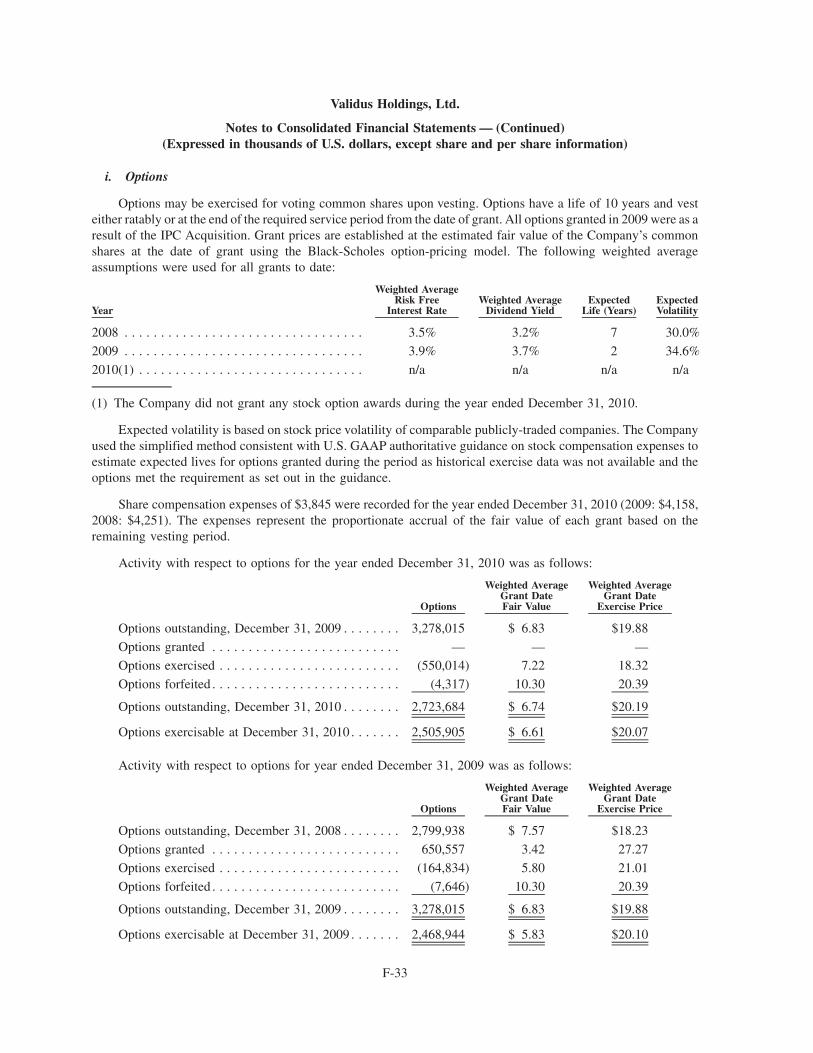
i. Options
Options may be exercised for voting common shares upon vesting. Options have a life of 10 years and vesteither ratably or at the end of the required service period from the date of grant. All options granted in 2009 were as aresult of the IPC Acquisition. Grant prices are established at the estimated fair value of the Company’s commonshares at the date of grant using the Black-Scholes option-pricing model. The following weighted averageassumptions were used for all grants to date:
Year
Weighted AverageRisk Free
Interest RateWeighted Average
Dividend YieldExpected
Life (Years)ExpectedVolatility
2008 . . . . . . . . . . . . . . . . . . . . . . . . . . . . . . . . . 3.5% 3.2% 7 30.0%
2009 . . . . . . . . . . . . . . . . . . . . . . . . . . . . . . . . . 3.9% 3.7% 2 34.6%
2010(1) . . . . . . . . . . . . . . . . . . . . . . . . . . . . . . . n/a n/a n/a n/a
(1) The Company did not grant any stock option awards during the year ended December 31, 2010.
Expected volatility is based on stock price volatility of comparable publicly-traded companies. The Companyused the simplified method consistent with U.S. GAAP authoritative guidance on stock compensation expenses toestimate expected lives for options granted during the period as historical exercise data was not available and theoptions met the requirement as set out in the guidance.
Share compensation expenses of $3,845 were recorded for the year ended December 31, 2010 (2009: $4,158,2008: $4,251). The expenses represent the proportionate accrual of the fair value of each grant based on theremaining vesting period.
Activity with respect to options for the year ended December 31, 2010 was as follows:
Options
Weighted AverageGrant DateFair Value
Weighted AverageGrant Date
Exercise Price
Options outstanding, December 31, 2009 . . . . . . . . 3,278,015 $ 6.83 $19.88Options granted . . . . . . . . . . . . . . . . . . . . . . . . . . — — —
Options exercised . . . . . . . . . . . . . . . . . . . . . . . . . (550,014) 7.22 18.32
Options forfeited . . . . . . . . . . . . . . . . . . . . . . . . . . (4,317) 10.30 20.39
Options outstanding, December 31, 2010 . . . . . . . . 2,723,684 $ 6.74 $20.19
Options exercisable at December 31, 2010 . . . . . . . 2,505,905 $ 6.61 $20.07
Activity with respect to options for year ended December 31, 2009 was as follows:
Options
Weighted AverageGrant DateFair Value
Weighted AverageGrant Date
Exercise Price
Options outstanding, December 31, 2008 . . . . . . . . 2,799,938 $ 7.57 $18.23
Options granted . . . . . . . . . . . . . . . . . . . . . . . . . . 650,557 3.42 27.27
Options exercised . . . . . . . . . . . . . . . . . . . . . . . . . (164,834) 5.80 21.01
Options forfeited . . . . . . . . . . . . . . . . . . . . . . . . . . (7,646) 10.30 20.39
Options outstanding, December 31, 2009 . . . . . . . . 3,278,015 $ 6.83 $19.88
Options exercisable at December 31, 2009 . . . . . . . 2,468,944 $ 5.83 $20.10
F-33
Validus Holdings, Ltd.
Notes to Consolidated Financial Statements — (Continued)(Expressed in thousands of U.S. dollars, except share and per share information)

Activity with respect to options for year ended December 31, 2008 was as follows:
Options
Weighted AverageGrant DateFair Value
Weighted AverageGrant Date
Exercise Price
Options outstanding, December 31, 2007 . . . . . . . . 2,761,176 $7.61 $17.82
Options granted . . . . . . . . . . . . . . . . . . . . . . . . . . 164,166 6.73 24.73
Options exercised . . . . . . . . . . . . . . . . . . . . . . . . . (112,825) 7.36 17.57
Options forfeited . . . . . . . . . . . . . . . . . . . . . . . . . . (12,579) 8.56 18.69
Options outstanding, December 31, 2008 . . . . . . . . 2,799,938 $7.57 $18.23
Options exercisable at December 31, 2008 . . . . . . . 1,396,353 $7.46 $17.63
At December 31, 2010, there were $823 (2009: $4,713, 2008: $9,139) of total unrecognized share compen-sation expenses that are expected to be recognized over a weighted-average period of 1.2 years (2009: 1.3 years;2008: 2.2 years).
ii. Restricted share awards
Restricted shares granted under the LTIP and STIP vest either ratably or at the end of the required serviceperiod and contain certain restrictions for the vesting period, relating to, among other things, forfeiture in the eventof termination of employment and transferability. Share compensation expenses of $20,038 were recorded for theyear ended December 31, 2010 (2009: $16,775, 2008: $15,060). The expenses represent the proportionate accrualof the fair value of each grant based on the remaining vesting period.
Activity with respect to unvested restricted shares for the year ended December 31, 2010 was as follows:
RestrictedShare
Awards
Weighted AverageGrant DateFair Value
Restricted share awards outstanding, December 31, 2009 . . . . . . . . . . 2,525,958 $23.43
Restricted share awards granted . . . . . . . . . . . . . . . . . . . . . . . . . . . . . 1,191,873 25.94
Restricted share awards vested . . . . . . . . . . . . . . . . . . . . . . . . . . . . . . (503,322) 23.44
Restricted share awards forfeited . . . . . . . . . . . . . . . . . . . . . . . . . . . . (100,470) 24.22
Restricted share awards outstanding, December 31, 2010 . . . . . . . . . . 3,114,039 $24.36
Activity with respect to unvested restricted share awards for the year ended December 31, 2009 was as follows:
RestrictedShare
Awards
Weighted AverageGrant DateFair Value
Restricted share awards outstanding, December 31, 2008 . . . . . . . . . . 2,307,402 $22.73
Restricted share awards granted . . . . . . . . . . . . . . . . . . . . . . . . . . . . . 772,672 24.68
Restricted share awards vested . . . . . . . . . . . . . . . . . . . . . . . . . . . . . . (512,847) 22.11
Restricted share awards forfeited . . . . . . . . . . . . . . . . . . . . . . . . . . . . (41,269) 24.05
Restricted share awards outstanding, December 31, 2009 . . . . . . . . . . 2,525,958 $23.43
F-34
Validus Holdings, Ltd.
Notes to Consolidated Financial Statements — (Continued)(Expressed in thousands of U.S. dollars, except share and per share information)
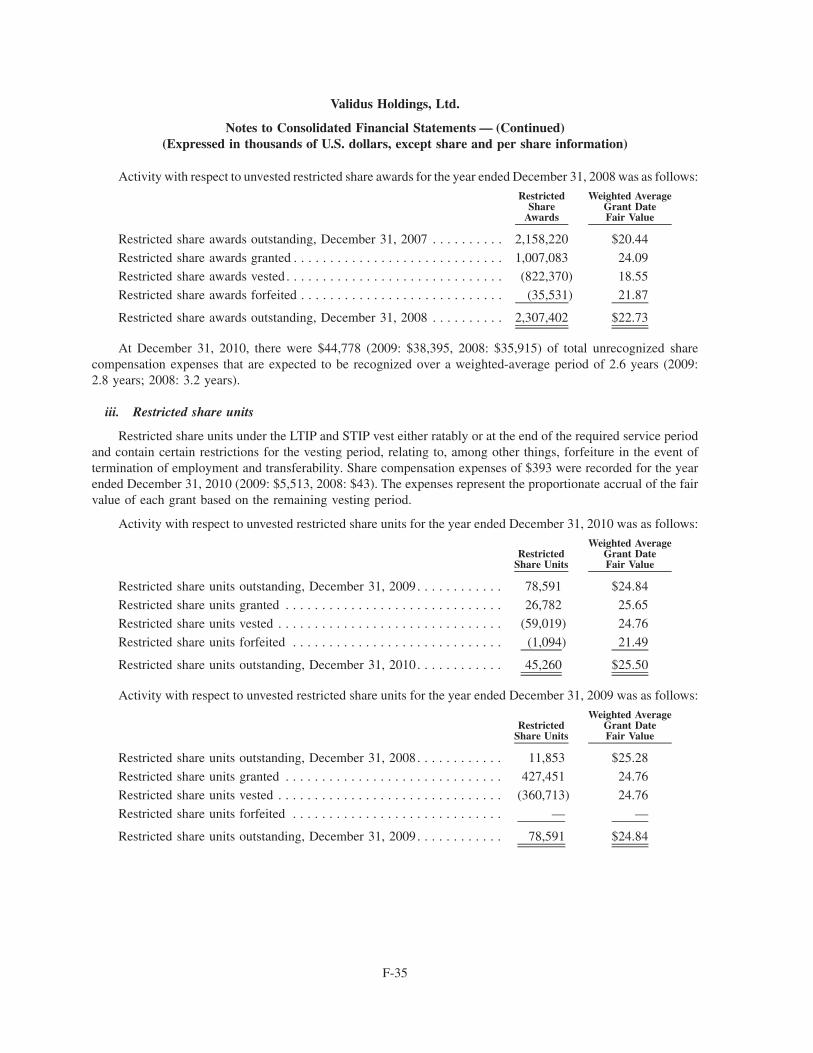
Activity with respect to unvested restricted share awards for the year ended December 31, 2008 was as follows:
RestrictedShare
Awards
Weighted AverageGrant DateFair Value
Restricted share awards outstanding, December 31, 2007 . . . . . . . . . . 2,158,220 $20.44
Restricted share awards granted . . . . . . . . . . . . . . . . . . . . . . . . . . . . . 1,007,083 24.09Restricted share awards vested . . . . . . . . . . . . . . . . . . . . . . . . . . . . . . (822,370) 18.55
Restricted share awards forfeited . . . . . . . . . . . . . . . . . . . . . . . . . . . . (35,531) 21.87
Restricted share awards outstanding, December 31, 2008 . . . . . . . . . . 2,307,402 $22.73
At December 31, 2010, there were $44,778 (2009: $38,395, 2008: $35,915) of total unrecognized sharecompensation expenses that are expected to be recognized over a weighted-average period of 2.6 years (2009:2.8 years; 2008: 3.2 years).
iii. Restricted share units
Restricted share units under the LTIP and STIP vest either ratably or at the end of the required service periodand contain certain restrictions for the vesting period, relating to, among other things, forfeiture in the event oftermination of employment and transferability. Share compensation expenses of $393 were recorded for the yearended December 31, 2010 (2009: $5,513, 2008: $43). The expenses represent the proportionate accrual of the fairvalue of each grant based on the remaining vesting period.
Activity with respect to unvested restricted share units for the year ended December 31, 2010 was as follows:
RestrictedShare Units
Weighted AverageGrant DateFair Value
Restricted share units outstanding, December 31, 2009. . . . . . . . . . . . 78,591 $24.84
Restricted share units granted . . . . . . . . . . . . . . . . . . . . . . . . . . . . . . 26,782 25.65
Restricted share units vested . . . . . . . . . . . . . . . . . . . . . . . . . . . . . . . (59,019) 24.76
Restricted share units forfeited . . . . . . . . . . . . . . . . . . . . . . . . . . . . . (1,094) 21.49
Restricted share units outstanding, December 31, 2010. . . . . . . . . . . . 45,260 $25.50
Activity with respect to unvested restricted share units for the year ended December 31, 2009 was as follows:
RestrictedShare Units
Weighted AverageGrant DateFair Value
Restricted share units outstanding, December 31, 2008. . . . . . . . . . . . 11,853 $25.28
Restricted share units granted . . . . . . . . . . . . . . . . . . . . . . . . . . . . . . 427,451 24.76
Restricted share units vested . . . . . . . . . . . . . . . . . . . . . . . . . . . . . . . (360,713) 24.76
Restricted share units forfeited . . . . . . . . . . . . . . . . . . . . . . . . . . . . . — —
Restricted share units outstanding, December 31, 2009. . . . . . . . . . . . 78,591 $24.84
F-35
Validus Holdings, Ltd.
Notes to Consolidated Financial Statements — (Continued)(Expressed in thousands of U.S. dollars, except share and per share information)

Activity with respect to unvested restricted share units for the year ended December 31, 2008 was as follows:
RestrictedShare Units
Weighted AverageGrant DateFair Value
Restricted share units outstanding, December 31, 2007. . . . . . . . . . . . — $ —Restricted share units granted . . . . . . . . . . . . . . . . . . . . . . . . . . . . . . 11,853 25.28
Restricted share units vested . . . . . . . . . . . . . . . . . . . . . . . . . . . . . . . — —
Restricted share units forfeited . . . . . . . . . . . . . . . . . . . . . . . . . . . . . — —
Restricted share units outstanding, December 31, 2008. . . . . . . . . . . . 11,853 $25.28
At December 31, 2010, there were $810 (2009: $578, 2008: $227) of total unrecognized share compensationexpenses that are expected to be recognized over a weighted-average period of 2.7 years (2009: 2.5 years; 2008:4.3 years). Additional restricted share units are issued in lieu of accrued dividends for each unvested restricted shareunit. As at December 31, 2010, unvested restricted share units issued in lieu of dividends were 1,789 (2009: 858,2008: 410).
iv. Performance share awards
The Performance Share Awards (“PSAs”) contain a performance based component. The performancecomponent relates to the compounded growth in the Dividend Adjusted Diluted Book Value per Share over athree year period. For PSAs granted in 2010, the grant date Diluted Book Value per Share (“DBVPS”) is $29.68, theDBVPS as at December 31, 2009. The Dividend Adjusted Performance Period End DBVPS will be the DBVPS as atDecember 31, 2012. The fair value estimate earns over the requisite attribution period and the estimate will bereassessed at the end of each performance period which will reflect any adjustments in the consolidated statementsof income in the period in which they are determined.
Share compensation expenses of $232 were recorded for the year ended December 31, 2010 (2009: $nil; 2008:$nil) for the PSAs. The expenses represent the proportionate accrual of the fair value of each grant based on theremaining vesting period.
Activity with respect to unvested performance share awards for the year ended December 31, 2010 was asfollows:
PerformanceShare Awards
Weighted AverageGrant DateFair Value
Performance share awards outstanding, December 31, 2009 . . . . . . . — $ —
Performance share awards granted . . . . . . . . . . . . . . . . . . . . . . . . . 132,401 28.70
Performance share awards vested . . . . . . . . . . . . . . . . . . . . . . . . . . — —
Performance share awards forfeited. . . . . . . . . . . . . . . . . . . . . . . . . — —
Performance share awards outstanding, December 31, 2010 . . . . . . . 132,401 $28.70
At December 31, 2010, there were $3,362 (2009: $nil; 2008: $nil) of total unrecognized share compensationexpenses that are expected to be recognized over a weighted-average period of 2.4 years (2009: 0 years; 2008:0 years).
b) Employee seller shares
Pursuant to the Share Sale Agreement for the purchase of Talbot Holdings, Ltd. (“Talbot”), the Companyissued 1,209,741 restricted shares to Talbot employees (the “employee seller shares”). Upon consummation of the
F-36
Validus Holdings, Ltd.
Notes to Consolidated Financial Statements — (Continued)(Expressed in thousands of U.S. dollars, except share and per share information)
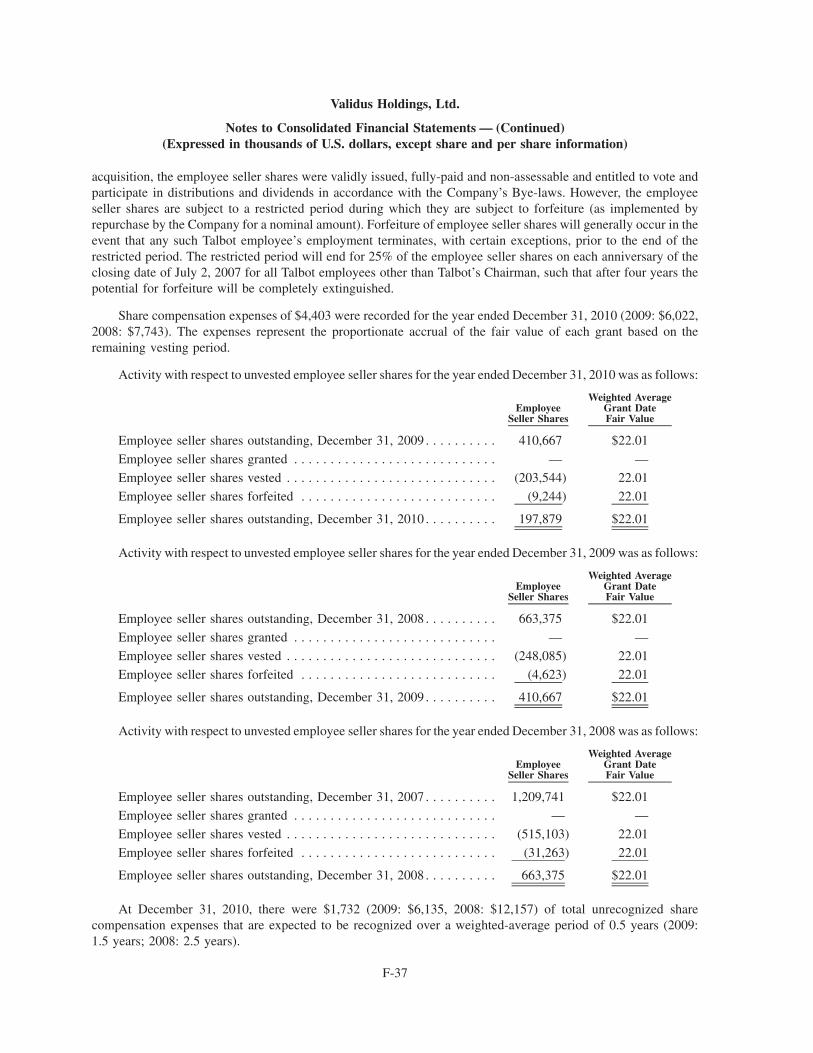
acquisition, the employee seller shares were validly issued, fully-paid and non-assessable and entitled to vote andparticipate in distributions and dividends in accordance with the Company’s Bye-laws. However, the employeeseller shares are subject to a restricted period during which they are subject to forfeiture (as implemented byrepurchase by the Company for a nominal amount). Forfeiture of employee seller shares will generally occur in theevent that any such Talbot employee’s employment terminates, with certain exceptions, prior to the end of therestricted period. The restricted period will end for 25% of the employee seller shares on each anniversary of theclosing date of July 2, 2007 for all Talbot employees other than Talbot’s Chairman, such that after four years thepotential for forfeiture will be completely extinguished.
Share compensation expenses of $4,403 were recorded for the year ended December 31, 2010 (2009: $6,022,2008: $7,743). The expenses represent the proportionate accrual of the fair value of each grant based on theremaining vesting period.
Activity with respect to unvested employee seller shares for the year ended December 31, 2010 was as follows:
EmployeeSeller Shares
Weighted AverageGrant DateFair Value
Employee seller shares outstanding, December 31, 2009 . . . . . . . . . . 410,667 $22.01
Employee seller shares granted . . . . . . . . . . . . . . . . . . . . . . . . . . . . — —
Employee seller shares vested . . . . . . . . . . . . . . . . . . . . . . . . . . . . . (203,544) 22.01
Employee seller shares forfeited . . . . . . . . . . . . . . . . . . . . . . . . . . . (9,244) 22.01
Employee seller shares outstanding, December 31, 2010 . . . . . . . . . . 197,879 $22.01
Activity with respect to unvested employee seller shares for the year ended December 31, 2009 was as follows:
EmployeeSeller Shares
Weighted AverageGrant DateFair Value
Employee seller shares outstanding, December 31, 2008 . . . . . . . . . . 663,375 $22.01
Employee seller shares granted . . . . . . . . . . . . . . . . . . . . . . . . . . . . — —
Employee seller shares vested . . . . . . . . . . . . . . . . . . . . . . . . . . . . . (248,085) 22.01
Employee seller shares forfeited . . . . . . . . . . . . . . . . . . . . . . . . . . . (4,623) 22.01
Employee seller shares outstanding, December 31, 2009 . . . . . . . . . . 410,667 $22.01
Activity with respect to unvested employee seller shares for the year ended December 31, 2008 was as follows:
EmployeeSeller Shares
Weighted AverageGrant DateFair Value
Employee seller shares outstanding, December 31, 2007 . . . . . . . . . . 1,209,741 $22.01
Employee seller shares granted . . . . . . . . . . . . . . . . . . . . . . . . . . . . — —
Employee seller shares vested . . . . . . . . . . . . . . . . . . . . . . . . . . . . . (515,103) 22.01
Employee seller shares forfeited . . . . . . . . . . . . . . . . . . . . . . . . . . . (31,263) 22.01
Employee seller shares outstanding, December 31, 2008 . . . . . . . . . . 663,375 $22.01
At December 31, 2010, there were $1,732 (2009: $6,135, 2008: $12,157) of total unrecognized sharecompensation expenses that are expected to be recognized over a weighted-average period of 0.5 years (2009:1.5 years; 2008: 2.5 years).
F-37
Validus Holdings, Ltd.
Notes to Consolidated Financial Statements — (Continued)(Expressed in thousands of U.S. dollars, except share and per share information)

c) Total share compensation expenses
Total share compensation expenses for the year ended December 31, 2009 included $5,431 of IPC relatedtermination expenses which were included in the gain on bargain purchase, net of expenses, in the Statement ofOperations. The breakdown of share compensation expenses by award type for the years ending December 31,2010, 2009 and 2008 is as follows:
December 31, 2010 December 31, 2009 December 31, 2008Year Ended
Options . . . . . . . . . . . . . . . . . . . . . . . . . . . $ 3,845 $ 4,158 $ 4,251
Restricted share awards . . . . . . . . . . . . . . . 20,038 16,775 15,060
Restricted share units . . . . . . . . . . . . . . . . 393 5,513 43
Performance share awards . . . . . . . . . . . . . 232 — —
Employee seller shares . . . . . . . . . . . . . . . 4,403 6,022 7,743
Total . . . . . . . . . . . . . . . . . . . . . . . . . . . . $28,911 $32,468 $27,097
16. Debt and financing arrangements
a) Financing structure and finance expenses
The financing structure at December 31, 2010 was:
Commitment Outstanding(1) Drawn
9.069% Junior Subordinated Deferrable Debentures. . . . . . $ 150,000 $150,000 $150,000
8.480% Junior Subordinated Deferrable Debentures. . . . . . 200,000 139,800 139,800
8.875% Senior Notes due 2040 . . . . . . . . . . . . . . . . . . . . . 250,000 250,000 246,874
$340,000 syndicated unsecured letter of credit facility . . . . 340,000 — —
$60,000 bilateral unsecured letter of credit facility . . . . . . 60,000 — —
$500,000 secured letter of credit facility . . . . . . . . . . . . . . 500,000 268,944 —
Talbot FAL Facility(2) . . . . . . . . . . . . . . . . . . . . . . . . . . . 25,000 25,000 —
IPC Bi-Lateral Facility . . . . . . . . . . . . . . . . . . . . . . . . . . . 80,000 68,063 —
Total . . . . . . . . . . . . . . . . . . . . . . . . . . . . . . . . . . . . . . . . $1,605,000 $901,807 $536,674
The financing structure at December 31, 2009 was:
Commitment Outstanding(1) Drawn
9.069% Junior Subordinated Deferrable Debentures. . . . . . $ 150,000 $150,000 $150,000
8.480% Junior Subordinated Deferrable Debentures. . . . . . 200,000 139,800 139,800
$200,000 unsecured letter of credit facility . . . . . . . . . . . . 200,000 — —
$500,000 secured letter of credit facility . . . . . . . . . . . . . . 500,000 225,823 —
Talbot FAL Facility(2) . . . . . . . . . . . . . . . . . . . . . . . . . . . 25,000 25,000 —
IPC Syndicated Facility . . . . . . . . . . . . . . . . . . . . . . . . . . 16,537 16,537 —
IPC Bi-Lateral Facility . . . . . . . . . . . . . . . . . . . . . . . . . . . 350,000 96,047 —
Total . . . . . . . . . . . . . . . . . . . . . . . . . . . . . . . . . . . . . . . . $1,441,537 $653,207 $289,800
(1) Indicates utilization of commitment amount, not drawn borrowings.
F-38
Validus Holdings, Ltd.
Notes to Consolidated Financial Statements — (Continued)(Expressed in thousands of U.S. dollars, except share and per share information)

(2) Talbot operates in Lloyd’s through a corporate member, Talbot 2002 Underwriting Capital Ltd (“T02”), whichis the sole participant in Syndicate 1183. Lloyd’s sets T02’s required capital annually based on syndicate 1183’sbusiness plan, rating environment, reserving environment together with input arising from Lloyd’s discussionswith, inter alia, regulatory and rating agencies. Such capital, called Funds at Lloyd’s (“FAL”), comprises: cash,investments and undrawn letters of credit provided by various banks.
Finance expenses consist of interest on our junior subordinated deferrable debentures and senior notes, theamortization of debt offering costs, fees relating to our credit facilities and the costs of FAL as follows:
December 31,2010
December 31,2009
December 31,2008
Year Ended
9.069% Junior Subordinated Deferrable Debentures . . . . 14,354 14,354 14,354
8.480% Junior Subordinated Deferrable Debentures . . . . 12,114 12,732 14,704
8.875% Senior Notes due 2040 . . . . . . . . . . . . . . . . . . . 20,770 — —
Credit facilities . . . . . . . . . . . . . . . . . . . . . . . . . . . . . . . 5,492 2,319 910
Talbot FAL Facility . . . . . . . . . . . . . . . . . . . . . . . . . . . . 333 542 255
Talbot other interest . . . . . . . . . . . . . . . . . . . . . . . . . . . . — — (186)
Talbot third party FAL facility . . . . . . . . . . . . . . . . . . . . 2,807 14,183 27,281
Total. . . . . . . . . . . . . . . . . . . . . . . . . . . . . . . . . . . . . . . 55,870 $44,130 $57,318
(b) $250,000 8.875% Senior Notes due 2040
On January 21, 2010, the Company offered and sold $250,000 of Senior Notes due 2040 (the “8.875% SeniorNotes”) in a registered public offering. The 8.875% Senior Notes mature on January 26, 2040, and are redeemable atthe Company’s option in whole any time or in part from time to time at a make-whole redemption price. TheCompany may redeem the notes in whole, but not in part, at any time upon the occurrence of certain tax events asdescribed in the notes prospectus supplement. The 8.875% Senior Notes bear interest at the rate of 8.875% perannum from January 26, 2010 to maturity or early redemption. Interest on the 8.875% Senior Notes is payable semi-annually in arrears on January 26 and July 26 of each year, commencing on July 26, 2010. The net proceeds of$243,967 from the sale of the 8.875% Senior Notes, after the deduction of commissions paid to the underwriters inthe transaction and other expenses, was used by the Company for general corporate purposes, which included therepurchase of its outstanding capital stock and payment of dividends to shareholders. Debt issuance costs of $2,808were deferred as an asset and amortized over the life of the 8.875% Senior Notes.
The 8.875% Senior Notes are unsecured and unsubordinated obligations and rank equally in right of paymentwith all of the Company’s existing and future unsecured and unsubordinated indebtedness. The 8.875% SeniorNotes will be effectively junior to all of the Company’s future secured debt, to the extent of the value of the collateralsecuring such debt, and will rank senior to all our existing and future subordinated debt. The 8.875% Senior Noteswill be structurally subordinated to all obligations of the Company’s subsidiaries.
F-39
Validus Holdings, Ltd.
Notes to Consolidated Financial Statements — (Continued)(Expressed in thousands of U.S. dollars, except share and per share information)
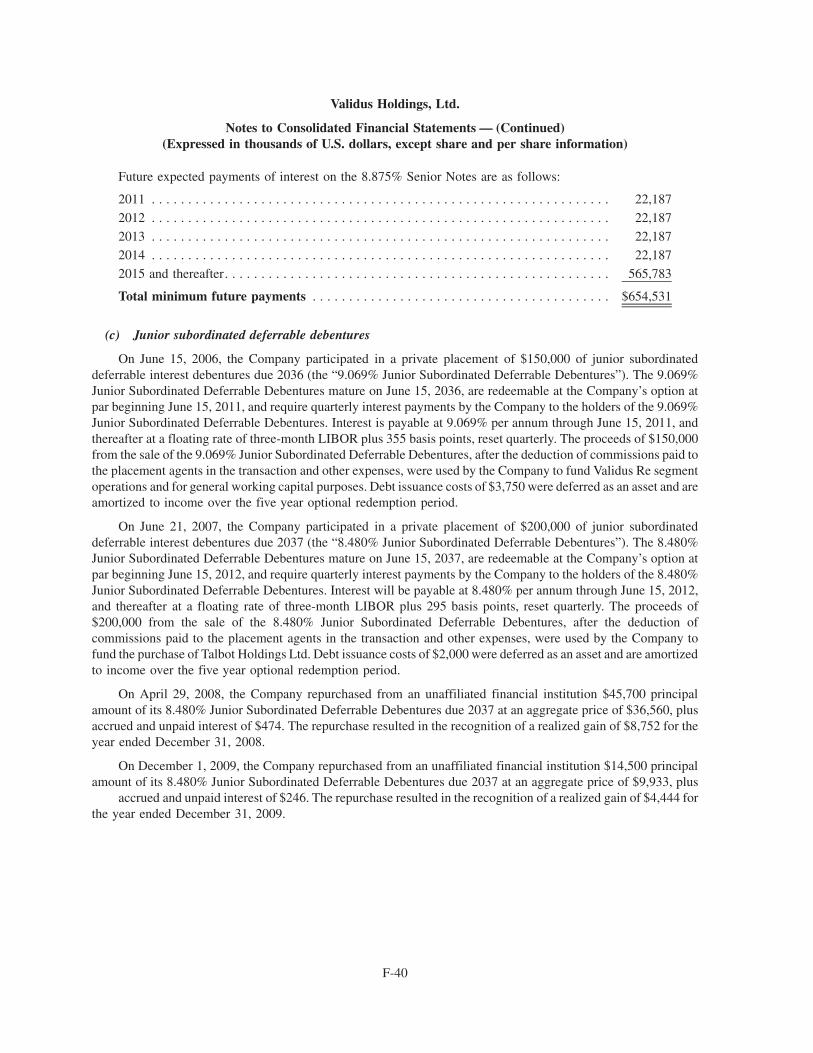
Future expected payments of interest on the 8.875% Senior Notes are as follows:
2011 . . . . . . . . . . . . . . . . . . . . . . . . . . . . . . . . . . . . . . . . . . . . . . . . . . . . . . . . . . . . . . . 22,187
2012 . . . . . . . . . . . . . . . . . . . . . . . . . . . . . . . . . . . . . . . . . . . . . . . . . . . . . . . . . . . . . . . 22,187
2013 . . . . . . . . . . . . . . . . . . . . . . . . . . . . . . . . . . . . . . . . . . . . . . . . . . . . . . . . . . . . . . . 22,187
2014 . . . . . . . . . . . . . . . . . . . . . . . . . . . . . . . . . . . . . . . . . . . . . . . . . . . . . . . . . . . . . . . 22,187
2015 and thereafter. . . . . . . . . . . . . . . . . . . . . . . . . . . . . . . . . . . . . . . . . . . . . . . . . . . . . 565,783
Total minimum future payments . . . . . . . . . . . . . . . . . . . . . . . . . . . . . . . . . . . . . . . . . $654,531
(c) Junior subordinated deferrable debentures
On June 15, 2006, the Company participated in a private placement of $150,000 of junior subordinateddeferrable interest debentures due 2036 (the “9.069% Junior Subordinated Deferrable Debentures”). The 9.069%Junior Subordinated Deferrable Debentures mature on June 15, 2036, are redeemable at the Company’s option atpar beginning June 15, 2011, and require quarterly interest payments by the Company to the holders of the 9.069%Junior Subordinated Deferrable Debentures. Interest is payable at 9.069% per annum through June 15, 2011, andthereafter at a floating rate of three-month LIBOR plus 355 basis points, reset quarterly. The proceeds of $150,000from the sale of the 9.069% Junior Subordinated Deferrable Debentures, after the deduction of commissions paid tothe placement agents in the transaction and other expenses, were used by the Company to fund Validus Re segmentoperations and for general working capital purposes. Debt issuance costs of $3,750 were deferred as an asset and areamortized to income over the five year optional redemption period.
On June 21, 2007, the Company participated in a private placement of $200,000 of junior subordinateddeferrable interest debentures due 2037 (the “8.480% Junior Subordinated Deferrable Debentures”). The 8.480%Junior Subordinated Deferrable Debentures mature on June 15, 2037, are redeemable at the Company’s option atpar beginning June 15, 2012, and require quarterly interest payments by the Company to the holders of the 8.480%Junior Subordinated Deferrable Debentures. Interest will be payable at 8.480% per annum through June 15, 2012,and thereafter at a floating rate of three-month LIBOR plus 295 basis points, reset quarterly. The proceeds of$200,000 from the sale of the 8.480% Junior Subordinated Deferrable Debentures, after the deduction ofcommissions paid to the placement agents in the transaction and other expenses, were used by the Company tofund the purchase of Talbot Holdings Ltd. Debt issuance costs of $2,000 were deferred as an asset and are amortizedto income over the five year optional redemption period.
On April 29, 2008, the Company repurchased from an unaffiliated financial institution $45,700 principalamount of its 8.480% Junior Subordinated Deferrable Debentures due 2037 at an aggregate price of $36,560, plusaccrued and unpaid interest of $474. The repurchase resulted in the recognition of a realized gain of $8,752 for theyear ended December 31, 2008.
On December 1, 2009, the Company repurchased from an unaffiliated financial institution $14,500 principalamount of its 8.480% Junior Subordinated Deferrable Debentures due 2037 at an aggregate price of $9,933, plus
accrued and unpaid interest of $246. The repurchase resulted in the recognition of a realized gain of $4,444 forthe year ended December 31, 2009.
F-40
Validus Holdings, Ltd.
Notes to Consolidated Financial Statements — (Continued)(Expressed in thousands of U.S. dollars, except share and per share information)

Future expected payments of interest and principal on the 9.069% and 8.480% Junior Subordinated DeferrableDebentures are as follows:
2011 . . . . . . . . . . . . . . . . . . . . . . . . . . . . . . . . . . . . . . . . . . . . . . . . . . . . . . . . . . . . . . . $168,6572012 . . . . . . . . . . . . . . . . . . . . . . . . . . . . . . . . . . . . . . . . . . . . . . . . . . . . . . . . . . . . . . . 145,727
2013 and thereafter. . . . . . . . . . . . . . . . . . . . . . . . . . . . . . . . . . . . . . . . . . . . . . . . . . . . . —
Total minimum future payments . . . . . . . . . . . . . . . . . . . . . . . . . . . . . . . . . . . . . . . . . $314,384
(d) Credit facilities
(i) $340,000 syndicated unsecured letter of credit facility, $60,000 bilateral unsecured letter of creditfacility and $500,000 secured letter of credit facility
On March 12, 2007, the Company entered into a $200,000 three-year unsecured facility, as subsequentlyamended on October 25, 2007 and September 4, 2009. The facility was refinanced at maturity on March 12, 2010with a three-year $340,000 syndicated unsecured letter of credit facility and a $60,000 bilateral unsecured letter ofcredit facility which provides for letter of credit availability for Validus Re and our other subsidiaries and revolvingcredit availability for the Company (the “Three Year Facilities”) (the full $400,000 of which is available for lettersof credit and/or revolving loans).
On March 12, 2007, the Company entered into a $500,000 five-year secured letter of credit facility, assubsequently amended on October 25, 2007, July 24, 2009, and March 12, 2010, which provides for letter of creditavailability for Validus Re and our other subsidiaries (the “Five Year Facility” and, together with the Three YearFacilities, the “Credit Facilities”). The Credit Facilities were provided by a syndicate of commercial banks arrangedby J.P. Morgan Securities Inc. and Deutsche Bank Securities Inc. On October 25, 2007, the Company entered intothe First Amendment to the Credit Facilities to provide for, among other things, additional capacity to incur up to$100,000 under a new Funds at Lloyd’s Letter of Credit Facility (as described below) to support underwritingcapacity provided to Talbot 2002 Underwriting Ltd through Syndicate 1183 at Lloyd’s of London for the 2008 and2009 underwriting years of account. The amendment also modified certain provisions in the Credit Facilities inorder to permit dividend payments on existing and future preferred and hybrid securities notwithstanding certainevents of default.
On September 4, 2009, the Company announced that it had entered into Amendments to each of its $500,000five-year secured letter of credit facility; $200,000 three-year unsecured facility and $100,000 Talbot FAL facilityto amend a specific investment restriction clause in order to permit the completion of the IPC Acquisition. Theamendment also modified and updated certain pricing and covenant terms.
As amended, the Credit Facilities contain covenants that include, among other things, (i) the requirement thatthe Company initially maintain a minimum level of consolidated net worth of at least 70% of consolidated net worth($2,925,590) and, commencing with the end of the fiscal quarter ending December 31, 2009 to be increasedquarterly by an amount equal to 50% of its consolidated net income (if positive) for such quarter plus 50% of any netproceeds received from any issuance of common shares during such quarter, (ii) the requirement that the Companymaintain at all times a consolidated total debt to consolidated total capitalization ratio not greater than 0.35:1.00,and (iii) the requirement that Validus Re and any other material insurance subsidiaries maintain a financial strengthrating by A.M. Best of not less than “B++” (Fair). For purposes of covenant compliance (i) “net worth is calculatedwith investments carried at amortized cost and (ii) “consolidated total debt” does not include the Company’s juniorsubordinated deferrable debentures. The credit facilities also contain restrictions on our ability to pay dividends andother payments in respect of equity interests at any time that we are otherwise in default with respect to certainprovisions under the credit facilities, make investments, incur debt at our subsidiaries, incur liens, sell assets andmerge or consolidate with others.
F-41
Validus Holdings, Ltd.
Notes to Consolidated Financial Statements — (Continued)(Expressed in thousands of U.S. dollars, except share and per share information)
As of December 31, 2010, there was $268,944 in outstanding letters of credit under the Five Year Facility(December 31, 2009: $225,823) and $nil outstanding under the Three Year Facilities (December 31, 2009: $nil).
As of December 31, 2010 and throughout the reporting periods presented, the Company was in compliancewith all covenants and restrictions under the Credit Facilities.
(ii) Talbot FAL Facility
On November 28, 2007, Talbot entered into a $100,000 standby Letter of Credit facility (the “Talbot FALFacility”) to provide Funds at Lloyd’s for the 2008 and 2009 underwriting years of account; this facility isguaranteed by the Company and is secured against the assets of Validus Re. The Talbot FAL Facility was providedby a syndicate of commercial banks arranged by Lloyds TSB Bank plc and ING Bank N.V., London Branch.
On November 19, 2009, the Company entered into an Amendment and Restatement of the Talbot FAL Facilityto reduce the commitment from $100,000 to $25,000, and to extend the support to the 2010 and 2011 underwritingyears of account.
As amended, the Talbot FAL Facility contains affirmative covenants that include, among other things, (i) therequirement that the Company initially maintain a minimum level of consolidated net worth of at least 70% ofconsolidated net worth ($2,607,219), and commencing with the end of the fiscal quarter ending September 30, 2009to be increased quarterly by an amount equal to 50% of our consolidated net income (if positive) for such quarterplus 50% of any net proceeds received from any issuance of common shares during such quarter, and (ii) therequirement that we maintain at all times a consolidated total debt to consolidated total capitalization ratio notgreater than 0.35:1.00.
The Talbot FAL Facility also contains restrictions on our ability to incur debt at our subsidiaries, incur liens,sell assets and merge or consolidate with others. Other than in respect of existing and future preferred and hybridsecurities, the payment of dividends and other payments in respect of equity interests are not permitted at any timethat we are in default with respect to certain provisions under the Credit Facilities. As of December 31, 2010 theCompany had $25,000 in outstanding letters of credit under this facility.
As of December 31, 2010 and throughout the reporting periods presented, the Company was in compliancewith all covenants and restrictions under the Talbot FAL Facility.
(iii) IPC Syndicated Facility and IPC Bi-Lateral Facility
IPC obtained letters of credit through the IPC Syndicated Facility and the IPC Bi-Lateral Facility (the “IPCFacilities”). In July 2009, certain terms of these facilities were amended including suspending IPC’s ability toincrease existing letters of credit or to issue new letters of credit. Effective March 31, 2010, the IPC SyndicatedFacility was closed. As of December 31, 2010, $68,063 of outstanding letters of credit were issued under theIPC Bi-Lateral Facility.
As of December 31, 2010 and throughout the reporting periods presented, the Company was in compliancewith all covenants and restrictions under the IPC Facilities.
(e) Funds at Lloyds
Talbot’s underwriting at Lloyd’s is supported by Funds at Lloyd’s (“FAL”) comprising: cash, investments andundrawn letters of credit provided by various banks on behalf of various companies and persons under reinsuranceand other agreements. The FAL are provided in exchange for payment calculated principally by reference to thesyndicate’s results, as appropriate, when they are declared. The amounts of cash, investments and letters of credit atDecember 31, 2010 supporting the 2011 underwriting year amount to $441,000, all of which is provided by theCompany.
F-42
Validus Holdings, Ltd.
Notes to Consolidated Financial Statements — (Continued)(Expressed in thousands of U.S. dollars, except share and per share information)
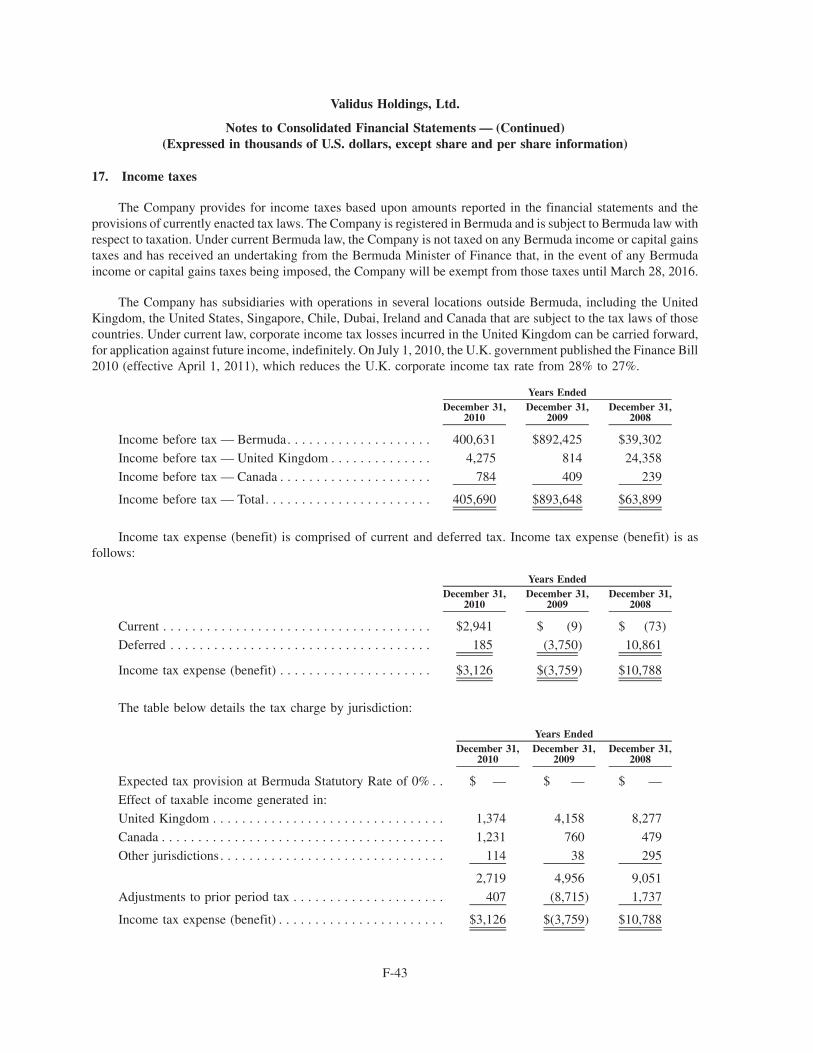
17. Income taxes
The Company provides for income taxes based upon amounts reported in the financial statements and theprovisions of currently enacted tax laws. The Company is registered in Bermuda and is subject to Bermuda law withrespect to taxation. Under current Bermuda law, the Company is not taxed on any Bermuda income or capital gainstaxes and has received an undertaking from the Bermuda Minister of Finance that, in the event of any Bermudaincome or capital gains taxes being imposed, the Company will be exempt from those taxes until March 28, 2016.
The Company has subsidiaries with operations in several locations outside Bermuda, including the UnitedKingdom, the United States, Singapore, Chile, Dubai, Ireland and Canada that are subject to the tax laws of thosecountries. Under current law, corporate income tax losses incurred in the United Kingdom can be carried forward,for application against future income, indefinitely. On July 1, 2010, the U.K. government published the Finance Bill2010 (effective April 1, 2011), which reduces the U.K. corporate income tax rate from 28% to 27%.
December 31,2010
December 31,2009
December 31,2008
Years Ended
Income before tax — Bermuda. . . . . . . . . . . . . . . . . . . . 400,631 $892,425 $39,302
Income before tax — United Kingdom . . . . . . . . . . . . . . 4,275 814 24,358
Income before tax — Canada . . . . . . . . . . . . . . . . . . . . . 784 409 239
Income before tax — Total. . . . . . . . . . . . . . . . . . . . . . . 405,690 $893,648 $63,899
Income tax expense (benefit) is comprised of current and deferred tax. Income tax expense (benefit) is asfollows:
December 31,2010
December 31,2009
December 31,2008
Years Ended
Current . . . . . . . . . . . . . . . . . . . . . . . . . . . . . . . . . . . . . $2,941 $ (9) $ (73)
Deferred . . . . . . . . . . . . . . . . . . . . . . . . . . . . . . . . . . . . 185 (3,750) 10,861
Income tax expense (benefit) . . . . . . . . . . . . . . . . . . . . . $3,126 $(3,759) $10,788
The table below details the tax charge by jurisdiction:
December 31,2010
December 31,2009
December 31,2008
Years Ended
Expected tax provision at Bermuda Statutory Rate of 0% . . $ — $ — $ —
Effect of taxable income generated in:
United Kingdom . . . . . . . . . . . . . . . . . . . . . . . . . . . . . . . . 1,374 4,158 8,277
Canada . . . . . . . . . . . . . . . . . . . . . . . . . . . . . . . . . . . . . . . 1,231 760 479
Other jurisdictions . . . . . . . . . . . . . . . . . . . . . . . . . . . . . . . 114 38 295
2,719 4,956 9,051
Adjustments to prior period tax . . . . . . . . . . . . . . . . . . . . . 407 (8,715) 1,737
Income tax expense (benefit) . . . . . . . . . . . . . . . . . . . . . . . $3,126 $(3,759) $10,788
F-43
Validus Holdings, Ltd.
Notes to Consolidated Financial Statements — (Continued)(Expressed in thousands of U.S. dollars, except share and per share information)
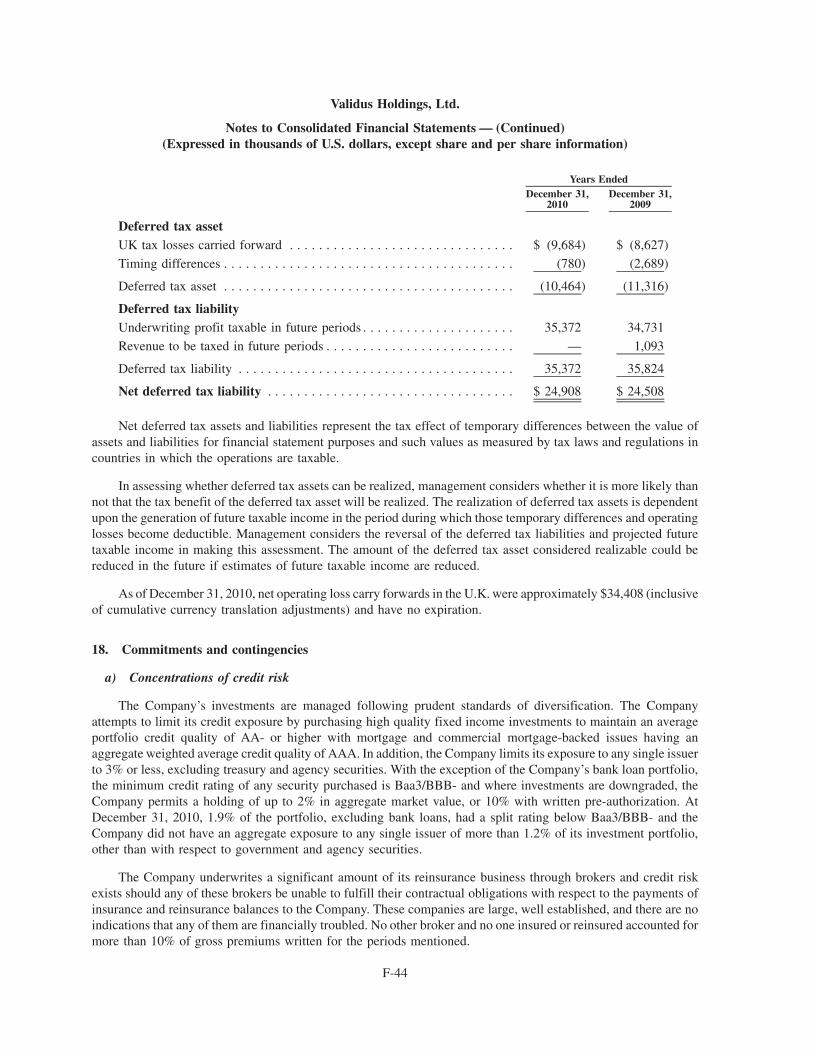
December 31,2010
December 31,2009
Years Ended
Deferred tax assetUK tax losses carried forward . . . . . . . . . . . . . . . . . . . . . . . . . . . . . . . $ (9,684) $ (8,627)
Timing differences . . . . . . . . . . . . . . . . . . . . . . . . . . . . . . . . . . . . . . . . (780) (2,689)
Deferred tax asset . . . . . . . . . . . . . . . . . . . . . . . . . . . . . . . . . . . . . . . . (10,464) (11,316)
Deferred tax liabilityUnderwriting profit taxable in future periods . . . . . . . . . . . . . . . . . . . . . 35,372 34,731
Revenue to be taxed in future periods . . . . . . . . . . . . . . . . . . . . . . . . . . — 1,093
Deferred tax liability . . . . . . . . . . . . . . . . . . . . . . . . . . . . . . . . . . . . . . 35,372 35,824
Net deferred tax liability . . . . . . . . . . . . . . . . . . . . . . . . . . . . . . . . . . $ 24,908 $ 24,508
Net deferred tax assets and liabilities represent the tax effect of temporary differences between the value ofassets and liabilities for financial statement purposes and such values as measured by tax laws and regulations incountries in which the operations are taxable.
In assessing whether deferred tax assets can be realized, management considers whether it is more likely thannot that the tax benefit of the deferred tax asset will be realized. The realization of deferred tax assets is dependentupon the generation of future taxable income in the period during which those temporary differences and operatinglosses become deductible. Management considers the reversal of the deferred tax liabilities and projected futuretaxable income in making this assessment. The amount of the deferred tax asset considered realizable could bereduced in the future if estimates of future taxable income are reduced.
As of December 31, 2010, net operating loss carry forwards in the U.K. were approximately $34,408 (inclusiveof cumulative currency translation adjustments) and have no expiration.
18. Commitments and contingencies
a) Concentrations of credit risk
The Company’s investments are managed following prudent standards of diversification. The Companyattempts to limit its credit exposure by purchasing high quality fixed income investments to maintain an averageportfolio credit quality of AA- or higher with mortgage and commercial mortgage-backed issues having anaggregate weighted average credit quality of AAA. In addition, the Company limits its exposure to any single issuerto 3% or less, excluding treasury and agency securities. With the exception of the Company’s bank loan portfolio,the minimum credit rating of any security purchased is Baa3/BBB- and where investments are downgraded, theCompany permits a holding of up to 2% in aggregate market value, or 10% with written pre-authorization. AtDecember 31, 2010, 1.9% of the portfolio, excluding bank loans, had a split rating below Baa3/BBB- and theCompany did not have an aggregate exposure to any single issuer of more than 1.2% of its investment portfolio,other than with respect to government and agency securities.
The Company underwrites a significant amount of its reinsurance business through brokers and credit riskexists should any of these brokers be unable to fulfill their contractual obligations with respect to the payments ofinsurance and reinsurance balances to the Company. These companies are large, well established, and there are noindications that any of them are financially troubled. No other broker and no one insured or reinsured accounted formore than 10% of gross premiums written for the periods mentioned.
F-44
Validus Holdings, Ltd.
Notes to Consolidated Financial Statements — (Continued)(Expressed in thousands of U.S. dollars, except share and per share information)
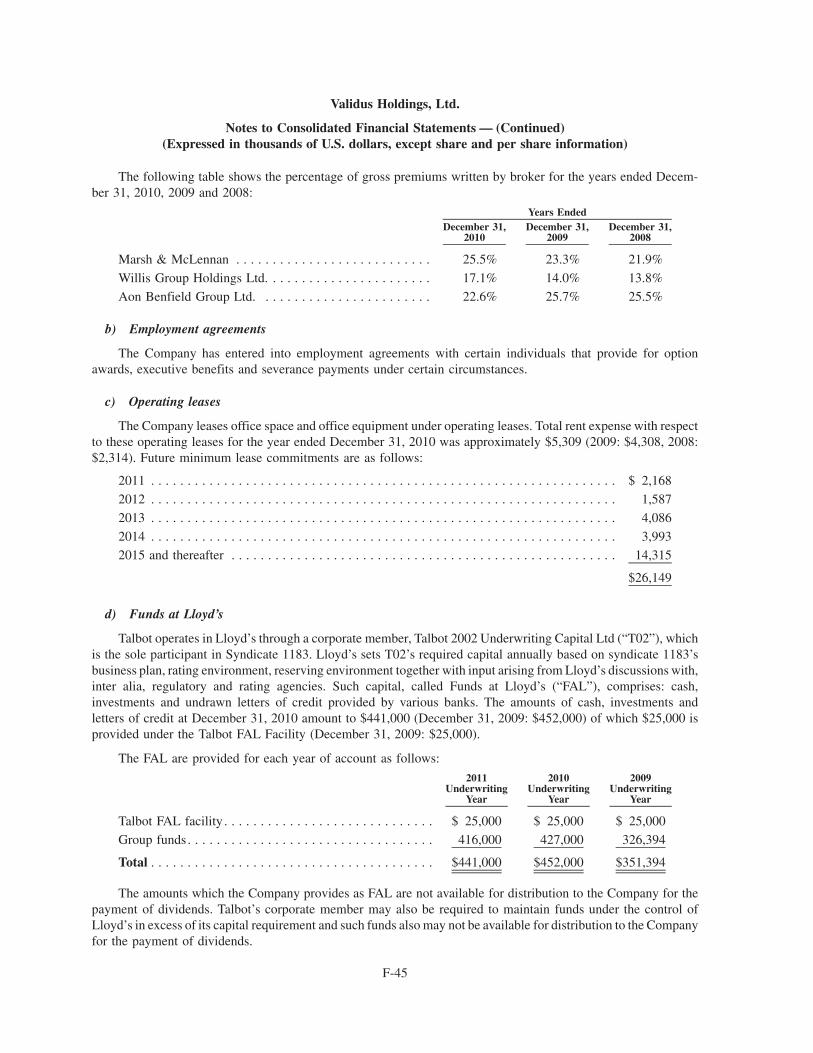
The following table shows the percentage of gross premiums written by broker for the years ended Decem-ber 31, 2010, 2009 and 2008:
December 31,2010
December 31,2009
December 31,2008
Years Ended
Marsh & McLennan . . . . . . . . . . . . . . . . . . . . . . . . . . . 25.5% 23.3% 21.9%
Willis Group Holdings Ltd. . . . . . . . . . . . . . . . . . . . . . . 17.1% 14.0% 13.8%
Aon Benfield Group Ltd. . . . . . . . . . . . . . . . . . . . . . . . 22.6% 25.7% 25.5%
b) Employment agreements
The Company has entered into employment agreements with certain individuals that provide for optionawards, executive benefits and severance payments under certain circumstances.
c) Operating leases
The Company leases office space and office equipment under operating leases. Total rent expense with respectto these operating leases for the year ended December 31, 2010 was approximately $5,309 (2009: $4,308, 2008:$2,314). Future minimum lease commitments are as follows:
2011 . . . . . . . . . . . . . . . . . . . . . . . . . . . . . . . . . . . . . . . . . . . . . . . . . . . . . . . . . . . . . . . . $ 2,168
2012 . . . . . . . . . . . . . . . . . . . . . . . . . . . . . . . . . . . . . . . . . . . . . . . . . . . . . . . . . . . . . . . . 1,587
2013 . . . . . . . . . . . . . . . . . . . . . . . . . . . . . . . . . . . . . . . . . . . . . . . . . . . . . . . . . . . . . . . . 4,086
2014 . . . . . . . . . . . . . . . . . . . . . . . . . . . . . . . . . . . . . . . . . . . . . . . . . . . . . . . . . . . . . . . . 3,993
2015 and thereafter . . . . . . . . . . . . . . . . . . . . . . . . . . . . . . . . . . . . . . . . . . . . . . . . . . . . . 14,315
$26,149
d) Funds at Lloyd’s
Talbot operates in Lloyd’s through a corporate member, Talbot 2002 Underwriting Capital Ltd (“T02”), whichis the sole participant in Syndicate 1183. Lloyd’s sets T02’s required capital annually based on syndicate 1183’sbusiness plan, rating environment, reserving environment together with input arising from Lloyd’s discussions with,inter alia, regulatory and rating agencies. Such capital, called Funds at Lloyd’s (“FAL”), comprises: cash,investments and undrawn letters of credit provided by various banks. The amounts of cash, investments andletters of credit at December 31, 2010 amount to $441,000 (December 31, 2009: $452,000) of which $25,000 isprovided under the Talbot FAL Facility (December 31, 2009: $25,000).
The FAL are provided for each year of account as follows:
2011Underwriting
Year
2010Underwriting
Year
2009Underwriting
Year
Talbot FAL facility . . . . . . . . . . . . . . . . . . . . . . . . . . . . . $ 25,000 $ 25,000 $ 25,000
Group funds. . . . . . . . . . . . . . . . . . . . . . . . . . . . . . . . . . 416,000 427,000 326,394
Total . . . . . . . . . . . . . . . . . . . . . . . . . . . . . . . . . . . . . . . $441,000 $452,000 $351,394
The amounts which the Company provides as FAL are not available for distribution to the Company for thepayment of dividends. Talbot’s corporate member may also be required to maintain funds under the control ofLloyd’s in excess of its capital requirement and such funds also may not be available for distribution to the Companyfor the payment of dividends.
F-45
Validus Holdings, Ltd.
Notes to Consolidated Financial Statements — (Continued)(Expressed in thousands of U.S. dollars, except share and per share information)
The amounts provided under the Talbot FAL facility would become a liability of the group in the event of thesyndicate declaring a loss at a level which would call on this arrangement.
e) Lloyd’s central fund
Whenever a member of Lloyd’s is unable to pay its debts to policyholders, such debts may be payable by theLloyd’s central fund. If Lloyd’s determines that the central fund needs to be increased, it has the power to assesspremium levies on current Lloyd’s members up to 3% of a member’s underwriting capacity in any one year. TheCompany does not believe that any assessment is likely in the foreseeable future and has not provided any allowancefor such an assessment. However, based on the Company’s 2011 estimated premium income at Lloyd’s of £560,000,the December 31, 2010 exchange rate of £1 equals $1.5468 and assuming the maximum 3% assessment theCompany would be assessed approximately $25,986.
19. Related party transactions
The transactions listed below are classified as related party transactions as each counterparty has either a director indirect shareholding in the Company.
a) On December 8, 2005, the Company entered into agreements with BlackRock Financial Management, Inc.(“BlackRock”) under which BlackRock provided investment management services for part of the Company’sinvestment portfolio. For the years ended December 31, 2009 and 2008, BlackRock was deemed to be a relatedparty due to a combination of Merrill Lynch (a shareholder of BlackRock) being a shareholder in the Company andhaving an employee on the Company’s Board of Directors during this period. For the year ended December 31,2010, BlackRock was no longer a related party. Investment management fees earned by BlackRock for the yearsended December 31, 2009 and 2008 were $2,036 and $2,243, respectively. Management believes that the feescharged were consistent with those that would have been charged in arm’s-length transactions with unrelated thirdparties.
b) On December 8, 2005, the Company entered into agreements with Goldman Sachs Asset Management andits affiliates (“GSAM”) under which GSAM provides investment management services for a portion of theCompany’s investment portfolio. Goldman Sachs entities, own 9,634,782 non-voting shares in the Company, holdwarrants to purchase 1,604,410 non-voting shares, and have an employee on the Company’s Board of Directors whodoes not receive compensation from the Company. For the years ended December 31, 2010, 2009 and 2008, SumitRajpal, a director of the Company, served as Managing Director of Goldman, Sachs and Co., GSAM’s parentcompany. Subsequent to year end Mr. Rajpal resigned from the Board of Directors of the Company. Investmentmanagement fees earned by GSAM for the year end December 31, 2010 were $1,728 (2009: $1,280; 2008: $1,404),of which $359 was included in accounts payable and accrued expenses at December 31, 2010 (2009: $371).Management believes that the fees charged were consistent with those that would have been charged in arm’s-lengthtransactions with unrelated third parties.
c) Vestar Capital entities own 7,786,770 shares in the Company, hold warrants to purchase 972,810 shares andhave an employee on the Company’s Board of Directors who does not receive compensation from the Company.Sander M. Levy, a director of the Company, serves as Managing Director of Vestar Capital Partners. During 2009,Vestar Capital entities were shareholders of PARIS RE Holdings, Limited (“Paris Re”). On July 4, 2009, PartnerReLtd. (“PartnerRe”) acquired the outstanding shares of Paris Re and as a result Paris Re was not a related party of theCompany during the year ended December 31, 2010. However, for the years ended December 31, 2009 and 2008,pursuant to reinsurance agreements with Paris Re, the Company recognized gross premiums written of $5,176 and$6,807, and earned premium adjustments of $5,918 and $4,457, respectively.
d) Aquiline Capital Partners, LLC and its related companies (“Aquiline”), which own 6,255,943 shares in theCompany, hold warrants to purchase 3,043,246 shares, and has two employees on the Board of Directors who do not
F-46
Validus Holdings, Ltd.
Notes to Consolidated Financial Statements — (Continued)(Expressed in thousands of U.S. dollars, except share and per share information)

receive compensation from the Company, are shareholders of Group Ark Insurance Holdings Ltd. (“Group Ark”).Christopher E. Watson, a director of the Company, also serves as a director of Group Ark. Pursuant to reinsuranceagreements with a subsidiary of Group Ark, the Company recognized gross premiums written during the year endedDecember 31, 2010 of $2,239 (2009 and 2008: $nil) of which $378 was included in premiums receivable atDecember 31, 2010 (2009: $nil). The Company also recognized reinsurance premiums ceded during the year endedDecember 31, 2010 of $738 (2009: $953; 2008: $1,348), of which $132 was included in reinsurance balancespayable at December 31, 2010 (2009: $nil). Earned premium adjustments of $1,024 were incurred during the yearended December 31, 2010 (2009 and 2008: $nil).
Aquiline is also a shareholder of Tiger Risk Partners LLC (“Tiger Risk”). Christopher E. Watson, a director ofthe Company serves as a director of Tiger Risk. Pursuant to certain reinsurance contracts, the Company recognizedbrokerage expenses paid to Tiger Risk during the year ended December 31, 2010 of $1,461 (2009: $1,231; 2008:$nil), of which $792 was included in accounts payable and accrued expenses at December 31, 2010 (2009: $643).
On November 24, 2009, the Company entered into an Investment Management Agreement with Conning, Inc.(“Conning”) to manage a portion of the Company’s investment portfolio. Aquiline acquired Conning on June 16,2009. John J. Hendrickson and Jeffrey W. Greenberg, directors of the Company, each serve as a director of ConningHoldings Corp., the parent company of Conning, and Michael Carpenter, the Chairman of Talbot Holdings, Ltd.serves as director of a subsidiary of Conning Holdings Corp. Investment management fees earned by Conning forthe year ended December 31, 2010 were $379 (2009: $13; 2008: $nil), of which $97 was included in accountspayable and accrued expenses at December 31, 2010 (2009: $13).
20. Earnings per share
The following table sets forth the computation of basic and diluted earnings per share for the years endedDecember 31, 2010, 2009 and 2008:
December 31,2010
December 31,2009
December 31,2008
Year Ended
Basic earnings per shareIncome . . . . . . . . . . . . . . . . . . . . . . . . . . . . . . . . . . . . . . . . . . $ 402,564 $ 897,407 $ 53,111less: Dividends and distributions declared on outstanding
warrants . . . . . . . . . . . . . . . . . . . . . . . . . . . . . . . . . . . . . . . (6,991) (6,507) (6,947)
Income available to common shareholders . . . . . . . . . . . . . . . . $ 395,573 $ 890,900 $ 46,164
Weighted average number of common shares outstanding . . . . . 116,018,364 93,697,194 74,677,903
Basic earnings per share . . . . . . . . . . . . . . . . . . . . . . . . . . . . $ 3.41 $ 9.51 $ 0.62
Diluted earnings per shareIncome . . . . . . . . . . . . . . . . . . . . . . . . . . . . . . . . . . . . . . . . . . $ 402,564 $ 897,407 $ 53,111less: Dividends and distributions declared on outstanding
warrants . . . . . . . . . . . . . . . . . . . . . . . . . . . . . . . . . . . . . . . — — (6,947)
Income available to common shareholders . . . . . . . . . . . . . . . . $ 402,564 $ 897,407 $ 46,164
Weighted average number of common shares outstanding . . . . . 116,018,364 93,697,194 74,677,903Share equivalents:
Warrants . . . . . . . . . . . . . . . . . . . . . . . . . . . . . . . . . . . . . . . 2,657,258 2,220,096 —Stock options . . . . . . . . . . . . . . . . . . . . . . . . . . . . . . . . . . . 888,281 478,472 136,701Unvested restricted shares . . . . . . . . . . . . . . . . . . . . . . . . . . 1,067,042 772,647 1,004,809
Weighted average number of common shares outstanding . . . . . 120,630,945 97,168,409 75,819,413
Diluted earnings per share . . . . . . . . . . . . . . . . . . . . . . . . . . $ 3.34 $ 9.24 $ 0.61
F-47
Validus Holdings, Ltd.
Notes to Consolidated Financial Statements — (Continued)(Expressed in thousands of U.S. dollars, except share and per share information)
Share equivalents that would result in the issuance of common shares of 136,881, 172,425 and 220,512 wereoutstanding for the years ended December 31, 2010, 2009 and 2008 respectively, but were not included in thecomputation of diluted earnings per share because the effect would be antidilutive.
21. Segment information
The Company conducts its operations worldwide through two wholly-owned subsidiaries, Validus Reinsur-ance, Ltd. and Talbot Holdings Ltd. from which two operating segments have been determined under U.S. GAAPsegment reporting. The Company’s operating segments are strategic business units that offer different products andservices. They are managed and have capital allocated separately because each business requires differentstrategies.
Validus Re
The Validus Re segment is focused on short-tail lines of reinsurance. The primary lines in which the segmentconducts business are property, marine and specialty, which include agriculture, aerospace & aviation, financiallines of business, nuclear, terrorism, life, accident & health, workers’ compensation and crisis management.
On September 4, 2009, the Company acquired all of the outstanding shares of IPC from a group of institutionaland other investors. The primary lines in which IPC conducted business were property catastrophe reinsurance and,to a limited extent, property-per-risk excess, aviation (including satellite) and other short-tail reinsurance on aworldwide basis. For segmental reporting purposes, the results of IPC’s operations since the acquisition date havebeen included within the Validus Re segment in the consolidated financial statements.
Talbot
The Talbot segment focuses on a wide range of marine and energy, war, political violence, commercialproperty, financial institutions, contingency, bloodstock, accident & health and aviation classes of business on aninsurance or facultative reinsurance basis and principally property, aerospace and marine classes of business on atreaty reinsurance basis.
Corporate and other reconciling items
The Company has a “Corporate” function, which includes the activities of the parent company, and whichcarries out certain functions for the group. “Corporate” includes ‘non-core’ underwriting expenses, predominantlygeneral and administrative and stock compensation expenses. “Corporate” also denotes the activities of certain keyexecutives such as the Chief Executive Officer and Chief Financial Officer. For internal reporting purposes,“Corporate” is reflected separately, however “Corporate” is not considered an operating segment under thesecircumstances. Other reconciling items include, but are not limited to, the elimination of intersegment revenues andexpenses and unusual items that are not allocated to segments.
F-48
Validus Holdings, Ltd.
Notes to Consolidated Financial Statements — (Continued)(Expressed in thousands of U.S. dollars, except share and per share information)

Year Ended December 31, 2010 Validus Re TalbotCorporate &Eliminations Total
Underwriting incomeGross premiums written. . . . . . . . . . . . . . . . . . . . . . . . . . $1,101,239 $ 981,073 $ (91,746) $1,990,566Reinsurance premiums ceded . . . . . . . . . . . . . . . . . . . . . . (63,147) (258,081) 91,746 (229,482)Net premiums written . . . . . . . . . . . . . . . . . . . . . . . . . . . 1,038,092 722,992 — 1,761,084Change in unearned premiums . . . . . . . . . . . . . . . . . . . . . 13,108 (13,069) — 39Net premiums earned . . . . . . . . . . . . . . . . . . . . . . . . . . 1,051,200 709,923 — 1,761,123Underwriting deductionsLosses and loss expenses . . . . . . . . . . . . . . . . . . . . . . . . . 601,610 385,976 — 987,586Policy acquisition costs . . . . . . . . . . . . . . . . . . . . . . . . . . 160,599 143,769 (11,469) 292,899General and administrative expenses. . . . . . . . . . . . . . . . . 45,617 114,043 49,630 209,290Share compensation expenses . . . . . . . . . . . . . . . . . . . . . 7,181 6,923 14,807 28,911Total underwriting deductions . . . . . . . . . . . . . . . . . . . . 815,007 650,711 52,968 1,518,686Underwriting income (loss) . . . . . . . . . . . . . . . . . . . . . . $ 236,193 $ 59,212 $ (52,968) $ 242,437Net investment income . . . . . . . . . . . . . . . . . . . . . . . . . . 113,968 29,287 (9,152) 134,103Other income . . . . . . . . . . . . . . . . . . . . . . . . . . . . . . . . . 4,211 12,802 (11,794) 5,219Finance expenses . . . . . . . . . . . . . . . . . . . . . . . . . . . . . . (5,471) (3,140) (47,259) (55,870)Operating income (loss) before taxes . . . . . . . . . . . . . . . 348,901 98,161 (121,173) 325,889Tax (expense) . . . . . . . . . . . . . . . . . . . . . . . . . . . . . . . . . (175) (2,730) (221) (3,126)Net operating income (loss) . . . . . . . . . . . . . . . . . . . . . . $ 348,726 $ 95,431 $(121,394) $ 322,763Net realized gains on investments. . . . . . . . . . . . . . . . . . . 23,637 8,861 — 32,498Net unrealized gains on investments . . . . . . . . . . . . . . . . . 45,276 676 — 45,952Foreign exchange (losses) gains . . . . . . . . . . . . . . . . . . . . (1,185) 2,091 445 1,351Net income (loss) . . . . . . . . . . . . . . . . . . . . . . . . . . . . . . $ 416,454 $ 107,059 $(120,949) $ 402,564
Selected ratios:Net premiums written / Gross premiums written . . . . . . . . 94.3% 73.7% 88.5%Losses and loss expenses . . . . . . . . . . . . . . . . . . . . . . . . . 57.2% 54.4% 56.1%Policy acquisition costs . . . . . . . . . . . . . . . . . . . . . . . . . . 15.3% 20.3% 16.6%General and administrative expenses(1) . . . . . . . . . . . . . . 5.0% 17.0% 13.5%Expense ratio . . . . . . . . . . . . . . . . . . . . . . . . . . . . . . . . . 20.3% 37.3% 30.1%Combined ratio . . . . . . . . . . . . . . . . . . . . . . . . . . . . . . . . 77.5% 91.7% 86.2%
Total assets . . . . . . . . . . . . . . . . . . . . . . . . . . . . . . . . . . $4,431,001 $2,599,158 $ 30,719 $7,060,878
(1) Ratios are based on net premiums earned. The general and administrative expense ratio includes sharecompensation expenses.
F-49
Validus Holdings, Ltd.
Notes to Consolidated Financial Statements — (Continued)(Expressed in thousands of U.S. dollars, except share and per share information)

Year Ended December 31, 2009 Validus Re (2) TalbotCorporate &Eliminations Total
Underwriting incomeGross premiums written. . . . . . . . . . . . . . . . . . . . . . $ 768,084 $ 919,906 $ (66,749) $1,621,241Reinsurance premiums ceded . . . . . . . . . . . . . . . . . . (95,446) (204,186) 66,749 (232,883)
Net premiums written . . . . . . . . . . . . . . . . . . . . . . . 672,638 715,720 — 1,388,358Change in unearned premiums . . . . . . . . . . . . . . . . . 122,912 (61,693) — 61,219
Net premiums earned . . . . . . . . . . . . . . . . . . . . . . 795,550 654,027 — 1,449,577
Underwriting deductionsLosses and loss expenses . . . . . . . . . . . . . . . . . . . . . 186,704 337,053 — 523,757Policy acquisition costs . . . . . . . . . . . . . . . . . . . . . . 127,433 139,932 (4,399) 262,966General and administrative expenses . . . . . . . . . . . . 65,710 96,352 23,506 185,568Share compensation expenses . . . . . . . . . . . . . . . . . 7,576 7,171 12,290 27,037
Total underwriting deductions. . . . . . . . . . . . . . . . 387,423 580,508 31,397 999,328
Underwriting income (loss) . . . . . . . . . . . . . . . . . . $ 408,127 $ 73,519 $ (31,397) $ 450,249Net investment income . . . . . . . . . . . . . . . . . . . . . . 94,973 30,114 (6,314) 118,773Other income . . . . . . . . . . . . . . . . . . . . . . . . . . . . . 5,149 5,225 (5,740) 4,634Finance expenses . . . . . . . . . . . . . . . . . . . . . . . . . . (1,774) (14,725) (27,631) (44,130)
Operating income (loss) before taxes . . . . . . . . . . . 506,475 94,133 (71,082) 529,526Tax (expense) benefit . . . . . . . . . . . . . . . . . . . . . . . (163) 3,922 — 3,759
Net operating income (loss) . . . . . . . . . . . . . . . . . . $ 506,312 $ 98,055 $ (71,082) $ 533,285Gain on bargain purchase, net of expenses . . . . . . . . — — 287,099 287,099Realized gain on repurchase of debentures . . . . . . . . — — 4,444 4,444Net realized (losses) on investments . . . . . . . . . . . . . (5,428) (6,115) — (11,543)Net unrealized gains on investments. . . . . . . . . . . . . 75,209 9,587 — 84,796Foreign exchange (losses) gains . . . . . . . . . . . . . . . . (1,406) 676 56 (674)
Net income. . . . . . . . . . . . . . . . . . . . . . . . . . . . . . . $ 574,687 $ 102,203 $220,517 $ 897,407
Selected ratios:Net premiums written / Gross premiums written . . . . 87.6% 77.8% 85.6%Losses and loss expenses . . . . . . . . . . . . . . . . . . . . . 23.5% 51.5% 36.1%Policy acquisition costs . . . . . . . . . . . . . . . . . . . . . . 16.0% 21.4% 18.1%General and administrative expenses(1) . . . . . . . . . . 9.2% 15.8% 14.7%
Expense ratio . . . . . . . . . . . . . . . . . . . . . . . . . . . . . 25.2% 37.2% 32.8%
Combined ratio . . . . . . . . . . . . . . . . . . . . . . . . . . . . 48.7% 88.7% 68.9%
Total assets . . . . . . . . . . . . . . . . . . . . . . . . . . . . . . $4,865,771 $2,137,393 $ 15,976 $7,019,140
(1) Ratios are based on net premiums earned. The general and administrative expense ratio includes sharecompensation expenses.
(2) Operating results of IPC have been included from the September 2009 date of acquisition.
F-50
Validus Holdings, Ltd.
Notes to Consolidated Financial Statements — (Continued)(Expressed in thousands of U.S. dollars, except share and per share information)
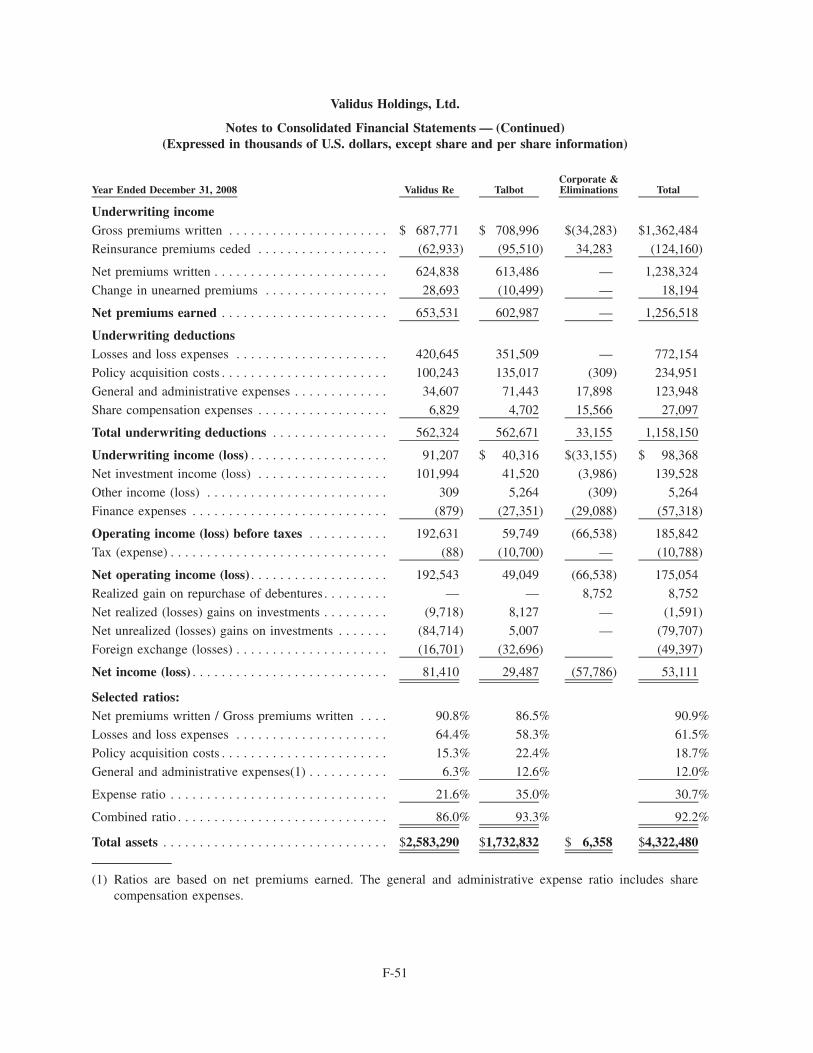
Year Ended December 31, 2008 Validus Re TalbotCorporate &Eliminations Total
Underwriting incomeGross premiums written . . . . . . . . . . . . . . . . . . . . . . $ 687,771 $ 708,996 $(34,283) $1,362,484
Reinsurance premiums ceded . . . . . . . . . . . . . . . . . . (62,933) (95,510) 34,283 (124,160)
Net premiums written . . . . . . . . . . . . . . . . . . . . . . . . 624,838 613,486 — 1,238,324
Change in unearned premiums . . . . . . . . . . . . . . . . . 28,693 (10,499) — 18,194
Net premiums earned . . . . . . . . . . . . . . . . . . . . . . . 653,531 602,987 — 1,256,518
Underwriting deductionsLosses and loss expenses . . . . . . . . . . . . . . . . . . . . . 420,645 351,509 — 772,154
Policy acquisition costs . . . . . . . . . . . . . . . . . . . . . . . 100,243 135,017 (309) 234,951
General and administrative expenses . . . . . . . . . . . . . 34,607 71,443 17,898 123,948
Share compensation expenses . . . . . . . . . . . . . . . . . . 6,829 4,702 15,566 27,097
Total underwriting deductions . . . . . . . . . . . . . . . . 562,324 562,671 33,155 1,158,150
Underwriting income (loss) . . . . . . . . . . . . . . . . . . . 91,207 $ 40,316 $(33,155) $ 98,368
Net investment income (loss) . . . . . . . . . . . . . . . . . . 101,994 41,520 (3,986) 139,528
Other income (loss) . . . . . . . . . . . . . . . . . . . . . . . . . 309 5,264 (309) 5,264
Finance expenses . . . . . . . . . . . . . . . . . . . . . . . . . . . (879) (27,351) (29,088) (57,318)
Operating income (loss) before taxes . . . . . . . . . . . 192,631 59,749 (66,538) 185,842
Tax (expense) . . . . . . . . . . . . . . . . . . . . . . . . . . . . . . (88) (10,700) — (10,788)
Net operating income (loss) . . . . . . . . . . . . . . . . . . . 192,543 49,049 (66,538) 175,054
Realized gain on repurchase of debentures . . . . . . . . . — — 8,752 8,752
Net realized (losses) gains on investments . . . . . . . . . (9,718) 8,127 — (1,591)
Net unrealized (losses) gains on investments . . . . . . . (84,714) 5,007 — (79,707)
Foreign exchange (losses) . . . . . . . . . . . . . . . . . . . . . (16,701) (32,696) (49,397)
Net income (loss) . . . . . . . . . . . . . . . . . . . . . . . . . . . 81,410 29,487 (57,786) 53,111
Selected ratios:Net premiums written / Gross premiums written . . . . 90.8% 86.5% 90.9%
Losses and loss expenses . . . . . . . . . . . . . . . . . . . . . 64.4% 58.3% 61.5%
Policy acquisition costs . . . . . . . . . . . . . . . . . . . . . . . 15.3% 22.4% 18.7%
General and administrative expenses(1) . . . . . . . . . . . 6.3% 12.6% 12.0%
Expense ratio . . . . . . . . . . . . . . . . . . . . . . . . . . . . . . 21.6% 35.0% 30.7%
Combined ratio . . . . . . . . . . . . . . . . . . . . . . . . . . . . . 86.0% 93.3% 92.2%
Total assets . . . . . . . . . . . . . . . . . . . . . . . . . . . . . . . $2,583,290 $1,732,832 $ 6,358 $4,322,480
(1) Ratios are based on net premiums earned. The general and administrative expense ratio includes sharecompensation expenses.
F-51
Validus Holdings, Ltd.
Notes to Consolidated Financial Statements — (Continued)(Expressed in thousands of U.S. dollars, except share and per share information)
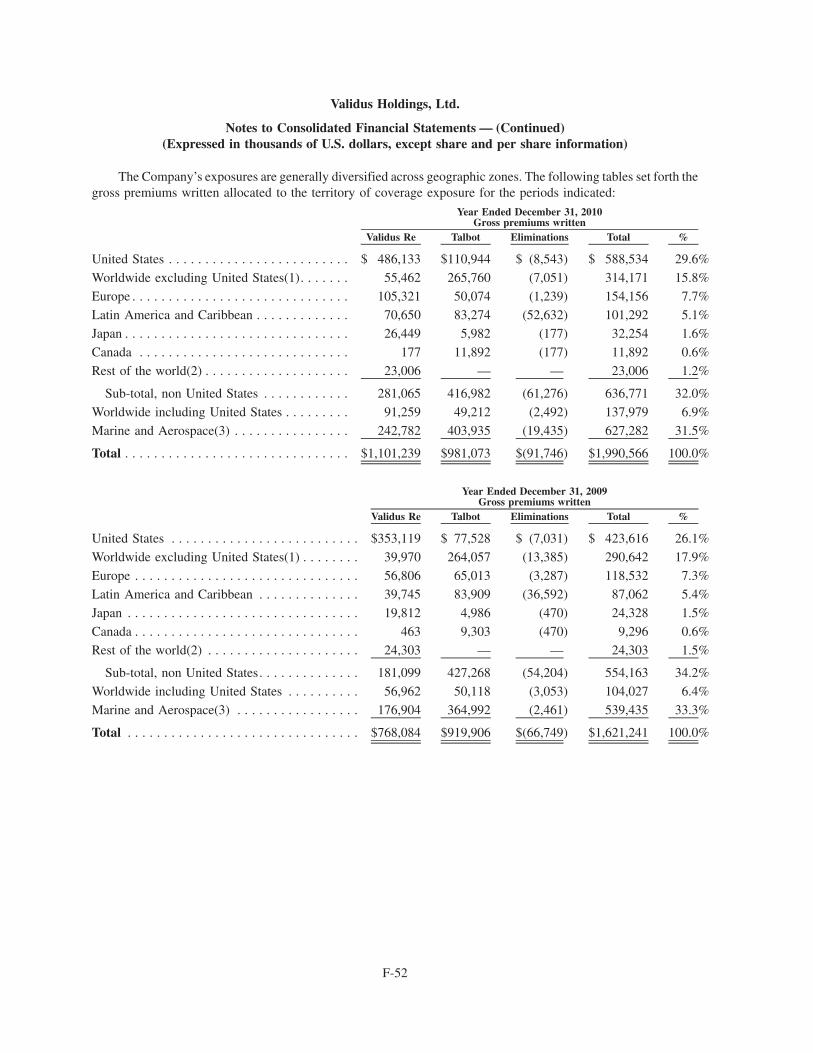
The Company’s exposures are generally diversified across geographic zones. The following tables set forth thegross premiums written allocated to the territory of coverage exposure for the periods indicated:
Validus Re Talbot Eliminations Total %
Year Ended December 31, 2010Gross premiums written
United States . . . . . . . . . . . . . . . . . . . . . . . . . $ 486,133 $110,944 $ (8,543) $ 588,534 29.6%
Worldwide excluding United States(1). . . . . . . 55,462 265,760 (7,051) 314,171 15.8%
Europe . . . . . . . . . . . . . . . . . . . . . . . . . . . . . . 105,321 50,074 (1,239) 154,156 7.7%
Latin America and Caribbean . . . . . . . . . . . . . 70,650 83,274 (52,632) 101,292 5.1%
Japan . . . . . . . . . . . . . . . . . . . . . . . . . . . . . . . 26,449 5,982 (177) 32,254 1.6%
Canada . . . . . . . . . . . . . . . . . . . . . . . . . . . . . 177 11,892 (177) 11,892 0.6%
Rest of the world(2) . . . . . . . . . . . . . . . . . . . . 23,006 — — 23,006 1.2%
Sub-total, non United States . . . . . . . . . . . . 281,065 416,982 (61,276) 636,771 32.0%
Worldwide including United States . . . . . . . . . 91,259 49,212 (2,492) 137,979 6.9%
Marine and Aerospace(3) . . . . . . . . . . . . . . . . 242,782 403,935 (19,435) 627,282 31.5%
Total . . . . . . . . . . . . . . . . . . . . . . . . . . . . . . . $1,101,239 $981,073 $(91,746) $1,990,566 100.0%
Validus Re Talbot Eliminations Total %
Year Ended December 31, 2009Gross premiums written
United States . . . . . . . . . . . . . . . . . . . . . . . . . . $353,119 $ 77,528 $ (7,031) $ 423,616 26.1%
Worldwide excluding United States(1) . . . . . . . . 39,970 264,057 (13,385) 290,642 17.9%
Europe . . . . . . . . . . . . . . . . . . . . . . . . . . . . . . . 56,806 65,013 (3,287) 118,532 7.3%
Latin America and Caribbean . . . . . . . . . . . . . . 39,745 83,909 (36,592) 87,062 5.4%
Japan . . . . . . . . . . . . . . . . . . . . . . . . . . . . . . . . 19,812 4,986 (470) 24,328 1.5%
Canada . . . . . . . . . . . . . . . . . . . . . . . . . . . . . . . 463 9,303 (470) 9,296 0.6%
Rest of the world(2) . . . . . . . . . . . . . . . . . . . . . 24,303 — — 24,303 1.5%
Sub-total, non United States. . . . . . . . . . . . . . 181,099 427,268 (54,204) 554,163 34.2%
Worldwide including United States . . . . . . . . . . 56,962 50,118 (3,053) 104,027 6.4%
Marine and Aerospace(3) . . . . . . . . . . . . . . . . . 176,904 364,992 (2,461) 539,435 33.3%
Total . . . . . . . . . . . . . . . . . . . . . . . . . . . . . . . . $768,084 $919,906 $(66,749) $1,621,241 100.0%
F-52
Validus Holdings, Ltd.
Notes to Consolidated Financial Statements — (Continued)(Expressed in thousands of U.S. dollars, except share and per share information)

Validus Re Talbot Eliminations Total %
Year Ended December 31, 2008Gross premiums written
United States . . . . . . . . . . . . . . . . . . . . . . . . . . $356,902 $ 62,098 $ — $ 419,000 30.8%
Worldwide excluding United States(1) . . . . . . . . 27,512 221,260 (20,870) 227,902 16.7%
Europe . . . . . . . . . . . . . . . . . . . . . . . . . . . . . . . 44,079 57,132 — 101,211 7.4%
Latin America and Caribbean . . . . . . . . . . . . . . 18,404 46,721 (13,413) 51,712 3.8%
Japan . . . . . . . . . . . . . . . . . . . . . . . . . . . . . . . . 9,416 3,955 — 13,371 1.0%
Canada . . . . . . . . . . . . . . . . . . . . . . . . . . . . . . . — 9,630 — 9,630 0.7%
Rest of the world(2) . . . . . . . . . . . . . . . . . . . . . — — — — 0.0%
Sub-total, non United States. . . . . . . . . . . . . . 99,411 338,698 (34,283) 403,826 29.6%
Worldwide including United States . . . . . . . . . . 74,391 58,079 — 132,470 9.7%
Marine and Aerospace(3) . . . . . . . . . . . . . . . . . 157,067 250,121 — 407,188 29.9%
Total . . . . . . . . . . . . . . . . . . . . . . . . . . . . . . . . $687,771 $708,996 $(34,283) $1,362,484 100.0%
(1) Represents risks in two or more geographic zones.
(2) Represents risks in one geographic zone.
(3) Not classified as geographic area as marine and aerospace risks can span multiple geographic areas and are notfixed locations in some instances.
22. Statutory and regulatory requirements
As disclosed in Note 18 (d), Syndicate 1183 and Talbot 2002 Underwriting Capital Ltd (“T02”) are subject toregulation by the Council of Lloyd’s. Syndicate 1183 and T02 are also subject to regulation by the U.K. FinancialServices Authority (“FSA”) under the Financial Services and Markets Act 2000.
T02 is a corporate member of Lloyd’s. As a corporate member of Lloyd’s, T02 is bound by the rules of theSociety of Lloyd’s, which are prescribed by Bye-laws and Requirements made by the Council of Lloyd’s underpowers conferred by the Lloyd’s Act 1982. These rules (among other matters) prescribe T02’s membershipsubscription, the level of its contribution to the Lloyd’s central fund and the assets it must deposit with Lloyd’s insupport of its underwriting. The Council of Lloyd’s has broad powers to sanction breaches of its rules, including thepower to restrict or prohibit a member’s participation on Lloyd’s syndicates.
The Company has four Bermuda-based subsidiaries, Validus Re, IPCRe Limited, AlphaCat Reinsurance, Ltd.and Talbot Insurance (Bermuda) Ltd. (“TIBL”) registered under The Insurance Act 1978 (Bermuda), AmendmentsThereto and Related Regulations (“The Act”). Under the Insurance Act, these subsidiaries are required to prepareStatutory Financial Statements and to file Statutory Financial Returns. These subsidiaries have to meet certainrequirements for minimum solvency and liquidity ratios. Effective for statutory filings for the year endedDecember 31, 2008, the BMA introduced a risk-based capital model, or Bermuda Solvency Capital Requirement(“BSCR”), as a tool to assist the BMA in measuring risk and determining appropriate capitalization. As atDecember 31, 2010 and 2009, these requirements were met.
F-53
Validus Holdings, Ltd.
Notes to Consolidated Financial Statements — (Continued)(Expressed in thousands of U.S. dollars, except share and per share information)

Statutory requirements based on draft regulatory filings for Validus Re, IPCRe Limited, TIBL and AlphaCatReinsurance, Ltd. are set out below:
December 31,2010
December 31,2009
December 31,2010
December 31,2009
December 31,2010
December 31,2009
December 31,2010
December 31,2009
Validus Re IPCRe Limited TIBL AlphaCat Reinsurance, Ltd
Minimum statutory capital and surplus . . $ 505,574 $ 335,802 $ 29,972 $ 187,690 $ 14,924 $ 13,315 $ 120 $ 120Actual statutory capital and surplus . . . . 4,850,860 3,576,958 300,487 1,952,038 432,281 341,316 123 120Minimum share capital . . . . . . . . . . . . 1,000 1,000 1,000 1,000 120 120 120 120Actual share capital . . . . . . . . . . . . . . 2,667,249 2,659,942 1,452,059 1,461,609 62,731 62,731 120 120Minimum relevant assets . . . . . . . . . . 796,711 582,002 184,643 268,643 66,618 161,902 71,061 35,019Actual relevant assets . . . . . . . . . . . . 3,848,938 2,283,968 512,509 2,248,900 520,671 556,816 94,870 46,812
The Bermuda Companies Act 1981 (the “Companies Act”) limits the Company’s ability to pay dividends anddistributions to shareholders.
23. Subsequent events
The Company has evaluated the following subsequent events:
• During late December 2010 and continuing into early January 2011, persistent rains in Eastern Australiacaused severe flooding. There was damage throughout much of the state of Queensland, including the statecapital city of Brisbane;
• During late January 2011, and continuing in February 2011, civil unrest and violence occurred in severalNorth African and Middle Eastern countries;
• During January 2011, persistent rains in South Eastern Australia caused severe flooding in the city ofVictoria; and
• On February 3, 2011, Cyclone Yasi, classified as a category 5 cyclone, made landfall in northernQueensland, Australia. The storm caused widespread damage to property and crops which was followedby severe flooding.
The Company is continuing to review its in-force contracts and preliminary loss information from clients forthe events described above and does not expect that 2011 losses, either individually or when aggregated, will have amaterial impact on its shareholders equity or liquidity.
On February 9, 2011, the Company announced that its Board of Directors had increased the Company’s annualdividend by 13.6% from $0.88 to $1.00 per common share and per common share equivalent for which eachoutstanding warrant is exercisable. The first quarterly cash dividend of $0.25 per each common share and $0.25 percommon share equivalent is payable on March 31, 2011 to holders of record on March 15, 2011.
F-54
Validus Holdings, Ltd.
Notes to Consolidated Financial Statements — (Continued)(Expressed in thousands of U.S. dollars, except share and per share information)
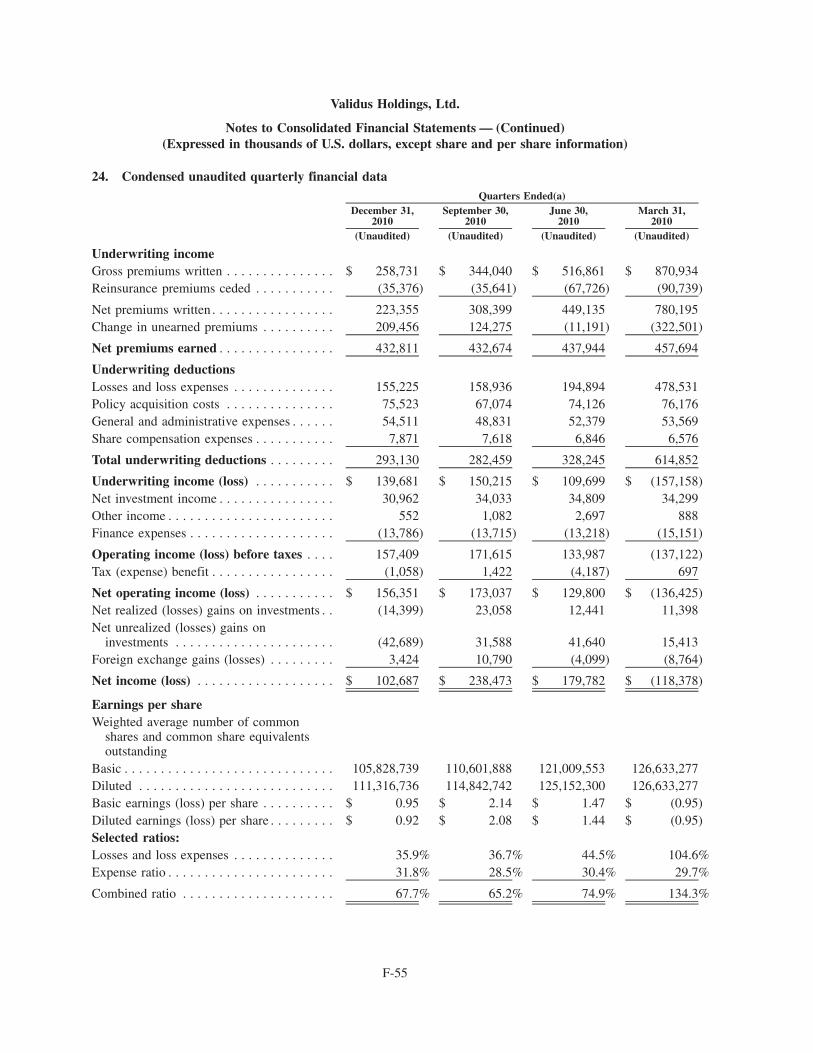
24. Condensed unaudited quarterly financial data
December 31,2010
September 30,2010
June 30,2010
March 31,2010
Quarters Ended(a)
(Unaudited) (Unaudited) (Unaudited) (Unaudited)
Underwriting incomeGross premiums written . . . . . . . . . . . . . . . $ 258,731 $ 344,040 $ 516,861 $ 870,934Reinsurance premiums ceded . . . . . . . . . . . (35,376) (35,641) (67,726) (90,739)
Net premiums written . . . . . . . . . . . . . . . . . 223,355 308,399 449,135 780,195Change in unearned premiums . . . . . . . . . . 209,456 124,275 (11,191) (322,501)
Net premiums earned . . . . . . . . . . . . . . . . 432,811 432,674 437,944 457,694
Underwriting deductionsLosses and loss expenses . . . . . . . . . . . . . . 155,225 158,936 194,894 478,531Policy acquisition costs . . . . . . . . . . . . . . . 75,523 67,074 74,126 76,176General and administrative expenses . . . . . . 54,511 48,831 52,379 53,569Share compensation expenses . . . . . . . . . . . 7,871 7,618 6,846 6,576
Total underwriting deductions . . . . . . . . . 293,130 282,459 328,245 614,852
Underwriting income (loss) . . . . . . . . . . . $ 139,681 $ 150,215 $ 109,699 $ (157,158)Net investment income . . . . . . . . . . . . . . . . 30,962 34,033 34,809 34,299Other income . . . . . . . . . . . . . . . . . . . . . . . 552 1,082 2,697 888Finance expenses . . . . . . . . . . . . . . . . . . . . (13,786) (13,715) (13,218) (15,151)
Operating income (loss) before taxes . . . . 157,409 171,615 133,987 (137,122)Tax (expense) benefit . . . . . . . . . . . . . . . . . (1,058) 1,422 (4,187) 697
Net operating income (loss) . . . . . . . . . . . $ 156,351 $ 173,037 $ 129,800 $ (136,425)Net realized (losses) gains on investments . . (14,399) 23,058 12,441 11,398Net unrealized (losses) gains on
investments . . . . . . . . . . . . . . . . . . . . . . (42,689) 31,588 41,640 15,413Foreign exchange gains (losses) . . . . . . . . . 3,424 10,790 (4,099) (8,764)
Net income (loss) . . . . . . . . . . . . . . . . . . . $ 102,687 $ 238,473 $ 179,782 $ (118,378)
Earnings per shareWeighted average number of common
shares and common share equivalentsoutstanding
Basic . . . . . . . . . . . . . . . . . . . . . . . . . . . . . 105,828,739 110,601,888 121,009,553 126,633,277Diluted . . . . . . . . . . . . . . . . . . . . . . . . . . . 111,316,736 114,842,742 125,152,300 126,633,277Basic earnings (loss) per share . . . . . . . . . . $ 0.95 $ 2.14 $ 1.47 $ (0.95)Diluted earnings (loss) per share . . . . . . . . . $ 0.92 $ 2.08 $ 1.44 $ (0.95)Selected ratios:Losses and loss expenses . . . . . . . . . . . . . . 35.9% 36.7% 44.5% 104.6%Expense ratio . . . . . . . . . . . . . . . . . . . . . . . 31.8% 28.5% 30.4% 29.7%
Combined ratio . . . . . . . . . . . . . . . . . . . . . 67.7% 65.2% 74.9% 134.3%
F-55
Validus Holdings, Ltd.
Notes to Consolidated Financial Statements — (Continued)(Expressed in thousands of U.S. dollars, except share and per share information)

December 31,2009
September 30,2009
June 30,2009
March 31,2009
Quarters Ended
(Unaudited) (Unaudited) (Unaudited) (Unaudited)
Underwriting incomeGross premiums written . . . . . . . . . . . . . . . . . . $ 255,289 $ 331,028 $ 425,032 $ 609,892Reinsurance premiums ceded . . . . . . . . . . . . . . (30,393) (67,687) (62,291) (72,512)
Net premiums written . . . . . . . . . . . . . . . . . . . 224,896 263,341 362,741 537,380Change in unearned premiums . . . . . . . . . . . . . 203,005 111,376 (34,541) (218,621)
Net premiums earned . . . . . . . . . . . . . . . . . . 427,901 374,717 328,200 318,759
Underwriting deductionsLosses and loss expenses . . . . . . . . . . . . . . . . . 133,020 134,152 124,751 131,834Policy acquisition costs . . . . . . . . . . . . . . . . . . 72,843 64,236 64,438 61,449General and administrative expenses . . . . . . . . 60,253 46,036 41,200 38,079Share compensation expenses . . . . . . . . . . . . . . 8,189 5,862 5,632 7,354
Total underwriting deductions . . . . . . . . . . . . 274,305 250,286 236,021 238,716
Underwriting income . . . . . . . . . . . . . . . . . . . $ 153,596 $ 124,431 $ 92,179 $ 80,043Net investment income . . . . . . . . . . . . . . . . . . 35,506 29,532 26,963 26,772Other income . . . . . . . . . . . . . . . . . . . . . . . . . 1,759 1,101 1,017 757Finance expenses . . . . . . . . . . . . . . . . . . . . . . . (14,398) (11,257) (10,752) (7,723)
Operating income before taxes . . . . . . . . . . . 176,463 143,807 109,407 99,849Tax benefit . . . . . . . . . . . . . . . . . . . . . . . . . . . 458 1,799 976 526
Net operating income . . . . . . . . . . . . . . . . . . . $ 176,921 $ 145,606 $ 110,383 $ 100,375Gain on bargain purchase, net of expenses . . . . — 302,950 (15,851) —Realized gain on repurchase of debentures . . . . 4,444 — — —Net realized gains (losses) on investments . . . . 9,099 5,429 (2,650) (23,421)Net unrealized (losses) gains on investments . . . (25,043) 50,437 37,249 22,153Foreign exchange gains (losses) . . . . . . . . . . . . 338 (5,244) 8,432 (4,200)
Net income . . . . . . . . . . . . . . . . . . . . . . . . . . . $ 165,759 $ 499,178 $ 137,563 $ 94,907
Earnings per shareWeighted average number of common shares
and common share equivalents outstandingBasic. . . . . . . . . . . . . . . . . . . . . . . . . . . . . . . . 130,413,790 92,492,373 76,138,038 75,744,577Diluted . . . . . . . . . . . . . . . . . . . . . . . . . . . . . . 134,794,120 95,834,809 78,942,065 79,102,643Basic earnings per share . . . . . . . . . . . . . . . . . $ 1.26 $ 5.38 $ 1.79 $ 1.23Diluted earnings per share . . . . . . . . . . . . . . . . $ 1.23 $ 5.21 $ 1.74 $ 1.20Selected Ratios:Losses and loss expenses . . . . . . . . . . . . . . . . . 31.1% 35.8% 38.0% 41.4%Expense ratio . . . . . . . . . . . . . . . . . . . . . . . . . 33.0% 30.9% 33.9% 33.6%
Combined ratio . . . . . . . . . . . . . . . . . . . . . . . . 64.1% 66.7% 71.9% 75.0%
(a) Operating results of IPC have been included from the September 2009 date of acquisition.
F-56
Validus Holdings, Ltd.
Notes to Consolidated Financial Statements — (Continued)(Expressed in thousands of U.S. dollars, except share and per share information)
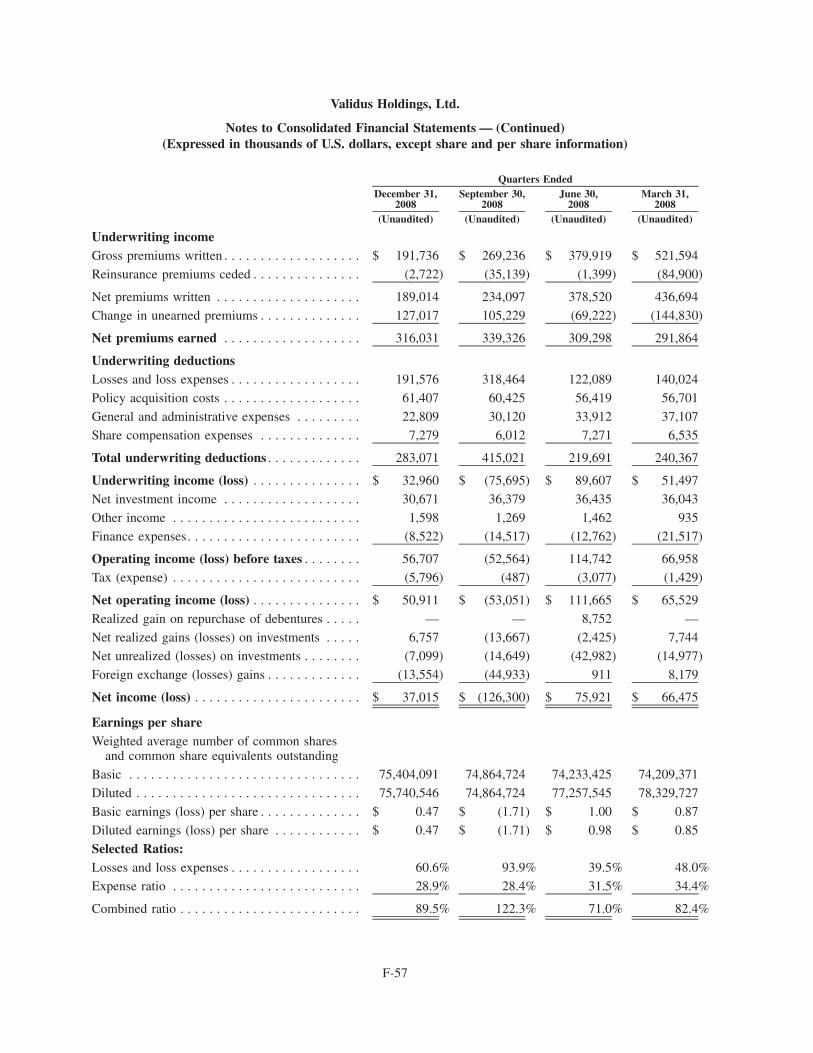
December 31,2008
September 30,2008
June 30,2008
March 31,2008
Quarters Ended
(Unaudited) (Unaudited) (Unaudited) (Unaudited)
Underwriting incomeGross premiums written . . . . . . . . . . . . . . . . . . . $ 191,736 $ 269,236 $ 379,919 $ 521,594
Reinsurance premiums ceded . . . . . . . . . . . . . . . (2,722) (35,139) (1,399) (84,900)
Net premiums written . . . . . . . . . . . . . . . . . . . . 189,014 234,097 378,520 436,694
Change in unearned premiums . . . . . . . . . . . . . . 127,017 105,229 (69,222) (144,830)
Net premiums earned . . . . . . . . . . . . . . . . . . . 316,031 339,326 309,298 291,864
Underwriting deductionsLosses and loss expenses . . . . . . . . . . . . . . . . . . 191,576 318,464 122,089 140,024
Policy acquisition costs . . . . . . . . . . . . . . . . . . . 61,407 60,425 56,419 56,701
General and administrative expenses . . . . . . . . . 22,809 30,120 33,912 37,107
Share compensation expenses . . . . . . . . . . . . . . 7,279 6,012 7,271 6,535
Total underwriting deductions . . . . . . . . . . . . . 283,071 415,021 219,691 240,367
Underwriting income (loss) . . . . . . . . . . . . . . . $ 32,960 $ (75,695) $ 89,607 $ 51,497
Net investment income . . . . . . . . . . . . . . . . . . . 30,671 36,379 36,435 36,043
Other income . . . . . . . . . . . . . . . . . . . . . . . . . . 1,598 1,269 1,462 935
Finance expenses. . . . . . . . . . . . . . . . . . . . . . . . (8,522) (14,517) (12,762) (21,517)
Operating income (loss) before taxes . . . . . . . . 56,707 (52,564) 114,742 66,958
Tax (expense) . . . . . . . . . . . . . . . . . . . . . . . . . . (5,796) (487) (3,077) (1,429)
Net operating income (loss) . . . . . . . . . . . . . . . $ 50,911 $ (53,051) $ 111,665 $ 65,529
Realized gain on repurchase of debentures . . . . . — — 8,752 —
Net realized gains (losses) on investments . . . . . 6,757 (13,667) (2,425) 7,744
Net unrealized (losses) on investments . . . . . . . . (7,099) (14,649) (42,982) (14,977)
Foreign exchange (losses) gains . . . . . . . . . . . . . (13,554) (44,933) 911 8,179
Net income (loss) . . . . . . . . . . . . . . . . . . . . . . . $ 37,015 $ (126,300) $ 75,921 $ 66,475
Earnings per shareWeighted average number of common shares
and common share equivalents outstanding
Basic . . . . . . . . . . . . . . . . . . . . . . . . . . . . . . . . 75,404,091 74,864,724 74,233,425 74,209,371
Diluted . . . . . . . . . . . . . . . . . . . . . . . . . . . . . . . 75,740,546 74,864,724 77,257,545 78,329,727
Basic earnings (loss) per share . . . . . . . . . . . . . . $ 0.47 $ (1.71) $ 1.00 $ 0.87
Diluted earnings (loss) per share . . . . . . . . . . . . $ 0.47 $ (1.71) $ 0.98 $ 0.85
Selected Ratios:Losses and loss expenses . . . . . . . . . . . . . . . . . . 60.6% 93.9% 39.5% 48.0%
Expense ratio . . . . . . . . . . . . . . . . . . . . . . . . . . 28.9% 28.4% 31.5% 34.4%
Combined ratio . . . . . . . . . . . . . . . . . . . . . . . . . 89.5% 122.3% 71.0% 82.4%
F-57
Validus Holdings, Ltd.
Notes to Consolidated Financial Statements — (Continued)(Expressed in thousands of U.S. dollars, except share and per share information)

SCHEDULE I
VALIDUS HOLDINGS, LTD.
SUMMARY OF INVESTMENTS OTHER THAN INVESTMENTS IN RELATED PARTIESAt December 31, 2010
(Expressed in thousands of U.S. dollars)
AmortizedCost
FairValue
Amount at whichShown on theBalance Sheet
U.S. Government and Government Agency . . . . . . . . . . . . . . . . $1,665,050 $1,677,166 $1,677,166
Non-U.S. Government and Government Agency. . . . . . . . . . . . . 550,759 554,199 554,199
States, municipalities, political subdivision. . . . . . . . . . . . . . . . . 26,365 26,285 26,285
Agency residential mortgage-backed securities . . . . . . . . . . . . . . 430,873 445,859 445,859
Non-Agency residential mortgage-backed securities . . . . . . . . . . 62,020 56,470 56,470
U.S. corporate . . . . . . . . . . . . . . . . . . . . . . . . . . . . . . . . . . . . . . 1,288,078 1,308,406 1,308,406
Non-U.S. corporate . . . . . . . . . . . . . . . . . . . . . . . . . . . . . . . . . . 497,689 502,067 502,067
Bank loans . . . . . . . . . . . . . . . . . . . . . . . . . . . . . . . . . . . . . . . . 52,612 52,566 52,566
Catastrophe bonds . . . . . . . . . . . . . . . . . . . . . . . . . . . . . . . . . . . 56,991 58,737 58,737Asset-backed securities . . . . . . . . . . . . . . . . . . . . . . . . . . . . . . . 123,354 123,569 123,569
Commercial mortgage-backed securities. . . . . . . . . . . . . . . . . . . 18,246 18,543 18,543
Total fixed maturities . . . . . . . . . . . . . . . . . . . . . . . . . . . . . . . . 4,772,037 4,823,867 4,823,867
Total short-term investments . . . . . . . . . . . . . . . . . . . . . . . . . . . 273,444 273,514 273,514
Total other investments . . . . . . . . . . . . . . . . . . . . . . . . . . . . . . . 18,392 21,478 21,478
Total . . . . . . . . . . . . . . . . . . . . . . . . . . . . . . . . . . . . . . . . . . . . . $5,063,873 $5,118,859 $5,118,859
F-58
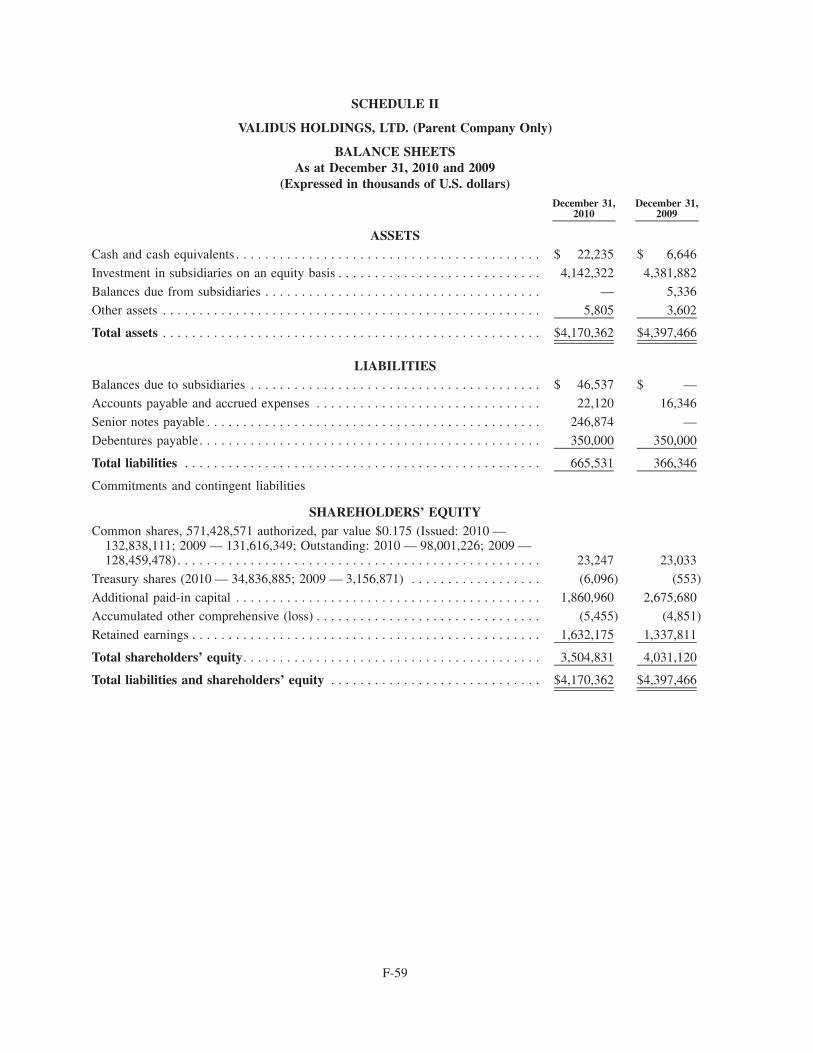
SCHEDULE II
VALIDUS HOLDINGS, LTD. (Parent Company Only)
BALANCE SHEETSAs at December 31, 2010 and 2009
(Expressed in thousands of U.S. dollars)December 31,
2010December 31,
2009
ASSETSCash and cash equivalents . . . . . . . . . . . . . . . . . . . . . . . . . . . . . . . . . . . . . . . . . . $ 22,235 $ 6,646
Investment in subsidiaries on an equity basis . . . . . . . . . . . . . . . . . . . . . . . . . . . . 4,142,322 4,381,882
Balances due from subsidiaries . . . . . . . . . . . . . . . . . . . . . . . . . . . . . . . . . . . . . . — 5,336
Other assets . . . . . . . . . . . . . . . . . . . . . . . . . . . . . . . . . . . . . . . . . . . . . . . . . . . . 5,805 3,602
Total assets . . . . . . . . . . . . . . . . . . . . . . . . . . . . . . . . . . . . . . . . . . . . . . . . . . . . $4,170,362 $4,397,466
LIABILITIESBalances due to subsidiaries . . . . . . . . . . . . . . . . . . . . . . . . . . . . . . . . . . . . . . . . $ 46,537 $ —
Accounts payable and accrued expenses . . . . . . . . . . . . . . . . . . . . . . . . . . . . . . . 22,120 16,346
Senior notes payable . . . . . . . . . . . . . . . . . . . . . . . . . . . . . . . . . . . . . . . . . . . . . . 246,874 —
Debentures payable. . . . . . . . . . . . . . . . . . . . . . . . . . . . . . . . . . . . . . . . . . . . . . . 350,000 350,000
Total liabilities . . . . . . . . . . . . . . . . . . . . . . . . . . . . . . . . . . . . . . . . . . . . . . . . . 665,531 366,346
Commitments and contingent liabilities
SHAREHOLDERS’ EQUITYCommon shares, 571,428,571 authorized, par value $0.175 (Issued: 2010 —
132,838,111; 2009 — 131,616,349; Outstanding: 2010 — 98,001,226; 2009 —128,459,478) . . . . . . . . . . . . . . . . . . . . . . . . . . . . . . . . . . . . . . . . . . . . . . . . . . 23,247 23,033
Treasury shares (2010 — 34,836,885; 2009 — 3,156,871) . . . . . . . . . . . . . . . . . . (6,096) (553)
Additional paid-in capital . . . . . . . . . . . . . . . . . . . . . . . . . . . . . . . . . . . . . . . . . . 1,860,960 2,675,680
Accumulated other comprehensive (loss) . . . . . . . . . . . . . . . . . . . . . . . . . . . . . . . (5,455) (4,851)
Retained earnings . . . . . . . . . . . . . . . . . . . . . . . . . . . . . . . . . . . . . . . . . . . . . . . . 1,632,175 1,337,811
Total shareholders’ equity. . . . . . . . . . . . . . . . . . . . . . . . . . . . . . . . . . . . . . . . . 3,504,831 4,031,120
Total liabilities and shareholders’ equity . . . . . . . . . . . . . . . . . . . . . . . . . . . . . $4,170,362 $4,397,466
F-59

VALIDUS HOLDINGS, LTD. (Parent Company Only)
STATEMENTS OF OPERATIONSFor the years ended December 31, 2010, 2009 and 2008
(Expressed in thousands of U.S. dollars)Year Ended
December 31,2010
Year EndedDecember 31,
2009
Year EndedDecember 31,
2008
RevenuesNet investment income . . . . . . . . . . . . . . . . . . . . . . . . . . . . . . . . . $ 2 $ 14 $ 71
Foreign exchange gains . . . . . . . . . . . . . . . . . . . . . . . . . . . . . . . . 154 56 —
Total revenues . . . . . . . . . . . . . . . . . . . . . . . . . . . . . . . . . . . . . . 156 70 71
ExpensesGeneral and administrative expenses . . . . . . . . . . . . . . . . . . . . . . . 37,601 25,404 4,181
Share compensation expenses . . . . . . . . . . . . . . . . . . . . . . . . . . . . 8,899 — —
Finance expenses . . . . . . . . . . . . . . . . . . . . . . . . . . . . . . . . . . . . . 52,485 31,716 31,745
Total expenses . . . . . . . . . . . . . . . . . . . . . . . . . . . . . . . . . . . . . . 98,985 $ 57,120 35,926
(Loss) before equity in net earnings of subsidiaries . . . . . . . . . . . . (98,829) (57,050) (35,855)
Equity in net earnings of subsidiaries . . . . . . . . . . . . . . . . . . . . 501,393 954,457 88,966
Net income . . . . . . . . . . . . . . . . . . . . . . . . . . . . . . . . . . . . . . . . . $402,564 $897,407 $ 53,111
F-60
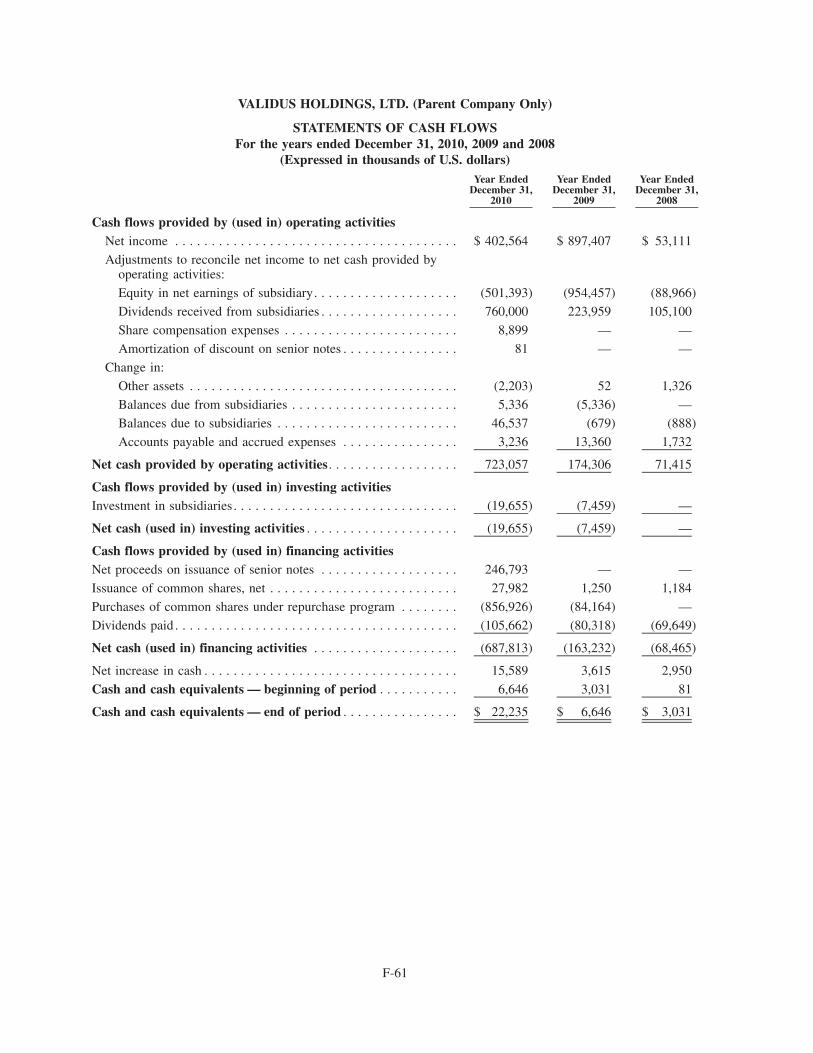
VALIDUS HOLDINGS, LTD. (Parent Company Only)
STATEMENTS OF CASH FLOWSFor the years ended December 31, 2010, 2009 and 2008
(Expressed in thousands of U.S. dollars)Year Ended
December 31,2010
Year EndedDecember 31,
2009
Year EndedDecember 31,
2008
Cash flows provided by (used in) operating activitiesNet income . . . . . . . . . . . . . . . . . . . . . . . . . . . . . . . . . . . . . . . $ 402,564 $ 897,407 $ 53,111
Adjustments to reconcile net income to net cash provided byoperating activities:
Equity in net earnings of subsidiary. . . . . . . . . . . . . . . . . . . . (501,393) (954,457) (88,966)
Dividends received from subsidiaries . . . . . . . . . . . . . . . . . . . 760,000 223,959 105,100
Share compensation expenses . . . . . . . . . . . . . . . . . . . . . . . . 8,899 — —
Amortization of discount on senior notes . . . . . . . . . . . . . . . . 81 — —
Change in:
Other assets . . . . . . . . . . . . . . . . . . . . . . . . . . . . . . . . . . . . . (2,203) 52 1,326
Balances due from subsidiaries . . . . . . . . . . . . . . . . . . . . . . . 5,336 (5,336) —
Balances due to subsidiaries . . . . . . . . . . . . . . . . . . . . . . . . . 46,537 (679) (888)
Accounts payable and accrued expenses . . . . . . . . . . . . . . . . 3,236 13,360 1,732
Net cash provided by operating activities. . . . . . . . . . . . . . . . . . 723,057 174,306 71,415
Cash flows provided by (used in) investing activitiesInvestment in subsidiaries . . . . . . . . . . . . . . . . . . . . . . . . . . . . . . . (19,655) (7,459) —
Net cash (used in) investing activities . . . . . . . . . . . . . . . . . . . . . (19,655) (7,459) —
Cash flows provided by (used in) financing activitiesNet proceeds on issuance of senior notes . . . . . . . . . . . . . . . . . . . 246,793 — —
Issuance of common shares, net . . . . . . . . . . . . . . . . . . . . . . . . . . 27,982 1,250 1,184
Purchases of common shares under repurchase program . . . . . . . . (856,926) (84,164) —
Dividends paid . . . . . . . . . . . . . . . . . . . . . . . . . . . . . . . . . . . . . . . (105,662) (80,318) (69,649)
Net cash (used in) financing activities . . . . . . . . . . . . . . . . . . . . (687,813) (163,232) (68,465)
Net increase in cash . . . . . . . . . . . . . . . . . . . . . . . . . . . . . . . . . . . 15,589 3,615 2,950
Cash and cash equivalents — beginning of period . . . . . . . . . . . 6,646 3,031 81
Cash and cash equivalents — end of period . . . . . . . . . . . . . . . . $ 22,235 $ 6,646 $ 3,031
F-61

SCHEDULE III
VALIDUS HOLDINGS, LTD.
SUPPLEMENTARY INSURANCE INFORMATIONAs at and for the years ended December 31, 2010, 2009 and 2008
(Expressed in thousands of U.S. dollars)
DeferredAcquisition
Costs
Reservefor Lossesand LossExpenses
UnearnedPremiums
NetPremiums
Earned
NetInvestment
Income
Lossesand LossExpenses
Amortizationof DeferredAcquisition
Costs
OtherOperatingExpenses
NetPremiums
Written
As at and for the Year Ended December 31, 2010
Validus Re . . . . . . . . . . . . $ 57,982 $ 998,165 $299,250 $1,051,200 $113,968 $601,610 $160,599 $ 52,798 $1,038,092
Talbot . . . . . . . . . . . . . . . 74,846 1,191,548 454,927 709,923 29,287 385,976 143,769 120,966 722,992
Corporate & Eliminations . . (8,931) (153,740) (25,661) — (9,152) — (11,469) 64,437 —
Total . . . . . . . . . . . . . . $123,897 $2,035,973 $728,516 $1,761,123 $134,103 $987,586 $292,899 $238,201 $1,761,084
DeferredAcquisition
Costs
Reservefor Lossesand LossExpenses
UnearnedPremiums
NetPremiums
Earned
NetInvestment
Income
Lossesand LossExpenses
Amortizationof DeferredAcquisition
Costs
OtherOperatingExpenses
NetPremiums
Written
As at and for the Year Ended December 31, 2009
Validus Re . . . . . . . . . . . . $ 54,325 $ 742,510 $325,260 $ 795,550 $ 94,973 $186,704 $127,433 $ 73,286 $ 672,638
Talbot . . . . . . . . . . . . . . . 68,341 903,986 427,284 654,027 30,114 337,053 139,932 103,523 715,720
Corporate & Eliminations . . (10,337) (24,362) (28,440) — (6,314) — (4,399) 35,796 —
Total . . . . . . . . . . . . . . $112,329 $1,622,134 $724,104 $1,449,577 $118,773 $523,757 $262,966 $212,605 $1,388,358
DeferredAcquisition
Costs
Reservefor Lossesand LossExpenses
UnearnedPremiums
NetPremiums
Earned
NetInvestment
Income
Lossesand LossExpenses
Amortizationof DeferredAcquisition
Costs
OtherOperatingExpenses
NetPremiums
Written
As at and for the Year Ended December 31, 2008
Validus Re . . . . . . . . . . . . $ 46,415 $ 535,888 $232,522 $ 653,531 $101,994 $420,645 $100,243 $ 41,436 $ 624,838
Talbot . . . . . . . . . . . . . . . 62,153 790,199 317,207 602,987 41,520 351,509 135,017 76,145 613,486
Corporate & Eliminations . . (412) (20,784) (10,279) — (3,986) — (309) 33,464 —
Total . . . . . . . . . . . . . . $108,156 $1,305,303 $539,450 $1,256,518 $139,528 $772,154 $234,951 $151,045 $1,238,324
F-62

SCHEDULE IV
VALIDUS HOLDINGS, LTD.
SUPPLEMENTARY REINSURANCE INFORMATIONAs at and for the years ended December 31, 2010, 2009 and 2008
(Expressed in thousands of U.S. dollars)
GrossCeded to
Other Companies
Assumedfrom OtherCompanies Net Amount
Percentageof Amount
Assumed to Net
Year Ended December 31, 2010 . . $460,337 $229,482 $1,530,229 $1,761,084 87%
Year Ended December 31, 2009 . . 459,771 232,883 1,161,470 1,388,358 84%
Year Ended December 31, 2008 . . 393,003 124,160 969,481 1,238,324 78%
F-63

SCHEDULE VI
VALIDUS HOLDINGS, LTD.
SUPPLEMENTARY INFORMATION CONCERNING PROPERTY/CASUALTY(RE)INSURANCE INFORMATION
As at and for the years ended December 31, 2010, 2009 and 2008(Expressed in thousands of U.S. dollars)
DeferredAcquisition
Costs
Reserves forLosses
and LossExpenses
Reserves forUnearnedPremiums
NetEarned
Premiums
NetInvestment
IncomeCurrent
YearPriorYear
Net PaidLosses
and LossExpenses
Amortizationof DeferredAcquisition
Costs
NetPremiumsWritten
Losses and Loss Expensesincurred related to
2010 . . . $123,897 $2,035,973 $728,516 $1,761,123 $134,103 $1,144,196 $(156,610) $673,422 $292,899 $1,761,084
2009 . . . 112,329 1,622,134 724,104 1,449,577 118,773 625,810 (102,053) 507,435 262,966 1,388,358
2008 . . . 108,156 1,305,303 539,450 1,256,518 139,528 841,856 (69,702) 406,469 234,951 1,238,324
F-64

Exhibit 21Validus Holdings, Ltd. Subsidiaries % Jurisdiction
Validus Holdings, Ltd. . . . . . . . . . . . . . . . . . . . . . . . . . . . . . . . . . . . . . . . . . . . . . . . . . . . . Bermuda
Underwriting Risk Services (Bermuda) Ltd. . . . . . . . . . . . . . . . . . . . . . . . . . . . . . . . . . . Bermuda
Validus Reinsurance, Ltd. . . . . . . . . . . . . . . . . . . . . . . . . . . . . . . . . . . . . . . . . . . . . . . . . Bermuda
Validus Amalgamation Subsidiary Ltd. . . . . . . . . . . . . . . . . . . . . . . . . . . . . . . . . . . . . Bermuda
IPCRe Limited . . . . . . . . . . . . . . . . . . . . . . . . . . . . . . . . . . . . . . . . . . . . . . . . . . . . Bermuda
Validus Re Europe Limited . . . . . . . . . . . . . . . . . . . . . . . . . . . . . . . . . . . . . . . . . Ireland
IPC Underwriting Services Ltd. . . . . . . . . . . . . . . . . . . . . . . . . . . . . . . . . . . . . . . . . Bermuda
Validus Re Chile S.A. . . . . . . . . . . . . . . . . . . . . . . . . . . . . . . . . . . . . . . . . . . . . . . . . . 99% Chile
Underwriting Risk Services S.A. . . . . . . . . . . . . . . . . . . . . . . . . . . . . . . . . . . . . . . . . . 99% Chile
Validus Specialty, Inc. . . . . . . . . . . . . . . . . . . . . . . . . . . . . . . . . . . . . . . . . . . . . . . . . Delaware
Validus Reaseguros, Inc. . . . . . . . . . . . . . . . . . . . . . . . . . . . . . . . . . . . . . . . . . . . . . Florida
Validus Services, Inc. . . . . . . . . . . . . . . . . . . . . . . . . . . . . . . . . . . . . . . . . . . . . . . . Delaware
Underwriting Risk Services, Inc. . . . . . . . . . . . . . . . . . . . . . . . . . . . . . . . . . . . . . . . Delaware
Validus Research, Inc. . . . . . . . . . . . . . . . . . . . . . . . . . . . . . . . . . . . . . . . . . . . . . . . . . . Ontario
Validus America, Inc. . . . . . . . . . . . . . . . . . . . . . . . . . . . . . . . . . . . . . . . . . . . . . . . . . . . Delaware
Validus Ventures Ltd. . . . . . . . . . . . . . . . . . . . . . . . . . . . . . . . . . . . . . . . . . . . . . . . . . . . Bermuda
Validus Managers Ltd. . . . . . . . . . . . . . . . . . . . . . . . . . . . . . . . . . . . . . . . . . . . . . . . . Bermuda
AlphaCat High Return Fund Ltd. . . . . . . . . . . . . . . . . . . . . . . . . . . . . . . . . . . . . . . . BermudaAlphaCat Fund Ltd. . . . . . . . . . . . . . . . . . . . . . . . . . . . . . . . . . . . . . . . . . . . . . . . . Bermuda
AlphaCat Reinsurance Ltd. . . . . . . . . . . . . . . . . . . . . . . . . . . . . . . . . . . . . . . . . . Bermuda
AlphaCat Master Fund Ltd. . . . . . . . . . . . . . . . . . . . . . . . . . . . . . . . . . . . . . . . . . Bermuda
Talbot Holdings Ltd. . . . . . . . . . . . . . . . . . . . . . . . . . . . . . . . . . . . . . . . . . . . . . . . . . . . Bermuda
Talbot 2002 Underwriting Capital Ltd. . . . . . . . . . . . . . . . . . . . . . . . . . . . . . . . . . . . . UK
Talbot Insurance (Bermuda) Ltd. . . . . . . . . . . . . . . . . . . . . . . . . . . . . . . . . . . . . . . . . . Bermuda
Talbot Underwriting Holdings Ltd. . . . . . . . . . . . . . . . . . . . . . . . . . . . . . . . . . . . . . . . UK
Talbot Underwriting Ltd. . . . . . . . . . . . . . . . . . . . . . . . . . . . . . . . . . . . . . . . . . . . . . UK
Talbot Risk Services Pte Ltd. . . . . . . . . . . . . . . . . . . . . . . . . . . . . . . . . . . . . . . . . Singapore
Underwriting Risk Services (Middle East) Ltd. . . . . . . . . . . . . . . . . . . . . . . . . . . . 50% Dubai
Talbot Underwriting Services Ltd. . . . . . . . . . . . . . . . . . . . . . . . . . . . . . . . . . . . . . . UK
Underwriting Risk Services Ltd. . . . . . . . . . . . . . . . . . . . . . . . . . . . . . . . . . . . . . . . UK
Underwriting Risk Services Italia SRL . . . . . . . . . . . . . . . . . . . . . . . . . . . . . . . . . Italy

Exhibit 23
CONSENT OF INDEPENDENT REGISTERED PUBLIC ACCOUNTING FIRM
We hereby consent to the incorporation by reference in the Registration Statement on Form S-3(No. 333-152856) of Validus Holdings, Ltd. of our report dated February 18, 2011 relating to the financialstatements, financial statement schedules and the effectiveness of internal control over financial reporting, whichappears in this Form 10-K.
/s/ PricewaterhouseCoopers
PricewaterhouseCoopers
Hamilton, BermudaFebruary 18, 2011

Exhibit 31.1
CERTIFICATION OF CHIEF EXECUTIVE OFFICERVALIDUS HOLDINGS, LTD.
PURSUANT TO SECTION 302 OF THE SARBANES-OXLEY ACT OF 2002(Chapter 98, Title 15 U.S.C. SS. 7241)
I, Edward J. Noonan, certify that:
1. I have reviewed this Annual Report on Form 10-K of Validus Holdings, Ltd.;
2. Based on my knowledge, this report does not contain any untrue statement of a material fact or omit to statea material fact necessary to make the statements made, in light of the circumstances under which such statementswere made, not misleading with respect to the period covered by this report;
3. Based on my knowledge, the financial statements, and other financial information included in this report,fairly present in all material respects the financial condition, results of operations and cash flows of the registrant asof, and for, the periods presented in this report;
4. The registrant’s other certifying officer and I are responsible for establishing and maintaining disclosurecontrols and procedures (as defined in Exchange Act Rules 13a-15(e) and 15d-15(e)) and internal control overfinancial reporting (as defined in Exchange Act Rules 13a-15(f) and 15d-15(f)) for the registrant and have:
(a) Designed such disclosure controls and procedures, or caused such disclosure controls and proceduresto be designed under our supervision, to ensure that material information relating to the registrant, including itsconsolidated subsidiaries, is made known to us by others within those entities, particularly during the period inwhich this report is being prepared;
(b) Designed such internal control over financial reporting, or caused such internal control over financialreporting to be designed under our supervision, to provide reasonable assurance regarding the reliability offinancial reporting and the preparation of financial statements for external purposes in accordance withgenerally accepted accounting principles;
(c) Evaluated the effectiveness of the registrant’s disclosure controls and procedures and presented in thisreport our conclusions about the effectiveness of the disclosure controls and procedures, as of the end of theperiod covered by this report based on such evaluation; and
(d) Disclosed in this report any change in the registrant’s internal control over financial reporting thatoccurred during the registrant’s most recent fiscal quarter (the registrant’s fourth fiscal quarter in the case of anannual report) that has materially affected, or is reasonably likely to materially affect, the registrant’s internalcontrol over financial reporting; and
5. The registrant’s other certifying officer and I have disclosed, based on our most recent evaluation of internalcontrol over financial reporting, to the registrant’s auditors and the audit committee of the registrant’s Board ofDirectors (or persons performing the equivalent functions):
(a) All significant deficiencies and material weaknesses in the design or operation of internal controlover financial reporting which are reasonably likely to adversely affect the registrant’s ability to record,process, summarize and report financial information; and
(b) Any fraud, whether or not material, that involves management or other employees who have asignificant role in the registrant’s internal control over financial reporting.
/s/ Edward J. Noonan
Edward J. NoonanChief Executive Officer
Dated: February 18, 2011

Exhibit 31.2
CERTIFICATION OF CHIEF FINANCIAL OFFICERVALIDUS HOLDINGS, LTD.
PURSUANT TO SECTION 302 OF THE SARBANES-OXLEY ACT OF 2002(Chapter 98, Title 15 U.S.C. SS. 7241)
I, Joseph E. (Jeff) Consolino, certify that:
1. I have reviewed this Annual Report on Form 10-K of Validus Holdings, Ltd.;
2. Based on my knowledge, this report does not contain any untrue statement of a material fact or omit to statea material fact necessary to make the statements made, in light of the circumstances under which such statementswere made, not misleading with respect to the period covered by this report;
3. Based on my knowledge, the financial statements, and other financial information included in this report,fairly present in all material respects the financial condition, results of operations and cash flows of the registrant asof, and for, the periods presented in this report;
4. The registrant’s other certifying officer and I are responsible for establishing and maintaining disclosurecontrols and procedures (as defined in Exchange Act Rules 13a-15(e) and 15d-15(e)) and internal control overfinancial reporting (as defined in Exchange Act Rules 13a-15(f) and 15d-15(f)) for the registrant and have:
(a) Designed such disclosure controls and procedures, or caused such disclosure controls and proceduresto be designed under our supervision, to ensure that material information relating to the registrant, including itsconsolidated subsidiaries, is made known to us by others within those entities, particularly during the period inwhich this report is being prepared;
(b) Designed such internal control over financial reporting, or caused such internal control over financialreporting to be designed under our supervision, to provide reasonable assurance regarding the reliability offinancial reporting and the preparation of financial statements for external purposes in accordance withgenerally accepted accounting principles;
(c) Evaluated the effectiveness of the registrant’s disclosure controls and procedures and presented in thisreport our conclusions about the effectiveness of the disclosure controls and procedures, as of the end of theperiod covered by this report based on such evaluation; and
(d) Disclosed in this report any change in the registrant’s internal control over financial reporting thatoccurred during the registrant’s most recent fiscal quarter (the registrant’s fourth fiscal quarter in the case of anannual report) that has materially affected, or is reasonably likely to materially affect, the registrant’s internalcontrol over financial reporting; and
5. The registrant’s other certifying officer and I have disclosed, based on our most recent evaluation of internalcontrol over financial reporting, to the registrant’s auditors and the audit committee of the registrant’s Board ofDirectors (or persons performing the equivalent functions):
(a) All significant deficiencies and material weaknesses in the design or operation of internal controlover financial reporting which are reasonably likely to adversely affect the registrant’s ability to record,process, summarize and report financial information; and
(b) Any fraud, whether or not material, that involves management or other employees who have asignificant role in the registrant’s internal control over financial reporting.
/s/ Joseph E. (Jeff) Consolino
Joseph E. (Jeff) ConsolinoPresident and Chief Financial Officer
Dated: February 18, 2011
Exhibit 32
CERTIFICATION ACCOMPANYING FORM 10-K REPORTOF
VALIDUS HOLDINGS, LTD. PURSUANT TO SECTION 906 OF THESARBANES-OXLEY ACT OF 2002
(Chapter 63, Title 18 U.S.C. SS.SS. 1350(a) and (b))
Pursuant to Section 906 of the Sarbanes-Oxley Act of 2002 (Chapter 63, Title 18 U.S.C. §§ 1350(a) and (b)),each of the undersigned hereby certifies that the Annual Report on Form 10-K for the year ended December 31,2010 of Validus Holdings, Ltd. (the “Company”) fully complies with the requirements of Section 13(a) orSection 15(d) of the Securities Exchange Act of 1934 and that the information contained in such Report fairlypresents, in all material respects, the financial condition and results of operations of the Company.
/s/ EDWARD J. NOONAN
Edward J. NoonanChief Executive OfficerValidus Holdings, Ltd.
Dated: February 18, 2011
/s/ JOSEPH E. (JEFF) CONSOLINO
Joseph E. (Jeff) ConsolinoPresident and Chief Financial OfficerValidus Holdings, Ltd.
Dated: February 18, 2011
A signed original of this written statement required by Section 906, or other document authenticating,acknowledging, or otherwise adopting the signature that appears in typed form within the electronic version of thiswritten statement required by Section 906, has been provided to Validus Holdings, Ltd. and will be retained byValidus Holdings, Ltd. and furnished to the Securities and Exchange Commission or its staff upon request.

(This page intentionally left blank)

Annual Report 2010 Validus
Corporate Information

Directors and Officers
Board of Directors Edward J. Noonan Chairman Matthew J. Grayson Jeffrey W. Greenberg John J. Hendrickson Sander M. Levy Jean-Marie Nessi Mandakini Puri Alok Singh Christopher E. Watson
Senior management Edward J. Noonan Chief Executive Officer Joseph E. (Jeff) Consolino President & Chief Financial Officer C. N. Rupert Atkin Chief Executive Officer, Talbot Michael E. A. Carpenter Chairman, Talbot C. Jerome Dill Executive Vice President & General Counsel Stuart W. Mercer Executive Vice President Jonathan P. Ritz Executive Vice President,
Business Operations Julian G. Ross Executive Vice President
& Chief Risk Officer Conan M. Ward Chief Executive Officer,
Validus Reinsurance

Board Committees
Audit Committee John J. Hendrickson Chairman Jean-Marie Nessi Christopher E. Watson
Compensation Committee Sander M. Levy Chairman John J. Hendrickson Mandakini Puri Alok Singh
Corporate Governance Jean-Marie Nessi Chairman& Nominating Committee Sander M. Levy Mandakini Puri
Executive Committee Mandakini Puri Chairwoman Matthew J. Grayson Jeffrey W. Greenberg Edward J. Noonan
Finance Committee Matthew J. Grayson Chairman Sander M. Levy Edward J. Noonan Alok Singh
Risk Committee Christopher E. Watson Chairman Matthew J. Grayson John J. Hendrickson Sander M. Levy Jean-Marie Nessi Edward J. Noonan
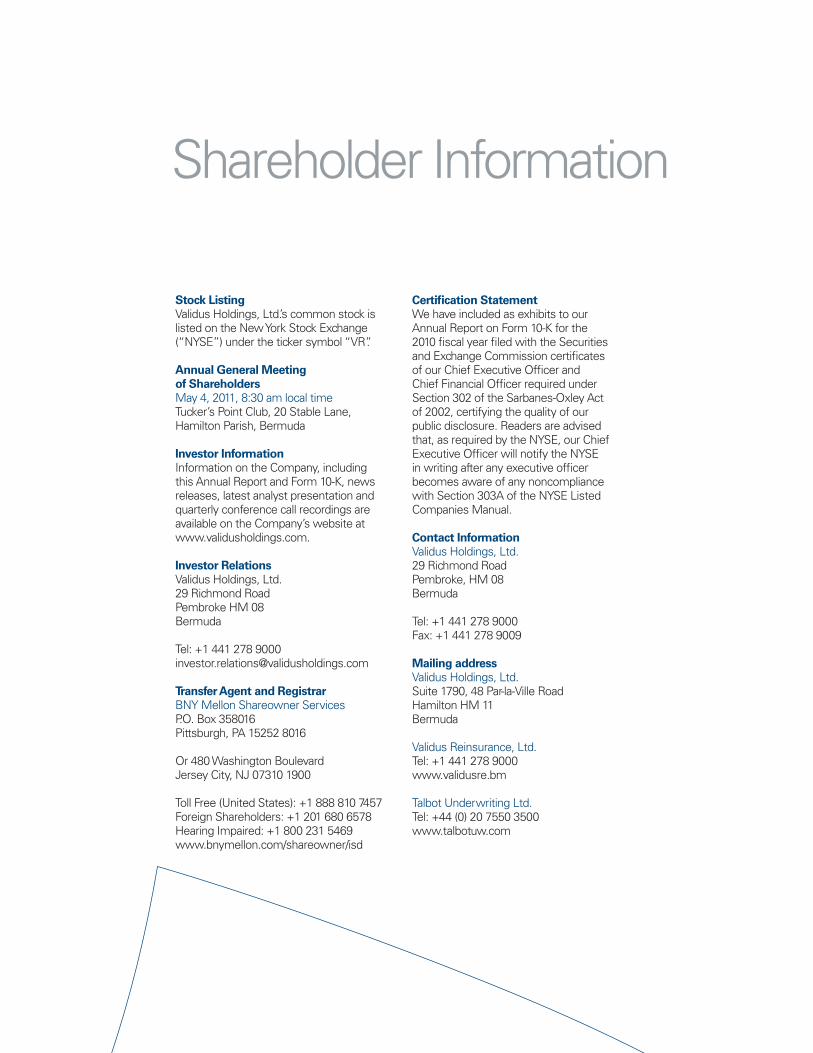
Shareholder Information
Stock ListingValidus Holdings, Ltd.’s common stock islisted on the New York Stock Exchange(“NYSE”) under the ticker symbol “VR”.
Annual General Meeting of ShareholdersMay 4, 2011, 8:30 am local timeTucker’s Point Club, 20 Stable Lane,Hamilton Parish, Bermuda
Investor InformationInformation on the Company, includingthis Annual Report and Form 10-K, newsreleases, latest analyst presentation andquarterly conference call recordings areavailable on the Company’s website atwww.validusholdings.com.
Investor RelationsValidus Holdings, Ltd.29 Richmond RoadPembroke HM 08Bermuda
Tel: +1 441 278 [email protected]
Transfer Agent and RegistrarBNY Mellon Shareowner ServicesP.O. Box 358016Pittsburgh, PA 15252 8016
Or 480 Washington BoulevardJersey City, NJ 07310 1900
Toll Free (United States): +1 888 810 7457Foreign Shareholders: +1 201 680 6578Hearing Impaired: +1 800 231 5469www.bnymellon.com/shareowner/isd
Certification StatementWe have included as exhibits to ourAnnual Report on Form 10-K for the2010 fiscal year filed with the Securitiesand Exchange Commission certificatesof our Chief Executive Officer andChief Financial Officer required underSection 302 of the Sarbanes-Oxley Actof 2002, certifying the quality of ourpublic disclosure. Readers are advisedthat, as required by the NYSE, our ChiefExecutive Officer will notify the NYSEin writing after any executive officerbecomes aware of any noncompliancewith Section 303A of the NYSE ListedCompanies Manual.
Contact InformationValidus Holdings, Ltd.29 Richmond RoadPembroke, HM 08Bermuda
Tel: +1 441 278 9000Fax: +1 441 278 9009
Mailing addressValidus Holdings, Ltd.Suite 1790, 48 Par-la-Ville RoadHamilton HM 11Bermuda
Validus Reinsurance, Ltd.Tel: +1 441 278 9000www.validusre.bm
Talbot Underwriting Ltd.Tel: +44 (0) 20 7550 3500www.talbotuw.com

Validus Group offers a broad range of innovative insurance and reinsurance solutions, with a particular emphasis on short-tail lines of business.
The paper in this report comprises of 100% (FSC) recycled fibres sourced entirely from post consumer waste.
Designed and produced by The College www.thecollege.uk.com

Annual Report 2010
Validus Holdings, Ltd. A
nnual Report 2010
www.validusholdings.com