Annual Report 2008 - Asian Development Bank
218
ANNUAL REPORT | FINANCIAL REPORT FINANCIAL REPORT
-
Upload
khangminh22 -
Category
Documents
-
view
1 -
download
0
Transcript of Annual Report 2008 - Asian Development Bank
ANNUAL REPORT
VOLUME 2||FINANCIAL REPORT FINANCIAL REPORT
About the Asian Development Bank
ADB’s vision is an Asia and Pacific region free of poverty. Its mission is to help its developing
member countries substantially reduce poverty and improve the quality of life of their people.
Despite the region’s many successes, it remains home to two thirds of the world’s poor:
1.8 billion people who live on less than $2 a day, with 903 million struggling on less than
$1.25 a day. ADB is committed to reducing poverty through inclusive economic growth,
environmentally sustainable growth, and regional integration.
Based in Manila, ADB is owned by 67 members, including 48 from the region. Its main
instruments for helping its developing member countries are policy dialogue, loans, equity
investments, guarantees, grants, and technical assistance.
© 2009 Asian Development Bank
Every effort has been made to ensure the accuracy of the data used in this publication. Variations in data in ADB publications often result from different publication dates, although differences may also come from source and interpretation of data. ADB accepts no responsibility from any consequence of their use.
The term “country,” as used in the context of ADB, refers to a member of ADB and does not imply any view on the part of ADB as to the member’s sovereignty or independent status.
In this publication, $ refers to US dollars.
ISSN 306-8370
Printed in the Philippines.
The ADB Annual Report 2008 comprises two separate volumes: Volume 1 is the main report and Volume 2 contains the financial statements and statistical annexes.

2008ANNUAL REPORT
VOLUME 2|FINANCIAL REPORT


FINANCIAL STATEMENTS AND REPORTS OF INDEPENDENT AUDITORS
I. MANAgEMENT’S DISCUSSION AND ANALySISOverview 6Ordinary Capital Resources 7Special Funds 24grant Cofinancing 30
II. ORDINARy CAPITAL RESOURCES (OCR) Management’s Report on Internal Control over Financial Reporting 33Report of Independent Auditors 34OCR-1 Balance Sheet, 31 December 2008 and 2007 36OCR-2 Statement of Income and Expenses for the years Ended 31 December 2008 and 2007 38OCR-3 Statement of Cash Flows for the years Ended 31 December 2008 and 2007 39OCR-4 Statement of Changes in Capital and Reserves for the years Ended 31 December 2008 and 2007 40OCR-5 Summary Statement of Loans, 31 December 2008 and 2007 42OCR-6 Summary Statement of Borrowings, 31 December 2008 and 2007 44OCR-7 Statement of Subscriptions to Capital Stock and Voting Power, 31 December 2008 46OCR-8 Notes to Financial Statements, 31 December 2008 and 2007 48
III. ASIAN DEVELOPMENT FUND (ADF) Management’s Report on Internal Control over Financial Reporting 71Report of Independent Auditors 72ADF-1 Special Purpose Statement of Assets, Liabilities and Fund Balances, 31 December 2008 and 2007 74ADF-2 Special Purpose Statement of Revenue and Expenses for the years Ended 31 December 2008 and 2007 75ADF-3 Special Purpose Statement of Cash Flows for the years Ended 31 December 2008 and 2007 76ADF-4 Special Purpose Statement of Changes in Fund Balances for the years Ended 31 December 2008 and 2007 77ADF-5 Special Purpose Summary Statement of Loans, 31 December 2008 and 2007 78ADF-6 Special Purpose Statement of Resources, 31 December 2008 80ADF-7 Notes to Special Purpose Financial Statements, 31 December 2008 and 2007 81
IV. TEChNICAL ASSISTANCE SPECIAL FUND (TASF) Management’s Report on Internal Control over Financial Reporting 89Report of Independent Auditors 90TASF-1 Statement of Financial Position, 31 December 2008 and 2007 92TASF-2 Statement of Activities and Changes in Net Assets for the years Ended 31 December 2008 and 2007 93TASF-3 Statement of Cash Flows for the years Ended 31 December 2008 and 2007 94TASF-4 Statement of Resources, 31 December 2008 95TASF-5 Summary Statement of Technical Assistance Approved and Effective for the year Ended 31 December 2008 96TASF-6 Notes to Financial Statements, 31 December 2008 and 2007 97
Contents
MD&A (CS4).indd 3 16/04/2009 5:12:01 PM

V. JAPAN SPECIAL FUND (JSF) Management’s Report on Internal Control over Financial Reporting 101Report of Independent Auditors 102JSF-1 Statement of Financial Position, 31 December 2008 and 2007 104JSF-2 Statement of Activities and Changes in Net Assets for the years Ended 31 December 2008 and 2007 105JSF-3 Statement of Cash Flows for the years Ended 31 December 2008 and 2007 106JSF-4 Notes to Financial Statements, 31 December 2008 and 2007 107
VI. ASIAN DEVELOPMENT BANk INSTITUTE SPECIAL FUND (ADBISF) Report of Independent Auditors 111ADBISF-1 Statement of Financial Position, 31 December 2008 and 2007 112ADBISF-2 Statement of Activities and Changes in Net Assets for the years Ended 31 December 2008 and 2007 113ADBISF-3 Statement of Cash Flows for the years Ended 31 December 2008 and 2007 114ADBISF-4 Notes to Financial Statements, 31 December 2008 and 2007 115
VII. ASIAN TSUNAMI FUND (ATF) Management’s Report on Internal Control over Financial Reporting 121Report of Independent Auditors 122ATF-1 Statement of Financial Position, 31 December 2008 and 2007 124ATF-2 Statement of Activities and Changes in Net Assets for the years Ended 31 December 2008 and 2007 125ATF-3 Statement of Cash Flows for the years Ended 31 December 2008 and 2007 126ATF-4 Notes to Financial Statements, 31 December 2008 and 2007 127
VIII. PAkISTAN EARThqUAkE FUND (PEF) Management’s Report on Internal Control over Financial Reporting 130Report of Independent Auditors 131PEF-1 Statement of Financial Position, 31 December 2008 and 2007 133PEF-2 Statement of Activities and Changes in Net Assets for the years Ended 31 December 2008 and 2007 134PEF-3 Statement of Cash Flows for the years Ended 31 December 2008 and 2007 135PEF-4 Notes to Financial Statements, 31 December 2008 and 2007 136 IX. REgIONAL COOPERATION AND INTEgRATION FUND (RCIF) Management’s Report on Internal Control over Financial Reporting 139Report of Independent Auditors 140RCIF-1 Statement of Financial Position, 31 December 2008 and 2007 142RCIF-2 Statement of Activities and Changes in Net Assets for the year Ended 31 December 2008 and for the Period 26 February to 31 December 2007 143RCIF-3 Statement of Cash Flows for the year Ended 31 December 2008 and for the Period 26 February to 31 December 2007 144RCIF-4 Notes to Financial Statements, 31 December 2008 and 2007 145 X. CLIMATE ChANgE FUND (CCF) Management’s Report on Internal Control over Financial Reporting 148Report of Independent Auditors 149CCF-1 Statement of Financial Position, 31 December 2008 151CCF-2 Statement of Activities and Changes in Net Assets for the Period 7 April to 31 December 2008 152CCF-3 Statement of Cash Flows for the Period 7 April to 31 December 2008 153CCF-4 Notes to Financial Statements, For the Period 7 April to 31 December 2008 154
MD&A (CS4).indd 4 16/04/2009 5:12:01 PM

STATISTICAL ANNEXES
1 Sovereign and Nonsovereign Loan Approvals by Country, 2008 1592 Grant-Financed Project Approvals by Country, 2008 1633 Loan Approvals by Sector: 3-Year Moving Averages, 1968-1970–2006-2008 1654 Loan Approvals by Sector, 2008 1665 Sectoral Distribution of Loans, 2008, 1967–2008 169
Sectoral Distribution of Grants, 2008, 1968–2008 1696 Loan and ADF Grant Approvals, by Country and Source of Funds, 2008 1707 Projects Involving Cofinancing, 2008 1718 Loan Disbursements, 2007 and 2008 1749a Program Loan Disbursements, 2008 1749b Trends in Program Lending and Grant, 1998–2008 17510 Nonsovereign Approvals and Total Project Costs by Country, 2008 17511 Nonsovereign Approvals and Total Project Costs by Sector, 2008 17612 Nonsovereign Approvals by Year, 1983–2008 17613 Nonsovereign Approvals by Country, 1983–2008 17714 Number of Loans and Projects Approved and Under Administration,
Project Completion Reports (PCRs) Circulated, Projects Completed, Loans Closed, and Project/Program Performance Evaluation Reports (PPERs) Circulated 178
15 Amount of Loans Approved, Contracts Awarded, and Disbursements 18016 Technical Assistance Grant Approvals by Country and Regional Activities, 1967–2008, 2007, 2008 18217 Technical Assistance Grant Approvals, 2008 18418 Technical Assistance Grant Approvals by Sector, 1967–2008, 2007, 2008 19319 Consulting Services Financed Through Loans by Sector, 2008 19320 Regional Technical Assistance Activities, 2008 19421 Net Transfer of Resources (Ordinary Capital Resources and
Asian Development Fund), 2006–2008 19922 Net Transfer of Resources (Ordinary Capital Resources and
Asian Development Fund), 1999–2008 20023 Asian Development Fund Resources and Commitment Authority 20124 Technical Assistance Special Fund 20225 Japan Special Fund—Regular and Supplementary Contributions 20326 Japan Special Fund—Asian Currency Crisis Support Facility 20327 Japan Fund for Poverty Reduction, 2008 20428 Projects with ADB-Administered Grant Financing, 2007 Approvals 20529 Contracts Awarded by Country of Origin, 2008:
Project Loans—Ordinary Capital Resources 20930 Contracts Awarded by Country of Origin, 2008:
Project Loans—Asian Development Fund 21031 Contracts Awarded by Country of Origin, 2008:
Project Loans—Ordinary Capital Resources and Asian Development Fund Combined 21132 Estimates of Payment to Supplying Countries for Foreign Procurement
Under Program Lending, 2008 21233 Cumulative Contracts Awarded, By Country of Origin:
Technical Assistance Operations 21334 Contracts Awarded by Country of Origin, 2006–2008 214

MA
NA
GEM
ENT’
S D
ISC
USS
ION
AN
D A
NA
LYSI
SAsian Development Bank6
MANAGEMENT’S DISCUSSION AND ANALYSISThe Asian Development Bank (ADB) is an international development financial institution whose vision is to make Asia and the Pacific free of poverty. ADB was established in 1966 through the Agreement Establishing the Asian Development Bank (the Charter), ratified by 31 countries to promote the social and economic development of the region and reduce poverty. As of 31 December 2008, ADB had 67 members, 48 of which are in the region.

MA
NA
GEM
ENT’S D
ISCU
SSION
AN
D A
NA
LYSIS7Annual Report 2008
ADB provides various forms of financial assistance to its
developing member countries. The main instruments are
loans, technical assistance, grants, guarantees, and equity
investments. These instruments are financed through or-
dinary capital resources (OCR), Special Funds, and various
trust funds. OCR and Special Funds are used to finance op-
erations that are solely under ADB administration. Trust
funds are externally funded and are administered by ADB
on behalf of donors. The Charter requires that funds from
each resource be kept separate from the others.
ADB also provides policy dialogues and advisory ser-
vices and mobilizes financial resources through its co-
financing operations tapping official, commercial, and
export credit sources to maximize the development im-
pact of its assistance. Cofinancing for ADB projects can be
in the form of external loans, grants for technical assistance
and components of loan projects, and credit enhancement
products such as guarantees and syndications.
ORDINARY CAPITAL RESOURCES
Funding for OCR operations comes from three distinct
sources: funds borrowed from private placements and cap-
ital markets, paid-in capital provided by shareholders, and
accumulated retained income (reserves). The financial
strength of OCR is largely based on the support of share-
holders and on financial policies and practices. Share-
holder support is reflected in the form of capital backing
from members and in the record of borrowing members in
meeting their debt service obligations.
Borrowed funds, together with equity, are used to
fund OCR lending and investment activities as well as
other general operations. Loans are generally made to de-
veloping member countries that have attained a higher
level of economic development and to private and other
nonsovereign borrowers. Sovereign loans are priced on a
cost pass-through basis in which the cost of funding the
loans plus a lending spread is passed through to the bor-
rowers. Nonsovereign loans are priced based on market
practice.
In addition to direct lending, ADB also provides guar-
antees to assist governments of developing member coun-
tries and nonsovereign borrowers secure commercial funds
for ADB-assisted projects. ADB experienced a strong and
growing demand for guarantees as credit enhancement
products.
Basis of Financial Reporting
Statutory Reporting. ADB prepares its financial statements
in accordance with accounting principles generally ac-
cepted in the United States of America. Table 1 presents
selected financial data for 2008.
ADB manages its balance sheet by selectively us-
ing derivatives to minimize the interest rate and curren-
cy risks associated with its financial assets and liabilities.
Derivative instruments are used to enhance asset and li-
ability management of individual positions and overall
portfolios, and to reduce borrowing costs.
Financial instruments including all derivatives,
structured and swapped borrowings, and marketable in-
vestments are recorded at their fair value while loans and
unswapped borrowings are recorded at carrying book val-
ue. Non-marketable equity investments are valued either
at cost less any permanent impairment, or using the eq-
uity method.
ADB complies with Financial Accounting Standards
(FAS) No. 133, “Accounting for Derivative Instruments
and Hedging Activities,” along with its related amend-
ments (collectively referred to as “FAS 133”), including
FAS 155 (Accounting for Certain Hybrid Financial Instru-
ments, an amendment to FAS 133 and 140). Effective 1
January 2008, ADB also adopted FAS 157, “Fair Value
Measurements,” and FAS 159, “The Fair Value Option
for Financial Assets and Financial Liabilities (including
an amendment of Financial Accounting Standards Board
Statement No. 115).”
FAS 133 establishes accounting and reporting stan-
dards for derivative instruments, including certain deriv-
ative instruments embedded in other contracts (collectively
referred to as derivatives), and for hedging activities. It
requires that an entity recognize all derivatives as either
assets or liabilities in the statement of financial position
and measure those instruments at fair value. FAS 133 al-
lows hedge accounting only if certain qualifying criteria are
met. An assessment of those criteria indicated that most of
ADB’s derivative transactions are highly effective in hedg-
ing the underlying transactions and are appropriate for re-
ducing funding costs. Compliance with hedge accounting
requirements will impose undue constraints on future bor-
rowings, loans, and hedge programs and will likely detract
ADB’s efforts to effectively and efficiently minimize the
funding costs for its borrowing member countries. Accord-

MA
NA
GEM
ENT’
S D
ISC
USS
ION
AN
D A
NA
LYSI
SAsian Development Bank8
TABLE 1: Selected Financial Data(31 December, amounts in $ Million)
Statutory Basis
2008 2007 2006 2005 2004
Revenue and Expenses
From Loan 1,358.0 1,442.3 1,210.1 1,036.3 1,038.3
From Investments 677.2 683.2 564.5 377.4 265.6
From Guarantees 6.9 5.1 4.1 4.1 3.5
From Equity Investments 3.7 58.9 41.5 3.3 (0.7)
From Other Sources 18.7 18.8 18.7 11.3 6.4
Total Revenue 2,064.5 2,208.3 1,838.9 1,432.4 1,313.1
Borrowings and Related Expenses 1,208.4 1,389.8 1,116.3 893.2 861.7
Administrative Expensesa 141.0 127.3 127.7 135.7 118.3
Technical Assistance to Member Countries 8.4 (0.7) (1.2) (3.4) (2.4)
Provision for Losses (3.5) (0.6) (32.5) (3.5) 2.2
Other Expenses 6.3 4.0 3.7 4.2 3.1
Total Expenses 1,360.6 1,519.8 1,214.0 1,026.2 982.9
Net Realized (Losses) Gains (28.1) 22.9 80.6 16.9 59.4
Net Unrealized Gains (Losses) 450.6 53.8 (135.4) (309.2) 41.0
Cumulative Effect of Change in Accounting Principle – – – (4.6) –
Net Income 1,126.3 765.2 570.1 109.3 430.6
Average Earning Assetsb 50,394 42,780 37,904 36,092 36,364
Annual Return on Average Earning Assets 2.24% 1.79% 1.50% 0.30% 1.18%
Return on Loans 3.84% 5.00% 4.98% 4.35% 4.16%
Return on Investments 3.20% 4.68% 4.18% 2.96% 2.21%
Cost of Borrowings 4.11% 4.32% 4.81% 5.04% 3.37%
Pre-FAS 133/159d Basis
Net Income 699.7 711.4 705.5 415.6 389.6
Average Earning Assetsb 50,443 42,757 37,859 36,076 36,306
Annual Return on Average Earning Assetsc 1.39% 1.66% 1.86% 1.15% 1.07%
Return on Loans 4.14% 5.14% 4.94% 4.35% 4.16%
Return on Investments 3.70% 4.72% 4.27% 2.99% 2.34%
Cost of Borrowings 3.29% 4.68% 4.31% 3.75% 3.58%
Current Value Basis
Net Income 101.9 1,159.0 544.1 93.7 562.8
Average Earning Assetsb 51,575 43,726 39,130 37,948 39,391
Annual Return on Average Earning Assets 0.20% 2.65% 1.31% 0.23% 1.47%
Return on Loans 9.18% 6.40% 2.58% (1.18%) 4.25%
Return on Investments 3.51% 7.77% 5.48% (1.11%) 3.51%
Cost of Borrowings 7.17% 5.32% 3.51% (1.34%) 3.56%
( ) = negative, FAS = Financial Accounting Standards.
a Net of administration expenses allocated to the Asian Development Fund and loan origination costs that are deferred.b Composed of investments and related swaps, outstanding loans (excluding net unamortized loan origination cost/front-end fees) and related swaps and equity investments.c Represents net income before net unrealized gains/losses on derivatives, over average earning assets.
d FAS 159 is applicable to 2008 only.
ingly, ADB elects not to adopt hedge accounting and re-
ports all derivative instruments on the balance sheet at fair
value while recognizing changes in the fair value of deriva-
tive instruments for the year as part of net income.
FAS 155 allows fair value measurement for hybrid fi-
nancial instruments that contain embedded features that
would otherwise be required to be treated as a separate
derivative instrument (bifurcated) in the reported finan-

MA
NA
GEM
ENT’S D
ISCU
SSION
AN
D A
NA
LYSIS9Annual Report 2008
TABLE 2: Condensed Current Value Balance Sheets as at 31 December 2008 and 2007($ Thousand)
31 December 200831 December
2007
Statutory Basis
Reversal of FAS 133/159
EffectsaPre–FAS
133/159 BasisCurrent Value Adjustments
Current Value Basis
Current Value Basis
Due from banks $ 142,238 $ – $ 142,238 $ – $ 142,238 $ 108,821
Investments and accrued income 15,544,399 – 15,544,399 – 15,544,399 13,440,728
Securities transferred under
repurchase agreement 309,358 – 309,358 – 309,358 5,041,387
Securities purchased under
resale arrangement 511,756 – 511,756 – 511,756 427,132
Loans outstanding and accrued interest 36,150,156 (451) 36,149,705 1,622,166 37,771,871 31,434,283
Provision for loan losses and unamortizednet loan origination costs 59,088 – 59,088 – 59,088 27,087
Equity investment 641,427 (6,060) 635,367 6,060 641,427 808,157
Receivable from members 144,514 – 144,514 (50,790) 93,724 105,027
Receivable from swaps
Borrowings 23,831,087 (2,237,329) 21,593,758 2,237,329 23,831,087 17,968,867
Others 882,793 (163,125) 719,668 163,125 882,793 512,089
Other assets 504,936 – 504,936 – 504,936 463,793
TOTAL $ 78,721,752 $ (2,406,965) $ 76,314,787 $ 3,977,890 $ 80,292,677 $ 70,337,371
Borrowings and accrued interest $ 36,026,446 $ 5,912 $ 36,032,358 $ 1,816,481 $ 37,848,839 $ 32,023,669
Payable for swaps
Borrowings 24,867,815 (1,347,193) 23,520,622 1,347,193 24,867,815 16,936,964
Others 1,198,781 (361,357) 837,424 361,357 1,198,781 583,320
Payable under securities
repurchase arrangement 301,759 – 301,759 – 301,759 5,092,316
Accounts payable and other liabilities 1,057,481 – 1,057,481 – 1,057,481 722,402
Total Liabilities 63,452,282 (1,702,638) 61,749,644 3,525,031 65,274,675 55,358,671
Paid-in capital 3,777,071 – 3,777,071 – 3,777,071 3,842,293
Net notional maintenance of value
receivable (564,383) – (564,383) – (564,383) (661,197)
Ordinary reserve 9,532,487 1,194 9,533,681 877,280 10,410,961 9,642,454
Special reserve 209,723 – 209,723 – 209,723 202,847
Loan loss reserve 195,062 – 195,062 – 195,062 182,100
Surplus 894,594 – 894,594 – 894,594 616,300
Cumulative revaluation adjustments account (23,336) 23,336 – – – –
Net incomeb — 31 December 2008 1,119,473 (426,647) 692,826 (597,852) 94,974 –
Net incomeb — 31 December 2007 227,500c (227,500) – – – 1,153,903
Accumulated other comprehensive income (98,721) (74,710) (173,431) 173,431 – –
Total Equity 15,269,470 (704,327) 14,565,143 452,859 15,018,002 14,978,700
TOTAL $ 78,721,752 $ (2,406,965) $ 76,314,787 $ 3,977,890 $ 80,292,677 $ 70,337,371
( ) = negative, FAS = Financial Accounting Standards. a Includes reversal of unrealized (gains) losses attributed to equity investments accounted for under equity method. b Net income after appropriation of guarantee fees to Special Reserve. c Cumulative effect of FAS 157/159 adoption to prior years’ net income.

MA
NA
GEM
ENT’
S D
ISC
USS
ION
AN
D A
NA
LYSI
SAsian Development Bank10
cial statements under FAS 133. As of 31 December 2008,
ADB holds a relatively small portion of hybrid financial in-
struments in its borrowing portfolio.
FAS 159 expands the scope of financial assets and liabili-
ties that companies may carry at fair value. Effective 1 January
2008, ADB utilized this election to fair value all non-hybrid
borrowings that are swapped. As a result of this election, all
borrowings that are swapped and their related derivatives are
reported at fair value, with changes in fair value reported in
earnings. However, ADB still reports all of its loans and those
borrowings that are not swapped at amortized cost.
FAS 157 defines fair value, establishes a framework
for measuring fair value, and expands disclosure require-
ments about fair value measurements. In compliance with
this standard, and in conjunction with the FAS 159 elec-
tion above, ADB incorporated its credit risk (as a credit
spread) in fair valuing its liabilities. The combined effect
of the adoption of FAS 157 and 159 was to increase the
opening balance of retained income as at 1 January 2008
by $227.5 million.
In March 2008, the Financial Accounting Standards
Board (FASB) issued FAS 161 “Disclosures about Deriva-
tive Instruments and Hedging Activities—an amendment
of FASB Statement No. 133,” which requires enhanced
disclosures about an entity’s derivative and hedging ac-
tivities and thereby improve the transparency of financial
reporting. This statement is effective for financial state-
ments issued for fiscal years and interim periods begin-
ning after 15 November 2008.
Supplemental Reporting. Because of the asymmetry creat-
ed in the financial statements resulting from applying fair
value to the derivatives and swapped borrowings, while
loans are carried at amortized cost less provision, man-
agement believes that the reported income does not ap-
propriately capture the true economic income of ADB.
Therefore, ADB has decided to continue issuing two non-
US GAAP supplemental financial reports using current
value and pre-FAS 133/159 to better reflect its financial
position and risk management. Applications of consistent
approaches on these statements allow better analysis for
management information and decision making.
For current value reporting all financial instruments
are measured using a model based on the present value of
expected cash flow. The model utilizes market data to de-
termine the cash flow and discount rates for each instru-
ment. Under pre-FAS 133/159, loans, promissory notes,
swapped borrowings, and all derivative instruments are
reported at cost.
Discussion and Analysis on Current Value
Table 2 presents estimates of the economic value of OCR’s
financial assets and liabilities taking into consideration
changes in interest rates, exchange rates, and credit risks.
Current value reflects the exit price for financial instru-
ments with liquid markets and is the estimated fair value.
For financial instruments with no market quotations, cur-
rent value is estimated by discounting the expected cash
flows by applying the appropriate market data. The cur-
rent value results may differ from the actual net realizable
value in the event of liquidation. The reversal of the ef-
fects of FAS 133/159 removes its impact, as these effects
are part of current value adjustments (Tables 3 and 4).
Current Value Balance Sheet
Loans and Related Swaps. Most loans are made to or guaran-
teed by ADB members. ADB does not sell its loans believ-
ing that there is no market for them. The current value
of loans incorporates management’s best estimate of ex-
pected cash flows including interest. Estimated cash flows
from principal repayments and interest are discounted by
the applicable market yield curves for ADB’s funding cost
plus lending spread.
The current value also includes an appropriate credit
risk assessment. To recognize this inherent risk and oth-
er potential overdue payments, the loan value is adjusted
through loan loss provisioning. ADB has never suffered a loss
on sovereign loans except opportunity losses resulting from
the difference between payments for interest and charges
not in accordance with the loan’s contractual terms.
The positive adjustment of $1.5 billion indicates that
the average interest rates on loans on an after-swap basis are
higher than ADB would currently originate on similar loans.
Investments and Related Swaps. Under both the statutory
and current value bases, investment securities and relat-
ed derivatives are reported at fair values based on market
quotations when available. Otherwise, the current value is
calculated using market-based valuation models incorporat-
ing observable market data. The net negative adjustment of
$68.8 million resulted from unrealized losses on asset
swaps due to declining interest rates in related markets.

MA
NA
GEM
ENT’S D
ISCU
SSION
AN
D A
NA
LYSIS11Annual Report 2008
TABLE 3: Condensed Current Value Income Statements for the Years Ended 31 December 2008 and 2007($ Thousand)
31 December 200831 December
2007
Statutory Basis
Reversal of FAS 133/159
Effectsa
Pre–FAS 133/159
BasisCurrent Value Adjustments
Current Value Basis
Current Value Basis
REVENUE
From loans $ 1,357,981 $ – $ 1,357,981 $ – $ 1,357,981 $ 1,442,338
From investments 677,175 – 677,175 – 677,175 683,212
From guarantees 6,876 – 6,876 – 6,876 5,049
From equity investments 3,737 24,055 27,792 (24,055) 3,737 58,897
From other sources - net 18,685 – 18,685 – 18,685 18,835
Total Revenue 2,064,454 24,055 2,088,509 (24,055) 2,064,454 2,208,331
EXPENSES
Borrowings and related expenses 1,208,391 – 1,208,391 – 1,208,391 1,389,778
Administrative expenses 141,047 – 141,047 – 141,047 127,327
Technical assistance to member countries 8,357 – 8,357 – 8,357 (683)
Provision for losses (3,467) – (3,467) 3,467 – –
Other expenses 6,272 – 6,272 – 6,272 3,998
Total Expenses 1,360,600 – 1,360,600 3,467 1,364,067 1,520,420
Net realized gains (28,096) – (28,096) – (28,096) 22,905
Net unrealized gains 450,591 (450,702)b (111) 24,055 23,944 14
Current value adjustmentsc – – – (597,852) (597,852) 447,543
Provision for losses – – – 3,467 3,467 579
NET INCOME $ 1,126,349 $ (426,647) $ 699,702 $ (597,852) $ 101,850 $ 1,158,952
( ) = negative, FAS = Financial Accounting Standards.a Includes reversal of unrealized (gains) losses attributed to equity investments accounted for under equity method.b FAS 133/159 adjustments are reversed as the current value adjustments incorporate the effect of net unrealized losses on derivatives and swapped borrowings under FAS 133 and FAS 159.c Current value adjustments include the effect of FAS 133/159 adjustments and the net unrealized losses on equity investments accounted for under equity method.
Equity Investments. Under both statutory and current value
bases, equity investments are reported at fair value when
market values are readily determinable; by applying equi-
ty method for investments in limited partnership and cer-
tain limited liability companies, or for investments where
ADB has the ability to exercise significant influence; or at
cost less permanent impairment, if any, which represents
a fair approximation of the current value.
Receivable from Members. This consists of promissory notes
that may be restricted by member countries. The current
value is based on the cash flow of the projected encash-
ment of the promissory notes discounted using appropri-
ate interest rates.
Borrowings after Swaps. The current value of these liabili-
ties includes the fair value of the borrowings and asso-
ciated financial derivative instruments, and is calculated
using market-based valuation models incorporating ob-
servable market data.
The $926.3 million unfavorable current value adjust-
ment is due to the fact that the average cost of the borrow-
ings on an after-swap basis is higher than the market rate
at which ADB can currently obtain new funding.
Current Value Income Statement
For 2008, the current value net income is $101.9 million
compared with pre-FAS 133/159 net income of $699.7 mil-
lion and statutory reported net income of $1,126.3 mil-
lion (Table 3).
Current Value Adjustments. The total current value adjust-
ment of $597.9 million ($447.5 million in 2007) represents
the change in the current value of all ADB financial instru-
ments during the year. The adjustment reflects changes

MA
NA
GEM
ENT’
S D
ISC
USS
ION
AN
D A
NA
LYSI
SAsian Development Bank12
in interest rates, currency exchange rates, and credit risks.
This comprised a net unfavorable adjustment of $257.6
million from the change in the valuation of all outstand-
ing financial instruments, $107.6 million from translation
adjustments, and $259.8 million adjustment in pension
and postretirement benefit liability, offset by $27.2 mil-
lion net unrealized gains on investments ($251.3 million
gain for investments; $224.1 million loss for equity invest-
ments) (Table 4).
Impact of Changes in Interest Rates. The net decrease in
the current value adjustments on the balance sheet dur-
ing 2008 was $257.6 million. It was a result of the increase
in unrealized losses in the borrowing portfolio of $831.1
million, unfavorable results for investments of $89.5 mil-
lion and equity investments of $24.1 million, offset by in-
crease in unrealized gains for loans of $668.1 million, and
decrease in unrealized losses on other assets of $19.0 mil-
lion.
Impact of Changes in Exchange Rates. Translation adjust-
ments, reported under the statutory basis as part of “accu-
mulated other comprehensive income”, are presented as
current value adjustments. The general strengthening of
the US dollar against most of the major currencies in 2008
resulted in a negative translation adjustment of $107.6
million compared to a favorable adjustment of $126.8 mil-
lion in 2007.
Operating Activities
In pursuing its objectives, ADB provides financial assis-
tance through loans, technical assistance, guarantees, and
equity investments to its developing member countries
to help them meet their development needs. This as-
sistance can be provided to sovereign and nonsovereign
entities. ADB also actively promotes cofinancing of its de-
velopment projects and programs to complement its own
assistance with funds from both official and commercial
sources including export credit agencies.
Loans. Until 30 June 2001, ADB’s three windows for loans
from OCR were the pool-based multicurrency loan, the
pool-based single-currency loan in US dollars, and the
market-based loan. With the introduction of the LIBOR-
based loan on 1 July 2001, the pool-based multicurrency
loan and market-based loan are no longer offered, and on 1
July 2002, the pool-based single-currency loan in US dol-
lars was retired. Effective January 2004, the pool-based
multi currency loans were transformed into pool-based
single currency loans in Japanese yen. The LIBOR-based
loan is a timely response to borrowers’ demand for loan
products that suit project needs and effectively manage
their external debt. LIBOR-based loan products give bor-
rowers a high degree of flexibility in managing interest
rate and exchange rate risks and at the same time provide
low intermediation risk to ADB. Since November 2002,
TABLE 4: Summary of Current Value Adjustments($ Thousand)
Balance Sheet Effects as of 31 December 2008Income Statement Effects
Year to Date
Loans After Swaps Investmentsa
Borrowings After
SwapsOther
Assetsb
Less Prior Year
Effectsc31 December
200831 December
2007
Total Current Value Adjustments on Balance Sheet $ 1,492,746 $ (62,752) $ (926,345) $ (50,790) $ (710,483) $ (257,624) $ 148,078
Unrealized Gains on Investmentsd 27,224e 232,792
Accumulated Translation Adjustments (107,617)f 126,844
Pension and Post Retirement Benefit Liability Adjustments (259,835) (60,171)
Total Current Value Adjustments $ (597,852) $ 447,543
( ) = negative, FAS = Financial Accounting Standards.a Relates to investments related swaps and equity investments under equity method.b Relates to receivable from members.c Prior Year Effects include cumulative current value adjustments on all financial instruments and equity investments accounted for under equity method, made in the prior years.d Relates to unrealized gains on investments and equity investments classified as available for sale.e Included in Other Comprehensive Income under statutory basis.f Relates to the translation adjustments for the period and current translation effects from FAS 133/159 reversals.

MA
NA
GEM
ENT’S D
ISCU
SSION
AN
D A
NA
LYSIS13Annual Report 2008
ADB has been offering local currency loans to nonsover-
eign borrowers and expanded this to sovereign borrowers
in August 2005.
Loan Approvals, Disbursements, Repayments, and Prepay-ments. In 2008, the Board of Directors approved 46 sover-
eign loans totaling $6.9 billion, and 15 nonsovereign loans
totaling $1.8 billion, compared with 2007 approvals of 38
sovereign loans totaling $7.3 billion and 22 nonsovereign
loans totaling $0.9 billion. Disbursements in 2008 totaled
$6.5 billion ($5.9 billion for sovereign loans and $0.6 bil-
lion for nonsovereign loans) representing an increase of
25% from the $5.2 billion disbursements in 2007. Regular
principal repayments for the year were $1.6 billion ($1.4
billion in 2007) while prepayments amounted to $0.3 bil-
lion ($0.1 billion in 2007). In 2008, eight loans were fully
prepaid. As of 31 December 2008, the total loans out-
standing after provision for losses and net unamortized
loan origination cost amounted to $35.9 billion, of which
$34.2 billion is for sovereign loans and $1.7 billion is for
nonsovereign loans.
In 2005, ADB established the multitranche financing
facility, a debt financing facility that allows ADB to deliver
financial resources for a specific program or investment in
a series of separate financing tranches over a fixed period.
Financing tranches may be provided as loans, guarantees,
equity or any combination of these instruments based on
periodic financing requests submitted by the borrower.
In 2008, six multitranche financing facilities totaling $4.3
billion (seven multitranche financing facilities totaling
$4.0 billion in 2007), were approved under OCR. Periodic
financing requests under multitranche financing facilities
amounting to $1.8 billion were approved in 2008 ($2.0 bil-
lion in 2007).
Starting September 2005, ADB provided lending
without sovereign guarantee to entities that can be consid-
ered public sector borrowers but are structurally separate
from the sovereign or central government. Such entities
include state-owned enterprises, government agencies,
municipalities, and local government units. In 2008, two
loans to state-owned enterprises without sovereign guar-
antee totaling $300 million were approved (one loan for
$10 million in 2007).
Status of Loans. One nonsovereign loan with an outstand-
ing principal balance of $1.7 million (four loans totaling
$16.5 million in 2007) was in non-accrual status as of 31
December 2008. The $14.8 million decline is mainly at-
tributed to the sale or restructuring of three loans, which
were in nonaccrual status.
One sovereign loan was restored to accrual status in
May 2008, following full settlement of overdue principal
and interest.
Loan Charges on Sovereign Loans. LIBOR-based loans carry
a floating lending rate that consists of 6-month LIBOR
and an effective contractual spread fixed over the life of
the loan. The lending rate is reset every 6 months on each
interest reset date and can be converted to fixed rate at
borrower’s request. The lending rates for pool-based sin-
gle-currency loans are based on the previous semester’s av-
erage cost of borrowings. Interest rates for market-based
loans are either fixed or floating. The floating rates are
determined based on 6-month LIBOR with reset dates of
either 15 March and 15 September or 15 June and 15 De-
cember. Effective 2000, all sovereign loans without spe-
cific provisions in the loan agreements were charged with
lending spread of 60 basis points over the base lending
rate. In 2004, 20 basis points of the lending spread were
waived on sovereign loans outstanding from 1 July 2004 to
30 June 2005 for borrowers that did not have loans in ar-
rears. Subsequently, the policy was extended to cover the
period up to June 2009. In December 2007, the Board of
Directors revised the lending rates for all sovereign LI-
BOR-based loans negotiated on or after 1 October 2007
by reducing the effective contractual spread to 20 basis
points over the base lending rate and eliminating the waiv-
er mechanism for such loans.
ADB’s variable lending rates for pool-based single-
currency loans in US dollars and in Japanese yen are shown
below.
Table 5: Lending Ratesa
(% per annum)
2008 2007 PSCLs
1 January 1.90 1.31 Japanese yen 6.12 5.91 US dollar
1 July 1.98 1.69 Japanese yen 5.64 6.34 US dollar
PSCL = Pool-based single-currency loan.a Lending rates are set on 1 January and 1 July every year and are valid for 6 months and
are represented net of 20 basis points lending spread waiver.

MA
NA
GEM
ENT’
S D
ISC
USS
ION
AN
D A
NA
LYSI
SAsian Development Bank14
ADB also charges a front-end fee of 1% on sovereign
loans to cover the administrative costs incurred in loan
origination. In 2004, the Board of Governors approved
the waiver of the entire front-end fee on all new sover-
eign loans approved from 1 January 2004 to 30 June 2005.
Subsequently, the policy was extended to cover the pe-
riod up to June 2009. In December 2007, the Board of
Directors approved the elimination of front-end fees for
sovereign LIBOR-based loans negotiated on or after 1
October 2007.
ADB applied a progressive commitment fee of 75 ba-
sis points on undisbursed loan balances for sovereign proj-
ect loans and a flat commitment fee of 75 basis points for
sovereign program loans. In October 2006, as part of the
enhancement of ADB’s loan and debt management prod-
ucts, all sovereign project loans negotiated after 1 Janu-
ary 2007 carried a flat commitment fee of 35 basis points
on the full amount of undisbursed loan balances. In April
2007, the Board also approved the waiver of 10 basis points
of the commitment charge on the undisbursed balances
of sovereign project loans negotiated after 1 January 2007
and 50 basis points of the commitment charge on the un-
disbursed balances of sovereign program loans. The waiver
is applicable to all interest periods starting from 1 Janu-
ary 2007 up to and including 30 June 2009. In December
2007, the Board of Directors approved the reduction of
the commitment charge from 75 basis points for sover-
eign program loans and 35 basis points for sovereign proj-
ect loans to 15 basis points for both sovereign program and
project loans negotiated on or after 1 October 2007, and
eliminated the waiver mechanism for such loans.
Rebates and surcharges are standard features of sov-
ereign LIBOR-based loans. To maintain the principle of
cost pass-through pricing, ADB returns the actual sub-LI-
BOR funding cost margin to its LIBOR-based loans sov-
ereign borrowers through rebates. A surcharge could arise
if ADB’s funding cost exceeds the 6-month LIBOR. Re-
bate or surcharge rates are set on 1 January and 1 July ev-
ery year and are based on the actual average funding cost
margin for the preceding 6 months. Effective 1 July 2007,
rebates or surcharges are passed on to the borrowers by in-
corporating them into the interest rate for the succeeding
interest period, rather than retroactively. Based on rebate
rates, ADB returned an actual sub-LIBOR funding cost
margin of $81.1 million to its LIBOR-based loan sovereign
borrowers in 2008 ($38.1 million in 2007).
Loan Charges on Nonsovereign Loans. For nonsovereign
loans, the lending spread is determined based on mar-
ket practices, which is intended to cover ADB’s risk expo-
sure to specific borrowers and projects. ADB also charges a
market-based front-end fee on nonsovereign loans to cov-
er the administrative costs incurred in loan origination.
Front-end fees are typically in the range of 1% to 1.5% de-
pending on the transaction. Based on the LIBOR-based
lending policy, ADB applies a commitment fee typically
in the range of 0.50% to 0.75% per annum on the undis-
bursed commitment.
Local currency loans are priced based on relevant lo-
cal funding benchmarks or ADB’s funding costs and a risk-
based spread.
Official Cofinancing for Loans. In 2008, $837.6 million from
official sources was mobilized in loan cofinancing with par-
tial administration by ADB for four loan projects totaling
$752.4 million.
Technical Assistance. From 1967 to 1991, technical assis-
tance expenses were charged to OCR and other technical
assistance funding resources—the Technical Assistance
Special Fund (TASF), the Japan Special Fund, and trust
or grant funds. From 1992 to 2000, no technical assistance
expenses were charged to OCR. In 2001, the Board of Di-
rectors approved the financing of high-priority technical
assistance programs out of OCR current income within
a rolling 4-year financing framework. The amount of fi-
nancing required varies between years and is subject to
the approval of the Board of Directors. In 2003, the Board
reverted to the practice of allocating OCR net income to
the TASF and of financing technical assistance activities
through it and other various funding resources. On an ex-
ceptional basis, ADB committed $10.0 million from OCR
net income as contribution to the Java Reconstruction
Fund in November 2008, for the Yogyakarta and Central
Java reconstruction. This was treated as a technical assis-
tance grant in 2008.
Table 6: Rebate Rates(% per annum)
US dollar Japanese yen
1 January 2008 0.34 0.31
1 July 2008 0.33 0.39

MA
NA
GEM
ENT’S D
ISCU
SSION
AN
D A
NA
LYSIS15Annual Report 2008
Guarantees. ADB provides guarantees1 as credit enhance-
ments for eligible projects to cover risks that the project and
its commercial cofinancing partners cannot easily absorb
or manage on its own. Reducing these risks can make a sig-
nificant difference in mobilizing debt funding for projects.
ADB has used its guarantee instruments successfully for in-
frastructure projects, financial institutions, capital markets,
and trade finance. These instruments generally are not rec-
ognized in the balance sheet and have off-balance sheet risks.
For guarantees issued and modified after 31 December 2002
in accordance with Financial Accounting Standards Board In-
terpretation No. 45 (FIN 45), “Guarantor’s Accounting and
Disclosure Requirements for Guarantees, Including Indirect
Guarantees of Indebtedness to Others,” ADB recognized at
the inception of a guarantee the noncontingent aspect of
its obligations. ADB’s total exposure on signed and effec-
tive loan guarantees is disclosed in Note F of OCR Financial
Statements. In 2008, ADB provided $10.0 million for one po-
litical risk guarantee operation.
Syndications. Syndications enable ADB to mobilize cofi-
nancing by transferring some or all of the risks associated
with its loans and guarantees to other financing partners2.
Syndications thus decrease and diversify the risk profile of
ADB’s financing portfolio. Syndications may be on a fund-
ed or unfunded basis and may be arranged on an individ-
ual, portfolio, or any other basis consistent with industry
practices. In 2008, $565.0 million for syndications through
B-loans3 was provided for three projects.
Equity Investments. In accordance with ADB’s Charter
which mandates that its nonsovereign operations pro-
mote the investment of private capital in the region for
development, ADB provides assistance in the form of eq-
uity investments, in addition to loans without government
guarantees, and other financing schemes. The Charter al-
lows the use of OCR for equity investments in private
enterprises up to 10% of its unimpaired paid-in capital
together with reserves and surplus, exclusive of special
reserves. The total equity investment portfolio for OCR
for both outstanding and undisbursed approved facilities
amounted to $911.14 million at end 2008. This represent-
ed about 61% of the ceiling defined by the Charter.
As of 31 December 2008, the total exposure of non-
sovereign operations in equity investments amounted to
about $815.0 million.
In 2008, seven equity investments totaling $123.1
million were approved compared with five equity invest-
ments totaling $79.8 million in 2007. In the same year,
ADB disbursed a total of $125.7 million in equity invest-
ments, 8.7% increase from $115.6 million disbursed in
2007, and received a total amount of $53.6 million from
capital distributions and divestments, whether in full or
in part, in 20 projects. The divestments were carried out
in a manner consistent with good business practices, af-
ter ADB’s development role in its investments have been
fulfilled, and without destabilizing the companies con-
cerned.
Capital and Resources
Capital. Total shareholders’ equity on a statutory basis
increased from $14.3 billion as of 31 December 2007 to
$15.3 billion as of 31 December 2008. This was due pri-
marily to net income for the year of $1.1 billion; the favor-
able effect of FAS 157/159 adoption to prior years’ income
amounting to $227.5 million; the net effect of change in
special drawing rights value on capital and reserves of
$33.1 million; and additional capital subscription received
of $7.4 million. These were offset by net decrease in other
comprehensive income of $276.7 million (adjustment to
pension and post retirement benefit obligation of $259.8
million, unfavorable translation adjustments of $43.4 mil-
lion; and amortization of FAS 133 adjustment of $0.7 mil-
lion; offset by unrealized gain on investments and equity
investments of $27.2 million); and allocations to the Asian
Development Fund and Climate Change Fund of $40.0
million each, and to the Technical Assistance Special
Fund of $23.0 million.
The total authorized and subscribed capital of ADB
is 3,546,311 shares valued at $54,890.2 million as of 31
December 2008. Of the subscribed capital, $3,860.6 mil-
1 ADB offers two types of guarantee products—political risk and partial credit—designed to facilitate cofinancing by mitigating risk exposure of commercial lenders and capital market investors. A political risk guarantee covers against specifically defined political risks. A partial credit guarantee provides comprehensive cover (of commercial and political risks) for a specific portion of the debt service provided by cofinanciers. These guarantees are issued for projects in which ADB satisfies its participation requirement.
2 Depending on whether ADB retains risk or not, there may or may not be a contingent liability to ADB.3 A B-loan is a tranche of a direct loan nominally advanced by ADB, subject to eligible financial institutions’ taking funded risk participations within such a tranche and without
recourse to ADB. It complements an A-loan funded by ADB.4 Excluding ADB’s share on net unrealized gains of investee companies accounted under equity method totaling $6.1 million.

MA
NA
GEM
ENT’
S D
ISC
USS
ION
AN
D A
NA
LYSI
SAsian Development Bank16
lion was paid-in and $51,029.6 million was callable. Callable
capital can be called only if required to meet ADB’s obliga-
tions incurred on borrowings or guarantees under OCR. No
call has ever been made on ADB’s callable capital.
To ensure it has adequate risk-bearing capacity, ADB
reviews its income outlook annually. Based on that review,
the Board of Directors allocates a portion of the previous
year’s net income to reserves to ensure that the level is
commensurate with the income planning framework. In
addition, to the extent feasible, it allocates part of the
net income to support development activities in its de-
veloping member countries. In May 2008, the Board of
Governors approved the allocation of 2007 net income of
$760.2 million to the cumulative revaluation adjustments
account for $87.6 million, to loan loss reserve for $13.0 mil-
lion, to surplus and ordinary reserves for $278.3 million
each, to Asian Development Fund and Climate Change
Fund for $40.0 million each, and to Technical Assistance
Special Fund for $23.0 million.
In December 2008, the Board of Directors approved
the revised policy on ADB’s lending limitation, which limits
the total amount of disbursed loans, approved equity invest-
ments, and the maximum amount that could be demanded
from ADB under its guarantee portfolio, to the total amount
of ADB’s unimpaired subscribed capital, reserves, and sur-
plus. In addition, the gross outstanding borrowings shall not
exceed the sum of callable capital from nonborrowing mem-
bers, paid-in capital, and reserves (including surplus). As of
31 December 2008, headroom for lending was $29.2 billion
and for borrowings, $8.9 billion, based on the new policy
(compared with $35.5 billion for lending and $16.4 billion
for borrowings as of 31 December 20075).
On 6 May, the Board of Directors reported to the
Board of Governors on the status of ADB’s resources and
highlighted the need to initiate a study on financial re-
sources. Accordingly, ADB prepared a working paper
that provided the required analysis and context to assess
ADB’s financial resource position during the implemen-
tation period of Strategy 2020, and reviewed all possible
avenues for resource mobilization.
The working paper was discussed by the Board of Di-
rectors on 6 October. The Directors noted that, while the
technical issues were well presented in the working paper,
the developmental and political issues are equally impor-
tant to address in the context of the general capital in-
crease and therefore requested the preparation of a second
working paper. The second working paper was discussed
by the Board of Directors in February 2009. Management
is currently reviewing and preparing a proposal on the fifth
general capital increase for ADB, which is scheduled for
board of directors’ discussion in April 2009.
Borrowings. ADB’s primary borrowing objective is to en-
sure availability of funds at the most stable and lowest
possible cost for its operations. Subject to this objective,
ADB seeks to diversify its funding sources across mar-
kets, instruments, and maturities. To achieve the objec-
tive, ADB continued in 2008 a strategy of issuing liquid
benchmark bonds to maintain its strong presence in key
currency bond markets, and raising funds through op-
portunistic financing and private placements, such as
retail-targeted transactions and structured notes, which
provide ADB with cost-efficient funding levels. All pro-
ceeds from new funding transactions are invested until
they are required for ADB’s ordinary operations, includ-
ing loan disbursements and refinancing of maturing
funding obligations.
2008 Funding Operations. During 2008, ADB completed
113 borrowing transactions raising about $9.4 billion in
long- and medium-term funds compared with $8.9 billion
in 2007. The new borrowings were raised in seven curren-
cies: Australian dollar, Japanese yen, New Zealand dollar,
Pound sterling, South African rand, Turkish lira, and US
dollar. After swaps, $9.2 billion or 97.6% of the 2008 bor-
rowings were in US dollar, and the remaining $0.2 billion
or 2.4% were in Japanese yen. The average maturity of
2008 borrowings was 3.5 years compared with 5.2 years in
2007. Of the total 2008 borrowings, $4.8 billion was raised
through 11 public offerings, and 102 private placements
amounting to $4.6 billion. In addition, ADB raised $2.9
billion in short-term funds under its Euro commercial pa-
per program to enhance its presence in the market and to
meet temporary cash needs. Table 7 shows details of 2008
borrowings compared with borrowings in 2007.
Local Currency Bond Issues. ADB continued to pursue its
objective of contributing to the development of region-
5 Recalculated based on the new policy.

MA
NA
GEM
ENT’S D
ISCU
SSION
AN
D A
NA
LYSIS17Annual Report 2008
Currency Composition of Outstanding Borrowings (Before Swaps)
Japanese Yen10.2%
Other Currenciesa
42.7%
U.S. Dollar47.1%
al bond markets. Although this year’s market conditions
have not been favorable for ADB to issue local currency
bonds, ADB raised about $200 million equivalent through
cross-currency swaps to meet local currency funding re-
quirements in Indian rupee, Indonesian rupiah, and Phil-
ippine peso.
Use of Derivatives. ADB undertakes currency and inter-
est rate swaps to raise, on a fully hedged basis, curren-
cies needed for operations in a cost efficient way while
maintaining its borrowing presence in major capital mar-
kets. Figures 1 and 2 show the effects of swaps on the in-
terest rate structure and currency composition of ADB’s
outstanding borrowings as of 31 December 2008. Interest
rate swaps are also used for asset and liability management
a Other currencies include Australian dollar, Canadian dollar, Chinese yuan, Euro, Hong Kong dollar, Indian rupee, Kazakhstan tenge, Malaysian ringgit, Mexican peso, New Taiwan dollar, New Zealand dollar, Philippine peso, Pound sterling, Singapore dollar, South African rand, Swiss franc, Thai baht, and Turkish lira.
b Other currencies include Chinese yuan, Indian rupee, Kazakhstan tenge, Philippine peso, Pound sterling, and Swiss franc.
Figure 1: Effect on Currency Composition
Currency Composition of Outstanding Borrowings (After Swaps)
Other Currenciesb
1.8%
Japanese Yen13.1%
U.S. Dollar85.1%
Interest Rate Structure of Outstanding Borrowings (Before Swaps)
Variable6.6%
Fixed93.4%
Interest Rate Structure of Outstanding Borrowings (After Swaps)
Fixed14.5%
Variable85.5%
Figure 2: Effect on Interest Rate Structures
Table 7: Borrowings(Amounts in $ Million)
2008 2007
Long Term Total Principal Amount 9,372.1 8,854.3 Average Maturity to First Call (years) 3.5 5.2 Average Final Maturity (years) 4.4 9.4 Number of Transactions Public Offerings 11 10 Private Placements 102 84 Number of Currencies (before swaps) Public Offerings 4 8 Private Placements 6 9
Short Terma Total Principal Amountb 2,866.6 3,139.1 Number of Transactions 21 24 Number of Currencies 2 3
a All euro-commercial papers. b At year-end, the outstanding principal amount was nil in 2008 and 2007.

MA
NA
GEM
ENT’
S D
ISC
USS
ION
AN
D A
NA
LYSI
SAsian Development Bank18
purposes to match the liabilities to the interest rate char-
acteristics of loans.
Liquidity Portfolio
The liquidity portfolio helps ensure the uninterrupted
availability of funds to meet loan disbursements, debt ser-
vicing, and other cash requirements. It also contributes to
ADB’s earning base. ADB’s Investment Authority governs
liquid asset investments. Its primary objective is to main-
tain the security and liquidity of funds invested. Subject
to these two parameters, ADB seeks to maximize the total
return on its investments. In compliance with its Charter,
ADB does not convert currencies for investment; invest-
ments are made in the same currencies in which they are
received. At present, liquid investments are held in 21
currencies.
Liquid assets are held in government and govern-
ment-related debt instruments, time deposits, and other
unconditional obligations of banks and financial institu-
tions, and, to a limited extent, in corporate bonds, mort-
gage-backed securities, and asset-backed securities of
high credit quality. They are held in four subportfoli-
os—prudential liquidity, operational cash, cash cushion,
and discretionary liquidity—all of which have different
risk profiles and performance benchmarks. The year-
end balance of the portfolios in 2008 and 2007, includ-
ing receivables for securities repurchased under resale
arrangements, and excluding securities transferred under
securities lending arrangements and pending sales and
purchases, is presented in Table 8.
The prudential liquidity portfolio is invested to en-
sure that the primary objective of a liquidity buffer is met.
Cash inflows and outflows are minimized to maximize the
total return relative to a defined level of risk. The portfolio
is funded largely by equity, and performance is measured
against external benchmarks with an average duration of
about 2.3 years. ADB revised the liquidity policy in Octo-
ber 2006 to bring up to date its financial and risk manage-
ment policies and practices in line with ADB’s business
activities and initiatives and to harmonize its liquidity pol-
icy with other multilateral development banks. Under the
new policy, the duration for the prudential liquidity port-
folio can be extended up to 4 years for the portfolio funded
by equity. The remaining part of the prudential liquidity
portfolio is funded by debt and is invested to maximize the
spread earned between borrowing cost and investment in-
come on high-quality investments.
The operational cash portfolio is designed to meet net
cash requirements over a 1-month horizon. It is funded by
equity and invested in short-term, highly liquid money
market instruments. The portfolio performance is mea-
sured against short-term external benchmarks.
The cash cushion portfolio holds the proceeds of
ADB’s borrowing transactions pending disbursement. It is
invested in short-term instruments, and the performance
is measured against short-term external benchmarks.
The discretionary liquidity portfolio is used to sup-
port medium-term funding needs and is funded by debt
to provide flexibility in executing the funding program
over the medium-term to permit borrowing ahead of cash
flow needs and bolster ADB’s access to short-term funding
through continuous presence in the market.
Table 8: Year-End Balance of Liquidity Portfolioa
($ Million)
2008 2007
Prudential Liquidity Portfolio 9,604.5 9,209.3Operational Cash Portfolio 298.2 395.1Cash Cushion Portfolio 2,605.9 778.8Discretionary Liquidity Portfolio 2,622.0 2,550.5Other Portfolio 626.1 645.7
TOTAL 15,756.7 13,579.4
a The composition of liquidity portfolio may shift from 1 year to another as part of ongoing liquidity management.
Table 9: Return on Liquidity Portfolio(%)
Annualized Financial Return
2008 2007
Prudential Liquidity Portfolio 6.43 5.84Operational Cash Portfolio 2.03 3.95Cash Cushion Portfolio 2.59 4.67Discretionary Liquidity Portfolioa 0.44 0.28Other Portfolio 2.83 3.64
a Spread over funding cost at 31 December.
Table 10: Contractual Cash Obligations($ Million)
2008 2007
Long-Term Debt 35,713.5 32,187.2Undisbursed Loan Commitments 20,648.5 19,011.3Undisbursed Equity Investment Commitments 275.7 344.0Guarantee Commitments 1,772.6 1,460.6Other Long-Term Liabilities 712.7 450.6
TOTAL 59,123.0 53,453.7

MA
NA
GEM
ENT’S D
ISCU
SSION
AN
D A
NA
LYSIS19Annual Report 2008
Table 11: Sovereign Borrower ConcentrationAs of 31 December 2008 and 2007 (%)
Country 2008 2007
Indonesia 29 31China, People’s Republic of 24 25India 18 16Pakistan 13 9Philippines 11 13Others 6 6
Note: Figures may not add up to 100 due to rounding.
Contractual Obligations
In the normal course of business, ADB enters into various
contractual obligations that may require future cash pay-
ments. Table 10 summarizes ADB’s significant contrac-
tual cash obligations at 31 December 2008 and 2007.
Long-term debt includes direct medium- and long-term
borrowings excluding swaps but does not include any ad-
justment for unamortized premiums, discounts, or effects
of applying FAS 133/159. Other long-term liabilities cor-
respond to accrued liabilities, including pension and post-
retirement medical benefits.
Financial Risk Management
In its development banking operations, ADB faces various
risks including credit, market, liquidity, and operational.
Among these risks, sovereign credit risk is the principal
risk as loans to developing member countries represent
91% of ADB’s operations portfolio with the remaining 9%
invested in nonsovereign entities. ADB takes a conserva-
tive approach to managing market and liquidity risks. To
ensure strong risk-bearing capacity, the institution main-
tains conservative capital adequacy.
The Risk Management Unit independently identi-
fies, measures, monitors, and manages these risks in ac-
cordance with industry best practice. The unit is under
the Office of the President and reports to the managing
director general. The Risk Committee, chaired by the
managing director general, provides senior management
oversight of the risk management function and makes rec-
ommendations on risk policies and actions.
Credit Risk
ADB principally faces three forms of credit risk: sovereign,
nonsovereign, and counterparty and issuer.
Sovereign. Sovereign credit risk is the risk that a sovereign
borrower may default on its loan or guarantee obligations.
ADB relies on monitoring, loan loss reserves, and conser-
vative capital adequacy to manage sovereign credit risk.
ADB uses a 10-category rating scale to evaluate its
sovereign borrowers. During 2008, the weighted average
risk rating increased from 4.83 to 4.85, which indicates
slightly weakening credit quality. Because some of the low
risk borrowers were upgraded in 2008, the small change in
the weighted average risk rating understates the impact
of the financial crisis and subsequent economic slowdown
to some sovereign borrowers.
Concentration risk, which occurs when a small group
of borrowers account for a large share of the portfolio, is
a key concern for ADB. During 2008, ADB’s exposure to
its three largest sovereign borrowers was essentially con-
stant at 71%.
ADB holds provisions to offset known or probable
losses in specific transactions and loan loss reserves to off-
set the average losses that ADB would expect to incur in
the course of its lending operations. The sum of provisions
and the loan loss reserve represents ADB’s expected loss.
Following the decline in credit quality, the expected loss
for the sovereign portfolio approximately doubled in 2008.
Nonsovereign. Nonsovereign credit risk is the risk that a
nonsovereign entity, such as a private-sector firm, state-
owned enterprise or local government, may default on its
loan or guarantee obligations. These transactions lack the
backing of a national government.
Management of nonsovereign credit risk begins during
the earliest stages of each proposed transaction. In addi-
tion to evaluating the development impact, ADB consid-
ers a proposal’s credit strength, corporate management and
governance, and financial, commercial, and technical via-
Table 12: Sovereign Portfolio Expected LossAs of 31 December 2008 and 2007
2008 2007 $ Million % $ Million %
Provision for loan losses 4.4 0.0 5.7 0.0Loan loss reserve requirementa 423.7 1.0 166.7 0.6Expected Loss 428.0 1.0 172.4 0.6
a The loan loss reserve requirement is subject to Board of Governors’ approval during the annual meeting in May 2009.
Note: 0.0 is less than 0.05%.

MA
NA
GEM
ENT’
S D
ISC
USS
ION
AN
D A
NA
LYSI
SAsian Development Bank20
bility. Not only do the business units undertake this due
diligence, but the Risk Management Unit also conducts an
independent assessment of each proposed transaction.
Currently, ADB uses a 7-scale rating system to eval-
uate its nonsovereign borrowers. During 2008, average
credit quality worsened, and the weighted average credit
rating increased from 3.5 to 3.7. The deteriorating macro-
economic conditions in some developing member coun-
tries led to the downgrade of firms operating in these
environments.
ADB uses a variety of limits to manage concentration
risk in the nonsovereign portfolio. The total assistance to
a single project must not exceed 25% of the total project
cost or $250.0 million, whichever is lower. This limit en-
sures that exposure to a single project or obligor does not
exceed 5% of the Board-approved ceiling of $5.0 billion for
nonsovereign operations. Furthermore, there are nonsov-
ereign exposure limits for corporate groups, industry sub-
sectors, and countries.
ADB must closely monitor country and sector con-
centrations in the nonsovereign portfolio particularly
due to the nature of its development mandate. Although
country concentration is still significant, it decreased in
2008 with the three largest country exposures falling
from 49% to 42% of the portfolio. Sector concentration
was more or less constant. ADB has focused on the en-
ergy and finance sectors for their development signifi-
cance, and they continued to represent over 75% of the
portfolio in 2008.
In addition to due diligence and limits, ADB monitors
its portfolio to identify any deterioration of credit quality
and uses loan loss reserves and loan provisions to offset ex-
pected losses. During 2008, expected losses increased due
to weakening credit quality.
Table 13: Nonsovereign Country ConcentrationAs of 31 December 2008 and 2007 (%)
Country 2008 Country 2007
India 20 China, People’s Republic of 20China, People’s Republic of 14 India 17Kazakhstan 8 Kazakhstan 12Pakistan 7 Bangladesh 8Philippines 7 Viet Nam 5Others 43 Others 38
Note: Figures may not add up to 100 due to rounding.
Table 14: Nonsovereign Sector ConcentrationAs of 31 December 2008 and 2007 (%)
Sector 2008 2007
Energy 44 36Finance 31 36Investment funds 12 17Transport and Communications 6 5Industry and Trade 5 4Others 2 1
Note: Figures may not add up to 100 due to rounding.
Table 16: Issuer and Counterparty Exposureby Credit RatingAs of 31 December 2008 and 2007 (%)
2008 2007
AAA, AAA- 65 42AA+, AA, AA- 27 52A+, A, A- 7 6Below A- 1 0
Note: 0 is less than 0.5%.
Table 15: Nonsovereign Portfolio Expected LossAs of 31 December 2008 and 2007
2008 2007
$ Million % $ Million %
Provision for loan losses 4.8 0.2 9.4 0.3 Loan loss reserve requirementa 69.5 2.7 28.4 1.0Expected Loss 74.4 2.8 37.7 1.4
a The loan loss reserve requirement is subject to Board of Governors’ approval during the annual meeting in May 2009.
Issuer and Counterparty. Issuer risk is the risk that a bond
issuer may default on its interest or principal payments; it
applies to both investments which ADB internally man-
ages and those investments for which it retains external
asset managers. Counterparty risk is the risk that a coun-
terparty may fail to meet its contractual obligations to
ADB. Issuer and counterparty risks principally affect the
Treasury portfolio.
To control issuer and counterparty credit risk, ADB on-
ly transacts with financially sound institutions with ratings
from at least two reputable public rating agencies. At the
end of 2008, 92% of the Treasury portfolio was rated at least
AA- with a higher proportion invested in AAA institutions
than in 2007, as ADB sought to mitigate its exposure to
counterparties vulnerable to the financial crisis. Moreover,
the Treasury portfolio is generally invested in conservative
assets, such as money market instruments and government
securities. During 2008, the former decreased and the lat-
ter increased as ADB sought lower-risk instruments due to
the financial crisis. In addition, ADB has established con-

MA
NA
GEM
ENT’S D
ISCU
SSION
AN
D A
NA
LYSIS21Annual Report 2008
servative exposure limits for its corporate investments, de-
pository relationships, and other asset classes.
ADB has not been materially impacted by the collapse
in credit quality of US mortgage-backed securities. ADB’s
exposure to these instruments is small, and any losses have
been offset by gains in ADB’s higher quality investments,
whose values have increased as investors have moved to saf-
er assets.
To mitigate counterparty credit risk arising through
derivative transactions, ADB has strict counterparty eligi-
bility criteria. In general, ADB will only undertake swap
transactions with counterparties that have met the re-
quired minimum counterparty credit rating, executed an
International Swaps and Derivatives Association Master
Agreement, and signed a credit support annex. Under the
credit support annex, derivative positions are marked-to-
market daily and collateral calls, mainly cash and US Trea-
sury securities, are made in accordance with the credit
support annex. ADB also sets exposure limits for individ-
ual swap counterparties and monitors these limits against
both current and potential exposures.
Market Risks
Market risk is the risk of loss on financial instruments due
to changes in market prices. ADB principally faces three
forms of market risk: interest rate, foreign exchange, and
equity price.
Interest Rate. ADB is primarily exposed to interest rate risk
through the Treasury portfolio. Interest rate risk in the
operations portfolio is fully hedged as borrowers’ inter-
est payments are matched to ADB’s borrowing expenses.
Therefore, the borrower assumes the risk of fluctuating
interest rates whereas ADB’s margin remains largely con-
stant. ADB monitors and manages interest rate risks in
the Treasury portfolio by employing various quantitative
methods. It marks all positions to market, monitors inter-
est rate risk metrics, and employs stress testing and sce-
nario analysis.
ADB principally uses two metrics to measure interest
rate risk, duration and interest rate value-at-risk (VaR). Du-
ration is the estimated percentage change in the portfolio’s
value in response to a 1% parallel change in interest rates.
During 2008, interest rate risk as measured by duration re-
mained essentially constant. Although the portfolio’s asset
composition shifted from deposits to government securi-
ties the aggregate maturity of the assets did not materially
change. Interest rate VaR is a measure of possible loss at a
given confidence level in a given timeframe due to changes in
interest rates. ADB uses a 95% confidence level and a 1-year
time horizon. In other words, ADB would expect to lose at
least this amount once every 20 years due to fluctuations in
interest rates. Unlike duration, which ADB uses to measure
interest rate risk across the Treasury portfolio, ADB only uses
VaR for the Prudential Liquidity Portfolio, which is the most
exposed to interest rate risk. In 2008, interest rate risk in the
Prudential Liquidity Portfolio increased primarily due to the
increase in interest rate volatility.
Foreign Exchange. In line with the Charter, ADB ensures
that its operations assume a minimum exposure to ex-
change rate risk. In both the operations and Treasury port-
folios, ADB is required to match its loans and investments
to the same currencies in which funds are received. Bor-
rowed funds or funds to be invested may only be converted
into other currencies provided that they are fully hedged
through cross currency swaps or forward exchange agree-
ments. Given its multicurrency operations, however, ADB
is exposed to fluctuations in reported US dollar results
due to currency translation adjustments.
Equity Price. Equity price risk arises through ADB’s invest-
ments in equity securities and private equity funds. ADB’s
Table 18: Interest Rate RiskAs of 31 December 2008 and 2007 (%)
2008 2007
Duration 1.6 1.5Interest Rate VaR 4.9 3.5
VaR = value-at-risk.
Table 17: Issuer and Counterparty Exposure by Asset ClassAs of 31 December 2008 and 2007 (%)
2008 2007
Government Securities 45 27Government Sponsored Entity Securities 25 12Deposits 10 39Corporate Securities 9 9Derivative Exposures 3 7Asset- and Mortgage-Backed Securities 4 4Cash 3 2
Note: Figures may not add up to 100 due to rounding.

MA
NA
GEM
ENT’
S D
ISC
USS
ION
AN
D A
NA
LYSI
SAsian Development Bank22
Charter limits equity investments to 10% of unimpaired
paid-in capital, reserves, and surplus less special reserves.
Additionally, private equity funds are limited to 5% of this
sum. ADB manages equity price risk using the same due
diligence and monitoring procedures as described under
nonsovereign credit risk.
Liquidity Risk
ADB’s liquidity policy ensures the availability of sufficient
cash flows to meet all financial and operational commit-
ments despite uncertain borrowing conditions. Under the
current framework, ADB holds sufficient liquidity to fund
18 months of operations. ADB’s liquidity requirements
are primarily determined by expected loan disburse-
ments, loan amortization prepayments, debt payments,
and cash from net income.
In addition, ADB holds discretionary liquidity to provide
flexibility in funding and debt redemptions. Liquidity levels
and net cash requirements are monitored on an ongoing basis
and reviewed by the Board of Directors quarterly.
Operational Risk
Operational risk is the risk of loss resulting from inadequate
or failed internal processes, people and systems, or from ex-
ternal events. ADB is exposed to many types of operational
risk, which it mitigates through sound internal controls. ADB
has a rigorous process for approving transactions to minimize
errors in the lending function. ADB has also adopted a strat-
egy to strengthen business continuity, and particularly in-
formation technologies, to reduce the impact of disruptions.
Capital Adequacy
Capital is a financial institution’s ultimate protection
against unexpected losses that may arise from various
risks. In ADB’s context, it also protects shareholders from
the possibility of having to contribute callable or addition-
al paid-in capital. ADB uses stress testing to assess its capi-
tal adequacy on a regular basis. Throughout 2008, ADB’s
capital position remained strong.
The capital stress test assesses ADB’s ability to absorb
credit shocks, which are the institution’s principal risk, while
supporting continued lending in line with its development
mandate. The desired outcome of the stress test is that ADB
should have sufficient capital to (i) absorb an income loss
due to the credit shock, and (ii) generate sufficient income
to support post-shock loan growth. For the stress test, ADB
generates thousands of potential portfolio scenarios and im-
poses credit shocks that are large enough to account for 99%
of those scenarios. ADB then assesses the impact of these
shocks on its capital by modeling its equity-to-loan ratio over
the next 10 years. With an equity-to-loan ratio of 38% at the
end of 2008, the current stress test results comfortably ex-
ceeded the desired outcome described above.
Asset and Liability Management. The objectives of asset
and liability management for ADB is to safeguard ADB’s
net worth and overall capital adequacy, promote steady
growth in ADB’s risk bearing capacity, and define sound
financial policies to undertake acceptable levels of finan-
cial risks to provide resources for developmental lend-
ing purposes at the lowest and most stable funding cost
to the borrowers along with the most reasonable lending
terms, while safeguarding ADB’s financial strength. The
asset and liability management safeguards net worth from
foreign exchange rate risks, protects net interest margin
from fluctuation in interest rates, and provides sufficient
liquidity to meet ADB’s operations. ADB also adheres to
cost pass-through pricing policy for the loans to sovereign
borrowers, and allocates the most cost efficient borrow-
ings to fund the loans. The asset and liability management
objectives and practices were clarified and formalized in
2006 through the Board-approved comprehensive asset
and liability management policy framework. The frame-
work has formalized the guiding principles for manag-
ing OCR financial assets and liabilities, and provided the
governing framework to guide all asset and liability man-
agement-related financial policies, including liquidity, in-
vestments, equity management, and capital adequacy.
Internal Control Over Financial Reporting
In line with global best practices on corporate governance,
ADB’s management carried out an evaluation of the ade-
quacy and effectiveness of internal control over financial
reporting using criteria established in Internal Control -
Integrated Framework issued by the Committee of the
Sponsoring Organization of the Treadway Commission
(COSO). The evaluation includes test of key controls
over financial reporting, and ADB’s external auditors con-
curred that ADB maintained effective internal control
over financial reporting for 2008.

MA
NA
GEM
ENT’S D
ISCU
SSION
AN
D A
NA
LYSIS23Annual Report 2008
Summary of Financial Performance
Net Income. Net income before net unrealized gains was
$675.8 million, compared with $711.4 million in 2007.
The decrease of $35.6 million (5.0%) was predominantly
due to the following:
�� ��������� ���������� ������������ � ������ -
ly due to $65.8 million net decrease in interest in-
come and other loan charges, $22.0 million increase in
expenses on asset swaps hedging loan products, and
$2.9 million decrease in provision for loan losses. De-
spite a higher outstanding loan portfolio, overall loan
income decreased because of lower US dollar LIBOR
compared with the same period in 2007;
�� ��������� ���������� � ����� �� ����������-
ing from lower investment returns associated with
the decrease in the interest rate environment;
�� ��������� ���������� � �������������� ����-
ments resulting mainly from $60.0 million reduction
in the proportionate share of income from private
equity funds, which are accounted for under equity
method, $17.0 million decrease in net realized gains
on disposal of equity investments, and recognition of
$8.7 million impairment loss mostly associated with
restructured accounts, net of $5.0 million increase in
dividend income;
�� ��������� � ������� ��� ���������!"� ������-
located to OCR. This was driven by the $15.9 million
increase in overall administrative expenses ($363.7
million in 2008; $347.8 million in 2007) mainly attrib-
uted to increases in salaries ($9.5 million), business
travel ($3.3 million), and contractual services ($2.2
million). This was offset by $1.5 million decrease in
deferred loan origination costs related to new loans
and guarantees;
�� �������� � ������� ����# ���������� �������-
ber countries following the $10.0 million grant pro-
vided to the Java Reconstruction Fund; and
�� �����&���� ���������� ���������'����* +��� ����-
lated expenses resulting mainly from declining inter-
est rates in some markets compared with the same
period in 2007.
Net unrealized gains of $450.6 million for the year
ended 31 December 2008 ($53.8 million in 2007) are pri-
marily the favorable result of FAS 133, 155, and 159 ap-
plication totaling $451.0 million ($57.5 million in 2007),
increasing the net income to $1,126.3 million for the year
ended 31 December 2008 from $765.2 million for the year
ended 31 December 2007.
Net Unrealized Gains and Losses on Financial Instruments as per FAS 133, 155, and 159. ADB posted net unrealized gain
of $1,441.7 million on derivatives used for hedging trans-
actions compared to net unrealized loss of $351.1 million
in 2007. Corresponding unrealized loss on the hedged
borrowings were $1,522.9 million in 2008 compared to an
unrealized gain of $408.6 million in 2007. The gain on de-
rivatives were primarily due to significant downward shift
of the short to medium-term yield curves of the major cur-
rencies, partially offset by the weakening of most major
currencies (with the exception of Japanese yen) against
the US dollar in 2008. The effect of declining interest
rates coupled with strengthening of the US dollar during
the period had a net effect of increasing the borrowing re-
lated derivatives value, i.e. swaps. The impact was largely
felt on the swaps relating to non-structured debts which
are designed to behave as long-term fixed assets denom-
inated in the hedged-borrowings in original currencies.
The liability portion of the swaps would behave similar to
long-term US dollar LIBOR-based liabilities.
Effective 1 January 2008, ADB adopted FAS 159
for non-structured swapped borrowings. The adoption
of FAS 159 resulted in a favorable adjustment of $227.5
million, which was recorded as an adjustment to the be-
ginning balance of reserves. Fair valuation of the non-
structured swapped borrowings resulted in an unrealized
loss of $2,035.9 million for 2008 offsetting the gain on the
hedged swap position of $2,001.4 million. However, the
liquidity crisis resulting from the current global financial
situation led to widening of the funding spreads resulting
in a net gain of $531.7 million from the application of cred-
it spread (FAS 157) to the entire portfolio that are carried
at fair value, including structured borrowings.
The appreciation of Japanese yen against the US dol-
lar in 2008 affected the structured debt portfolio to a cer-
tain extent. The decrease in value of the underlying debts
outweighed the increase in the value of the embedded de-
rivatives, which are highly sensitive to the expected foreign
exchange rates movements. On an after-swap basis, the
change in fair value of the structured debts led to an unreal-

MA
NA
GEM
ENT’
S D
ISC
USS
ION
AN
D A
NA
LYSI
SAsian Development Bank24
ized gain of $140.0 million for the year ended 31 December
2008. The unrealized gains were due mainly to movements
of foreign exchanges and interest rates. As the structured
instruments are fully hedged, the swaps would economi-
cally offset any foreign exchange and interest rate risks of
the instruments (Note M of OCR Financial Statements).
CRITICAL ACCOUNTING POLICIES AND ESTIMATES
Significant accounting policies are contained in Note B of
OCR’s financial statements. As disclosed in the financial
statements, Management estimates the fair value of fi-
nancial instruments. Estimates by their nature are based
on judgment and available information; therefore, actual
results may differ and might have a material impact on the
financial statements.
Fair Value of Financial Instruments. Under statutory report-
ing, ADB carries its financial instruments and derivatives,
as defined by FAS 133 and FAS 159, on a fair value basis.
These financial instruments include embedded derivatives
that are valued and accounted for in the balance sheet as
a whole. Fair values are usually based on quoted market
prices. If market prices are not readily available, fair values
are usually determined using market-based pricing models
incorporating readily observable market data and require
judgment and estimates.
The pricing models used for determining fair values
of ADB’s financial instruments are based on discounted
expected cash flows using observable market data. ADB
reviews the pricing models to assess the appropriateness
of assumptions to reasonably reflect the valuation of the
financial instruments. In addition, the fair values derived
from the models are subject to ongoing internal and ex-
ternal verification and review. The models use market-
sourced inputs such as interest rates, exchange rates, and
option volatilities. Selection of these inputs may involve
some judgment and may impact net income. ADB believes
that the estimates of fair values are reasonable given exist-
ing controls and processes.
Financial Accounting Standards Board issued FAS 157–
Fair Value Measurements, in September 2006, and FAS
159–Fair Value Option for Financial Assets and Financial
Liabilities, in February 2007. FAS 157 emphasizes the def-
inition and methods for measuring fair value, and expands
disclosure requirements for financial reporting purposes,
while FAS 159 expands the scope of financial instruments
that may be carried at fair value. These are discussed in
more detail in Note B of OCR’s financial statements.
Provision for Loan Losses. Provision against loan losses for
impaired loans reflects management’s judgment and esti-
mate of the present value of expected future cash flows dis-
counted at the loan’s effective interest rate. ADB considers
a loan impaired when, based on current information and
events, it is probable that ADB will be unable to collect all
the amounts due according to the loan’s contractual terms.
In 2006, the Board approved the revision of the loan loss
provisioning methodology for ADB’s nonsovereign operations
to a risk-based model. The assessment applies the concept of
expected loss to establish loss provision and loss reserve, simi-
lar to the concept applied to ADB’s sovereign operations ap-
proved in 2004. The provisioning estimate is performed by the
Risk Management Unit on a quarterly basis.
In the revised methodology, ADB uses an internal risk
rating system to estimate the probability of default based
on its past loan loss experience and various tools available
in the market. Loans that are considered impaired based
on the probability of default are provisioned through the
income statement. Those that are not impaired will be
provisioned through the establishment of a loss reserve in
the equity section as an allocation of net income subject
to the approval of the Board of Governors.
SPECIAL FUNDS
ADB is authorized by its Charter to establish and adminis-
ter special funds. These are the Asian Development Fund,
Technical Assistance Special Fund, Japan Special Fund,
ADB Institute Special Fund, the Asian Tsunami Fund, the
Pakistan Earthquake Fund, the Regional Cooperation and
Integration Fund, and the Climate Change Fund. Finan-
cial statements for each fund are prepared in accordance
with generally accepted accounting principles except for
ADF’s which are special purpose financial statements pre-
pared in accordance with ADF Regulations.
Asian Development Fund
ADF is ADB’s concessional financing window for devel-
oping member countries with low per capita gross na-

MA
NA
GEM
ENT’S D
ISCU
SSION
AN
D A
NA
LYSIS25Annual Report 2008
tional product and limited debt repayment capacity. It
is the only multilateral source of concessional assistance
dedicated exclusively to reducing poverty and to improv-
ing the quality of life in Asia and the Pacific. Thirty-two
donor members (regional and nonregional) have contrib-
uted to the fund. Cofinancing with bilateral and multi-
lateral development partners complement ADB’s ADF
resources.
In August 2008, the Board of Governors adopted the
resolution providing for the ninth replenishment of the
ADF (ADF X) and the fourth regularized replenishment
of the TASF. The resolution provides for a substantial re-
plenishment of the ADF to finance ADB’s concessional
program for the 4-year period from January 2009, and for a
replenishment of the TASF in conjunction with the ADF
replenishment, to finance technical assistance operations
under the TASF. Total replenishment size is special
drawing rights (SDR) 7.1 billion ($11.3 billion), consist-
ing of SDR6.9 billion for ADF X and SDR0.2 billion for
TASF. About 37% of the replenishment will be financed
from new donor contributions amounting to SDR2.6 bil-
lion ($4.2 billion equivalent). The replenishment shall be
effective upon receipt of the Instruments of Contribu-
tion for Unqualified Contribution commitments in an ag-
gregate amount equivalent to at least SDR1.3 billion, and
such date should not be later than 1 July 2009.
Currency Management. Effective 1 January 2006, the new
currency management framework for ADF, which was ap-
proved by the Board of Directors in October 2005, was
implemented. Under this new framework, the practice of
managing ADF resources in as many as 15 currencies was
discontinued, and an approach based on special drawing
rights (SDR) basket of currencies was introduced. ADF
donor contributions and loan reflows received in curren-
cies that do not constitute SDR are immediately convert-
ed into one of SDR currencies to maintain SDR-based
liquidity portfolio. In addition, the borrower’s obligations
for new ADF loans are now determined in SDR.
Loan Conversion. In July 2007, as an application of the
Board-approved new currency management framework,
ADB offered a full-fledged special drawing rights (SDR)
approach to ADF legacy loans by providing ADF borrow-
ers the option to convert their existing liability (i.e., dis-
bursed and outstanding loan balance) in various currencies
into SDR, while the undisbursed portions will be treated
as new loans. The conversion will shorten the time horizon
to achieve the full benefits, reduce exchange rate volatility
associated with legacy ADF loans, and provide a consistent
debt portfolio management framework across peer multi-
lateral banks and all ADF loans. The conversion was made
available beginning 1 January 2008. A series of workshops
were conducted from late 2007 to October 2008 to promote
borrowers’ awareness of the conversion option, and assist
borrowers in making informed decisions. As of December
2008, 16 out of 30 ADF borrowing countries have signified
their agreement to the conversion and $11.5 billion of out-
standing legacy loans had been converted to SDR loans.
Revised Framework for Grants and Hard-Term Facility. In
September 2007, the Board of Directors approved the
revised ADF grant framework which limits grants eligi-
bility to ADF-only countries and introduced a new hard-
term ADF lending facility. The facility will have a fixed
interest rate of 150 basis points below the weighted av-
erage of the 10-year fixed swap rates of the special draw-
ing rights component currencies plus the OCR lending
spread, or the current ADF rate, whichever is higher.
Other terms are similar to those of regular ADF loans.
In general, blend countries with per capita income not
exceeding the International Development Association
operational cutoff for more than 2 consecutive years and
an active ordinary capital resources lending program are
eligible to borrow from this new facility. The interest
rate will be reset every January through a board informa-
tion paper. The rate will apply to all hard-term loans ap-
proved that year and will be fixed for the life of the loan.
For hard-term ADF loans approved in 2008, the interest
rate was set at 3.15%. Three loans were approved under
this new facility in 2008.
Financial Framework. In December 2007, the Board of Di-
rectors approved a new ADF financial framework that aims
to enhance the long-term financial capacity of ADF and im-
prove prudential financial management practices. The new
framework establishes tranching of liquidity to improve the
liquidity management and prudential minimum liquidity
level ADF should maintain. The new framework allows
ADF to have a higher and more stable commitment author-
ity for future replenishments and ensure that liquidity is
managed in a transparent and efficient manner.

MA
NA
GEM
ENT’
S D
ISC
USS
ION
AN
D A
NA
LYSI
SAsian Development Bank26
Heavily Indebted Poor Countries (HIPC) Debt Relief. ADF
donors requested ADB’s participation in the HIPC debt
relief. In line with this, ADB Board of Governors adopted
Board Resolution No. 329 on 7 April 2008 for ADB to par-
ticipate in the HIPC debt relief, and to provide Afghan-
istan with debt relief. The estimated principal amount
of Afghanistan’s ADF debt to be forgiven and charged
against ADF income is $89.8 million.6
The HIPC Initiative was launched in 1996 by the In-
ternational Development Association and International
Monetary Fund to reduce the excessive debt burden faced
by the world’s poorest countries. A “sunset clause” was
stipulated to prevent the HIPC debt relief from becoming
a permanent facility, minimize moral hazard, and encour-
age early adoption of reform programs. This has been ex-
tended several times with the latest “sunset clause” being
end-2006 with a “ring-fence” of its application to coun-
tries satisfying the income and indebtedness criteria using
end-2004 data. Thus far, Afghanistan is the only ADF bor-
rower that has qualified for HIPC debt relief. While other
ADF borrowers have met the HIPC indebtedness crite-
ria, it is not possible to currently estimate whether these
countries will qualify for HIPC debt relief.
Under the policy, upon approval of debt relief for a
country by the Board of Directors, the principal compo-
nent of the estimated debt relief costs will be recorded
as a reduction of the disbursed and outstanding loans on
a provisional basis and charged against ADF income. The
International Development Association and Internation-
al Monetary Fund boards will decide when a country has
satisfied the conditions for reaching the completion point.
Upon reaching the completion point the debt relief will
become irrevocable. The accumulated provision for HIPC
debt relief will be reduced when debt relief is provided on
the loan service payment date. As of 31 December 2008,
provision of $0.5 million has been written off under this
arrangement, bringing the balance to $87.5 million, at 31
December 2008 exchange rate.
Contributed Resources. During the eighth replenishment of
the ADF (ADF IX), donors recommended a replenishment
of $7.0 billion, consisting of $3.3 billion in new contributions
from donors and $3.7 billion from internal resources based on
the exchange rate specified in the Resolution of the Board
of Governors. ADF IX, which covers the 4-year period from
2005 to 2008, became effective in April 2005 after instru-
ments of contribution deposited with ADB for unqualified
contribution exceeded 50% of all pledged contributions. As
of 31 December 2008, 30 donors have committed a total of
$3.7 billion7 to ADF IX, including contributions of Ireland
($32.5 million) and Brunei Darussalam ($9.5 million). Total
deposited installment payments amounting to $3.4 billion7
include $3.0 billion for ADF operations, $0.2 billion for Tech-
nical Assistance Special Fund, and $0.2 billion for financing
forgone interest of grants. The remaining unpaid contribu-
tions under ADF VIII as of 31 December 2008 amounted to
$168.8 million7 (For details of amounts released for opera-
tional commitment in 2008, see the column labeled “Addi-
tion” in Statistical Annex 23.)
In May 2008, the Board of Governors approved the
transfer of $40 million to ADF as part of OCR’s net in-
come allocation ($40 million in 2007). In addition, a to-
tal of $1,133.3 million from loan savings and cancellations
have been included in the commitment authority. This
resulted from Management’s continuous assessment of
6 Based on the disbursed and outstanding debt as of 20 March 2006, converted to US dollar using the exchange rate as of 7 April 2008.7 US dollar equivalent at 31 December 2008 exchange rates.
Table 19: Asian Development Fund Commitment Authoritya
31 December 2008 and 2007 ($ Million)
2008 2007
Carryover from ADF VIII Commitment Authorityb 124.4 126.9
ADF IX Contributionsc 2,976.5 2,144.4
ADF VIII Contributions 161.6 164.6
OCR Net Income Transfer 160.0 120.0
Expanded Advance Commitment Authority 3,895.7 2,979.7
Loans Savings and Cancellation 1,133.3 890.8
Credits from Accelerated Note Encashment Program 63.0 –
Provision for Disbursement Riskd (158.4) (157.9)
Provision for Foreign Exchange Volatilitye 15.2 –
Total ADF IX Commitment Authority 8,371.3 6,268.5
Loans and Grants Committed 8,248.7 5,833.1
ADF Commitment Authority Available for Future Commitments 122.6 435.4
( ) = negative, ADF = Asian Development Fund, OCR = ordinary capital resources.a The schedule reflects cumulative commitment authority for ADF IX.b The US dollar equivalent of SDR80.4 million at each year-end exchange rates.c Contributions received to finance forgone interest of grants are excluded as they
have been incorporated as cash inflows in the computation of Expanded Advance Commitment Authority.
d Applies to contribution and net income transfer received prior to the adoption of the new ADF Financial Framework in December 2007.
e Represents an allowance to cover the shortfall in the commitment authority due to exchange rate fluctuation during the last 3 months of 2008.
Note: Total may not add due to rounding.

MA
NA
GEM
ENT’S D
ISCU
SSION
AN
D A
NA
LYSIS27Annual Report 2008
opportunities for freeing committed resources through
cancellations of unused loan balances. During 2008, prom-
issory notes totaling $603.1 million have been encashed,
$58.6 million of which was transferred to the Technical
Assistance Special Fund.
Loan Approvals, Disbursements, and Repayments. In 2008,
36 ADF loans totaling $1.8 billion were approved com-
pared with 36 loans totaling $1.9 billion in 2007. Dis-
bursements during 2008 totaled $2.0 billion, an increase
of 26.3% from $1.6 billion in 2007. At the end of the year,
cumulative disbursements from ADF resources were
$27.0 billion. Loan repayments during the year amount-
ed to $676.9 million. At year-end, outstanding ADF loans
amounted to $26.4 billion.
Status of Loans. At the end of the year, 28 sovereign loans to
Myanmar with total principal outstanding of $565.8 mil-
lion were in non-accrual status representing about 2.1% of
the total outstanding ADF loans.
Investment Portfolio Position. The ADF investment port-
folio8 amounted to $6.3 billion at 31 December 2008 com-
pared with $7.0 billion in 2007. About 16% of the portfolio
was invested in bank deposits, and 84% was invested in
fixed income securities. The annualized rate of return on
ADF investments including unrealized gains and losses
was 5.2% (4.7% in 2007).
Grants. With the introduction of grant financing in ADF
IX, 27 grants (24 in 2007) were approved in 2008 totaling
$707.4 million ($519.3 million in 2007), while 27 grants
(17 in 2007) totaling $539.8 million ($377.8 million in
2007) became effective.
Cofinancing for Loans. In 2008, $87.0 million was mobilized
in official loan cofinancing for two loan projects totaling
$126.0 million.
Technical Assistance Special Fund
The Technical Assistance Special Fund was established
to provide technical assistance on a grant basis to devel-
oping member countries of the Asian Development Bank
and regional technical assistance.
In August 2008, the Board of Governors adopted the
resolution providing for the ninth replenishment of the
ADF (ADF X) and the fourth regularized replenishment
of the Technical Assistance Special Fund (TASF). Con-
sidering the demand estimate and the availability of funds
from other sources, the donors agreed to contribute 3% of
the total replenishment size as the fourth replenishment
of the TASF. The replenishment will cover the 4-year pe-
riod 2009 to 2012 (see related notes under ADF).
Contributed Resources. As of 31 December 2008, 28 do-
nors committed a total of $219.5 million to TASF, as part
of the ADF IX and the third regularized replenishment
of TASF. Of the total commitment, $202.9 million have
been received.
During the year, India made a direct voluntary con-
tribution amounting to $0.25 million, and Pakistan, $0.07
million. In addition, $23.0 million was allocated to TASF
as part of OCR’s 2007 net income allocation, and a total
of $7.0 million regularized replenishment was received.
At the end of 2008, total TASF resources amounted to
$1,402.6 million, of which $1,299.9 million was commit-
ted, leaving an uncommitted balance of $102.7 million
(Statistical Annex 24).
Operations. Technical assistance (TA) commitments
(approved and effective) increased from $77.5 million
in 2007 to $108.2 million in 2008 for 156 TA projects that
were made effective during the year, net of $15.6 mil-
lion ($11.9 million in 2007) write back of undisbursed
commitments for completed and cancelled TA projects.
Undisbursed commitments for technical assistance in-
creased to $222.7 million as of 31 December 2008 ($183.7
Table 20: Technical Assistance Special Fund Cumulative Resources($ Million)
2008 2007
Regularized Replenishment Contributions 432.6 425.7Allocations from OCR Net Income 706.0 683.0Direct Voluntary Contributions 89.2 88.8Income from Investment and Other Sources 178.3 167.3Transfers from the TASF to the ADF (3.5) (3.5)
TOTAL 1,402.6 1,361.3
( ) = negative, ADF = Asian Development Fund, OCR = ordinary capital resources, TASF = Technical Assistance Special Fund.
8 Includes securities purchased under resale arrangement.

MA
NA
GEM
ENT’
S D
ISC
USS
ION
AN
D A
NA
LYSI
SAsian Development Bank28
million as of 31 December 2007). TASF financed 43.5%
of all TA activities approved in 2008.
Investment Position. As of 31 December 2008, total TASF
investment portfolio, including securities purchased un-
der resale arrangement, amounted to $295.7 million,
slightly higher than the $295.1 million as of year-end of
2007. Despite a higher investment portfolio in 2008, to-
tal revenue from investments decreased to $10.9 million,
from $14.2 million during the same period in 2007, due
mainly to the decrease in yield on US dollar placements.
Japan Special Fund
The Japan Special Fund was established in 1988 when
ADB acting as the administrator, entered into a financial
arrangement with Japan, who agreed to make the initial
contribution, to help developing member countries of
ADB restructure their economies and broaden the scope
of opportunities for new investments, mainly through
technical assistance operations.
Contributed Resources. In January 2008, Japan contributed
¥1.9 billion ($17.4 million equivalent) as a regular contri-
bution to Japan Special Fund. As of 31 December 2008,
Japan’s cumulative contribution to the fund since its in-
ception in 1988 amounted to ¥112.9 billion (about $973.7
million equivalent) comprising regular contributions of
¥94.8 billion ($822.9 million equivalent) and supplemen-
tary contributions of ¥18.1 billion ($150.8 million equiv-
alent). The uncommitted balance including approved
technical assistance but not yet effective as of 31 Decem-
ber 2008 was $86.8 million.
Operations. The technical assistance (TA) grants financed
by Japan Special Fund continued to support ADB opera-
tions aimed at reducing poverty. In 2008, 57 TA projects
totaling $55.0 million were approved, and 69 TA projects
totaling $59.6 million became effective. The undisbursed
TA commitments increased to $95.8 million as of 31 De-
cember 2008 ($82.9 million as of 31 December 2007).
Sector Activities. In 2008, the Japan Special Fund (JSF)
financed 20% of the total amount of technical assis-
tance (TA) that ADB approved, including 47% of the
total amount of project preparatory TA during the year.
Table 21 illustrates the breakdown of JSF approvals by
sector.
Investment position. As of 31 December 2008, total Japan
Special Fund investment portfolio amounted to $198.9
million, lower than the balance of $215.1 million as of 31
December 2007. With this, and with lower yield on US
dollar placements, revenue from investments decreased,
from $11.8 million in 2007 to $6.5 million in 2008.
ADB Institute Special Fund
The ADB Institute was established in 1996 as a subsid-
iary body of ADB, whose objectives are the identification
of effective development strategies and capacity improve-
ments for sound development management in developing
member countries.
The costs for operating the ADB Institute are met
from the ADB Institute Special Fund which is adminis-
tered by ADB in accordance with the Statute of ADB In-
stitute. In 2008, Japan committed its 13th contribution
in the amount of ¥0.70 billion ($7.8 million equivalent),
which was reported as Due from Contributors.
As of 31 December 2008, cumulative contributions
committed amounted to ¥16.5 billion (about $141.2 mil-
lion equivalent) excluding translation adjustments. Of
the total contributions received, $125.5 million had been
used by the end of the year mainly for research and ca-
pacity-building activities including organizing symposia,
forums, and trainings; preparing research reports, publi-
cations, and websites; and for associated administrative
expenses. The balance of net current assets (excluding
property, furniture, and equipment) available for future
projects and programs was about $15.6 million.
Table 21: Japan Special Fund Technical Assistance by Sector, 2008
$ Milliona %
Agriculture and Natural Resources 13.5 25Transport and Communications 10.1 18Multisector 9.1 17Education 4.5 8Law, Economic Management and Public Policy 4.4 8Energy 4.4 8Industry and Trade 3.8 7Finance 2.9 5Water Supply, Sanitation and Waste Management 1.9 3Health, Nutrition, and Social Protection 0.4 1
TOTAL 55.0 100a Totals may not add due to rounding.

MA
NA
GEM
ENT’S D
ISCU
SSION
AN
D A
NA
LYSIS29Annual Report 2008
Asian Tsunami Fund
The Asian Tsunami Fund was established on 11 Febru-
ary 2005 in response to the special circumstances sur-
rounding the developing member countries that were
stricken by the effects of the tsunami on 26 December
2004.
Contributed Resources. ADB contributed $600 million
to the fund, of which, $50 million unutilized funds
were transferred back to OCR ($40 million in Novem-
ber 2005 and $10 million in June 2006). In addition,
Australia contributed $3.8 million, and Luxembourg,
$1.0 million. As of 31 December 2008, total resources
of the fund amounted to $625.9 million, $579.5 million
of which has been utilized, leaving an uncommitted bal-
ance of $46.4 million ($40.0 million as of 31 December
2007).
Operations. There were no technical assistance or grants
that were approved or made effective during the year. The
balance of undisbursed commitments as of 31 December
2008 amounted to $248.3 million, compared with $389.1
million as of year-end of 2007.
Investment position. As of 31 December 2008, Asian Tsuna-
mi Fund’s investment portfolio amounted to $251.3 mil-
lion ($366.5 million as of 31 December 2007). With the
lower portfolio, and lower yield on US dollar placements,
revenue from investments decreased, from $22.3 million
in 2007 to $9.1 million in 2008.
Pakistan Earthquake Fund
The Pakistan Earthquake Fund was established in No-
vember 2005 in response to the special needs of Pakistan
subsequent to the earthquake on 8 October 2005. The
dedicated fund is to deliver emergency grant financing for
investment projects and technical assistance to support
immediate reconstruction, rehabilitation and associated
development activities.
Contributed Resources. ADB contributed $80 million to
the fund. In addition, Australia contributed $15.0 mil-
lion; Belgium, $14.3 million; Finland, $12.3 million; and
Norway, $20.0 million. As of 31 December 2008, total re-
sources of the fund amounted to $142.4 million, $140.2
million of which has been utilized, leaving an uncommit-
ted balance of $2.2 million (negative $3.5 million as of 31
December 2007).
The contributions of Belgium and Norway were in
the form of debt-for-development swap agreements. The
agreements involved the conversion of Pakistan’s loan
service payments to the two countries for their loans to
Pakistan of up to €9.9 million and $20.0 million, respec-
tively, into Belgium’s and Norway’s contributions to the
Pakistan Earthquake Fund. Belgium’s contributions were
made in three equal installments of €3.3 million from 2007
to 2008, while Norway’s contributions were undertaken
in four equal installments of $5.0 million in 2006–2008.
Operations. There were no technical assistance or grants
that were approved or made effective during the year. The
balance of undisbursed commitments as of 31 December
2008 amounted to $66.2 million, compared with $73.2
million as of year-end of 2007.
Investment position. As of 31 December 2008, Pakistan
Earthquake Fund’s investment portfolio amounted to
$61.3 million ($60.7 million as of 31 December 2007).
With the increase in the average investment portfolio, rev-
enue from investments for 2008 increased to $3.1 million
from $2.4 million in 2007.
Regional Cooperation and Integration Fund
The Regional Cooperation and Integration Fund was es-
tablished in February 2007 in response to the increasing
demand for regional cooperation and integration activities
among ADB’s member countries in Asia and the Pacific.
Its main objective is to improve regional cooperation and
integration (RCI) in Asia and the Pacific by facilitating the
pooling and provision of additional financial and knowl-
edge resources to support RCI activities.
Contributed Resources. ADB contributed $40 million to the
fund as part of the 2006 OCR net income allocation. As of
31 December 2008, total resources of the fund amounted
to $42.5 million, $17.9 million of which has been utilized,
leaving an uncommitted balance of $24.6 million ($33.8
million as of 31 December 2007).

MA
NA
GEM
ENT’
S D
ISC
USS
ION
AN
D A
NA
LYSI
SAsian Development Bank30
Operations. In 2008, 13 technical assistance totaling $10.5
million became effective (four technical assistance and
one supplementary approval totaling $7.4 million in
2007). The balance of undisbursed commitments as of
31 December 2008 amounted to $16.6 million, compared
with $7.4 million as of year-end of 2007.
Investment position. As of 31 December 2008, Regional
Cooperation and Integration Fund’s investment port-
folio amounted to $39.3 million ($39.9 million as of 31
December 2007). With the increase in average volume of
investments, which was offset by lower yield on US dollar
placements, revenue from investments for 2008 was just
slightly higher than the revenue for 2007 ($1.24 million in
2008; $1.19 million in 2007).
Climate Change Fund
The Climate Change Fund was established in April 2008
to facilitate greater investments in DMCs to address the
causes and consequences of climate change alongside
ADB’s own assistance in various related sectors.
Contributed Resources. ADB provided the initial contribu-
tion of $40.0 million in May 2008, as part of OCR’s 2007
net income allocation. With accumulated investment in-
come of $0.5 million, total resources of the fund as of 31
December 2008 amounted to $40.5 million, $3.1 million
of which has been utilized, leaving an uncommitted bal-
ance of $37.4 million.
Operations. In 2008, one technical assistance amounting
to $3.0 million was approved and became effective. There
has been no disbursement yet for this technical assistance.
Investment position. As of 31 December 2008, Climate
Change Fund’s investment portfolio amounted to $38.9
million, providing $0.5 million revenue for the period.
GRANT COFINANCING
Trust funds and project-specific grants are key instruments
to mobilize and channel grants from external sources to fi-
nance technical assistance and components of investment
projects. They play an important role in complementing
ADB’s own resources to meet capacity development and
other specific demands from DMCs. Multilateral, bilateral,
and private sector partners have contributed more than $2.0
billion in grants to ADB operations (Table 22). In 2008, a
total of $154.2 million in grant cofinancing was mobilized
comprising $84.2 million for 76 technical assistance proj-
ects and $70.0 million for 17 investment projects. By year-
end, there were 29 trust funds under active administration
by ADB which included 19 active single donor trust funds
to finance activities in various sectors or for specific themes,
and 10 multidonor trust funds to finance activities with a
thematic focus, including poverty reduction, governance,
gender and development, managing for development re-
sults, HIV/AIDS, water, energy, education, information
and communications technology, and trade and finance.
Initially, trust funds were established through donor-
specific channel financing agreements, for a wide range
of sectors, focused primarily on financing technical assis-
tance operations. More recently, in response to the chang-
ing needs of developing member countries and consistent
with ADB’s financing partnership strategy9 and harmoniza-
tion efforts, ADB has established some trust funds based
on common agreements with development partners and
financing through instruments of contribution. These are
established under an umbrella facility of sector- and theme-
focused financing partnership, and finance technical assis-
tance and grant components of investment projects.
Technical Assistance and Grant Funds under Financing Part-nership Facilities and Special Initiatives. ADB has estab-
lished two multidonor and three single donor trust funds
under the financing partnership facilities framework, to
support both technical assistance and grant components
of investment projects in priority sectors consistent with
Strategy 2020. Since 2006, about $100.0 million has been
mobilized from bilateral sources to finance activities in
the water sector, for clean energy, and for regional coop-
eration and integration.
Japan made its initial contributions of $23.1 million
to the Asian Clean Energy Fund and $11.5 million to the
Investment Climate Facilitation Fund, the two new ini-
tiatives that were established last year under the Clean
Energy Financing Partnership Facility and Regional Co-
9 ADB. 2006. ADB’s Financing Partnership Strategy. Manila.

MA
NA
GEM
ENT’S D
ISCU
SSION
AN
D A
NA
LYSIS31Annual Report 2008
operation and Integration Facility. Austria and Spain each
contributed $5 million to the Multidonor Water Trust
Fund. Spain and Sweden made their first contributions of
$5 million and $4.7 million respectively, to the Multido-
nor Clean Energy Fund. Australia expressed its intent to
make a total additional contribution of A$25 million each
to these multidonor funds by 2011.
Under ADB’s Carbon Market Initiative, the Future
Carbon Fund was established in 2008 complementing the
existing Asia Pacific Carbon Fund. The fund will provide
financing up front for ADB-supported projects that will
continue to generate carbon credits after 2012. The initial
target size of the fund is $100 million and may be increased
to $200 million if there is sufficient demand.
Japan Fund for Poverty Reduction
The Japan Fund for Poverty Reduction (JFPR) was estab-
lished in May 2000 as a trust fund to support poverty re-
duction and social development activities that can add
substantial value to ADB projects. Since 2000, Japan has
contributed $360.4 million in total. To date, $300.3 million
for 116 projects has been approved, of which 13 projects val-
ued at $34.0 million were approved in 2008 (www.adb.org/
JFPR; Statistical Annex 27). A number of projects have been
completed this year and these are the subjects of knowledge-
sharing sessions organized by ADB. In 2008, the JFPR publi-
cation series was launched which will focus on the impact and
outcomes, and lessons learned from JFPR projects.
Japan Scholarship Program
The Japan Scholarship Program (JSP) was established in
1988 to provide an opportunity for well-qualified citizens
of developing member countries to undertake postgradu-
ate studies in economics, management, science and tech-
nology, and other development-related fields at selected
educational institutions in Asia and the Pacific. JSP is
funded by Japan and administered by ADB. Currently, 20
institutions in 10 countries participate.
Between 1988 and 2008, Japan contributed $100.1
million. A total of 2,417 scholarships has been awarded
to recipients from 35 member countries. Recently, an av-
erage of about 150 scholarships have been awarded each
year. Of the total, 2,053 have completed their courses.
Women have received 823 scholarships.

MA
NA
GEM
ENT’
S D
ISC
USS
ION
AN
D A
NA
LYSI
SAsian Development Bank32
Table 22: Schedule of Contributions and Net AssetsGrants from External SourcesAs of 31 December 2008 ($ Million)
Contribution Net Assetsa
Administered by ADB
Country
Australia 161.3 13.6 Austria 6.0 3.3 Belgium 29.2 27.1 Brunei Darussalam 0.6 (0.0) Canada 124.1 51.6 China, People’s Republic of 20.2 8.3 Denmark 24.7 2.9 European Community 250.0 93.9 Finland 56.8 31.5 France 33.4 4.1 Ireland 2.2 0.5 Italy 2.7 0.9 Japanb 526.8 214.2 Korea, Republic of 20.1 13.9 Luxembourg 18.2 15.5 The Netherlands 370.1 126.8 New Zealand 31.6 0.6 Norway 117.5 43.6 Portugal 15.0 15.1 Spain 47.6 37.8 Sweden 142.2 49.9 Switzerland 40.0 28.0 United Kingdom and Northern Ireland 491.9 139.8 United States 1.8 0.4
Subtotal 2,534.0 923.3
Others
Cities Alliance 0.5 (0.0) Global Environment Fund 76.0 28.3 Nordic Development Fund 11.0 (0.4) Private Sector/Foundations 3.0 0.1 Public Private Infrastructure Advisory Facility 0.4 (0.0) Trust Fund for Forest (Viet Nam) 17.2 1.5 United Nation Development Programme 111.2 0.3
Subtotal 219.3 29.8
Not Administered by ADB
Country Switzerland 25.7 6.6 Kuwait 15.0 1.0
Subtotal 40.7 7.6
Grand Total 2,794.1 960.7
Note: Figures may not add to total due to rounding.( ) Negative; 0.0 is less than $50,000. a Excludes projects approved but not yet effective. b Includes Japan Fund for Poverty Reduction, Japan Scholarship Program, Japan Fund for Information, Communication and Technology, and Japan Fund for Public Policy Training.

ORD
INA
RY CA
PITAL RESO
URC
ES33Annual Report 2008
ORDINARY CAPITAL RESOURCES
Management's Report on Internal Control over Financial Reporting
The management of Asian Development Bank (“ADB”) is responsible for establishing and
maintaining adequate internal control over financial reporting. ADB's internal control over
financial reporting is a process designed to provide reasonable assurance regarding the reliabil-
ity of financial reporting and the preparation of financial statements for external purposes in
accordance with generally accepted accounting principles in the United States of America.
ADB's internal control over financial reporting includes those policies and procedures that
(i) pertain to the maintenance of records that, in reasonable detail, accurately and fairly re-
flect the transactions and dispositions of the assets of ADB; (ii) provide reasonable assurance
that transactions are recorded as necessary to permit preparation of financial statements in
accordance with generally accepted accounting principles, and that receipts and expenditures
of ADB are being made only in accordance with authorizations of management and directors
of ADB; and (iii) provide reasonable assurance regarding prevention or timely detection of
unauthorized acquisition, use or disposition of ADB's assets that could have a material effect
on the financial statements.
Because of its inherent limitations, internal control over financial reporting may not prevent
or detect misstatements. Also, projections of any evaluation of effectiveness to future periods
are subject to the risk that controls may become inadequate because of changes in conditions,
or that the degree of compliance with the policies or procedures may deteriorate.
ADB's management assessed the effectiveness of ADB's internal control over financial report-
ing as of 31 December 2008. In making this assessment, ADB's management used the criteria
set forth by the Committee of Sponsoring Organizations of the Treadway Commission in
Internal Control – Integrated Framework. Based on that assessment, management believes that as
of 31 December 2008, ADB's internal control over financial reporting is effective based upon
the criteria established in Internal Control – Integrated Framework.
Haruhiko Kuroda
President
Bindu N. Lohani
Vice President (Finance and Administration)
Hong-Sang Jung
Controller
5 March 2009
ORD
INA
RY C
API
TAL
RESO
URC
ESAsian Development Bank34
Report of Independent Auditors to the Asian Development Bank
In our opinion, the accompanying balance sheets and the related statements of income and expenses,
cash flows, and changes in capital and reserves present fairly, in all material respects, the financial
position of the Asian Development Bank (“ADB” or “the Bank”)—Ordinary Capital Resources at
31 December 2008 and 2007, and the results of its operations and its cash flows for the years then
ended, in conformity with accounting principles generally accepted in the United States of America.
Also in our opinion, management’s assertion that ADB maintained effective internal control over
financial reporting as of 31 December 2008 is fairly stated, in all material respects, based on criteria
established in Internal Control—Integrated Framework issued by the Committee of Sponsoring
Organizations of the Treadway Commission (COSO). The management of ADB is responsible for
these financial statements, for maintaining effective internal control over financial reporting and for
its assertion of the effectiveness of internal control over financial reporting, included in the accom-
panying Management’s Report on Internal Control over Financial Reporting. Our responsibility is to
express opinions on these financial statements and on ADB’s internal control over financial report-
ing based on our integrated audit in 2008 and financial statement audit in 2007. We conducted our
audits of the financial statements in accordance with auditing standards generally accepted in the
United States of America and our audit of internal control over financial reporting in accordance
with attestation standards established by the American Institute of Certified Public Accountants.
Those standards require that we plan and perform the audits to obtain reasonable assurance about
whether the financial statements are free of material misstatement and whether effective internal
control over financial reporting was maintained in all material respects. Our audits of the financial
statements included examining, on a test basis, evidence supporting the amounts and disclosures
in the financial statements, assessing the accounting principles used and significant estimates made
by management, and evaluating the overall financial statement presentation. Our audit of internal
control over financial reporting included obtaining an understanding of internal control over financial
reporting, assessing the risk that a material weakness exists, and testing and evaluating the design
and operating effectiveness of internal control based on the assessed risk. Our audits also included
performing such other procedures as we considered necessary in the circumstances. We believe that
our audits provide a reasonable basis for our opinions.
PricewaterhouseCoopers LLPpwc.com/sg 8 Cross Street #17-00PWC BuildingSingapore 048424Telephone (65) 6236 3388Facsimile (65) 6236 3300
GST No.: M90362193L Reg. No.: T09LL0001D
PricewaterhouseCoopers LLP (Registration No. T09LL0001D) is an accounting limited liability partnership registered in Singapore under the Limited Liability Partner-ships Act (Chapter 163A). It was converted from a partnership (with the name “PricewaterhouseCoopers” and Registration no. 000640) to an accounting limited liability partnership on 1 January 2009. PricewaterhouseCoopers LLP is part of the network of member firms of PricewaterhouseCoopers International Limited, each of which is a separate and independent legal entity.

ORD
INA
RY CA
PITAL RESO
URC
ES35Annual Report 2008
Our audits were conducted for the purpose of forming an opinion on the basic financial statements
taken as a whole. The accompanying summary statements of loans and of borrowings as at 31 De-
cember 2008 and 2007, and of statement of subscriptions to capital stock and voting power as at 31
December 2008 are presented for purposes of additional analyses and are not required parts of the
basic financial statements. Such information has been subjected to the auditing procedures applied in
the audits of the basic financial statements and in our opinion, is fairly stated in all material respects
in relation to the basic financial statements taken as a whole.
A company’s internal control over financial reporting is a process effected by those charged with
governance, management, and other personnel, designed to provide reasonable assurance regarding
the preparation of reliable financial statements in accordance with accounting principles generally
accepted in the United States of America. A company’s internal control over financial reporting in-
cludes those policies and procedures that (i) pertain to the maintenance of records that, in reasonable
detail, accurately and fairly reflect the transactions and dispositions of the assets of the company;
(ii) provide reasonable assurance that transactions are recorded as necessary to permit preparation of
financial statements in accordance with generally accepted accounting principles, and that receipts and
expenditures of the company are being made only in accordance with authorizations of management
and those charged with governance; and (iii) provide reasonable assurance regarding prevention, or
timely detection of unauthorized acquisition, use, or disposition of the company’s assets that could
have a material effect on the financial statements.
Because of its inherent limitations, internal control over financial reporting may not prevent or detect
misstatements. Also, projections of any evaluation of effectiveness to future periods are subject to
the risk that controls may become inadequate because of changes in conditions, or that the degree
of compliance with the policies or procedures may deteriorate.
PricewaterhouseCoopers LLP
Public Accountants and Certified Public Accountants
Singapore
5 March 2009

ORD
INA
RY C
API
TAL
RESO
URC
ESAsian Development Bank36
ASIAN DEVELOPMENT BANK—ORDINARY CAPITAL RESOURCES
BALANCE SHEET 31 December 2008 and 2007Expressed in Thousands of United States Dollars (Note B)
A S S E T S
2008 2007
DUE FROM BANKS (Notes B and C) $ 142,238 $ 108,821
INVESTMENTS (Notes B, C, D, L, and P) Government and government-guaranteed obligations $ 6,485,000 $ 2,343,130 Time deposits 1,481,370 7,491,886 Other securities 7,446,149 15,412,519 3,461,927 13,296,943
SECURITIES TRANSFERRED UNDER REPURCHASE AGREEMENT (Notes B and P) 309,358 5,041,387
SECURITIES PURCHASED UNDER RESALE ARRANGEMENT (Notes B and P) 511,756 427,132
LOANS OUTSTANDING (OCR-5) (Notes A, B, E, and Q) (Including FAS 133 adjustment of $451– 2008 and $538 – 2007; net unamortized loan origination costs of $68,262 – 2008 and $42,130 – 2007) Sovereign 34,256,740 29,008,793 Nonsovereign 1,662,494 1,289,129
35,919,234 30,297,922
Less—provision for loan losses 9,174 35,910,060 15,043 30,282,879
EQUITY INVESTMENTS (Notes A, B, G, and P) 641,427 808,157
ACCRUED REVENUE On investments 131,880 143,785 On loans 299,184 431,064 320,514 464,299
RECEIVABLE FROM MEMBERS (Note K) Nonnegotiable, noninterest-bearing demand obligations (Note C) 144,514 174,805
RECEIVABLE FROM SWAPS (Notes B, H, P, and Q) Borrowings 23,831,087 17,968,867 Others 882,793 24,713,880 512,089 18,480,956
OTHER ASSETS Property, furniture, and equipment (Notes B and I) 158,235 154,239 Investment related receivables 229,390 138,149 Unamortized issuance cost of borrowings 2,781 58,869 Miscellaneous (Note N) 114,530 504,936 112,536 463,793
TOTAL $78,721,752 $69,549,172
The accompanying notes are an integral part of these financial statements (OCR-8).

ORD
INA
RY CA
PITAL RESO
URC
ES37Annual Report 2008
OCR-1
LIABILITIES, CAPITAL, AND RESERVES
2008 2007 BORROWINGS (OCR-6) (Notes B, H, J, and P) At amortized cost $ 4,627,521 $28,615,661 At fair value 31,012,976 $35,640,497 2,954,704 $31,570,365
ACCRUED INTEREST ON BORROWINGS 385,949 388,935
PAYABLE FOR SWAPS (Notes B, H, J, P, and Q) Borrowings $24,867,815 $16,936,964 Others 1,198,781 26,066,596 583,320 17,520,284
PAYABLE UNDER SECURITIES REPURCHASE AGREEMENT (Note B) 301,759 5,092,316
ACCOUNTS PAYABLE AND OTHER LIABILITIES Investment related payables 275,066 230,114 Undisbursed technical assistance commitments (Note M) 10,489 2,318 Accrued pension and postretirement medical benefit costs (Note O) 635,300 368,284 Miscellaneous (Notes B, F, I, and N) 136,626 1,057,481 121,686 722,402
TOTAL LIABILITIES 63,452,282 55,294,302
CAPITAL AND RESERVES (OCR-4) Capital stock (OCR-7) (Notes B and K) Authorized and subscribed (SDR35,463,110,000 – 2008 and 2007) 54,890,156 55,977,810 Less—”callable” shares subscribed 51,029,546 52,040,702
“Paid-in” shares subscribed 3,860,610 3,937,108 Less—subscription installments not due 9,848 19,664
Subscription installments matured 3,850,762 3,917,444 Less—capital transferred to the Asian Development Fund 73,691 75,151
3,777,071 3,842,293
Net notional amounts required to maintain value of currency holdings (Notes B and K) (564,383) (661,197) Ordinary reserve (Note L) 9,532,487 9,245,332 Special reserve (Note L) 209,723 202,847 Loan loss reserve (Note L) 195,062 182,100 Surplus (Note L) 894,594 616,300 Cumulative revaluation adjustments account (Note L) (23,336) (110,959) Cumulative effect of FAS 157/159 adoption (Note B) 227,500 – Net income after appropriation (OCR-2) (Note L) 1,119,473 760,174 Accumulated other comprehensive income (OCR-4) (Notes B and L) (98,721) 15,269,470 177,980 14,254,870
TOTAL $78,721,752 $69,549,172

ORD
INA
RY C
API
TAL
RESO
URC
ESAsian Development Bank38
OCR-2
ASIAN DEVELOPMENT BANK—ORDINARY CAPITAL RESOURCES
STATEMENT OF INCOME AND EXPENSES For the Years Ended 31 December 2008 and 2007 Expressed in Thousands of United States Dollars (Note B)
2008 2007
REVENUE (Note M) From loans (Notes B and E) Interest $1,316,105 $1,385,036 Commitment charge 59,668 55,206 Other (17,792) $1,357,981 2,096 $1,442,338
From investments (Notes B and D) Interest 677,175 683,212
From guarantees (Notes B and F) 6,876 5,049
From equity investments 3,737 58,897
From other sources—net (Notes E and R) 18,685 18,835
TOTAL REVENUE $2,064,454 $2,208,331
EXPENSES (Note M) Borrowings and related expenses (Note J) 1,208,391 1,389,778 Administrative expenses (Note M) 141,047 127,327 Technical assistance to member countries 8,357 (683) Provision for losses (Notes B and E) (3,467) (579) Other expenses 6,272 3,998
TOTAL EXPENSES 1,360,600 1,519,841
NET REALIZED GAINS (LOSSES) From loans 525 3,980 From investments (Notes D and M) (24,837) (2,801) From equity investments (Note M) (3,884) 21,793 From borrowings 70 (106) Others 30 39
NET REALIZED (LOSSES) GAINS (28,096) 22,905
NET UNREALIZED GAINS (Note M) 450,591 53,828
NET INCOME $1,126,349 $ 765,223
The accompanying notes are an integral part of these financial statements (OCR-8).

ORD
INA
RY CA
PITAL RESO
URC
ES39Annual Report 2008
OCR-3 ASIAN DEVELOPMENT BANK—ORDINARY CAPITAL RESOURCES
STATEMENT OF CASH FLOWS For the Years Ended 31 December 2008 and 2007 Expressed in Thousands of United States Dollars (Note B)
2008 2007 CASH FLOWS FROM OPERATING ACTIVITIES Interest and other charges on loans received $ 1,230,411 $ 1,202,933 Interest on investments received 633,155 635,459 Interest received for securities purchased under resale arrangement 5,634 17,080 Interest and other financial expenses paid (913,351) (1,236,490) Administrative expenses paid (118,517) (95,784) Technical assistance disbursed (136) (1,477) Others—net 49,153 13,452
Net Cash Provided by Operating Activities 886,349 535,173
CASH FLOWS FROM INVESTING ACTIVITIES Sales of investments 7,979,848 8,205,482 Maturities of investments 152,126,260 176,587,583 Purchases of investments (162,198,163) (184,797,477) Net receipts (payments) on future contracts 1,082 (372) Net (payments for) receipts from securities purchased under resale arrangement (61,122) 1,990 Principal collected on loans 1,919,052 1,454,419 Loans disbursed (6,340,161) (5,074,927) Net currency and interest rate swaps 2,097 (8,329) Property, furniture, and equipment acquired (20,302) (9,569) Purchases of equity investments (125,697) (115,603) Sales of equity investments 53,550 112,107
Net Cash Used in Investing Activities (6,663,556) (3,644,696)
CASH FLOWS FROM FINANCING ACTIVITIES Net proceeds of new borrowings 11,803,386 11,874,946 Borrowings redeemed (6,301,308) (9,137,838) Matured capital subscriptions collected1 4,618 4,618 Borrowing issuance expenses paid (13,030) (30,506) Demand obligations of members encashed 9,255 8,068 Net currency and interest rate swaps 408,500 368,067 Resources transferred to ADF (40,000) (40,000) Resources transferred to TASF (23,000) – Resources transferred to CCF (40,000) – Resources transferred to RCIF – (40,000)
Net Cash Provided by Financing Activities 5,808,421 3,007,355
Effect of Exchange Rate Changes on Due from Banks 2,203 5,571
Net Increase (Decrease) in Due from Banks 33,417 (96,597)
Due from Banks at Beginning of Year 108,821 205,418
Due from Banks at End of Year $ 142,238 $ 108,821
RECONCILIATION OF NET INCOME TO NET CASH PROVIDED BY OPERATING ACTIVITIES: Net Income (OCR-2) $ 1,126,349 $ 765,223 Adjustments to reconcile net income to net cash provided by operating activities: Depreciation and amortization 301,985 81,127 Provision for losses written back—net (3,467) (579) Net realized losses (gains) from investments and other borrowings 19,963 (18,886) Proportionate share in losses (earnings) on equity investments 12,160 (47,827) Net unrealized gains (450,591) (53,828) Change in accrued revenue from loans, investments, and other swaps (116,103) (252,022) Change in receivable from ADF - allocation of administrative expenses (2,973) (2,902) Change in accrued interest on borrowings and swaps, and other expenses 224,249 144,002 Change in undisbursed technical assistance commitments 8,171 (2,409) Change in pension and postretirement benefit liability (259,835) (60,171) Others—net 26,441 (16,555)
Net Cash Provided by Operating Activities $ 886,349 $ 535,173
1 Supplementary disclosure of noncash financing activities: Nonnegotiable, noninterest-bearing demand promissory notes amounting to $2,726 ($2,738 - 2007) were received from members.
The accompanying notes are an integral part of these financial statements (OCR-8).

ORD
INA
RY C
API
TAL
RESO
URC
ESAsian Development Bank40
ASIAN DEVELOPMENT BANK—ORDINARY CAPITAL RESOURCES
STATEMENT OF CHANGES IN CAPITAL AND RESERVES For the Years Ended 31 December 2008 and 2007 Expressed in Thousands of United States Dollars (Notes B and K)
Cumulative Accumulated Net Notional Revaluation Net Income Other Capital Maintenance Ordinary Special Loan Loss Adjustments After Comprehensive Stock of Value Reserve Reserve Reserve Surplus Account Appropriations Income Total
Balance- 1 January 2007 $3,652,800 $(672,899) $8,993,737 $197,799 $130,100 $330,117 $ 27,519 $565,886 $ (82,160) $13,142,899
Comprehensive income for the year 2007 (Note L) 765,223 260,140 1,025,363 Appropriation of guarantee fees to Special Reserve (Note L) 5,049 (5,049) –Change in SDR value of paid-in shares subscribed 185,667 185,667 Change in subscription installments not due (2,889) (2,889)Additional paid-in shares subscribed during the year 10,242 10,242 Change in SDR value of capital transferred to Asian Development Fund (3,527) (3,527)Change in notional maintenance of value (Note K) 11,702 11,702 Allocation of 2006 net income to ordinary reserve, loan loss reserve and surplus and transfer from cumulative revaluation account (Note L) 286,183 52,000 286,183 (138,479) (485,886) – Allocation of 2006 net income to ADF and RCIF (Note L) (80,000) (80,000)Charge to ordinary reserve for change in SDR value of capital stock (Note L) (34,587) (34,587)
Balance- 31 December 2007 $3,842,293 $(661,197) $9,245,332 $202,847 $182,100 $616,300 $(110,959) $760,174 $177,980 $14,254,870

ORD
INA
RY CA
PITAL RESO
URC
ES41Annual Report 2008
Cumulative Accumulated Net Notional Revaluation Net Income Other Capital Maintenance Ordinary Special Loan Loss Adjustments After Comprehensive Stock of Value Reserve Reserve Reserve Surplus Account Appropriations Income Total
Balance- 31 December 2007 $ 3,842,293 $ (661,197) $ 9,245,332 $ 202,847 $ 182,100 $ 616,300 $(110,959) $ 760,174 $177,980 $ 14,254,870
Cumulative effect of FAS 157/159 adoption 227,500 227,500 Comprehensive income for the year 2008 (Note L) 1,126,349 (276,701) 849,648 Appropriation of guarantee fees to Special Reserve (Note L) 6,876 (6,876) – Change in SDR value of paid-in shares subscribed (74,035) (74,035)Change in subscription installments not due 7,353 7,353 Change in SDR value of capital transferred to Asian Development Fund 1,460 1,460 Change in notional maintenance of value (Note K) 96,814 96,814 Allocation of 2007 net income to ordinary reserve, loan loss reserve and surplus and transfer to cumulative revaluation account (Note L) 278,294 12,962 278,294 87,623 (657,174) – Allocation of 2007 net income to ADF, TASF and CCF (Note L) (103,000) (103,000)Charge to ordinary reserve for change in SDR value of capital stock (Note L) 8,860 8,860
Balance- 31 December 2008 $3,777,071 $(564,383) $9,532,487 $209,723 $195,062 $894,594 $(23,336) $1,346,973 $(98,721) $15,269,470
Note: Figures may not add to total due to rounding.
Accumulated Other Comprehensive Income (Note L) For the Years Ended 31 December 2008 and 2007 Expressed in Thousands of United States Dollar (Note B)
Pension/ FAS 133 Accumulated Unrealized Postretirement Accumulated Other Adjustments and Translation Investment Liability Adjustment- Comprehensive Amortization Adjustments Holding Gains FAS 158 Income
2008 2007 2008 2007 2008 2007 2008 2007 2008 2007
Balance, 1 January $ (289) $ (1,154) $(113,385) $(200,039) $433,376 $200,584 $(141,722) $(81,551) $177,980 $(82,160)Amortization (669) 865 – – – – – – (669) 865 Other comprehensive income for the year – – (43,420) 86,654 27,223 232,792 (259,835) (60,171) (276,032) 259,275
Balance, 31 December $ (958) $ (289) $(156,805) $(113,385) $460,599 $433,376 $(401,557) $(141,722) $(98,721) $177,980
The accompanying notes are an integral part of these financial statements (OCR-8).
OCR-4

ORD
INA
RY C
API
TAL
RESO
URC
ESAsian Development Bank42
ASIAN DEVELOPMENT BANK—ORDINARY CAPITAL RESOURCES
SUMMARY STATEMENT OF LOANS 31 December 2008 and 2007Expressed in Thousands of United States Dollars (Note B)
Undisbursed Loans Loans Balances of Not Yet Total Percent of Borrowers/Guarantors Outstanding1 Effective Loans2 Effective Loans Total Loans
Afghanistan $ 72,745 $ 31,667 $ – $ 104,412 0.18Azerbaijan 55,328 235,552 215,400 506,280 0.90Bangladesh 517,884 822,182 82,000 1,422,066 2.52Bhutan – – 51,000 51,000 0.09Cambodia 7,000 – – 7,000 0.01 China, People’s Rep. of 8,464,133 4,223,072 1,658,852 14,346,057 25.38Cook Islands – – 8,630 8,630 0.02Fiji Islands 94,832 24,565 – 119,397 0.21Georgia 25,000 – – 25,000 0.04India 6,453,809 4,289,109 1,563,480 12,306,398 21.77Indonesia 10,160,917 545,360 95,000 10,801,277 19.11Kazakhstan 216,529 25,128 390,000 631,657 1.12Korea, Rep. of 108,847 – – 108,847 0.19Lao People’s Dem. Rep. 62,743 7,257 – 70,000 0.12Malaysia 212,368 – – 212,368 0.38Maldives 1,500 10,500 – 12,000 0.02Marshall Islands 3,142 – – 3,142 0.01Micronesia, Fed. States of 101 4,699 – 4,800 0.01Mongolia 12,500 2,000 – 14,500 0.03Myanmar – – – – – Nauru 1,214 – – 1,214 0.00Nepal 16,929 – – 16,929 0.03Pakistan 4,345,421 2,003,171 599,300 6,947,892 12.29Papua New Guinea 123,821 113,878 – 237,699 0.42Philippines 3,891,694 171,821 490,000 4,553,515 8.06Sri Lanka 319,722 566,342 7,500 893,564 1.58Thailand 51,145 – – 51,145 0.09Uzbekistan 440,428 301,006 85,000 826,434 1.46Viet Nam 173,220 425,787 1,552,200 2,151,207 3.84
35,832,972 13,803,096 6,798,362 56,434,430 99.88Regional 18,000 14,500 32,500 65,000 0.12
TOTAL – 31 December 2008 35,850,972 13,817,596 6,830,862 56,499,430 100.00 Provision for loan losses (9,174) – – (9,174) Unamortized loan origination cost – net 68,262 – – 68,262
NET BALANCE – 31 December 2008 $35,910,060 $13,817,596 $6,830,862 $56,558,518
Made up of: Sovereign Loans $34,252,384 $13,099,342 $5,498,830 $52,850,556 Nonsovereign Loans Private Sector 1,573,676 718,254 1,032,032 3,323,962 Public Sector 84,000 – 300,000 384,000
Net balance – 31 December 2008 $35,910,060 $13,817,596 $6,830,862 $56,558,518
TOTAL – 31 December 2007 $30,255,792 $12,971,665 $6,039,610 $49,267,067 Provision for loan losses (15,043) – – (15,043) Unamortized front-end fee 42,130 – – 42,130
NET BALANCE – 31 December 2007 $30,282,879 $12,971,665 $6,039,610 $49,294,154
Made up of: Sovereign Loans $29,003,104 $12,814,137 $5,061,815 $46,879,056 Nonsovereign Loans Private Sector 1,248,775 113,528 797,795 2,160,098 Public Sector 31,000 44,000 180,000 255,000
Net balance – 31 December 2007 $30,282,879 $12,971,665 $6,039,610 $49,294,154
1 Amounts outstanding on the multicurrency fixed lending rate loans totaled $33,734 ($38,049 - 2007), on pool-based loans totaled $10,257,327 ($10,861,527 - 2007) and on LIBOR-based loans and market-based loans totaled $25,559,911 ($19,356,215 - 2007). The average yield on loans was 3.84% (5% - 2007).
2 Of the undisbursed balances, ADB has made irrevocable commitments to disburse various amounts totaling $333,541 ($361,280 - 2007).

ORD
INA
RY CA
PITAL RESO
URC
ES43Annual Report 2008
MATURITY OF EFFECTIVE LOANS
Twelve Months Five Years Ending Ending 31 December Amount 31 December Amount 2009 $ 1,987,970 2018 14,245,184 2010 2,370,739 2023 11,685,193 2011 2,641,966 2028 7,521,777 2012 2,935,736 2033 3,086,366 2013 3,152,033 over 2033 41,604 Total $49,668,568 3
SUMMARY OF CURRENCIES RECEIVABLE ON LOANS OUTSTANDING
Currency 2008 2007 Currency 2008 2007 Chinese yuan $ 83,098 $ 23,001 Kazakhstan tenge 39,727 49,776 Euro – 920 Pakistan rupee 131 –Japanese yen 5,566,126 4,607,011 Philippine peso 81,011 42,856 Indian rupee 190,354 143,024 Swiss franc 3,247 3,502 Indonesian rupiah 10,762 – United States dollar 29,876,516 25,385,702
Total $35,850,972 $30,255,792
3 Includes undisbursed commitment relating to Revolving Credit Facility of Trade Financing Facilitation Program amounting to $14,500.
The accompanying notes are an integral part of these financial statements (OCR-8).
OCR-5

ORD
INA
RY C
API
TAL
RESO
URC
ESAsian Development Bank44
ASIAN DEVELOPMENT BANK—ORDINARY CAPITAL RESOURCES
SUMMARY STATEMENT OF BORROWINGS 31 December 2008 and 2007Expressed in Thousands of United States Dollars (Note B)
Borrowings Swap Arrangements2
Principal Outstanding1 Payable (Receivable)3
2008 2007 2008 2007
Australian dollar $ 6,010,372 $ 5,729,446 $ (6,094,769) $(5,463,460)Canadian dollar 1,327,790 1,526,591 (1,496,399) (1,521,721)Chinese yuan 145,574 136,909 28,805 14,363 (31,718) Euro 42,851 47,117 (45,899) (45,819)Hong Kong dollar 365,694 345,983 (367,466) (353,274)Indian rupee 100,867 126,791 26,779 16,384 (27,398) Japanese yen 3,639,786 4,607,002 4,472,977 2,706,761 (3,285,653) (3,220,956)Kazakhstan tenge 39,727 49,776 – –Malaysian ringgit 472,027 421,941 (447,571) (421,221)Mexican peso 121,615 155,913 (123,482) (153,378)New Taiwan dollar 153,801 146,437 (154,063) (146,437)New Zealand dollar 402,099 463,271 (413,403) (464,535)Philippine peso 150,736 168,824 3,584 (130,271) (121,092) Pound sterling 882,641 695,816 (767,883) (517,914)Singapore dollar 400,826 380,307 (404,681) (392,574)South African rand 2,469,917 1,850,334 (2,483,788) (1,742,132)Swiss franc 414,266 374,924 Thai baht 327,484 349,708 (329,481) (356,683)Turkish lira 1,416,566 474,746 (1,334,657) (483,611)United States dollar 16,787,230 13,517,474 20,335,670 14,199,456 (5,901,684) (2,554,881)
Subtotal 35,671,869 31,569,310 $ 1,036,728 $(1,031,903)
Unamortized discounts/ premiums and transition adjustments (31,372) 1,055ATAFAS 133 Adjustments
Total $35,640,497 $31,570,365
MATURITY STRUCTURE OF BORROWINGS OUTSTANDING5
Twelve Months Ending Five Years Ending 31 December Amount 31 December Amount
2009 6,877,509 2018 8,233,829 2010 6,723,106 2023 215,601 2011 4,981,028 2028 2,237,164 2012 3,262,047 2033 39,247 2013 3,102,338 over 2034 –
Total $35,671,869
1 Reported at Fair Value upon adoption of FAS 157/159 effective 1 January 2008, except for unswapped borrowings which are reported at net of principal amount and unamortized discount/premium of zero coupon bonds. The aggregate face amounts and discounted values of zero coupon and deep discount borrowings (in United States dollar equivalents) are:
Aggregate Face Amount Discounted Value
2008 2007 2008 2007 Australian dollar $1,188,688 $1,506,016 $1,040,308 $1,258,707 Canadian dollar 657,516 814,913 554,656 660,746 Philippine peso 52,615 60,643 44,914 47,538 South African rand 386,809 161,672 305,381 125,014 Swiss franc 461,212 434,223 320,561 286,703 Turkish lira 712,080 255,334 552,518 217,699 United States dollar 1,898,326 1,977,963 1,445,211 1,229,074
2 Include currency and interest rate swaps. At 31 December 2008, the remaining maturity of swap agreements ranged from less than one year to 35 years. Ap-proximately 81.57% of the swap receivables and 87.29% of the payables are due before 1 January 2014.
3 Adjusted by the cumulative effect of the adoption of FAS 133 effective 1 January 2001.

ORD
INA
RY CA
PITAL RESO
URC
ES45Annual Report 2008
OCR-6
Net Currency Obligation3 Weighted Average
2008 2007 Cost (%) After Swaps4
$ (84,397) $ 265,986 (11.75) (168,609) 4,870 3.67 142,661 151,272 4.43
(3,048) 1,298 0.63 (1,772) (7,291) 0.18 100,248 143,175 7.39
4,827,110 4,092,807 1.18
39,727 49,776 6.69 24,456 720 0.47 (1,867) 2,535 0.05 (262) – 0.10 (11,304) (1,264) (6.50) 33,228 38,553 3.11
114,758 177,902 11.80 (3,855) (12,267) 1.93 (13,871) 108,202 3.88 414,266 374,924 5.33 (1,997) (6,975) 30.17 81,909 (8,865) (0.06) 31,221,216 25,162,049 3.62
$ 36,708,597 $ 30,537,407 3.32
2.54 (1.75)
4.11
INTEREST RATE SWAP ARRANGEMENTS Average Rate (%)
Notional Receive Pay Amount Fixed Floating6 Maturing Through7
Receive Fixed Swaps: Australian dollar8 $ 55,350 2.64 0.66 2027-2032 Chinese yuan 146,299 3.34 4.26 2015 Euro9 110,699 4.40 3.62 2010 Indian rupee 103,167 5.40 7.77 2014 Philippine peso 34,362 4.92 2010 United States dollar 11,151,658 3.51 2.64 2009-2043 United States dollar10 55,350 2.14 0.60 2016-2027
Receive Floating Swaps: Japanese yen 742,237 0.88 0.62 0.59 2009-2032 United States dollar 1,000,000 1.91 2.82 2011
Total $13,399,122
4 Calculation is based on average carry book value of borrowings net of fair value of swaps. Thus, the weighted average cost may be negative if the related swaps payable exposure is in a different currency and the fair value of swaps receivable exceeds the carry book value of borrowings.
5 Bonds with put and call options were considered maturing on the first put or call date. 6 Represent average current floating rates, net of spread. 7 Swaps with early termination date were considered maturing on the first termination date. 8 Consists of dual currency swaps with interest receivable in Australian dollar and interest payable in Japanese yen. 9 Consists of dual currency swap with interest receivable in Euro and interest payable in Japanese yen. 10 Consists of dual currency swaps with interest receivable in United States dollar and interest payable in Japanese yen. The accompanying notes are an integral part of these financial statements (OCR-8).

ORD
INA
RY C
API
TAL
RESO
URC
ESAsian Development Bank46
ASIAN DEVELOPMENT BANK—ORDINARY CAPITAL RESOURCES
STATEMENT OF SUBSCRIPTIONS TO CAPITAL STOCK AND VOTING POWER 31 December 2008Expressed in Thousands of United States Dollars (Note B)
SUBSCRIBED CAPITAL VOTING POWER
Number of Percent Par Value Of Shares Number of Percent MEMBERS Shares of Total Total Callable Paid-in Votes of Total
REGIONAL Afghanistan 1,195 0.034 $ 18,496 $ 12,584 $ 5,913 14,427 0.325 Armenia 10,557 0.298 163,402 151,918 11,485 23,789 0.537 Australia 204,740 5.773 3,168,986 2,947,061 221,925 217,972 4.917 Azerbaijan 15,736 0.444 243,563 226,429 17,134 28,968 0.653 Bangladesh 36,128 1.019 559,193 520,033 39,160 49,360 1.114 Bhutan 220 0.006 3,405 3,049 356 13,452 0.303 Brunei Darussalam 12,462 0.351 192,888 179,329 13,559 25,694 0.580 Cambodia 1,750 0.049 27,087 22,474 4,612 14,982 0.338 China, People’s Rep. of 228,000 6.429 3,529,007 3,281,806 247,201 241,232 5.442 Cook Islands 94 0.003 1,455 1,362 93 13,326 0.301 Fiji Islands 2,406 0.068 37,240 34,625 2,616 15,638 0.353 Georgia 12,081 0.341 186,991 173,850 13,141 25,313 0.571 Hong Kong, China 19,270 0.543 298,263 277,368 20,895 32,502 0.733 India 224,010 6.317 3,467,249 3,224,444 242,805 237,242 5.352 Indonesia 192,700 5.434 2,982,630 2,773,768 208,861 205,932 4.646 Japan 552,210 15.571 8,547,162 7,948,593 598,569 565,442 12.756 Kazakhstan 28,536 0.805 441,683 410,742 30,941 41,768 0.942 Kiribati 142 0.004 2,198 2,043 155 13,374 0.302 Korea, Republic of 178,246 5.026 2,758,909 2,565,727 193,182 191,478 4.320 Kyrgyz Republic 10,582 0.298 163,789 152,320 11,469 23,814 0.537 Lao PDR 492 0.014 7,615 6,795 820 13,724 0.310 Malaysia 96,350 2.717 1,491,315 1,386,869 104,446 109,582 2.472 Maldives 142 0.004 2,198 2,043 155 13,374 0.302 Marshall Islands 94 0.003 1,455 1,362 93 13,326 0.301 Micronesia, Fed. States of 142 0.004 2,198 2,043 155 13,374 0.302 Mongolia 532 0.015 8,234 7,662 573 13,764 0.310 Myanmar 19,270 0.543 298,263 277,368 20,895 32,502 0.733 Nauru 142 0.004 2,198 2,043 155 13,374 0.302 Nepal 5,202 0.147 80,517 74,868 5,650 18,434 0.416 New Zealand 54,340 1.532 841,080 782,186 58,894 67,572 1.524 Pakistan 77,080 2.174 1,193,052 1,109,501 83,551 90,312 2.037 Palau 114 0.003 1,765 1,641 124 13,346 0.301 Papua New Guinea 3,320 0.094 51,387 47,812 3,575 16,552 0.373 Philippines 84,304 2.377 1,304,866 1,213,499 91,367 97,536 2.200 Samoa 116 0.003 1,795 1,610 186 13,348 0.301 Singapore 12,040 0.340 186,356 173,308 13,048 25,272 0.570 Solomon Islands 236 0.007 3,653 3,405 248 13,468 0.304 Sri Lanka 20,520 0.579 317,611 295,369 22,242 33,752 0.761 Taipei,China 38,540 1.087 596,526 554,766 41,760 51,772 1.168 Tajikistan 10,134 0.286 156,855 145,819 11,036 23,366 0.527 Thailand 48,174 1.358 745,642 693,419 52,223 61,406 1.385 Timor-Leste 350 0.010 5,417 5,030 387 13,582 0.306 Tonga 142 0.004 2,198 2,043 155 13,374 0.302 Turkmenistan 8,958 0.253 138,653 128,902 9,751 22,190 0.501 Tuvalu 50 0.001 774 712 62 13,282 0.300 Uzbekistan 23,834 0.672 368,905 343,072 25,833 37,066 0.836 Vanuatu 236 0.007 3,653 3,405 248 13,468 0.304 Viet Nam 12,076 0.341 186,914 165,476 21,437 25,308 0.571
Total Regional (Forward) 2,247,995 63.390 34,794,691 32,341,552 2,453,140 2,883,131 65.040

ORD
INA
RY CA
PITAL RESO
URC
ES47Annual Report 2008
SUBSCRIBED CAPITAL VOTING POWER
Number of Percent Par Value Of Shares Number of Percent MEMBERS Shares of Total Total Callable Paid-in Votes of Total
Total Regional (Forward) 2,247,995 63.390 34,794,691 32,341,552 2,453,140 2,883,131 65.040
NONREGIONAL Austria 12,040 0.340 186,356 173,308 13,048 25,272 0.570 Belgium 12,040 0.340 186,356 173,308 13,048 25,272 0.570 Canada 185,086 5.219 2,864,780 2,664,168 200,612 198,318 4.474 Denmark 12,040 0.340 186,356 173,308 13,048 25,272 0.570 Finland 12,040 0.340 186,356 173,308 13,048 25,272 0.570 France 82,356 2.322 1,274,714 1,185,437 89,278 95,588 2.156 Germany 153,068 4.316 2,369,202 2,203,277 165,925 166,300 3.752 Ireland 12,040 0.340 186,356 173,246 13,110 25,272 0.570 Italy 63,950 1.803 989,824 920,498 69,326 77,182 1.741 Luxembourg 12,040 0.340 186,356 173,246 13,110 25,272 0.570 The Netherlands 36,294 1.023 561,762 522,432 39,330 49,526 1.117 Norway 12,040 0.340 186,356 173,308 13,048 25,272 0.570 Portugal 12,040 0.340 186,356 173,246 13,110 25,272 0.570 Spain 12,040 0.340 186,356 173,308 13,048 25,272 0.570 Sweden 12,040 0.340 186,356 173,308 13,048 25,272 0.570 Switzerland 20,650 0.582 319,623 297,226 22,397 33,882 0.764 Turkey 12,040 0.340 186,356 173,308 13,048 25,272 0.570 United Kingdom 72,262 2.038 1,118,478 1,040,159 78,319 85,494 1.929 United States 552,210 15.571 8,547,162 7,948,593 598,569 565,442 12.756
Total Nonregional 1,298,316 36.610 20,095,465 18,687,995 1,407,470 1,549,724 34.960
TOTAL 3,546,311 100.000 $54,890,156 $51,029,546 $3,860,610 4,432,855 100.000
Note: Figures may not add due to rounding.
The accompanying notes are an integral part of these financial statements (OCR-8).
OCR-7

ASIAN DEVELOPMENT BANK—ORDINARY CAPITAL RESOURCES
NOTES TO FINANCIAL STATEMENTS31 December 2008 and 2007
Asian Development Bank48O
RDIN
ARY
CA
PITA
L RE
SOU
RCES
NOTE A—NATURE OF OPERATIONS AND LIMITATIONS ON LOANS, GUARANTEES AND EQUITY INVESTMENTS
Nature of Operations
The Asian Development Bank (ADB), a multilateral de-
velopment financial institution, was established in 1966
with its headquarters in Manila, Philippines. ADB and its
operations are governed by the Agreement Establishing
the Asian Development Bank (the Charter). Its purpose
is to foster economic development and co-operation in
the Asian and Pacific region and to contribute to the
acceleration of the process of economic development
of the developing member countries (DMCs) in the
region, collectively and individually. With the adoption
of its poverty reduction strategy at the end of 1999,
ADB made reducing poverty in the region its main goal.
ADB provides financial and technical assistance (TA) for
projects and programs, which will contribute to achieving
this purpose.
Mobilizing financial resources, including
cofinancing, is an integral part of ADB's operational
activities. In addition, ADB, alone or jointly, administers
on behalf of donors, including members, their agencies
and other development institutions, funds restricted for
specific uses, which include TA grants as well as regional
programs.
ADB's ordinary operations comprise loans, equity
investments, and guarantees. During the years 2001 and
2002, limited technical assistance to member countries
to support high priority TA programs was included. ADB
finances its ordinary operations through borrowings,
paid-in capital, and reserves.
Limitations on Loans, Guarantees, and Equity Investments
Article 12, paragraph 1 of the Charter provides that the
total amount outstanding of loans, equity investments,
and guarantees made by ADB shall not exceed the total
of ADB's unimpaired subscribed capital, reserves, and
surplus, exclusive of the special reserve. In December
2008, the Board of Directors approved the revised pol-
icy on ADB’s lending limitations, which limits the total
amount of disbursed loans, approved equity investments,
and the maximum amount that could be demanded from
ADB under its guarantee portfolio, to the total amount
of ADB's unimpaired subscribed capital, reserves and
surplus. At 31 December 2008 and 2007, the total of such
loans, equity investments, and guarantees aggregated
approximately 55.7% and 46.9%, respectively, of the
total subscribed capital, reserves, and surplus as defined,
based on this new policy.
Article 12, paragraph 3 of the Charter provides
that equity investments shall not exceed 10% of the
unimpaired paid-in capital together with reserves
and surplus, exclusive of the special reserve. At 31
December 2008, such equity investments represented
approximately 6.1% (7.6% - 2007) of the paid-in capital,
reserves, and surplus, as defined.
NOTE B—SUMMARY OF SIGNIFICANT ACCOUNTING POLICIES
Functional Currencies and Reporting Currency
The currencies of members are all functional currencies
as these are the currencies of the primary economic envi-
ronment in which ADB generates and expends cash. The
reporting currency is the United States dollar (USD).
Translation of Currencies
ADB adopts the use of daily exchange rates for account-
ing and financial reporting purposes. This allows transac-
tions in currencies other than USD to be translated to
the reporting currency using exchange rates applicable at
the time of transactions. At the end of each accounting
month, translations of assets, liabilities, capital, and re-
serves denominated in non-USD are adjusted using the
applicable rates of exchange at the end of the reporting
period. These translation adjustments, other than those
relating to the non-functional currencies (Note M) and
to the maintenance of Special Drawing Right (SDR)
capital values (Notes K and L), are charged or credited to
“Accumulated translation adjustments” and reported in
“CAPITAL AND RESERVES” as part of “Accumulated
other comprehensive income.”
Valuation of Capital Stock
The authorized capital stock of ADB is defined in Article
4, paragraph 1 of the Charter “in terms of United States
dollars of the weight and fineness in effect on 31 January
1966” (the 1966 dollar) and the value of each share is

OCR-8
31 December 2007 and 200631 December 2007 and 2006
49Annual Report 2008O
RDIN
ARY C
APITA
L RESOU
RCES
CONTINUED
defined as 10,000 1966 dollars. The capital stock had his-
torically been translated into the current United States
dollar (ADB's unit of account) on the basis of its par value
in terms of gold. From 1973 until 31 March 1978, the rate
arrived at on this basis was $1.20635 per 1966 dollar. Since
1 April 1978, at which time the Second Amendment to
the Articles of Agreement of the International Monetary
Fund (IMF) came into effect, currencies no longer have
par values in terms of gold. Pending ADB's selection of
the appropriate successor to the 1966 dollar, the capital
stock has been valued for purposes of these financial
statements in terms of the SDR at the value in current
United States dollars as computed by the IMF, with each
share valued at SDR10,000.
As of 31 December 2008, the value of the SDR in
terms of the current United States dollar was $1.54781
($1.57848 – 2007) giving a value for each share of ADB's
capital equivalent to $15,478.10 ($15,784.80 – 2007).
However, ADB could decide to fix the value of each share
at $12,063.50 based on the 31 March 1978 par value of
the United States dollar in terms of gold.
Derivative Financial Instruments
ADB reports all derivative transactions in accordance
with Statement of Financial Accounting Standards
(FAS) No. 133, “Accounting for Derivative Instruments
and Hedging Activities,” along with its amendments,
collectively referred as FAS 133. FAS 133 requires that
derivative instruments be recorded in the Balance Sheet
as either assets or liabilities measured at fair value. The
initial application of FAS 133 in January 2001 gave rise to
a transition loss of $81,657,000 in other comprehensive
income and a gain of $34,656,000 was reported in net
income. The amount recorded in other comprehensive
income as transition loss is being reclassified into earn-
ings in the same period or periods in which the underlying
transactions affect earnings.
In applying FAS 133 for purposes of financial
statement reporting, ADB has elected not to define any
qualifying hedging relationships. Rather, all derivative
instruments, as defined by FAS 133, have been marked
to fair value, and all changes in fair value have been
recognized in net income. ADB has elected not to
define any qualifying hedging relationships, not because
economic hedges do not exist, but rather because the
application of FAS 133 hedging criteria does not make
fully evident ADB’s risk management strategies.
In February 2006, the Financial Accounting
Standards Board issued FAS 155, “Accounting for Certain
Hybrid Financial Instruments, an amendment of FASB
Statements No. 133 and 140.” ADB decided to early adopt
the provisions which allow hybrid financial instruments
that contain embedded derivatives requiring bifurcation
under FAS 133 to be measured at fair value, effective 1
January 2006. With this, FAS 133 as presented in ADB’s
financial statements incorporates the provisions of FAS
155.
ADB issues hybrid instruments, i.e. structured
debts, to lower its cost of borrowings, which are generally
fully hedged through derivative transactions. ADB
measures and reports any of its qualified bifurcable
structured debts and their corresponding derivatives at
fair value with changes in fair value recognized in net
income. This consistent accounting treatment would
fully capture the economic hedging relationship between
the hybrid instruments and their derivatives.
Investments
All investment securities and negotiable certificate of
deposits held by ADB other than derivative instruments
are considered by Management to be “Available for
Sale” and are reported at estimated fair value, which
represents their fair market value. Time deposits are
reported at cost, which is a reasonable estimate of
fair value. Unrealized gains and losses are reported in
“CAPITAL AND RESERVES” as part of “Accumulated
other comprehensive income.” Realized gains and
losses are included in income from investments and are
measured by the difference between amortized cost
and the net proceeds of sales. With respect to exchange
traded futures, realized gains or losses are reported based
on daily settlement of the net cash margin.
Interest income on investment securities and time
deposits is recognized as earned and reported, net of
amortizations of premiums and discounts.
Unrealized losses on investment securities are
assessed to determine whether the impairment is
deemed to be other than temporary. If the impairment
is deemed to be other than temporary, the investment is
written down to the impaired value, which becomes the
new cost basis of the investments. Impairment losses are
not reversed for subsequent recoveries in the value of
the investments, until it is sold.

ASIAN DEVELOPMENT BANK—ORDINARY CAPITAL RESOURCES
NOTES TO FINANCIAL STATEMENTS31 December 2008 and 2007
Asian Development Bank50O
RDIN
ARY
CA
PITA
L RE
SOU
RCES
Securities Transferred Under Repurchase Agreement and Securities Purchased Under Resale Arrangement
ADB accounts for transfers of financial assets in ac-
cordance with FAS 140, “Accounting for Transfers and
Servicing of Financial Assets and Extinguishments
of Liabilities - a replacement of FAS 125.” In general,
transfers are accounted for as sales when control over
the transferred assets has been relinquished. Otherwise
the transfers are accounted for as repurchase/resale
agreements and collateralized financing arrangements.
Under repurchase agreements, securities transferred are
recorded as assets and reported at estimated fair value
and cash collateral received are recorded as liabilities.
ADB monitors the fair value of the securities transferred
under repurchase agreements and the collateral. Under
resale arrangements, securities purchased are recorded
as assets, while securities received are not recorded as
liabilities and are not re-pledged. All outstanding securi-
ties as of 31 December 2008 and 2007 classified under
securities transferred under repurchase agreement cor-
rectly reflect the nature of the transactions.
Loans
ADB's loans are made to or guaranteed by members, with
the exception of nonsovereign loans, and have maturities
ranging between 3 and 32 years. ADB requires its borrow-
ers to absorb exchange risks attributable to fluctuations
in the value of the currencies which it has disbursed.
Loan interest income and loan commitment fees are
recognized on accrual basis. In line with ADB's principle
of cost pass through pricing, any variation in the actual
cost of borrowings is passed to LIBOR-based borrowers
as surcharge or rebate.
It is the policy of ADB to place loans in non-accrual
status for which principal, interest, or other charges
are overdue by six months. Interest and other charges
on non-accruing loans are included in income only to
the extent that payments have been received by ADB.
ADB maintains a position of not taking part in debt
rescheduling agreements with respect to sovereign loans.
In the case of nonsovereign loans, ADB may agree to debt
rescheduling only after alternative courses of action have
been exhausted.
ADB determines that a loan is impaired and
therefore subject to provisioning when principal or
interest is in arrears for one year for sovereign loans
(unless there is clear and convincing evidence warranting
the deferment or acceleration of such provisioning) and
six months for nonsovereign loans. If the present value
of expected future cash flows discounted at the loan’s
effective interest rate is less than the carrying value
of the loan, a valuation allowance is established with a
corresponding charge to provision for loan losses.
ADB’s periodic evaluation of the adequacy of the
provision for loan losses is based on its past loan loss
experience, known and inherent risks in existing loans,
and adverse situations that may affect a borrower’s ability
to repay.
In December 2006, the Board approved the
application of the concept of expected loss for
nonsovereign credit exposure to establish loss provision
and loss reserve, the same concept that was applied to
sovereign operations in 2004. In line with accounting
principles generally accepted in the United States of
America, the amount of expected loss pertaining to
credit exposures that are impaired and rated substandard
or worse is charged to the income statement, following
the discounted cash flow method described above, while
those that are better are recorded as loss reserve in the
equity section of the balance sheet. Any adjustment
to loan loss reserve following this new methodology is
subject to the approval of the Board of Governors.
Effective 2000, ADB levies front-end fees on all new
sovereign loans. These fees are deferred and amortized
over the life of the loans after offsetting deferred direct
loan origination costs. In 2004, ADB waived the entire
front-end fee on all new sovereign loans approved during
the year. Subsequently, the policy was extended to
cover the period up to June 2009. In December 2007,
the Board approved the elimination of front-end fees on
sovereign LIBOR-based loans negotiated on and after 1
October 2007.
ADB levies a commitment charge on the
undisbursed balance of effective loans. Unless otherwise
provided by the loan agreement, the charges take effect
commencing on the 60th day after the loan signing date
and are credited to loan income.
Guarantees
ADB extends guarantees to sovereign and nonsovereign
borrowers. Guarantees are regarded as outstanding when
the underlying financial obligation of the borrower is
incurred. ADB would be required to perform under its

OCR-8
31 December 2007 and 200631 December 2007 and 2006
51Annual Report 2008O
RDIN
ARY C
APITA
L RESOU
RCES
CONTINUED
guarantees if the payments guaranteed were not made
by the debtor, and the guaranteed party called the guar-
antee by demanding payments from ADB in accordance
with the term of the guarantee.
Prior to 1 January 2003, guarantees in the absence
of any call, were not reflected in the financial statements
but disclosed as a note to the financial statements (Note F) in accordance with the provisions of FASB No. 5,
Accounting for Contingencies. FASB Interpretation No.
45 (FIN 45), “Guarantor’s Accounting and Disclosure
Requirements for Guarantees, Including Indirect
Guarantees of Indebtedness to Others,” which came
into effect in 2003, requires the recognition of two types
of liabilities that are associated with guarantees: (a)
the stand-by ready obligation to perform, and (b) the
contingent liability. ADB recognizes at the inception
of a guarantee, a liability for the stand-by ready
obligation to perform on guarantees issued and modified
after 31 December 2002. The liability is included in
“Miscellaneous liabilities.”
Front-end fee income on guarantees received is
deferred and amortized over the term of the guarantee
contract and the unamortized balance of deferred front-
end fee of guarantee is included in “Miscellaneous
liabilities.”
Equity Investments
All equity investments are considered as “Available for
Sale” and are reported at estimated fair value.
Investments in equity securities with readily
determinable market price are reported at fair value,
with unrealized gains and losses reported in “CAPITAL
AND RESERVES” as part of “Accumulated other
comprehensive income.”
Investments in equity securities without readily
determinable fair values are reported at cost or at
impaired value, for investments where the impairment
is deemed other than temporary. These investments
are assessed each quarter to reflect the amount that
can be realized using valuation techniques appropriate
to the market and industry of each investment. When
impairment is identified and is deemed to be other than
temporary, the equity investment is written down to the
impaired value, which becomes the new cost basis of the
equity investments. Impairment losses are not reversed
for subsequent recoveries in the value of the equity
investments, until it is sold.
ADB applies the equity method of accounting to
investments in limited liability partnerships (LLPs) and
certain limited liability companies (LLCs) that maintain
a specific ownership account for each investor.
Variable Interest Entities
ADB complies with FIN 46R, “Consolidation of Variable
Interest Entities – an interpretation of ARB No. 51,
Consolidated Financial Statements.” FIN 46 requires an
entity to consolidate and provide disclosures for any VIE
for which it is the primary beneficiary. An entity that will
absorb a majority of VIE’s expected losses or receive a
majority of expected residual return is deemed to be the
primary beneficiary of the VIE. Variable interests can arise
from equity investments, loans, and guarantees. ADB is
required to disclose information about its involvement in
VIE where ADB holds significant variable interest (Note
S).
Property, Furniture, and Equipment
Property, furniture, and equipment are stated at cost
and, except for land, depreciated over estimated useful
lives on a straight-line basis. Maintenance, repairs, and
minor betterments are charged to expense.
Borrowings
Borrowings are generally reported on the balance sheet at
their carrying book value, adjusted for any unamortized
discounts or premium. As part of its borrowing strat-
egy, ADB issues various types of contractual obligations,
which include structured debts containing embedded
derivatives in order to minimize the cost of borrowings.
ADB simultaneously enters into currency and/or interest
rate swaps to fully hedge the debt.
Upon the adoption of FAS 155 on 1 January 2006,
ADB no longer bifurcates and fair values the embedded
derivatives (the debt was valued at its carrying book
value) in the structured debt portfolio that meet the
bifurcation criteria under FAS 133. Instead, ADB
measures and reports at fair value any structured debt
that contains embedded derivatives that would otherwise
be bifurcated under FAS 133 as a whole, with changes in
fair value reported in net income.
Effective 1 January 2008, ADB adopted the
provisions of FAS 159 for non-hybrid borrowings that are

ASIAN DEVELOPMENT BANK—ORDINARY CAPITAL RESOURCES
NOTES TO FINANCIAL STATEMENTS31 December 2008 and 2007
Asian Development Bank52O
RDIN
ARY
CA
PITA
L RE
SOU
RCES
swapped. Further information relating to the adoption of
FAS 159 and the reasons for electing FAS 159 for these
financial instruments are discussed in detail in Note P.
Borrowing valuations are further adjusted for the credit
spread by currency.
Accounting Estimates
The preparation of the financial statements in con-
formity with generally accepted accounting principles
requires Management to make reasonable estimates and
assumptions that affect the reported amounts of assets
and liabilities and disclosure of contingent liabilities at
the end of the year and the reported amounts of revenues
and expenses during the year. The actual results could
differ from those estimates.
Accounting and Reporting Developments
Effective 1 January 2008, ADB adopted FAS 157 and FAS
159. FAS 157 defines fair value (FV) which focuses on the
price that would be received to sell the asset or paid to
transfer the liability (exit price) and establishes a frame-
work for measuring FV through a FV hierarchy that ranks
the quality and reliability of the data used in FV measure-
ments. FAS 159 expands the scope of financial instruments
that may be carried at FV. It offers an irrevocable option to
carry the majority of financial assets and liabilities at FV,
on an instrument-by-instrument basis, with changes in FV
recognized in earnings. Fair Value Option may be elected
at the time an entity recognizes an eligible financial asset
or liability. FAS 159 also allows a one time election for
existing financial assets and liabilities, on an instrument-
by-instrument basis, at the initial adoption date. The
adoption of FAS 157 and 159 was applied prospectively
and the cumulative effect of changes in valuation of the
financial assets and liabilities for which the Fair Value
Option have been elected were reported as an adjustment
to the 1 January 2008 balance of reserves.
In March 2008, the Financial Accounting Standards
Board (FASB) issued Statement No. 161 “Disclosures
about Derivative Instruments and Hedging Activities
– an amendment of FASB Statement No. 133,” which
will be applicable for fiscal years beginning after 15
November 2008 and interim periods within those
fiscal years. This statement amends and expands the
disclosure requirements of FAS 133 to provide users
with better understanding of (i) how and why an entity
uses derivatives; (ii) how derivative instruments and
related hedged items are accounted for under FAS 133
and its related interpretations; and (iii) how derivative
instruments and hedged items affect an entity’s financial
position, performance, and cash flows. ADB is currently
assessing the impact of this standard on its financial
statements.
In December 2008, the FASB issued FASB Staff
Position (FSP) FAS 132(R)-1, which amends 132(R)
to require more detailed disclosures about employers'
plan assets, including employers' investment strategies,
major categories of plan assets, concentration of risk
within plan assets, and valuation techniques used to
measure the fair value of plan assets. This aims to
address financial statement users' concerns “about the
lack of transparency surrounding the types of assets and
associated risks in an employer's defined benefit pension
or other postretirement plan and events in the economy
and markets that could have a significant effect on the
value of the plan assets.” An entity must provide the
FSP's disclosures in financial statements for fiscal years
ending after 15 December 2009.
Statement of Cash Flows
For the purposes of the Statement of Cash Flows, ADB
considers that its cash and cash equivalents are limited
to “DUE FROM BANKS.”
Reclassification
Certain non-material reclassifications of prior year’s
amounts and information have been made to conform to
the current year’s presentation.
NOTE C—RESTRICTIONS ON USE OF CURRENCIES AND DEMAND OBLIGATIONS OF MEMBERS
In accordance with Article 24, paragraph 2(i) of the Charter,
the use by ADB or by any recipient from ADB of certain
currencies may be restricted by members to payments for
goods or services produced and intended for use in their
territories. With respect to the currencies of 42 DMCs
for 2008 (44 - 2007), cash in banks (due from banks) and
demand obligations totaling $70,095,000 ($65,915,000
– 2007) and $144,515,000 ($174,805,000 – 2007), respec-
tively, may be, but are not currently so restricted.

OCR-8
31 December 2007 and 200631 December 2007 and 2006
53Annual Report 2008O
RDIN
ARY C
APITA
L RESOU
RCES
CONTINUED
In accordance with Article 24, paragraphs 2(i)
and (ii) of the Charter, one member (one - 2007) has
restricted the use by ADB or by any recipient from ADB
of its currency to payments for goods or services produced
in its territory. As such, cash in banks (due from banks)
and investments totaling $20,000 ($20,000 - 2007) and
$3,182,000 ($3,082,000 - 2007), respectively, have been
restricted. None of the demand obligations held by ADB
in 2008 and in 2007 was restricted.
NOTE D—INVESTMENTS
The main investment management objective is to main-
tain security and liquidity. Subject to these parameters,
ADB seeks the highest possible return on its investments.
Investments are governed by the Investment Authority
approved by the Board of Directors in 1999, and reviewed
in 2006. The review endorsed a portfolio strategy that is
largely consistent with the 1999 approach.
ADB may purchase and sell exchange traded financial
futures and option contracts, and enter into currency
and interest rate swaps, and forward rate agreements.
Exposure to interest rate risk may be adjusted within
defined bands to reflect changing market conditions.
These adjustments are made through the purchase and
sale of securities, and financial futures. Accordingly,
financial futures are held for risk management purposes.
At 31 December 2008, the notional amount of outstanding
purchase and sales futures contracts were $6,300,000 and
$7,000,000, respectively, ($99,300,000 and $54,200,000,
respectively – 2007).
Included in “Other securities” as of 31 December
2008 were corporate bonds and other obligations of banks
amounting to $6,688,083,000 ($2,622,373,000 – 2007)
and asset/mortgage-backed securities of $758,066,000
($838,716,000 – 2007).
The currency compositions of the investment
portfolio as of 31 December 2008 and 2007 expressed in
United States dollars are as follows:
Currency 2008 2007
Australian dollar $ 412,599,000 $ 462,654,000 Canadian dollar 261,180,000 306,592,000 Euro 898,121,000 854,590,000 Japanese yen 1,277,485,000 928,670,000 Pound sterling 208,158,000 288,721,000 Swiss franc 463,590,000 457,381,000 United States dollar 11,407,590,000 9,480,057,000 Others 483,796,000 518,278,000
Total $15,412,519,000 $13,296,943,000
The estimated fair value and amortized cost of the
investments by contractual maturity at 31 December
2008 are as follows:
Estimated Amortized Fair Value Cost Due in one year or less $ 6,119,336,000 $ 6,100,549,000 Due after one year through five years 6,802,245,000 6,595,104,000 Due after five years through ten years 2,490,938,000 2,393,526,000 Total $15,412,519,000 $15,089,179,000
Additional information relating to investments in
government and government-guaranteed obligations
and other securities are as follows:
2008 2007 As of 31 December:Amortized cost $13,607,809,000 $5,770,063,000 Estimated fair value 13,931,149,000 5,805,057,000 Gross unrealized gains 364,824,000 60,811,000 Gross unrealized losses (41,484,000) (25,817,000) For the years ended 31 December: Change in net unrealized gains from prior year 288,346,000 76,994,000 Proceeds from sales 7,979,848,000 8,205,482,000 Gross gain on sales 53,508,000 13,466,000 Gross loss on sales (81,408,000) (19,411,000)

ASIAN DEVELOPMENT BANK—ORDINARY CAPITAL RESOURCES
NOTES TO FINANCIAL STATEMENTS31 December 2008 and 2007
Asian Development Bank54O
RDIN
ARY
CA
PITA
L RE
SOU
RCES
As of 31 December 2008, gross unrealized losses
amounted to $41,484,000 ($25,817,000 – 2007) from
government and government-guaranteed obligations,
corporate bonds, and mortgage/asset-backed securities.
One government and government-guaranteed obligation
(12 – 2007), five corporate obligations (32 - 2007), and 11
mortgage/asset-backed securities (75 – 2007) sustained
unrealized losses for over one year, representing 3.70%
(9.34% - 2007) of the total investments. Comparative
details for 2008 and 2007 are as follows:
One year or less Over one year Total
For the year 2008 Fair Unrealized Fair Unrealized Fair Unrealized Value Losses Value Losses Value Losses
Government and government - guaranteed obligations $ 67,243,000 $ 215,000 $ 239,844,000 $ 897,000 $ 307,087,000 $ 1,112,000 Corporate bonds 546,087,000 6,431,000 320,160,000 2,552,000 866,247,000 8,983,000 Mortgage/Asset-backed securities 255,292,000 23,525,000 10,241,000 7,864,000 265,533,000 31,389,000
Total $868,622,000 $30,171,000 $ 570,245,000 $11,313,000 $1,438,867,000 $41,484,000
One year or less Over one year Total
For the year 2007 Fair Unrealized Fair Unrealized Fair Unrealized Value Losses Value Losses Value Losses
Government and government- guaranteed obligations $290,291,000 $ 5,814,000 $ 460,364,000 $ 6,816,000 $ 750,655,000 $12,630,000 Corporate bonds 507,085,000 3,835,000 627,532,000 3,301,000 1,134,617,000 7,136,000 Mortgage/Asset-backed securities 119,347,000 2,980,000 153,954,000 3,021,000 273,301,000 6,001,000 Options 300,000 50,000 – – 300,000 50,000
Total $917,023,000 $12,679,000 $1,241,850,000 $13,138,000 $2,158,873,000 $25,817,000
Asset/Mortgage-backed Securities: Asset/Mortgage-
backed securities are instruments whose cash flow is
based on the cash flows of a pool of underlying assets or
mortgage loans managed by a trust.
Exchange Traded Futures: Futures are contracts
for delayed delivery of securities or money market
instruments in which the seller agrees to make delivery
at a specified future date of a specified instrument at a
specified price or yield. Initial margin requirements are
met with cash or securities, and changes in the market
prices are generally settled daily in cash. ADB generally
closes out open positions prior to maturity. Therefore,
cash receipts or payments are limited to the change in
market value of the future contracts. As of 31 December
2008, net receipts on future contracts amounted to
$1,082,000 ($372,000 net payments – 2007).
NOTE E—LOANS
Loans
ADB does not sell its sovereign loans, nor does it believe
there is a market for its sovereign loans. The estimated
fair value of all loans is based on the estimated cash flows
from principal repayments, interest and other charges
discounted at the applicable market yield curves for
ADB’s borrowing cost plus lending spread.
The carrying amount and estimated fair value of
loans outstanding at 31 December 2008 and 2007 are as
follows:

OCR-8
31 December 2007 and 200631 December 2007 and 2006
55Annual Report 2008O
RDIN
ARY C
APITA
L RESOU
RCES
CONTINUED
Prior to 1 July 1986, the lending rate of ADB was
based on a multicurrency fixed lending rate system under
which loans carried interest rates fixed at the time of loan
approval for the entire life of the loans. Effective 1 July
1986, ADB adopted a multicurrency pool-based variable
lending rate system. In addition, in July 1992, ADB
introduced a United States dollar pool-based variable
lending rate system, and in November 1994, a market-
based lending rate system was made available to financial
intermediaries of sovereign and nonsovereign borrowers.
The outstanding balances of pool-based
multicurrency loans were subsequently transformed
into pool-based single currency loans in Japanese yen,
effective 1 January 2004.
Commencing 1 July 2001, ADB offered LIBOR-based
loans (LBLs) in the following currencies – Euro, Japanese
yen, and United States dollar. The LBL lending facility offers
borrowers the flexibility of (i) choice of currency and interest
rate basis; (ii) change the original loan terms (currency and
interest rate basis) at any time during the life of the loan;
and (iii) options to cap or collar the floating lending rate at
any time during the life of the loan. With the introduction
of LBLs, all other loan windows are no longer offered to
borrowers. In November 2002, ADB offered local currency
loans (LCLs) to nonsovereign borrowers. In August 2005,
ADB also offered LCLs to sovereign borrowers. In November
2006, ADB introduced series of enhancements to sovereign
LBLs negotiated after 1 January 2007, offering additional
major currencies that ADB can efficiently intermediate, and
additional repayment options including (i) annuity method
with various discount factors, (ii) straight-line repayment,
(iii) bullet repayment, and (iv) custom-tailored repayment.
In 2008, ADB received prepayments for 11 loans
(6 loans – 2007) amounting to $277,053,000 ($80,139,000
– 2007) and collected prepayment premiums of $3,937,000
($210,000 - 2007). Ninety percent of the prepaid amounts in
2008 were pool-based single currency US dollar and Japanese
yen loans compared to 87% for pool-based single currency US
dollar loans in 2007.
Loan Charges
Since 1988, ADB has charged front-end fees for non-
sovereign loans. Effective 1 January 2000, ADB levied
front-end fee of 1% for sovereign loans for which the loan
negotiations are completed after that date. In addition, a
flat commitment fee of 0.75% was charged for new pro-
gram loans and a progressive commitment fee of 0.75%
was maintained for project loans. Effective 1 January
2000, the lending spread applied to all outstanding pool-
based sovereign loans and new sovereign market-based
loans was increased from 0.4% to 0.6%.
In 2004, the Board approved the waiver of the
entire 1% front-end fee on all new sovereign loans
approved during 1 January 2004 to 30 June 2005 (waiver
of 50 basis points on sovereign loans approved in 2003)
and waiver of 20 basis points of the lending spread on
sovereign loans outstanding from 1 July 2004 – 30 June
2005 for borrowers that do not have loans in arrears.
Subsequently, the policy was extended to cover the
period up to June 2009.
The front-end fees received on nonsovereign loans
for the year ended 31 December 2008 were $10,987,000
($4,576,000 – 2007). Administrative expenses relating to
direct loan origination of $35,540,000 for the year ended
31 December 2008 ($34,080,000 – 2007) were deferred
and offset against front-end fees received. The excess, if
any, is amortized over the life of each loan.
In November 2006, the Board approved a change in
the commitment charge policy for all sovereign project
2008 2007
Carrying Estimated Carrying Estimated Value Fair Value Value Fair Value
Fixed rate multicurrency loans $ 22,246,000 $ 27,157,000 $ 22,462,000 $ 28,279,000 Pool-based single currency (JPY) loans 3,202,996,000 3,683,699,000 3,138,612,000 3,594,501,000 Pool-based single currency (US$) loans 7,049,324,000 8,609,127,000 7,716,536,000 8,537,918,000 LIBOR-based loans 25,219,728,000 25,084,442,000 19,135,910,000 19,012,074,000 Fixed rate loans 11,470,000 12,806,000 15,587,000 17,811,000 Local currency loans 404,296,000 413,728,000 253,772,000 270,787,000
Total $35,910,060,000 $37,830,959,000 $30,282,879,000 $31,461,370,000
ASIAN DEVELOPMENT BANK—ORDINARY CAPITAL RESOURCES
NOTES TO FINANCIAL STATEMENTS31 December 2008 and 2007
Asian Development Bank56O
RDIN
ARY
CA
PITA
L RE
SOU
RCES
LIBOR-based loans negotiated after 1 January 2007, from
75 basis points on a progressive structure of undisbursed
loan balances to a flat fee of 35 basis points on the full
amount of undisbursed balances. Further to this, the Board
also approved in April 2007, the waiver of 10 basis points
of the commitment charge on the undisbursed balances
of sovereign project loans negotiated after 1 January 2007
and 50 basis points of the commitment charge on the
undisbursed balances of sovereign program loans.
In December 2007, the Board approved the revision
of loan charges for sovereign LIBOR-based loans negotiated
on and after 1 October 2007 by a) providing a credit of
0.4% for the duration of the loan, resulting to an effective
contractual spread of 0.2%; b) reducing the commitment
charge from 0.75% and 0.35% for sovereign program and
project loans to 0.15% for both sovereign program and
project loans; and c) eliminating front-end fees.
Undisbursed loan commitments and an analysis of
loans by borrowing member countries as of 31 December
2008 are shown in OCR-5. The carrying amounts of loan
outstanding by loan products at 31 December 2008 and
2007 are as follows:
2008 2007
Sovereign Loans Fixed rate multicurrency loans $ 22,246,000 $ 22,462,000 Pool-based single currency (JPY) loans 3,202,996,000 3,136,766,000 Pool-based single currency (US$) loans 7,054,332,000 7,722,916,000 LIBOR-based loans 23,901,052,000 18,078,713,000
34,180,626,000 28,960,857,000
Provision for loan losses (4,356,000) (5,689,000) Unamortized direct loan origination cost 76,114,000 47,936,000
71,758,000 42,247,000
Subtotal 34,252,384,000 29,003,104,000
Nonsovereign Loans Pool-based single currency (JPY) loans – 1,846,000 Fixed rate loans 11,488,000 15,586,000 LIBOR-based loans 1,253,775,000 1,018,846,000 Local currency loans 404,952,000 258,657,000 Others 131,000 –
1,670,346,000 1,294,935,000
Provision for loan losses (4,818,000) (9,354,000) Unamortized front-end fee (7,852,000) (5,806,000)
(12,670,000) (15,160,000)
Subtotal 1,657,676,000 1,279,775,000
Total $35,910,060,000 $30,282,879,000
Loans in Non-accrual Status
One nonsovereign loan was in non-accrual status as of 31
December 2008 (four – 2007). The principal outstand-
ing at that date was $1,674,000 ($16,507,000 – 2007) of
which $1,315,000 ($9,659,000 - 2007) was overdue. Loans
in non-accrual status resulted in $151,000 ($3,223,000
– 2007) not being recognized as income from nonsover-
eign loans for the year ended 31 December 2008, and a
total of $525,000 as of 31 December 2008 ($8,314,000
– 2007). The significant decrease resulted mainly from
the waiver of loan charges totaling $4,735,000 due to sale
of two loans in January 2008 and restructuring of one
loan in April 2008, and recovery of $2,717,000 from the
restructured loan.
In 2008, one sovereign loan was restored to accrual
status and loan charges of $1,130,000 for 2007 was
recognized as income for the current year.
Loan Loss Provision
ADB has not suffered any losses of principal on sovereign
loans. During the year, $1,333,000 loan loss provision was
written back on two loans ($427,000 on one loan – 2007).
Accumulated loan loss provision for sovereign loans as of
31 December 2008 was $4,356,000 ($5,689,000 – 2007).
Loan loss provisions for nonsovereign loans totaling
$4,968,000 were written back/off mainly due to sale of
two loans. This reduced the balance of accumulated loan
loss provision for nonsovereign loans to $4,818,000 as of
31 December 2008 ($9,354,000 – 2007).
Information pertaining to loans which were subject
to loan loss provisions at 31 December 2008 and 2007 is
as follows: 2008 2007
Loans not subject to loss provisions $35,841,044,000 $30,233,596,000 Loans subject to loss provisions 9,928,000 22,196,000
Total $35,850,972,000 $30,255,792,000
Average amount of loans subject to loss provisions $ 11,325,000 $ 30,019,000 Related interest income on such loans recognized in the year $ 4,946,000 $ 921,000 Cash received on related interest income on such loans $ 4,933,000 $ 782,000

OCR-8
31 December 2007 and 200631 December 2007 and 2006
57Annual Report 2008O
RDIN
ARY C
APITA
L RESOU
RCES
CONTINUEDCONTINUED
The changes in the provision for loan losses during 2008 and 2007 are as follows:
2008 2007
Sovereign Nonsovereign Sovereign Nonsovereign Loans Loans Total Loans Loans Total
Balance 1 January $5,689,000 $9,354,000 $15,043,000 $6,116,000 $22,223,000 $28,339,000 Provision written back - net (1,333,000) (2,134,000) (3,467,000) (427,000) (152,000) (579,000)Provision written off – (2,400,000) (2,400,000) – (12,717,000) (12,717,000)Translation adjustment – (2,000) (2,000) – – –
Balance 31 December $4,356,000 $4,818,000 $9,174,000 $5,689,000 $9,354,000 $15,043,000
Cofinancing
ADB functions as lead lender in cofinancing arrangements
with other participating financial institutions who also
provide funds to ADB’s sovereign and nonsovereign bor-
rowers. In such capacity, ADB provides loan administra-
tion services, which include loan disbursements and loan
collections. The participating financial institutions have
no recourse to ADB for their outstanding loan balances.
Loans administered by ADB on behalf of
participating institutions as at 31 December 2008 and
2007 are as follows:
2008
No.of Amount Loans Sovereign loans $503,017,000 36Nonsovereign loans 403,517,000 10 Total $906,534,000 46
2007
No.of Amount Loans Sovereign loans $527,247,000 32Nonsovereign loans 432,865,000 12
Total $960,112,000 44
During the year ended 31 December 2008, a total of
$115,000 ($490,000 - 2007) was received as compensation
for arranging and administering such loans. This amount
has been included in “Income from other sources.”
NOTE F—GUARANTEES
ADB extends guarantees to public sector and private
sector borrowers. Such guarantees include (i) partial
credit guarantees where only certain principal and/or
interest payments are covered; and (ii) political risk
guarantees, which provide coverage against well-defined
sovereign risks. While counterguarantees from the host
government are required for all public sector guarantees,
guarantees for private sector projects may be provided
with or without a host government counterguarantee. A
counterguarantee takes the form of a member govern-
ment agreement to indemnify ADB for any payments it
makes under the guarantee. In the event that a guarantee
is called, ADB has the contractual right to require pay-
ment from the government, on demand, or as ADB may
otherwise direct.
Guaranteed payments under partial credit
guarantees are generally due 10 or more years from
the loan inception date. ADB’s political risk guarantee
is callable when a guaranteed event has occurred and
such an event has resulted in debt service default to the
guaranteed lender.
In October 2008, ADB paid a total of PKR10,375,000
($127,000 equivalent) under a partial credit guarantee
agreement. The amount was booked as a loan arising from
a guarantee call with a corresponding 100% provision for
losses.

ASIAN DEVELOPMENT BANK—ORDINARY CAPITAL RESOURCES
NOTES TO FINANCIAL STATEMENTS31 December 2008 and 2007
Asian Development Bank58O
RDIN
ARY
CA
PITA
L RE
SOU
RCES
The committed and outstanding amounts of these guarantee obligations as of 31 December 2008 and 2007
covered:
None of the outstanding amounts as of 31
December 2008 were subject to call. The committed
amount represents the maximum potential amount
of undiscounted future payment that ADB could be
required to make, inclusive of standby portion for
which ADB is committed but not currently at risk. The
outstanding amount represents the guaranteed amount
utilized under the related loans, which have been
disbursed as of the end of a reporting period, exclusive
of the standby portion. ADB estimates that the present
value of guarantees outstanding at 31 December 2008
was $1,130,777,000 ($965,849,000 – 2007).
As of 31 December 2008, a total liability of
$23,257,000 ($13,668,000 – 2007) relating to stand-by
ready obligation for seven partial credit risk guarantees
(five – 2007) and two political risk guarantees (two -
2007) has been included in “Miscellaneous liabilities”
on the balance sheet for all guarantees issued after
31 December 2002.
NOTE G—EQUITY INVESTMENTS
ADB's investments in equity securities issued by private
enterprises located in DMCs include $208,071,000
($212,463,000 – 2007) investments in limited liability
2008 2007
Committed Outstanding Committed Outstanding Amount Amount Amount Amount
Partial Credit Guarantees with counterguarantee $1,164,044,000 $1,097,258,000 $1,001,492,000 $ 962,160,000 without counterguarantee 432,363,000 363,075,000 280,863,000 271,881,000
1,596,407,000 1,460,333,000 1,282,355,000 1,234,041,000
Political Risk Guarantees with counterguarantee 145,156,000 129,419,000 146,813,000 134,210,000 without counterguarantee 30,070,000 24,899,000 30,462,000 27,306,000
175,226,000 154,318,000 177,275,000 161,516,000 Others 950,000 950,000 950,000 950,000
Total $1,772,583,000 $1,615,601,000 $1,460,580,000 $1,396,507,000
partnership and limited liability companies. Such eq-
uity investments are accounted for under the equity
method.
As of 31 December 2008, there were six (six
– 2007) equity investments which were reported at fair
value totaling $238,497,000 ($462,115,000 – 2007). One
investment (nil – 2007) sustained unrealized losses of
$106,816,000 as of year end of 2008.
Accumulated net unrealized gains on equity
investments reported at market value were $116,895,000
at 31 December 2008 ($340,958,000 – 2007) and were
reported in “CAPITAL AND RESERVES” as part of
“Accumulated other comprehensive income.”
Approved equity investment facility that has not
been disbursed was $275,740,000 at 31 December
2008 ($344,046,000 – 2007).
NOTE H—DERIVATIVE INSTRUMENTS
The fair value of outstanding currency and interest rate
swap agreements is determined at the estimated amount
that ADB would receive or pay to terminate the agree-
ments using market-based valuation models. The basis
of valuation is the present value of expected cash flows
based on observable market data.

OCR-8
31 December 2007 and 200631 December 2007 and 2006
59Annual Report 2008O
RDIN
ARY C
APITA
L RESOU
RCES
CONTINUED
Interest rate swaps: Under a typical interest
rate swap agreement, one party agrees to make periodic
payments based on a notional principal amount and an
interest rate that is fixed at the outset of the agreement.
The counterparty agrees to make floating rate payments
based on the same notional principal amount. The terms
of ADB's interest rate swap agreements usually match
the terms of particular borrowings.
Currency swaps: Under a typical currency swap
agreement, one party agrees to make periodic payments
in one currency while the counterparty agrees to make
periodic payments in another currency. The payments
may be fixed at the outset of the agreement or vary based
on interest rates. A receivable is created for the currency
swapped out, and a payable is created for the currency
swapped in. The terms of ADB's currency swap agreements
usually match the terms of particular borrowings.
Included in Receivable/Payable from Swaps-Others
are interest rate and currency swaps that ADB has entered
into for the purpose of hedging specific investments and
loans. The loan related swaps were executed to better
align the composition of certain outstanding loans with
funding sources.
NOTE I—PROPERTY, FURNITURE, AND EQUIPMENT
In 1991, under the terms of an agreement with the
Philippines (Government), ADB returned the former
headquarters premises, which had been provided by the
Government. In accordance with the agreement as sup-
plemented by a memorandum of understanding, ADB
was compensated $22,657,000 for the return of these
premises. The compensation is in lieu of being provided
premises under the agreement and accordingly, is de-
ferred and amortized over the estimated life of the new
headquarters building as a reduction of occupancy ex-
pense. The amortization for the year ended 31 December
2008 amounted to $386,000 ($387,000 – 2007) reducing
depreciation expense for the new headquarters build-
ing from $4,427,000 ($4,471,000 – 2007) to $4,041,000
($4,084,000 – 2007). At 31 December 2008, the un-
amortized deferred compensation balance (included in
“ACCOUNTS PAYABLE AND OTHER LIABILITIES
- Miscellaneous”) was $8,218,000 ($9,529,000 – 2007).
At 31 December 2008 accumulated depreciation for
property, furniture, and equipment was $158,259,000
($147,999,000 – 2007).
NOTE J—BORROWINGS
The key objective of ADB’s borrowing strategy is to raise
funds at the lowest possible cost for the benefit of its
borrowers. ADB uses financial derivative instruments
in connection with its borrowing activities to increase
cost efficiency, while achieving risk management objec-
tives. Currency swaps enable ADB to raise operationally
needed currencies in a cost-efficient way and to maintain
its borrowing presence in the major capital markets.
Interest rate swaps are used generally to reduce interest
rate mismatches arising from lending operations.
NOTE K—CAPITAL STOCK, CAPITAL TRANSFERRED TO ASIAN DEVELOPMENT FUND, MAINTENANCE OF VALUE OF CURRENCY HOLDINGS, AND MEMBERSHIP
Capital Stock
The authorized capital stock of ADB as of the end of 2008
and 2007 consists of 3,546,311 shares, all of which have
been subscribed by members. Of the subscribed shares,
3,296,887 are “callable” and 249,424 are “paid-in.” The
“callable” share capital is subject to call by ADB only as
and when required to meet ADB's obligations incurred on
borrowings of funds for inclusion in its Ordinary Capital
Resources (OCR) or on guarantees chargeable to such
resources. The “paid-in” share capital has been paid or is
payable in installments, partly in convertible currencies
and partly in the currency of the subscribing member
which may be convertible. In accordance with Article 6,
paragraph 3 of the Charter, ADB accepts non-negotiable,
non-interest-bearing demand obligations in satisfaction
of the portion payable in the currency of the member,
provided such currency is not required by ADB for the
conduct of its operations. The settlement of such amounts
is not determinable and, accordingly, it is not practicable
to determine a fair value for these receivables.
As of 31 December 2008, all matured installments
amounting to $3,850,762,000 ($3,917,444,000 - 2007)
were received. Installments not due aggregating
$9,848,000 ($19,664,000 - 2007) are as follows:
For the Year ending 31 December:
2009 $6,563,000 2010 $3,285,000

ASIAN DEVELOPMENT BANK—ORDINARY CAPITAL RESOURCES
NOTES TO FINANCIAL STATEMENTS31 December 2008 and 2007
Asian Development Bank60O
RDIN
ARY
CA
PITA
L RE
SOU
RCES
Capital Transferred to Asian Development Fund
Pursuant to the provisions of Article 19, paragraph 1(i)
of the Charter, the Board of Governors has authorized
the setting aside of 10% of the unimpaired “paid-in”
capital paid by members pursuant to Article 6, paragraph
2(a) of the Charter and of the convertible currency por-
tion paid by members pursuant to Article 6, paragraph
2(b) of the Charter as of 28 April 1973 to be used as
a part of the Special Funds of ADB. The resources so
set aside amounting to $73,691,000 as of 31 December
2008 ($75,151,000 - 2007) expressed in terms of the
SDR on the basis of $1.54781 ($1.57848 - 2007) per
SDR ($57,434,000 in terms of $1.20635 per 1966 dol-
lar—Note B), were allocated and transferred to the Asian
Development Fund.
Maintenance of Value of Currency Holdings
Prior to 1 April 1978, the effective date of the Second
Amendment to the IMF Articles, ADB implemented
maintenance of value (MOV) in respect of holdings of
member currencies in terms of 1966 dollars, in accord-
ance with the provisions of Article 25 of the Charter and
relevant resolutions of the Board of Directors. Since then,
settlement of MOV has been put in abeyance.
In as much as the valuation of ADB's capital stock
and the basis of determining possible MOV obligations
are still under consideration, notional amounts have
been calculated provisionally as receivable from or
payable to members in order to maintain the value of
currency holdings in terms of the SDR. In view thereof,
the notional MOV amounts of receivables and payables
are offset against one another and shown as net notional
amounts to maintain value of currency holdings in the
“CAPITAL AND RESERVES” portion of the Balance
Sheet. The carrying book value for such receivables and
payables approximates its fair value.
The net notional amounts as of 31 December
2008 consisted of (a) the increase of $740,985,000
($806,160,000 – 2007) in amounts required to maintain
the value of currency holdings to the extent of matured
and paid capital subscriptions due to the increase in the
value of the SDR in relation to the United States dollar
during the period from 1 April 1978 to 31 December 2008
and (b) the net increase of $176,602,000 ($144,963,000
- 2007) in the value of such currency holdings in relation
to the United States dollar during the same period. In
terms of receivable from and payable to members, they
are as follows:
2008 2007
Notional MOV Receivables $957,549,000 $853,546,000 Notional MOV Payables 393,166,000 192,349,000
Total $564,383,000 $661,197,000
Membership
As of 31 December 2008, ADB’s shareholders consist of
67 member countries, 48 countries from the region and
19 countries from outside the region (OCR–7).
NOTE L—RESERVES
Ordinary Reserve and Net Income
Under the provisions of Article 40 of the Charter, the
Board of Governors shall determine annually what part
of the net income shall be allocated, after making provi-
sion for reserves, to surplus and what part, if any, shall be
distributed to the members.
In May 2008, the Board of Governors approved
the allocation of 2007 net income of $760,174,000
to Cumulative Revaluation Adjustments account for
$87,623,000, to Loan Loss Reserve for $12,962,000, to
Surplus and Ordinary Reserve for $278,294,000 each, to
Technical Assistance Special Fund for $23,000,000, and
to Asian Development Fund (ADF) and Climate Change
Fund for $40,000,000 each.
In 2007, the 2006 net income of $565,886,000 and
additions from Cumulative Revaluation Adjustments
account of $138,479,000 were allocated to Loan Loss
Reserve for 52,000,000, to Surplus and Ordinary Reserve
for $286,183,000 each, and to ADF and Regional
Cooperation and Integration Fund for $40,000,000 each.
The restatement of the capital stock for purposes
of these financial statements on the basis of the SDR
instead of the 1966 dollar (Note B) resulted in a net credit
of $8,860,000 to the Ordinary Reserve during the year
ended 31 December 2008 (net charge of $34,587,000 -
2007). That credit is the decrease in the value of the
matured and paid capital subscriptions caused by the
change during the year in the value of the SDR in relation
to the United States dollar not allocated to members as

OCR-8
31 December 2007 and 200631 December 2007 and 2006
61Annual Report 2008O
RDIN
ARY C
APITA
L RESOU
RCES
CONTINUED
notional maintenance of value adjustments in accordance
with resolutions of the Board of Directors.
Cumulative Revaluation Adjustments Account
In May 2002, the Board of Governors approved the al-
location of net income representing the cumulative net
unrealized gains (losses) on derivatives, as required by
FAS 133 to a separate category of Reserves - “Cumulative
Revaluation Adjustments Account.” Beginning 2008, the
unrealized portion of net income from equity invest-
ments accounted under equity method is also transferred
to this account. During the year, the 2007 net unrealized
gains on derivatives of $57,508,000 and on income from
equity investments accounted under equity method of
$30,115,000 reduced the credit balance of the Cumulative
Revaluation Adjustments account at 31 December 2008
to $23,336,000 ($110,959,000 – 2007).
Special Reserve
The Special Reserve includes commissions on loans
and guarantee fees on guarantees set aside pursuant to
Article 17 of the Charter. Special Reserve assets consist
of term deposits and government and government-guar-
anteed obligations and are included under the heading
“INVESTMENTS.” For the year ended 31 December
2008, guarantee fees amounting to $6,876,000 ($5,049,000
– 2007) were appropriated to Special Reserve.
Loan Loss Reserve
In 2004, the Board of Directors approved the creation of
Loan Loss Reserve through an allocation of $218,800,000
out of prior year net income. The Loan Loss Reserve forms
part of Capital and Reserves to be used as a basis for capital
adequacy against the estimated expected loss in ADB’s
sovereign loans and guarantees portfolio. In December
2006, the Board of Directors approved the adoption of
this policy to nonsovereign credit exposures.
In 2008, the estimated loan loss reserve requirement
was $195,062,000 resulting to an increase of $12,962,000.
The estimated expected loss is determined using ADB’s
credit risk model net of loan loss provisions taken up
in accordance with generally accepted accounting
principles.
Surplus
Surplus represents funds for future use to be deter-
mined by the Board of Governors. In the first half of
2008, the Board of Governors approved the allocation
of $278,294,000 out of 2007 net income to Surplus
($286,183,000 – 2007).
Comprehensive Income
Comprehensive income has two major components: net
income and other comprehensive income comprising
gains and losses affecting equity that, under accounting
principles generally accepted in the United States of
America, are excluded from net income. Other compre-
hensive income includes such items as the effects of the
implementation of FAS 133, unrealized gains and losses
on available-for-sale securities and listed equity invest-
ments, currency translation adjustments, and pension
and post-retirement liability adjustment.
NOTE M—INCOME AND EXPENSES
Total income from loans for the year ended 31 December
2008 was $1,358,506,000 ($1,446,318,000 – 2007). The
average yield on the loan portfolio during the year was
3.84% (5.00% - 2007), excluding premium received on
prepayment and other loan income. Premium on prepaid
loans during 2008 amounted to $3,915,000 ($232,000
– 2007).
Total income from investments including net
realized losses on sales, net unrealized losses on
derivatives, and interest earned for securities transferred
under repurchase agreements and resale arrangements
for the year ended 31 December 2008 was $564,059,000
($676,230,000 – 2007). The annualized rate of return
on the average investments held during the year, based
on the portfolio held at the beginning and end of each
month, was 3.20% (4.68% – 2007) excluding unrealized
gains and losses on investments and 4.63% (5.79% – 2007)
including unrealized gains and losses on investments.
Including net realized losses, equity investment
operations resulted to a net loss of $147,000 ($80,690,000
income – 2007) for the year ended 31 December 2008.
This included a total of $12,160,000 share in the net losses
of investee companies accounted under equity method
and $8,688,000 impairment losses mostly associated
with restructured accounts, offset by dividend income,

ASIAN DEVELOPMENT BANK—ORDINARY CAPITAL RESOURCES
NOTES TO FINANCIAL STATEMENTS31 December 2008 and 2007
Asian Development Bank62O
RDIN
ARY
CA
PITA
L RE
SOU
RCES
gains on disposals, and other income of $15,823,000,
$4,804,000, and $75,000 respectively.
Income from other sources primarily included
income received as executing agency amounting to
$9,979,000 ($9,843,000 – 2007), interests earned on
bank accounts and on staff accounts totaling $1,369,000
($645,000 – 2007) and $1,682,000 ($2,265,000 – 2007),
respectively, and reversals of expenses charged to prior
years of $4,335,000 ($4,719,000 – 2007).
Total interest expense incurred for the year
ended 31 December 2008 amounted to $1,181,410,000
($1,368,177,000 – 2007). Other borrowings and related
expenses consisted of amortization of borrowings’
issuance costs and other expenses of $26,981,000
($21,601,000 – 2007).
Administrative expenses (other than those
pertaining directly to ordinary operations and special
operations) for the year ended 31 December 2008 were
apportioned between OCR and ADF in proportion of
the relative volume of operational activities of each fund.
Of the total administrative expenses of $363,724,000
($347,803,000 – 2007), $187,138,000 ($186,396,000
– 2007) was accordingly charged to ADF. The balance of
administrative expenses after allocation was reduced by
the deferral of direct loan origination costs of $35,539,000
($34,080,000 – 2007) related to new loans that became
effective for the year ended 31 December 2008 (Notes B and E).
In November 2008, following the approval by the
Board of Directors in September 2007, ADB entered into
a Trust fund Grant Arrangement with International Bank
for Reconstruction and Development and International
Development Association, to provide $10,000,000 as
a contribution to the Java Reconstruction Fund. This
was charged to OCR current income as “TECHNICAL
ASSISTANCE TO MEMBER COUNTRIES.” Net of
write-back for the year totaling $1,643,000 ($683,000
– 2007) representing cancellations of the undisbursed
amounts of completed TA projects committed in prior
periods, technical assistance for the year amounted to
$8,357,000.
As of 31 December 2008, the net cumulative amount
of TA commitments that had been charged to OCR net
income amounted to $76,205,000 ($67,848,000 – 31
December 2007) out of which $65,716,000 ($65,530,000
– 2007) had been disbursed.
For the year ended 31 December 2008, total write-
back of provision for losses amounted to $3,467,000
($579,000 - 2007). This corresponded to $1,333,000 for
two sovereign loans and $2,134,000 for a nonsovereign
loan, resulting mainly from repayments and loan
restructuring.
Other expenses of $6,271,000 ($3,998,000 – 2007)
included non-borrowings related financial expenses
such as fees paid to external asset managers and bank
charges.
Net unrealized gains incorporated $429,000
net losses ($3,680,000 – 2007) from the translation
adjustments of financial instruments denominated in
non-functional currencies (South African Rand and
Mexican Peso), and net unrealized gains on derivatives
of $451,020,000 ($57,508,000 – 2007), which were made
up of:
2008 2007
Unrealized gains (losses) on: Hybrid financial instruments and related swaps* $387,136,000 $ (5,322,000) Non-hybrid financial instruments and related swaps* 249,942,000 108,028,000 Investments related swaps (88,279,000) (4,182,000) Loan related swaps (98,625,000) (38,089,000) FX Forward 263,000 (1,958,000)Amortization of the FAS 133 transition adjustment 583,000 (969,000)
Total $451,020,000 $ 57,508,000
*Figures are not comparable due to the adoption of FAS 157 and 159 effective 1 January 2008, where (a) credit risk (spread) were incorporated in fair valuing the outstanding financial instruments, and (b) non-hybrid swapped borrowings which were recorded at amortized cost in 2007, were recorded at fair value in 2008.
NOTE N—OTHER ASSETS AND LIABILITIES— MISCELLANEOUS
At 31 December 2008 and 2007, ADB had the follow-
ing receivables from/payables to special funds and trust
funds resulting from administrative arrangements and
operating activities:

OCR-8
31 December 2007 and 200631 December 2007 and 2006
63Annual Report 2008O
RDIN
ARY C
APITA
L RESOU
RCES
CONTINUED
2008 2007
Amounts receivable from:
Asian Development Fund (Note M) $31,743,000 $28,750,000
Technical Assistance Special Fund – 14,000 Japan Special Fund 145,000 159,000 Asian Tsunami Fund 669,000 343,000 Pakistan Earthquake Fund 4,000 5,000 Regional Cooperation and Integration Fund 15,000 – Climate Change Fund 6,000 – Asian Development Bank Institute Special Fund 847,000 341,000 Staff Retirement Plan – 11,012,000 Agency Trust Funds (net) 842,000 1,984,000
Total $34,271,000 $42,608,000
Amounts payable to:
Technical Assistance Special Fund $ 12,000 $ – Staff Retirement Plan 14,205,000 –
Total $14,217,000 $ –
NOTE O—STAFF RETIREMENT PLAN AND POSTRETIREMENT MEDICAL BENEFITS
Staff Retirement Plan
ADB has a contributory defined benefit Staff Retirement
Plan (the Plan). Every employee, as defined under the
Plan, shall, as a condition of service, become a participant
from the first day of service, provided that at such a date,
the employee has not reached the normal retirement age
of 60. The Plan applies also to members of the Board of
Directors who elect to join the Plan. Retirement ben-
efits are based on length of service and highest average
remuneration during two years of eligible service. The
Plan assets are segregated and are not included in the
accompanying Balance Sheet. The costs of administering
the Plan are absorbed by ADB, except for fees paid to
the investment managers and related charges, including
custodian fees, which are borne by the Plan.
Participants hired on or before 30 September 2006
are required to contribute 9 1/3% of their salary to the
Plan while those hired after that date do not anymore
contribute to the plan. Participants may also make
additional voluntary contributions. ADB's contribution
is determined at a rate sufficient to cover that part of
the costs of the Plan not covered by the participants'
contributions.
Expected Contributions
The expected amount of contributions to the Plan for
2009 amounts to $51,499,000 ($43,291,000 – 2007)
representing ADB’s contributions of $29,394,000
($22,902,000 – 2007), based on budgeted contribu-
tion rate of 19% (16% - 2007), participants’ mandatory
contributions of $11,605,000 ($11,889,000 – 2007) and
discretionary contributions of $10,500,000 ($8,500,000
– 2007).
Investment Strategy
Contributions in excess of current benefits payments
are invested in international financial markets and in a
variety of investment vehicles. The Plan employs nine
external asset managers and one global custodian who
function within the guidelines established by the Plan’s
Investment Committee. The investment of these assets,
over the long term, is expected to produce higher returns
than short-term investments. The investment policy
incorporates the Plan’s package of desired investment re-
turn and tolerance for risk, taking into account the nature
and duration of the Plan’s liabilities. The Plan’s assets are
diversified among different markets and different asset
classes. The use of derivatives for speculation, leverage or
taking risks is prohibited. Selected derivatives are used
for hedging and transactional efficiency purposes.
The Plan’s investment policy is periodically
reviewed and revised to reflect the best interest of the
Plan’s participants and beneficiaries. The current policy,
adopted in January 2003, specifies an asset-mix structure
of 70% of assets in equities and 30% in fixed income
securities. At present, investments of the Plan’s assets
are divided into three categories: US equity, Non-US
equity, and US fixed income.

ASIAN DEVELOPMENT BANK—ORDINARY CAPITAL RESOURCES
NOTES TO FINANCIAL STATEMENTS31 December 2008 and 2007
Asian Development Bank64O
RDIN
ARY
CA
PITA
L RE
SOU
RCES
As of 31 December 2008 and 2007, the breakdown
of the fair value of plan assets held are as follows:
2008
Amount Percentage
Equity Securities US $ 320,303,000 Non-US 215,489,000
535,792,000 58.6%Fixed Income Securities 362,584,000 39.6 Other Assets (Liabilities) – net 16,254,000 1.8
Total $ 914,630,000 100.0%
2007
Amount Percentage
Equity Securities US $ 541,837,000 Non-US 407,222,000
949,059,000 72.9%Fixed Income Securities 362,646,000 27.9 Other Assets (Liabilities) – net (10,150,000) (0.8)
Total $1,301,555,000 100.0%
All investments excluding time deposits are
valued using market prices. Time deposits are reported
at cost which is a reasonable estimate of fair value.
Fixed income securities include US government and
government guaranteed obligations, corporate bonds and
time deposits. Other assets include forward exchange
contracts in various foreign currencies transacted to
hedge currency exposure in the investment portfolio,
which are reported at fair value.
For the year ended 31 December 2008 the net return
on the Plan assets was -29.5% (6.0% – 2007). ADB expects
the long-term rate of return on the assets to be 8%.
Assumptions
The assumed overall rate of return takes into account
long-term return expectations of the underlying as-
set classes within the investment portfolio mix, and
the expected duration of the Plan’s liabilities. Return
expectations are forward looking and, in general, not
much weight is given to short-term experience. Unless
there is a drastic change in investment policy or market
environment, the assumed investment return of 8% on
the Plan’s assets is expected to remain broadly the same,
year to year.
Postretirement Medical Benefits Plan
In 1993, ADB adopted a cost-sharing plan for retirees’
medical insurance premiums. Under the plan, ADB is
obligated to pay 75% of the Group Medical Insurance
Plan premiums for retirees, including retired members
of the Board of Directors, and their eligible dependents
who elected to participate. The cost-sharing plan is cur-
rently unfunded.
Generally accepted accounting principles require
an actuarially determined assessment of the periodic
cost of postretirement medical benefits.
The following table sets forth the pension and
postretirement medical benefits at 31 December 2008
and 2007:

OCR-8
31 December 2007 and 200631 December 2007 and 2006
65Annual Report 2008O
RDIN
ARY C
APITA
L RESOU
RCES
CONTINUED
For measurement purposes, a 9.0% annual rate of
increase in the per capita cost of covered health care
benefits was assumed for the valuation as at 31 December
Pension Benefits Postretirement Medical Benefits
2008 2007 2008 2007
Change in projected benefit obligation: Projected benefit obligation at beginning of year $1,476,832,000 $1,336,833,000 $ 193,008,000 $ 187,030,000 Service cost 38,077,000 38,564,000 8,432,000 8,823,000 Interest cost 89,682,000 81,558,000 11,969,000 11,634,000 Plan participants’ contributions 30,831,000 27,186,000 – – Transfers – (232,000) – – Actuarial (gain) loss (163,591,000) 59,287,000 (57,563,000) (11,952,000) Amendments – – – – Benefits paid (75,032,000) (66,364,000) (2,715,000) (2,527,000)
Projected benefit obligation at end of year $1,396,799,000 $1,476,832,000 $ 153,131,000 $ 193,008,000 Change in plan assets: Fair value of plan assets at beginning of year $1,301,555,000 $1,235,346,000 $ – $ – Actual return on plan assets (381,940,000) 73,905,000 – – Employer’s contribution 39,216,000 31,714,000 2,715,000 2,527,000 Plan participants’ contributions 30,831,000 27,186,000 – – Transfers – (232,000) – – Benefits paid (75,032,000) (66,364,000) (2,715,000) (2,527,000)
Fair value of plan assets at end of year $ 914,630,000 1,301,555,000 $ – – Funded status $ (482,169,000) $ (175,277,000) $ (153,131,000) $(193,008,000) Amounts recognized in the Balance sheet consist of: Current liabilities – – (4,183,000) (3,907,000) Noncurrent liabilities (482,169,000) (175,277,000) (148,948,000) (189,101,000) Net amount recognized $ (482,169,000) $ (175,277,000) $ (153,131,000) $(193,008,000) Amounts recognized in the Accumulated other comprehensive income consist of: Net actuarial loss (gain) $ 425,385,000 $ 110,605,000 $ (15,660,000) $ 43,853,000 Prior service cost (credit) 11,833,000 15,912,000 (20,002,000) (28,648,000) Total amount recognized $ 437,218,000 $ 126,517,000 $ (35,662,000) $ 15,205,000 Weighted-average assumptions as of 31 December Discount rate 7.25% 6.00% 7.25% 6.00% Expected return on plan assets 8.00% 8.00% N/A N/A Rate of compensation increase varies with age and averages 5.05% 4.65% 5.05% 4.65%
2008. The rate was assumed to decrease gradually to
5.0% for 2013 and remain at the level thereafter.

ASIAN DEVELOPMENT BANK—ORDINARY CAPITAL RESOURCES
NOTES TO FINANCIAL STATEMENTS31 December 2008 and 2007
Asian Development Bank66O
RDIN
ARY
CA
PITA
L RE
SOU
RCES
The accumulated benefit obligation of the pension
plan as of 31 December 2008 was $1,306,323,000
($1,374,738,000 – 2007).
The estimated net loss and prior service cost for
the defined benefit pension plans that will be amortized
from accumulated other comprehensive income into
net periodic benefit cost over the next fiscal year are
US$8,940,000 and US$4,079,000, respectively. The
estimated net loss and prior service credit for the other
postretirement benefits plan that will be amortized
from accumulated other comprehensive income into
net periodic benefit cost over the next fiscal year is
US$(27,000) and US$(8,646,000), respectively.
A one-percentage-point change in assumed health
care trend rates would have the following effects:
1-Percentage- 1-Percentage- Point Increase Point Decrease
Effect on total service and interest cost components $ 5,234,000 $ (3,953,000)Effect on postretirement benefit obligation 27,449,000 (21,903,000)
Estimated Future Benefits Payments
The following table shows the benefit payments expected
to be paid in each of the next five years and subsequent
five years. The expected benefit payments are based
on the same assumptions used to measure the benefit
obligation at 31 December 2008:
Pension Postretirement Benefits Medical Benefits
2009 $ 68,830,000 $ 4,183,000 2010 66,041,000 4,802,000 2011 71,501,000 5,475,000 2012 76,081,000 6,137,000 2013 78,628,000 6,780,000 2014-2018 460,645,000 43,674,000
NOTE P—FAIR VALUE OF FINANCIAL INSTRUMENTS
The carrying amounts and estimated fair values of ADB's
significant financial instruments as of 31 December 2008
and 2007 are summarized in the next page.
The Fair Value Option
Effective 1 January 2008, ADB elected the Fair Value
Option on all borrowings with associated derivative
instruments. This election allows ADB to mitigate the
earnings volatility in its statutory reporting that is caused
by the different accounting treatment of the borrowing
and its related derivative without having to apply the
complex hedge accounting requirements of FAS 133.
Fair Value Measurement
FAS 157 defines fair value as the price that would be
received to sell an asset or paid to transfer a liability at
measurement date (exit price) in an orderly transaction
among willing participants with an assumption that the
transaction takes place in the entity’s principal market,
the most advantageous market for the asset or liability.
The most advantageous market is the market where the
sale of the asset or transfer of liability would maximize the
amount received for the asset or minimize the amount
paid to transfer the liability. The fair value measurement
is not adjusted for transaction cost.
ADB determines fair values using inputs based on
quoted or observable market prices and cash flow models.
Inputs for the models are based on observable market
data such as yield curves, interest rates, volatilities, and
foreign exchange rates. Parameters and models used for
valuation are subject to internal review and periodic
external validation.
Pension Benefits Postretirement Medical Benefits
2008 2007 2008 2007
Components of net periodic benefit cost:
Service cost $38,077,000 $38,564,000 $ 8,432,000 $ 8,823,000 Interest cost 89,682,000 81,558,000 11,969,000 11,634,000 Expected return on plan assets (98,293,000) (88,047,000) – – Amortization of prior service cost 4,079,000 4,079,000 (8,646,000) (8,646,000) Recognized actuarial loss 1,862,000 2,569,000 1,950,000 3,304,000
Net periodic benefit cost $35,407,000 $38,723,000 $13,705,000 $15,115,000

OCR-8
31 December 2007 and 200631 December 2007 and 2006
67Annual Report 2008O
RDIN
ARY C
APITA
L RESOU
RCES
CONTINUED
Following guidelines are applied in determining
the fair values of financial instruments:
Borrowings and associated derivative instruments. Structured borrowings issued by ADB are valued by using
the discounted cash flow models based on embedded
options such as caps, floors, calls, and credit spread. These
models use pay-off profiles within the realm of accepted
market practices such as Hull-White, Black and Scholes,
Libor Market Model as applicable. Non-structured
swapped borrowings, forward foreign exchange, interest
rate, and cross currency swap contracts are fair valued
with observable market inputs using discounted cash
flow models. Market observable inputs, such as yield
curves, foreign exchange rates, basis spreads, credit
spreads, cross currency rates, and volatilities are applied
to the models to determine fair value of borrowings.
Classified under Level 2 are swapped borrowings and the
related derivatives for which ADB can obtain observable
market inputs in the form of primary broker quotes for
similar debt instruments. Included in Level 3 category
are swapped borrowings fair-valued using significant
unobservable inputs.
Investments, asset swaps, repurchase agreements and resale arrangements. Readily marketable investments
are fair valued using active market quotes in Level 1
category. Level 2 category includes investments and
repurchase agreements fair valued with significant other
market observable inputs. Included in Level 3 category
are insignificant portfolio of investments fair valued
using significant unobservable inputs including prices
provided by third parties such as the custodians and
asset managers. Forward foreign exchange, interest rate,
and cross currency swap contracts are fair valued with
observable market inputs using discounted cash flow
models. Market observable inputs, such as yield curves,
foreign exchange rates, basis spreads, credit spreads,
cross currency rates, and volatilities are applied to the
models to determine fair value of investments.
2008 2007
Carrying Estimated Carrying Estimated Amounta Fair Value Amounta Fair Value
On-balance sheet financial instruments:
ASSETS:
Due from banks $ 142,238,000 $ 142,238,000 $ 108,821,000 $ 108,821,000 Investments (Note D) 15,412,519,000 15,412,519,000 13,296,943,000 13,296,943,000 Securities transferred under repurchase agreement 309,358,000 309,358,000 5,041,387,000 5,041,387,000 Securities purchased under resale arrangement 511,756,000 511,756,000 427,132,000 427,132,000 Loans outstanding (Note E) 35,910,060,000 37,830,959,000 30,282,879,000 31,461,370,000 Equity investments (Note G) 641,427,000 641,427,000 808,157,000 808,157,000 Other assets Non-negotiable, non-interest-bearing demand obligations 144,514,000 93,724,000 174,805,000 105,027,000 Receivable from swaps – others (Note H) 882,793,000 882,793,000 512,089,000 512,089,000 Receivable from swaps – borrowings (Note H) 23,831,087,000 23,831,087,000 17,968,867,000 17,968,867,000 Future guarantee receivable 23,257,000 23,257,000 13,668,000 13,668,000
LIABILITIES:
Borrowings (Note J) 36,026,446,000 37,848,839,000 31,959,299,000 32,023,669,000 Other liabilities Payable for swaps – others (Note H) 1,198,781,000 1,198,781,000 583,321,000 583,321,000 Payable for swaps – borrowings (Note H) 24,867,815,000 24,867,815,000 16,936,964,000 16,936,964,000 Guarantee liability 23,257,000 23,257,000 13,668,000 13,668,000
2008 2007
Outstanding Present Outstanding Present Amount Value Amount Value
Off-balance sheet financial instruments: Guarantees (Note F) $ 1,189,851,000 $ 769,204,000 $ 1,060,328,000 $ 689,145,000
a The carrying amount for borrowings and swaps are inclusive of accrued interest.

ASIAN DEVELOPMENT BANK—ORDINARY CAPITAL RESOURCES
NOTES TO FINANCIAL STATEMENTS31 December 2008 and 2007
Asian Development Bank68O
RDIN
ARY
CA
PITA
L RE
SOU
RCES
Equity Investments. Readily marketable equity
investments are fair valued using quoted prices in active
markets.
Fair Value Hierarchy
FAS 157 establishes a fair value hierarchy that gives the
highest priority to quoted prices in active markets for
identical assets or liabilities (Level 1), next priority to
observable market inputs or market corroborated data
(Level 2), and the lowest priority to unobservable inputs
without market corroborated data (Level 3). FAS 157
requires the fair value measurement to maximize the use
of market observable inputs.
Assets and liabilities measured at fair value on a
recurring basis:
The fair value of the following financial assets and liabilities as of 31 December 2008 were reported based on the following:
Fair Value Measurements
Quoted Prices in Significant Significant Active Markets for Other Observable Unobservable Identical Assets Inputs Inputs 31 December 2008 (Level 1) (Level 2) (Level 3)
Assets
Investments $15,412,519,000 $6,410,116,000 $ 8,978,004,000 $ 24,399,000 Securities transferred under repurchase agreement 309,358,000 309,358,000 – – Securities purchased under resale arrangement 511,756,000 – 511,756,000 – Investments related swaps 544,796,000 – 544,796,000 – Loans related swaps 337,997,000 – 337,997,000 – Borrowings related swaps 23,831,087,000 – 23,831,087,000 – Equity investments 238,497,000 238,497,000 – –
Total $41,186,010,000 $6,957,971,000 $34,203,640,000 $ 24,399,000
Liabilities
Borrowings $31,012,976,000 – $24,528,881,000 $6,484,095,000 Borrowings related swaps 24,867,815,000 – 24,867,815,000 – Investments related swaps 745,289,000 – 745,289,000 – Loans related swaps 453,492,000 – 453,492,000 –
Total $57,079,572,000 $ – $50,595,477,000 $6,484,095,000
Assets (liabilities) measured at fair value on a recurring basis using significant unobservable inputs (level 3):
Investments Borrowings
Balance, 1 January 2008 $127,442,000 $(5,034,939,000) Total gains (losses) – (realized/unrealized) Included in earnings 52,000 384,233,000 Included in other comprehensive income (8,652,000) 550,965,000 Purchases, sales, and paydowns 1,262,000 – Issuances, redemptions, and maturities – (2,384,354,000) Transfers out of Level 3 (95,705,000) –
Balance, 31 December 2008 $ 24,399,000 $(6,484,095,000)
The amount of net losses for the period included in earnings attributable to the change in net unrealized gains relating to assets/liabilities still held at the reporting date $ – $ 282,466,000
OCR-8
31 December 2007 and 200631 December 2007 and 2006
69Annual Report 2008O
RDIN
ARY C
APITA
L RESOU
RCES
The following table provides the effect of the initial adoption of FAS 157 and FAS 159.
Carrying value Carrying value 1 January 2008, Net gain 1 January 2008, prior to adoption upon adoption after adoption Borrowings $31,959,300,000 $(227,500,000) $31,731,800,000
Cumulative effect to 1 January 2008 balance of reserves $227,500,000
The fair value of borrowings for which the fair value
option has been elected exceeds the aggregate principal
balance by $1,541,598,000.
The estimated gain from fair value changes included
in earnings that are attributable to the widening of the
credit spreads was $531,665,000 for the year ended 31
December 2008. Changes in fair value resulting from
changes in instrument-specific credit risk were estimated
by incorporating ADB's current observable credit spread
by currency into the relevant valuation technique used
to value the borrowing instruments.
The related interest expense continues to be
measured based on the contractual interest rates
and reported as such in the Statement of Income and
Expenses.
NOTE Q—CREDIT RISK
ADB is exposed to risk if the borrowers fall in arrears on
payments. ADB manages country risk for lending opera-
tions through continuous monitoring of creditworthiness
of the borrowers and rigorous capital adequacy frame-
work. Guarantees involve elements of credit risk which
are also not reflected on the balance sheet. Credit risk
represents the potential loss due to possible nonperform-
ance by obligors and counterparties under the terms of
the contract.
As of 31 December 2008, ADB has a significant
concentration of credit risk to Asian and the Pacific region
associated with loan and guarantee products with credit
exposure determined based on fair value of loans and
outstanding guarantees amounting to $39,446,560,000
($32,857,877,000 – 2007).
ADB undertakes derivative transactions with its
eligible counterparties and transacts in various financial
instruments as part of liquidity and asset/liability
management purposes that may involve credit risks.
For all investment securities and their derivatives, ADB
manages credit risks by following the guidelines set forth
in the Investment Authority (Note D).ADB has a potential risk of loss if the swap
counterparty fails to perform its obligations. In order to
reduce such credit risk, ADB only enters into long-term
swap transactions with counterparties eligible under
ADB's swap guidelines which include a requirement
that the counterparties have a credit rating of A-/A3 or
higher and requires certain counterparties with executed
Credit Support Annex, to provide collateral in form of
cash or other approved liquid securities based on mark-
to-market exposure.
As of 31 December 2008, ADB had received
collateral of $418,995,000 ($461,017,000 – 2007) in
connection with the swap agreements. ADB has also
entered into master swap agreements which contain
legally enforceable close-out netting provisions for all
counterparties with outstanding swap transactions.
NOTE R—SPECIAL AND TRUST FUNDS
ADB's operations include special operations, which are
financed from special fund resources, consisting of the
Asian Development Fund, the Technical Assistance
Special Fund, Japan Special Fund, the Asian Development
Bank Institute Special Fund, the Asian Tsunami Fund,
the Pakistan Earthquake Fund, the Regional Cooperation
and Integration Fund, and the Climate Change Fund.
The OCR and special fund resources are at all
times used, committed, and invested entirely separate
from each other. The Board of Governors may approve
allocation of the net income of OCR to special funds,
based on the funding and operational requirements for
the funds. The administrative and operational expenses
pertaining to the OCR and special funds are charged
to the respective special funds. The administrative
CONTINUED
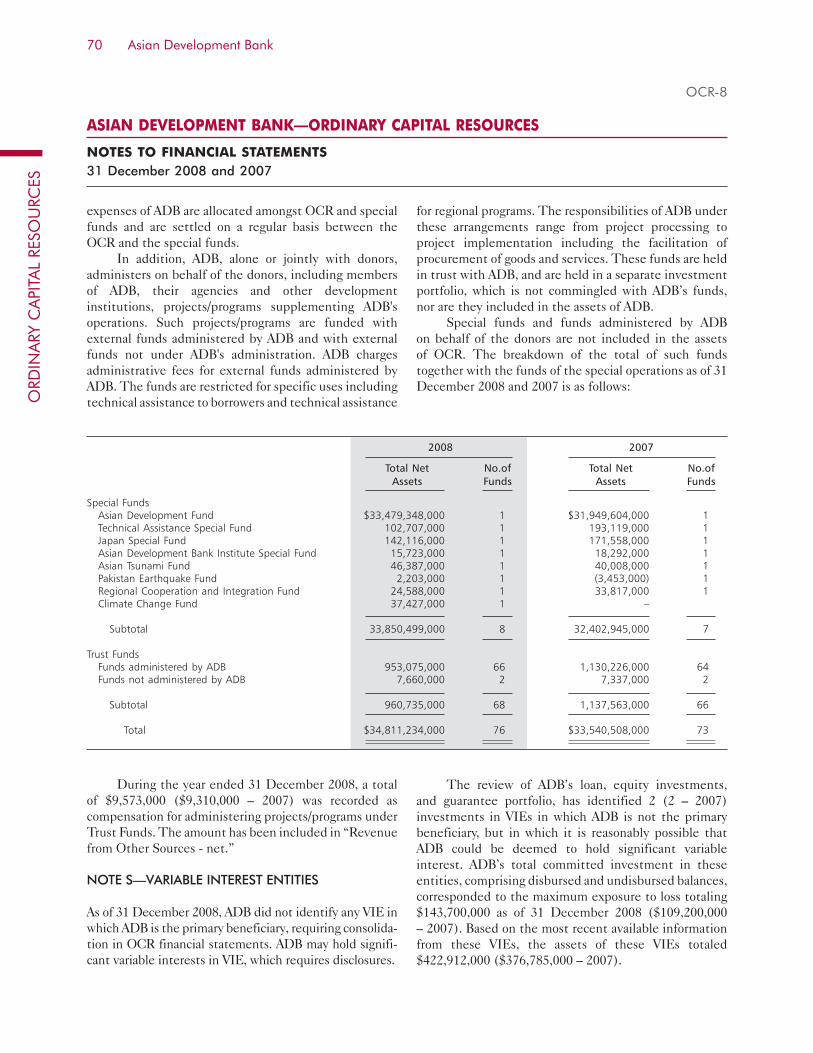
ASIAN DEVELOPMENT BANK—ORDINARY CAPITAL RESOURCES
NOTES TO FINANCIAL STATEMENTS31 December 2008 and 2007
Asian Development Bank70O
RDIN
ARY
CA
PITA
L RE
SOU
RCES
expenses of ADB are allocated amongst OCR and special
funds and are settled on a regular basis between the
OCR and the special funds.
In addition, ADB, alone or jointly with donors,
administers on behalf of the donors, including members
of ADB, their agencies and other development
institutions, projects/programs supplementing ADB's
operations. Such projects/programs are funded with
external funds administered by ADB and with external
funds not under ADB's administration. ADB charges
administrative fees for external funds administered by
ADB. The funds are restricted for specific uses including
technical assistance to borrowers and technical assistance
2008 2007
Total Net No.of Total Net No.of Assets Funds Assets Funds Special Funds Asian Development Fund $33,479,348,000 1 $31,949,604,000 1 Technical Assistance Special Fund 102,707,000 1 193,119,000 1 Japan Special Fund 142,116,000 1 171,558,000 1 Asian Development Bank Institute Special Fund 15,723,000 1 18,292,000 1 Asian Tsunami Fund 46,387,000 1 40,008,000 1 Pakistan Earthquake Fund 2,203,000 1 (3,453,000) 1 Regional Cooperation and Integration Fund 24,588,000 1 33,817,000 1 Climate Change Fund 37,427,000 1 –
Subtotal 33,850,499,000 8 32,402,945,000 7
Trust Funds Funds administered by ADB 953,075,000 66 1,130,226,000 64 Funds not administered by ADB 7,660,000 2 7,337,000 2
Subtotal 960,735,000 68 1,137,563,000 66
Total $34,811,234,000 76 $33,540,508,000 73
for regional programs. The responsibilities of ADB under
these arrangements range from project processing to
project implementation including the facilitation of
procurement of goods and services. These funds are held
in trust with ADB, and are held in a separate investment
portfolio, which is not commingled with ADB’s funds,
nor are they included in the assets of ADB.
Special funds and funds administered by ADB
on behalf of the donors are not included in the assets
of OCR. The breakdown of the total of such funds
together with the funds of the special operations as of 31
December 2008 and 2007 is as follows:
During the year ended 31 December 2008, a total
of $9,573,000 ($9,310,000 – 2007) was recorded as
compensation for administering projects/programs under
Trust Funds. The amount has been included in “Revenue
from Other Sources - net.”
NOTE S—VARIABLE INTEREST ENTITIES
As of 31 December 2008, ADB did not identify any VIE in
which ADB is the primary beneficiary, requiring consolida-
tion in OCR financial statements. ADB may hold signifi-
cant variable interests in VIE, which requires disclosures.
The review of ADB’s loan, equity investments,
and guarantee portfolio, has identified 2 (2 – 2007)
investments in VIEs in which ADB is not the primary
beneficiary, but in which it is reasonably possible that
ADB could be deemed to hold significant variable
interest. ADB’s total committed investment in these
entities, comprising disbursed and undisbursed balances,
corresponded to the maximum exposure to loss totaling
$143,700,000 as of 31 December 2008 ($109,200,000
– 2007). Based on the most recent available information
from these VIEs, the assets of these VIEs totaled
$422,912,000 ($376,785,000 – 2007).
OCR-8

71Annual Report 2008A
SIAN
DEVELO
PMEN
T FUN
D
ASIAN DEVELOPMENT FUND
Management's Report on Internal Control over Financial Reporting
The management of Asian Development Bank (“ADB”) is responsible for establishing and
maintaining adequate internal control over financial reporting. ADB's internal control over
financial reporting is a process designed to provide reasonable assurance regarding the reliabil-
ity of financial reporting and the preparation of financial statements for external purposes in
accordance with generally accepted accounting principles in the United States of America.
ADB's internal control over financial reporting includes those policies and procedures that
(i) pertain to the maintenance of records that, in reasonable detail, accurately and fairly re-
flect the transactions and dispositions of the assets of ADB; (ii) provide reasonable assurance
that transactions are recorded as necessary to permit preparation of financial statements in
accordance with generally accepted accounting principles, and that receipts and expenditures
of ADB are being made only in accordance with authorizations of management and directors
of ADB; and (iii) provide reasonable assurance regarding prevention or timely detection of
unauthorized acquisition, use or disposition of ADB's assets that could have a material effect
on the financial statements.
Because of its inherent limitations, internal control over financial reporting may not prevent
or detect misstatements. Also, projections of any evaluation of effectiveness to future periods
are subject to the risk that controls may become inadequate because of changes in conditions,
or that the degree of compliance with the policies or procedures may deteriorate.
ADB's management assessed the effectiveness of ADB's internal control over financial report-
ing as of 31 December 2008. In making this assessment, ADB's management used the criteria
set forth by the Committee of Sponsoring Organizations of the Treadway Commission in
Internal Control – Integrated Framework. Based on that assessment, management believes that as
of 31 December 2008, ADB's internal control over financial reporting is effective based upon
the criteria established in Internal Control – Integrated Framework.
Haruhiko Kuroda
President
Bindu N. Lohani
Vice President (Finance and Administration)
Hong-Sang Jung
Controller
5 March 2009

Asian Development Bank72A
SIA
N D
EVEL
OPM
ENT
FUN
D
PricewaterhouseCoopers LLP (Registration No. T09LL0001D) is an accounting limited liability partnership registered in Singapore under the Limited Liability Partner-ships Act (Chapter 163A). It was converted from a partnership (with the name “PricewaterhouseCoopers” and Registration no. 000640) to an accounting limited liability partnership on 1 January 2009. PricewaterhouseCoopers LLP is part of the network of member firms of PricewaterhouseCoopers International Limited, each of which is a separate and independent legal entity.
Report of Independent Auditors to the Asian Development Bank
In our opinion, the accompanying special purpose statements of assets, liabilities, fund balances and
the related special purpose statements of revenues and expenses, cash flows and changes in fund
balances present fairly, in all material respects, the financial position of Asian Development Bank
(“ADB” or “the Bank”)—Asian Development Fund at 31 December 2008 and 2007 and the results of
its operations and its cash flows for the years then ended, in conformity with accounting principles
generally accepted in the United States of America, with the exception of loan loss provisioning which
has been eliminated with the adoption of special purpose financial statements. Also in our opinion,
management’s assertion that ADB maintained effective internal control over financial reporting as of
31 December 2008 is fairly stated, in all material respects, based on criteria established in Internal
Control - Integrated Framework issued by the Committee of Sponsoring Organizations of the Tread-
way Commission (COSO). The management of ADB is responsible for these financial statements, for
maintaining effective internal control over financial reporting and for its assertion of the effectiveness
of internal control over financial reporting, included in the accompanying Management’s Report on
Internal Control over Financial Reporting. Our responsibility is to express opinions on these financial
statements and on ADB’s internal control over financial reporting based on our integrated audit in
2008 and financial statement audit in 2007. We conducted our audits of the financial statements in
accordance with auditing standards generally accepted in the United States of America and our audit
of internal control over financial reporting in accordance with attestation standards established by
the American Institute of Certified Public Accountants. Those standards require that we plan and
perform the audits to obtain reasonable assurance about whether the financial statements are free of
material misstatement and whether effective internal control over financial reporting was maintained
in all material respects. Our audits of the financial statements included examining, on a test basis,
evidence supporting the amounts and disclosures in the financial statements, assessing the accounting
principles used and significant estimates made by management, and evaluating the overall financial
statement presentation. Our audit of internal control over financial reporting included obtaining an
understanding of internal control over financial reporting, assessing the risk that a material weakness
exists, and testing and evaluating the design and operating effectiveness of internal control based on
the assessed risk. Our audits also included performing such other procedures as we considered neces-
sary in the circumstances. We believe that our audits provide a reasonable basis for our opinions.
PricewaterhouseCoopers LLPpwc.com/sg 8 Cross Street #17-00PWC BuildingSingapore 048424Telephone (65) 6236 3388Facsimile (65) 6236 3300
GST No.: M90362193L Reg. No.: T09LL0001D

73Annual Report 2008A
SIAN
DEVELO
PMEN
T FUN
D
Our audits were conducted for the purpose of forming an opinion on the special purpose financial
statements taken as a whole. The accompanying special purpose statements of loans as at 31 Decem-
ber 2008 and 2007, and of resources as at 31 December 2008 are presented for purposes of additional
analyses and are not required parts of the special purpose financial statements. Such information
has been subjected to the auditing procedures applied in the audits of the special purpose financial
statements and in our opinion is fairly stated in all material respects in relation to the special purpose
financial statements taken as a whole.
A company’s internal control over financial reporting is a process effected by those charged with
governance, management, and other personnel, designed to provide reasonable assurance regarding
the preparation of reliable financial statements in accordance with accounting principles generally
accepted in the United States of America. A company’s internal control over financial reporting in-
cludes those policies and procedures that (i) pertain to the maintenance of records that, in reasonable
detail, accurately and fairly reflect the transactions and dispositions of the assets of the company;
(ii) provide reasonable assurance that transactions are recorded as necessary to permit preparation of
financial statements in accordance with generally accepted accounting principles, and that receipts and
expenditures of the company are being made only in accordance with authorizations of management
and those charged with governance; and (iii) provide reasonable assurance regarding prevention, or
timely detection of unauthorized acquisition, use, or disposition of the company’s assets that could
have a material effect on the financial statements.
Because of its inherent limitations, internal control over financial reporting may not prevent or detect
misstatements. Also, projections of any evaluation of effectiveness to future periods are subject to
the risk that controls may become inadequate because of changes in conditions, or that the degree
of compliance with the policies or procedures may deteriorate.
PricewaterhouseCoopers LLP
Public Accountants and Certified Public Accountants
Singapore
5 March 2009

Asian Development Bank74A
SIA
N D
EVEL
OPM
ENT
FUN
D
ADF-1
ASIAN DEVELOPMENT BANK—ASIAN DEVELOPMENT FUND
SPECIAL PURPOSE STATEMENT OF ASSETS, LIABILITIES, AND FUND BALANCES 31 December 2008 and 2007 Expressed in Thousands of United States Dollars (Note B)
2008 2007 ASSETS
DUE FROM BANKS (Note B) $ 7,974 $ 2,945
INVESTMENTS (Notes B, C, and L) Government and government-guaranteed obligations $ 2,912,159 $ 688,654 Time deposits 687,147 6,054,661 Corporate bonds 2,401,231 6,000,537 151,409 6,894,724
SECURITIES PURCHASED UNDER RESALE ARRANGEMENT (Notes B, C, and L) 322,361 58,178
LOANS OUTSTANDING (ADF-5) (Notes B, D, L, and M) Sovereign 26,427,289 24,017,992 Less—provision for HIPC Debt Relief 87,471 26,339,818 – 24,017,992
ACCRUED REVENUE On investments 56,659 32,618 On loans 56,045 112,704 59,077 91,695
DUE FROM CONTRIBUTORS (Notes B, E, and L) 1,928,941 1,678,404
RECEIVABLE FROM FORWARD CONTRACTS 307,811 –
OTHER ASSETS 41,270 36,495 TOTAL $35,061,416 $32,780,433 LIABILITIES AND FUND BALANCES
PAYABLE TO RELATED FUNDS (Notes F and H) $ 31,743 $ 30,170
ADVANCE PAYMENTS ON CONTRIBUTIONS (ADF-6) (Note B) 124,473 117,573
UNDISBURSED COMMITMENTS (Notes B, K, and L) 1,052,333 682,582
PAYABLE FOR FORWARD CONTRACTS 373,041 –
OTHER LIABILITIES (Note G) 478 504
TOTAL LIABILITIES 1,582,068 830,829
FUND BALANCES Amounts available for operational commitments (ADF-6) Contributed Resources (Notes B and G) $31,089,051 $28,725,096 Unamortized Discount (ADF-6) (Note B) (44,645) (46,711)
31,044,406 28,678,385 Set-Aside Resources (Note I) 73,691 75,151 Transfers from Ordinary Capital Resources and Technical Assistance Special Fund (Note A) 743,823 703,986
31,861,920 29,457,522 Accumulated surplus (ADF-4) 3,719,782 2,243,408
Accumulated other comprehensive income (ADF-4) (Notes B and J) (2,102,354) 33,479,348 248,674 31,949,604 TOTAL $35,061,416 $32,780,433
The accompanying notes are an integral part of these special purpose financial statements (ADF-7).

75Annual Report 2008A
SIAN
DEVELO
PMEN
T FUN
D
ADF-2
ASIAN DEVELOPMENT BANK—ASIAN DEVELOPMENT FUND
SPECIAL PURPOSE STATEMENT OF REVENUE AND EXPENSES For the Years Ended 31 December 2008 and 2007 Expressed in Thousands of United States Dollars (Note B)
2008 2007
REVENUE From loans (Notes B and D) $ 250,568 $ 218,761 From investments (Notes B and C) 258,880 317,579 From other sources—net 1,066 $ 510,514 1,277 $ 537,617 EXPENSES Grants (Notes B and K) 539,800 377,760 Administrative expenses (Note H) 187,138 186,396 Amortization of discounts on contributions (Notes B and G) 6,547 4,237 Provision for HIPC Debt Relief (Notes D and M) 89,788 – Other expenses 17 823,290 25 568,418 NET REALIZED GAINS From loans (Note B) 2,088,211 – From investments 362 2,088,573 – – NET UNREALIZED (LOSSES) GAINS (Note B) (299,423) 13,486 REVENUE IN EXCESS OF (LESS THAN) EXPENSES $1,476,374 $ (17,315)
The accompanying notes are an integral part of these special purpose financial statements (ADF-7).

Asian Development Bank76A
SIA
N D
EVEL
OPM
ENT
FUN
D
ADF-3
ASIAN DEVELOPMENT BANK—ASIAN DEVELOPMENT FUND
SPECIAL PURPOSE STATEMENT OF CASH FLOWS For the Years Ended 31 December 2008 and 2007 Expressed in Thousands of United States Dollars (Note B)
2008 2007
CASH FLOWS FROM OPERATING ACTIVITIES Interest charges on loans received $ 228,544 $ 185,569 Interest on investments received 201,334 302,569 Interest received from securities under resale arrangement 939 2,022 Cash received from other sources 1,066 1,247 Administrative expenses paid (184,109) (183,664) Grants disbursed (177,466) (62,804) Financial expenses paid (16) (24)
Net Cash Provided by Operating Activities 70,292 244,915
CASH FLOWS FROM INVESTING ACTIVITIES Sales of investments 362 – Maturities of investments 132,364,873 135,378,128 Purchases of investments (131,564,370) (135,503,687) Net payments for securities purchased under resale arrangement (247,866) (3,863) Net payments for forward contracts (12,644) – Principal collected on loans 676,889 586,409 Loans disbursed (2,015,224) (1,592,955)
Net Cash Used in Investing Activities (797,980) (1,135,968)
CASH FLOWS FROM FINANCING ACTIVITIES Contributions received and encashed1 698,028 847,961 Cash received from Ordinary Capital Resources 40,000 40,000
Net Cash Provided by Financing Activities 738,028 887,961
Effect of Exchange Rate Changes on Due from Banks (5,311) 3,435
Net Increase in Due from Banks 5,029 343
Due from Banks at Beginning of Year 2,945 2,602
Due from Banks at End of Year $ 7,974 $ 2,945
RECONCILIATION OF REVENUE IN EXCESS OF (LESS THAN) EXPENSES TO NET CASH PROVIDED BY OPERATING ACTIVITIES:
Revenue in excess of (less than) expenses (ADF-2) $ 1,476,374 $ (17,315) Adjustments to reconcile revenue in excess of (less than) expenses to net cash provided by operating activities: Amortization of discounts/premiums on investments (26,222) (18,570) Amortization of discounts/premiums on forward contracts (3,089) – Amortization of discount under ANE 6,547 4,237 Grants approved and effective 539,800 377,760 Capitalized charges on loans (27,421) (24,675) Net loss on sales of investments (362) – Provision for HIPC debt relief 89,788 – Change in disbursed grants (170,098) (51,051) Change in advances under TA grants (7,333) (11,801) Change in accrued revenue on investments and loans (21,898) (2,934) Change in accrued expenses 2,993 2,780 Change in other assets (0) (30) Translation adjustments (1,788,787) (13,486)
Net Cash Provided by Operating Activities $ 70,292 $ 244,915
0 – Less than $500.1 Supplementary disclosure on noncash financing activities: Nonnegotiable, noninterest-bearing demand promissory notes amounting to $823,323 ($783,246 - 2007) were received from contributing members.The accompanying notes are an integral part of these special purpose financial statements (ADF-7).

77Annual Report 2008A
SIAN
DEVELO
PMEN
T FUN
D
ADF-4
ASIAN DEVELOPMENT BANK—ASIAN DEVELOPMENT FUND
SPECIAL PURPOSE STATEMENT OF CHANGES IN FUND BALANCES For the Years Ended 31 December 2008 and 2007 Expressed in Thousands of United States Dollars (Note B)
Accumulated Transfers Other Contributed Set-Aside from OCR Accumulated Comprehensive Resources Resources & TASF Surplus Income Total
Balance - 1 January 2007 $25,963,646 $71,624 $663,614 $2,260,723 $287,863 $29,247,470
Comprehensive income for the year 2007 (Note J) (17,315) (39,189) (56,504) Change in amounts available for operational commitments Contributed Resources 2,727,913 2,727,913 Unamortized Discount (13,174) (13,174) Transfer from ordinary capital resources 40,000 40,000 Change in SDR value of set-aside resources 3,527 3,527 Change in value of transfers from Technical Assistance Special Fund 372 372
Balance - 31 December 2007 $28,678,385 $75,151 $703,986 $2,243,408 $248,674 $31,949,604
Comprehensive income for the year 2008 (Note J) 1,476,374 (2,351,028) (874,654) Change in amounts available for operational commitments Contributed Resources 2,363,955 2,363,955 Unamortized Discount 2,066 2,066 Transfer from ordinary capital resources 40,000 40,000 Change in SDR value of set-aside resources (1,460) (1,460) Change in value of transfers from Technical Assistance Special Fund (163) (163)
Balance - 31 December 2008 $31,044,406 $73,691 $743,823 $3,719,782 $(2,102,354) $33,479,348
Accumulated Other Comprehensive Income (Note J) For the Years Ended 31 December 2008 and 2007 Expressed in Thousands of United States Dollars (Note B)
Accumulated Translation Unrealized Investment Accumulated Other Adjustments Holding Gains (Losses) Comprehensive Income
2008 2007 2008 2007 2008 2007
Balance, 1 January $ 241,638 $ 288,700 $ 7,036 $ (837) $ 248,674 $287,863 Other comprehensive income for the year (2,451,641) (47,062) 100,613 7,873 (2,351,028) (39,189)
Balance, 31 December $(2,210,003) $ 241,638 $107,649 $ 7,036 $(2,102,354) $248,674
The accompanying notes are an integral part of these special purpose financial statements (ADF-7).

Asian Development Bank78A
SIA
N D
EVEL
OPM
ENT
FUN
D
ASIAN DEVELOPMENT BANK—ASIAN DEVELOPMENT FUND
SPECIAL PURPOSE SUMMARY STATEMENT OF LOANS 31 December 2008 and 2007Expressed in Thousands of United States Dollars (Note B)
Undisbursed Loans Loans Balances of Not Yet Total Percent of Borrowers/Guarantors1 Outstanding Effective Loans2 Effective2 Loans Total Loans
Afghanistan $ 463,601 $ 324,022 $ – $ 787,623 2.39 Armenia 8,100 59,343 17,337 84,780 0.26 Azerbaijan 26,558 31,570 – 58,128 0.18 Bangladesh 5,743,777 1,156,028 84,850 6,984,655 21.16 Bhutan 115,992 56,852 29,148 201,992 0.61 Cambodia 812,591 215,568 – 1,028,159 3.11 Cook Islands 26,770 76 7,002 33,848 0.10 Georgia 72,560 38,141 – 110,701 0.34 Indonesia 1,130,869 463,476 80,500 1,674,845 5.07 Kazakhstan 7,353 525 – 7,878 0.02 Kiribati 14,520 – – 14,520 0.04 Kyrgyz Republic 570,858 53,359 – 624,217 1.89 Lao PDR 1,129,607 75,169 – 1,204,776 3.65 Maldives 67,199 24,061 7,078 98,338 0.30 Marshall Islands 67,748 – – 67,748 0.21 Micronesia, Fed. States of 48,699 19,100 – 67,799 0.21 Mongolia 575,286 90,020 – 665,306 2.02 Myanmar 565,751 – – 565,751 1.71 Nepal 1,564,986 328,870 – 1,893,856 5.74 Pakistan 6,403,379 763,024 230,229 7,396,632 22.41 Papua New Guinea 301,809 68,417 104,146 474,372 1.44 Philippines 907,770 – – 907,770 2.75 Samoa 84,867 41,645 2,647 129,159 0.39 Solomon Islands 56,169 – – 56,169 0.17 Sri Lanka 2,614,832 403,603 61,996 3,080,431 9.33 Tajikistan 237,101 146,593 – 383,694 1.16 Thailand 45,870 – – 45,870 0.14 Tonga 44,317 – – 44,317 0.13 Tuvalu 6,989 990 – 7,979 0.02 Uzbekistan 26,126 113,257 45,504 184,887 0.56 Vanuatu 53,816 – – 53,816 0.16 Viet Nam 2,630,421 1,107,475 330,708 4,068,604 12.33 Regional 998 593 – 1,591 –
TOTAL – 31 December 2008 26,427,289 5,581,777 1,001,145 33,010,211 100.00 Provision for HIPC Debt Relief (87,471) – – (87,471)
NET BALANCE – 31 December 2008 $ 26,339,818 $ 5,581,777 $ 1,001,145 $ 32,922,740
NET BALANCE – 31 December 2007 $ 24,017,992 $ 6,127,364 $ 1,048,872 $ 31,194,228
1 Loans other than those made directly to a member or to its central bank have been guaranteed by the member.2 Loans negotiated before 1 January 1983 were denominated in current United States dollars. Loans negotiated after that date are denominated in Special Drawing
Rights (SDR) for the purpose of commitment. The undisbursed portions of such SDR loans are translated into United States dollars at the applicable exchange rates as of the end of a reporting period. Of the undisbursed balances, ADB has entered into irrevocable commitments to disburse various amounts totaling $27,601 ($49,996 - 2007).

79Annual Report 2008A
SIAN
DEVELO
PMEN
T FUN
D
MATURITY OF EFFECTIVE LOANS
Twelve Months Five Years Ending 31 December Amount Ending 31 December Amount 2009 $ 1,135,914 2018 7,094,027 2010 945,246 2023 7,272,100 2011 1,059,334 2028 5,751,782 2012 1,136,702 2033 4,000,091 2013 1,214,380 2038 1,805,918 2043 436,212 2048 157,360
Total $ 32,009,066
SUMMARY OF CURRENCIES RECEIVABLE ON LOANS OUTSTANDING
Currency 2008 2007 Currency 2008 2007
Australian dollar $ 59,046 $ 230,396 Norwegian krone 112,091 279,628 Canadian dollar 278,119 921,698 Pound sterling 189,337 497,311 Danish krone 36,809 82,874 Singapore dollar 86 2,603 Euro 2,235,000 5,051,792 Swedish krona 98,374 296,379 Japanese yen 6,262,394 11,740,188 Swiss franc 128,826 356,988 Korean won 24,536 96,630 Thai baht 863 4,103 Malaysian ringgit 875 6,923 United States dollar 2,101,757 3,911,724 New Zealand dollar 1,279 12,958 Special Drawing Rights3 14,897,897 525,797
Total $26,427,289 $24,017,992
3 Basket of currencies defined by the International Monetary Fund consisting of the Euro, Japanese yen, Pound sterling and US dollar.
The accompanying notes are an integral part of these special purpose financial statements (ADF-7).
ADF-5

Asian Development Bank80A
SIA
N D
EVEL
OPM
ENT
FUN
D
ADF-6
ASIAN DEVELOPMENT BANK—ASIAN DEVELOPMENT FUND
SPECIAL PURPOSE STATEMENT OF RESOURCES 31 December 2008 Expressed in Thousands of United States Dollars (Note B)
Effective Effective Amounts Amounts Amounts Committed Not Yet Amounts Committed At Exchange At 31 December 2008 Available Available During Rates Per Exchange For Operational For Operational Amounts Amounts 2008 Resolutions Rates Commitments Commitments Received Receivable
CONTRIBUTED RESOURCES
Australia $ – $ 1,528,867 $ 1,317,489 $ – $ 1,317,489 $ 1,317,489 $ – Austria – 196,897 271,000 17,512 253,488 253,488 – Belgium – 181,749 234,752 1,814 232,938 232,938 – Brunei Darussalam1 9,500 9,500 9,500 – 9,500 9,500 – Canada 5,934 1,581,659 1,638,863 18,205 1,620,657 1,620,657 – China, People’s Republic of – 28,004 28,004 – 28,004 28,004 – Denmark 1,198 211,781 268,061 3,804 264,257 264,257 – Finland 614 132,515 148,550 1,907 146,644 146,644 – France – 1,096,317 1,359,361 – 1,359,361 1,359,361 – Germany – 1,479,254 2,036,586 104,845 1,931,741 1,931,741 – Hong Kong – 54,459 54,459 – 54,459 54,459 – Indonesia – 14,960 14,960 – 14,960 14,960 – Ireland – 28,046 32,470 – 32,470 32,470 – Italy 112,428 916,215 915,630 – 915,630 915,630 – Japan – 8,602,366 15,759,886 – 15,759,886 15,759,886 – Korea, Rep. of 1,400 267,256 220,135 2,541 217,594 217,594 – Luxembourg – 38,328 47,818 – 47,818 47,818 – Malaysia – 14,667 12,435 – 12,435 12,435 – Nauru – 1,933 1,933 – 1,933 1,433 500 The Netherlands – 587,468 798,349 – 798,349 798,349 – New Zealand 295 113,174 100,894 561 100,334 100,334 – Norway – 200,475 187,696 4,255 183,440 183,440 – Portugal – 65,994 93,709 – 93,709 93,709 – Singapore – 7,734 9,130 – 9,130 9,130 – Spain – 295,384 384,090 4,879 379,211 379,211 – Sweden 1,674 338,996 284,391 5,197 279,194 279,194 – Switzerland – 288,698 444,559 – 444,559 444,559 – Taipei,China – 63,475 60,990 – 60,990 60,990 – Thailand – 9,470 9,019 – 9,019 9,019 – Turkey – 110,520 110,520 2,524 107,996 107,996 – United Kingdom – 1,051,133 868,016 – 868,016 868,016 – United States – 3,767,249 3,767,249 278,054 3,489,195 3,489,195 –
Total 133,042 2 23,284,544 31,490,504 3 446,098 4 31,044,406 5 31,043,906 6 500
SET-ASIDE RESOURCES – 73,691 – 73,691 73,691 –
TRANSFER FROM ORDINARY CAPITAL RESOURCES 40,000 740,000 – 740,000 740,000 –
TRANSFERS FROM TECHNICAL ASSISTANCE SPECIAL FUND7 – – 3,823 – 3,823 3,823 –
TOTAL $173,042 $23,284,544 $32,308,018 $446,098 $31,861,920 $31,861,420 $500
Note: Figures may not add due to rounding.1 Became a member of ADB in June 2006, and have committed and fully paid its contribution to ADF IX in June 2008. 2 Except for Brunei and Italy, amounts committed during the year represents the discount due to the accelerated note encashment (ANE).3 Represents amounts committed per Instrument of Contribution including discount on donor’s contributions due to the ANE for ADF IX totaling $56,758.4 Includes the balance of unamortized discount on donor’s contributions due to the ANE for ADF IX totaling $44,645.5 Includes the amortized discount on donor’s contributions due to the ANE for ADF IX totaling $12,113 and the foregone interest received.6 Excludes advance payments received from donors totaling $124,473, which have not been made available for operational commitments as of 31 December
2008. 7 Includes translation adjustments amounting to $352 as of 31 December 2008.
The accompanying notes are an integral part of these special purpose financial statements (ADF-7).

ADF-7
81Annual Report 2008
ASIAN DEVELOPMENT BANK—ASIAN DEVELOPMENT FUND
NOTES TO SPECIAL PURPOSE FINANCIAL STATEMENTS31 December 2008 and 2007
ASIA
N D
EVELOPM
ENT FU
ND
NOTE A—NATURE OF OPERATIONS
The Asian Development Fund (ADF) was established
on 28 June 1974 to more effectively carry out the special
operations of the Asian Development Bank (ADB) by
providing resources on concessional terms which are
made available almost exclusively to the least developed
borrowing countries.
The resources of ADF have been subsequently
augmented by eight replenishments, the most recent
of which became effective in April 2005 consisting
of $3,302,547,000 in contributions from donors and
$3,700,000,000 from internal resources to cover the
operational requirements for the four-year period from
January 2005. Under this replenishment, ADB was
authorized to provide financing in the form of grants for
projects and programs of high developmental priority.
In August 2008, the Board of Governors approved
the resolution providing for the ninth replenishment of
the Asian Development Fund (ADF X) and the fourth
regularized replenishment of the Technical Assistance
Special Fund (TASF). The resolution provides for a
substantial replenishment of the ADF to finance ADB’s
concessional program for the four-year period from January
2009, and for a replenishment of the TASF in conjunction
with the ADF replenishment, to finance technical
assistance operations under the fund. Total replenishment
size is SDR7,111,290,000, of which SDR2,641,290,000
will come from new donor contributions. Donors
agreed to allocate 3% of the total replenishment size
(equivalent to 8% of total donor contributions) to TASF.
The replenishment shall be effective upon receipt
of the Instruments of Contribution for Unqualified
Contribution commitments in an aggregate amount
equivalent to at least SDR1,320,645,000, and such date
should not be later than 1 July 2009.
NOTE B— SUMMARY OF SIGNIFICANT ACCOUNTING POLICIES
In May 2001, the Board of Directors approved the
adoption of the special purpose financial statements for
ADF. Due to the nature and organization of ADF, these
financial statements have been prepared for the spe-
cific purpose of reflecting the sources and applications
of member contributions and are presented in US dollar
equivalents at the reporting dates. With the adoption
of the special purpose financial statements, loan loss
provisioning has been eliminated. With the exceptions
of the aforementioned, the ADF financial statements
are prepared in accordance with accounting principles
generally accepted in the United States of America.
In November 2005, to improve ADF currency
management practices, the Board of Governors accepted
a resolution to adopt a full-fledged special drawing rights
(SDR) approach to facilitate resource administration and
operational planning for the benefit of borrowers. The
currency management framework was implemented on 1
January 2006 whereby ADB is authorized to convert ADF
resources held in various currencies into the currencies
which constitute the SDR, to value disbursements,
repayments and loan charges in terms of SDR, and to
determine the value of contributors’ paid-in contributions
and all other resources of the Fund in terms of SDR, in
case of withdrawal of a Contributor or termination of
ADF.
In July 2007, as an application of the Board-approved
currency management exercise, ADB decided to offer
a full-fledged special drawing rights (SDR) approach
to ADF legacy loans by providing ADF borrowers the
option to convert their existing liability (i.e., disbursed
and outstanding loan balance) in various currencies into
SDR, while the undisbursed portions will be treated as
new loans. The conversion was made available beginning
1 January 2008, and as of 31 December 2008, 16 out
of 30 ADF borrowing countries have opted to convert
their loans, which were carried out on the nearest loan
service payment dates from their concurrence. The
conversion resulted in a realized gain of $2,088,211,000
with a corresponding reduction in other comprehensive
income.
Functional Currencies and Reporting Currency
The implementation of the full-fledged SDR framework
is expected to change the primary economic environment
of ADF. Until this process is completed, and a significant
change in the primary economic environment becomes
evident, the currencies of contributing member countries
are functional currencies as these represent the curren-
cies of the primary economic environment in which ADF
generates and expends cash. The United States dollar is
the reporting currency of the fund.

ASIAN DEVELOPMENT BANK—ASIAN DEVELOPMENT FUND
NOTES TO SPECIAL PURPOSE FINANCIAL STATEMENTS31 December 2008 and 2007
Asian Development Bank82A
SIA
N D
EVEL
OPM
ENT
FUN
D Translation of Currencies
ADB adopts the use of daily exchange rates for accounting
and financial reporting purposes. This allows transactions
in currencies other than USD to be translated to the
reporting currency using exchange rates applicable at the
time of transactions. At the end of each accounting month,
translations of assets, liabilities, and amounts available for
operational commitments denominated in non-USD are
adjusted using the applicable rates of exchange at the end
of the reporting period. Translation adjustments relating
to set-aside resources (Note I) are recorded as notional
amounts receivable from or payable to OCR. Translation
adjustments relating to the maintenance of SDR loans
are charged or credited to “Unrealized Gains/Losses” and
reported in the Statement of Revenue and Expenses. All
other translation adjustments are charged or credited to
“accumulated translation adjustments” and reported in
“FUND BALANCES” as part of “Accumulated Other
Comprehensive Income.”
Investments
Investment securities and negotiable certificate of
deposits are classified as “Available for Sale” and are re-
ported at estimated fair value, which represents their fair
market value. Unrealized gains and losses are reported
in “FUND BALANCES” as part of “Accumulated Other
Comprehensive Income.” Realized gains and losses are
measured by the difference between amortized cost and
the net proceeds of sales. Time deposits are reported at
cost, which is a reasonable estimate of fair value.
Interest income on investment securities and time
deposits is recognized as realized and reported, net of
amortizations of premiums and discounts.
Securities Transferred Under Repurchase Agreement and Securities Purchased Under Resale Arrangement
ADF accounts for transfers of financial assets in ac-
cordance with FAS 140, “Accounting for Transfers and
Servicing of Financial Assets and Extinguishments
of Liabilities - a replacement of FAS 125.” In general,
transfers are accounted for as sales when control over
the transferred assets has been relinquished. Otherwise
the transfers are accounted for as repurchase/resale
agreements and collateralized financing arrangements.
Under repurchase agreements, securities transferred are
recorded as assets and reported at estimated fair value
and cash collateral received are recorded as liabilities.
ADB monitors the fair value of the securities transferred
under repurchase agreements and the collateral. Under
resale arrangements, securities purchased are recorded
as assets, while securities received are not recorded as
liabilities and are not re-pledged.
There were no outstanding securities transferred
under repurchase agreement as of 31 December 2008
and 2007.
Loans
Loan interest income is recognized on accrual basis. It
is the policy of ADF to place in non-accrual status loans
made to eligible borrowing member countries if the prin-
cipal or interest with respect to any such loans is overdue
by six months. Interest on non-accruing loans is included
in revenue only to the extent that payments have actu-
ally been received by ADF. ADB maintains a position of
not taking part in debt rescheduling agreements with
respect to sovereign loans. In the case of nonsovereign
loans, ADB may agree to debt rescheduling only after
alternative courses of action have been exhausted. When
ADB decides that a particular loan is no longer collect-
ible, the entire amount is expensed during the period.
Contributed Resources
Contributions by donors are included in the financial
statements as amounts committed and are reported in
“Contributed Resources” as part of Fund Balances from
the date Instruments of Contribution are deposited and
related formalities are completed and made available for
operational commitments.
Contributions are generally received in the currency
of the contributor either in cash or notes.
Under ADF IX, contributors have the option to pay
their contributions under accelerated note encashment
(ANE) program and receive a discount. ADF invests the
cash generated from this program and the investment
income is used to finance operations. The related
contributions are recorded at the full undiscounted
amount, and the discount is amortized over the standard
encashment period of 10 years.

83Annual Report 2008
ASIAN DEVELOPMENT BANK—ASIAN DEVELOPMENT FUND
NOTES TO SPECIAL PURPOSE FINANCIAL STATEMENTS31 December 2008 and 2007
ASIA
N D
EVELOPM
ENT FU
ND
Advanced Payments on Contributions
Payments received in advance or as qualified contribu-
tions that cannot be made available for operational com-
mitment are recorded as advance payments and included
under “Liabilities.”
Grants and Undisbursed Commitments
Grants are recognized in the financial statements when
the grant is approved and becomes effective. Upon
completion of a project or cancellation of a grant, any
undisbursed amount is written back as a reduction in the
grants for the year and the corresponding undisbursed
commitment is eliminated accordingly.
Accounting Estimates
The preparation of special purpose financial statements
in conformity with generally accepted accounting princi-
ples requires Management to make reasonable estimates
and assumptions that affect the reported amounts of
assets, liabilities, and fund balances as at the end of the
year and the reported amounts of revenue and expenses
during the year. The actual results could differ from
those estimates.
Accounting and Reporting Developments
In March 2008, the Financial Accounting Standards
Board (FASB) issued Statement No. 161 “Disclosures
about Derivative Instruments and Hedging Activities
– an amendment of FASB Statement No. 133,” which
will be applicable for fiscal years beginning after 15
November 2008 and interim periods within those fiscal
years. This statement amends and expands the disclosure
requirements of FAS 133 to provide users with better
understanding of (i) how and why an entity uses deriva-
tives; (ii) how derivative instruments and related hedged
items are accounted for under FAS 133 and its related
interpretations; and (iii) how derivative instruments
and hedged items affect an entity’s financial position,
performance, and cash flows. ADB is currently assessing
the impact of this standard on its financial statements.
Special Purpose Statement of Cash Flows
For the purposes of the Special Purpose Statement of
Cash Flows, ADF considers that its cash and cash equiva-
lents are limited to “DUE FROM BANKS.”
NOTE C—INVESTMENTS
The main investment management objective is to main-
tain security and liquidity. Subject to these parameters,
ADB seeks the highest possible return on its investments.
Investments are governed by the Investment Authority
approved by the Board of Directors in 1999, and reviewed
in 2006. The review endorsed a portfolio strategy that is
largely consistent with the 1999 approach.
The net unrealized gains on the outstanding ANE
portfolio amounted to $19,069,000 ($7,135,000 - 2007).
The currency composition of the investment
portfolio as of 31 December 2008 and 2007 expressed in
United States dollars are as follows:
Currency 2008 2007
Australian dollar $ – $ 71,531,000Canadian dollar – 44,620,000Euro 2,581,915,000 2,806,481,000Japanese yen 583,470,000 366,715,000Pound sterling 604,228,000 995,227,000United States dollar 2,230,923,000 2,610,150,000 Total $6,000,536,000 $6,894,724,000
The estimated fair value and amortized cost of the
investments as of 31 December 2008 are as follows:
Estimated Amortized Fair Value Cost
Due in one year or less $3,754,777,000 $3,747,964,000Due in one year through five years 2,165,685,000 2,071,155,000Due after five years through ten years 80,074,000 73,768,000
Total $6,000,536,000 $5,892,887,000
ADF-7
CONTINUED

ASIAN DEVELOPMENT BANK—ASIAN DEVELOPMENT FUND
NOTES TO SPECIAL PURPOSE FINANCIAL STATEMENTS31 December 2008 and 2007
Asian Development Bank84A
SIA
N D
EVEL
OPM
ENT
FUN
D Additional information relating to investments in
government and government-guaranteed obligations and
corporate bonds is as follows:
2008 2007
As of 31 December: Amortized cost $5,205,740,000 $833,026,000Estimated fair value 5,313,389,000 840,063,000Gross unrealized gains 110,118,000 8,402,000Gross unrealized losses (2,469,000) (1,365,000) For the years ended 31 December: Change in net unrealized gains (losses) from prior year 100,613,000 7,874,000Proceeds from sales 14,350,000 –Gross gain on sales 365,000 –
The rate of return on the average investments held
during the year, including securities transferred under
securities lending arrangement and securities purchased
under resale arrangement, based on the portfolio held
at the beginning and end of each month, was 3.72%
(4.60% - 2007) excluding unrealized gains and losses
on investment securities, and 5.17% (4.72% – 2007)
including unrealized gains and losses on investments.
As of 31 December 2008, gross unrealized losses
amounted to $2,469,000 ($1,365,000 – 2007) from
government and government-guaranteed obligations
and corporate bonds, resulting from market movements.
There are no positions in 2008 that sustained unrealized
losses for over one year, (fifteen positions representing
1.64% of the investments in 2007). Comparative details
for 2008 and 2007 are as follows:
One year or less Over one year Total
For the year 2008 Fair Unrealized Fair Unrealized Fair Unrealized Value Losses Value Losses Value Losses
Government and government- guaranteed obligations $ 28,416,000 $ 4,000 $ – $ – $ 28,416,000 $ 4,000Corporate bonds 205,417,000 2,465,000 – – 205,417,000 2,465,000
Total $233,833,000 $ 2,469,000 $ – $ – $ 233,833,000 $ 2,469,000
One year or less Over one year Total
For the year 2007 Fair Unrealized Fair Unrealized Fair Unrealized Value Losses Value Losses Value Losses
Government and government- guaranteed obligations $ 44,608,000 $ 18,000 $ 82,419,000 $ 1,168,000 $ 127,027,000 $ 1,186,000Corporate bonds 31,361,000 36,000 30,989,000 143,000 62,350,000 179,000
Total $ 75,969,000 $ 54,000 $113,408,000 $ 1,311,000 $ 189,377,000 $ 1,365,000
NOTE D—LOANS AND LOAN LOSS PROVISION
Loans
Prior to 1 January 1999, loans of ADF were extended
to eligible borrowing member countries, which bore
a service charge of 1% and required repayment over
periods ranging from 35 to 40 years. On 14 December
1998, the Board of Directors approved an amendment
to ADF loan terms, as follows: (i) for loans to finance
specific projects, the maturity was shortened to 32 years
including an 8-year grace period; (ii) for program loans
to support sector development, the maturity was short-
ened to 24 years including an 8-year grace period; and
(iii) all new loans bear a 1% interest charge during the
grace period, and 1.5% during the amortization period,
with equal amortization. The revised ADF lending terms
took effect on 1 January 1999 for loans for which formal

ADF-7
85Annual Report 2008
ASIAN DEVELOPMENT BANK—ASIAN DEVELOPMENT FUND
NOTES TO SPECIAL PURPOSE FINANCIAL STATEMENTS31 December 2008 and 2007
ASIA
N D
EVELOPM
ENT FU
ND
loan negotiations were completed on or after 1 January
1999. ADF requires borrowers to absorb exchange risks
attributable to fluctuations in the value of the currencies
disbursed.
In September 2007, the Board of Directors approved
a new hard-term ADF lending facility. The facility will
have a fixed interest rate of 150 basis points below the
weighted average of the ten-year fixed swap rates of the
special drawing rights component currencies plus the
OCR lending spread, or the current ADF rate, whichever
is higher. Other terms are similar to those of regular ADF
loans. The interest rate will be reset every January and
will apply to all hard-term loans approved that year and
will be fixed for the life of the loan. For hard-term ADF
loans approved in 2008, the interest rate was set at 3.15%
(3.85% – 2007). Three loans were approved under this
facility in 2008 (nil – 2007).
ADB believes that there is no comparable market,
nor ADB intends to sell ADF loans. The use of market
data to arrive at the loan at fair value will give meaningless
results. As such, the fair value of loans is determined based
on the terms at which a similar loan would currently be
made by ADB to a similar borrower. For such loans, fair
value approximates the carrying amount. The estimated
fair value of loans is not affected by credit risks because
the amount of any such adjustment is not considered to
have a material effect based on ADB's experience with
its borrowers.
Undisbursed loan commitments and an analysis of
loans by country as of 31 December 2008 are shown in
ADF-5.
As of 31 December 2008 and 2007, loans to borrowers
that exceeded 5% of the total loans outstanding were as
follows:
2008 2007
Pakistan $ 6,403,379,000 $ 5,444,555,000Bangladesh 5,743,777,000 5,399,187,000Vietnam, Socialist Republic of 2,630,421,000 2,298,804,000Sri Lanka 2,614,832,000 2,539,657,000Nepal 1,564,986,000 1,486,034,000Others (individually less than 5% of total loans) 7,469,894,000 6,849,755,000
Total Outstanding Loans 26,427,289,000 $24,017,992,000
Provision for HIPC Debt Relief (87,471,000) –
Net Outstanding Loans $26,339,818,000 $24,017,992,000
The principal amount outstanding of sovereign
loans in non-accrual status as of 31 December 2008
was $565,751,000 ($488,901,000 – 2007) of which
$263,444,000 ($209,477,000 - 2007) was overdue. Loans
in non-accrual status resulted in $5,176,000 ($4,691,000
– 2007) not being recognized as income from loans for
the year ended 31 December 2008. The accumulated
interest on these loans that was not recognized as income
as of 31 December 2008 would have totaled $63,802,000
($50,260,000 – 2007). The loans in non-accrual status
as of 31 December 2008 were 28 loans to Myanmar
representing 2.1% of the total outstanding loans (28
loans to Myanmar – 2007).
During the period, provision for HIPC debt relief
amounting to $89,788,000 relating to the Afghanistan
debt relief under the HIPC initiative was recognized and
charged to income. Of this amount, a total of $527,000 was
written-off as the loan service payments of some affected
loans fell due. This brought the balance of Provision for
HIPC debt relief as of 31 December 2008, including the
effects of translation adjustments, to $87,471,000 (nil
– 31 December 2007) (See Note M).
NOTE E—DUE FROM CONTRIBUTORS
Included in “Due From Contributors” are notes of
contributors and contributions receivable. Notes of
contributors are non-negotiable, non-interest-bearing
and, subject to certain restrictions imposed by applicable
Board of Governors' resolutions, encashable by ADB at
par upon demand.
ADB currently expects that the notes outstanding
at 31 December 2008 will be encashed in varying amounts
over a six-year period ending 31 December 2014.
The fair value of notes of contributors is determined
based on the terms at which notes are currently being
accepted from contributors. On this basis, the fair value
of outstanding notes of contributors approximates their
carrying amount.
NOTE F—PAYABLE TO RELATED FUNDS
The OCR and special fund resources are at all times
used, committed, and invested entirely separate from
each other. The administrative and operational expenses
pertaining to the OCR and ADF are allocated based on
operational activities and are settled regularly. Under
ADF IX and third regularized replenishment of Technical
CONTINUED

ASIAN DEVELOPMENT BANK—ASIAN DEVELOPMENT FUND
NOTES TO SPECIAL PURPOSE FINANCIAL STATEMENTS31 December 2008 and 2007
Asian Development Bank86A
SIA
N D
EVEL
OPM
ENT
FUN
D Assistance Special Fund (TASF), a specific portion of
the total contributions are to be allocated to TASF. ADF
receives all contributions of members and subsequently
transfers TASF’s portion to TASF.
As of 31 December 2008, $31,743,000 representing
administration charges was payable to OCR ($28,750,000
– 2007). No payable to TASF was outstanding in 2008
while $1,419,000 in 2007 corresponds to contributions
from donors incorporated in ADF IX for the third
regularized replenishment of TASF.
NOTE G—CONTRIBUTED RESOURCES/ OTHER LIABILITIES
As of 31 December 2008, contributions from 30 donors to-
taling $3,431,219,000 (28 donors totaling $3,290,116,000
– 2007) were committed for ADF IX. Of these, contribu-
tions totaling $3,153,949,000 ($2,270,884,000 – 2007),
including amortized discount totaling $12,112,000
($7,523,000 – 2007), were received and made available
for operational commitment. These were recorded in
“Contributed Resources.”
In May 2008, the Board of Governors approved the
allocation of $40,000,000 from OCR's 2007 net income
to ADF.
As of 31 December 2008, Italy's promissory note
received under ADF VI has a remaining balance of
€342,000 ($481,000 equivalent). This was recorded in
Deferred Credits and included in “Other liabilities.”
NOTE H—ADMINISTRATIVE EXPENSES AND ADMINISTRATION CHARGE
Administrative expenses represent administration charge
from OCR which is an apportionment of all administra-
tive expenses of ADB (other than those pertaining
directly to ordinary operations and special operations),
in the proportion of the relative volume of operational
activities of each fund.
NOTE I—SET-ASIDE RESOURCES
Pursuant to the provisions of Article 19, paragraph 1(i)
of the Articles of Agreement Establishing the Asian
Development Bank (the Charter), the Board of Governors
has authorized the setting aside of 10% of the unimpaired
“paid-in” capital paid by member countries pursuant
to Article 6, paragraph 2(a) of the Charter and of the
convertible currency portion paid by member countries
pursuant to Article 6, paragraph 2(b) of the Charter as of
28 April 1973, to be used as a part of the Special Funds
of ADB. The capital so set aside was allocated and trans-
ferred from the OCR to ADF as Set-Aside Resources.
The capital stock of ADB is defined in Article 4,
paragraph 1 of the Charter, “in terms of United States
dollars of the weight and fineness in effect on 31 January
1966” (the 1966 dollar). Therefore, Set-Aside Resources
had historically been translated into the current United
States dollar (ADB's unit of account), on the basis of its
par value in terms of gold. From 1973 until 31 March
1978, the rate arrived at on this basis was $1.20635
per 1966 dollar. Since 1 April 1978, at which time the
Second Amendment to the Articles of Agreement of the
International Monetary Fund (IMF) came into effect,
currencies no longer had par values in terms of gold.
Pending ADB's selection of the appropriate successor to
the 1966 dollar, the Set-Aside Resources have been valued
for purposes of the accompanying financial statements in
terms of the Special Drawing Right (SDR), at the value
in current United States dollars as computed by the IMF.
As of 31 December 2008, the value of the SDR in terms of
the current United States dollar was $1.54781 ($1.57848
- 2007). On this basis, Set-Aside Resources amounted to
$73,691,000 ($75,151,000 - 2007). If the capital stock of
ADB as of 31 December 2008 had been valued in terms
of $12,063.50 per share, Set-Aside Resources would have
been $57,434,000.
NOTE J—COMPREHENSIVE INCOME
Comprehensive Income has two major components:
revenue in excess of (less than) expenses and other
comprehensive income. Other Comprehensive Income
includes unrealized gains and losses on “Available for
Sale” securities and translation adjustments of functional
currencies.
NOTE K—GRANTS AND UNDISBURSED COMMITMENTS
The ADF IX introduced financing in the form of grants
for the first time. As of 31 December 2008 and 2007, 27
grants amounting to $707,360,000 and 24 grants amount-
ing to $519,340,000 were approved, respectively. During
the year, grants totaling $539,800,000 ($377,760,000
– 2007) became effective.

ADF-7
87Annual Report 2008
ASIAN DEVELOPMENT BANK—ASIAN DEVELOPMENT FUND
NOTES TO SPECIAL PURPOSE FINANCIAL STATEMENTS31 December 2008 and 2007
ASIA
N D
EVELOPM
ENT FU
ND
The fair value of undisbursed commitments
approximates the amount outstanding, because ADB
expects that disbursements will substantially be made for
all the projects/programs covered by the commitments.
NOTE L—FAIR VALUE MEASUREMENTS
FAS 157 defines fair value as the price that would be
received to sell an asset or paid to transfer a liability at
measurement date (exit price) in an orderly transaction
among willing participants with an assumption that the
transaction takes place in the entity’s principal market,
the most advantageous market for the asset or liability.
The most advantageous market is the market where the
sale of the asset or transfer of liability would maximize the
amount received for the asset or minimize the amount
paid to transfer the liability. The fair value measurement
is not adjusted for transaction cost.
FAS 157 also establishes a fair value hierarchy
that gives the highest priority to quoted prices in
active markets for identical assets or liabilities (Level
1), next priority to observable market inputs or market
corroborated data (Level 2), and the lowest priority to
unobservable inputs without market corroborated data
(Level 3). FAS 157 requires the fair value measurement
to maximize the use of market observable inputs.
The following guidelines are applied in determining
the fair values of financial instruments:
Investments, forward contracts, and securities purchased under resale arrangements
Readily marketable investments are fair valued using ac-
tive market quotes in Level 1 category. Level 2 category
includes investments, resale arrangements, and forward
contracts which are fair valued with significant other
market observable inputs. Forward foreign exchange
contracts are fair valued using discounted cash flow
models.
The fair value of the following financial assets of
ADF as of 31 December 2008 were reported based on
the following:
CONTINUED
Fair Value Measurements Quoted Prices in Significant Significant Active Markets for Other Observable Unobservable Identical Assets Inputs Inputs 31 December 2008 (Level 1) (Level 2) (Level 3)
Assets Investments $6,000,536,000 $3,951,007,000 $2,049,529,000 $ – Securities purchased under resale arrangement 322,361,000 – 322,361,000 – Receivable - forward contracts 307,811,000 – 307,811,000 –
Total $6,630,708,000 $3,951,007,000 $2,679,701,000 $ – Liabilities Payable - forward contracts $ 373,041,000 $ – $ 373,041,000 $ –
See Notes C, D, E, and K for discussions relating
to investments, loans, due from contributors, and
undisbursed commitments. In all other cases, the
carrying amounts of ADF's assets, liabilities, and fund
balances are considered to approximate fair values for all
significant financial instruments.
NOTE M—HEAVILY INDEBTED POOR COUNTRIES (HIPC) INITIATIVE
In April 2008, the Board of Governors adopted the
resolution on Providing Heavily Indebted Poor Countries
(HIPC) Relief from Asian Development Fund Debt, for
ADB to participate in the HIPC debt relief initiative.

ASIAN DEVELOPMENT BANK—ASIAN DEVELOPMENT FUND
NOTES TO SPECIAL PURPOSE FINANCIAL STATEMENTS31 December 2008 and 2007
Asian Development Bank88A
SIA
N D
EVEL
OPM
ENT
FUN
D The HIPC debt relief initiative was launched in
1996 by the International Development Association
(IDA) and International Monetary Fund (IMF) to
address the debt problems of heavily indebted poor
countries to ensure that reform efforts in these countries
are not put at risk due to their high external debt burden.
Under the HIPC debt relief initiative, all bilateral and
multilateral creditors provide debt relief for countries
that demonstrated good policy performance over an
extended period to bring their debt service burden to
sustainable level. As of 31 December 2008, Afghanistan
is the only borrower that has qualified for HIPC debt
relief.
ADF-7

89Annual Report 2008TEC
HN
ICA
L ASSISTA
NC
E SPECIA
L FUN
D
TECHNICAL ASSISTANCE SPECIAL FUND
Management's Report on Internal Control over Financial Reporting
The management of Asian Development Bank (“ADB”) is responsible for establishing and
maintaining adequate internal control over financial reporting. ADB's internal control over
financial reporting is a process designed to provide reasonable assurance regarding the reliabil-
ity of financial reporting and the preparation of financial statements for external purposes in
accordance with generally accepted accounting principles in the United States of America.
ADB's internal control over financial reporting includes those policies and procedures that
(i) pertain to the maintenance of records that, in reasonable detail, accurately and fairly re-
flect the transactions and dispositions of the assets of ADB; (ii) provide reasonable assurance
that transactions are recorded as necessary to permit preparation of financial statements in
accordance with generally accepted accounting principles, and that receipts and expenditures
of ADB are being made only in accordance with authorizations of management and directors
of ADB; and (iii) provide reasonable assurance regarding prevention or timely detection of
unauthorized acquisition, use or disposition of ADB's assets that could have a material effect
on the financial statements.
Because of its inherent limitations, internal control over financial reporting may not prevent
or detect misstatements. Also, projections of any evaluation of effectiveness to future periods
are subject to the risk that controls may become inadequate because of changes in conditions,
or that the degree of compliance with the policies or procedures may deteriorate.
ADB's management assessed the effectiveness of ADB's internal control over financial report-
ing as of 31 December 2008. In making this assessment, ADB's management used the criteria
set forth by the Committee of Sponsoring Organizations of the Treadway Commission in
Internal Control – Integrated Framework. Based on that assessment, management believes that as
of 31 December 2008, ADB's internal control over financial reporting is effective based upon
the criteria established in Internal Control – Integrated Framework.
Haruhiko Kuroda
President
Bindu N. Lohani
Vice President (Finance and Administration)
Hong-Sang Jung
Controller
5 March 2009

Asian Development Bank90TE
CH
NIC
AL
ASS
ISTA
NC
E SP
ECIA
L FU
ND
Report of Independent Auditors to the Asian Development Bank
In our opinion, the accompanying statements of financial position and the related statements of ac-
tivities and changes in net assets and cash flows present fairly, in all material respects, the financial
position of the Asian Development Bank (“ADB” or “the Bank”)—Technical Assistance Special Fund
at 31 December 2008 and 2007, and the results of its activities and changes in net assets and its cash
flows for the years then ended, in conformity with accounting principles generally accepted in the
United States of America. Also in our opinion, management’s assertion that ADB maintained effective
internal control over financial reporting as of 31 December 2008 is fairly stated, in all material respects,
based on criteria established in Internal Control – Integrated Framework issued by the Committee of
Sponsoring Organizations of the Treadway Commission (COSO). The management of ADB is respon-
sible for these financial statements, for maintaining effective internal control over financial reporting
and for its assertion of the effectiveness of internal control over financial reporting, included in the
accompanying Management's Report on Internal Control over Financial Reporting. Our responsibil-
ity is to express opinions on these financial statements and on ADB’s internal control over financial
reporting based on our integrated audit in 2008 and financial statement audit in 2007. We conducted
our audits of the financial statements in accordance with auditing standards generally accepted in
the United States of America and our audit of internal control over financial reporting in accordance
with attestation standards established by the American Institute of Certified Public Accountants.
Those standards require that we plan and perform the audits to obtain reasonable assurance about
whether the financial statements are free of material misstatement and whether effective internal
control over financial reporting was maintained in all material respects. Our audits of the financial
statements included examining, on a test basis, evidence supporting the amounts and disclosures in
the financial statements, assessing the accounting principles used and significant estimates made
by management, and evaluating the overall financial statement presentation. Our audit of internal
control over financial reporting included obtaining an understanding of internal control over financial
reporting, assessing the risk that a material weakness exists, and testing and evaluating the design
and operating effectiveness of internal control based on the assessed risk. Our audits also included
performing such other procedures as we considered necessary in the circumstances. We believe that
our audits provide a reasonable basis for our opinions.
PricewaterhouseCoopers LLPpwc.com/sg 8 Cross Street #17-00PWC BuildingSingapore 048424Telephone (65) 6236 3388Facsimile (65) 6236 3300
GST No.: M90362193L Reg. No.: T09LL0001D
PricewaterhouseCoopers LLP (Registration No. T09LL0001D) is an accounting limited liability partnership registered in Singapore under the Limited Liability Partner-ships Act (Chapter 163A). It was converted from a partnership (with the name “PricewaterhouseCoopers” and Registration no. 000640) to an accounting limited liability partnership on 1 January 2009. PricewaterhouseCoopers LLP is part of the network of member firms of PricewaterhouseCoopers International Limited, each of which is a separate and independent legal entity.
91Annual Report 2008TEC
HN
ICA
L ASSISTA
NC
E SPECIA
L FUN
D
Our audits were conducted for the purpose of forming an opinion on the basic financial state-
ments taken as a whole. The accompanying statement of resources as at 31 December 2008
and summary statement of technical assistance approved and effective for the year ended
31 December 2008 are presented for purposes of additional analyses and are not required parts of
the basic financial statements. Such information has been subjected to the auditing procedures ap-
plied in the audits of the basic financial statements and in our opinion, is fairly stated in all material
respects in relation to the basic financial statements taken as a whole.
A company’s internal control over financial reporting is a process effected by those charged with
governance, management, and other personnel, designed to provide reasonable assurance regarding
the preparation of reliable financial statements in accordance with accounting principles generally
accepted in the United States of America. A company’s internal control over financial reporting in-
cludes those policies and procedures that (i) pertain to the maintenance of records that, in reasonable
detail, accurately and fairly reflect the transactions and dispositions of the assets of the company;
(ii) provide reasonable assurance that transactions are recorded as necessary to permit preparation of
financial statements in accordance with generally accepted accounting principles, and that receipts and
expenditures of the company are being made only in accordance with authorizations of management
and those charged with governance; and (iii) provide reasonable assurance regarding prevention, or
timely detection of unauthorized acquisition, use, or disposition of the company’s assets that could
have a material effect on the financial statements.
Because of its inherent limitations, internal control over financial reporting may not prevent or detect
misstatements. Also, projections of any evaluation of effectiveness to future periods are subject to
the risk that controls may become inadequate because of changes in conditions, or that the degree
of compliance with the policies or procedures may deteriorate.
PricewaterhouseCoopers LLP
Public Accountants and Certified Public Accountants
Singapore
5 March 2009

Asian Development Bank92TE
CH
NIC
AL
ASS
ISTA
NC
E SP
ECIA
L FU
ND
TASF-1
ASIAN DEVELOPMENT BANK—TECHNICAL ASSISTANCE SPECIAL FUND
STATEMENT OF FINANCIAL POSITION 31 December 2008 and 2007 Expressed in Thousands of United States Dollars (Note B)
2008 2007
ASSETS
DUE FROM BANKS (Note B) $ 1,692 $ 1,306 INVESTMENTS (Notes B, C, and G) Time deposits $156,114 $295,078 Corporate bonds 139,429 295,543 – 295,078 SECURITIES PURCHASED UNDER RESALE ARRANGEMENT (Notes B and G) 111 – ACCRUED REVENUE 124 788 DUE FROM CONTRIBUTORS (Notes B and F) 17,304 68,489 OTHER ASSETS (Note D) 10,674 11,264 TOTAL $325,448 $376,925
LIABILITIES AND UNCOMMITTED BALANCES
MISCELLANEOUS LIABILITIES (Note D) $ 19 $ 88
UNDISBURSED COMMITMENTS (Notes B, E, and G) 222,722 183,718
UNCOMMITTED BALANCES (TASF-2 and TASF-4) (Notes B and F), represented by: Unrestricted net assets 102,707 193,119
TOTAL $325,448 $376,925
The accompanying notes are an integral part of these financial statements (TASF-6).

93Annual Report 2008TEC
HN
ICA
L ASSISTA
NC
E SPECIA
L FUN
D
TASF-2
ASIAN DEVELOPMENT BANK—TECHNICAL ASSISTANCE SPECIAL FUND
STATEMENT OF ACTIVITIES AND CHANGES IN NET ASSETS For the Years Ended 31 December 2008 and 2007Expressed in Thousands of United States Dollars (Note B)
2008 2007
CHANGES IN UNRESTRICTED NET ASSETS
CONTRIBUTIONS (TASF-4) (Notes B and F) $ 30,269 $ 52
REVENUE From investments (Notes B and C) 10,880 14,162 From other sources—net (Note E) 138 195
Total 41,287 14,409
EXPENSES Technical assistance—net (TASF-5) (Notes B and E) 108,159 77,532 Financial expenses 8 5
Total 108,167 77,537
CONTRIBUTIONS AND REVENUE LESS THAN EXPENSES (66,880) (63,128)
EXCHANGE (LOSSES) GAINS—net (Note B) (23,532) 35,714
DECREASE IN NET ASSETS (90,412) (27,414)
NET ASSETS AT BEGINNING OF YEAR 193,119 220,533
NET ASSETS AT END OF YEAR $102,707 $193,119
The accompanying notes are an integral part of these financial statements (TASF-6).

Asian Development Bank94TE
CH
NIC
AL
ASS
ISTA
NC
E SP
ECIA
L FU
ND
TASF-3
ASIAN DEVELOPMENT BANK—TECHNICAL ASSISTANCE SPECIAL FUND
STATEMENT OF CASH FLOWS For the Years Ended 31 December 2008 and 2007 Expressed in Thousands of United States Dollars (Note B)
2008 2007 CASH FLOWS FROM OPERATING ACTIVITIES Contributions received $ 85,526 $ 51,698 Interest on investments received 9,972 14,721 Cash received from other sources 172 199 Technical assistance disbursed (70,044) (77,872) Financial expenses paid (9) (5) Net Cash Provided by (Used in) Operating Activities 25,617 (11,259) CASH FLOWS FROM INVESTING ACTIVITIES Maturities of investments 11,780,926 3,513,304 Purchases of investments (11,804,622) (3,502,634) Net payments for securities purchased under resale arrangement (290) (198) Net Cash (Used in) Provided by Investing Activities (23,986) 10,472 Effect of Exchange Rate Changes on Due from Banks (1,245) 265 Net Increase (Decrease) in Due from Banks 386 (522) Due from Banks at Beginning of Year 1,306 1,828 Due from Banks at End of Year $ 1,692 $ 1,306 RECONCILIATION OF DECREASE IN NET ASSETS TO NET CASH PROVIDED BY (USED IN) OPERATING ACTIVITIES:
Decrease in net assets (TASF-2) $ (90,412) $ (27,414) Adjustments to reconcile decrease in net assets to net cash provided by (used in) operating activities: Amortization of discounts/premiums on investments (1,529) – Change in accrued revenue 622 558 Change in due from contributors 47,187 49,918 Change in other assets (826) 35 Change in miscellaneous liabilities (64) (29) Change in undisbursed commitments 39,004 (344) Translation adjustments 31,635 (33,983) Net Cash Provided by (Used in) Operating Activities $ 25,617 $ (11,259)
The accompanying notes are an integral part of these financial statements (TASF-6).

95Annual Report 2008TEC
HN
ICA
L ASSISTA
NC
E SPECIA
L FUN
D
TASF-4
ASIAN DEVELOPMENT BANK—TECHNICAL ASSISTANCE SPECIAL FUND
STATEMENT OF RESOURCES 31 December 2008Expressed in Thousands of United States Dollars (Note B)
Contributions Direct Committed Voluntary Regularized Total During 2008 Contributions Replenishment1 Contributions
DIRECT VOLUNTARY CONTRIBUTIONS
Australia $ – $ 2,484 $ 29,368 $ 31,852 Austria – 159 3,793 3,952 Bangladesh – 47 – 47 Belgium – 1,394 3,207 4,601 Canada – 3,346 26,638 29,984 China, People’s Rep. of – 1,600 1,996 3,596 Denmark – 1,963 4,034 5,997 Finland – 237 2,058 2,295 France – 1,698 20,969 22,667 Germany – 3,315 26,642 29,957 Hong Kong, China – 100 1,397 1,497 India 250 3,310 – 3,310 Indonesia – 250 40 290 Italy 6,950 774 16,320 17,094 Japan – 47,710 157,606 205,316 Korea, Rep. of – 1,900 8,104 10,004 Luxembourg – – 238 238 Malaysia – 909 333 1,242 Nauru – – 67 67 The Netherlands – 1,338 11,823 13,161 New Zealand – 1,096 2,234 3,330 Norway – 3,279 4,308 7,587 Pakistan 70 1,736 – 1,736 Portugal – – 1,344 1,344 Singapore – 1,100 266 1,366 Spain – 190 6,189 6,379 Sri Lanka – 6 – 6 Sweden – 861 6,855 7,716 Switzerland – 1,035 5,463 6,498 Taipei,China – 200 1,710 1,910 Thailand – – 202 202 Turkey – – 2,720 2,720 United Kingdom – 5,617 21,662 27,279 United States – 1,500 65,031 66,531
Total $ 7,269 $ 89,154 $ 432,617 $ 521,771
Transfers to Asian Development Fund (3,472)
Allocation from OCR Net Income 23,000 706,000
Other Resources2 178,257
TOTAL $30,269 $1,402,556
Note: Figures may not add to total due to rounding.1 Represents TASF portion of contributions to the replenishment of the Asian Development Fund and the Technical Assistance Special Fund authorized by Governors’
Resolution Nos. 182, 214 and 300 at historical values.2 Represents income, repayments, and reimbursement accruing to TASF since 1980.
The accompanying notes are an integral part of these financial statements (TASF-6).

Asian Development Bank96TE
CH
NIC
AL
ASS
ISTA
NC
E SP
ECIA
L FU
ND
TASF-5
ASIAN DEVELOPMENT BANK—TECHNICAL ASSISTANCE SPECIAL FUND
SUMMARY STATEMENT OF TECHNICAL ASSISTANCE APPROVED AND EFFECTIVE For the Year Ended 31 December 2008 Expressed in Thousands of United States Dollars (Note B)
Project Project Implementation/ Recipient Preparation Advisory Total
Afghanistan $ (1,122) $ (2,322) $ (3,444)Armenia 970 600 1,570 Azerbaijan 903 (149) 754 Bangladesh 335 3,791 4,126 Bhutan (6) 1,608 1,602 Cambodia 750 1,995 2,745 China, People’s Rep. of 7,576 9,390 16,966 Cook Islands 125 214 339 Fiji Islands 121 (96) 25 Georgia 600 – 600 India 3,475 9,616 13,091 Indonesia (161) 3,462 3,301 Kazakhstan 300 – 300 Kiribati (47) – (47)Kyrgyz Republic 1,250 (96) 1,154 Lao PDR 500 2,142 2,642 Malaysia – (3) (3)Maldives (57) – (57)Marshall Islands – (47) (47)Micronesia, Fed. States of – (44) (44)Mongolia 367 – 367 Nauru – 225 225 Nepal 180 5,365 5,545 Pakistan 2,121 1,487 3,608 Papua New Guinea (10) 225 215 Philippines – 1,903 1,903 Samoa – (81) (81)Solomon Islands – (161) (161)Sri Lanka 150 541 691 Tajikistan 121 (5) 116 Thailand 270 1,199 1,469 Timor-Leste – (30) (30)Tonga – (45) (45)Tuvalu – 800 800 Uzbekistan 182 903 1,085 Vanuatu – (24) (24)Viet Nam 3,440 1,875 5,315
Total $ 22,333 $ 44,238 66,571
Regional Activities 41,588
TOTAL $ 108,159
Notes: Figures may not add to total due to rounding. Negative amounts represent net undisbursed commitments written back to balances available for future commitments (Notes B and E).
The accompanying notes are an integral part of these financial statements (TASF-6).

TASF-6
31 December 2007 and 200631 December 2007 and 2006
97Annual Report 2008
ASIAN DEVELOPMENT BANK—TECHNICAL ASSISTANCE SPECIAL FUND
NOTES TO FINANCIAL STATEMENTS31 December 2008 and 2007
TECH
NIC
AL A
SSISTAN
CE SPEC
IAL FU
ND
NOTE A—NATURE OF OPERATIONS
The Technical Assistance Special Fund (TASF) was
established to provide technical assistance on a grant
basis to developing member countries (DMCs) of the
Asian Development Bank (ADB) and for regional techni-
cal assistance. TASF resources consist of direct voluntary
contributions by members, allocations from the net
income of Ordinary Capital Resources (OCR) and Asian
Development Fund (ADF) contributions, and revenue
from investments and other sources.
The eighth replenishment of the Asian Devel-
opment Fund (ADF IX) and the third regularized
replenishment of the Technical Assistance Special Fund
(TASF) became effective in April 2005. Under the
resolution, a specific portion of the contribution is to be
allocated to TASF.
In August 2008, the Board of Governors adopted
the resolution providing for the ninth replenishment of
the Asian Development Fund (ADF X) and the fourth
regularized replenishment of the TASF. In conjunction
with the ADF replenishment, the resolution provides
for a replenishment of the TASF to finance technical
operations under the fund. Total replenishment size is
SDR7,111,290,000, of which SDR2,641,290,000 will
come from new donor contributions. Donors agreed to
allocate 3% of the total replenishment size (equivalent
to 8% of total donor contributions) to TASF. The
ADF X replenishment shall be effective upon receipt
of the Instruments of Contribution for Unqualified
Contribution commitments in an aggregate amount
equivalent to at least SDR1,320,645,000, and such date
should not be later than 1 July 2009.
NOTE B— SUMMARY OF SIGNIFICANT ACCOUNTING POLICIES
Presentation of the Financial Statements
The financial statements of the TASF are presented on
the basis of those for not-for-profit organizations.
TASF reports donors’ contributions of cash and
other assets as unrestricted assets as these are made
available to TASF without conditions other than for the
purpose of pursuing its objectives.
Functional and Reporting Currency
The United States dollar is the functional and report-
ing currency, representing the currency of the primary
economic operating environment of TASF.
Translation of Currencies
ADB adopts the use of daily exchange rates for account-
ing and financial reporting purposes. This allows transac-
tions denominated in non-US dollar to be translated to
the reporting currency using exchange rates applicable
at the time of transactions. Contributions included in
the financial statements during the year are recognized
at applicable exchange rates as of the respective dates
of commitment. At the end of each accounting month,
translations of assets, liabilities, and uncommitted
balances which are denominated in non-US dollar are
adjusted using the applicable rates of exchange at the
end of the reporting period. These translation adjust-
ments are accounted for as exchange gains or losses and
are credited or charged to operations.
Investments
All investment securities held by TASF are reported at
estimated fair value, which represents their fair market
value. Realized and unrealized gains and losses are in-
cluded in revenue. Time deposits are reported at cost
which is a reasonable estimate of fair value.
Interest income on investment securities and time
deposits are recognized as realized and reported, net of
amortizations of premiums and discounts.
Securities Purchased Under Resale Arrangements
TASF accounts for transfer of financial assets in ac-
cordance with FAS 140, “Accounting for Transfers and
Servicing of Financial Assets and Extinguishments of
Liabilities – a replacement of FAS 125.” In general,
transfers are accounted for as sales under FAS 140 when
control over the transferred assets has been relinquished.
Otherwise, the transfers are accounted for as repurchase/
resale arrangements and collateralized financing arrange-
ments. Securities purchased under resale arrangement
are recorded as assets while securities received are not
recorded as liabilities and are not re-pledged.

ASIAN DEVELOPMENT BANK—TECHNICAL ASSISTANCE SPECIAL FUND
NOTES TO FINANCIAL STATEMENTS31 December 2008 and 2007
Asian Development Bank98TE
CH
NIC
AL
ASS
ISTA
NC
E SP
ECIA
L FU
ND
Contributions
The contributions from donors and the allocations from
OCR net income are included in the financial statements,
from the date of effectivity of the contribution agreement,
and the Board of Governors’ approval, respectively.
Technical Assistance to Member Countries and Undisbursed Commitments
Technical assistance is recognized in the financial state-
ments when the project is approved and becomes effec-
tive. Upon completion or cancellation of a TA project,
any undisbursed amount is written back as a reduction
in technical assistance for the year and the corresponding
undisbursed commitment is eliminated accordingly.
Accounting Estimates
The preparation of financial statements in conformity
with generally accepted accounting principles requires
Management to make reasonable estimates and assump-
tions that affect the reported amounts of assets and
liabilities and uncommitted balances as at the end of the
year and the reported amounts of revenue and expenses
during the year. The actual results could differ from
those estimates.
Statement of Cash Flows
For the purposes of the Statement of Cash Flows, the
TASF considers that its cash and cash equivalents are
limited to “DUE FROM BANKS.”
NOTE C—INVESTMENTS
The main investment management objective is to main-
tain security and liquidity. Subject to these parameters,
ADB seeks the highest possible return on its investments.
Investments are governed by the Investment Authority
approved by the Board of Directors in 1999, and reviewed
in 2006. The review endorsed a portfolio strategy that is
largely consistent with the 1999 approach.
Investment securities and negotiable certificate
of deposits held as of 31 December 2008 are considered
“Available for Sale” and are reported at fair value, which
represents their fair market value. Unrealized gains and
losses are included in revenue from investments.
The currency composition of the investment
portfolio as of 31 December 2008 and 2007 expressed in
United States dollars are as follows:
Currency 2008 2007
Australian dollar $ 25,642,000 $ 26,278,000Canadian dollar 42,759,000 155,810,000Euro 16,327,000 6,479,000United States dollar 199,591,000 92,493,000Others 11,224,000 14,018,000 Total $295,543,000 $295,078,000
The annualized rate of return on the average
investments held during the year, based on the portfolio
held at the beginning and end of each month was 3.60%
(4.90% – 2007).
NOTE D—RELATED PARTY TRANSACTIONS
The OCR and special fund resources are at all times used,
committed, and invested entirely separate from each other.
Under ADF IX and the third regularized replenishment
of TASF, a specific portion of the total contributions are
to be allocated to TASF. ADF receives all contributions
of members and subsequently transfers TASF’s portion
to TASF. Regional technical assistance projects and
programs may be combined activities between special and
trust funds. Interfund accounts are settled on a regular
basis between TASF and the other funds.
The interfund account balances included in other
assets and miscellaneous liabilities are as follows:
2008 2007Receivable from: OCR $ 12,000 $ – ADF – 1,419,000 JSF 21,000 2,000 RCIF 22,000 – Agency Trust Funds – Net 73,000 –
Total $ 128,000 $1,421,000 Payable to: OCR $ – $ 14,000 Agency Trust Funds – Net – 35,000
Total $ – $ 49,000

TASF-6
31 December 2007 and 200631 December 2007 and 2006
99Annual Report 2008
ASIAN DEVELOPMENT BANK—TECHNICAL ASSISTANCE SPECIAL FUND
NOTES TO FINANCIAL STATEMENTS31 December 2008 and 2007
TECH
NIC
AL A
SSISTAN
CE SPEC
IAL FU
ND
TASF-6
NOTE E—UNDISBURSED COMMITMENTS
Undisbursed commitments are denominated in United
States dollars and represent effective ongoing grant-
financed TA projects/programs which are not yet
disbursed as of the end of the year. During 2008, an
amount of $15,646,000 ($11,875,000 – 2007) represent-
ing completed and canceled TA projects was written
back as a reduction in technical assistance of the period
and the corresponding undisbursed commitment was
eliminated. The fair value of undisbursed commitments
approximates the amounts undisbursed, because ADB
expects that disbursements will be made for all projects/
programs covered by the commitments.
NOTE F— CONTRIBUTIONS AND UNCOMMITTED BALANCES
Since inception in 1967, direct contributions have been
made by 29 member countries. India and Pakistan made
direct and voluntary contribution in 2008 of Rs10,000,000
($250,000 equivalent) and $70,000 respectively.
In 1986, 1992 and 2005, the Board of Governors
of ADB, in authorizing replenishments of the ADF,
provided for allocations to the TASF in aggregate
amounts equivalent to $72,000,000, $141,000,000 and
$220,000,000, respectively, to be used for technical
assistance to ADF borrowing DMCs and for regional
technical assistance. The total amount received for ADF
IX replenishment for the years ended 31 December 2008
and 2007 amounted to $52,434,000 and $51,622,000
respectively, leaving a total of $17,304,000 as due from
contributors ($68,489,000 – 2007).
In 2008, $23,000,000 was allocated out of OCR net
income to TASF bringing the accumulated allocation out
of OCR net income to $706,000,000.
Some of the direct contributions received can be
subject to restricted procurement sources, while some
are given on condition that the technical assistance be
made on a reimbursable basis. The total contributions
received for the years ended 31 December 2008 and
2007 were without restrictions.
Uncommitted balances comprised of amounts which
have not been committed by ADB as at 31 December
2008 and 2007. These balances include approved TA
projects/programs that are not yet effective.
NOTE G—FAIR VALUE MEASUREMENTS
FAS 157 defines fair value as the price that would be
received to sell an asset or paid to transfer a liability at
measurement date (exit price) in an orderly transaction
among willing participants with an assumption that the
transaction takes place in the entity’s principal market,
the most advantageous market for the asset or liability.
The most advantageous market is the market where the
sale of the asset or transfer of liability would maximize the
amount received for the asset or minimize the amount
paid to transfer the liability. The fair value measurement
is not adjusted for transaction cost.
FAS 157 also establishes a fair value hierarchy
that gives the highest priority to quoted prices in
active markets for identical assets or liabilities (Level
1), next priority to observable market inputs or market
corroborated data (Level 2), and the lowest priority to
unobservable inputs without market corroborated data
(Level 3). FAS 157 requires the fair value measurement
to maximize the use of market observable inputs.
The following guidelines are applied in determining
the fair values of financial instruments:
Investments and securities purchased under resale arrangements
Readily marketable investments are fair valued using ac-
tive market quotes in Level 1 category. Level 2 category
includes investments and securities purchased under
resale arrangements which are fair valued with significant
other market observable inputs.
CONTINUED

ASIAN DEVELOPMENT BANK—TECHNICAL ASSISTANCE SPECIAL FUND
NOTES TO FINANCIAL STATEMENTS31 December 2008 and 2007
Asian Development Bank100TE
CH
NIC
AL
ASS
ISTA
NC
E SP
ECIA
L FU
ND
The fair value of the following financial assets of TASF as of 31 December 2008 were reported based on the
following:
See Notes C and E for discussions with respect
to investments and undisbursed commitments,
respectively. In all other cases, the carrying amounts of
TASF's assets, liabilities, and uncommitted balances are
considered to approximate fair values for all significant
financial instruments.
Fair Value Measurements Quoted Prices in Significant Significant Active Markets for Other Observable Unobservable Identical Assets Inputs Inputs 31 December 2008 (Level 1) (Level 2) (Level 3)
Assets Investments $295,543,000 $ – $295,543,000 $ – Securities purchased under resale arrangement 111,000 – 111,000 –
Total $295,654,000 $ – $295,654,000 $ –
TASF-6

101Annual Report 2008JA
PAN
SPECIA
L FUN
D
JAPAN SPECIAL FUND
Management's Report on Internal Control over Financial Reporting
The management of Asian Development Bank (“ADB”) is responsible for establishing and
maintaining adequate internal control over financial reporting. ADB's internal control over
financial reporting is a process designed to provide reasonable assurance regarding the reliabil-
ity of financial reporting and the preparation of financial statements for external purposes in
accordance with generally accepted accounting principles in the United States of America.
ADB's internal control over financial reporting includes those policies and procedures that
(i) pertain to the maintenance of records that, in reasonable detail, accurately and fairly re-
flect the transactions and dispositions of the assets of ADB; (ii) provide reasonable assurance
that transactions are recorded as necessary to permit preparation of financial statements in
accordance with generally accepted accounting principles, and that receipts and expenditures
of ADB are being made only in accordance with authorizations of management and directors
of ADB; and (iii) provide reasonable assurance regarding prevention or timely detection of
unauthorized acquisition, use or disposition of ADB's assets that could have a material effect
on the financial statements.
Because of its inherent limitations, internal control over financial reporting may not prevent
or detect misstatements. Also, projections of any evaluation of effectiveness to future periods
are subject to the risk that controls may become inadequate because of changes in conditions,
or that the degree of compliance with the policies or procedures may deteriorate.
ADB's management assessed the effectiveness of ADB's internal control over financial report-
ing as of 31 December 2008. In making this assessment, ADB's management used the criteria
set forth by the Committee of Sponsoring Organizations of the Treadway Commission in
Internal Control – Integrated Framework. Based on that assessment, management believes that as
of 31 December 2008, ADB's internal control over financial reporting is effective based upon
the criteria established in Internal Control – Integrated Framework.
Haruhiko Kuroda
President
Bindu N. Lohani
Vice President (Finance and Administration)
Hong-Sang Jung
Controller
5 March 2009

Asian Development Bank102JA
PAN
SPE
CIA
L FU
ND
PricewaterhouseCoopers LLPpwc.com/sg 8 Cross Street #17-00PWC BuildingSingapore 048424Telephone (65) 6236 3388Facsimile (65) 6236 3300
GST No.: M90362193L Reg. No.: T09LL0001D
Report of Independent Auditors to the Asian Development Bank
In our opinion, the accompanying statements of financial position and the related statements of ac-
tivities and changes in net assets and cash flows present fairly, in all material respects, the financial
position of the Asian Development Bank (“ADB” or “the Bank”)—Japan Special Fund at 31 December
2008 and 2007, and the results of its activities and changes in net assets and its cash flows for the
years then ended, in conformity with accounting principles generally accepted in the United States of
America. Also in our opinion, management’s assertion that ADB maintained effective internal control
over financial reporting as of 31 December 2008 is fairly stated, in all material respects, based on
criteria established in Internal Control - Integrated Framework issued by the Committee of Sponsor-
ing Organizations of the Treadway Commission (COSO). The management of ADB is responsible
for these financial statements, for maintaining effective internal control over financial reporting and
for its assertion of the effectiveness of internal control over financial reporting, included in the ac-
companying Management’s Report on Internal Control over Financial Reporting. Our responsibility
is to express opinions on these financial statements and on ADB’s internal control over financial
reporting based on our integrated audit in 2008 and financial statement audit in 2007. We conducted
our audits of the financial statements in accordance with auditing standards generally accepted in
the United States of America and our audit of internal control over financial reporting in accordance
with attestation standards established by the American Institute of Certified Public Accountants.
Those standards require that we plan and perform the audits to obtain reasonable assurance about
whether the financial statements are free of material misstatement and whether effective internal
control over financial reporting was maintained in all material respects. Our audits of the financial
statements included examining, on a test basis, evidence supporting the amounts and disclosures in
the financial statements, assessing the accounting principles used and significant estimates made
by management, and evaluating the overall financial statement presentation. Our audit of internal
control over financial reporting included obtaining an understanding of internal control over financial
reporting, assessing the risk that a material weakness exists, and testing and evaluating the design
and operating effectiveness of internal control based on the assessed risk. Our audits also included
performing such other procedures as we considered necessary in the circumstances. We believe that
our audits provide a reasonable basis for our opinions.
PricewaterhouseCoopers LLP (Registration No. T09LL0001D) is an accounting limited liability partnership registered in Singapore under the Limited Liability Partner-ships Act (Chapter 163A). It was converted from a partnership (with the name “PricewaterhouseCoopers” and Registration no. 000640) to an accounting limited liability partnership on 1 January 2009. PricewaterhouseCoopers LLP is part of the network of member firms of PricewaterhouseCoopers International Limited, each of which is a separate and independent legal entity.

103Annual Report 2008JA
PAN
SPECIA
L FUN
D
A company’s internal control over financial reporting is a process effected by those charged
with governance, management, and other personnel, designed to provide reasonable assur-
ance regarding the preparation of reliable financial statements in accordance with accounting
principles generally accepted in the United States of America. A company’s internal control
over financial reporting includes those policies and procedures that (i) pertain to the main-
tenance of records that, in reasonable detail, accurately and fairly reflect the transactions and
dispositions of the assets of the company; (ii) provide reasonable assurance that transactions
are recorded as necessary to permit preparation of financial statements in accordance with
generally accepted accounting principles, and that receipts and expenditures of the company
are being made only in accordance with authorizations of management and those charged with
governance; and (iii) provide reasonable assurance regarding prevention, or timely detection of
unauthorized acquisition, use, or disposition of the company’s assets that could have a material
effect on the financial statements.
Because of its inherent limitations, internal control over financial reporting may not prevent
or detect misstatements. Also, projections of any evaluation of effectiveness to future periods
are subject to the risk that controls may become inadequate because of changes in conditions,
or that the degree of compliance with the policies or procedures may deteriorate.
PricewaterhouseCoopers LLP
Public Accountants and Certified Public Accountants
Singapore
5 March 2009

Asian Development Bank104JA
PAN
SPE
CIA
L FU
ND
JSF-1 ASIAN DEVELOPMENT BANK—JAPAN SPECIAL FUND
STATEMENT OF FINANCIAL POSITION 31 December 2008 and 2007 Expressed in Thousands of United States Dollars (Note B)
2008 2007
JSF JSF Regular & Regular & ACCSF Supplementary Total ACCSF Supplementary Total
ASSETS
DUE FROM BANKS (Note B) $ 224 $ 489 $ 713 $ 564 $ 185 $ 749 INVESTMENTS (Notes A, B, C, and G) Time deposits 16,133 60,908 77,041 34,958 215,146 250,104 Corporate Obligations 20,009 137,943 157,952 – – –
36,142 198,851 234,993 34,958 215,146 250,104 ACCRUED REVENUE 85 378 463 44 247 291 OTHER ASSETS (Notes B and D)1 – 2,273 2,231 18 4,497 4,428
TOTAL1 $36,451 $201,991 $238,400 $35,584 $220,075 $255,572
LIABILITIES AND UNCOMMITTED BALANCES
ACCOUNTS PAYABLE AND OTHER LIABILITIES (Note D)1 $ 42 $ 236 $ 236 $ 87 $ 296 $ 296 UNDISBURSED COMMITMENTS (Notes B, E, and G) Technical assistance 223 95,825 96,048 793 82,925 83,718 TOTAL LIABILITIES1 265 96,061 96,284 880 83,221 84,014 NET ASSETS (JSF-2) (Note B), represented by: Uncommitted balances (Notes B and F) Unrestricted – 105,930 105,930 – 136,854 136,854 Temporarily restricted 28,009 – 28,009 27,545 – 27,545 28,009 105,930 133,939 27,545 136,854 164,399 Net accumulated investment income (Notes B and F) Temporarily restricted 8,177 – 8,177 7,159 – 7,159 36,186 105,930 142,116 34,704 136,854 171,558
TOTAL1 $36,451 $201,991 $238,400 $35,584 $220,075 $255,572
The accompanying notes are an integral part of these financial statements (JSF-4).
1 Totals may not add up due to elimination of interfund account of $42,000 ($87,000 - 2007).

105Annual Report 2008JA
PAN
SPECIA
L FUN
D
JSF-2
ASIAN DEVELOPMENT BANK—JAPAN SPECIAL FUND
STATEMENT OF ACTIVITIES AND CHANGES IN NET ASSETS For the Years Ended 31 December 2008 and 2007 Expressed in Thousands of United States Dollars (Note B)
2008 2007
JSF JSF Regular & Regular & ACCSF Supplementary Total ACCSF Supplementary Total
CHANGES IN UNRESTRICTED NET ASSETS
CONTRIBUTIONS (Notes B and F) $ – $ 17,373 $ 17,373 $ – $ 27,674 $ 27,674 REVENUE FROM INVESTMENTS (Notes B and C) – 6,459 6,459 – 11,807 11,807 REVENUE FROM OTHER SOURCES – 91 91 – 198 198 NET ASSETS REVERTED BACK TO TEMPORARILY RESTRICTED ASSETS (Notes B and F) (437) – (437) (26) – (26)
Total (437) 23,923 23,486 (26) 39,679 39,653 EXPENSES Technical assistance—net (Notes B, E, and F) (449) 53,812 53,363 (37) 32,521 32,484 Administrative expenses (Note F) 12 1,278 1,290 11 1,235 1,246 Financial expenses 0 0 0 – 0 0
Total (437) 55,090 54,653 (26) 33,756 33,730 CONTRIBUTIONS AND REVENUE (LESS THAN) IN EXCESS OF EXPENSES – (31,167) (31,167) – 5,923 5,923
EXCHANGE GAINS (LOSSES) (Note B) – 243 243 – (12) (12) (DECREASE) INCREASE IN UNRESTRICTED NET ASSETS – (30,924) (30,924) – 5,911 5,911
CHANGES IN TEMPORARILY RESTRICTED NET ASSETS
REVENUE FROM INVESTMENTS AND OTHER SOURCES (Notes B and C) 1,045 – 1,045 1,829 – 1,829
NET ASSETS REVERTED BACK TO TEMPORARILY RESTRICTED ASSETS (Notes B and F) 437 – 437 26 – 26
INCREASE IN TEMPORARILY RESTRICTED NET ASSETS 1,482 – 1,482 1,855 – 1,855
INCREASE (DECREASE) IN NET ASSETS 1,482 (30,924) (29,442) 1,855 5,911 7,766
NET ASSETS AT BEGINNING OF YEAR 34,704 136,854 171,558 32,849 130,943 163,792
NET ASSETS AT END OF YEAR $36,186 $105,930 $142,116 $34,704 $136,854 $171,558
0 – Less than $500.
The accompanying notes are an integral part of these financial statements (JSF-4).

Asian Development Bank106JA
PAN
SPE
CIA
L FU
ND
JSF-3
ASIAN DEVELOPMENT BANK—JAPAN SPECIAL FUND
STATEMENT OF CASH FLOWS For the Years Ended 31 December 2008 and 2007Expressed in Thousands of United States Dollars (Note B)
2008 2007
JSF JSF Regular & Regular & ACCSF Supplementary Total ACCSF Supplementary Total
CASH FLOWS FROM OPERATING ACTIVITIES Contributions received $ – $ 17,373 $ 17,373 $ – $ 27,674 $ 27,674 Interest on investments received 952 5,559 6,511 1,750 12,727 14,477 Technical assistance disbursed (148) (38,669) (38,817) (380) (35,178) (35,558) Administrative expenses paid (12) (1,337) (1,349) (11) (1,172) (1,183) Financial expenses paid (0) (0) (0) – (0) (0) Cash received from other sources 15 89 104 90 254 344
Net Cash Provided by (Used in) Operating Activities 807 (16,985) (16,178) 1,449 4,305 5,754
CASH FLOWS FROM INVESTING ACTIVITIES Maturities of investments 1,075,733 5,521,344 6,597,077 630,096 3,221,747 3,851,843 Purchases of investments (1,076,880) (5,504,281) (6,581,161) (632,846) (3,228,829) (3,861,675) Net receipts from (payments for) securities purchased under resale arrangement – 264 264 – (78) (78)
Net Cash (Used in) Provided by Investing Activities (1,147) 17,327 16,180 (2,750) (7,160) (9,910)
Effect of Exchange Rate Changes on Due from Banks – (38) (38) – 5 5
Net (Decrease) Increase in Due from Banks (340) 304 (36) (1,301) (2,850) (4,151)
Due from Banks at Beginning of Year 564 185 749 1,865 3,035 4,900
Due from Banks at End of Year $ 224 $ 489 $ 713 $ 564 $ 185 $ 749
RECONCILIATION OF INCREASE (DECREASE) IN NET ASSETS TO NET CASH PROVIDED BY (USED IN) OPERATING ACTIVITIES: Increase (decrease) in net assets (JSF-2) $ 1,482 $ (30,924) $ (29,442) $ 1,855 $ 5,911 $ 7,766 Adjustments to reconcile increase (decrease) in net assets to net cash provided by (used in) operating activities: Amortization of discounts on investments (4) (613) (617) – – – Unrealized investment gains (33) (156) (189) – – – Change in undisbursed commitments (571) 12,901 12,330 (466) (2,592) (3,058) Translation adjustment – (244) (244) – 67 67 Others-net (67) 2,051 1,984 60 919 979
Net Cash Provided by (Used in) Operating Activities $ 807 $ (16,985) $ (16,178) $ 1,449 $ 4,305 $ 5,754
0 – Less than $500.
The accompanying notes are an integral part of these financial statements (JSF-4).

JSF-4
ASIAN DEVELOPMENT BANK—JAPAN SPECIAL FUND
NOTES TO FINANCIAL STATEMENTS31 December 2008 and 2007
107Annual Report 2008JA
PAN
SPECIA
L FUN
D
NOTE A—NATURE OF OPERATIONS
The Japan Special Fund (JSF) was established in
March 1988 when Government of Japan and the Asian
Development Bank (ADB) entered into a financial ar-
rangement whereby Government of Japan agreed to make
an initial contribution and ADB became the administra-
tor. The purpose of JSF is to help developing member
countries (DMCs) of ADB restructure their economies
and broaden the scope of opportunities for new invest-
ments, thereby assisting the recycling of funds to DMCs
of ADB. While JSF resources are used mainly to finance
technical assistance (TA) operations, these resources
may also be used for equity investment operations in
ADB’s DMCs. Under the agreement between ADB and
Japan, ADB may invest the proceeds of JSF pending
disbursement.
In March 1999, the Board approved the acceptance
and administration by ADB of the Asian Currency Crisis
Support Facility (ACCSF) to assist Asian currency
crisis-affected member countries (CAMCs). Funded by
Government of Japan, ACCSF was established within
JSF to assist in the economic recovery of CAMCs through
interest payment assistance (IPA) grants, TA grants, and
guarantees. With the general fulfillment of the purpose
of the facility, Government of Japan and ADB agreed to
terminate the ACCSF on 22 March 2002. The ACCSF
account is to be kept open until the completion of all TA
disbursements and the settlement of all administrative
expenses.
NOTE B— SUMMARY OF SIGNIFICANT ACCOUNTING POLICIES
Presentation of the Financial Statements
The financial statements of JSF are presented on the
basis of those for not-for-profit organizations and as
unrestricted and temporarily restricted net assets.
ACCSF funds are separately reported in the financial
statements.
JSF reports the contributions of cash and other
assets as restricted support if they are received with
donor stipulations that limit the use of the donated
assets. When the donor restriction expires, that is, when
a stipulated time or purpose restriction is accomplished,
temporarily restricted net assets are reclassified to
unrestricted net assets and reported in the Statement of
Activities and Changes in Net Assets as “NET ASSETS
RELEASED FROM RESTRICTIONS.”
Functional and Reporting Currency
The United States dollar is the functional and report-
ing currency, representing the currency of the primary
economic operating environment of JSF.
Translation of Currencies
ADB adopts the use of daily exchange rates for account-
ing and financial reporting purposes. This allows transac-
tions denominated in non-US dollar to be translated to
the reporting currency using exchange rates applicable
at the time of transactions. Contributions included in
the financial statements during the year are recognized
at applicable exchange rates as of the respective dates
of commitment. At the end of each accounting month,
translations of assets, liabilities, and uncommitted
balances which are denominated in non-US dollar are
adjusted using the applicable rates of exchange at the
end of the reporting period. These translation adjust-
ments are accounted for as exchange gains or losses and
are credited or charged to operations.
Investments
All investment securities held by JSF are reported at
estimated fair value, which represents their fair market
value. Realized and unrealized gains and losses are in-
cluded in revenue. Time deposits are reported at cost
which is a reasonable estimate of fair value.
Interest income on investment securities and time
deposits are recognized as realized and reported, net of
amortizations of premiums and discounts.
Securities Purchased Under Resale Arrangements
JSF accounts for transfer of financial assets in accordance
with FAS 140, “Accounting for Transfers and Servicing
of Financial Assets and Extinguishments of Liabilities
– a replacement of FAS 125.” In general, transfers are
accounted for as sales under FAS 140 when control over
the transferred assets has been relinquished. Otherwise,
the transfers are accounted for as repurchase/resale ar-
rangements and collateralized financing arrangements.
Securities purchased under resale arrangement are

ASIAN DEVELOPMENT BANK—JAPAN SPECIAL FUND
NOTES TO FINANCIAL STATEMENTS31 December 2008 and 2007
Asian Development Bank108JA
PAN
SPE
CIA
L FU
ND
recorded as assets while securities received are not
recorded as liabilities and are not re-pledged.
There were no outstanding securities purchased
under resale arrangements as of 31 December 2008 and
2007.
Contributions
Contributions by Japan are included in the financial state-
ments from the date indicated by Japan that funds are
expected to be made available. Contributions which are
restricted by the donor for specific TA projects/programs
or for IPA grants are classified as temporarily restricted
contributions. Those without any stipulation as to spe-
cific use are accounted for and reported as unrestricted
contributions.
Technical Assistance and Undisbursed Commitments
Technical assistance is recognized in the financial state-
ments when the project is approved and becomes effec-
tive. Upon completion of a TA project or cancellation
of a grant, any undisbursed amount is written back as a
reduction in the TA for the year and the corresponding
undisbursed commitment is eliminated accordingly.
Advances are provided from technical assistance
grant funds to the executing agency or co-operating
institution, for the purpose of making payments
for eligible expenses. The advances shall be subject
to liquidation and charged against undisbursed
commitment, any unutilized portion shall be refunded
to the fund. These are included in other assets.
Accounting Estimates
The preparation of financial statements in conformity
with generally accepted accounting principles requires
Management to make reasonable estimates and as-
sumptions that affect the reported amounts of assets
and liabilities as at the end of the year and the reported
amounts of income and expenses during the year. The
actual results could differ from those estimates.
Statement of Cash Flows
For the purposes of the Statement of Cash Flows, the JSF
considers that its cash and cash equivalents are limited to
“DUE FROM BANKS.”
NOTE C—INVESTMENTS
The main investment management objective is to main-
tain security and liquidity. Subject to these parameters,
ADB seeks the highest possible return on its investments.
Investments are governed by the Investment Authority
approved by the Board of Directors in 1999, and reviewed
in 2006. The review endorsed a portfolio strategy that is
largely consistent with the 1999 approach.
Investment securities and negotiable certificate
of deposits held as of 31 December 2008 are considered
“Available for Sale” and are reported at fair value, which
represents their fair market value. Unrealized gains and
losses are included in revenue from investments.
The annualized rates of return on the average
investments held under ACCSF and JSF funds during
the year, based on the portfolio held at the beginning and
end of each month were 2.90% and 2.94%, respectively
(5.24% and 5.26%, respectively - 2007).
NOTE D—RELATED PARTY TRANSACTIONS
The Ordinary Capital Resources (OCR) and special fund
resources are at all times used, committed, and invested
entirely separate from each other. The administrative
and operational expenses pertaining to OCR and special
fund resources are charged to the respective funds. The
administrative expenses of JSF are settled on a regular ba-
sis between OCR and JSF. Regional technical assistance
projects and programs may be combined activities between
special and trust funds. Interfund accounts are settled on
a regular basis between JSF and the other funds.
The interfund balances between other funds,
which are included in other assets and liabilities are as
follows:
2008 2007Amounts Receivable by:
JSF from: ACCSF $ 42,000 $ 87,000 Agency Trust Funds 19,000 –
Total $ 61,000 $ 87,000
Amounts Payable by:
JSF to: OCR $145,000 $159,000 TASF 21,000 2,000 Agency Trust Funds – 24,000
Total $166,000 $185,000
ACCSF to: JSF $ 42,000 $ 87,000

JSF-4
ASIAN DEVELOPMENT BANK—JAPAN SPECIAL FUND
NOTES TO FINANCIAL STATEMENTS31 December 2008 and 2007
109Annual Report 2008JA
PAN
SPECIA
L FUN
D
NOTE E—UNDISBURSED COMMITMENTS
Undisbursed commitments are denominated in United
States dollars and represent effective TA projects/pro-
grams not yet disbursed. Completed but partially can-
celled TA projects amounting to $6,883,000 was written
back as a reduction in technical assistance during 2008
($4,749,000 – 2007), and the corresponding undisbursed
commitments was eliminated. Out of this amount,
$449,000 ($37,000 – 2007) corresponds to ACCSF. The
fair value of undisbursed commitments approximates
the amounts outstanding, because ADB expects that
disbursements will substantially be made for all the
projects/programs covered by the commitments.
NOTE F—CONTRIBUTIONS AND UNCOMMITTED BALANCES
All contributions for the years ended 31 December 2008
and 2007 were received during the respective years.
Effective 31 December 2002, all remaining
temporarily restricted net assets under JSF were
transferred and integrated into the unrestricted regular
net assets, as concurred by Japan, in order to optimize
the use of JSF. Similarly, Japan lifted the restriction
over the use of net accumulated investment income,
which under the original terms of agreement between
ADB and Japan, may only be used for defraying JSF’s
administrative expenses. Japan agreed to use the net
accumulated investment income as additional resources
for funding future ADB operations.
Uncommitted balances comprised of amounts
which have not been committed by ADB as at
31 December 2008 and 2007. These balances include
approved TA projects/programs that are not yet
effective.
As of 31 December 2008 and 2007 these balances
are as follows:
2008 2007
JSF JSF Regular and Regular and ACCSF Supplementary Total ACCSF Supplementary Total Uncommitted balances $28,009,000 $105,930,000 $133,939,000 $27,545,000 $136,854,000 $164,399,000
TA projects/programs approved by Japan and ADB but not yet effective – (14,840,000) (14,840,000) – (20,135,000) (20,135,000)
TA projects/programs approved by Japan and not yet effective – (4,300,000) (4,300,000) – (12,925,000) (12,925,000)
Uncommitted balances available for new commitments $28,009,000 $86,790,000 $114,799,000 $27,545,000 $103,794,000 $131,339,000
The temporarily restricted uncommitted balance
remaining available as of 31 December 2008 corresponds
to funds under ACCSF of $28,009,000 ($27,545,000
- 2007) to cover completion of TA disbursements and
the amount of net accumulated investment income of
$8,177,000 ($7,159,000 – 2007) for settlement of all
administrative expenses.
Net assets reverted back to temporarily restricted
assets under ACCSF relate to savings on financially
completed technical assistance net of amount from
accumulated investment income, released from
restrictions to defray the administrative expenses of
ACCSF.
CONTINUED

ASIAN DEVELOPMENT BANK—JAPAN SPECIAL FUND
NOTES TO FINANCIAL STATEMENTS31 December 2008 and 2007
Asian Development Bank110JA
PAN
SPE
CIA
L FU
ND
Fair Value Measurements Quoted Prices in Significant Significant Active Markets for Other Observable Unobservable Identical Assets Inputs Inputs 31 December 2008 (Level 1) (Level 2) (Level 3)
Assets Investments $234,993,000 $12,185,000 $222,808,000 $ –
NOTE G—FAIR VALUE MEASUREMENTS
FAS 157 defines fair value as the price that would be
received to sell an asset or paid to transfer a liability at
measurement date (exit price) in an orderly transaction
among willing participants with an assumption that the
transaction takes place in the entity’s principal market,
the most advantageous market for the asset or liability.
The most advantageous market is the market where the
sale of the asset or transfer of liability would maximize the
amount received for the asset or minimize the amount
paid to transfer the liability. The fair value measurement
is not adjusted for transaction cost.
FAS 157 also establishes a fair value hierarchy
that gives the highest priority to quoted prices in
active markets for identical assets or liabilities (Level
1), next priority to observable market inputs or market
corroborated data (Level 2), and the lowest priority to
unobservable inputs without market corroborated data
(Level 3). FAS 157 requires the fair value measurement
to maximize the use of market observable inputs.
The following guidelines are applied in determining
the fair values of financial instruments:
Investments and securities purchased under resale arrangements
Readily marketable investments are fair valued using ac-
tive market quotes in Level 1 category. Level 2 category
includes investments and securities purchased under
resale arrangements which are fair valued with significant
other market observable inputs.
The fair value of the following financial assets of
JSF as of 31 December 2008 were reported based on the
following:
See Notes C and E for discussions relating to
investments and undisbursed commitments. In all other
cases, the carrying amounts of JSF’s assets, liabilities, and
uncommitted balances are considered to approximate
fair values for all significant financial instruments.
JSF-4

111Annual Report 2008A
SIAN
DEVELO
PMEN
T BAN
K INSTITU
TE SPECIA
L FUN
D
Report of Independent Auditors to the Asian Development Bank
In our opinion, the accompanying statement of financial position and the related statements of ac-
tivities and changes in net assets, and cash flows present fairly, in all material respects, the financial
position of the Asian Development Bank (“ADB” or “the Bank”)—Asian Development Bank Institute
Special Fund at 31 December 2008 and 2007, and the results of its operations and its cash flows for
the years then ended, in conformity with accounting principles generally accepted in the United
States of America. These financial statements are the responsibility of the management of the Asian
Development Bank Institute. Our responsibility is to express an opinion on these financial state-
ments based on our audits. We conducted our audits of these statements in accordance with auditing
standards generally accepted in the United States of America. Those standards require that we plan
and perform the audit to obtain reasonable assurance about whether the financial statements are
free of material misstatement. An audit includes examining, on a test basis, evidence supporting the
amounts and disclosures in the financial statements, assessing the accounting principles used and
significant estimates made by management, and evaluating the overall financial statement presenta-
tion. We believe that our audits provide a reasonable basis for our opinion.
PricewaterhouseCoopers LLP
Public Accountants and Certified Public Accountants
Singapore
5 March 2009
PricewaterhouseCoopers LLPpwc.com/sg 8 Cross Street #17-00PWC BuildingSingapore 048424Telephone (65) 6236 3388Facsimile (65) 6236 3300
GST No.: M90362193L Reg. No.: T09LL0001D
PricewaterhouseCoopers LLP (Registration No. T09LL0001D) is an accounting limited liability partnership registered in Singapore under the Limited Liability Partner-ships Act (Chapter 163A). It was converted from a partnership (with the name “PricewaterhouseCoopers” and Registration no. 000640) to an accounting limited liability partnership on 1 January 2009. PricewaterhouseCoopers LLP is part of the network of member firms of PricewaterhouseCoopers International Limited, each of which is a separate and independent legal entity.

Asian Development Bank112A
SIA
N D
EVEL
OPM
ENT
BAN
K IN
STIT
UTE
SPE
CIA
L FU
ND
ADBISF-1
ASIAN DEVELOPMENT BANK—ASIAN DEVELOPMENT BANK INSTITUTE SPECIAL FUND
STATEMENT OF FINANCIAL POSITION 31 December 2008 and 2007Expressed in Thousands of United States Dollars (Note B)
2008 2007
ASSETS
DUE FROM BANKS (Note B) $ 304 $ 603
INVESTMENTS (Notes B, C, and D) Time deposits – 6,749
SECURITIES PURCHASED UNDER RESALE ARRANGEMENT (Notes B, C, and D) 10,405 1,157
PROPERTY, FURNITURE, AND EQUIPMENT (Notes B and E) One-time Establishment Cost and Furnitures $3,398 $2,733 Less–allowance for depreciation 3,398 – 2,733 –
Leased Property 243 196 Less–allowance for depreciation 146 97 78 118
DUE FROM CONTRIBUTORS (Note F) 7,759 11,716
OTHER ASSETS 2,512 2,024
TOTAL $21,077 $22,367
LIABILITIES AND UNCOMMITTED BALANCES
ACCOUNTS PAYABLE AND OTHER LIABILITIES (Notes B, E, and H) $ 5,354 $ 4,075
UNCOMMITTED BALANCES (ADBISF-2) Unrestricted net assets 15,723 18,292
TOTAL $21,077 $22,367
The accompanying notes are an integral part of these financial statements (ADBISF-4)

113Annual Report 2008A
SIAN
DEVELO
PMEN
T BAN
K INSTITU
TE SPECIA
L FUN
D
ADBISF-2
ASIAN DEVELOPMENT BANK—ASIAN DEVELOPMENT BANK INSTITUTE SPECIAL FUND
STATEMENT OF ACTIVITIES AND CHANGES IN NET ASSETS For the Years Ended 31 December 2008 and 2007Expressed in Thousands of United States Dollars (Note B)
2008 2007
CHANGES IN UNRESTRICTED NET ASSETS
CONTRIBUTIONS (Notes B and F) $ 7,759 $ 11,716 REVENUE Income from investments (Notes B and C) 85 71 Income from other sources (Note G) 256 7
Total 8,100 11,794 EXPENSES Administrative expenses 9,743 8,782 Program expenses 3,814 2,388
Total 13,557 11,170 CONTRIBUTIONS AND REVENUE (LESS THAN) IN EXCESS OF EXPENSES (5,457) 624 EXCHANGE LOSSES—NET (159) (93) TRANSLATION ADJUSTMENTS (Note B) 3,337 730 EFFECT OF FASB STATEMENT NO. 158 (Note I) (290) (377) (DECREASE) INCREASE IN UNRESTRICTED NET ASSETS (2,569) 884 NET ASSETS AT BEGINNING OF YEAR 18,292 17,408
NET ASSETS AT END OF YEAR $ 15,723 $ 18,292
The accompanying notes are an integral part of these financial statements (ADBISF-4).

Asian Development Bank114A
SIA
N D
EVEL
OPM
ENT
BAN
K IN
STIT
UTE
SPE
CIA
L FU
ND
ADBISF-3
ASIAN DEVELOPMENT BANK—ASIAN DEVELOPMENT BANK INSTITUTE SPECIAL FUND
STATEMENT OF CASH FLOWS For the Years Ended 31 December 2008 and 2007 Expressed in Thousands of United States Dollars (Note B)
2008 2007
CASH FLOWS FROM OPERATING ACTIVITIES Contributions received $ 12,163 $ 11,144 Interest on investments received 87 70 Expenses paid (13,009) (10,839) Others—net 97 (86) Net Cash (Used in) Provided by Operating Activities (662) 289 CASH FLOWS FROM INVESTING ACTIVITIES Maturities of investments 220,580 155,105 Purchases of investments (212,945) (156,267) Net (payments for) receipts from securities under resale arrangement (7,406) 511 Net Cash Provided by (Used in) Investing Activities 229 (651) Effect of Exchange Rate Changes on Due from Banks 134 269 Net Decrease in Due from Banks (299) (93) Due from Banks at Beginning of Year 603 696 Due from Banks at End of Year $ 304 $ 603 RECONCILIATION OF (DECREASE) INCREASE IN UNRESTRICTED NET ASSETS TO NET CASH (USED IN) PROVIDED BY OPERATING ACTIVITIES: (Decrease) Increase in unrestricted net assets (ADBISF-2) $ (2,569) $ 884 Adjustments to reconcile (decrease) increase in unrestricted net assets to net cash (used in) provided by operating activities: Depreciation 48 177 Change in due from contributors 4,404 (572) Change in other assets (488) (233) Change in accounts payable and other liabilities 1,279 808 Translation adjustments (3,337) (730) Others—net 1 (45) Net Cash (Used in) Provided by Operating Activities $ (662) $ 289
The accompanying notes are an integral part of these financial statements (ADBISF-4).
ADBISF-4
ASIAN DEVELOPMENT BANK—ASIAN DEVELOPMENT BANK INSTITUTE SPECIAL FUND
NOTES TO FINANCIAL STATEMENTS31 December 2008 and 2007
115Annual Report 2008A
SIAN
DEVELO
PMEN
T BAN
K INSTITU
TE SPECIA
L FUN
D
NOTE A—NATURE OF OPERATIONS
In 1996, the Asian Development Bank (ADB) approved
the establishment of the Asian Development Bank
Institute (the Institute) in Tokyo, Japan as a subsidiary
body of ADB. The Institute commenced its operations
upon the receipt of the first funds from Japan on 24 March
1997, and it was inaugurated on 10 December 1997. The
Institute’s funds may consist of voluntary contributions,
donations, and grants from ADB member countries,
non-government organizations, and foundations. The
objectives of the Institute, as defined under its Statute,
are the identification of effective development strate-
gies and capacity improvement for sound development
management in developing member countries.
NOTE B— SUMMARY OF SIGNIFICANT ACCOUNTING POLICIES
Presentation of the Financial Statements
The financial statements of the Institute are presented
on the basis of those for not-for-profit organizations.
The Institute reports donor’s contributed cash
and other assets as unrestricted support as these are
made available to the Institute without conditions other
than for the purposes of pursuing the objectives of the
Institute.
Functional Currency and Reporting Currency
The functional currency of the Institute is the Japanese
yen. The reporting currency is the United States dollar.
Translation of Currencies
Assets, liabilities, and uncommitted balances are trans-
lated from the functional currency to the reporting
currency at the applicable rates of exchange at the end
of a reporting period. Commitments included in the
financial statements during the year are recognized at
the applicable exchange rates as of the respective dates
of commitment. Revenue and expense amounts in cur-
rency other than the United States dollar are translated
for each semi-monthly period generally at the applicable
rates of exchange at the beginning of each period; such
practice approximates the application of average rates in
effect during the period. Translation adjustments are ac-
counted for as exchange gains or losses and are credited
or charged to operations.
Investments
All investment securities held by the Institute are re-
ported at estimated fair value which represents their fair
market value. Realized and unrealized gains and losses
are included in revenue. Time deposits are reported at
cost which is a reasonable estimate of fair value.
Securities Purchased Under Resale Arrangements
ADBI accounts for transfer of financial assets in accordance
with FAS 140, “Accounting for Transfers and Servicing
of Financial Assets and Extinguishments of Liabilities
– a replacement of FAS 125.” In general, transfers are
accounted for as sales under FAS 140 when control over
the transferred assets has been relinquished. Otherwise,
the transfers are accounted for as repurchase/resale ar-
rangements and collateralized financing arrangements.
Securities purchased under resale arrangement are
recorded as assets and reported at estimated fair value,
while securities received are not recorded as liabilities
and are not re-pledged.
Property, Furniture, and Equipment
Property, furniture, and equipment are stated at cost and
depreciated over their estimated useful lives using the
straight-line method. Maintenance, repairs and minor
betterments are charged to expense.
The Institute distinguishes between capital
leases and operating leases based on the objective of
the expenditure. Expenditures amounting to more
than $30,000 for a single asset or a combination of
assets forming an integral part of a separate asset are
capitalized.
Contributions
Contributions from donors are included in the financial
statements from the date committed.
Accounting Estimates
The preparation of the financial statements in conformity
with generally accepted accounting principles requires

ASIAN DEVELOPMENT BANK—ASIAN DEVELOPMENT BANK INSTITUTE SPECIAL FUND
NOTES TO FINANCIAL STATEMENTS31 December 2008 and 2007
Asian Development Bank116A
SIA
N D
EVEL
OPM
ENT
BAN
K IN
STIT
UTE
SPE
CIA
L FU
ND
Management to make estimates and assumptions that
affect the reported amounts of assets and liabilities as at
the end of the year and the reported amounts of revenue
and expenses during the year. Actual results could differ
from those estimates.
Accounting and Reporting Developments
In December 2008, the FASB issued FASB Staff Position
(FSP) FAS 132(R)-1, which amends 132(R) to require
more detailed disclosures about employers' plan assets,
including employers' investment strategies, major cat-
egories of plan assets, concentration of risk within plan
assets, and valuation techniques used to measure the fair
value of plan assets. This aims to address financial state-
ment users' concerns “about the lack of transparency
surrounding the types of assets and associated risks in an
employer's defined benefit pension or other postretire-
ment plan and events in the economy and markets that
could have a significant effect on the value of the plan
assets.” An entity must provide the FSP's disclosures
in financial statements for fiscal years ending after 15
December 2009.
Statement of Cash Flows
For the purposes of the Statement of Cash Flows, the
Institute considers that its cash and cash equivalents are
limited to “DUE FROM BANKS.”
Reclassification
Certain non-material reclassifications of prior year’s
amounts and information have been made to conform to
the current year’s presentation.
NOTE C—INVESTMENTS
The main investment management objective is to
maintain security and liquidity. Subject to these param-
eters, ADB administers the Institute’s investments and
seeks the highest possible return on its investments.
Investments are governed by the Investment Authority
approved by the Board of Directors in 1999, and reviewed
in 2006. The review endorsed a portfolio approach that is
largely consistent with the 1999 approach.
The investment portfolio was composed wholly
of investments denominated in Japanese yen as of 31
December 2007. All such investments were due within
one year. The total investment income reported as of
31 December 2008 consisted of interest income earned
during the year.
The annualized rate of return on the average
investments held during the year including receivable
for securities purchased under resale arrangement, based
on the portfolio held at the beginning and end of each
month was 0.58% (0.58% - 2007).
NOTE D—FAIR VALUE MEASUREMENTS
FAS 157 defines fair value as the price that would be
received to sell an asset or paid to transfer a liability at
measurement date (exit price) in an orderly transaction
among willing participants with an assumption that the
transaction takes place in the entity’s principal market,
the most advantageous market for the asset or liability.
The most advantageous market is the market where the
sale of the asset or transfer of liability would maximize the
amount received for the asset or minimize the amount
paid to transfer the liability. The fair value measurement
is not adjusted for transaction cost.
FAS 157 also establishes a fair value hierarchy
that gives the highest priority to quoted prices in
active markets for identical assets or liabilities (Level
1), next priority to observable market inputs or market
corroborated data (Level 2), and the lowest priority to
unobservable inputs without market corroborated data
(Level 3). FAS 157 requires the fair value measurement
to maximize the use of market observable inputs.
The following guidelines are applied in determining
the fair values of financial instruments:
Investments and securities purchased under resale arrangements
Readily marketable investments are fair valued using ac-
tive market quotes in Level 1 category. Level 2 category
includes investments and securities purchased under
resale arrangements which are fair valued with significant
other market observable inputs.
The fair value of the following financial assets of
ADBISF as of 31 December 2008 were reported based
on the following:

ADBISF-4
ASIAN DEVELOPMENT BANK—ASIAN DEVELOPMENT BANK INSTITUTE SPECIAL FUND
NOTES TO FINANCIAL STATEMENTS31 December 2008 and 2007
117Annual Report 2008A
SIAN
DEVELO
PMEN
T BAN
K INSTITU
TE SPECIA
L FUN
D
See Note B for discussions relating to investments
and securities purchased under resale arrangements. In
all other cases, the carrying amounts of ADBISF's assets,
liabilities, and uncommitted balances are considered
to approximate fair values for all significant financial
instruments.
NOTE E—LEASED ASSETS
On 6 January 2006, the Institute concluded an agreement
regarding the lease of a server, which requires ADBI to
pay a total amount of $205,000 over the period of 60
months for the lease of the server.
The following is a schedule by years of future
minimum lease payments under capital lease together
with present value of the net minimum lease payment as
of 31 December 2008:
Year ending 31 December 2009 $ 53,000 2010 53,000
Total minimum lease payment 106,000 Less: Amount representing interest 3,000
Present value of net minimum lease payments $103,000
NOTE F—CONTRIBUTIONS
In 2008, the Government of Japan committed its 13th
contribution to ADBI amounting to ¥700,900,000
($7,759,000 equivalent), which was transferred to the
Fund on 15 January 2009. The amount contributed was
reported in 31 December 2008 balance sheet as “Due
from Contributors.”
NOTE G—INCOME FROM OTHER SOURCES
Income from other sources in 2008 primarily consists
of sublease rental income of $171,000, received accord-
ing to a space sharing agreement with the Japanese
Representative Office of ADB. The transactions with
ADB were made in the ordinary course of business and
were negotiated at arm's length.
NOTE H—DUE TO ADB
Accounts payable and other liabilities include amounts
due to ADB of $847,000 and $341,000 at 31 December
2008 and 2007, respectively. The payable results from
transactions in the normal course of business.
NOTE I—STAFF RETIREMENT PLAN AND POSTRETIREMENT MEDICAL BENEFITS
Staff Retirement Plan
The Institute participates in the contributory defined
benefit Staff Retirement Plan (the Plan) of ADB. Every
employee, as defined under the Plan, shall, as a condi-
tion of service, become a participant from the first day of
service, provided that at such a date, the employee has
not reached the normal retirement age of 60. Retirement
benefits are based on length of service and highest aver-
age remuneration during two years of eligible service. The
Plan assets are segregated and are not included in the
accompanying Balance Sheet. The costs of administering
the Plan are absorbed by ADB, except for fees paid to
the investment managers and related charges, including
custodian fees, which are borne by the Plan.
Participants hired on or before 30 September 2006
are required to contribute 9 1/3% of their salary to the
Plan while those hired after that date do not anymore
Fair Value Measurements Quoted Prices in Significant Significant Active Markets for Other Observable Unobservable Identical Assets Inputs Inputs 31 December 2008 (Level 1) (Level 2) (Level 3)
Assets Securities purchased under resale arrangement $10,405,000 $ – $10,405,000 $ –
CONTINUED

ASIAN DEVELOPMENT BANK—ASIAN DEVELOPMENT BANK INSTITUTE SPECIAL FUND
NOTES TO FINANCIAL STATEMENTS31 December 2008 and 2007
Asian Development Bank118A
SIA
N D
EVEL
OPM
ENT
BAN
K IN
STIT
UTE
SPE
CIA
L FU
ND
contribute to the plan. Participants may also make
additional voluntary contributions. ADBI's contribution
is determined at a rate sufficient to cover that part of
the costs of the Plan not covered by the participants'
contributions.
Expected Contributions
The expected amount of contributions to the Plan for
2009, based on the Institute’s contribution rate for the
coming year of 19%, and the participants’ mandatory con-
tribution are $221,000 and $62,000, respectively (2007
- $158,000 and $58,000).
Investment Strategy
Contributions in excess of current benefits payments
are invested in international financial markets and in a
variety of investment vehicles. The Plan employs nine
external asset managers and one global custodian who
function within the guidelines established by the Plan’s
Investment Committee. The investment of these assets,
over the long term, is expected to produce higher returns
than short-term investments. The investment policy
incorporates the Plan’s package of desired investment re-
turn, and tolerance for risk, taking into account the nature
and duration of the Plan’s liabilities. The Plan’s assets are
diversified among different markets and different asset
classes. The use of derivatives for speculation, leverage or
taking risks is prohibited. Selected derivatives are used
for hedging and transactional efficiency purposes.
The Plan’s investment policy is periodically
reviewed and revised to reflect the best interest of the
Plan’s participants and beneficiaries. The current policy,
adopted in January 2003, specifies an asset-mix structure
of 70% of assets in equities and 30% in fixed income
securities.
At present, investments of the Plan’s assets are
divided into three categories: US equity, Non-US equity,
and US fixed income.
As of 31 December 2008 and 2007, the breakdown
of the fair value of plan assets held is as follows:
2008 2007
Amount Percentage Amount Percentage
Equity Securities US $ 770,000 $1,139,000 Non-US 518,000 856,000
1,288,000 58.6% 1,995,000 73.0%
Fixed income securities 872,000 39.7 762,000 27.9 Other Assets (Liabilities)—net 38,000 1.7 (24,000) (0.9)
Total $2,198,000 100.0% $2,733,000 100.0%
All investments, excluding time deposits, are
valued using market prices. Time deposits are reported
at cost which is the reasonable estimate of the fair value.
Fixed income securities include US government and
government guaranteed obligations, corporate bonds and
time deposits. Other assets include forward exchange
contracts in various foreign currencies transacted to
hedge currency exposure in the investment portfolio,
which are reported at fair value.
For the year ended 31 December 2008 the net
return on the Plan assets was -29.5% (6.0% – 2007). ADB
expects the long-term rate of return on the assets to be
8%.
Assumptions
The assumed overall rate of return takes into account
long-term return expectations of the underlying as-
set classes within the investment portfolio mix, and
the expected duration of the Plan’s liabilities. Return
expectations are forward looking and, in general, not
much weight is given to short-term experience. Unless
there is a drastic change in investment policy or market
environment, the assumed investment return of 8% on
the Plan’s assets is expected to remain broadly the same,
year to year.

ADBISF-4
ASIAN DEVELOPMENT BANK—ASIAN DEVELOPMENT BANK INSTITUTE SPECIAL FUND
NOTES TO FINANCIAL STATEMENTS31 December 2008 and 2007
119Annual Report 2008A
SIAN
DEVELO
PMEN
T BAN
K INSTITU
TE SPECIA
L FUN
D
Postretirement Medical Benefits Plan
The Institute participates in the cost-sharing plan of
ADB for retirees’ medical insurance premiums. Under
the plan, the Institute is obligated to pay 75% of the
Group Medical Insurance Plan premiums for retirees
and their eligible dependents who elected to participate.
The cost-sharing plan is currently unfunded.
Generally accepted accounting principles require
an actuarially determined assessment of the periodic
cost of postretirement medical benefits.
The following table sets forth the pension and
postretirement benefits at 31 December 2008 and
31 December 2007:
Postretirement Pension Benefits Medical Benefits
2008 2007 2008 2007
Change in benefit obligation: Projected benefit obligation at beginning of year $ 4,960,000 $ 4,269,000 $ 98,000 $ 231,000 Service cost 163,000 126,000 20,000 14,000 Interest cost 305,000 258,000 7,000 15,000 Plan participants’ contributions 322,000 49,000 – – Transfers – 232,000 – – Actuarial (gain) loss (818,000) 430,000 (8,000) (152,000) Benefits paid (88,000) (404,000) (21,000) (10,000)
Projected benefit obligation at end of year $ 4,844,000 $ 4,960,000 $ 96,000 $ 98,000
Change in plan assets: Fair value of plan assets at beginning of year $ 2,733,000 $ 2,623,000 $ – $ – Actual return on plan assets (851,000) 149,000 – – Employer’s contribution 82,000 84,000 21,000 10,000 Plan participants’ contributions 322,000 49,000 – – Transfers – 232,000 – – Benefits paid (88,000) (404,000) (21,000) (10,000)
Fair value of plan assets at end of year $ 2,198,000 $ 2,733,000 $ – $ –
Funded Status $(2,646,000) $(2,227,000) $ (96,000) $ (98,000)
Amounts recognized in the Balance sheet consist of: Current liability $ – $ – $ – $ – Non-current liability (2,646,000) (2,227,000) (96,000) (98,000)
Net amount recognized $(2,646,000) $(2,227,000) $ (96,000) $ (98,000)
Amounts recognized in the Unrestricted net assets consist of: Net actuarial loss (gain) $ 994,000 $ 761,000 $ (395,000) $ (426,000) Prior service cost (credit) 10,000 15,000 (1,000) (32,000)
Net amount recognized $ 1,004,000 $ 776,000 $ (396,000) $ (458,000)
Weighted-average assumptions as of 31 December Discount rate 7.25% 6.00% 7.25% 6.00% Expected return on plan assets 8.00% 8.00% N/A N/A Rate of compensation increase varies with age and averages 5.05% 4.65% 5.05% 4.65%
CONTINUED

ASIAN DEVELOPMENT BANK—ASIAN DEVELOPMENT BANK INSTITUTE SPECIAL FUND
NOTES TO FINANCIAL STATEMENTS31 December 2008 and 2007
Asian Development Bank120A
SIA
N D
EVEL
OPM
ENT
BAN
K IN
STIT
UTE
SPE
CIA
L FU
ND
For measurement purposes, a 9.0% annual rate of
increase in the per capita cost of covered health care
benefits was assumed for the valuation as at 31 December
2008. The rate was assumed to decrease gradually to
5.0% for 2013 and remain at that level thereafter.
Postretirement Pension Benefits Medical Benefits
2008 2007 2008 2007
Components of net periodic benefit cost: Service cost $163,000 $126,000 $ 20,000 $ 14,000 Interest cost 305,000 258,000 7,000 15,000 Expected return on plan assets (226,000) (198,000) – – Amortization of prior service cost 5,000 5,000 (31,000) (31,000) Recognized actuarial loss 26,000 – (39,000) (24,000) Net periodic benefit cost $273,000 $191,000 $(43,000) $(26,000)
The accumulated benefit obligation of the pension
plan as of 31 December 2008 was $4,635,000 ($4,726,000
– 2007).
A one-percentage-point change in assumed health
care cost trend rates would have the following effects:
1-Percentage- 1-Percentage- Point Increase Point Decrease
Effect on total service and interest cost components $ 7,000 $ (5,000)Effect on postretirement benefit obligation 22,000 (19,000)
Estimated Future Benefits Payments
The following table shows the benefit payments expected
to be paid in each of the next five years and subsequent
five years. The expected benefit payments are based
on the same assumptions used to measure the benefit
obligation at 31 December 2008:
Postretirement Pension Benefits Medical Benefits
2009 $ 215,000 $ –2010 179,000 –2011 209,000 –2012 241,000 –2013 272,000 1,0002014-2018 1,671,000 12,000
ADBISF-4

121Annual Report 2008A
SIAN
TSUN
AM
I FUN
D
ASIAN TSUNAMI FUND
Management's Report on Internal Control over Financial Reporting
The management of Asian Development Bank (“ADB”) is responsible for establishing and
maintaining adequate internal control over financial reporting. ADB's internal control over
financial reporting is a process designed to provide reasonable assurance regarding the reliabil-
ity of financial reporting and the preparation of financial statements for external purposes in
accordance with generally accepted accounting principles in the United States of America.
ADB's internal control over financial reporting includes those policies and procedures that
(i) pertain to the maintenance of records that, in reasonable detail, accurately and fairly re-
flect the transactions and dispositions of the assets of ADB; (ii) provide reasonable assurance
that transactions are recorded as necessary to permit preparation of financial statements in
accordance with generally accepted accounting principles, and that receipts and expenditures
of ADB are being made only in accordance with authorizations of management and directors
of ADB; and (iii) provide reasonable assurance regarding prevention or timely detection of
unauthorized acquisition, use or disposition of ADB's assets that could have a material effect
on the financial statements.
Because of its inherent limitations, internal control over financial reporting may not prevent
or detect misstatements. Also, projections of any evaluation of effectiveness to future periods
are subject to the risk that controls may become inadequate because of changes in conditions,
or that the degree of compliance with the policies or procedures may deteriorate.
ADB's management assessed the effectiveness of ADB's internal control over financial report-
ing as of 31 December 2008. In making this assessment, ADB's management used the criteria
set forth by the Committee of Sponsoring Organizations of the Treadway Commission in
Internal Control – Integrated Framework. Based on that assessment, management believes that as
of 31 December 2008, ADB's internal control over financial reporting is effective based upon
the criteria established in Internal Control – Integrated Framework.
Haruhiko Kuroda
President
Bindu N. Lohani
Vice President (Finance and Administration)
Hong-Sang Jung
Controller
5 March 2009

Asian Development Bank122A
SIA
N T
SUN
AM
I FU
ND
Report of Independent Auditors to the Asian Development Bank
In our opinion, the accompanying statements of financial position and the related statements of ac-
tivities and changes in net assets and cash flows present fairly, in all material respects, the financial
position of the Asian Development Bank (“ADB” or “the Bank”)—Asian Tsunami Fund at 31 December
2008 and 2007, and the results of its activities and changes in net assets and its cash flows for the
years then ended, in conformity with accounting principles generally accepted in the United States of
America. Also in our opinion, management’s assertion that ADB maintained, effective internal control
over financial reporting as of 31 December 2008 is fairly stated, in all material respects, based on
criteria established in Internal Control - Integrated Framework issued by the Committee of Sponsor-
ing Organizations of the Treadway Commission (COSO). The management of ADB is responsible
for these financial statements, for maintaining effective internal control over financial reporting and
for its assertion of the effectiveness of internal control over financial reporting, included in the ac-
companying Management's Report on Internal Control over Financial Reporting. Our responsibility
is to express opinions on these financial statements and on ADB’s internal control over financial re-
porting based on our integrated audit in 2008 and financial statement audit in 2007. We conducted
our audits of the financial statements in accordance with auditing standards generally accepted in
the United States of America and our audit of internal control over financial reporting in accordance
with attestation standards established by the American Institute of Certified Public Accountants.
Those standards require that we plan and perform the audits to obtain reasonable assurance about
whether the financial statements are free of material misstatement and whether effective internal
control over financial reporting was maintained in all material respects. Our audits of the financial
statements included examining, on a test basis, evidence supporting the amounts and disclosures in
the financial statements, assessing the accounting principles used and significant estimates made
by management, and evaluating the overall financial statement presentation. Our audit of internal
control over financial reporting included obtaining an understanding of internal control over financial
reporting, assessing the risk that a material weakness exists, and testing and evaluating the design
and operating effectiveness of internal control based on the assessed risk. Our audits also included
performing such other procedures as we considered necessary in the circumstances. We believe that
our audits provide a reasonable basis for our opinions.
PricewaterhouseCoopers LLPpwc.com/sg 8 Cross Street #17-00PWC BuildingSingapore 048424Telephone (65) 6236 3388Facsimile (65) 6236 3300
GST No.: M90362193L Reg. No.: T09LL0001D
PricewaterhouseCoopers LLP (Registration No. T09LL0001D) is an accounting limited liability partnership registered in Singapore under the Limited Liability Partner-ships Act (Chapter 163A). It was converted from a partnership (with the name “PricewaterhouseCoopers” and Registration no. 000640) to an accounting limited liability partnership on 1 January 2009. PricewaterhouseCoopers LLP is part of the network of member firms of PricewaterhouseCoopers International Limited, each of which is a separate and independent legal entity.

123Annual Report 2008A
SIAN
TSUN
AM
I FUN
D
A company’s internal control over financial reporting is a process effected by those charged with
governance, management, and other personnel, designed to provide reasonable assurance regarding
the preparation of reliable financial statements in accordance with accounting principles generally
accepted in the United States of America. A company’s internal control over financial reporting in-
cludes those policies and procedures that (i) pertain to the maintenance of records that, in reasonable
detail, accurately and fairly reflect the transactions and dispositions of the assets of the company;
(ii) provide reasonable assurance that transactions are recorded as necessary to permit preparation of
financial statements in accordance with generally accepted accounting principles, and that receipts and
expenditures of the company are being made only in accordance with authorizations of management
and those charged with governance; and (iii) provide reasonable assurance regarding prevention, or
timely detection of unauthorized acquisition, use, or disposition of the company’s assets that could
have a material effect on the financial statements.
Because of its inherent limitations, internal control over financial reporting may not prevent or detect
misstatements. Also, projections of any evaluation of effectiveness to future periods are subject to
the risk that controls may become inadequate because of changes in conditions, or that the degree
of compliance with the policies or procedures may deteriorate.
PricewaterhouseCoopers LLP
Public Accountants and Certified Public Accountants
Singapore
5 March 2009

Asian Development Bank124A
SIA
N T
SUN
AM
I FU
ND
ATF-1
ASIAN DEVELOPMENT BANK—ASIAN TSUNAMI FUND
STATEMENT OF FINANCIAL POSITION 31 December 2008 and 2007Expressed in Thousands of United States Dollars (Note B)
2008 2007
ASSETS
DUE FROM BANKS (Note B) $ 383 $ 161
INVESTMENTS (Notes B, C, and G) Time deposits $ 93,032 $366,524 Corporate bonds 158,256 251,288 – 366,524
ACCRUED REVENUE 731 375
ADVANCES FOR GRANTS (Note B) 43,017 62,443
TOTAL $295,419 $429,503
LIABILITIES AND UNCOMMITTED BALANCES
ACCOUNTS PAYABLE AND OTHER LIABILITIES (Note D) $ 694 $ 363
UNDISBURSED COMMITMENTS (Notes B, E, and G) 248,338 389,132
UNCOMMITTED BALANCES (ATF-2) (Notes B and F), represented by: Unrestricted net assets 46,387 40,008
TOTAL $295,419 $429,503
The accompanying notes are an integral part of these financial statements (ATF-4).

125Annual Report 2008A
SIAN
TSUN
AM
I FUN
D
ATF-2
ASIAN DEVELOPMENT BANK—ASIAN TSUNAMI FUND
STATEMENT OF ACTIVITIES AND CHANGES IN NET ASSETS For the Years Ended 31 December 2008 and 2007Expressed in Thousands of United States Dollars (Note B)
2008 2007
CHANGES IN UNRESTRICTED NET ASSETS
REVENUE From investments (Notes B and C) $ 9,125 $ 22,257 From other sources 215 $ 9,340 389 $ 22,646
EXPENSES Technical assistance (Notes B and E) – (115) Administrative expenses (Note D) 2,849 2,218 Financial expenses 2 2,851 1 2,104
REVENUE IN EXCESS OF EXPENSES 6,489 20,542
EXCHANGE LOSSES (Note B) (110) (16) INCREASE IN NET ASSETS 6,379 20,526 NET ASSETS AT BEGINNING OF YEAR 40,008 19,482 NET ASSETS AT END OF YEAR $ 46,387 $ 40,008
The accompanying notes are an integral part of these financial statements (ATF-4).

Asian Development Bank126A
SIA
N T
SUN
AM
I FU
ND
ATF-3
ASIAN DEVELOPMENT BANK—ASIAN TSUNAMI FUND
STATEMENT OF CASH FLOWS For the Years Ended 31 December 2008 and 2007 Expressed in Thousands of United States Dollars (Note B)
2008 2007 CASH FLOWS FROM OPERATING ACTIVITIES Interest on investments received $ 7,622 $ 22,644 Grants / Technical assistance disbursed (121,820) (128,707) Administrative expenses paid (2,178) (2,107) Cash received from other sources 216 387 Net Cash Used in Operating Activities (116,160) (107,783) CASH FLOWS FROM INVESTING ACTIVITIES Maturities of investments 9,337,364 9,180,041 Purchases of investments (9,220,982) (9,072,380) Net Cash Provided by Investing Activities 116,382 107,661 Net Increase (Decrease) in Due from Banks 222 (122) Due from Banks at Beginning of Year 161 283 Due from Banks at End of Year $ 383 $ 161 RECONCILIATION OF INCREASE IN NET ASSETS TO NET CASH USED IN OPERATING ACTIVITIES:
Increase in net assets (ATF-2) $ 6,379 $ 20,526 Adjustments to reconcile increase in net assets to net cash used in operating activities: Amortization of discounts/premiums on investments (834) – Change in accrued revenue (357) 386 Change in advances for grants 19,427 (20,543) Change in accounts payable and other liabilities 331 110 Change in undisbursed commitments (140,794) (108,262) Change in unrealized investment gains (312) – Net Cash Used in Operating Activities $ (116,160) $ (107,783)
The accompanying notes are an integral part of these financial statements (ATF-4).

ATF-4
ASIAN DEVELOPMENT BANK—ASIAN TSUNAMI FUND
NOTES TO FINANCIAL STATEMENTS31 December 2008 and 2007
127Annual Report 2008A
SIAN
TSUN
AM
I FUN
D
NOTE A— NATURE OF OPERATIONS
The Asian Tsunami Fund (ATF) was established on 11
February 2005 in response to the special circumstances
surrounding the developing member countries (DMCs)
that were stricken by the effects of the tsunami on 26
December 2004. The purpose of ATF is to provide
emergency grant financing promptly and effectively to
affected DMCs in the form of technical assistance (TAs)
and investment projects to support reconstruction,
rehabilitation and associated development activities fol-
lowing the tsunami disaster.
ATF will serve as a dedicated source of grant
financing to support priority rehabilitation and
reconstruction needs on a multi-sector basis. Resources
from the Fund will be available to central governments
and other suitable entities including non-governmental
organizations.
ATF’s resources may consist of allocations from the
net income of Ordinary Capital Resources (OCR) and
contributions from bilateral, multilateral and individual
sources.
NOTE B— SUMMARY OF SIGNIFICANT ACCOUNTING POLICIES
Presentation of the Financial Statements
The financial statements of the ATF are presented on
the basis of those for not-for-profit organizations.
ATF reports donors’ contributions of cash and other
assets as unrestricted assets as these are made available
to ATF without conditions other than for the purpose of
pursuing its objectives.
Functional and Reporting Currency
The United States dollar is the functional and report-
ing currency, representing the currency of the primary
economic operating environment of ATF.
Translation of Currencies
ADB adopts the use of daily exchange rates for account-
ing and financial reporting purposes. This allows transac-
tions denominated in non-US dollar to be translated to
the reporting currency using exchange rates applicable
at the time of transactions. Contributions included in
the financial statements during the year are recognized
at applicable exchange rates as of the respective dates
of commitment. At the end of each accounting month,
translations of assets, liabilities, and uncommitted
balances which are denominated in non-US dollar are
adjusted using the applicable rates of exchange at the
end of the reporting period. These translation adjust-
ments are accounted for as exchange gains or losses and
are credited or charged to operations.
Investments
All investment securities held by ATF are reported at
estimated fair value, which represents their fair market
value. Realized and unrealized gains and losses are in-
cluded in revenue. Time deposits are reported at cost
which is a reasonable estimate of fair value.
Interest income on investment securities and time
deposits are recognized as realized and reported, net of
amortizations of premiums and discounts.
Contributions
The contributions from donors and the allocations from
OCR net income are included in the financial statements,
from the date of effectivity of the contribution agreement,
and the Board of Governors’ approval, respectively.
Technical Assistance, Grants and Undisbursed Commitments
Technical Assistance and grants are recognized in the
financial statements when the project is approved and
becomes effective. Upon completion of the TA project
or cancellation of a grant, any undisbursed amount is
written back as a reduction in technical assistance or
grants for the year and the corresponding undisbursed
commitment is eliminated accordingly.
Advances are provided from technical assistance
grant funds to the executing agency or co-operating
institution, for the purpose of making payments for
eligible expenses. The advances shall be subject to
liquidation and charged against undisbursed commitment,
any unutilized portion shall be refunded to the fund.

ASIAN DEVELOPMENT BANK—ASIAN TSUNAMI FUND
NOTES TO FINANCIAL STATEMENTS31 December 2008 and 2007
Asian Development Bank128A
SIA
N T
SUN
AM
I FU
ND
Accounting Estimates
The preparation of financial statements in conformity
with generally accepted accounting principles requires
Management to make reasonable estimates and assump-
tions that affect the reported amounts of assets and
liabilities and uncommitted balances as at the end of the
year and the reported amounts of revenue and expenses
during the year. The actual results could differ from
those estimates.
Statement of Cash Flows
For the purposes of the Statement of Cash Flows, ATF
considers that its cash and cash equivalents are limited
to “DUE FROM BANKS.”
NOTE C—INVESTMENTS
The main investment management objective is to main-
tain security and liquidity. Subject to these parameters,
ADB seeks the highest possible return on its investments.
Investments are governed by the Investment Authority
approved by the Board of Directors in 1999, and reviewed
in 2006. The review endorsed a portfolio strategy that is
largely consistent with the 1999 approach.
Investment securities and negotiable certificate of
deposits held as of 31 December 2008 are classified as
“Available for Sale” and are reported at fair value, which
represents their fair market value. Unrealized gains and
losses are included in revenue from investments.
The annualized rate of return on the average
investments held during the year, based on the portfolio
held at the beginning and end of each month was 2.96%
(5.27% – 2007).
NOTE D—RELATED PARTY TRANSACTIONS
The OCR and special fund resources are at all times
used, committed, and invested entirely separate from
each other. The administrative and operational expenses
pertaining to ATF are settled on a regular basis between
OCR and ATF. As of 31 December 2008, $669,000
($343,000 – 2007) was payable to OCR which is included
in accounts payable and other liabilities.
NOTE E—UNDISBURSED COMMITMENTS
Undisbursed commitments are denominated in United
States dollars and represent effective technical assist-
ance and grants not yet disbursed. The fair value of
undisbursed commitments approximates the amounts
outstanding, because ADB expects that disbursements
will substantially be made for all the projects/programs
covered by the commitments.
In 2008, there were no undisbursed commitments
on closed TA projects that were written back as a
reduction of technical assistance ($115,000 – 2007).
NOTE F— CONTRIBUTIONS AND UNCOMMITTED BALANCES
In April and May 2005, ADB contributed $600,000,000
from OCR surplus to ATF. Contributions were also
received from Australia and Luxembourg amounting to
$3,796,000 and $1,000,000, respectively. In November
2005, following the establishment of Pakistan Earthquake
Fund (PEF) in response to the special circumstances
surrounding the 8 October 2005 earthquake in Pakistan,
unutilized ATF fund of $40,000,000 was transferred
back to OCR, which was subsequently transferred to
PEF. Another $10,000,000 was returned to OCR in June
2006 and was committed as ADBs contribution to the
Java Reconstruction Fund in November 2008, to support
post-disaster management, rehabilitation, immediate
construction, and urgent vital development activities in
Yogyakarta and Central Java in Indonesia.
No contributions were received in 2008 and 2007.
Uncommitted balances comprised of amounts
which have not been committed by ADB as at 31
December 2008 and 2007.
NOTE G—FAIR VALUE MEASUREMENTS
FAS 157 defines fair value as the price that would be
received to sell an asset or paid to transfer a liability at
measurement date (exit price) in an orderly transaction
among willing participants with an assumption that the
transaction takes place in the entity’s principal market,
the most advantageous market for the asset or liability.
The most advantageous market is the market where the
sale of the asset or transfer of liability would maximize the

ATF-4
ASIAN DEVELOPMENT BANK—ASIAN TSUNAMI FUND
NOTES TO FINANCIAL STATEMENTS31 December 2008 and 2007
129Annual Report 2008A
SIAN
TSUN
AM
I FUN
D
ATF-4
amount received for the asset or minimize the amount
paid to transfer the liability. The fair value measurement
is not adjusted for transaction cost.
FAS 157 also establishes a fair value hierarchy
that gives the highest priority to quoted prices in
active markets for identical assets or liabilities (Level
1), next priority to observable market inputs or market
corroborated data (Level 2), and the lowest priority to
unobservable inputs without market corroborated data
(Level 3). FAS 157 requires the fair value measurement
to maximize the use of market observable inputs.
The following guidelines are applied in determining
the fair values of financial instruments:
Investments
Readily marketable investments are fair valued using
active market quotes in Level 1 category. Level 2 cat-
egory includes investments which are fair valued with
significant other market observable inputs.
The fair value of the following financial assets of
ATF as of 31 December 2008 were reported based on
the following:
See Notes C and E for discussions relating to
investments and undisbursed commitments. In all
other cases, the carrying amounts of the ATF's assets,
Fair Value Measurements Quoted Prices in Significant Significant Active Markets for Other Observable Unobservable Identical Assets Inputs Inputs 31 December 2008 (Level 1) (Level 2) (Level 3)
Assets Investments $251,288,000 $88,455,000 $162,833,000 $ –
liabilities, and uncommitted balances are considered
to approximate fair values for all significant financial
instruments.
CONTINUED

Asian Development Bank130PA
KIST
AN
EA
RTH
QU
AKE
FU
ND
PAKISTAN EARTHQUAKE FUND
Management's Report on Internal Control over Financial Reporting
The management of Asian Development Bank (“ADB”) is responsible for establishing and
maintaining adequate internal control over financial reporting. ADB's internal control over
financial reporting is a process designed to provide reasonable assurance regarding the reliabil-
ity of financial reporting and the preparation of financial statements for external purposes in
accordance with generally accepted accounting principles in the United States of America.
ADB's internal control over financial reporting includes those policies and procedures that
(i) pertain to the maintenance of records that, in reasonable detail, accurately and fairly re-
flect the transactions and dispositions of the assets of ADB; (ii) provide reasonable assurance
that transactions are recorded as necessary to permit preparation of financial statements in
accordance with generally accepted accounting principles, and that receipts and expenditures
of ADB are being made only in accordance with authorizations of management and directors
of ADB; and (iii) provide reasonable assurance regarding prevention or timely detection of
unauthorized acquisition, use or disposition of ADB's assets that could have a material effect
on the financial statements.
Because of its inherent limitations, internal control over financial reporting may not prevent
or detect misstatements. Also, projections of any evaluation of effectiveness to future periods
are subject to the risk that controls may become inadequate because of changes in conditions,
or that the degree of compliance with the policies or procedures may deteriorate.
ADB's management assessed the effectiveness of ADB's internal control over financial report-
ing as of 31 December 2008. In making this assessment, ADB's management used the criteria
set forth by the Committee of Sponsoring Organizations of the Treadway Commission in
Internal Control – Integrated Framework. Based on that assessment, management believes that as
of 31 December 2008, ADB's internal control over financial reporting is effective based upon
the criteria established in Internal Control – Integrated Framework.
Haruhiko Kuroda
President
Bindu N. Lohani
Vice President (Finance and Administration)
Hong-Sang Jung
Controller
5 March 2009

131Annual Report 2008PA
KISTAN
EARTH
QU
AKE FU
ND
Report of Independent Auditors to the Asian Development Bank
In our opinion, the accompanying statements of financial position and the related statements of ac-
tivities and changes in net assets and cash flows present fairly, in all material respects, the financial
position of the Asian Development Bank (“ADB” or “the Bank”)—Pakistan Earthquake Fund at 31
December 2008 and 2007, and the results of its activities and changes in net assets and its cash flows
for the years then ended, in conformity with accounting principles generally accepted in the United
States of America. Also in our opinion, management’s assertion that ADB maintained effective inter-
nal control over financial reporting as of 31 December 2008 is fairly stated, in all material respects,
based on criteria established in Internal Control - Integrated Framework issued by the Committee of
Sponsoring Organizations of the Treadway Commission (COSO). The management of ADB is respon-
sible for these financial statements, for maintaining effective internal control over financial reporting
and for its assertion of the effectiveness of internal control over financial reporting, included in the
accompanying Management’s Report on Internal Control over Financial Reporting. Our responsibil-
ity is to express opinions on these financial statements and on ADB’s internal control over financial
reporting based on our integrated audit in 2008 and financial statement audit in 2007. We conducted
our audits of the financial statements in accordance with auditing standards generally accepted in
the United States of America and our audit of internal control over financial reporting in accordance
with attestation standards established by the American Institute of Certified Public Accountants.
Those standards require that we plan and perform the audits to obtain reasonable assurance about
whether the financial statements are free of material misstatement and whether effective internal
control over financial reporting was maintained in all material respects. Our audits of the financial
statements included examining, on a test basis, evidence supporting the amounts and disclosures in
the financial statements, assessing the accounting principles used and significant estimates made
by management, and evaluating the overall financial statement presentation. Our audit of internal
control over financial reporting included obtaining an understanding of internal control over financial
reporting, assessing the risk that a material weakness exists, and testing and evaluating the design
and operating effectiveness of internal control based on the assessed risk. Our audits also included
performing such other procedures as we considered necessary in the circumstances. We believe that
our audits provide a reasonable basis for our opinions.
PricewaterhouseCoopers LLPpwc.com/sg 8 Cross Street #17-00PWC BuildingSingapore 048424Telephone (65) 6236 3388Facsimile (65) 6236 3300
GST No.: M90362193L Reg. No.: T09LL0001D
PricewaterhouseCoopers LLP (Registration No. T09LL0001D) is an accounting limited liability partnership registered in Singapore under the Limited Liability Partner-ships Act (Chapter 163A). It was converted from a partnership (with the name “PricewaterhouseCoopers” and Registration no. 000640) to an accounting limited liability partnership on 1 January 2009. PricewaterhouseCoopers LLP is part of the network of member firms of PricewaterhouseCoopers International Limited, each of which is a separate and independent legal entity.

Asian Development Bank132PA
KIST
AN
EA
RTH
QU
AKE
FU
ND
A company’s internal control over financial reporting is a process effected by those charged with
governance, management, and other personnel, designed to provide reasonable assurance regarding
the preparation of reliable financial statements in accordance with accounting principles generally
accepted in the United States of America. A company’s internal control over financial reporting in-
cludes those policies and procedures that (i) pertain to the maintenance of records that, in reasonable
detail, accurately and fairly reflect the transactions and dispositions of the assets of the company;
(ii) provide reasonable assurance that transactions are recorded as necessary to permit preparation of
financial statements in accordance with generally accepted accounting principles, and that receipts and
expenditures of the company are being made only in accordance with authorizations of management
and those charged with governance; and (iii) provide reasonable assurance regarding prevention, or
timely detection of unauthorized acquisition, use, or disposition of the company’s assets that could
have a material effect on the financial statements.
Because of its inherent limitations, internal control over financial reporting may not prevent or detect
misstatements. Also, projections of any evaluation of effectiveness to future periods are subject to
the risk that controls may become inadequate because of changes in conditions, or that the degree
of compliance with the policies or procedures may deteriorate.
PricewaterhouseCoopers LLP
Public Accountants and Certified Public Accountants
Singapore
5 March 2009
133Annual Report 2008PA
KISTAN
EARTH
QU
AKE FU
ND
PEF-1
ASIAN DEVELOPMENT BANK—PAKISTAN EARTHQUAKE FUND
STATEMENT OF FINANCIAL POSITION 31 December 2008 and 2007Expressed in Thousands of United States Dollars (Note B)
2008 2007 ASSETS
DUE FROM BANKS (Note B) $ 823 $ 1,601
INVESTMENTS (Notes B, C, and G) Government or government-guaranteed obligations $ 8,066 $ – Time deposits 53,237 61,303 60,690 60,690
ACCRUED REVENUE 111 121
DUE FROM CONTRIBUTORS (Notes B and F) 2,973 6,395
ADVANCES FOR GRANTS (Note B) 3,187 1,007
TOTAL $68,397 $69,814
LIABILITIES AND UNCOMMITTED BALANCES
MISCELLANEOUS LIABILITIES (Note D) $ 33 $ 30
UNDISBURSED COMMITMENTS (Notes B, E, and G) 66,161 73,237
UNCOMMITTED BALANCES (PEF-2) (Notes B and F), represented by: Unrestricted net assets 2,203 (3,453)
TOTAL $68,397 $ 69,814
The accompanying notes are an integral part of these financial statements (PEF-4).

Asian Development Bank134PA
KIST
AN
EA
RTH
QU
AKE
FU
ND
PEF-2
ASIAN DEVELOPMENT BANK—PAKISTAN EARTHQUAKE FUND
STATEMENT OF ACTIVITIES AND CHANGES IN NET ASSETS For the Years Ended 31 December 2008 and 2007 Expressed in Thousands of United States Dollars (Note B)
2008 2007
CHANGES IN UNRESTRICTED NET ASSETS
CONTRIBUTIONS (Notes B and F) $ 10,225 $ 19,123 REVENUE From investments (Notes B and C) $ 3,078 $ 2,387 From other sources 171 3,249 201 2,588
Total 13,474 21,711
EXPENSES Grants (Note B) – 30,000 Technical assistance (Notes B and E) – 2,000 Administrative expenses (Note D) 171 171 70 32,070
CONTRIBUTIONS AND REVENUE IN EXCESS OF (LESS THAN) EXPENSES 13,303 (10,359)
NET EXCHANGE (LOSSES) GAINS (Note B) (7,647) 860
INCREASE (DECREASE) IN NET ASSETS 5,656 (9,499)
NET ASSETS AT BEGINNING OF YEAR (3,453) 6,046
NET ASSETS AT END OF YEAR $ 2,203 $ (3,453)
The accompanying notes are an integral part of these financial statements (PEF-4).

135Annual Report 2008PA
KISTAN
EARTH
QU
AKE FU
ND
PEF-3
ASIAN DEVELOPMENT BANK—PAKISTAN EARTHQUAKE FUND
STATEMENT OF CASH FLOWS For the Years Ended 31 December 2008 and 2007 Expressed in Thousands of United States Dollars (Note B)
2008 2007
CASH FLOWS FROM OPERATING ACTIVITIES Contributions received $ 13,094 $ 25,100 Interest on investments received 2,940 2,331 Cash received from other sources 171 201 Grants and technical assistance disbursed (9,256) (1,980) Administrative and financial expenses paid (168) (40) Net Cash Provided by Operating Activities 6,781 25,612 CASH FLOWS FROM INVESTING ACTIVITIES Maturities of investments 1,134,641 767,960 Acquisition of investments (1,141,160) (793,545) Net Cash Used in Investing Activities (6,519) (25,585) Effect of Exchange Rate Changes on Due from Banks (1,040) (44) Net Decrease in Due from Banks (778) (17) Due from Banks at Beginning of Year 1,601 1,618 Due from Banks at End of Year $ 823 $ 1,601
RECONCILIATION OF INCREASE (DECREASE) IN NET ASSETS TO NET CASH PROVIDED BY OPERATING ACTIVITIES:
Increase (decrease) in net assets (PEF-2) $ 5,656 $ (9,499) Adjustments to reconcile increase (decrease) in net assets to net cash provided by operating activities: Amortization of discounts/premiums on investments (97) – Change in accrued revenue 10 (56) Change in due from contributors 2,255 5,257 Change in advances for grants (2,180) (717) Change in miscellaneous liabilities 4 30 Change in undisbursed commitments (7,077) 30,737 Translation adjustments 8,261 (140) Change in unrealized investment holding gains (51) – Net Cash Provided by Operating Activities $ 6,781 $ 25,612
The accompanying notes are an integral part of these financial statements (PEF-4).

ASIAN DEVELOPMENT BANK—PAKISTAN EARTHQUAKE FUND
NOTES TO FINANCIAL STATEMENTS31 December 2008 and 2007
Asian Development Bank136PA
KIST
AN
EA
RTH
QU
AKE
FU
ND
NOTE A—NATURE OF OPERATIONS
The Pakistan Earthquake Fund (PEF) was established
on 14 November 2005 in response to the special circum-
stances confronted by Pakistan resulting from the effects
of an earthquake on 8 October 2005. The objective of the
PEF is to deliver emergency grant financing promptly and
effectively to Pakistan in the form of technical assistance
(TA) and investment projects to support reconstruction,
rehabilitation, and associated development activities.
PEF resources will be available to the Government
of Pakistan and other suitable entities acceptable to the
Government of Pakistan and ADB, including, where
appropriate, non-government organizations.
PEF’s resources may consist of allocations from the
net income of Ordinary Capital Resources (OCR) and
contributions from bilateral, multilateral, and individual
sources.
NOTE B— SUMMARY OF SIGNIFICANT ACCOUNTING POLICIES
Presentation of the Financial Statements
The financial statements of the PEF are presented on
the basis of those for not-for-profit organizations.
PEF reports donors’ contributions of cash and other
assets as unrestricted assets as these are made available
to PEF without conditions other than for the purpose of
pursuing its objectives.
Functional and Reporting Currency
The United States dollar is the functional and report-
ing currency, representing the currency of the primary
economic operating environment of PEF.
Translation of Currencies
ADB adopts the use of daily exchange rates for account-
ing and financial reporting purposes. This allows transac-
tions denominated in non-US dollar to be translated to
the reporting currency using exchange rates applicable
at the time of transactions. Contributions included in
the financial statements during the year are recognized
at applicable exchange rates as of the respective dates
of commitment. At the end of each accounting month,
translations of assets, liabilities, and uncommitted
balances which are denominated in non-US dollar are
adjusted using the applicable rates of exchange at the
end of the reporting period. These translation adjust-
ments are accounted for as exchange gains or losses and
are credited or charged to operations.
Investments
All investment securities held by PEF are reported at
estimated fair value, which represents their fair market
value. Realized and unrealized gains and losses are in-
cluded in revenue. Time deposits are reported at cost
which is a reasonable estimate of fair value.
Interest income on investment securities and time
deposits are recognized as realized and reported, net of
amortizations of premiums and discounts.
Contributions
The contributions from donors and the allocations from
OCR net income are included in the financial statements,
from the date of effectivity of the contribution agreement,
and the Board of Governors’ approval, respectively.
Technical Assistance, Grants and Undisbursed Commitments
Technical assistance and grants are recognized in the
financial statements when the project is approved and
becomes effective. Upon completion of a TA project or
cancellation of a grant, any undisbursed amount is writ-
ten back as a reduction in technical assistance or grants
for the year and the corresponding undisbursed commit-
ment is eliminated accordingly.
Advances are provided from technical assistance
grant funds to the executing agency or co-operating
institution, for the purpose of making payments for
eligible expenses. The advances shall be subject to
liquidation and charged against undisbursed commitment,
any unutilized portion shall be refunded to the fund.
Accounting Estimates
The preparation of financial statements in conform-
ity with generally accepted accounting principles requires
Management to make reasonable estimates and assump-
tions that affect the reported amounts of assets and liabili-
ties and uncommitted balances as at the end of the year and

PEF-4
ASIAN DEVELOPMENT BANK—PAKISTAN EARTHQUAKE FUND
NOTES TO FINANCIAL STATEMENTS31 December 2008 and 2007
137Annual Report 2008PA
KISTAN
EARTH
QU
AKE FU
ND
CONTINUED
the reported amounts of revenue and expenses during the
year. The actual results could differ from those estimates.
Statement of Cash Flows
For the purposes of the Statement of Cash Flows, PEF
considers that its cash and cash equivalents are limited
to “DUE FROM BANKS.”
NOTE C—INVESTMENTS
The main investment management objective is to main-
tain security and liquidity. Subject to these parameters,
ADB seeks the highest possible return on its investments.
Investments are governed by the Investment Authority
approved by the Board of Directors in 1999, and reviewed
in 2006. The review endorsed a portfolio strategy that is
largely consistent with the 1999 approach.
Investment securities and negotiable certificate
of deposits as of 31 December 2008 are considered
“Available for Sale” and are reported at fair value, which
represents their fair market value. Unrealized gains and
losses are included in revenue from investments.
The currency compositions of the investment
portfolio as of 31 December 2008 and 2007 expressed in
United States dollars are as follows:
Currency 2008 2007
Pakistan rupee $25,087,000 $22,689,000United States dollar 36,216,000 38,001,000 Total $61,303,000 $60,690,000
The annualized rate of return on the average
investments held during the year, based on the portfolio
held at the beginning and end of each month was 5.24%
(5.81% – 2007).
NOTE D—RELATED PARTY TRANSACTIONS
The OCR and special fund resources are at all times
used, committed, and invested entirely separate from
each other. The administrative and operational expenses
pertaining to PEF are settled on a regular basis between
OCR and PEF. As of 31 December 2008, $4,000 was
payable to OCR ($5,000 – 2007) which is included in
miscellaneous liabilities.
NOTE E—UNDISBURSED COMMITMENTS
Undisbursed commitments are denominated in United
States dollars and represent effective grants not yet
disbursed. The fair value of undisbursed commitments
approximates the amounts outstanding, because ADB
expects that disbursements will substantially be made for
all the projects/programs covered by the commitments.
NOTE F— CONTRIBUTIONS AND UNCOMMITTED BALANCES
In November 2005, ADB transferred $80,000,000 from
OCR Surplus to PEF. Contributions were also received
from Australia and Finland amounting to $15,036,000
and $12,261,000, respectively.
In 2006 and 2007, instruments of contributions
were received from the Government of Norway and
the Kingdom of Belgium which undertook to make
contributions to the PEF a maximum amount of
$20,000,000 and €9,924,000, respectively. This is by
way of a debt-for development swap arrangement with
Pakistan, where Pakistan shall match the value of debt
and debt service cancellations with equivalent amounts
in Pakistan rupees, which shall be transferred to the Fund
as Norway’s and Belgium’s contributions. In 2008, PEF
received the remaining contributions due from Norway
and Belgium amounting to $5,000,000 and €3,308,000
($5,225,000 equivalent), respectively.
In 2006, the Government of Australia committed
A$20,000,000 ($15,036,000 equivalent). Of this amount,
A$4,300,000 ($2,973,000 equivalent) has not been
received as of 31 December 2008 and was recorded as
“Due from Contributors.”
Uncommitted balances comprised of amounts
which have not been committed by ADB as at 31
December 2008, and committed amount which exceeded
cumulative resources as of 31 December 2007. This
shortfall was covered by additional contributions from
Norway and Belgium in 2008.
NOTE G—FAIR VALUE MEASUREMENTS
FAS 157 defines fair value as the price that would be
received to sell an asset or paid to transfer a liability at
measurement date (exit price) in an orderly transaction
among willing participants with an assumption that the
transaction takes place in the entity’s principal market,

ASIAN DEVELOPMENT BANK—PAKISTAN EARTHQUAKE FUND
NOTES TO FINANCIAL STATEMENTS31 December 2008 and 2007
Asian Development Bank138PA
KIST
AN
EA
RTH
QU
AKE
FU
ND
PEF-4
the most advantageous market for the asset or liability.
The most advantageous market is the market where the
sale of the asset or transfer of liability would maximize the
amount received for the asset or minimize the amount
paid to transfer the liability. The fair value measurement
is not adjusted for transaction cost.
FAS 157 also establishes a fair value hierarchy
that gives the highest priority to quoted prices in
active markets for identical assets or liabilities (Level
1), next priority to observable market inputs or market
corroborated data (Level 2), and the lowest priority to
unobservable inputs without market corroborated data
(Level 3). FAS 157 requires the fair value measurement
to maximize the use of market observable inputs.
The following guidelines are applied in determining
the fair values of financial instruments:
Investments
Readily marketable investments are fair valued using
active market quotes in Level 1 category. Level 2 cat-
egory includes investments which are fair valued with
significant other market observable inputs.
The fair value of the following financial assets of
PEF as of 31 December 2008 were reported based on
the following:
Fair Value Measurements Quoted Prices in Significant Significant Active Markets for Other Observable Unobservable Identical Assets Inputs Inputs 31 December 2008 (Level 1) (Level 2) (Level 3)
Assets Investments $61,303,000 $ – $61,303,000 $ –
See Notes C and E for discussions relating to
investments and undisbursed commitments. In all other
cases, the carrying amount of PEF’s assets, liabilities and
uncommitted balances are considered to approximate
fair values for all significant financial instruments.

139Annual Report 2008REG
ION
AL C
OO
PERATIO
N A
ND
INTEG
RATIO
N FU
ND
REGIONAL COOPERATION AND INTEGRATION FUND
Management's Report on Internal Control over Financial Reporting
The management of Asian Development Bank (“ADB”) is responsible for establishing and
maintaining adequate internal control over financial reporting. ADB's internal control over
financial reporting is a process designed to provide reasonable assurance regarding the reliabil-
ity of financial reporting and the preparation of financial statements for external purposes in
accordance with generally accepted accounting principles in the United States of America.
ADB's internal control over financial reporting includes those policies and procedures that
(i) pertain to the maintenance of records that, in reasonable detail, accurately and fairly re-
flect the transactions and dispositions of the assets of ADB; (ii) provide reasonable assurance
that transactions are recorded as necessary to permit preparation of financial statements in
accordance with generally accepted accounting principles, and that receipts and expenditures
of ADB are being made only in accordance with authorizations of management and directors
of ADB; and (iii) provide reasonable assurance regarding prevention or timely detection of
unauthorized acquisition, use or disposition of ADB's assets that could have a material effect
on the financial statements.
Because of its inherent limitations, internal control over financial reporting may not prevent
or detect misstatements. Also, projections of any evaluation of effectiveness to future periods
are subject to the risk that controls may become inadequate because of changes in conditions,
or that the degree of compliance with the policies or procedures may deteriorate.
ADB's management assessed the effectiveness of ADB's internal control over financial report-
ing as of 31 December 2008. In making this assessment, ADB's management used the criteria
set forth by the Committee of Sponsoring Organizations of the Treadway Commission in
Internal Control – Integrated Framework. Based on that assessment, management believes that as
of 31 December 2008, ADB's internal control over financial reporting is effective based upon
the criteria established in Internal Control – Integrated Framework.
Haruhiko Kuroda
President
Bindu N. Lohani
Vice President (Finance and Administration)
Hong-Sang Jung
Controller
5 March 2009

Asian Development Bank140RE
GIO
NA
L C
OO
PERA
TIO
N A
ND
INTE
GRA
TIO
N F
UN
D
PricewaterhouseCoopers LLPpwc.com/sg 8 Cross Street #17-00PWC BuildingSingapore 048424Telephone (65) 6236 3388Facsimile (65) 6236 3300
GST No.: M90362193L Reg. No.: T09LL0001D
Report of Independent Auditors to the Asian Development Bank
In our opinion, the accompanying statements of financial position and the related statements of ac-
tivities and changes in net assets and cash flows present fairly, in all material respects, the financial
position of the Asian Development Bank (“ADB” or “the Bank”)—Regional Cooperation and Integra-
tion Fund at 31 December 2008 and 2007, and the results of its activities and changes in net assets
and its cash flows for the year ended 31 December 2008 and for the period from 26 February 2007
(establishment of the Fund) to 31 December 2007, in conformity with accounting principles gener-
ally accepted in the United States of America. Also in our opinion, management’s assertion that ADB
maintained effective internal control over financial reporting as of 31 December 2008 is fairly stated,
in all material respects, based on criteria established in Internal Control - Integrated Framework issued
by the Committee of Sponsoring Organizations of the Treadway Commission (COSO). The manage-
ment of ADB is responsible for these financial statements, for maintaining effective internal control
over financial reporting and for its assertion of the effectiveness of internal control over financial
reporting, included in the accompanying Management’s Report on Internal Control over Financial
Reporting. Our responsibility is to express opinions on these financial statements and on ADB’s
internal control over financial reporting based on our integrated audit in 2008 and financial state-
ment audit in 2007. We conducted our audits of the financial statements in accordance with auditing
standards generally accepted in the United States of America and our audit of internal control over
financial reporting in accordance with attestation standards established by the American Institute of
Certified Public Accountants. Those standards require that we plan and perform the audits to obtain
reasonable assurance about whether the financial statements are free of material misstatement and
whether effective internal control over financial reporting was maintained in all material respects.
Our audits of the financial statements included examining, on a test basis, evidence supporting the
amounts and disclosures in the financial statements, assessing the accounting principles used and
significant estimates made by management, and evaluating the overall financial statement presenta-
tion. Our audit of internal control over financial reporting included obtaining an understanding of
internal control over financial reporting, assessing the risk that a material weakness exists, and test-
ing and evaluating the design and operating effectiveness of internal control based on the assessed
risk. Our audits also included performing such other procedures as we considered necessary in the
circumstances. We believe that our audits provide a reasonable basis for our opinions.
PricewaterhouseCoopers LLP (Registration No. T09LL0001D) is an accounting limited liability partnership registered in Singapore under the Limited Liability Partner-ships Act (Chapter 163A). It was converted from a partnership (with the name “PricewaterhouseCoopers” and Registration no. 000640) to an accounting limited liability partnership on 1 January 2009. PricewaterhouseCoopers LLP is part of the network of member firms of PricewaterhouseCoopers International Limited, each of which is a separate and independent legal entity.

141Annual Report 2008REG
ION
AL C
OO
PERATIO
N A
ND
INTEG
RATIO
N FU
ND
A company’s internal control over financial reporting is a process effected by those charged with
governance, management, and other personnel, designed to provide reasonable assurance regarding
the preparation of reliable financial statements in accordance with accounting principles generally
accepted in the United States of America. A company’s internal control over financial reporting in-
cludes those policies and procedures that (i) pertain to the maintenance of records that, in reasonable
detail, accurately and fairly reflect the transactions and dispositions of the assets of the company;
(ii) provide reasonable assurance that transactions are recorded as necessary to permit preparation of
financial statements in accordance with generally accepted accounting principles, and that receipts and
expenditures of the company are being made only in accordance with authorizations of management
and those charged with governance; and (iii) provide reasonable assurance regarding prevention, or
timely detection of unauthorized acquisition, use, or disposition of the company’s assets that could
have a material effect on the financial statements.
Because of its inherent limitations, internal control over financial reporting may not prevent or detect
misstatements. Also, projections of any evaluation of effectiveness to future periods are subject to
the risk that controls may become inadequate because of changes in conditions, or that the degree
of compliance with the policies or procedures may deteriorate.
PricewaterhouseCoopers LLP
Public Accountants and Certified Public Accountants
Singapore
5 March 2009

Asian Development Bank142RE
GIO
NA
L C
OO
PERA
TIO
N A
ND
INTE
GRA
TIO
N F
UN
D
RCIF-1
ASIAN DEVELOPMENT BANK—REGIONAL COOPERATION AND INTEGRATION FUND
STATEMENT OF FINANCIAL POSITION 31 December 2008 and 2007Expressed in Thousands of United States Dollars (Note B)
2008 2007
ASSETS
DUE FROM BANKS (Note B) $ 1,446 $ 1,240
INVESTMENTS (Notes B, C, and G) Government and government-guaranteed obligations $ 6,104 $ – Time deposits 8,199 39,925 Corporate bonds 24,973 39,276 – 39,925
ACCRUED REVENUE 154 61
ADVANCES FOR GRANTS (Note B) 335 –
TOTAL $41,211 $41,226
LIABILITIES AND UNCOMMITTED BALANCES
MISCELLANEOUS LIABILITIES (Note D) $ 52 $ 9
UNDISBURSED COMMITMENTS (Notes B, E, and G) 16,571 7,400
UNCOMMITTED BALANCES (RCIF-2) (Notes B and F), represented by: Unrestricted net assets 24,588 33,817
TOTAL $41,211 $41,226
The accompanying notes are an integral part of these financial statements (RCIF-4).

143Annual Report 2008REG
ION
AL C
OO
PERATIO
N A
ND
INTEG
RATIO
N FU
ND
RCIF-2
ASIAN DEVELOPMENT BANK—REGIONAL COOPERATION AND INTEGRATION FUND
STATEMENT OF ACTIVITIES AND CHANGES IN NET ASSETS For the Year Ended 31 December 2008 and For the Period 26 February to 31 December 2007Expressed in Thousands of United States Dollars (Note B)
2008 2007
CHANGES IN UNRESTRICTED NET ASSETS
CONTRIBUTIONS (Notes B and F) $ – $ 40,000
REVENUE From investments (Notes B and C) $ 1,244 $ 1,186 From other sources 34 1,278 40 1,226
Total 1,278 41,226
EXPENSES Technical assistance (Notes B and E) 10,458 7,400 Administrative expenses (Note D) 41 10,499 9 7,409
CONTRIBUTIONS AND REVENUE (LESS THAN) IN EXCESS OF EXPENSES (9,221) 33,817
NET EXCHANGE LOSSES (Note B) (8) –
(DECREASE) INCREASE IN NET ASSETS (9,229) 33,817
NET ASSETS AT BEGINNING OF YEAR 33,817 –
NET ASSETS AT END OF YEAR $ 24,588 $ 33,817
The accompanying notes are an integral part of these financial statements (RCIF-4).

Asian Development Bank144RE
GIO
NA
L C
OO
PERA
TIO
N A
ND
INTE
GRA
TIO
N F
UN
D
RCIF-3
ASIAN DEVELOPMENT BANK—REGIONAL COOPERATION AND INTEGRATION FUND
STATEMENT OF CASH FLOWS For the Year Ended 31 December 2008 and For the Period 26 February to 31 December 2007 Expressed in Thousands of United States Dollars (Note B)
2008 2007
CASH FLOWS FROM OPERATING ACTIVITIES Contributions received $ – $ 40,000 Interest on investments received 962 1,125 Cash received from other sources 34 40 Technical assistance disbursed (1,600) – Administrative and financial expenses paid (28) – Net Cash (Used in) Provided by Operating Activities (632) 41,165 CASH FLOWS FROM INVESTING ACTIVITIES Maturities of investments 730,875 579,875 Acquisition of investments (730,037) (619,800) Net Cash Provided by (Used in) Investing Activities 838 (39,925) Net Increase in Due from Banks 206 1,240 Due from Banks at Beginning of Year 1,240 – Due from Banks at End of Year $ 1,446 $ 1,240
RECONCILIATION OF (DECREASE) INCREASE IN NET ASSETS TO NET CASH (USED IN) PROVIDED BY OPERATING ACTIVITIES: (Decrease) Increase in net assets (RCIF-2) $ (9,229) $ 33,817 Adjustments to reconcile (decrease) increase in net assets to net cash (used in) provided by operating activities: Amortization of discounts/premiums on investments (132) – Change in accrued revenue (93) (61) Change in accrued expenses 6 9 Change in interfund payables 37 – Change in advances for grants (343) – Change in undisbursed commitments 9,171 7,400 Change in unrealized investment holding gains (57) – Translation adjustments 8 – Net Cash (Used in) Provided by Operating Activities $ (632) $ 41,165
The accompanying notes are an integral part of these financial statements (RCIF-4).

ASIAN DEVELOPMENT BANK—REGIONAL COOPERATION AND INTEGRATION FUND
NOTES TO FINANCIAL STATEMENTS31 December 2008 and 2007
145Annual Report 2008
RCIF-4
REGIO
NA
L CO
OPERATIO
N A
ND
INTEG
RATION
FUN
D
NOTE A—NATURE OF OPERATIONS
The Regional Cooperation and Integration Fund (RCIF),
together with Regional Cooperation and Integration
(RCI)Trust Funds, was established on 26 February
2007 under the “umbrella” of Regional Cooperation and
Integration Financing Partnership Facility (RCIFPF),
in response to the increasing demand for regional coop-
eration and integration activities among ADB’s member
countries in Asia and the Pacific. Its main objective is to
enhance regional cooperation and integration in Asia and
the Pacific by facilitating the pooling and provision of
additional financial and knowledge resources to support
RCI activities.
Financial assistance will be provided in the form
of untied grants for technical assistance (TA), including
advisory, project preparatory, and regional TA.
RCIF’s resources may consist of contributions from
ADB and other bilateral, multilateral, and individual
sources, including companies and foundations.
NOTE B—SUMMARY OF SIGNIFICANT ACCOUNTING POLICIES
Presentation of the Financial Statements
The financial statements of the RCIF are presented on
the basis of those for not-for-profit organizations.
RCIF reports donors’ contributions of cash and
other assets as unrestricted assets as these are made
available to RCIF without conditions other than for the
purpose of pursuing its objectives.
Functional and Reporting Currency
The United States dollar is the functional and report-
ing currency, representing the currency of the primary
economic operating environment of RCIF.
Translation of Currencies
ADB adopts the use of daily exchange rates for account-
ing and financial reporting purposes. This allows transac-
tions denominated in non-US dollar to be translated to
the reporting currency using exchange rates applicable
at the time of transactions. Contributions included in
the financial statements during the year are recognized
at applicable exchange rates as of the respective dates
of commitment. At the end of each accounting month,
translations of assets, liabilities, and uncommitted
balances which are denominated in non-US dollar are
adjusted using the applicable rates of exchange at the
end of the reporting period. These translation adjust-
ments are accounted for as exchange gains or losses and
are credited or charged to operations.
Investments
All investment securities held by RCIF are reported at
estimated fair value, which represents their fair market
value. Realized and unrealized gains and losses are in-
cluded in revenue. Time deposits are reported at cost
which is a reasonable estimate of fair value.
Interest income on investment securities and time
deposits are recognized as realized and reported, net of
amortizations of premiums and discounts.
Contributions
The contributions from donors and allocations from the
net income of Ordinary Capital Resources are included
in the financial statements, from the date of effectivity of
the contributions agreement, and the Board of Governors’
approval, respectively.
Technical Assistance, Grants and Undisbursed Commitments
Technical assistance is recognized in the financial
statements when the project is approved and becomes
effective. Upon completion of the project or cancellation
of a technical assistance, any undisbursed amount is writ-
ten back as a reduction in technical assistance for the
year and the corresponding undisbursed commitment is
eliminated accordingly.
Advances are provided from technical assistance
grant funds to the executing agency or co-operating
institution, for the purpose of making payments for
eligible expenses. The advances shall be subject to
liquidation and charged against undisbursed commitment,
any unutilized portion shall be refunded to the fund.
Accounting Estimates
The preparation of financial statements in conformity
with generally accepted accounting principles requires

ASIAN DEVELOPMENT BANK—REGIONAL COOPERATION AND INTEGRATION FUND
NOTES TO FINANCIAL STATEMENTS31 December 2008 and 2007
Asian Development Bank146RE
GIO
NA
L C
OO
PERA
TIO
N A
ND
INTE
GRA
TIO
N F
UN
D
Management to make reasonable estimates and assump-
tions that affect the reported amounts of assets and
liabilities and uncommitted balances as at the end of the
year and the reported amounts of revenue and expenses
during the year. The actual results could differ from
those estimates.
Statement of Cash Flows
For the purposes of the Statement of Cash Flows, RCIF
considers that its cash and cash equivalents are limited
to “DUE FROM BANKS.”
NOTE C—INVESTMENTS
The main investment management objective is to main-
tain security and liquidity. Subject to these parameters,
ADB seeks the highest possible return on its investments.
Investments are governed by the Investment Authority
approved by the Board of Directors in 1999, and reviewed
in 2006. The review endorsed a portfolio strategy that is
largely consistent with the 1999 approach.
Investment securities and negotiable certificate
of deposits held as of 31 December 2008 are considered
“Available for Sale” and are reported at fair value, which
represents their fair market value. Unrealized gains and
losses are included in revenue from investments.
The annualized rate of return on the average
investments held during the period ended 31 December
2008, based on the portfolio held at the beginning and
end of each month, was 3.12% (5.31% - 2007).
NOTE D—RELATED PARTY TRANSACTIONS
The OCR and special fund resources are at all times
used, committed, and invested entirely separate from
each other. Regional technical assistance projects and
programs may be combined activities between special
and trust funds. The administrative and operational ex-
penses pertaining to RCIF are settled on a regular basis
between RCIF and the other funds. As of 31 December
2008, $15,000 (nil-2007) and $22,000 (nil-2007) was pay-
able to OCR and TASF, respectively, which are included
in miscellaneous liabilities.
NOTE E— TECHNICAL ASSISTANCE AND UNDISBURSED COMMITMENTS
During the year, there were thirteen (four technical as-
sistance (TA) and one supplementary approval – 2007)
TA grants totaling $10,458,000 ($7,400,000 – 2007)
which became effective.
Undisbursed commitments are denominated
in United States dollars and represent technical
assistance not yet disbursed. The fair value of
undisbursed commitments approximates the amounts
outstanding, because ADB expects that disbursements
will substantially be made for all the projects/programs
covered by the commitments.
NOTE F— CONTRIBUTIONS AND UNCOMMITTED BALANCES
In May 2007, the Board of Governors approved the al-
location of $40,000,000 to the RCIF from the 2006 OCR
net income.
Uncommitted balances comprised of amounts
which have not been committed by ADB as at 31
December 2008.
NOTE G—FAIR VALUE MEASUREMENTS
FAS 157 defines fair value as the price that would be
received to sell an asset or paid to transfer a liability at
measurement date (exit price) in an orderly transaction
among willing participants with an assumption that the
transaction takes place in the entity’s principal market,
the most advantageous market for the asset or liability.
The most advantageous market is the market where the
sale of the asset or transfer of liability would maximize the
amount received for the asset or minimize the amount
paid to transfer the liability. The fair value measurement
is not adjusted for transaction cost.
FAS 157 also establishes a fair value hierarchy
that gives the highest priority to quoted prices in
active markets for identical assets or liabilities (Level
1), next priority to observable market inputs or market
corroborated data (Level 2), and the lowest priority to
unobservable inputs without market corroborated data
(Level 3). FAS 157 requires the fair value measurement
to maximize the use of market observable inputs.
The following guidelines are applied in determining
the fair values of financial instruments:

ASIAN DEVELOPMENT BANK—REGIONAL COOPERATION AND INTEGRATION FUND
NOTES TO FINANCIAL STATEMENTS31 December 2008 and 2007
147Annual Report 2008
RCIF-4
REGIO
NA
L CO
OPERATIO
N A
ND
INTEG
RATION
FUN
D
Fair Value Measurements Quoted Prices in Significant Significant Active Markets for Other Observable Unobservable Identical Assets Inputs Inputs 31 December 2008 (Level 1) (Level 2) (Level 3)
Assets Investments $39,276,000 $ – $39,276,000 $ –
Investments
Readily marketable investments are fair valued using
active market quotes in Level 1 category. Level 2 cat-
egory includes investments which are fair valued with
significant other market observable inputs.
See Notes C and E for discussions relating to
investments and undisbursed commitments. In all other
cases, the carrying amount of RCIF’s assets, liabilities
The fair values of the following financial assets of
RCIF as of 31 December 2008 were reported based on
the following:
and uncommitted balances are considered to approximate
fair values for all significant financial instruments.
CONTINUED

Asian Development Bank148C
LIM
ATE
CH
AN
GE
FUN
D
CLIMATE CHANGE FUND
Management's Report on Internal Control over Financial Reporting
The management of Asian Development Bank (“ADB”) is responsible for establishing and
maintaining adequate internal control over financial reporting. ADB's internal control over
financial reporting is a process designed to provide reasonable assurance regarding the reliabil-
ity of financial reporting and the preparation of financial statements for external purposes in
accordance with generally accepted accounting principles in the United States of America.
ADB's internal control over financial reporting includes those policies and procedures that
(i) pertain to the maintenance of records that, in reasonable detail, accurately and fairly re-
flect the transactions and dispositions of the assets of ADB; (ii) provide reasonable assurance
that transactions are recorded as necessary to permit preparation of financial statements in
accordance with generally accepted accounting principles, and that receipts and expenditures
of ADB are being made only in accordance with authorizations of management and directors
of ADB; and (iii) provide reasonable assurance regarding prevention or timely detection of
unauthorized acquisition, use or disposition of ADB's assets that could have a material effect
on the financial statements.
Because of its inherent limitations, internal control over financial reporting may not prevent
or detect misstatements. Also, projections of any evaluation of effectiveness to future periods
are subject to the risk that controls may become inadequate because of changes in conditions,
or that the degree of compliance with the policies or procedures may deteriorate.
ADB's management assessed the effectiveness of ADB's internal control over financial report-
ing as of 31 December 2008. In making this assessment, ADB's management used the criteria
set forth by the Committee of Sponsoring Organizations of the Treadway Commission in
Internal Control – Integrated Framework. Based on that assessment, management believes that as
of 31 December 2008, ADB's internal control over financial reporting is effective based upon
the criteria established in Internal Control – Integrated Framework.
Haruhiko Kuroda
President
Bindu N. Lohani
Vice President (Finance and Administration)
Hong-Sang Jung
Controller
5 March 2009

149Annual Report 2008C
LIMA
TE CH
AN
GE FU
ND
Report of Independent Auditors to the Asian Development Bank
In our opinion, the accompanying statements of financial position and the related statements of activities
and changes in net assets and cash flows present fairly, in all material respects, the financial position
of the Asian Development Bank (“ADB” or “the Bank”)—Climate Change Fund at 31 December 2008,
and the results of its activities and changes in net assets and its cash flows for the period from 7 April
2008 (establishment of the Fund) to 31 December 2008, in conformity with accounting principles
generally accepted in the United States of America. Also in our opinion, management’s assertion that
ADB maintained, effective internal control over financial reporting as of 31 December 2008 is fairly
stated, in all material respects, based on criteria established in Internal Control – Integrated Frame-
work issued by the Committee of Sponsoring Organizations of the Treadway Commission (COSO).
The management of ADB is responsible for these financial statements, for maintaining effective
internal control over financial reporting and for its assertion of the effectiveness of internal control
over financial reporting, included in the accompanying Management's Report on Internal Control over
Financial Reporting. Our responsibility is to express opinions on these financial statements and on
ADB’s internal control over financial reporting based on our integrated audit in 2008. We conducted
our audits of the financial statements in accordance with auditing standards generally accepted in
the United States of America and our audit of internal control over financial reporting in accordance
with attestation standards established by the American Institute of Certified Public Accountants.
Those standards require that we plan and perform the audits to obtain reasonable assurance about
whether the financial statements are free of material misstatement and whether effective internal
control over financial reporting was maintained in all material respects. Our audits of the financial
statements included examining, on a test basis, evidence supporting the amounts and disclosures in
the financial statements, assessing the accounting principles used and significant estimates made
by management, and evaluating the overall financial statement presentation. Our audit of internal
control over financial reporting included obtaining an understanding of internal control over financial
reporting, assessing the risk that a material weakness exists, and testing and evaluating the design
and operating effectiveness of internal control based on the assessed risk. Our audits also included
performing such other procedures as we considered necessary in the circumstances. We believe that
our audits provide a reasonable basis for our opinions.
PricewaterhouseCoopers LLPpwc.com/sg 8 Cross Street #17-00PWC BuildingSingapore 048424Telephone (65) 6236 3388Facsimile (65) 6236 3300
GST No.: M90362193L Reg. No.: T09LL0001D
PricewaterhouseCoopers LLP (Registration No. T09LL0001D) is an accounting limited liability partnership registered in Singapore under the Limited Liability Partner-ships Act (Chapter 163A). It was converted from a partnership (with the name “PricewaterhouseCoopers” and Registration no. 000640) to an accounting limited liability partnership on 1 January 2009. PricewaterhouseCoopers LLP is part of the network of member firms of PricewaterhouseCoopers International Limited, each of which is a separate and independent legal entity.

Asian Development Bank150C
LIM
ATE
CH
AN
GE
FUN
D
A company’s internal control over financial reporting is a process effected by those charged with
governance, management, and other personnel, designed to provide reasonable assurance regarding
the preparation of reliable financial statements in accordance with accounting principles generally
accepted in the United States of America. A company’s internal control over financial reporting in-
cludes those policies and procedures that (i) pertain to the maintenance of records that, in reasonable
detail, accurately and fairly reflect the transactions and dispositions of the assets of the company;
(ii) provide reasonable assurance that transactions are recorded as necessary to permit preparation of
financial statements in accordance with generally accepted accounting principles, and that receipts and
expenditures of the company are being made only in accordance with authorizations of management
and those charged with governance; and (iii) provide reasonable assurance regarding prevention, or
timely detection of unauthorized acquisition, use, or disposition of the company’s assets that could
have a material effect on the financial statements.
Because of its inherent limitations, internal control over financial reporting may not prevent or detect
misstatements. Also, projections of any evaluation of effectiveness to future periods are subject to
the risk that controls may become inadequate because of changes in conditions, or that the degree
of compliance with the policies or procedures may deteriorate.
PricewaterhouseCoopers LLP
Public Accountants and Certified Public Accountants
Singapore
5 March 2009

151Annual Report 2008C
LIMA
TE CH
AN
GE FU
ND
CCF-1
ASIAN DEVELOPMENT BANK—CLIMATE CHANGE FUND
STATEMENT OF FINANCIAL POSITION 31 December 2008Expressed in Thousands of United States Dollars (Note B)
ASSETS
DUE FROM BANKS (Note B) $ 1,564
INVESTMENTS (Notes B, C, and G) Time deposits $ 10,921 Corporate obligations 27,973 38,894
ACCRUED REVENUE 50
TOTAL $ 40,508
LIABILITIES AND UNCOMMITTED BALANCES
MISCELLANEOUS LIABILITIES (Note D) $ 81
UNDISBURSED COMMITMENTS (Notes B, E, and G) 3,000
UNCOMMITTED BALANCES (CCF-2) (Notes B and F), represented by: Unrestricted net assets 37,427
TOTAL $ 40,508
The accompanying notes are an integral part of these financial statements (CCF-4).

Asian Development Bank152C
LIM
ATE
CH
AN
GE
FUN
D
CCF-2
ASIAN DEVELOPMENT BANK—CLIMATE CHANGE FUND
STATEMENT OF ACTIVITIES AND CHANGES IN NET ASSETS For the Period 7 April to 31 December 2008 Expressed in Thousands of United States Dollars (Note B)
CHANGES IN UNRESTRICTED NET ASSETS
CONTRIBUTIONS (Notes B and F) $ 40,000
REVENUE From investments (Notes B and C) 545 From other sources 9
Total 40,554 EXPENSES Administrative expenses (Note D) 124 Technical assistance (Note B) 3,000
Total 3,124 CONTRIBUTIONS AND REVENUE IN EXCESS OF EXPENSES 37,430 NET EXCHANGE LOSSES (Note B) (3)
NET ASSETS AT END OF PERIOD $ 37,427
The accompanying notes are an integral part of these financial statements (CCF-4).
153Annual Report 2008C
LIMA
TE CH
AN
GE FU
ND
CCF-3
ASIAN DEVELOPMENT BANK—CLIMATE CHANGE FUND
STATEMENT OF CASH FLOWS For the Period 7 April to 31 December 2008 Expressed in Thousands of United States Dollars (Note B)
CASH FLOWS FROM OPERATING ACTIVITIES Contributions received $ 40,000 Interest on investments received 315 Administrative expenses paid (46) Cash received from other sources 9 Net Cash Provided by Operating Activities 40,278 CASH FLOWS FROM INVESTING ACTIVITIES Maturities of investments 336,872 Acquisition of investments (375,586) Net Cash Used in Investing Activities (38,714) Due from Banks at End of Period $ 1,564
RECONCILIATION OF INCREASE IN NET ASSETS TO NET CASH PROVIDED BY OPERATING ACTIVITIES:
Increase in net assets (CCF-2) $ 37,427 Adjustments to reconcile increase in net assets to net cash provided by operating activities: Amortization of discounts on investments (180) Change in accrued revenue (50) Change in miscellaneous assets (0) Change in miscellaneous liabilities 78 Change in undisbursed commitments 3,000 Translation adjustments 3 Net Cash Provided by Operating Activities $ 40,278
0 - Less than $500.The accompanying notes are an integral part of these financial statements (CCF-4).

ASIAN DEVELOPMENT BANK—CLIMATE CHANGE FUND
NOTES TO FINANCIAL STATEMENTSFor the Period 7 April to 31 December 2008
Asian Development Bank154C
LIM
ATE
CH
AN
GE
FUN
D
NOTE A—NATURE OF OPERATIONS
The Climate Change Fund (CCF) was established on 7
April 2008 to facilitate greater investments in developing
member countries (DMCs) to address the causes and
consequences of climate change alongside ADB’s own
assistance in various related sectors. The CCF will be a
key mechanism to pool resources within ADB to address
climate change through (i) technical assistance (TA),
(ii) investment components for both private and public
sector projects, and (iii) any other form of cooperation
that partners and ADB may agree upon for a defined
program of activities.
Financial assistance will be provided in the form
of untied grants for components of investment projects,
for advisory, project preparatory, and regional technical
assistance (TA); as well as for any other activities that
may be agreed between external contributors and ADB.
CCF’s resources may consist of contributions from
ADB and other bilateral, multilateral, and individual
sources, including companies and foundations.
NOTE B— SUMMARY OF SIGNIFICANT ACCOUNTING POLICIES
Presentation of the Financial Statements
The financial statements of the CCF are presented on
the basis of those for not-for-profit organizations.
CCF reports donors’ contributions of cash and other
assets as unrestricted assets as these are made available
to CCF without conditions other than for the purpose of
pursuing its objectives.
Functional and Reporting Currency
The United States dollar is the functional and report-
ing currency, representing the currency of the primary
economic operating environment of CCF.
Translation of Currencies
ADB adopts the use of daily exchange rates for account-
ing and financial reporting purposes. This allows transac-
tions denominated in non-US dollar to be translated to
the reporting currency using exchange rates applicable
at the time of transactions. Contributions included in
the financial statements during the year are recognized
at applicable exchange rates as of the respective dates
of commitment. At the end of each accounting month,
translations of assets, liabilities, and uncommitted
balances which are denominated in non-US dollar are
adjusted using the applicable rates of exchange at the
end of the reporting period. These translation adjust-
ments are accounted for as exchange gains or losses and
are credited or charged to operations.
Investments
All investment securities held by CCF are reported at
estimated fair value, which represents their fair market
value. Realized and unrealized gains and losses are in-
cluded in revenue. Time deposits are reported at cost
which is a reasonable estimate of fair value.
Interest income on investment securities and time
deposits are recognized as realized and reported, net of
amortizations of premiums and discounts.
Contributions
The contributions from donors and the allocations from
net income of Ordinary Capital Resources are included
in the financial statements, from the date of effectivity of
the contributions agreement, and the Board of Governors'
approval, respectively.
Technical Assistance and Undisbursed Commitments
Technical assistance is recognized in the financial
statements when the project is approved and becomes
effective. Upon completion of the project or cancellation
of a technical assistance, any undisbursed amount is writ-
ten back as a reduction in technical assistance for the
year and the corresponding undisbursed commitment is
eliminated accordingly.
Accounting Estimates
The preparation of financial statements in conformity
with generally accepted accounting principles requires
Management to make reasonable estimates and assump-
tions that affect the reported amounts of assets and
liabilities and uncommitted balances as at the end of the
year and the reported amounts of revenue and expenses
during the year. The actual results could differ from
those estimates.

CCF-4
ASIAN DEVELOPMENT BANK—CLIMATE CHANGE FUND
NOTES TO FINANCIAL STATEMENTSFor the Period 7 April to 31 December 2008
155Annual Report 2008C
LIMATE C
HA
NG
E FUN
D
Statement of Cash Flows
For the purposes of the Statement of Cash Flows, CCF
considers that its cash and cash equivalents are limited
to “DUE FROM BANKS.”
NOTE C—INVESTMENTS
The main investment management objective is to main-
tain security and liquidity. Subject to these parameters,
ADB seeks the highest possible return on its investments.
Investments are governed by the Investment Authority
approved by the Board of Directors in 1999, and reviewed
in 2006. The review endorsed a portfolio strategy that is
largely consistent with the 1999 approach.
Investment securities and negotiable certificate
of deposits held as of 31 December 2008 are considered
“Available for Sale” and are reported at fair value, which
represents their fair market value. Unrealized gains and
losses are included in revenue from investments.
Interest on investment securities and time
deposits are recognized as realized and reported net of
amortizations of premiums and discounts.
The annualized rate of return on the average
investments held during the period ended 31 December
2008, based on the portfolio held at the beginning and
end of each month, was 2.59%.
NOTE D—RELATED PARTY TRANSACTIONS
The OCR and special fund resources are at all times used,
committed, and invested entirely separate from each
other. The administrative and operational expenses per-
taining to CCF are settled on a regular basis between OCR
and CCF. As of 31 December 2008, $6,000 was payable to
OCR which is included in miscellaneous liabilities.
NOTE E—UNDISBURSED COMMITMENTS
Undisbursed commitments are denominated in United
States dollars and represent technical assistance not yet
disbursed. The fair value of undisbursed commitments
approximates the amounts outstanding, because ADB
expects that disbursements will substantially be made for
all the projects/programs covered by the commitments.
NOTE F— CONTRIBUTIONS AND UNCOMMITTED BALANCES
In May 2008, the Board of Governors approved the al-
location of $40,000,000 to the CCF from the 2007 OCR
net income.
Uncommitted balances comprised of amounts
which have not been committed by ADB as at 31
December 2008.
NOTE G—FAIR VALUE MEASUREMENTS
FAS 157 defines fair value as the price that would be
received to sell an asset or paid to transfer a liability at
measurement date (exit price) in an orderly transaction
among willing participants with an assumption that the
transaction takes place in the entity’s principal market,
the most advantageous market for the asset or liability.
The most advantageous market is the market where the
sale of the asset or transfer of liability would maximize the
amount received for the asset or minimize the amount
paid to transfer the liability. The fair value measurement
is not adjusted for transaction cost.
FAS 157 also establishes a fair value hierarchy
that gives the highest priority to quoted prices in
active markets for identical assets or liabilities (Level
1), next priority to observable market inputs or market
corroborated data (Level 2), and the lowest priority to
unobservable inputs without market corroborated data
(Level 3). FAS 157 requires the fair value measurement
to maximize the use of market observable inputs.
The following guidelines are applied in determining
the fair values of financial instruments:
Investments
Readily marketable investments are fair valued using
active market quotes in Level 1 category. Level 2 cat-
egory includes investments which are fair valued with
significant other market observable inputs.
CONTINUED

ASIAN DEVELOPMENT BANK—CLIMATE CHANGE FUND
NOTES TO FINANCIAL STATEMENTSFor the Period 7 April to 31 December 2008
Asian Development Bank156C
LIM
ATE
CH
AN
GE
FUN
D
The fair value of the following financial assets of CCF as of 31 December 2008 were reported based on the
following:
Fair Value Measurements Quoted Prices in Significant Significant Active Markets for Other Observable Unobservable Identical Assets Inputs Inputs 31 December 2008 (Level 1) (Level 2) (Level 3) Assets Investments $38,894,000 $ – $38,894,000 $ –
CCF-4
See Notes C and E for discussions relating to
investments and undisbursed commitments. In all other
cases, the carrying amount of CCF’s assets, liabilities and
uncommitted balances are considered to approximate
fair values for all significant financial instruments.

STA
TIST
ICA
L A
NN
EXES
Asian Development Bank158

STATISTIC
AL A
NN
EXES157Annual Report 2008
STATISTICAL ANNEXES

STATISTIC
AL A
NN
EXES159Annual Report 2008
Statistical Annex 1 SOVEREIGN AND NONSOVEREIGN LOAN APPROVALS BY COUNTRY, 2008 ($ million)
Total Date OCR ADF Total Project Costa Approved
SOVEREIGN Armenia Rural Road Sector (Supplementary) – 17.32 17.32 23.44 7 Nov
Subtotal – 17.32 17.32 23.44
Azerbaijan
Road Network Development Program – Tranche 2 55.40 – 55.40 73.90 22 Aug Power Transmission Enhancement 160.00 – 160.00 240.00 10 Sep
Subtotal 215.40 – 215.40 313.90
Bangladesh Emergency Disaster Damage Rehabilitation (Sector) – 120.00 120.00 220.00 31 Jan Skills Development – 50.00 50.00 66.70 6 Jun Emergency Assistance for Food Security – 170.00 170.00 1,293.00 22 Jul Public-Private Infrastructure Development Facility 82.00 83.00 165.00 925.00 2 Oct Second Urban Governance and Infrastructure Improvement (Sector) – 87.00 87.00 167.50 28 Oct
Subtotal 82.00 510.00 592.00 2,672.20
Bhutan Green Power Development 51.00 29.00 80.00 234.45 29 Oct
Subtotal 51.00 29.00 80.00 234.45
Cambodia Road Asset Management – 6.00 6.00 58.35 21 Jan Emergency Food Assistance – 17.50 17.50 40.08 2 Oct Financial Sector Program II Cluster (Subprogram 2) – 10.30 10.30 10.30 5 Dec Promoting Economic Diversification Program (Subprogram 1) – 20.00 20.00 22.00 5 Dec
Subtotal – 53.80 53.80 130.73
China, People’s Republic of Gansu Baiyin Urban Development 80.00 – 80.00 161.53 23 Jan Gansu Heihe Rural Hydropower Development Investment Program – Tranche 2: Dagushan Hydropower Project 28.00 – 28.00 61.92 28 Jan Xinjiang Municipal Infrastructure and Environmental Improvement 105.00 – 105.00 190.90 23 Apr Guangdong Energy Efficiency and Environment Improvement Investment Program – Tranche 1 35.00 – 35.00 50.00 9 Jun Integrated Ecosystem and Water Resources Management in the Baiyangdian Basin 100.00 – 100.00 273.38 24 Jun Ningxia Integrated Ecosystem and Agricultural Development 100.00 – 100.00 221.02 29 Aug Central Yunnan Roads Development 200.00 – 200.00 745.00 25 Sep Lanzhou–Chongqing Railway Development 300.00 – 300.00 8,608.90 18 Nov Dryland Sustainable Agriculture 83.00 – 83.00 204.69 25 Nov Chongqing–Lichuan Railway Development 150.00 – 150.00 3,071.10 8 Dec Songhua River Basin Water Pollution Control and Management 200.00 – 200.00 396.33 11 Dec Guangxi Wuzhou Urban Development 100.00 – 100.00 263.40 15 Dec Qingdao Water Resources and Wetland Protection 45.00 – 45.00 105.80 17 Dec
Subtotal 1,526.00 – 1,526.00 14,353.96
– = nil, ADF = Asian Development Fund, OCR = ordinary capital resources.a Total project cost includes financing by ADB, governments, beneficiaries, and subborrowers; cofinancing from official, export credit, and commercial sources; equity
sponsors; and local participating private companies and financial institutions.

STA
TIST
ICA
L A
NN
EXES
Asian Development Bank160
Total Date OCR ADF Total Project Costa Approved
CONTINUED
Cook Islands Avatiu Port Development 8.63 6.88 15.51 18.19 20 Nov
Subtotal 8.63 6.88 15.51 18.19
Georgia Municipal Services Development – 40.00 40.00 63.25 12 Sep Emergency Assistance for Post-Conflict Recovery – 70.00 70.00 70.00 12 Nov
Subtotal – 110.00 110.00 133.25
India Uttarakhand Urban Sector Development Investment Program – Tranche 1 60.00 – 60.00 85.70 1 Feb Rural Roads Sector II Investment Program – Tranche 2 77.65 – 77.65 100.46 17 Mar National Power Grid Development Investment Program – Tranche 1 400.00 – 400.00 429.42 28 Mar Assam Governance and Public Resource Management Sector Development Program (Subprogram II) 100.00 – 100.00 100.00 17 Sep Bihar State Highways 420.00 – 420.00 468.00 18 Sep Orissa Integrated Irrigated Agriculture and Water Management Investment Program – Tranche 1 47.20 – 47.20 67.50 26 Sep Rural Roads Sector II Investment Program – Tranche 3 130.00 – 130.00 168.80 26 Sep Khadi Reform and Development Program 150.00 – 150.00 150.00 2 Oct Urban Water Supply and Environmental Improvement in Madhya Pradesh (Supplementary) 71.00 – 71.00 108.00 13 Oct Uttarakhand State-Road Investment Program – Tranche 2 140.00 – 140.00 200.00 22 Oct Himachal Pradesh Clean Energy Development Investment Program – Tranche 1 150.00 – 150.00 224.80 27 Oct Uttarakhand Power Sector Investment Program – Tranche 2 62.40 – 62.40 89.14 23 Dec
Subtotal 1,808.25 – 1,808.25 2,191.82 Indonesia Vocational Education Strengthening – 80.00 80.00 115.00 31 Mar Rural Infrastructure Support to PNPM Mandiri – 50.00 50.00 62.50 29 Sep Infrastructure Reform Sector Development Program (Subprogram 2) 280.00 – 280.00 280.00 27 Nov Second Local Government Finance and Governance Reform Program Cluster (Subprogram 1) 350.00 – 350.00 350.00 4 Dec Fourth Development Policy Support Program 200.00 – 200.00 200.00 16 Dec Integrated Citarum Water Resources Management Investment Program – Tranche 1 20.00 30.00 50.00 88.63 22 Dec
Subtotal 850.00 160.00 1,010.00 1,096.13
Kazakhstan CAREC Transport Corridor I (Zhambyl Oblast Section) [Western Europe–Western People’s Republic of China International Transit Corridor] Investment Program – Tranche 1 340.00 – 340.00 400.00 30 Dec
Subtotal 340.00 – 340.00 400.00
Maldives Private Sector Development – 7.50 7.50 7.80 20 Jun
Subtotal – 7.50 7.50 7.80
– = nil, ADF = Asian Development Fund, CAREC = Central Asia Regional Economic Cooperation, OCR = ordinary capital resources, PNPM = Program Nasional Pemberdayaan Masyarakat (National Program for Community Empowerment).a Total project cost includes financing by ADB, governments, beneficiaries, and subborrowers; cofinancing from official, export credit, and commercial sources; equity
sponsors; and local participating private companies and financial institutions.

STATISTIC
AL A
NN
EXES161Annual Report 2008
Total Date OCR ADF Total Project Costa Approved
Pakistan Barani Integrated Water Resources Sector 55.00 20.00 75.00 104.50 3 Mar Preparing the Lahore Rapid Mass Transit System – 6.00 6.00 7.50 4 Jun Power Distribution Enhancement Investment Program – Tranche 1 242.00 10.00 252.00 327.00 12 Sep Accelerating Economic Transformation Program (Subprogram 1) 300.00 200.00 500.00 500.00 30 Sep Second Balochistan Resource Management Program (Subprogram 1) 45.00 55.00 100.00 100.00 11 Dec Sindh Growth and Rural Revitalization Program (Subprogram 1) – 100.00 100.00 100.00 11 Dec Punjab Millennium Development Goals Program (Subprogram 1) – 100.00 100.00 100.00 11 Dec Sindh Cities Improvement Investment Program – Tranche 1 – 38.00 38.00 50.00 19 Dec
Subtotal 642.00 529.00 1,171.00 1,289.00
Papua New Guinea Highlands Region Road Improvement Investment Program – Tranche 1b – 100.00 100.00 140.00 22 Dec
Subtotal – 100.00 100.00 140.00
Philippines Development Policy Support Program (Subprogram 2) 250.00 – 250.00 250.00 30 Sep Agrarian Reform Communities Project II 70.00 – 70.00 208.40 27 Oct Governance in Justice Sector Reform Program (Subprogram 1) 300.00 – 300.00 300.00 16 Dec
Subtotal 620.00 – 620.00 758.40
Samoa Sanitation and Drainage (Supplementary) – 2.78 2.78 7.81 12 Sep
Subtotal – 2.78 2.78 7.81
Sri Lanka Southern Transport Development (Supplementary) 90.00 – 90.00 179.10 6 Mar Dry Zone Urban Water and Sanitation – 59.78 59.78 113.33 28 Nov
Subtotal 90.00 59.78 149.78 292.43
Uzbekistan Surkhandarya Water Supply and Sanitation – 30.00 30.00 40.00 3 Nov Water Resources Management Sector 85.00 15.00 100.00 148.00 17 Dec
Subtotal 85.00 45.00 130.00 188.00
Viet Nam Song Bung 4 Hydropower 196.00 – 196.00 267.30 26 Jun Ho Chi Minh City–Long Thanh–Dau Giay Expressway Construction 410.20 – 410.20 932.40 30 Sep Greater Mekong Subregion Sustainable Tourism Development – 10.00 10.00 11.11 15 Oct Greater Mekong Subregion: Ha Noi–Lang Son, Greater Mekong Subregion: Ha Long–Mong Cai, and Ben Luc-Long Thanh Expressways Technical Assistance – 26.00 26.00 30.80 23 Oct Health Care in the South Central Coast Region – 72.00 72.00 80.00 7 Nov Emergency Rehabilitation of Calamity Damage (Supplementary) – 25.50 25.50 30.00 8 Dec Support for the Implementation of the Poverty Reduction Program V (Subprogram 1) – 25.00 25.00 32.14 8 Dec
Subtotal 606.20 158.50 764.70 1,383.75
Total Sovereign 6,924.48 1,789.56 8,714.04 25,635.26 – = nil, ADF = Asian Development Fund, OCR = ordinary capital resources.a Total project cost includes financing by ADB, governments, beneficiaries, and subborrowers; cofinancing from official, export credit, and commercial sources; equity
sponsors; and local participating private companies and financial institutions.b Consists of two ADF loans.

STA
TIST
ICA
L A
NN
EXES
Asian Development Bank162
Total Date OCR ADF Total Project Costa Approved
CONTINUED
NONSOVEREIGN Afghanistan Roshan Expansion (Phase III) 60.00 – 60.00 175.00 29 Jul
Subtotal 60.00 – 60.00 175.00
China, People’s Republic of Municipal District Energy Infrastructure Development 200.00 – 200.00 1,285.14 2 Jun Inner Mongolia Wind Power 24.08 – 24.08 73.42 4 Sep
Subtotal 224.08 – 224.08 1,358.56
India Gujarat Paguthan Wind Energy Financing Facility (Samana Phase I) 45.00 – 45.00 67.64 17 Apr Mundra Ultra Mega Power 450.00 – 450.00 4,226.75 17 Apr CLP Wind Farms Private Limited (Samana Phase II and the Saundatti Project) 60.00 – 60.00 169.13 17 Apr GTL Infrastructure Limited Phase II Telecommunication Infrastructure 150.00 – 150.00 1,184.54 23 May National Highway 1 Panipat–Jalandhar Toll Road 100.00 – 100.00 1,067.00 23 Oct Columbia Asia Hospitals Development 38.64 – 38.64 154.55 10 Nov Rural Electrification Corporation of India 225.00 – 225.00 225.00 27 Nov
Subtotal 1,068.64 – 1,068.64 7,094.61
Indonesia Bank Mandiri (Persero) 75.00 – 75.00 300.00 29 Jul
Subtotal 75.00 – 75.00 300.00
Maldives Housing Development Finance Corporation 7.50 – 7.50 33.00 9 Apr
Subtotal 7.50 – 7.50 33.00
Philippines Acquisition and Rehabilitation of the Masinloc Coal-Fired Thermal Power Plant 200.00 – 200.00 1,100.00 15 Jan Privatization and Refurbishment of the Calaca Coal-Fired Thermal Power Plant 120.00 – 120.00 890.00 2 Jun
Subtotal 320.00 – 320.00 1,990.00
Viet Nam Saigon Thuong Tin Bank (Sacombank) 25.00 – 25.00 25.00 10 Dec
Subtotal 25.00 – 25.00 25.00
Total Nonsovereign 1,780.23 – 1,780.23 10,976.18
TOTAL 8,704.71 1,789.56 10,494.27 36,611.44 – = nil, ADF = Asian Development Fund, OCR = ordinary capital resources.a Total project cost includes financing by ADB, governments, beneficiaries, and subborrowers; cofinancing from official, export credit, and commercial sources; equity
sponsors; and local participating private companies and financial institutions.

STATISTIC
AL A
NN
EXES163Annual Report 2008
Statistical Annex 2 GRANT-FINANCED PROJECT APPROVALS BY COUNTRY, 2008 ($ million)
Date ADF Other Sourcesa Total Approved
Afghanistan Agriculture Market Infrastructure 30.00 – 30.00 21 Nov Development of Mini Hydropower Plants in Badakhshan and Bamyan Provinces – 12.00 JFPR 12.00 28 Nov Energy Sector Development Investment Program – Tranche 1 164.00 – 164.00 2 Dec Road Network Development Investment Program – Tranche 1 60.00 – 60.00 2 Dec
Subtotal 254.00 12.00 266.00
Bangladesh Emergency Disaster Damage Rehabilitation (Sector)a – 10.00 Canada 10.00 28 Mar Post-Literacy and Continuing Education (Supplementary)a – 2.50 Switzerland 2.50 1 Jul Skills Developmenta – 6.00 Switzerland 6.00 17 Dec
Subtotal – 18.50 18.50
Bhutan Green Power Developmenta 25.28 – 25.28 29 Oct Green Power Developmenta – 1.00 ACEF-CEFPF 1.00 26 Dec
Subtotal 25.28 1.00 26.28
Cambodia Road Asset Managementa – 4.80 Australia 4.80 21 Jan Health Sector Support (Supplementary)a – 1.80 United Kingdom 1.80 31 Mar Emergency Food Assistancea 17.50 – 17.50 2 Oct Public Financial Management for Rural Development Program (Subprogram 1) 6.71 – 6.71 4 Dec Public Financial Management for Rural Development Project 4.10 – 4.10 4 Dec Capacity Development in Sanitary and Phytosanitary Standards Management Systemsa 2.00 – 2.00 5 Dec
Subtotal 30.31 6.60 36.91
China, People’s Republic of Capacity Building for Energy Efficiency Implementation – 0.80 CEF-CEFPF 0.80 4 Jun Ningxia Integrated Ecosystem and Agricultural Developmenta – 4.55 GEF 4.55 29 Aug Dryland Sustainable Agriculturea – 0.35 Spain 0.35 25 Nov
Subtotal – 5.70 5.70
Kyrgyz Republic Southern Agriculture Area Development (Supplementary)a – 2.50 GEF 2.50 15 May Investment Climate Improvement Program (Subprogram 1) 12.50 – 12.50 3 Nov Investment Climate Improvement Program System Support Project 2.90 – 2.90 3 Nov Community-Based Infrastructure Services Sector 30.00 – 30.00 3 Nov CAREC Transport Corridor 1 (Bishkek–Torugart Road) 20.00 – 20.00 14 Nov
Subtotal 65.40 2.50 67.90
Lao People’s Democratic Republic Alternative Livelihood for Upland Ethnic Groups in Houaphanh Province – 1.82 JFPR 1.82 13 Feb Greater Mekong Subregion Sustainable Tourism Developmenta 10.00 – 10.00 15 Oct
Subtotal 10.00 1.82 11.82
Micronesia, Federated States of Weno Water Supply Well Remediation – 0.98 JFPR 0.98 17 Jul
Subtotal – 0.98 0.98
Mongolia Western Regional Road Corridor Development – Phase I 37.60 – 37.60 26 Feb Community-Based Local Road Upgrading and Maintenance in the Western Region of Mongolia – 2.00 JFPR 2.00 10 Jul Water Point and Extension Station Establishment for Poor Herding Families – 2.00 JFPR 2.00 30 Jul Poverty Reduction through Community-Based Natural Resource Management – 2.00 JFPR 2.00 5 Aug Energy Conservation and Emissions Reduction from Poor Households – 2.00 JFPR 2.00 23 Sep Agriculture and Rural Development 14.72 – 14.72 29 Sep
– = nil, ACEF-CEFPF = Asian Clean Energy Fund (Japan) under the Clean Energy Financing Partnership Facility, ADF = Asian Development Fund, CAREC = Central Asia Regional Economic Cooperation, CEF-CEFPF = Clean Energy Fund under the Clean Energy Financing Partnership Facility, GEF = Global Environment Facility, JFPR = Japan Fund for Poverty Reduction. a Grant component of a loan project.

STA
TIST
ICA
L A
NN
EXES
Asian Development Bank164
Date ADF Other Sourcesa Total Approved
CONTINUED
Education Sector Reform 10.00 – 10.00 21 Nov Food and Nutrition Social Welfare Program 9.00 – 9.00 10 Dec Food and Nutrition Social Welfare – Capacity Development Project 3.00 – 3.00 10 Dec
Subtotal 74.32 8.00 82.32
Nepal Education Sector Program Cluster (Subprogram II) 8.00 – 8.00 24 Jan Information and Communication Technology Development 25.00 – 25.00 28 Jan Governance Support Program (Subprogram 1) 106.30 – 106.30 22 Oct Rural Reconstruction and Rehabilitation Sector Development Project (Supplementary) – 20.00 United Kingdom 20.00 11 Nov
Subtotal 139.30 20.00 159.30
Philippines Developing Microinsurance – 1.00 JFPR 1.00 15 Feb
Subtotal – 1.00 1.00
Samoa Sanitation and Drainagea 2.22 – 2.22 12 Sep
Subtotal 2.22 – 2.22
Solomon Islands Road Improvement Sector (Supplementary) – 0.47 Australia 0.47 30 Apr Domestic Maritime Support (Sector) 14.00 5.25 EC 19.25 25 Nov
Subtotal 14.00 5.72 19.72
Sri Lanka Improvement of Rural Access Roads and Livelihood Development for the Poor – 2.00 JFPR 2.00 21 Jan Dry Zone Urban Water and Sanitationa 23.22 2.00 NET-WFPF 25.22 28 Nov
Subtotal 23.22 4.00 27.22
Tajikistan Rural Development (Supplementary)a – 3.50 GEF 3.50 15 May Community Participatory Flood Management – 3.00 JFPR 3.00 8 Sep Nurek 500 kV Switchyard Reconstruction 54.77 – 54.77 17 Nov
Subtotal 54.77 6.50 61.27
Tonga Integrated Urban Development Sector 11.30 – 11.30 27 May
Subtotal 11.30 – 11.30
Tuvalu Improved Financial Management Program 3.24 – 3.24 16 Dec
Subtotal 3.24 – 3.24
Uzbekistan Land Improvementa – 3.00 GEF 3.00 09 Jan Surkhandarya Water Supply and Sanitationa – 1.50 MDTF-WFPF 1.50 3 Nov
Subtotal – 4.50 4.50
Viet Nam Community-Based Early Childhood Care and Development – 1.90 JFPR 1.90 19 Feb Livelihood Improvement of Vulnerable Ethnic Minority Communities Affected by the Song Bung 4 Hydropower Project in Quang Nam Provincea – 2.00 JFPR 2.00 26 Jun Demand-Driven Skills Training for Poverty Reduction in the Cuu Long (Mekong) River Delta – 1.30 JFPR 1.30 18 Jul
Subtotal – 5.20 5.20 TOTAL 707.36 104.01 811.37
– = nil, ADF = Asian Development Fund, EC = European Commission, GEF = Global Environment Facility, JFPR = Japan Fund for Poverty Reduction, MDTF-WFPF = Multidonor Trust Fund under the Water Financing Partnership Facility, NET-WFPF = The Netherlands Trust Fund for the Water Financing Partnership Facility.a Grant component of a loan project.

STATISTIC
AL A
NN
EXES165Annual Report 2008
Statistical Annex 3 LOAN APPROVALS BY SECTOR: 3-YEAR MOVING AVERAGES, 1968-1970–2006-2008
Law, Water Health, Economic Transport Supply, Total Agriculture Nutrition, Management, and Sanitation, Lendinga and Natural and Social Industry and Public Commu- and Waste Multi- ($ million) Resources Education Energy Finance Protection and Trade Policy nications Management sector
Average during (percent of total lending) 1968–1970 128.44 18.32 0.78 11.98 14.27 – 24.92 – 24.03 5.32 0.38 1969–1971 199.25 19.16 0.50 25.38 13.45 – 15.89 – 21.68 3.70 0.25 1970–1972 271.92 13.86 0.82 33.06 10.71 – 9.95 – 21.48 9.93 0.18
1971–1973 330.53 12.72 1.02 32.18 11.29 – 7.68 – 23.88 11.23 – 1972–1974 428.42 14.17 0.79 26.71 12.73 – 8.46 – 21.32 13.33 2.49 1973–1975 543.15 16.57 1.28 23.03 13.35 – 16.03 – 17.68 9.16 2.89
1974–1976 661.29 17.48 0.73 20.74 14.67 – 14.53 – 16.61 9.06 6.18 1975–1977 774.22 17.85 1.49 21.50 13.09 – 12.17 – 16.97 8.43 8.51 1976–1978 940.36 17.56 2.95 21.11 11.01 1.36 10.16 – 15.98 8.97 10.90
1977–1979 1,098.92 19.65 5.13 22.84 9.54 1.17 9.55 – 12.10 8.71 11.31 1978–1980 1,282.01 22.81 5.56 23.74 7.71 1.41 8.42 – 12.39 8.05 9.93 1979–1981 1,454.96 24.70 5.35 26.21 7.29 1.72 9.21 – 9.41 7.67 8.45
1980–1982 1,598.97 29.52 4.41 27.61 6.04 2.01 7.43 – 11.53 5.87 5.59 1981–1983 1,751.46 31.78 5.19 26.60 6.61 2.91 8.00 – 7.52 6.87 4.52 1982–1984 1,937.03 34.36 5.34 28.98 4.09 1.88 4.05 – 12.12 5.94 3.25
1983–1985 1,978.52 31.63 5.27 24.63 4.48 2.42 3.75 – 12.75 8.36 6.71 1984–1986 2,013.77 32.17 4.95 25.26 3.82 2.02 2.23 – 14.40 6.02 9.11 1985–1987 2,081.84 27.37 3.97 17.47 7.80 2.19 7.53 – 20.54 4.75 8.38
1986–1988 2,512.17 22.78 5.20 18.76 8.07 1.60 12.68 – 23.12 1.47 6.32 1987–1989 3,053.72 19.80 4.97 16.07 12.42 1.91 12.30 – 23.47 3.42 5.65 1988–1990 3,564.93 22.53 6.33 20.48 11.10 1.35 7.43 – 20.68 3.38 6.71
1989–1991 4,115.49 22.51 5.25 25.79 9.55 1.43 6.67 – 17.93 3.09 7.77 1990–1992 4,610.39 18.03 5.00 28.91 7.96 1.14 6.40 – 20.60 2.04 9.91 1991–1993 5,022.89 11.37 5.18 31.01 6.60 1.26 8.48 0.09 23.46 3.07 9.47
1992–1994 4,665.65 9.19 4.90 29.63 6.11 1.56 5.08 0.09 29.31 4.43 9.70 1993–1995 4,791.51 10.83 5.74 31.66 5.61 1.13 3.58 0.09 26.79 6.34 8.22 1994–1996 4,806.49 14.06 5.64 27.54 6.15 1.65 1.52 1.77 25.64 5.63 10.39
1995–1997 6,718.17 10.34 6.71 18.66 30.08 1.70 1.29 1.84 16.33 5.21 7.85 1996–1998 6,883.72 7.34 5.46 11.67 34.80 5.50 1.19 2.02 18.49 3.87 9.67 1997–1999 6,776.72 5.50 4.64 9.76 34.15 6.76 1.97 4.38 16.84 4.92 11.08
1998–2000 5,499.56 7.77 4.01 13.94 12.54 8.09 4.64 5.30 23.49 4.64 15.58 1999–2001 5,284.95 10.68 4.96 15.92 3.60 3.58 5.02 10.96 23.99 4.22 17.07 2000–2002 5,526.40 10.94 5.35 17.02 8.60 1.58 3.83 9.51 27.04 2.98 13.15
2001–2003 5,693.81 9.03 4.10 14.27 7.44 1.35 2.61 10.40 33.23 5.33 12.24 2002–2004 5,593.92 6.53 4.29 14.79 7.63 2.65 3.03 8.65 37.43 4.99 10.01 2003–2005 5,628.15 5.28 2.93 15.03 3.83 2.74 2.30 9.84 37.50 7.49 13.05
2004–2006 6,021.31 7.20 3.25 17.03 11.82 1.83 1.01 8.76 28.71 7.12 13.26 2005–2007 7,663.50 5.43 1.97 16.41 13.32 0.47 0.37 9.47 30.80 7.24 14.52 2006–2008 9,241.38 5.01 1.90 18.61 10.52 0.94 0.82 12.06 29.19 5.22 15.71
Cumulativea $ million (1968–2008) 143,528.39 17,063.03 6,023.83 28,502.50 16,690.00 3,292.22 5,715.04 7,741.44 35,115.60 7,311.66 16,073.08
– = nil. a Totals may not add because of rounding.

STA
TIST
ICA
L A
NN
EXES
Asian Development Bank166
Statistical Annex 4 LOAN APPROVALS BY SECTOR, 2008
$ Million
OCR ADF Total
AGRICULTURE AND NATURAL RESOURCES CAM Emergency Food Assistance – 17.50 17.50 IND Orissa Integrated Irrigated Agriculture and Water Management Investment Program – Tranche 1 47.20 – 47.20 PHI Agrarian Reform Communities Project II 70.00 – 70.00 PRC Ningxia Integrated Ecosystem and Agricultural Development 100.00 – 100.00 PRC Dryland Sustainable Agriculture 83.00 – 83.00 UZB Water Resources Management Sector 85.00 15.00 100.00 VIE Emergency Rehabilitation of Calamity Damage (Supplementary) – 25.50 25.50
Subtotal 385.20 58.00 443.20 EDUCATION BAN Skills Development – 50.00 50.00 INO Vocational Education Strengthening – 80.00 80.00
Subtotal – 130.00 130.00 ENERGY AZE Power Transmission Enhancement 160.00 – 160.00 BHU Green Power Development 51.00 29.00 80.00 IND Gujarat Paguthan Wind Energy Financing Facilitya (Samana Phase I) 45.00 – 45.00 IND Mundra Ultra Mega Powera 450.00 – 450.00 IND CLP Wind Farms Private Limiteda (Samana Phase II and the Saundatti Project) 60.00 – 60.00 IND National Power Grid Development Investment Program – Tranche 1 400.00 – 400.00 IND Himachal Pradesh Clean Energy Development Investment Program – Tranche 1 150.00 – 150.00 IND Uttarakhand Power Sector Investment Program – Tranche 1 62.40 – 62.40 PAK Power Distribution Enhancement Investment Program – Tranche 1 242.00 10.00 252.00 PHI Acquisition and Rehabilitation of the Masinloc Coal-Fired Thermal Power Planta 200.00 – 200.00 PHI Privatization and Refurbishment of the Calaca Coal-Fired Thermal Power Planta 120.00 – 120.00 PRC Municipal District Energy Infrastructure Developmenta 200.00 – 200.00 PRC Inner Mongolia Wind Powera 24.08 – 24.08 PRC Gansu Heihe Rural Hydropower Development Investment Program – Tranche 2: Dagushan Hydropower 28.00 – 28.00 PRC Guangdong Energy Efficiency and Environment Improvement Investment Program – Tranche 1 35.00 – 35.00 VIE Song Bung 4 Hydropower 196.00 – 196.00
Subtotal 2,423.48 39.00 2,462.48 FINANCE CAM Financial Sector Program II Cluster (Subprogram 2) – 10.30 10.30 INO Bank Mandiri (Persero)a 75.00 – 75.00 MLD Housing Development Finance Corporationa 7.50 – 7.50 VIE Saigon Thuong Tin Bank (Sacombank)a 25.00 – 25.00
Subtotal 107.50 10.30 117.80 HEALTH, NUTRITION, AND SOCIAL PROTECTION IND Columbia Asia Hospitals Developmenta 38.64 – 38.64 PAK Punjab Millennium Development Goals Program (Subprogram 1) – 100.00 100.00 VIE Health Care in the South Central Coast Region – 72.00 72.00
Subtotal 38.64 172.00 210.64
– = nil, ADF = Asian Development Fund, AZE = Azerbaijan, BAN = Bangladesh, BHU = Bhutan, CAM = Cambodia, IND = India, INO = Indonesia, MLD = Maldives, OCR = ordinary capital resources, PAK = Pakistan, PHI = Philippines, PRC = People’s Republic of China, UZB = Uzbekistan, VIE = Viet Nam.a Nonsovereign Loan.

STATISTIC
AL A
NN
EXES167Annual Report 2008
$ Million OCR ADF Total
CONTINUED
INDUSTRY AND TRADE IND Khadi Reform and Development Program 150.00 – 150.00 MLD Private Sector Development – 7.50 7.50 VIE Greater Mekong Subregion Sustainable Tourism Development – 10.00 10.00
Subtotal 150.00 17.50 167.50 LAW, ECONOMIC MANAGEMENT, AND PUBLIC POLICY CAM Promoting Economic Diversification Program (Subprogram 1) – 20.00 20.00 IND Assam Governance and Public Resource Management Sector Development Program (Subprogram II) 100.00 – 100.00 INO Second Local Government Finance and Governance Reform Program Cluster (Subprogram 1) 350.00 – 350.00 INO Fourth Development Policy Support Program 200.00 – 200.00 PAK Accelerating Economic Transformation Program (Subprogram 1) 300.00 200.00 500.00 PAK Second Balochistan Resource Management Program (Subprogram 1) 45.00 55.00 100.00 PAK Sindh Growth and Rural Revitalization Program (Subprogram 1) – 100.00 100.00 PHI Development Policy Support Program (Subprogram 2) 250.00 – 250.00 PHI Governance in Justice Sector Reform Program (Subprogram 1) 300.00 – 300.00 VIE Support for the Implementation of the Poverty Reduction Program V (Subprogam 1) – 25.00 25.00
Subtotal 1,545.00 400.00 1,945.00 TRANSPORT AND COMMUNICATIONS ARM Rural Road Sector (Supplementary) – 17.32 17.32 AZE Road Network Development Program – Tranche 2 55.40 – 55.40 CAM Road Asset Management – 6.00 6.00 COO Avatiu Port Development 8.63 6.88 15.51 IND GTL Infrastructure Limited Phase II Telecommunication Infrastructurea 150.00 – 150.00 IND National Highway 1 Panipat-Jalandhar Toll Roada 100.00 – 100.00 IND Rural Roads Sector II Investment Program – Tranche 2 77.65 – 77.65 IND Bihar State Highways 420.00 – 420.00 IND Rural Roads Sector II Investment Program – Tranche 3 130.00 – 130.00 IND Uttarakhand State-Road Investment Program – Tranche 2 140.00 – 140.00 KAZ CAREC Transport Corridor I (Zhambyl Oblast Section) [Western Europe- Western People’s Republic of China International Transit Corridor] Investment Program – Tranche 1 340.00 – 340.00 PAK Preparing the Lahore Rapid Mass Transit System – 6.00 6.00 PNG Highlands Region Road Improvement Investment Program – Tranche 1b – 100.00 100.00 PRC Central Yunnan Roads Development 200.00 – 200.00 PRC Lanzhou–Chongqing Railway Development 300.00 – 300.00 PRC Chongqing–Lichuan Railway Development 150.00 – 150.00 SRI Southern Transport Development (Supplementary) 90.00 – 90.00 VIE Ho Chi Minh City–Long Thanh–Dau Giay Expressway Construction 410.20 – 410.20 VIE Greater Mekong Subregion: Ha Noi–Lang Son, Greater Mekong Subregion: Ha Long-Mong Cai, and Ben Luc–Long Thanh Expressways Technical Assistance – 26.00 26.00
Subtotal 2,571.88 162.20 2,734.08
– = nil, ADF = Asian Development Fund, ARM = Armenia, AZE = Azerbaijan, CAM = Cambodia, CAREC = Central Asia Regional Economic Cooperation, COO = Cook Islands, IND = India, INO = Indonesia, KAZ = Kazakhstan, MLD = Maldives, OCR = ordinary capital resources, PAK = Pakistan, PHI = Philippines, PNG = Papua New Guinea, PRC = People’s Republic of China, SRI = Sri Lanka, VIE = Viet Nam.a Nonsovereign Loan.b Consists of two ADF loans.

STA
TIST
ICA
L A
NN
EXES
Asian Development Bank168
WATER SUPPY, SANITATION, AND WASTE MANAGEMENT IND Urban Water Supply and Environmental Improvement in Madhya Pradesh (Supplementary) 71.00 – 71.00 PAK Sindh Cities Improvement Investment Program – Tranche 1 – 38.00 38.00 PRC Songhua River Basin Water Pollution Control and Management 200.00 – 200.00 SAM Sanitation and Drainage (Supplementary) – 2.78 2.78 SRI Dry Zone Urban Water and Sanitation – 59.78 59.78 UZB Surkhandarya Water Supply and Sanitation – 30.00 30.00
Subtotal 271.00 130.56 401.56 MULTISECTOR AFG Roshan Expansion (Phase III)a 60.00 – 60.00 BAN Emergency Disaster Damage Rehabilitation (Sector) – 120.00 120.00 BAN Emergency Assistance for Food Security – 170.00 170.00 BAN Public-Private Infrastructure Development Facility 82.00 83.00 165.00 BAN Second Urban Governance and Infrastructure Improvement (Sector) – 87.00 87.00 GEO Municipal Services Development – 40.00 40.00 GEO Emergency Assistance for Post-Conflict Recovery – 70.00 70.00 IND Uttarakhand Urban Sector Development Investment Program – Tranche 1 60.00 – 60.00 IND Rural Electrification Corporation of Indiaa 225.00 – 225.00 INO Rural Infrastructure Support to PNPM Mandiri – 50.00 50.00 INO Infrastructure Reform Sector Development Program (Subprogram 2) 280.00 – 280.00 INO Integrated Citarum Water Resources Management Investment Program – Tranche 1 20.00 30.00 50.00 PAK Barani Integrated Water Resources Sector 55.00 20.00 75.00 PRC Gansu Baiyin Urban Development 80.00 – 80.00 PRC Xinjiang Municipal Infrastructure and Environmental Improvement 105.00 – 105.00 PRC Integrated Ecosystem and Water Resources Management in the Baiyangdian Basin 100.00 – 100.00 PRC Guangxi Wuzhou Urban Development 100.00 – 100.00 PRC Qingdao Water Resources and Wetland Protection 45.00 – 45.00
Subtotal 1,212.00 670.00 1,882.00 TOTAL 8,704.71 1,789.56 10,494.27
– = nil, ADF = Asian Development Fund, AFG = Afghanistan, BAN = Bangladesh, GEO = Georgia, IND = India, INO = Indonesia, OCR = ordinary capital re-sources, PAK = Pakistan, PNPM = Program Nasional Pemberdayaan Masyarakat (National Program for Community Empowerment), PRC = People’s Republic of China, SAM = Samoa, SRI = Sri Lanka, UZB = Uzbekistan.a Nonsovereign loan.
$ Million OCR ADF Total
CONTINUED

STATISTIC
AL A
NN
EXES169Annual Report 2008
Statistical Annex 5 SECTORAL DISTRIBUTION OF LOANS,a 2008, 1967–2008
2008 Loans OCR ADF Total Cumulative as of 2008
No. of No. of No. of No. of Sector Loans $ Million Loans $ Million Projectsb $ Million Projectsb $ Million %
Agriculture and Natural Resources 5 385.2 3 58.0 7 443.2 453 17,063.0 12Education – – 2 130.0 2 130.0 143 6,023.8 4Energy 16 2,423.5 2 39.0 15 2,462.5 317 28,502.5 20Finance 3 107.5 1 10.3 4 117.8 185 16,690.0 12Health, Nutrition, and Social Protection 1 38.6 2 172.0 3 210.6 62 3,292.2 2Industry and Trade 1 150.0 2 17.5 3 167.5 151 5,715.0 4Law, Economic Management, and Public Policy 7 1,545.0 5 400.0 10 1,945.0 56 7,741.4 5Transport and Communications 14 2,571.9 7 162.2 18 2,734.1 378 35,115.6 24Water Supply, Sanitation, and Waste Management 2 271.0 4 130.6 6 401.6 155 7,311.7 5Multisector 12 1,212.0 9 670.0 18 1,882.0 247 16,073.1 11
TOTALc 61 8,704.7 37 1,789.6 86 10,494.3 2,147 143,528.4 100
SECTORAL DISTRIBUTION OF GRANTSd, 2008, 1967–2008
2008 Grants
ADF Other Sources Total Cumulative as of 2008
No. of No. of No. of No. of Grants $ Million Grants $ Million Projectse $ Million Projectse $ Million %
Agriculture and Natural Resources 3 62.2 9 22.9 12 85.1 57 461.6 11Education 2 18.0 3 9.8 5 27.8 30 631.9 15Energy 3 244.1 4 15.8 5 259.9 15 328.7 8Finance – – 1 1.0 1 1.0 13 86.8 2Health, Nutrition, and Social Protection 2 12.0 2 3.7 3 15.7 37 262.0 6Industry and Trade 1 10.0 – – 1 10.0 7 30.5 1Law, Economic Management, and Public Policy 5 122.4 – – 4 122.4 16 226.3 6Transport and Communications 5 156.6 4 12.5 7 169.1 27 705.8 17Water Supply, Sanitation, and Waste Management 3 55.4 3 4.5 5 59.9 15 103.6 3Multisector 3 26.7 4 33.8 6 60.5 46 1,247.3 31
TOTALc 27 707.4 30 104.0 49 811.4 263 4,084.5 100
– = nil, ADF = Asian Development Fund, OCR = ordinary capital resources.a Includes count for an earlier approved loan with supplementary financing in the current year. b A project with multiple loans is counted as one project. c Totals may not add up because of rounding. d Refers to grant-financed projects. Includes count for an earlier approved grant with supplementary financing in the current year.e A project with multiple grants is counted as one project.

STA
TIST
ICA
L A
NN
EXES
Asian Development Bank170
Statistical Annex 6 LOAN AND ADF GRANT APPROVALS, BY COUNTRY AND SOURCE OF FUNDS, 2008 (amounts in $ million)
OCR ADF Loan Loan Grant Total %
Sovereign Afghanistan – – 254.0 254.0 2.3 Armenia – 17.3 – 17.3 0.2 Azerbaijan 215.4 – – 215.4 1.9 Bangladesh 82.0 510.0 – 592.0 5.3 Bhutan 51.0 29.0 25.3 105.3 0.9 Cambodia – 53.8 30.3 84.1 0.8 China, People’s Republic of 1,526.0 – – 1,526.0 13.6 Cook Islands 8.6 6.9 – 15.5 0.1 Georgia – 110.0 – 110.0 1.0 India 1,808.3 – – 1,808.3 16.1 Indonesia 850.0 160.0 – 1,010.0 9.0 Kazakhstan 340.0 – – 340.0 3.0 Kyrgyz Republic – – 65.4 65.4 0.6 Lao People’s Democratic Republic – – 10.0 10.0 0.1 Maldives – 7.5 – 7.5 0.1 Mongolia – – 74.3 74.3 0.7 Nepal – – 139.3 139.3 1.2 Pakistan 642.0 529.0 – 1,171.0 10.5 Papua New Guinea – 100.0 – 100.0 0.9 Philippines 620.0 – – 620.0 5.5 Samoa – 2.8 2.2 5.0 0.0 Solomon Islands – – 14.0 14.0 0.1 Sri Lanka 90.0 59.8 23.2 173.0 1.5 Tajikistan – – 54.8 54.8 0.5 Tonga – – 11.3 11.3 0.1 Tuvalu – – 3.2 3.2 0.0 Uzbekistan 85.0 45.0 – 130.0 1.2 Viet Nam 606.2 158.5 – 764.7 6.8 Subtotal 6,924.5 1,789.6 707.4 9,421.4 84.1 Nonsovereign Afghanistan 60.0 – – 60.0 0.5 China, People’s Republic of 224.1 – – 224.1 2.0 India 1,068.6 – – 1,068.6 9.5 Indonesia 75.0 – – 75.0 0.7 Maldives 7.5 – – 7.5 0.1 Philippines 320.0 – – 320.0 2.9 Viet Nam 25.0 – – 25.0 0.2 Subtotal 1,780.2 – – 1,780.2 15.9 TOTALa 8,704.7 1,789.6 707.4 11,201.6 100.0
– = nil, ADF = Asian Development Fund, OCR = ordinary capital resources.a Totals may not add up because of rounding.

STATISTIC
AL A
NN
EXES171Annual Report 2008
Statistical Annex 7 PROJECTS INVOLVING COFINANCING,a 2008 ($ million)
Cofinancing
Official ADB Grants Loans Commercial Source of Cofinancing
CENTRAL AND WEST ASIA 187.30 10.50 20.00 10.00 DVA cofinancing 10.50 – 10.00 Non-DVA cofinancing – 20.00 – Afghanistan Roshan Expansion (Phase III)b 60.00 10.00c, d Commercial lender with ADB political risk guarantee 20.00 Société de Promotion et de Participation pour la Coopération Economique, France
Kyrgyz Republic Southern Agriculture Area Development (Supplementary)e 20.00 2.50c Global Environment Facility (GEF)
Tajikistan Rural Development (Supplementary)e 17.10 3.50c GEF
Uzbekistan Land Improvemente 60.20 3.00c GEF Surkhandarya Water Supply and Sanitation 30.00 1.50c Multidonor Trust Fund under the Water Financing Partnership Facility EAST ASIA 1,572.08 5.70 – 6,381.52 DVA cofinancing 5.70 – 200.00 Non-DVA cofinancing – – 6,181.52 China, People’s Republic of Central Yunnan Roads Development 200.00 211.50 Industrial and Commercial Bank of China (ICBC), People’s Republic of China (PRC) Chongqing–Lichuan Railway Development 150.00 1,385.60 China Construction Bank (CCB), PRC Dryland Sustainable Agriculture 83.00 0.35c Spain Gansu Baiyin Urban Development 80.00 12.08 Domestic banks Capacity Building for Energy Efficiency Clean Energy Fund under the Clean Energy Financing Implementation 35.00 0.80c Partnership Facility Guangxi Wuzhou Urban Development 100.00 80.90 CCB, PRC Inner Mongolia Wind Powerb 24.08 25.00 ICBC, PRC Integrated Ecosystem and Water Resources Management in the Baiyangdian Basin 100.00 4.60 CCB, PRC Lanzhou–Chongqing Railway Development 300.00 3,166.40 CCB, PRC 838.00 ICBC, PRC Municipal District Energy Infrastructure Developmentb 200.00 200.00c Commercial lenders under ADB B-loan 457.14 Commercial banks Ningxia Integrated Ecosystem and Agricultural Development 100.00 4.55c GEF Songhua River Basin Water Pollution Control and Management 200.00 0.30 Domestic banks PACIFIC 14.00 5.72 – – DVA cofinancing 5.72 – – Non-DVA cofinancing – – – Solomon Islands Domestic Maritime Support (Sector) 14.00 5.25c European Commission Road Improvement Sector (Supplementary)e – 0.47c Australian Agency for International Development (AusAID), Australia
– = nil, DVA = direct value-added. a List excludes technical assistance projects. b Nonsovereign private sector loan. c DVA cofinancing.d Cancelled/not made effective.e Anchor ADB project was approved in prior years with cofinancing arranged this year.

STA
TIST
ICA
L A
NN
EXES
Asian Development Bank172
SOUTH ASIA 1,838.80 166.30 1,420.00 4,650.56 DVA cofinancing 41.50 370.00 140.00 Non-DVA cofinancing 124.80 1,050.00 4,510.56
Bangladesh Emergency Disaster Damage Rehabilitation (Sector) 120.00 10.00c Canadian International Development Agency, Canada 60.00c Japan Bank for International Cooperation (JBIC), Japan 20.00c OPEC Fund for International Development (OFID) Post-Literacy and Continuing Education (Supplementary)e – 2.50c Swiss Agency for Development and Cooperation (SDC), Switzerland Public–Private Infrastructure Development Facility 165.00 100.00 Islamic Development Bank Second Urban Governance and Infrastructure Improvement (Sector) 87.00 4.70 Deutsche Gesellschaft für Technische Zusammenarbeit, Germany 36.10 Kredinstalt für Wiederaufbau (KfW), Germany Skills Development 50.00 6.00c SDC Bhutan Green Power Development 105.30 1.00c Asian Clean Energy Fund (Japan) under the Clean Energy Financing Partnership Facility 55.46 Oesterreichische Kontrollbank Aktiengessellschaft, Austria
India Infrastructure Project Financing Facilitye 300.00 2,124.00 Commercial lenders Mundra Ultra Mega Powerb, f 450.00 450.00 International Finance Corporation (IFC) A Loan 1,470.10 Domestic banks 300.00 Korea Export Insurance Corporation (KEIC), Republic of Korea 500.00 The Export–Import Bank of Korea (KEXIM), Republic of Korea National Highway 1 Panipat–Jalandhar Toll Roadb 100.00 140.00c,d Commercial lenders under ADB B-loan 561.00 Domestic banks Orissa Integrated Irrigated Agriculture and Water Management Investment Program 47.20 30.00c OFID Rural Electrification Corporation of Indiag 225.00 80.00c Agence Française de Developpement, France 100.00c European Investment Bank 80.00c KfW
Nepal Governance Support Program (Subprogram 1) 106.30 12.00 Denmark 30.00 Department for International Development (DFID), United Kingdom 6.60 Norway 3.40 SDC 2.25 United Nations Capital Development Fund 4.70 United Nations Development Programme 9.15 United Nations Population Fund 13.90 United Nations Children’s Fund 0.50 Unted Nations Volunteers Rural Reconstruction and Rehabilitation Sector Development Project (Supplementary)e – 20.00c DFID 1.50 SDC
Sri Lanka Dry Zone Urban Water and Sanitation 83.00 2.00c The Netherlands Trust Fund for the Water Financing Partnership Facility
CONTINUED
Cofinancing
Official
ADB Grants Loans Commercial Source of Cofinancing
– = nil, DVA = direct value-added. a List excludes technical assistance projects. b Nonsovereign private sector loan. c DVA cofinancing. d Cancelled/not made effective. e Anchor ADB project was approved in prior years with cofinancing arranged this year.f Includes a tranche of up to $200 million funded by ADB to KEXIM through a risk participation agreement.g Nonsovereign public sector loan.

STATISTIC
AL A
NN
EXES173Annual Report 2008
SOUTHEAST ASIA 1,361.20 6.60 2,134.60 800.00 DVA cofinancing 6.60 554.60 225.00 Non-DVA cofinancing 1,580.00 575.00 Cambodia Health Sector Support (Supplementary)e – 1.80c DFID Road Asset Management 6.00 4.80c AusAID 30.00 International Development Agency 7.00c OFIDIndonesia Bank Mandiri (Persero)g 75.00 225.00c Commercial lenders under ADB B loan Fourth Development Policy Support Program 200.00 100.00 JBIC 750.00 World Bank (WB) Infrastructure Reform Sector Development Program (Subprogram 2) 280.00 100.00 JBIC 200.00 WB Philippines Acquisition and Rehabilitation of the Masinloc Coal-Fired 200.00 250.00 IFC A-loan Thermal Power Plantb 265.00 Commercial banks Agrarian Reform Communities Project II 70.00 30.00c OFID Privatization and Refurbishment of the Calaca Coal-Fired 120.00 150.00 IFC A-loan Thermal Power Plantb 100.00 Commercial lenders under IFC B-loan 210.00 Domestic banks Viet Nam Ho Chi Minh City–Long Thanh–Dau Giay Expressway Construction 410.20 517.60 c JBIC TOTAL 4,973.38 194.81 3,574.60 11,842.08 DVA cofinancing 70.01 924.60 575.00
Non-DVA cofinancing 124.80 2,650.00 11,267.08 – = nil, DVA = direct value-added. a List excludes technical assistance projects. b Nonsovereign private sector loan. c DVA cofinancing. d Cancelled/not made effective. e Anchor ADB project was approved in prior years with cofinancing arranged this year.f Includes a tranche of up to $200 million funded by ADB to KEXIM through a risk participation agreement.g Nonsovereign public sector loan.
Cofinancing
Official
ADB Grants Loans Commercial Source of Cofinancing

STA
TIST
ICA
L A
NN
EXES
Asian Development Bank174
Statistical Annex 9a PROGRAM LOAN DISBURSEMENTS, 2008 ($ million)
OCR ADF Total
Afghanistan – 2.53 2.53 Bangladesh – 96.94 96.94 Cambodia – 47.37 47.37 India 290.00 – 290.00 Indonesia 830.00 – 830.00 Lao People’s Democratic Republic – 8.66 8.66 Nepal – 2.59 2.59 Pakistan 1,011.42 508.19 1,519.62 Philippines 587.55 – 587.55 Sri Lanka 15.00 – 15.00 Viet Nam – 47.01 47.01
TOTALa 2,733.98 713.30 3,447.28
– = nil, ADF = Asian Development Fund, OCR = ordinary capital resources.a Totals may not add up because of rounding.
Statistical Annex 8 LOAN DISBURSEMENTS, 2007 and 2008 (amounts in $ thousand)
2 0 0 7
% of % of % of Total Total Total OCR OCR ADF ADF Total Disbursements
Projecta Nondevelopment Finance Institution 1,931,730 37 906,931 56 2,838,661 41 Development Finance Institution 17,178 – – – 17,178 –
Total Project Loans 1,948,908 37 906,931 56 2,855,839 41 Programb 1,972,574 38 566,069 35 2,538,643 37Sectorc 821,662 16 144,630 9 966,292 14 Private Sectord 490,627 9 – – 490,627 7
TOTALe 5,233,771 100 1,617,630 100 6,851,401 100
2 0 0 8
% of % of % of % Change
Total Total Total (2008/2007) OCR OCR ADF ADF Total Disbursements OCR ADF Total
Projecta Nondevelopment Finance Institution 2,256,882 35 1,170,673 57 3,427,555 40 17 29 21 Development Finance Institution 127,860 2 – – 127,860 2 644 – 644
Total Project Loans 2,384,742 37 1,170,673 57 3,555,415 42 22 29 24 Programb 2,733,977 42 713,296 35 3,447,273 40 39 26 36 Sectorc 759,288 12 158,665 8 917,953 11 (8) 10 (5) Private Sectord 594,382 9 – – 594,382 7 21 – 21
TOTALe 6,472,389 100 2,042,634 100 8,515,023 100 24 26 24
– = nil, ( ) = negative, ADF = Asian Development Fund, OCR = ordinary capital resources.a A project loan is provided to finance specific projects. ADB uses development finance institutions in its developing member countries (DMCs) as vehicles to finance
small to medium-sized projects in the private sector.b A program loan is provided to support DMCs’ efforts to improve the policy, institutional, and investment environment of sector development. It helps meet short-
term costs that policy adjustments entail. c A sector loan is provided to develop a specific sector or subsector. It finances a large number of subprojects in a single sector or subsector.d Includes nonsovereign public sector loans and excludes equity investments.e Totals may not add up because of rounding.

STATISTIC
AL A
NN
EXES175Annual Report 2008
Statistical Annex 9b TRENDS IN PROGRAM LENDING AND GRANT, 1998–2008
Program Loan and ADF Grant Project Loan and ADF Grant Total
Year $ Million % $ Million % $ Million
1998 2,627.5 44 3,355.0 56 5,982.5 1999 1,694.0 34 3,239.6 66 4,933.6 2000 1,102.0 20 4,480.6 80 5,582.6 2001 1,583.0 30 3,755.7 70 5,338.7 2002 1,702.2 30 3,955.7 70 5,657.9 2003 1,139.5 19 4,945.3 81 6,084.8 2004 1,121.4 22 3,917.6 78 5,039.0 2005 1,143.5 19 4,863.7 81 6,007.2 2006 3,204.6 43 4,331.6 57 7,536.2 2007 2,521.0 24 7,963.9 76 10,484.9 2008 2,631.1 23 8,570.6 77 11,201.6
ADF = Asian Development Fund.
Statistical Annex 10 NONSOVEREIGN APPROVALS AND TOTAL PROJECT COSTS BY COUNTRY,a 2008 ($ million)
Equity Total Complementary Partial Political Swap Total Project Invest- ADB Loan Credit Risk with ADB Cost/ Loan ment Funds (B-Loan) Guarantee Guarantee DMCs Approvals Fund Size
Afghanistan Roshan Expansion (Phase III) 60.00 – 60.00 – – 10.00 – 70.00 175.00
China, People’s Republic of Municipal District Energy Infrastructure Development 200.00 – 200.00 200.00 – – – 400.00 1,285.14 Inner Mongolia Wind Power 24.08 – 24.08 – – – – 24.08 73.42
India Mundra Ultra Mega Power 450.00 – 450.00 – – – – 450.00 4,226.75 Gujarat Paguthan Wind Energy Financing Facilityb 105.00 – 105.00 – – – – 105.00 236.77 India Mortgage Guarantee Company – 18.58 18.58 – – – – 18.58 27.87 Columbia Asia Hospitals Development 38.64 – 38.64 – – – – 38.64 154.55 GTL Infrastructure Limited Phase II Telecommunication Infrastructure 150.00 – 150.00 – – – – 150.00 1,184.54 National Highway 1 Panipat–Jalandhar Toll Road 100.00 – 100.00 140.00 – – – 240.00 1,067.00 Rural Electrification Corporation of India 225.00 – 225.00 – – – – 225.00 225.00
Indonesia Bank Mandiri (Persero) 75.00 – 75.00 225.00 – – – 300.00 300.00
Maldives Housing Development Finance Corporation 7.50 4.50 12.00 – – – – 12.00 33.00
Philippines Acquisition and Rehabilitation of the Masinloc Coal-Fired Power Project 200.00 – 200.00 – – – – 200.00 1,100.00 Privatization and Refurbishment of the Calaca Coal-Fired Thermal Power Plant 120.00 – 120.00 – – – – 120.00 890.00
Viet Nam Saigon Thuong Tin Bank (Sacombank) 25.00 – 25.00 – – – – 25.00 25.00
Regional Asian Clean Energy Private Equity Funds – 100.00 100.00 – – – – 100.00 1,100.00
TOTAL 1,780.23 123.08 1,903.31 565.00 – 10.00 – 2,478.30 12,104.05
– = nil, DMC = developing member country.a Includes projects processed by the Private Sector Operations Department and regional departments of ADB. b This project is composed of two loans: (i) Gujarat Paguthan Wind Energy Financing Facility (Samana Phase I - loan amount: $45.0 million; and (ii) CPL Wind Farms
Private Limited (Samana Phase II and the Saundatti Project) - loan amount: $60.0 million.

STA
TIST
ICA
L A
NN
EXES
Asian Development Bank176
Statistical Annex 11 NONSOVEREIGN APPROVALS AND TOTAL PROJECT COSTS BY SECTOR,a 2008 ($ million)
Total Complementary Partial Political Swap Total Total Equity ADB Loan Credit Risk with ADB Project Sector Loan Investment Funds (B-Loan) Guarantee Guarantee DMCs Approvals Cost
Infrastructure 1,634.08 100.00 1,734.08 340.00 – 10.00 – 2,084.08 11,563.63
Investment Funds and Financial Institutions 107.50 23.08 130.58 225.00 – – – 355.58 385.87
Health 38.64 – 38.64 – – – – 38.64 154.55
TOTALb 1,780.23 123.08 1,903.31 565.00 – 10.00 – 2,478.30 12,104.05
– = nil, DMC = developing member country.a Includes projects processed by the Private Sector Operations Department and regional departments of ADB.b Totals may not add up because of rounding.
Statistical Annex 12 NONSOVEREIGN APPROVALS BY YEAR,a, b 1983–2008 (amounts in $ million)
Total Complementary Partial Political Swap Total Total No. of Equity ADB Loan Credit Risk with ADB Project Year Projects Loan Investmentc Funds (B-Loan) Guarantee Guarantee DMCs Approvals Cost
1983 2 – 2.96 2.96 – – – – 2.96 36.001984 1 – 0.42 0.42 – – – – 0.42 2.801985 3 – 3.40 3.40 – – – – 3.40 26.501986 4 6.46 6.01 12.47 – – – – 12.47 20.321987 7 20.50 27.61 48.11 5.00 – – – 53.11 519.241988 12 58.00 35.67 93.67 – – – – 93.67 502.321989 16 95.70 67.59 163.29 51.10 – – – 214.39 1,038.661990 17 78.85 35.94 114.79 24.00 – – – 138.79 2,026.131991 10 156.80 20.52 177.32 – – – – 177.32 1,325.181992 4 50.00 5.42 55.42 81.50 – – – 136.92 402.291993 9 182.10 20.70 202.80 19.30 – – – 222.10 1,505.701994 9 – 48.70 48.70 – – – – 48.70 919.201995 8 68.00 99.41 167.41 5.83 – – – 173.24 1,050.321996 7 98.50 80.15 178.65 91.50 – – – 270.15 1,788.771997 6 45.00 49.50 94.50 – 50.00 – – 144.50 1,239.691998 6 136.12 39.44 175.56 151.08 65.00 – – 391.64 1,152.701999 3 101.50 7.40 108.90 61.50 – – – 170.40 847.702000 9 152.00 77.65 229.65 45.00 – 122.00 – 396.65 1,629.842001 6 37.50 30.36 67.86 – – – – 67.86 648.002002 6 110.00 25.53 135.53 – – 60.00 – 195.53 1,136.602003 7 167.00 35.65 202.65 170.00 170.00 – – 542.65 2,300.002004 14 92.50 164.37 256.87 – – 10.00 – 266.87 2,227.702005 13 513.02 176.50 689.52 – 18.40 50.00 – 757.92 8,676.422006 18 450.00 230.50 680.50 330.00 109.80 15.00 – 1,135.30 7,678.342007 23 725.27 79.75 805.02 200.00 376.00 – – 1,381.02 3,644.542008 16 1,780.23 123.08 1,903.31 565.00 – 10.00 – 2,478.31 12,104.05
TOTAL 236 5,125.05 1,494.23 6,619.28 1,800.81 789.20 267.00 – 9,476.29 54,449.01
– = nil, DMC = developing member country. a Includes nonsovereign projects processed by the Private Sector Operations Department and regional departments of ADB. Regional departments started nonsovereign
operations in 2007. b Net of facilities canceled in full before signing.c Includes equity investments, lines of equity, and equity underwriting.

STATISTIC
AL A
NN
EXES177Annual Report 2008
Statistical Annex 13 NONSOVEREIGN APPROVALS BY COUNTRY,a, b 1983–2008 (amounts in $ million)
Total Complementary Partial Political Swap Total Total No. of Equity ADB Loan Credit Risk with ADB Project Projects Loan Investmentc Funds (B-Loan) Guarantee Guarantee DMCs Approvals Cost
Afghanistan 6 135.00 8.10 143.10 30.00 – 35.00 – 208.10 650.70 Azerbaijan 4 66.00 – 66.00 – – – – 66.00 66.00 Bangladesh 8 137.20 14.98 152.18 20.00 – 70.00 – 242.18 890.36 Bhutan 1 – 0.53 0.53 – – – – 0.53 0.79 Cambodia 1 8.00 – 8.00 – – – – 8.00 32.00 China, People’s Republic of 21 571.30 369.30 940.60 646.50 107.00 – – 1,694.10 6,519.28 Georgia 1 25.00 – 25.00 – – – – 25.00 125.00 India 37 1,660.61 237.31 1,897.92 370.00 – – – 2,267.92 15,690.85 Indonesia 15 557.00 23.85 580.85 288.50 9.80 – – 879.15 7,472.02 Kazakhstan 5 225.00 – 225.00 – 325.00 – – 550.00 1,050.00 Korea, Republic of 3 – 8.96 8.96 – – – – 8.96 288.00 Lao People’s Democratic Republic 1 50.00 – 50.00 – – 50.00 – 100.00 1,450.00 Malaysia 2 10.00 2.00 12.00 – – – – 12.00 29.24 Maldives 2 12.00 4.50 16.50 – – – – 16.50 37.50 Mongolia 2 14.50 1.60 16.10 – – – – 16.10 50.00 Nepal 4 49.55 3.26 52.81 5.83 – – – 58.64 218.03 Pakistan 27 429.10 53.38 482.48 129.90 109.00 – – 721.38 2,997.01 Philippines 28 595.32 40.85 636.17 113.58 18.40 – – 768.15 4,688.72 Samoa 1 – 0.40 0.40 – – – – 0.40 1.60 Sri Lanka 13 99.50 13.58 113.08 – 115.00 52.00 – 280.08 543.48 Thailand 10 71.46 77.07 148.53 170.00 – – – 318.53 3,067.55 Viet Nam 8 218.50 – 218.50 26.50 – 60.00 – 305.00 1,520.00 Regional 36 190.00 634.57 824.57 – 105.00 – – 929.57 7,060.87
TOTAL 236 5,125.05 1,494.23 6,619.28 1,800.81 789.20 267.00 – 9,476.30 54,449.01 – = nil, DMC = developing member country. a Includes nonsovereign projects processed by the Private Sector Operations Department and regional departments of ADB. Regional departments started nonsovereign
operations in 2007. b Net of facilities canceled in full before signing.c Includes equity investments, lines of equity, and equity underwriting.

STA
TIST
ICA
L A
NN
EXES
Asian Development Bank178
Statistical Annex 14 NUMBER OF LOANS AND PROJECTS APPROVED AND UNDER ADMINISTRATION, PROJECT COMPLETION REPORTS (PCRs) CIRCULATED, PROJECTS COMPLETED, LOANS CLOSED, AND PROJECT/PROGRAM PERFORMANCE EVALUATION REPORTS (PPERs) CIRCULATED (as of 31 December 2008)
Cumulative Cumulative Cumulative Cumulative Cumulative Cumulative No. of No. of No. of No. of No. of No. of Loans Effective Projects Blended Supplementary Cofinanced Approveda Loans Approvedb Loans Loans Projectsc
Afghanistan 23 22 21 1 1 5Armenia 3 2 2 – 1 –Azerbaijan 13 11 9 3 – –Bangladesh 192 188 169 14 4 26Bhutan 25 23 22 2 – 1Cambodia 46 46 36 2 1 9China, People’s Republic of 154 142 151 – – 21Cook Islands 15 13 14 1 – –Fiji Islands 16 16 16 – – 1Georgia 3 3 3 – – –Hong Kong, China 5 5 5 – – –India 130 119 106 3 2 15Indonesia 297 293 261 25 2 26Kazakhstan 17 15 12 2 – 3Kiribati 6 6 6 – – –Korea, Republic of 81 81 80 – – –Kyrgyz Republic 26 26 20 – – 4Lao People’s Democratic Republic 68 68 60 1 3 9Malaysia 77 77 75 1 1 –Maldives 19 17 19 – – 2Marshall Islands 12 12 11 1 – –Micronesia, Federated States of 8 8 6 1 – –Mongolia 41 41 35 – – 2Myanmar 32 32 28 2 2 6Nauru 1 1 1 – – –Nepal 116 116 104 2 9 20Pakistan 284 272 214 45 5 38Papua New Guinea 63 61 48 12 2 8Philippines 204 200 173 18 4 33Samoa 33 31 28 – 4 3Singapore 14 14 14 – – –Solomon Islands 16 16 15 – – 3Sri Lanka 143 141 121 11 7 26Taipei,China 12 12 12 – – –Tajikistan 23 22 17 3 – 5Thailand 84 84 80 2 2 7Timor-Leste – – – – – –Tonga 15 14 15 – – 1Turkmenistan – – – – – –Tuvalu 3 3 2 – 1 –Uzbekistan 29 25 24 4 – 4Vanuatu 9 9 8 – 1 –Viet Nam 98 86 84 4 1 15Regional 7 6 20f 1 – 1 TOTAL 2,463 2,379 2,147 161 53 294
– = 0. a Includes nonsovereign loans but excludes terminated loans.b A project with multiple loans is counted as one project. Supplementary loans, special implementation assistance loans, and subprogram loans of program loan
clusters are not counted as separate projects.c These are non-ADB funds generated by ADB’s financing partnership operations including loans, credit enhancements, and grants, fully or partially administered by
ADB, and/or cofinanced under cooperation/sector-wide approach arrangements. d Includes projects/loans which have been approved but awaiting effectivity, inactive loans, fully disbursed nonsovereign loans, but still under administration; excludes
projects/loans exclusively financed from other sources.

STATISTIC
AL A
NN
EXES179Annual Report 2008
No. of No. of No. of No. of No. of No. of Cumulative Projects Loans of PCRs PPERs Loans Under Projects Under No. of PCRs Completed Closed Circulated Circulated Administrationd Administrationa,d,g Circulatedg in 2008e,g in 2008 in 2008g in 2008g
13 13 – – – – – Afghanistan 3 2 – – – – – Armenia 13 9 – 1 – – – Azerbaijan 53 42 125 2 2 5 – Bangladesh 6 4 16 – 1 1 – Bhutan 20 19 17 6 4 5 1 Cambodia 62 60 84 3 7 6 2 China, People’s Republic of 3 2 12 – – – – Cook Islands 2 2 11 – 1 1 – Fiji Islands 3 3 – – – – – Georgia – – 5 – – – – Hong Kong, China 56 46 52 – 3 8 2 India 36 30 203 6 6 12 – Indonesia 8 6 8 1 – – – Kazakhstan – – 5 – 1 1 – Kiribati – – 61 – – – – Korea, Republic of 7 7 16 – 2 3 – Kyrgyz Republic 18 16 42 3 6 5 1 Lao People’s Democratic Republic 1 1 56 – – – – Malaysia 10 10 8 1 – – – Maldives – – 10 – – 1 – Marshall Islands 4 3 3 – – – – Micronesia, Federated States of 13 12 19 2 2 1 2 Mongolia – – 26 – – – – Myanmar – – 1 – – – – Nauru 24 22 82 2 1 4 – Nepal 65 46 141 9 15 8 – Pakistan 10 6 36 1 5 1 1 Papua New Guinea 17 17 134 3 6 2 – Philippines 5 4 22 1 – – – Samoa – – 7 – – – – Singapore – – 14 – 1 – – Solomon Islands 46 36 80 6 4 4 1 Sri Lanka – – 1 – – – – Taipei,China 13 13 7 1 1 1 – Tajikistan 1 1 59 – – – – Thailand – – 5 – – 1 – Timor-Leste – – 16 – – – – Tonga – – – – – – – Turkmenistan 2 1 1 – – – – Tuvalu 19 17 7 – – 2 – Uzbekistan – – 8 – – – – Vanuatu 43 39 37 1 7 9 3 Viet Nam 3 3 5 – – 1 1 Regional 579 492 1,442 49 75 82 14 TOTAL
e Projects which were physically completed in 2008.f Includes the regional projects—Greater Mekong Subregion (GMS): Phnom Penh to Ho Chi Minh City Highway (Cambodia and Viet Nam loan components); GMS:
East–West Corridor (Lao People’s Democratic Republic [Lao PDR] and Viet Nam loan components); Almaty–Bishkek Regional Road Rehabilitation (Kazakhstan and Kyrgyz Republic loan components); GMS: Mekong Tourism Development (Cambodia, Lao PDR, and Viet Nam loan components); Regional Power Transmission Modernization (Tajikistan and Uzbekistan loan components); Regional Trade Facilitation and Customs Cooperation Program (Kyrgyz Republic and Tajikistan loan components); Asian Finance and Investment Corporation, Ltd.; Trade Finance Facilitation Program; Establishment of the Pacific Aviation Safety Office Project; Regional Power Transmission Interconnection (Afghanistan and Tajikistan loan components); Micro and Small Enterprise Financing Facility; and GMS Sustainable Tourism Development (Viet Nam loan component and Lao PDR grant component).
g Regional projects with loans to multiple countries are reported separately.
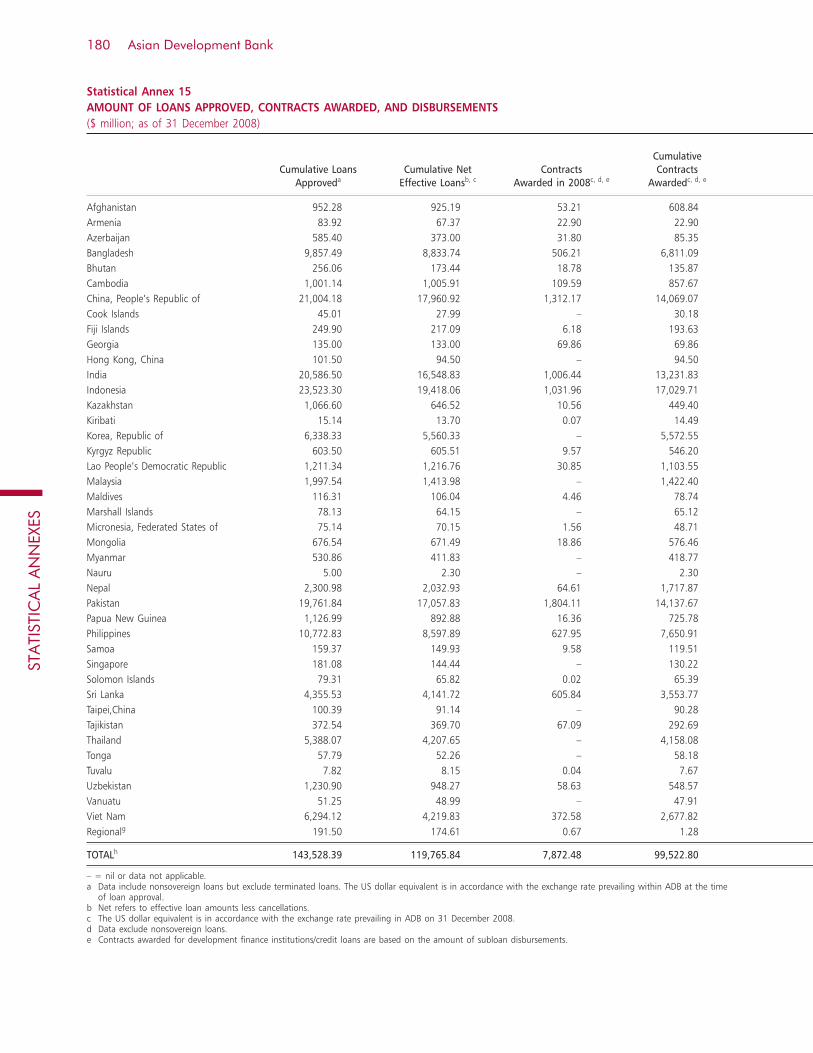
STA
TIST
ICA
L A
NN
EXES
Asian Development Bank180
Statistical Annex 15 AMOUNT OF LOANS APPROVED, CONTRACTS AWARDED, AND DISBURSEMENTS ($ million; as of 31 December 2008)
Cumulative Cumulative Loans Cumulative Net Contracts Contracts Approveda Effective Loansb, c Awarded in 2008c, d, e Awardedc, d, e
Afghanistan 952.28 925.19 53.21 608.84 Armenia 83.92 67.37 22.90 22.90 Azerbaijan 585.40 373.00 31.80 85.35 Bangladesh 9,857.49 8,833.74 506.21 6,811.09 Bhutan 256.06 173.44 18.78 135.87 Cambodia 1,001.14 1,005.91 109.59 857.67 China, People’s Republic of 21,004.18 17,960.92 1,312.17 14,069.07 Cook Islands 45.01 27.99 – 30.18 Fiji Islands 249.90 217.09 6.18 193.63 Georgia 135.00 133.00 69.86 69.86 Hong Kong, China 101.50 94.50 – 94.50 India 20,586.50 16,548.83 1,006.44 13,231.83 Indonesia 23,523.30 19,418.06 1,031.96 17,029.71 Kazakhstan 1,066.60 646.52 10.56 449.40 Kiribati 15.14 13.70 0.07 14.49 Korea, Republic of 6,338.33 5,560.33 – 5,572.55 Kyrgyz Republic 603.50 605.51 9.57 546.20 Lao People’s Democratic Republic 1,211.34 1,216.76 30.85 1,103.55 Malaysia 1,997.54 1,413.98 – 1,422.40 Maldives 116.31 106.04 4.46 78.74 Marshall Islands 78.13 64.15 – 65.12 Micronesia, Federated States of 75.14 70.15 1.56 48.71 Mongolia 676.54 671.49 18.86 576.46 Myanmar 530.86 411.83 – 418.77 Nauru 5.00 2.30 – 2.30 Nepal 2,300.98 2,032.93 64.61 1,717.87 Pakistan 19,761.84 17,057.83 1,804.11 14,137.67Papua New Guinea 1,126.99 892.88 16.36 725.78 Philippines 10,772.83 8,597.89 627.95 7,650.91 Samoa 159.37 149.93 9.58 119.51 Singapore 181.08 144.44 – 130.22 Solomon Islands 79.31 65.82 0.02 65.39 Sri Lanka 4,355.53 4,141.72 605.84 3,553.77 Taipei,China 100.39 91.14 – 90.28 Tajikistan 372.54 369.70 67.09 292.69 Thailand 5,388.07 4,207.65 – 4,158.08 Tonga 57.79 52.26 – 58.18 Tuvalu 7.82 8.15 0.04 7.67 Uzbekistan 1,230.90 948.27 58.63 548.57 Vanuatu 51.25 48.99 – 47.91 Viet Nam 6,294.12 4,219.83 372.58 2,677.82 Regionalg 191.50 174.61 0.67 1.28
TOTALh 143,528.39 119,765.84 7,872.48 99,522.80
– = nil or data not applicable. a Data include nonsovereign loans but exclude terminated loans. The US dollar equivalent is in accordance with the exchange rate prevailing within ADB at the time
of loan approval. b Net refers to effective loan amounts less cancellations. c The US dollar equivalent is in accordance with the exchange rate prevailing in ADB on 31 December 2008. d Data exclude nonsovereign loans. e Contracts awarded for development finance institutions/credit loans are based on the amount of subloan disbursements.

STATISTIC
AL A
NN
EXES181Annual Report 2008
% of Cumulative % of Cumulative Contracts Awarded Disbursements to Cumulative Net Disbursements Cumulative to Cumulative Net Effective Loansc in 2008 Disbursementsf Effective Loans
65.81 80.54 559.50 60.47 Afghanistan 33.99 8.03 8.03 11.92 Armenia 22.88 20.76 87.88 23.56 Azerbaijan 77.10 615.64 6,856.05 77.61 Bangladesh 78.34 4.27 116.59 67.22 Bhutan 85.26 113.45 789.34 78.47 Cambodia 78.33 1,292.81 13,437.54 74.82 China, People’s Republic of 107.81 1.34 27.91 99.69 Cook Islands 89.19 9.67 192.53 88.69 Fiji Islands 52.52 69.86 94.86 71.32 Georgia 100.00 – 94.50 100.00 Hong Kong, China 79.96 1,655.63 12,005.42 72.55 India 87.70 1,003.15 18,400.99 94.76 Indonesia 69.51 8.31 619.04 95.75 Kazakhstan 105.74 – 13.70 100.00 Kiribati 100.22 – 5,560.32 100.00 Korea, Republic of 90.20 27.11 552.15 91.19 Kyrgyz Republic 90.70 52.51 1,134.33 93.23 Lao People’s Democratic Republic 100.60 – 1,413.98 100.00 Malaysia 74.25 2.72 71.49 67.41 Maldives 101.51 – 64.15 100.00 Marshall Islands 69.44 3.56 46.35 66.07 Micronesia, Federated States of 85.85 34.68 579.47 86.30 Mongolia 101.68 – 411.83 100.00 Myanmar 100.00 – 2.30 100.00 Nauru 84.50 61.66 1,703.70 83.80 Nepal 82.88 1,923.34 14,234.56 83.45 Pakistan 81.28 19.88 710.59 79.58 Papua New Guinea 88.99 853.17 8,389.48 97.58 Philippines 79.71 2.63 108.29 72.22 Samoa 90.15 – 144.44 100.00 Singapore 99.35 0.07 65.82 100.00 Solomon Islands 85.80 259.54 3,161.71 76.34 Sri Lanka 99.06 – 91.14 100.00 Taipei,China 79.17 50.01 223.10 60.35 Tajikistan 98.82 – 4,207.65 100.00 Thailand 111.32 – 52.26 100.00 Tonga 94.12 0.60 7.16 87.86 Tuvalu 57.85 48.97 534.00 56.31 Uzbekistan 97.80 – 48.99 100.00 Vanuatu 63.46 264.56 2,633.66 62.41 Viet Nam 0.73 26.55 162.84 93.26 Regional
83.10 8,515.02 99,619.63 83.18 TOTAL
f The cumulative disbursements may exceed the cumulative contracts awarded due to disbursed amount without procurement contract summary sheet, e.g., interest during construction, contingencies, and nonsovereign loans which do not require procurement.
g Data include regional loan on Establishment of the Pacific Aviation Safety Office and private sector loans to Asian Finance and Investment Corporation Ltd., Trade Finance Facilitation Program, and Micro and Small Enterprise Financing Facility.
h Totals may not add up because of rounding.

Asian Development Bank182ST
ATI
STIC
AL
AN
NEX
ES
Statistical Annex 16 TECHNICAL ASSISTANCE GRANT APPROVALS BY COUNTRY AND REGIONAL ACTIVITIES,a, b 1967–2008, 2007, 2008 (amounts in $ thousand)
1 9 6 7 – 2 0 0 8 2 0 0 7
TASF JSF PEF RCIF Other No. Amount % No. Financing Financing Financing Financing Sources Total %
Afghanistan 60 65,647.70 1.85 2 2,800.00 – – – 1,700.00 4,500.00 1.78Armenia 5 2,200.00 0.06 3 900.00 – – – – 900.00 0.36Azerbaijan 22 12,122.00 0.34 – – – – – – – – Bangladesh 331 183,156.17 5.17 8 4,867.85 1,825.00 – – 1,000.00 7,692.85 3.04
Bhutan 105 42,443.15 1.20 4 1,080.00 1,600.00 – – – 2,680.00 1.06Brunei Darussalam 1 600.00c 0.02 – – – – – – – – Cambodia 151 99,384.60 2.80 5 1,259.00 475.00 – – 1,250.00 2,984.00 1.18China, People’s Republic of 563 310,321.65 8.75 33 17,314.00 – – – 3,168.00 20,482.00 8.10
Cook Islands 29 9,995.00 0.28 1 – 500.00 – – 200.00 700.00 0.28Fiji Islands 80 27,349.80 0.77 1 250.00 – – – – 250.00 0.10Georgia 2 720.00 0.02 1 120.00 – – – – 120.00 0.05
India 254 181,634.86 5.12 11 3,500.00 6,800.00 – – 500.00 10,800.00 4.27Indonesia 498 276,609.17d 7.80 9 14,510.00d 900.00 – – 750.00 16,160.00 6.39Kazakhstan 58 26,177.00 0.74 1 60.00 – – – – 60.00 0.02Kiribati 36 12,840.70 0.36 – – – – – – – –
Korea, Republic of 33 5,010.15 0.14 – – – – – – – – Kyrgyz Republic 71 40,951.40 1.15 3 1,200.00 – – – 500.00 1,700.00 0.67Lao People’s Democratic Republic 234 118,107.08 3.33 5 1,350.00 2,293.00 – – 500.00 4,143.00 1.64
Malaysia 93 25,352.30 0.71 – – – – – – – – Maldives 56 19,525.00 0.55 – – – – – – – – Marshall Islands 46 18,757.00 0.53 – – – – – – – –
Micronesia, Federated States of 42 24,428.00 0.69 1 – 400.00 – – – 400.00 0.16Mongolia 134 69,370.65 1.96 3 450.00 2,100.00 – – – 2,550.00 1.01Myanmar 38 10,716.00 0.30 – – – – – – – –
Nauru 7 1,946.81 0.05 – – – – – – – – Nepal 279 132,139.70 3.73 10 4,850.00 1,950.00 – 300.00 120.00 7,220.00 2.86Pakistan 325 187,931.13 5.30 10 5,733.00 1,000.00 2,000.00 – 11,500.00 20,233.00 8.00Palau, Republic of 3 2,100.00 0.06 2 – 1,700.00 – – – 1,700.00 0.67
Papua New Guinea 137 54,651.12 1.54 5 160.00 1,500.00 – – 213.52 1,873.52 0.74Philippines 334 158,264.25 4.46 4 1,300.00 1,350.00 – – – 2,650.00 1.05Samoa 85 27,081.50 0.76 3 105.00 1,100.00 – – 1,250.00 2,455.00 0.97
Singapore 2 577.42 0.02 – – – – – – – – Solomon Islands 59 18,245.24 0.51 2 800.00 2,000.00 – – – 2,800.00 1.11Sri Lanka 229 96,398.10 2.72 1 – – – – 600.00 600.00 0.24
Taipei,China 1 100.00 0.003 – – – – – – – – Tajikistan 58 33,886.06 0.96 5 1,661.06 600.00 – – 1,000.00 3,261.06 1.29Thailand 159 60,299.60 1.70 2 300.00 700.00 – – – 1,000.00 0.40
Timor-Leste 30 28,550.90 0.81 1 3,000.00 – – – 12,000.00 15,000.00 5.93Tonga 55 16,051.50 0.45 – – – – – – – – Turkmenistan 4 715.00 0.02 1 150.00 – – – – 150.00 0.06Tuvalu 20 5,914.75 0.17 – – – – – – – –
Uzbekistan 71 37,080.00 1.05 2 1,400.00 – – – – 1,400.00 0.55Vanuatu 55 16,364.76 0.46 1 – 600.00 – – – 600.00 0.24Viet Nam 235 177,804.46 5.01 20 3,295.00 6,745.00 – – 3,085.00 13,125.00 5.19
All DMCs 5,090 2,639,521.68 74.44 160 72,414.90 36,138.00 2,000.00 300.00 39,336.52 150,189.43 59.40Regional 1,509 906,254.61 25.56 82 38,277.25 6,950.00 – 7,100.00 50,325.70 102,652.95 40.60
TOTAL 6,599 3,545,776.29 100.00 242 110,692.15 43,088.00 2,000.00 7,400.00 89,662.22 252,842.38 100.00
– = nil or data not applicable, CCF = Climate Change Fund, DMC = developing member country, JSF = Japan Special Fund, PEF = Pakistan Earthquake Fund, RCIF = Regional Cooperation and Integration Fund, TASF = Technical Assistance Special Fund.a Excludes technical assistance financed under loans that are included in ADB’s loan data.b Data are adjusted to exclude technical assistance projects withdrawn by governments.c Reimbursable technical assistance.d Includes $10 million from ordinary capital resources as a contribution to the Java Reconstruction Fund.

183Annual Report 2008STA
TISTICA
L AN
NEXES
2008
TASF JSF RCIF CCF Other No. Financing Financing Financing Financing Sources Total %
3 1,155.00 1,800.00 – – – 2,955.00 1.08 Afghanistan 1 1,000.00 – – – – 1,000.00 0.36 Armenia 2 1,150.00 – – – – 1,150.00 0.42 Azerbaijan 8 2,925.00 990.00 – 600.00 – 4,515.00 1.64 Bangladesh
3 950.00 650.00 888.00 – – 2,488.00 0.91 Bhutan 1 – – – – 600.00 c 600.00 0.22 Brunei Darussalam 8 3,221.00 1,800.00 – – – 5,021.00 1.83 Cambodia China, People’s 31 15,900.00 – – 1,400.00 2,150.00 19,450.00 7.09 Republic of
2 350.00 – – – – 350.00 0.13 Cook Islands 2 125.00 – – – – 125.00 0.05 Fiji Islands 1 600.00 – – – – 600.00 0.22 Georgia
25 14,165.00 9,800.00 – – 3,450.00 27,415.00 9.99 India 8 3,950.00 1,300.00 – – 7,700.00 12,950.00 4.72 Indonesia 1 300.00 – – – – 300.00 0.11 Kazakhstan 1 – 800.00 – – – 800.00 0.29 Kiribati
– – – – – – – – Korea, Republic of 3 1,250.00 – – – – 1,250.00 0.46 Kyrgyz Republic Lao People’s 9 3,545.00 600.00 – – 977.00 5,122.00 1.87 Democratic Republic
– – – – – – – – Malaysia – – – – – – – – Maldives – – – – – – – – Marshall Islands
Micronesia, Federated 1 – 750.00 – – – 750.00 0.27 States of 6 1,300.00 3,200.00 – – 1,000.00 5,500.00 2.00 Mongolia – – – – – – – – Myanmar
1 225.00 – – – – 225.00 0.08 Nauru 10 2,600.00 1,300.00 – – 646.00 4,546.00 1.66 Nepal 10 6,202.00 1,600.00 – – 80.00 7,882.00 2.87 Pakistan 1 – 400.00 – – – 400.00 0.15 Palau, Republic of
4 225.00 2,800.00 – – – 3,025.00 1.10 Papua New Guinea 11 3,850.00 3,160.00 – – 2,400.00 9,410.00 3.43 Philippines 1 – 1,200.00 – – – 1,200.00 0.44 Samoa
– – – – – – – – Singapore 1 1,000.00 – – – 600.00 1,600.00 0.58 Solomon Islands 6 1,550.00 300.00 – – 50.00 1,900.00 0.69 Sri Lanka
– – – – – – – – Taipei,China 2 240.00 – 650.00 – – 890.00 0.32 Tajikistan 4 1,270.00 – – – 1,500.00 2,770.00 1.01 Thailand
2 – 1,300.00 – – – 1,300.00 0.47 Timor-Leste 1 – 700.00 – – – 700.00 0.26 Tonga – – – – – – – – Turkmenistan 2 800.00 – – – 327.75 1,127.75 0.41 Tuvalu
3 350.00 1,200.00 – – – 1,550.00 0.56 Uzbekistan – – – – – – – – Vanuatu 22 6,465.00 5,600.00 – – 14,790.00 26,855.00 9.78 Viet Nam
197 76,663.00 41,250.00 1,538.00 2,000.00 36,270.75 157,721.75 57.46 All DMCs 102 42,641.97 13,700.00 8,920.00 3,000.00 48,517.63 116,779.60 42.54 Regional
299 119,304.97 54,950.00 10,458.00 5,000.00 84,788.38 274,501.35 100.00 TOTAL

Asian Development Bank184ST
ATI
STIC
AL
AN
NEX
ES
Statistical Annex 17 TECHNICAL ASSISTANCE GRANT APPROVALS, 2008 ($ thousand)
TA Type Sector TASF JSF RCIF CCF Others Source Total
Afghanistan Water Resources Development PP AG – 1,800.00 – – – 1,800.00 Security Plan for Project Implementation AD LW 995.00 – – – – 995.00 Development of Wind Energy AD EN 160.00 – – – – 160.00
Subtotal 1,155.00 1,800.00 – – – 2,955.00
Armenia North–South Road Corridor Development Program PP TC 1,000.00 – – – – 1,000.00
Subtotal 1,000.00 – – – – 1,000.00
Azerbaijan Power Transmission Enhancement PP EN 150.00 – – – – 150.00 Railways Sector Development Program PP TC 1,000.00 – – – – 1,000.00
Subtotal 1,150.00 – – – – 1,150.00
Bangladesh Urban Primary Health Care Sector Development Program (Supplementary) PP HL 400.00 – – – – 400.00 Financial Management and Monitoring AD MS 200.00 – – – – 200.00 Strengthening the Government’s Institutional Capacity for Improving Food Security AD MS 600.00 – – – – 600.00 Capacity Development for the Infrastructure Development Company Limited AD MS 500.00 – – – – 500.00 Primary Education Sector Development Program PP ED – 990.00 – – – 990.00 Strengthening the Resilience of the Water Sector in Khulna to Climate Change AD MS – – – 600.00 – 600.00 Capacity Development for Madrasah Education AD ED 1,000.00 – – – – 1,000.00 Supporting the Establishment of Khulna Water Supply and Sewerage Authority AD WS 225.00 – – – – 225.00
Subtotal 2,925.00 990.00 – 600.00 – 4,515.00
Bhutan Strengthening of the Credit Information Bureau AD FI 350.00 – – – – 350.00 Road Network II PP TC – 650.00 – – – 650.00 Promotion of Clean Power Export Development AD EN 600.00 – 888.00 – – 1,488.00
Subtotal 950.00 650.00 888.00 – – 2,488.00
Brunei Darussalam Development of the Capital Market and a Modernized Payment and Settlement Systema AD FI – – – – 600.00 Brunei 600.00 Darussalam
Subtotal – – – – 600.00 600.00
Cambodia Enhancing the Resettlement Legal Framework and Institutional Capacity (Supplementary) AD HL 71.00 – – – – 71.00
– = nil or data not applicable; AD = advisory; AG = agriculture and natural resources; CCF = Climate Change Fund; ED = education; EN = energy; FI = finance; HL = health, nutrition, and social protection; JSF = Japan Special Fund; LW = law, economic management, and public policy; MS = multisector; PP = project prepara-tory; RCIF = Regional Cooperation and Integration Fund; TA = technical assistance; TASF = Technical Assistance Special Fund; TC = transport and communications; WS = water supply, sanitation, and waste management.a Approved by the President on a reimbursable basis by the Government of Brunei Darussalam.

185Annual Report 2008STA
TISTICA
L AN
NEXES
CONTINUED
TA Type Sector TASF JSF RCIF CCF Others Source Total
Private Sector and Small and Medium-Sized Enterprise Development Program PP LW 550.00 – – – – 550.00 Second Rural Water Supply and Sanitation Sector PP WS – 500.00 – – – 500.00 Strengthening Technical and Vocational Education and Training PP ED – 800.00 – – – 800.00 Strengthening Institutional Capacity for Emergency Response to Food Crisis and Improving Food Security AD AG 1,500.00 – – – – 1,500.00 Implementation of Key Policy Triggers of Subprogram 3 AD FI 300.00 – – – – 300.00 Enhancing Private Sector Competitiveness AD LW 800.00 – – – – 800.00 Provincial/Rural Road Asset Management PP TC – 500.00 – – – 500.00
Subtotal 3,221.00 1,800.00 – – – 5,021.00
China, People’s Republic of Western Yunnan Roads Development II (Supplementary) PP TC 100.00 – – – – 100.00 Lanzhou Sustainable Urban Transport (Supplementary) PP TC 150.00 – – – – 150.00 Asset-Backed Securitization for Expressway Financing and Corporate Debt Restructuring in Yunnan Province AD FI 150.00 – – – – 150.00 Providing Emergency Response to Sichuan Earthquake AD MS 1,000.00 – – – – 1,000.00 Urban Wastewater Reuse and Sludge Utilization Policy Study AD WS 700.00 – – – 300.00 MDTF-WFPF 1,000.00 People’s Republic of China: Supporting Fiscal Reforms in High Priority Sectors AD LW 1,000.00 – – – – 1,000.00 Qinghai Rural Water Resources Management PP AG 700.00 – – – – 700.00 Chongqing Urban–Rural Infrastructure Development Demonstration PP MS 900.00 – – – – 900.00 Strengthening the Capacity of the Judiciary to Implement Economic Laws AD LW 400.00 – – – – 400.00 Heilongjiang Road Development II (Yichun to Nenjiang) PP TC 600.00 – – – – 600.00 Anhui Road Network Development PP TC 600.00 – – – – 600.00 River Basin Water Resources Allocation and Management Policy AD AG 500.00 – – – 250.00 MDTF-WFPF 750.00 Capacity Strengthening in Planning and Implementation of Integrated Gasification Combined Cycle Plan AD EN 200.00 – – – – 200.00 Enhancing the Competitiveness and Efficiency of Railway Passenger Operations AD TC 500.00 – – – – 500.00 New Models for Civil Society Participation in Poverty Reduction AD HL 400.00 – – – – 400.00 Guangxi Border Cities Development PP MS 800.00 – – – – 800.00 Improvement of Public Employment Service System in the Western Region AD HL 400.00 – – – – 400.00 Chongqing–Guiyang Railway Development PP TC 500.00 – – – – 500.00 Provincial Development Strategies for Two Northeastern Provinces AD MS 800.00 – – – – 800.00 Railway Sector Energy Efficiency Strategy AD TC – – – – 800.00 CEF 800.00
– = nil or data not applicable; AD = advisory; AG = agriculture and natural resources; CCF = Climate Change Fund; CEF = Clean Energy Fund; ED = education; EN = energy; FI = finance; HL = health, nutrition, and social protection; JSF = Japan Special Fund; LW = law, economic management, and public policy; MDTF-WFPF = Multidonor Trust Fund under the Water Financing Partnership Facility; MS = multisector; PP = project preparatory; RCIF = Regional Cooperation and Integration Fund; TA = technical assistance; TASF = Technical Assistance Special Fund; TC = transport and communications; WS = water supply, sanitation, and waste management.

Asian Development Bank186ST
ATI
STIC
AL
AN
NEX
ES
CONTINUED
TA Type Sector TASF JSF RCIF CCF Others Source Total
Transport Efficiency through Logistics Development Policy Study AD TC 500.00 – – – – 500.00 Rural Finance Development and Supervision AD FI 400.00 – – – – 400.00 Wuhan Urban Environmental Improvement PP WS 700.00 – – – – 700.00 Jiangxi Sustainable Forest Ecosystem Development PP AG 700.00 – – – – 700.00 Preparing National Guidelines for Eco- Compensation in River Basins and a Framework for Soil Pollution Management AD AG 400.00 – – – 400.00 MDTF-WFPF 800.00 Design of the National Sulfur Dioxide Emission Trading System AD EN 500.00 – – – – 500.00 Fiscal Policy Support for Economic Development in Henan AD LW 400.00 – – – – 400.00 Utilization of Foreign Capital to Promote Energy Conservation and Energy-Efficient Power Generation Scheduling AD EN 600.00 – – 900.00 – 1,500.00 China Clean Development Mechanism Fund Capacity Development AD EN 300.00 – – 500.00 – 800.00 Promoting a More Inclusive and Effective Disaster Risk Management System AD MS 650.00 – – – – 650.00 Enabling the Protection of Jiaozhou Bay Water Quality and Wetland Ecosystem AD MS 350.00 – – – 400.00 MDTF-WFPF 750.00
Subtotal 15,900.00 – – 1,400.00 2,150.00 19,450.00
Cook Islands Infrastructure Development (Supplementary) PP MS 125.00 – – – – 125.00 Public Sector Review and Improvement AD LW 225.00 – – – – 225.00
Subtotal 350.00 – – – – 350.00
Fiji Islands Fourth Road Upgrading (Sector) (Supplementary) PP TC 50.00 – – – – 50.00 Preparing Economic Restructuring Program Loan (Supplementary) PP LW 75.00 – – – – 75.00
Subtotal 125.00 – – – – 125.00
Georgia Ajara Bypass Roads Development PP TC 600.00 – – – – 600.00
Subtotal 600.00 – – – – 600.00
India Chhattisgarh State Roads Sector Development (Supplementary) PP TC 990.00 – – – – 990.00 Mainstreaming Public–Private Partnerships at State Level (Supplementary) AD LW 2,000.00 – – – – 2,000.00 Capacity Development of the National Capital Region Planning Board AD MS 2,000.00 – – – – 2,000.00 Developing the Power System Master Plan for Bihar AD EN 600.00 – – – – 600.00 Knowledge Management for Enhanced Operational Effectiveness AD MS 1,000.00 – – – – 1,000.00
– = nil or data not applicable; AD = advisory; AG = agriculture and natural resources; CCF = Climate Change Fund; EN = energy; FI = finance; JSF = Japan Special Fund; LW = law, economic management, and public policy; MDTF-WFPF = Multidonor Trust Fund under the Water Financing Partnership Facility; MS = multisector; PP = project preparatory; RCIF = Regional Cooperation and Integration Fund; TA = technical assistance; TASF = Technical Assistance Special Fund; TC = transport and communications; WS = water supply, sanitation, and waste management.

187Annual Report 2008STA
TISTICA
L AN
NEXES
TA Type Sector TASF JSF RCIF CCF Others Source Total
Energy Efficiency Enhancement Project in Assam PP EN – 1,000.00 – – – 1,000.00 Integrated Renewable Energy Development PP EN 1,400.00 – – – – 1,400.00 Bihar Urban Development PP WS – 1,000.00 – – – 1,000.00 National Capital Region Planning Board PP MS – 700.00 – – – 700.00 Integrated Flood and River Erosion Management – Arunachal Pradesh PP AG 150.00 – – – 750.00 MDTF-WFPF 900.00 Supporting the Assam Governance and Public Resource Management Sector Development Program (Subprogram II) AD LW – 600.00 – – – 600.00 Institutional Strengthening of the Bihar Road Sector AD TC 1,000.00 – – – – 1,000.00 Institutional Development of Integrated Water Resources Management in Orissa AD AG – – – – 250.00 MDTF-WFPF 250.00 Preparing and Enhancing Readiness of Proposed North Eastern State Roads Investment Program PP TC 800.00 – – – – 800.00 Integrated Flood and Riverbank Erosion Risk Management – Assam (Phase 2): Processing and Institutional Strengthening PP AG 150.00 – – – 750.00 MDTF-WFPF 900.00 Capacity Building for Reforming the Khadi and Village Industry Subsector AD IN – 2,000.00 – – – 2,000.00 Promoting Inclusive Urban Development in Indian Cities AD MS 1,000.00 – – – – 1,000.00 Public–Private Partnerships Pilot Projects Initiative (Mainstreaming Public–Private Partnerships) PP MS – 2,000.00 – – – 2,000.00 Facilitating the Operations of the Energy Conservation Fund “Energy Smart” in Madhya Pradesh AD EN – – – – 1,700.00 DEN-E2 1,700.00 Capacity Building for Himachal Pradesh Power Sector Agencies AD EN 900.00 – – – – 900.00 Capacity Development Programs for Executing Agency Staff of India Projects AD MS 225.00 – – – – 225.00 Agribusiness Infrastructure Development Investment Program (Phase 2) PP AG 1,000.00 – – – – 1,000.00 Bihar State Highways II PP TC 700.00 – – – – 700.00 Dedicated Freight Corridor PP TC – 1,500.00 – – – 1,500.00 Preparing Nonsovereign Urban Infrastructure Projects PP MS 250.00 1,000.00 – – – 1,250.00
Subtotal 14,165.00 9,800.00 – – 3,450.00 27,415.00
Indonesia Integrated Citarum Water Resources Management (Supplementary) PP AG – – – – 200.00 GEF 200.00 Metropolitan Sanitation Management and Health (Supplementary) PP WS – – – – 500.00 MDTF-WFPF 500.00 Enhance Continuing Skills Development AD ED 500.00 – – – – 500.00 Regional Roads Development PP TC – 1,300.00 – – – 1,300.00 Strengthening Environmental Practices for Road Network Development in Kalimantan AD TC 150.00 – – – – 150.00 Local Government Finance and Governance Reform AD LW 1,500.00 – – – – 1,500.00
– = nil or data not applicable; AD = advisory; AG = agriculture and natural resources; CCF = Climate Change Fund; DEN-E2 = Second Danish Cooperation Fund for Renewable Energy and Energy Efficiency in Rural Areas; ED = education; EN = energy; GEF = Global Environment Facility; IN = industry and trade; JSF = Japan Special Fund; LW = law, economic management, and public policy; MDTF-WFPF = Multidonor Trust Fund under the Water Financing Partnership Facility; MS = multisector; PP = project preparatory; RCIF = Regional Cooperation and Integration Fund; TA = technical assistance; TASF = Technical Assistance Special Fund; TC = transport and communications; WS = water supply, sanitation, and waste management.

Asian Development Bank188ST
ATI
STIC
AL
AN
NEX
ES
CONTINUED
TA Type Sector TASF JSF RCIF CCF Others Source Total
Institutional Strengthening for Integrated Water Resources Management in the 6 Cis MDTF- River Basin Territory AD MS 1,000.00 – – – 7,000.00 WFPF/The 8,000.00 Netherlands Social Security Reform and Economic Modeling Capacity Building AD MS 800.00 – – – – 800.00
Subtotal 3,950.00 1,300.00 – – 7,700.00 12,950.00
Kazakhstan CAREC Transport Corridor I (Zhambyl Oblast Section) PP TC 150.00 – – – – 150.00 CAREC Transport Corridor I (Zhambyl Oblast Section) (Supplementary) PP TC 150.00 – – – – 150.00
Subtotal 300.00 – – – – 300.00
Kiribati Economic Management and Public Sector Reform AD LW – 800.00 – – – 800.00
Subtotal – 800.00 – – – 800.00
Kyrgyz Republic CAREC Transport Corridor I (Bishkek–Torugart Road) PP TC 150.00 – – – – 150.00 Investment Climate Improvement Program PP MS 500.00 – – – – 500.00 Implementation Support for Investment Climate Reform PP MS 600.00 – – – – 600.00
Subtotal 1,250.00 – – – – 1,250.00
Lao People’s Democratic Republic Sector-Wide Approach in Education Sector Development (Supplementary) AD ED – – – – 477.00 Australia 477.00 Agriculture and Natural Resources Sector Needs Assessment (Supplementary) AD AG 245.00 – – – – 245.00 Piloting Community e-Centers for Better Health AD HL – – – – 500.00 EAKPF 500.00 Strengthening Public Financial Management AD LW 1,100.00 – – – – 1,100.00 Greater Mekong Subregion Nam Theun 2 Hydroelectric Project – Social Safeguards Monitoring AD EN 400.00 – – – – 400.00 Strengthening Higher Education PP ED – 600.00 – – – 600.00 Health Sector Development Program PP HL 500.00 – – – – 500.00 Building Lao PDR’s Capacity to Develop Special Economic Zones AD LW 700.00 – – – – 700.00 Capacity Strengthening for Enhancing Aid Effectiveness AD LW 600.00 – – – – 600.00
Subtotal 3,545.00 600.00 – – 977.00 5,122.00
Micronesia, Federated States of Strengthening Public Sector Performance AD LW – 750.00 – – – 750.00
Subtotal – 750.00 – – – 750.00
– = nil or data not applicable; AD = advisory; AG = agriculture and natural resources; CAREC = Central Asia Regional Economic Cooperation; CCF = Climate Change Fund; EAKPF = Republic of Korea e-Asia and Knowledge Partnership Fund; ED = education; EN = energy; HL = health, nutrition, and social protection; JSF = Japan Special Fund; Lao PDR = Lao People’s Democratic Republic; LW = law, economic management, and public policy; MDTF-WFPF = Multidonor Trust Fund under the Water Financing Partnership Facility; MS = multisector; PP = project preparatory; RCIF = Regional Cooperation and Integration Fund; TA = technical assistance; TASF = Technical Assistance Special Fund; TC = transport and communications.

189Annual Report 2008STA
TISTICA
L AN
NEXES
TA Type Sector TASF JSF RCIF CCF Others Source Total
Mongolia Regional Logistics Development PP TC 400.00 – – – – 400.00 Capital Markets Development AD FI 500.00 – – – – 500.00 Agricultural Marketing and Brand Development AD AG – 2,000.00 – – – 2,000.00 Urban Transport Development PP TC – 1,200.00 – – – 1,200.00 HIV/AIDS Prevention in ADB Infrastructure Projects and the Mining Sector AD HL – – – – 1,000.00 HIV 1,000.00 Southeast Gobi Urban and Border Town Development PP WS 400.00 – – – – 400.00
Subtotal 1,300.00 3,200.00 – – 1,000.00 5,500.00
Nauru Nauru Trust Fund AD FI 225.00 – – – – 225.00
Subtotal 225.00 – – – – 225.00
Nepal Capacity Building in Rural Finance Institutions (Supplementary) AD FI – 600.00 – – – 600.00 Transmission and Distribution Project PP EN 150.00 – – – – 150.00 Knowledge Transfer for Public Procurement AD LW – – – – 500.00 EAKPF 500.00 Enhancing Project Readiness for North-South Fast Track Road Connectivity (PPP) AD TC 225.00 – – – – 225.00 Strengthening Capacity for Managing for Development Results AD LW 500.00 – – – – 500.00 Strengthening Capacity for Macroeconomic Analysis AD LW 675.00 – – – – 675.00 Strengthening Capacity for Managing Climate Change and the Environment AD LW 500.00 – – – – 500.00 Electricity Connectivity and Energy Efficiency I PP EN 150.00 – – – – 150.00 Secondary Towns Integrated Urban Environmental Improvement PP MS – 700.00 – – 146.00 NET-WFPF 846.00 Rural Finance Sector Development Cluster Program (Subprogram II) PP FI 400.00 – – – – 400.00
Subtotal 2,600.00 1,300.00 – – 646.00 4,546.00
Pakistan Sindh Basic Urban Services (Supplementary) PP WS 202.00 – – – 80.00 CFWS 282.00 Competitiveness and Structural Transformation in Pakistan AD LW 350.00 – – – – 350.00 Sustainable Energy Efficiency Development Program PP EN 600.00 – – – – 600.00 Lahore Rapid Mass Transit System PP TC 150.00 – – – – 150.00 Accelerating Economic Transformation Program PP LW 800.00 – – – – 800.00 Sindh Water Resouce Development and Management Investment Program PP AG – 800.00 – – – 800.00 Improving Efficiency and Accountability of North Sindh Urban Services Corporation Limited AD WS 2,500.00 – – – – 2,500.00 Market Infrastructure PP AG – 800.00 – – – 800.00 Supporting the Second Balochistan Resource Management Program PP LW 800.00 – – – – 800.00
– = nil or data not applicable; AD = advisory; AG = agriculture and natural resources; CCF =Climate Change Fund; CFWS = Cooperation Fund for the Water Sec-tor; EAKPF = Republic of Korea e-Asia and Knowledge Partnership Fund; EN = energy; FI = finance; HIV = Cooperation Fund for Fighting HIV/AIDS in Asia and the Pacific; HIV/AIDS = human immunodeficiency virus/acquired immunodeficiency syndrome; HL = health, nutrition, and social protection; JSF = Japan Special Fund; LW = law, economic management, and public policy; MS = multisector; NET-WFPF = The Netherlands Trust Fund for the Water Financing Partnership Facility; PP = project preparatory; PPP = public-private partnership; RCIF = Regional Cooperation and Integration Fund; TA = technical assistance; TASF = Technical Assistance Special Fund; TC = transport and communications; WS = water supply, sanitation, and waste management.

Asian Development Bank190ST
ATI
STIC
AL
AN
NEX
ES
CONTINUED
TA Type Sector TASF JSF RCIF CCF Others Source Total
Improving Private Sector Participation and Public Expenditure Management AD LW 800.00 – – – – 800.00
Subtotal 6,202.00 1,600.00 – – 80.00 7,882.00
Palau, Republic of Development of a Sustainable Health Financing Scheme AD HL – 400.00 – – – 400.00
Subtotal – 400.00 – – – 400.00
Papua New Guinea Power Sector Development PP EN – 1,200.00 – – – 1,200.00 Pilot Border Trade and Investment Development PP IN – 900.00 – – – 900.00 Support for Development Planning AD LW 225.00 – – – – 225.00 National Transport Development Plan (2011–2020) AD TC – 700.00 – – – 700.00
Subtotal 225.00 2,800.00 – – – 3,025.00
Philippines Capacity Building for Housing Microfinance (Supplementary) AD MS – – – – 500.00 EAKPF 500.00 Philippines Basic Urban Services Sector PP MS – 650.00 – – – 650.00 Strengthening Provincial and Local Planning and Expenditure Management Phase 2 AD LW 650.00 – – – – 650.00 Pasuquin East Wind Farm Development PP EN – – – – 200.00 CEF 200.00 Road Sector Improvement PP TC – 660.00 – – – 660.00 Integrated Natural Resources and Environmental Management Sector Development Program PP AG – 850.00 – – – 850.00 Water District Development Sector PP WS – – – – 1,200.00 MDTF-WFPF 1,200.00 Improving Public Expenditure Management AD LW 800.00 – – – – 800.00 Irrigation System Operation Efficiency Improvement PP AG – 1,000.00 – – – 1,000.00 Harmonization and Development Effectiveness AD LW 900.00 – – – – 900.00 Supporting Governance in Justice Sector Reform in the Philippines AD LW 1,500.00 – – – 500.00 GDCF 2,000.00
Subtotal 3,850.00 3,160.00 – – 2,400.00 9,410.00
Samoa Afulilo Environmental Enhancement PP EN – 1,200.00 – – – 1,200.00
Subtotal – 1,200.00 – – – 1,200.00
Solomon Islands Establishment of the Solomon Islands Maritime Safety Administration AD TC 1,000.00 – – – 600.00 EC 1,600.00
Subtotal 1,000.00 – – – 600.00 1,600.00
– = nil or data not applicable; AD = advisory; AG = agriculture and natural resources; CCF = Climate Change Fund; CEF = Clean Energy Fund; EAKPF = Republic of Korea e-Asia and Knowledge Partnership Fund; EC = European Commission; EN = energy; GDCF = Gender and Development Cooperation Fund; HL = health, nutri-tion, and social protection; IN = industry and trade; JSF = Japan Special Fund; LW = law, economic management, and public policy; MDTF-WFPF = Multidonor Trust Fund under the Water Financing Partnership Facility; MS = multisector; PP = project preparatory; RCIF = Regional Cooperation and Integration Fund; TA = technical assistance; TASF = Technical Assistance Special Fund; TC = transport and communications; WS = water supply, sanitation, and waste management.

191Annual Report 2008STA
TISTICA
L AN
NEXES
TA Type Sector TASF JSF RCIF CCF Others Source Total
Sri Lanka Independent External Monitoring of Resettlement Activities of the Southern Transport Development Project (Supplementary) AD TC 175.00 – – – – 175.00 Land Use Planning of the Southern Highway Corridor AD TC 300.00 – – – – 300.00 Institutional Strengthening for Decentralized Service Delivery in the Water Sector AD WS 700.00 – – – 50.00 CFWS 750.00 Deepening of Fiscal Management Reforms PP LW – 300.00 – – – 300.00 Assessing Colombo Municipality Wastewater Systems PP WS 150.00 – – – – 150.00 Establishment of a Central Procurement Unit in the Road Development Authority AD TC 225.00 – – – – 225.00
Subtotal 1,550.00 300.00 – – 50.00 1,900.00
Tajikistan Cotton Sector Restructuring (Supplementary) PP AG 240.00 – – – – 240.00 CAREC Transport Corridor III (Dushanbe–Uzbekistan Border Road) PP TC – – 650.00 – – 650.00
Subtotal 240.00 – 650.00 – – 890.00
Thailand Greater Mekong Subregion Highway Expansion PP TC 150.00 – – – – 150.00 Greater Mekong Subregion Highway Expansion (Supplementary) PP TC 120.00 – – – – 120.00 Capital Market Development Phase II AD FI 1,000.00 – – – – 1,000.00 Capacity Building and School Networking for Educational Services (e-Learning) in Thailand AD ED – – – – 500.00 EAKPF 500.00 Mainstreaming Energy Efficiency Measures in Thai Municipalities AD EN – – – – 1,000.00 CEF 1,000.00
Subtotal 1,270.00 – – – 1,500.00 2,770.00
Timor-Leste Road Network Development PP TC – 800.00 – – – 800.00 Capacity Building to Strengthen Public Sector Management and Governance Skills, Phase III AD ED – 500.00 – – – 500.00
Subtotal – 1,300.00 – – – 1,300.00
Tonga Urban Planning and Management System AD MS – 700.00 – – – 700.00
Subtotal – 700.00 – – – 700.00
Tuvalu Capacity Building for Taxation Reforms (Supplementary) AD LW – – – – 270.00 Australia 270.00 Capacity Development for Public Financial Management AD LW 800.00 – – – 57.75 Australia 857.75
Subtotal 800.00 – – – 327.75 1,127.75
– = nil or data not applicable; AD = advisory; AG = agriculture and natural resources; CAREC = Central Asia Regional Economic Cooperation; CCF = Climate Change Fund; CEF = Clean Energy Fund; CFWS = Cooperation Fund for the Water Sector; EAKPF = Republic of Korea e-Asia and Knowledge Partnership Fund; ED = education; EN = energy; FI = finance; JSF = Japan Special Fund; LW = law, economic management, and public policy; MS = multisector; PP = project preparatory; RCIF = Regional Cooperation and Integration Fund; TA = technical assistance; TASF = Technical Assistance Special Fund; TC = transport and communications; WS = water supply, sanitation, and waste management.

Asian Development Bank192ST
ATI
STIC
AL
AN
NEX
ES
Uzbekistan Djizzak and Surkhandarya Rural Water Supply and Sanitation Sector (Supplementary) PP WS 200.00 – – – – 200.00 Eligibility of State-Owned Road Enterprises for Participation in ADB-Financed Projects AD TC 150.00 – – – – 150.00 Water Resources Management Sector PP AG – 1,200.00 – – – 1,200.00
Subtotal 350.00 1,200.00 – – – 1,550.00
Viet Nam Support for Public–Private Development of the O Mon Thermal Power Complex (Supplementary) PP EN 740.00 – – – – 740.00 Developing Benefit Sharing Mechanisms for People Adversely Affected by Power Generation Projects (Supplementary) AD EN – – – – 240.00 MDTF-WFPF 240.00 Ho Chi Minh City Metro Rail System (Supplementary) PP TC 500.00 – – – – 500.00 Health Care in the South Central Coast Region (Supplementary) PP HL 500.00 – – – – 500.00 Viet Nam Water Sector Review (Supplementary) AD MS – – – – 550.00 The 550.00 Netherlands Making Markets Work Better for the Poor Phase 2 AD IN 400.00 – – – 8,000.00 United 8,400.00 Kingdom Second Small and Medium-Sized Enterprise Development Program PP LW – 500.00 – – – 500.00 Skills Enhancement PP ED – 600.00 – – – 600.00 Support for Developing Capital Markets and Building Capacity in the Financial Sector AD FI 1,000.00 – – – – 1,000.00 Hue Water Supply PP WS – – – – 1,500.00 NET-WFPF 1,500.00 Ho Chi Minh City Water Supply PP WS – – – – 1,500.00 France 1,500.00 Higher Education Sector Development PP ED – 1,000.00 – – – 1,000.00 Strengthening Water Management and Irrigation Systems Rehabilitation PP AG – 1,000.00 – – – 1,000.00 Supporting Civil Service Reform AD LW 1,000.00 – – – – 1,000.00 Central Region Rural Water Supply and Sanitation Sector PP WS 600.00 – – – – 600.00 Da Nang Water Supply PP WS – – – – 1,500.00 MDTF-WFPF 1,500.00 Hai Phong Water Supply PP WS – – – – 1,000.00 NET-WFPF 1,000.00 Greater Mekong Subregion Ha Noi–Lang Son and Ha Long–Mong Cai Expressway PP TC 1,500.00 – – – – 1,500.00 Ben Luc–Long Thanh Expressway PP TC – 1,500.00 – – – 1,500.00 Geo-Information Technology for Hazard Risk Assessment AD AG – – – – 500.00 EAKPF 500.00 Sustainable Rural Infrastructure Development Project in the Northern Mountain Provinces PP MS – 1,000.00 – – – 1,000.00 Capacity Building of the National Power Transmission Corporation in a Competitive Power Market Environment AD EN 225.00 – – – – 225.00
Subtotal 6,465.00 5,600.00 – – 14,790.00 26,855.00 TOTAL 76,663.00 41,250.00 1,538.00 2,000.00 36,270.75 157,721.75
– = nil or data not applicable; AD = advisory; AG = agriculture and natural resources; CCF = Climate Change Fund; EAKPF = Republic of Korea e-Asia and Knowledge Partnership Fund; ED = education; EN = energy; FI = finance; HL = health, nutrition, and social protection; IN = industry and trade; JSF = Japan Special Fund; LW = law, economic management, and public policy; MDTF-WFPF = Multidonor Trust Fund under the Water Financing Partnership Facility; MS = multisector; NET-WFPF = The Netherlands Trust Fund for the Water Financing Partnership Facility; PP = project preparatory; RCIF = Regional Cooperation and Integration Fund; TA = technical assistance; TASF = Technical Assistance Special Fund; TC = transport and communications; WS = water supply, sanitation, and waste management.
CONTINUED
TA Type Sector TASF JSF RCIF CCF Others Source Total

193Annual Report 2008STA
TISTICA
L AN
NEXES
Statistical Annex 18 TECHNICAL ASSISTANCE GRANT APPROVALS BY SECTOR,a, b 1967–2008, 2007, 2008
1967–2008 2007 2008
No. $ thousand % No. $ thousand % No. $ thousand %
Agriculture and Natural Resources 1,099 542,097.02 20.54 18 10,647.00 7.09 21 18,135.00 11.50
Education 299 146,625.72 5.56 5 2,505.00 1.67 10 6,967.00 4.42
Energy 533 264,196.11 10.01 28 21,609.06 14.39 23 16,503.00 10.46
Finance 449 215,405.72 8.16 6 5,530.00 3.68 11 5,525.00 3.50
Health, Nutrition, and Social Protection 183 97,328.42 3.69 9 13,202.52 8.79 9 4,171.00 2.64
Industry and Trade 265 119,130.00 4.51 – – – 3 11,300.00 7.16
Law, Economic Management, and Public Policy 963 498,492.30 18.89 39 39,505.00 26.30 34 24,922.75 15.80
Transport and Communications 669 336,798.30 12.76 26 16,552.85 11.02 40 25,445.00 16.13
Water Supply, Sanitation, and Waste Management 272 134,168.45 5.08 11 10,128.00 6.74 18 15,507.00 9.83
Multisector 358 285,279.65 10.81 18 30,510.00 20.31 28 29,246.00 18.54
TOTAL 5,090 2,639,521.68 100.00 160 150,189.43 100.00 197 157,721.75 100.00
– = nil. a Excludes technical assistance financed under loans that are included in ADB’s loan data and regional activities.b Data are adjusted to exclude technical assistance projects withdrawn by governments.
Statistical Annex 19 CONSULTING SERVICES FINANCED THROUGH LOANS BY SECTOR, 2008 (amounts in $ million)
Sector Loan %
Agriculture and Natural Resources 19.64 8.02
Education 5.34 2.18
Energy 26.69 10.90
Finance – –
Health, Nutrition, and Social Protection 3.55 1.45
Industry and Trade 3.92 1.60
Law, Economic Management, and Public Policy – –
Transport and Communications 117.66 48.06
Water Supply, Sanitation, and Waste Management 11.15 4.55
Multisector 56.87 23.23
TOTAL 244.82 100.00
– = nil.

Asian Development Bank194ST
ATI
STIC
AL
AN
NEX
ES
Statistical Annex 20 REGIONAL TECHNICAL ASSISTANCE ACTIVITIES, 2008 ($ thousand)
TASF JSF RCIF CCF Others Source Total
CONFERENCE Supporting the Boao Forum for Asia – – – – 500.00 PRC RPRF 500.00 Supporting Regional Capacities for Financial Asset and Liability and Risk Management – – 320.00 – – 320.00 Supporting the Third High–Level Forum on Aid Effectiveness and its Preparatory Consultation Process 500.00 – – – – 500.00 Natural Catastrophe Risk Insurance Mechanisms for the Asia and Pacific Region – 800.00 – – – 800.00 South Asian Bond Markets Conference 66.00 – – – – 66.00 South Asia Forum on the Impact of Global Economic and Financial Crisis 800.00 – – – – 800.00 Public Debt and Risk Management Forum 650.00 – – – – 650.00 Strengthening Capacity of the Developing Member Countries for Managing Credit Enhancement Products 500.00 – – – – 500.00
Subtotal 2,516.00 800.00 320.00 – 500.00 4,136.00 RESEARCH Establishment of Regional Knowledge Hubs (Supplementary) 150.00 – – – – 150.00 Bond Financing for Infrastructure Projects in the ASEAN+3 Region – 700.00 – – – 700.00 Developing Securitization Markets in ASEAN+3 – 700.00 – – – 700.00 Strategic Partnerships for Policy Development and Action to Foster Regional Cooperation in South Asia – – 700.00 – – 700.00 Promoting Energy Efficiency in the Pacific – – – – 1,200.00 CEF 1,200.00 Asian Development Outlook 2009 460.00 – – – – 460.00 Knowledge Sharing on Infrastructure Public-Private Partnerships in Asia – – – – 500.00 EAKPF 500.00 Quantifying the Costs and Benefits of Regional Economic Integration in Asia 910.00 – – – – 910.00 Minimizing Foreign Exchange Settlement Risk in the ASEAN+3 Region: Support for Group of Experts – – – – 850.00 ICFF 850.00 Enterprise Development and the Challenge of Inclusive Growth 500.00 – – – – 500.00
Subtotal 2,020.00 1,400.00 700.00 – 2,550.00 6,670.00 STUDY Central Asia Regional Economic Cooperation: Transport Sector Strategy Study (Supplementary) 325.00 – – – – 325.00 Enhancing Effective Regulation of Water and Energy Infrastructure and Utility Services (Supplementary) – – – – 700.00 Australia 700.00 A Development Framework for Sustainable Urban Transport (Supplementary) – – – – 220.00 United 220.00 Kingdom Development Study of GMS Economic Corridors (Supplementary) 200.00 – – – 400.00 PRC RPRF 600.00 Managing the Cities in Asia (Supplementary) – – – – 2,000.00 Spain 2,000.00
– = nil or data not applicable; ASEAN+3 = Association of Southeast Asian Nations, plus the People’s Republic of China, Japan, and Republic of Korea; CCF = Climate Change Fund; CEF = Clean Energy Fund; EAKPF = Republic of Korea e-Asia and Knowledge Partnership Fund; GMS = Greater Mekong Subregion; ICFF = Investment Climate Facilitation Fund; JSF = Japan Special Fund; PRC RPRF = People’s Republic of China Regional Cooperation and Poverty Reduction Fund; RCIF = Regional Cooperation and Integration Fund; TASF = Technical Assistance Special Fund.

195Annual Report 2008STA
TISTICA
L AN
NEXES
ASEAN+3 Regional Guarantee and Investment Mechanism Phase 2 (Supplementary) 400.00 – – – – 400.00 Improving the Implementation of Environmental Safeguards for ADB Projects in Central and West Asia 150.00 – – – – 150.00 Equity in the Delivery of Public Services in Selected Developing Member Countries 500.00 – – – – 500.00 Strengthening Pacific Economic Analysis and Policy Development 1,500.00 – – – 400.00 Australia 1,900.00 Selected Evaluation Studies for 2008 1,493.00 – – – – 1,493.00 Managing Water in Asia’s River Basins: Charting Progress and Facilitating Investment – 2,000.00 – – – 2,000.00 Strengthening Coastal and Marine Resources Management in the Coral Triangle of the Pacific (Phase 1) – – – – 850.00 Finland/ 850.00 GEF South Asian Regional Cooperation in 2030: The Potential Role of India and Pakistan – – 750.00 – – 750.00 Preparing a Response in the Pacific to High Prices 225.00 – – – – 225.00 Addressing Climate Change in the Asia and Pacific Region 1,250.00 – – – – 1,250.00 Improving Price Collection of Non–Household Expenditure Components and Updating Purchasing Power Parity Estimates for Selected Developing Member Countries 600.00 – – – – 600.00 Adopting the Supply and Use Framework Towards 1993 System of National Accounts Compliance in Selected Developing Member Countries 800.00 – – – – 800.00 Developing a Computable General Equilibrium Modeling Framework for Analyzing the Impacts of Power Trading Between Mongolia and the People’s Republic of China – – – – 150.00 PRC RPRF 150.00 Harmonization of Bond Standards in ASEAN+3 – – – – 950.00 EAKPF/ICFF 950.00 Attracting and Managing Foreign Direct Investments in the Transitional Economies of Southeast Asia 225.00 – – – – 225.00 Macroprudential Framework for the Early Detection of Financial Vulnerabilities 225.00 – – – – 225.00
Subtotal 7,893.00 2,000.00 750.00 – 5,670.00 16,313.00
TRAINING Greater Mekong Subregion Phnom Penh Plan for Development Management III (Supplementary) – – – – 900.00 PRC RPRF/ 900.00 New Zealand Strengthening Pro-Poor Policy in the Pacific (Supplementary) 24.00 – – – 232.00 Australia 256.00 Anticorruption Seminars, 2008–2009 450.00 – – – – 450.00 Enhancing Collaboration with Supreme Audit Institutions through Project Procurement– Related Audits 140.00 – – – – 140.00 Capacity Building and Institutional Strengthening of the Free Trade Agreement Units of Selected ASEAN Member Countries – – – – 500.00 PRC RPRF 500.00
TASF JSF RCIF CCF Others Source Total
– = nil or data not applicable; ASEAN = Association of Southeast Asian Nations; ASEAN+3 = Association of Southeast Asian Nations, plus the People’s Republic of China, Japan, and Republic of Korea; CCF = Climate Change Fund; EAKPF = Republic of Korea e-Asia and Knowledge Partnership Fund; GEF = Global Environment Facility; ICFF = Investment Climate Facilitation Fund; JSF = Japan Special Fund; PRC RPRF = People’s Republic of China Regional Cooperation and Poverty Reduction Fund; RCIF = Regional Cooperation and Integration Fund; TASF = Technical Assistance Special Fund.

Asian Development Bank196ST
ATI
STIC
AL
AN
NEX
ES
Capacity Building for Bond Market Development in ASEAN+3 – – 500.00 – – 500.00 Strengthening the Asian Ombudsman Association 900.00 – – – – 900.00 Pacific Financial Technical Assistance Centre 2008–2011 1,000.00 – – – – 1,000.00 Strengthening Governance and Accountability in Pacific Island Countries (Phase 2) – 1,500.00 – – 400.00 Australia 1,900.00 Targeted Capacity Building for Mainstreaming Indigenous Peoples Concerns in Development 600.00 – – – – 600.00 Promoting South Asian Regional Economic Cooperation II 1,500.00 – – – – 1,500.00
Subtotal 4,614.00 1,500.00 500.00 – 2,032.00 8,646.00 OTHERS Core Environment Program and Biodiversity Conservation Corridors Initiative in the Greater Mekong Subregion (Supplementary) 400.00 – – – 6,200.00 PRC RPRF/ 6,600.00 Finland/The Netherlands Development Partnership Program for South Asia (Supplementary) – – – – 588.00 Norway/ 588.00 Sweden Strengthening Country Safeguard Systems (Supplementary) 597.97 – – – – 597.97 Enhancing Gender and Development Capacity in Developing Member Countries – Phase 2 (Supplementary) – – – – 1,000.00 GDCF 1,000.00 Promoting Gender Equality and Women’s Empowerment (Supplementary) – – – – 1,000.00 GDCF 1,000.00 Fighting HIV/AIDS in Asia and the Pacific (Supplementary) – – – – 1,300.00 HIV 1,300.00 Enhancement of Subregional Cooperation in BIMP–EAGA and IMT–GT (Supplementary) 121.00 – – – – 121.00 Energy Sector Strategy and Development 2007 (Supplementary) 1,000.00 – – – – 1,000.00 Private Sector Development Initiative (Supplementary) – – – – 300.00 Australia 300.00 Mainstreaming Environment for Poverty Reduction (Supplementary) – – – – 2,600.00 Poverty and 2,600.00 Environment Fund Rolling Out Air Quality Management in Asia (Supplementary) – – – – 484.63 Sweden 484.63 Promoting Effective Water Management Policies and Practices – Phase 5 (Supplementary) – – – – 1,219.00 CFWS 1,219.00 Promoting South Asian Regional Economic Cooperation (Supplementary) 80.00 – – – – 80.00 Implementation of the Seed Capital Assistance Facility – – – – 4,200.00 GEF 4,200.00 Energy for All Initiative – – – – 2,300.00 The 2,300.00 Netherlands
TASF JSF RCIF CCF Others Source Total
CONTINUED
– = nil or data not applicable; ASEAN = Association of Southeast Asian Nations; ASEAN+3 = Association of Southeast Asian Nations, plus the People’s Republic of China, Japan, and Republic of Korea; BIMP-EAGA = Brunei Darussalam-Indonesia-Malaysia-Philippines East ASEAN Growth Area; CCF = Climate Change Fund; CFWS = Cooperation Fund for the Water Sector; GDCF = Gender and Development Cooperation Fund; GEF = Global Environment Facility; HIV = Cooperation Fund for Fighting HIV/AIDS in Asia and the Pacific; HIV/AIDS = human immunodeficiency virus/acquired immunodeficiency syndrome; IMT-GT = Indonesia-Malaysia-Thailand Growth Triangle; JSF = Japan Special Fund; PRC RPRF = People’s Republic of China Regional Cooperation and Poverty Reduction Fund; RCIF = Regional Cooperation and Integration Fund; TASF = Technical Assistance Special Fund.

197Annual Report 2008STA
TISTICA
L AN
NEXES
Support for Implementation of the Second Governance and Anticorruption Action Plan – – – – 2,600.00 GCF 2,600.00 Strengthening Sound Environmental Management in the Brunei Darussalam, Indonesia, Malaysia, and Philippines East ASEAN Growth Area 1,500.00 – – – – 1,500.00 Strengthening Sound Environmental Management in the Brunei Darussalam, Indonesia, Malaysia, and Philippines East ASEAN Growth Area (Supplementary) – – – – 500.00 GEF 500.00 Integrating Human Trafficking and Safe Migration Concerns for Women and Children into Regional Cooperation – – 1,000.00 – – 1,000.00 Enhancing Transport and Trade Facilitation in the Greater Mekong Subregion – – 1,000.00 – 750.00 Australia/ 1,750.00 PRC RPRF Pyanj River Basin Flood Management 1,600.00 – – – – 1,600.00 Greater Mekong Subregion Flood and Drought Risk Management and Mitigation – 2,000.00 – – – 2,000.00 Comprehensive Midterm Review of the Brunei Darussalam–Indonesia–Malaysia–Philippines East ASEAN Growth Area Road Map to Development 300.00 – – – – 300.00 Asia Regional Integration Center, Phase II 900.00 – – – – 900.00 Institutional Development for Enhanced Subregional Cooperation in the aSEA Region 3,800.00 – – – – 3,800.00 Asian Bonds Online Website Project, Phase II – 900.00 – – – 900.00 HIV Prevention and Infrastructure: Mitigating Risk in the Greater Mekong Subregion – – – – 6,000.00 Australia 6,000.00 Strengthening Southeast Asian Financial Markets – – 650.00 – – 650.00 Enhancing Engagement with Pacific Developing Member Countries 1,500.00 – – – – 1,500.00 Second Northern Greater Mekong Subregion Transport Network Improvement – 1,300.00 – – – 1,300.00 Enhancing Social Protection Initiatives in Developing Member Countries 1,000.00 – – – – 1,000.00 Ban Sok–Pleiku Power Transmission Project in the Greater Mekong Subregion – 1,000.00 – – – 1,000.00 Mekong Water Supply and Sanitation – 400.00 500.00 – 300.00 NET-WFPF 1,200.00 Improved Management of Water Resources in Central Asia – – – – 998.00 MDTF-WFPF 998.00 Central Asia Regional Economic Cooperation Institute, 2009–2012 4,000.00 – 500.00 – 500.00 PRC RPRF 5,000.00 Thirteenth Agriculture and Natural Resources Research at International Agricultural Research Centers 3,000.00 – – – – 3,000.00 Assessing the Socioeconomic Effects of the Greater Mekong Subregion Projects 950.00 – – – – 950.00 Gender-Responsive Decentralized Governance in Asia 500.00 – – – – 500.00 Strengthening Evidence-Based Policy-Making in the Pacific: Support for Development of National Health Accounts – 1,000.00 – – – 1,000.00 Regional Partnerships for Climate Change Adaptation and Disaster Preparedness – – 1,000.00 – – 1,000.00 Capacity Building for Regional Trade Integration and Facilitation – 900.00 – – – 900.00
TASF JSF RCIF CCF Others Source Total
– = nil or data not applicable, aSEA = archipelagic Southeast Asia, ASEAN = Association of Souteast Asian Nations, CCF = Climate Change Fund, GCF = Governance Coperation Fund, GGEF = Global Environment Facility, HIV = human immunodeficiency virus, JSF = Japan Special Fund, MDTF-WFPF = Multidonor Trust Fund under the Water Financing Partnership Facility, NET-WFPF = The Netherlands Trust Fund for the Water Financing Partnership Facility, PRC RPRF = People’s Republic of China Regional Cooperation and Poverty Reduction Fund, RCIF = Regional Cooperation and Integration Fund, TASF = Technical Assistance Special Fund.

Asian Development Bank198ST
ATI
STIC
AL
AN
NEX
ES
Knowledge and Innovation Support for ADB’s – – – – 2,000.00 NET-WFPF/ 2,000.00 Water Financing Program MDTF-WFPF Expanding the Implementation of the Energy Efficiency Initiative in Developing Member Countries – – – 3,000.00 – 3,000.00 Regional Knowledge and Partnership Networks for Poverty Reduction and Inclusive Growth – – – – 1,000.00 EAKPF/ 1,000.00 PRC RPRF Capturing and Transferring Air Quality Management Knowledge in Asia – 500.00 – – – 500.00 Improving Connectivity and Destination Management of Cultural and Natural Resources in the South Asia Subregion – – 2,000.00 – – 2,000.00 Enhancing Financial Disclosure Standards in Armenia, Azerbaijan, and Georgia – – – – 600.00 ICFF 600.00 Strengthening Public Financial Management in Pacific Developing Member Countries 1,500.00 – – – – 1,500.00 Regional Stocktaking and Mapping of Disaster Risk Reduction Interventions for Asia and the Pacific 400.00 – – – – 400.00 Rural Information and Communication Technology Policy Advocacy, Knowledge Sharing, and Capacity Building – – – – 500.00 EAKPF 500.00 Impact of Maternal and Child Health Private Expenditure on Poverty and Inequity 300.00 – – – 326.00 Australia 626.00 Promoting Inclusive Growth through Business Development at the Base of the Pyramid 650.00 – – – – 650.00 Accelerating the Implementation of the Core Agriculture Support Program 1,500.00 – – – 500.00 PRC RPRF 2,000.00
Subtotal 25,598.97 8,000.00 6,650.00 3,000.00 37,765.63 81,014.60 TOTAL 42,641.97 13,700.00 8,920.00 3,000.00 48,517.63 116,779.60 – = nil or data not applicable, CCF = Climate Change Fund, EAKPF = Republic of Korea e-Asia and Knowledge Partnership Fund, ICFF = Investment Climate Facilitation Fund, JSF = Japan Special Fund, MDTF-WFPF = Multidonor Trust Fund under the Water Financing Partnership Facility, NET-WFPF = The Netherlands Trust Fund for the Water Financing Partnership Facility, PRC RPRF = People’s Republic of China Regional Cooperation and Poverty Reduction Fund, RCIF = Regional Cooperation and Integration Fund, TASF = Technical Assistance Special Fund.
TASF JSF RCIF CCF Others Source Total
CONTINUED

199Annual Report 2008STA
TISTICA
L AN
NEXES
Statistical Annex 21 NET TRANSFER OF RESOURCES (ORDINARY CAPITAL RESOURCES AND ASIAN DEVELOPMENT FUND),a, b 2006–2008 ($ million)
OCR ADF
2006 2007 2008 2006 2007 2008
Afghanistan 9.54 4.92 8.37 63.62 91.08 46.78 Armenia – – – – – 8.03 Azerbaijan 3.92 42.35 2.87 4.03 12.98 8.62 Bangladesh 53.00 20.07 87.47 53.64 79.19 237.99
Bhutan (1.90) – – 2.37 6.43 0.87 Cambodia – – 6.95 45.06 45.65 89.16 China, People’s Republic of 517.25 607.60 703.60 – – –
Cook Islands – – – (0.34) (0.72) 0.40 Fiji Islands 2.62 1.89 1.69 – – – Georgia – 24.75 (1.76) – – 69.86 Hong Kong, China – – – – – –
India 264.28 1,154.77 1,246.38 – – – Indonesia 12.15 156.68 (69.88) 67.44 91.50 13.37 Kazakhstan 118.29 35.15 (47.04) (1.51) (49.32) (0.26)
Kiribati – – – (0.10) (0.25) (0.29)Korea, Republic of (19.32) (20.47) (26.23) – – – Kyrgyz Republic – – – 35.76 21.35 11.19
Lao People’s Democratic Republic 11.49 14.77 0.72 49.21 47.60 13.86 Malaysia (66.85) (37.11) (51.10) – – – Maldives – 1.46 (0.18) 3.63 3.72 0.56
Marshall Islands (0.22) (0.68) (0.47) (0.51) (2.17) (1.24)Micronesia, Federated States of – – 0.05 1.94 2.83 2.22 Mongolia (5.00) (0.68) 7.17 18.36 12.02 8.97
Myanmar – – – – – – Nauru – – (2.32) – – – Nepal (5.99) (6.11) (11.93) 62.45 43.98 (2.40)
Pakistan 404.94 345.29 1,037.63 56.07 228.84 377.72 Papua New Guinea (38.76) (30.21) (2.62) 3.31 (5.92) (10.90)Philippines 302.15 80.96 237.15 (33.70) (35.08) (42.14)
Samoa – – – (1.99) (2.47) (1.81)Singapore – – – – – – Solomon Islands – – – 2.35 1.70 (2.23)
Sri Lanka 6.99 (15.54) 67.38 66.39 58.07 52.24 Taipei,China – – – – – – Tajikistan – – – 34.05 36.80 46.87
Thailand (117.43) (50.87) (13.56) (3.35) (4.19) (4.63)Timor-Leste – – – – – –Tonga – – – (1.46) (1.55) (1.63)
Turkmenistan – – – – – – Tuvalu – – – 1.14 1.07 0.28 Uzbekistan 27.59 12.81 7.01 (0.05) (0.03) 2.51
Vanuatu – – – (1.08) (1.28) (1.74)Viet Nam (7.31) 27.55 (14.34) 139.44 138.85 187.03 Regional 14.20 7.71 17.63 0.15 0.31 0.55
TOTALc 1,485.65 2,377.04 3,190.63 666.33 820.98 1,109.79
– = nil, ( ) = negative, ADF = Asian Development Fund, OCR = ordinary capital resources. a Net transfer of resources for OCR defined as loan disbursements less principal repayments/prepayments and interest/charges received. Includes nonsovereign loans
and net equity investments. b Net transfer of resources for ADF defined as loan disbursements less principal repayments and interest/charges received. c Totals may not add up because of rounding.

Asian Development Bank200ST
ATI
STIC
AL
AN
NEX
ES
Statistical Annex 22 NET TRANSFER OF RESOURCES (ORDINARY CAPITAL RESOURCES AND ASIAN DEVELOPMENT FUND),a 1999–2008 ($ million)
1999–2003 Average 2004 2005 2006 2007 2008
Afghanistan 27.51 42.13 54.17 73.16 96.00 55.15 Armenia – – – – – 8.03 Azerbaijan – – 0.50 7.95 55.33 11.49 Bangladesh 117.84 19.54 81.17 106.64 99.26 325.46
Bhutan 5.79 5.28 10.34 0.47 6.43 0.87 Cambodia 53.07 70.87 76.73 45.06 45.65 96.11 China, People’s Republic of (164.87) 0.49 544.64 517.25 607.60 703.60
Cook Islands 0.10 1.14 0.53 (0.34) (0.72) 0.40 Fiji Islands (2.62) 4.11 8.30 2.62 1.89 1.69 Georgia – – – – 24.75 68.10 Hong Kong, China – – – – – –
India (291.90) (1,036.01) 457.20 264.28 1,154.77 1,246.38 Indonesia 75.35 (253.74) 142.80 79.59 248.18 (56.51)Kazakhstan (12.25) (85.45) (153.85) 116.78 (14.17) (47.30)
Kiribati 1.04 2.32 1.36 (0.10) (0.25) (0.29)Korea, Republic of (621.21) (66.84) (1,756.33) (19.32) (20.47) (26.23)Kyrgyz Republic 39.80 50.36 25.10 35.76 21.35 11.19
Lao People’s Democratic Republic 38.61 31.00 72.84 60.70 62.37 14.58 Malaysia (47.15) (59.48) (52.99) (66.85) (37.11) (51.10)Maldives 2.47 0.94 3.66 3.63 5.18 0.38
Marshall Islands 6.55 0.40 (0.26) (0.73) (2.85) (1.71)Micronesia, Federated States of 2.93 0.63 1.24 1.94 2.83 2.27 Mongolia 31.81 38.54 20.56 13.36 11.34 16.14
Myanmar (0.30) – – – – – Nauru 0.42 – – – – (2.32)Nepal 25.65 (23.35) (2.79) 56.46 37.87 (14.33)
Pakistan 43.79 (862.98) 242.91 461.01 574.13 1,415.35 Papua New Guinea (6.66) (14.67) (9.52) (35.45) (36.13) (13.52)Philippines (160.89) (218.54) (118.94) 268.45 45.88 195.01
Samoa (0.91) (0.17) (0.35) (1.99) (2.47) (1.81)Singapore – – – – – – Solomon Islands (1.04) (0.71) 1.16 2.35 1.70 (2.23)
Sri Lanka 94.77 116.30 122.70 73.38 42.53 119.62 Taipei,China – – – – – – Tajikistan 10.56 19.00 25.22 34.05 36.80 46.87
Thailand (426.45) (102.22) (394.42) (120.78) (55.06) (18.19)Timor-Leste – – – – – – Tonga 2.45 (1.26) (1.37) (1.46) (1.55) (1.63)
Turkmenistan – – – – – – Tuvalu 0.79 0.01 0.06 1.14 1.07 0.28 Uzbekistan 30.26 70.82 69.49 27.54 12.78 9.52
Vanuatu 3.37 (0.92) (0.93) (1.08) (1.28) (1.74)Viet Nam 216.88 167.59 181.62 132.13 166.40 172.69 Regional 1.63 (6.32) (27.65) 14.35 8.02 18.18
TOTALb (902.80) (2,091.19) (375.08) 2,151.98 3,198.02 4,300.42
– = nil, ( ) = negative.a Net transfer of resources defined as loan disbursements less principal repayments/prepayments and interest/charges received. Includes private sector loans and net
equity investments.b Totals may not add up because of rounding.

201Annual Report 2008STA
TISTICA
L AN
NEXES
Statistical Annex 23 ASIAN DEVELOPMENT FUND RESOURCES AND COMMITMENT AUTHORITY
ADF-CONTRIBUTED RESOURCES ($ million; as of 31 December 2008) Change in 2008
Valued as of Exchange Rate Net Valued as of 31 December 2007 Addition Adjustment Change 31 December 2008 ($ equivalent) ($ equivalent) ($ equivalent) ($ equivalent) ($ equivalent) (SDR equivalenta)
Australia 1,608.81 66.08 (357.40) (291.32) 1,317.49 851.20Austria 263.21 2.34 (12.06) (9.72) 253.49 163.77Belgium 237.41 7.04 (11.51) (4.47) 232.94 150.50Brunei – 9.50 – 9.50 9.50 6.14Canada 1,956.37 50.47 (386.18) (335.71) 1,620.66 1,047.06China, People’s Republic of 21.00 7.00 – 7.00 28.00 18.09Denmark 267.76 9.54 (13.04) (3.50) 264.26 170.73Finland 148.61 5.33 (7.30) (1.97) 146.64 94.74France 1,370.27 48.90 (59.81) (10.91) 1,359.36 878.25Germany 2,009.17 14.41 (91.84) (77.43) 1,931.74 1,248.05Hong Kong, China 49.98 4.48 – 4.48 54.46 35.18Indonesia 14.96 0.00 – – 14.96 9.67Ireland 25.51 9.10 (2.14) 6.96 32.47 20.98Italy 841.34 122.57 (48.28) 74.29 915.63 591.56Japan 12,414.47 299.40 3,046.02 3,345.42 15,759.89 10,182.05Korea, Republic of 267.95 29.88 (80.24) (50.36) 217.59 140.58Luxembourg 49.08 1.02 (2.28) (1.26) 47.82 30.89Malaysia 11.69 1.41 (0.67) 0.74 12.43 8.03Nauru 1.93 0.00 – – 1.93 1.25The Netherlands 808.74 29.78 (40.17) (10.39) 798.35 515.79New Zealand 127.80 4.96 (32.43) (27.47) 100.33 64.82Norway 227.65 10.63 (54.84) (44.21) 183.44 118.52Portugal 92.46 6.14 (4.89) 1.25 93.71 60.54Singapore 7.97 1.17 (0.01) 1.16 9.13 5.90Spain 379.13 18.84 (18.76) 0.08 379.21 245.00Sweden 325.34 14.30 (60.45) (46.15) 279.19 180.38Switzerland 407.56 12.13 24.87 37.00 444.56 287.22Taipei,China 55.83 5.16 – 5.16 60.99 39.40Thailand 9.52 0.84 (1.34) (0.50) 9.02 5.83Turkey 107.63 0.36 – 0.36 108.00 69.77United Kingdom 1,149.60 52.20 (333.78) (281.58) 868.02 560.80United States 3,419.61 69.58 – 69.58 3,489.20 2,254.28
TOTAL 28,678.39 914.54 1,451.48 2,366.02 31,044.41 20,056.97
ADF COMMITMENT AUTHORITY ($ million; as of 31 December 2008)
2007 2008
Carryover from ADF VIII Commitment Authorityb 126.89 124.43 ADF IX Contributionsc 2,144.38 2,976.46 ADF VIII Contributions 164.58 161.62 OCR Net Income Transfer 120.00 160.00 Expanded Advance Commitment Authority 2,979.70 3,895.73 Loan Savings and Cancellations 890.82 1,133.27 Credits from Accelerated Note Encashment Program – 62.97 Less: Provision for Disbursement Riskd 157.88 158.42 Provision for Foreign Exchange Volatilitye – 15.23 Total ADF IX Commitment Authority 6,268.49 8,371.29 Less: Loans and Grants Committedf 5,833.10 8,248.68
ADF Commitment Authority Available for Future Commitments 435.39 122.61
– = data not applicable, ADF = Asian Development Fund, OCR = ordinary capital resources. Note: Totals may not add up because of rounding.a Refers to the special drawing rights (SDR) equivalent of the US dollar amount valued at the rate of $1.547810 per SDR as of 31 December 2008.b The US dollar equivalent of SDR80.39 million at each year-end exchange rates.c Contributions received to finance forgone interest of grants are excluded as they have been incorporated in the computation of the Expanded Advance Commitment
Authority.d Applies to contribution and net income transfer received prior to the adoption of the new ADF Financial Framework approved in December 2007.e Represents an allowance to cover the shortfall in the commitment authority due to exchange rate fluctuation during the last 3 months of 2008. f Loans and grants approved from 1 January 2005 to 31 December 2008.

Asian Development Bank202ST
ATI
STIC
AL
AN
NEX
ES
Statistical Annex 24 TECHNICAL ASSISTANCE SPECIAL FUND ($ thousand; as of 31 December 2008)
Total Amount Contributions Utilized
Direct Voluntary Contributions Australia 2,484 2,484 Austria 159 159 Bangladesh 47 47
Belgium 1,394 1,394 Canada 3,346 3,346 China, People’s Republic of 1,600 1,600
Denmark 1,963 1,963 Finland 237 237 France 1,698 1,698
Germany 3,315 3,315 Hong Kong, China 100 100 India 3,310 3,310
Indonesia 250 250 Italy 774 774 Japan 47,710 47,710
Korea, Republic of 1,900 1,900 Malaysia 909 909 The Netherlands 1,338 1,338
New Zealand 1,096 1,096 Norway 3,279 3,279 Pakistan 1,736 1,736
Singapore 1,100 1,100 Spain 190 190 Sri Lanka 6 6
Sweden 861 861 Switzerland 1,035 1,035 Taipei,China 200 200
United Kingdom 5,617 5,617 United States 1,500 1,500
Subtotal 89,154 89,154
Regularized Replenishment Contributionsa 432,617 415,934
Transfer to Asian Development Fund (3,472) (3,472)
Allocation from OCR Net Incomeb 884,257 798,234
Subtotal 1,313,402 1,210,696
TOTAL 1,402,556 1,299,850
( ) = negative, OCR = ordinary capital resources. a Represents Technical Assistance Special Fund (TASF) portion of contributions to the replenishment of the Asian Development Fund and the TASF authorized by
Board of Governors’ Resolutions 182, 214, and 300 at historical values. b Includes income, repayments, and reimbursements to the TASF since 1980, including investment holding gains (losses).

203Annual Report 2008STA
TISTICA
L AN
NEXES
Statistical Annex 25 JAPAN SPECIAL FUND—Regular and Supplementary Contributions Statement of Activities and Change in Net Assets ($ million)
1988–2002a 2003 2004 2005 2006 2007 2008 Total
Contributions Committed 836.0 16.6 24.2 27.3 24.5 27.7 17.4 973.7 Revenue 129.0 3.3 4.3 7.1 10.7 12.0 6.6 173.0
Total 965.0 19.9 28.5 34.4 35.2 39.7 24.0 1,146.7
Transfer to Cooperation Fund for Regional Trade and Financial Security Initiative – – (1.0) – – – – (1.0)Expenses 767.2 39.6 19.7 35.9 51.1 33.7 55.1 1,002.3 Exchange Gain (Loss) (25.2) (0.3) 1.2 (0.8) (0.1) – 0.2 (25.0)Translation Adjustments (12.5) – – – – – – (12.5)
Change in Net Assets 160.1 (20.0) 9.0 (2.3) (16.0) 6.0 (30.9) 105.9
– = nil, ( ) = negative.a Prior years’ amounts have been restated to conform with the 1995 presentation.
Statistical Annex 26 JAPAN SPECIAL FUND—Asian Currency Crisis Support Facility Statement of Activities and Change in Net Assets ($ million)
1999–2003 2004 2005 2006 2007 2008 Total
Contributions Committed 241.0a – – – – – 241.0 Revenue 2.8 0.5 1.1 1.7 1.8 1.1 9.0
Total 243.8 0.5 1.1 1.7 1.8 1.1 250.0
Transfer to Japan Fund for Poverty Reduction (90.0) – – – – – (90.0)Interest Payment Assistance Written Back 33.2 – – – – – 33.2 Expenses 131.5 (0.9) (0.8) (0.4) – (0.4) 129.0 Exchange Gain (Loss) (1.7) – – – – – (1.7)Translation Adjustments (26.3) – – – – – (26.3)
Change in Net Assets 27.5 1.4 1.9 2.1 1.8 1.5 36.2
– = nil, ( ) = negative. a A guarantee facility is provided under the Asian Currency Crisis Support Facility for which the Government of Japan has made available noninterest-bearing, non-
negotiable notes in the amount of 360 billion yen, encashable by ADB at any time to meet a call on any guarantee. In the absence of any concluded guarantee, the note was returned to the Government of Japan on 25 March 2002.

Asian Development Bank204ST
ATI
STIC
AL
AN
NEX
ES
Statistical Annex 27 JAPAN FUND FOR POVERTY REDUCTION, 2008
Amount Project Name ($ thousand)
Afghanistan Development of Mini Hydropower Plants in Badakhshan and Bamyan Provinces 12,000 Lao People’s Democratic Republic Alternative Livelihood for Upland Ethnic Groups in Houaphanh Province 1,820 Micronesia, Federated States of Weno Water Supply Well Remediation 980 Mongolia Energy Conservation and Emissions Reduction from Poor Households 2,000 Poverty Reduction through Community-Based Natural Resource Management 2,000 Water Point and Extension Station Establishment for Poor Herding Families 2,000 Community-Based Local Road Upgrading and Maintenance in the Western Region of Mongolia 2,000 Philippines Developing Microinsurance 1,000 Sri Lanka Improvement of Rural Access Roads and Livelihood Development for the Poor 2,000 Tajikistan Community Participatory Flood Management 3,000 Viet Nam Demand–Driven Skills Training for Poverty Reduction in the Cuu Long (Mekong) River Delta 1,300 Livelihood Improvement of Vulnerable Ethnic Minority Communities Affected by the Song Bung 4 Hydropower Project in Quang Nam Province 2,000 Community-Based Early Childhood Care and Development 1,900 TOTAL 34,000

205Annual Report 2008STA
TISTICA
L AN
NEXES
Statistical Annex 28 PROJECTS WITH ADB-ADMINISTERED GRANT FINANCING, 2008 APPROVALS
Amount ($ thousand)
Project Name Technical Soft Loan Assistance Component
BILATERAL TRUST FUNDS
Australia CAM Road Asset Management 4,800.00 LAO Sector-Wide Approach in Education Sector Development (Supplementary) 477.00 SOL Road Improvement Sector (Supplementary) 469.88 TUV Capacity Building for Taxation Reforms (Supplementary) 270.00 TUV Capacity Building for Public Financial Management 57.75 REG Enhancing Effective Regulation of Water and Energy Infrastructure and Utility Services (Supplementary) 700.00 REG Enhancing Transport and Trade Facilitation in the Greater Mekong Subregion 250.00 REG HIV Prevention and Infrastructure: Mitigating Risk in the Greater Mekong Subregion 6,000.00 REG Impact of Maternal and Child Health Private Expenditure on Poverty and Inequity 326.00 REG Strengthening Governance and Accountability in Pacific Island Countries (Phase 2) 400.00 REG Strengthening Pro-Poor Policy in the Pacific (Supplementary) 232.00 REG Private Sector Development Initiative (Supplementary) 300.00 REG Strengthening Pacific Economic Analysis and Policy Development 400.00
Subtotal 9,412.75 5,269.88
Canada BAN Emergency Disaster Damage Rehabilitation (Sector) 10,000.00
Subtotal 10,000.00
Second Danish Cooperation Fund for Renewable Energy and Energy Efficiency in Rural Areas IND Facilitating the Operations of the Energy Conservation Fund “Energy Smart” in Madhya Pradesh 1,700.00
Subtotal 1,700.00
Finland REG Strengthening Coastal and Marine Resources Management in the Coral Triangle of the Pacific (Phase 1) 550.00 REG Core Environment Program and Biodiversity Conservation Corridors Initiative in the Greater Mekong Subregion (Supplementary) 4,900.00
Subtotal 5,450.00
France VIE Ho Chi Minh City Water Supply 1,500.00
Subtotal 1,500.00
Japan–Asian Clean Energy Fund under the Clean Energy Financing Partnership Facility BHU Green Power Development 1,000.00
1,000.00 Republic of Korea e-Asia and Knowledge Partnership Fund LAO Piloting Community e-Centers for Better Health 500.00 NEP Knowledge Transfer for Public Procurement 500.00 PHI Capacity Building for Housing Microfinance (Supplementary) 500.00 THA Capacity Building and School Networking for Educational Services (e-Learning) in Thailand 500.00 VIE Geo-Information Technology for Hazard Risk Assessment 500.00 REG Harmonization of Bond Standards in ASEAN+3 500.00 REG Knowledge Sharing on Infrastructure Public–Private Partnerships in Asia 500.00 REG Rural Information and Communication Technology Policy Advocacy, Knowledge Sharing, and Capacity Building 500.00 REG Regional Knowledge and Partnership Networks for Poverty Reduction and Inclusive Growth 500.00
Subtotal 4,500.00
ASEAN+3 = Association of Southeast Asian Nations plus the People’s Republic of China, Japan, and Republic of Korea; BAN = Bangladesh; BHU = Bhutan; CAM = Cambodia; IND = India; LAO = Lao People’s Democratic Republic; NEP = Nepal; PHI = Philippines; REG = regional; SOL = Solomon Islands; THA = Thailand; TUV = Tuvalu; VIE = Viet Nam.

Asian Development Bank206ST
ATI
STIC
AL
AN
NEX
ES
Amount ($ thousand)
Project Name Technical Soft Loan Assistance Component
CONTINUED
The Netherlands INO Instititutional Strengthening for Integrated Water Resources Management in the 6 Cis River Basin Territory 5,000.00 VIE Viet Nam Water Sector Review 550.00 REG Core Environment Program and Biodiversity Conservation Corridors Initiative in the Greater Mekong Subregion (Supplementary) 800.00 REG Energy for All Initiative 2,300.00
Subtotal 8,650.00
The Netherlands Trust Fund for the Water Financing Partnership Facility NEP Secondary Towns Integrated Urban Environmental Improvement 146.00 SRI Dry Zone Urban Water and Sanitation 2,000.00 VIE Hue Water Supply 1,500.00 VIE Hai Phong Water Supply 1,000.00 REG Mekong Water Supply and Sanitation 300.00 REG Knowledge and Innovation Support for ADB’s Water Financing Program 800.00
Subtotal 3,746.00 2,000.00
New Zealand REG Greater Mekong Subregion Phnom Penh Plan for Development Management III (2nd Supplementary) 400.00
Subtotal 400.00
Norway REG Development Partnership Program for South Asia (Supplementary) 300.00
Subtotal 300.00
People’s Republic of China Regional Cooperation and Poverty Reduction Fund REG Developing a Computable General Equilibrium Modeling Framework for Analyzing the Impacts of Power Trading between Mongolia and the People’s Republic of China 150.00 REG Central Asia Regional Economic Cooperation Institute, 2009–2012 500.00 REG Development Study of GMS Economic Corridors (Supplementary) 400.00 REG Enhancing Transport and Trade Facilitation in the Greater Mekong Subregion 500.00 REG Capacity Building and Institutional Strengthening of the Free Trade Agreement Units of Selected ASEAN Member Countries 500.00 REG Greater Mekong Subregion Phnom Penh Plan for Development Management III (Supplementary) 500.00 REG Supporting the Boao Forum for Asia 500.00 REG Core Environment Program and Biodiversity Conservation Corridors Initiative in the Greater Mekong Subregion (Supplementary) 500.00 REG Regional Knowledge and Partnership Networks for Poverty Reduction and Inclusive Growth 500.00 REG Accelerating the Implementation of the Core Agriculture Support Program 500.00
Subtotal 4,550.00
Spain PRC Dryland Sustainable Agriculture 350.00 REG Managing the Cities in Asia (Supplementary) 2,000.00
Subtotal 2,000.00 350.00
ASEAN = Association of Southeast Asian Nations, GMS = Greater Mekong Subregion, INO = Indonesia, NEP = Nepal, PRC = People’s Republic of China, REG = regional, SRI = Sri Lanka, VIE = Viet Nam.

207Annual Report 2008STA
TISTICA
L AN
NEXES
Amount ($ thousand)
Project Name Technical Soft Loan Assistance Component
Sweden REG Development Partnership Program for South Asia (Supplementary) 288.00 REG Rolling Out Air Quality Management in Asia (Supplementary) 484.63
Subtotal 772.63 Switzerland BAN Post Literacy and Continuing Education (Supplementary) 2,500.00 BAN Skills Development 6,000.00
Subtotal 8,500.00
United Kingdom CAM Health Sector Support (Supplementary) 1,800.00 NEP Rural Reconstruction and Rehabilitation Sector Development Project (Supplementary) 20,000.00 VIE Making Markets Work Better for the Poor (Phase 2) 8,000.00 REG A Development Framework for Sustainable Urban Transport (Supplementary) 120.00 REG A Development Framework for Sustainable Urban Transport (2nd Supplementary) 100.00
Subtotal 8,220.00 21,800.00
MULTIDONOR COOPERATION FUNDS/PARTNERSHIPS
Clean Energy Fund PHI Pasuquin East Wind Farm Development 200.00 PRC Railway Sector Energy Efficiency Strategy 800.00 PRC Capacity Building for Energy Efficiency Implementation 800.00 THA Mainstreaming Energy Efficiency Measures in Thai Municipalities 1,000.00 REG Promoting Energy Efficiency in the Pacific 1,200.00
Subtotal 3,200.00 800.00 Cooperation Fund for Fighting HIV/AIDS in Asia and the Pacific MON HIV/AIDS Prevention in ADB Infrastructure Projects and the Mining Sector 1,000.00 REG Fighting HIV/AIDS in Asia and the Pacific (Supplementary) 1,000.00 REG Fighting HIV/AIDS in Asia and the Pacific (2nd Supplementary) 300.00
Subtotal 2,300.00
Cooperation Fund for the Water Sector PAK Sindh Basic Urban Services (Supplementary) 80.00 SRI Institutional Strengthening for Decentralized Service Delivery in the Water Sector 50.00 REG Promoting Effective Water Management Policies and Practices – Phase 5 (Supplementary) 1,219.00
Subtotal 1,349.00
European Commission SOL Domestic Maritime Support (Sector) 5,250.00 SOL Establishment of the Solomon Islands Maritime Safety Administration 600.00
Subtotal 600.00 5,250.00
Gender and Development Cooperation Fund PHI Supporting Governance in Justice Sector Reform in the Philippines 500.00 REG Enhancing Gender and Development Capacity in Developing Member Countries – Phase 2 (Supplementary) 1,000.00 REG Promoting Gender Equality and Women’s Empowerment (Supplementary) 1,000.00
Subtotal 2,500.00
BAN = Bangladesh, CAM = Cambodia, HIV/AIDS = human immunodeficiency virus/acquired immunodeficiency syndrome, MON = Mongolia, NEP = Nepal, PAK = Pakistan, PHI = Philippines, PRC = People’s Republic of China, REG = regional, SOL = Solomon Islands, SRI = Sri Lanka, THA = Thailand, VIE = Viet Nam.

Asian Development Bank208ST
ATI
STIC
AL
AN
NEX
ES
Amount ($ thousand)
Project Name Technical Soft Loan Assistance Component
CONTINUED
Governance Cooperation Fund REG Support for Implementarion of the Second Governance and Anticorruption Action Plan 2,600.00
Subtotal 2,600.00
Global Environment Facility INO Integrated Citarum Water Resources Management (Supplementary) 200.00 KGZ Southern Agriculture Area Development (Supplementary) 2,500.00 PRC Ningxia Integrated Ecosystem and Agricultural Development 4,545.00 TAJ Rural Development (Supplementary) 3,500.00 UZB Land Improvement 3,000.00 REG Implementation of the Seed Capital Assistance Facility 4,200.00 REG Strengthening Coastal and Marine Resources Management in the Coral Triangle of the Pacific (Phase 1) 300.00 REG Strengthening Sound Environmental Management in the Brunei Darussalam, Indonesia, Malaysia, and Philippines East ASEAN Growth Area (Supplementary) 500.00
Subtotal 5,200.00 13,545.00 Investment Climate Facilitation Fund REG Harmonization of Bond Standards in ASEAN+3 450.00 REG Minimizing Foreign Exchange Settlement Risk in the ASEAN+3 Region: Support for Group of Experts 850.00 REG Enhancing Financial Disclosure Standards in Armenia, Azerbaijan, and Georgia 600.00
Subtotal 1,900.00 Poverty and Environment Fund REG Mainstreaming Environment for Poverty Reduction (Supplementary) 2,600.00
Subtotal 2,600.00 Water Financing Partnership Facility IND Instititutional Development of Integrated Water Resources Management in Orissa 250.00 IND Integrated Flood and River Erosion Management – Arunachal Pradesh 750.00 IND Integrated Flood and Riverbank Erosion Risk Management – Assam (Phase 2): Processing and Institutional Strengthening 750.00 INO Metropolitan Sanitation Management and Health (Supplementary) 500.00 INO Instititutional Strengthening for Integrated Water Resources Management in the 6 Cis River Basin Territory 2,000.00 PHI Water District Development Sector 1,200.00 PRC Enabling the Protection of Jiaozhou Bay Water Quality and Wetland Ecosystem 400.00 PRC Preparing National Guidelines for Eco-Compensation in River Basins and a Framework for Soil Pollution Management 400.00 PRC River Basin Water Resources Allocation and Management Policy 250.00 PRC Urban Wastewater Reuse and Sludge Utilization Policy Study 300.00 UZB Surkhandarya Water Supply and Sanitation 1,500.00 VIE Da Nang Water Supply 1,500.00 VIE Developing Benefit Sharing Mechanisms for People Adversely Affected by Power Generation Projects (Supplementary) 240.00 REG Improved Management of Water Resources in Central Asia 998.00 REG Knowledge and Innovation Support for ADB’s Water Financing Program 1,200.00
Subtotal 10,738.00 1,500.00
TOTAL 84,188.38 70,014.88
ASEAN = Association of Southeast Asian Nations; ASEAN+3 = ASEAN plus the People’s Republic of China, Japan, and Republic of Korea; IND = India; INO = Indonesia; KGZ = Kyrgyz Republic; PHI = Philippines; PRC = People’s Republic of China; REG = regional; TAJ = Tajikistan; UZB = Uzbekistan; VIE = Viet Nam.

209Annual Report 2008STA
TISTICA
L AN
NEXES
Statistical Annex 29 CONTRACTS AWARDED BY COUNTRY OF ORIGIN,a 2008 PROJECT LOANS—ORDINARY CAPITAL RESOURCES (amounts in $ million) Goods, Related Services, and Civil Works Consulting Services Total Procurement
Amount % Distribution Amount % Distribution Amount % Distribution
Afghanistan – – – – – – Armenia – – – – – – Australia 0.28 0.01 5.47 5.99 5.75 0.18 Austria – – – – – – Azerbaijan 7.84 0.26 – – 7.84 0.25 Bangladesh 7.24 0.24 – – 7.24 0.23 Belgium 0.70 0.02 – – 0.70 0.02 Bhutan – – – – – – Brunei Darussalam – – – – – – Cambodia – – – – – – Canada 1.95 0.06 1.64 1.79 3.58 0.12 China, People’s Republic of 1,236.83 40.99 2.46 2.69 1,239.29 39.86 Cook Islands – – – – – – Denmark 0.98 0.03 – – 0.98 0.03 Fiji Islands 6.18 0.20 – – 6.18 0.20 Finland 3.71 0.12 – – 3.71 0.12 France 0.41 0.01 6.78 7.42 7.19 0.23 Georgia – – – – – – Germany 122.20 4.05 1.36 1.49 123.56 3.97 Hong Kong, China 1.20 0.04 1.67 1.83 2.87 0.09 India 695.93 23.06 28.03 30.68 723.96 23.29 Indonesia 106.10 3.52 4.51 4.93 110.60 3.56 Ireland – – – – – – Italy 2.75 0.09 – – 2.75 0.09 Japan 64.67 2.14 0.68 0.74 65.35 2.10 Kazakhstan 10.57 0.35 – – 10.57 0.34 Kiribati – – – – – – Korea, Republic of 286.99 9.51 1.16 1.27 288.16 9.27 Kyrgyz Republic – – 0.01 0.01 0.01 0.00 Lao People’s Democratic Republic – – – – – – Luxembourg 0.37 0.01 – – 0.37 0.01 Malaysia 28.80 0.95 1.06 1.16 29.86 0.96 Maldives – – – – – – Marshall Islands – – – – – – Micronesia, Federated States of – – – – – – Mongolia – – – – – – Myanmar – – – – – – Nauru – – – – – – Nepal – – – – – – The Netherlands 1.31 0.04 2.00 2.18 3.31 0.11 New Zealand – – 0.06 0.06 0.06 0.00 Norway 0.02 0.00 – – 0.02 0.00 Pakistan 151.45 5.02 10.22 11.19 161.67 5.20 Palau – – – – – – Papua New Guinea 10.87 0.36 – – 10.87 0.35 Philippines 25.09 0.83 0.50 0.55 25.59 0.82 Portugal – – – – – – Samoa – – – – – – Singapore 5.44 0.18 3.34 3.65 8.78 0.28 Solomon Islands – – – – – – Spain – – – – – – Sri Lanka 124.39 4.12 6.11 6.69 130.50 4.20 Sweden 0.75 0.02 – – 0.75 0.02 Switzerland 0.32 0.01 – – 0.32 0.01 Taipei,China 0.69 0.02 – – 0.69 0.02 Tajikistan – – – – – – Thailand 11.98 0.40 – – 11.98 0.39 Timor-Leste – – – – – – Tonga – – – – – – Turkey 0.35 0.01 – – 0.35 0.01 Turkmenistan – – – – – – Tuvalu – – – – – – United Kingdom 0.98 0.03 10.44 11.43 11.42 0.37 United States 8.28 0.27 3.47 3.80 11.75 0.38 Uzbekistan 16.14 0.53 0.39 0.43 16.53 0.53 Vanuatu – – – – – – Viet Nam 74.03 2.45 – – 74.03 2.38 Regional – – – – – – International – – – – – –
TOTALb 3,017.74 100.00 91.36 100.00 3,109.09 100.00
– = nil, 0.00 = % is less than 0.01.a Represents the country of origin where the goods are mined, produced, grown, and/or manufactured, based on US dollar value equivalent of contract.b Totals may not add up because of rounding.

Asian Development Bank210ST
ATI
STIC
AL
AN
NEX
ES
Statistical Annex 30 CONTRACTS AWARDED BY COUNTRY OF ORIGIN,a 2008 PROJECT LOANS—ASIAN DEVELOPMENT FUND (amounts in $ million) Goods, Related Services, and Civil Works Consulting Services Total Procurement
Amount % Distribution Amount % Distribution Amount % Distribution
Afghanistan 3.49 0.28 0.01 0.00 3.50 0.25 Armenia 19.45 1.57 2.02 1.47 21.47 1.56 Australia 3.78 0.31 6.07 4.40 9.85 0.71 Austria – – – – – – Azerbaijan 14.30 1.15 3.29 2.39 17.59 1.28 Bangladesh 165.97 13.38 11.45 8.30 177.43 12.88 Belgium 0.05 0.00 – – 0.05 0.00 Bhutan 17.23 1.39 – – 17.23 1.25 Brunei Darussalam – – – – – – Cambodia 13.35 1.08 4.28 3.11 17.64 1.28 Canada 0.08 0.01 3.31 2.40 3.39 0.25 China, People’s Republic of 80.60 6.50 1.11 0.80 81.71 5.93 Cook Islands – – – – – – Denmark – – – – – – Fiji Islands – – – – – – Finland 0.11 0.01 – – 0.11 0.01 France 15.46 1.25 1.40 1.01 16.86 1.22 Georgia 69.86 5.63 – – 69.86 5.07 Germany 1.50 0.12 0.43 0.31 1.93 0.14 Hong Kong, China 0.98 0.08 – – 0.98 0.07 India 97.72 7.88 1.75 1.27 99.47 7.22 Indonesia 40.79 3.29 23.41 16.97 64.20 4.66 Ireland – – – – – – Italy 1.16 0.09 – – 1.16 0.08 Japan 11.90 0.96 13.06 9.47 24.96 1.81 Kazakhstan 0.06 0.00 – – 0.06 0.00 Kiribati 0.07 0.01 – – 0.07 0.00 Korea, Republic of 2.21 0.18 8.07 5.85 10.28 0.75 Kyrgyz Republic 8.51 0.69 0.66 0.48 9.16 0.66 Lao People’s Democratic Republic 18.74 1.51 0.82 0.59 19.56 1.42 Luxembourg – – – – – – Malaysia 0.86 0.07 1.14 0.83 2.00 0.15 Maldives 2.74 0.22 0.26 0.19 3.00 0.22 Marshall Islands 0.02 0.00 – – 0.02 0.00 Micronesia, Federated States of 0.98 0.08 – – 0.98 0.07 Mongolia 5.72 0.46 0.13 0.09 5.84 0.42 Myanmar 0.30 0.02 – – 0.30 0.02 Nauru – – – – – – Nepal 37.39 3.02 2.34 1.69 39.73 2.88 The Netherlands 0.45 0.04 3.42 2.48 3.88 0.28 New Zealand 2.53 0.20 0.74 0.53 3.26 0.24 Norway – – – – – – Pakistan 196.79 15.87 4.54 3.29 201.33 14.61 Palau – – – – – – Papua New Guinea 4.28 0.35 0.24 0.17 4.53 0.33 Philippines 0.21 0.02 0.09 0.07 0.31 0.02 Portugal 0.01 0.00 – – 0.01 0.00 Samoa 3.54 0.29 0.61 0.44 4.15 0.30 Singapore 9.09 0.73 – – 9.09 0.66 Solomon Islands 0.02 0.00 – – 0.02 0.00 Spain 0.02 0.00 – – 0.02 0.00 Sri Lanka 89.59 7.23 1.35 0.98 90.95 6.60 Sweden – – 2.30 1.67 2.30 0.17 Switzerland 0.04 0.00 0.10 0.07 0.14 0.01 Taipei,China 0.69 0.06 4.98 3.61 5.67 0.41 Tajikistan 23.50 1.90 – – 23.50 1.71 Thailand 34.83 2.81 – – 34.83 2.53 Timor-Leste – – – – – – Tonga – – – – – – Turkey – – – – – – Turkmenistan – – – – – – Tuvalu – – – – – – United Kingdom 0.50 0.04 8.57 6.21 9.07 0.66 United States 5.89 0.48 22.80 16.53 28.69 2.08 Uzbekistan 1.88 0.15 – – 1.88 0.14 Vanuatu 0.05 0.00 – – 0.05 0.00 Viet Nam 230.70 18.60 3.17 2.30 233.86 16.97 Regional – – – – – – International – – – – – –
TOTALb 1,239.99 100.00 137.92 100.00 1,377.90 100.00
– = nil, 0.00 = % is less than 0.01.a Represents the country or origin where the goods are mined, produced, grown and/or manufactured, based on US dollar value equivalent of contract.b Totals may not add up because of rounding.

211Annual Report 2008STA
TISTICA
L AN
NEXES
Statistical Annex 31 CONTRACTS AWARDED BY COUNTRY OF ORIGIN,a 2008 PROJECT LOANS—ORDINARY CAPITAL RESOURCES AND ASIAN DEVELOPMENT FUND COMBINED (amounts in $ million) Goods, Related Services, and Civil Works Consulting Services Total Procurement
Amount % Distribution Amount % Distribution Amount % Distribution
Afghanistan 3.49 0.08 0.01 0.00 3.50 0.08 Armenia 19.45 0.46 2.02 0.88 21.47 0.48 Australia 4.06 0.10 11.54 5.03 15.60 0.35 Austria – – – – – – Azerbaijan 22.13 0.52 3.29 1.44 25.43 0.57 Bangladesh 173.21 4.07 11.45 5.00 184.66 4.12 Belgium 0.76 0.02 – – 0.76 0.02 Bhutan 17.23 0.40 – – 17.23 0.38 Brunei Darussalam – – – – – – Cambodia 13.35 0.31 4.28 1.87 17.64 0.39 Canada 2.03 0.05 4.95 2.16 6.98 0.16 China, People’s Republic of 1,317.42 30.94 3.57 1.56 1,321.00 29.44 Cook Islands – – – – – – Denmark 0.98 0.02 – – 0.98 0.02 Fiji Islands 6.18 0.15 – – 6.18 0.14 Finland 3.82 0.09 – – 3.82 0.09 France 15.88 0.37 8.18 3.57 24.06 0.54 Georgia 69.86 1.64 – – 69.86 1.56 Germany 123.69 2.91 1.80 0.78 125.49 2.80 Hong Kong, China 2.17 0.05 1.67 0.73 3.84 0.09 India 793.64 18.64 29.78 12.99 823.42 18.35 Indonesia 146.89 3.45 27.92 12.18 174.81 3.90 Ireland – – – – – – Italy 3.91 0.09 – – 3.91 0.09 Japan 76.57 1.80 13.74 5.99 90.30 2.01 Kazakhstan 10.62 0.25 – – 10.62 0.24 Kiribati 0.07 0.00 – – 0.07 0.00 Korea, Republic of 289.20 6.79 9.23 4.03 298.43 6.65 Kyrgyz Republic 8.51 0.20 0.67 0.29 9.17 0.20 Lao People’s Democratic Republic 18.74 0.44 0.82 0.36 19.56 0.44 Luxembourg 0.37 0.01 – – 0.37 0.01 Malaysia 29.66 0.70 2.20 0.96 31.87 0.71 Maldives 2.74 0.06 0.26 0.11 3.00 0.07 Marshall Islands 0.02 0.00 – – 0.02 0.00 Micronesia, Federated States of 0.98 0.02 – – 0.98 0.02 Mongolia 5.72 0.13 0.13 0.05 5.84 0.13 Myanmar 0.30 0.01 – – 0.30 0.01 Nauru – – – – – – Nepal 37.39 0.88 2.34 1.02 39.73 0.89 The Netherlands 1.77 0.04 5.42 2.36 7.19 0.16 New Zealand 2.53 0.06 0.79 0.35 3.32 0.07 Norway 0.02 0.00 – – 0.02 0.00 Pakistan 348.24 8.18 14.76 6.44 363.00 8.09 Palau – – – – – – Papua New Guinea 15.15 0.36 0.24 0.11 15.39 0.34 Philippines 25.30 0.59 0.60 0.26 25.89 0.58 Portugal 0.01 0.00 – – 0.01 0.00 Samoa 3.54 0.08 0.61 0.27 4.15 0.09 Singapore 14.53 0.34 3.34 1.46 17.87 0.40 Solomon Islands 0.02 0.00 – – 0.02 0.00 Spain 0.02 0.00 – – 0.02 0.00 Sri Lanka 213.98 5.03 7.47 3.26 221.45 4.94 Sweden 0.75 0.02 2.30 1.00 3.05 0.07 Switzerland 0.36 0.01 0.10 0.04 0.45 0.01 Taipei,China 1.37 0.03 4.98 2.17 6.35 0.14 Tajikistan 23.50 0.55 – – 23.50 0.52 Thailand 46.81 1.10 – – 46.81 1.04 Timor-Leste – – – – – – Tonga – – – – – – Turkey 0.35 0.01 – – 0.35 0.01 Turkmenistan – – – – – – Tuvalu – – – – – – United Kingdom 1.48 0.03 19.01 8.29 20.49 0.46 United States 14.17 0.33 26.28 11.46 40.45 0.90 Uzbekistan 18.01 0.42 0.40 0.17 18.41 0.41 Vanuatu 0.05 0.00 – – 0.05 0.00 Viet Nam 304.72 7.16 3.17 1.38 307.89 6.86 Regional – – – – – – International – – – – – –
TOTALb 4,257.72 100.00 229.28 100.00 4,487.00 100.00
– = nil, 0.00 = % is less than 0.01.a Represents the country or origin where the goods are mined, produced, grown and/or manufactured, based on US dollar value equivalent of contract.b Totals may not add up because of rounding.

Asian Development Bank212ST
ATI
STIC
AL
AN
NEX
ES
Statistical Annex 32 ESTIMATES OF PAYMENT TO SUPPLYING COUNTRIES FOR FOREIGN PROCUREMENT UNDER PROGRAM LENDING,a 2008 Ordinary Capital Resources (OCR) Asian Development Fund (ADF) Combined OCR and ADF
$ million % Distribution $ million % Distribution $ million % Distribution
Afghanistan 2.68 0.10 1.01 0.16 3.70 0.11 Armenia – – – – – – Australia 90.04 3.28 5.88 0.91 95.92 2.83 Austria 9.45 0.34 2.11 0.33 11.55 0.34 Azerbaijan 0.66 0.02 – – 0.66 0.02 Bangladesh 3.67 0.13 0.94 0.15 4.61 0.14 Belgium 37.61 1.37 4.25 0.66 41.86 1.24 Bhutan 0.24 0.01 0.10 0.02 0.35 0.01 Brunei Darussalam 11.45 0.42 – – 11.45 0.34 Cambodia 0.01 0.00 0.17 0.03 0.17 0.01 Canada 53.69 1.96 22.65 3.52 76.34 2.25 China, People’s Republic of 359.35 13.11 94.37 14.66 453.71 13.40 Cook Islands – – – – – – Denmark 5.44 0.20 1.44 0.22 6.88 0.20 Fiji Islands 0.01 0.00 – – 0.01 0.00 Finland 12.27 0.45 2.03 0.31 14.30 0.42 France 41.30 1.51 8.36 1.30 49.66 1.47 Georgia 0.02 0.00 – – 0.02 0.00 Germany 112.38 4.10 18.36 2.85 130.75 3.86 Hong Kong, China 57.94 2.11 18.69 2.90 76.62 2.26 India 50.90 1.86 38.56 5.99 89.45 2.64 Indonesia 101.55 3.70 50.86 7.90 152.41 4.50 Ireland 11.82 0.43 0.59 0.09 12.41 0.37 Italy 84.34 3.08 38.98 6.05 123.31 3.64 Japan 417.28 15.22 105.23 16.34 522.51 15.43 Kazakhstan 0.51 0.02 0.19 0.03 0.70 0.02 Kiribati – – – – – – Korea, Republic of 131.52 4.80 20.99 3.26 152.51 4.50 Kyrgyz Republic 0.01 0.00 – – 0.01 0.00 Lao People’s Democratic Republic 0.01 0.00 0.18 0.03 0.18 0.01 Luxembourg 0.28 0.01 0.16 0.02 0.44 0.01 Malaysia 183.39 6.69 64.20 9.97 247.59 7.31 Maldives 0.39 0.01 0.18 0.03 0.57 0.02 Marshall Islands – – – – – – Micronesia, Federated States of – – – – – – Mongolia – – 0.05 0.01 0.05 0.00 Myanmar 3.65 0.13 0.92 0.14 4.56 0.13 Nauru – – – – – – Nepal 1.55 0.06 0.07 0.01 1.62 0.05 The Netherlands 34.46 1.26 4.91 0.76 39.36 1.16 New Zealand 12.64 0.46 1.08 0.17 13.72 0.41 Norway 4.14 0.15 1.29 0.20 5.43 0.16 Pakistan 3.99 0.15 1.70 0.26 5.70 0.17 Palau – – – – – – Papua New Guinea 3.25 0.12 0.01 0.00 3.25 0.10 Philippines 8.65 0.32 2.35 0.36 11.00 0.32 Portugal 1.15 0.04 0.68 0.11 1.83 0.05 Samoa – – – – – – Singapore 326.81 11.92 27.07 4.20 353.88 10.45 Solomon Islands 0.01 0.00 – – 0.01 0.00 Spain 13.13 0.48 2.16 0.34 15.29 0.45 Sri Lanka 4.57 0.17 0.86 0.13 5.43 0.16 Sweden 22.16 0.81 6.68 1.04 28.84 0.85 Switzerland 24.87 0.91 6.88 1.07 31.75 0.94 Taipei,China – – – – – – Tajikistan 0.05 0.00 0.10 0.02 0.15 0.00 Thailand 95.64 3.49 29.87 4.64 125.50 3.71 Timor-Leste – – – – – – Tonga 0.01 0.00 – – 0.01 0.00 Turkey 17.44 0.64 9.26 1.44 26.70 0.79 Turkmenistan 0.51 0.02 0.23 0.04 0.74 0.02 Tuvalu – – – – – – United Kingdom 62.43 2.28 11.97 1.86 74.40 2.20 United States 302.62 11.04 28.65 4.45 331.27 9.79 Uzbekistan 0.47 0.02 2.03 0.31 2.49 0.07 Vanuatu 0.10 0.00 – – 0.10 0.00 Viet Nam 17.11 0.62 4.62 0.72 21.73 0.64 Regional – – – – – – International – – – – – –
TOTALb 2,741.60 100.00 643.89 100.00 3,385.48 100.00
– = nil, 0.00 = % is less than 0.01.a Estimates are based on import data drawn from the latest information available on borrowers’ trade statistics compiled by the International Monetary Fund Direction
of Trade Statistics.b Totals may not add up because of rounding.

213Annual Report 2008STA
TISTICA
L AN
NEXES
Statistical Annex 33 CUMULATIVE CONTRACTS AWARDED BY COUNTRY OF ORIGINa TECHNICAL ASSISTANCE OPERATIONS (amounts in $ million, as of 31 December 2008) ADB’s % Administered % Japan % Total % Own Distri- Trust Distri- Special Distri- Contracts Distri- Resources bution Funds bution Fund bution Awarded bution
Afghanistan 1.25 0.09 1.63 0.31 0.02 0.00 2.91 0.11 Armenia 0.66 0.05 – – – – 0.66 0.02 Australia 163.39 12.31 64.11 12.15 126.09 13.89 353.57 12.80 Austria 1.35 0.10 – – 0.95 0.10 2.30 0.08 Azerbaijan 0.47 0.04 0.25 0.05 0.02 0.00 0.74 0.03 Bangladesh 15.81 1.19 5.13 0.97 6.36 0.70 27.30 0.99 Belgium 4.48 0.34 1.10 0.21 2.26 0.25 7.84 0.28 Bhutan 0.43 0.03 0.07 0.01 0.15 0.02 0.64 0.02 Cambodia 1.90 0.14 3.17 0.60 0.48 0.05 5.55 0.20 Canada 97.52 7.35 45.50 8.62 67.93 7.49 210.91 7.63 China, People’s Republic of 20.15 1.52 4.98 0.94 7.95 0.88 33.09 1.20 Cook Islands 0.09 0.01 0.16 0.03 – – 0.24 0.01 Denmark 12.66 0.95 5.07 0.96 17.95 1.98 35.68 1.29 Fiji Islands 1.27 0.10 0.72 0.14 0.23 0.03 2.22 0.08 Finland 10.22 0.77 6.45 1.22 9.03 1.00 25.71 0.93 France 29.76 2.24 17.88 3.39 23.32 2.57 70.95 2.57 Georgia 0.01 0.00 – – – – 0.01 0.00 Germany 25.46 1.92 16.24 3.08 35.76 3.94 77.45 2.80 Hong Kong, China 30.58 2.30 6.15 1.17 22.02 2.43 58.75 2.13 India 59.91 4.51 24.69 4.68 21.79 2.40 106.42 3.85 Indonesia 18.28 1.38 11.35 2.15 12.33 1.36 41.96 1.52 Ireland 0.20 0.02 – – – – 0.20 0.01 Italy 5.14 0.39 0.84 0.16 2.68 0.30 8.65 0.31 Japan 30.32 2.28 12.06 2.29 28.48 3.14 70.87 2.57 Kazakhstan 1.14 0.09 1.31 0.25 0.13 0.01 2.58 0.09 Kiribati 0.01 0.00 0.05 0.01 0.01 0.00 0.06 0.00 Korea, Republic of 5.03 0.38 1.56 0.30 4.03 0.44 10.61 0.38 Kyrgyz Republic 1.45 0.11 0.48 0.09 0.23 0.02 2.14 0.08 Lao People’s Democratic Republic 3.17 0.24 1.88 0.36 0.98 0.11 6.04 0.22 Malaysia 12.77 0.96 1.37 0.26 4.21 0.46 18.34 0.66 Maldives 0.11 0.01 0.05 0.01 0.03 0.00 0.18 0.01 Marshall Islands 0.19 0.01 0.19 0.04 0.01 0.00 0.38 0.01 Micronesia 0.01 0.00 – – 0.02 0.00 0.03 0.00 Mongolia 1.51 0.11 0.59 0.11 0.75 0.08 2.85 0.10 Myanmar 0.94 0.07 0.71 0.13 0.01 0.00 1.66 0.06 Nauru 0.01 0.00 0.01 0.00 – – 0.02 0.00 Nepal 10.94 0.82 5.04 0.95 2.46 0.27 18.38 0.67 The Netherlands 23.24 1.75 20.34 3.86 28.38 3.13 71.96 2.60 New Zealand 68.19 5.14 20.00 3.79 64.07 7.06 152.26 5.51 Norway 5.34 0.40 4.52 0.86 3.36 0.37 13.21 0.48 Pakistan 27.17 2.05 11.62 2.20 3.81 0.42 42.57 1.54 Palau 0.03 0.00 – – – – 0.03 0.00 Papua New Guinea 1.22 0.09 0.40 0.08 1.51 0.17 3.13 0.11 Philippines 96.42 7.26 24.93 4.72 33.85 3.73 155.28 5.62 Portugal 0.10 0.01 – – 0.09 0.01 0.19 0.01 Samoa 0.86 0.06 0.04 0.01 0.87 0.10 1.77 0.06 Singapore 17.78 1.34 2.96 0.56 10.69 1.18 31.42 1.14 Solomon Islands 0.50 0.04 0.19 0.04 0.22 0.02 0.91 0.03 Spain 5.75 0.43 2.90 0.55 1.02 0.11 9.68 0.35 Sri Lanka 13.17 0.99 3.51 0.66 3.86 0.43 20.50 0.74 Sweden 7.53 0.57 5.77 1.09 9.29 1.02 22.59 0.82 Switzerland 11.21 0.84 6.54 1.24 11.81 1.30 29.56 1.07 Taipei,China 1.08 0.08 0.07 0.01 2.71 0.30 3.85 0.14 Tajikistan 0.47 0.04 1.25 0.24 0.16 0.02 1.88 0.07 Thailand 14.17 1.07 8.19 1.55 12.07 1.33 34.43 1.25 Timor-Leste 0.74 0.06 0.18 0.03 0.10 0.01 1.03 0.04 Tonga 0.32 0.02 0.03 0.01 0.14 0.02 0.49 0.02 Turkey 0.42 0.03 0.27 0.05 0.05 0.01 0.73 0.03 Turkmenistan 0.10 0.01 0.05 0.01 – – 0.15 0.01 Tuvalu 0.06 0.00 – – – – 0.06 0.00 United Kingdom 175.47 13.22 66.50 12.60 134.93 14.87 376.89 13.64 United States 254.94 19.20 87.71 16.63 172.57 19.02 515.26 18.65 Uzbekistan 0.95 0.07 0.33 0.06 0.83 0.09 2.12 0.08 Vanuatu 0.75 0.06 0.01 0.00 1.20 0.13 1.96 0.07 Viet Nam 4.23 0.32 6.21 1.18 3.21 0.35 13.63 0.49 Regional 3.49 0.26 8.22 1.56 3.12 0.34 14.82 0.54 International Organizations 23.21 1.75 4.07 0.77 4.90 0.54 32.17 1.16
TOTALb 1,327.48 100.00 527.54 100.00 907.49 100.00 2,762.46 100.00
– = nil, 0.00 = % is less than 0.01.a Represents the country of origin where the goods are mined, produced, grown and/or manufactured, based on US dollar value equivalent of contract.b Totals may not add up because of rounding.

Asian Development Bank214ST
ATI
STIC
AL
AN
NEX
ES
Statistical Annex 34 CONTRACTS AWARDED BY COUNTRY OF ORIGIN,a 2006–2008 TECHNICAL ASSISTANCE OPERATIONS (amounts in $ million) 2006 2007 2008
Amount % Amount % Amount %
Afghanistan 0.39 0.25 0.85 0.46 0.26 0.17Armenia 0.30 0.19 0.23 0.12 0.10 0.06Australia 19.07 12.25 32.33 17.46 23.72 15.62Austria 1.30 0.83 – – 0.08 0.05Azerbaijan 0.14 0.09 – – 0.01 0.01Bangladesh 2.47 1.59 1.98 1.07 3.85 2.54Belgium 0.17 0.11 0.07 0.04 0.37 0.24Bhutan 0.01 0.00 0.10 0.06 0.09 0.06Brunei Darussalam – – – – – –Cambodia 1.29 0.83 0.37 0.20 0.77 0.51Canada 10.84 6.96 10.63 5.74 8.84 5.82China, People’s Republic of 4.39 2.82 5.05 2.73 3.33 2.20Cook Islands 0.01 0.01 – – 0.10 0.06Denmark 2.75 1.76 0.35 0.19 1.46 0.96Fiji Islands 0.09 0.06 0.19 0.10 0.30 0.20Finland 2.60 1.67 0.30 0.16 0.85 0.56France 1.09 0.70 3.58 1.93 11.04 7.27Georgia – – – – – –Germany 4.28 2.75 1.39 0.75 8.84 5.82Hong Kong, China 4.46 2.86 4.46 2.41 1.91 1.26India 9.80 6.29 17.59 9.50 11.51 7.58Indonesia 3.82 2.45 5.47 2.95 2.13 1.40Ireland – – 0.12 0.06 0.05 0.03Italy 0.07 0.04 0.11 0.06 0.29 0.19Japan 2.43 1.56 3.52 1.90 6.13 4.04Kazakhstan 0.38 0.24 0.17 0.09 0.12 0.08Kiribati 0.01 0.01 0.02 0.01 – –Korea, Republic of 0.44 0.28 0.26 0.14 0.45 0.30Kyrgyz Republic 0.36 0.23 0.16 0.08 0.22 0.14Lao People’s Democratic Republic 0.14 0.09 0.83 0.45 0.19 0.12Luxembourg – – – – – –Malaysia 1.39 0.89 1.48 0.80 1.90 1.25Maldives 0.03 0.02 0.04 0.02 – –Marshall Islands 0.08 0.05 0.04 0.02 0.04 0.03Micronesia, Federated States of 0.02 0.01 – – – –Mongolia 0.25 0.16 0.32 0.17 0.20 0.13Myanmar 0.01 0.01 0.22 0.12 – –Nauru – – – – – –Nepal 2.28 1.47 2.97 1.60 2.06 1.35The Netherlands 2.75 1.76 2.17 1.17 0.95 0.63New Zealand 8.53 5.48 7.91 4.27 8.74 5.75Norway 0.89 0.57 0.12 0.06 0.11 0.07Pakistan 5.44 3.50 4.78 2.58 4.15 2.73Palau – – 0.02 0.01 – –Papua New Guinea 0.35 0.23 0.08 0.05 0.28 0.18Philippines 10.62 6.82 11.74 6.34 6.80 4.48Portugal – – 0.07 0.04 – –Samoa 0.01 0.01 0.03 0.02 0.01 0.01Singapore 2.65 1.70 2.31 1.25 0.88 0.58Solomon Islands – – 0.18 0.10 0.12 0.08Spain 1.36 0.87 1.03 0.56 1.53 1.00Sri Lanka 0.76 0.49 1.96 1.06 0.65 0.43Sweden 1.04 0.67 2.79 1.51 1.71 1.13Switzerland 2.73 1.75 0.24 0.13 0.19 0.13Taipei,China 0.03 0.02 – – 0.66 0.44Tajikistan 0.30 0.19 0.94 0.51 0.04 0.03Thailand 1.95 1.25 2.62 1.41 1.19 0.78Timor-Leste – – 0.03 0.02 0.11 0.07Tonga 0.01 0.00 0.03 0.01 0.06 0.04Turkey 0.07 0.04 0.04 0.02 0.10 0.06Turkmenistan 0.02 0.01 0.04 0.02 – –Tuvalu – – – – – –United Kingdom 12.51 8.03 15.39 8.31 12.57 8.28United States 24.95 16.03 26.87 14.51 16.84 11.09Uzbekistan 0.37 0.24 0.72 0.39 0.26 0.17Vanuatu – – 0.01 0.00 – –Viet Nam 1.23 0.79 2.23 1.20 2.10 1.38Regional – – 5.67 3.06 – –International Organizations – – – – 0.59 0.39
TOTALb 155.69 100.00 185.17 100.00 151.83 100.00
– = nil, 0.00 = % is less than 0.01.a Represents the country of origin where the goods are mined, produced, grown, and or manufactured based on US dollar value equivalent of contract.b Totals may not add up because of rounding.

The Annual Report 2008 is printed using vegetable oil-based inks on recycled paper. The paper is made using a totally chlorine-free process.
About the front coverResidents of Kinjipi village in Papua New Guinea’s Western Highlands stop a basketball game to discuss how life will change when they have a paved road. ADB has financed the upgrading of several roads in the area.
Photo CreditsCover: Ian Gill; 6: Michael Hanson/Aurora Photos/Corbis; 158: Jonathan Blair/Corbis

Asian Development Bank6 ADB Avenue, Mandaluyong City1550 Metro Manila, Philippines
Tel +63 2 632 4444Fax +63 2 636 [email protected]
Treasury DepartmentFax +63 2 632 4707 +63 2 632 4120SWIFT Address ASDBPH MM Printed in the Philippines