Asia's post- pandemic encounter with foreign finance RBI ...
Upload
khangminh22Category
view
5download
0
History of Asia’s development over the past 50 years
and the role of ADBYasuyuki Sawada
Chief Economist, Asian Development Bank (ADB)
Bio: Mr. Sawada is the chief spokesperson for ADB on economic and development trends, and leads the Economic Research and Regional Cooperation Department, which publishes ADB's flagship knowledge products.
1
Disclaimer: The views expressed in this presentation are those of the authors and do not necessarily reflect the views and policies of the Asian Development Bank (ADB) or its Board of Governors or the governments they represent.
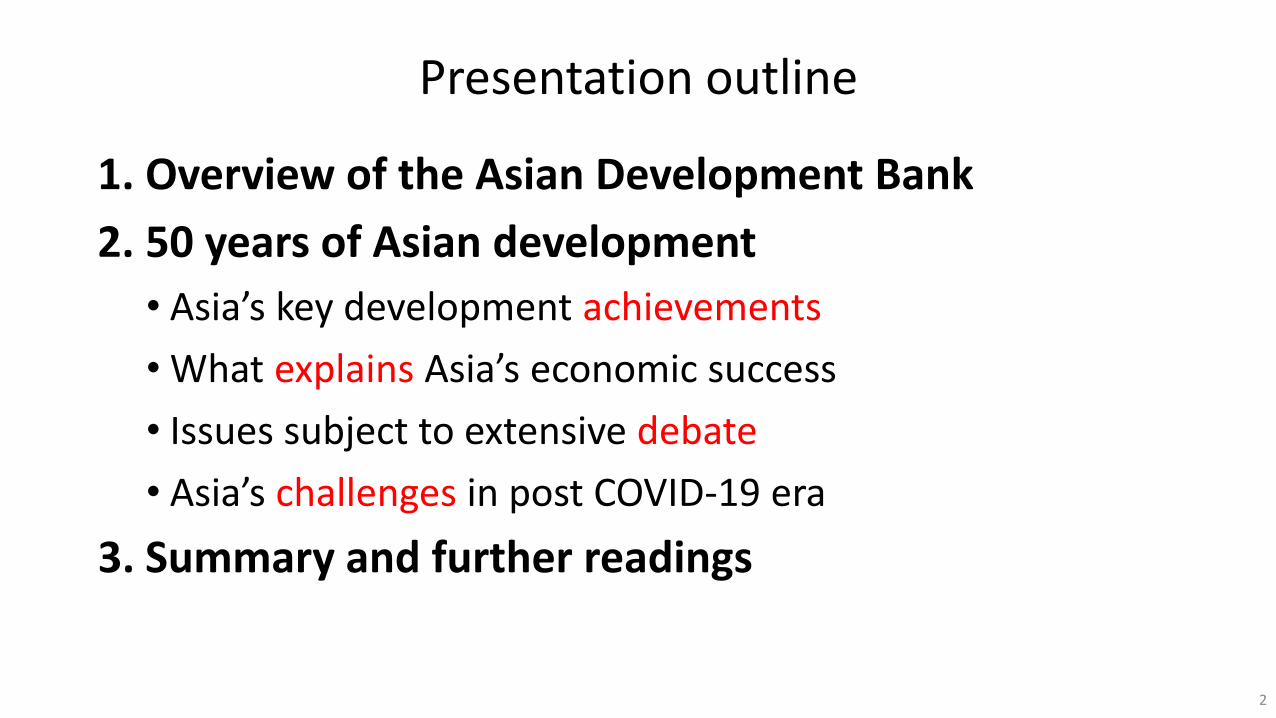
Presentation outline
1. Overview of the Asian Development Bank
2. 50 years of Asian development
• Asia’s key development achievements
• What explains Asia’s economic success
• Issues subject to extensive debate
• Asia’s challenges in post COVID-19 era
3. Summary and further readings
2

Presentation outline
1. Overview of the Asian Development Bank
2. 50 years of Asian development
• Asia’s key development achievements
• What explains Asia’s economic success
• Issues subject to extensive debate
• Asia’s challenges in post COVID-19 era
3. Summary and further readings
3

Overview: Asian Development Bank (ADB)• Founded in 1966, headquartered in Manila, Philippines• Main Roles: help developing member countries in Asia and Pacific
through: (i) combining finance and knowledge; (ii) promoting good policies; and (iii) catalyzing regional cooperation and friendship.
• 3,630 Staff• International Staff (1,318): Japan (142), United States (141), India (103), United Kingdom (86),
Australia (82), Korea (76), PRC (67), Canada (55), Philippines (54), Germany (46), France (45), Pakistan (40), Indonesia (26), others (355)
• Contribution by members• Ordinary Capital Resources (capital share, voting power share)
• Japan (15.6%, 12.8%), United States (15.6%, 12.8%), • PRC (6.4%, 5.4%), India (6.3%, 5.3%), Australia (5.8%, 4.9%), • Indonesia (5.4%, 4.6%), Canada (5.2%, 4.5%), Korea (5.0%, 4.3%), • Germany (4.3%, 3.7%), others (30.4%, 41.7%)
• Asian Development Fund (cumulative contribution)• Japan (38.5%), United States (13.3%), Australia (8.3%), • Canada (5.8%), Germany (5.6%), United Kingdom (5.1%), • France (4.0%), others (19.4%)
4
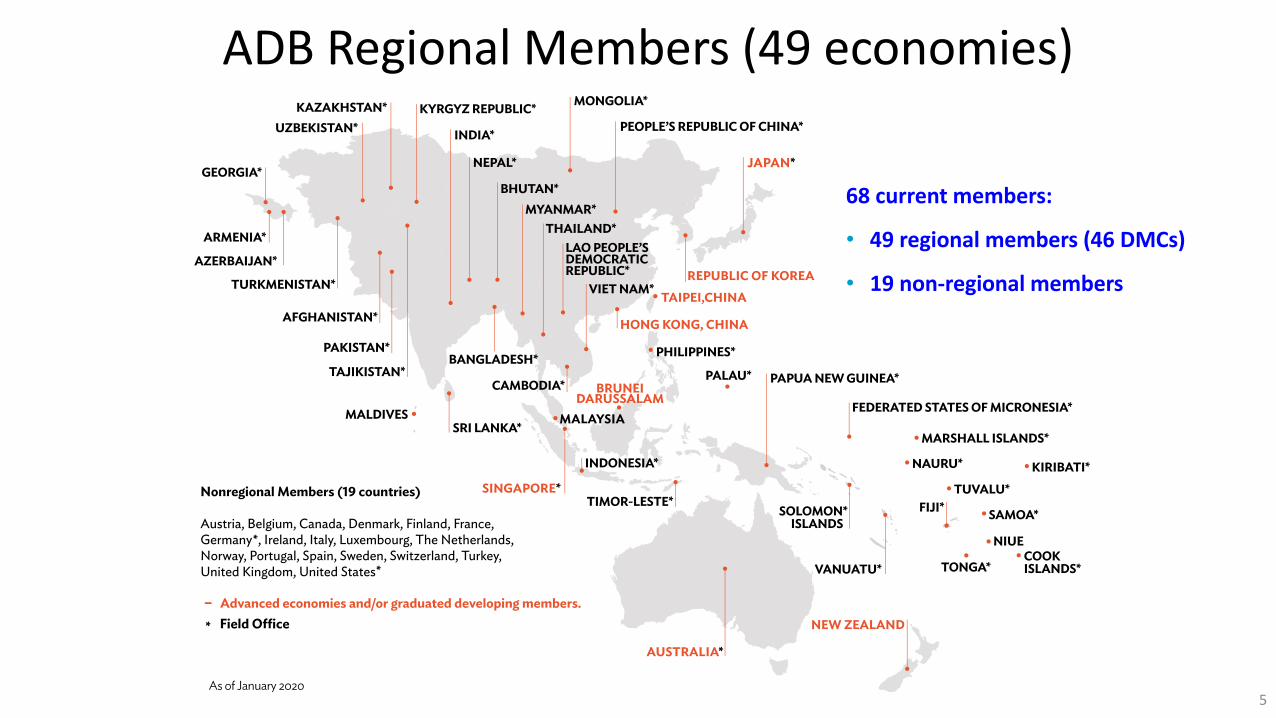
ADB Regional Members (49 economies)
68 current members:
• 49 regional members (46 DMCs)
• 19 non-regional members
5

Organization Chart of ADBBoard of
Governors
1 Board of Directors currently consists of 12 Directors from Australia, Canada, PRC, Italy, Germany, India, Indonesia, Japan, Korea, Thailand, Philippines and the US.
2 Under operations departments, 40 field offices located in 40 countries.
Sustainable Development & Climate Change Department
Budget, Personnel and Management Systems Dept.
Information Technology Department
Controller’s Department
Office of Risk Management
Treasury Department
Office of Anticorruption and Integrity
Office of Professional Conduct
Office of the Auditor General
Strategy, Policy and Partnerships Department
- European Representative Office- Japanese Representative Office- North American Representative Office
Office of the Ombudsperson
ADB Institute
Office of the Special Project Facilitator
Board of Directors1
President
Independent Evaluation Department
Office of the Compliance Review Panel
Central and West Asia Department2
South Asia Department2
East Asia Department2
Pacific Department2
Southeast Asia Department2
Department of Communications
Economic Research & Regional Cooperation Department
Office of Administrative Services
Office of the General Counsel
Office of The Secretary
Procurement, Portfolio, and Financial Management Dept.
Office of Public-Private Partnership
Private Sector Operations Department
Vice President (Operations 1)
Vice President (Knowledge Mgmt. &
Sustainable Dev’t)
Vice President (Operations 2)
Vice President
(Private Sector &
PPPs)
Vice President (Administration & Corporate Mgmt.)
Vice President
(Finance & Risk Management)
6

• Loans are financed from Ordinary Capital Resources (OCR)
- Middle-income countries (per capita income ≤ $6,975): regular OCR at quasi market rate- Low-income countries (per capita income ≤ $1,175): concessional terms with long maturities and low
interest rates
• Asian Development Fund (ADF) grants are offered to countries with limited debt
repayment capacity, i.e., Afghanistan, Tajikistan, and Pacific island countries
• Technical assistance includes capacity building, project preparation, and research
ADB Operations
a Preliminary figures.b Excluding allowance for credit losses.c Including paid-in capital of $7.4 billion, ordinary reserves of $44.3 billion (comprising accumulated
retained earnings ($13.6 billion) plus a one-time income ($30.7 billion) in 2017 due to the merger of the ADF loan assets with OCR) , and other reserves of $1.0 billion.
d Including other debt securities and equity investments.
(billion USD)
2020 Commitmentsa
excluding cofinancingQ3 2020
OutstandingQ3 2020Equity
OCR (loans) 28.17 125.3b 52.7c
Regular 23.65d 94.3
Concessional 4.52 31.0
ADF (grants) 1.08 1.5
Technical assistance 0.29
7

ADB Operations in 2020* by Volume of Financing
PRC = People's Republic of China.Bracketed numbers are from 2019.* Figures for 2020 are preliminary.
Ordinary Capital Resources (OCR) and Asian Development Fund (ADF) Operations(Financing committed in 2020 increased to $29.25 billion from $21.64 billion in 2019)
India18% (19%)
Philippines14% (12%)
Indonesia12% (8%)
PRC8% (10%)
Pakistan6% (10%)
Bangladesh6% (6%)
Thailand5% (2%)
Uzbekistan4% (5%)
Kazakhstan4% (1%)
Others22% (27%)
By Country
Public Sector Management
32% (14%)
Energy15% (12%)
Health13% (3%)
Transport13% (35%)
Finance11% (10%)
Water & Urban7% (6%)
Agriculture4% (10%)
Education4% (5%)
Industry and Trade2% (3%)
ICT0.2% (3%)
By Sector
8

ADB Operations in Q3 2020 by Loans Outstanding
PRC = People's Republic of China.
Ordinary Capital Resources (OCR) and Asian Development Fund Operations (ADF) (Loans Outstanding in Q3 2020 increased to $125.29 billion from $109.33 billion in Q3 2019)
India16%
PRC15%
Pakistan11%
Indonesia10%
Bangladesh9%
Philippines8%
Viet Nam7%
Sri Lanka4%
Others20%
By Country
Transport28%
Energy18%Public Sector
Management18%
Finance9%
Water & Urban8%
Agriculture7%
Education5%
Multisector3%
Industry and Trade2%
Health2%
ICT0.5%
By Sector
9
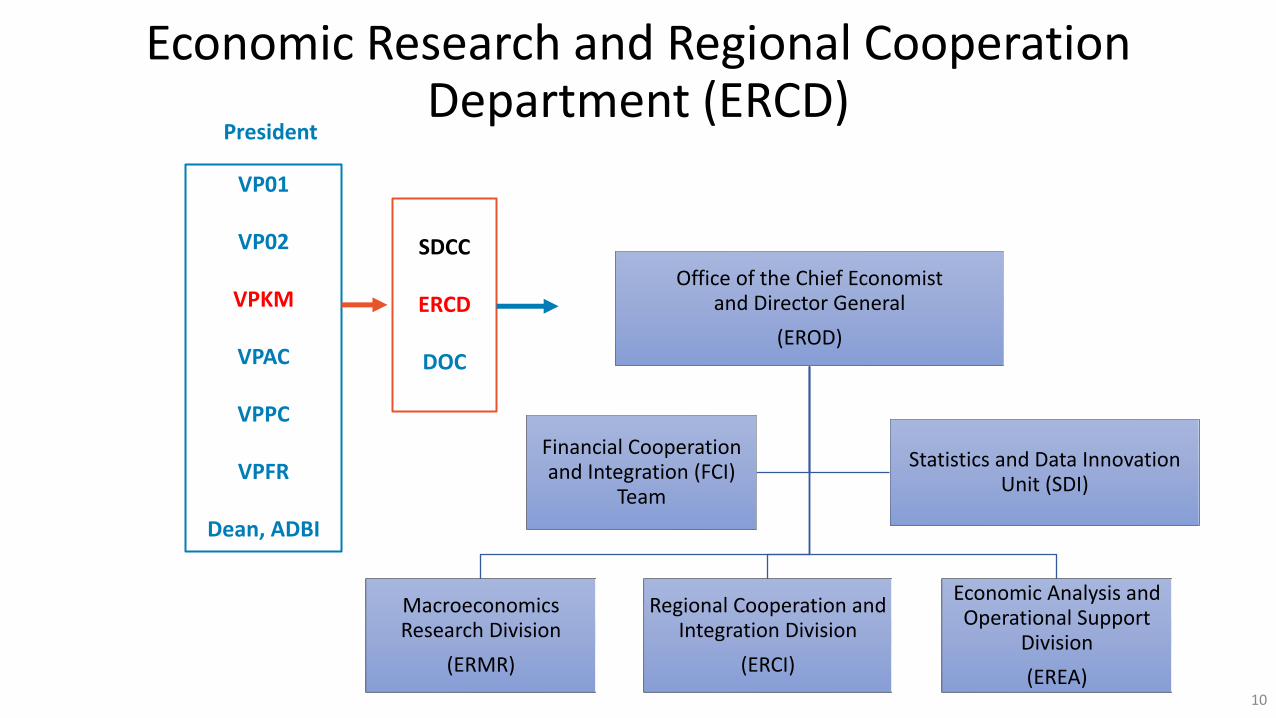
Economic Research and Regional Cooperation Department (ERCD)
Office of the Chief Economist and Director General
(EROD)
Macroeconomics Research Division
(ERMR)
Regional Cooperation and Integration Division
(ERCI)
Economic Analysis and Operational Support
Division
(EREA)
Financial Cooperation and Integration (FCI)
Team
Statistics and Data Innovation Unit (SDI)
SDCC
ERCD
DOC
President
VP01
VP02
VPKM
VPAC
VPPC
VPFR
Dean, ADBI
10
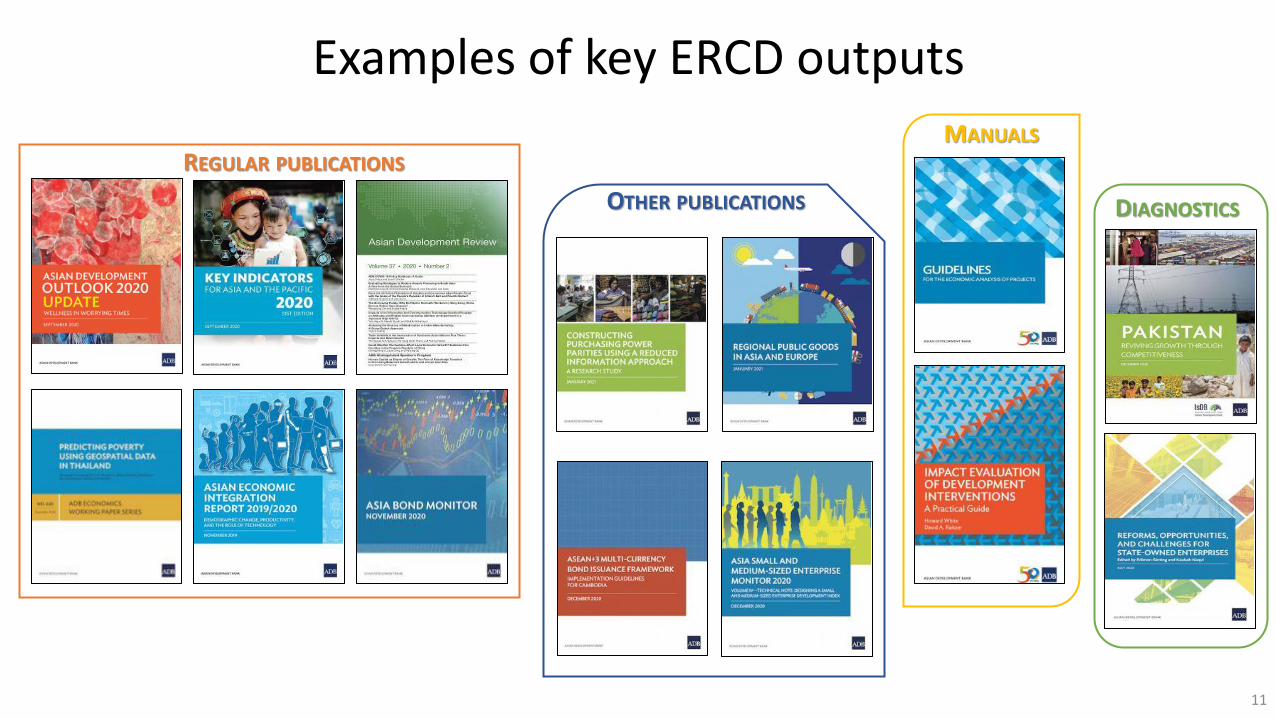
OTHER PUBLICATIONS
MANUALS
DIAGNOSTICS
Examples of key ERCD outputs
11
REGULAR PUBLICATIONS

12
https://adb-org.zoom.us/webinar/register/WN_2RNf2HIrTmOPRq9S7QGUtg

Presentation outline
1. Overview of the Asian Development Bank
2. 50 years of Asian development
• Asia’s key development achievements
• What explains Asia’s economic success
• Issues subject to extensive debate
• Asia’s challenges in post COVID-19 era
3. Summary and further readings
13
ASIA’S JOURNEY TO PROSPERITYPolicy, Market, and Technology over 50 Years
14
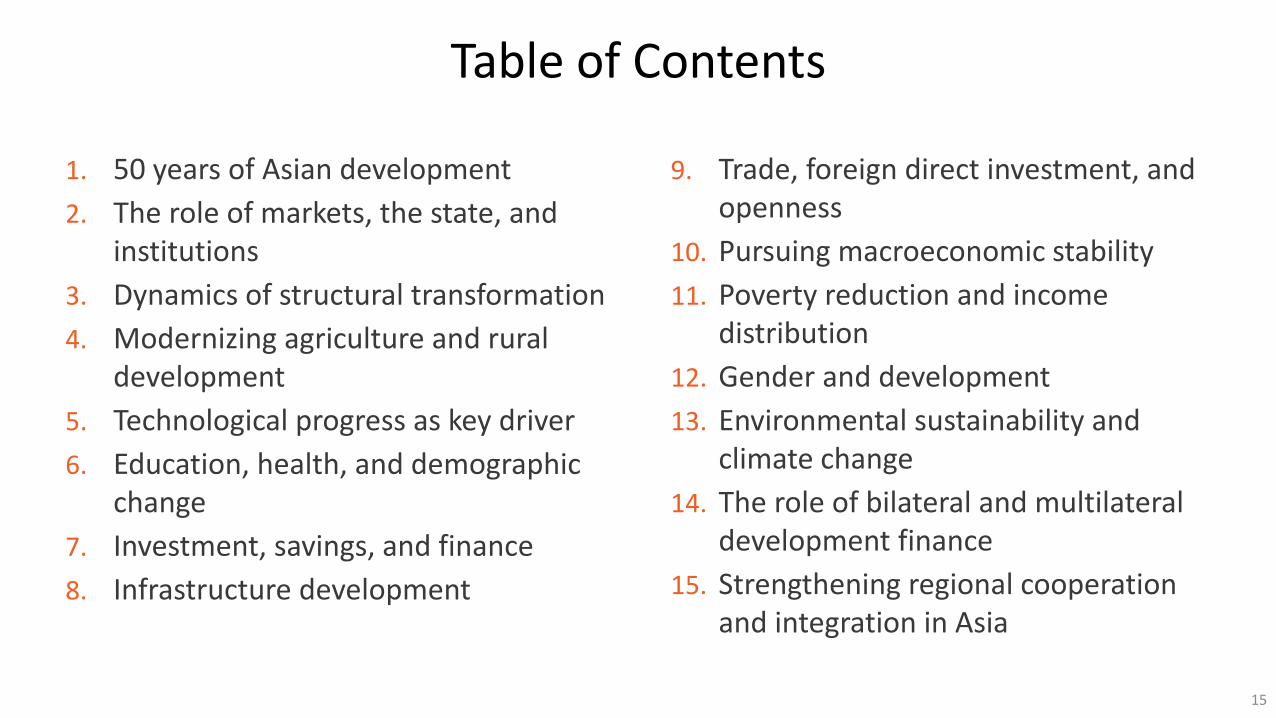
1. 50 years of Asian development
2. The role of markets, the state, and institutions
3. Dynamics of structural transformation
4. Modernizing agriculture and rural development
5. Technological progress as key driver
6. Education, health, and demographic change
7. Investment, savings, and finance
8. Infrastructure development
Table of Contents
9. Trade, foreign direct investment, and openness
10. Pursuing macroeconomic stability
11. Poverty reduction and income distribution
12. Gender and development
13. Environmental sustainability and climate change
14. The role of bilateral and multilateral development finance
15. Strengthening regional cooperation and integration in Asia
15

Presentation outline
1. Overview of the Asian Development Bank
2. 50 years of Asian development
• Asia’s key development achievements
• What explains Asia’s economic success
• Issues subject to extensive debate
• Asia’s challenges in post COVID-19 era
3. Summary and further readings
16

• Rapid economic growth led to rising share in global GDP…
2.2
4.0
5.0
4.9
6.2
5.5
4.7
0 5 10
1960s
1970s
1980s
1990s
2000s
2010s
1960-2018
Average Annual per Capita GDP growth (%)
PRC1.1%
India1.3%
Philippines0.2% Rest of DA
1.5%
Japan7.0%
AUS & NZL
2.2%
Latin America & the Caribbean
7.1%
MENA3.9%
Sub-Saharan Africa2.2%North America
30.6%
European Union36.2%
Rest of the World6.6%
1960
Developing Asia’s share in global GDP increased from 4% to 24% in 1960-2018; including Japan, Australia and New Zealand, Asia’s share rose from 13% to 34%.
PRC13.1%
India3.4%
Philippines0.4%
Rest of DA7.1%
Japan7.5%
AUS & NZL1.9%
MENA4.3%
Sub-Saharan Africa2.2%
North America
23.9%
European Union23.2%
Rest of the World5.6%
2018
Latin America and the Caribbean 7.4%
Asia’s key development achievements
AUS = Australia, DA = developing Asia, GDP = gross domestic product, MENA = Middle East and North Africa, NZL = New Zealand, PRC = People’s Republic of China.Sources: Asian Development Bank. Key Indicators Database. https://kidb.adb.org/kidb (accessed 2 August 2019); World Bank. World Development Indicators. https://data.worldbank.org(accessed 2 August 2019); and Asian Development Bank estimates. 17

• … and improvement in broad development indicators.
Developing Asia
1960 1980 2000 2018
Per capita GDP (constant 2010 $) 330 647 1,762 4,903
Extreme poverty rate (% of population) … 68.1 33.1 6.9
Life expectancy at birth (years) 45.0 59.3 65.8 71.8
Infant mortality (per 1,000 live births) 137.8 80.1 48.1 26.2
Mean years of schooling (age 20–24) 3.5 6.0 7.7 8.9
Asia’s key development achievements (cont.)
… = data not available, GDP = gross domestic product.Notes: Poverty refers to the rate of extreme poverty using the $1.90 per day international poverty line at 2011 purchasing power parity for 1981, 2002, and 2015. Life expectancy refers to life expectancy at birth in years. Infant mortality rate refers to infant deaths per 1,000 live births. Mean years of schooling are for those aged 20–24; data for 2018 refer to 2010.Sources: United Nations, Department of Economic and Social Affairs, Population Division. 2019. World Population Prospects 2019. Online Edition. https://population.un.org/wpp/ (accessed 23 August 2019); World Bank. PovcalNet Database. http://iresearch.worldbank.org/PovcalNet/home.aspx (accessed 28 September 2019); World Bank. World Development Indicators. https://data.worldbank.org (accessed 30 September 2019); and Barro, R., and J.-W. Lee. Database Version 2.2. http://www.barrolee.com (accessed 30 September 2019). 18
Presentation outline
1. Overview of the Asian Development Bank
2. 50 years of Asian development
• Asia’s key development achievements
• What explains Asia’s economic success
• Issues subject to extensive debate
• Asia’s challenges in post COVID-19 era
3. Summary and further readings
19

• Peace and stability, especially after the Viet Nam War
• Favorable demographic conditions
• Freer trade and investment policies in advanced countries
• A low-income level providing potential to catch up
• Better policies and stronger institutions for market-based growth
What explains Asia’s economic success?
20

• In the last half century, Asian development policy shifted from state-led industrialization to market-oriented growth
Late 1940s–late 1950s:Post-war political independence, reconstruction, and start of state-ledIndustrialization and import substitution.
Late 1950–late 1970s:Export promotion and market-led growth in Japan and “four tigers”, and state control and inward orientation in the People’s Republic of China (PRC), India, and many other countries.
Late 1970s–early 1990s: “East Asian Miracle” fully recognized, and first wave of opening and market-oriented reform in the PRC, Viet Nam, India, and Central Asia.
Early 1990s–2007:Broadening of opening and market-oriented reform, growing trade and capital flows, Asian financial crisis, and post-crisis reform.
2008–present: Global financial crisis, Asia leading global growth, promotion of inclusive growth and good governance, and rethinking positive role of the state in overcoming market failure.
21
(1) Relying on markets and private sector as engines of growth, with proactive state support to address market failure

• Structural transformation (ST) is the primary driver of growth across the world.
• Stylized fact about ST: Over time, resources are transferred from agriculture to industry (up to a certain level) and services, and, within each of the three sectors, from low- to high-productivity production.
• Asia is no exception, but with a faster pace.
(2) Promoting structural transformation
71.0%
33.5%
14.1%
25.5%
14.9%
41.0%
1970s
2018
Agriculture Industry Services
GDP = gross domestic product, USD = United States dollar.Sources: For output shares: World Bank. World Development Indicators. https://data.worldbank.org/indicator(accessed 2 August 2019); United Nations (UN). UN Statistics Division Database. https://unstats.un.org (accessed 28 August 2019); national sources; and Asian Development Bank estimates. For employment shares: International Labour Organization (ILO). ILOSTAT Database. https://www.ilo.org/ilostat (accessed 28 August 2019); Organisation for Economic Co-Operation and Development (OECD). OECD Employment and LabourMarket Statistics. https://www.oecd-ilibrary.org/employment/data/oecd-employment-and-labour-market-statistics_lfs-data-en (accessed 28 August 2019); Timmer, M. P., G.J. de Vries, and K. de Vries. 2015. Patterns of Structural Change in Developing Countries. In Weiss, J., and M. Tribe, eds. Routledge Handbook of Industry and Development. Abingdon: Routledge. pp. 65–83 (for the Groningen Growth and Development Center 10-Sector Database) (accessed 28 August 2019); and Asian Development Bank estimates.
Share in Employment(% of total)
Output and Employment Shares, 1970-2018
22

• Structural transformation also involves shift from low- to high-productivity production within each sector, through technological progress
❑ “Growth accounting” framework to decompose GDP growth into:
❑Physical capital accumulation (green)
❑ Labor input increase (orange)
❑Human capital accumulation (yellow)
❑Total Factor Productivity (blue)
❑Asian economies relied on
❑ first, physical capital accumulation and labor inputs
❑ later, broad technological progress
60.448.2 41.8
31.2
17.7
8.1
15.0
12.3
9.2
(6.6)
21.9
40.8
1970-1985 1995-2005 2010-2017
Physical capital Labor Human capital TFP
(2) Promoting structural transformation (cont.)
( ) = negative, GDP = gross domestic product, TFP = total factor productivity.Sources: Estimates based on data from Feenstra, R. C., R. Inklaar, and M. P. Timmer. 2015. The Next Generation of the Penn World Table. American Economic Review. 105 (10). pp. 3150–3182. http://www.ggdc.net/pwt (accessed 1 July 2019); and Asian Productivity Organization (APO). APO Database. https://www.apo-tokyo.org/wedo/measurement (accessed 1 July 2019).
Contribution to Asia’s GDP Growth
(% of total)
23

• High-growth Asian economies made large investments in physical capital, financed largely by domestic savings.
Physical capital stock
(2011 constant $,
trillion)
Capital stock
growth
(%)
1960 2017 1960–2017
Developing Asia 3.9 176.0 6.9
Central Asia … 2.4 …
East Asia 1.3 108.2 8.1
PRC 1.0 94.9 8.3
South Asia 1.4 34.8 5.7
India 1.2 29.9 5.9
Southeast Asia 1.1 30.5 6.0
(3) Investing in productive capacity
18.0
24.9
27.4
32.9
36.6
41.0
20.3
26.1
28.5
32.3
33.3
38.9
0 10 20 30 40 50
1960s
1970s
1980s
1990s
2000s
2010s
Gross Domestic Savings and Investment (% of GDP)
Gross domestic investment Gross domestic savings
... = data not available, PRC = People’s Republic of China.Notes: Data are not available for the Pacific island countries. Data for 1960 are not available for Central Asia and Bhutan, Brunei Darussalam, Cambodia, Maldives, Mongolia, and Myanmar.Sources: Feenstra, R., R. Inklaar, and M. P. Timmer. 2015. The Next Generation of the Penn World Table Version 9.1. American Economic Review. 105 (10). pp. 3150–3182 (accessed 4 May 2019); and Asian Development Bank estimates.
GDP = gross domestic product.Note: Data for Taipei,China refer to gross national savings.Sources: World Bank. World Development Indicators. https://data.worldbank.org (accessed2 August 2019). For Taipei,China: Directorate-General of Budget, Accounting and Statistics.
24

(3) Investing in productive capacity (cont.)
• A key part of physical capital investment was for infrastructure—transport, power, water and sanitation, and telecommunications.
117
134
1,398
165
343
4,247
3,648
4,120
321
1,215
2,722
3,501
5,092
5,277
8,615
8,709
10,363
11,491
0 2,000 4,000 6,000 8,000 10,000 12,000
India
Thailand
World
PRC
Malaysia
OECD
Japan
Australia
Republic of Korea
Electricity Generation per Capita (kWh/capita)
2018
1971
• During 1971–2018, per capita electricity generation increased by 35 times in the Republic of Korea, 30 times in the PRC, 19 times in Thailand, 14 times in Malaysia, and 9 times in India, significantly narrowing the gaps with advanced countries.
kWh = kilowatt-hour, OECD = Organisation for Economic Co-operation and Development, PRC = People’s Republic of China. Note: Per capita electricty generation estimated with Enerdata’s electricity generation data and World Bank’s population data.Sources: Enerdata. 2019. Global Energy Statistical Yearbook. https://www.enerdata.net/publications/world-energy-statistics-supply-and-demand.html; and World Bank. World Development Indicators. https://data.worldbank.org/ (accessed 29 October 2019). 25
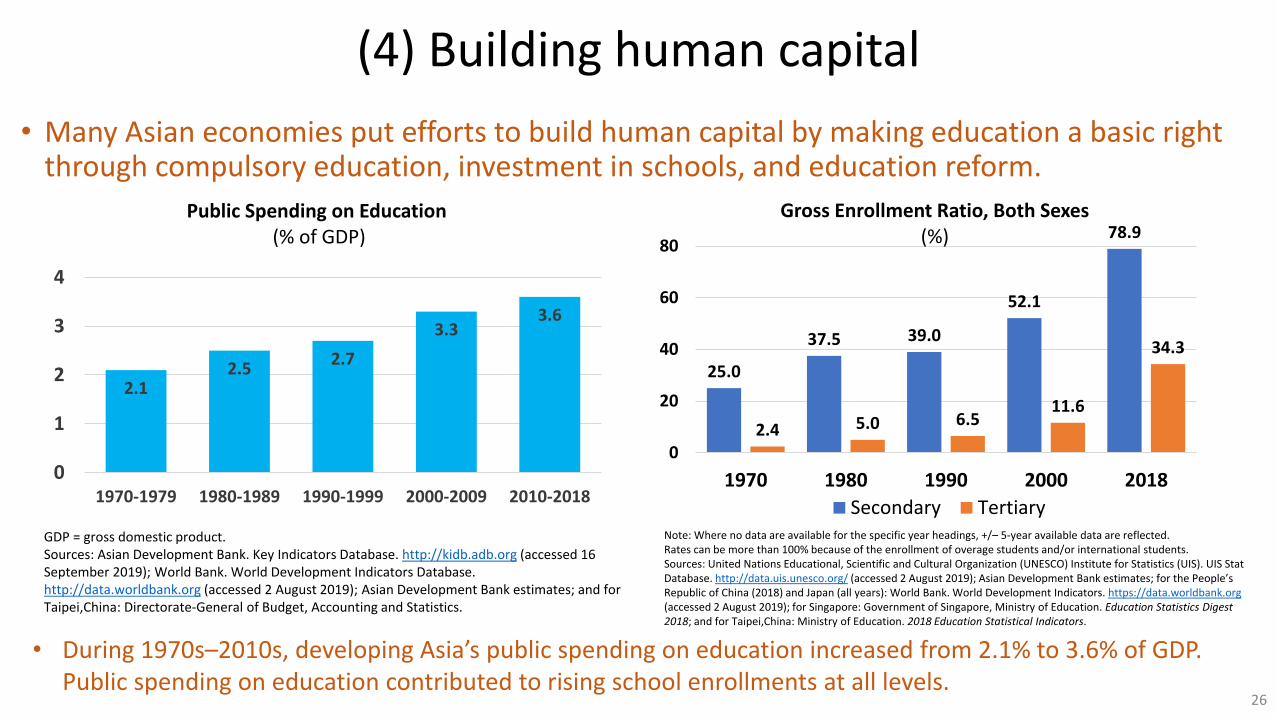
• Many Asian economies put efforts to build human capital by making education a basic right through compulsory education, investment in schools, and education reform.
(4) Building human capital
25.0
37.5 39.0
52.1
78.9
2.4 5.0 6.511.6
34.3
0
20
40
60
80
1970 1980 1990 2000 2018
Gross Enrollment Ratio, Both Sexes(%)
Secondary Tertiary
2.12.5
2.7
3.33.6
0
1
2
3
4
1970-1979 1980-1989 1990-1999 2000-2009 2010-2018
Public Spending on Education(% of GDP)
• During 1970s–2010s, developing Asia’s public spending on education increased from 2.1% to 3.6% of GDP. Public spending on education contributed to rising school enrollments at all levels.
GDP = gross domestic product.Sources: Asian Development Bank. Key Indicators Database. http://kidb.adb.org (accessed 16September 2019); World Bank. World Development Indicators Database. http://data.worldbank.org (accessed 2 August 2019); Asian Development Bank estimates; and for Taipei,China: Directorate-General of Budget, Accounting and Statistics.
Note: Where no data are available for the specific year headings, +/– 5-year available data are reflected.Rates can be more than 100% because of the enrollment of overage students and/or international students.Sources: United Nations Educational, Scientific and Cultural Organization (UNESCO) Institute for Statistics (UIS). UIS Stat Database. http://data.uis.unesco.org/ (accessed 2 August 2019); Asian Development Bank estimates; for the People’s Republic of China (2018) and Japan (all years): World Bank. World Development Indicators. https://data.worldbank.org(accessed 2 August 2019); for Singapore: Government of Singapore, Ministry of Education. Education Statistics Digest 2018; and for Taipei,China: Ministry of Education. 2018 Education Statistical Indicators.
26
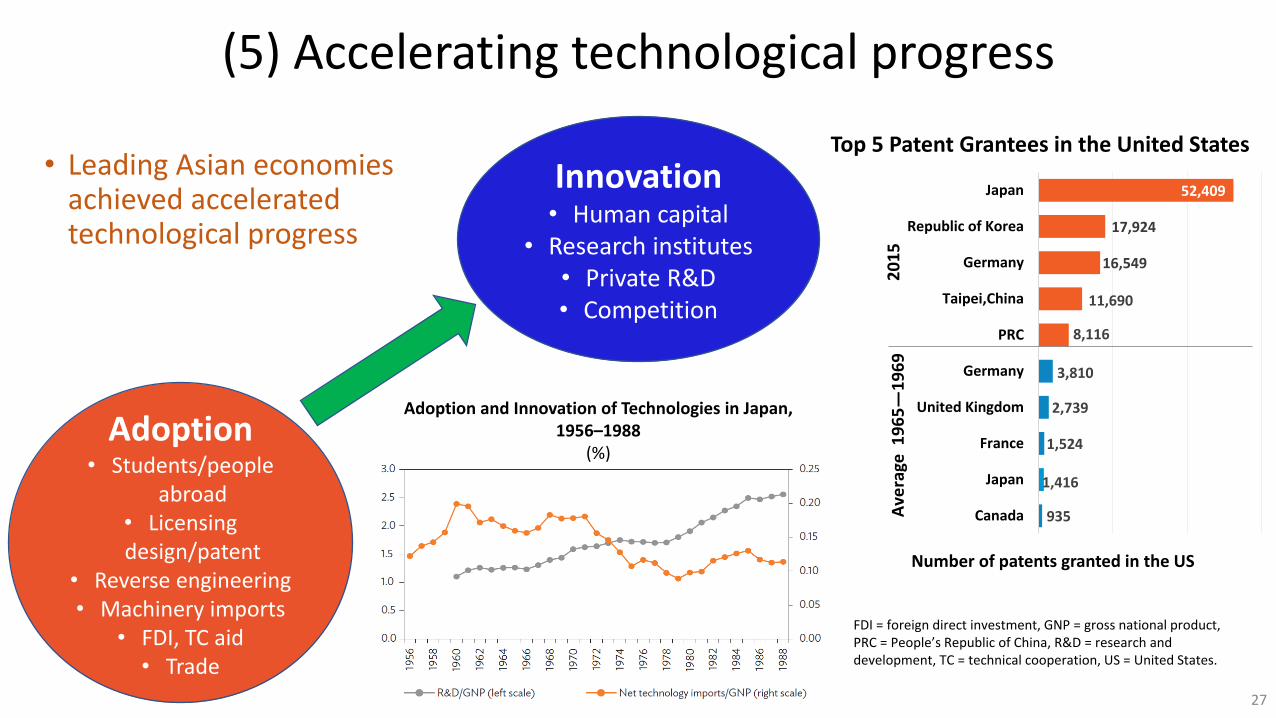
• Leading Asian economies achieved accelerated technological progress
Number of patents granted in the US
935
1,416
1,524
2,739
3,810
8,116
11,690
16,549
17,924
52,409
Canada
Japan
France
United Kingdom
Germany
PRC
Taipei,China
Germany
Republic of Korea
Japan
20
15
Ave
rage
19
65
—1
96
9
(5) Accelerating technological progress
FDI = foreign direct investment, GNP = gross national product, PRC = People’s Republic of China, R&D = research and development, TC = technical cooperation, US = United States.
Top 5 Patent Grantees in the United States
Adoption• Students/people
abroad• Licensing design/patent
• Reverse engineering• Machinery imports
• FDI, TC aid• Trade
Innovation• Human capital
• Research institutes• Private R&D• Competition
Adoption and Innovation of Technologies in Japan,1956–1988
(%)
27

• High-growth Asian economies all maintained open trade and investment regimes, making Asia a center of global manufacturing production and value chains.
(6) Opening trade and investment
Asia’s Top 5 Merchandise Exports (% of total)
11
8
7
6
5
0 10
Textile yarn, fabrics, madeup articles, etc.
Textile fibers, notmanufactured, and waste
Transport equipment
Iron and steel
Electrical machinery,apparatus, and appliances
1960-1969
20
14
9
6
5
0 10 20
Electrical machinery,apparatus, and
appliances
Machinery, other thanelectric
Transport equipment
Petroleum andpetroleum products
Clothing
2010-2018
• They initially promoted exports of labor-intensive manufacturing products, and over time, moved up to export more sophisticated products such as cars, electronics, and machines. In the last 2–3 decades, they participated in global value chains.
• To attract FDI, they set up special economic zones (SEZs) and provided tax incentives, making developing Asia one of the most attractive FDI destinations, accounting for 35% of the world total in 2017.
Source: World Bank. World Integrated Trade Solution. https://wits.worldbank.org/ (accessed 4 November 2019).
0%
5%
10%
15%
20%
25%
30%
35%
40%
0
100
200
300
400
500
600
1970 1975 1980 1985 1990 1995 2000 2005 2010 2015 2016 2017
$ b
illio
n
Asia's Foreign Direct Investment (FDI)
Inflow (left) Outflow (left)
Inflow, % of world total (right) Outflow, % of world total (right)
28

• Compared with other developing regions, Asia did better in macroeconomic management, whether looking at growth, inflation, or frequency of economic crises
(7) Maintaining macroeconomic stability
4.0
7.35.1
8.7
9.17.4
22.6
12.2
0
5
10
15
20
25
PRC India NIES ASEAN5 Rest ofDeveloping
Asia
LatinAmerica
Sub-Saharan
Africa
OECD
Average Inflation by Decade (%)
1970–1979 1980–1989 1990–1999 2000–2009 2010–2018
7061.9
_Full period average
• Good macro management provided the basis for sustained growth, and reforms in response to the Asian financial crisis laid the foundation for future resilience.
0
2
4
6
8
10
12
PRC India NIEs ASEAN5 Rest ofDeveloping
Asia
LatinAmerica
Sub-Saharan
Africa
OECD
1970–1979 1980–1989 1990–1999 2000–2009 2010–2018ASEAN = Association of Southeast Asian Nations, GDP = gross domestic product, NIEs = newly industrialized economies, OECD = Organisation for Economic Co-operation and Development, PRC = People’s Republic of China.Notes: The NIEs comprise Hong Kong, China; the Republic of Korea; Singapore; and Taipei,China. ASEAN5 comprises Indonesia, Malaysia, the Philippines, Thailand, and Viet Nam. Rest of Developing Asia refers to all Asian Development Bank developing member economies excluding the PRC, India, the NIEs, and ASEAN5.Sources: Asian Development Bank. Key Indicators Database. https://kidb.adb.org/kidb/ (accessed 2 August 2019); and World Bank. World Development Indicators. https://databank.worldbank.org/source/world-development-indicators (accessed 2 August 2019); International Monetary Fund. World Economic Outlook Database. https://www.imf.org/external/pubs/ft/weo/2019/01/weodata/index.aspx (accessed 27 August 2019); and Asian Development Bank estimates.
Average Annual GDP Growth by Decade(%)
29

PRC
MONBAN
BHU
IND
NEPPAK
SRI
INO
LAO
MYA
PHI THA
VIE
PNG
SOL
VAN
y = 0.25x + 0.42R² = 0.38
0.0
0.5
1.0
1.5
2.0
2.5
3.0
0.0 2.0 4.0 6.0 8.0 10.0
An
nu
al r
ate
of
po
vert
y re
du
ctio
n
(p.p
.)
Annual growth of per capita GDP (%)
Economic Growth and Poverty Reduction, 1981‒2015(based on international poverty lines)
• Rapid economic growth and targeted policies led to rapid poverty reduction.
(8) Promoting social inclusiveness and gender equality
Malaysia Singapore
Hong Kong, ChinaPhilippines
Thailand
Indonesia
Republic of Korea
Taipei,China
Peru
Mexico
Brazil
Colombia
Venezuela
Chile
Argentina
-20
-15
-10
-5
0
5
-2 0 2 4 6 8 10Ch
ange
in G
ini (
19
81
-19
90
min
us
19
65
-19
70
)
Average Annual per Capita GDP Growth, 1965-1990
Changes in Income Inequality and Annual per Capita GDP Growth, 1960s-1980s
• Asia had stable inequality in the 1960s–1980s, a pattern known as “growth with equity” in East Asia; since the 1990s, growth has been accompanied by rising inequality in some economies.
GDP = gross domestic product, p.p. = percentage point, BAN = Bangladesh, BHU = Bhutan, IND = India, INO = Indonesia,LAO = Lao People’s Democratic Republic, MON = Mongolia, MYA = Myanmar, NEP = Nepal, PAK = Pakistan, PHI =Philippines, PNG = Papua New Guinea, PRC = People’s Republic of China, SOL = Solomon Islands, SRI = Sri Lanka, THA =Thailand, VAN = Vanuatu, VIE = Viet Nam.Notes: Poverty rates are measured using the $1.90 per day international poverty line for extreme poverty. The initialyear is 1981 for most economies, but 1984 for the Lao People’s Democratic Republic and 1990 for Solomon Islands.Sources: World Bank. PovcalNet Database. http://iresearch.worldbank.org/PovcalNet/home.aspx (accessed 7 November2019); and World Bank. World Development Indicators. https://data.worldbank.org (accessed 2 August 2019).
GDP = gross domestic productSources: World Bank, The East Asian Miracle and World Bank. World Development Indicators. https://data.worldbank.org.
30

1.4 2.4 1.9 1.74.4
8.113.3
9.1 7.5 6.8 5.96.4 5.9 5.6
3.4
3.9
2.7
1.1
1.6 1.1 0.7 0.5
-5
0
5
10
15
20
25
1970 1975 1980 1985 1990 1995 2000 2005 2010 2015 2017
Net Capital Inflows by Nonresidents to Developing Asia, 1970–2017
(% of gross domestic investment)
Net FDI inflows Net official flows Net bank lending and bonds Net portfolio equity inflows
• Asia benefited from engaging with bilateral partners and multilateral development banks in investing in development, especially infrastructure, education, and health.
• In South Asia and Southeast Asia, development assistance financed 10–20% of gross domestic investment in the 1970s and 1980s.
• Such partnerships remain relevant to Asia’s changing needs, providing responsive support by combining financing with policy advice.
(9) Engaging with development partners & promoting RCI
FDI = foreign direct investment.Notes: Bonds are securities issued with a fixed rate of interest for a period of more than 1 year. They include net flows through cross-border public and publicly guaranteed and private nonguaranteed bond issues. Data are in current United States dollars.Sources: Asian Development Bank estimates; World Bank. World Development Indicators. https://data.worldbank.org (accessed 2 August 2019); United Nations Conference on Trade and Development (UNCTAD). UNCTADStat. https://unctadstat.unctad.org(accessed 28 August 2019); and Organisation for Economic Co-operation and Development (OECD). OECD Statistics. https://stats.oecd.org (accessed 26 August 2019).
31

• Regional cooperation and integration (RCI) has played an important role in supporting Asian development by contributing to
• peace and security;
• intraregional trade and investment; and
• regional public goods.
• In 2018, close to 60% of Asian trade were among Asian economies and 50% of FDI inflows were from within Asia and the Pacific region
57.5
48
30
35
40
45
50
55
60
1990 1992 1994 1996 1998 2000 2002 2004 2006 2008 2010 2012 2014 2016 2018
Shares of Intraregional Trade and Intraregional Foreign Direct Investment Inflows, Asia and the Pacific
Trade
Foreign Direct Investment
%
(9) Engaging with development partners & promoting RCI (cont.)
Source: ADB calculations using data from International Monetary Fund. Direction of Trade Statistics. https://www.imf.org/en/Data (accessed September 2019). 32

Presentation outline
1. Overview of the Asian Development Bank
2. 50 years of Asian development
• Asia’s key development achievements
• What explains Asia’s economic success
• Issues subject to extensive debate
• Asia’s challenges in post COVID-19 era
3. Summary and further readings
33
Issues subject to extensive debate
1. Is Asian development unique?
2. The role of industrial policy
3. Can industrialization be bypassed?
4. Importance of institutions
34

10 policy recommendations of the Washington Consensus
Fiscal discipline
Public expenditure reform
Tax reform
Financial liberalization & market-determined interest rates
Competitive exchange rates
Import liberalization
FDI liberalization
Privatization of state-owned enterprises
Deregulation
Protection of property rights
Issue one: Is Asian development unique?
• Some studies considered the Asian experience unique, i.e., there is an “Asian development model,” which emphasizes the role of state interventions, as opposed to the so-called “Washington Consensus,” which follows more closely the standard economic theory of market economies.
• The book argues that Asian economies implemented policies and reforms that are not very different from standard economic theories of market economies—in this sense, Asian development is not unique.
• Asian economies adopted a more gradual and pragmatic approach to implementing policy reforms, including the practice of testing major policy changes before full-scale implementation and careful sequencing. In this sense, Asian development is unique.
35

• Many Asian economies used industrial policies (IP) to promote development. “Horizontal” IP has worked by improving business environment. But targeted IP has been more controversial, and outcomes mixed.
➢ Targeted IP was discredited after the Asian financial crisis but received renewed attention in recent years.
• The book argues that targeted IP, if used badly, can lead to rent-seeking, unfair competition, and inefficiency; but if used wisely, can be effective, especially in areas with strong positive spillovers and coordination problems.
• Targeted IP is more likely to succeed when it is performance-based and promotes competition, with clear targets, sunset clauses, and transparent implementation rules.
• As a country becomes more developed, IP should focus more on supporting R&D to promote technological innovation that are less intrusive.
Issue two: The role of industrial policy
36

• Asian economies achieved high growth by promoting manufacturing and exports through large capital investment, R&D, trade and FDI, education and training, and SEZs.
NigeriaUSAVenezuela
Brazil
Colombia
Egypt
Australia
Bangladesh
India
Indonesia
PRC
Japan
Pakistan
Nepal
New Zealand
Philippines
Sri Lanka
Papua New Guinea
Rep. of KoreaSingapore
Hong Kong, China
Fiji
Malaysia Taipei,ChinaThailand
0
2
4
6
8
10
0 2 4 6 8 10 12 14 16 18
GD
P g
row
th
(an
nu
al a
vera
ge, %
)
Export Growth and Economic Growth, 1960–2017
Bubble size: Population (2017). Color gradient:
Trade/GDP (2017)
Growth in export of goods and services (annual average, %)
Issue three: Can industrialization be bypassed?
0
50
India PRC NIEs ASEAN4
Manufacturing Employment (% of total)
1970-1979 1980-1989 1990-1999 2000-2009 2010-2018
• Historically, manufacturing was important almost in all high-income countries worldwide before de-industrialization.
• Manufacturing is important because it: produces tradable outputs and generates foreign exchange; has high income elasticity of demand, large scope for innovation, and scale economies; and creates better paying jobs.
ASEAN = Association of Southeast Asian Nations, NIEs = newly industrialized economies, PRC = People’s Republic of China.Notes: ASEAN4 includes Indonesia, Malaysia, the Philippines, and Thailand. NIEs include Hong Kong, China; the Republic of Korea; Singapore; and Taipei,China.Sources: International Labour Organization (ILO). ILOSTAT database. https://www.ilo.org/ilostat(accessed 28 August 2019); Timmer, M. P., G.J. de Vries, and K. de Vries. 2015. Patterns of Structural Change in Developing Countries. In Weiss, J., and M. Tribe, eds. Routledge Handbook of Industry and Development. Abingdon: Routledge. pp. 65–83 (for the Groningen Growth and Development Center 10-Sector Database) (accessed 28 August 2019); and Asian Development Bank estimates
GDP = gross domestic product, PRC = People’s Republic of China, USA = United States.Notes: GDP and exports of goods and services are in constant national 2011 prices. Trade-to-GDP ratio is based on nominal values. Trade refers to exports plus imports of goods and services. Source: Feenstra, R. C., R. Inklaar, and M. P. Timmer. 2015. The Next Generation of the Penn World Table. American Economic Review. 105 (10). pp. 3150–3182. http://www.ggdc.net/pwt.
37

Issue four: The importance of institutions
y = 0.39x + 3.86R² = 0.60
0.0
1.0
2.0
3.0
4.0
5.0
6.0
-2.0 -1.0 0.0 1.0 2.0 3.0
Government effectiveness score
Government Effectiveness Score and Per Capita GDP in 2011, Developing Asia
Log
(per
cap
ita
GD
P)
• There is a positive association between quality of institutions and economic development, and Asia is no exception. But this correlation may vary across different dimensions of institutions and depends on a country’s stage of development.
• At a low-income stage, igniting growth is a priority, and government effectiveness, regulatory quality and control of corruption are important. As a country becomes more developed, the priority is sustaining growth, and accountability and wide citizen participation could become more important.
• In some Asian economies, creating a vision for the future that was shared across a wide spectrum of society and promoted by forward looking leaders, made a difference, especially when backed by a component bureaucracy. GDP = gross domestic product.
Source: Asian Development Bank. 2013. Asian Development Outlook 2013 Update: Governance and Public Service Delivery. Manila
38

Presentation outline
1. Overview of the Asian Development Bank
2. 50 years of Asian development
• Asia’s key development achievements
• What explains Asia’s economic success
• Issues subject to extensive debate
• Asia’s challenges in post COVID-19 era
3. Summary and further readings
39

Asia’s challenges in post COVID-19 era
Asia’s development gaps with advanced countries remain large—in 2018, developing Asia’s per capita GDP was just 13% of OECD level with remaining and emerging challenges, such as:
1. Overcoming the health crisis by “smart” approaches and achieving universal health coverage
2. Promoting innovation-based growth
3. Making growth more inclusive and narrowing gender gaps
4. Reopening education with better quality
5. Reducing large infrastructure gaps
6. Building back greener
7. Responding to demographic change and population aging
40

There are renewed COVID-19 waves globally… but it is stable or declining in developing Asia
The virus continues to spread globally… …with South Asia being the epicenter in developing Asia.
Note: Latin America includes Argentina, Bolivia, Brazil, Chile, Colombia, Costa Rica, Cuba, Dominican Republic, El Salvador, Guatemala, Haiti, Honduras, Mexico, Nicaragua, Panama, Paraguay, Peru, Uruguay, Venezuela.Sources: European Centre for Disease Prevention and Control, Johns Hopkins University, Telegraph UK, and Worldometer (accessed on 25 January 2021).
Sources: European Centre for Disease Prevention and Control, Johns Hopkins University,
Telegraph UK, and Worldometer (accessed on 25 January 2021) .
100
1,000
10,000
100,000
1,000,000
3 2020 4 2020 5 2020 6 2020 7 2020 8 2020 9 2020 102020
112020
122020
1 2021
New cases, 7-day moving average (Log scale)
Developing Asia
Latin America
United States
Euro Area
0
1
10
100
1,000
10,000
100,000
2 2020 3 2020 4 2020 5 2020 6 2020 7 2020 8 2020 9 2020 102020
112020
122020
1 2021
New cases, 7-day moving average (Log scale)
South Asia
Southeast Asia
Central Asia
East Asia
The Pacific
41
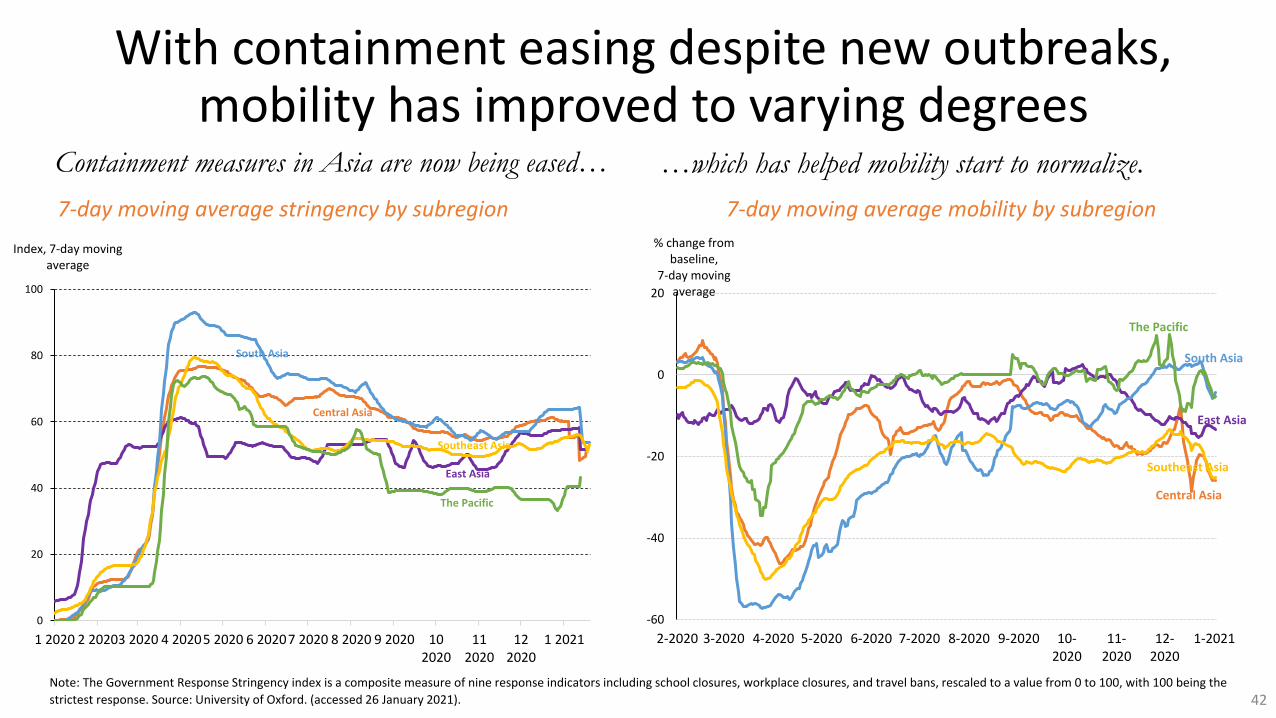
With containment easing despite new outbreaks, mobility has improved to varying degrees
Containment measures in Asia are now being eased…
Note: The Government Response Stringency index is a composite measure of nine response indicators including school closures, workplace closures, and travel bans, rescaled to a value from 0 to 100, with 100 being the
strictest response. Source: University of Oxford. (accessed 26 January 2021).
…which has helped mobility start to normalize.
7-day moving average mobility by subregion7-day moving average stringency by subregion
Central Asia
East Asia
South Asia
Southeast Asia
The Pacific
0
20
40
60
80
100
1 2020 2 20203 2020 4 20205 2020 6 20207 2020 8 2020 9 2020 102020
112020
122020
1 2021
Index, 7-day moving average
Central Asia
East Asia
South Asia
Southeast Asia
The Pacific
-60
-40
-20
0
20
2-2020 3-2020 4-2020 5-2020 6-2020 7-2020 8-2020 9-2020 10-2020
11-2020
12-2020
1-2021
% change from baseline,
7-day moving average
42

But no end is yet in sight for the global tourism collapse…
Decline in tourist arrivals, selected developing Asian economies
For the 24 economies with tourist arrivals data available in Q4 2020, the year-on-year decline in arrivals ranges from 85% to 100%. For Pacific economies, year-on-year declines in arrivals are between 96% and 100%.
FSM = Federated States of Micronesia.Sources: CEIC Data Company; IMF Tourism Tracker; and official sources (accessed 19 January 2021).
-84.8
-100
-80
-60
-40
-20
0
20
40
Jan 2019 Apr Jul Oct Jan 2020 Apr Jul Oct
% change year on year
India Indonesia Viet Nam
Sri Lanka Taipei,China Rep. of Korea
Singapore Nepal Hong Kong, China
Thailand Maldives Georgia
-95.7
-100
-50
0
50
100
Jan 2019 Apr Jul Oct Jan 2020 Apr Jul Oct
% change year on year
Vanuatu Palau FijiSamoa Cook Islands FSMPapua New Guinea Marshall Islands Solomon IslandsTonga Tuvalu
43

…with many travelers deferring travel for a longer period.
Travel plans after bans are lifted
Source: IATA
22%
45%
23%
7%
3%
14%
47%
28%
8%
4%
12%
33%36%
14%
5%
15%
33% 32%
15%
5%
Not wait at all Wait a month or two Wait six months or so Wait a year or so Not travel for the foreseeablefuture
February Survey April Survey June Survey August Survey
52% of survey respondents plan to
wait six months to a year or more
after travel bans are lifted before
traveling or have deferred travel
indefinitely.
There has also been a
shift toward domestic
and short-haul travel.
44
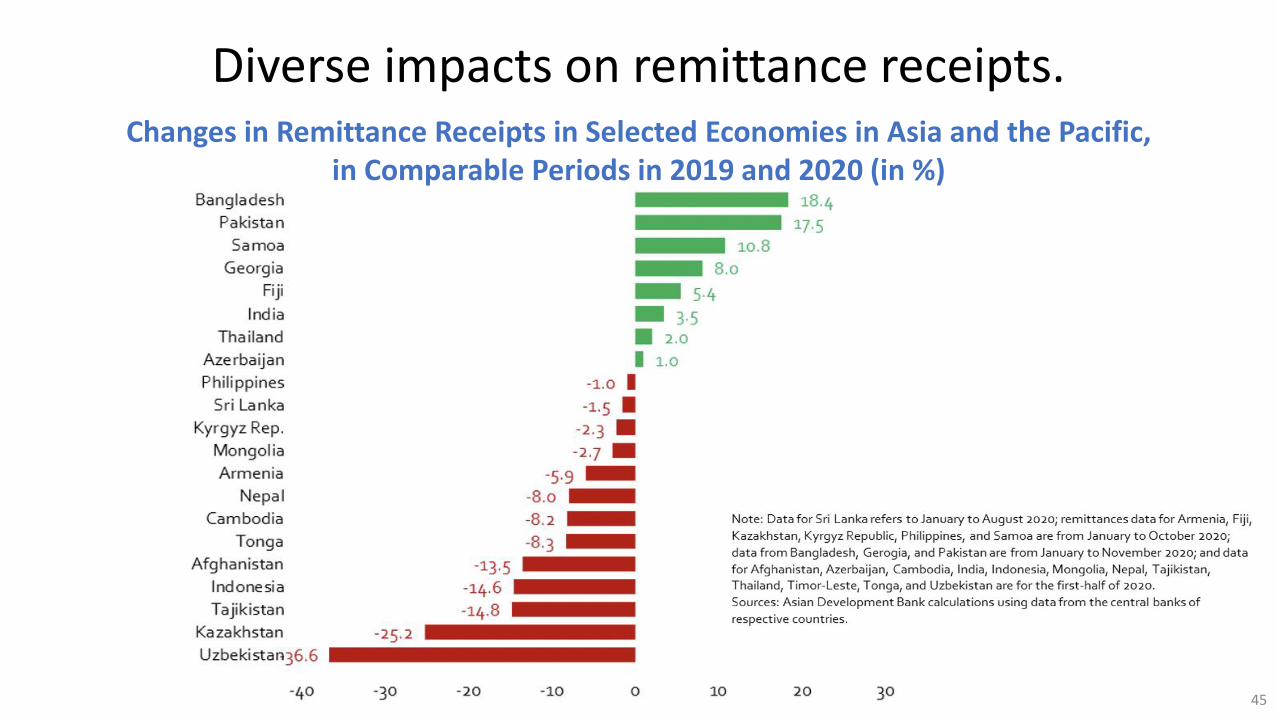
Diverse impacts on remittance receipts.
45
Changes in Remittance Receipts in Selected Economies in Asia and the Pacific, in Comparable Periods in 2019 and 2020 (in %)

COVID-19’s impact will drag into 2021.
Note: Small tourism-dependent economies include Cook Islands, Fiji, Maldives, Palau, and Vanuatu.Source: The Impact of COVID-19 on Developing Asia: The Pandemic Extends into 2021. ADB Brief No. 159, 4 December 2020.
COVID-19’s impact on developing Asian subregions (relative to a no-COVID baseline)
COVID-19’s global impact: 5.5% to 8.7% of lost global GDP in 2020 3.6% to 6.3% of lost global GDP in 2021
COVID-19’s regional impact: 6.0% to 9.5% of lost regional GDP in 2020 3.6% to 6.3% of lost regional GDP in 2021
46

Regional GDP contracted by 0.4% in 2020…
Real GDP growth in developing Asia
ADO = Asian Development Outlook, ADOS = ADO Supplement, GDP = gross domestic product.Source: Asian Development Outlook database.
Real GDP levels in developing Asia
100
110
120
130
140
2015 2016 2017 2018 2019 2020 2021
2015 real GDP = 100
Forecast
Pre-COVID trend
After a 0.4% contraction in 2020, growth will resume this year… …but output will remain well below where it should be.
5.95.1
-0.4
6.8
2.2
6.2
-0.7-2
0
2
4
6
8
2018 2019 2020 2021
%
April 2020ADO
December 2020ADOS
Forecast
%
April 2020ADO
December 2020ADOS
Forecast
September 2020Update
47

p = upgraded forecast, q = downgraded forecast, no sign = unchanged.
ADOS = Asian Development Outlook Supplement.Source: Asian Development Outlook database.
2020 2021 2020 2021September
UpdateDecember
ADOSSeptember
UpdateDecember
ADOSSeptember
UpdateDecember
ADOSSeptember
UpdateDecember
ADOS
East Asia 1.3 1.6 p 7.0 7.0 Southeast Asia -3.8 -4.4 q 5.5 5.2 q
Hong Kong, China -6.5 -5.5 p 5.1 5.1 Indonesia -1.0 -2.2 q 5.3 4.5 q
People’s Rep. of China 1.8 2.1 p 7.7 7.7 Malaysia -5.0 -6.0 q 6.5 7.0 p
Republic of Korea -1.0 -0.9 p 3.3 3.3 Philippines -7.3 -8.5 q 6.5 6.5
Taipei,China 0.8 1.7 p 3.5 3.3q Singapore -6.2 -6.2 4.5 5.1 p
Thailand -8.0 -7.8 p 4.5 4.0 q
South Asia -6.8 -6.1 p 7.1 7.2p Viet Nam 1.8 2.3 p 6.3 6.1 q
India -9.0 -8.0 p 8.0 8.0
The Pacific -6.1 -6.1 1.3 1.3
Central Asia -2.1 -2.1 3.9 3.8q
Kazakhstan -3.2 -3.2 2.8 2.8
Developing Asia -0.7 -0.4 p 6.8 6.8 Excluding NIEs -0.5 -0.3 p 7.2 7.2
…with East Asia doing much better than the rest of the region.
GDP growth (%)
48
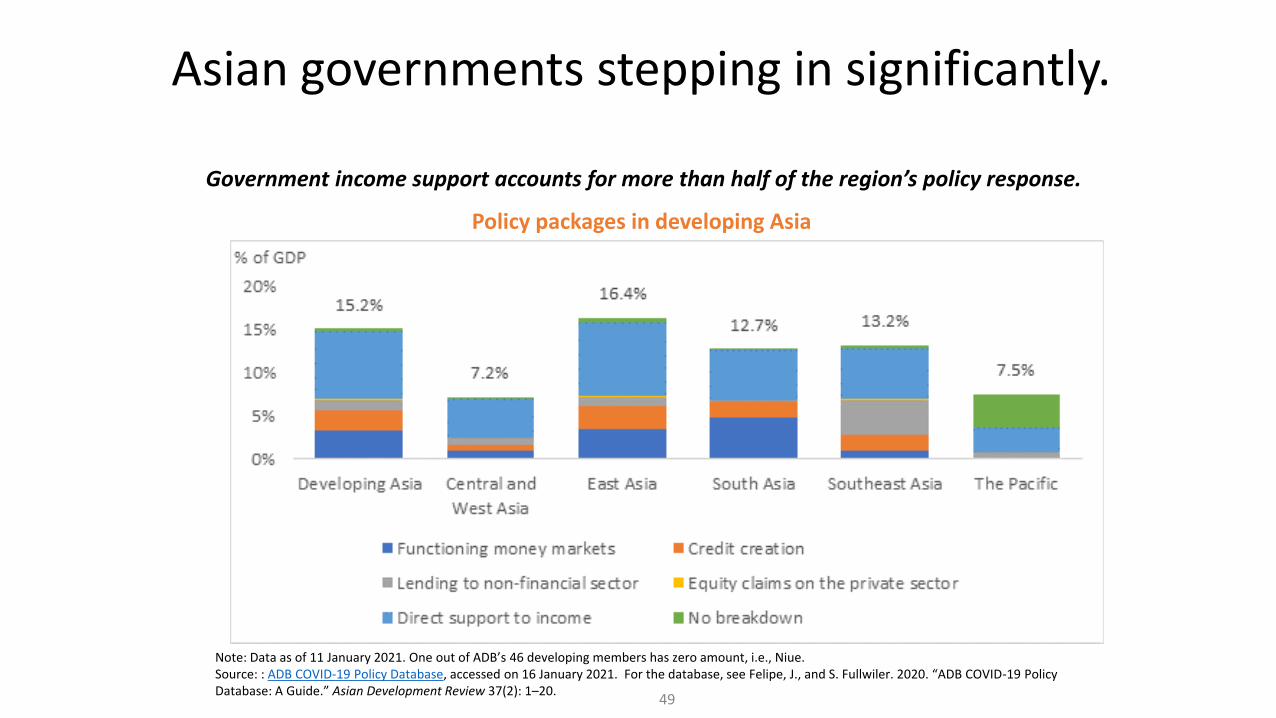
Asian governments stepping in significantly.
Policy packages in developing Asia
Note: Data as of 11 January 2021. One out of ADB’s 46 developing members has zero amount, i.e., Niue.Source: : ADB COVID-19 Policy Database, accessed on 16 January 2021. For the database, see Felipe, J., and S. Fullwiler. 2020. “ADB COVID-19 Policy Database: A Guide.” Asian Development Review 37(2): 1–20.
49
Government income support accounts for more than half of the region’s policy response.

50
Many economies moved from balanced budgets and low debt to sizeable deficits and higher debt.
AFG
KIR
LAO
MLD
RMIFSM
SAMTAJ TON
TUV
AFG
KIR
LAO
MLD
RMI
FSM
SAM
TAJTON
TUV
BAN
CAM
MYA
NEP
TIM
UZB
BHU
KGZ
PNG
SOL
VAN
BAN
CAM
MYANEP
TIM
UZB
BHU
KGZ
PNG
SOL
VAN
0%
25%
50%
75%
100%
125%
150%
-50% -40% -30% -20% -10% 0% 10% 20% 30%
Pub
lic D
ebt
(% o
f G
DP)
Fiscal Balance (% of GDP)
2019
2021
2019: 2 DMCs2021: 1 DMCs
2019: 9 DMCs2021: 19 DMCs
2019: 19 DMCs2021: 18 DMCs
2019: 10 DMCs2021: 2 DMCs
DMC = developing member country, GDP = gross domestic product.Notes: Projections are from Baseline Scenario. Comprises a panel of 40 ADB DMCs. Lower-income DMCs are shown with darker shaded dots and labels. Sources: ADB projections using data from World Economic Outlook (WEO) October 2019, WEO April 2020, WEO October 2020 and Asian Development Outlook (ADO) Update – September 2020.
Public debt and fiscal balance

51

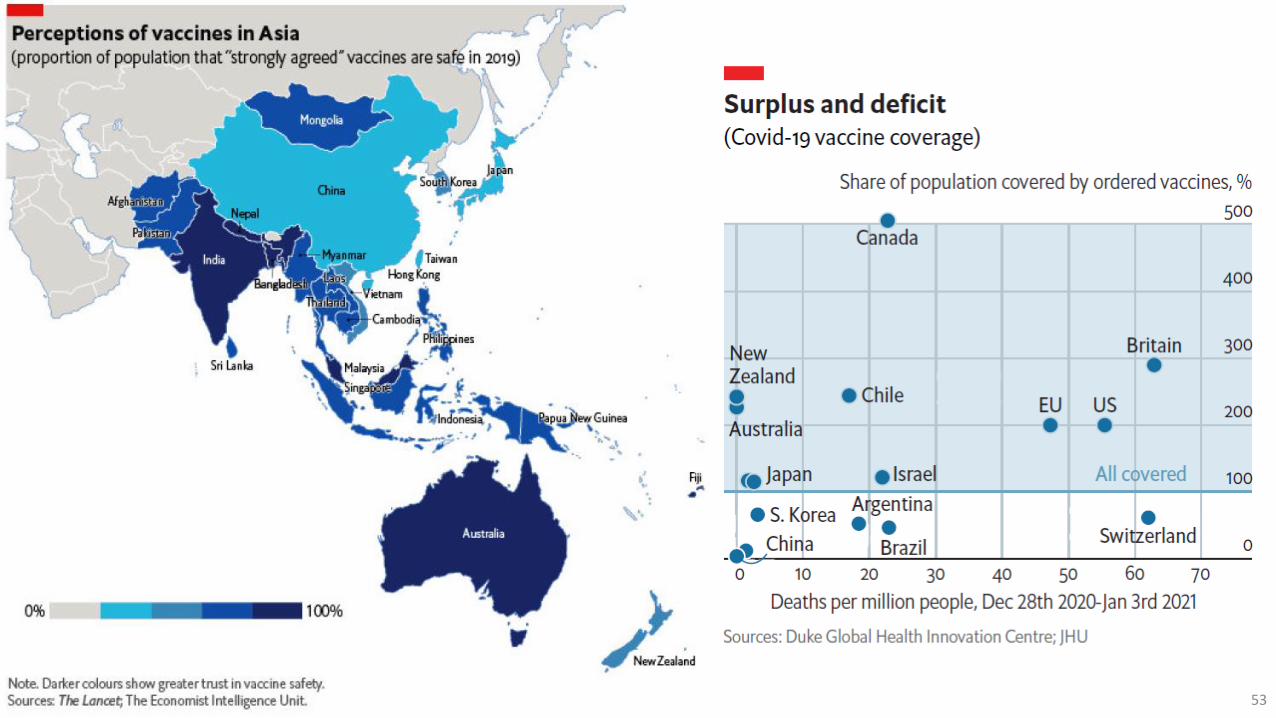
Vaccination policies differ significantly
52
Vaccine Procurement in Selected Asian Economies
Source: Duke Global Health Innovation Center (https://launchandscalefaster.org/COVID-19).
0%
20%
40%
60%
80%
100%
120%
140%
Perc
ent
of
Pop
ula
tio
n C
ove
red
CanSino Gamaleya Janssen Moderna Novavax Oxford Pfizer Sinopharm Sinovac
53

Total current health expenditure (% of GDP)
Of Which, GovernmentHealth Expenditures
(% of GDP)
Out-of-Pocket Current Expenditure
(% of total current health expenditure)
2000 2010 2016 2000 2010 2016 2000 2010 2016
Developing Asia 3.9 4.1 4.8 1.2 2.0 2.5 55.9 43.9 39.5
Central Asia 5.0 4.1 5.5 2.0 1.8 2.1 57.5 52.2 57.1
East Asia 4.3 4.5 5.2 1.3 2.4 3.1 55.3 39.5 35.5
People’s Republic of China 4.5 4.2 5.0 1.0 2.2 2.9 60.1 40.8 35.9
South Asia 4.3 4.5 5.2 0.9 0.8 0.9 69.1 65.3 64.4
India 4.0 3.3 3.7 0.8 0.9 0.9 71.7 65.2 64.6
Southeast Asia 2.8 3.4 3.9 1.2 1.4 1.9 41.6 42.9 37.1
The Pacific 3.6 2.9 3.1 2.7 1.7 2.0 8.9 12.4 10.0
Developed Asia 7.2 9.0 10.6 5.7 7.2 8.5 16.3 15.3 14.4
Australia 7.6 8.4 9.3 5.2 5.8 6.3 21.0 19.7 18.9
Japan 7.2 9.2 10.9 5.8 7.5 9.1 15.9 14.6 13.5
Latin America and the Caribbean 5.9 7.9 8.6 2.5 3.5 4.1 41.9 39.2 36.7
Sub-Saharan Africa 5.1 5.3 5.2 1.7 1.9 1.8 32.4 33.5 36.7
OECD 9.3 11.6 12.6 5.6 7.4 10.1 16.3 14.6 13.9
World 8.6 9.6 10.0 4.9 5.8 7.4 19.1 18.9 18.6
• Asian economies improved their overall healthcare systems by
❖ raising government spending on health;
❖ implementing reforms in health service delivery, institutions, and financing; and
❖ encouraging private health sector participation.
54
GDP = gross domestic product, OECD = Organisation for Economic Co-operation and Development.Note: Private enterprises and other nongovernment organizations account for the difference between total current health expenditure and the sum of government and out-of-pocket current health expenditure.Source: World Bank. World Development Indicators. https://databank.worldbank.org/reports.aspx?
Health Expenditures by Subregion, 2000, 2010, and 2016
Achieving universal health coverage (UHC)…

… and improving education quality
16.2
18.5
39.5
44.6
48.6
52.7
57.5
71.8
77.4
79.2
81.0
82.7
87.3
89.2
90.5
92.6
92.8
93.5
93.5
93.8
0.1
0.1
0.3
0.4
0.3
1.4
1.4
1.1
5.8
11.6
10.5
2.7
24.6
20.7
28.6
24.0
11.6
22.2
20.8
37.0
0 20 40 60 80 100
India*
Kyrgyz Republic
Philippines
Indonesia
Azerbaijan
Georgia
Thailand
Mongolia
Malaysia
OECD
US
Armenia
PRC*
ROK
Taipei,China
Japan
Viet Nam
Hong Kong, China
Kazakhstan
Singapore
Average Science/Mathematics Test Scores (% of student participants achieving 400+ and 600+)
600+ 400+
55
OECD = Organisation for Economic Co-operation and Development, PRC = People’s Republic of China, ROK = Republic of Korea, US = United States.Notes: PRC* includes only Beijing, Shanghai, Jiangsu, and Guangdong. India* includes only Himachal Pradesh and Tamil Nadu. The test scores are standardized to range from 0 to 1,000. Data are for 2015 Programme for International Student Assessment (PISA) / Trends in International Mathematics and Science Study (TIMSS) scores except for Armenia and the Philippines (TIMSS 2003); Mongolia (TIMSS 2007); Azerbaijan, India, and the Kyrgyz Republic (PISA 2009).Sources: Organisation for Economic Co-operation and Development (OECD). 2016. PISA 2015 Results in Focus. Paris; OECD. 2010. PISA 2009 Results: Learning Trends. Paris; International Association for the Evaluation of Educational Achievement (IEA). 2016. Trends in International Mathematics and Science Study 2015. Chestnut Hill, MA: TIMSS & PIRLS International Study Center, Boston College; IEA. 2008. Trends in International Mathematics and Science Study 2007. Chestnut Hill, MA: TIMSS & PIRLS International Study Center, Boston College.; and IEA. 2004. Trends in International Mathematics and Science Study 2003. Chestnut Hill, MA: TIMSS & PIRLS International Study Center, Boston College.

Addressing rising income inequality
Gini coefficients change in 1990s-2010s End-year value
RegionPre-tax and Pre-transfer Gini (mean)
Post-tax and Post-transfer Gini (mean)
% Difference
Developing Asia 40.0 37.4 (6.3)
Japan, Australia, and New Zealand
45.7 32.6 (28.6)
Latin America and the Caribbean
47.1 43.4 (7.7)
Sub-Saharan Africa 45.9 45.0 (1.8)
European Union 46.8 29.9 (36.0)
North America 48.6 34.5 (29.1)
OECD 46.4 31.0 (33.2)
Asia’s Inequality in the Global Context
-10 -5 0 5 10 15
PRC (1990-2017)
Sri Lanka (1990-2016)
Indonesia (1990-2017)
Bangladesh (1991-2016)
India (1993-2012)
Lao PDR (1992-2012)
Pakistan (1990-2015)
Viet Nam (1992-2016)
Mongolia (1995-2016)
Nepal (1995-2010)
Philippines (1991-2015)
Thailand (1990-2017)
Malaysia (1992-2015)
46.7 (I)
39.8 (C)
38.1 (C)
32.4 (C)
35.7 (C)
36.4 (C)
33.5 (C)
35.3 (C)
32.3 (C)
32.8 (C)
40.1 (C)
45.3 (I)
41.0 (I)
Lao PDR = Lao People’s Democratic Republic, PRC = People’s Republic of China.Notes: Bars refer to changes in Gini coefficients between the two indicated periods. Numbers in the column on the right refer to levels of Gini coefficients for the final year. Symbols in parentheses indicate whether a Gini coefficient is income-based (I) or consumption expenditure-based (C).Sources: World Bank. PovcalNet Database. http://iresearch.worldbank.org/PovcalNet/home.aspx (accessed 1 October 2019); for the PRC: National Bureau of Statistics of China. China Statistical Yearbook. http://www.stats.gov.cn/english/Statisticaldata/AnnualData/(accessed 1 March 2019); and for Thailand: National Economic and Social Development Board. Social Development Indicators. https://www.nesdb.go.th/nesdb_en/main.php?filename=social_dev_report (accessed 1 March 2019).
( ) = negative, OECD = Organisation for Economic Co-operation and Development.Note: Mean refers to the simple average of Gini coefficients of the countries in the region.Source: Solt, F. 2019. Measuring Income Inequality across Countries and over Time: The Standard World Income Inequality Database, Version 8. https://dataverse.harvard.edu/dataset.xhtml?persistentId=doi:10.7910/DVN/%20LM4OWF (accessed 1 August 2019). 56

Narrowing gender gaps
Challenges to achieve gender equality:
❑ Increase women’s access to the formal labor market and decent work
❑ Reduce women’s unequal share of unpaid care and domestic work
❑ Increase women’s public and political participation
❑ Eliminate gender discrimination in laws, policies, and social norms
Share of Vulnerable Employment of Women (% of total female employment)
38.4 46.9
79.053.2
82.855.2
8.122.0
46.0
0
20
40
60
80
100
Central Asia East Asia(excl. ROK)
South Asia SoutheastAsia
The Pacific DevelopingAsia
Japan ROK World
Gender Wage Gap in the World by Income Level, 1995–2015
Developing Asia
Rest of the World
Real GDP per capita (2010 US dollars)
Notes: East Asia excludes the Republic of Korea. Workers in vulnerable employment include own-account workers (self-employed persons without engaging employees) and contributing family workers (self-employed persons working in an establishment operated by a relative of the same household).Source: Asian Development Bank calculations using data from International Labour Organization. ILOSTAT. https://www.ilo.org/ilostat/ (accessed 1 March 2019).
GDP = gross domestic product, US = United States.Sources: Wage data from Terada-Hagiwara, A., S. Camingue-Romance, and J. Zveglich. 2019. Gender Differences and Relative Pay: Does the Stage of Development Matter? Paper presented at the Asian and Australasian Society of Labour Economics 2019 Conference, National University of Singapore, 12–14 December; real per capita GDP data from World Bank. World Development Indicators. https://data.worldbank.org; for Taipei,China: data from Directorate-General of Budget, Accounting and Statistics. 57

GDP = gross domestic productSources: ADB estimates.
Baseline Climate-adjusted
Total % of GDP Total % of GDP
Central Asia 492 6.8 565 7.8
East Asia 13,781 4.5 16,062 5.2
South Asia 5,477 7.6 6,347 8.8
Southeast Asia 2,759 5 3,147 5.7
The Pacific 42 8.2 46 9.1
Asia and the Pacific 22,5515.1
26,1665.9
Annual Average 1,503 1,744
Developing Asia’s investment needs, 2016–2030 ($ billion in 2015 prices)
Reducing large infrastructure gaps
58

Rest of Developing Asia, 12.7%
People's Republic of China,
24.7%
India, 6.8%
Japan, 2.8%
Australia and New
Zealand, 1.2%
Middle East and North
Africa, 8.1%
Sub-Saharan Africa, 5.9%
LAC, 8.4%
North America,
15.3%
Europe,14.1%
2014
Rest of Developing Asia, 11.3%%
PRC, 8.7%
India, 3.5%
Japan, 3.4%
AUS and NZL,1.6%
MENA, 5.3%
Sub-Saharan Africa, 7.7%
Latin America and
the Caribbean, 10.4%
North America,
19.0%
Europe, 29.3%
1990
• Pressure from rapid economic development has created many environmental problems.
• Environmental policy responses were initiated and expanded in recent 2–3 decades.
• But much more action is needed to make the region’s development sustainable and contribute to global efforts.
Global Shares of Greenhouse Gas (Carbon Dioxide Equivalent)Annual Emissions
Protecting environment and tackling climate change
AUS = Australia, LAC = Latin America and the Caribbean, MENA = Middle East and North Africa, NZL = New Zealand, PRC = People’s Republic of China.Note: Includes emissions from land use, land-use change, and forestry. Source: Authors' calculations from World Resources Institute. CAIT Climate Data Explorer. http://cait.wri.org. (accessed 26 October 2019)
59

36.4 40.4 41.3 38.2 34.0 30.6 26.1 24.0
59.7 56.1 55.1 57.6 61.4 64.0 67.6 68.1
4.0 3.5 3.6 4.1 4.7 5.5 6.3 7.9
1950 1960 1970 1980 1990 2000 2010 2018
0.0
0.5
1.0
1.5
2.0
2.5
3.0
3.5
4.0
4.5
5.0
0
10
20
30
40
50
60
70
80
90
100
1950 1960 1970 1980 1990 2000 2010 2018
Tota
l po
pu
lati
on
, bill
ion
Po
pu
lati
on
by
age
, % o
f To
tal
Total Population (billion) and Population by Age (% of Total), Developing Asia, 1950‒2018
0-14 15-64 65+ Developing Asia
Responding to demographic change and population aging
Source: United Nations, Department of Economic and Social Affairs, Population Division. 2019. World Population Prospects 2019. Online Edition. https://population.un.org/wpp (accessed 18 June 2019).
60

Presentation outline
1. Overview of the Asian Development Bank
2. 50 years of Asian development
• Asia’s key development achievements
• What explains Asia’s economic success
• Issues subject to extensive debate
• Asia’s challenges in post COVID-19 era
3. Summary and further readings
61

• Asia’s economic success owes much to creating better policy and stronger institutions. The book highlights the following:
1) relying on markets with proactive state support;
2) promoting structural transformation;
3) investing in productive capacity;
4) building human capital;
5) opening trade and investment;
6) maintaining macroeconomic stability;
7) promoting social inclusiveness; and
8) engaging with development partners and promoting RCI.
• Going forward, Asia still faces many challenges and there is no room for complacency.
• Asia must continue to maintain good policy, strengthen institutions, and contribute to the development of science and technology and to tackling global issues.
Summary
62

• Akamatsu, K. 1962. A Historical Pattern of Economic Growth in Developing Countries. The DevelopingEconomies. 1 (August). pp. 3–25
• Cherif, R., and F. Hasanov. 2019. The Return of the Policy That Shall Not Be Named: Principles ofIndustrial Policy. IMF Working Paper. No. WP/19/74. Washington, DC: International Monetary Fund.
• Maddison, A. 2007. Contours of the World Economy 1-2030 AD: Essays in Macro-Economic History. NewYork: Oxford University Press.
• Myrdal, G. 1968. Asian Drama: An Inquiry into the Poverty of Nations. London: Alien Lane, The PenguinPress.
• Prebisch, R. 1962. The Economic Development of Latin America and Its Principal Problems. EconomicBulletin for Latin America. 7 (1). pp. 1–23
• Rodrik, D. 2004. Industrial Policy for the Twenty-First Century. KSG Working Paper Series. No. RWP04-047. Cambridge, MA: Kennedy School of Government, Harvard University
• Rosenstein-Rodan, P. 1943. Problems of Industrialisation of Eastern and South-Eastern Europe. EconomicJournal. 53 (210/211). pp. 202–211.
• Williamson, J. 1989. What Washington Means by Policy Reform. Washington, DC: Peterson Institute forInternational Economics.
• World Bank. 1993. The East Asian Miracle: Economic Growth and Public Policy. New York: OxfordUniversity Press.
Further readings
63

Thank you!
My email address is:
The soft copy of the book can be downloaded at
https://www.adb.org/publications/asias-journey-to-prosperity
64

A Course Question
• Can manufacturing-driven growth be bypassed in your country? What is the role of industrial policy on manufacturing or non-manufacturing sector?
65
Copyright © 2022 FDOKUMEN