
1. Introduction - Asian Development Bank
108
1 A merchant may sell many things, but a worker usually has only one job, which supplies not only his livelihood but often much of his sense of identity. An unsold commodity is a nuisance, an unemployed worker a tragedy. Paul Krugman (1999, p. 15) 1. Introduction The developing member countries (DMCs) of the Asian Development Bank (ADB) have made considerable progress in improving the standard of living of their populations. However, far too many Asians continue to live in poverty. In terms of the $2-a-day poverty line—the one typically used in low- to middle-income countries to measure the extent of poverty—1.9 billion people, or 60% of Asia’s population, were poor in 2002 (ADB 2004a). Moreover, this poverty is widespread across Asia. Thus, while the incidence of $2-a-day poverty is extraordinarily high in South Asia, afflicting nearly 80% of the subregion’s population, it is by no means insubstantial in other parts of the region. A case in point is Indonesia, where $1-a-day poverty has been estimated in single digits (7.5% in 2002), but where $2-a-day poverty afflicts the majority of the population (52.4% in 2002). Even in Thailand, which has succeeded in pushing $1-a-day poverty to the low single digits, just under a third of the population subsists on less than $2 a day. How can Asia help its poor climb out of poverty? While there are many causes of poverty, ultimately the “poor are poor because they earn too little from the work that they do” (Fields 2004a). Regardless of whether they are self-employed, helping on the family farm or enterprise, or working for wages, most of Asia’s workers derive their incomes, and therefore sustain themselves and their families, by using their labor. From this point of view, improving labor market opportunities for workers is the key to reducing poverty and improving standards of living for the large majority of Asia’s workers and their families. Poverty reduction requires helping people as workers. Indeed, of all the problems that beset DMCs today, the employment problem is probably the central one. The challenge for Asia’s policy makers is not just one of creating jobs for the unemployed and for the new entrants to the labor force (of whom there will be many more in the years ahead) but also about improving the productivity and earnings of the available jobs. As elaborated throughout this theme chapter, Asia’s labor markets suffer from two main features. The first is considerable underutilization of labor, which manifests itself in unemployment and underemployment. While unemployment is easily understood (i.e., a person who lacks a job and is looking for one), underemployment is a much more subtle problem. Moreover, it is not confined to rural labor markets since it affects urban labor markets as well, especially in the informal economy, where many migrants from rural areas and longtime urban residents work hard to eke out a very basic living. Underemployment takes mainly the following four forms: (i) workers involuntarily working less than full time; (ii) highly skilled workers forced to take up low-paying jobs that require, at best, modest levels of skill (this causes a mismatch in the labor market); (iii) underutilization of employed workers due to overstaffing; and (iv) workers utilizing their raw labor and assisted with few complementary inputs, especially capital, which results in low productivity and meager earnings. The second main feature of Asia’s labor markets is that, while some countries have managed to achieve relatively high growth rates of output, the corresponding growth rates of employment have been somewhat disappointing (Box 1.1). In view of the large-scale unemployment and underemployment that characterize Asia’s labor markets and the difficulties inherent in accelerating the growth of employment, a key message of this theme chapter is that governments across the region must give maximum priority to promoting full, productive, and decent employment and to implementing credible and measurable policies to achieve these three objectives. What does full employment mean? In industrial countries, where integrated formal labor markets exist, and where employed workers are paid a market-determined wage rate, the notion of full employment consists in
-
Upload
khangminh22 -
Category
Documents
-
view
3 -
download
0
Transcript of 1. Introduction - Asian Development Bank

1
A merchant may sell many things, but a worker usually has only one job, which supplies not only his livelihood but often much of his sense of identity. An unsold commodity is a nuisance, an unemployed worker a tragedy.
Paul Krugman (1999, p. 15)
1. Introduction
The developing member countries (DMCs) of the Asian Development Bank (ADB) have made considerable progress in improving the standard of living of their populations. However, far too many Asians continue to live in poverty. In terms of the $2-a-day poverty line—the one typically used in low- to middle-income countries to measure the extent of poverty—1.9 billion people, or 60% of Asia’s population, were poor in 2002 (ADB 2004a). Moreover, this poverty is widespread across Asia. Thus, while the incidence of $2-a-day poverty is extraordinarily high in South Asia, affl icting nearly 80% of the subregion’s population, it is by no means insubstantial in other parts of the region. A case in point is Indonesia, where $1-a-day poverty has been estimated in single digits (7.5% in 2002), but where $2-a-day poverty affl icts the majority of the population (52.4% in 2002). Even in Thailand, which has succeeded in pushing $1-a-day poverty to the low single digits, just under a third of the population subsists on less than $2 a day.
How can Asia help its poor climb out of poverty? While there are many causes of poverty, ultimately the “poor are poor because they earn too little from the work that they do” (Fields 2004a). Regardless of whether they are self-employed, helping on the family farm or enterprise, or working for wages, most of Asia’s workers derive their incomes, and therefore sustain themselves and their families, by using their labor. From this point of view, improving labor market opportunities for workers is the key to reducing poverty and improving standards of living for the large majority of Asia’s workers and their families. Poverty reduction requires helping people as workers. Indeed, of all the problems that beset DMCs today, the employment problem is probably the central one.
The challenge for Asia’s policy makers is not just one of creating jobs for the unemployed and for the new entrants to the labor force (of whom there will be
many more in the years ahead) but also about improving the productivity and earnings of the available jobs. As elaborated throughout this theme chapter, Asia’s labor markets suffer from two main features. The fi rst is considerable underutilization of labor, which manifests itself in unemployment and underemployment. While unemployment is easily understood (i.e., a person who lacks a job and is looking for one), underemployment is a much more subtle problem. Moreover, it is not confi ned to rural labor markets since it affects urban labor markets as well, especially in the informal economy, where many migrants from rural areas and longtime urban residents work hard to eke out a very basic living. Underemployment takes mainly the following four forms: (i) workers involuntarily working less than full time; (ii) highly skilled workers forced to take up low-paying jobs that require, at best, modest levels of skill (this causes a mismatch in the labor market); (iii) underutilization of employed workers due to overstaffi ng; and (iv) workers utilizing their raw labor and assisted with few complementary inputs, especially capital, which results in low productivity and meager earnings.
The second main feature of Asia’s labor markets is that, while some countries have managed to achieve relatively high growth rates of output, the corresponding growth rates of employment have been somewhat disappointing (Box 1.1).
In view of the large-scale unemployment and underemployment that characterize Asia’s labor markets and the diffi culties inherent in accelerating the growth of employment, a key message of this theme chapter is that governments across the region must give maximum priority to promoting full, productive, and decent employment and to implementing credible and measurable policies to achieve these three objectives.
What does full employment mean? In industrial countries, where integrated formal labor markets exist, and where employed workers are paid a market-determined wage rate, the notion of full employment consists in
ThemeApRev.indd 1ThemeApRev.indd 1 08/08/2005 11:31:47 AM08/08/2005 11:31:47 AM

2 Key Indicators of Developing Asian and Pacific Countries
Box 1.1: Growth without Employment
minimizing the number of unemployed in the labor force.1 In developing countries, however, the meaning is slightly different. The reason is that in these countries, an important proportion of the labor force is underutilized. Therefore, full employment in the developing country context is about reducing unemployment as well as reducing underemployment—a far more pressing problem than unemployment in most DMCs.
It must be added that the objective of full employment is not enough in itself. Indeed, the employment created must be productive. This is to avoid governments succumbing to the temptation to solve the unemployment problem by creating hundreds (or even thousands) of unneeded jobs in, for example, state enterprises. This might offer no more than a temporary palliative to the unemployment problem that would, however, exacerbate the underemployment 1 We follow Pasinetti (1993), for whom full employment means
zero involuntary unemployment, i.e., no one who is ready and willing to work full time (it also refers to zero involuntary part-time employment and underemployment) for an appropriate wage is jobless. This is different from the notions of the natural rate of unemployment (NRU) or the nonaccelerating inflation rate of unemployment (NAIRU). While achieving zero involuntary unemployment is virtually impossible, it does not mean that governments should not strive to achieve it. That is why in the text, reference is made to minimizing (involuntary) unemployment rather than eliminating it.
problem. For example, state enterprises may hire many qualifi ed people, such as engineers to run electricity companies. However, they may hire so many of them that, for all practical purposes, these engineers are underutilized.2
Governments also need to ensure that employment is decent. This means that employment provides workers with basic rights (such as the freedom of association, protection from forced or compulsory labor, and elimination of discrimination) and security. This is most critical in the informal sector, i.e., that part of the economy largely outside the purview of government regulations,3 where the absence of basic rights at work and inadequate social protection is most pronounced (ILO 2002a). Protecting the basic rights of workers and giving them a say in the decisions that affect their lives are key to ensuring that 2 DMCs have statistics of underemployment. These correspond, in
general, to the first type of underemployment mentioned above (workers involuntarily working less than full time). Statistics of the second and third types of underemployment (due to skills mismatch and to overstaffing) are not published. The fourth type of underemployment (due to work with few complementary inputs) is potentially the most difficult to measure, but not impossible. In its extreme form, this type of underemployment can be approximated through statistics on poverty.
3 Common features include evasion of taxes, lack of enforcement of labor laws, and a nonexistent contract system.
The development literature recognizes that unemployment in urban areas is only one aspect of the wider problem of unemployment, underemployment, and poverty in developing countries. It may be that the situation of the unemployed (many of whom are young and educated) but supported by the extended family system, is no worse than that of a fully employed poor farmer who works for a subsistence wage. Unemployment must be linked with the general problem of underutilization of resources and with poverty.
Nevertheless, unemployment in urban areas, in particular affecting the 15–24 age group, has become a serious problem in most developing countries. In 2004, unemployment in Metro Manila (Philippines), for example, was around 16%, well above the national average; unemployment in the 15–24 age group stood at above 20%. However, the Philippines managed to grow by about 6.1% in 2004. This indicates that the country is facing a chronic rather than a cyclical problem.
The phenomenon of growth without employment has exposed the problems of conventional development strategies based on the “Lewis”-type of labor surplus models (see Section 2), which rely on the assumption of a modern sector with the capacity to lead the country’s industrialization. These models have seriously overestimated the capacity of the modern sector to absorb the unemployed and underemployed as well as the labor surplus in the agriculture sector, and to be the engine of growth. Moreover, the type of modern sector development that has taken place has an urban bias, is capital intensive, and has led to high wages and productivity in some sectors and areas. It has exacerbated the situation by further attracting migration toward urban areas without their having the capacity to absorb new entrants.
On the supply side, two factors have in particular contributed to a rapid increase in the labor force: the high rate of population growth and the “education explosion,” which has increased the proportion of the young leaving rural areas to seek modern sector jobs. The education system has a clear urban-academic bias. The rapid spread of universal primary education has raised expectations among the young to seek modern sector jobs, causing widespread unemployment among primary school leavers. These two factors operate against a background of significant inequalities in land holdings, which result in the inability of many, frequently large, families to provide sufficient work and income for themselves, given their lack of capital and knowledge of capital-intensive techniques. Low and unstable prices of agricultural products, poor transport facilities, and poor general infrastructure turn the terms of trade against the rural sector.
On the demand side, the capital-intensive nature of the modern sector has meant that output has grown faster than employment. The presence of multinational corporations plays an important role in explaining why this has happened, as they determine the nature of the technologies being used. This is because these technologies are devised in industrial countries, where most of the research is carried out. Hence, they tend to reflect the conditions and relative prices there.
Finally, the rural-urban differential is a key factor explaining the constant and high rate of migration from rural to urban areas. Thus, employment policies will have to consider this issue explicitly.
Source: Ghatak (2003).
ThemeApRev.indd 2ThemeApRev.indd 2 08/08/2005 11:32:17 AM08/08/2005 11:32:17 AM

3
workers can lead a life of dignity even when their earnings are low. Moreover, better and fairer working conditions, along with the ability to draw upon mechanisms of social protection, can also enhance workers’ productivity.
This theme chapter is not claiming that the achievement of full, productive, and decent employment is an easy task for policy makers. The message that it aims to convey is that, unless these three objectives become a fundamental part of the macroeconomic agenda of DMCs, it is easy to conceive of a region, say 25 years from now, which, despite continuous growth, will still harbor most of the world’s poor. For this reason, DMC governments must devise time-bound, feasible, credible, and measurable strategies, which should be incorporated as part of the countries’ development plans, to reduce unemployment and underemployment in a sensible manner. That the plan must be time-bound means that policy makers must commit themselves to reducing, and potentially eliminating, unemployment and underemployment within a reasonable amount of time, say 25 years (not necessarily the same in each country). This objective must be broken down into partial objectives for decades, 5-year periods, and years. For the plan to be feasible it must be consistent with the broad contours of a given country’s economic policy and economic context. A credible plan means that policy makers must avoid “populist” measures. Constituents will not be fooled by plans that are not credible.4 Finally, the plan must be based on measurable indicators. This will enable policy makers to provide appropriate policy responses. It was indicated above that policy makers must follow the evolution of both unemployment and underemployment.5
What government policies will promote full, productive, and decent employment? Figure 1.1 summarizes a blueprint for this, intended to be a guide for policy action. The fi gure is divided into three blocks. The left-hand side shows the labor market outcomes across most DMCs—unemployment and underemployment. They are the main causes of poverty and informality in the region. These outcomes are the result of the dynamics and interaction of labor supply (population growth) and demand (investment), which operate within each country’s particular context of labor market policies and institutions as well as within the general context of a world characterized by globalization, technological progress, and competitiveness. The right-
4 This is the case of the Philippines’ Medium-Term Philippine Development Plan 2004–2010. See Felipe and Lanzona (2005).
5 One possibility is, for example, to devise a composite index of both unemployment and underemployment. Certainly, this calls for an improvement in the unemployment and underemployment statistics. As noted in an earlier footnote, in most DMCs, statistics cover only one of the four types of underemployment.
hand side of Figure 1.1 shows that policy makers must give maximum priority to the achievement of full, productive, and decent employment. The block in the middle highlights three types of policies required to move from today’s labor market outcomes to these objectives—labor market, growth-promoting, and human capital policies.
This chapter conveys a series of very important key messages with policy implications. Examination of labor market outcomes shows that while some parts of Asia—in particular, the newly industrialized economies of Hong Kong, China; Republic of Korea (hereafter Korea); Singapore; and Taipei,China—have done exceedingly well in terms of employing their labor forces productively and in generating many “good jobs” (or jobs that demand high skills and command high wages) in the industry and services sectors, other parts of Asia have generally failed to do this. In these other parts, labor markets continue to operate with considerable unemployment and underemployment. In South Asia in particular, the movement of workers out of low-productivity employment in the agriculture sector has been protracted. Moreover, many of the new jobs in South Asia being created outside agriculture are in the informal sector and are not necessarily signifi cantly better than those in agriculture—a situation that also characterizes many other subregions in Asia.
In addition, the empirical evidence on the relationship between employment and productivity growth indicates that, overall, countries across the region are not doing very well when it comes to employment growth. While many countries have achieved very high output and productivity growth rates, corresponding employment growth rates are far lower. This theme chapter argues that increasing returns to scale and technological progress are responsible for this outcome. At the theoretical level, it also argues that under a wage-led regime—a regime under which an increase in the share of labor leads to an increase in aggregate demand—wage increases need not lead to decreases in employment, as standard neoclassical models suggest. The problem, however, is that wage-led economies are not well prepared to absorb technological progress, and productivity increases lead to lower employment. Hence, the challenge for policy makers in DMCs is how to translate increases in productivity into higher real wages and aggregate demand.
Proponents of globalization and market-oriented reforms have argued that the solution to these problems is labor market reform, essentially geared toward fostering greater labor market fl exibility. This theme chapter, however, argues that such labor market reforms are by no means a panacea for labor markets in the region. A
ThemeApRev.indd 3ThemeApRev.indd 3 08/08/2005 11:32:18 AM08/08/2005 11:32:18 AM

4 Key Indicators of Developing Asian and Pacific Countries
detailed examination of labor market policies in Asia, evidence from cross-country comparisons of labor market regulations, and stocktaking exercises for four countries—India, Indonesia, Philippines, and Viet Nam—lead to the conclusion that, in general, labor market regulations governing hiring and fi ring and minimum wage laws are not the binding constraint on employment generation. This chapter argues, however, that there may be some aspects of labor market regulation in some countries that do indeed constrain employment growth and that must therefore be addressed. For example, in some cases regulations that make it diffi cult to reallocate workers may need to be modifi ed. Where this is deemed necessary, labor market reforms will have to be complemented with reforms in other areas. This conclusion undermines the case for across-the-board labor market reforms and advocates in-depth case studies to identify the specifi c policies that, in each country, constrain employment creation.
At the same time, labor regulations covering basic rights of workers are conspicuous by their absence—due either to deliberate policy or to weak enforcement of regulation—for the large majority of workers in the informal sector. These workers are also poorly protected
from the many risks they face due to the weaknesses of the systems of social protection. Labor market reforms will have to provide basic rights and effective systems of social protection to achieve decent employment.
If labor market reforms represent only one piece—and not the key one—of the problem of creation of productive jobs in DMCs (and in particular for generating rapid growth of “good” jobs), where should policy makers focus their efforts to meet the objectives of full and productive employment? This theme chapter proposes a broad range of growth-oriented policies for Asia’s DMCs to meet these objectives. These fall into two groups: growth-promoting policies and human capital policies. Under the fi rst, the theme chapter discusses the following: (i) policies to improve incomes in the rural areas, including those generated by nonfarm enterprises, and in the urban informal sector; (ii) policies to promote an export push; and (iii) industrial strategies and policies to achieve coordination between public and private sectors, diversifi cation, and restructuring.
The rest of the theme chapter explores these arguments in greater detail, in six sections.
Full, Productive, and DecentEmployment
Growth Promoting
Supplyof Labor
Demandfor Labor
Labor Market Reforms
Well-FunctioningLabor Market:
• Resource Allocation • Income Allocation • Risk Allocation
Improvementin Quality ofLabor Supply
Industrial Policies:
Private-PublicCoordination,Diversification,
and Restructuring
ImprovingIncomes:• Rural Economy• Urban Informal Sector
Export Push
Domestic Context:
Labor Market Policiesand Social Protection
International Context:
• Globalization• Technological Progress• Competitiveness
Labor Market Outcomes:
Unemployment,Underemployment
Poverty, Informalization
Labor Market Human Capital
Figure 1.1: Blueprint for Full, Productive, and Decent Employment
Labor Market Outcomes Today Policies Objectives
ThemeApRev.indd 4ThemeApRev.indd 4 08/08/2005 11:32:18 AM08/08/2005 11:32:18 AM

5
2. Labor Market Outcomes in Asia: An Overview
This section provides an overview of labor market outcomes in the region. It is worth noting at the outset that comparing labor market outcomes across Asian countries is not as straightforward as it may seem. While virtually all DMCs carry out labor force surveys—the single best source for most labor market data—the frequency, coverage, scope, and defi nitions of labor market variables differ across surveys. Nevertheless, the available data do allow an understanding of the broad contours of conditions of labor markets across the region.
2.1 Labor Force
At approximately 1.7 billion, Asia’s labor force is enormous, accounting for 57.3% of the world’s labor force. A large share live in Asia’s two giants—the People’s Republic of China (PRC) and India. As can be inferred from the fi rst column of Table 2.1, these two countries together account for 71% of Asia’s labor force. (Box 2.1 gives defi nitions of commonly used labor market-related terms.)6
Asia’s labor force is growing. Assuming unchanged rates of labor force participation within individual countries, projections of the population of those of working age (15–64 years) indicate that Asia’s labor force will increase by 14%, or 245 million by 2015 relative to 2005. (See Box 2.2a on labor force participation of adults and Box 2.2b on child labor.) While the PRC will account for a large percentage of this increase due to its sheer size, the increase in its labor force as a share of its current labor force will actually be quite low. In fact, as Figure 2.1 shows, the PRC’s labor force 10 years from today is forecast to be around 7% greater than it is today. By contrast, the labor force will be far higher in countries such as Pakistan (around 30%), Bangladesh (25%), and the Philippines (24%).
6 Computing comparable estimates of the size of labor force across countries for a common reference year—such as 2005, for example—is a difficult task. In the first place, not all countries carry out labor force surveys or reasonably informative population censuses every year. More significantly, there are differences across countries in the scope and coverage of the survey; the reference population (for example, 10 years and older in Pakistan versus those 15 years and older in Indonesia); the reference period over which labor force status is determined; and definition used for identifying labor force status and respondents. The labor force estimates provided for 2005 here are computed by applying projections of recent labor force participation rates, primarily from World Bank (2005a) (but augmented from ILO (2003a) and country sources for particular countries) to projections of the working-age populations (15–64) for 2005 from United Nations (2005). As a result, the labor force estimates presented here may differ from those based on other sources, including country sources.
Table 2.1: Labor Force Estimates/Projections, 2005–2030 (’000)
Estimates/Projections
DMC 2005 2015 2030
East Asia China, People’s Rep. of 785,945 842,388 812,930 Hong Kong, China 3,662 3,996 3,820 Korea, Rep. of 24,072 25,053 21,994 Mongolia 1,425 1,702 1,975 Taipei,China 10,127 10,419 9,119
Southeast Asia Cambodia 7,042 8,830 11,642 Indonesia 106,310 121,642 136,358 Lao PDR 2,759 3,630 5,080 Malaysia 10,682 13,187 15,685 Myanmar 26,105 30,297 33,174 Philippines 34,126 42,451 52,267 Singapore 2,125 2,418 2,134 Thailand 37,119 40,141 40,779 Viet Nam 44,027 53,026 60,044
South Asia Afghanistan 10,464 14,917 24,021 Bangladesh 68,026 85,322 108,290 Bhutan 932 1,225 1,692 India 460,174 550,809 654,272 Maldives 97 136 190 Nepal 11,211 14,642 19,582 Pakistan 57,795 75,444 101,620 Sri Lanka 9,354 10,133 10,355
Central Asia Azerbaijan 3,913 4,536 4,550 Kazakhstan 7,534 7,820 7,325 Kyrgyz Republic 2,396 2,860 3,218 Tajikistan 2,625 3,408 4,334 Turkmenistan 2,265 2,780 3,223 Uzbekistan 12,071 15,084 17,962
Pacific DMCs Fiji Islands 332 368 395 Papua New Guinea 2,641 3,476 4,562 Solomon Islands 237 318 448 Tonga 36 40 39
Total 1,747,630 1,992,499 2,173,076
Notes: To derive the labor force estimates, the United Nations’ projections for working-age population (15–64) have been multiplied by the labor force participation rates from World Bank (2005a), except for (i) Afghanistan, Bhutan, Maldives, Fiji Islands, Solomon Islands, and Tonga, in which the source for labor force participation rates is ILO (2003a); and (ii) Taipei,China, where estimates have been derived using own-country labor force and working-age population data for 2005, 2016, and 2031.
Sources of basic data: ILO (2003a); DGBAS (2004); United Nations (2005); World Bank (2005a).
ThemeApRev.indd 5ThemeApRev.indd 5 08/08/2005 11:32:19 AM08/08/2005 11:32:19 AM

6 Key Indicators of Developing Asian and Pacific Countries
Labor Market Indicators
Labor force—persons classified either as employed or unemployed during a specified period of reference, usually a day or a week.
Labor force participation rate—the number of persons in the labor force as a percentage of the working-age population. The working-age population is the population above a certain reference age—15 years old and over, 15–64, etc.
Employed persons—all persons above a specific age who, during a specified period, either 1 week or 1 day, were under (i) paid employment, i.e., they performed some work for wage or salary, in cash or in kind, or they have a job but were temporarily not at work; (ii) self-employment, i.e., they performed some work for profit or family gain, in cash or in kind, or if they have an enterprise and were temporarily not at work. “Some work” may be interpreted as work for at least 1 hour. The self-employed include employers, own-account workers, and contributing family workers.
Employment rate—ratio of employed to total labor force.
Unemployed persons—all persons in the labor force above a specified age who during the reference period were: (i) without work, i.e., without paid employment or self-employment; (ii) currently available for work; and (iii) “seeking work,” i.e., had taken specific steps in a specified recent period to seek paid employment or self-employment.
Unemployment rate—ratio of unemployed to total labor force.
Underemployed persons (time-based)—persons in employment whose hours of work were below a certain cut-off point and reported involuntary reasons for working fewer than full-time hours, or who wanted to work additional hours, or who sought to work additional hours.
Underemployment rate (time-based)—ratio of underemployed to either total labor force or total employment.
Employment Classification
Wage and salaried workers—those engaged in paid employment jobs with explicit or implicit employment contracts that give them a basic remuneration that is not directly dependent upon the revenue of the unit for which they work. Persons in “paid employment jobs” are typically remunerated by wages and salaries, but may be paid by commission from sales, by piece-rates, bonuses or in-kind payments such as food, housing, or training.
Self-employed—those engaged in jobs where the remuneration is directly dependent upon the profits (or the potential for profits) derived from the goods and services produced (where own consumption is considered to be part of profits).
Employers—those workers who, working on their own account or with one or a few partners, hold the type of job defined as a “self-employment job” and, in this capacity, on a continuous basis (including the reference period) have engaged one or more persons to work for them in their business as wage or salaried workers.
Own-account workers—those workers who, working on their own account or with one or more partners, hold the type of job defined as a “self-employment job,” and have not engaged on a continuous basis any “employees” to work for them during the reference period.
Contributing family workers—those workers who hold a “self-employment” job in a market-oriented establishment operated by a related person living in the same household, who cannot be regarded as a partner, because their degree of commitment to the operation of the establishment is not at a level comparable to that of the head of the establishment.
Box 2.1: Definitions
Sources: ILO (2003a, 2003b).
ThemeApRev.indd 6ThemeApRev.indd 6 08/08/2005 11:32:19 AM08/08/2005 11:32:19 AM

7
0 5 10 15 20 25 30 35 40 45
Solomon IslandsPapua New Guinea
TongaFiji Islands
TajikistanUzbekistan
TurkmenistanKyrgyz Republic
AzerbaijanKazakhstan
AfghanistanMaldives
BhutanNepal
PakistanBangladesh
IndiaSri Lanka
Lao PDRCambodia
PhilippinesMalaysiaViet NamMyanmarIndonesiaSingapore
Thailand
MongoliaHong Kong, China
China, People's Rep. ofKorea, Rep. of
Taipei,China
%
East Asia
Southeast Asia
South Asia
Central Asia
Pacific DMCs
Figure 2.1: Percentage Change in Labor Force Projections,2005–2015
Notes: 1. See note for Table 2.1. 2. The figure for Taipei,China refers to percentage change in working-age population between 2005 and 2016.
Sources of basic data: ILO (2003a); DGBAS (2004); United Nations (2005); World Bank (2005a).
ThemeApRev.indd 7ThemeApRev.indd 7 08/08/2005 11:32:20 AM08/08/2005 11:32:20 AM

8 Key Indicators of Developing Asian and Pacific Countries
Box 5 Technical Details on Poverty Measures
Not all of those in the working-age groups participate in the labor force. Women in South Asia, in particular, are less likely to participate in the labor force than their counterparts elsewhere in the region. In Pakistan, for example, only 39.3% of working-age women are included in the labor force. This contrasts with female labor force participation rates of 75–85% in countries such as Cambodia, PRC, Lao People’s Democratic Republic, Thailand, and Viet Nam, and 60–70% in the Central Asian republics.
One reason for the lower labor force participation rates of women in South Asia is cultural. Another reason, which applies
more broadly in low-income countries, has to do with the fact that women take principal responsibility for housework and that this housework consists of the production of goods and services that would be purchased in the market in higher-income countries. In particular, housework in low-income countries includes the collection of free goods such as drinking water and firewood, as well as activities such as knitting, tailoring, and weaving for the use of the household. Indeed, some estimates of labor force participation rates based on alternative definitions of economic activity reveal female participation rates in India marginally higher than those of men (Ghose 2004).
Box 2.2a: Labor Force Participation
Male FemaleDMC (%) (%)
East Asia China, People’s Rep. of 88.8 79.2 Hong Kong, China 85.6 57.7 Korea, Rep. of 79.9 59.7 Mongolia 86.2 77.6 Taipei,China 76.2 51.2 a
Southeast Asia Cambodia 84.3 83.9 Indonesia 84.7 59.5 Lao PDR 90.0 77.9 Malaysia 81.4 51.9 Myanmar 89.3 68.5 Philippines 82.6 52.0 Singapore 81.7 54.5 Thailand 89.7 77.7 Viet Nam 83.5 77.3
South Asia Afghanistan 87.7 48.9 b Bangladesh 88.6 68.4 Bhutan 91.5 59.5 b India 86.6 45.2 Maldives 75.7 28.6 b Nepal 86.5 58.4 Pakistan 85.6 39.3 Sri Lanka 82.6 47.8
Central Asia Azerbaijan 77.9 61.4 Kazakhstan 80.0 69.1 Kyrgyz Republic 77.9 68.0 Tajikistan 77.3 64.1 Turkmenistan 80.4 67.3 Uzbekistan 78.1 68.2
Pacific DMCs Cook Islands 66.3 44.7 c Fiji Islands 80.5 40.3 c Papua New Guinea 86.9 69.2 Solomon Islands 90.3 84.4 b Tonga 77.5 43.5 c
a Refers to 2001. b Refers to 1995.c Refers to 1996.
Box Table 2.2a: Labor Force Participation Rates (aged 15–64), Male and Female, 2003
Sources: World Bank (2005a), except for Afghanistan; Bhutan; Maldives; Cook Islands; Fiji Islands; Taipei,China; Solomon Islands; and Tonga, for which the source is ILO (2003a).
ThemeApRev.indd 8ThemeApRev.indd 8 08/08/2005 11:32:22 AM08/08/2005 11:32:22 AM

9
According to recent estimates, about 211 million children around the world aged 5–14 were engaged in economic activity in 2000 (ILO 2002b). Data also indicate that 127 million, or 19% of all children in Asia, were involved in paid or unpaid work. Moreover, the Asian region accounted for 60% of all working children in the world. Concerns about the welfare of children have led to calls for the elimination of child labor.
These concerns are rooted in large part in the view that equates child labor with child abuse, or that most child workers are employed by establishments in hazardous work conditions. However, a recent study by Edmonds and Pavnik (2005) shows that, contrary to this popular view, most child workers are actually working for their parents rather than engaged in some kind of paid work. They find that 65% of children aged 5–14 are engaged in domestic work (household chores in one’s own household) and only 25% are involved in paid, unpaid, family business, or farm work (i.e., market work). Most children involved in market work are also employed by their parents. Only a small proportion of children, at 2.4%, are actually hired to do paid work. Most economically active children are also in agriculture, which accounted for 73% of working children in Cambodia in 2001, 67% in Pakistan in 1996, and 92% in Viet Nam in 1998 (Edmonds and Pavnik 2005).
To better understand why child labor exists, it would be useful to contrast hazardous work with the more “benign” type of child labor, which can allow children to accumulate skills and experience useful for their adult lives. Hazardous work, “by its nature or type has, or leads to, adverse effects on the child’s safety, health (physical or mental), and moral development” (ILO 2002b, p. 33). A key issue in child labor should be the elimination of all hazardous forms of child labor. But a direct policy intervention, such as the outright banning of child labor, might have more adverse implications for children. In particular, this might push children into worse forms of child labor or lead them into acute hunger or starvation (Edmonds and Pavnik 2005, Basu 1999). Instead, policy measures to address child labor should focus on improving access to schooling through better infrastructure and lower costs, and on expanding the opportunities for parents to access the employment that provides an adequate income. Beegle et al. (2004) also find that not only is child labor more prevalent among households that are further away from schools, but also among those that have higher borrowing costs, which implies that reducing child labor also requires facilitating access to credit and encouraging parents to be more forward-looking to appreciate the benefits of schooling.
Box 2.2b: Child Labor
Box Table 2.2b: Regional Estimates of Economically Active Children (aged 5–14), 2000
Region No. of Children (’000) No. at Work (’000) Work Ratio Share of Total Child Labor (%)
Asia and the Pacific 665,100 127,300 19 60.3
Developed Economies 119,000 2,500 2 1.2
Latin America and the Caribbean 108,100 17,400 16 8.2
Middle East and North Africa 87,900 13,400 15 6.4
Sub-Saharan Africa 166,900 48,000 29 22.7
Transition Economies 62,400 2,400 4 1.1
Total 1,209,400 211,000 18 100.0
Source: ILO (2002b).
These wide differentials in the growth rates of the labor force across DMCs simply refl ect the varying pace of the demographic transition across Asia. Since the transition process has moved furthest in East Asia and some other countries such as Thailand in Southeast Asia, Sri Lanka in South Asia, and Kazakhstan in Central Asia, the share of these countries’ population made up by the young (14 years and below) tends to be around 20% or a little higher.7,8 In contrast, in many other DMCs the young constitute close to a third or more of the total population. Needless to say, in 10–15 years there will be many more potential workers in these countries.
The DMCs that will see rapid growth in their labor force face the prospects of a “demographic dividend”—that is, an increased proportion of the working-age group 7 See Appendix 2.1 on projections of the age distribution as a
share of total population. 8 In the case of Kazakhstan, infant mortality rates remain fairly
high while total fertility rates are less than 2.1 (i.e., replacement fertility).
translates into a higher proportion of workers and a lower proportion of dependent population. This raises the prospects of increased rates of savings and investment, and higher investment in human capital of the young. Of course, the demographic dividend is not guaranteed and, among other things, depends critically on whether countries can mobilize suffi cient capital to employ productively the growing share and number of potential workers (Box 2.3).9
9 Whether or not these countries are successful in harnessing the dividend, the dynamics of demographic change predict that eventually, the demographic “dividend” becomes a burden. As the “bulge” population ages, the relative share of old people increases. Several DMCs, especially those in East Asia, are already facing the prospects of an aging population. For example, in Korea about 4.5 million people belong to the age group of 65 and above, accounting for 9% of the population. The PRC has about 100 million elderly people, equal to 8% of the total population. More broadly, the DMCs are aging faster than they are developing. In other words, the time left to establish effective and sustainable programs suited to an aging society is growing short. See ADB (2002a) for a detailed discussion on these and related points.
ThemeApRev.indd 9ThemeApRev.indd 9 08/08/2005 11:32:23 AM08/08/2005 11:32:23 AM

10 Key Indicators of Developing Asian and Pacific Countries
Population growth plays an ambivalent role in the development process—it can act as both a stimulus and an impediment to growth and development. The standard view is that high levels and rates of population growth constitute a problem for developing countries because they depress human welfare. It sees population growth as using up nonrenewable resources and causing environmental degradation; putting pressure on food supplies; leading to overcrowding and congestion in cities; adding to the employment problem; and reducing the savings ratio and diluting the quantity of capital per person employed. In Asia, for example, close to 1 billion people live in cities, which already suffer from very high levels of air pollution and congestion. On present trends, Asia will be the largest single source of “greenhouse gases” by 2015.
The pessimistic approach to population growth originated with Malthus’ view that population grows faster than the means of subsistence (although his negative views evolved over time, to the point where he acknowledged that population growth could have a positive effect on society’s welfare), with the classical belief in the law of diminishing returns, and with an underestimation of humankind’s response to the challenge of diminishing productivity due to the expansion of population through invention and innovation. Malthus argued that human beings tend to reproduce faster than their capability to feed themselves increases. Thus, although every child is potentially a worker, he or she produces less and less additional output. Technological progress would not be rapid enough to offset the tendency.
However, there are solid counterarguments that population growth has benefits. Indeed, the world as a whole has become richer while its population has expanded. Moreover, the pessimistic view of population growth is rarely backed by direct empirical evidence. The effect of population growth on savings, for example, is very complex, and simply arguing that population growth reduces the savings ratio is incorrect. The conventional argument is that population growth reduces society’s savings ratio by leading to a high dependency ratio of younger people who consume but do not contribute to production. The implication of the argument is that a reduction in population growth would lead to an increase in the savings ratio by raising the age structure of the population. Against this, it must be noted that many retired people consume but do not produce and that the proportion of retired people to total population rises as population growth slows. Thus, the aggregate savings ratio will depend on how the composition of the total dependency ratio varies and on the propensity to save (or dissave) of the two groups of dependents. If the propensity to dissave of those retired is higher than that of the younger group, the aggregate savings ratio might fall with a reduction in population growth as the retired dependency ratio increases. The implication of this brief analysis is that it is wrong to conclude that countries with high rates of population growth will, all other things being equal, have lower savings ratios than countries with lower rates of population growth. In fact, in the long run, the savings ratio tends to rise with the rate of population growth as a consequence of the increase in the ratio of active to nonactive households.
A related point is that the effect of children on a society’s total savings works primarily through the family as a unit and
depends on how each family reacts to the increase in the number of children. On the one hand, there might be a substitution of one type of expenditure for another. On the other, the family might decide to work harder to provide for the additional children. Either way, there need not be an adverse effect on saving.
It is also important to consider the relationship between population and productivity growth. This is because the increase in population, and hence in the labor force, creates work and production incentives that affect output and productivity. There is empirical evidence that supports this claim. Why should this be so? First, because an economy with a faster rate of growth of employment and output may be able to learn faster and this increases its rate of technological progress. Second, if there are economies of scale in production, faster employment and output will lead to a faster rate of growth of labor productivity. And third, there are likely to be economies of scale in the use of capital.
The conclusion is that population growth presents a paradox. On the one side, increases in population may reduce living standards due to the adverse effect of population growth on savings and capital per head. Decreasing amounts of capital per worker imply a negative relationship between population growth and per capita output growth, so that output per head is lower than it would otherwise be as the population increases. On the other, increases in population and in the labor force can raise living standards via learning effects and economies of scale. The possibility of increasing returns implies a positive relationship between population growth and per capita output growth, so that living standards increase as the population grows.
The theoretical implication is that, if the relationship between population growth and the growth rate of per capita output is negative, then population growth will prevent the rise of living standards. If, however, the relationship is positive, the effect of population growth on the growth of output and per capita output will be positive. The empirical evidence seems to indicate that population growth and the rate of capital accumulation are inversely related. This decreases the growth of labor productivity. However, growth and technological progress are positively related. This increases the growth of labor productivity. The two effects tend to offset each other, thus leaving the total effect of population growth on the growth of per capita output roughly neutral. Indeed, correlation across a cross-section of countries of population growth and the growth of per capita output tends to be insignificant.
This lack of empirical evidence is not to deny that decreasing population growth may be desirable for some of the reasons mentioned above, for example, to relieve overcrowding and halt or even turn back environmental degradation. And certainly it does not dismiss the relevance of population-management programs. Quite the opposite—given the ambiguity of the relationship between population growth and per capita output and the relevance of the other arguments for population management, the most judicious strategy is to pursue these programs on the hypothesis that population management does lead to increases in per capita output.
Box 2.3: The Costs and Benefits of Population Growth
Source: Thirlwall (2003).
ThemeApRev.indd 10ThemeApRev.indd 10 08/08/2005 11:32:23 AM08/08/2005 11:32:23 AM
11
2.2 Unemployment and Underemployment
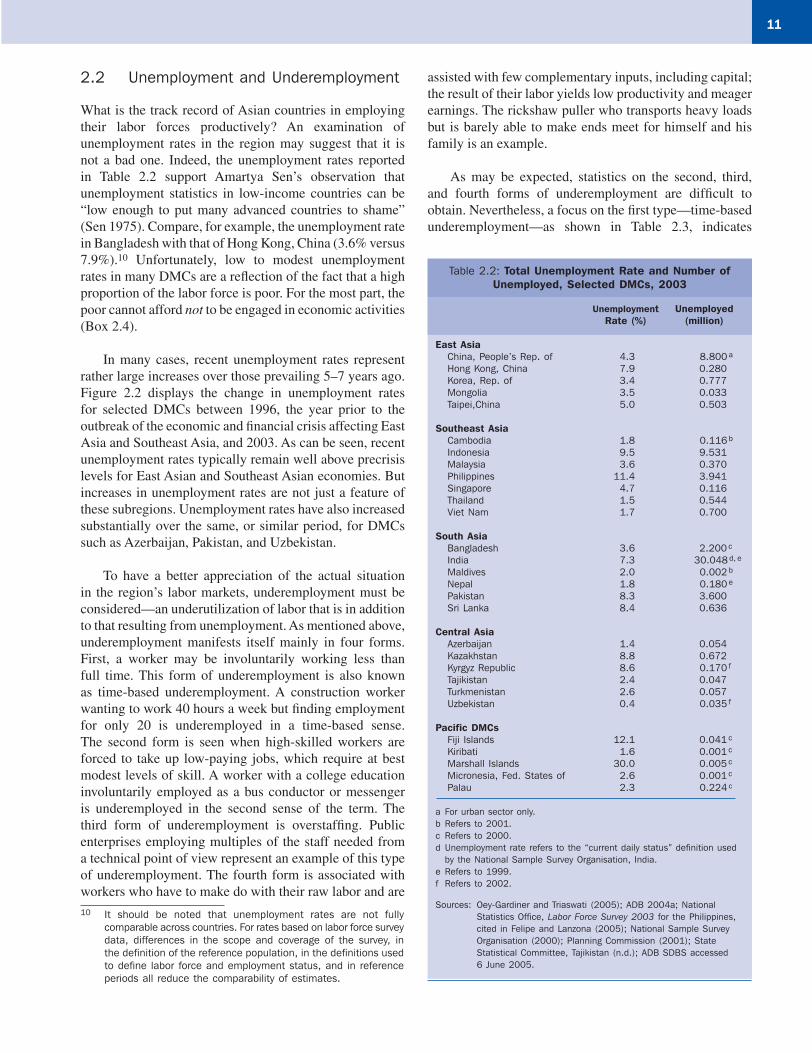
What is the track record of Asian countries in employing their labor forces productively? An examination of unemployment rates in the region may suggest that it is not a bad one. Indeed, the unemployment rates reported in Table 2.2 support Amartya Sen’s observation that unemployment statistics in low-income countries can be “low enough to put many advanced countries to shame” (Sen 1975). Compare, for example, the unemployment rate in Bangladesh with that of Hong Kong, China (3.6% versus 7.9%).10 Unfortunately, low to modest unemployment rates in many DMCs are a refl ection of the fact that a high proportion of the labor force is poor. For the most part, the poor cannot afford not to be engaged in economic activities (Box 2.4).
In many cases, recent unemployment rates represent rather large increases over those prevailing 5–7 years ago. Figure 2.2 displays the change in unemployment rates for selected DMCs between 1996, the year prior to the outbreak of the economic and fi nancial crisis affecting East Asia and Southeast Asia, and 2003. As can be seen, recent unemployment rates typically remain well above precrisis levels for East Asian and Southeast Asian economies. But increases in unemployment rates are not just a feature of these subregions. Unemployment rates have also increased substantially over the same, or similar period, for DMCs such as Azerbaijan, Pakistan, and Uzbekistan.
To have a better appreciation of the actual situation in the region’s labor markets, underemployment must be considered—an underutilization of labor that is in addition to that resulting from unemployment. As mentioned above, underemployment manifests itself mainly in four forms. First, a worker may be involuntarily working less than full time. This form of underemployment is also known as time-based underemployment. A construction worker wanting to work 40 hours a week but fi nding employment for only 20 is underemployed in a time-based sense. The second form is seen when high-skilled workers are forced to take up low-paying jobs, which require at best modest levels of skill. A worker with a college education involuntarily employed as a bus conductor or messenger is underemployed in the second sense of the term. The third form of underemployment is overstaffi ng. Public enterprises employing multiples of the staff needed from a technical point of view represent an example of this type of underemployment. The fourth form is associated with workers who have to make do with their raw labor and are 10 It should be noted that unemployment rates are not fully
comparable across countries. For rates based on labor force survey data, differences in the scope and coverage of the survey, in the definition of the reference population, in the definitions used to define labor force and employment status, and in reference periods all reduce the comparability of estimates.
Table 2.2: Total Unemployment Rate and Number of Unemployed, Selected DMCs, 2003
Unemployment Unemployed Rate (%) (million)
East Asia China, People’s Rep. of 4.3 8.800 a Hong Kong, China 7.9 0.280 Korea, Rep. of 3.4 0.777 Mongolia 3.5 0.033 Taipei,China 5.0 0.503
Southeast Asia Cambodia 1.8 0.116 b Indonesia 9.5 9.531 Malaysia 3.6 0.370 Philippines 11.4 3.941 Singapore 4.7 0.116 Thailand 1.5 0.544 Viet Nam 1.7 0.700
South Asia Bangladesh 3.6 2.200 c India 7.3 30.048 d, e Maldives 2.0 0.002 b
Nepal 1.8 0.180 e Pakistan 8.3 3.600 Sri Lanka 8.4 0.636
Central Asia Azerbaijan 1.4 0.054 Kazakhstan 8.8 0.672 Kyrgyz Republic 8.6 0.170 f Tajikistan 2.4 0.047 Turkmenistan 2.6 0.057 Uzbekistan 0.4 0.035 f
Pacific DMCs Fiji Islands 12.1 0.041 c Kiribati 1.6 0.001 c Marshall Islands 30.0 0.005 c Micronesia, Fed. States of 2.6 0.001 c Palau 2.3 0.224 c
a For urban sector only.b Refers to 2001.c Refers to 2000.d Unemployment rate refers to the “current daily status” definition used by the National Sample Survey Organisation, India.e Refers to 1999.f Refers to 2002.
Sources: Oey-Gardiner and Triaswati (2005); ADB 2004a; National Statistics Office, Labor Force Survey 2003 for the Philippines, cited in Felipe and Lanzona (2005); National Sample Survey Organisation (2000); Planning Commission (2001); State Statistical Committee, Tajikistan (n.d.); ADB SDBS accessed 6 June 2005.
assisted with few complementary inputs, including capital; the result of their labor yields low productivity and meager earnings. The rickshaw puller who transports heavy loads but is barely able to make ends meet for himself and his family is an example.
As may be expected, statistics on the second, third, and fourth forms of underemployment are diffi cult to obtain. Nevertheless, a focus on the fi rst type—time-based underemployment—as shown in Table 2.3, indicates
ThemeApRev.indd 11ThemeApRev.indd 11 08/08/2005 11:32:24 AM08/08/2005 11:32:24 AM

12 Key Indicators of Developing Asian and Pacific Countries
Poverty in developing Asia is overwhelmingly associated with low earnings. To be precise, poverty is not the result of unemployment, but rather the result of work that pays poorly. The number of poor in rural areas is typically far larger than the number of poor in urban areas. As Box Table 2.4 shows, around 75% of the total poor in India lived in rural areas in 1999. In Thailand and Viet Nam, rural poverty has accounted for around 90% of total poverty in recent years.
The preponderance of poverty in rural areas is due to two factors. First, rural areas account for a large proportion of the population in these DMCs (for example, the rural population accounts for more than two thirds of the total population in many large DMCs, including Bangladesh, India, Thailand, and Viet Nam; it accounts for between one half and two thirds of the total population in PRC, Indonesia, Pakistan, and Philippines). Second, urban poverty rates are almost always lower than rural poverty rates (as can be seen from Box Table 2.4).
In the rural sector, the poor are typically found among landless agriculture laborers. In India for example, data from the 1999/2000 household expenditure survey reveals that while households engaged primarily as agricultural laborers accounted for 32.2% of all rural households, they represented 48% of poor households. Households cultivating their own land were less likely to be poor; even though such households made up 32.7% of total rural households, they accounted for 25% of poor households.
This pattern, whereby landless agricultural workers are the poorest among all labor force participants, is repeated elsewhere.
In Viet Nam, poverty incidence was highest among hired farm workers, at 55.4% compared with 47% of self-employed farmers in 1997/98. In Bangladesh, data show that although casual wage laborers accounted for only 33% of the rural population, they constituted 46% of the total rural poor in 2000.
The urban counterparts of the agricultural laborers or small-farm cultivators are those employed as daily-wage laborers and the self-employed. Again in India, the data indicate that 14% of households reported their primary engagement as daily-wage workers (“casual labor”). Such households, however, accounted for almost 30.2% of poor households. But the largest contributor to poor households comprised households described as self-employed. While such households made up 34.5% of all urban households, they accounted for 38.7% of poor urban households.
Data from other countries’ urban sectors reveal a similar pattern. In Bangladesh, casual wage workers accounted for only 20% of the population, but 36% of the total urban poor. In Pakistan, the self-employed in 1998/99 were estimated to be about 18.2% of the total urban population, but poverty estimates reveal that this group accounted for 21.4% of all urban poor.
The significance of the finding that a large proportion of the self-employed are among the poor is that it confirms that a large part of self-employment is a coping mechanism, one explained by the paucity of better earning opportunities, which leads workers to engage in poorly remunerated (and low-productivity) jobs.
Box 2.4: Poverty and the Labor Market 1
1 This discussion defines poverty in absolute terms, that is, an individual is considered poor if his or her consumption or income falls below a threshold level fixed in real terms.
Sources: ADB (2004a); Bales et al. (2001); Huong et al. (2003); Sundaram and Tendulkar (2002); World Bank (2002a, 2002b).
Box Table 2.4: Poverty Estimates Based on National and International PovertyLines, Urban and Rural, Selected DMCS, Various Years
Region/Country National Poverty Rural Poverty International Poverty Rates (%) (%) a Measures
Year National Urban Rural Year $1-a-Day $2-a-Day
East Asia China, People’s Rep. of b 2003 3.1 2001 16.6 46.7 Mongolia 1998 35.6 39.4 32.6 38.8 1998 27.0 74.9
Southeast Asia Cambodia 1999 35.9 18.2 40.1 91.9 1997 34.1 77.7 Indonesia 2002 18.2 14.5 21.1 65.9 2002 7.5 52.4 Lao PDR 1997 38.6 26.9 41.0 87.4 1997 39.0 81.7 Malaysia 1999 7.5 3.4 12.4 72.5 1997 0.2 9.3 Myanmar 1997 22.9 23.9 22.4 72.1 ... ... ... Philippines 2000 34.0 20.4 47.4 71.5 2000 15.5 47.5 Thailand 2002 9.8 4.0 12.6 88.5 2000 1.9 32.5 Viet Nam 2002 28.9 6.6 35.6 94.1 2002 13.1 58.5
South Asia Bangladesh 2000 49.8 36.6 53.0 81.3 2000 36.0 82.8 India 1999 26.1 23.6 27.1 75.2 1999 36.0 81.3 Maldives 1998 43.0 20.0 50.0 87.2 1998 0.1 2.9 Nepal 1996 42.0 23.0 44.0 94.2 1995 39.1 80.9 Pakistan 1999 32.6 25.9 34.8 73.4 1999 25.3 77.2 Sri Lanka 1995 25.2 14.7 27.0 86.9 1995 6.6 45.4
... = data not available.a Based on national poverty rates.b The PRC has not adopted an official urban poverty line for the country. Its national poverty rates therefore pertain only to the rural sector.
Sources: ADB (2004a) for national and international poverty rates; staff estimates for share of rural poverty.
ThemeApRev.indd 12ThemeApRev.indd 12 08/08/2005 11:32:25 AM08/08/2005 11:32:25 AM

13
-100 -50 0 50 100 150 200
Uzbekistan dTajikistan
Kyrgyz Republic dKazakhstan
Azerbaijan
Sri LankaPakistan
India c
Viet NamThailand
SingaporePhilippines
MalaysiaIndonesia b
Taipei,China
China, People’s Rep. ofKorea, Rep. of
Hong Kong, China
Cen
tral
Asi
aSo
uth
Asi
aSo
uthe
ast
Asi
aEa
stA
sia
%
7.9
3.4
4.3
5.0
1.48.8
8.6
2.4
0.4
5.6
3.611.4
4.7
1.5
1.7
7.38.3
8.4
Figure 2.2: Change in Unemployment Rates, 1996–2003 a
substantial levels of underemployment in terms of workers who are working less than they would like to. In Indonesia, the underemployed, defi ned as those involuntarily working less than 35 hours a week, accounted for about 34% of the total number of those employed in 2003. While underemployment in the Philippines has been on a downtrend since 2000, it remains substantial, at 17% of total employment. To give a better sense of the magnitude of the problem, Figure 2.3 shows for the Philippines an “index of labor underutilization,” computed as the sum of the number of time-based underemployed and unemployed people, divided by the labor force. Although the value of the index is below what it was in the 1980s, it is still at an unacceptably high rate of about a quarter of the labor force. As indicated in the Introduction to this theme chapter, this index is a better indicator of the extent of the poor labor market outcomes, in the context of the defi nition of full employment provided there, than only the unemployment rate.
a The numbers beside the bars refer to the latest unemployment rates. b Change in 1991–1996 average and 2003; for purposes of comparison, unemployment
rates here for Indonesia refer to the old definition. c Change between 1993 and 1999.d Change between 1996 and 2002.
Sources: Planning Commission (2001) for India; Felipe and Lanzona (2005) for the Philippines; Oey-Gardiner and Triaswati (2005) for Indonesia; State Statistical Committee (n.d.) for Tajikistan; ADB SDBS for other countries.
Table 2.3: Time-Based Underemployment Rates for Selected DMCs
As Share of Labor Force As Share of Employed (%) (%)
Bangladesh a 35.4 ...Cambodia b ... 29.6Indonesia c ... 34.0Nepal d 27.4 ...Pakistan e 21.9 ...Philippines f ... 17.0Thailand g 3.8 4.0Viet Nam h ... 11.0, 56.0
... = data not available.
Sources: a Salmon (2002), cited in World Bank (2004a); b estimated from the number of workers who reported being available for additional work in the Cambodia labor force survey 2001 (National Institute of Statistics, 2001); c for 2003; Oey-Gardiner and Triaswati (2005); d Central Bureau of Statistics, Nepal (1999), cited in World Bank (2004a); e World Bank (2004a), using labor force survey 2001/02; f National Statistics Office, Labor Force Survey 2003; g for 2000; ILO (2003a); h for 2002, for urban and rural sectors, respectively; Nguyen et al. (2005).
ThemeApRev.indd 13ThemeApRev.indd 13 08/08/2005 11:32:25 AM08/08/2005 11:32:25 AM

14 Key Indicators of Developing Asian and Pacific Countries
0
5
10
15
20
25
30
35
40
45
1983 1992 2001
Labor Underutilization
Underemployment
Unemployment
Figure 2.3: Philippines—Unemployment, Underemployment (time-based), and Labor Underutilization Rates
1980 1995 1998
%
19891986
Extending this approach to the case of other DMCs as well, the information from Tables 2.1–2.3 can be used to suggest an estimate of the underutilization of labor in the region in terms of unemployment and time-based underemployment. More specifi cally, applying the unemployment and underemployment rates in Tables 2.2 and 2.3, respectively, to labor force projections for 2005 provided in Table 2.1 suggests that out of a total labor force of 1.7 billion in the DMCs, around 500 million are underutilized in terms of being either unemployed or underemployed in the time-based sense.11 It needs to be stressed that as large as this number may seem, it still constitutes an underestimate of the total underutilization of labor in DMCs. This is because this number does not capture forms of underemployment other than time-based underemployment.
More generally, it is underemployment of labor in all senses of the term, especially the fourth form (raw labor with few complementary inputs), that explains the coexistence of low unemployment with high poverty in many parts of Asia. But what explains underemployment? Many observers have focused on Asia’s rural economy, and particularly on its agriculture sector. Agriculture has often been described as a sector with “surplus labor”—an extreme form of the fourth form of underemployment. In essence, a large number of farmers work with a limited amount of land and capital inputs. However, the resulting
11 Since time-based underemployment rates are available only for a handful of DMCs, these are used to impute underemployment rates for other DMCs. For example, it is assumed that the underemployment rate in India is equal to the average of the underemployment rates available for the three South Asian countries listed in Table 2.3. Similarly, it is assumed that underemployment rates for the PRC are the average of the underemployment rates for the five Southeast Asian countries listed in Table 2.3.
productivity of labor is so low that it would be possible to remove some of the labor without adversely affecting total output in any signifi cant way. (Appendix 2.2 offers a discussion of unemployment and underemployment and their links to rural-urban migration in developing countries in the context of the Lewis and Harris-Todaro models.)
While this view is not without its critics, it is a fact that a large proportion of Asia’s farmers (including agricultural wage workers) have low productivity and low earnings. These can be seen in Tables 2.4 and 2.5, respectively.
Table 2.4: Value Added per Worker by Sector(constant 2000 US$), Selected DMCs
Value Added per Worker
Country/Region Agriculture Industry Services Year
East Asia China, People’s Rep. of 530 4,351 4,133 2000 Hong Kong, China 17,096 34,115 52,534 2001 Korea, Rep. of 10,208 32,663 23,912 2001 Mongolia 696 1,704 4,034 2000
Southeast Asia Indonesia 662 4,612 1,692 2001 Malaysia 4,647 15,271 7,929 2000 Philippines 1,103 5,279 2,907 2001 Singapore 16,384 54,957 35,748 2001 Thailand 688 8,211 5,662 2000 Viet Nam 264 1,925 1,543 1997
South Asia Bangladesh 361 2,167 1,843 2000 India 432 1,602 2,039 1999 Nepal 270 1,061 1,292 1998 Pakistan 1,001 2,322 2,826 2000 Sri Lanka 1,106 2,645 3,493 1998
Central Asia Azerbaijan 635 5,993 1,098 2001 Kazakhstan 1,142 5,376 2,198 1999 Kyrgyz Republic 494 1,676 644 1999 Tajikistan 410 1,095 1,031 1997 Uzbekistan 1,171 1,585 1,556 1999
Sources: ILO (2003a) for employment levels except for India, which is based on Planning Commission (2001), cited in Anant et al. (2005), and for Nepal, which is based on labor force surveys; World Bank (2005b) for value added.
Table 2.5: Wages and Earnings in Selected DMCs
Country Ratio of Agricultural to Nonagricultural Wages or Earnings
Regular Workers Casual Workers All Workers
India a 0.46 0.64 Indonesia b 0.57 Philippines c 0.60Thailand d 0.34Viet Nam e 0.90
a Agricultural to nonagricultural earnings in rural sector. b Agricultural to nonagricultural earnings. c Agricultural to manufacturing earnings. d Agricultural to nonagricultural wage. e Agricultural to industry wage.
Sources of basic data: Bales (2000), cited in Nguyen et al. (2005); Dyson et al. (2004) cited in Anant et al. (2005); Felipe and Lanzona (2005); Oey-Gardiner and Triaswati (2005); National Statistical Office, Thailand (n.d.).
Source: National Statistics Office, Philippines, Labor Force Survey, various years.
ThemeApRev.indd 14ThemeApRev.indd 14 08/08/2005 11:32:27 AM08/08/2005 11:32:27 AM

15
Figure 2.1: Percentage Change in Labor Force Projections,2005–2015
0
10
20
30
40
50
60
70
80
90
100
Nepal Cambodia Bangladesh India Pakistan China,People’sRep. of
Indonesia Philippines Thailand Malaysia Korea,Rep. of
Taipei,China
Singapore Hong Kong,China
Services
Industry
Agriculture
$238 $282 $360 $450 $531 $728 $856 $991 $2,021 $3,881 $10,890 $22,767 $24,810$13,985
Figure 2.4: Employment Shares and GDP per Capita (constant US$), 2000
%
Refl ecting the low productivity and earnings in agriculture, the association between the share of employment in agriculture and low per capita incomes at the national level is strong. As Figure 2.4 indicates, the share of employment in agriculture tends to be largest in Asian countries with the lowest income. As per capita income increases from left to right across the economies in the fi gure, a general decline in the share of employment of agriculture can be seen. The sector continues to account for the majority of employment in low-income DMCs such as Bangladesh, India, and Nepal in South Asia, and Cambodia in Southeast Asia. The share of employment in agriculture is lowest in Korea and Taipei,China (if Hong Kong, China; and Singapore are excluded).
The inverse relationship between per capita incomes and the share of employment in agriculture also holds within countries. In DMCs, there has been a reduction in the share of employment in agriculture over the last three to fi ve decades as economies have grown.
Given that the agriculture sector is where productivity levels and earnings are the lowest on average, the transition away from agriculture is welcome. However, two features of this transition are troubling. First, as Figure 2.5 indicates, it has moved at very different speeds across DMCs. Thus, while it was fastest in Korea and Taipei,China during the 1960s–1990s, it has been very slow in some other DMCs, especially in South Asia. Second, all too often the jobs being created in the industry and services sectors are not signifi cantly better than the agricultural jobs left behind.
To examine this issue more closely, the structure of labor markets in urban areas is now discussed.12
2.3 Urban Labor Markets and Dualism
Employment in urban areas essentially entails work in the industry and services sectors. While on average, conditions of work in these two sectors are better than work in agriculture, there is a great deal of heterogeneity in labor market conditions within both sectors, especially services. Thus, for example, while the services sector includes well-paid accountants and lawyers, it also includes low-paid domestic servants. Indeed, Arthur Lewis’ description of many nonagriculture jobs that he observed in developing economies in the 1950s illustrates the point well:
Another large sector to which [the phenomenon of surplus labor] applies is the whole range of casual jobs—the workers on the docks, the young men who rush forward asking to carry your bags as you appear, the jobbing gardener, and the like. These occupations usually have a multiple of the number they need, each of them earning very small sums from occasional employment…
(Lewis 1954, p. 141)
12 The focus on the urban sector should not be taken to imply that industry and services sector activities take place only in urban areas. In fact, as increasingly acknowledged, industry and services sector activities are an important component of economic activity in rural areas.
Note: Data for India and Nepal refer to 1999 and 1998, respectively.
Sources: National Bureau of Statistics, PRC (2004); National Statistics Office, Korea (2003); Central Bureau of Statistics, Nepal (1999); DGBAS (2004); Oey-Gardiner and Triaswati (2005); World Bank (2005b, downloaded 12 May).
ThemeApRev.indd 15ThemeApRev.indd 15 08/08/2005 11:32:28 AM08/08/2005 11:32:28 AM

16 Key Indicators of Developing Asian and Pacific Countries
Figure 2.5: Employment Shares by Sector, Selected DMCs
Indonesia
0
10
20
30
40
50
60
70
80
90
1971 1978 1982 1986 1988 1990 1992 1994 1996 1998 2000
Agriculture Industry Services
Malaysia
0
10
20
30
40
50
60
70
1980 1982 1984 1986 1988 1990 1993 1996 1998 2000
Agriculture Industry Services
Agriculture Industry Services
Philippines
0
10
20
30
40
50
60
70
Agriculture Industry Services
Taipei,China
10
20
30
40
50
60
70
80
1965 1970 1975 1980 1985 1990 1995 2000
Agriculture Industry Services
Republic of Korea
0 0
10
20
30
40
50
60
70
80
1963 1967 19791971 1975 19911983 1987 1995 1999
Agriculture Manufacturing S.O.C. and other services
People's Republic of China
0
10
20
30
40
50
60
70
80
90
1960 1965 1970 1975 1980 1985 1990 1995 2000
1960 1970 1980 1982 1964 1986 1998 1990 1992 1994 1996 1998 2000
ThemeApRev.indd 16ThemeApRev.indd 16 08/08/2005 11:32:30 AM08/08/2005 11:32:30 AM

17
Agriculture Industry Services
Agriculture Industry Services
Agriculture Industry Services
Agriculture Industry Services
Thailand
0
10
20
30
40
50
60
70
80
90
Bangladesh
0
10
20
30
40
50
60
70
80
90
1961 1974 1984 1986 1989 1991 1996 2000
Pakistan
0
10
20
30
40
50
60
70
80
1967 1969 1971 1975 1983 1986 1988 1992 1994 1997
India
0
10
20
30
40
50
60
70
80
1951 1961 1971 1981 1983 1988 1994 2000
Figure 2.5: (contInued)
1960 1980 1982 1984 1986 1988 1990 1992 1994 1996 1998 2000 2002
As suggested by Lewis’ observation, an important feature of the urban labor markets of most Asian developing countries is their dualism—the coexistence of the “modern” or “formal” with the “traditional” or “informal.”13
Adopting the informal-formal terminology, the informal sector is characterized by much self-employment. Wage labor, when used in this sector, typically exists in the context of small fi rms employing 10 or fewer workers. Work arrangements are fl exible, and wage and employment contracts are ill-defi ned. The operations of informal sector enterprises are often unregulated. This may be because regulations may not encompass the operations
13 This type of dualism also exists in rural sectors. However, it appears to be at its starkest in urban areas.
of enterprises below a certain threshold size or may stem from the lack of enforcement of these regulations in small enterprises. Production in the informal sector is typically carried out with very little capital.14
The formal sector, in comparison, is dominated by large fi rms. Moreover, in the case of South Asia and the transition economies of Asia such as PRC and Viet Nam, it is also dominated by government employment. Indeed, of the increase in total wage employment over a two-decade period, the public sector accounted for only 10%
14 It may be noted that most agricultural employment in developing Asia is informal, encompassing self-employment and unpaid family work on small farms and agricultural wage workers employed without well-defined and explicit contracts.
SOC = refers to social overhead and capital (services and electricity, gas, water, and construction).
Sources: Bangladesh Bureau of Statistics (various years); National Bureau of Statistics, PRC (various years); Sundrum (1987) and Chadha and Sahu (2002), cited in Anant et al. (2005); National Statistics Office, Korea: http://kosis.nso.go.kr/cgi-bin/sws_888.cgi; Federal Bureau of Statistics, Pakistan (various years); DGBAS (various years); World Bank (2005b).
ThemeApRev.indd 17ThemeApRev.indd 17 08/08/2005 11:32:35 AM08/08/2005 11:32:35 AM

18 Key Indicators of Developing Asian and Pacific Countries
and 33%, respectively, in Taipei,China (1965–1985) and Thailand (1963–1983). In sharp contrast, the public sector accounted for 71% of the corresponding increase in India between 1960 and 1980. In Sri Lanka, the importance of the public sector was even higher: between 1971 and 1983, it accounted for 87% of the increase in total wage employment (World Bank 1993, p. 269).
The operation of enterprises in the formal sector is regulated by the government in many dimensions. One of these relates to the terms governing the use of labor. In particular, the formal sector is characterized by well-defi ned wage and employment contracts. Among other things, these contracts provide workers not only with much better wages and salaries than similar workers in the informal sector (i.e., workers of a similar age and educational characteristics and the same gender), but also with much greater job security. In addition, they offer protection to workers in terms of both formal mechanisms of insurance as well as coverage under and recourse to the labor regulations of the country. Labor regulations may also protect the right of workers to form labor unions to represent them in discussions with fi rms’ management. Finally, a large part of the enforcement machinery of the government is targeted at the formal sector.
Presenting comparable statistics across DMCs on the number of jobs in the formal versus informal sector is not easy due to the different defi nitions used to distinguish between the two sectors and to measure employment. A key difference in defi nitions is whether enterprise characteristics or employment status form the basis upon which distinctions between the two sectors are made.15 Appendix 2.3, based primarily on Amin (2002), provides defi nitions used in selected DMCs. In India, for example, informal sector workers are those who are not employed by the public sector, by recognized educational institutions, or by fi rms registered under a variety of legislative acts. In Indonesia though, the typical practice is to classify the self-employed and unpaid family workers as belonging to the informal sector. While the self-employed and unpaid family workers are part of the informal sector in India and Indonesia, a big difference could arise from the treatment of wage and salaried workers since, although Indonesian practice seems to place all wage and salaried employees in
15 While the ILO offers a common operational definition of informal sector workers as the sum of nonprofessional self-employed, domestic workers, unpaid (family) workers, and workers in enterprises employing five or fewer workers, applying the definition to the data is not easy due to the way labor force statistics are collected at the country level originally. In particular, enterprise characteristics are rarely canvassed from respondents of labor force surveys in Asia. Thus there is no direct way to determine whether a wage/salaried worker is employed in a formal sector enterprise. This may be contrasted with various Latin American countries where labor force surveys are able to probe deeper into respondents’ engagement in the formal or informal sector.
the formal sector, this is not so in India. In India, only wage and salaried workers employed in registered enterprises are categorized as employed in the formal sector. The rest are categorized as informal sector workers. It is clear therefore from these two examples that comparability of estimates of informal and formal employment between these two countries may well be weak.
Subject to this caveat on comparability, the data indicate that informal sector employment (as a share of nonagricultural or urban employment) tends to be lower the higher per capita income is, as may be seen in Figure 2.6. This would suggest that as Asia’s economies grow, the importance of the informal sector in employment declines. However, this is not necessarily happening. In India for example, the share of the informal sector in total nonagricultural employment increased from 80.5% to 83.2% between 1993/94 and 1999/2000. Over the same period, per capita GDP grew by around 4.7% per annum.16
The informal sector also appears to be expanding in fast-growing transition economies such as the PRC and Viet Nam. Though hard numbers such as those available for India are diffi cult to fi nd, in both countries the retrenchment of workers in formal enterprises—driven by the situation in state-owned enterprises—combined with some easing of rural-urban migration appears to be increasing the extent of informal sector employment (Amin 2002).
Where growth has been less robust, the extent of informalization may be even greater. The main example of this is Indonesia. Classifying the self-employed and unpaid family workers as informal sector workers, recent labor force survey data show that since 1997, the year Asia’s economic and fi nancial crisis broke, employment has become markedly more informal.17 As may be inferred from Figure 2.7, in 1998 there were 54 million informal sector workers in Indonesia, accounting for 65% of the total number of workers. By 2003, the number had grown to 64 million, or 71% of total workers (Oey-Gardiner and Triaswati 2005).
Similar to the case of Indonesia, though less dramatically, the crisis seems to have reversed a trend of a declining share of informal sector employment elsewhere. In Thailand, for example, Amin (2002) reports that while the share of informal sector in urban employment declined from 65.2% in 1976 to 58% in 1994, it had increased to 59.9% by 1999. In the Philippines, self-employed and unpaid family workers grew as a share of total employment
16 The growth of per capita GDP is based on data from World Bank (2005b).
17 Due to data availability, the reported numbers cover agriculture as well as nonagriculture sectors.
ThemeApRev.indd 18ThemeApRev.indd 18 08/08/2005 11:32:40 AM08/08/2005 11:32:40 AM
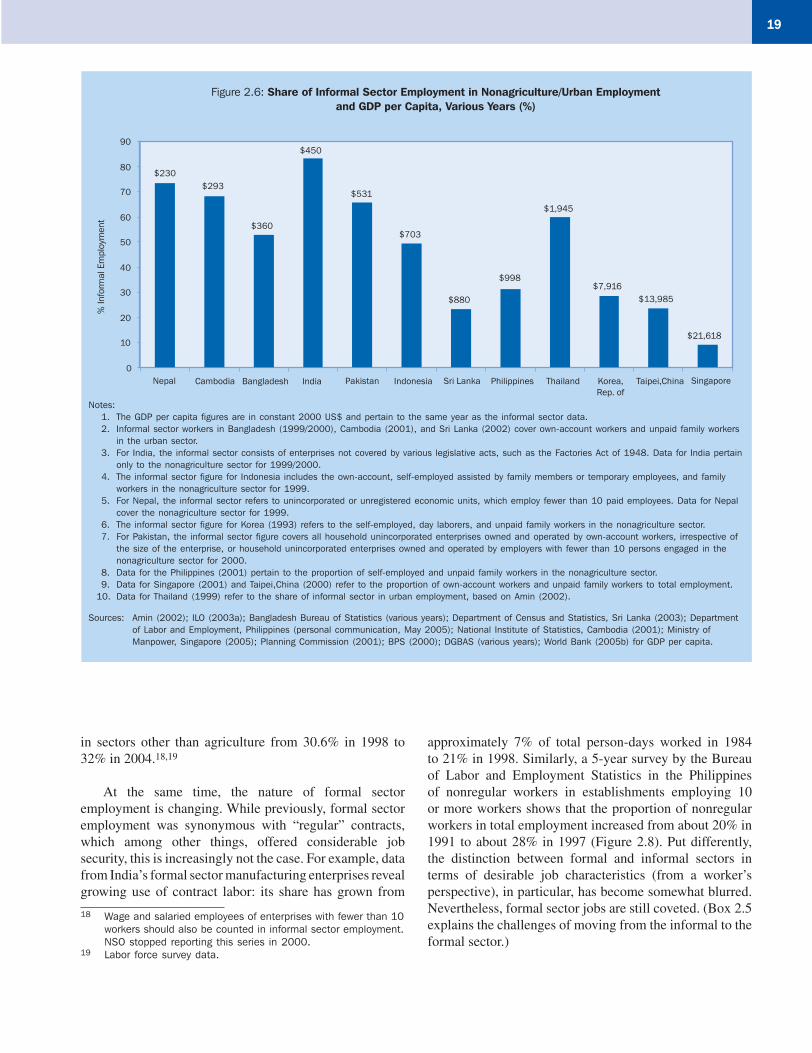
19
0
10
20
30
40
50
60
70
80
90
Nepal Cambodia Bangladesh India Pakistan Indonesia Sri Lanka Philippines Thailand Korea,Rep. of
Taipei,China Singapore
% In
form
al E
mpl
oym
ent
$360
$450
$531
$703
$880
$998
$1,945
$7,916$13,985
$21,618
$293$230
Figure 2.6: Share of Informal Sector Employment in Nonagriculture/Urban Employment and GDP per Capita, Various Years (%)
in sectors other than agriculture from 30.6% in 1998 to 32% in 2004.18,19
At the same time, the nature of formal sector employment is changing. While previously, formal sector employment was synonymous with “regular” contracts, which among other things, offered considerable job security, this is increasingly not the case. For example, data from India’s formal sector manufacturing enterprises reveal growing use of contract labor: its share has grown from
18 Wage and salaried employees of enterprises with fewer than 10 workers should also be counted in informal sector employment. NSO stopped reporting this series in 2000.
19 Labor force survey data.
approximately 7% of total person-days worked in 1984 to 21% in 1998. Similarly, a 5-year survey by the Bureau of Labor and Employment Statistics in the Philippines of nonregular workers in establishments employing 10 or more workers shows that the proportion of nonregular workers in total employment increased from about 20% in 1991 to about 28% in 1997 (Figure 2.8). Put differently, the distinction between formal and informal sectors in terms of desirable job characteristics (from a worker’s perspective), in particular, has become somewhat blurred. Nevertheless, formal sector jobs are still coveted. (Box 2.5 explains the challenges of moving from the informal to the formal sector.)
Notes: 1. The GDP per capita figures are in constant 2000 US$ and pertain to the same year as the informal sector data. 2. Informal sector workers in Bangladesh (1999/2000), Cambodia (2001), and Sri Lanka (2002) cover own-account workers and unpaid family workers
in the urban sector. 3. For India, the informal sector consists of enterprises not covered by various legislative acts, such as the Factories Act of 1948. Data for India pertain
only to the nonagriculture sector for 1999/2000. 4. The informal sector figure for Indonesia includes the own-account, self-employed assisted by family members or temporary employees, and family
workers in the nonagriculture sector for 1999. 5. For Nepal, the informal sector refers to unincorporated or unregistered economic units, which employ fewer than 10 paid employees. Data for Nepal
cover the nonagriculture sector for 1999. 6. The informal sector figure for Korea (1993) refers to the self-employed, day laborers, and unpaid family workers in the nonagriculture sector. 7. For Pakistan, the informal sector figure covers all household unincorporated enterprises owned and operated by own-account workers, irrespective of
the size of the enterprise, or household unincorporated enterprises owned and operated by employers with fewer than 10 persons engaged in the nonagriculture sector for 2000.
8. Data for the Philippines (2001) pertain to the proportion of self-employed and unpaid family workers in the nonagriculture sector. 9. Data for Singapore (2001) and Taipei,China (2000) refer to the proportion of own-account workers and unpaid family workers to total employment.10. Data for Thailand (1999) refer to the share of informal sector in urban employment, based on Amin (2002).
Sources: Amin (2002); ILO (2003a); Bangladesh Bureau of Statistics (various years); Department of Census and Statistics, Sri Lanka (2003); Department of Labor and Employment, Philippines (personal communication, May 2005); National Institute of Statistics, Cambodia (2001); Ministry of Manpower, Singapore (2005); Planning Commission (2001); BPS (2000); DGBAS (various years); World Bank (2005b) for GDP per capita.
ThemeApRev.indd 19ThemeApRev.indd 19 08/08/2005 11:32:42 AM08/08/2005 11:32:42 AM

20 Key Indicators of Developing Asian and Pacific Countries
10
15
20
25
30
1991a 1992 1993 1994 1995 1996% o
f Non
-reg
ular
em
ploy
men
t to
tot
al e
mpl
oym
ent
Figure 2.8: Share of Nonregular Workers to Total Workers(in establishments employing 10 or more workers),
Philippines (%)
1997 b
70.869.6
67.770.8
69.4 69.267.7
65.6 64.462.8
65.464.0
64.9
29.2 29.230.430.6 30.832.3
34.435.6
37.234.6 36.0 35.1
32.3
0
10
20
30
40
50
60
70
80
1990 1991 1992 1993 1994 1996 1997 1998 1999 2000 2001 2002 2003
Informal Formal
Figure 2.7: Share of Formal and Informal Sector Employment, Indonesia (%)
%
2.4 Summary
This section’s overview of labor market outcomes in Asia highlights several important development challenges that the region faces. First, Asia’s labor force is not only large, it is also growing. Based on available projections for the working-age population, Asia’s labor force is expected to grow by 14% over the next 10 years and by 24% over the next 25. This is on the assumption that recent estimates of labor force participation rates continue to apply into the future. If, however, labor force participation rates increase—driven, for example by greater participation of women—the future labor force will be even larger. Second, ensuring that this labor force is utilized productively will not be easy and, while some parts of the region have done an excellent job in this regard, large parts continue with a vast pool of underutilized labor. This is most evident in South Asia where the large majority of the labor force is employed in agriculture and where low productivity
Source: Oey-Gardiner and Triaswati (2005).
a Excludes agriculture, forestry, and fisheries. b As the Survey of Specific Groups of Workers was terminated in 1998, 1997 presents the latest available data.
Source: Bureau of Labor and Employment Statistics, Philippines (various years a).
ThemeApRev.indd 20ThemeApRev.indd 20 08/08/2005 11:32:44 AM08/08/2005 11:32:44 AM

21
Why work in the informal sector given that the “good” jobs are in the formal sector? While some analysts believe that many of those working in the informal sector do so voluntarily for a variety of reasons—including the possibility of earning more than in formal employment, and for the independence that self-employment can provide—in the context of Asia’s developing economies, the most important reason is that informal sector work is a coping strategy on the part of individuals seeking employment in the formal sector, but failing to find it. In this characterization, the informal sector worker is one who, having failed to find formal sector employment, enters the informal sector “to earn some cash in preference to earning nothing” (Fields 2004a).
As pointed out by Mazumdar (1999), there is a long tradition of focusing on labor market regulations in the formal sector as a primary reason for differentials in earnings between the two sectors. In particular, minimum wage legislation, employment security laws, social security legislation, and laws governing labor union activity have been put forward as key reasons for the earnings differentials. Although such regulations may well have an impact—something examined in greater detail in Section 4—economic reasons unconnected to labor legislation are likely to be playing an important role as well, such as the much better access that firms in the formal sector have to finance and technology. Mazumdar argues that in the Asian context, as distinct from Latin America, institutional intervention on behalf of formal sector workers has been weak and of recent origin in most countries in the region.1
Similarly, one does not need to appeal to the “closed shop” practices of strong labor unions to understand why vertical mobility from informal sector work to formal sector work may be limited. Employers may well rely on supervisors and senior workers to help recruit new workers if they believe that having a cohesive workforce is important for labor productivity. In stratified societies such as those of South Asia, the population from which new recruits will be drawn may not thus be the population of individuals looking for jobs, but rather the population of those who have close kinship or community ties to those who are already employed. Practices such as lifetime employment for workers—which need not be the result of labor market legislation—would further restrict the vertical mobility of informal sector workers who missed joining the formal sector at early points in their working careers. Finally, the pool of workers who can realistically hope to secure formal sector employment can be further narrowed due to such attributes as gender and education. Considerable evidence from all around Asia shows that certain jobs tend to become associated with women. A problem with such “labels” is that when women seek to enter other parts of the formal sector, they may find it difficult to convince employers of their ability to perform adequately the tasks required. In India’s textile industry, for example, women are typically employed only in specific occupations. Partly as a result of these labels, women are more likely to end up seeking employment in informal work. Indeed, data from India shows that the proportion of women in the formal sector, in addition to being small to begin with, has been declining over time. As regards the self-employed in the informal sector, including owners of microenterprises, their upward mobility is often limited by a serious lack of access to capital and other complementary inputs.
of work has led to unacceptably high rates of poverty. Third, while a transition out of agriculture into industry and services holds the key to improving labor market outcomes, nonagricultural work in Asia presents some alarming features. For example, a very large proportion of nonagricultural workers continues to be employed in the informal sector. Additionally, recent trends reveal either stagnation or even an increase in the share of workers
engaged in the informal sector.20 Given the low earnings and low productivity of many informal sector jobs, these trends show the enormity of the challenge that lies ahead for Asia’s policy makers.
20 There is also evidence of an increase in the share of formal sector workers engaged in nonregular work with few of the benefits that formal sector workers typically receive.
1 As regards a country like India, where institutional intervention has been greater, Mazumdar points out that large factories, thus the ones in the formal sector, historically paid higher wages well before the introduction of important pro-worker labor legislation in the formal sector. He ascribes the wage differences to the higher productivity of factories working with modern capital inputs and technology, and to the existence of “efficiency wage” and “profit-sharing” considerations.
Sources: Mazumdar (1999) and Fields (2004a).
Box 2.5: Some Issues of Formal and Informal Sector Work
ThemeApRev.indd 21ThemeApRev.indd 21 08/08/2005 11:32:46 AM08/08/2005 11:32:46 AM

22 Key Indicators of Developing Asian and Pacific Countries
0
10,000
20,000
30,000
40,000
50,000
60,000
70,000
1990 2000
Cap
ital-L
abor
Rat
io (
$)
without PRC, India, ex-Soviet bloc with PRC, India, ex-Soviet bloc
Figure 3.1: Near Halving of the Global Capital-LaborRatio, 1990 and 2000
3. Labor Markets in a Globalizing World
This section provides an overall overview of labor markets in a globalizing economy. It starts by arguing that a country’s labor market outcomes are greatly infl uenced by the effects of the interplay of globalization, technological progress, and competitiveness; and documents the impact of the increase in worldwide employment due to the incorporation of the PRC, India, and the countries of the ex-Soviet bloc into the global economy. It then discusses the major functions of the labor market—allocation of resources, income, and risk. These form an important component of the policies to achieve the full and productive employment objectives. An evaluation of the arguments for labor market reform follows, from the perspective of mainstream economists who are calling for increasing labor market fl exibility. It is argued that this call is a consequence of the theoretical models used by mainstream economists to explain unemployment, and of the fact that competitiveness is a major policy objective of countries in today’s world. Next, the section presents an empirical analysis of the relationship between growth, productivity, employment, and technological progress. It is found that employment elasticities across the region are low and that, in general, they decreased in the 1990s vis-à-vis the 1980s. This, it is argued, is the result of the interaction of increasing returns to scale and labor-saving technological progress. The section ends with a brief theoretical interpretation of this empirical evidence based on the notion of wage-led employment.
3.1 The Economic Context in which Labor Markets Operate
The economic landscape in which labor markets operate has been undergoing tremendous changes over the last decade and a half. Today we live in a world characterized by the interplay of three factors, namely, globalization, technical change, and competition (ADB 2003a, pp. 205–272). Their interaction is rapidly turning a segmented worldwide labor market into a very integrated market. At the same time, the global supply of labor has increased rapidly and continues to do so. In part, this is the result of the demographic transition experienced by many developing countries, especially in Asia. But it is also due to the integration of more economies, especially the PRC and increasingly so India, into the international economy. Many countries are pushing for reforms so as not to miss the train of the new economic order imposed by globalization and competitiveness. The objective is, ultimately, to try to attain growth rates as high as possible with a view to reducing poverty and catching up with the industrial world. Growth
is seen as the key to poverty reduction and, ultimately, to the achievement of the Millennium Development Goals and broad development.21 Consequently, in order to become more competitive, developing countries have been advised to dismantle their trade barriers, abolish their legal monopolies, privatize their state-owned enterprises, and reduce overstaffi ng in their bloated bureaucracies and, lately, to reform their labor markets. The focus on competitiveness questions is clear in policy discussions throughout the developing world.
Crucially, the increase in the effective size of the global labor force has not been accompanied by a concomitant surge in capital for investment. Figure 3.1 provides estimates of the impact on the capital-labor ratio of the increase in employment due to the incorporation of the PRC, India, and the ex-Soviet bloc countries into the global economy. Using data from the Penn World Table, Richard Freeman has estimated that the collapse of communism, India’s turn from autarky, and the PRC’s shift to market capitalism have increased the global workforce from about 1.46 billion workers (excluding this group) to about 2.93 billion (including this group).22 He has estimated the world’s capital-labor ratio at $53,500 in 1990 (excluding it), and at $29,800 (including it). By 2000, the world’s capital-labor ratio stood at $61,300 (excluding it) and $37,600 (including it). These are rough estimates but serve to highlight the issue.
21 It is worth mentioning that the Millennium Development Goals make scant reference to the importance of employment creation or making it central to macroeconomic policy to reduce poverty.
22 These figures were provided by Richard Freeman, Harvard University (personal communication). His contribution is gratefully acknowledged.
Source: Richard Freeman (personal communication, May 2005).
ThemeApRev.indd 22ThemeApRev.indd 22 08/08/2005 11:32:47 AM08/08/2005 11:32:47 AM

23
A consequence of the declining capital-labor ratio is apprehension of a “race to the bottom” whereby globalization may be forcing workers to compete to attract capital by accepting lower wages, inferior working conditions, or both. Indeed, it seems that globalization has brought the world closer together, by making it smaller and more homogeneous. But the same forces have fragmented the globe by creating winners and losers. Globalization begets multiple worlds. The fear of most Asian countries outside the two Asian giants (and indeed of other countries in the world) is that the PRC and India have the capacity to absorb much of this limited pool of available capital, which will reduce these other countries’ capacity to generate new employment so as to absorb their increasing labor supply.
This and the following subsections discuss how these factors appear to be affecting the evolution of labor market outcomes in broad terms. They also examine the interplay between these factors and labor market regulations. Clearly, a labor market does not operate in an institutional vacuum. In particular, governments intervene to make it well functioning, in the broader context of achieving full, productive, and decent employment. Of course, the nature and degree of this intervention varies widely across the world. It is possible that in some cases, these interventions may be seriously interfering with the full and productive employment objectives, especially in the context of globalization, technological change, and competition. In such cases, reform of labor market regulations might be necessary. However, reform must not entail indiscriminate elimination of labor regulations. Instead, reform requires identifying which specifi c elements of labor regulations are interfering with effi ciency and fairness, and therefore, which elements are candidates for removal or adjustment. Equally, reform of labor market regulations involves identifying elements of labor regulations that are conspicuous by their absence, for example, protection against loss of income.
How are Asia’s policy makers grappling with the labor market problems they face? One way or another, market-oriented economic reforms play a central role. Developing countries, especially in Latin America, have been advised for a long time (particularly since the 1980s) to reform almost everything, along the lines of the “Washington consensus”:23 liberalization of trade and inward foreign direct investment, privatization of state-owned enterprises, industrial deregulation, strengthening of property rights regimes, tax reform, liberalization of prices (including
23 The term Washington consensus was coined by John Williamson in 1989. On several occasions, he has complained that his ideas have often been misinterpreted because they have been taken to extremes (neoliberalism) that he never intended, such as capital account liberalization, monetarism, supply-side economics, or a minimal state.
interest rates), introduction of a competitive exchange rate, and fi scal discipline. This package could be labeled “fi rst generation reforms.” The three key underlying ideas are: achieving macroeconomic discipline; putting in place a market economy; and opening to the world (at least with respect to trade and foreign direct investment).
What does the record say about the success of these reforms in developing countries? Overall, results have been disappointing, especially when viewed from the perspective of most workers. First, several crises have occurred (e.g., the Mexican crisis of 1994 and the Asian crisis of 1997–98). While these crises may not have been the result of liberal policies concerning trade in goods and services per se, their occurrence was intimately connected to the broader process of globalization. The Asian crisis ended an era of high rates of economic growth and, while some crisis-affected countries have resumed economic growth (though below precrisis rates), in several cases the adverse impacts on labor markets persist. As may be recalled from Section 2, unemployment rates in several East Asian and Southeast Asian economies remain considerably higher than they were in 1996, prior to the crisis. As also noted in Section 2, the share of informal employment has increased since the crisis in countries such as Indonesia, Philippines, and Thailand.
Second, although it is true that in some countries the economic and social transformations of the last decade have put their economies on a higher and more sustainable growth path, labor market outcomes, even there, have not improved systematically. Thus, in a number of countries where economic growth has been generally robust, problems with unemployment and underemployment are persistent, while informality appears to have grown—India offers a prominent example of this. And even in a manufacturing powerhouse such as the PRC, layoffs in state-owned enterprises have led to increased unemployment and a surprisingly large decline of around 15% in manufacturing employment between 1995 and 2002 (ILO 2004, p. 116). However, a group of workers has emerged—typically the most highly skilled and therefore a small minority of the workforce—for whom labor market opportunities have improved dramatically. In India, for example, an examination of earnings of workers versus supervisors in the formal manufacturing sector reveals a growing divergence since the early 1990s (Figure 3.2).
The real problem in labor market outcomes of many developing countries is not a failure to create jobs; rather, that growth in the number of entrants into the labor market is outpacing that of jobs being created, particularly jobs in
ThemeApRev.indd 23ThemeApRev.indd 23 08/08/2005 11:32:49 AM08/08/2005 11:32:49 AM

24 Key Indicators of Developing Asian and Pacific Countries
0
10,000
20,000
30,000
40,000
50,000
60,000
Workers Supervisors
Figure 3.2: Real Wage and Salary Earnings in India(rupees)
1981 1983 1985 1987 1989 1991 1993 1995 1997 1999 2001
the formal (or modern) sector of the economy.24 Indeed, of all the jobs being created, a large, and in several cases growing, share is accounted for by the informal sector (as, for example, nonagricultural jobs in India and the Philippines). Certainly, the informal sector encompasses a wide variety of work and not all informal sector workers are there involuntarily. Nevertheless, on average, conditions of work and labor market opportunities in the informal sector are worse than those in the formal sector. This is especially true in the services sector, where informal jobs tend to command low wages but require arduous physical labor (domestic servants, haulers, and rickshaw pullers, for example).25 At the same time, it must be noted that not all formal sector jobs are desirable in all respects. Nevertheless, the terms and conditions of employment in formal sector jobs still make these jobs coveted. Indeed, greater job security, decent working conditions, and some social protection (access to subsidized health insurance, the chance to contribute to a pension program, etc.) are factors that impel many otherwise well-qualifi ed workers to seek relatively low-skill tasks in the formal sector. An example of this would be a college-educated individual who takes up work as a waiter or waitress in a fi ve-star hotel.
At a broader level, the record of growth in the 1990s is disappointing as regards income inequality and, ultimately, the distribution of labor earnings. Indeed, the experience offers some contrast to that of newly industrialized economies, such as Korea and especially Taipei,China,
24 For example, in 2004, the Philippine economy created 977,000 new jobs (67% in services, the rest equally divided between the agriculture and industry sectors), compared with 574,000 in 2003, while there were 1,289,000 new entrants. This implies that the MTPDP 2004–2010 was not achieved and that the system added 312,000 new unemployed to the already high level of unemployment. Between 1981 and 1997, the Philippine economy generated a total of 11,815,000 new jobs (an average of about 695,000 a year), out of which 2,779,000 were in agriculture, 2,673,000 in industry (1,104,000 in manufacturing), and 6,399,000 in services. Over the same period, 13,087,000 new workers joined the labor force. This means that, between 1981 and 1997, unemployment increased by 1,272,000. Over the period 1999–2003 (for the reasons stated above 1998 is excluded), the economy generated a total of 4,011,000 new jobs (an average of about 1,000,000 a year), out of which 1,141,000 were in agriculture, 298,000 in industry (225,000 in manufacturing), and 2,572,000 in services. Over the same period, 4,897,000 new workers joined the labor force, leading to an increase in unemployment of 886,000.
25 In countries such as the Philippines or India, call centers and software development are also part of the mushrooming of jobs in the formal service sector. But these jobs, which have received much attention by the media, are all too few. For example, even a fourfold increase in the number of information technology (IT) jobs (ranging from call-center work to software development) between 2004 and 2008 in India would leave the sector accounting for only 0.8% of the labor force, as calculated from 4 million IT jobs (based on projections by NASSCOM [2002], India’s main chamber of commerce for the IT industry), divided by a projected labor force of 485 million in 2008 (based on the projection implicit in Table 2.1).
during their phase of robust and rapid growth (the 1960s to the mid-1990s). In Taipei,China, the Gini index remained both low and stable, ranging from the low 30s to the high 20s (Dollar and Kraay 2002). In Korea, the Gini index was a little higher, generally in the low to mid-30s in the 1960s, 1980s, and mid-1990s. Although it hit the high 30s at various points in the 1970s in Korea, as Fields (1984, p. 79) points out, the “data supporting this conclusion are open to serious question.”
The case of other DMCs is different. The PRC, for example, recorded an almost 13 percentage point increase in the Gini index between 1981 and 2000 (Ravallion and Chen 2004). In India, robust economic growth in the 1990s was associated with growing inequality between rural areas—where the majority of India’s poor work—and urban areas (Deaton and Dreze 2002). Inequality has increased within urban areas as well.26 In the meantime, the incidence of poverty measured in terms of the national poverty line has gone down, but by much less than if growth had been more equitable. Indeed, decomposition of poverty reduction into growth and distribution components using household expenditure survey data reveals that distributionally neutral growth in household expenditure would have been associated with a 1 percentage point reduction in urban poverty per annum between 1993 and 1999. However, worsening distribution meant that poverty reduction amounted to a little less than two thirds of a
26 A particularly stark manifestation of the latter is the finding (from income tax records) that real incomes of the top 1% of income earners increased by 50% in real terms while the real incomes of the top 1% of 1% increased by 300% during the 1990s (Banerjee and Piketty 2001).
Source: Data from the Annual Survey of Industry, cited in Anant et al. (2005).
ThemeApRev.indd 24ThemeApRev.indd 24 08/08/2005 11:32:49 AM08/08/2005 11:32:49 AM

25
percentage point per annum (ADB 2004a).27 What has driven increasing inequality in labor market outcomes? It is diffi cult to isolate the exact cause. However, the interplay of globalization and technology are probably important factors. Especially in the context of an inegalitarian distribution of skills acquired through education, it is possible that only a minority is gaining from the adoption of new technologies.28
3.2 Functions of the Labor Market
The labor market is one of the main channels through which globalization is affecting developing countries (Rama 2003). First, employment shocks resulting from structural reforms are dealt with in the labor market. Second, a labor market that makes possible job creation and leads to increases in productivity is a key element of the development of a business climate where new fi rms are created and where innovation is fostered. Finally, labor is often the only asset that poor people have.
One of the pillars to achieve the objectives of full, productive, and decent employment is the development of a labor market that is well functioning. A labor market is said to function “well” if it achieves the two primary objectives of effi ciency and fairness. If these two objectives are met, the labor market will adequately perform the following three major functions.
Resource Allocation. An important role of the job market is to match workers with jobs. In an effi cient labor market, all workers willing to work are likely to fi nd jobs that match their skills (this is one of the aspects of underemployment discussed above), and no vacancies should be left unfi lled (Box 3.1). Moreover, workers are likely to have the right jobs given their education, skills, experience, and needs of the marketplace. Finally, in an effi cient labor market, workers should be able to fi nd employment fast.
Income Allocation. The second function responds to the question of whether workers are paid a fair wage. Here it is important to make a clarifi cation, namely, that there is a tendency to argue that when wages are “low,” they
27 Birdsall and de la Torre (2001) have proposed a program that aims to complement the Washington consensus by listing a set of reforms intended to improve income distribution and reduce poverty without reducing growth. These include: an income floor for workers and middle-class households during slumps, greater public spending on preschools, anti-tax-evasion efforts, better worker protection, rural land reform, and improvements in public health.
28 New technologies need not be skills-biased for this result to prevail. As long as the more skilled have an advantage in utilizing new technologies more effectively, then the skilled will draw a disproportionate benefit from the adoption of new technologies.
are not fair. For this reason, it is important to clarify what a fair wage is. For economists, fairness is measured in terms of whether a worker is paid what he or she is worth, and this is measured in terms of a worker’s productivity. Thus, a fair wage is one that is related in some sense to that worker’s productivity. Indeed, at the most intuitive level, the statement that wage rates cannot outstrip labor productivity (a least for a signifi cant amount of time) is a very general economic principle; otherwise no fi rm could survive. Fundamental to the process of growth of any economic unit is the concept of economic surplus, and the use to which such a surplus is put in allocating resources over time. The surplus can be defi ned as the difference between the value of output (Q) and its cost of production, measured at constant prices. Labor is often the primary input in the process. The cost of labor is the total wage bill (W). In per worker terms, the surplus is the difference between the productivity of labor (Q/L) and its real wage rate (w/P). Hence, the survival of the fi rm requires that (Q/L) > (w/P).29
Risk Allocation. The third major function of the labor market is to allocate risks, mostly related to losing one’s job. A well-functioning market protects workers against the risk of income loss. If workers can fi nd a new job quickly (the resource allocation function), income loss is kept to a minimum. For those who become unemployed, unemployment insurance provides a temporary solution.
3.3 The Mainstream Argument for Labor Market Reforms
Labor market reforms are a reaction to the alleged excessive regulation of the labor market that takes the form of labor codes that prevent the normal working of supply and demand. Why do governments regulate labor markets in the fi rst place? The answer would seem to be that they aim to achieve a well-functioning labor market. Labor markets are often not competitive due to uneven market power between the two main participants, workers and employers. This is the result of imperfect mobility of workers and asymmetric information. These imperfections lead to unfair and ineffi cient outcomes in the form of underpaid workers, hazardous working conditions, or discrimination against certain groups of workers (women, for example), when their bargaining position is weak. In general, private markets, if left to themselves, tend to do a poor job of protecting unemployed workers. Governments typically intervene to correct these failures.
29 The relationship between wage rates and productivity directly relates to the distribution of income between firms and workers. The key question is about how the firms and workers distribute productivity gains.
ThemeApRev.indd 25ThemeApRev.indd 25 08/08/2005 11:32:51 AM08/08/2005 11:32:51 AM

26 Key Indicators of Developing Asian and Pacific Countries
However, labor market reforms tend to be a thorny issue for three reasons. First, from a technical point of view, to be successful, they need to be coordinated with reforms in other markets. Second, from a political point of view, some groups resist change—the vested interests. These tend to be the ones that perceive the reform as a threat to the status quo (e.g., reforms to reduce employment protection). In fact, labor market reforms are probably more diffi cult to implement than reforms in any other economic area. It is possible that this happens because labor unions oppose them. However, another reason is worth considering. This is the existing public perception about the effects of reforms, for they are associated with deregulation and a tendency toward “free markets” and a laissez-faire view of the economy. Convincing the public in general, and certain groups of workers in particular, that reducing labor security and facilitating the fi ring process will improve labor market conditions is not easy. This is because the direct impact on those directly affected is very transparent and immediate. In the words of Freeman: “When workers decide, rightly or wrongly, that reforms are undesirable, there is a danger
that they will protest and attempt to overturn the program” (Freeman 1993, p. 137). “Selling” a labor market reform on the grounds that it will benefi t the economy is a much more diffi cult task than selling reforms in areas such as trade or taxes. For this reason, designing labor market reform programs needs strong political support.
The third reason is that the economics profession is divided between those who see protective labor market interventions as a hindrance to development and those who argue that they have positive effects (for example, Freeman 1993, Forteza and Rama 2002). The fi rst group argues that the success of economic reforms depends, in general, on whether labor costs can vary freely in response to changes in labor demand. This is because reforms entail, one way or another, a process of labor reallocation. The time this takes depends on how fl exible the labor market is; the longer it takes the worse. In broad terms, the fi rst group’s criticism of labor market interventions rests on the following: they misallocate labor; they waste resources through rent seeking; they impair adjustments to economic
A mismatch in the labor market is defined as a gap between, on the one hand, the skills and abilities that enterprises (employers) consider necessary for workers in performing their assigned tasks and duties, and, on the other, the skills and abilities that they actually possess. The affected parties in this situation are employers, workers, institutions of education and training, and national or local governments. What are their individual roles?
Firms develop the strategies to stay in business and achieve their objectives as well as the abilities necessary to perform tasks and select workers with such abilities from the labor market; but it is workers who deal with the actual operations. Institutions of education and training determine the number of workers with certain abilities. Here, the role of the educational system, ranging from elementary school to university, is quite significant. Likewise, the influence of national policy on education and training is fundamental. Workers receive formal education in the school system before joining the labor market. This determines the quality and quantity of the labor force. However, workers enhance their abilities after employment. Indeed, many companies offer in-house education and training and many workers improve their skills through on-the-job as well as off-the-job training.
Mismatches in the labor market would not occur if the quality and quantity of labor desired by companies and existing in the labor market coincided, and workers were distributed to workplaces suited to their abilities. Thus, mismatches exist because of failure in one or more parties in the roles of obtaining information on enterprise needs and other related matters, planning based upon this information, and carrying out the plans.
Mismatches in the labor market have become an acute issue because human resources development is a complicated process
and because the education and training systems are not usually flexible enough to adapt to new industrial circumstances. The imbalance between the rapidly changing skills requirements of many companies and the very slow changes to the training curricula of education and training institutes as well as the malfunctioning of the mechanism of supply and demand of labor at the national level has created a type of unemployment and underemployment that affects highly skilled and educated workers. While unemployment of highly educated workers can be the source of a sociopolitical conflict (such as the “brain drain” in the Philippines), underemployment of this type of workers is a different type of phenomenon. If someone with a college degree ends up driving a taxi, productivity need not necessarily fall. The problem is that from society’s point of view, sending this person to college was an investment with probably a low return and a waste of valuable resources. But in other cases this type of underemployment can lead to decreases in productivity due to lack of motivation, because the worker affected cannot fully utilize his or her skills and knowledge in a job more in accordance with the training received. In these cases, wages will not be commensurate with the abilities and educational levels and will also be a factor affecting productivity.
Underemployment of skilled workers is a problem in many Asian countries due to the dynamic change in industrial structures and to the rapid development of information technologies. Thus, there is a constant pressure to improve workers’ skills and abilities because it is an essential strategy to remain competitive in a global market.
It is important to stress that there is no immediate and standardized solution for overcoming the mismatch problem. The solution involves, among other things, appropriate educational policies, as well as changes to social norms and myriad country-specific factors.
Box 3.1: Unemployment, Underemployment, and Mismatches in the Labor Market
Source: Muta (2003).
ThemeApRev.indd 26ThemeApRev.indd 26 08/08/2005 11:32:52 AM08/08/2005 11:32:52 AM

27
shocks; and they deter investment, thereby reducing rates of growth.30
Moreover, according to proponents of market-oriented reforms (Box 3.2) a problem may arise if government interventions are poorly designed, in terms of, for example, providing excessive protection to a minority of formal sector “insiders.” For example, the protection of workers’ welfare through extremely costly dismissal clauses can prevent employers from responding to changes in product market conditions, such as those of that would result from trade liberalization. It would also make employers reluctant to hire new workers, effectively pushing those who are not hired into the informal sector, or into unemployment. In general, while governments intervene in the labor market to achieve a balance between the two primary objectives of effi ciency and fairness, inappropriate interventions can lead to poor outcomes.
Put differently, calls for reforms of the labor market by proponents of market-oriented reforms argue that such reforms are necessary to maintain, if not increase, competitiveness. The contrast in this way of thinking about economic policy with that in the fi rst three decades following World War II—described as the “golden age of egalitarian economic policy”—is stark. As noted by Bowles
30 As Freeman puts it: “Claims that labor market interventions have an adverse effect do not follow mechanically, it should be noted, from ‘pure theory.’ Distortionist analysts make selective use of economic theory. For example, those who believe that social security payroll taxes adversely affect savings and investment reject Ricardian equivalence; those who use nonwage costs to measure interventionist distortions reject the fungibility of models of compensation; those who argue that employment protection laws have efficiency costs ignore Coase’s theorem that property rights do not affect efficiency. Even distortionist criticisms of minimum wages involve more than applying optimizing calculus […] Distortionist arguments are not the final word of economic theory ” (Freeman 1993, p. 120).
and Gintis (1995) “attention has shifted from the effect of egalitarian policies on aggregate demand to their effect on “competitiveness” which is to say on costs and productivity […] and the growing focus on questions of wages and productivity under the general rubric of competitiveness has supported a near consensus that wage restraint and the limitation of social expenditures are necessary conditions for adequate economic performance. Society might still opt for egalitarian measures on moral grounds, many now believe, but at the cost of leaving even the poor to suffer in the long run” (Bowles and Gintis 1995, pp. 409–410; emphasis added). To increase competitiveness, runs the argument, it is imperative to reform labor markets (Appendix 3.1).
Conversely, those who argue that interventions in the labor market play an important and positive role (Box 3.2) base their case on: (i) a rejection of standard neoclassical analysis, from which most of the case for reform draws, in the sense that the models used do not correspond to reality; and (ii) the belief that the more equal the distribution of adjustment costs, the shorter and weaker the resistance to economic reforms. They argue that adjustment programs must be complemented by mechanisms to compensate the workers affected by the reforms. These include job separation packages, early retirement programs, and unemployment benefi ts. In general, these economists argue that the enforcement of labor standards and legally mandated benefi ts “force” employers to shift attention from cost-cutting issues to productivity-enhancement measures (for example, training and technical innovation).
It is important to understand that the argument against labor market regulation as a solution to the unemployment problem is a consequence of the theoretical model used by the economists who favor them, namely, the neoclassical framework. The way in which these economists argue about
For Labor Market Regulation. The right to join a union and bargain collectively can increase workers’ voice, encourage stability in industrial relations, promote on-the-job training, and reduce pressure on taxpayers to maintain acceptable standards of living by placing the responsibility for decent income and benefits on firms (and consumers). The provision of unemployment insurance and assistance would not only help workers in time of need but would facilitate job search, and thereby potentially improve matches between jobs and worker skills and interests. The unemployment benefit system can reduce the incentive to work, but it can also promote job training and search among workers (since they do not have to take an inappropriate job immediately) and can facilitate productivity improvements though enhanced employment flexibility, since employers in “solidaristic societies” will be more likely to fire workers (and workers will be more likely to accept working under this threat) if there is a substantial safety net (for example, the “Danish” model).
Against Labor Market Regulation. The rationale has its roots in the basic supply and demand framework that assumes perfectly competitive markets. High minimum wages and widespread collective bargaining must raise wages and compress the wage structure, pricing less skilled workers out of the labor market. This follows from the supply-demand model used—constraining downward wage adjustments leads to employers responding with fewer jobs. The stakes are raised with demand shocks, such as productivity slowdowns, oil price hikes, significant technological changes, and intensifying trade competition, which may require downward wage flexibility, particularly for the less skilled. On the supply side, social spending that supports family income tends to reduce the incentive for family members to take available jobs. In sum, welfare-state interventions raise both the wage floor (the lowest wages that can be paid) and the reservation wage (the lowest wage at which workers will be willing to work), necessarily reducing the demand for labor.
Box 3.2: The Cases For and Against Labor Market Regulation
ThemeApRev.indd 27ThemeApRev.indd 27 08/08/2005 11:32:53 AM08/08/2005 11:32:53 AM

28 Key Indicators of Developing Asian and Pacific Countries
(and the solutions they propose for) the unemployment problem is a function of what they believe causes it. Mainstream explanations of unemployment share the idea that wages are set above market-clearing levels for different reasons. This is what gives rise to unemployment. What these theories presume is that a market economy, if left undisturbed, has the mechanisms to produce a wage rate that clears the labor market (i.e., all those who want to work fi nd jobs).
The neoclassical school argues that increases in real wages will cause employment to decline, for two reasons: (i) higher wages induce fi rms to substitute other inputs for labor; and (ii) higher wages entail cost increases, which induce buyers to shift suppliers. From a policy perspective, adherents to this view contend that a competitive market has an internal mechanism that allows it to eliminate unemployment (in particular, that a market economy has a long-run tendency to full employment). This mechanism is the speedy adjustment of prices (wages) to their equilibrium level at which demand equals supply. Thus, existing unemployment is the result of workers refusing to accept the equilibrium wage rate as determined by labor demand and supply. The policy implication and the solution to the unemployment problem is, they maintain, more competition and less government intervention in market processes through, for example, the setting of minimum wages or through ensuring job security. In competitive markets, the law of demand and supply ensures that eventually, in the long run, the demand for labor will equal the supply of labor—so that the labor market will clear and there will be no unemployment.
In these circumstances, the level of employment in equilibrium represents “full employment,” that is, all those members of the labor force who desire to work at the equilibrium real wage can do so. The market then clears. Classical full employment equilibrium is, therefore, compatible with the existence of voluntary unemployment, but does not admit the possibility of involuntary unemployment. What is the most important policy prescription of this paradigm to eliminate unemployment? In short, that real wages should be reduced by cutting the money wage rate (Appendix 3.2).
What are the possible explanations for setting wages above the market-clearing level? One such explanation is provided by the “effi ciency wage” model of wage rigidity and unemployment (Basu 1997, Chapter 10). This theory argues that employers prefer not to lower wages despite the existence of surplus labor because, this model assumes, in poor countries higher wages lead to higher productivity. Employers behave this way because output is a function of the wage that the worker receives. Involuntary unemployment arises because, although there
is competition among the unemployed to fi nd jobs, it fails to lower wages because employers prefer to pay a higher wage.
A second model that leads to wages above the market-clearing rate and that explains unemployment in developing countries is the “collusive theory” (Basu 1997, Chapter 10). In this case, it is workers’ refusal to undercut one another, since they fear that this will lower wages for everybody, not only now but also in the future. Thus, they prefer to remain unemployed in the hope that in the next period they may be lucky enough to fi nd jobs at the prevailing high wage rate.
Finally, a third model that explains unemployment in a context of wages set above the market-clearing level argues that wages in the formal sector in many developing countries are set by a juxtaposition of institutional forces different from supply and demand (Fields 2004a). These institutional forces are minimum wages, labor unions, public sector pay policies, multinational corporations, and labor codes. These forces create infl exible labor markets. The converse, labor market fl exibility, refers to the capacity to change the quantity, quality, and price of labor inputs to reduce production costs, and make output more adjustable to rapid changes in market demand (Sardaña 1998, p. 70). Infl exible labor markets are, therefore, those which do not allow these types of changes. Such infl exibility causes unemployment. Indeed, discussions in many developing countries today about making the labor market more fl exible are based on the assumption that factors such as the increase in the bargaining power of labor unions are responsible for unemployment and, thus, policies designed to combat unemployment should focus on the labor market.31 These factors are called wage-push factors as they increase the wage demands of workers. The literature distinguishes three types: (i) labor costs, which include minimum wages, unemployment benefi ts, fi ring restrictions, and unionization of the labor force; (ii) functional fl exibility, which involves the ability of fi rms to reorganize the labor process as needed, and the adaptability of workers within the fi rm to different tasks as required by the production process; and (iii) numerical fl exibility, which concerns the adjustment of working hours or the size of the workforce to output demand fl uctuations, or in response to technological changes. According to this 31 In the debate over job creation, nearly everyone agrees that
flexibility is a good thing. It is certainly hard to argue with flexibility if the alternative is rigidity. But in the economist’s lexicon, “flexibility” has a particular meaning: a market is flexible if short-run adjustments of prices and quantities (wages and employment) produce a match between demand and supply. In labor markets, this means that, with full information and negligible cost, workers should move quickly and smoothly from one job to another to land the best job, while employers should hire and fire workers—again with full information and negligible cost—to maximize profits.
ThemeApRev.indd 28ThemeApRev.indd 28 08/08/2005 11:32:54 AM08/08/2005 11:32:54 AM

29
argument, the rise in unemployment is due to changes in these wage-push factors. Hence, policies to increase labor market fl exibility are usually recommended, and include cutting unemployment benefi ts, reducing the minimum wage, weakening labor unions, and doing away with employment protection measures—in short, deregulating the labor market to achieve market fl exibility and to bring it closer to a perfectly competitive market.
In fact, today’s main mainstream explanation of unemployment is that labor market institutions are “too rigid” and wages “too high.” The theoretical model used today to support these conclusions is the nonaccelerating infl ation rate of unemployment, or NAIRU (Appendixes 3.3, 3.4, and 3.5 provide various views). The Organisation for Economic Co-operation and Development (OECD) (1994) and International Monetary Fund (IMF) (1999, 2003) for example, have insisted for several years that, in order to accelerate growth, Europe has to reform its labor markets so as to make them more fl exible, following the US approach. But the argument over the need to reform labor markets is also sweeping across developing countries, as the book by Heckman and Pagés (2004) shows.32
The response from pro-reform policy makers and analysts to the diffi culties faced by many developing countries in terms of generating enough employment has been from the technical point of view, namely, that they regard reforms as incomplete. In particular, they contend that reforming a distorted market will not usually lead to increased effi ciency and growth unless the reform is comprehensive and is accompanied by complementary actions on several fronts. For example, they put it that opening up the economy to international trade is unlikely to attract signifi cant investment if the physical infrastructure (such as roads and electric power) or the legal infrastructure (such as contract enforcement) is highly defi cient. This way, while labor market reforms were not part of the fi rst generation reform package, the recent purview of market-oriented reforms has been expanded to cover regulations of the labor market in what could be called “second generation reforms” (which also include a host of institutional reforms). Analogous to the case of defi cient physical infrastructure, the pro-reform camp argues that the benefi ts of trade liberalization—including both “static” gains from trade resulting from sectoral reallocation of production in line with comparative advantage, as well as “dynamic” gains from trade resulting from improvements in effi ciency—will not be forthcoming if existing laws and regulations make it diffi cult to shed or reallocate labor.
32 Howell (2005) offers a collection of very critical papers of mainstream arguments for structural reforms of the labor market. It is particularly critical of the empirical work presented by OECD (1994) and IMF (1999, 2003).
More specifi cally, labor market reforms have often translated into a call for action on three fronts:33
Wage-Setting Practices. These directly affect labor costs and, consequently, decisions of fi rms on the best combination of factor inputs, adoption of new technologies, and ultimately output growth. Reformers propose to make wage and labor costs more fl exible by removing restrictions that prevent wages from refl ecting local conditions and individual skill levels, in particular of younger workers.
Regulations Affecting Hiring and Firing. These provide job security for covered workers. Reformers argue that overly strict regulations tend to (i) raise the cost of workforce reorganization, often required when growth-enhancing new technologies are adopted; and (ii) tilt incentives for fi rms to move into the informal sector. Reformers propose revamping such employment security provisions.
Taxes on Labor and Social Security Contributions. Reformers maintain that unemployment and related benefi t systems and their interaction with the tax system should be changed, such that societies’ fundamental equity goals are achieved in ways that impinge far less on the effi cient functioning of labor markets.
These calls for action have led to recommendations that wages should be downwardly fl exible, refl ecting the demand for and supply of skills in local labor markets; that employment protection legislation should be limited or eliminated altogether; and, similarly, that social protection spending and regulations (passive labor market policies) should be scaled back or eliminated. The only possible exception to a free market approach would be the promotion of job search and worker training (active labor market policies).
3.4 Growth, Productivity, Employment, and the Role of Technology
Defenders and detractors of globalization disagree on the effects on globalization. While the former group claims that globalization has positive effects on society at large, the latter group emphasizes the negative effects.
For the fi rst group, globalization has brought a series of worldwide benefi ts, mostly through trade and fi nance. To name a few: (i) openness to foreign direct investment can contribute to growth by increasing the available amount of investment resources; (ii) openness to capital fl ows may increase opportunities for portfolio risk diversifi cation and
33 Drawn from OECD (1997, Box 3).
ThemeApRev.indd 29ThemeApRev.indd 29 08/08/2005 11:32:55 AM08/08/2005 11:32:55 AM
30 Key Indicators of Developing Asian and Pacific Countries
consumption smoothing through borrowing and lending; (iii) increased access to the domestic fi nancial system by foreign banks may raise the effi ciency of the intermediation process between savers and borrowers, thereby lowering mark-up rates in the banking system; (iv) fi nancial openness helps mitigate asymmetric information problems and can improve the opportunities for the poor to access the formal fi nancial system; and (v) openness to trade leads to static and dynamic gains. Likewise, openness to trade facilitates the transmission of ideas. Overall, empirical evidence seems to suggest that countries that have opened themselves the most to trade during the last two decades have grown on average the fastest, though it is less clear on the benefi ts associated with fi nancial integration.
Despite the benefi ts of globalization via trade and fi nancial integration, even most of its defenders are beginning to recognize and accept that the process of globalization entails both signifi cant risks as well as potentially large economic and social costs that might last for quite some time. Nevertheless, concerns about the negative effects of globalization have led to a polarized debate. For example, openness to global capital markets has brought greater volatility to domestic fi nancial markets. Large reversals in short-term capital fl ows have led to several fi nancial crises and to sharp increases in unemployment and poverty in the short run. Likewise, trade liberalization has, in some countries, led to reduced demand for unskilled labor and lower real wages in the short term. Since developing countries often suffer from a low degree of intersectoral labor mobility, job losses and declines in income have led to higher poverty rates.
The question of whether, as fi rms become more productive they need fewer workers, has no straightforward answer.34 In simple terms, detractors of globalization argue that, for a given rate of output growth, if productivity increases as a consequence of technological progress, then employment must go down. Indeed, in these circumstances, more rapid productivity growth will diminish the growth of employment and compound the unemployment problem. The argument is that as the workforce becomes more effi cient, fewer workers will be needed. Globalization’s defenders though, on the other side of the debate, contend that this argument does not consider what happens after productivity improves and allows the economy to expand and create new jobs.
The standard mechanism enabling real per capita demand to rise in market economies has been growth in real wages in line with productivity increases. In very simple terms, these arguments can be put as follows. As a matter of defi nition, one can think of output (Y) as
34 On this, see also ILO (2005a), Chapter 2.
the product of employment (L) times labor productivity (y), i.e., Y L y= × . This means that a given level of output can be achieved either with high productivity and low employment, or with low productivity and high employment. In the former case, the employment intensity of economic growth is said to be low, and in the latter, high. This also means that the growth rate of employment can be written as the difference between the growth rate of output and that of labor productivity, i.e., ˆ ˆ ˆL Y y= − . As noted above, the problems in the eyes of globalization’s detractors is that a given rate of output growth can potentially lead to lower employment growth.
From the point of view of the capital intensity of the techniques used, if labor is the more abundant factor of production in developing countries, one would expect to observe the use of more labor-intensive techniques of production in the industry sector there. This simply refl ects the lower price of labor relative to capital. In practice, however, for the same outputs produced, the capital intensity of techniques is often not very different in industrial and developing countries, and the capital-labor ratio often differs between them in the aggregate only to the extent that the composition of output differs. This is because developing countries have sectors where the capital-labor ratio is very low, as in, for example, subsistence farming and petty services activities. In reality, the modern sector in developing countries is not much different from those in industrial countries in terms of capital intensity. The problem is that given the supply of labor available, and given the rate of investment, the more capital intensive the techniques, the less employment will be required. Hence, unemployment will be the result of the use of “inappropriate” techniques.
Five main factors account for the relative capital intensity of modern sector techniques in developing countries. First, for a large number of commodities, there is very little capital-labor substitutability in their production; hence the manufacturing technology does not vary much between industrial and developing countries. Second, the market price of factors of production in developing countries often fails to refl ect relative abundance. This is due to the existence of distortions in the form of, for example, subsidies to capital, and to the encouragement of high wages in the modern sector. The cheaper that capital is made relative to labor, the more capital-intensive the technique will be. Developing country governments appear to believe that labor-intensive techniques lead to a lower output because of the relative ineffi ciency and higher wage bill. Indeed, there is a potential confl ict between employment and output because methods that employ low capital-labor ratios (i.e., labor-intensive techniques)
ThemeApRev.indd 30ThemeApRev.indd 30 08/08/2005 11:32:56 AM08/08/2005 11:32:56 AM

31
may involve high capital-output ratios.35 However, there is little evidence that techniques with a low capital-labor ratio have higher capital-output ratios than capital-intensive techniques. The empirical evidence gathered by Pack (1974) indicates that this is not true in general (i.e., that there is no confl ict between the employment and output objectives). Techniques can be more labor intensive without affecting the level of output.
Third, although money wages may be lower in developing countries, unit labor costs or effi ciency wages (i.e., the wage rate divided by labor productivity) may differ little; in these circumstances, it is profi table to use a relatively capital-intensive technique. Fourth, capital intensity may be the result of a skill constraint. Typically, labor-intensive techniques require skilled labor, and capital-intensive techniques semiskilled labor, such that in developing countries, frequently short of skilled workers, capital may substitute for skills.
Fifth and fi nally, perhaps the most important factor is that the techniques of production are frequently imported from industrial countries, and these techniques tend to be labor saving. This simply refl ects the fact that technological progress in industrial countries saves on labor (since labor is the relatively expensive factor of production). This is also, then, a case of inappropriate technology.
What does the empirical evidence reveal with regard to the relationship between output, productivity, and employment growth? First, employment elasticities have been estimated (i.e., percentage increase in employment associated with a 1 percentage point increase in GDP growth) by country. They are shown in Table 3.1. These elasticities have two important features. The fi rst is that they are relatively low, at about 0.5 and below. Interpreted from the point of view of Verdoorn’s law, this provides evidence of increasing returns to scale.36 The second is that the elasticities of the 1990s are lower than those of the 1980s, except for Pakistan, Philippines, and Singapore.
35 The capital-output ratio (K/Y) may be written as the product of the capital-labor ratio (K/L) times the unit labor requirement, i.e., the inverse of labor productivity (L/Y). It is theoretically possible that a technique with a high K/Y ratio can have a low K/L ratio. This will be the case if the technique has low productivity, i.e., a high L/Y ratio.
36 Verdoorn’s law is the hypothesis that output growth causes a faster growth of productivity. For a detailed explanation, see McCombie and Thirlwall (1994, Chapter 2).
Table 3.1: Employment Elasticities
DMC 1980s 1990s
Bangladesh 0.550 0.495China, People’s Rep. of 0.330 0.129Indonesia 0.435 0.379India 0.384 0.312Korea, Rep. of 0.223 0.225Malaysia 0.683 0.406Pakistan 0.406 0.553Philippines 0.535 0.731Singapore 0.375 0.711Thailand 0.315 0.193Taipei,China 0.242 0.139
Source: Authors’ estimates.
These elasticities are largely consistent with the regional estimates provided by Kapsos (2005, Tables 3.7 and 3.8) for the 1990s. For East Asia, his estimates are below 0.2; for Southeast Asia and the Pacifi c they range between 0.2 and 0.4; and for South Asia the range is 0.35 to 0.5. In the case of East Asia, he argued that the level of these elasticities, combined with high GDP growth rates, implies that the region has experienced robust growth of productivity (where productivity is measured by real GDP per worker).
Kapsos (2005) also shows how employment growth, output growth, productivity growth, and employment elasticity are related theoretically. In countries with positive GDP growth and with an employment elasticity of between 0 and 1, employment growth and productivity growth are necessarily positive. For this reason, the relationship between employment and productivity growth across selected Asian countries is also examined. Figure 3.3 displays the scatter plots of the two variables for 11 DMCs in 1980–1989 and 1990–2000. The second period corresponds to an era in which Asia’s economies probably felt the forces of globalization, technological change, and competitiveness in a bigger way. The two graphs reveal several interesting features. First, with only one exception (the Philippines in 1980–1989), both employment growth and productivity growth have been positive. Second, employment growth displays less variation than growth in labor productivity, especially in 1980–1989. Finally, as indicated by the negative slope of the relationship, employment growth has tended to be slower in countries with higher productivity growth. This fi nding is consistent with the one that, while technological change raises productivity, it can have an adverse impact on employment growth.
ThemeApRev.indd 31ThemeApRev.indd 31 08/08/2005 11:32:58 AM08/08/2005 11:32:58 AM
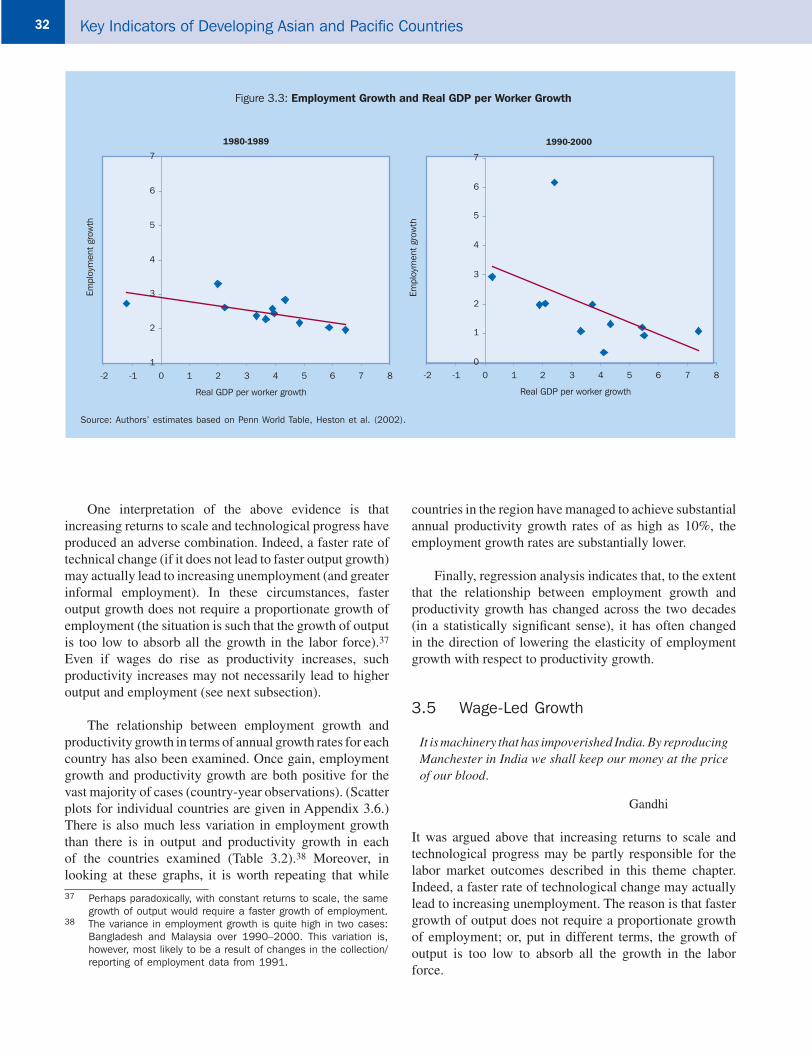
32 Key Indicators of Developing Asian and Pacific Countries
1980-1989
1
2
3
4
5
6
7
-2 -1 0 1 2 3 4 5 6 7 8
Real GDP per worker growth
Empl
oym
ent
grow
th
1990-2000
0
1
2
3
4
5
6
7
-2 -1 0 1 2 3 4 5 6 7 8
Real GDP per worker growth
Empl
oym
ent
grow
th
Figure 3.3: Employment Growth and Real GDP per Worker Growth
One interpretation of the above evidence is that increasing returns to scale and technological progress have produced an adverse combination. Indeed, a faster rate of technical change (if it does not lead to faster output growth) may actually lead to increasing unemployment (and greater informal employment). In these circumstances, faster output growth does not require a proportionate growth of employment (the situation is such that the growth of output is too low to absorb all the growth in the labor force).37 Even if wages do rise as productivity increases, such productivity increases may not necessarily lead to higher output and employment (see next subsection).
The relationship between employment growth and productivity growth in terms of annual growth rates for each country has also been examined. Once gain, employment growth and productivity growth are both positive for the vast majority of cases (country-year observations). (Scatter plots for individual countries are given in Appendix 3.6.) There is also much less variation in employment growth than there is in output and productivity growth in each of the countries examined (Table 3.2).38 Moreover, in looking at these graphs, it is worth repeating that while
37 Perhaps paradoxically, with constant returns to scale, the same growth of output would require a faster growth of employment.
38 The variance in employment growth is quite high in two cases: Bangladesh and Malaysia over 1990–2000. This variation is, however, most likely to be a result of changes in the collection/reporting of employment data from 1991.
countries in the region have managed to achieve substantial annual productivity growth rates of as high as 10%, the employment growth rates are substantially lower.
Finally, regression analysis indicates that, to the extent that the relationship between employment growth and productivity growth has changed across the two decades (in a statistically signifi cant sense), it has often changed in the direction of lowering the elasticity of employment growth with respect to productivity growth.
3.5 Wage-Led Growth
It is machinery that has impoverished India. By reproducing Manchester in India we shall keep our money at the price of our blood.
Gandhi
It was argued above that increasing returns to scale and technological progress may be partly responsible for the labor market outcomes described in this theme chapter. Indeed, a faster rate of technological change may actually lead to increasing unemployment. The reason is that faster growth of output does not require a proportionate growth of employment; or, put in different terms, the growth of output is too low to absorb all the growth in the labor force.
Source: Authors’ estimates based on Penn World Table, Heston et al. (2002).
ThemeApRev.indd 32ThemeApRev.indd 32 08/08/2005 11:32:59 AM08/08/2005 11:32:59 AM

33
Table 3.2: Growth in Real GDP, Real GDP per Worker, and Employment, Selected DMCs
Real GDP Growth Real GDP per Worker Growth Employment Growth
DMC 1980–1989 1990–2000 1980–1989 1990–2000 1980–1989 1990–2000
Mean Variance Mean Variance Mean Variance Mean Variance Mean Variance Mean Variance
Bangladesh 5.0 8.1 4.9 1.6 2.3 8.4 4.4 35.3 2.7 0.1 0.7 29.3China, People’s Rep. of 6.7 24.4 8.8 8.1 4.1 22.9 7.6 7.5 2.5 0.0 1.2 0.1India 6.1 1.5 5.8 5.0 3.7 1.4 3.7 5.3 2.3 0.0 2.0 0.1Indonesia 5.9 5.2 4.7 28.3 3.4 5.0 2.6 29.6 2.4 0.0 2.1 0.2Korea, Rep. of 8.8 4.8 6.3 27.6 6.7 5.8 4.9 28.2 2.0 0.3 1.3 0.2Malaysia 5.5 12.7 7.2 7.9 2.1 11.8 5.8 42.9 3.4 0.1 1.5 20.4Pakistan 7.5 1.7 3.9 2.0 4.5 1.5 1.8 4.6 2.9 0.0 2.1 1.8Philippines 1.6 22.0 3.3 7.7 -1.1 20.5 0.3 13.6 2.8 0.1 3.0 2.1Singapore 6.8 23.1 9.2 14.5 4.0 16.0 3.1 26.9 2.6 3.5 6.1 4.9Thailand 7.3 10.0 5.3 38.4 5.0 9.8 4.1 33.6 2.2 0.0 1.2 0.5Taipei,China 8.3 8.9 6.5 1.0 6.1 10.9 5.4 1.2 2.1 0.3 1.0 0.0
Source: Authors’ estimates based on Penn World Table, Heston et al. (2002).
on aggregate demand and employment. These will be seen if income distribution (inequality) affects the demand for consumer goods; or, put another way, if a larger wage share supports a higher level of demand for consumer goods. However, proponents of wage-led productivity growth strategies advocate wage increases as a means of sustaining a higher level of output per unit of input. But if productivity growth is strongly wage led, it is unlikely that wage increases will lead to the creation of employment. In fact, a frequently heard objection to productivity-enhancing strategies is that if they are successful, they will lead to reductions in employment. These are the strategies that labor unions and many labor advocacy groups fear and oppose.40
Wage-led growth occurs when the impact of profi ts on investment is negligible; in this instance, an increase in the wage share leads to an increase in the equilibrium capacity utilization rate, which leads to a faster growth rate in the capital stock and an increase in growth. Wage-led growth occurs because the increase in consumption demand that is derived from the increase in the labor share has a positive feedback effect on investment through raising the capacity utilization rate. On the assumption that investment is not too sensitive to profi ts, there is no dampening effect through changes in profi tability from the labor share increase (Foley and Michl 1999, Chapter 10).
An important question to tackle is that of how wage-led economies react to productivity improvements. (A graphical representation of this is given in Figure 3.7.2 40 Bowles and Boyer (1995) show how to test whether an economy
is wage led. The econometric evidence they provide is for a group of industrial countries. These seem to be profit led. The authors of this theme chapter do not know of similar studies for developing countries. Preliminary empirical evidence for the Philippines indicates that it is a wage-led economy.
The situation described in the previous paragraph originated with the Luddite movement and David Ricardo. Toward the beginning of the nineteenth century, Ricardo argued that the opinion prevailing in “the labouring class, that the employment of machinery is frequently detrimental to their interests, is not founded on prejudice and error, but is conformable to the correct principles of political economy” (1981, p. 392).39 Most contemporary and subsequent economists have disagreed with this view. This chapter does not intend to take an open position on the issue, though the arguments are useful to help explain the reality of many countries, in particular developing economies. Luddite arguments can be valid if an economy with less than full employment is wage led, that is, if following an exogenous increase in the real wage or in the labor share, consumer demand increases and so does overall demand. However, if the corresponding reduction in the capital share results in a reduction in investment that dominates the increase in consumption, the economy is said to be profi t led. A wage-led employment regime is defi ned as an “institutional structure within which an exogenous wage increase induces an increase in employment […] under a wage-led aggregate demand regime an exogenous increase in the real wage increases the level of aggregate demand” (Bowles and Boyer 1995, p. 145). The converse regimes are referred to as profi t-led employment and profi t-led aggregate demand, respectively. A necessary condition for a wage-led employment regime is that the aggregate demand regime be wage led. (Figure 3.7.1 in Appendix 3.7 describes the concept of wage-led employment.)
From a policy perspective, wage-led employment strategies focus on the likely positive effects of the wage
39 Ricardo added the chapter “On Machinery” to the third (1821) edition of his Principles of Political Economy and Taxation.
ThemeApRev.indd 33ThemeApRev.indd 33 08/08/2005 11:33:01 AM08/08/2005 11:33:01 AM

34 Key Indicators of Developing Asian and Pacific Countries
in Appendix 3.7.) In the short run, higher productivity is unlikely to lead immediately to real wage increases, especially in the context of unemployment. However, real wage increases lead to the elimination of jobs and, consequently, total wage payments decline. Then consumer demand will decline too. Eventually, investment and new capacity formation will also fall. What needs to be discovered, then, is whether the unemployment in a wage-led economy that potentially results from increases in productivity is a reason to prevent or control the diffusion of labor-saving techniques (Dutt 1984, Taylor 1991). The increase in productivity will eventually lead to increases in wages (though smaller than the increases in productivity), leading to a new position with lower unit labor costs. This, in turn, will most likely cause aggregate demand to drop.41 This will eventually lead to reductions in capacity utilization and the employment rate. The result is that, in general, wage-led economies are not well prepared to absorb technological change.
To realize a complete picture of how the economy reacts to increases in productivity, one has to analyze how the economy evolves in the long run and thus see what happens to the growth rate of the capital stock in the new equilibrium. To this end, assume that investment in this wage-led economy responds negatively but weakly to higher unit labor costs (labor share) and positively to capacity utilization. In these circumstances, the lower capacity utilization effect dominates the higher investment due to lower unit labor costs (higher capital share). Hence, the overall result is a reduction in capital and output growth, and consequently in employment. This line of reasoning leads to the conclusion that, in a wage-led economy, the Luddite arguments also apply in the long run, a problem that is magnifi ed in the context of globalization, where labor-saving technological advances are constantly being applied. The implication is that in the wage-led economy, arguments in favor of limiting labor-saving technological progress would seem to make sense.42
The problem with this conclusion is that it presents an interesting paradox, namely, that growth in real wages and per capita incomes are impossible without productivity gains, themselves the result of technological change. The key question for developing countries, therefore, is not how to impede productivity gains, but how to translate them into higher real wages and aggregate demand. (Section 6 looks at this issue again.)
41 This is because unit labor costs are, essentially, the share of labor in output.
42 Fan and Felipe (2005) document the existence of technological progress in the PRC and India, and discuss the evidence for other countries. This seems to be what is known as Marx-biased technical change. This type of technical change increases labor productivity and decreases capital productivity, i.e., it is simultaneously labor saving and capital using.
4. Labor Market Policies in Asia
This section provides a discussion on labor market policies in Asia. Given that the task is extremely complicated, three steps are involved. First, a brief summary of the fi ndings of the empirical literature, based mainly on research conducted by the World Bank and ILO, is provided. Second, the information in a fairly recent data set created by Botero et al. (2003) is summarized. This contains data on employment laws and collective relations laws. Third, case studies for India, Indonesia, Philippines, and Viet Nam are reviewed. A brief discussion on the PRC’s labor market is also provided.
4.1 Overview of the International Experience
As discussed above, mainstream models rely on the idea that wages determine employment and that there exists an equilibrium wage rate for which all those wishing to be hired will indeed be hired. Based on this, critics of labor market regulation claim that collective bargaining institutions, employment regulations, and income security measures reduce employment growth. If collective bargaining institutions keep wages above the market-clearing wage rate, then wage-push factors will depress employment. And if employment protection increases the cost of laying off workers in the future, then employers will be more reluctant to hire today. Moreover, as the argument goes, increasing workers’ rights (for example, the right to strike) undermines the business climate, raises labor costs, and reduces employment growth.
However, “to validate the claim that interventions have major allocative, rent-seeking, adjustment, or growth costs requires empirical evidence that interventions are effective in producing differentials in pay or conditions of work that would not otherwise arise in unfettered markets and that they have suffi ciently large adverse effects on resource allocation to affect the overall economy” (Freeman 1993, p. 120; emphasis added). Furthermore, adherents to a different school of thought argue that the mainstream view of the labor market does not seem to correspond to the reality in industrial countries, much less to that in developing countries, where unemployment and underemployment are constant features. In fact, they argue that interventions in the labor market lead to good outcomes. They base their case on a rejection of standard neoclassical analysis (see “The Mainstream Argument for Labor Markets Reforms,” above) and on the belief that the more equal the distribution of adjustment costs, the shorter and weaker is the resistance to economic reforms.
ThemeApRev.indd 34ThemeApRev.indd 34 08/08/2005 11:33:01 AM08/08/2005 11:33:01 AM

35
A review of the empirical literature leaves the reader somewhat confused since both camps have managed to produce evidence that seems to validate their claims. For example, in a recent study by Heckman and Pagés (2004) for Latin American countries, the authors advocate the need for further labor market reforms in that region, on the basis of empirical evidence that seems to be overwhelming. In contrast, ILO studies have, among others, highlighted the positive role of minimum wages in protecting low-income workers and industrial relations systems (see, for example, ILO 1991a and ILO 1991b). Based on a thorough evaluation of the research conducted by the World Bank and ILO during the 1980s, Freeman (1993), in a very balanced “scorecard,” found little support for the notion that interventions are major impediments to resource allocation, structural adjustment, or stabilization programs. Interestingly though, he also found little evidence on the value of social pacts and relative consultative modes of adjustment favored by those who argue that interventions are benefi cial. The following are Freeman’s main conclusions.
Sectoral Wage Differentials
The drop in public urban salary premiums in the 1980s refutes fears that institutional rigidities make pay-setting infl exible in the formal or modern sector, and renders invalid the concerns of advocates of labor market reforms with regard to sectoral wage differentials and urban bias in labor market outcomes. Micro-studies of wages in several developing countries have shown important pay differentials among comparable workers that cannot be explained by government or labor union interventions. These results cast doubt on the alleged negative effect of market interventions.
Nonwage Costs
Nonwage costs (payroll taxes, unemployment compen-sation, etc.) do not necessarily constitute a distortionary factor.
Minimum Wages
Freeman (1993, p. 126) claims that there is evidence that an enforced minimum wage substantially reduces employment (see Table 4.1 for minimum wages of selected DMCs). However, “such minimum wage intervention is far from the norm in the developing world. Many countries set minimum wages too low, or are too lax in enforcing the law for the regulation to have much effect” (Freeman 1993, p. 127). One of the studies cited rejected the importance of minimum wages in India (Fallon 1987). However, another study for Zimbabwe claims that increases in minimum wages after independence had an important impact on
the country’s wage structure (Fallon and Lucas 1991). Freeman argues that what denies legitimacy to the claim that minimum wages have had a distortionary effect is the evidence that real minimum wages have fallen in many countries (for example, the Philippines in Table 4.2), implying that they have had no impact in terms of being a harmful minimum fl oor. This also implies that minimum wages have failed to fulfi ll the role they were supposed to play in the fi rst place. Freeman’s conclusion (1993, p. 128) is that countries will not set minimum wages at levels that negatively affect employment (see, for example, Box 4.1). When the unemployment rate in a country is relatively high, the minimum wage will be unenforceable as both workers and employers will have an incentive not to comply with the law.
Job Security and Other EmploymentRegulations
The evidence of the negative impact of job security regulations—which require fi rms to obtain the approval of government or other institutions for laying off workers and in some cases setting the amount of severance pay (hence raising the costs of reductions in staff)—is not compelling, according to Freeman (1993). In some of his studies these costs seem to be important. For example, the experience of Spain provides a strong case in which relaxation of regulations spurred job growth (where the reduction in the unemployment rate was achieved at the expense of a large increase in the number of temporary contracts). But in other countries, such relaxation may not have had much impact. The evidence on employment protection legislation appears to be strongly associated with more stable employment (OECD 1999, Bertola 1999). But while such legislation reduces job destruction, it also appears to reduce job creation. The result is that the net effect on total employment is uncertain.
Government Employment
High and increasing government employment in some developing countries is raising concerns that a large public sector may be a major distortion in the labor market. A fair assessment seems to be that, while government employment beyond some level may prove harmful, few countries let things reach that stage (Freeman 1993).
Wage Adjustments
Freeman’s analysis suggests that institutions (in general) did not obstruct stabilization and adjustment programs during the 1980s, when the world economy was sluggish. Once again, the sharp drop in real wages proves that wages were fl exible when required. However, institutional interventions seem to have produced a “suboptimal rate of
ThemeApRev.indd 35ThemeApRev.indd 35 08/08/2005 11:33:02 AM08/08/2005 11:33:02 AM

36 Key Indicators of Developing Asian and Pacific Countries
Table 4.1: Minimum Wage Levels, Selected DMCs
Country Date of Introduction Minimum Maximum
Bangladesh Agricultural laborers—1984; Agricultural laborers—3.27 kilograms of rice per day, US$50 for ordinary operators in Workers in EPZs—1989; or an amount of money than is equal to the the electronics industry in EPZs Workers in industries price of this quantity of rice in the (approximately PPP$248.18— (non-EPZs)—1994. local market. 2003).
US$30 per month for helpers in EPZs Tk900 per month for ordinary (approximately Tk1, 815—2003) machine operators in the garment (approximately PPP$148.91—2003). industry (non-EPZs) (US$15.3— 2003) (PPP$73.84—2003). Tk600 (US$10.20—2003) (PPP$49.23—2003), per month for helpers in the garment industry.
Cambodia 1 July 2000 US$45 per month for regular workers in the textile, garment, and footwear sector.
China, People’s Shanghai—1 July 2004; CNY190 per month (in certain towns in CNY635 per month (In ShanghaiRep. of Jianxi region—1 March 2000. the Jiangxi region) (US$—2003) city) (US$76.69—2003) (PPP$—2003). (PPP$350.21—2003).
India The minimum wage rates included The following minimum/maximum rates Rs92.71 per day—Unskilled applied as of 1 October 2001. are taken from the minimum wage rates workers in Metropolitan cities and set by the central Government. Ahmedebad, Lucknow, Nagpur, Kanpur and Greater Bombay, Rs52.00 per day—Unskilled workers in working in the agriculture sector. most rural areas, working in the construction sector (US$2.00—2003) (PPP$10.43— (US$1.10—2003) (PPP$5.85—2003). 2003).
Indonesia 1 February 2003 PRp281,750 per month in East Java PRp631,550 per month in the (US$32.80—2003) (PPP$113.88—2003). province of Jakarta (US$73.60— 2003) (PPP$255.06—2003).
Korea, Effective from 1 September 2003 Hourly: W2,510Rep. of to 31 August 2004. Daily: (8 hours per day) W20,080 Monthly: (226 hours per month) W567,260 (US$476—2003) (PPP$674.74—2003).
Lao PDR 1 February 2000 KN3,600 per day (US$0.34—2003) KN93,600 per month (US$8.90—2003) (PPP$46.19—2003).
Malaysia No minimum wages. Only for cinema Cinema workers: RM155.00 per month Shop assistants: RM250.00 per workers and Penang stevedores, for unskilled workers in cinemas normally month for workers aged 21 and cargo-handlers and lightermen showing four films a day above in certain urban districts sectors—1989, shop assistants (US$40.79—2003) (PPP$94.98—2003). (US$65.79—2003) sector—1982, catering and hotel (PPP$153.19—2003). sector—1983.
Pakistan October 2001 Rs2,500 per month (rate for unskilled workers across whole country) (US$43.25—2003) (PPP$182.08—2003).
Philippines The Wage Orders currently in force P102 per day (US$1.88—2003) P265 per day—P250 basic wage were issued between 2000 and 2002. (PPP$8.24—2003) for workers in Sulu and plus P15 cost of living allowance Certain regions introduced staggered Tawi-Tawi in the ARMM region working in the for nonagricultural workers in the minimum wage increases, prescribing retail/services sector, employed by an enterprise National Capital Region increases at 6–12-month intervals. employing not more than 10 workers. (US$4.88—2003) (PPP$21.41—2003).
Thailand 1 August 2003 B133 per day (US$3.20—2003) B169 (US$4.07—2003) (PPP$10.53—2003) for all provinces other (PPP$13.38—2003) per day for than Samut Prakarn, Nakorn Pathom, Pathum the following provinces: Bangkok, Thani, Samut Sakorn and Phuket; Chonburi, Samut Prakarn, Nakorn Pathom, Chiang Mai, Nakorn Rachasima, Phang Ngar, Pathum Thani, Samut Sakorn. and Saraburi.
Viet Nam Laborers working in enterprises D290,000 per month (US$18.70—2003) D626,000 per month operating under the State Enterprises (PPP$96.97—2003) (for laborers working in (US$40.36—2003) and the Enterprises Law—January 2003; enterprises operating under the State Enterprises (PPP$209.32—2003) (for laborers Vietnamese employees working in foreign and Enterprises Law). working in foreign-invested invested enterprises—June 1999. enterprises in Hanoi City and Ho Chi Minh City (urban districts).
EPZ = export processing zone, PPP = purchasing power parity.
Source: ILO (2005b).
ThemeApRev.indd 36ThemeApRev.indd 36 08/08/2005 11:33:03 AM08/08/2005 11:33:03 AM

37
reduction” with accompanying unemployment. However, Freeman maintains, to contend that greater real wage reductions are still necessary “seems excessive because it puts the entire burden of adjustment to macroeconomic distress on wages and the labor market. […] When the reduction in real wages necessary to eliminate open unemployment exceeds the huge reductions observed in many developing countries, I would look beyond the labor market for the root cause of the economic disaster” (Freeman 1993, p. 133).
Table 4.2: Philippines: Minimum Wages by Region, 2003–2004
2003 2004
Nominal Real Nominal Real Fall in RealRegion Wage Wage Wage Wage Wages (%)
National Capital Region 280 159.89 300 157.71 1.36Cordillera Autonomous Region 190 116.02 205 110.18 5.03I 190 114.10 200 108.56 4.86II 185 112.35 193 110.05 2.05III 229 136.98 244 132.16 3.52IV 237 136.71 255 131.90 3.52V 182 100.16 194 96.43 3.72VI 180 111.66 190 108.19 3.11VII 200 108.72 208 105.19 3.25VIII 188 108.39 195 104.53 3.56IX 175 103.55 180 100.38 3.06X 192 110.13 202 105.75 3.98XI 195 118.33 195 109.12 7.78XII 180 113.00 200 109.61 3.00CARAGA 179 107.18 189 102.05 4.79Autonomous Region in Muslim 150 75.91 150 72.91 3.95 Mindanao
Mean 195.72 114.57 206.22 110.30 3.73
Standard Deviation 909.07 336.60 1,176.50 335.90
Note: Base year is 1994.Source: NWPC (2005).
Collective Bargaining
The success of the East Asian economies during the 1980s raises the question of the role of labor unions. This is because these were largely suppressed or severely restricted. This may lead some to believe that suppressing unions contributes positively to economic growth. Freeman (1993, pp. 133–134) indicates that no robust empirical evidence verifi es this claim, and that the experience of a wide variety of countries, both industrial and developing,
protect the welfare of workers and reduce work-related illnesses and diseases; provide more opportunities for the disabled to get work and develop saleable skills; improve the skills and wages of the labor force by increasing training opportunities to raise the general status of workers from “unskilled” to “semiskilled”; protect workers’ rights; formalize a wage, welfare, and taxation structure for migrant workers; and tighten the rules of outsourcing to ensure that temporary workers are not exploited.
The State Enterprise Labor Relations Confederation of Thailand has asked the Government to increase the minimum monthly wage to no less than B7,000; stop privatization; control consumer product prices; and abolish subcontract employment and outsourcing.
The following was based on an article in The Nation newspaper, Bangkok.
The Prime Minister Thaksin Shinawatra is unlikely to approve a demand from labor groups to increase the minimum daily wage. He said that the proposed daily wage increase from B175 to B233 was too large and would discourage foreign investors because this could lead to financial losses. It would, in turn, cause closure of factories and firing of workers.
However, Prime Minister Thaksin agreed to other demands of workers, submitted by the Labor Congress of Thailand. He pledged to implement an eight-point set of labor policies, namely to: create a greater choice of sustainable jobs by encouraging more investment; make sure that workers are not exploited or bullied;
Source: The Nation. 2 May 2005.
Box 4.1: Thailand: Wage Hike Will Scare Investors
ThemeApRev.indd 37ThemeApRev.indd 37 08/08/2005 11:33:04 AM08/08/2005 11:33:04 AM
38 Key Indicators of Developing Asian and Pacific Countries
indicates that unions do not seem to hamper growth. He mentions, however, that the empirical evidence for Korea shows that suppression of labor was associated with a high rate of work-related accidents, and produced a very unhappy labor force despite signifi cant increases in real wages. He also shows that “tripartite pacts” (i.e., wage-setting arrangements among labor unions, employers, and government) are not easy to institute or maintain. This is because they “require a strong labor movement, with leaders able to assess the economic scene and convince workers to accept current consumption losses for future gains; a business community that accepts labor as a social partner; and a government willing to share some prerogatives with its social partners” (Freeman 1993, p. 138).
Forteza and Rama (2002) evaluated the impact of labor market rigidities on growth rates over the decade preceding the adoption of a serious reform effort and the decade immediately after. Their regression analysis of empirical data compares the annual growth rates of 119 countries over the period 1970–1986. The indicators of labor market rigidity that the authors used are minimum wages, cost of mandated benefi ts, strength of the labor market movement, and size of government employment. The authors argue that the fi rst two variables refl ect the extent to which the government directly interferes in the adjustment of labor costs, while the second two capture the ability of potential losers from reform to convey their grievances. The results of their analysis show four main points.
First, labor market rigidity is a determinant of the success or failure of economic reforms. Second, countries with more rigid labor markets experienced declines in growth rates before they adopted the adjustment programs and weaker recoveries afterward. Third, labor market rigidity matters more for political reasons than for economic reasons. That is, it is not factors such as high minimum wages or mandated benefi ts that make economic reforms less likely to be successful. Instead, it is greater unionization and government employment, which are associated with deeper recessions before adjustment and weaker recoveries afterward. The authors interpret this result as implying that organized interest groups that stand to lose from the reforms may succeed in delaying their adoption and diluting their content.
Fourth, minimum wages and mandated benefi ts do not appear to hinder economic growth. This result is consistent with the evidence for industrial countries (Box 4.2), where labor market policies arguably have modest hard-to-uncover effects on economic effi ciency. Forteza and Rama conclude that “the possible irrelevance of minimum wages and mandated benefi ts for the success of economic reforms questions the wisdom of efforts to deregulate the labor market” (2002, p. 29). Moreover, they argue that abolishing
minimum wages or curtailing social security benefi ts might not contribute much to economic performance. In sum, labor market deregulation might be effective at reducing rigidity “on paper,” but not necessarily in practice: “… it seems preferable to concentrate reform efforts on issues such as taxation, government spending, trade barriers, fi nancial regulations and enterprise ownership, rather than on re-drafting the labor code” (Forteza and Rama 2002, p. 29).
4.2 Labor Market Policies in Asia: An Overview
Providing a detailed account and discussion of the labor regulations and policies of all Asian countries is well beyond the scope of this theme chapter. One problem is the large number of countries. Another one, perhaps more subtle, is that it is very diffi cult to make an “unbiased” evaluation of these policies. Recall Freeman’s (1993) discussion of the different positions with respect to the role of labor market interventions (epitomized in the almost diametrically opposed positions of the World Bank and the ILO), namely, that while for some economists these have negative consequences, for others, they are necessary to protect workers. Thus, while minimum wages, for example, represent a clear distortion for some economists, for others it plays an important role in terms of reducing inequalities.
Some indication of the extent to which labor markets in Asia and elsewhere are regulated may be provided by the number of ILO conventions signed by countries.43 Information on ratifi ed ILO conventions is provided in Figure 4.1. It shows that by 1980, the European and some Latin American countries had already ratifi ed most of these conventions. Bangladesh, India, and Pakistan had also signed substantially more conventions than other Asian countries (but still fewer than the European and Latin American countries). Fewer conventions had been signed by Sri Lanka, Philippines, and Singapore. At the bottom were countries like Thailand, Malaysia, and Indonesia.
Some researchers have treated a higher number of ILO conventions ratifi ed as an indicator of more restrictive and infl exible labor markets (see, for example, the discussion in Forteza and Rama 2002). One could ask: Is the number of ILO conventions ratifi ed a good proxy for the distortion of the labor market? It is diffi cult to say. First, not all conventions may be equally relevant to
43 Once a country ratifies a particular convention, it commits to make it legally binding. In this way, the number of ILO conventions ratified by a country could be a proxy for the “thickness” of its labor code—see, for example, Forteza and Rama (2002), p. 10.
ThemeApRev.indd 38ThemeApRev.indd 38 08/08/2005 11:33:04 AM08/08/2005 11:33:04 AM

39
the issue of labor market fl exibility and rigidity. Second, even if a convention is ratifi ed, the degree to which it is enforced is uncertain, since the ILO does not have power of enforcement. Instead, it relies on moral suasion and voluntary compliance. Conversely, nonratifi cation does not imply that a country is not complying with the spirit of a convention (Hasan 2003). Perhaps more crucially, using the number of ILO conventions ratifi ed as a regressor in a regression exercise (probably a reduced form without a solid theory supporting it), however statistically signifi cant, would not prove that signing them leads to lower growth or bad labor market outcomes. This is because there might be another variable not specifi ed in the regression causing the seemingly signifi cant relationship. Moreover, European
countries have succeeded in delivering optimal labor market outcomes in terms of equity and effi ciency and yet have signed most of these conventions.
Something similar happens with the use of the Botero et al. (2003) data set on employment policies for 85 countries as of 1997. They codifi ed data on employment laws (that govern individual employment contracts), industrial and collective relations laws (that regulate the bargaining), and social security laws (that govern the social response to needs and conditions that have a signifi cant impact on the quality of life, e.g., unemployment, maternity leave, and pay); they also generated measures of worker protection. In essence, for each policy in each country, Botero et al. have
The evidence of the role of labor market institutions in industrial countries is much more abundant than in developing countries. For example, Buchele and Christiansen (1992, 1995, 1999a, 1999b) have found that workers’ rights have a generally positive effect on the growth of output per hour worked. They maintain that all the basic determinants of productivity growth (e.g., pace of innovation in technology, rate of growth of the capital-labor ratio, development of human capital) depend crucially on the cooperation and effective participation of workers. The reason is that workers hold the key to the success of the production process (they carry it out!), so they are in a unique position to contribute improvements in technology and work organization that increase labor productivity. When will they cooperate the most? When they feel that they have a secure stake in the long-run success of the company they work for; and when they feel that they are treated fairly and trust that their employer will continue to treat them fairly in the future. How is this feeling on the workers’ part accomplished? By guaranteeing workers’ rights, including collective bargaining, and by implementing measures with a view to reducing workers’ vulnerability against job loss. The result, Buchele and Christiansen argue, is that strengthening workers’ rights encourages labor-management cooperation and workers’ active involvement in improving productivity and product quality. Also studying the effect of wages on labor motivation, Bowles et al. (1983) documented the existence of a positive relationship between wages and productivity.
These empirical findings are very much in line with the work of Bewley (1999), who, during 1990–91, interviewed 336 managers, labor leaders, and employment counselors mainly in Connecticut (US), on the subject of why, when unemployed workers are available, firms do not cut wages until the excess supply is eliminated.1 The answer from the interviews was one that conventional theory had not considered, namely, that the most important factor preventing nominal wage cuts was the psychological factor of morale.2 Good morale among a firm’s workforce has a positive effect on the firm’s profits, on the one hand, by increasing workers’ productivity, effort, creativity, and cooperativeness, and, on the other, by reducing
absenteeism and turnover. Likewise, well-motivated employees tend to provide good customer service. Workers would perceive a cut in nominal wages as a hostile act.3
In a widely cited article about unemployment in Europe, Bean (1994) dismissed many clichés about unemployment there. For example, he argued that the hypothesis that unemployment results from unionization was rather unconvincing; that US salaries do not decline much in response to unemployment; that the welfare state was not a source of unemployment; and that the evidence available did not show that the existence of generous unemployment benefits was the cause of persistent unemployment.
Nickel (1997, 1998) argued that the higher unemployment in Europe than in the US is often attributed to the more rigid labor institutions in the former (i.e., the NAIRU arguments summarized above). He regressed unemployment rates on wage-push variables such as unemployment benefits, employment protection measures, union density, level of collective bargaining and coverage of bargaining, the “tax wedge,” and the active labor market policy in a cross-country regression. He concluded that measures of labor market rigidity do not have any impact on total employment, although protection tends to lower short-term unemployment as expected.
Nickel and Layard (2000) argue that labor market institutions such as unions and social security systems are important drivers of economic performance, with strict labor market regulations, employment protection, and minimum wages playing a lesser role.
Stockhammer (2004) has rejected the idea that unemployment in Europe is the result of rigid labor markets, contending that changes in labor market institutions are unable to explain the rise in unemployment (see also Howell 2005). According to him, the main reason is the decline in capital accumulation; employment growth is determined by demand growth, and the path of growth is set by investment decisions.
1 There would seem to be no reason why his findings should be restricted to a small US state.2 Bewley also indicated that the economic theories he wanted to discuss seemed ridiculously naive to those he was interviewing.3 Edralin (2001) shows, in the context of the Philippines, that a majority of management and labor groups are in favor of what is known as the
“social clause,” which refers to the incorporation of various social provisions in labor relations. These provisions include freedom of association and the right to organize. Reasons cited in favor of this clause are: to enhance and improve the quality and productivity of workers; to boost benefits for better competition; and to serve as guide or protection for both union and management. Edralin also stresses that despite the general agreement about the benefits of a social clause, a number of industries have found it very difficult to comply with such standards, and emphasizes the inflexibility of institutions in relation to worker benefits, despite the benefits brought about by globalization. She argues that firms can very well be willing to provide such rights and protection to workers provided that the costs of doing so are not too prohibitive and that the productivity of workers is improved.
Box 4.2: Labor Market Regulations in Industrial Countries: The Empirical Evidence
ThemeApRev.indd 39ThemeApRev.indd 39 08/08/2005 11:33:06 AM08/08/2005 11:33:06 AM

40 Key Indicators of Developing Asian and Pacific Countries
ILO Conventions (2000)
0 20 40 60 80
Viet Nam
Thailand
Sri Lanka
Singapore
Philippines
Pakistan
Malaysia
Korea, Rep. of
Indonesia
India
China, People’s Rep. of
Bangladesh
Mexico
Japan
Chile
Brazil
Argentina
Latin America
Europe
DMCs
ILO Conventions (1980)
0 20 40 60 80
Thailand
Sri Lanka
Singapore
Philippines
Pakistan
Malaysia
Indonesia
India
Bangladesh
Mexico
Japan
Chile
Brazil
Argentina
Latin America
Europe
DMCs
Figure 4.1: ILO Conventions Ratified, 1980 and 2000
China, People’s Rep. of
identifi ed the government regulation of each specifi c area, and assigned a higher score when a regulation is seemingly more protective to workers.44 Some of the information contained in this data set is now briefl y summarized.
First, a quick and general snapshot of the Asian countries is given, and the scores with those of other regions of the world are compared. Table 4.3 provides regional summaries for Asia, industrial countries, Latin America, and Africa of the scores of 22 variables selected. The scores are of two types. Some variables are dummies, i.e., 1, 0; the others are continuous. For the dummy variables, the regional summary statistic used is the mode, while for the continuous variables it is the average. One can ask the following question: Is Asia different from the other three regions in terms of labor market policies? The response falls under four heads.
44 The employment laws of most countries are available on line in the NATLEX database of the ILO. The theme chapter also relied on secondary sources to confirm the data, including Blanpain (various years), Borch (2004), ILO (1994 and 1995), and US Social Security Administration (1999).
Employment Laws. Asia is clearly not different. In the case of the dummy variables, the mode is the same as in at least two other regions (i.e., one of the other three regions is the different one). In the case of the averages, a cursory look at the data indicates that Asia does not stand out. For example, it has fewer days of annual leave with pay in manufacturing (no. 5); the number of paid mandatory holidays (no. 6) is slightly higher than in the industrial countries and Africa, but the same as in Latin America; the cost of increasing hours worked (no. 8) is similar in the three developing regions, and substantially lower than in the industrial countries; legally mandated severance pay (no. 9) is substantially higher than in the industrial countries and Africa, but about the same as in Latin America; fi nally, the cost of fi ring workers (no. 10) is also higher in Asia than in the industrial countries and Africa, and about the same as in Latin America. It seems, therefore, that there could be two areas where Asia may be labeled as different, in the sense of having a restrictive legal system that may affect the creation of employment. These are legally mandated severance pay and the cost of fi ring workers. In the latter, all Asian economies bear a high cost (except for Hong Kong, China).
Source: Hasan (2003).
ThemeApRev.indd 40ThemeApRev.indd 40 08/08/2005 11:33:07 AM08/08/2005 11:33:07 AM

41
Table 4.3: Regional Scores
Industrial LatinVariable 1 Variable Description Asia 2 Countries 3 America 4 Africa 5
Employment Laws
Part-time workers are Equals 1 if a part-time worker working half the time of a full-time worker 1 1 1 1not exempt from the enjoys at least half of the benefits enjoyed by the full-time worker. Themandatory benefits variable is also equal to 1 if part-time employment is prohibited by the laborof full-time workers laws. The variable equals 0 if part-time workers are not entitled to: (i) at least(no. 1) half of the maximum hours of work, leaves, and overtime premiums; (ii) social security coverage (pensions, health, unemployment); or (iii) if there are entitlement thresholds of more than half of the legally mandated regular work week for premiums, leave, or social security coverage. In countries where there are minimum-earnings thresholds to obtain benefits (rather than time-based thresholds), the analysis is done considering a salary equal to half of the country’s gross national product per worker.
It is not easier or less Equals 1 if part-time workers working half time enjoy at least half of the legal 1 1 1 1costly to terminate rights to advance notice and separation fees for the termination of thepart-time workers than employment contract of full-time workers. Equals 0 otherwise.full-time workers (no. 2)
Fixed-term contracts are The term “fixed-term contract” refers to workers employed for fixed periods of 0 0 0 0only allowed for fixed-term weeks, months, or years. In many countries a person working for 2 or 3 days pertasks (no. 3) week is considered a fixed-term, rather than a part-time worker. This variable equals 1 if fixed-term contracts are allowed only: (i) for jobs that are temporary by nature; (ii) for temporary vacancies to replace a permanent worker in maternity or sickness leave; (iii) for training contracts; (iv) for seasonal work; and/or (v) if the law expressly states that the will of the parties involved in the contract is not a good enough reason for entering into a fixed-term contract. Equals 0 otherwise.
Maximum duration of Measures the maximum cumulative duration of fixed-term contracts. The variable 0.30 0.27 0.24 0.37fixed-term contracts is normalized from 0 to 1, where higher values mean a lower allowed duration of(no. 4) fixed-term contracts (higher protection). If there is no legally mandated ceiling or if fixed-term contracts can be renewed without limit, the variable equals zero. The highest observation in the sample is 96 months and the lowest observation is 0.
Days of annual leave Measures the length of annual paid leave in manufacturing after 20 years of 14.19 19.10 21.46 19.13with pay in manufacturing employment. If annual leave entails less than full pay, the number of days are(no. 5) discounted proportionally. The highest observation in the sample is 30 days and the lowest is 0.
Paid mandatory holidays Measures the number of mandatory paid holidays in a year. If only half a day is 10.00 7.43 10.23 8.87(no. 6) granted for particular holidays, each is counted as 0.5 days and is rounded off to the nearest whole. The highest observation in the sample is 18 and the lowest is 0.
Maximum number of Measures the maximum duration of the regular work week (excluding overtime). 45.25 40.81 46.15 44.47hours per week (no. 7) The highest observation in the sample is 52 hours and the lowest observation is 37 hours.
Cost of increasing hours Measures the cost of increasing the number of hours worked. The starting point 0.23 0.67 0.24 0.32worked (no. 8) is calculating the “maximum number of hours of work in a year before overtime” per year in each country (excluding overtime, vacations, holidays, etc.). Normal hours range from 1,758 in Denmark to 2,418 in Kenya. Then it is assumed that firms need to increase the hours worked by their employees from 1,758 to 2,418 hours during 1 year. A firm first increases the number of hours worked until it reaches the country’s maximum normal hours of work, and then uses overtime. If existing employees are not allowed to increase the hours worked to 2,418 hours in a year, perhaps because overtime is capped, it is assumed that the firm doubles its workforce and each worker is paid for 1,758 hours, doubling the wage bill of the firm. The cost of increasing hours worked is computed as the ratio of the final wage bill to the initial one.
Legally mandated Measures the amount of mandatory severance payment for the dismissal of one 10.20 3.71 11.29 4.20severance payment redundant worker in manufacturing after 3 years of employment. The variable is(redundancy) (no. 9) expressed in weeks of pay. For countries that code their legally mandated severance pay in days or months of pay, it is changed into weeks, assuming 7 days per week and 4.3 weeks per month.
ThemeApRev.indd 41ThemeApRev.indd 41 08/08/2005 11:33:10 AM08/08/2005 11:33:10 AM

42 Key Indicators of Developing Asian and Pacific Countries
Cost of firing workers Measures the cost of firing 20% of the firm’s workers (10% are made redundant 0.54 0.38 0.50 0.42(no. 10) and 10% are fired without cause). The cost of firing a worker is calculated as the sum of the notice period, severance pay, and any mandatory penalties established by law or mandatory collective agreements for a worker with 3 years of tenure with the firm. If dismissal is illegal, the cost of firing is set as equal to the annual wage. The new wage bill incorporates the normal wage of the remaining workers and the cost of firing workers. The cost of firing workers is computed as the ratio of the new wage bill to the old one.
The employer needs Equals 1 if, by law or mandatory collective agreement, the employer needs the 0 0 0 0the approval of a third approval of a third party (labor union, workers’ council, or government agency) party prior to a collective prior to a collective (more than one worker) dismissal. Equals 0 if the employerdismissal (no. 11) may dismiss more than one worker without third party approval, or if the employer may contract out of the prohibition.
The employer needs the Equals 1 if, by law or mandatory collective agreement, the employer needs the 0 0 0 0approval of a third party approval of a third party (labor union, workers’ council, or government agency) to dismiss one redundant to dismiss a redundant worker. Equals 0 if the employer may dismiss a workerworker (no. 12) without the approval of a third party, or if the employer may contract out of the prohibition.
Collective Relations Laws
Labor Union Power
Right to unionization Measures the protection of the right to form labor unions in the country’s 0 0 1 1(no. 13) constitution. Equals 1 if a right to form labor unions is expressly granted by the constitution. Equals 0.67 if labor unions are described as a matter of public policy or public interest (or mentioned within the chapter on rights). Equals 0.33 if labor unions are otherwise mentioned in the constitution. Equals 0 otherwise.
Right to collective Measures the protection of the right to collective bargaining or the right to 0 0 1 0bargaining (no. 14) enter into collective labor contracts in the country’s constitution. Equals 1 if a right to collective bargaining is expressly granted by the constitution. Equals 0.67 if collective bargaining is described as a matter of public policy or public interest (or mentioned within the chapter on rights). Equals 0.33 if collective bargaining is otherwise mentioned in the constitution. Equals 0 otherwise.
Employers have the Equals 1 if employers have the legal duty to bargain and/or to reach an 1 1 1 1legal duty to bargain agreement with unions, workers’ councils, or other organizations of workers. with unions (no. 15) Equals 0 if employers may lawfully refuse to bargain with workers. The variable only measures the duty to bargain, as opposed to the duty to bargain in good faith.
Workers’ councils are Equals 1 if workers’ councils, committees, or equivalent bodies are mandated by law. 1 1 0 0mandated by law Equals 0 if workers’ councils are not regulated by law or if their creation is voluntary(no. 16) for the employer. Workers’ councils are institutions of employers and workers created for the discussion of company policies affecting workers at the company level. This arrangement is sometimes called the “Swedish” model. The employer still has the sole right to decide on the operations of the company, but must negotiate and decide all matters affecting workers within the framework of workers’ councils.
Collective Disputes
Wildcat strikes are legal Equals 1 if wildcat strikes are legal, and 0 otherwise. Wildcat strikes are strikes 0 0 1 0(no. 17) not authorized by the labor union or the assembly of workers.
A strike is not illegal Equals 1 if a strike is not illegal even if there is a collective agreement in force, 1 0 0 0even if there is a and 0 otherwise.collective agreement in force (no. 18)
Compulsory third party Equals 1 if the parties to a labor dispute are legally required to seek third-party 1 0 1 1arbitration during a labor arbitration or the government is always entitled to impose compulsory arbitrationdispute is mandated by on them. Equals 0 otherwise. The term “compulsory arbitration” refers tolaw (no. 19) arbitration of private disputes against the will of the parties. It may protect workers by granting them an alternative to costly strikes in case of deadlocks in the negotiation process, but it may also limit workers’ right to strike.
Table 4.3: (continued)
Industrial LatinVariable 1 Variable Description Asia 2 Countries 3 America 4 Africa 5
ThemeApRev.indd 42ThemeApRev.indd 42 08/08/2005 11:33:10 AM08/08/2005 11:33:10 AM

43
Employers are not Equals 1 if the law prohibits employers from firing striking workers or from hiring 1 1 1 1allowed to fire or replace replacement labor to maintain the plant in operation during a nonviolent andstriking workers (no. 20) nonpolitical strike. Equals 0 otherwise.
Civil Rights
Mandatory minimum Equals 1 if: (i) there is a mandatory minimum wage defined by statute; 1 0 1 1wage (no. 21) or (ii) there is a minimum wage established by mandatory (administratively extended) collective agreement, which is legally binding for most sectors of the economy. Ignored are variations in the minimum wage laws stemming from: (i) reduced or subminimum rates for youth, apprentices, students, and disabled employees; (ii) adjustments for regional costs of living; (iii) exemptions for public employees and those serving in the armed forces; (iv) experience and marital status of the employee; and (v) specific exemptions for certain groups. The variable equals 0 otherwise. The coding of this variable follows the principles laid down in the classification of minimum wages by OECD (1998).
Political Variable
Union density (no. 22) Measures the percentage of the total work force affiliated to labor unions 0.21 0.42 0.21 0.20 in 1997.
Collective Bargaining Laws. Once again, the overall Asian picture is not altogether different from that of the rest of the world. In this case, all scores displayed are modes. In Asia, workers’ councils (no. 16) are mandated by law, the same as in the industrial countries. Also, the law in Asia does not allow sympathy, solidarity, or secondary strikes, though they are allowed in the other three regions. However, Asia is the only one of the four regions where a strike is not illegal even if there is a collective agreement in force (no. 18). This is the only industrial relations aspect where Asia seems to be different and which may affect employment creation.
Social Security Laws. The evidence is once again clear: Asia is not particularly different from the other regions in terms of disability and death benefi ts or sickness and health benefi ts, although the number of months of required contributions is lower than in the industrial countries. Moreover, the social security system does not cover the risk of unemployment (this variable is a mode).
Civil and Political Rights. Most Asian countries have mandatory minimum wages (no. 21), the same as the other two developing regions. Only Hong Kong, China;
Table 4.3: (continued)
Industrial LatinVariable 1 Variable Description Asia 2 Countries 3 America 4 Africa 5
1 Values of 1 or 0 represents the mode; otherwise, the value represents the average.2 Comprises People’s Republic of China; Hong Kong, China; India; Indonesia; Kazakhstan; Korea; Kyrgyz Republic; Malaysia; Pakistan; Philippines;
Singapore; Sri Lanka; Taipei,China; Thailand; and Viet Nam.3 Comprises Australia, Austria, Belgium, Canada, Denmark, Finland, France, Germany, Greece, Ireland, Italy, Japan, Netherlands, New Zealand, Norway,
Portugal, Spain, Sweden, Switzerland, United Kingdom, and United States.4 Comprises Argentina, Bolivia, Brazil, Chile, Columbia, Dominican Republic, Ecuador, Jamaica, Mexico, Panama, Peru, Uruguay, and Venezuela.5 Comprises Burkina Faso, Ghana, Kenya, Madagascar, Malawi, Mali, Mozambique, Nigeria, Senegal, South Africa, United Republic of Tanzania, Tunisia,
Uganda, Zambia, and Zimbabwe.
Source: Authors’ computations based on Botero et al. (2003).
Malaysia; and Singapore do not have mandatory minimum wages. The industrial countries are split on this issue. Asia has the same union density (proportion of workers affi liated, no. 22) as the other two developing regions, and about half that of the industrial countries.
Tables 4.4 and 4.5 provide the individual scores on worker protection for 15 Asian economies. Table 4.4 shows the score for selected East Asian and Southeast Asian economies, and Table 4.5 for selected South Asian and transition economies. The most salient features of these two tables are as follows.
Employment Laws. In most countries, part-time workers are not exempt from mandatory benefi ts (no. 1). The exception is Sri Lanka. Likewise, it is not easier or less costly in most countries to terminate part-time workers than full time workers (no. 2). Here the exceptions are Indonesia and Sri Lanka. Malaysia has the maximum duration of fi xed-term contracts (no. 4), followed by India, Kyrgyz Republic, Singapore, and Korea. The economies with the highest number of days of annual leave with pay in manufacturing (no. 5) are Korea and Taipei,China with 28 and 24 days, respectively. India has far fewer, at 15.
ThemeApRev.indd 43ThemeApRev.indd 43 08/08/2005 11:33:11 AM08/08/2005 11:33:11 AM
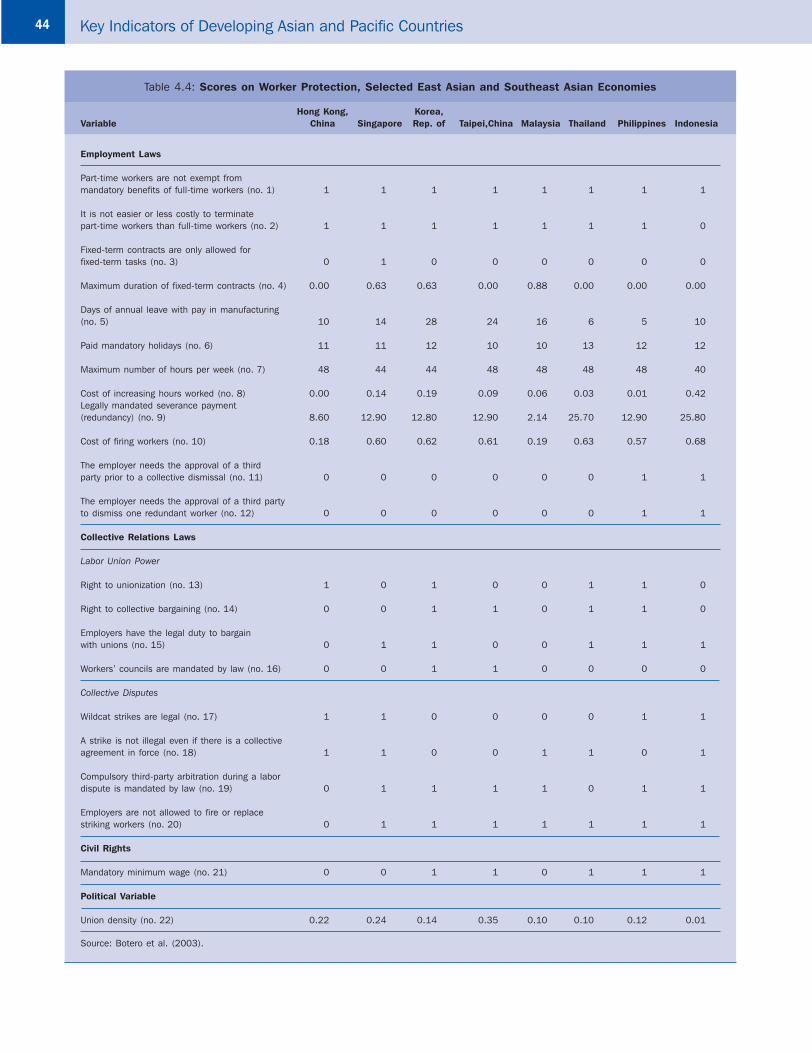
44 Key Indicators of Developing Asian and Pacific Countries
Table 4.4: Scores on Worker Protection, Selected East Asian and Southeast Asian Economies
Hong Kong, Korea, Variable China Singapore Rep. of Taipei,China Malaysia Thailand Philippines Indonesia
Employment Laws
Part-time workers are not exempt from mandatory benefits of full-time workers (no. 1) 1 1 1 1 1 1 1 1
It is not easier or less costly to terminate part-time workers than full-time workers (no. 2) 1 1 1 1 1 1 1 0
Fixed-term contracts are only allowed for fixed-term tasks (no. 3) 0 1 0 0 0 0 0 0
Maximum duration of fixed-term contracts (no. 4) 0.00 0.63 0.63 0.00 0.88 0.00 0.00 0.00
Days of annual leave with pay in manufacturing (no. 5) 10 14 28 24 16 6 5 10
Paid mandatory holidays (no. 6) 11 11 12 10 10 13 12 12
Maximum number of hours per week (no. 7) 48 44 44 48 48 48 48 40
Cost of increasing hours worked (no. 8) 0.00 0.14 0.19 0.09 0.06 0.03 0.01 0.42Legally mandated severance payment (redundancy) (no. 9) 8.60 12.90 12.80 12.90 2.14 25.70 12.90 25.80
Cost of firing workers (no. 10) 0.18 0.60 0.62 0.61 0.19 0.63 0.57 0.68
The employer needs the approval of a third party prior to a collective dismissal (no. 11) 0 0 0 0 0 0 1 1
The employer needs the approval of a third party to dismiss one redundant worker (no. 12) 0 0 0 0 0 0 1 1
Collective Relations Laws
Labor Union Power
Right to unionization (no. 13) 1 0 1 0 0 1 1 0
Right to collective bargaining (no. 14) 0 0 1 1 0 1 1 0
Employers have the legal duty to bargain with unions (no. 15) 0 1 1 0 0 1 1 1
Workers’ councils are mandated by law (no. 16) 0 0 1 1 0 0 0 0
Collective Disputes
Wildcat strikes are legal (no. 17) 1 1 0 0 0 0 1 1
A strike is not illegal even if there is a collective agreement in force (no. 18) 1 1 0 0 1 1 0 1
Compulsory third-party arbitration during a labor dispute is mandated by law (no. 19) 0 1 1 1 1 0 1 1
Employers are not allowed to fire or replace striking workers (no. 20) 0 1 1 1 1 1 1 1
Civil Rights
Mandatory minimum wage (no. 21) 0 0 1 1 0 1 1 1
Political Variable
Union density (no. 22) 0.22 0.24 0.14 0.35 0.10 0.10 0.12 0.01
Source: Botero et al. (2003).
ThemeApRev.indd 44ThemeApRev.indd 44 08/08/2005 11:33:11 AM08/08/2005 11:33:11 AM

45
Table 4.5: Scores on Worker Protection, Selected South Asian and Transition Economies
China, People's KyrgyzVariable India Pakistan Sri Lanka Rep. of Viet Nam Kazakhstan Republic
Employment Laws
Part-time workers are not exempt from mandatory benefits of full-time workers (no. 1) 1 1 0 1 1 1 1
It is not easier or less costly to terminate part-time workers than full-time workers (no. 2) 1 1 0 1 1 1 1
Fixed-term contracts are only allowed for fixed-term tasks (no. 3) 0 1 0 0 1 0 0
Maximum duration of fixed-term contracts (no. 4) 0.75 0.00 0.00 0.00 0.38 0.00 0.75
Days of annual leave with pay in manufacturing (no. 5) 15 14 10 6 12 15 20
Paid mandatory holidays (no. 6) 5 13 13 7 5 8 10
Maximum number of hours per week (no. 7) 48 48 45 40 48 41 40
Cost of increasing hours worked (no. 8) 0.07 0.13 0.03 0.20 0.03 1.00 1.00
Legally mandated severance payment (redundancy) (no. 9) 6.43 0.00 0.00 12.90 12.90 8.60 4.30
Cost of firing workers (no. 10) 0.62 0.49 0.48 0.60 0.62 0.61 0.57
The employer needs the approval of a third party prior to a collective dismissal (no. 11) 1 0 1 0 1 1 0
The employer needs the approval of a third party to dismiss one redundant worker (no. 12) 1 0 1 0 1 1 0
Collective Relations Laws
Labor Union Power
Right to unionization (no. 13) 0 0 1 0 1 1 1
Right to collective bargaining (no. 14) 0 0 0 0 0 1 0
Employers have the legal duty to bargain with unions (no. 15) 0 1 0 0 1 1 1
Workers’ councils are mandated by law (no. 16) 1 1 1 1 1 1 1
Collective Disputes
Wildcat strikes are legal (no. 17) 1 0 1 0 1 0 0
A strike is not illegal even if there is a collective agreement in force (no. 18) 1 0 0 0 1 1 1
Compulsory third party arbitration during a labor dispute is mandated by law (no. 19) 0 1 1 1 1 1 0
Employers are not allowed to fire or replace striking workers (no. 20) 1 1 1 1 1 1 1
Civil Rights
Mandatory minimum wage (no. 21) 1 1 1 1 1 1 1
Political Variable
Union density (no. 22) 0.03 0.10 0.70 0.14 0.50 ... ...
... = data not available.
Source: Botero et al. (2003).
ThemeApRev.indd 45ThemeApRev.indd 45 08/08/2005 11:33:12 AM08/08/2005 11:33:12 AM

46 Key Indicators of Developing Asian and Pacific Countries
In terms of paid mandatory holidays (no. 6), Pakistan, Sri Lanka, and Thailand with 13 days, are the highest. India pays only 5 days. With regard to the cost of increasing hours worked (no. 8), the highest-cost countries are Indonesia, Kazakhstan, and Kyrgyz Republic. As for legally mandated severance pay (no. 9), two countries are far ahead of the rest, namely, Indonesia and Thailand, with 25 days. Firing workers (no. 10) costs the least in Hong Kong, China and in Malaysia. For the rest, the cost is substantially higher. Finally, regarding the need for the approval of a third party prior to a collective dismissal or to dismiss one redundant worker (nos. 11 and 12), except for Indonesia and the Philippines, the East Asian and Southeast Asian economies do not require it. In the case of South Asia, India and Sri Lanka require third-party approval, while Pakistan does not.
Collective Relations Laws. These are split into two subgroups, labor union power (nos. 13–16) and collective disputes (nos. 17–20). Great dispersion is observed in the four variables of labor union power. In two countries, all four measures take on a value of 1 (interpreted in the data set as pro-worker legislation), i.e., Kazakhstan and Korea; and in four countries, three of the four variables are 1, i.e., Kyrgyz Republic, Philippines, Thailand, and Viet Nam. The three South Asian countries (India, Pakistan, and Sri Lanka) do not seem to have the most restrictive policies according to these variables (only one or two of these policies are required). Regarding collective disputes, there is also variation across countries. For example, three countries have a value of 1 in all four variables, i.e., Indonesia, Singapore, and Viet Nam; the Philippines and Sri Lanka have the same labor market policies regarding collective disputes; and what is legal in Hong Kong, China (nos. 17 and 18) is illegal in Korea and Taipei,China; and vice versa.
Finally, minimum wages (no. 21), as noted above, are mandatory everywhere except in Hong Kong, China; Malaysia; and Singapore. Sri Lanka and Viet Nam have the highest union density (no. 22), while India and Indonesia have the lowest. Among the East Asian economies, Taipei,China has the highest union density.
This brief analysis of the Botero et al. (2003) data set leads to a series of conclusions. First, it appears to be extremely diffi cult to make generalizations about labor market policies. Some countries with different experiences in terms of labor outcomes seem to have similar labor market policies; and vice versa, some countries which on paper are perceived as similar, have different labor market policies. Second, it would seem that some labor market practices impose restrictions on and impediments to the creation of employment. These should be removed. But this does not mean, as stressed above, that overwhelming
labor market reform is needed. Indeed often, discussions about labor market policies single out egregious regulations to argue that regulating labor is detrimental to economic performance. Though the analysis may be showing correctly that excessive severance payments or dismissal criteria impair fi rms’ ability to adjust in a recession, the policy implications are often exaggerated and taken as a call for broad-based labor market deregulation. This is seen, for example, in Heckman and Pagés (2004, p. 88), who conclude their survey of labor markets in Latin America by stating that “further labor reforms offer the promise of promoting both effi ciency and equity.”
The conclusion to this subsection is that the question of whether labor market policies constrain employment growth calls for detailed country analysis with a view to identifying the particular labor market policy or policies (minimum wages, hiring and fi ring restrictions, unemployment benefi ts, etc.) that are the source of controversy and, ultimately, constrain employment generation. What governments have to do is to address these policies.
The next four subsections concentrate on four countries, namely, India, Indonesia, Philippines, and Viet Nam. They discuss in some detail the most important features of labor market policies, in particular the most controversial.45
4.3 Labor Market Policies in India46
Market-oriented structural reforms in India, initiated in the 1980s and intensifi ed in the 1990s, have, according to most accounts, put the economy on a higher growth path.47 Unfortunately, growth in employment in the formal, or organized sector as it is known in India, has been slow (Figure 4.2).48 Formal sector employment grew at approximately 1.4% per annum in the 1980s and at less than 1% in the 1990s.
45 This is based largely on an ongoing research project on labor markets in Asia at ADB.
46 This subsection is based primarily on Anant et al. (2005). 47 Per capita growth in PPP was 1.7% per annum during 1950–1980.
It increased to 3.8% in 1980–2000 (Rodrik and Subramanian 2004).
48 The definition of the formal sector is based on the basis of the definition of the Factories Act of 1948 which stipulates two conditions of size of the establishment (10 or more workers in an establishment using power and 20 or more workers in establishments not using power). The formal sector produces about 40% of domestic output mainly in industry and services in public sector, private corporate sector, and factory manufacturing. Two thirds of it is employed in the public sector (including public administration and defense), the rest working in private corporate sector, registered manufacturing, and recognized educational institutions, etc.
ThemeApRev.indd 46ThemeApRev.indd 46 08/08/2005 11:33:12 AM08/08/2005 11:33:12 AM

47
28.127.225.724.0
311.0334.1
382.8406.8
0
100
200
300
400
500
1983 1988 1994 1999
mill
ions
Formal Sector Employment Labor Force
Figure 4.2: Labor Force and Formal Sector Employmentin India, Various Years
In comparison, the labor force has been growing at about 2% for much of this period, though this growth declined in the late 1990s. With the formal sector employing less than one tenth of the workforce, there is considerable disappointment in the inability of economic growth to generate formal sector jobs, typically the most coveted jobs in India, in anywhere near the numbers desirable.
One of the key factors widely believed to explain the lackluster creation of formal sector jobs, despite reasonably high rates of economic growth, is India’s labor market policies. In particular, it is widely held that formal labor markets in India suffer from serious rigidities, with employers unable to lay off even a single worker without securing the approval of the state. As many reform-oriented analysts and observers of the Indian economy like to point out, while India’s trade and industrial policy regimes have been subject to far-reaching reforms, labor market policies have remained outside the domain of reform due to lack of political consensus.
In the rest of this subsection on India, fi rst, some special aspects of the country’s labor laws are described. Then the focus moves to those aspects of its labor laws that may be inducing rigidities in the operation of labor markets, and the existing evidence on these rigidities is examined. The subsection concludes with a discussion on what the available evidence suggests should be done to reform the labor market.
4.3.1 Legislative and Regulatory Systems Governing Labor
India’s constitution grants to both the central (federal) Government as well as individual state governments the
power of legislating on labor issues. Accordingly, the labor administration and enforcement machinery operate at both the central and state levels. The legislative and enforcement machineries have, however, been disproportionately targeted toward the formal sector, even though the formal sector accounts only for around 7% of the total labor force.
In broad terms, fi ve types of labor legislation cover industrial relations laws, welfare and safety laws, social security laws, wage laws, and special laws for different sectors or categories.49 A few key laws on industrial relations and the use of contract labor are at the heart of the debate over labor law reform.
Industrial Disputes Act 1947
The Industrial Disputes Act (IDA) provides the machinery and outlines the procedures for the investigation and settlement of industrial disputes. Until 1976, its provisions were fairly uncontroversial. The IDA allowed fi rms to lay off or retrench workers due to economic circumstances as long as certain requirements, such as the provision of suffi cient notice, severance payments, and the order of retrenchment among workers (last in fi rst out), were met.50 An amendment in 1976 (in Chapter VB), however, made it compulsory for employers with more than 300 workers to seek the prior approval of the appropriate government before workers could be dismissed. A further amendment in 1982 widened the scope of this regulation by making it applicable to employers with 100 workers or more.
While the IDA does not prohibit retrenchments, critics of the act have argued that it is diffi cult to carry them out. Datta-Chaudhuri (1996) points out, for example, that states have often been unwilling to grant permission to retrench, perhaps for reasons of political expediency.
The Trade Union Act
The Trade Union Act (TUA) facilitates unionization in both the formal and informal sectors and allows any seven workers in an enterprise to form and register a labor union. The law is supported by the constitutional right of
49 Since gaining independence in 1947, there has been a proliferation of labor legislation of many kinds leading to a situation where there are now 47 central labor laws and no less than 200 state-level laws. This has led to severe problems of definition and incompatibilities, administrative overlap and inefficiencies, and a judicial nightmare.
50 In India’s legal terminology, the term layoff refers to a temporary or seasonal dismissal of a group of workers due to slackness of current demand. Retrenchments denote permanent dismissals of a group of workers.
Source: Dyson et al. (2004); Planning Commission (2001), cited in Anant et al. (2005).
ThemeApRev.indd 47ThemeApRev.indd 47 08/08/2005 11:33:13 AM08/08/2005 11:33:13 AM

48 Key Indicators of Developing Asian and Pacific Countries
freedom of association.51 The right to register a union does not, though, mean that the employer must recognize the union. There is in fact no India-wide law that provides for recognition of labor unions; consequently, there is no legal compulsion for employers, even in the formal sector, to bargain collectively.52
Industrial Employment (Standing Orders) Act
Provisions for job security among individual workers come, additionally, from the operation of the Industrial Employment (Standing Orders) Act. This act requires all employers with 100 or more workers (50 in certain states) to specify to workers the terms of their employment. While the act seeks to make labor contracts complete, fair, and legally binding, it has some features that may interfere with quick adjustments to changing conditions. In particular, workers’ consent is required to modify job descriptions or to move workers from one plant to another, in response perhaps to changes in the market. The problem, according to some analysts, is that the workings of India’s TUA make it diffi cult to obtain such consent. Since the TUA has no provisions for union recognition (for example, via a secret ballot), the result has been multiple unions (within the same establishment) with rivalries common across unions so that a requirement of workers’ consent for enacting changes “can become one of consensus amongst all unions and groups, a virtual impossibility” (Anant 2000, p. 251).
Contract Labor (Regulation and Prohibition) Act 1970
The Contract Labor (Regulation and Prohibition) Act aims at regulating the employment of contract labor in certain establishments. It also provides for the abolition of contract labor in certain circumstances. Section 10 of the act empowers the appropriate government authority to abolish contract labor after consultation with an advisory board in any work that is carried out in the establishment and that is of a perennial nature, and that is carried out by regular workers in the same or similar establishment.
51 Readers may note that Table 4.5 in the previous subsection, based on the work of Botero et al., codes “the right to unionization” (as measured by the protection provided by a country’s constitution to the right to form labor unions) with a zero value for India. While such a coding may be technically correct, the Trade Union Act and the constitutional right on freedom of association indicate that India’s workers enjoy legislative backing to form trade unions.
52 In practice, however, the course of collective bargaining was influenced by the recommendations of the Fair Wage Committee of 1948 regarding the concepts of minimum, fair, and living wages. These three wage levels were defined and it was pointed out that all industries must pay the minimum wage and that the capacity to pay would apply only to the fair wage, which could be linked to productivity. This gave a boost to collective bargaining; many formal sector trade unions achieved reasonably satisfactory indexation and a system of securing an annual bonus.
The act was designed to protect contract workers from exploitation. Its chief aim was to regulate and, only in certain instances, abolish contract labor. The act, however, has given rise to several industrial disputes over the question of regularization of contract labor.
4.3.2 Is Labor Legislation Constraining Formal Sector Employment?
There are three major effects that are presumed to result from the “rigidities” induced by the combined operation of the above legislation.
Employment Effect. Recent studies have argued that labor market rigidities, induced by labor legislation that effectively guarantees employment security, have hindered employment growth in the formal sector, since fi rms have a strong disincentive to hire additional workers who cannot be laid off easily (see, for example, Fallon and Lucas 1991).
Labor Substitution Effect. Disincentives for hiring workers lead fi rms to gravitate toward capital-intensive production processes and sectors. As a result, there is an artifi cially induced substitution of abundant labor by scarce capital (see, for example, Datta-Chaudhuri 1996).
Industrial Disputes Effect. By strengthening the bargaining power of formal sector labor and/or by increasing the discretion given to the Government in decisions pertaining to industrial disputes, India’s labor legislation can raise the level of occurrence of industrial disputes (see, for example, Besley and Burgess 2004).
What is the empirical evidence for this? While several studies have found evidence of a negative impact of these laws, other studies have contested their results. See, for example, the detailed discussion in Bhalotra (1998) on the fi ndings of Fallon and Lucas (1991).
A recent study whose results appear to be more robust than earlier studies is that of Besley and Burgess (2004), who exploit state-level amendments to the IDA over 1958–1992, and code legislative changes across major states as either pro-worker, neutral, or pro-employer. These legislative amendments are then used in a regression analysis of a variety of outcomes in the formal manufacturing sector, including employment outputs and investment. Consistent with expectations of reformers, Besley and Burgess fi nd that pro-worker labor regulations have had a negative impact on employment, output, and investment in formal manufacturing. The impacts can be large. A case in point is that of the state of West Bengal. Besley and Burgess’ results indicate that, had West Bengal not passed any pro-worker amendments, formal employment in its manufacturing
ThemeApRev.indd 48ThemeApRev.indd 48 08/08/2005 11:33:16 AM08/08/2005 11:33:16 AM

49
sector would have been 23% higher than its 1990 level, and formal manufacturing output would have been 24% higher.
Besley and Burgess’ results suggest that there may be large gains from legislative changes that make the IDA more employer friendly. Several points still need to be kept in mind, though. First, a puzzling feature of Besley and Burgess’ results is that pro-worker legislative amendments are not found to raise workers’ wages. The possibility that this fi nding is the result of some methodological weaknesses in the study cannot be ruled out. Similarly, reading off directly from legal statutes to measure rigidities as Besley and Burgess have done could be misleading. The effect of laws is translated into labor market outcomes indirectly through a range of intermediate factors such as the enforcement environment, background rules, and cultures of governance and compliance. Changes in these intermediate factors could very easily defl ect or nullify the presumed effect of statutes.53
Second, and more relevant from the standpoint of policy reform issues today, is that it is far from clear how much impact labor laws have had since the early 1990s. While there has been much verbal support from many policy makers for changes in labor laws, the necessary legislation for diluting the IDA in particular has not been introduced as the political consensus is lacking. However, the introduction of the National Renewal Fund in the 1990s for fi nancing a voluntary retirement scheme in public sector enterprises may well have legitimized layoffs and retrenchments in the formal private sector. Though the labor laws themselves remain unchanged, their enforcement appears to have been substantially diluted as the Government appears to have shown gradually less enthusiasm for enforcing them (Anant et al. 2005).
Why would the Government let up on enforcement? The dirigiste development policies followed by India’s Government until the 1990s functioned through a web of mutually interrelated policies. The private sector was assured returns via policies limiting entry and competition from trade. In return, it was expected that employers would “protect” employment by respecting labor legislation. With the Government committed to trade and industrial liberalization from the early 1990s, it has appeared to dilute, in a de facto sense, the labor laws given the heightened competition that Indian industry became exposed to.
Box 4.3 summarizes the results of a study that are consistent with such an interpretation. Further supporting
53 See the discussion in Hasan et al. (2003) on evidence suggesting that the actual operation of labor market policy—taking into account issues of enforcement, in particular—could be different from what stated policy would suggest in some states.
evidence comes from the trend of increasing usage of contract labor in not just private enterprises, but also public sector enterprises. In the latter, contract labor as a proportion of total employment remains small, but increased from 2.9% in 1986 to 10.9% in 1998. Moreover, there has been a sharp decline in the number of person-days lost due to strikes and lockouts since the early to mid-1980s (Figure 4.3). Given the strong state involvement in shaping industrial relations, it might be hypothesized that shifts in the mindset with which government offi cials have approached regulations have had a big role to play in explaining recent trends in this decline.
Finally, and perhaps most important, it would be overstating the case if the weak growth in formal employment were attributed entirely to rigidities stemming from labor market policy. A large part of the explanation also has to do with the rigidities in other dimensions of industrial and economic policy. Anant and Goswami (1995) provide a detailed case study, which brings out the interplay of rigidities in banking, land, and labor laws, and industrial licensing leading to industrial sickness, especially for large plants (1,000 or more employees). While some of these rigidities have been dealt with over the last decade or so, many unreformed areas remain, including barriers to exit due to defi ciencies in insolvency laws.54
In addition, impediments to the development of the formal sector and formal manufacturing, in particular, are likely to arise from weaknesses in infrastructure, inappropriate reservations for small-scale enterprises, and fragmented, localized markets for goods. The effect of these impediments has been to constrain growth of investment, output, and employment in the formal sector. Indeed, a detailed examination of the industrial landscape in India, and a comparison with other countries, led Lewis (2004) to conclude that it would be incorrect to pin too much blame on India’s labor laws for the lack of dynamism in industry given the many barriers to product market competition and infrastructure-related defi ciencies that exist in the country.
In summary, while India’s labor laws on industrial relations do indeed need reform, one cannot overemphasize the importance of complementary reform on other fronts. The demand for reform of labor laws needs to take into
54 The weakness of the regime has meant that firms are effectively prevented from closing down, so locking up valuable assets in long drawn out court proceedings. This delay hurts workers as their wages are subject to court orders, and the inability to recover loans raises the cost of lending to enterprises. Once again, the greater burden of this is put on larger corporate enterprises as smaller entities are not subject to the vagaries of this procedure. As part of the ongoing reform agenda, the law was amended in 2002 but its implementation is still held up on account of litigation.
ThemeApRev.indd 49ThemeApRev.indd 49 08/08/2005 11:33:17 AM08/08/2005 11:33:17 AM

50 Key Indicators of Developing Asian and Pacific Countries
Figure 4.3: Working Days Lost from Strikes and Lockouts, India, 1961–2002
0
0.5
1.0
1.5
2.0
2.5
3.0
3.5
Days lost due to strikes per organized sector worker
Days lost due to lockouts per organised sector worker
Total days lost per organised sector worker
1961 1963 1965 1967 1969 1971 1973 1975 1977 1979 1981 1983 1985 1987 1989 1991 1993 1995 1997 1999 2001
The impact of trade liberalization on workers in developing countries has been the subject of a number of studies in recent years. While many of them have examined whether trade liberalization hurts or benefits unskilled workers relative to skilled workers, a few have looked at the impact of trade liberalization on labor demand elasticity—in other words, how responsive labor demand is to changes in wages. Some scholars have argued that greater openness to trade makes labor demand more responsive to changes in wages (see, in particular, Rodrik 1997). They maintain that since greater openness makes it easier to import all kinds of goods—capital inputs, finished goods, and intermediate goods—it can make it easier to substitute the services of domestic workers via the import of capital inputs and/or the products they were producing.1 For any given increase in wages, more elastic labor demand would lead to a larger reduction in labor demand than otherwise. In this way, trade liberalization can erode the bargaining power of workers vis-à-vis the owners of capital in the sharing of profits. It can also lead to workers bearing a greater burden of the impact of nonwage labor costs (such as improved working conditions).
Hasan et al. (2003) use industry-level panel data from India’s formal manufacturing sector along with industry-specific information on average tariff rates and nontariff barrier (NTB) coverage ratios
to examine whether India’s trade liberalization, begun in earnest in 1991, has made the demand for labor more elastic. They find that estimates of labor demand elasticity are larger after 1991 and larger in industries with lower tariff rates and/or NTB coverage ratios. For example, a reduction in average tariff rates from 150% (1988) to 40% (1997) would be associated with an increase of 9–13% in labor demand elasticities, depending on model specifics.
Significantly, Hasan et al. also find that the share of the wage bill in either total output or value added is lower in the more open trading environment after 1991, and is lower in industries that have lower barriers to trade. For example, controlling for industry and location (via the introduction of industry-location fixed effects), their estimates of labor share equations suggest that labor shares would decline by around 4% (as a share of total output) and 5% (as a share of value added) for a reduction in tariffs from 150% to 40%.
These results are consistent with the argument that workers in India’s formal manufacturing sector have seen their bargaining power weaken as a result of trade liberalization. This is despite the fact that, crucially, domestic labor laws have not changed on paper—though there is evidence of weaker enforcement.
Box 4.3: Liberalization and its Impact on Workers in Formal Manufacturing
1 Trade can also render more elastic the demand for the fi nal goods that workers are making. In turn, this would lead to a more elastic demand for labor.
Source: Hasan et al. (2003).
Source: Anant et al. (2005).
ThemeApRev.indd 50ThemeApRev.indd 50 08/08/2005 11:33:18 AM08/08/2005 11:33:18 AM
51
account the following two main points. First, efforts to reduce labor market rigidities stemming from the labor code should focus on those elements of the labor code that are actually important in causing rigidities. This, for example, would require dealing specifi cally with Chapter VB of the IDA and introducing provisions for union recognition in the TUA. Attempts at introducing labor market fl exibility by a much more broad-based attack on labor laws—as appears to have been tried in pushing through the recent Special Economic Zones (SEZ) Bill—are unlikely to succeed for political reasons; they are probably also unnecessary. Among other things, Section 50 of the SEZ Bill, introduced in May 2005, would have given India’s states the power to exempt SEZs from the operation of a whole gamut of labor-related legislation, including laws relating to “trade unions, industrial and labour disputes, welfare of labour including conditions of work, provident funds, employers’ liability, workmen’s compensation, invalidity and old age pensions and maternity benefi ts” (draft of SEZ Bill, 2005). After considerable debate in Parliament, the Bill was only passed after Section 50 had been dropped altogether.
Second, the call for labor reforms needs to be broadened from its current emphasis on the rigidity-inducing effects of the labor code. In particular, the current debate has put other key issues on the back burner, such as the strengthening of social protection institutions to provide more effective and effi cient coverage, not just for formal sector workers but also for workers in the informal sector.
4.4 Labor Market Policies in Indonesia
Labor market policies have undergone a dramatic change since the economic crisis of 1997 and the ensuing political changes in 1998 during which President Suharto’s rule gave way to democratically elected governments. Labor market policies and institutions have moved sharply in the direction of stronger workers’ rights and the protection of their welfare, and most observers have welcomed the broad thrust of the new policies. However, some observers are concerned that particular elements of the new policies may be harmful for Indonesia’s investment climate and employment generation in the formal sector.55
Prior to the crisis, labor markets in Indonesia operated under conditions of labor repression (though not necessarily wage repression). Interestingly, labor market policies were, in theory, protective of workers’ welfare, at least by the standards of neighboring countries (Manning 2004a). Their pro-worker nature was the result of laws introduced in the 1950s and 1960s (prior to President Suharto’s rule),
55 The term formal employment used here does not include casual wage employment.
which were partly based on labor policies operating in the Netherlands at the time. However, under Suharto’s rule the implementation of labor laws was diluted through tight control of organized labor—from 1973 until 1998 workers could join only one offi cial labor union with close links to the ruling party. The practice of using the police and military to clamp down on strikes, and the fact that many labor inspectors and offi cials were on the payroll of private companies further diluted the protection provided to workers under the law (Manning 2004a).
The emergence of democratic rule in 1998 led to signifi cant changes both to labor market policies and to their implementation. The two main pieces of legislation that embody the changes are the Trade Union Act of 2000 and the Manpower Protection Act of 2003. The scope of the latter is particularly broad and addresses labor concerns in both large and small enterprises. The issues covered include the terms of employment for children, women, and foreign workers; wages and the conditions of work; contract employment; dismissals; collective bargaining; and the settlement of grievances (Manning 2004a).
4.4.1 Labor Unions
The right of workers to organize and establish their own unions has been codifi ed through the ratifi cation of ILO’s Freedom of Association Convention (No. 87) and, perhaps more signifi cantly, through the Trade Union Act of 2000. The latter allows labor unions with membership as low as 10 workers, and provides the conditions and rules for the operation of multiple unions and establishments.
4.4.2 Minimum Wages
Minimum wage regulations have been around for some time in Indonesia, though for many years they were largely symbolic (Rama 1996). In the early 1990s, minimum wages doubled in real terms. Although domestic concerns at the possibility of labor unrest were a factor in giving minimum wage regulations more teeth, international pressure played an important role. In particular, pressure was brought to bear by union members and consumers in the US, resulting in complaints fi led under the Generalized System of Preferences, which ultimately would have deprived Indonesia of the low tariffs it carried on its exports to the US (Rama 1996). An additional threat was the withdrawal of investment guarantees to US companies interested in operating in Indonesia.
In the post-Suharto era, it is primarily domestic forces that have strengthened minimum wage regulations, in terms not only of raising the levels at which minimum wages are set but also of improving compliance. Minimum wage increases are depicted in Figure 4.4. That minimum wages
ThemeApRev.indd 51ThemeApRev.indd 51 08/08/2005 11:33:20 AM08/08/2005 11:33:20 AM

52 Key Indicators of Developing Asian and Pacific Countries
Mon
ths
of P
ay
30
25
20
15
10
5
0Less than one year
3 Years 5 Years 10 Years 20 Years Maximum
Years of Service
1986 1996 2000 2003
Figure 4.5: Legally Payable Severance, Number of MonthsPay by Years of Service, Indonesia, 1986–2003
250
200
150
100
50
01992 1994 1996 1998 2000 2002
JakartaBandung
SurabayaIndonesia
Figure 4.4: Real Minimum Wages in Indonesia and its Major Industrial Centers, 1992–2002(Rp’000 per month, in 1996 prices)
are now more binding is suggested by SMERU (2001), which notes that minimum wages are not well below average wages as they used to be for most of the Suharto era, and that actual wages are more closely bunched around minimum wages than they used to be.
4.4.3 Severance Pay
Severance pay has been part of Indonesia’s labor code since well before the crisis of 1997, similar to the case of minimum wages. The country has in recent years experienced both an increase in severance pay rates and more efforts at improving compliance. Figure 4.5 shows how severance pay (in terms of months of pay) varies by years of service as per not only most recent regulations passed in 2003, but also as early as 1986. As can clearly be seen, sharp increases in severance pay have been instituted for workers who have put in 3 years of service, and even more so for those with 10 years or more of service.
Indonesia’s severance pay rates are high relative to other economies in the region. (This can also be seen from Tables 4.4 and 4.5 above. As the data relating to row nine and row ten reveal, severance pay—expressed in weeks of pay required for laying off a worker with at least 3 years of service—and the costs of fi ring workers—in terms of the ratio of the new wage bill, inclusive of all costs of fi ring associated with laid-off workers, to the old wage bill—are the highest in Indonesia among the economies in the table.)
4.4.4 Contract Workers
To reduce their exposure to severance payments associated with the termination of regular workers, employers may hire workers on a contract basis. Indonesia’s Manpower Protection Act of 2003 provides the terms and conditions of contract work and outsourcing, and in these areas the act’s provisions appear to be fairly similar to those in other countries.
4.4.5 Main Concerns with the New Labor Market Policies
As noted above, some elements of Indonesia’s new labor market policies have raised concern among analysts and policy makers. The concern needs to be understood in the context of the economic crisis of 1997 and economic and labor outcomes since then.
Until 1997, Indonesia’s economy was among the faster growing in both the region and the developing world. Economic growth of 5–9% over a period of 25 years had brought signifi cant gains to workers and the population more widely. Poverty rates declined dramatically from the 1980s to 1997, and a steadily growing share of Indonesia’s labor force made the transition from agriculture to higher productivity jobs in industry and services. The share of workers in agriculture declined fairly constantly from around 55% in 1990 to 40.7% in 1997. Over this period, industry saw its share of the workforce increase from 14% to 19%.
Source: Manning (2004b). Source: Manning (2004a).
ThemeApRev.indd 52ThemeApRev.indd 52 08/08/2005 11:33:20 AM08/08/2005 11:33:20 AM
53
After a severe economic contraction in 1998 and a mild contraction in 1999, Indonesia’s economy started recovering in 2000. Growth rates of per capita GDP have, however, been low, in the range of 2–4.6% between 2000 and 2004. Investment, a key driver of growth prior to 1997, has been around 16% of GDP in recent years, down from around 30% in the 10 years before 1997. Signifi cantly, the weak economic recovery has been associated with a growing increase in the share of agriculture in total employment, a decline in the share of industrial employment, and an increase in informal work (defi ned here in terms of a growing share of self-employed and unpaid family workers).
Several factors are responsible for the weak recovery and unfavorable labor outcomes just described. These include the dramatic changes in the political sphere, the ensuing uncertainties, and, some have argued, specifi c elements of the new labor code adopted since 1998. The argument made is that the large increases in minimum wages and severance pay, coming at a time of weak economic growth and investment, infl ated the costs of business and reduced the demand for formal employment. A survey of manufacturing enterprises found, for example, that 23% of managers reported labor market policies to be a major or severe constraint to their operations and growth (ADB 2005a). With regards to the impact on formal employment, Bird and Manning (2002) have used province-specifi c labor force data for 1990–2000 to examine the impact of minimum wages on the allocation of employment between the formal and informal sectors in urban areas. Controlling for regional GDP and the size of the working-age population, they fi nd higher minimum wages to be signifi cantly associated with a larger share of informal sector employment (and a smaller share of formal employment) after 1997. The authors interpret their fi ndings as indicating that higher and binding minimum wages have led employers to hire fewer workers in the formal sector than they would have otherwise.
Concerns over the impact of the minimum wage policy have also been raised on account of decentralization (which started in 2001), as minimum wages are now set by regional governments, which may not always follow standard criteria for setting them. This can lead to arbitrary differences in minimum wages across regions.
Finally, Manning (2004a) has raised the possibility that fi rms have been less likely to hire new workers given that it is more costly to retrench them if the need arises. These adverse impacts are arguably largest in labor-intensive sectors. Manning has also questioned the logic
of limiting outsourcing activities, especially in industries such as garments where fi rms often outsource orders to households at times of peak demand. In this case, he argues, the economics of outsourcing are so compelling that both fi rms and workers have incentives to evade the law. The key benefi ciaries may be labor inspectors and offi cials who receive bribes for looking the other way.
These concerns indicate that further and more detailed study on the new regulations governing minimum wages and severance pay, in particular, is required. If these are indeed constraining the growth of formal sector employment, then some reform on the specifi c regulations and the manner in which they are enforced, especially in the context of decentralization, is needed.
At the same time, it is crucial to emphasize that these elements of Indonesia’s new labor regulations cannot be the only elements that are constraining the growth of formal sector employment. In fact, available data suggest that factors other than labor regulations are of greater importance. In the fi rst place, the survey of manufacturing enterprises described above found macroeconomic instability, policy uncertainty, corruption, current tax rates, and costs of fi nancing to be listed more often than labor regulations as major or severe constraints to their business (ADB 2005a). Second, and in a related vein, Indonesia’s business regulations can by no means be absolved of blame. A World Bank study of such regulations from around the world shows that procedures for starting and closing a business in Indonesia are among the most cumbersome in Asia (World Bank 2004b). Of the 15 DMCs covered by the study, the number of days it takes to start a business was 151—the highest—compared with 41 days in the PRC, and only 8 days in Singapore (the lowest in Asia). Similarly, the time it takes to close a business due to bankruptcy was estimated to be as high as 6 years (the second highest in Asia after India). The corresponding periods for the PRC and Singapore (again the lowest) are 2.4 years and 0.8 year, respectively. Finally, a widely used indicator of governance developed by Kauffman et al. (2003) shows a deterioration of the quality of governance in Indonesia on fi ve out of six dimensions between 1996 and 2002.
Taking all of this other evidence into account, the conclusion that may be drawn is that, while certain elements of new labor regulations may reduce formal fi rms’ incentives to hire, other factors—ones that a large-scale survey of fi rms’ managers themselves list as more important—are constraining the expansion of the formal sector. It is these other factors that are especially important in dragging down investment and employment in the formal sector.
ThemeApRev.indd 53ThemeApRev.indd 53 08/08/2005 11:33:23 AM08/08/2005 11:33:23 AM

54 Key Indicators of Developing Asian and Pacific Countries
4.5 Labor Market Policies in the Philippines56
The Philippines is one of the Asian countries where unemployment has increased in recent years, and yet the country has achieved signifi cant growth. Today, around 4 million workers are unemployed (about 12% of the total labor force) and another 5 million are underemployed (around 17% of those employed). This is a refl ection of what happens in the rest of the economy, in particular of its incapacity to provide jobs (especially in the formal sector) for the country’s growing labor force.
To be precise, the problem of the Philippines is not “jobless growth”—if only because the country does generate employment. Rather, the pressing problem is on the supply side, namely, that the labor force is growing faster than the number of jobs created. In 2004, for example, the economy created 977,000 jobs (in net terms), while there were 1,289,000 new entrants. This implies that the system added 312,000 new unemployed to the already high level of unemployment. This is happening in a country in which GDP in 2004 grew by 6.1%.
Given the magnitude of the problem, in 2004, when the Government unveiled its Medium-Term Philippine Development Plan (MTPDP) for 2004–2010, the administration openly acknowledged the issue and set the target of creating about 1.5 million jobs a year by 2010, for a total of about 10 million jobs (60% in the services sector) (NEDA 2004). Certainly, the problem has been acknowledged for a long time. Indeed, the 2001–2004 MTPDP recognized that output growth does not guarantee employment growth. It stated that “the employment policy challenge to the Macapagal-Arroyo administration […] is to formulate effective strategies and identify employment-generating lead sectors under a unifi ed policy framework to promote decent and productive employment for every Filipino worker as a means to alleviating poverty. Employment generation shall be enhanced through the modernization of agriculture, the strengthening of information and communications technology (ICT) and the revival of tourism” (NEDA 2001). The MTPDP 2004–2010 emphasizes the acceleration of economic growth, job creation, energy sector reform, support of social justice and basic needs, provision of education and better opportunities for young people, and good governance and anticorruption programs.
The policy and legal framework covering the labor sector is embodied in the 1987 Constitution, the 1974 Labor Code, and other executive policy instruments. They are implemented by the Department of Labor and
56 This subsection is based on Felipe and Lanzona (2005).
Employment. The Labor Code promotes tripartism, defi ned as the interaction between the state, employers, and labor as social partners in the development of industrial relations policies that seek solutions to issues of common concern.
The Labor Code (amended several times) can be divided into two parts. First are the employment laws that govern individual employment contracts, determining the compensation, the length of trial periods, and the conditions of part-time work. The Government regulates employment relationships by restricting the range of feasible contracts and by raising the costs of both laying off workers and increasing hours of work. These regulations seem to favor full-time, indefi nite contracts, over short-term, fi xed-term, or temporary contracts. As a form of worker protection, the labor code mandates a minimum advance notice period prior to termination, specifi es which causes are considered justifi ed reasons for dismissal, and establishes compensation to be awarded to workers, depending on the reason for termination. However, temporary contracts can be terminated at no cost once they have expired. To prevent fi rms from exclusively hiring workers on temporary contracts, the use of such arrangements is restricted. The labor code also imposes a limit of 6 months to test and dismiss a worker at no cost if his or her performance is considered unsatisfactory.
The second category is the collective or industrial relations laws. These regulate the bargaining, adoption, and enforcement of collective agreements; the organization of labor unions; and industrial action by workers and employers. In order to counteract the power of employers against workers, the Government empowers labor unions to represent workers collectively, and protects particular union strategies in negotiations with employers. These laws thus govern the balance of power between labor unions, employers, and employers’ associations. The collective laws of the Labor Code effectively allow workers to play a part in the contract negotiation process, particularly in the area of compensation, through their participation in collective bargaining agreements (CBAs) and in the arbitration process.
The Labor Code was conceived primarily with a view to distributing the rents that employers supposedly gain from the various types of trade policy protection measures existing at the time. However, as trade restrictions were dismantled, the rigidity introduced by these laws has been questioned, and the law itself has been modifi ed to more adequately refl ect supply and demand in the labor market. The question often debated is whether a supposedly restrictive labor market hampers new investment and the creation of employment. In particular, three key labor market policies seem to create diffi culties (binding constraints) for employers. The fi rst deals with labor
ThemeApRev.indd 54ThemeApRev.indd 54 08/08/2005 11:33:24 AM08/08/2005 11:33:24 AM

55
relations and the protection of permanent and unionized workers. The second refers to the laws relating to labor contracts. Two articles, in particular, are the source of contention. One refers to the restrictions to subcontracting arrangements (Article 106); the other refers to the security of tenure that has to be granted after a probationary period of 6 months, after which time the employer must offer a permanent employment out of which it is very diffi cult, but not impossible, to release workers. The third potentially problematic labor market policy is the one that guarantees a minimum wage.
4.5.1 Labor Relations
The Labor Code provides workers with various rights, including the right to organize (Article 234), the right to set CBAs with employers (Article 253A), and the right to stage strikes, pickets, and lockouts (Article 263). These rights are accompanied by procedural mechanisms, restrictions, and limits to allow both employers and workers time to discuss and to resolve workplace issues. In particular, Article 260 stipulates that parties engaged to a CBA must establish “a machinery for the adjustment and resolution of grievances arising from the interpretation of their CBA and those arising from the interpretation of enforcement of company personnel policies.” In addition, Article 264 enumerates the prohibited activities of workers pertaining to the staging of strikes, pickets, and lockouts. In these articles, the role of the Government is limited to the monitoring and evaluation of labor organizations, CBAs, grievance machineries, and strikes in order to assure both workers and employers that the provisions of the Labor Code are consistently followed. In sum, these articles form the basis of the tripartite system that the state espouses for creating the proper resolution of labor-employer confl icts.
Teodosio (2001, p. 140), corroborating Freeman’s (1993, p. 138) view of the tripartite pacts—namely, that they are not easy to institute or implement—indicates that while collective agreements are constantly forged, the tripartite system has failed to deliver employment, job security, and effective enforcement of the labor law. In reality, attempts to discuss issues relating to the tripartite system usually become caught up in the larger question of the system’s inability to close the gap between policy statements and practice in a society that is divided. The result, in her view, is that “contentious problems were intensifi ed rather than resolved” (Teodosio 2001, p. 140). This divergence of views is clear, for example, in discussions of the so-called “social clauses.”
Organized labor in the Philippines has been relatively weak. In 1986, it was estimated that about 2.3 million Filipinos were part of the union movement, accounting for approximately 25% of the salaried workforce or 12% of
the total labor force (Figure 4.6). In 2001, about 4 million workers belonged to a labor organization, accounting for about 26% of the total number of salaried workers, and 13% of the total labor force. These workers were organized into about 10,000 unions, only one fi fth of which were connected to a national union or federation. The importance of these labor unions is refl ected in the way they are able to infl uence wages and CBAs.
4.5.2 Employment Arrangements
Subcontracting is the most common form of fl exible labor arrangement in the Philippines, together with agency hiring and the use of homeworkers. Many fi rms in the Philippines hire nonregular workers or subcontract some of them to meet short-term demand. The resort to fl exible labor arrangements by many companies has promoted high worker turnover and discouraged unionism. Subcontracting, however, is only legitimate if any one of the following conditions is satisfi ed (Article 106):57
• the contractor or subcontractor carries on a distinct and independent business from that of the main fi rm;
• the contractor or subcontractor has substantial capital or investment; or
• the agreement between the principal and the contractor or subcontractor assures the contractual employees entitlement to all occupational safety and health standards, free exercise of the right to self-organization, security of tenure, and social and welfare benefi ts.
57 This specific definition of legitimate subcontracting does not appear in Article 106. It was downloaded from a government website, http://www.gov.ph/faqs/labor_contract.asp. Here it is explained that the Labor Code does not contain a specific definition of subcontracting.
0
5
10
15
20
25
30
35
% to Total Wage and Salary Workers % of Total Number of Workers
Figure 4.6: Memberships in Labor Organizations,Philippines, 1980–2001
%
1980 1984 1988 1992 1996 2000
Source: Bureau of Labor and Employment Statistics, Philippines (various years b).
ThemeApRev.indd 55ThemeApRev.indd 55 08/08/2005 11:33:25 AM08/08/2005 11:33:25 AM

56 Key Indicators of Developing Asian and Pacific Countries
The law guarantees Philippine workers security of tenure (Article 279) after a probationary period of 6 months (Article 281). As said above, once this is granted, it is diffi cult, but not impossible, to release workers. By virtue of these legal provisions, security of employment is given to a probationary worker after 6 months and confers to him or her all the guarantees and various benefi ts, including membership in labor unions and freedom from dismissal except for just cause. Unfortunately, an employer often has many reasons for wanting to remove workers, mainly for economic reasons related to the survival of the fi rm in the market. In a globalized economy, these laws may prevent fi rms from responding immediately to the unexpected fl uctuations in the world market.
The problem with such regulations, as Sicat (2004) points out, concerns the legal requirement to grant job security to regular employees. Because of this, it seems that the Government interferes with the prerogatives and judgment of management and with the working of the labor market, making it diffi cult for employers to dismiss or to end employment of workers.
The law, however, allows employers to terminate a regular employee if the employer can present justifi able reasons or if economic conditions make termination necessary. Article 282 of the Labor Code lists the following as “just causes” for termination: (i) serious misconduct by the employee in connection with his/her work; (ii) willful disobedience by the employee; (iii) gross or habitual neglect by the employee of his duties; (iv) fraud or willful breach of the trust reposed on the employee by the employer; (v) commission of crime or offense by the employee; and (vi) analogous causes to the foregoing, such as gross ineffi ciency, violation of company rules and abandonment of work. Article 283 of the New Labor Relations Law of 1989 allows the employer to terminate the employment of any employee due to: (i) installation of labor-saving devices; (ii) redundancy; (iii) retrenchment to prevent losses; and (iv) the closing or cessation of operation of the establishment or undertaking. However, the system requires that the company justifi es to the department of labor its decision, a process that may be very costly. Because of this, short-term subcontracting has become a feasible and practical option.
Moreover, the theoretical interference in the labor market may not necessarily be as restrictive as it seems on paper. First, according to a survey of nonregular workers—i.e., contractual workers, casual workers, commission-paid workers, part-time workers, and pakyao workers (who are remunerated based on a specifi c task)—by the Bureau of Labor and Employment Statistics (Table 4.6), there has been a steady increase in the use of nonregular workers, from 21% to 28%. Second, the table indicates that there are
other types of contracts, other than subcontracting, that are available to the fi rms. These include piece-rate workers, who are paid based on some particular output; or pakyao workers. In effect, there exists some leeway for fi rms to hire nonregular workers. Third, in 1997, nonregular employment stood at 808,000, representing 28.2% of the total 2.9 million employed in establishments with 10 or more workers. By category, around half were contractual workers. This indicates that, in practice, the Labor Code is not much of a hindrance since it allows individual fi rms to contract directly with individual workers for the purpose of meeting some specifi c requirements that fi rms may have. The dismissal of workers is not, therefore, considered a matter of national concern by either fi rms and workers. Rather, it belongs to the area of negotiation that may be developed between labor and management at the fi rm level.
Table 4.6: Nonregular Workers in Establishments Employing 10 or More Workers, 1991–1997 (’000)
Type of Worker 1991 a 1992 1993 1994 1995 1996 1997 b
Total Employment 2,292 2,504 2,561 2,493 2,692 2,606 2,865
Nonregular Workers 470 514 547 505 672 630 808
Contractual Workers 161 250 250 197 319 320 401
Commission-Paid Workers 163 90 129 135 143 119 170
Casual Workers 95 102 87 108 119 108 134
Part-time Workers 34 37 46 37 48 51 63
Task or Pakyao Workers 17 35 35 28 43 32 40
Nonregular Workers in Total Employment (%) 20.51 20.53 21.36 20.26 24.96 24.17 28.20
a Excludes agriculture, fisheries, and forestry. b The Survey of Specific Groups of Workers was terminated in 1998.
Source: Bureau of Labor and Employment Statistics, Philippines (various years a).
Figure 4.7 shows that the increase in part-time employment continued increasing, and in 2003 affected 11,311,000 workers. The number of full-time workers has also increased, but only marginally, and in 2003, 18,845,000 workers were in this category.
Apart from reduced work time and nonregular jobs, labor fl exibility can also be seen in the number of establishments resorting to closures, layoffs, and job rotation. Between 1997 and 1999, 4,955 fi rms resorted to closure and retrenchment. This affected a total of 209,072 workers over the 3 years. A survey undertaken in 1990 by the Philippine Institute for Labor Studies on the extent of labor fl exibility concluded that about two thirds of the respondent establishments employed nonregular workers (Sardaña 1998, p. 72). Overall, this evidence seems to suggest that companies are given enough fl exibility in determining employment.
ThemeApRev.indd 56ThemeApRev.indd 56 08/08/2005 11:33:26 AM08/08/2005 11:33:26 AM

57
02,0004,0006,0008,000
10,00012,00014,00016,00018,00020,000
Part-Time Workers Full-Time Workers
Figure 4.7: Number of Part-Time and Full-Time Workers,Philippines, 1991–2003 (’000)
1991 1993 1995 1997 1999 2001 2003
These broad criteria are then translated by the National Wages and Productivity Commission into 11 specific criteria, which are:
• demand for living wages, • wage adjustment vis-à-vis the consumer price index, • cost of living and changes therein, • needs of workers and their families, • need to induce industries to invest in the countryside, • improvements in the standards of living, • prevailing wage levels, • fair return on the capital invested and capacity to pay of
employers, • effects on employment generation and family income, • equitable distribution of income and wealth, and • productivity.
The frequency of the adjustments is not usually more than once every year (usually in October–December). Adjustments are often made as a response to above-normal increases in petroleum prices or basic necessities, such as rice. The regional boards are also authorized to exempt certain firms from paying the minimum wages. These will often include new establishments, distressed firms, and establishments with fewer than 10 workers.
4.5.3 Minimum Wage Setting Process
Minimum wages in the Philippines are determined by two agencies, the National Wages and Productivity Commission and the Regional Tripartite Wage and Productivity Boards (Box 4.4).58 The latter determine and fi x minimum wage rates applicable in their regions, provinces, or industries subject to the guidelines set by the former. The National Wages and Productivity Commission reviews the regional minimum wage rates to determine whether these are
58 Article 127 of the Labor Code pertains to minimum wages.
in accordance with prescribed guidelines and national development plans. Minimum wages are set for different occupations and for 16 different regions.
The setting of minimum wages for sectors and regions leads to a number of complications. The fi rst is the plethora of different wages around the country, inducing perhaps greater mobility toward the urbanized regions. Because minimum wage rates tend to be higher in urban areas, migration to the National Capital Region and other large urban areas is an unintended outcome of this mechanism. The second is that wage adjustments always attempt to restore real wages and take into account some other considerations (such as fair return on capital invested). Thus, by keeping real wages more or less constant, the system disregards the fact that relative wages may have changed, for example due to variations in factor endowments. However, it has never been clear why different industries require different minimum wages. Finally, aside from the mandatory minimum wage, employers are forced by law to provide other benefi ts, such as the 13th month pay and holiday pay. One would expect the minimum wage to refl ect these benefi ts already.
The empirical evidence indicates that real wages fell between 2003 and 2004 in all regions. The decline in real minimum wages, however, is not a new phenomenon. Balisacan (1994, p. 510) indicates that “legislated minimum wages declined for the most part of the 1970s, rose in the early 1980s, and fell again until 1987.” In countries like the Philippines, both employers and employees have
Source: National Statistics Office, Philippines (various years a).
Before 1989, the minimum wage was set by Congress, with no variation by region or by industry. It was determined after public hearings and consultations with employers, unions, and government agencies, with the objectives of protecting workers from exploitation and of giving them the means to meet their basic living requirements, thereby bringing about more equity in the distribution of national income. Wage adjustments were implemented irregularly, depending upon public pressure for an increase.
In 1989, Regional Tripartite Wage and Productivity Boards (RTWPBs) were established to take over the task of setting the minimum wage, in an effort to make this wage better reflect regional and industry variations in economic conditions. The RTWPBs are composed of eight members—two from the labor sector, two from management, and four from government. This, in itself, is a weakness since tied votes cannot be broken easily. Congress, nevertheless, can still legislate minimum wages, in particular when imposing an overall increase for the nation. The RTWPBs are meant to take into consideration four major criteria in determining regional minimum wages, namely:
• needs of workers,• comparable wages and incomes, • capacity to pay, and • requirements of economic development.
Box 4.4. Minimum Wage Setting in the Philippines
Source: Felipe and Lanzona (2005).
ThemeApRev.indd 57ThemeApRev.indd 57 08/08/2005 11:33:27 AM08/08/2005 11:33:27 AM

58 Key Indicators of Developing Asian and Pacific Countries
incentives not to comply with the minimum wage law. Indeed, Balisacan (1994, pp. 510–511) indicates that minimum wage rates have not been effectively enforced and they have only affected formal, large establishments in urban areas, especially in Metro Manila, and the reason is not that government bureaucracy is not capable of enforcement. Rather, both workers and employers have negotiated salaries below the minimum wage. Workers have been willing to accept a job, even for a salary below the minimum wage, and employers have resorted to practices effectively circumventing the law, such as hiring on a casual basis (see also Box 4.5).
The Bureau of Working Conditions sends out inspection teams to establishments with more than 20 workers to determine whether they are complying with the prescribed labor standards, including payment of minimum wages. Inspectors cover about 80,000 establishments a year, excluding enterprises in the informal sector. Compliance with minimum wage legislation is regularly compiled by the Department of Labor and Employment and provides a guide to the importance of minimum wages compared with real wages. Figure 4.8 shows the percentage of surveyed fi rms committing violations of labor standards, including those relating to minimum wages. After falling in 1987 to
Brooks (2002, p. 21), in his study of unemployment in the Philippines, concluded that a key policy implication of his analysis was “that higher economic growth and moderate increases in the real minimum wage are required to reduce unemployment.” And: “to reduce unemployment to a level more consistent with other countries in the region…will require sustained implementation of a comprehensive policy package focused on macroeconomic stability, structural reform, poverty reduction, and better governance.” The conclusions were derived from the results of a regression of the logarithm of employment ( lnL ) on the logarithms of real GDP ( lnY ) and the real minimum wage ( *lnw ), i.e., *ln ln lnL c Y wα β= + + . This is a simplified labor demand curve specification because it does not include the cost of capital or other variables typically included in the regression, such as a time trend or the capital stock (Felipe and McCombie 2004). Brooks’ regressions for different sectors show invariably that α is positive and statistically significant, in most the cases around unity. In contrast, β , the elasticity of employment with respect to the minimum wage, is negative (in some of the regressions it is not significant). However, the policy conclusions that Brooks derived from this type of work are problematic because there is no other way he could have obtained different results, i.e., the regression specified above must always yield a positive α and a negative β without implying any causality from the two right-hand side variables to employment. In other words, no data set can reject statistically the relationship embedded in this regression. Hence, as a potentially refutable theory, it is not of much use. Following Felipe and McCombie (2004), it may be noted that, by definition, one can write the identity for the labor share in output ( Ls ) as ( ) /Ls w L Y≡ × , where w is the average wage rate. The symbol ≡ is used to denote that this expression is an accounting identity, not a behavioral equation. This identity can be rewritten as ( / )LL s Y w≡ × , which in logarithms becomes
1 2ln ln lnL c Y wγ γ≡ + − , where ln( )Lc s≡ . It is obvious that this regression must provide suspiciously good results, with 1 1γ = ,
2 1γ =− and a perfect statistical fit ( 2 1R = ). It is an identity
and hence it does not explain anything. The negative relationship between employment and wage rate is embedded in the identity. Using this framework, it is impossible to refute statistically the null hypothesis that employment and wage rate are negatively related. Note that the identity 1 2ln ln( ) ln lnLL S Y wγ γ≡ + − holds whether the labor share ( )Ls is constant or not. What the argument says is that is that if the labor share ( )Ls is perfectly constant (and thus it is well approximated by c), then the identity explains the results.
But what if the labor share is not perfectly constant (as it is in real data)? The argument still applies. Suppose the labor share varies a little. In this case, nothing changes for practical purposes. If, though, the variation is large, it is true that results will deviate substantially from the identity. But this will simply indicate that the labor share varies too much to be approximated by a constant (hence the need to approximated through a different form, for example, a trend if it is increasing), and not that employment, output, and wages are unrelated (i.e., rejection of the model being tested). The difference between this regression and Brooks’ is that he used the minimum wage rate instead of the average wage rate. This is what induces in his results the deviation from the (perfect) results embedded in the labor share identity specification. However, the negative sign of the wage rate variable remains as well as the positive sign of output (with an estimate close to unity). This must be indeed the case since minimum wage rate and average wage rate are positively correlated. In the extreme, suppose the minimum wage rate is a constant fraction of the average wage rate. Then the two regressions are identical. If Brooks ran his regression to “test” a behavioral model, the problem is that such a regression would not be able to reject the putative model: the signs of the two variables are a foregone conclusion and the magnitudes of the coefficients will be relatively close to what the identity predicts. The conclusion is, therefore, that the Brooks-type of analysis has no policy implications.1
Box 4.5: Do Minimum Wages Cause Unemployment in the Philippines?
1 Fields (2004a, p.10) argues that the basic neoclassical model is often misused: “One common misperception is that the wage ‘should’ vary with labor productivity, commonly measured as value added per worker. Nothing could be further from the truth.” This is because the model’s prediction is a relationship between the real wage rate and marginal productivity. However, Fields is not entirely correct on two grounds. First, what most economists do is to assume a Cobb-Douglas production function. In this case, the marginal productivity is equal to the average product of labor times the elasticity of output with respect to labor. The assumption of the Cobb-Douglas might be questionable, but once it is made, then it is true that the marginal product of labor is directly related to the average product. The doubt here is whether the statement that the wage rate “should” vary with labor productivity is a normative or a positive one. Second, in general, wage rates and labor productivity do move together. But this is true
simply due to the labor share identity, which can be rewritten as ( / )Lw s Y L≡ × . Since the labor share does not vary that much, any regression of the wage rate on the average product of labor will “work.” Unfortunately, many economists take this as evidence of the marginal theory of factor pricing because a similar relationship follows by assuming a Cobb-Douglas production function, which, as argued above, is what many economists do (it works!).
Sources: Brooks (2002); Felipe and McCombie (2004).
ThemeApRev.indd 58ThemeApRev.indd 58 08/08/2005 11:33:29 AM08/08/2005 11:33:29 AM

59
0102030405060708090
100
Firms with Violations
Firms not Complying with Minimum Wage
Figure 4.8: Share of Firms with Violations of LaborStandards and Noncompliance with Minimum Wage,
Philippines, 1980–2003
1980 1982 1984 1986 1988 1990 1992 19981994 20001996 2002
%
43%, noncompliance with general labor standards among establishments inspected rose to 55% in the 1990s. Close to half of these violations result from noncompliance with the minimum wage law. In the 1990s, an average of 23% of the establishments surveyed did not comply with it. This is a relatively high noncompliance rate, which may suggest that minimum wages could be out of line with the wage rate that the market, if left to its own devices, would determine. Whether minimum wages are above market wages at the lower end, whether minimum wages are necessary to preserve the living conditions of workers, and whether increases in minimum wages lead to infl ation, are all debatable points that need empirical evidence.
This brief analysis of the role of labor market policies in the Philippines leads to the following main conclusions. First, the importance of a series of supposedly rigid policies as responsible for the lack of job creation is overstated. The number of nonregular workers has increased, the level of confl ict is reduced, and violations of the Labor Code are relatively high. Second, while some labor market policies might constrain job creation, in many areas the labor laws of the Philippines do not seem to be signifi cantly different from those of other countries. Further research is needed, particularly in areas such as minimum wages and the costs of dismissal.
4.6 Labor Market Policies in Viet Nam59
4.6.1 Introduction
The concept of the labor market is relatively new in Viet Nam. Not until the country started its economic 59 This subsection is based on Nguyen et al. (2005).
modernization program, or Doi Moi, in 1986, did it have a “labor market” in the sense of market-determined employment levels and wage rates. Before Doi Moi, Viet Nam had a centrally planned economy where economic activities, including the determination of employment and wages, were controlled and set by the Government. With the adoption of Doi Moi, decollectivization and self-managed multiple-ownership production systems were introduced throughout the country, which resulted in the diversifi cation of rural employment and the emergence of a vibrant urban workforce.
While the economic reforms allowed labor supply-demand forces to operate, these are only the initial requirements of moves toward a well-functioning labor market, and serious challenges remain. For instance, there is evidence of persistent and substantial underemployment in the agriculture sector and labor redundancy in state-owned enterprises. There are growing concerns that the current labor market is incapable of creating enough jobs to absorb the new entrants plus those workers retrenched as a consequence of public sector downsizing programs and privatization of state-owned enterprises. Recent research shows the existence of substantial market segmentation, refl ected in the large gap between rural and urban areas in terms of the returns to labor as well as in the positive expected gains from rural-urban migration. As Viet Nam further integrates into the global economy, its labor market needs to keep up with the changing demand in skills. Studies also show that government educational and training institutions lack the capability to prepare the population to take full advantage of economic integration, or to support groups of vulnerable workers.
The shift toward a market economy under Doi Moi has required various labor market policy reforms. The Government’s overall strategy is to reduce the state’s direct involvement in economic activities and to lay the legal foundations for effective labor market transactions to take place. To reduce state employment and increase that in nonstate sectors, the Government has abandoned collective farms in rural areas and has restructured state-owned enterprises in urban areas. However, initial steps in this regard were viewed as “ad hoc” and dealt with disparate areas with little regard for cohesion and clarity. Consequently, the Government decided to complement these initial steps with the enactment of the 1994 Labor Code. This, along with the subsequent related decrees, amendments, and rules, seeks to establish the country’s legal framework for labor-related transactions in both state and nonstate sectors.
Intrinsic to all these labor policy reforms is the need for Viet Nam to maintain its recent high growth rates and create enough jobs. It is estimated that the economy needs
Source: Bureau of Labor and Employment Statistics, Philippines (various years b).
ThemeApRev.indd 59ThemeApRev.indd 59 08/08/2005 11:33:32 AM08/08/2005 11:33:32 AM

60 Key Indicators of Developing Asian and Pacific Countries
to absorb approximately 1 million–1.3 million new workers annually. In addition, despite impressive economic gains over the last two decades, Viet Nam’s income distribution remains unequal and poverty incidence is high. To create more jobs and lessen income disparities that result from the transition to a market economy, the Government has put in place various employment generation programs since the mid-1990s.
The rest of this subsection discusses the most urgent issues in Viet Nam in the area of labor market policies, namely, the problems in implementing the Labor Code.
4.6.2 Labor Code and Regulatory Documents on Labor Markets
Prior to Doi Moi, markets played very little role in the allocation of labor in Viet Nam. The Government controlled fi rms’ resources, and assigned jobs and wages to workers. Managers had no discretion in setting their workers’ wages or in hiring and fi ring employees. Labor mobility across state-owned enterprises was virtually nonexistent. In short, labor regulations prior to Doi Moi provided few incentives to both employers and employees to engage effectively in production, thereby creating serious economic ineffi ciencies. The Government tried to rectify this by passing the Labor Code in June 1994. This provides a common legal framework for labor-management relations throughout the economy. It acknowledges the freedom to sell and buy labor services.
The Labor Code, together with its long list of implementing decrees and regulations, provides a comprehensive regulatory framework for the labor market. It regulates the employer-employee relationship and wage rates, as well as recruitment and termination. While the regulatory framework looks comprehensive on paper, only parts of it can be enforced in practice. Diffi culties in implementing the Labor Code stem from its limited coverage, its uneven applicability, and shortcomings inherent in the Government’s legal framework itself. Overall, these problems tend to limit the impact of the Labor Code on labor market outcomes. Three key diffi culties in implementing it are as follows.
Limited Coverage. In theory, the Labor Code applies to urban and rural laborers who have signed a labor contract or agreement or who have obtained an oral agreement. But it has had a limited direct impact on the labor market because the majority of workers are employed in the informal sector, and are thus outside the purview of government regulations. Moreover, the provisions in the Labor Code are not uniformly applied even to those employed in the formal sector.
Uneven Applicability. A major problem of the legal framework is the proliferation of highly differentiated laws (such as those on minimum wage levels) applying separately to the many different legal forms of economic organization. Uneven application of the Labor Code makes it diffi cult to honor the principle of equal treatment under the law, and to avoid discriminating in favor of one class of business against another.
Weak Compliance. Circumventing the Labor Code has become most evident in four areas. The fi rst is labor contracts. A 1996 survey showed that only 79% of workers in state enterprises and 92% of laborers in joint ventures had contracts. In most cases, contracts are not correctly prepared and signed because most employers prefer to keep workers’ compensation at a minimum and try to avoid paying overheads, such as social insurance, in deliberate violation of the Labor Code. Workers, for their part, and particularly those employed in agriculture, lack the education and understanding of the importance of an employment contract. The lack of acceptance of formal contracts is perpetuated, moreover, by their adherence to long-held customs and norms.
The second is social insurance. Chapter XI of the Labor Code mandates all enterprises employing 10 or more workers to pay an amount equal to 15% of the worker’s wage as social insurance, and employees are required to contribute 5% of their wages. This payment is allotted to fi nance old-age benefi ts, sickness and maternity benefi ts, workers’ compensation insurance, and retirement. Male workers become eligible for pensions at 60 and female workers at 55, if they have paid social insurance premiums for at least 15 years. However, noncompliance with social insurance payment is widespread. The latest data show that of the 9.6 million workers who are subject to compulsory social security payment, only 5.4 million or 56% are covered by social insurance.
The third is minimum wages. In May 1992, following laws that allowed foreign investment, the Government instituted a minimum wage for workers in foreign-invested enterprises, based on a perception of what Viet Nam could reasonably charge, given wage rates in countries similarly competing for foreign investment. As a result, the minimum wage level was set at different rates for domestic and foreign enterprises. During the 1990s, violations of the minimum wage law were prevalent among foreign-invested enterprises engaged in garments, leather tanning, paper production, and agriculture. This is not surprising because the minimum wages for foreign enterprises were three or four times the domestic minimum wages. This could probably explain why most foreign investment did not venture into more labor-intensive industries.
ThemeApRev.indd 60ThemeApRev.indd 60 08/08/2005 11:33:33 AM08/08/2005 11:33:33 AM

61
The fourth area in which circumvention of the Labor Code is most prevalent concerns labor unions. Chapter XII of the Labor Code protects the right of workers to organize a union within a certain time frame in all enterprises—state and nonstate—with 10 or more employees. There are questions, however, on the usefulness of this policy on grounds of representation and size. First, observers point out the lack of any true freedom of association, as there are no independent labor unions in Viet Nam. The Labor Code stipulates that only the provincial VGCL union—a government affi liate—can set up subsidiary unions in enterprises. Second, since the majority of workers are engaged in agriculture or in entrepreneurial household activities with fewer than 10 employees, unionization seems irrelevant. Moreover, while the labor unions have become more widespread and active recently, a large number of enterprises are still not unionized. Only 10% of the labor force is unionized. However, the rates vary signifi cantly by sector: around 90–95% of workers in the public sector and state-owned enterprises have joined a union, compared with 30% in the private sector.
In summary, the time is ripe to carry out a rigorous evaluation of the impact of the 1994 Labor Code and its policies on the country’s labor market outcomes. The peculiarity of Viet Nam is that it is a transition economy, in a state of learning how to become a market economy. The fact that the state does not determine wages and employment any longer is something all affected parties have to learn how to deal with; for example, many workers do not have formal contracts. This has led to several problems that the Government will need to resolve.
At the same time, it should also be stressed that ironing out the shortcomings in the Labor Code—for example, its uneven application to different types of economic organizations—is only one small part of the range of actions required to improve labor market outcomes. A major part will have to deal with sustaining economic growth and making sure that it generates large numbers of productive jobs. In this context, it is useful to note that the equitable distribution of land rights to rural households and economic reforms, which provided incentives for increasing farm production, helped economic growth in the 1990s go hand in hand with a remarkable decline in the incidence of poverty. The benefi ts from these earlier policies have, however, already been reaped. Improving labor market outcomes from now on will require decision makers to focus their attention on policies that generate greater opportunities for nonfarm enterprises; on development of the economy’s human capital by building on its good base of a literate population; and on policies and strategies that encourage both industrial restructuring (especially in state-owned enterprises) and diversifi cation and expansion of the private sector.
4.7 The Labor Market in the PRC
Given its size and importance in Asia, it is imperative to make a reference, however brief, to the labor market in the PRC, which is peculiar due to the combined effect of a series of factors: an enormous labor force; a labor force concentrated in agriculture; an economy in transition; and a large rural-urban income disparity, close to a factor of three.
Since the start of the economic reform process in 1978, the PRC’s economy has steadily become increasingly market oriented. This is refl ected not only in terms of the growing importance of the private sector in economic activity, but also in terms of the greater role that the “labor market” has been playing in determining employment levels and wages as opposed to the case in the prereform period when the allocation of labor was accomplished through the direct allocation of jobs and wages were controlled administratively.
By all accounts, economic reforms have served the PRC’s economy very well. It has been among the fastest, if not the fastest, growing economy in the world over the last two decades. Industry has been a main engine of the country’s economic expansion. For example, the production of manufactured goods increased 12% a year from 1990 to 2002. Moreover, the economy has also become steadily more integrated into the global economy. Indeed, the PRC is more integrated in the world trading system than other large countries such as Brazil, India, or the United States. While exports and imports are no more than 25% of GDP in the case of these three countries, trade represents 70% of the PRC’s GDP.
The rapid expansion of the PRC’s economy has meant improved labor market outcomes for many of the country’s workers, especially those in urban areas and the coastal provinces. However, there remain challenges in the labor market. One of the most important is the existence of considerable underemployment in the rural sector, which employed almost 490 million workers in 2002 but where productivity is low, and in state enterprises, which employed almost 40 million workers in 2001 (Brooks and Tao 2003). Employment in state enterprises has contracted dramatically since the mid-1990s, falling by almost 37 million between 1995 and 2001. Yet labor productivity there continues to be signifi cantly lower than in the nonstate sector, leading some researchers to suggest that an improvement of labor productivity in state enterprises to nonstate levels would leave 10 million–11 million workers from those enterprises redundant.
Despite the layoffs in state enterprises, jobs in urban areas have increased by 3% a year since the early 1990s.
ThemeApRev.indd 61ThemeApRev.indd 61 08/08/2005 11:33:34 AM08/08/2005 11:33:34 AM

62 Key Indicators of Developing Asian and Pacific Countries
An expansion of jobs has taken place in what could be described as the formal private sector, which when defi ned to include foreign-funded enterprises, created 17.5 million jobs between 1995 and 2001. However, labor force surveys suggest that a far larger number of jobs, around 75 million, has been created in the informal sector (Brooks and Tao 2003). To the extent that many jobs in the informal sector are low productivity and low-paying ones, underemployment is a problem even in urban areas.
Nevertheless, employment prospects remain far better in urban areas than in rural areas. An important refl ection of this is the large rural-urban income disparity. However, despite this disparity, permanent migration from rural to urban areas has been limited, due to a range of imperfections in the labor market. The PRC’s traditional emphasis on industrialization, based on the development of heavy industry, caused segmentation between areas, with an excessive concentration of capital in urban areas and of labor in rural areas. This also resulted in huge distortions in factor markets. While the PRC started reforming its product markets more than two decades ago, ultimately leading to World Trade Organization (WTO) accession, factor market reforms have not been addressed with the same vigor.
The labor code governing the operation of private enterprises in the PRC does not seem to present obstacles for fi rms to adjust their employment levels and/or their wages (see, for example, the discussion in Lora 2005). Instead, rigidities in the PRC’s labor market stems from outside the labor code. There are two main restrictions in the PRC’s labor market. The fi rst one is the system of offi cial registration, used to control rural migration to urban areas. The PRC’s authorities require households to have a hukou (household registration system) card, to legally reside in any given place. In a developing country like the PRC, there are wide differences between the services provided in rural and in urban areas. The problem is that without such a card, access to the amenities that cities provide, such as housing and education, is limited and very expensive. This restricts legal migration from rural to urban areas, and from city to city. Highly skilled workers and investors can buy a permit, called a “blue stamp” hukou card and thus reside in the place of their choice. Even if they do not buy one, their income allows them to pay for the higher fees that they have to pay when, for example, they visit a hospital. Most rural workers, however, cannot afford one.60
For this reason, migration in the PRC is a transitory phenomenon, which many workers endure to take advantage of the very signifi cant wage differential. One
60 The restrictions on rural-urban migration imposed by the hukou are gradually being relaxed. However, they still seem to be quite important (Brooks and Tao 2003).
estimate by Zhao (1999) for Sichuan province for 1995 documents an annual wage gap between rural and urban work of CNY2,387.6 for unskilled workers of comparable background and ability. This has led to a huge number of “fl oating workers,” i.e., workers who live and work in one place but do not have a hukou card and therefore have very limited access to the amenities that urban areas provide. Their number is estimated at about 90 million, or 19% of the total rural labor force, excluding commuters.
The second labor market restriction in the PRC refers to off-farm labor mobility, i.e., the absence of a fully functioning land market that would permit existing land owners to rent their land to others and migrate to the city (if they found higher wages there). Indeed, the absence of a well-defi ned land tenure system has raised the opportunity cost of leaving the farm. Households that cease to farm the land may lose the rights to it, so they have a strong incentive to continue some level of agricultural activity, even though profi tability may be very low.
Zhao (1999) also found that there is considerable evidence that temporary migrants prefer to stay at home in rural areas and engage in nonfarm work if it is available. Her empirical analysis leads to the conclusion that about 30% of the total rural-urban wage gap can be explained by the costs of migration, i.e., the unobservable transaction costs such as transportation, housing, and the cost of the necessary documents. Most of the wage gap is due to the social costs associated with migration. These include the disutility of being away from the family, poor quality of housing, limited social services for migrants, danger of being robbed during the trip, and uncertainty associated with not having a hukou card.
Shi et al. (2002) explored the question of rural-urban inequality in nine different provinces. They estimate that the unexplained portion of the rural-urban income gap is about 50%, and the rest is due either to compensation for higher urban living costs, or to labor market distortion. They concluded that the labor market distortion, once differences in living costs are taken into account, represented about 42% of the rural-urban labor income differential and 48% of the hourly earnings differential. When applied to the average wage differential, it amounts to an ad valorem rate of apparent taxation on rural wages of 81%.
In a follow-up paper, Shi (2002) argues that there might be other unobserved factors causing the rural-urban wage differential. Therefore, the estimation of the labor market distortion in the way it is done by Shi et al. (2002) is biased in the direction of overstating the hukou-related distortion. Moreover, rural-urban wage differentials exist in market economies not subject to this household registration system. Therefore, Shi (2002) estimates the direct impact
ThemeApRev.indd 62ThemeApRev.indd 62 08/08/2005 11:33:35 AM08/08/2005 11:33:35 AM

63
In a recent paper, Hertel and Zhai (2004) simulate the impact of two key labor market reforms on rural-urban inequality and income distribution, and explore how these factor market reforms interact with product market reforms being made as part of the PRC’s WTO accession. These two labor market reforms are the hukou household registration system and the lack of off-farm labor mobility. To do this, the authors use a recursive dynamic computable general equilibrium model for the PRC.
As is standard in computable general equilibrium modeling, the authors start by defining a baseline scenario, in this case up to 2007 where the PRC is not part of WTO. This is because the authors seek to explore separately the impact of labor market distortions and WTO accession, and thereafter examine how this recent opening of the economy interacts with existing labor market distortions. Hertel and Zhai then consider a sequence of scenarios to explore the relationship between economic growth, labor market distortions, further opening of the economy to world trade, and rural-urban inequality.
In the first scenario, Hertel and Zhai examine the impact of a relaxation of the hukou system. Citing recent research, they argue that the labor market distortion caused by this system amounts to an ad valorem tax on rural wages of about 81%. The exercise consists in estimating the impact of a reduction of this tax on rural wages to 34% at current levels of migration. In the second scenario, they consider the impact of putting in place a system of well-defined property rights for agricultural land (currently lacking). This reform is introduced in the simulations in 2003, such that households evaluate the difference between the marginal value product of their labor in agriculture and nonfarm rural wages in deciding where to work. In the third scenario, the authors reduce import tariffs to simulate the PRC’s accession to WTO. They implement this in two different ways: in conjunction with labor market reforms, and in their absence.
The authors present their results in an incremental as well as a cumulative fashion to distinguish the effects of the three individual reforms (the two reforms affecting the labor market and WTO accession). The most important results of the exercise are as follows.
The two labor market reforms lead to an increase in migration from the rural to the urban sector. In the second scenario, 10.1 million additional workers leave agriculture when they are permitted to rent their land out, as opposed to simply leaving it behind. These workers migrate to the off-farm rural labor market, which in turn induces an additional 7.9 million temporary migrants to the urban sector in order to equalize rural and urban wages. Most of these workers, 5.0 million, are semiskilled. The release of
these workers from agriculture depresses unskilled and semiskilled wages, respectively, in the rural nonfarming economy by 8.9% and 3.2%. Skilled wages in the rural nonfarming economy rise by 1.1%. Something similar happens to urban wages: for the unskilled group they decrease by 8.4% and for the semiskilled by 2.7%, while for the skilled group the increase is 1.1%.
When the transaction costs associated with temporary migration are reduced due to the elimination of the hukou system, rural-urban migration expands by 26.8 million workers, of whom 17.8 are semiskilled. The first effect of the simulated reduction in the tax on rural wages is to increase the supply of rural labor to the urban economy, thus increasing rural wages and depressing urban wages. Moreover, the reform of the hukou system also draws some additional labor out of agriculture, 3.1 million workers.
Income distribution, measured in terms of the urban-rural income ratio, improves. With the relaxation of the hukou system, the ratio declines from 2.59 to 2.42. The decline in the second scenario is similar. When combined, these measures result in a very substantial decline in rural-urban inequality, bringing the projected 2007 urban-rural income ratio from 2.59 to 2.27. In terms of the Gini coefficient, inequality also decreases.
The combined impact of both labor market reforms on the macroeconomic performance of the PRC’s economy is important: GDP increases by 2.1%. Most striking is the impact on unskilled wages: urban unskilled wages are 17.3% lower, while urban semiskilled wages are 7.1% lower, as a consequence of these labor market reforms.
When the authors consider the impact of WTO accession, they find that skilled wages rise more than semiskilled wages, which in turn rise more than unskilled wages. The decline in agricultural profitability and the accompanying expansion of urban activity gives rise to additional out-migration for agriculture, along with increased temporary migration of 1.2 million workers in the absence of labor market reforms. When labor market reforms are included, the migration response is higher, at 1.3 million workers due to the higher degree of labor mobility out of agriculture. The effect of the WTO accession is similar to a second-best result, which appears moderated when labor market reforms precede WTO accession.
Also in the context of WTO accession, GDP increases without labor market reforms by 0.6%, and with labor market reforms by 0.5%. This is because the productivity differential across sectors is smaller with the labor market reforms. The reduction in trade barriers gives a substantial boost to trade in the PRC, with both exports and imports rising by 15%.
of the hukou system on the observed wage differential among households. His results indicate that only 28% of the rural-urban wage difference can be explained directly by the hukou system, substantially less than by following the Shi et al. (2002) method.
One of the biggest uncertainties for the labor market concerns the impact of opening the PRC’s economy as a consequence of WTO accession on rural-urban inequality and income distribution. Box 4.6 summarizes some simulation results.
4.8 Summary
A key implication of the international experience and country studies examined in this section is that the case for reform of labor markets based on the supposed infl exibility of labor regulations and policies is weaker than proponents of market-oriented reforms argue. In the fi rst place, labor regulations commonly identifi ed with ineffi cient functioning of the labor market, such as minimum wage laws and restrictions on hiring and fi ring, are found to place few serious constraints on the
Box 4.6: Labor Market Distortions and the Opening of the PRC Economy: Some Simulation Results
Source: Hertel and Zhai (2004).
ThemeApRev.indd 63ThemeApRev.indd 63 08/08/2005 11:33:35 AM08/08/2005 11:33:35 AM
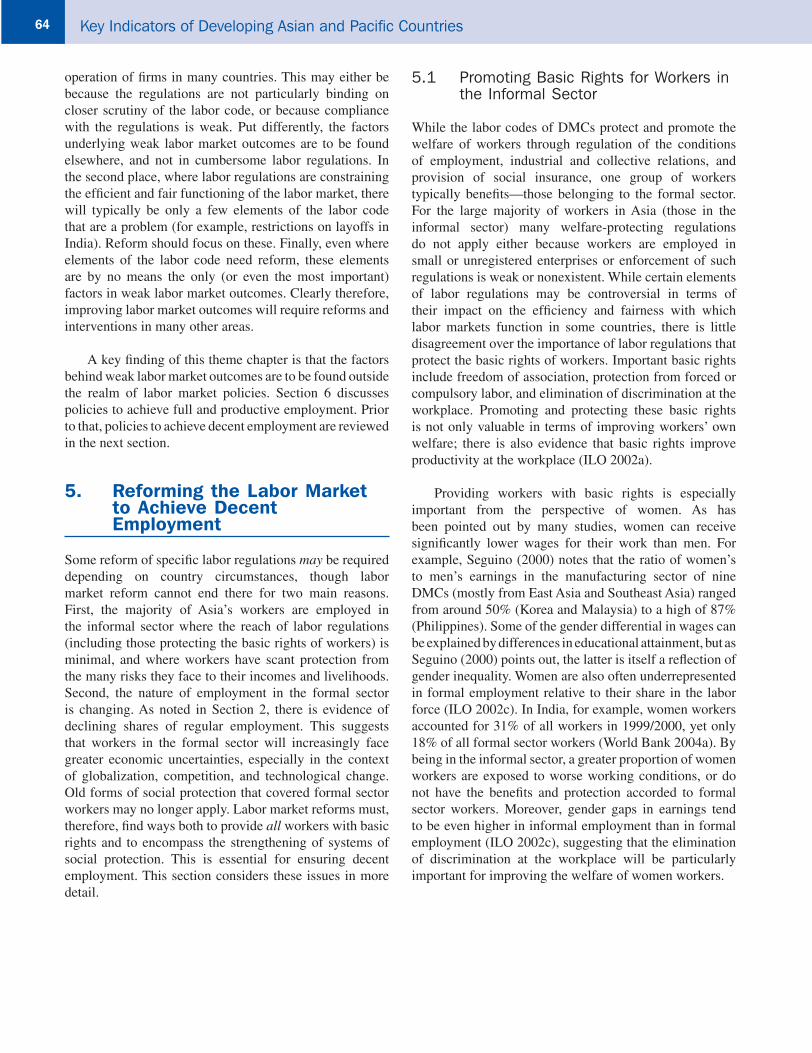
64 Key Indicators of Developing Asian and Pacific Countries
operation of fi rms in many countries. This may either be because the regulations are not particularly binding on closer scrutiny of the labor code, or because compliance with the regulations is weak. Put differently, the factors underlying weak labor market outcomes are to be found elsewhere, and not in cumbersome labor regulations. In the second place, where labor regulations are constraining the effi cient and fair functioning of the labor market, there will typically be only a few elements of the labor code that are a problem (for example, restrictions on layoffs in India). Reform should focus on these. Finally, even where elements of the labor code need reform, these elements are by no means the only (or even the most important) factors in weak labor market outcomes. Clearly therefore, improving labor market outcomes will require reforms and interventions in many other areas.
A key fi nding of this theme chapter is that the factors behind weak labor market outcomes are to be found outside the realm of labor market policies. Section 6 discusses policies to achieve full and productive employment. Prior to that, policies to achieve decent employment are reviewed in the next section.
5. Reforming the Labor Market to Achieve Decent Employment
Some reform of specifi c labor regulations may be required depending on country circumstances, though labor market reform cannot end there for two main reasons. First, the majority of Asia’s workers are employed in the informal sector where the reach of labor regulations (including those protecting the basic rights of workers) is minimal, and where workers have scant protection from the many risks they face to their incomes and livelihoods. Second, the nature of employment in the formal sector is changing. As noted in Section 2, there is evidence of declining shares of regular employment. This suggests that workers in the formal sector will increasingly face greater economic uncertainties, especially in the context of globalization, competition, and technological change. Old forms of social protection that covered formal sector workers may no longer apply. Labor market reforms must, therefore, fi nd ways both to provide all workers with basic rights and to encompass the strengthening of systems of social protection. This is essential for ensuring decent employment. This section considers these issues in more detail.
5.1 Promoting Basic Rights for Workers in the Informal Sector
While the labor codes of DMCs protect and promote the welfare of workers through regulation of the conditions of employment, industrial and collective relations, and provision of social insurance, one group of workers typically benefi ts—those belonging to the formal sector. For the large majority of workers in Asia (those in the informal sector) many welfare-protecting regulations do not apply either because workers are employed in small or unregistered enterprises or enforcement of such regulations is weak or nonexistent. While certain elements of labor regulations may be controversial in terms of their impact on the effi ciency and fairness with which labor markets function in some countries, there is little disagreement over the importance of labor regulations that protect the basic rights of workers. Important basic rights include freedom of association, protection from forced or compulsory labor, and elimination of discrimination at the workplace. Promoting and protecting these basic rights is not only valuable in terms of improving workers’ own welfare; there is also evidence that basic rights improve productivity at the workplace (ILO 2002a).
Providing workers with basic rights is especially important from the perspective of women. As has been pointed out by many studies, women can receive signifi cantly lower wages for their work than men. For example, Seguino (2000) notes that the ratio of women’s to men’s earnings in the manufacturing sector of nine DMCs (mostly from East Asia and Southeast Asia) ranged from around 50% (Korea and Malaysia) to a high of 87% (Philippines). Some of the gender differential in wages can be explained by differences in educational attainment, but as Seguino (2000) points out, the latter is itself a refl ection of gender inequality. Women are also often underrepresented in formal employment relative to their share in the labor force (ILO 2002c). In India, for example, women workers accounted for 31% of all workers in 1999/2000, yet only 18% of all formal sector workers (World Bank 2004a). By being in the informal sector, a greater proportion of women workers are exposed to worse working conditions, or do not have the benefi ts and protection accorded to formal sector workers. Moreover, gender gaps in earnings tend to be even higher in informal employment than in formal employment (ILO 2002c), suggesting that the elimination of discrimination at the workplace will be particularly important for improving the welfare of women workers.
ThemeApRev.indd 64ThemeApRev.indd 64 08/08/2005 11:33:37 AM08/08/2005 11:33:37 AM

65
In order to provide basic rights to informal sector workers, a critical step is a process of legalization, which would bring both workers and enterprises in the informal sector within the legal framework. For workers, it will be essential for the labor code to be extended to cover workers in all enterprises, large or small, in so far as basic workers’ rights are concerned. At the same time, large-scale information campaigns and promotion of forums for dialogue between the various stakeholders, including workers, employers, and government staff involved in the administration of labor issues, will be required to build awareness of the importance and benefi ts of basic workers’ rights both for the workers themselves and for society at large. Including government staff in information campaigns and dialogue is crucial, given their role in making sure that laws on basic rights are enforced.
Why limit the extension of the coverage of the labor code only to basic rights? The main reason is feasibility. First, it is doubtful whether the small enterprises where informal sector workers are employed have either the fi nancial or administrative capacity to meet the types of regulations that larger fi rms could meet. Second, enforcement of labor regulations is a tricky issue even when it comes to the formal sector. It is a virtual nonstarter to expect labor administration in most Asian countries to
be able to implement the whole gamut of labor regulations across all enterprises, formal and informal, large and small, even if they wanted to.
Just as workers in the informal sector need to be brought under the umbrella of labor legislation, informal sector enterprises, too, need legal recognition. Analogous to the case of workers, the regulations and procedures for informal sector enterprises need to be simple. (This issue is revisited in the next section which, among other things, discusses the improvements needed in the regulatory and institutional environment in which the informal sector works.)
5.2 Strengthening Social Protection
From the perspective of workers, social protection embraces policies and programs that, on the one hand, diminish workers’ exposure to job-related risks and, on the other, enhance workers’ capacity to protect themselves against loss of income. Loss of income may be due to layoffs or other factors, including ill health, disability, and old age. Box 5.1 describes the components of social protection as defi ned by ADB. The defi nition used is a broad one and encompasses the need for social protection not only for workers, but for the population at large.
Labor market policies and programs aim to reduce risks of unemployment, underemployment, or low wages resulting from inappropriate skills or poorly functioning labor markets. Labor market policies and programs are further categorized into (i) active labor market programs that aim to put people to work, and (ii) passive labor market policies that extend better protection to workers. Active labor market programs are intended to generate employment, develop employment services, and enhance workers’ skills. Such programs include direct employment generation schemes, labor exchanges or employment services, and skills development programs. Passive policies include interventions that relate to unemployment insurance, income support, and an appropriate legislative framework that balances economic efficiency and labor protection.
Social insurance programs are designed to cushion risks associated with unemployment, ill health, disability, work-related injury, and old age. Pensions, health and disability insurance, and unemployment insurance are examples of social insurance schemes.
Micro- and area-based schemes provide social protection to the rural and urban informal sectors on a geographic basis, to complement the more traditional national social insurance
programs that target those in the formal sector. Programs under this component include micro-insurance, agricultural insurance, community-based social funds, and programs to manage the effects of natural disasters.
Social assistance and welfare schemes are intended for the most vulnerable groups with no other means of adequate support, such as single-parent households, victims of natural disasters or civil conflict, handicapped people, or the destitute poor. Examples are welfare and social services (to highly vulnerable groups such as the physically or mentally disabled, orphans, or substance abusers), cash or in-kind transfers (such as food stamps and family allowances), and temporary subsidies for food in times of crisis.
Child protection ensures the healthy and productive development of children. Early child development programs, school feeding programs, scholarships or school fee waivers, waiving of fees for mothers and children in health services, and provision of family allowances to assist families with young children to meet part of their basic needs fall under child protection. Programs to protect youth also include programs for street children, advocacy against child abuse and child labor, and measures to protect youth against criminality, sexually transmitted diseases, early pregnancies, and drug addition.
Box 5.1: Components of Social Protection as Defined by the Asian Development Bank
Sources: ADB (2003c, 2004b, 2005b).
ThemeApRev.indd 65ThemeApRev.indd 65 08/08/2005 11:33:38 AM08/08/2005 11:33:38 AM
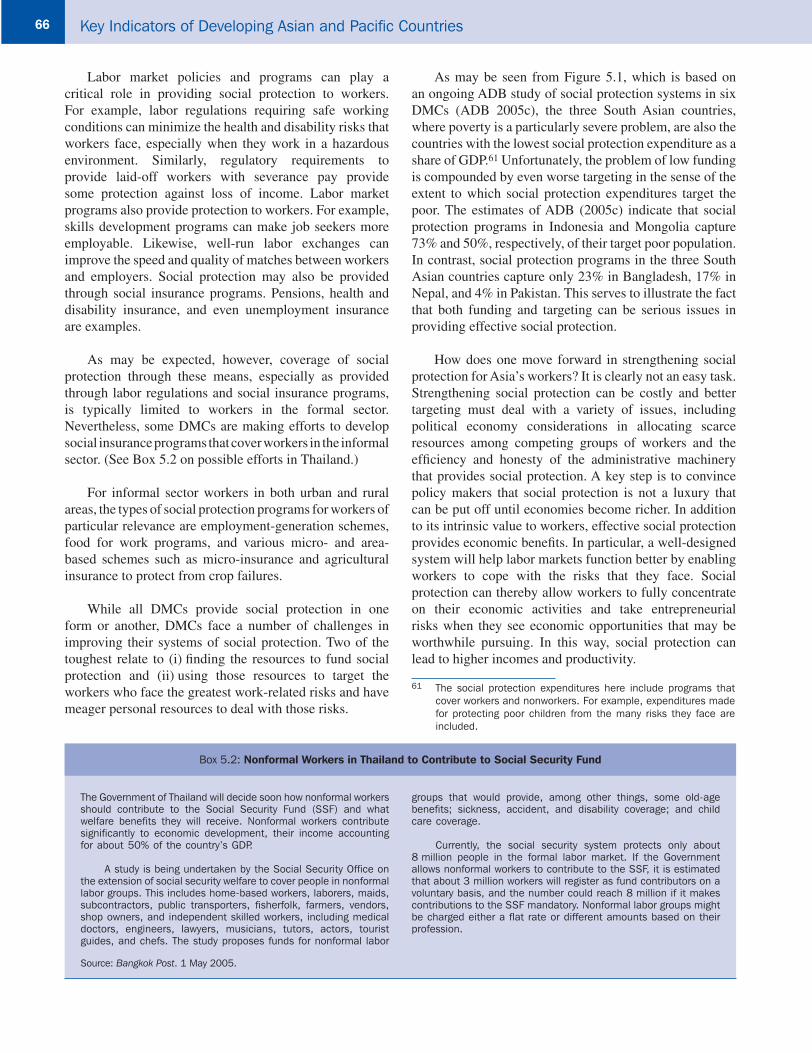
66 Key Indicators of Developing Asian and Pacific Countries
Labor market policies and programs can play a critical role in providing social protection to workers. For example, labor regulations requiring safe working conditions can minimize the health and disability risks that workers face, especially when they work in a hazardous environment. Similarly, regulatory requirements to provide laid-off workers with severance pay provide some protection against loss of income. Labor market programs also provide protection to workers. For example, skills development programs can make job seekers more employable. Likewise, well-run labor exchanges can improve the speed and quality of matches between workers and employers. Social protection may also be provided through social insurance programs. Pensions, health and disability insurance, and even unemployment insurance are examples.
As may be expected, however, coverage of social protection through these means, especially as provided through labor regulations and social insurance programs, is typically limited to workers in the formal sector. Nevertheless, some DMCs are making efforts to develop social insurance programs that cover workers in the informal sector. (See Box 5.2 on possible efforts in Thailand.)
For informal sector workers in both urban and rural areas, the types of social protection programs for workers of particular relevance are employment-generation schemes, food for work programs, and various micro- and area-based schemes such as micro-insurance and agricultural insurance to protect from crop failures.
While all DMCs provide social protection in one form or another, DMCs face a number of challenges in improving their systems of social protection. Two of the toughest relate to (i) fi nding the resources to fund social protection and (ii) using those resources to target the workers who face the greatest work-related risks and have meager personal resources to deal with those risks.
As may be seen from Figure 5.1, which is based on an ongoing ADB study of social protection systems in six DMCs (ADB 2005c), the three South Asian countries, where poverty is a particularly severe problem, are also the countries with the lowest social protection expenditure as a share of GDP.61 Unfortunately, the problem of low funding is compounded by even worse targeting in the sense of the extent to which social protection expenditures target the poor. The estimates of ADB (2005c) indicate that social protection programs in Indonesia and Mongolia capture 73% and 50%, respectively, of their target poor population. In contrast, social protection programs in the three South Asian countries capture only 23% in Bangladesh, 17% in Nepal, and 4% in Pakistan. This serves to illustrate the fact that both funding and targeting can be serious issues in providing effective social protection.
How does one move forward in strengthening social protection for Asia’s workers? It is clearly not an easy task. Strengthening social protection can be costly and better targeting must deal with a variety of issues, including political economy considerations in allocating scarce resources among competing groups of workers and the effi ciency and honesty of the administrative machinery that provides social protection. A key step is to convince policy makers that social protection is not a luxury that can be put off until economies become richer. In addition to its intrinsic value to workers, effective social protection provides economic benefi ts. In particular, a well-designed system will help labor markets function better by enabling workers to cope with the risks that they face. Social protection can thereby allow workers to fully concentrate on their economic activities and take entrepreneurial risks when they see economic opportunities that may be worthwhile pursuing. In this way, social protection can lead to higher incomes and productivity.
61 The social protection expenditures here include programs that cover workers and nonworkers. For example, expenditures made for protecting poor children from the many risks they face are included.
Box 5.2: Nonformal Workers in Thailand to Contribute to Social Security Fund
Source: Bangkok Post. 1 May 2005.
The Government of Thailand will decide soon how nonformal workers should contribute to the Social Security Fund (SSF) and what welfare benefits they will receive. Nonformal workers contribute significantly to economic development, their income accounting for about 50% of the country’s GDP.
A study is being undertaken by the Social Security Office on the extension of social security welfare to cover people in nonformal labor groups. This includes home-based workers, laborers, maids, subcontractors, public transporters, fisherfolk, farmers, vendors, shop owners, and independent skilled workers, including medical doctors, engineers, lawyers, musicians, tutors, actors, tourist guides, and chefs. The study proposes funds for nonformal labor
groups that would provide, among other things, some old-age benefits; sickness, accident, and disability coverage; and child care coverage.
Currently, the social security system protects only about 8 million people in the formal labor market. If the Government allows nonformal workers to contribute to the SSF, it is estimated that about 3 million workers will register as fund contributors on a voluntary basis, and the number could reach 8 million if it makes contributions to the SSF mandatory. Nonformal labor groups might be charged either a flat rate or different amounts based on their profession.
ThemeApRev.indd 66ThemeApRev.indd 66 08/08/2005 11:33:39 AM08/08/2005 11:33:39 AM

67
Figure 5.1 Social Protection Expendituresas Share of GDP (%)
0
2
4
6
8
10
12
Bangladesh Indonesia Mongolia Nepal Pakistan Viet Nam
%
A related benefi t of a well-designed system of social protection is that it can enable labor markets to match workers with jobs effi ciently, especially in the formal sector. An important reason for this is that in many cases, existing mechanisms of coping with risks are provided through the worker’s job (health insurance, disability benefi ts, pension program, etc.). Moreover, in some countries, regulations that provide job security have been used in lieu of providing workers with social protection in the fi rst place. In either case, it is only natural to expect workers in the formal sector to resist layoffs, even when these make solid economic sense from the point of view of the enterprises to which they belong. If, however, workers could count on systems of social protection to provide (i) some basic protection from the loss of income and other job-related benefi ts (such as health insurance),62 (ii) effi cient labor exchanges that increased the speed and quality of matching job seekers with available jobs, and (iii) subsidized retraining programs, it is likely that the resistance of workers—not only to layoffs, but also to more fl exible rules for layoffs in countries where regulations providing job security exist and are binding—would be diminished.
In addition, while it is true that government fi nances are in a precarious situation virtually everywhere, opportunities still exist for raising resources for social protection. There
62 Ultimately, a movement toward unemployment insurance mechanisms needs to be contemplated in so far as protecting workers from income loss is concerned. The unemployment insurance mechanisms tend to be particularly intensive in administrative capabilities (for example, to monitor eligibility of recipients) and require a relatively large formal sector. For this reason, such systems may not hold immediate importance for low-income DMCs.
Source: ADB (2005c).
are several items of government expenditure that could be channeled more usefully toward funding social protection systems. Consider the case of India where various subsidies (on electricity, fertilizer, the food distribution system, etc.) are estimated to be around 13–14% of GDP. Myriad studies have shown that the subsidies do not assist the poor and that the economic benefi ts of the subsidies to the economy at large are tenuous at best (e.g., Srivastava 2004).
However, diverting funds from such items of expenditure to strengthen social protection requires dealing with vested interests. This requires the formation of a social consensus for policy reform in general. For example, if market-oriented policy reform makes life better for the better-off, then ways must be found for them to agree to a rationalization of subsidies so as to help poorer workers cope with the risks that they face.
A social consensus would also help address the problem of governance. In particular, even where the priorities of social protection are sensible on paper—for example, targeting the poor and most vulnerable—the actual delivery systems in place can have serious defi ciencies. Corruption, ineffi cient administration, and the politicization of social protection schemes all serve to whittle away whatever resources are to be provided in the fi rst place. Yet many of the schemes that are affected by these governance problems are vital—for example, the public works program, Maharashtra Employment Guarantee Scheme (MEGS), which in the 1980s created an average of 160 million person-days of work per year in that Indian state. MEGS has been criticized for its wieldy administrative scheme and complex wage determination process. It has also been criticized on the basis that the scheme has not had much impact on the reduction of poverty rates in the state. Indeed, while many of these criticisms are fair, they cannot be grounds for dismissing similar schemes as ultimately unviable. In the case of MEGS, even if headcount ratios have not changed signifi cantly in response to it, the scheme has clearly had a positive impact on the welfare of the poor (even if it has not lifted them out of poverty). As pointed out in Ravallion (1991) MEGS has stabilized income: income has been found to be 50% less variable in villages with a public works program than in villages without such a program. In addition, the scheme has had indirect benefi ts on nonparticipants. These have accrued as labor was drawn away from other activities by the scheme’s leading to higher wages in other activities. Ultimately, the needs are important enough that governments have to do much more to improve the design and administration of social protection programs, as well as their monitoring and evaluation.
ThemeApRev.indd 67ThemeApRev.indd 67 08/08/2005 11:33:40 AM08/08/2005 11:33:40 AM

68 Key Indicators of Developing Asian and Pacific Countries
6. Toward Full and Productive Employment: Promoting Formal Sector Employment and Raising Incomes in the Informal Sector
As argued throughout this theme chapter, a major objective of economic policy in DMCs must be the attainment of full and productive employment. This entails creating the conditions under which the formal sector generates more jobs and improving earnings prospects in the informal sector. To achieve these, it is important to make employment and productivity growth central to macroeconomic policy. It was also argued in Section 3 that the dilemma of wage-led economies, which are often adversely affected by productivity improvements because they are not well prepared to absorb technological change, is how to shift productivity gains to higher real wages and aggregate demand. Section 4 argued that labor market reform, when understood in terms of introducing higher labor market fl exibility to facilitate hiring and fi ring, is not the policy that will bring in full and productive employment. This section addresses these issues and proposes a series of growth-promoting policies for full and productive employment that will have a much higher impact on employment creation than labor market reforms.
Policies that generate economic growth are of vital importance. However, this does not mean that all that countries need to do is to focus on growth exclusively and accept unquestionably the labor market outcomes that result, a view that is simplistic and ignores two issues. First, high economic growth rates should not be viewed as an end in themselves. Growth that takes place without making a serious dent in poverty (especially in countries where poverty is large) or that creates too few productive and rewarding jobs (in a country where such jobs are seriously lacking) is failing to improve the welfare of a large proportion of its population. Second, there are good reasons for believing that a growth process that is highly inequitable will be diffi cult to sustain. Indeed, a widely held view on the results of India’s national elections held in 2004 is that an incumbent party, which had presided over a fast-growing economy, lost because of the perceptions of voters in rural areas that they were being left behind.
Moreover, inequality may even impede a growth process from igniting in the fi rst place. As noted by Bowles and Gintis, for example, “the relationship between inequality and economic performance is mediated by the structure of economic governance: inequality impedes economic performance in part by obstructing the evolution of productivity-enhancing governance structures” (Bowles and Gintis 1995, pp. 409–414 ). They offer three
arguments in support of a positive relationship between effi ciency and equity, and a source of equality-productivity complementarity: institutional structures supporting high levels of inequality often prove costly to maintain; more equal societies may be capable of supporting levels of cooperation and trust unavailable in more economically divided societies; and economies with highly unequal asset distribution face more ineffi cient incentive structures.
Thus, the real challenge for policy makers is how to put in place a growth process that is wholly compatible with and delivers the goal of full employment. In the context of DMCs, this would require that the growth process be characterized by increasing incomes in the nonwage sector (self-employed workers, unpaid family workers) and the informal wage sector; and by increases in the proportion of workers in the wage (formal) sector.63
What policies should governments implement to achieve full and productive employment? Sections 3 and 4 examined the role of labor market policies in facilitating or enabling better labor market outcomes consistent with full employment, and concluded that labor market reforms are not a panacea. This section examines other critical dimensions, put into two groups: growth-promoting and human capital policies. The fi rst is split further into policies directed at improving productivity and incomes in rural areas, and in the urban informal sector; export push; and industrial policies for public-private coordination, diversifi cation, and restructuring (Figure 1.1, above). The following subsections review these two groups.
6.1 Growth-Promoting Policies
The types of policies discussed below take as their starting point the idea that employment is determined by investment expenditures and other autonomous types of expenditures, such as exports and government investment. The key to employment creation is to increase the rate of capital accumulation of the economy.
6.1.1 Policies to Improve Productivity and Incomes in the Rural Economy and Urban Informal Sector
Rural Economy
As noted earlier, the rural economy is where the majority of Asia’s poor work and is also a sector characterized by a high degree of underemployment and low productivity. Unfortunately, the rural economy is also one that has
63 Perhaps one would also like to see a reduction in the earning gaps between the formal and informal sectors. But this is secondary to the other two conditions.
ThemeApRev.indd 68ThemeApRev.indd 68 08/08/2005 11:33:42 AM08/08/2005 11:33:42 AM

69
suffered the relative neglect of policy makers. In part, this neglect has been the fl ip-side of the attention paid to developing modern/formal industrial economies in urban areas—after all, economic development is about the contraction of the traditional rural economy and the expansion of modern industry and services sectors, and growth of urban centers. Yet from the point of view of generating full employment, the pursuit of a package of policies mainly focused on expanding the modern sector with a heavy urban bias has limitations. A critical issue is how large the (surplus) labor pool is in the rural economy. If it is very large (as in India) it is unlikely that the modern sector of the economy will be able to absorb it to the point that wages in the former sector will increase signifi cantly. For this reason, it is necessary to pursue a complementary policy of increasing the supply price of labor directly in the rural sector by increasing productivity in agriculture. When a large portion of the labor force is employed in the primary sector, it is the productivity of this sector that sets the supply price of labor in the rest of the economy, and unless the external sector of the economy is large relative to GDP, wages in the economy will not increase unless the supply price increases through an increase in physical productivity in agriculture (e.g., increasing yields per acre) (Mazumdar 1999).
Increased public investments of different types will have a critical role to play in enabling farm productivity and incomes to improve. Consider fi rst the provision of rural infrastructure, including irrigation, rural transport, and rural electrifi cation, and the provision of new technologies through agriculture extension services. Irrigation, aside from having a powerful impact on farm productivity, increases the frequency of cropping and therefore the demand for farm labor. The presence of rural roads cuts down on transport costs in a signifi cant way and allows for the development of markets and trade for all types of inputs and outputs. Rural electrifi cation allows the usage of new farming inputs—for example, the operation of electric pumps. Finally, agriculture extension services are critical to enabling farmers to move from traditional farming techniques to high-yield modern techniques.
Signifi cantly, increased productivity on the farm also brings benefi ts for the nonfarm rural economy. In the fi rst place, rural roads and rural electrifi cation also benefi t the expansion of the nonfarm sector. In the second, increased incomes from improved farm productivity will typically have a benefi cial impact on the nonfarm economy by raising demand for its output.
At the same time, investments in physical infrastructure need to be complemented by public investments in basic health care (including family planning services) and education. There are a variety of benefi ts to be had from
these investments. First, longitudinal studies of rural households clearly show the dramatic impact that illness can have on a household’s poverty status over long periods of time. For example, a study of a number of villages in rural India demonstrates that the illness of a key earning member as long as 25 years ago can drive a family into the poverty trap, as a result of the loss of that member’s earnings, as well as into a debt trap, in order either to meet consumption needs at the time of illness or to meet expenses to treat the illness. Second, basic education has been found to have a causal link with the ability of farmers to switch from traditional farming techniques to modern ones based on, for example, use of high-yield variety seeds (Foster and Rosenzweig 1996). Some evidence also suggests that education makes it easier for farm workers to move to nonfarm activities. Finally, growing evidence shows that access to both basic education and health care can lead to improved maternal health care and the decision to have fewer children. In the short to medium term, a smaller portion of the household budget needs to go into looking after young dependents. In the longer term, not only does this imply fewer entrants to an already crowded labor market, but also that entrants will be better educated.
Admittedly, public fi nances in many DMCs could seriously constrain the ability of governments to invest in the rural economy (as noted above). However, if these DMCs are to make a dent in the serious amounts of underemployment and poverty that exist today, they will have to fi nd the required political will and fi nancial resources. The former is especially important in the context of wasteful subsidies that are given for various political economy reasons (for example, poorly targeted subsidies for power, water, and fertilizer in India).
Additionally, raising farm productivity will also require that infrastructure inputs be combined with private assets, especially land (or land-use rights in the context of the transition economies). If land is inequitably distributed, improving the productivity of land may be associated with only minor increases in farm incomes of the poor leaving the supply price of labor essentially unchanged. In such situations, there is a case for pushing land reforms aimed at improving the poor’s access to land. There is considerable evidence, including that from the experience of Korea and Taipei,China, of the benefi cial impact that land reforms can have on incomes of marginal farmers. Land reforms can be of various types. It can involve redistribution of land, but this is not all. For example, where property rights are ill-defi ned, land reform can take the form of a clearer defi nition of use and access rights, which can dramatically alter investment behavior. In the PRC for example, the introduction of the household responsibility system, whereby land-use rights were allocated to individual small farmers, was a major boost to the productivity of land (Lin
ThemeApRev.indd 69ThemeApRev.indd 69 08/08/2005 11:33:43 AM08/08/2005 11:33:43 AM

70 Key Indicators of Developing Asian and Pacific Countries
1992), and perhaps to farm self-employment as well. The fact that land-use rights were allocated equitably meant that marginal farmers benefi ted considerably. Land reform may also take the form of legislating ceilings on landholdings and improving tenurial security, etc. Evidence from India indicates that changes in the terms of land contracts rather than actual redistribution reduced poverty and raised agricultural wages (Besley and Burgess 1999). Similarly, a province-level analysis for the Philippines by Balisacan and Fuwa (2004) fi nds that implementation of land reform is a signifi cant and positive factor for growth. Ultimately, of course, the political capital required to push through with such reforms needs to be there. Moreover, land reform programs, where they can be implemented, need to be designed carefully. For example, they need to ensure that the redistributed land leaves farming households with plots that are viable in the context of improved modern methods, and not just traditional farming methods.
It has already been noted that improvements to rural infrastructure will benefi t not only the farm economy but also the rural nonfarm economy. But much more needs to be done for the rural nonfarm economy given its tremendous potential. This potential, and the benefi ts of realizing it, are perhaps best seen in the light of the PRC’s experience with township and village enterprises (TVEs). From 1978 to 1996, their number increased from 1.5 million to 23.4 million (Lin 2004), while the number of workers employed by them rose from 9.5% of the total rural labor force to 29.8%. Crucially, the TVEs are widely seen to be a key driver of the PRC’s excellent growth record (e.g., Lin 2004). The case of the TVEs is important in demonstrating the benefi ts that can accrue from a dynamic rural nonfarm sector.
Credit is an area in which rural-based enterprises may be severely rationed owing to a variety of market failures. In a survey of rural nonfarm entrepreneurs, access to credit appeared as the top-ranked business need, ahead of market access, skills, raw material supply, infrastructure, or social stratifi cation (Som et al. 2002). While previous generations of rural credit programs have been disappointing, improved modalities for credit delivery have emerged. The most prominent example has been microfi nance schemes, which have stimulated considerable interest due to their specialization toward a poor clientele, their high repayment rates, and their low subsidy levels relative to earlier supervised credit programs. Loan sizes are kept small (though perhaps graduating in size over time). Collateral requirements are typically eliminated, though other incentive features are introduced, the most important of which is group liability. Often these programs are targeted toward women, thus improving their command over household resources as well as accelerating their
participation in commercial activities. While the case for microfi nance is often overstated, these features are solidifying into a list of good practices by which to widen access to credit for the poor.
The provision of producer services is another crucial need of enterprise development. For farms, the most familiar form of service is technology extension; counterpart services for nonfarm enterprises would be technical assistance, training, and support programs for the gamut of small-scale enterprises in rural areas. Assistance in terms of management capacity-building (business plan formulation, fi nancial management, etc.), as well as market assistance (price information, trade fairs, business matching, etc.) is also common among small enterprise programs.
While governments have been engaged in providing such services and assistance, these programs have been traditionally delivered by top-down, supply-driven formats determined by the government, under a subsidy regime. Such an approach has proven largely ineffective. The sheer diversity of technical and managerial needs of farm and nonfarm entrepreneurs has overwhelmed the capacities of these systems, which have little incentive to attempt to match their supply to actual needs. A new market-oriented paradigm has therefore emerged as an alternative (Marr 2004). Subsidies are being phased out, and cost-recovery schemes phased in. This forces public (or nonprofi t) service providers to compete with their private counterparts, to prioritize the range of services provided, and to operate on a fi nancially sustainable footing.
Another important type of producer service is the facilitation of business linkages. The private sector has shown a robust capacity to forge these vertical linkages along the supply chain. Moreover, private contractual arrangements often have desirable effi ciency or feasibility features that deal with the problems of coordination, strategic opportunism, and risk sharing that are inherent in these supply chains. However, there is no presumption that the market can provide linkage-forming services at optimal levels. Public (or nonprofi t) provision may need to supplement their activities. Legal and institutional support for contracts, dispute resolution, and enforcement mechanisms should also be in place, though invasive regulation of contract provisions should be avoided.
Urban Informal Sector
Many urban workers in developing countries must look for work in the informal sector, for two reasons: the actions that governments take to hinder entrepreneurship and growth (de Soto 1989); and the actions that governments
ThemeApRev.indd 70ThemeApRev.indd 70 08/08/2005 11:33:43 AM08/08/2005 11:33:43 AM

71
fail to take to promote entrepreneurship and growth (de Soto 2001). The costs of informality are summarized in Box 6.1.
The urban informal sector is where many urban jobs are being created. And while the sector is very heterogeneous in terms of its characteristics—so that one cannot describe all jobs in the sector as low productivity/low earnings jobs—for many employed in the sector, low productivity/low earnings are a fact of life. As in the case of rural nonfarm enterprises, the self-employed and own-account workers in micro- and small enterprises in urban areas need special assistance in becoming more productive. Like their counterparts in rural areas, improvements in access to credit, technical assistance, building of management capacity, market assistance, and the facilitation of business linkages with other fi rms including those in the formal sector are all essential parts of the policy package required by the urban informal sector.
However, perhaps more so than rural enterprises, the urban informal sector needs a much improved legal and institutional framework in which to operate. This is because the urban informal sector often contains activities outside the law, or at least on its margins (ILO 2002a). Some aspects of the legal and institutional framework are particularly relevant: one is the business regulations that govern the procedures and costs of starting and operating an enterprise; another is the property rights regime.
The importance of the legal and institutional framework for the informal sector has been emphasized forcefully by de Soto (1989, 2001). He argues that the major stumbling block that keeps most of the world from benefi ting from capitalism is its inability to produce capital. Capital is the force that raises the productivity of labor and creates the wealth of nations, the lifeblood of the capitalist system, the foundation of progress, and the one thing that the poor countries of the world cannot seem to produce for
The division of economic activities into formal and informal has adverse effects on the economy in general. These effects include declining productivity, reduced investment, inefficient tax system, increased utility rates, limited technological progress, and difficulties in formulating economic policy.
Declining Productivity. Compliance with excessive government regulations by formal businesses affects the flexibility of decision making and leads to an inefficient use of resources. It is difficult to be productive when government restrictions hamper the pooling of resources, when taxes and tariffs distort the price of materials and products, and when price controls distort production incentives. Also, the concept of “red tape,” accounting requirements, and other procedural rules increase costs for businesses. More important, some labor laws render the mobility of labor difficult, making it extremely costly to engage new staff. When labor and social regulations increase the cost of labor excessively, formal companies respond by using less labor and more capital. This implies that formal businesses do not effectively utilize labor resources.
Meanwhile, the costs of engaging in informal business, including more expensive capital and the absence of facilitating legal instruments, also generally result in lowered productivity.
Since formal businesses are more capital intensive and the informal sector is more labor intensive, an arbitrary and inefficient distribution of resources is created. For an optimum level of productivity to be reached, the appropriate combination of employment and capital must be applied.
Reduced Investment. The presence of informal activities reduces aggregate investment as there is less long-term investment in production in view of the high rate of return required by informal investors and the difficulties that informal businesses experience in enforcing contracts.
Inefficient Tax System. The existence of informal businesses generates a smaller tax base. This causes formal businesses to pay more taxes than they would if informality did not exist. To some extent, this discourages formal companies from expanding. More
important, formal activities become less and less attractive and informality continues to grow. Meanwhile, tax evasion becomes widespread, prompting the government to spend on strategies to detect tax evaders and less on much-needed infrastructure and social services.
Increased Utility Rates. Informal businesses tap the water and electricity supplies illegally to avoid paying for them. Since the full use of utilities should be accounted for, formal businesses are charged with higher utility rates to subsidize the part consumed by informal businesses.
Limited Technological Progress. Technological progress is hampered by the existence of informal businesses because informal companies generally engage in small-scale business, maintain a lower level of interaction in production, and are unable to protect technological innovation. Informal companies usually have small-size businesses due to fear of detection, the absence of property rights, and the difficulty of enforcing contracts. These companies cannot benefit from technological innovation because, in order to do so, they would have to increase their scale, which would make their detection more likely.
Difficulties in Formulating Macroeconomic Policy. The macroeconomic decisions relating to the real, monetary, fiscal, and external sectors of the economy that a government formulates are largely dependent on the accurate measurement of the performance of the economy. The existence of informal activities renders it extremely difficult to obtain precise information on national economic performance and introduces an excessive element of speculation in decision making.
If informal activities were a constant proportion of total economic activity, the margin of error might not be so great. However, informal activities, at least in some countries, have grown more rapidly than formal activities so that the growth of economic output in these countries is underestimated. The growth of informal transactions also provides some difficulty in measuring other economic indicators, such as inflation, employment, unemployment, and underemployment.
Box 6.1: National Economic Consequences of the Costs of Informality
Source: de Soto (1989).
ThemeApRev.indd 71ThemeApRev.indd 71 08/08/2005 11:33:44 AM08/08/2005 11:33:44 AM

72 Key Indicators of Developing Asian and Pacific Countries
themselves. This is what he refers to as the mystery of capital. Capital is the key to development because of the potential it holds to deploy new production. Since this potential is an abstract feature, it requires a conversion process from physical assets in the form of “dead capital” into the potential to deploy new production and into the force that raises the productivity of labor and creates the wealth of nations. Thus, an economy’s wealth depends on its ability to use capital.
De Soto (2001) contends that there is a crucial institution that holds the key in the conversion process; and that there is a link, in terms of causality, that has been missed. The institution is the system of property rights; the missing link is that this institution has a capital-generating function. In other words, the conversion process takes place through the legal infrastructure and the system of property rights. The process and arguments are summarized in Figure 6.1.
What is the problem in developing countries? According to de Soto, they have not developed a system of property rights that allows and facilitates the transformation of dead capital into potential capital.64 It is not that capital does not exist in developing countries.65 Many people in these countries have houses but no titles, crops but no deeds, businesses but no statutes of incorporation. It is the unavailability of these essential representations that explains why these people have not been able to produce suffi cient capital to make their domestic capitalism work. For de Soto, developing countries lack the world of legally enforceable transactions, and the institutions that give rise to capital. In developing countries, it can be diffi cult to trace and validate the ownership of assets. This affects mostly poor people. What the poor lack is easy access to the property mechanisms that could legally fi x the potential of their assets so that they could be used to produce, secure, or guarantee greater value in the market. Developing nations need to recognize and protect the property that many poor people have created, but that is currently of uncertain legal provenance, and thus of little use in securing the loans necessary to invest in personal or business development. The process of converting a
64 Woodruff (2001) is very critical of de Soto’s (2001) arguments. First, he indicates that capital markets function poorly in developing countries for reasons other than title to property. He maintains that unlocking capital will require more than just recognizing existing informal property rights. At a minimum, a set of complementary reforms—for example, of bankruptcy laws and banking regulations—will be required. Second, he questions de Soto’s estimates of the value of informal land simply because de Soto is not clear at all about how he and his team produced the figures. The value of dead capital in the Philippines is estimated at $132.9 billion. This is disaggregated into $72.1 billion in urban areas (of this, $66.4 billion is concentrated in Metro Manila), and $60.8 billion in rural areas.
65 And certainly, developing countries do not lack entrepreneurship, talent, and enthusiasm à la Schumpeter. These are not scarce resources in developing countries.
physical asset (say, a house) into generating capital (say, an enterprise) is very complex.
The problem is not that developing countries do not have an adequate legal system. It is that this legal system is chaotic and not conducive to the transformation process. Thus, it is imperative that developing countries update and simplify their legal systems so that these systems can play the capital-generating role that they perform in industrial countries.66 This system protects ownership and secures transactions. It encourages citizens to respect titles, honor contracts, and obey the law—that is, it helps avoid corruption. Moreover, often the problem goes beyond the fact that the legal system is inadequate for the purpose of realizing the existing potential capital. The legal systems of developing countries do not acknowledge that property can go beyond ownership. This means that in many of them the system functions purely as an ownership inventory of deeds and maps standing in for assets, without allowing for the additional mechanisms required to create a network through which people can recombine their assets into more valuable goods and services.
Once this system is enforced, citizens will have an interest (i.e., they will have incentives) in maintaining the “capitalist game” since a great part of the potential value of legal property is derived from the possibility of forfeiture. Thus, they will commit themselves to playing by the rules of the game. A well-integrated legal property system does two things: it reduces the costs of knowing the economic qualities of assets by representing them in a way that our senses can pick up quickly; and it facilitates the capacity to agree on how to use assets to create further production and increase the division of labor (so that more people participate). The challenge of many developing countries is to understand the legal institutions and gather the political will necessary to build a property system that is easily accessible to the poor, articulating a legal system that allows millions of people (presently outside the realm of the formal economy) to participate legally and formally in a modern economy. This increases the division of labor and increases productivity.
66 Not all economists would agree with de Soto’s call for reforming legal systems as a means of strengthening property rights regimes in developing countries. Rodrik (2003) argues that while the goal of strengthening property rights regimes is laudable, administrative and political constraints in developing countries can often be such as to require institutional innovations that “[depart] significantly from Western norms” (p. 7). A case he puts forward is that of the TVEs in the PRC. The formal ownership of TVEs lay not in private hands but in local government ownership. As a result, local governments had an incentive in the growth of TVEs as this would generate direct revenue benefits for them. Given conditions prevailing in the PRC at that time, it is possible that property rights were more secure with local government ownership of TVEs than under a private property legal regime.
ThemeApRev.indd 72ThemeApRev.indd 72 08/08/2005 11:33:45 AM08/08/2005 11:33:45 AM

73
6.1.2 Export Push
Ultimately, attaining the goals of full and productive employment will require signifi cant increases in the demand for labor in the modern/formal industry and services sectors. This requires not only that formal industry and services expand in terms of their contributions to aggregate value added (driven by private-sector decisions for all practical purposes),67 but also that the expansion of formal industry and services be suffi ciently labor intensive to generate the large numbers of formal sector jobs that are required to meet the goals of full and productive employment. An export push as well as public-private coordination, diversifi cation, and restructuring policies (in short, industrial strategies and policies) have a key role to play in making both happen. This and the following subsection review these areas.
In order to expand the modern sector, DMCs will have to rely on policies that lead to an expansion of exports. This is especially true for the laggard countries in Asia, such as South Asian countries and the Philippines. An export push can be induced by lower unit labor costs. This can be done in one of two ways: lower wages or higher productivity. The fi rst option is extremely diffi cult for the obvious reason that workers are unwilling to accept it. Moreover, countries that try to exploit their comparative
67 In a number of DMCs, especially in South Asia and in the transition economies of Asia, employment in the formal sector has often been driven by public sector employment. Unfortunately, much of this expansion has been pushed by political considerations rather than those relating to e.g., profitability and efficiency.
advantages based on low labor costs by restricting wages may end up stuck in a vicious cycle of low productivity, defi cient training, and lack of skilled jobs, preventing the sector in question from competing effectively in the markets for skills-intensive products.
The second option is the one that countries should try to pursue. Korea and Taipei,China, succeeded in following this road. Ways to improve productivity include increases in the capital-labor ratio, training and reorganization of the shop fl oor, and the introduction of competition policies. Of course, in a dynamic setting, this option leads to the question of how gains in productivity are shared between capitalists and workers, i.e., the functional distribution of income. In any case, not every country will be able to emulate these two economies.
The above considerations lead to the next important question: What is the role of the state, if any, in developing policies that affect the creation of new employment? In general terms, Asian countries dealt with the labor surplus question following two different industrialization strategies as means of economic growth: (i) import substitution (IS), followed by the South Asian countries; and (ii) export orientation, followed by the East Asian and Southeast Asian economies (after an initial phase of IS). Although countries throughout the region today are not implementing IS policies, it is worth making a brief reference. As is well known, IS ended up not providing an acceptable solution to many of the problems that developing countries had (and still have). In particular, the domestic market for manufactured products tends to be small in developing
Figure 6.1: The Mystery of Capital: Developing Countries’ Inability to Produce Capital
Assets
Houses without titles; crop without deeds;businesses without statutes of incorporation
They have slipped out of the legal registry but are there: dead capital
Entrepreneurship
Labor
Legal Infrastructure:
• Ownership and property system• System of property rights and institutions that give rise to capital
Capital as potential to deploy new production. Force that raises the productivity of labor and creates the wealth of nations.
Representation of assets with titles: (capital-generating function of the property rights system)
+
Conversion Process of DeadCapital into Productive
Capital
ThemeApRev.indd 73ThemeApRev.indd 73 08/08/2005 11:33:46 AM08/08/2005 11:33:46 AM

74 Key Indicators of Developing Asian and Pacific Countries
countries and the proportion of employment in large-scale manufacturing fi rms (the fi rms that IS targets) is too low to provide a basis for a large expansion of effective demand. In the face of this problem, developing countries have two options. Either there is a large increase in per capita income in agriculture and services, which provide the bulk of employment in developing countries, so that the purchasing power of workers in these sectors increases and they can buy manufactured goods; or the country has to open up and export. A second problem of the IS strategy leads to problems of ineffi ciencies of all sorts (managerial, use of wrong techniques, etc.) due to lack of competition, and prevents transfers of better and more up-to-date techniques. Finally, the IS strategy induces the creation of vested interests. The costs of rent seeking are high. The South Asian countries spent a long time following this strategy, and it was only in the early 1990s that India began opening its markets. The results, as documented, have been positive and the country continues to implement important reforms.
The East Asian and Southeast Asian economies switched early on to the export orientation strategy and they were able to deal effi ciently with the problems of IS, including the achievement of full employment. In recent times, it has been argued that the export-led strategy of these countries has resulted in other problems, such as excessive dependence on industrial countries to absorb exports and a fallacy of composition, i.e., that while it is possible that one or several countries may have signifi cant export expansion, it is not possible for all of them to expand exports signifi cantly (Palley 2002). In fact, it has been suggested that the Asian economic and fi nancial crisis could have had its roots in the real side of the economy, namely, the lack of capacity to react to problems of the export-led growth model when it came under strain in the mid-1990s. Felipe (2003) reviews this literature and concludes that although some of these criticisms are valid, export orientation still offers tremendous benefi ts to countries in the region.68 Further evidence is presented in ADB (2005d).
Not all DMCs, however, have been as successful as those in East Asia and Southeast Asia. Most other countries are constrained, in the sense that there exists a gap between the available and desired levels of resources; moreover, they have very few options to successfully implement output and employment policies, in particular because developing countries are often hit by shocks. Most developing countries operate in the shadow of two
68 Mazumdar (1999) advocates the search for a “golden mean” between IS and export orientation. By this he means that Asian countries should be able to find an optimal growth-employment strategy that avoids the problems of IS as well excessive reliance on export orientation.
constraints (Taylor 1994): savings and foreign exchange. The fi rst indicates that investment must be fi nanced out of available savings. The second results from the fact that developing countries require imported capital goods, hence they need to export to pay for full-employment imports (i.e., the value of imports that is seen when resources are fully utilized), which support investment. This imposes an important trade-off between short-term employment and investment for long-term growth. In these circumstances, the range of maneuver of most developing countries is rather limited. What is therefore needed is a policy package involving a certain degree of government intervention, and this is elaborated on in the next subsection.69
6.1.3 Industrial Policies for Public-Private Coordination, Diversification, and Restructuring
While market forces and private initiative are today widely acknowledged as potent drivers of economic activity, “it is increasingly recognized that developing societies need to embed private initiative in a framework of public action that encourages restructuring, diversifi cation, and technological dynamism beyond what market forces on their own would generate” (Rodrik 2004, p. 1). Policies for economic restructuring—which Rodrik points out are essentially what industrial policies are—need not be restricted to the industry (or narrower, manufacturing) sector. They also apply to the development of nontraditional activities in agriculture or services. Additionally, the use of industrial policies should not imply that governments make production and employment decisions. Instead, it requires that governments play a “strategic and coordinating role” in the development of nontraditional activities—activities where the underlying costs and opportunities are unknown to begin with and unfold only when such activities start.
Industrial strategies and policies defi ned in this way have a special signifi cance in so far as meeting the goals of full and productive employment. Consider the case of India’s food processing industry—a labor-intensive sector as far as manufacturing activities go and one that has strong direct linkages with the agriculture sector. Less than 2% of fruit and vegetable production in India
69 In any case, these policies may not guarantee higher employment (Bacha 1990). For example, fiscal restraint to generate savings will allow faster capacity growth and reduced inflation, but with lower capacity utilization and employment. The same occurs with increased public investment. This will affect the investment schedule, thereby accelerating capacity growth, while there is also investment “crowding-in” on private capital formation, but probably also at the cost of higher inflation and lower current output. Finally, higher exports will relieve the foreign exchange constraint. Improving exports in the short run is not easy though, especially for raw material exporters. Such a policy may be easier for semi-industrialized economies.
ThemeApRev.indd 74ThemeApRev.indd 74 08/08/2005 11:33:47 AM08/08/2005 11:33:47 AM

75
is processed, compared with 30% in Thailand and 80% in Malaysia (Sundaram and Tendulkar 2002). Several market analysts have identifi ed food processing as an industry with signifi cant potential to expand both domestically and internationally. So the question must be: What has constrained the expansion of India’s food processing industry? Sundaram and Tendulkar (2002) suggest that the answer lies in the cultivation of traditional varieties of fruit and vegetables unsuitable for processing; lack of infrastructure for postharvest preservation and quality control and testing; lack of storage facilities including silos, warehouses, and cold-storage facilities; and lack of air-conditioned transport. Modern processing and packaging facilities are also required.
It is certainly possible that some of these constraints are themselves the result of policies and regulations governing the production, movement, and sale of agricultural produce around the country; and of restrictions on the entry of large-scale fi rms both in certain product categories and in distribution and retailing. But the constraints go beyond these “government failures.” Coordination failures are likely to abound in preventing the growth of the sector in which there are so many inputs and players. Similarly, not just government failures, but market failures as well have limited the productivity and quantity of employment in India’s services sector. Sectors such as travel and tourism, housing and real estate development, retailing and distribution, and education and health are all sectors where relatively large numbers of productive jobs could be created.
The importance of promoting productive jobs in the services sector takes on added signifi cance in the context of new technologies. In particular, new technologies appear to be increasingly capital and skills intensive. There are several reasons for this. First, and as noted in Section 3, new technologies are invariably developed in today’s industrial economies where factor prices call for technological change to be labor saving. Second, in today’s globalized world, high levels of product quality have become the norm. While in principle, there are products where high quality requires highly specialized work (branded shoes and watches, etc.), for the most part, high-quality products require more automation. As a result, for today’s poorer DMCs that are trying to industrialize, the techniques available for all practical purposes are much less labor intensive than they were 20 or 30 years ago when, for example, Hong Kong, China; Korea; Singapore; and Taipei,China were industrializing. It therefore seems unlikely that an expansion of the industry sector will be able to generate, by itself, as many good jobs as would have been possible before. But certainly, many DMCs have room for the secondary sector to expand and create
more jobs (Box 6.2). The rest of the jobs to employ growing labor forces will have to come from the services sector. The question here is whether services will be able to generate enough productive jobs, and not to be a mere residual sector that employs all those workers who move from rural to urban areas.
More generally, it is certainly true that DMCs must rely on private initiative and market forces to drive growth and employment in the modern sector. Policies that constrain private investment—such as inordinately high start-up costs, cumbersome and time-consuming procedures for starting and registering businesses, barriers to entry in particular lines of business—are prime candidates for review. So are policies that in reality, as opposed to just on paper, serve to reduce the demand for labor. Eliminating such practices will probably be good both for business and for employment generation. However, eliminating such cumbersome and counterproductive regulations is unlikely to serve as a “magic bullet.” Policy makers must not lose sight of the fact that spurring the private sector is unlikely to be driven by the elimination or reduction of “government failures.” Spurring private investment will also require the elimination or reduction of market failures through an appropriately designed partnership between the state and market as well as the building-up of institutions. This partnership consists of a series of tasks and responsibilities assigned to each (ADB 2003a, pp. 224–237). The critical challenge for private sector development is probably getting this design correct, and is even more so in many DMCs, where markets and institutions are less developed than in the industrial countries. More research in uncovering the nature and processes that can lead to more effective public-private partnerships is likely to be a high value-added activity. It is also one that is likely to require in-depth country-specifi c studies.
In this context, Rodrik (2004) lists some general “design principles” that could have a high pay-off. First, public support and incentives should be provided only for activities and not sectors. Moreover, the activities in question should be new ones, including products that are new to the local economy or new technologies for existing products. They should also have the potential to “crowd-in other, complementary investments or generate informational or technological spillovers” (Rodrik 2004, p. 23). Second, to make sure that public support is not abused or wasted, clear benchmarks for success and failure must be adopted. Public support should not be indefi nite. The use of sunset clauses to phase out support could help in this regard. Third, agencies that implement industrial policy must be competent, have good communication with the private sector, and be monitored by the highest level of leadership possible.
ThemeApRev.indd 75ThemeApRev.indd 75 08/08/2005 11:33:49 AM08/08/2005 11:33:49 AM

76 Key Indicators of Developing Asian and Pacific Countries
During the last few years, the Philippines communications subsector, in particular activities relating to the development of call center activities, has registered very high growth rates. At the same time, industry has stagnated. This has led some commentators to ask if the Philippines can somehow develop, bypassing the traditional stages that other countries went through, that is, the transition from agriculture to industry and then to services, and directly jump from an agriculture to a services economy.
Most likely call centers, and in general most service activities, cannot provide the impetus that the country needs to generate sustained growth (though see below). Research has shown that there is a close association across countries between the growth of industry and the growth of GDP; or more precisely, that GDP growth is faster the greater the excess of industrial growth relative to GDP growth, that is, when the share of industry in total GDP is rising the fastest. This strong empirical association has led industry to be referred to as “the engine of growth.”
What is special about industry and particularly manufacturing industry? Since differences in the growth of GDP are largely accounted for by differences in the rate of growth of labor productivity, there must be an association between the growth of industry and the growth of labor productivity. This is indeed to be expected for two main reasons. The first is that there are increasing returns to scale in industry, which are of two types: (i) those derived from large-scale production, which induce lower average costs; and (ii) those derived from the fact that output growth has an effect on capital accumulation and the embodiment of new technological progress in capital. Labor productivity also increases as output grows through “learning by doing.”
The second main reason is that if activities outside industry are subject to diminishing returns, with the marginal product of labor less than the average product, if resources are drawn from these activities into industry as the latter expands, the average product of labor will rise in nonindustrial activities. These relationships between industrial growth, productivity growth, and GDP growth are known as Kaldor’s Growth Laws.
Kaldor (1961) argued that the faster the rate of growth of manufacturing output, the faster the transference of labor from other sectors of the economy where there are either diminishing returns or where no relationship exists between employment growth and output growth. A reduction in the amount of labor in these sectors (agriculture, for example) will raise productivity growth outside manufacturing. As a result of increasing returns in the latter, on the one hand, and induced productivity growth of manufacturing output, on the other, one would expect that the faster the rate of growth of manufacturing output, the faster the
rate of growth of productivity in the economy as a whole. As the scope for transferring labor from agriculture (diminishing returns activities in general) diminishes, or as output comes to depend on employment in all sectors of the economy, the degree of overall productivity growth induced by manufacturing growth is likely to diminish, and so will the overall growth rate of the economy.
There are two fundamental questions in this analysis. The first is: What determines the rate at which industry (manufacturing) grows in the first place? In the early stages of development, it must be demand coming from the agriculture sector, i.e., the growth of manufacturing output is constrained or determined by demand from agriculture. In the later stages of development, it is probably export demand that drives the system. In many developing countries (though certainly not all), the internal market is too small to reap economies of scale, and selling to the domestic market does not provide the foreign exchange to pay for necessary imported inputs. As is well known, the most successful developing countries are those that managed to implement export-led growth policies. A fast rate of growth of exports and output will tend to set up a cumulative process, or virtuous cycle of growth, through the link between output growth and productivity growth. The lower costs of production in fast-growing countries make it very difficult (though not impossible) for other industrializing economies to establish export activities with favorable growth characteristics.
The other fundamental question is: How do developing countries bring about structural change in favor of industrial activities (if growth and development is to be accelerated)? This question is left open. History seems to tell us that today’s industrial countries developed on the basis of protection and promotion of their infant industries (Felipe and Vernengo 2004). Of course it is a myth that the highly successful economies of East Asia and Southeast Asia grew and developed by allowing markets to work freely. Government intervention, industrial policy, and the development of infant industries were all at work.
In summary, while the creation of employment by call centers is something that cannot be dismissed in a country like the Philippines, it is difficult to believe that they will provide the country with the solution to the unemployment and underemployment problems. It must be added that only about 4% of the applicants are taken. This is because the large majority of the applicants do not meet the basic requirement for the positions, namely, to be able to speak very good English. This requirement refers to the ability to speak without committing grammatical mistakes and to speak with a client’s accent. Although English is widely spoken in the Philippines, the reality is that only a small proportion of people speak very good English. A large number of these people are university graduates for whom a job in a call center is a form of underemployment.
Box 6.2: The Role of Economies of Scale and the Importance of Industry: Can Call Centers Provide the Growth and Employment Impetus Needed in the Philippines?
6.2 Human Capital Policies
Countries that try to exploit their comparative advantages based on low labor costs by restricting wages (or through devaluations), as noted earlier, may end up in a vicious cycle of low productivity, defi cient training, and a lack of skilled jobs, preventing the sector in question from competing effectively in the markets for skills-intensive products. This situation is referred to as the “low-skill, bad-job trap” (Snower 1996). “Bad jobs” are associated with low wages and little opportunity to accumulate human capital; “good jobs” demand higher skills and
command higher wages. A second trap derives from the complementarities between capital and labor. The problem is referred to as a “low-skill, low-tech trap.” If workers have insuffi cient skills to operate modern machinery, it will be underutilized. Consequently, fi rms will have little incentive to invest in the latest technology. This reduces workers’ productivity even more. A third problem emerges from the interaction between innovation and skills. Innovating is crucial for developing technological capabilities, but it requires well-trained workers. Economies can get caught in a vicious cycle in which fi rms do not innovate because the labor force is insuffi ciently skilled; and workers do not
ThemeApRev.indd 76ThemeApRev.indd 76 08/08/2005 11:33:50 AM08/08/2005 11:33:50 AM

77
have incentives to invest in knowledge because there is no demand for these skills. For example, Amante (2003) documents the problems of the Filipino educational system and argues as follows: “The low level of benefi ts derived from the Philippine education, especially at the secondary and tertiary levels, is traceable to the unemployability and low productivity of Philippine labor. In turn, these could be attributed to inadequate investments and low levels of technology utilized by business establishments and the very thin economic base of the country” (Amante 2003, p. 275).
Snower (1996) argues that the relatively low demand for and supply of skills in a country derives from rational decisions made by both fi rms and individuals in the context of their particular legal and institutional framework. Countries with a less skilled workforce have greater incentives to produce nontraded services rather than tradables such as manufactured goods because the former are relatively protected from foreign competition. This pattern of specialization creates and perpetuates the demand for less skilled labor. For example, the Philippines Presidential Commission on Educational Reform 2000 Report lamented that: “The country has too long suffered the imbalance of an overly credential-conscious society, which puts a premium more on diplomas than knowledge or skills, and values prestige institutions granting degrees
more than the competence that the degree itself embodies.” The report echoed the observation that “Education obtained in a typical Philippine college or university may only be equivalent to a secondary education from the better high schools in the country, or from a typical high school in Japan or Europe.” Filipinos prefer a white-collar profession and look down on vocational and technical education.70
Continuing with the Philippines, Amante argues that there is a substantial mismatch between the expectations of the competencies of the workforce arising from industry restructuring and the spread of information technology. In particular: “In an environment of global competition, organizations must focus upon skills and competencies” (Amante 2003, p. 282). Today’s world demands organizations designed on skill-based systems, which adapt quickly to the new circumstances and which react to the fact that, with globalization, the nature and content of jobs and the skills required are changing at a tremendously fast pace. This mismatch between the skills that fi rms demand and the practical knowledge that workers bring to the workplace has led to a cycle of lack of skills (the source of the mismatch), unemployment (underemployment), and poverty (Figure 6.2).
70 References to the Presidential Commission on Educational Reform is taken from Amante (2003, p. 272).
Lack of Skills
Unemployment and
UnderemploymentPoverty
State InterventionSkills TrainingEducational Reforms
Reality: why skills training fails to mitigate poverty
1. Lack of policy focus; policy incoherence2. Gaps in public leadership and management training3. Lack of coordination with private sector4. Lack of incentives5. Lack of resources: Training facilities Trainers Appropriate financing package6. Information/communication gap: government agencies concerned with training, private sector, students/trainees
Figure 6.2: Breaking the Cycle: Reducing Poverty through Skills Training
Source: Adapted from Amante et al. (1999), Figure 1.
Other state interventionse.g., antipoverty measures, investment areas with incentives
ThemeApRev.indd 77ThemeApRev.indd 77 08/08/2005 11:33:51 AM08/08/2005 11:33:51 AM

78 Key Indicators of Developing Asian and Pacific Countries
Where does the mismatch come from? On the one hand, the type of business, level of investment, and scale of operations determine the competencies expected from employees. The prevailing circumstances of global competition and the spread of new technologies such as the Internet affect those expectations. On the other, the knowledge, skills, and attitudes of the workforce are shaped by existing social institutions, including the quality of education, support services, and government policy.
One of the most important consequences of the defi ciency in training is the effect on the composition of goods produced in the country: a lack of skilled workers adversely affects product quality. And skill defi ciencies lead to production and export of relatively poor-quality and low-value products. A businessperson with only an unskilled labor pool available may well consider that any attempt to produce high-value goods will be subject to errors and poor quality. Thus, the labor force will be more suited to the production of low-value products. The manufacture of products of high quality requires highly trained workers. But if the country does not generate enough of these workers, fi rms will be forced to produce low-quality goods; and likewise, workers will acquire little training because few high-quality goods are produced. This leads to a vicious cycle because the choices made by employers refl ect the availability of a skilled workforce. Different outputs require different types of training. A businessperson aware that his or her workers are not highly skilled (and thus, more likely to make mistakes) will tend to specialize in the production of low-value products.
Why can this happen? Because the market does not lead to the best possible outcome. The reason is that there are differences between private and social returns to knowledge. Individuals are not fully rewarded for the social contribution they make when they invest in knowledge, a process in which they increase the stock of knowledge available to everyone. They get no reward for this spillover, and so contributions to social knowledge will be underprovided. In the end, fi rms’ decisions about what type of products to produce depend on the degree to which skilled labor is available. The result is that “in countries that offer little support for education and training and that contain a large proportion of unskilled workers, the market mechanism may reinforce the existing lack of skills by providing little incentive to acquire more; whereas in countries with well-functioning educational and training institutions and large bodies of skilled labor, the free market may do much more to induce people to become skilled” (Snower 1996, p. 112). (See, however, Box 6.3 on the potential for international migration to encourage the accumulation of skills in countries where
the domestic market does not provide incentives to acquire relatively sophisticated education and skills.)
The market, if left to itself, will not necessarily create the incentives that induce the accumulation of knowledge and skills, and thus growth. A poor economy might be stuck forever in a vicious cycle and immersed in a poverty trap. Therefore, lifting it out of this dilemma may require government intervention so as to create the incentive to accumulate capital. Perhaps what is required is an initial injection, a push from the government, in terms of, perhaps, subsidizing the acquisition of knowledge so as to achieve the minimum rate of return, and this way lay the fi rst stone until increasing returns set in.
Certainly, this is easier said than done since there is no guarantee that a government will correct market failure. It is diffi cult for the government to know all the aptitudes needed by every single fi rm and worker. Likewise, government support for training is not cheap and must be fi nanced by imposing taxes or cutting other expenditures. Indeed, such support will not help the economy get out of a trap through substantial public investment if it is fi nanced by a punitive tax on private investment. This implies that the subsidies should be fi nanced by taxes that do not discourage the acquisition of knowledge accumulation, such as taxes on consumption.
Sectors with “good jobs” are not predetermined. New sectors with increasing productivity and earnings are constantly emerging. Although securing a foothold in the growing sectors is sometimes a matter of chance selection, preparing workers with the requisite skills is an essential element for enhanced opportunity. It also needs to be stressed that training in specifi c skills is best done within individual enterprises. What general employment policy can do is to provide workers with a broad spectrum of general skills that enables them to move around the range of emerging opportunities in the labor market. This underlines the importance of the type of education policies, which are often cited as part of the economic success of East Asian and Southeast Asian economies, with their emphasis on strong primary and secondary education, and which might have been defi cient in South Asia. Thus, the low-skill, bad-job trap can be addressed through training vouchers, for example. These would be fi nanced by government revenues; and would aim at compensating the fi rms for providing training and the workers for acquiring the resulting skills. Investment tax credits and depreciation allowances can help overcome the investment problem derived from the complementarities between capital and labor.
ThemeApRev.indd 78ThemeApRev.indd 78 08/08/2005 11:33:51 AM08/08/2005 11:33:51 AM

79
Needless to say, breaking the cycle of mismatch and unemployment/underemployment requires a mobilization of resources. Yet those people who have the resources and access to correct training tend to be those in the urban sector in developing countries. Thus, governments need to make efforts to redress this imbalance, and ensure that their policies do not reinforce the problem by favoring the urban core. The pernicious link between the lack of skills and unemployment or underemployment must be tackled via state interventions, skills training, and labor market reforms, to lead to the employability of the labor force. Such interventions should also take into account the structural roots of the gaps between actual and expected competencies of the workforce.
Several East Asian economies, in particular Korea and Singapore, have undertaken a range of training programs since the 1970s. For example, in 1976, Korea introduced the Basic Law for Vocational Training that requires private fi rms with 150 or more employees to conduct in-house training for a portion of its employees, or to pay a training levy equivalent to no less than 6% of its wage bill. This levy is used to promote vocational training via government-sponsored vocational training schools. Likewise, Singapore has a series of programs such as the Vocational and Industrial Training Board, set up in 1979 and fi nanced with a levy of 1% on wages to subsidize efforts to upgrade the skills and expertise of employees or retraining of retrenched workers. Other initiatives are
Globalization and trade liberalization have resulted in the freer flow of goods, services, and capital among countries. Industries increasingly feel the need to adopt advanced technologies to remain competitive. This heightens the demand for more skilled-intensive and technology-literate workforce. Thus, the demand pattern for migrant workers shifts toward employing workers with higher skills. However, for a developing economy, this poses a major problem as the highly educated and trained people are attracted to much higher paying jobs in other countries, contributing to the “brain drain” phenomenon.
The propensity for skilled and educated foreign workers in the receiving countries has led to claims of deskilling of professional and highly skilled workers in developing countries. Indeed, a large number of migrants hold college degrees or are established professionals. Often, these tend to find lower-end jobs in the services sector as, for example, domestic helpers, caretakers, or cleaners. The problem is that the sending developing country incurred the cost of educating these people.
Soriano (1998), for example, indicates that a 1988 survey conducted by the Department of Labor and Employment of the Philippines showed that more than 50% of migrant workers had a tertiary education, when, at the time, only 17.2% of the total labor force and 19% of the total employed had reached this level. The survey also revealed that 4 out of 10 overseas workers had at least 5 years of work experience in the Philippines prior to working abroad, and 6 out of 10 were employed when they applied for an overseas job. In addition, 8 out of 10 claimed that the skills they had acquired in the Philippines were helpful in their overseas jobs. In contrast, half of those who reported that they had acquired skills while overseas perceived that such skills would not help in their search for local jobs when they returned home because they were either not in demand or not applicable in the Philippines. These results support those of a previous survey, which reported that at least 75% of overseas workers fully utilized their skills when abroad. Moreover, some even reported that they taught foreign workers from other countries.
What is the impact of migration on long-term development? One view is that international migration selects the best educated and the most skilled in the labor force. As such, it can undermine the country’s potential for development through the “brain drain”
effect. A different view is that overseas employment poses economic benefits, particularly in terms of foreign exchange earnings. It also helps ease the pressures from unemployment. At the microeconomic level, overseas remittances affect positively the level of income and savings of the receiving family. These savings are eventually translated into investments, which translates into higher capital accumulation. Finally, it is also argued that remittances tend to reduce income inequality.
Recent research by Beine et al. (2001) has questioned the traditionally accepted detrimental growth effect stemming from brain drain. The rationale is that in a poor economy with inadequate growth potential, the return to capital is likely to be low, which leads to a limited incentive to acquire human capital. However, the world at large values education, hence, allowing migration to take place increases the educated fraction of the population. Given that only a proportion of the educated would effectively migrate, it could well be that the average level of education of the remaining population increases. Therefore, one could distinguish two effects of the brain drain on growth. First, an ex ante “brain effect.” This follows from the fact that migration prospects foster investments in education because of higher returns to education abroad. Secondly, an ex post “drain effect,” which follows from the fact that some of the educated workers migrate.
The case for a “beneficial brain drain” occurs when the first effect dominates. Using cross-sectional data for 37 developing countries, Beine et al. (2001) conclude that the possibility of a beneficial brain drain cannot be rejected. Some tentative policy implications from their work are as follows: (i) from the perspective of the source countries, the imposition of barriers to the international mobility of skilled labor could end up having opposite effects and result in a decrease in the long-run level of human capital; (ii) the critical issue is that of the appropriate pricing of human capital in terms of tax and subsidy policies that would allow the human capital that is necessary for growth to be retained at home; (iii) subsidies to education are likely to be inefficient if the probability of leaving is high for the educated, but also if wage differentials are important—and, since the expected return to education is high, no subsidy is needed to foster human capital formation; and (iv) from the perspective of the destination countries, selective immigration policies could be reconsidered in the light of their impact on growth in the source countries.
Box 6.3: Labor Migration, “Brain Effect,” and “Brain Drain”
Sources: Beine et al. (2001); Soriano (1998).
ThemeApRev.indd 79ThemeApRev.indd 79 08/08/2005 11:33:52 AM08/08/2005 11:33:52 AM

80 Key Indicators of Developing Asian and Pacific Countries
the Basic Education and Skills Development program to teach basic skills in arithmetic and literacy to workers, and the creation of the National Productivity Board in 1972, and the National Productivity Council 1982, to promote productivity consciousness. Elsewhere, in Malaysia, training costs can be subsidized, and the Penang Skills Development Center puts together training courses contributed by multinational corporations to upgrade their suppliers’ skills. Thailand grants a 150% tax deduction for training expenses.
Finally, it must be added that Lewis (2004) has argued that the importance of education as a cause of success (development) or failure (underdevelopment) has been overrated. Education is not the way out of the poverty trap in which many DMCs are immersed; more education does not mean more growth. Lewis’s important point is that,
regardless of the institutional educational level, workers around the world can be adequately trained on the job for high productivity. He makes an important distinction between education and trainability. The former is defi ned as the means through which societies acquire political philosophies based on individual rights. In developing countries, education facilitates workers’ mobility not only across sectors but also across classes. The latter is defi ned as the capacity to understand how to use a given technology. Without denying the role of education in any society, it is the latter that matters for quick increases in productivity. A modern society needs educated people—not just engineers, chemists, and doctors, but millions of people who can write letters, fi ll in forms, explain insurance policies, and interpret statistical data from machines on factory fl oors. Some of these skills can be learned only at university; others are mastered at primary and secondary school. (See Boxes 6.4 and 6.5.)
The rapid pace of technological change demands workforces that can cope with significant social change. Human resource development policies in the form of general education, vocational/technical education or training, and on-the-job training or off-the-job training are effective means to develop the quality of workers and to promote economic growth.
Vocational/Technical education
DMCs are making efforts at increasing the number of workers who receive basic general education in an attempt to improve the quality of the labor force through increased literacy rates. All countries offer vocational/technical education in addition to general education. In Thailand, for example, general education provides work-oriented education to elementary school children, allowing them to gain work experience. Work-oriented education and vocational education are offered as elective and compulsory courses at both lower and upper secondary levels. In Nepal, technical schools have been established to produce basic and middle-level technical human resources locally for various development projects. In India, private and voluntary organizations have been involved in setting up diploma-level polytechnics, degree-level engineering colleges, and degree-level management institutes. In Singapore, the Institute of Technical Education is a postsecondary institution that equips secondary school leavers and adults with technical
skills and knowledge to meet the staffing needs of various sectors of industry. The Institute of Technical Education provides full-time institutional training and apprenticeship programs for school leavers as well as continuing education and training programs for the employed.
Problems in Vocational/Training Institutions
In Sri Lanka, school education emphasizes academic knowledge and the supply of vocational training is thereby reduced. In Taipei,China, workers opt to receive general education because vocational/technical schools do not have sufficient facilities. Moreover, these types of schools are regarded as institutes for those who fail to pass the entrance exams for upper secondary school. Also in Taipei,China, job training programs are offered by the authorities to improve unskilled workers' qualifications in the labor market. However, a college degree or high school diploma is more favored in Taipei,China than certificates from job training programs, especially in the information technology and computer industry. In Thailand, most vocational graduates tend to study further after graduation because they believe that their vocational education does not provide them with the required skills. In Viet Nam, it is easier to enroll in technical colleges than in universities. However, many high school students choose not to go on to technical colleges because the skills that they impart are of a lower level than those required by employers.
Box 6.4: Importance of Human Resources Development
Source: Muta (2003).
7. Conclusions: Making Full, Productive, and Decent Employment in Asia a Reality
This theme chapter has analyzed and proposed policies to address what are arguably Asia’s most pressing problems today, namely, unemployment and underemployment. While the forces of globalization, intense competition, and fast technological progress have brought immense
benefi ts to Asia’s workers during the last two decades, at least 500 million of them are still either unemployed or underemployed. Unemployment and underemployment are the ultimate causes of poverty and informality in the region. In some countries, the number of unemployed plus underemployed workers represents more than a quarter of the labor force. For this reason, the chapter has argued that attaining full, productive, and decent employment must be the priority for DMC policy makers in the march to a poverty-free Asia. Indeed, the surest means of fi ghting poverty is large-scale job creation.
ThemeApRev.indd 80ThemeApRev.indd 80 08/08/2005 11:33:53 AM08/08/2005 11:33:53 AM

81
Box 6.5: Policies to Reduce Mismatches in the Labor Market
Source: Muta (2003).
To minimize the labor mismatch derived from the increase in the labor force, it is necessary to increase employment opportunities. One measure to expand labor demand is to distribute labor, which tends to be concentrated in urban areas, toward rural areas. In Indonesia, economic policies focus on the development of small and medium enterprises in rural areas in an attempt to expand labor demand. Nepal has given tax preferences to firms in rural areas. Countries, where the primary sector plays a major role, are trying to expand labor demand by reforming the sector. Bangladesh, Philippines, Sri Lanka, and Thailand, where the domestic labor market cannot absorb the increasing labor force, have been exporting their excess labor supply. Countries like Nepal and Viet Nam have invited foreign investments in an attempt to develop their industries, thus increasing job opportunities in the private sector.
Measures to address the mismatch due to the imbalance in the demand for a skilled workforce include the development of abilities useful in work through school education and training after employment. General education plays an important role in enhancing knowledge and abilities. However, the knowledge and skills gained through school education often fail to match the needs of many firms. To solve this problem, many countries are establishing vocational/technical schools, integrating vocational training in formal education, and setting up training centers. In the Philippines, for example, under the Technical Education and Skills Development Authority, public and private sectors cooperate in offering skills training in an attempt to produce a high-quality
workforce. In India, a joint council of vocational and academic circles supports the vocational education program in the country. It is proposed to start an industry needs-driven program with trade and commerce associations for vocational/technical courses. Sri Lanka and Viet Nam are improving foreign language education in a move to increase labor demand by seeking foreign investment and business.
Some specific measures that require an active government role are as follows:• Stimulating the private sector;• Improving the agriculture sector by raising its productivity
through the introduction of new technologies and development of domestic resources;
• Creating jobs for experienced workers;• Improving curricula and teaching methods in vocational
education;• Developing short-term training courses to meet the needs of
industry;• Encouraging the private sector to operate training centers and
training schools;• Establishing training centers in rural areas;• Conducting trainers’ training;• Providing general education; and• Developing an international network of labor markets that
results in better methods for teaching new skills and adoption of cutting-edge technologies. For this, support from industrial countries is necessary.
Although the region’s success has been discussed at length in the literature, especially the phenomenal episode of growth in East Asia and Southeast Asia since the mid-1960s (only interrupted by the economic and fi nancial crisis of 1997–98), large parts of the region remain in a situation similar to those described by Lewis (1965) and Myrdal (1968) four decades ago. If anything, the situation has, perhaps, worsened in that dualism—the coexistence of the “modern” or “formal” with the “traditional” or “informal”—has become a more acute and notorious feature of labor markets in many DMCs. This is because countries in the region today have very well-developed formal sectors in industry and services that resemble those in industrial countries, while simultaneously having large informal sectors. In some cases, employment in the informal sector has grown more rapidly than in the formal sector. Moreover, in countries across Asia, due to the effects of increasing returns to scale and technological progress, output growth has led to less than proportional increases in employment growth. The policy dilemma in many DMCs is how to shift productivity gains derived from technological progress into higher real wages and aggregate demand.
Figure 1.1 earlier proposed a blueprint to achieve the objectives of full, productive, and decent employment. In the context of a DMC, full employment consists in maximizing the economy’s capacity to absorb and utilize its labor force, i.e., reducing unemployment as well as underemployment. It must be stressed that, in most DMCs, the real problem is underemployment, more than unemployment. This is the key variable for policy makers to monitor. To achieve full employment it will be necessary for them to create the conditions under which the formal sector generates more jobs, and improve earnings prospects in the informal sector. The objective of productive employment helps ensure that countries do not implement policies that generate underutilized employment (by, for example, increasing unneeded employment in state enterprises). Moreover, unless the objectives of full and productive employment become central to macroeconomic policy, and DMCs implement time-bound, feasible, credible, and measurable policies, Asia could continue displaying high growth rates of output during the next two decades and still be plagued by huge unemployment, underemployment, and poverty. Decent employment refers to the creation of employment that provides workers with basic rights (such as the freedom of association, protection from forced or compulsory labor, and elimination of discrimination) and security. This is most critical in the informal sector.
ThemeApRev.indd 81ThemeApRev.indd 81 08/08/2005 11:33:54 AM08/08/2005 11:33:54 AM

82 Key Indicators of Developing Asian and Pacific Countries
One of the key conclusions of this chapter is that, overall, labor market rigidities are not to be blamed for poor labor market outcomes (based on country studies for India, Indonesia, Philippines, and Viet Nam). This is a very important point, because many economists argue that the reason for such outcomes in the region has to do with rigidities in the labor market. Consequently, labor market reforms aimed at increasing fl exibility of the labor market are promoted as the solution. Hence, the chapter has rejected calls for across-the-board labor market reforms and has advocated well-designed country-specifi c piecemeal reforms that target the particular policies that may inhibit employment creation. This is not to dismiss the key role of a well-functioning labor market in order to create employment. Quite the opposite, in fact. Without a well-functioning labor market it will not be possible to achieve full, productive, and decent employment. A labor market is said to perform well if it achieves the objectives of effi ciency and fairness. These objectives imply that the job market will match workers with jobs, and that workers will be paid a wage rate that is related to their productivity. Moreover, a well-functioning labor market will protect workers against the risk of income loss. To this end, countries will have to reform labor markets to develop social protection systems and provide basic rights to all workers to achieve the objective of decent employment.
This chapter has argued that the policies that will have the highest impact in achieving full and productive employment are the growth-promoting policies, namely: (i) policies to improve incomes in the rural economy and in the urban informal sector. These are policies whose goal is to shift productivity gains into higher real wages and aggregate demand; (ii) export push, based not on low wages but on increased productivity; and (iii) industrial policy. The term “industrial policy” does not mean “picking the winners.” Industrial policy is a process of embedding private initiative in a framework of public action that encourages restructuring, diversifi cation, and technological dynamism. The essence of successful industrial policy is effective coordination, a role that must be undertaken by the government.
A simple checklist of growth-promoting includes the following: (i) develop an industrial policy framework to coordinate the private and public sectors’ activities. The
objective is to encourage restructuring, diversifi cation, and technological dynamism. Here, it is imperative to be creative; (ii) develop strategies for the manufacturing and services sectors; (iii) put forward a big-push rural development program in terms of targeted investments, in particular in infrastructure, in order to reduce migration from the countryside. This big push will have to be enough to place a suffi ciently large number of people in a situation where migration offers no attraction; (iv) develop policies to increase productivity and incomes in the informal urban sector. This sector is small in scale, labor intensive, and rather competitive. It has often been neglected by government and discriminated against via a range of measures that favor the modern sector; (v) develop policies to increase the proportion of workers in the formal sector to absorb workers from the informal sector; (vi) develop policies that encourage the use of labor-intensive methods of production and the development of intermediate technologies that do not entail reduction in employment; and (vii) push exports via increases in productivity.
The theme chapter has also argued that policy makers will also have to improve the quality of the human capital of the labor force of their countries, especially in terms of trainability, that is, the capacity to understand how to use a given technology. As globalization advances, the development of this capacity has become a necessary condition to be able to assimilate new technologies effectively, and the key to move up the development ladder. The chapter has argued that developing countries often become immersed in a series of traps and vicious cycles that derive from the low quality of their labor. For example, if workers have insuffi cient skills to operate modern machines, the latter will be underutilized. Consequently, fi rms will have little incentive to invest in the latest technology. This reduces workers’ productivity even more. One of the most important consequences of the lack of skilled workers is the adverse effect on product quality, while skill defi ciencies lead to the production and export of relatively low-quality and low-value products. Solving these problems will require implementing an education policy that places less emphasis on the quantitative link between occupation and formal education (to eliminate mismatches), and more attention on the structure and content of education, making it more appropriate for the economic environment in which most students will live.
ThemeApRev.indd 82ThemeApRev.indd 82 08/08/2005 11:33:55 AM08/08/2005 11:33:55 AM

83
Appendix 2.1: Age Distribution as a Share of Total Population (%)
2000 2005 Projections 2015 Projections
DMC 0–14 15–64 65+ 0–14 15–64 65+ 0–14 15–64 65+
East Asia China, People’s Rep. of 25 68 7 21 71 8 19 72 10 Hong Kong, China 17 72 11 14 74 12 13 73 14 Korea, Rep. of 21 72 7 19 72 9 14 73 13 Mongolia 35 61 4 31 66 4 26 70 4 Taipei,China 22 70 9 19 71 10 16 71 13
Southeast Asia Cambodia 41 56 3 37 60 3 34 62 4 Indonesia 30 65 5 28 66 6 25 68 6 Lao PDR 43 54 4 41 56 4 37 59 4 Malaysia 34 62 4 32 63 5 27 67 6 Myanmar 33 63 5 30 66 5 24 70 6 Philippines 38 59 4 35 61 4 30 65 5 Singapore 22 71 7 20 72 9 13 74 13 Thailand 26 68 6 24 69 7 21 70 9 Viet Nam 34 61 5 30 65 5 25 69 6
South Asia Afghanistan 47 51 3 47 51 3 45 52 3 Bangladesh 38 59 3 36 61 4 31 65 4 Bhutan 41 55 4 38 57 5 35 60 5 India 34 61 5 32 63 5 28 66 6 Maldives 44 53 4 41 56 4 36 61 3 Nepal 41 56 4 39 57 4 34 62 4 Pakistan 41 55 4 38 58 4 34 62 4 Sri Lanka 26 67 7 24 69 7 21 69 9
Central Asia Azerbaijan 31 63 6 26 67 7 21 72 7 Kazakhstan 28 66 7 23 68 9 21 71 8 Kyrgyz Republic 35 60 6 32 62 6 28 67 6 Tajikistan 42 54 3 39 57 4 33 64 4 Turkmenistan 36 60 4 32 64 5 27 69 4 Uzbekistan 37 58 4 33 62 5 28 67 4
Pacific DMCs Fiji Islands 33 63 3 32 64 4 28 67 5 Micronesia, Fed. States of 40 56 4 39 58 3 38 58 4 Papua New Guinea 42 56 2 40 57 2 34 63 3 Samoa 41 55 4 41 55 5 34 61 5 Solomon Islands 42 55 2 41 57 2 36 61 3 Tonga 38 57 6 36 58 6 31 62 7 Vanuatu 42 55 3 40 57 3 36 61 4
Sources: United Nations (2005); DGBAS (2001 and 2003).
APPENDIXES
ThemeApRev.indd 83ThemeApRev.indd 83 08/08/2005 11:33:56 AM08/08/2005 11:33:56 AM

84 Key Indicators of Developing Asian and Pacific Countries
As noted in the main body of Section 2, unemployment and underemployment are probably Asia’s most pressing problems. They are different manifestations of essentially the same phenomenon, namely, an inadequacy in the economy’s capacity to employ its labor force. In industrial countries, excess supply manifests itself mostly in terms of unemployment. Social security and unemployment provisions take case of those affected. In contrast, in developing countries, due to the lack of a support system for the unemployed, workers must work. So the problem manifests itself in terms of underemployment, the bottom line of which is low productivity, caused by a lack of capital. Unemployment in developing countries is the extreme case of lack of employment. In this appendix both unemployment and underemployment are briefl y reviewed from a theoretical point of view. This is important for a full understanding of discussions of the need to reform labor markets.
Since less developed countries are thought to be less homogeneous than industrial countries, it is common to analyze developing economies in terms of “dual” economy models, that is, models with two sectors—one sector that, depending on model specifi cs and the choice of the modeler, has been variously called modern, formal, industrial, or urban, and the other variously called traditional, informal, agricultural, or rural. Nobel Laureate Arthur W. Lewis’ (1954) model continues being the starting point (at least from a conceptual point of view) of most analyses of developing countries from the point of view of dualism. 71 The Lewis model is a long-run analysis of the development of a dual economy, which traces the path of a poor economy gradually industrializing over time. The central problem addressed is that of how to transfer “surplus” labor from unproductive to productive employment to promote growth.
This question was fi rst tackled by Lewis (1954). The essence of labor market dualism is that workers earn different wages depending on the sector of the economy in which they can fi nd work. Surplus labor is defi ned as that part of the labor force that can be moved without
71 See also Fields 2004b.
reducing the total amount of output produced. Lewis assumed that output per worker is higher in the modern sector (synonymous with the industrial or urban sectors in his framework) as compared to the traditional sector (synonymous with the agricultural or rural sectors) and that the latter sector is characterized by the existence of an unlimited labor supply at the “subsistence wage” (m) (Appendix Figure 2.2). This means that at the subsistence wage, there is an excess supply of labor and the excess supply is suffi ciently large so that no employer worries, when considering employing more workers, about having to increase wages. This also means that the marginal product of labor in the traditional sector is negligible or zero, or at least below the subsistence wage. This feature implies that if some workers from the agriculture sector obtained alternative jobs, the rest could maintain, and even increase, output.72 There is no unemployment in this model.
In Lewis’s model, the traditional sector follows the classical authors, who assumed that rural wages will not fall below the minimum due to a number of institutional factors, namely, people need a minimum wage to subsist. There are three main means to escape from the tendency to diminishing returns and zero marginal product in agriculture: (i) by increasing productivity faster than population through the absorption of more and more of the agricultural population into industry; (ii) through technological progress in the agriculture sector, which will increase the marginal product of labor; and (iii) by accumulating capital, which both raises productivity and stimulates technological progress.
If the modern sector wishes to draw labor from the unlimited supply of labor, it cannot do it at the subsistence wage. It will have to pay a higher wage (w) in order to attract workers into the modern sector, and this higher wage rate depends on factors such as the higher real living 72 While the characterization of agricultural activity as one of
surplus labor is not without its critics (Box 1.1 indicated that the phenomenon of growth without employment has exposed the problems of the development strategy encapsulated in this model; see also Basu 1997, chapter 7), it remains the case that a large proportion of Asia’s farmers (including agricultural workers) have low productivity and their earnings are very low.
Appendix 2.2: The Lewis and Harris-Todaro Models
The British have exploited India through its cities, the latter have exploited the villages. The blood of the villages is the cement with which the edifice of the cities is built.
Gandhi
ThemeApRev.indd 84ThemeApRev.indd 84 08/08/2005 11:33:57 AM08/08/2005 11:33:57 AM

85
costs in the modern sector (in general, urban areas) and job uncertainty. Given this, Lewis argued that capitalists, the owners of the modern sector, have an interest in holding down productivity in the agriculture sector. L denotes the total amount of labor in the economy. The marginal product curve of labor in the traditional sector is horizontal over a considerable stretch. RO is the origin of the traditional sector and MO is the origin of the modern sector. Initially, the marginal product curve of labor in the modern sector is given by 1 1A B . To maximize profi ts, the modern sector employer employs M 1O L units of labor. The remaining labor, i.e., M 1 R 1L O L O L− = remains in the rural sector, with the marginal worker earning m; or workers in excess of what the modern sector can employ at this wage rate earn also the subsistence wage m.
What matters now is what occurs in the model. For this purpose, it is assumed that only modern sector capitalists save and invest. The expansion of the modern sector and the rate of absorption of labor from the traditional sector depend on the use made of the profi ts obtained. If period 1’s profi ts ( 1 1A B w ) are reinvested in the modern sector, leading to greater capital formation, it will lead to an increase in the total product of labor. In these circumstances, the marginal product of labor will increase to 2 2A B , which means that if wages remain constant, the modern sector will be able to employ more labor ( M 2O L ), and will draw labor from the traditional sector (rural employment becomes
R 2O L ). The surplus will further increase to 2 2A B w , and on the assumption that it is further reinvested, it will continue drawing workers from the traditional sector. This relentless
cycle of surplus, reinvestment, and growth continues, and steadily the modern sector absorbs the rural one up to the point where M TO L labor is employed in the modern sector. This is the fi rst major point of this model. The second one is that when all the surplus labor in the traditional sector has moved to the modern sector, wages will start rising in both sectors. At this point, the traditional sector’s wage rate ceases to be below that of the modern sector. Also at this point, the unlimited supplies of labor have been exhausted and the supply of labor to the industry sector becomes less than perfectly elastic. The economy will enter a stage of self-sustaining growth.
Lewis (1954) mentioned that an urban-rural wage differential of about 30% was necessary to attract labor to the industry sector. What has in fact happened in many cases is that the urban-rural wage differential has increased and is beyond this level. This has led to a huge migration to urban areas. It is worth recalling that there is no unemployment in the Lewis model. In period 1,
M 1O L workers are employed in the urban sector at a wage w, and R 1O L workers are employed in the rural sector at the lower wage rate m. The wage rate differential should attract workers from the subsistence into the modern sector. Most likely however, not all these workers would fi nd jobs instantaneously in period 1 in the modern sector, and therefore, there would be some urban unemployment (this situation remains at each point in time). Migration has, thus, served to transfer underemployment from rural to urban areas.
Appendix Figure 2.2: Economic Development with Unlimited Supplies of Labor
Source: Basu (1997, Chapter 7).
A2
Rural marginalproduct of labor
w
OM L1 L2
B1 B2
LLT
m
OR
A1
ThemeApRev.indd 85ThemeApRev.indd 85 08/08/2005 11:33:58 AM08/08/2005 11:33:58 AM

86 Key Indicators of Developing Asian and Pacific Countries
The Harris-Todaro (1970) model constitutes a fundamental contribution to the understanding of the migration process and its links with unemployment (see also Basu 1997, chapter 8). In this model, migration is a response to differences in “expected” urban and rural incomes. As a result, the observed accelerated rates of migration from rural to urban areas in developing countries are rational decisions from the private “expected” income maximization viewpoint of individual migrants. The two main economic factors involved in the decision to migrate are the existing rural-urban real wage differential and the degree of probability of fi nding a job in the modern sector. Two important factors are at play. First, the rural-urban differential alone does not explain migration, given the relatively high urban unemployment. Second, the positive stimulus of the differential is likely to be restrained by the negative effect of the risk that a migrant may not fi nd a job in the modern sector. However, even if the probability of fi nding a well-paid job in the short term is low, hence the expected rural income might be higher than the expected urban income, it may still be rational to migrate. Indeed,
if migrants take a longer view of their permanent income prospects, and if they expect that the probability of fi nding a job will increase as they become more familiar with the urban labor market, then the decision to migrate will be justifi ed.
An important conclusion of the Harris-Todaro model is that unemployment in the urban sector will increase if the elasticity of the urban labor supply (by migration) with respect to the urban-rural wage differential exceeds the expected urban-rural wage differential as a proportion of the urban wage times the unemployment rate. Indeed, in this model, while a reduction in the actual urban wage reduces the equilibrium level of unemployment (an increase in the rural wage will reduce it), paradoxically, an increase in the rate of new job creation will raise the equilibrium level of unemployment by increasing the probability of obtaining a job and encouraging migration. This implies that the success of policies, such as wage subsidies to reduce unemployment, depends on whether the increase in the demand for labor is greater or lower than the induced supply.
ThemeApRev.indd 86ThemeApRev.indd 86 08/08/2005 11:34:00 AM08/08/2005 11:34:00 AM
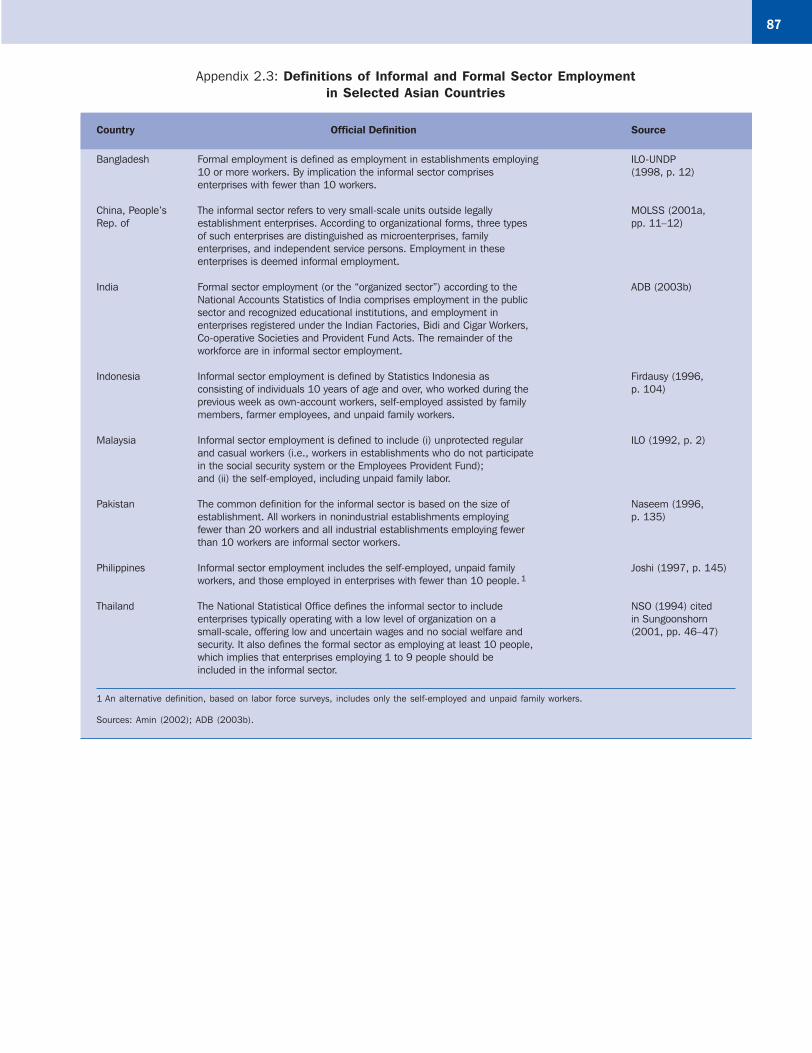
87
Appendix 2.3: Definitions of Informal and Formal Sector Employment in Selected Asian Countries
Country Official Definition Source
Bangladesh Formal employment is defined as employment in establishments employing ILO-UNDP 10 or more workers. By implication the informal sector comprises (1998, p. 12) enterprises with fewer than 10 workers.
China, People’s The informal sector refers to very small-scale units outside legally MOLSS (2001a,Rep. of establishment enterprises. According to organizational forms, three types pp. 11–12) of such enterprises are distinguished as microenterprises, family enterprises, and independent service persons. Employment in these enterprises is deemed informal employment.
India Formal sector employment (or the “organized sector”) according to the ADB (2003b) National Accounts Statistics of India comprises employment in the public sector and recognized educational institutions, and employment in enterprises registered under the Indian Factories, Bidi and Cigar Workers, Co-operative Societies and Provident Fund Acts. The remainder of the workforce are in informal sector employment.
Indonesia Informal sector employment is defined by Statistics Indonesia as Firdausy (1996, consisting of individuals 10 years of age and over, who worked during the p. 104) previous week as own-account workers, self-employed assisted by family members, farmer employees, and unpaid family workers.
Malaysia Informal sector employment is defined to include (i) unprotected regular ILO (1992, p. 2) and casual workers (i.e., workers in establishments who do not participate in the social security system or the Employees Provident Fund); and (ii) the self-employed, including unpaid family labor.
Pakistan The common definition for the informal sector is based on the size of Naseem (1996, establishment. All workers in nonindustrial establishments employing p. 135) fewer than 20 workers and all industrial establishments employing fewer than 10 workers are informal sector workers.
Philippines Informal sector employment includes the self-employed, unpaid family Joshi (1997, p. 145) workers, and those employed in enterprises with fewer than 10 people. 1
Thailand The National Statistical Office defines the informal sector to include NSO (1994) cited enterprises typically operating with a low level of organization on a in Sungoonshorn small-scale, offering low and uncertain wages and no social welfare and (2001, pp. 46–47) security. It also defines the formal sector as employing at least 10 people, which implies that enterprises employing 1 to 9 people should be included in the informal sector.
1 An alternative definition, based on labor force surveys, includes only the self-employed and unpaid family workers.
Sources: Amin (2002); ADB (2003b).
ThemeApRev.indd 87ThemeApRev.indd 87 08/08/2005 11:34:01 AM08/08/2005 11:34:01 AM

88 Key Indicators of Developing Asian and Pacific Countries
The most commonly held approach to international competitiveness focuses on differences in unit labor costs (ulcs).73 Unit labor costs are defi ned as the cost of worker compensation and benefi ts per unit of output. Algebraically, ulcs are defi ned as the ratio of the nominal wage rate (e.g., dollars per worker) to labor productivity, where the latter is defi ned as the “quantity” of output produced per worker (e.g., bushels of corn per worker). At any level of aggregation, however, the quantity of output (a physical magnitude) has to be proxied by defl ated value added. Therefore, it becomes (Felipe 2004a):
( / )/n n
n n
w w Lulc P
VA P L VA
⎛ ⎞⎟⎜ ⎟= =⎜ ⎟⎜ ⎟⎜⎝ ⎠ (1)
where wn denotes the nominal wage rate, L is employment (e.g., number of workers), nVA is nominal value added and P is the output defl ator. ( /n nw L VA ) can be referred to as the “pure ulc effect,” and P is the “price adjustment effect.”
At the most intuitive level, ulcs are used as a measure of competitiveness because wages are a major component of costs, and hence, of prices. But costs will be reduced if, for any given money wage, the level of productivity is higher. The standard argument is that the lower the ulc the more competitive the economy is. Unit labor costs are an important variable for policy making. In the standard interpretation, if the ulc of a country grows faster than that of its competitor(s), this will reduce market shares at home and abroad, negatively affect economic growth, and increase unemployment.
A concern with expression (1) for purposes of intercountry comparison is how to translate the costs calculated for individual countries into comparable or common currency units. The most common method is to multiply country i’s local currency iulc by its current nominal exchange rate against the numeraire currency, usually the US dollar (ER—expressed in terms of units of the country’s currency per dollar). There is also a problem with output (or productivity) since it is also measured in terms of each country’s currency. Therefore, a meaningful comparison of ulcs requires the conversion of both wages (numerator) and output (denominator) into a common currency (e.g., US dollars). There is an added issue, however, if one converts output (value added) into dollars using market exchange rates. This is the well-known problem that it is not unusual for the price of a particular good to differ substantially across countries when
73 Some authors have tried to define the concept of competitiveness more broadly by including issues such as the country’s capacity to export (and thus gain market share). See, for example, Lall (2001).
translated into common currency units at market exchange rates. Notice that this problem arises because aggregate output is not a physical quantity, but a value magnitude, however defl ated. One proposal to deal with this problem has been the use of purchasing power parities (PPPs). A PPP exchange rate is the ratio of the local currency price of a particular basket of goods in two different countries, e.g., the number of pesos it takes to buy a hamburger in the Philippines relative to the number of dollars it takes to buy a hamburger in the US.
Suppose the ulc in expression (1) is adjusted by the market exchange rate in the numerator and by the PPP exchange rate in the denominator. The ulc becomes:
(2)( / )
( / )/
n n
n n
w ER w L PPPulc
VA PPP L VA ER
⎛ ⎞ ⎛ ⎞⎟⎜ ⎟⎜⎟= =⎜ ⎟⎜⎟ ⎟⎜ ⎟⎜⎟⎜ ⎝ ⎠⎝ ⎠
where, once again, ( n nw L/VA ) is the “pure ulc effect,” and /xr PPP ER= is the “price adjustment effect.”
How does a fi rm (country) try to maintain a low ulc? This issue can be analyzed by looking at the elements of expressions (1) or (2):
(i) fi rst, by keeping nominal wages ( nw ) as low as possible;
(ii) second, by increasing labor productivity ( /VA L ), where ( / )nVA VA P= in expression (1), and
( / )nVA VA PPP= in expression (2). There are four mechanisms to achieve this. First, by increasing physical investment, that is, by increasing capital deepening (the capital-labor ratio). This has a triple effect: (a) each worker becomes more productive with a higher amount of capital; (b) the introduction of machines that bring in more up-to-date production technologies raises labor productivity; and (c) technological progress often destroys employment, at least in the short run. The second mechanism is investment in human capital (e.g., training). The third mechanism to increase labor productivity is through institutional factors such as change in work rules, i.e., the way labor is organized to operate the equipment, and by improving the rules and regulations governing competition. The fourth mechanism used by fi rms to increase labor productivity is to increase unpaid labor time. This often happens in developing countries due to lax implementation of labor laws;
(iii) third, in terms of equation (2), through nominal devaluations of the exchange rate ( ER ). At the fi rm level, nothing can be done in this area. At the national level, however, authorities can manipulate their exchange rates and intervene in the foreign exchange market.
Appendix 3.1: Unit Labor Costs and Competitiveness
ThemeApRev.indd 88ThemeApRev.indd 88 08/08/2005 11:34:01 AM08/08/2005 11:34:01 AM

89
For all practical purposes, fi rms (countries) try to keep down ulcs through a combination of all these mechanisms. Nominal wages ( nw ) and labor productivity ( /VA L ) tend to move together since the latter is the most important determinant of the former; the question is, which of the two moves faster? In this context, the key concern is how gains in labor productivity are passed on to wages in the labor-capital bargaining process.
One important implication of this brief discussion is that correctly calculating ulcs is a diffi cult task for it requires good and comparable statistics across countries. Moreover, often, in empirical applications, researchers do not discuss clearly and openly how ulcs are calculated.
It will be appreciated that the expression( / )L
n ns w L VA≡ , what was called the “pure ulc effect,” is nothing but the labor share in output, which implies that
Lulc s P= in the case of expression (1) and Lulc s xr= in the case of expression (2). This point has three important implications. First, competitiveness, measured or interpreted in terms of unit labor costs, is not just a “technical” concept. This is because it embeds the factors that affect the functional distribution of income between the social classes, i.e., between labor and capital.
Second, if the ulc is decreasing (and thus the economy is considered as becoming more competitive), it means, all other things equal, that the labor share Ls is decreasing, and thus, the capital share in output must be increasing (since both factor shares add up to one). This consideration has profound implications for understanding growth in an economy, the policy implications of ulcs, and discussions about competitiveness.
Third, it can be argued that the analysis of competitiveness could equally be carried out in terms of what could be called the unit capital cost (ukc), defi ned as the ratio of the nominal profi t rate to capital productivity, i.e.,
(3)
( / )/
n n
n n
r r Kukc P
VA P K VA
⎛ ⎞⎟⎜ ⎟= =⎜ ⎟⎜ ⎟⎜⎝ ⎠
where nr is the nominal ex post profi t rate and K is the stock of capital. As above, ( / )K
n ns r K VA≡ is the capital share in output and thus, Kukc s P= (and similarly,
Kukc s xr= ). And it is easy to see that ulc ukc P+ = (and ulc ukc xr+ = ). Using a parallel argument to the one above with unit labor costs, the lower the ukc the more competitive the economy will be. Effectively, this means that the lower the capital share the more competitive the economy. The notion of ukc shifts the burden of competitiveness on to
capital, i.e., to become more competitive, capitalists have to accept lower profi t rates or increase the productivity of the capital invested.
Can both unit costs decrease simultaneously? The answer is yes, but to understand how this can happen, one has to look at both equations (1) and (3). Given that
(1 )K Ls s= − , the “pure” unit cost effects must move in opposite directions. The “price effect” is the same. Given this, if both ulc and ukc move in the same direction, it must be because the price effect dominates.
The left-hand side of Appendix Figure 3.1.1 shows the estimates of unit labor and capital costs for the Philippines for 1980–2003, both calculated with their own GDP defl ator ( P ), i.e., calculated as Lulc s P= and
Kukc s P= . The labor share is shown in Appendix Figure 3.1.2 (together with those of Indonesia, Malaysia, and Thailand). These labor shares incorporate the income of unincorporated enterprises (a large part of which is self-employment), typically shown under profi ts (“surplus” in national accounts terminology), as part of the wage bill. This is because in developing countries, it is known that most of this income is really wages. The unadjusted labor shares of these countries, computed as the ratio of wage payments to GDP from the national accounts, are only about 30% (hence the capital share is 70%). Computed with the adjustment, the labor shares (i.e., ulcs) are not signifi cantly different from those of industrial countries. It is worth mentioning that, except in Indonesia, labor shares show a downward trend.
Appendix Figure 3.1.1 indicates that both ulc and ukc have increased substantially. What is interesting is the source of this increase. On one hand, if the labor share of the Philippines has decreased, the increase in the unit labor unit cost must be exclusively the result of the increase in the price defl ator. On the other, the increase in the unit capital cost is due to the interaction of the increase in the capital share (one minus the labor share) and the increase in the defl ator.
The right-hand side of Appendix Figure 3.1.1 shows the Philippine ulc and ukc calculated with the ratio of the PPP to the nominal exchange rate, i.e., Lulc s xr= and
Kukc s xr= . Unit capital costs display a slight increase. These results are induced by the relative constancy of xr .
The aim of this brief analysis has been to show that the discussion of unit labor (and capital) costs depends on the manner in which they have been computed, which in turn can lead to very different conclusions.
ThemeApRev.indd 89ThemeApRev.indd 89 08/08/2005 11:34:03 AM08/08/2005 11:34:03 AM

90 Key Indicators of Developing Asian and Pacific Countries
1980 1983
0
20
40
60
80
100
%
Indonesia
Labor Share
Malaysia
20
40
60
100
Labor Share
Philippines
Labor share
Thailand
Labor Share
Appendix Figure 3.1.2: Wage Shares in GDP, Selected DMCs
1986 1989 1992 1995 1998 2001 1960 1964 1968 1972 1976 1980 1984 1988 1992 1996 2000
1980 1983 1986 1989 1992 1995 1998 2001
0
20
40
60
80
100
%
80
%
0
20
40
60
80
100
%
0
1980 1983 1986 1989 1992 1995 1998 2001
With GDP Deflator
0
0.1
0.2
0.3
0.4
0.5
0.6
0.7
0.8
Unit labor costs
Unit capital costs
With PPP and Nominal Exchange Rate
0.00
0.05
0.10
0.15
0.20
0.25
0.30
0.35
Unit labor costs
Unit capital costs
Appendix Figure 3.1.1: Unit Labor Costs and Unit Capital Costs, Philippines
1980 1982 1984 1986 1988 1990 1992 1994 1996 1998 2000 2002 1980 1982 1984 1986 1988 1990 1992 1994 1996 1998 2000 2002
Source: Authors’ calculations.
Source: Felipe (2004b).
ThemeApRev.indd 90ThemeApRev.indd 90 08/08/2005 11:34:06 AM08/08/2005 11:34:06 AM

91
In the classical and neoclassical models, the idea of fairness, i.e., that workers are paid according to their productivity, is presented in terms of the equality of the wage rate and marginal productivity. In this model, a profi t-maximizing fi rm sets its marginal revenue equal to its marginal cost of production. If a fi rm hires labor in a perfectly competitive labor market, a certain money wage ( w ) must be paid to each extra worker hired. The additional cost of hiring an extra unit of labor ( L∆ ) will be w L∆ . The extra revenue generated by an additional worker is the extra output produced ( Q∆ ) multiplied by the output price ( P ), i.e., P Q∆ . It pays for a profi t-maximizing fi rm to hire labor as long as w L P Q∆ < ∆ . To maximize profi ts requires equality between the two, which implies that ( / ) ( / )Q L w P∆ ∆ = . In other words, a fi rm should hire labor until the marginal product of labor ( /Q L∆ ∆ ) equals the real wage rate ( /w P ). This model says that the wage rate is determined by what the last employer is willing to pay in order to attract and employ a worker, and by what the last worker requires in order to be attracted and employed. This idea lies behind the well-known result that the demand for labor is an inverse function of the real wage rate: the lower the real wage the more labor will be profi tably employed.
On the other hand, the supply of labor is derived by assuming that workers maximize their utility, which depends on how they divide their time between work and leisure. In this setting, a worker decides how many hours he works on the basis of his preferences between income and leisure. The supply of labor is a positive function of the real wage rate, indicating that at higher wage rates, workers will be willing to work more hours. This is because a rise in the real wage rate makes leisure more expensive in terms of forgone income. It also tends to increase the supply of labor.
However, this representation of the labor market leads to some theoretical and empirical problems. To start with, the standard notions of labor demand and supply curves that underlie the neoclassical analysis are not straightforward concepts (Keen 2001, Chapter 5). It must be remembered that aggregate production functions, the sine qua non of the concept behind the notion of a labor demand function at the aggregate level, can be derived theoretically only under conditions that no real economy satisfi es (Felipe and Fisher, 2003). Despite this important shortcoming, orthodox analyses proceed on the premise that wage increases entail reductions in employment as predicted by neoclassical theory (for example, Heckman and Pagés 2004, Table 4 and pp. 39–43).
At the empirical level, Felipe and McCombie (2004) have shown that the sacrosanct negative relationship between employment and the wage rate that many economists believe in, is the only possible result when estimating the so-called labor demand function. However, Felipe and McCombie (2004) show that it is an artifact. The reason is that the equation estimated is an approximation to the income accounting identity that relates the value of output to that of the wage bill plus total profi ts. This identity determines a priori the negative relationship between employment and the wage rate.
The notion of labor supply is also problematic. Long ago, Joan Robinson put it as follows: “The orthodox conception of wages tending to the marginal disutility of labour, which has its origins in the picture of a peasant farmer leaning on his hoe in the evening and deciding whether the extra product of another hour’s work will repay the extra backache, is projected into the modern labour market, where the individual worker has no opportunity to decide anything except whether it is better to work or starve” (Robinson 1942, pp. 2–3; her emphasis). Reviving this view, Keen (2001, pp. 124–125) has argued that: “The vision of a worker deciding how many hours to work on the basis of his/her preferences between income and leisure, and offering more labour as the wage rate rises is, like so much else of economic theory, superfi cially appealing. But […] how can one enjoy leisure time without income?” In real life, most leisure activities cost money, hence, how can one enjoy leisure time without income?
Blanchfl ower and Oswald (1994) have introduced the
notion of the “wage curve,” namely, a negative empirical relationship between the wage and unemployment rates, where causality is thought to run from the unemployment level to the wage level. This means that employees who work in areas of high unemployment earn less, other things being equal, than those who are surrounded by low unemployment. The elasticity of the wage rate with respect to unemployment is estimated at about -0.1. This is a robust fi nding across countries, and it is also present within nations across different periods of time. The important observation is that in standard economic analysis, wages and unemployment are positively associated. The authors argue that the “wage curve” is an equilibrium locus of wages and unemployment rates that replaces the market level labor supply function. These fi ndings lead the authors to argue that the standard competitive demand-supply framework is the wrong way to think about the labor market.
Appendix 3.2: Some Theoretical and Empirical Problems with the Standard Analysis of the Labor Market
ThemeApRev.indd 91ThemeApRev.indd 91 08/08/2005 11:34:09 AM08/08/2005 11:34:09 AM

92 Key Indicators of Developing Asian and Pacific Countries
Finally, Thurow (1975, pp. 211–230) has argued that it is diffi cult to use the marginal productivity theory of factor pricing, i.e., the neoclassical model, at the empirical level. His reason is that the theory could exist at different levels. As indicated above, a conclusion of this theory is that a profi t-maximizing fi rm should hire labor up to the point at which the marginal product of labor equals the real wage rate. But what does this mean and how does one test it? Does it mean that if the real wage rate is above the marginal product then labor is “expensive”? Thurow argues that “In its most rigorous form, marginal productivity states that each individual factor of production is paid his, her, or its
marginal product at each instant in time. From this position there exists a continuum of possibilities where individual factors are paid their marginal products but only over longer periods of time. At the other end of this continuum, factors are paid their marginal products, but only over the course of their entire lifetimes” (Thurow 1975, p. 212). He concludes: “Fortunately or unfortunately, each reader is going to have to construct his or her own marginal-productivity model […] As long as marginal productivity is left as a general amorphous theory, it can neither be used nor criticized” (Thurow 1975, p. 230).
Appendix 3.3: Neo-Keynesian Labor Market
In the 1980s, a new generation of Keynesian economists emerged, referred to as the “new Keynesians.” The proponents of this school of thought share basic principles with the neoclassical school, but show how market economies fail to deliver effi cient outcomes in the face of informational asymmetries. Today, new Keynesians use different versions of the nonaccelerating infl ation rate of unemployment (NAIRU) theory to explain infl ation and unemployment. The interesting thing is that the NAIRU theory is used to give policy recommendations that are very similar to those of the neoclassical school. Indeed, the NAIRU also identifi es the infl exibilities of labor markets as the culprits for the rise of unemployment, but through a different argument. Hence, for them too, labor market reforms are the solution.
The NAIRU theory is based on bargaining models whose underlying rationale is that there is a confl ict between workers and fi rms. This confl ict is mediated by a bargaining process, not by the market. The NAIRU is the rate of unemployment that generates consistency between the target real wage of workers and the feasible real wage determined by labor productivity and the fi rm’s mark-up.
The NAIRU is both a theory of infl ation and unemployment with, at its core, a trade-off between the two. The NAIRU is determined by labor market institutions, and infl ation by the difference between actual unemployment and the NAIRU, so that at any time there will be only one rate of unemployment that allows for a stable rate of infl ation. The theory takes wage bargaining as its starting point. Unlike in the neoclassical model, the
real wage does not adjust to clear the labor market so as to ensure full employment. Rather, nominal wages are the result of a bargaining process between fi rms and unions. The nominal wage depends on the bargaining strength of the two parties. Unemployment affects the power of labor negatively. For their part, prices—according to the theory—are set by fi rms with market power and depend on aggregate demand. Consequently, unemployment is an equilibrium phenomenon. If the real wages implied by the wage bargaining process and by the price-setting mechanism are inconsistent with each other, unexpected infl ation will occur.
In terms of policy implications, as indicated above, the NAIRU theory is similar to the standard neoclassical arguments: frictions and infl exibilities in the labor market are the cause of unemployment. Labor market policies, such as minimum wages, increase equilibrium unemployment in the NAIRU theory; whereas in the standard neoclassical model, they increase unemployment because the labor market will be out of equilibrium. Thus, curbing unemployment benefi ts and reducing minimum wages are standard prescriptions. In this sense then, there are great similarities between the NAIRU and the standard neoclassical theories although they are signifi cantly different—the NAIRU is not based on the notion of a real wage set in the labor market as the result of the interaction between labor supply and demand. Also, any attempt by fi scal or monetary policy to move unemployment away from the equilibrium level will only lower unemployment temporarily and cause infl ation.
ThemeApRev.indd 92ThemeApRev.indd 92 08/08/2005 11:34:10 AM08/08/2005 11:34:10 AM

93
Appendix 3.4: Keynesian and Marxian Theories of Unemployment
Some theories view unemployment as being caused via a mechanism different from that of the neoclassical model, hence, they propose different solutions. For example, the Keynesian and Marxian models deny the mechanisms that the neoclassical model claims a market economy has. The Keynesian model denies that market economies have an “automatic” or self-adjusting mechanism to eliminate unemployment caused by the existence of rigidities and market failures. Keynes advanced three reasons. First, there is no feedback from unemployment that guarantees that real wages will fall. An increase in unemployment will probably reduce nominal wages; but in a recession, prices will also decrease (Appendix 3.5 presents Keynes’ argument in more detail). The result is that real wages need not fall. Second, a signifi cant part of effective demand depends on investment, which depends on unknown “animal spirits.” Third, fi nancial markets are often a source of destabilization. In sum, markets do not work like the simple demand and supply model and, therefore, unemployment is a natural consequence. For Keynes, there was no “invisible hand” channeling self-interest into some social optimum. He rejected the idea that capitalist economies gravitate smoothly to a general equilibrium where all markets clear and where full employment prevails. His vision of the functioning of the economy was one of asymmetry in the relation between markets. He developed a theory of effective demand where output and employment are determined by investment expenditures and other autonomous expenditures (e.g., exports, government expenditures). In this theory, equilibrium in the goods market (mostly set by investment decisions) determines the level of employment. The labor market follows the developments in the goods market. In sum, employment growth is determined by demand growth, which is set by investment decisions.
Therefore, for Keynes, unemployment was the result of various demand shocks, mostly through business investment and, more specifi cally, low accumulation. The feedback from unemployment to the rest of the economy is either slow or dysfunctional, as it materializes in a defl ationary tendency rather than a decrease in the real wage rate. In particular, involuntary unemployment is likely to be a feature of the labor market if money wages are rigid. But Keynes argued that fl exibility of nominal wages would be unlikely to generate powerful enough forces that could lead the economy to full employment. The policy implication is that well-designed government interventions to achieve full employment are necessary via fi scal and monetary policies.
A different theoretical position is that unemployment is functional to capitalism. In the Marxian version, capitalism creates a “reserve army.” Marx maintained that capitalist production always coexists with noncapitalist production, such as subsistence agriculture, and draws part of its labor supply from these noncapitalist sectors through migration and the mobilization of female and child labor. Marx viewed these sectors and groups of the economy as reserve armies of labor. When a capitalist economy is growing rapidly enough so that the reserve army of unemployed is depleted, then workers will utilize their increased bargaining power to raise wages and shift the distribution of income in their favor. Profi ts are correspondingly squeezed. As a result, capitalists’ animal spirits are dampened and they reduce investment spending. This then leads to a fall in job creation, higher unemployment, and a replenishment of the reserve army. The reserve army is, in effect, the instrument that capitalists use to prevent signifi cant wage increases and thereby maintain profi tability.
ThemeApRev.indd 93ThemeApRev.indd 93 08/08/2005 11:34:11 AM08/08/2005 11:34:11 AM

94 Key Indicators of Developing Asian and Pacific Countries
Appendix 3.5: Can a Reduction in Nominal Wages Stimulate Employment?
industry as a whole relating the quantity of employment to different wage levels.
Where does the fallacy lie? Keynes argued that the demand schedules of particular industries can only be constructed on some fi xed assumption, both, as to the nature of the demand and supply schedules of other industries and as to the amount of aggregate effective demand. The important point is that it is invalid to transfer the argument to the industry as a whole unless one also transfers the assumption that aggregate effective demand is fi xed. However, this assumption renders the argument irrelevant. Indeed, while it is true that a reduction in nominal wages with effective demand unchanged will induce an increase in employment, the precise question is whether the reduction in nominal wages will or will not be accompanied by the same aggregate effective demand as before, or by a level of aggregate effective demand that has decreased proportionally less than the decrease in nominal wages. But, Keynes concluded, if the classical theory is not allowed to extend by analogy its conclusions for a particular industry to the industry as a whole, then it is unable to answer the question of what will be the effect of a reduction in nominal wages on employment.
Keynes contended that, in some circumstances, it is indeed possible that a reduction in nominal wages leads to an increase in employment, but his reasoning is different from that of the classical theory. The simplest way of showing it is by way of rebutting the conclusion that a reduction in nominal wages increases employment because it reduces the cost of production. Keynes argued that it is not unlikely that the individual entrepreneur, realizing that his costs decrease, will overlook the repercussions on the demand for his product and will act on the assumption that he will be able to sell a higher output than before at a profi t. But will this indeed happen? This will occur only if society’s marginal propensity to consume equals unity, so that there is no gap between the increment in income and the increment in consumption. In general, a reduction in nominal wages will involve a redistribution of real income that will lead to a decrease in the propensity to consume; or, if the reduction in nominal wages has the effect of shifting upward the marginal effi ciency of capital schedule, the amount of investment will increase. Otherwise, entrepreneurs will not be able to sell a higher output at a profi t and employment will fall back to its previous level. The reason is that if fi rms offer a level of employment (assuming they could sell their output at the expected
Classical theory assumes that the economic system has a self-adjusting character that depends on the fl uidity of nominal wages. Rigidity is the cause of maladjustment. The theory posits that a reduction in nominal wages will, other things being equal, stimulate demand by diminishing the price of the fi nished product, and will therefore increase output and employment up to the point where the reduction in nominal wages that employees have agreed to accept is offset by the diminishing marginal effi ciency of labor as output increases.
As is well known, Keynes (1936, Chapter 19) challenged this proposition, in particular that a reduction in nominal wages can stimulate the economy. To be precise, Keynes did not question this; rather, he argued that this is possible in certain circumstances, but the way to reach this conclusion is not through the classical arguments.
Keynes argued that the classical position is tantamount to assuming that the reduction in nominal wages leaves demand unaffected. Some economists, he noted, would maintain that there is no reason why aggregate demand should be affected, since it is determined through the quantity theory of money. Some economists may also argue that as wages go down, profi ts must increase. However, Keynes contended that a reduction in nominal wages must have some impact on aggregate demand via a reduction in the purchasing power of workers. Moreover, he continued, the real demand of other factors whose nominal retributions have not been reduced will be stimulated by the fall in price of the fi nished products. The aggregate demand of workers will rise as a result of the increase in employment, unless the demand for labor in response to changes in nominal wages is inelastic. In the new equilibrium there will be more employment than there would have been otherwise.
Keynes disagreed with the classical line of reasoning and indicated that the underlying analysis was fallacious. In any given industry, he argued that there is a demand schedule for the product relating the quantities that can be sold and the prices asked. Simultaneously, there is a series of supply schedules relating the prices asked for the different quantities. These schedules lead to another one which, on the assumption that other costs remain unchanged, gives the demand schedule for labor in the industry relating the quantity of employment to different wage levels. This relationship is transferred without modifi cation to the industry as a whole, which leads to the assumption that there is a demand schedule for labor in the
ThemeApRev.indd 94ThemeApRev.indd 94 08/08/2005 11:34:12 AM08/08/2005 11:34:12 AM

95
price) that would provide incomes enabling workers to save more than the amount of current investment, fi rms will make a loss on this difference. And this will be the case irrespective of the level of the nominal wage.
Keynes’ conclusion is that the reduction in nominal wages will have no lasting tendency to increase employment except by virtue of its repercussions, either on the propensity to consume, on the marginal effi ciency of capital, or on the interest rate. There are no grounds to believe that a fl exible wage policy is capable of maintaining a state of continuous full employment.
ThemeApRev.indd 95ThemeApRev.indd 95 08/08/2005 11:34:13 AM08/08/2005 11:34:13 AM
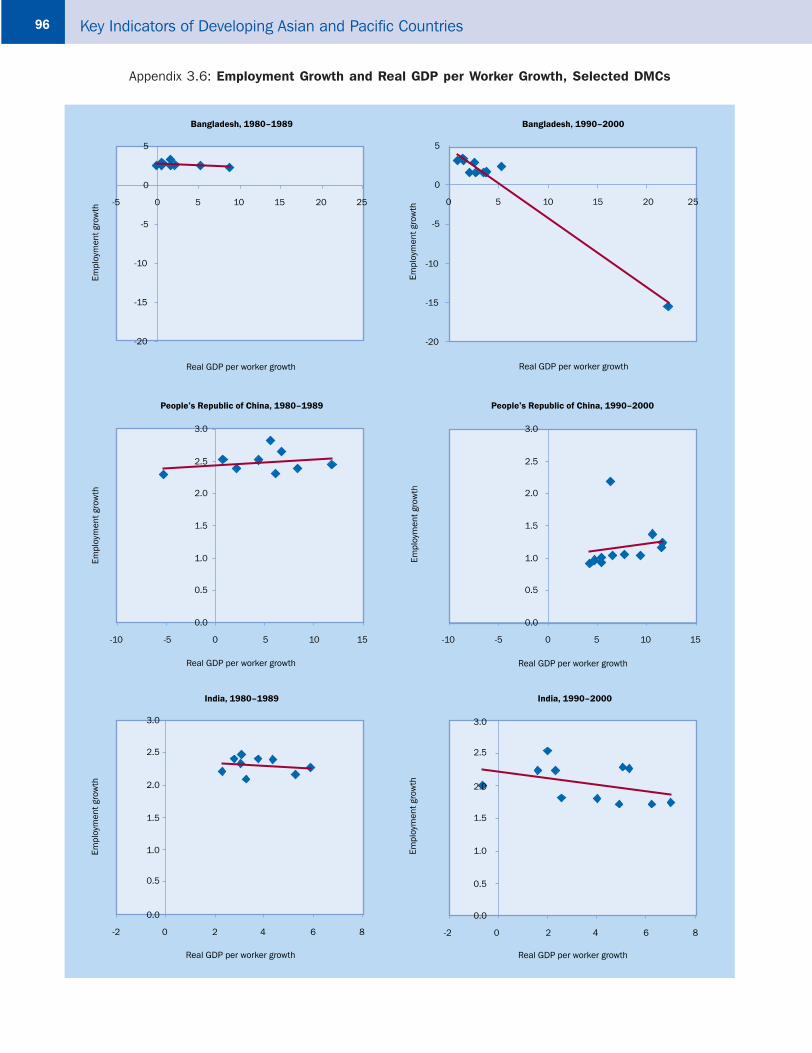
96 Key Indicators of Developing Asian and Pacific Countries
Appendix 3.6: Employment Growth and Real GDP per Worker Growth, Selected DMCs
Bangladesh, 1980–1989
-20
-15
-10
-5
0
5
-5 0 5 10 15 20 25
Real GDP per worker growth
Empl
oym
ent g
row
th
Bangladesh, 1990–2000
-20
-15
-10
-5
0
5
0 5 10 15 20 25
Real GDP per worker growth
Empl
oym
ent g
row
thPeople’s Republic of China, 1980–1989
0.0
0.5
1.0
1.5
2.0
2.5
3.0
-10 -5 0 5 10 15
Real GDP per worker growth
Empl
oym
ent g
row
th
People’s Republic of China, 1990–2000
0.0
0.5
1.0
1.5
2.0
2.5
3.0
-10 -5 0 5 10 15
Real GDP per worker growth
Empl
oym
ent g
row
th
India, 1980–1989
0.0
0.5
1.0
1.5
2.0
2.5
3.0
-2 0 2 4 6 8
Real GDP per worker growth
Empl
oym
ent g
row
th
India, 1990–2000
0.0
0.5
1.0
1.5
2.0
2.5
3.0
-2 0 2 4 6 8
Real GDP per worker growth
Empl
oym
ent g
row
th
ThemeApRev.indd 96ThemeApRev.indd 96 08/08/2005 11:34:13 AM08/08/2005 11:34:13 AM

97
Indonesia, 1980–1989
0.0
0.5
1.0
1.5
2.0
2.5
3.0
-15 -10 -5 0 5 10
Real GDP per worker growth
Empl
oym
ent g
row
th
Indonesia, 1990–2000
0.0
0.5
1.0
1.5
2.0
2.5
3.0
-15 -10 -5 0 5 10
Real GDP per worker growth
Empl
oym
ent g
row
th
Republic of Korea, 1980–1989
0.0
0.5
1.0
1.5
2.0
2.5
3.0
-15 -10 -5 0 5 10 15
Real GDP per worker growth
Empl
oym
ent g
row
th
Republic of Korea, 1990–2000
0.0
0.5
1.0
1.5
2.0
2.5
3.0
-15 -10 -5 0 5 10 15
Real GDP per worker growth
Empl
oym
ent g
row
th
Malaysia, 1980–1989
-14
-12
-10
-8
-6
-4
-2
0
2
4
6
-5 0 5 10 15 20 25
Real GDP per worker growth
Empl
oym
ent g
row
th
Malaysia, 1990–2000
-14
-12
-10
-8
-6
-4
-2
0
2
4
6
8
-5 0 5 10 15 20 25
Real GDP per worker growth
Empl
oym
ent g
row
th
Appendix 3.6: (continued)
ThemeApRev.indd 97ThemeApRev.indd 97 08/08/2005 11:34:15 AM08/08/2005 11:34:15 AM
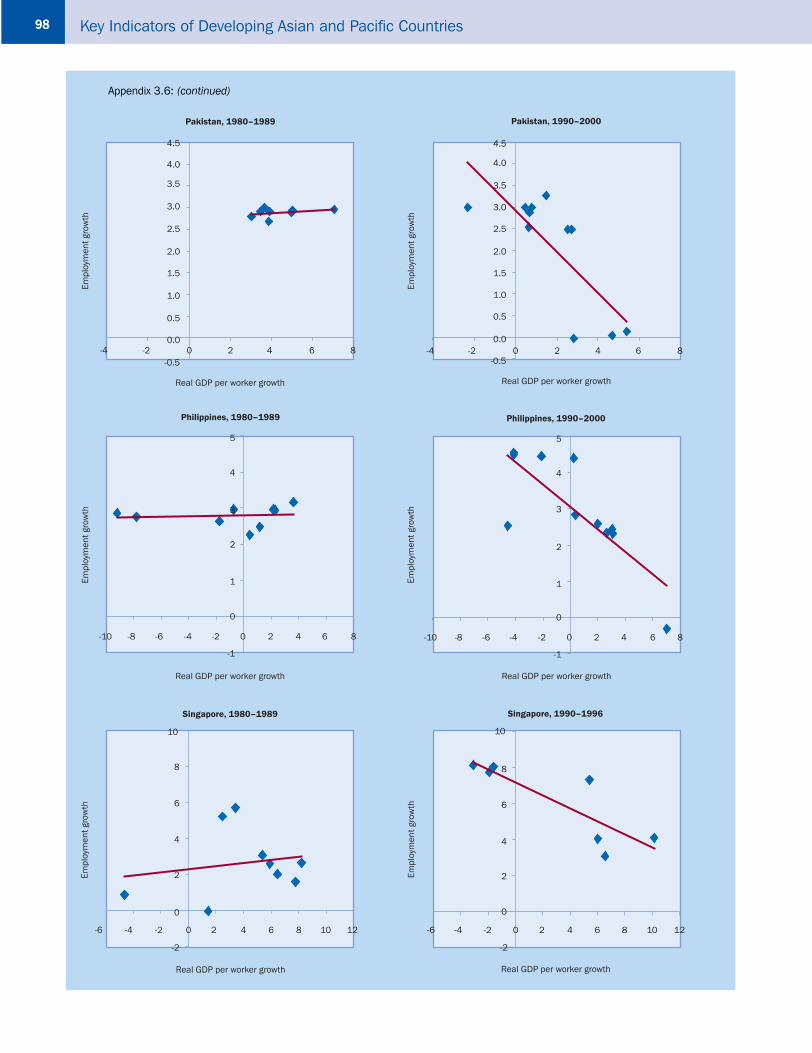
98 Key Indicators of Developing Asian and Pacific Countries
Pakistan, 1980–1989
-0.5
0.0
0.5
1.0
1.5
2.0
2.5
3.0
3.5
4.0
4.5
-4 -2 0 2 4 6 8
Real GDP per worker growth
Empl
oym
ent g
row
th
Pakistan, 1990–2000
-0.5
0.0
0.5
1.0
1.5
2.0
2.5
3.0
3.5
4.0
4.5
-4 -2 0 2 4 6 8
Real GDP per worker growth
Empl
oym
ent g
row
thPhilippines, 1980–1989
-1
0
1
2
3
4
5
-10 -8 -6 -4 -2 0 2 4 6 8
Real GDP per worker growth
Empl
oym
ent g
row
th
Philippines, 1990–2000
-1
0
1
2
3
4
5
-10 -8 -6 -4 -2 0 2 4 6 8
Real GDP per worker growth
Empl
oym
ent g
row
th
Singapore, 1980–1989
-2
0
2
4
6
8
10
-6 -4 -2 0 2 4 6 8 10 12
Real GDP per worker growth
Empl
oym
ent g
row
th
Singapore, 1990–1996
-2
0
2
4
6
8
10
-6 -4 -2 0 2 4 6 8 10 12
Real GDP per worker growth
Empl
oym
ent g
row
th
Appendix 3.6: (continued)
ThemeApRev.indd 98ThemeApRev.indd 98 08/08/2005 11:34:17 AM08/08/2005 11:34:17 AM

99
Thailand, 1980–1989
-1.0
-0.5
0.0
0.5
1.0
1.5
2.0
2.5
3.0
-15 -10 -5 0 5 10 15
Real GDP per worker growth
Empl
oym
ent g
row
th
Thailand, 1990–2000
-1.0
-0.5
0.0
0.5
1.0
1.5
2.0
2.5
3.0
-15 -10 -5 0 5 10 15
Real GDP per worker growth
Empl
oym
ent g
row
th
Taipei,China, 1980–1989
0.0
0.5
1.0
1.5
2.0
2.5
3.0
0 2 4 6 8 10 12
Real GDP per worker growth
Empl
oym
ent g
row
thTaipei,China, 1990–1998
0.0
0.5
1.0
1.5
2.0
2.5
3.0
0 2 4 6 8 10 12
Real GDP per worker growth
Empl
oym
ent g
row
th
Appendix 3.6: (continued)
Source: Authors' estimates based on Penn World Table, Heston et al. (2002).
ThemeApRev.indd 99ThemeApRev.indd 99 08/08/2005 11:34:19 AM08/08/2005 11:34:19 AM

100 Key Indicators of Developing Asian and Pacific Countries
Appendix 3.7: Wage-Led Employment Regime
Following Bowles and Boyer (1995), the market clearing condition is ( , ) ( , ) ( , )D w h I w h S w h 0= − = , where D denotes excess aggregate demand, I is investment, and S is savings, all three written as functions of the wage rate ( w ) and employment ( h ). It represents loci in combinations of w and h that satisfy the macroeconomic equilibrium conditions of market clearing. It is assumed that wI 0< ,
hI 0> , wS 0< , and hS 0> .The effect of a wage change on employment equals w w w
h h h
D S Idh
dw D I S
−=− =
−.
A wage-led aggregate demand regime requires that dh0
dw>
(i.e., demand function positively sloped). Given the assumption that ( )h hI S 0− < , i.e., that savings responds more to the employment level than does investment, and hence, an increase in employment will reduce excess demand, the requirement for a wage-led regime is that ( )w wS I 0− < , i.e., a wage increase reduces savings more than it reduces investment. This will lead to an increase in aggregate demand and employment. Given appropriate savings and investment functions, empirically, an economy
will be wage led if rwr i)ss( >− , where rs is the savings propensities out of profi ts, ws is the savings propensity out of wages, and
ri is the effect on investment of a change in the profi t rate, holding the employment rate constant.74
The dotted lines in Appendix Figure 3.7.1 indicate the effects of a wage increase from w to w’. The investment function is drawn fl atter than the savings function, implying that at employment levels above the equilibrium level indicated by D(h,w)=0, there is excess supply, leading to cutback in employment. The arrows in the lower part of the fi gure indicate the out-of-equilibrium adjustment of the employment level. To the right of D(h,w)=0, excess supply exists, and fi rms hire fewer workers, reducing employment h, while to the left of D(h,w)=0, there is excess demand for goods and fi rms expand employment.
An increase in the wage rate from w to w’ shifts the investment and savings functions leading to an increase in employment from h* to h’.
74 The model can be easily extended to incorporate net exports and government borrowing into the excess aggregate demand function.
S, I
S(h,w)
w
w'
Excess Demand Excess Supply
h* h'
A'
B'
h* h'
S(h,w')
B
A
D(h,w)=0
l(h,w')
l(h,w)
Source: Bowles and Boyer (1995).
Appendix Figure 3.7.1: The Aggregate Demand for Labor Function: The Wage-Led Case
ThemeApRev.indd 100ThemeApRev.indd 100 08/08/2005 11:34:21 AM08/08/2005 11:34:21 AM

101
Employment Rate
Unit LaborCost
Employment
CapacityUtilization
Cost
DemandA
B
B'
A'
Appendix Figure 3.7.2: Effects of Faster Productivity Growth When Effective Demand Is Wage Led
The demand curve in Appendix Figure 3.7.2 shows capacity utilization increasing or decreasing as a function of unit labor costs. In the lower quadrant, the employment rate is an increasing function of capacity utilization.
The cost schedules represent the supply side of the system. The cost schedules slope upward because wages typically rise with output over the medium term.
Starting at the combination (A, A’), assume there is a speed-up in productivity growth. This will shift downward the cost schedule, which will cause aggregate demand to drop. The wage share (unit labor cost), rate of capacity utilization, and employment rate will decrease (B, B’). This indicates that a wage-led economy is not well prepared to absorb technical change.
ThemeApRev.indd 101ThemeApRev.indd 101 08/08/2005 11:34:23 AM08/08/2005 11:34:23 AM

102 Key Indicators of Developing Asian and Pacific Countries
References
Amante, Maragtas S.V. 2003. “Philippines.” In Mismatch in the Labor Market. Asian Experience, ed. Hiromitsu Muta . Tokyo: Asian Productivity Organization, pp. 270-304.
Amante, Maragtas S.V., Rene Ofreneo, and Ina Ortiz. 1999. Skills Training and Policy Reforms in the Philippines. Manila: ILO-South East Asia and the Pacifi c Multidisciplinary Advisory Team.
Amin, T.M.N. 2002. “The Informal Sector in Asia from the Decent Work Perspective.” Working Paper on the Informal Economy No 4. International Labour Organization, Geneva.
Anant, T.C.A. 2000. “Reforming the Labour Market.” In Economic Reforms for the Poor, ed. S. Gangopadhyay and W. Wadhwa. Konark, New Delhi.
Anant, T.C.A. and O. Goswami. 1995. “Getting Everything Wrong: India’s Policy Regarding Sick Firms.” In Indian Industry: Policies and Performance, ed. Dilip Mookherjee. New Delhi: Oxford University Press.
Anant, T.C.A., R. Hasan, P. Mohapatra, R. Nagraj, and S.K. Sasikumar. 2005. “Labor Markets In India: Issues, Perspectives, and a Research Agenda.” ERD Working Paper on Labor Markets in Asia. ADB, Manila. Unpublished.
Asian Development Bank (ADB). 2002. Key Indicators 2002: Population and Human Resource Trends and Challenges. Manila.
. 2003a. Asian Development Outlook 2003. Manila. Available: http://www.adb.org/Documents/Books/ADO/2003/default.asp
. 2003b. Technical Assistance to India for Pension Reforms for the Unorganized Sector. TAR: IND 36346. Manila.
. 2003c. Social Protection. Manila. Available: http://www.adb.org/Documents/Policies/Social_Protection/default.asp.
. 2004a. Key Indicators 2004: Poverty in Asia: Measurement, Estimates, and Prospects. Manila.
. 2004b. “Social Protection Strategy. 2003 Progress Report to the Board of Directors.” Manila. Available: http://www.adb.org/Documents/Reports/Social_Protection/IN230-04.pdf.
. 2005a. “Improving the Investment Climate in Indonesia.” Manila.
. 2005b. “Social Protection: Reducing Risks and Increasing Opportunities.” Manila.
. 2005c. TA No. 6120-REG: Social Protection Index for Committed Poverty Reduction. Multi-Country Report. Manila.
. 2005d. Asian Development Outlook 2005, pp. 40–62. Manila.
. n.d. Statistical Database System (SDBS). Manila.Bacha, Edmar L. 1990. “A Three-Gap Model of Foreign
Transfers and the GDP Growth Rate in Developing Countries.” Journal of Development Economics, 32: 279-296.
Badan Pusat Statistik (BPS). 2000. Statistik Indonesia. Statistical Yearbook of Indonesia 1999. Jakarta: Badan Pusat Statistik.
Bales, Sarah. 2000. “Viet Nam’s Labor Situation and Trends—Analysis based on 1992–93 and 1997–98 Viet Nam Living Standards Data.” Background Paper to the Viet Nam Development Report 2000, Hanoi.
Bales, S., Phung Duc Tung, and Ho Si Cuc. 2001. “Sectoral Changes and Poverty,” Chapter 3 in Living Standards During an Economic Boom, ed. D. Haughton, J. Haughton, and Nguyen Phong. Hanoi: Statistical Publishing House.
Balisacan, Arsenio M. 1994. “Employment and Human Resource Development.” In Rural Poverty in Developing Asia, ed. M. G. Quibria. Manila: ADB.
Balisacan, A. and N. Fuwa. 2004. Changes in Spatial Income Inequality in the Philippines: An Exploratory Analysis. Research Paper No. 34. World Institute for Economics Development Research, United Nations University, Tokyo.
Banerjee, A. and T. Piketty. 2001. “Are the Rich Growing Richer: Evidence from Indian Tax Data.” MIT, Cambridge, MA, and CEPREMAP, Paris. Unpublished. Available: http://www.worldbank.org/indiapovertyworkshop.
Bangkok Post. 1 May 2005. “Social Security Fund to Open.” Available: http://www.bangkokpost.com/010505_News/01May2005_news08.php.
Bangladesh Bureau of Statistics. Various years. Statistical Yearbook of Bangladesh. Dacca: Bangladesh Bureau of Statistics
Basu, Kaushik.1997. Analytical Development Economics. Cambridge: MIT Press.
. 1999. Child Labor: Cause, Consequence, and Cure, with Remarks on International Labor Standards. Journal of Economic Literature, 37(3): 1183-1119.
Bean, Charles. 1994. “European Unemployment: A Survey.” Journal of Economic Literature, 32: 573-619.
Beegle, Kathleen, Rakeev Dehejia, and Roberta Gatti. 2004. “Why Should We Care about Child Labor? The Education, Labor Market, and Health Consequences of Child Labor.” NBER Working Paper No. 10980. Cambridge, MA.
Beine, Michel, Frédéric Docquier, and Hillel Rapoport. 2001. “Brain Drain and Economic Growth: Theory and Evidence.” Journal of Development Economics, 64:275-289.
Bertola, Giuseppe. 1999. “Microeconomic Perspectives on Aggregate Labor Markets.” In Handbook of
ThemeApRev.indd 102ThemeApRev.indd 102 08/08/2005 11:34:24 AM08/08/2005 11:34:24 AM

103
Labor Economics, ed. O. Ashenfelter and D. Card. Amsterdam: North-Holland Publishers, vol. 3B, pp. 2985–3028.
Besley, Timothy and Robin Burgess. 1999. “Land Reform, Poverty Reduction and Growth: Evidence from India” (draft). Suntory and Toyota International Centres for Economics and Related Disciplines (STICERD), London School of Economics and Political Science, UK.
———. 2004. “Can Labor Regulation Hinder Economic Performance? Evidence form India.” Quarterly Journal of Economics, pp. 91-123. February.
Bewley, Truman F. 1999. Why Wages Don’t Fall During a Recession. Cambridge, MA: Harvard University Press.
Bhalotra, Sonia. 1998. “The Puzzle of Jobless Growth in Indian Manufacturing.” Oxford Bulletin of Economics and Statistics, 60(1).
Bird, Kelly and Chris Manning. 2002. “Impact of Minimum Wage Policy on Employment and Earning in the Informal Sector: The Case of Indonesia.” Paper presented at the 8th Convention of the East Asian Economic Association, 4–5 November 2002. Kuala Lumpur.
Birdsall, Nancy and Augusto de la Torre. 2001. Washington Contentious: Economic Policies for Social Equity in Latin America. Washington, DC: Carnegie Endowment for International Peace Press.
Blanchfl ower, D. and A. Oswald. 1994. The Wage Curve. Cambridge: MIT Press.
Blanpain, R., ed. Various years. International Encyclopaedia for Labour Law and Industrial Relations. Deventer, Netherlands: Kluwer.
Borch, Susanne. 2004. International Handbook on Contracts of Employment. New York: Aspen Publishers, Inc.
Botero, Juan, Simeon Djankov, Rafael La Porta, Florencio Lopez de Silanes, and Andrei Shliefer. 2003. “The Regulation of Labor.” NBER Working Paper No. 9756. June. Downloaded from http://www.nber.org/papers/w9756.
Bowles, Samuel and Herbert Gintis. 1995. “Escaping the Effi ciency-Equity Tradeoff: Productivity-Enhancing Asset Distributions.” In Macroeconomic Policy After the Conservative Era, ed. Gerald E. Epstein and Herbert Gintis. Cambridge: Cambridge University, pp. 409-410.
Bowles, Samuel and Robert Boyer. 1995. “Wages, Aggregate Demand and Employment in an Open Economy: An Empirical Investigation.” In Macroeconomic Policy After the Conservative Era, ed. Gerald E. Epstein and Herbert Gintis. Cambridge: Cambridge University Press, pp. 143-171.
Bowles, Samuel, David Gordon, and Thomas Weisskopf. 1983. “Hearts and Minds: A Social Model of US
Productivity Growth.” Brookings Papers on Economic Activity, 2:381-450.
Brooks, Ray. 2002. “Why is Unemployment High in the Philippines?” IMF Working Paper 02/23. International Monetary Fund: Washington, DC.
Brooks, Ray and Ran Tao. 2003. “China’s Labor Market Performance and Challenges.” IMF Working Paper 03/210. International Monetary Fund, Washington, DC.
Buchele, Robert and Jens Christiansen. 1992. “Industrial Relations and Productivity Growth: A Comparative Perspective.” International Contributions to Labor Studies, 2:77-97.
. 1995. “Productivity, Real Wages and Worker Compensation Rights: A Cross-National Comparison.” Labour: Review of Labor Economics and Industrial Relations, 9(3):405-422.
. 1999a. “Labor Relations and Productivity Growth in Advanced Capitalists Economies.” Review of Radical Political Economics, 31(1):87-110.
. 1999b. “Employment and Productivity Growth in Europe and North America: The Impact of Labor Market Institutions.” International Review of Applied Economics, 13(3):313-332.
Bureau of Labor and Employment Statistics, Philippines. Various years a. Survey of Specifi c Groups of Workers. Department of Labor and Employment. Manila.
. Various years b. Yearbook of Labor Statistics. Department of Labor and Employment. Manila.
Central Bureau of Statistics, Nepal. 1999. Report on the Nepal Labour Force Survey 1998/99. Kathmandu. Available: http:/www.cbs.gov.np/hhold_survey/nlfs_tables.htm.
Chadha, G.K. and P.P. Sahu. 2002. Post-Reform Setbacks in Rural Employment: Issues that Need Further Scrutiny. Economic and Political Weekly, May 25, pp. 1198-2026.
Datta-Chaudhuri, Mrinal. 1996. “Labor Markets as Social Institutions in India.” IRIS-India Working Paper No. 10. University of Maryland, College Park, MD.
De Soto, Hernando. 1989. The Other Path. Basic Books: New York.
. 2001. The Mystery of Capital. London: Bantam Press.
Deaton, A. and J. Dreze. 2002, “Poverty and Inequality in India: A Reexamination.” Economic and Political Weekly, pp. 3729-3748, 7 September.
Department of Census and Statistics, Sri Lanka. 2003. Annual Report of the Sri Lanka Labour Force Survey 2002. Colombo: Department of Census and Statistics.
Directorate General of Budget, Accounting, and Statistics (DGBAS). Various years. Statistical Yearbook of the Republic of China. Executive Yuan. Republic of China.
Dollar, David and Aart Kraay. 2002 (data set). “Growth
ThemeApRev.indd 103ThemeApRev.indd 103 08/08/2005 11:34:25 AM08/08/2005 11:34:25 AM

104 Key Indicators of Developing Asian and Pacific Countries
Is Good for the Poor.” Journal of Economic Growth, 7(3):195-225. Available: http://web.worldbank.org/WBSITE/EXTERNAL/EXTDEC/EXTRESEARCH/E X T P R O G R A M S / E X T M A C R O E C O /0,,contentMDK:20355294~menuPK:814941~pagePK:64168182~piPK:64168060~theSitePK:477872,00.html.
Dyson, Tim, Robert Cassen, and Leela Visaria. 2004. Twenty-fi rst Century India: Population, Economy, Human Development and the Environment. New Delhi: Oxford University Press.
Dutt, A.K. 1984. “Stagnation, Income Distribution, and Monopoly Power.” Cambridge Journal of Economics, 8:25-40.
Edmonds, Eric and Nina Pavnik. 2005. “Child Labor in the Global Economy.” Journal of Economic Perspectives, 19(1):199-220.
Edralin, Divina M. 2001. “Factors Infl uencing the Observance of the Core ILO Labor Standards by Manufacturing Companies.” In The Filipino Worker in a Global Economy, Leonardo A. Lanzona Jr., ed. Philippine APEC Study Center Network and Philippine Institute of Development Studies: Manila, pp. 87-138.
Fallon, Peter. 1987. “The Effects of Labor Regulation Upon Industrial Employment in India.” Discussion Paper 287. World Bank, Development Research Department, Washington, DC.
Fallon, P. R. and R. E. Lucas. 1991. “The Impact of Changes in Job Security in India and Zimbabwe.” World Bank Economic Review, 5(3):395-413.
Fan, E., and J. Felipe. 2005. “Investment, Capital-Accumulation, Technological Progress and Growth: The PRC and India Compared.” Economics and Research Department. ADB, Manila. Unpublished.
Federal Bureau of Statistics, Pakistan. Various years. Pakistan Statistical Yearbook. Government of Pakistan.
Felipe, Jesus. 2003. “Is Export-Led Growth Passé? Implications for Developing Asia.” ERD Working Paper No. 48. ADB, Manila.
. 2004a. “A Note on Competitiveness, Unit Labor Costs and Growth: Is Kaldor’s Paradox a Figment of Interpretation?” ERD. ADB, Manila. Unpublished.
. 2004b. “Competitiveness, Income Distribution, and Growth in the Philippines: What Does the Long-run Evidence Show?” ERD Working Paper No. 53. ADB, Manila.
Felipe, Jesus and Franklin M. Fisher. 2003. “Aggregation in Production Functions: What Applied Economists Should Know.” Metroeconomica, 54:208-262.
Felipe, Jesus and J.S.L. McCombie. 2004. “Are Estimates of Labor Demand Functions Mere Statistical Artifacts?” ADB, Manila and University of Cambridge. Unpublished.
Felipe, Jesus and Leonardo Lanzona. 2005. “Unem-ployment, Labor Laws and Economic Policies in the Philippines: A Stocktaking Review.” ERD Working Paper on Labor Markets in Asia. ADB, Manila. Unpublished.
Felipe, Jesus and Matias Vernengo. 2004. “Demystifying the Principle of Comparative Advantage: Implications for Developing Countries.” International Journal of Political Economy, 32(4):49-75. Winter 2002-3.
Fields, Gary. 1984. “Employment, Income Distribution, and Economic Growth in Seven Small Open Economies.” The Economic Journal, 94(373):74-83.
. 2004a. “A Guide to Multisector Labor Market Models.” Paper prepared for the World Bank Labor Market Conference, 18–19 November 2004. Washington, DC.
. 2004b. “Dualism in the Labor Market: A Perspective on the Lewis Model After Half a Century.” The Manchester School, 72(6):724-735. December.
Firdausy, C. M. 1996. “The Informal Service Sector in Urban Poverty Alleviation in Indonesia.” In Role of the Informal Service Sector in Urban Poverty Alleviation. Bangkok: UN-ESCAP.
Foley, K. Duncan and Thomas R. Michl. 1999. Growth and Distribution. Cambridge, MA: Harvard University Press.
Forteza, Alvaro and Martin Rama. 2002. Labor Market ‘Rigidity’ and the Success of Economic Reforms Across More than One Hundred Countries. Unpublished. August.
Foster, Andrew D. and Mark R. Rosenzweig. 1996. “Technical Change and Human Capital Returns and Investments: Evidence from the Green Revolution.” American Economic Review, pp. 931-953. September.
Freeman, R. 1993. “Labor Market Institutions and Policies: Help or Hindrance to Economic Development?” World Bank Annual Conference on Development Economics 1992, pp. 117-144. World Bank, Washington, DC.
Ghatak, Subrata. 2003. Introduction to Development Economics, pp. 289-291. 4th edition. London: Routledge.
Ghose, A.K. 2004. “The Employment Challenge in India.” Economic and Political Weekly, 39(48). 27 November. Available: http://www.planningcommission.nic.in/aboutus/taskforce/tk_empopp.pdf.
Harris, J.R. and M.P. Todaro. 1970. “Migration, Unemployment and Development: A Two-sector Analysis”. American Economic Review, 60(1):126-38.
Hasan, Rana. 2003. “The Impact of Trade and Labor Market Regulations on Employment and Wages: Evidence from Developing Countries.” In The Impact of Trade on Labor—Issues, Perspectives and Experiences from Developing Asia, ed. R. Hasan and D. Mitra. Amsterdam: Elsevier Science (North-
ThemeApRev.indd 104ThemeApRev.indd 104 08/08/2005 11:34:25 AM08/08/2005 11:34:25 AM

105
Holland Publishers), pp. 65-97.Hasan, Rana, D. Mitra, and K.V. Ramaswamy. 2003. “Trade
Reforms, Labor Regulations and Labor-Demand Elasticities: Empirical Evidence from India.” NBER Working Paper No. 9879. Available: http://www.nber.org/papers/w9879.
Heckman, James and Carmen Pagés. 2004. “Introduction.” In Law and Employment: Lessons from Latin America and the Caribbean, ed. James Heckman and Carmen Pagés, pp. 1-107. National Bureau of Economic Research: Cambridge, MA.
Hertel, Thomas and Fan Zhai. 2004. “Labor Market Distortions, Rural-Urban Inequality and the Opening of People’s Republic of China’s Economy.” ERD Working Paper No. 59. ADB, Manila. November.
Heston, A., Robert Summers, and Bettina Aten. 2002. Penn World Table Version 6.1. Center for International Comparisons at the University of Pennsylvania. October.
Howell, David R., ed. 2005. Fighting Unemployment: The Limits of Free Market Orthodoxy. Oxford University Press.
Huong, Pham Lan, Bui Quang Tuan, and Dinh Hien Minh. 2003. “Employment Poverty Linkages and Policies for Pro-poor Growth in Viet Nam. Issues in Employment and Poverty Discussion Paper 9.” ILO, Geneva.
International Labour Organization. 1991a. “Employment Policies in the Economic Restructuring of Latin America and the Caribbean.” Tripartite Symposium on Structural Adjustment and Employment in Latin America and the Caribbean. WEP 1-4-07 (Doc. 2). August. Geneva
. 1991b. “Social Protection, Safety Nets and Structural Adjustment.” Governing Body Committee on Employment. GB.2511/CE/4/5. November. Geneva.
. 1992. A Malaysia Country Report. Paper presented to the Seminar on Employment Policies for the Urban Informal Sector in East and Southeast Asia, Bangkok, Thailand, 12–16 October.
. 1994 and 1995. Conditions of Work Digest. Geneva.
. 2002a. “Decent Work and the Informal Economy: Report VI.” International Labour Conference 90th Session. Geneva.
. 2002b. Every Child Counts: New Global Estimates on Child Labor. Geneva.
. 2002c. Women and Men in the Informal Economy: A Statistical Picture. Geneva: International Labour Offi ce.
. 2003a. Key Indicators of the Labour Market, 3rd edition. Geneva. Available: http://www.ilo.org/public/english/employment/strat/kilm/kilm01.htm, http://www.ilo.org/public/english/bureau/stat/class/icse.htm.
. 2003b. Yearbook of Labour Statistics 2003. Geneva.
. 2004. Economic Security for a Better World. Geneva.
. 2005a. World Employment Report 2004-05: Employment, Productivity and Poverty Reduction. Geneva. Available: http://www.ilo.org/public/english/employment/strat/wer2004.htm.
. 2005b. Minimum Wages Database. Available: http://www.ilo.org/travaildatabase/servlet/
minimumwages (downloaded 11 May 2005).. n.d. LABORSTA. Available: http://laborsta.ilo.
org.International Labour Offi ce–United Nations Development
Programme Bangladesh. 1998. “Employment Promotion in the Non-Formal Sector.” A Report Prepared by ILO-South Asia Multidisciplinary Advisory Team (SAAT) under UNDP. Technical Support Service 1. ILO, Geneva.
International Monetary Fund. 1999. “Chronic Unemployment in the Euro Area: Causes and Cures.” Chapter 4 in World Economic Outlook. Washington, DC. May.
. 2003. “Unemployment and Labor Market Institutions: Why Reforms Pay Off.” Chapter 4 in World Economic Outlook. Washington, DC. May.
Joshi, G. 1997. “Urban Informal Sector in Metro Manila: A Problem or Solution?” Manila, ILO, South East Asia and the Pacifi c Multidisciplinary Advisory Team.
Kaldor, N. 1961. “Capital Accumulation and Growth.” In The Theory of Capital, ed. F.A. Lutz and D.C. Hague. London: Macmillan.
Kapsos, Steven. 2005. The Employment Intensity of Growth: Trends and Macroeconomic Determinants. Employment Strategy Department. Geneva: International Labour Organization.
Kauffman, Daniel, Aart Kraay, and Massimo Mastruzzi. 2003. Governance Matters III: Governance Indicators for 1996–2000. Washington, DC: World Bank.
Keen, Steve. 2001. Debunking Economics. Sydney, Australia: Pluto Press.
Keynes, J. M. 1936. The General Theory of Employment, Interest and Money. London: Macmillan.
Krugman, Paul. 1999. The Accidental Theorist. London: Penguin Books.
Lall, S. 2001. “Competitiveness Indices and Developing Countries: An Economic Evaluation of the Global Competitiveness Report.” World Development, 29(9):1501-25.
Lewis, A. W. 1954. “Economic Development with Unlimited Supplies of Labor.” The Manchester School, 22:139-191.
. 1965. Theory of Economic Growth. London: George Allen and Unwin, Ltd.
Lewis, William W. 2004. The Power of Productivity.
ThemeApRev.indd 105ThemeApRev.indd 105 08/08/2005 11:34:26 AM08/08/2005 11:34:26 AM

106 Key Indicators of Developing Asian and Pacific Countries
Chicago: The University of Chicago Press.Lin, Justin Y. 1992. Rural Reforms and Agricultural Growth
in China. American Economic Review, 82(1):34–51.. 2004. “Development Strategies for Inclusive
Growth in Developing Asia.” Asian Development Review, 21(2):1-27. Manila: ADB.
Lora, Eduardo. 2005. “Should Latin America Fear China?” Research Department Working Paper Series No. 531. Inter-American Development Bank: Washington, DC.
Manning, Chris. 2004a. “Legislating Labor Protection: Betting on the Weak or the Strong?” Working Papers in Trade and Development. Working Paper No. 2004/08. December. Australian National University: Canberra.
. 2004b. “Labor Regulation and the Business Environment: Time to Take Stock.” In Business in Indonesia: New Challenges, Old Problems, ed. M. Chatib Basri and Pierre van den Eng. Australian National University: Canberra.
Marr, A. 2004. “Institutional Approaches to the Delivery of Business Development: A Review of Recent Literature.” Report No. 2771. Natural Resources Institute, University of Greenwich, UK.
Mazumdar, Dipak. 1999. “Constraints to Achieving Full Employment in Asia.” Employment and Training Papers No. 51. Geneva: International Labour Offi ce.
McCombie, J.S.L. and A.P. Thirlwall. 1994. Economic Growth and the Balance of Payments Constraint. St. Martin’s Press: New York.
Ministry of Labor and Social Security (MOLSS). 2001. “Urban Poverty Alleviation and Informal Sector Employment in China.” Paper prepared by the Ministry of Labor and Social Security for the National Seminar on Poverty Reduction and Urban Informal Sector Employment, Beijing. March.
Ministry of Manpower, Singapore. 2005. Labor Force Survey. Available: http://www.mom.gov.sg/Stat is t ics/ManpowerResearchNStatist ics/LabourMarketStatistics/Employment-print.htm.
Muta, Hiromitsu, ed. 2003. Mismatch in Labor Market: Asian Experience. Tokyo: Asian Productivity Organization.
Myrdal, Gunnar. 1968. Asian Drama: An Inquiry into the Poverty of Nations. Pantheon: New York.
Naseem, S. M. 1996. “The Informal Service Sector in Urban Poverty Alleviation in Pakistan.” In Role of the Informal Service Sector in Urban Poverty Alleviation. Bangkok: UN-ESCAP.
NASSCOM. 2002. “NASSCOM-McKinsey Report Predicts Robust Growth For Indian IT Services and IT Enabled Services Industry.” Press release dated 10 June 2002. Available: http://www.nasscom.org/artdisplay.asp?Art_id=1435.
National Bureau of Statistics, PRC. Various years. China Statistical Yearbook. Beijing: China Statistics Press.
National Economic and Development Authority (NEDA).
2001. “Medium-Term Philippine Development Plan (MTPDP) 2001–2004,” p. 31. Manila.
. 2004. “Medium-Term Philippine Development Plan (MTPDP) 2004–2010,” Introduction, Table D. Manila.
National Institute of Statistics, Cambodia. 2001. Labour Force Survey of Cambodia 2001. Available: http://www.nis.gov.kh/SURVEYS/LFS2001/table_3.htm.
National Sample Survey Organisation, Government of India. 2000. Employment and Unemployment in India: Key Results. Report No. 455 (55/10/1). New Delhi.
National Statistics Offi ce, Korea. Various years. Korea Statistical Yearbook. Seoul.
National Statistics Offi ce, Philippines. Various years a. Labor Force Survey. Manila.
. Various years b. Philippine Statistical Yearbook. Manila.
National Statistical Offi ce, Thailand (NSO). 1994. “Formal and Informal Labor Force Market Survey. 1994 Labor Force Survey.” Bangkok.
. n.d. Economic and Social Statistics Bureau. Bangkok. Available: http://www.nso.go.th/eng/stat/lfs/tab8r4.htm.
National Wages and Productivity Commission, Philippines (NWPC). 2005. Department of Labor and Employment. Available: http://www.nwpc.dole.gov.ph/statistic.html (downloaded April).
Nguyen, Bihn, Cu Chi Loi, and Nguyen Chien Thang. 2005. “Labor Markets, Growth and Poverty Reduction in Viet Nam.” ERD Working Paper on Labor Markets in Asia. ADB, Manila. Unpublished.
Nickel, Stephen. 1997. “Unemployment and Labor Market Rigidities: Europe versus North America.” Journal of Economic Perspectives, XI:54-74.
. 1998. “Unemployment: Questions and Some Answers.” Economic Journal, 108:802-816.
Nickel, Stephen and Richard Layard. 2000. “Labor Market Institutions and Economic Performance.” In Handbook of Labor Economics, ed. Orley Ashenfelter and David Card. Amsterdam: North-Holland Publishers.
Oey-Gardiner, Mayling and Ninasapti Triaswati. 2005. “Employment Creation, Labor Markets and Growth in Indonesia.” ERD Working Paper on Labor Markets in Asia. ADB, Manila. Unpublished.
Offi cial Government Portal of the Republic of the Philippines. Available: http://www.gov.ph.
Organisation for Economic Co-operation and Development (OECD). 1994. The OECD Jobs Study: Facts, Analysis, Strategies. Paris: OECD.
. 1997. Implementing the OECD Jobs Strategy: Member Countries’ Experience. Paris: OECD.
. 1999 and 1998. Employment Outlook. Paris: OECD.
Pack, Howard. 1974. “The Employment-Output Trade-off in LDCs—A Microeconomic Approach.” Oxford
ThemeApRev.indd 106ThemeApRev.indd 106 08/08/2005 11:34:27 AM08/08/2005 11:34:27 AM

107
Economic Papers, 26(3):388-404.Palley, Thomas I. 2002. “A New Development Paradigm:
Domestic Demand-Led Growth. Why It is Needed and How To Make it Happen.” Foreign Policy in Focus. Discussion Paper, pp.1-8. September.
Pasinetti, L. 1993. Structural Economic Dynamics. Cambridge: Cambridge University Press.
Planning Commission, Government of India. 2001. Report of Task Force on Employment Opportunities. New Delhi. Available: http://www.planningcommission.nic.in/aboutus/taskforce/tk_empopp.pdf.
Rama, Martin. 1996. “The Consequences of Doubling the Minimum Wage: The Case of Indonesia.” Workshop for Economic Reforms and Labor Market Restructuring for Indonesia: Indonesian Workers in the 21st Century at Jakarta, World Bank.
. 2003. “Globalization and Workers in Developing Countries.” In The Impact of Trade on Labor—Issues, Perspectives and Experiences from Developing Asia, ed. R. Hasan and D. Mitra. Amsterdam: Elsevier Science (North-Holland Publishers), pp. 19-64.
Ravallion, M. 1991. “Reaching the Rural Poor through Public Employment: Arguments, Evidence, and Lessons from South Asia.” World Bank Research Observer 6(2):53-75. July.
Ravallion, Martin and Shaohua Chen. 2004. “China’s (Uneven) Progress Against Poverty.” World Bank Policy Research Working Paper No. 3408.
Ricardo, D. 1981. “On the Principles of Political Economy and Taxation.” In The Works and Correspondence of David Ricardo, 1821, 3rd edition, ed. Piero Sraffa. Cambridge University Press: Cambridge.
Robinson, Joan. 1942. An Essay on Marxian Economics. London: Macmillan and Co.
Rodrik, Dani. 1997. Has Globalization Gone Too Far? Washington, DC: Institute for International Economics.
. 2003. “Growth Strategies” (draft). John F. Kennedy School of Government, Cambridge, MA.
. 2004. “Industrial Policy for the Twenty-First Century.” John F. Kennedy School of Government, Cambridge, MA. Unpublished.
Rodrik, Dani and Arvind Subramanian. 2004. “From ‘Hindu Growth’ to Productivity Surge: The Mystery of the Indian Growth Transition.” Paper presented at the IMF Jacques Polak Annual Research Conference, 4–5 November 2004, at the IMF, Washington, DC.
Salmon, Claire. 2002. “Performance of the Bangladeshi Labor Markets During the Nineties.” Background paper prepared for ADB and the World Bank.
Sardaña, M. C. 1998. “Globalization and Employment Relations: The Philippine Experience.” Philippine Labor Review, 12(1):57-92.
Seguino, S. 2000. “Accounting for Asian Economic Growth: Adding Gender to the Equation.” Feminist
Economics, 6(3): 27-58.Sen, Amartya. 1975. Employment, Technology and
Development. Oxford: Clarendon Press.Shi, Xinzheng, Terry Sicular, and Yaohui Zhao. 2002.
“Analyzing Urban-Rural Income Inequality in China.” Paper presented at the International Symposium on Equity and Social Justice in Transitional China.” Beijing, 11–12 July.
Shi, Xinzheng. 2002. “Empirical Research on Urban-Rural Income Differentials: The Case of China.” China Center for Economic Research, Beijing University. Unpublished.
Sicat, Gerardo. 2004. “Reform of the Philippine Labor Market.” University of the Philippines School of Economics Discussion Paper No. 04. Quezon City.
Snower, Dennis. 1996. “The Low-Skill, Bad-Job Trap.” In Acquiring Skills: Market Failures, Their Symptoms and Policy Responses, ed. Alison L. Booth and Dennis J. Snower. Cambridge: Cambridge University Press, pp. 109-124.
Social Monitoring and Early Response Unit (SMERU). 2001. The Impact of Minimum Wages in the Formal Urban Sector. SMERU, Jakarta.
Som, R., U. Kleih, Y. Kumar, and S-K. Jena. 2002. “Rural Nonfarm Employment in Madhya Pradesh: Findings of a Participatory Rural Appraisal in 8 Villages.” Report No. 2694. Natural Resources Institute, University of Greenwich.
Soriano, Maria Teresa. 1998. “Implications of International Migration: A Focus on the Philippine Experience.” Philippine Labor Review, vol. 22, no. 1 (January-June): pp. 93-107.
Srivastava, Pradeep. 2004. “Poverty Targeting in Asia: Country Experience of India.” ADB Institute Discussion Paper No. 5.
State Statistical Committee, Tajikistan. n.d. “Labor Resources and Employment, 1985–2004.” Available: http://www.stat.tj/english_tables/table_14.xls.
Stockhammer, Engelbert. 2004. The Rise of Unemployment in Europe: A Keynesian Approach. Cheltenham, UK: E. Elgar.
Sundaram, K. and S.D. Tendulkar. 2002. “The Working Poor in India: Employment-Poverty Linkages and Employment Policy Options.” Issues in Employment and Poverty Discussion Paper No. 4. Recovery and Reconstruction Department. Geneva: International Labour Organization.
Sundrum, R.M. 1987. Growth and Income Distribution in India. New Delhi: Sage.
Sungoonshorn, S. 2001. “Accessibility of Urban Informal Sector Workers to Welfare and Non-Welfare Services: A Focus on Bangkok Slums.” Ph.D. thesis. Asian Institute of Technology, Bangkok.
Taylor, L. 1991. Income Distribution, Infl ation, and Growth. Cambridge: MIT Press.
ThemeApRev.indd 107ThemeApRev.indd 107 08/08/2005 11:34:28 AM08/08/2005 11:34:28 AM

108 Key Indicators of Developing Asian and Pacific Countries
. 1994. “Gap Models.” Journal of Development Economics, 45:17-34.
Teodosio, Virginia A. 2001. “Tripartism and the Role of the State in a Period of Restructuring under Globalization.” In The Filipino Worker in a Global Economy, ed. L. Lanzona. Philippine APEC Study Center Network and Philippine Institute for Development Studies, Makati, pp. 185-274.
The Nation. 2 May 2005. “Wage hike will scare investors: Thaksin.” Bangkok. Available: http://www.nationmultimedia.com/search/page.arcview.php?clid=2&id=115177&date=2005-05-02&usrsess=.
Thirlwall, A.P. 2003. Growth and Development. Palgrave Macmillan: New York, pp. 303-308.
Thurow, Lester C. 1975. Generating Inequality. The Macmillan Press: London.
United Nations. 2005. Population Division of the Department of Economic and Social Affairs of the United Nations Secretariat. World Population Prospects: The 2004 Revision and World Urbanization Prospects: The 2003 Revision. Available: http://esa.un.org/unpp/.
United States Social Security Administration. 1999. Social Security Programs Throughout the World. Washington, DC. Available: http://www.ssa.gov.
Woodruff, Christopher, 2001, “Review of de Soto’s ‘The Mystery of Capital’.” Journal of Economic Literature, 39:1215–23. December.
World Bank. 1993. “The East Asian Miracle: Economic Growth and Public Policy.” World Bank Policy
Research Report. Oxford: Oxford University Press. . 2001. World Development Indicators 2001. . 2002a. “Pakistan Poverty Assessment.” Report
No. 24296-PAK. Poverty Reduction and Economic Management Sector Unit, South Asia Region, Washington, DC.
. 2002b. “Poverty in Bangladesh: Building Progress.” Report No. 24299-BD. Poverty Reduction and Economic Management Sector Unit, South Asia Region, Washington, DC.
. 2004a. “Labor Markets in South Asia: Issues and Challenges” (draft). In collaboration with the Human Development Hub. Available: http://siteresources.worldbank.org/INTLM/Resources/390041-
1103750362599/SAR_paper.pdf.. 2004b. Doing Business in 2004: Understanding
Regulation. Copublication with International Finance Corporation and Oxford University Press. Washington: The International Bank for Reconstruction and Development/The World Bank.
. 2005a. World Development Indicators 2005. Available: http://www.worldbank.org/data/wdi2005/wditext/Home.htm.
. 2005b. World Development Indicators Online. Available: http://devdata.worldbank.org/dataonline. Downloaded 7 March 2005 and 19 April 2005.
Zhao, Yaohui. 1999. “Labor Migration and Earnings Differences: The Case of China.” Economic Development and Cultural Change, 47(4): pp. 767-782.
ThemeApRev.indd 108ThemeApRev.indd 108 08/08/2005 11:34:29 AM08/08/2005 11:34:29 AM