ANNUAL PERFORMANCE PLAN
129
DEPARTMENT OF BASIC EDUCATION ANNUAL PERFORMANCE PLAN 2020/2021 MARCH 2020
-
Upload
khangminh22 -
Category
Documents
-
view
0 -
download
0
Transcript of ANNUAL PERFORMANCE PLAN

DEPARTMENT OF BASIC EDUCATION
ANNUAL PERFORMANCE PLAN2020/2021
MARCH 2020


3
CONTENTS
LIST OF FIGURES 5
LIST OF TABLES 5
LIST OF ACRONYMS 6
Executive Authority Statement 9
Accounting Officer Statement 11
Official Sign-Off 13
Part A: Mandate 14
1. Updates to the relevant legislative and policy mandates 14
2. Updates to Institutional Policies and Strategies 14
3. Updates to Relevant Court Rulings 16
3 1 KENMONT SCHOOL AND ANOTHER V DEVERAJH MOODLEY AND OTHERS 16
3 2 CENTRE FOR CHILD LAW V MINISTER OF BASIC EDUCATION AND OTHERS 17
3 3 ROSINA KOMAPE V MINISTER OF BASIC EDUCATION AND OTHERS 18
3 4 SADTU AND OTHERS V MINISTER OF BASIC EDUCATION AND OTHERS 18
3 5 PESTALOZZI TRUST AND OTHERS V MINISTER OF BASIC EDUCATION AND OTHERS 19
Part B: Strategic Focus 20
4. Updated Situation Analysis 20
4.1 Situational Analysis: External Environment 20
4.1.1 Introduction 20
4.1.2 Historical Context 20
4.1.3 Our Education Theory of Change 22
4.1.4 The Demographic and Spending Trends 25
4.1.5 Inclusivity 26
4.1.6 Early Childhood Development 26
4.1.7 Foundation Phase 27
4.1.8 Intermediate and Senior Phases 29
4.1.9 Grade Repetition 31
4.1.10 National Senior Certificate (Further Education and Training Band) 32
4.1.11 e-Education 34
4.1.12 EdTech 34
4.2 Situational Analysis: Internal Environment 35
4.2.1 Structure of the DBE 36
4.2.2 BBBEE Status 36
4.3 SWOT Analysis 36
4.4 Overview of 2020/2021 Budget and MTEF Estimates 38
Part C: Measuring Our Performance 39
5. Institutional Programme Performance Information 39
5.1 Programme 1: Administration 39
5.1.1 Outcomes, Outputs, Performance Indicators and Targets 39
5.1.2 Indicators, Annual and Quarterly Targets 40
5.1.3 Explanation of planned performance over the medium-term period 40
5.1.4 Programme Resource Considerations 42
5.2 Programme 2: Curriculum Policy, Support and Monitoring 43
5.2.1 Outcomes, Outputs, Performance Indicators and Targets 44
5.2.2 Indicators, Annual and Quarterly Targets 49
5.2.3 Explanation of planned performance over the medium-term period 52
4
5.2.4 Programme Resource Considerations 53
5.3 Programme 3: Teachers, Education Human Resources and Institutional Development 57
5.3.1 Outcomes, Outputs, Performance Indicators and Targets 58
5.3.2 Indicators, Annual and Quarterly Targets 60
5.3.3 Explanation of planned performance over the medium-term period 60
5.3.4 Programme Resource Considerations 62
5.4 Programme 4: Planning, Information and Assessment 64
5.4.1 Outcomes, Outputs, Performance Indicators and Targets 65
5.4.2 Indicators, Annual and Quarterly Targets 68
5.4.3 Explanation of planned performance over the medium-term period 69
5.4.4 Programme Resource Considerations 70
5.5 Programme 5: Educational Enrichment Services 73
5.5.1 Outcomes, Outputs, Performance Indicators and Targets 74
5.5.2 Indicators, Annual and Quarterly Targets 75
5.5.3 Explanation of planned performance over the medium-term period 75
5.5.4 Programme Resource Considerations 76
6. Updated Key Risks 78
7. Public Entities 79
8. Infrastructure Projects 79
9. Public-Private Partnerships 79
Part D: Technical Indicator Descriptions (TID) 80
Programme 1: Administration 80
Programme 2: Curriculum Policy, Support and Monitoring 83
Programme 3: Teachers, Education Human Resources and Institutional Development 102
Programme 4: Planning, Information and Assessment 112
Programme 5: Educational Enrichment Services 122
Annexures to the Annual Performance Plan 125

5
LIST OF FIGURESFigure 1: Theory of Change 23
Figure 2: Percentage of 5 to 6-year-olds with Disabilities and Those without Disabilities Attending Educational Institutions by Province, 2014–2018 27
Figure 3: Learner-Educator (LE) Ratios, 2003 to 2017 28
Figure 4: Past and Envisaged Educational Quality Trend for South Africa 30
Figure 5: Percentage of Repeaters by Grade and Gender, 2018 32
Figure 6: NSC and Bachelor-Level Increases since 1994 33
Figure 7: Grade 12 Attainment Among Youths according to Household Data 33
Figure 8: Access to Computer Labs in Schools, 2017 35
LIST OF TABLESTable 1: Constitutional and Legislative Mandates 14
Table 2: Access to Education for Learners with Disabilities 26
Table 3: Percentage of 3 to 4-year-olds attending ECD Facilities by Province, 2009–2018 26
Table 4: Percentage of 5 to 6-year-olds attending Educational Institutions by Province, 2009–2018 27
Table 5: Percentage of 16 to 18-year-olds who have completed Grade 7 and above by Population Group, 2009–2018 28
Table 6: Percentage of 19 to 21-year-olds who have completed Grade 9 and above by Population Group, 2009–2018 29
Table 7: DBE Programmes 35
Table 8: Status of the Institution regarding Women, Youth And People with Disabilities 36
Table 9: Expenditure Estimates 38
Table 10: Programme 1: Outcomes, Outputs, Performance Indicators and Targets 39
Table 11: Programme 1: Indicators, Annual and Quarterly Targets 40
Table 12: Programme 1: Reconciling Performance Targets with the Budget and MTEF 2020/21 42
Table 13: Programme 2: Outcomes, Outputs, Performance Indicators and Targets 44
Table 14: Programme 2: Indicators, Annual and Quarterly Targets 49
Table 15: Programme 2: Reconciling performance targets with the Budget and MTEF Expenditure estimates 56
Table 16: Programme 3: Outcomes, Outputs, Performance Indicators and Targets 58
Table 17: Programme 3: Indicators, Annual and Quarterly Targets 60
Table 18: Programme 3: Performance targets with the Budget and MTEF Expenditure estimates 63
Table 19: Programme 4: Outcomes, Outputs, Performance Indicators and Targets 65
Table 20: Programme 4: Indicators, Annual and Quarterly Targets 68
Table 21: Programme 4: Performance targets with the Budget and MTEF Expenditure estimates 72
Table 22: Programme 5: Outcomes, Outputs, Performance Indicators and Targets 74
Table 23: Programme 5: Indicators, Annual and Quarterly Targets 75
Table 24: Programme 5: Performance targets with the Budget and MTEF Expenditure estimates 77
Table 25: Key Strategic Risks and Mitigation 78
Table 26: Public Entities resorting under DBE 79
Table 27: Conditional Grants 125

6
LIST OF ACRONYMSAGSA Auditor-General of South Africa AIDS Acquired Immune Deficiency SyndromeANA Annual National Assessments APP Annual Performance Plan ASIDI Accelerated School Infrastructure Delivery InitiativeBAS Basic Accounting SystemBBBEE Broad-Based Black Economic EmpowermentBELA Basic Education Laws Amendment BillC/LPID Children/ Learners with Profound Intellectual DisabilityC/LSPID Children/ Learners with Severe to Profound Intellectual Disability CAPS Curriculum and Assessment Policy StatementCEM Council of Education MinistersCOVID-19 Coronavirus Disease 2019CPTD Continuous Professional Teacher DevelopmentCSE Comprehensive Sexuality Education CSTL Care and Support for Teaching and LearningCSPID Children with Severe to Profound Intellectual Disabilities DBE Department of Basic Education DDD Data-Driven DistrictsDHET Department of Higher Education and TrainingDPME Department of Planning, Monitoring and Evaluation DPSA Department of Public Service and Administration DTDCs District Teacher Development CentresEC Eastern CapeECD Early Childhood Development EFAL English First Additional Language EGRA Early Grade Reading Assessment EGRS Early Grade Reading Study EIG Education Infrastructure GrantEMIS Educational Management Information SystemsEMS:PMDS Education Management Service: Performance Management and Development SystemENE Estimate of National ExpenditureeQPRS electronic Quarterly Performance Reporting SystemFAL First Additional Language FET Further Education and TrainingFS Free StateFLBP Funza Lushaka Bursary ProgrammeGEC General Education Certificate GCIS Government Communications and Information SystemsGET General Education and TrainingGHS General Household Survey GITOC Government Information Technology Officers CouncilGP Gauteng ProvinceHEDCOM Heads of Education Departments CommitteeHIV Human Immunodeficiency VirusHR Human Resource HRD Human Resource Development

7
HRM Human Resource ManagementHSRC Human Sciences Research CouncilIA Implementing AgentICTs Information and Communication TechnologiesIEB Independent Examination BoardIIAL Incremental Introduction of African LanguagesITE Initial Teacher EducationIPREC Inter-Provincial Rural Education CommitteeIQMS Integrated Quality Management SystemKZN KwaZulu-NatalLoLT Language of Learning and TeachingLP Limpopo ProvinceLSEN Learners with Special Education NeedsLTSMs Learning and Teaching Support MaterialsLURITS Learner Unit Record Information and Tracking System MEC Member of the Executive CouncilMEO Multiple Examination OpportunityMP Mpumalanga ProvinceMST Mathematics, Science and TechnologyMTEF Medium Term Expenditure FrameworkMTSF Medium Term Strategic Framework NAF National Assessment FrameworkNC Northern CapeNCS National Curriculum Statement NDP National Development Plan NECT National Education Collaboration TrustNEPA National Education Policy ActNQF National Qualifications FrameworkNSC National Senior Certificate NSFAS National Student Financial Aid SchemeNSLA National Strategy for Learner Attainment NSNP National School Nutrition ProgrammeNSSF National School Safety FrameworkNT National TreasuryNW North WestOECD Organisation for Economic Co-operation and DevelopmentPEDs Provincial Education Departments PERSAL Personnel Salary Management SystemPGCE Post-Graduate Certificate in EducationPIRLS Progress in International Reading Literacy StudyPISA Programme for International Student AssessmentPOPI Protection of Personal InformationPPE Personal Protective EquipmentPSRIP Primary School Reading Intervention ProgrammePTDIs Provincial Teachers Development InstitutesREAP Rural Education Assistants ProjectQMS Quality Management System REQV Relative Education Qualification ValueSEACMEQ Southern and Eastern Africa Consortium for Monitoring Educational Quality

8
SACE South African Council for Educators SADTU South African Democratic Teachers UnionSAFE Sanitation Appropriate For Education SAPS South African Police ServiceSASA South African Schools ActSA-SAMS South African School Administration and Management SystemSASCE South African School Choral EisteddfodSC Senior CertificateSCMP Second Chance Matric ProgrammeSDIP Service Delivery Improvement PlanSGBs School Governing BodiesSIAS Screening, Identification, Assessment and Support SIPE Social Inclusion and Partnerships in Education SITA State Information Technology AgencySMS Senior Management Service SMT School Management TeamSoNA State of the Nation AddressSOPs Standard Operating ProceduresSRH Sexual and Reproductive Health STATS SA Statistics South AfricaSTIs Sexually Transmitted InfectionsSWOT Strengths, Weaknesses, Opportunities and ThreatsTALIS Teaching and Learning International SurveyTARMII Teacher Assessment Resources for Monitoring Improving InstructionsTB TuberculosisTIDs Technical Indicator Descriptions TIMSS Trends in International Mathematics and Science StudyTRC Truth and Reconciliation CommissionTVET Technical and Vocational Education and TrainingUNESCO United Nations Educational, Scientific and Cultural OrganizationWC Western CapeWCPSE Western Cape Provincial School EducationWSE Whole School Evaluation

9
Executive Authority StatementThe third annual Basic Education Sector Lekgotla convened from 22 to 24 January 2019 under the theme ‘’Equipping Learners with
Knowledge and Skills for a Changing World’’, set the tone for the emerging priorities in education. South Africa is refocusing the
curriculum towards a competency-based approach integrating the 21st century skills and competencies across the subjects and
introducing new subjects and programmes that are responsive to the demands of the changing world. These new subjects include
Coding and Robotics, Marine Sciences, Hydro/Aquaponics and Aviation Sciences. Working with industry, we are developing the
curriculum for these subjects that will assist learners to enter job markets that lack skilled workers to service these industries.
Amongst the objectives of the 2020 Basic Education Lekgotla, the following were highlighted; to take stock of the progress we have
made and steps taken to accelerate the achievement of the Sustainable Development Goal 4 (SDG4) and the National Development
Plan (NDP) goals and objectives; reemphasise the importance of focusing on quality and efficiency of learning outcomes utilising
assessment data to craft new strategies; and as a follow-up from the 2019 Lekgotla, ventilate on the progress made and measures
taken to ensure that our learners are equipped with knowledge and skills for a changing world.
The strategic planning sessions in the Department deliberated on both short term and long term plans based on the priorities set
by the Government and adopted those into the Education sector priorities. These plans were adopted by the Council of Education
Ministers.
The sixth administration of the South African government brings a new dawn for a trajectory of hope and progress. The focus of
this administration is to tackle the triple challenges of poverty, inequality, and unemployment, which remain racially entrenched,
through bringing higher economic growth, creating more jobs and consolidating the provision of social services to the people of
South Africa. The sixth administration has committed to accountability and consequence management for non-performance and
non-delivery.
On 18 February 2020, I presented the Department of Basic Education’s (DBE’s) response to President Cyril Ramaphosa’s 2020 State
of the Nation Address (SoNA) where I articulated that the 2014 to 2019 Medium Term Strategic Framework (MTSF) was mainly to
improve the quality of, and expand access to, education and training for all South African citizens. The combined and common
mandate for the 2019 to 2024 MTSF, is to close the skills gap and increase employment opportunities for young people. Since
the outbreak of COVID-19, the Directorate has ensured, with the assistance of the Private Party, the provision of sufficient hand
sanitisers, Personal Protective Equipment (PPE) including face masks, gloves and where necessary face shields. After the lifting of
the level 5 lockdown, but before officials arrived, the building was cleaned and sanitised thoroughly. The building is still thoroughly
cleaned on a daily basis. A screening basis has been put in place where temperatures and the basic COVID-19 symptom related
information are taken and registered. The screening information with the access control information are used to contact trace
officials who are either showing symptoms or confirmed COVID-19 infected. The areas where they were located are then cleaned
and sanitised.
Responding to the President’s statement that “a youthful population has more access to education than ever before with 2.4
million children in Early Childhood Development and pre-school,” attendance in Early Childhood Development (ECD) among 0 to
4-year-olds, has increased significantly. “We are in the process of declaring the two years prior to Grade 1, as compulsory through
the Basic Education Amendment Bill, which will be tabled in Parliament during 2020”.
We have developed an Integrated Reading Sector Plan, which is driven through the Primary School Reading Intervention Programme
(PSRIP) to improve learning outcomes, in response to the President’s announcement that “learners must read with meaning on
the year they turn ten years of age.”

10
We have prioritised the Sanitation Appropriate for Education (SAFE) Initiative launched by the President during 2018, National
Treasury has made available funding for the first phase. In concluding my response to SoNA 2020, I appealed to South Africans
to rally behind Government to address the social ills facing learners and institutions. “Education is a societal issue and we must
always remind ourselves that it takes a village to raise a child and that South Africans have a responsibility towards the well-being
of our children”.
For the past ten years, the NSC pass rate has consistently increased, going up from 60% in 2009 to above 70% pass rates in recent
years. The Class of 2019 maintained this trend. The 2019 NSC overall pass rate, with the progressed learners included, stands at a
new record of 81.3%, a 3.1% improvement from the 78.2% achieved in 2018. A record 409 906 candidates passed the 2019 NSC
examinations.
I am confident that the commitments that we made as a Department and the sector as a whole will bring about remarkable
improvements in the schooling system, and above all, will change the lives of our learners and teachers.
Mrs. A M Motshekga , MPExecutive Authority of Basic Education

11
Accounting Officer StatementThe DBE is responsible for the development of policies, oversight and monitoring of all activities to ensure quality basic education. The Annual Performance Plan is developed from the DBE Strategic Plan, which outlines the six outcomes that the Department intends to achieve through the five budget programmes in the next MTSF cycle.
COVID-19 has brought with it the biggest shocks to global education systems since the Second World War. The DBE has reprioritised considerable amounts of its budget towards responding to infection control, school rearrangement, curriculum recovery and emergency space and sanitation requirements. It has become necessary to re-examine our priorities as a sector in our contribution to the reduction of poverty and inequality. The DBE has provided emergency water and sanitation assistance, as well as guidance to provinces on the need for digital oversight and monitoring of activities. Some activities have had to be suspended and some performance expectations amended. We, however, continue to commit the Department to improving learning outcomes through the expanded provision of books, quality teaching, infrastructure and support towards early grade reading.
The outcomes of the Department are to:
• Maintain and develop the system of policies, including for curriculum and assessment, governing the basic education sector to advance a quality and inclusive, safe and healthy basic education system;
• Maintain and develop information and other systems which enable transformation and an efficient and accountable sector;
• Maintain and develop knowledge, monitoring and research functions to advance more evidence-driven planning, instruction and delivery;
• Advance the development of innovative and high-quality educational materials;
• Conduct strategic interventions to assist and develop provincial education systems; and
• Communicate information to, and partner with, relevant stakeholders in better ways.
The Department has made remarkable improvements in the sector such as better internal coaching, oversight and monitoring, policy implementation and expansion of access. The Department prides itself on the following organisational improvements; good data systems, internal control and integrated planning and reporting, the electronic business process, appointments at Senior Management Service (SMS) level for improved service delivery, and training programmes intended to up-skill the staff for enhanced productivity. The last administration achieved success in improving quality, efficiency, internal administration and coordination. However, there were also challenges identified in terms of our leadership of the sector.
The Department sets aside funds to implement three social cohesion and equity programmes, the great success of which attests to the enormous support and participation of our partners in the areas of human rights and equity:
• National Schools Moot Court, which gives learners an opportunity to test the extent to which Constitutional values may find expression within the judiciary system;
• iNkosi Albert Luthuli Oral History Programme, in which learners document their local historical events and anniversaries, discovering unsung heroes and heroines and communities as part of promoting nation-building and unity; and
• Evaluation of Textbooks, which attempts to identify areas in textbooks that depict discrimination, stereotypes, sexism, cultural discrepancies and misrepresentation.
Recent achievements in providing support to learners with special education needs included 480 textbooks adapted into Braille, including providing Grade R, Grades 1–6 Home Language, Grades 1–9 Mathematics workbooks and toolkits in all 11 languages to schools for the visually impaired; numerous concessions being granted to NSC candidates with special needs; and the NSC examination now being available in sign language.
The Department released a number of reports and surveys in 2019 such as the official release of the results for the 2017 School Monitoring Survey. The School Monitoring Survey monitors progress against Action Plan goals and the overall performance of the education system. It is not a performance management tool for our teachers and officials, but instead focuses on gathering information that is not available in other data sets, such as those collected by Stats SA.
The Department also submitted the 25-Year Review report to the DPME on service delivery progress and challenges since the advent of democracy in 1994. The 25-year review showed that, despite the sustained interventions through the Accelerated

12
School Infrastructure Delivery Initiative and the Education Infrastructure Grant, there are still substantial numbers of schools with unsafe facilities that do not comply with the Schools Infrastructure Norms and Standards. The greatest challenge is the large number of schools with undignified and unsafe pit toilets, as well as non-functional or inadequate sanitation infrastructure. The latest sanitation audit reflects that there are 3 898 schools that still have inappropriate sanitation. The urgency of this challenge and the response from the public and private sector has seen the initiation of several public-private partnerships to fund these specific areas of infrastructure. This is an important achievement in responding to priority needs in the sector.
The DBE has demonstrated commitment to ensuring that every learner and teacher has access to the minimum set of materials required to implement the national curriculum, as stipulated in the Minimum Schoolbag Guidelines. The guidelines provide standards on content and quality improvements, and the monitoring and oversight being strengthened. Although still challenged, provisioning has steadily improved.
The national workbooks initiative has been heralded as one of the most ambitious and most successful projects ever undertaken by Government. The Minister launched the Textbook Evaluation Report on 5 April 2019, produced by a Ministerial Task Team which was appointed to evaluate a broad sample of existing textbooks and Learning and Teaching Support Materials (LTSMs) with the aim of aligning what is taught at schools with the constitutional values of openness, freedom and liberty.
During the next five years, the DBE will work on implementing the following priorities, which are linked to the National Development Plan (NDP) and the 2019 State of the Nation Address (SoNA), to address sector priorities on improved reading and learning outcomes: Early Childhood Development (ECD); Infrastructure/ Sanitation Appropriate for Education (SAFE); Reading; Skills and competencies for a changing world; School Safety; and Assessment and Accountability.
Foundation Phase reading, and by implication, writing, remains a concern for the sector. Although there has been a notable improvement in the PIRLS1 results, South Africa still performs lower than most African countries. Research shows that in order to effect significant change in reading and learning outcomes, interventions should target the Foundation Phase. As such, the area of early grade reading is a policy priority for the sector. In response to the SoNA, and the MTSF outcome “10-year-old learners enrolled in publicly funded schools read for meaning”, the Department will implement the Early Grade Reading Programme – an integrated package of lesson plans, additional reading materials and professional support to Foundation Phase teachers – in North West in 2020, with wider scale-up planned over the next five years.
Initiatives such as the Read-to-Lead campaign also seek to encourage a culture of reading from a young age, by ensuring learners have reading material available for reading enjoyment. In addition, the sector will pursue improving learners’ reading proficiency in the Foundation Phase in underperforming schools through the use of the Early Grade Reading Assessment, a diagnostic reading assessment tool that aims at improving reading proficiency levels in the early grades.
The Department is introducing new subjects and curriculum content to equip learners with skills for a changing world and to ensure that South African children do not get left behind with regards to acquiring basic skills that are required in the digital age. The three streams model is another innovation towards matching the skills of the future labour force to the needs of the South African economy, and expanding participation in the technical streams. In the new MTEF, several ordinary public schools will be transformed into focus schools and new technology subjects and specialisation will be introduced.
The review of the Department’s vision and mission is a clear indication of the Department’s approach to Khawuleza, which means doing things differently, urgently and more innovatively to speed up service delivery. There have been severe budget cuts over the MTEF even before COVID-19. However, I have confidence in the DBE personnel that new ways of monitoring and oversight can increasingly be introduced to achieve the mandate the Department is expected to deliver.
Mr HM Mweli Accounting Officer of Basic Education
1 Progress in International Reading and Literacy Study.

13
Approved by:
Mrs AM Motshekga, MP Minister of Basic Education
Dr M MaboyaDeputy Director-General: Curriculum Policy, Support and Monitoring
Ms S GeyerDeputy Director-General: Planning and Delivery Oversight Unit and Acting Deputy Director-General: Office of the Director-General
Mr SG PadayacheeDeputy Director-General: Planning, Information and Assessments
Dr GC WhittleDeputy Director-General: Educational Enrichment Services and Acting Deputy Director-General: Teachers, Education Human Resources and Institutional Development
Mr D van der WesthuijzenHead of Infrastructure
Ms C Nuga DeliweHead Official responsible for Planning
Mr S NaikenChief Information Officer
Mr PRM KhunouChief Financial Officer (Deputy Director-General: Finance and Administration)
Mr HM Mweli Accounting Officer
Dr MR Mhaule, MPDeputy Minister of Basic Education
Official Sign-OffIt is hereby certified that this Annual Performance Plan:
Was developed by the management of the Department of Basic Education under the guidance of Minister AM Motshekga.
Takes into account all the relevant policies, legislation and other mandates for which the Department of Basic Education is responsible.
Accurately reflects the impacts, outcomes and outputs which the Department of Basic Education will endeavour to achieve over the period 2020/21.
14
Part A: MandateThe mandate of the Department of Basic Education is to monitor the standards of education provision, delivery and performance throughout the Republic annually or at other specified intervals, with the objective of assessing progress in complying with the provisions of the Constitution and with national education policy.
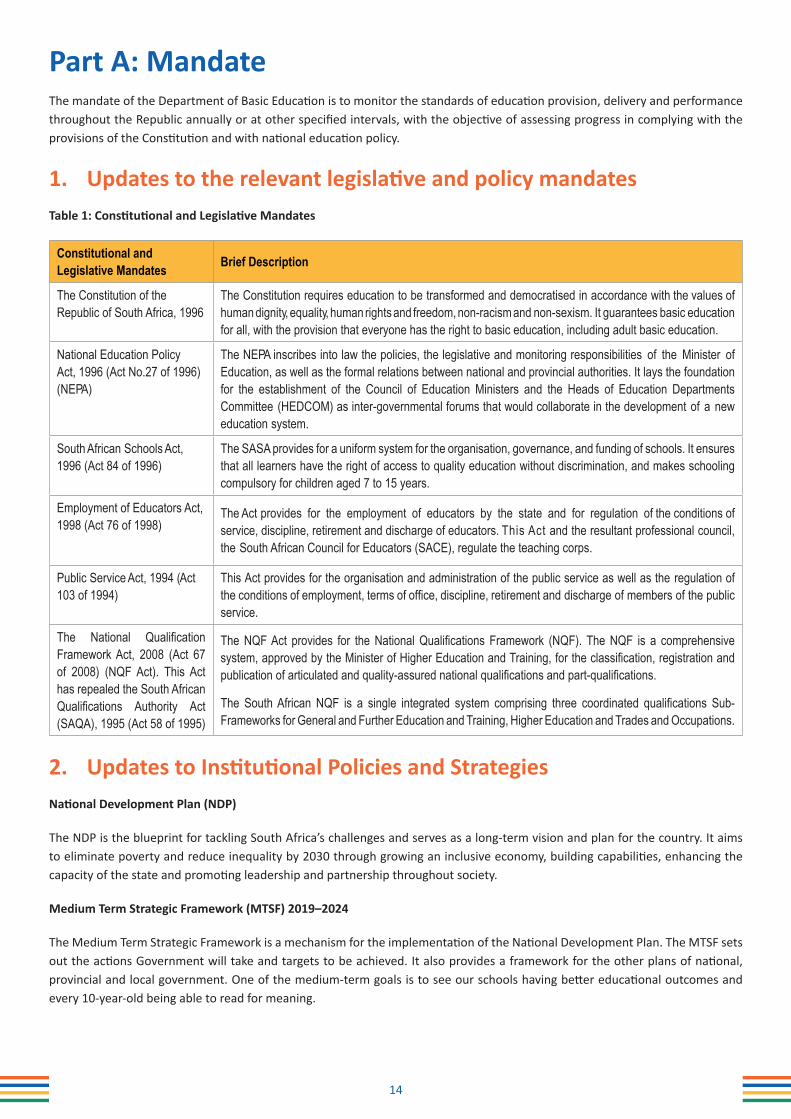
1. Updates to the relevant legislative and policy mandatesTable 1: Constitutional and Legislative Mandates
Constitutional and Legislative Mandates Brief Description
The Constitution of the Republic of South Africa, 1996
The Constitution requires education to be transformed and democratised in accordance with the values of human dignity, equality, human rights and freedom, non-racism and non-sexism. It guarantees basic education for all, with the provision that everyone has the right to basic education, including adult basic education.
National Education Policy Act, 1996 (Act No.27 of 1996) (NEPA)
The NEPA inscribes into law the policies, the legislative and monitoring responsibilities of the Minister of Education, as well as the formal relations between national and provincial authorities. It lays the foundation for the establishment of the Council of Education Ministers and the Heads of Education Departments Committee (HEDCOM) as inter-governmental forums that would collaborate in the development of a new education system.
South African Schools Act, 1996 (Act 84 of 1996)
The SASA provides for a uniform system for the organisation, governance, and funding of schools. It ensures that all learners have the right of access to quality education without discrimination, and makes schooling compulsory for children aged 7 to 15 years.
Employment of Educators Act, 1998 (Act 76 of 1998)
The Act provides for the employment of educators by the state and for regulation of the conditions of service, discipline, retirement and discharge of educators. This Act and the resultant professional council, the South African Council for Educators (SACE), regulate the teaching corps.
Public Service Act, 1994 (Act 103 of 1994)
This Act provides for the organisation and administration of the public service as well as the regulation of the conditions of employment, terms of office, discipline, retirement and discharge of members of the public service.
The National Qualification Framework Act, 2008 (Act 67 of 2008) (NQF Act). This Act has repealed the South African Qualifications Authority Act (SAQA), 1995 (Act 58 of 1995)
The NQF Act provides for the National Qualifications Framework (NQF). The NQF is a comprehensive system, approved by the Minister of Higher Education and Training, for the classification, registration and publication of articulated and quality-assured national qualifications and part-qualifications.
The South African NQF is a single integrated system comprising three coordinated qualifications Sub- Frameworks for General and Further Education and Training, Higher Education and Trades and Occupations.
2. Updates to Institutional Policies and StrategiesNational Development Plan (NDP)
The NDP is the blueprint for tackling South Africa’s challenges and serves as a long-term vision and plan for the country. It aims to eliminate poverty and reduce inequality by 2030 through growing an inclusive economy, building capabilities, enhancing the capacity of the state and promoting leadership and partnership throughout society.
Medium Term Strategic Framework (MTSF) 2019–2024
The Medium Term Strategic Framework is a mechanism for the implementation of the National Development Plan. The MTSF sets out the actions Government will take and targets to be achieved. It also provides a framework for the other plans of national, provincial and local government. One of the medium-term goals is to see our schools having better educational outcomes and every 10-year-old being able to read for meaning.

15
The Seven MTSF Priorities are as follows:
Priority 1: Building a capable, ethical and developmental state;Priority 2: Economic Transformation and Job Creation;Priority 3: Education, Skills and Health;Priority 4: Consolidating Social Wage through reliable and quality basic services;Priority 5: Spatial integration , human settlements and local government;Priority 6: Social cohesion and safer communities; andPriority 7: A better Africa and World.
State of the Nation Address (SoNA)
The SoNA is a joint sitting of Parliament in which the President of South Africa reports on the status of the nation. The SoNA tells the citizens what the Government’s Programme of Action is for the year ahead. It is during the SoNA that the President makes announcements on what each Department will achieve.
Action Plan to 2024
The Action Plan to 2024: Towards the Realisation of Schooling 2030 is the basic education sector plan and is in the process of being finalised. The Action Plan is based on 27 national goals that are intended to improve basic education across all levels.
Thirteen of these goals are output goals, dealing with better school results and better enrolment of learners in schools. The remaining 14 goals deal with what must happen for the output goals to be realised.
Sector Priorities
The basic education sector developed activities around the key priorities articulated in the NDP, SoNA 2019, MTSF priorities and the revised draft of the sector plan, Action Plan to 2024: Towards the Realisation of Schooling 2030. Over the next five years, the sector will work on implementing the following priorities, which are linked to the NDP, the 2019 SoNA and sector planning priorities in support of improved reading and learning outcomes.
• Early Childhood Development (ECD);• Infrastructure/ Sanitation Appropriate for Education (SAFE);• Reading;• Skills and competencies for a changing world; • School Safety; and• Assessment and Accountability.
PRESIDENTIAL EMPLOYMENT STIMULUS
The DBE, in its contribution to the Presidential Employment Stimulus, has developed plans to roll out a total of 442 406 employment opportunities over the Medium-Term Expenditure Framework, covering Teachers, Education Human Resources and Institutional Development, Care and Support in Schools, Partnership in Education, School Infrastructure and Planning and Delivery Oversight Unit budget programmes. The jobs will be created in the sector through the following initiatives: Number of youth, women and persons with disabilities employed on community-based approach for infrastructure delivery and maintenance; Number of students, learners or graduates from Technical High schools, Technical and Vocational Education and Training (TVET) colleges and Higher Education Institutions (HEIs) and community members employed on Infrastructure projects; Number of youth, women and persons with disabilities employed on Department of Water and Sanitation projects related to delivery of water and sanitation projects; Number of security staff appointed to support safety in schools; Number teacher assistants appointed to support learners, with the after-school programmes; Number of child and youth care workers (CYCW) employed at school level - To provide counselling sessions and home visits to support learners; Number of Screeners and Learner Support Agents placed in provinces to support with COVID-19 measures and protocol; An Annual Sector Report is produced on the number of screeners and Learner Support Agents (LSAs) placed in Quintiles 1-3 schools and Number of quarterly monitoring reports indicating the number of appointed teacher assistants.
The reporting of the same will be through, as soon as the voted or extraordinary allocation for the Presidential Employment Stimulus is finalised. The DBE, will engage the Provincial Education Departments, and other relevant stakeholders in preparation for the implementation of the Presidential Employment Stimulus, and to ensure effective monitoring and reporting. As a concurrent function, policies and strategies are developed at National level and interventions take place at provincial level.

16
3. Updates to Relevant Court Rulings
3.1 KENMONT SCHOOL AND ANOTHER V DEVERAJH MOODLEY AND OTHERS
The Constitutional Court handed down judgement in October 2019 judgement in an application for confirmation of an order by the High Court of South Africa, KwaZulu-Natal Local Division, Durban, declaring section 58A(4) of the South African Schools Act 84 of 1996 (Schools Act) constitutionally invalid. Kenmont School and the Kenmont School Governing Body (school respondents) applied for leave to appeal against the judgement of the High Court.
The applicant, Mr Deverajh Moodley, successfully challenged the admission policy of Kenmont School in the High Court which ordered the school respondents to pay his legal costs. The school respondents took the matter on appeal to the Supreme Court of Appeal, which dismissed the appeal and, like the High Court, made a costs order in favour of the applicant.
The applicant’s taxed bill of costs amounted close to R600 000, excluding interest. After unsuccessfully seeking satisfaction of his costs award from the school respondents, the applicant obtained a warrant of execution against the school and attached the school’s bank account as well as a motor vehicle belonging to the school. The school respondents approached the High Court, on an urgent basis, seeking a court order setting aside the warrant of execution and relied on section 58A(4) of the Schools Act, which protects the assets of public schools from attachment as a result of any legal action taken against the school. The applicant filed a counter-application seeking, among others, an order declaring section 58A(4) of the Schools Act unconstitutional. The High Court granted the applicant’s counter-application and declared the section constitutionally invalid.
The Applicant then approached the Constitutional Court for confirmation of the declaration of invalidity. The Head of Department, Department of Education, KwaZulu-Natal, the MEC for Education, the Minister of Justice and Correctional Services and the Minister of Basic Education (government respondents), the third to sixth respondents, argued that it was misconceived to contend that the applicant’s costs must be paid by the State as no costs order was awarded against the State. They further submitted that the school respondents were cautioned against engaging in the litigation. The government respondents took the view that section 58A(4) ought not to be declared constitutionally invalid.
In a unanimous judgement penned by Justice Madlanga, the Constitutional Court declined to confirm the High Court’s declaration of constitutional invalidity. The Court held that although section 58A(4) limits the rights to equality and dignity, in light of the right that it seeks to protect – the right to basic education – the limitation is reasonable and justifiable under section 36(1) of the Constitution. It concluded that the purpose of the limitation brought about by the prohibition in section 58A(4) is to avoid any adverse effects that could be caused by the attachment of school assets, thereby protecting the right to basic education and ensuring that the children’s best interests are afforded paramount importance. The limitation is therefore well-tailored to its purpose and there are no less restrictive means to achieve this purpose.
With regard to the fate of the Applicant’s costs awards, the Court held that despite its prohibition of the attachment of assets of a public school, section 58A(4) does not outlaw the grant of orders sounding in money, including costs orders, against public schools.
The Court found that implicit in a public school’s legal capacity to sue and be sued in its own name is the power to pay the opposing side’s costs if so ordered by a court. Public schools cannot be empowered to sue and be sued, but be immune to adverse costs orders. In terms of section 37(6)(c) of the Schools Act, the governing body of a public school is empowered to pay legal costs. The Court, therefore, concluded that the Kenmont School Governing Body had the statutory mandate to settle the applicant’s bills of costs. It further ordered that the members of the Kenmont School Governing Body must, individually or collectively, take the necessary steps to ensure that the payment does take place.

17
3.2 CENTRE FOR CHILD LAW V MINISTER OF BASIC EDUCATION AND OTHERS
The Applicants in this matter are the Centre for Child Law (CCL) and the School Governing Body of Phakamisa High School. The Respondents are the Minister of Basic Education, MEC for Education Eastern Cape and Superintendent General of the Eastern Cape Department of Education.
The Applicants applied for, amongst others, the following orders:
i. That a circular issued by the Eastern Cape Education Department be set aside. The circular indicated that norms and standards, post provisioning allocation and National School Nutrition Programme (NSNP) transfers to schools in the Eastern Cape will be based only on learner numbers where valid identity, permit or passport numbers have been captured in the South African School Administration Management System (SA-SAMS);
ii. Directing that no learner may be excluded from a public school on the basis that he or she does not have an identity, permit or passport number.
iii. Directing the Respondents and all public schools to admit a learner who does not have a South African identity number, passport or permit number, provided that such learner provides valid proof of identity and where such proof is not obtainable, a sworn statement or an affidavit in a format prescribed by the Respondents that may be acceptable.
This matter was heard in court on 18 September 2019. Judgement was delivered on 12 December 2019
(iv) The court amongst others made the following orders:
(a) Clauses 15 and 21 of the admission policy were declared to be inconsistent with the constitution and therefore invalid;
(b) Clause 15 provides that when a parent applies to an ordinary public school for admission of a learner the parent must present an official birth certificate of the learner. The learner will be conditionally admitted of the parent is unable to present such birth certificate and the parent must finalise the admission of the learner within three months of the conditional admission of the learner;
(c) Eastern Cape Education Department Circular 6 of 2016, dated 17 March 2016, was declared to be inconsistent with the Constitution and therefore invalid and was set aside. This circular deals with the payment of Norms and Standards funding, School Nutrition and post provisioning to public schools and provides that payment of such funding will be based on learners with valid identity numbers on the SA-SAMS system;
(d) The First to Third Respondents are directed to admit all children not in possession of an official birth certificate and where a learner cannot provide an official birth certificate the principal of the relevant school is directed to accept alternative proof of identity such as an affidavit or a sworn statement deposed to by the parent, care giver or guardian of the learner wherein the learner is fully identified;
(e) Sections 39 and 42 of the Immigration Act 13 of 2002 do not prohibit the admission of illegal foreign children into schools and do not prohibit the provision of basic education to illegal foreign children.
(f) The First, Second and Third Respondents are interdicted and restrained from, in any manner whatsoever, removing or excluding from schools, children, including illegal foreign children, already admitted, purely by reason of the fact that the children have no identity document number, permit or passport, or have not produced any identification documents.

18
3.3 ROSINA KOMAPE V MINISTER OF BASIC EDUCATION AND OTHERS
The case is about the tragic death of a grade R learner, Michael Komape, who drowned when he fell into a pit latrine toilet at his school which is located in the province of Limpopo. Michael’s parents and siblings (the Plaintiffs), assisted by Section 27, instituted action proceedings in the High Court of Limpopo for damages arising from the death of Michael Komape.
The Plaintiffs case consisted of five claims (Claims A-E). Claim A was for emotional trauma and shock that each of the family members had experienced. Claim B was for the grief suffered by the Plaintiffs as immediate family members and in the alternative to claim B constitutional damages based on a breach of their constitutional rights as set out in sections 9(2) and (3),10, 24, 28 and 29 of the Constitution of the Republic of South Africa, 1996 (the Constitution). Claim C was for past and future medical expenses as a result of their impaired mental health suffered because of the death of Micheal Komape. Claim D was for funeral expenses and Claim E was for loss of earnings in respect of the first Plaintiff. In addition the Plaintiffs also sought a declaratory order that the Defendants have breached their constitutional obligations in respect of the rights contained in sections 9, 10, 11, 24, 27, 28 and 29 of the Constitution. Claims C, D and E were settled during the trial for R135,372.65.
The case was heard in the High Court of Limpopo on several dates spanning from 13 to 17 November 2017 and again on 20, 23, 27-28 November 2017 and 1-2 February 2018. Judgement was delivered on 23 April 2018. The Plaintiffs claim was dismissed in respect of claims A and B. In respect to the alternative to claim B, a structural interdict was granted by the court that the Defendants file a plan on affidavit on how they will eradicate pit latrine toilets in the province. The plan had to be filed on or before 31 July 2018. In respect to claim C the court granted an amount of R 6 000 each to the minor children Maria and Enoch Komape for future treatment.
The Plaintiffs applied for leave to appeal. The application was dismissed. The Plaintiffs filed a petition with the Supreme Court of Appeal to request the court to grant them leave to appeal. The Supreme Court of Appeal granted leave to appeal. The matter was argued in the Supreme Court of Appeal on 2 September 2019.
The Supreme Court of Appeal overturned the High Court decision and ordered the Defendants to pay the first and second Plaintiffs in respect of emotional shock and grief an amount of R350 000 each, and the third and fourth Plaintiffs an amount of R200 000 each and R100 000 each for the minor children Maria, Onica and Moses Komape.The judgement amounts were paid by the Limpopo Education Department.
Pending Cases
3.4 SADTU AND OTHERS V MINISTER OF BASIC EDUCATION AND OTHERS
The Applicants in this matter is SADTU. The Respondents are the MEC for Education WC, National Minister of Basic Education, Speaker of the Provincial Legislature: WC Province, the Premier of the WC, and the Minister of Justice and Constitutional Development.
SADTU brought an application that the Western Cape Provincial School Education Amendment Act, 2018 (WCPSEA Act) be declared unconstitutional and amongst others raised the following issues:
i. declaring sections 9A,11A,11B,11C,11D,11E,11F,11G,11H, of the Western Cape Provincial School Education Act, 1997 (Act No. 12 of 1997) (WCPSE Act), as amended by the Western Cape Provincial School Education Amendment Act, 2018 (Act No. 4 of 2018), to be inconsistent with the Constitution and invalid to the extent that they provide for the monitoring and support of curriculum delivery and the establishment of a Schools Evaluation Authority;
ii. declaring sections 12C and 12D of the WCPSE Act as amended by the WCPSEA Act to be inconsistent with the Constitution and invalid to the extent that they provide for the establishment of Collaboration and Donor-Funded Public Schools;
iii. declaring section 12E of the WCPSE Act as amended by the WCPSEA Act to be inconsistent with the Constitution and invalid to the extent that it provides for the establishment of intervention facilities;
iv. declaring section 45B of the WCPSE Act as amended by the WCPSEA Act to be inconsistent with the Constitution and invalid to the extent that it provides for an exception to the prohibition of alcoholic liquor on school premises or during school activities; and
v. suspending the declaration of the constitutional invalidity for 12 months in order for the third Respondent to remedy the defect in accordance with the Court’s judgement in the matter.

19
3.5 PESTALOZZI TRUST AND OTHERS V MINISTER OF BASIC EDUCATION AND OTHERS
The Applicant in this matter is the Pestalozzi Trust. The Respondents are the Minister of Basic Education and the Director-General Basic Education.
The Applicant applied for an order that the Home Education Policy of the Department be set aside. The Applicant in their court application raised amongst others a number of procedural and substantive grounds for challenging the policy. The procedural issues include the following:
vi. The Department did not meaningfully consult with stakeholders on the policy.
vii. The Department used the incorrect empowering provision in declaring the policy and did not fully comply with the provisions of the National Education Policy Act when the policy was declared.
The Applicant also raised a number of substantive issues with regard to certain clauses of the policy. In this regard the Applicant alleged that these provisions are vague, unworkable, irrational and in some instances unconstitutional.

20
Part B: Strategic Focus4. Updated Situation AnalysisThe strategic direction of the Department is derived from the Government’s plans and priorities, namely the National Development Plan (NDP), Medium Term Strategic Framework (MTSF) and the State of the Nation Address (SoNA). Furthermore, the strategy of the Department is guided by the National Education Policy Act (NEPA), the draft sector plan ‘Action Plan to 2024’, the sector priorities and the Minister of Basic Education’s budget speeches.
4.1 Situational Analysis: External Environment
4.1.1 Introduction
Since March 2020, majority of countries in the world have been under lockdown due to the COVID-19 pandemic.
Important note on the COVID-19 pandemic
The five-year plan was formulated before the COVID-19 pandemic. By May 2020, the reality of the enormous costs of the pandemic for society, the economy, and education were clear. The effects of the pandemic will remain for years. At the same time, the pandemic provided an opportunity for South Africans to prove their resilience and ingenuity at a time when the nation faced a common enemy.
The pandemic does not remove any of the priorities outlined in the plan. However, it delays the point at which certain milestones can be reached, for budgetary and other reasons. Moreover, the pandemic reshapes to some extent existing priorities.
The overall goal of the various actors in the basic education sector must remain to improve the quality of learning outcomes, and reduce educational inequalities. We should not lose sight of this. South Africa has been on an upward trajectory in terms of the skills acquired by learners for around two decades. This has profound and positive implications for South Africa’s future. The momentum of this improvement cannot be lost as a result of the pandemic.
In fact, we can think of illiteracy among our primary school learners almost in the way we have learnt to think about the coronavirus. It is a scourge which must be eliminated, by identifying ‘hotspots’ where children are not learning as they should, and intervening to ensure that people’s futures are not compromised.
COVID-19 is unlikely to disappear quickly, and beyond that there is a high likelihood that we could be struck by another pandemic. In future, the basic education system should be better prepared for this risk. Good nutrition and hygiene are the backbone of effective learning, especially for younger learners. The National School Nutrition Programme needs to be better prepared to ensure that food continues to be available to learners from poor households, even during school closures. Understanding pandemics, and basic hygiene needs to feature more strongly in the Life Orientation curriculum. There needs to be emergency plans which school managers are familiar with, and which can be put into effect at relatively short notice. School infrastructure needs to support hygiene. Here an uninterrupted supply of water, which has not been a reality for all schools, needs to be prioritised.
Lastly, the COVID-19 pandemic has brought to the fore the weakness of Information and Communication Technologies (ICTs) infrastructure in many schools, and gaps with regard to digital content for learners and educators. South Africa is behind many similar countries in this regard. This gap must be closed. Learners, particularly those at the secondary level facing important national examinations, should become more accustomed to using online resources. If teachers are accustomed to using these resources, it becomes easier for this to be realised among learners. Technology innovation is important whether we are faced with a health crisis or not.

21
This section begins by considering the longer-term historical context which remains an important backdrop for planning going forward. A Theory of Change for how educational improvements will happen is presented. This serves to highlight a number of critical areas to focus on during planning. Thereafter, a situational analysis of the various phases of schooling is provided: Early Childhood Development, the Foundation Phase, the Intermediate and Senior Phases, and the Further Education and Training Phase. The themes of redress, access, quality, equity, inclusivity and efficiency are used to focus the discussion of each phase. Key areas of innovation are also considered. Lessons from research and evaluations are incorporated throughout the analysis.
4.1.2 Historical Context
The apartheid legacy of division by race and language is still strong and is reinforced by economic inequalities in the democratic era. The schooling system has a critical role to play in healing the divisions of the past, fostering a sense of South African nationhood and, above all, providing education opportunities that will break down the deep inequalities that pervade South African society.
It is increasingly being recognised that part of the current challenge relates to what has been referred to as the work of decolonising education. Decolonising the system as a whole, and the curriculum in particular, will involve understanding the harm done to nationhood and the psychology of both the oppressed and the oppressors. This understanding should guide a process of healing that affirms equality, undoes the marginalisation of African culture and privileging of values brought about by colonisation and apartheid, and moves beyond the confines of a Eurocentric world view and curriculum.
Apartheid education was characterised not only by the racial segregation of learners, but also segregated education for learners with disabilities and, for the majority of black learners with disabilities, education only up to the equivalent of Grade 7. Segregated education also characterised the training of teachers, where different ‘racial’ groups of teachers experienced training that was different in terms of its resourcing, quality and ideological thrust. Individual teachers, teacher unions, universities, NGOs and governments have done much work over the years to erode the apartheid teacher training legacy through in-service training programmes and the promotion of common values. Yet this apartheid legacy persists and will need to be considered in the design of in-service training and in the way training programmes target teachers for many years to come.
Per learner spending by the state under apartheid was highly unequal and differentiated by race and ethnicity. Even towards the end of apartheid, in 1994, spending on every white learner was still about 4,5 times higher than on a black African learner. Public spending per learner was only fully equalised around 2000. However, the legacy of inequality with respect to many years of unequal expenditure remains, both as far as backlogs in physical capital (such as school buildings) and human capital (largely due to the unequal teacher training legacy mentioned above) are concerned. Allowing school fees in public schools has often been referred to as the cost of maintaining an inclusive public school system serving a broad range of South African society. Indeed, by developing country standards, the size of South Africa’s independent school sector is small. However, allowing the charging of fees in public schools has advantaged the middle class and reinforced still large inequalities in school resources reflected within the public school system, as opposed to between the public and private school systems, as in many developing countries. These historical factors make South Africa’s school funding system complex and, in many ways, unique. A key challenge will continue to be improving equality within a public school system that operates within a highly unequal society. Reducing inequality in basic education, especially with respect to the skills learners leave school with, is fundamental to bringing about a more equal society. A priority is also to provide inclusive education that enables everyone to participate effectively in a free society.
The legacy of land dispossession and forced resettlement has shaped the human geography of South Africa and influenced the location of schools. Schools in former ‘homelands’ account for just under half of all public school enrolments and face a particular form of poverty characterised by the inaccessibility of public facilities and jobs. To a large degree, Quintiles 1 to 3 of the five socio-economic quintiles cover the schools in question, meaning that many of the quintile-specific interventions by government are attempts to address the specific needs of rural schools.
The legacy of colonialism persists through the dominance of colonial languages. In South Africa, English, though only spoken by about 4% of public school learners as a home language2, is the predominant language of the textbooks used in classrooms, as well as in the system’s policy documents. There is compelling research indicating that young children learn best if, during the first few years of their schooling, key concepts, especially literacy and reading skills, are taught in their home language. But beyond these pedagogical considerations, promoting all languages in the education system is a matter of national pride and of liberation.
Finally, South Africa has inherited a tradition of associating success (and value) in education with a university qualification. While

22
university studies are obviously valuable, alternative educational pathways have not received the focus they deserve. In particular, vocational training options within schools and beyond basic education were not sufficiently available and, when available, were undervalued by many teachers and parents. This is partly a symptom of the history of unequal access to both university and vocational training under apartheid and the legacy of race-based job reservation. Today, in the National Senior Certificate examinations, white learners are six times as likely as black African learners to take one or more of the four key technical subjects3 Going forward, there is a need to provide learners with better access to vocationally-oriented subjects and for schools to play a more proactive role in alerting the youth to new training and job opportunities so as to move away from the notion of university studies as the sole post-school study option.
4.1.3 Our Education Theory of Change
In developing our plans, our assumptions of improvement in learning outcomes over the last 2 decades have been disrupted as a result of COVID-19. However, our commitment to quality education and to reducing inequality through schools remains the same. Therefore, this theory of change below is provided. Schools safety, health and nutrition are now more important than ever before. Effective teaching and maintaining Early Childhood Development participation and learning outcomes are extremely important to overcome the effects of COVID-19 in our sector and in our county. We know that the social and economic impact of the pandemic will affect communities, teachers, learners and parents alike. We have to improve learners opportunities in life and in the future, in spite of COVID-19.
Developing a theory of change can be an extremely detailed and complex process, even when only looking at a single programme or policy. Therefore, a theory of change for the entire basic education system will inevitably be a simplification of reality, and also a useful tool to understand and explain important processes that facilitate educational change. The following diagram depicts the DBE’s understanding of how better quality schooling will be brought about.
3 Engineering Graphics and Design, Civil Technology, Electrical Technology, Mechanical Technology.

23
Figure 1: Theory of Change
TEACHERWith his or her subject knowledge, linguistic background, teaching
skills, professional identity, level of job satisfaction, view of
society.SYSTEM OF TEACHER
DEPLOYMENTIncludes incentives to
teach in disadvantaged schools.
LEARNING AND TEACHING SUPPORT MATERIALS (LTSMs)
With 'hardware' (e.g. book or tablet) and 'software' (content)
elements.
CURRICULUM AND ASSESSMENT POLICYSTATEMENT (CAPS)
Includes supplementary policies and guidance relating to teaching
methods, assessment tools, and grade promotion.
CONTINUOUS PROFESSIONAL
TEACHER DEVELOPMENT (CPTD)
Also known as 'in-service training'.
LEARNERSArranged in classes of particular sizes, and with a range of individual special
needs.INITIAL TEACHEREDUCATION (ITE)
Also known as 'pre-service training'.
CONDITIONS OF SERVICE
Includes careerpathways.
EARLY CHILDHOOD DEVELOPMENT
SCHOOL PRINCIPAL AND SMT
SCHOOL ACCOUNTABILITY FRAMEWORKDraws from School Improvement Plans, annual reports, school report cards, SA-SAMS, Matric examinations, IQMS, WSE.
NATIONAL STRATEGYIncludes this 'theory of change', effective plans and reliable reports, maintenance of a lively and constructive policy discourse, alignment with international commitments.
PROVINCIAL AND DISTRICT AUTHORITIES
PARENTS AND SCHOOL
GOVERNING BODIES
SCHOOL-SPECIFIC POLICIES AND ETHOS
A THEORY OF CHANGE FOR QUALITY BASIC EDUCATION
LANGUAGEPOLICY
SOCIALPROTECTIONIncludes nutrition
and health interventions, school
safety.
The theory of change is about improving learning in a manner that improves the learner’s opportunities in life through the acquisition of foundational language and numeracy competencies, and beyond that, specific subject knowledge and life skills.
Figure 1 is deliberately a simplification of what is clearly a far more complex system. The following points will assist in understanding some of the complexities either simplified or omitted from the diagram.
4.1.3.1 Direct change factors
• School infrastructure was excluded, partly because the evidence on the impact of specific classroom designs on learning is mixed and partly because basic elements of school infrastructure such as decent toilets have relevance beyond the matter of effective learning, as they also involve the fulfilment of basic human rights.

24
• Early Childhood Development (ECD) is intentionally at the top of the diagram, reflecting increasing evidence of the importance of health and psychosocial interventions during a child’s earliest years for subsequent learning in school. For example, at the most basic level, around one-fifth of children have suffered stunting due to poor nutrition, which could result in lasting impairments in the ability to learn.
• Once in school, a learner’s chances of learning are strongly influenced by three key classroom factors: the capabilities of the teacher, the availability of Learning and Teaching Support Materials (LTSM) and class size. Moreover, particularly for learners from poorer households, a nutritional meal provided by the school plays a major role in learning ability.
• Initial Teacher Education (ITE) is meant to provide teachers with the professional grounding needed for effective teaching. There is some evidence to suggest that this element of the system has improved in the last two decades. However, around two-thirds of teachers currently working in public schools received their initial professional training before the reforms of the early 2000s, and it is only around 2038 that we expect all teachers to have a post-reform ITE background. This makes it especially important to offer Continuous Professional Teacher Development (CPTD) to enable teachers to update their skills, in part because teaching methods evolve as new technologies emerge.
• The availability of effective LTMSs relies in part on investments in the development of good content and in part on funding, distribution systems and technologies that make texts accessible to learners. The development of LTSMs is not a straightforward matter, and clearly not all LTSMs are equally effective in different linguistic, socio-economic and cultural contexts. The positive impacts of LTSMs are likely to be enhanced if learners can take materials home. It is also important for teacher support strategies to help teachers to integrate the effective use of LTSMs into their lessons.
• While there is important research from around the world showing that changing average class sizes only makes a small difference to what learners learn, it must be noted that this research tends to deal with class sizes that are much lower than in many South African schools. The large size of South African classes is particularly worrying at the primary level where individualised attention to learners is important. According to the TIMSS data, one in seven Grade 5 learners is in a class with 50 or more learners.
4.1.3.2 Indirect change factors
Other elements in the diagram that are described below may not impact as directly on the classroom as the elements referred to above, but they remain vital change factors.
South Africa’s conditions of service for educators are determined nationally. These policies play a large role in influencing who chooses to take up teaching as a profession and whether the best teachers remain in the public system. It is important to develop clear and logical career pathways for teachers, including opportunities for advancement with respect to pay, responsibilities and professional self-fulfilment. Much work is needed to improve existing career pathways, for instance through a better focus on the role of senior teaching positions such as those of schools-based ‘heads of department’, and a more transparent process of promotion into management posts. Budget constraints in recent years have underlined the importance of better costing methods and better cost projections to inform conditions of service and career pathway policies.
The system of teacher deployment includes the ‘post provisioning’ policy governing how enrolment numbers are used to generate each school’s entitlement to publicly paid educator posts, and a complex system of redeployment which moves ‘excess’ teachers with fewer years of experience first, giving these teachers some say as to where they move, and schools some say as to who they appoint as a new teacher. The system works better in some provinces than in others. A crucial element of any deployment system should be incentives to teach in disadvantaged schools. While policy for such incentives exists, it is not widely implemented and is due for review.
The Curriculum and Assessment Policy Statement (CAPS) describes what should be taught in each subject and grade, and to some extent, how. It moreover explains how teachers and schools should assess learners. There are aspects of the CAPS which need to be expanded, including a critical need to provide Foundation Phase teachers with better guidance and materials to help them teach reading. Improving the availability of good assessment tools for teachers is a critical area. Schools need better formative assessment (assessment for learning) in schools throughout the school year, in addition to the summative assessments of learning that often occur twice a year.

25
Learners who speak one of the nine indigenous African languages at home generally experience a dual disadvantage: not only do they usually begin learning in an unfamiliar language in Grade 4, usually English, they also tend to come from more socio-economically disadvantaged households. To facilitate a better transition in the Language of Learning and Teaching (LOLT), more support will be needed to improve the teaching of English as a First Additional Language (FAL) in the Foundation Phase, but perhaps even more importantly, more support will be needed to improve the teaching of Home Language Literacy in the Foundation Phase because it is a child’s home language skills that are used to learn a second language. Furthermore, the DBE will investigate ways to ensure that the home language resources of children are drawn upon to a greater extent in Grade 4 and beyond. This is aimed at allowing language to be a positive resource to help our children learn rather than viewed as a barrier to learning.
Principals, supported by their School Management Team (SMT), need to play a stronger instructional leadership role as agents of change in the schooling system. Managers need to pay more attention to how teachers teach, and how academic improvement over time for the school as a whole is monitored, keeping in mind that the national improvement in learning outcomes envisaged by the NDP is the sum of improvements brought about in each of several thousand schools across the country.
While schools are accountable to districts and the provincial authorities, there is a need for a holistic school accountability framework to bring together the various strands and identify critical gaps to effect educational improvement. Existing school accountability elements include the annual school improvement plan, school annual report, the increasing use of the SA-SAMS and the Whole School Evaluation (WSE) programme run in certain provinces.
Strengthening the accountability of the approximately 14 800 public primary schools with no grade above Grade 7, and their principals, remains a key challenge. The NDP noted the need for ‘reliable measures’ of primary school performance. A 2017 agreement with teacher unions focuses on establishing the Systemic Evaluation programme, which would include the testing of samples of Grades 3, 6 and 9 learners every year. This would permit highly accurate monitoring of whether learning outcomes were improving at provincial and national levels. In fact, this sample-based testing is likely to produce more accurate system-level trends than a testing system covering every school. There would still be a need to monitor the levels of performance and trends of all primary schools with reasonable accuracy.
Depending on the definition of poverty used, between a quarter and half of South Africa’s learners come from poor households. Poverty involves many factors impacting negatively on learning, including an inability to pay for transport to school or a school uniform, weak capacity of parents or caregivers to provide educational support and a variety of social problems in the home. Policies dealing with nutrition, scholar transport, safety in schools and the identification of especially vulnerable children, among others, contribute to the social protection offered by the schooling system to mitigate the effects of poverty.
Districts play a critical role in managing support to schools and teachers and the accountability of schools. Their support functions span many of the boxes in the diagram, including professional teacher development, teacher deployment, LTSMs and school governing bodies. As emphasised in the NDP, the accountability between districts and schools is mutual. Schools are accountable to districts for effective use of the available resources, and districts are accountable to schools for providing quality support services.
A national strategy to bring about quality basic education is needed, as articulated in the NDP and the DBE’s Action Plan. The national strategy must be a living one, characterised by a lively and constructive policy discourse, informed by reliable information produced by government and non-government players. All this could profoundly influence the mood in the sector and trust between stakeholders, which inevitably impact on what happens in schools and classrooms. The key element which the DBE will prioritise is the new Systemic Evaluation programme expected to become fully operational in 2020. This programme focuses not just on learning outcomes, but also on the multitude of contextual factors. Importantly, the programme will enable South Africa to report against the UN Sustainable Development Goal indicators dealing with the attainment of proficiency levels among children.
4.1.4 The Demographic and Spending Trends
A large increase in Grade 1 enrolments, particularly in 2011, followed by a large Grade 2 increase in 2012, and so on up the grades, were reflections of serious and unexpected demographic shifts. It is now clear that the number of births per year rose to a new level during the 2003 to 2005 period. The reasons for this are not fully understood, but the evidence suggests easier access to antiretroviral treatment was the principal cause. Whatever the cause, the schooling system had to deal with an unexpectedly large inflow of children. For instance, Grades 1 to 3 enrolments increased by 12% between 2010 and 2017, while Grades 4 to 7 enrolments increased by 10% between 2013 and 2017. In addition to these, large enrolment increases were seen in Grades 10 to 12, not as a result of the rise in births, but due to lower dropout rates from the upper secondary level.

26
4.1.5 Inclusivity
The NDP envisages an education system that will build an “inclusive society, providing equal opportunities and helping all South Africans to realise their full potential, in particular those previously disadvantaged by apartheid policies, namely black people, women and people with disabilities” (NDP, p. 296). The DBE aligns itself with the social justice principles of access, redress, equity, efficiency, quality and inclusivity. Our policy obligations include the establishment of effective management, policy, planning and monitoring capacity to guide and support the development of an inclusive education and training system. This includes ensuring that learning difficulties are not only perceived as residing within a learner, but also within various aspects of the system. Table 2 shows that progress has been made with regards to ensuring inclusivity in the basic education system. Learning losses due to COVID-19 threaten the improving picture of equity in the schooling system.
Table 2: Access to Education for Learners with Disabilities
Growth Area 2002 2018
Number of special schools 295 501 (447 Public, 54 Independent)
Learner enrolment in special schools 64 000 93 699
Number of full-service schools 30 848
Number of learners with disabilities in public ordinary schools 77 000 121 461
Number of children with severe to profound intellectual disability supported in special care centres
Implementation started in 2018 6 654
Source: EMIS data for 2019.
4.1.6 Early Childhood Development
With the President’s recent pronouncements about the migration of more ECD services to the DBE, this sub-sector became a top priority for the next five years. It is important to note that expanded access to ECD opportunities has been an area of redress where much was achieved in the last two decades. Schools-based Grade R attendance increased from 13% to 72% of the age five cohort between 1999 and 2017. Table 3 and 4 below also indicate substantial improvements in attendance of ECD facilities for 3 to 4-year-olds and 5 to 6-year-olds since 2009. However, more work clearly needs to be done in certain provinces, especially KwaZulu-Natal and Northern Cape, to improve access to ECD opportunities among 3 to 4-year-olds. The loss of household income and jobs as a result of the COVID-19 pandemic, could reduce the numbers of learners participating in ECD. This is a risk that has to be mitigated against.
Table 3: Percentage of 3 to 4-year-olds attending ECD Facilities by Province, 2009–2018
Province 2009 2010 2011 2012 2013 2014 2015 2016 2017 2018
WC 44.1 54.8 53.7 59.1 62.5 61.9 61.7 54.6 61.4 68.4
EC 56.7 57.0 59.3 63.1 62.1 66.0 58.5 56.9 63.0 64.3
NW 38.8 37.3 42.1 46.2 53.8 60.4 51.4 62.4 53.8 58.5
FS 62.8 53.7 66.1 71.5 82.8 80.0 76.8 67.8 78.4 73.1
KZN 39.9 42.0 39.6 41.5 54.4 58.3 51.8 49.2 46.7 45.1
NC 39.1 46.6 49.1 55.8 56.1 55.3 59.6 55.6 58.5 54.0
GP 66.6 66.4 67.2 73.3 79.7 83.2 80.0 76.8 76.3 76.1
MPU 46.7 50.1 54.0 51.0 56.7 53.5 54.6 61.4 58.5 62.9
LP 54.4 56.4 65.1 65.0 68.3 68.9 69.7 68.0 70.4 71.6
Total 50.9 53.4 55.8 58.9 64.7 66.6 63.3 61.0 62.4 63.7Sources: Statistics South Africa, General Household Survey (GHS), DBE own calculation.

27
Table 4: Percentage of 5 to 6-year-olds attending Educational Institutions by Province, 2009–2018
Province 2009 2010 2011 2012 2013 2014 2015 2016 2017 2018
EC 89.6 94.7 93.9 94.9 95.2 95.3 94.0 95.8 96.1 93.1
FS 90.6 86.8 88.7 92.0 91.2 93.7 92.2 94.1 95.9 98.2
GT 87.6 91.5 90.0 90.5 90.2 91.9 94.6 93.1 94.5 92.1
KZN 81.9 89.1 87.3 86.4 88.9 92.0 89.5 88.8 89.5 89.2
LP 95.5 97.6 96.7 96.2 97.6 95.9 97.1 97.0 98.6 97.7
MP 88.7 82.9 90.9 91.5 87.9 92.7 92.5 94.3 91.8 90.2
NC 80.9 87.9 86.9 81.2 91.0 88.5 85.8 89.4 90.0 87.6
NW 77.0 83.5 90.4 93.0 90.2 86.4 91.3 92.7 86.8 91.1
WC 87.0 81.3 83.9 83.6 83.9 81.8 85.7 90.9 83.9 85.2
National 86.8 89.6 90.1 90.3 90.6 91.5 92.1 92.9 92.4 91.6
Figure 2 below indicates that, in most provinces, educational attendance among 5 to 6-year-olds is not lagging too much for children with a disability, although more work needs to be done in Mpumalanga.
Figure 2: Percentage of 5 to 6-year-olds with Disabilities and Those without Disabilities Attending Educational Institutions by Province, 2014–2018
Sources: Statistics South Africa, General Household Survey (GHS), DBE own calculations. Note: Data for 2014 to 2018 was pooled together to overcome small sample challenges.
There have been concerns about the quality of both Grade R and pre-schooling. An evaluation of schools-based Grade R as it existed in the 2005 to 2011 period has been commissioned by Government and published. This evaluation revealed a low impact of Grade R in Quintile 1–3 schools. The quality of school-based Grade R is likely to have improved in subsequent years following the introduction of national workbooks and other materials in this Grade, but the variable quality of Grade R remains a crucial equity concern going forward.
4.1.7 Foundation Phase
Participation in Foundation Phase schooling has now become nearly universal in South Africa. About 99% of children 7 to 13 years old attend school, according to 2018 GHS data. Primary school completion rates are now estimated at about 95%, as Table 5 below shows. These achievements can be attributed to a number of pro-poor schooling policies and programmes, such as no-fee schooling and the National School Nutrition Programme (NSNP). Since 2010, the percentage of learners benefiting from the NSNP has increased from around 70% in 2010 to around 82% in 2018. The highest proportions of learners benefiting from the NSNP are found in those provinces that are regarded as mostly rural and where the need is the greatest.

28
Table 5: Percentage of 16 to 18-year-olds who have completed Grade 7 and above by Population Group, 2009–2018
Population Group 2009 2010 2011 2012 2013 2014 2015 2016 2017 2018
African/Black 89.7 91.0 92.0 92.4 93.7 94.0 94.0 93.6 94.7 94.5
Coloured 94.9 97.2 95.6 97.4 95.4 94.6 95.2 94.5 95.2 95.5
Indian/Asian 99.2 97.8 98.1 100.0 96.5 97.8 96.1 98.3 100.0 100.0
White 98.2 98.2 97.0 98.9 99.2 99.8 98.7 100.0 100.0 98.9
Total 90.9 92.2 92.8 93.4 94.2 94.4 94.4 94.1 95.2 94.9Sources: Statistics South Africa, General Household Survey (GHS), DBE own calculations.
The focus in the Foundation Phase is now shifting to issues of learning quality. In particular, it is being recognised that foundational learning in literacy and numeracy is lacking in many schools, and is essential for later learning. The PIRLS of 2016 and the TIMSS of 2015 provided internationally respected measures of learning trends over time and these studies indicated that large proportions of South African children reach Grade 4 without having learned to read for meaning and Grade 5 without achieving basic numeracy proficiency. These outcomes at Grades 4 and 5 are a reflection of the quality challenges that persist in the Foundation Phase.
Evidence has been mounting globally of the importance of reading acquisition of children in the initial grades, and which interventions best improve the situation. Ground-breaking research in South Africa – the EGRS research project – was undertaken in recent years by the DBE, working with partner organisations, to produce South Africa-specific knowledge about early grade reading. The study confirmed that better reading skills among learners could be achieved through better materials (specifically lesson plans and graded reading materials in the African languages) and teacher training on how to implement the curriculum. Importantly, the EGRS tested various in-service teacher training methods and concluded that certain approaches involving some individualised coaching were preferable, yet not prohibitively costly. Details on the EGRS are available in a series of published reports. Initiatives to scale up the implementation of what was found to work through the EGRS are being incorporated into a newly developed sector reading plan.
A combination of rising learner enrolments and above-inflation wage increases in recent years has put the basic education sector under tremendous financial pressure. One effect of this has been to worsen learner-educator ratios, which led to larger class sizes. Figure 3 shows how learner-educator ratios have increased in recent years, especially in primary schools.
A related matter is that grade repetition rates remain high, even in the Foundation Phase. In Grade 1 around 15% of learners are repeating, while the figure is around 10% for Grades 2 and 3. This contributes significantly to higher class sizes. Several South African education experts have argued that making learners repeat in the Foundation Phase does more harm than good. It has been suggested that experiences in countries such as Brazil, which have recently opted for automatic grade promotion at the primary level, should be examined.
Figure 3: Learner-Educator (LE) Ratios, 2003 to 2017
28
29
30
31
32
33
34
35
2003
2004
2005
2006
2007
2008
2009
2010
2011
2012
2013
2014
2015
2016
2017LE
rat
io
All Primary Secondary
Source: Snap Survey microdata.

29
Note: Only public ordinary schools are considered. ‘Primary’ is any school with learners in the range of Grades 1 to 7. ‘Secondary’ is any school with learners in the range of Grades 8 to 12. There is a small overlap between the two categories, where schools have both primary and secondary learners. For the numerator of each school, only Grades 1 to 12 learners were counted. For the denominator, all educators, whether public employees or employees of the School Governing Body, were counted. Grade R practitioners were not counted. Mean LE ratios across schools were calculated using total enrolment as a weight in order to avoid biases produced by small schools. A method was used which compared two adjacent years at a time, using only schools present in both years, with the highest and lowest 5% of LE ratios excluded. This was necessary, given some anomalies with the educator values in the Snap Survey.
4.1.8 Intermediate and Senior Phases
Projected learning losses due to COVID-19:
School closures and learning losses: The actual learning losses suffered by children due to disruptions such as school closures can be considered to be higher than those attributed to the number of days schools are closed. For these projections, we have used inflated the values by 25%. Thus 40 days of school closures would result in the loss of 50 days’ worth of learning, in line with the evidence from developing and developed countries. What is not clear in the data is whether learning losses seen immediately after learners return to school, worsen, stay the same, or shrink, over time. Two South African pandemic-induced scenarios are worth noting, one where learning losses remain unchanged for the rest of each learner’s schooling, another where there is a catching up to the pre-pandemic trajectory after three years. Without catching up, the skills of Grade 12 graduates would be lower than in the no-pandemic scenario for a decade up to 2031. In contrast, the catching up scenario takes the quality of graduates back to the no-pandemic trend in 2023.
Participation in the Intermediate and Senior Phases of schooling has increased in recent years and this has served to reduce historical inequalities. Table 6 shows that Grade 9 completion rates have continued to increase since 2009 with a narrowing of the gaps between population groups.
Table 6: Percentage of 19 to 21-year-olds who have completed Grade 9 and above by Population Group, 2009–2018
Population Group 2009 2010 2011 2012 2013 2014 2015 2016 2017 2018
African 81.5 84.3 83.5 84.7 84.7 85.3 86.0 87.8 89.0 89.8
Coloured 86.4 84.7 86.7 84.6 82.1 82.5 83.3 87.9 87.7 89.0
Indian 98.2 97.8 93.5 94.4 93.4 99.5 100.0 100.0 100.0 96.2
White 99.6 99.9 96.1 97.5 95.7 98.2 96.2 96.9 98.6 96.7
Total 83.4 85.7 84.8 85.8 85.4 86.2 86.7 88.6 89.6 90.2Sources: Statistics South Africa, General Household Survey (GHS), DBE own calculations.
As was mentioned when discussing the Foundation Phase, the heart of development in the schooling sector must obviously be what learners learn, the learning outcomes. This is made clear in the NDP and the Sustainable Development Goals. It is of great significance for South Africa’s development that learning outcomes, although still too low, have been improving according to several reliable standardised testing programmes.
Figure 4 below outlines past achievements and the targets Government envisages for the future, in terms of the TIMSS Mathematics tests. When the Department set ambitious TIMSS targets in its first sector plan, the Action Plan to 2014, there was little certainty that they could be reached. It was thus good news when the 2011 and 2015 TIMSS results revealed significant improvements, comparable to that of the fastest-improving countries in the world (for instance, Brazil’s PISA4 improvements between 2000 and 2012). This put South Africa on track to achieve its long-range TIMSS targets. By 2015, South Africa was almost on par with Botswana. If these improvement trends continue, South Africa is set to reach a level of performance in Grade 8 seen in Thailand in 2015 by around 2022 and would surpass Malaysia’s 2015 Grade 8 level by 2030.

30
Figure 4: Past and Envisaged Educational Quality Trend for South Africa
200
250
300
350
400
450
500
2000 2005 2010 2015 2020 2025 2030
TIM
SS G
rade
9 sc
ore
in m
athe
mat
ics
Already achieved2002-2015
Future targets
Thailand Gr 8 2015
Botswana Gr 9 2015 Malaysia Gr 8
2015
Morocco Gr 8 2015Ghana Gr 8
2011
Sources: Points indicated in the graph, South African and other, are from official TIMSS reports, with one exception, namely the 2002 Grade 9 figure for South Africa, which is from Reddy et al. (2012).
Note: All the South Africa points refer to Grade 9. The 2002 Grade 8 average was 264, 21 points below the Grade 9 average for the same year, but this Grade 8 figure is not reflected in the graph. The 2019 target of 401 is from MTSF targets published online in 2016. The 2029 target of 472 is from Action Plan to 2019.
The TIMSS Science results reveal similar patterns to the TIMSS Mathematics tests. The analysis for the landmark 2017 “Report of the High Level Panel on the Assessment of Key Legislation and the Acceleration of Fundamental Change” confirmed that South Africa’s TIMSS trends are based on a comparable sample of learners and that the improvements were strongest among the most disadvantaged learners, meaning that schooling had contributed to reducing social inequalities. Importantly, it is these improvements in the grades below Grade 12 which account for upward trends in the Grade 12 indicators. SEACMEQ5 and PIRLS results at the primary level are somewhat more difficult to interpret than the TIMSS results, in part due to statistical adjustment issues, yet both point to improvements of a magnitude comparable to those seen in the TIMSS.
Although it is impossible to attribute these improvements in any scientific way to specific interventions and social trends, new policies and successes in implementing these policies, provide an indication of five likely drivers of change in the sector: (1) increasing access to Grade R and pre-school below Grade R; (2) the CAPS tools designed to facilitate the implementation of the curriculum in the classroom; (3) better access of learners to high-quality books, such as the national workbooks; (4) more focused assessment practices; and (5) improved subject knowledge among newly graduated teachers. While further improvements in learning outcomes are of course not guaranteed, sustained dedication to the activities described below and outlined in sector plans and the NDP would improve the chances of sustained improvement.
Improvement factor 1: Increased access to Grade R and pre-school below Grade R.
This has already been discussed in the section on ECD above.
Improvement factor 2: CAPS tools designed to facilitate the implementation of the curriculum in the classroom
The Curriculum and Assessment Policy Statement (CAPS) was a set of guides introduced into the schooling system between 2012 and 2014 and intended to clarify exactly what had to be taught in the various subjects and grades. The CAPS provided certainty, whereas the previous curriculum documents introduced in 2002 were arguably too vague and difficult to interpret. In 2017, the DPME released an evaluation of the implementation of CAPS which reported that the great majority of the users of the guides found them superior to preceding guides. An earlier 2014 evaluation by Umalusi had arrived at similar conclusions. Both reports lend support to the probability that teachers’ access to better curriculum documentation accompanied by training was a likely factor behind the improvements in learning outcomes described above.

31
Improvement factor 3: Better access among learners to high-quality books, such as the national workbooks
Any notion that textbooks are unimportant, not uncommonly held fifteen years ago, has been abandoned. Not only is the CAPS very clear about the importance of textbooks, but teachers reporting that they use a textbook as their main classroom resource for teaching Mathematics have increased from a worryingly low 30% in 2002 to 70% in 2011, according to the TIMSS6. In the SEACMEQ, the percentage of Grade 6 learners saying they had access to a Mathematics textbook increased from around 36% in 2007 to around 66% in 2013. The General Household Survey (GHS) of Stats SA, points towards a consistent decline in the percentage of learners who lack books, from 20% in 2002 to 4% in 2017. The GHS has included additional questions on access to books in schools since 2013, with responses indicating that access to national workbooks improved from around 83% of Grades 1 to 9 learners in 2013 to 96% in 2017, with similar trends across grades.
This was achieved by prioritising budgets for LTSMs, including the so-called school allocation. The government has focused strongly on lowering book prices, in particular where books are bought in bulk. South Africa’s successes in achieving particularly low unit costs for workbooks without compromising on quality has been acknowledged by the United Nations Educational, Scientific and Cultural Organisation (UNESCO). Moreover, national and provincial systems for delivering materials to schools have been strengthened.
Despite these improvements, access to books still falls short of the ideal of 100% for all learners. In Grades 10 to 12, the percentage of learners accessing textbooks in all their subjects remained at around 78% between 2013 and 2017, according to the GHS. According to the 2017 School Monitoring Survey, a survey aimed specifically at monitoring progress against indicators put forward in Action Plan to 2019, 83% of Grade 9 learners and around 84% of Grade 12 learners had access to a Mathematics textbook.
Improvement factor 4: More focused assessment practices
Assessment as a tool for improving teaching and learning has evolved over the last ten years and important lessons have been learned which will help to shape the way forward. The CAPS distinguishes between informal and formal assessment activities, with the latter category comprising assessment tasks, tests and examinations. The CAPS also provides considerable guidance on how teachers should conduct assessments, guidance which was reinforced through an intensive process of CAPS training in the years 2011 to 2014. The curriculum guides introduced in 2002 that preceding the CAPS had provided far less guidance on assessments.
Systemic assessments are assessments without any direct implications for individual learners, for instance with regard to grade promotion, but which help managers and planners understand the relative academic performance of schools, districts, provinces or the country as a whole. In 2015, South Africa ended its participation in the international Annual National Assessments (ANA) covering Grades 1 to 6 and Grade 9. This was due to disagreements among stakeholders and particularly between the government and teacher unions about the purpose of the ANA. During the four years in which the ANA was implemented, it played a major role in bringing to the fore the quality of learning and teaching in the national debates and at a local level. School principals, parents and district officials were able to compare the quality of learning across schools, in particular the primary schools, in ways which had not been possible previously. Following an intensive evaluation of the strengths and weaknesses of the ANA, stakeholders reached consensus on the specific problems in the design of the ANA that should be avoided in future. The newly designed National Assessment Programme which is to be implemented in 2020, will provide an important opportunity to again use assessments to stimulate a focus on learning throughout the school system.
Improvement factor 5: Improved subject knowledge among newly graduated teachers
Despite some concerns around the quality and relevance of Initial Teacher Education at universities, there are indications that younger teachers are being better equipped to teach than older peers who received their initial training in the previous system. Specifically, the results from Mathematics and language tests written by teachers as part of the SEACMEQ in 2007 and 2013 showed that younger teachers displayed a considerably higher level of subject knowledge than older teachers. In policy terms, this pattern suggests that moving all teacher education from colleges to universities in the late 1990s was an effective change.
4.1.9 Grade Repetition
Grade repetition remains an efficiency challenge in the system and this is especially so for boys. The General Household Surveys indicate higher levels of grade repetition by boys at all grades, except Grades 11 and 12. This is probably both a reflection of and a contributing factor towards the overall underperformance of males relative to females in South African education.
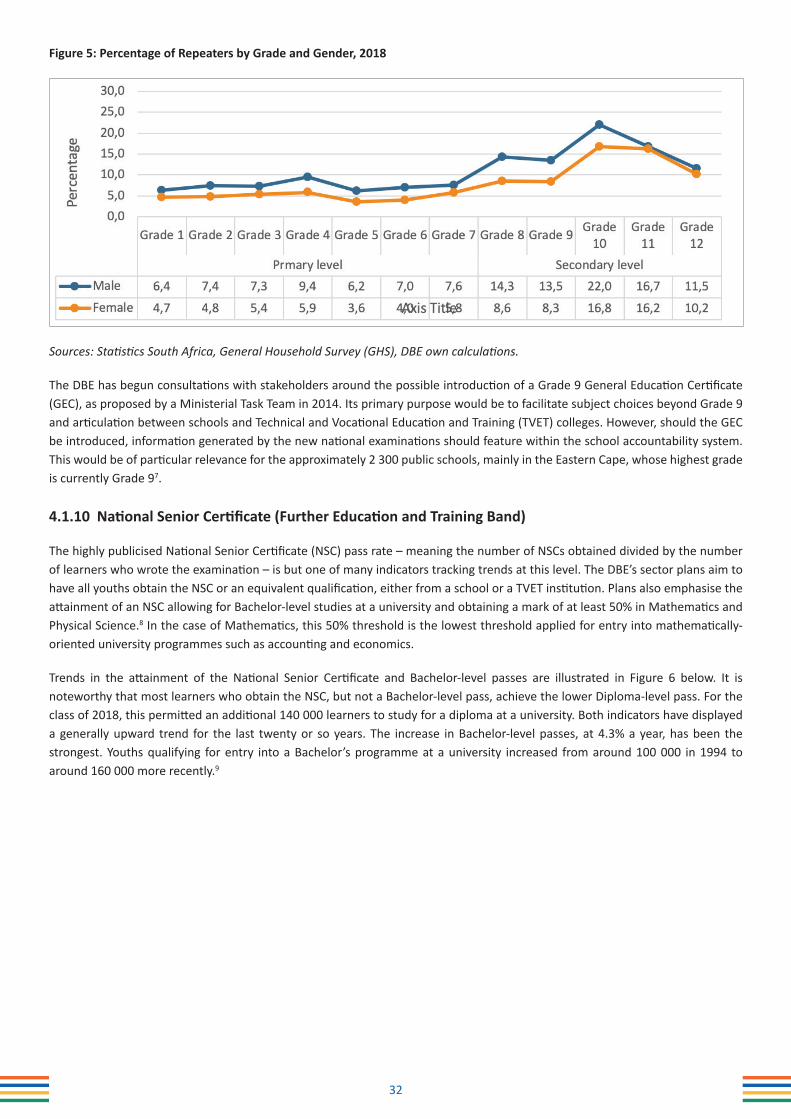
32
Figure 5: Percentage of Repeaters by Grade and Gender, 2018
Sources: Statistics South Africa, General Household Survey (GHS), DBE own calculations.
The DBE has begun consultations with stakeholders around the possible introduction of a Grade 9 General Education Certificate (GEC), as proposed by a Ministerial Task Team in 2014. Its primary purpose would be to facilitate subject choices beyond Grade 9 and articulation between schools and Technical and Vocational Education and Training (TVET) colleges. However, should the GEC be introduced, information generated by the new national examinations should feature within the school accountability system. This would be of particular relevance for the approximately 2 300 public schools, mainly in the Eastern Cape, whose highest grade is currently Grade 97
4.1.10 National Senior Certificate (Further Education and Training Band)
The highly publicised National Senior Certificate (NSC) pass rate – meaning the number of NSCs obtained divided by the number of learners who wrote the examination – is but one of many indicators tracking trends at this level. The DBE’s sector plans aim to have all youths obtain the NSC or an equivalent qualification, either from a school or a TVET institution. Plans also emphasise the attainment of an NSC allowing for Bachelor-level studies at a university and obtaining a mark of at least 50% in Mathematics and Physical Science.8 In the case of Mathematics, this 50% threshold is the lowest threshold applied for entry into mathematically-oriented university programmes such as accounting and economics.
Trends in the attainment of the National Senior Certificate and Bachelor-level passes are illustrated in Figure 6 below. It is noteworthy that most learners who obtain the NSC, but not a Bachelor-level pass, achieve the lower Diploma-level pass. For the class of 2018, this permitted an additional 140 000 learners to study for a diploma at a university. Both indicators have displayed a generally upward trend for the last twenty or so years. The increase in Bachelor-level passes, at 4.3% a year, has been the strongest. Youths qualifying for entry into a Bachelor’s programme at a university increased from around 100 000 in 1994 to around 160 000 more recently.9

33
Figure 6: NSC and Bachelor-Level Increases since 1994
0
50,000
100,000
150,000
200,000
250,000
300,000
350,000
400,000
450,000
500,000
19931994199519961997199819992000200120022003200420052006200720082009201020112012201320142015201620172018
Lear
ners
NSC Bachelors-level
Note: These values reflect only the results of full-time candidates, excluding the effect of supplementary examinations and any examinations taken by Multiple Examination Opportunity (MEO) candidates in the following year.
Stats SA data collected from households confirm the rise in the number of youths obtaining the NSC. As shown in Figure 7 below, the percentage of youths successfully completing Grade 12 has increased from around 45% in 2005 to close to 55% in 2017. The peaks of the various curves in the graph point to the fact that many youths obtained their NSC rather late. For instance, in 2017 the peak at age 24 illustrates that below this age, many youths had still not obtained the NSC. This not only reflects that opportunities were created to allow youths to achieve the NSC beyond their first attempt, but also points to a challenge to have more youths successfully complete their secondary schooling at a younger age.
Figure 7: Grade 12 Attainment Among Youths according to Household Data
30
35
40
45
50
55
20 21 22 23 24 25 26 27 28
Perc
enta
ge o
f you
ths
Age
2017
2016
2015
2014
2013
2012
2011
2009
2007
2004
Source: Stats SA’s General Household Surveys.
The government’s targets envisage 270 000 Bachelor-level NSC passes per year by 2019, with the number rising to 435 000 by 2030. The NDP set a target of 425 000 university graduates produced annually by 2030. While the 4.3% annual increase in the number of Bachelor-level NSCs takes the country closer to these targets, roughly double that increase is needed between 2019 and 2030 if the 2030 targets are to be reached.

34
4.1.11 e-Education
The use of modern Information and Communication Technologies (ICTs) in the delivery of schooling – e-Education – is an important area of innovation to be focused on in the next five years. A 2018 study facilitated by the National Education Collaboration Trust (NECT), which brought together the insights of several foreign and local experts and around 1 200 district and school personnel, led to seven ‘high priority’ recommendations:
1. Enhance the links across education goals, metrics and data down to the school level, and tailor them to the provincial context.
2. Create mechanisms for accountability for data accuracy 3. Accelerate the rollout of Operation Phakisa of ICT infrastructure and improve data affordability 4. Create dedicated roles with strong specialist ICT and data analysis capabilities 5. Define and implement a public-private collaboration framework.6. Build a robust ICT landscape of data systems and EdTech tools 7. Define data and system interoperability standards
The study found that growth in the use by schools of SA-SAMS and better organised provincial and national warehousing of SA-SAMS data have had tangible benefits in the forms of less duplication in the submission of data and the introduction of online tools through which schools and districts can visualise important statistics. Crucially, the study found that managers, for instance in districts, are becoming increasingly aware of how data can contribute towards better planning and management. Progress was achieved largely through modalities of development involving public-private partnerships. The Data-Driven Districts (DDD) initiative, involving the education departments, the Dell Foundation and other stakeholders, has provided valuable lessons not just on how to harness technology, but also on how partners can work together to advance e-Education.
But the study also found that South Africa lacked a sufficiently clear and widely understood e-Education strategy.10 Quality assurance of data was still not what it should be, meaning certain statistics, such as those on learner attendance and assessment results, were too often unreliable and difficult to interpret. Above all, new approaches and technologies were not being fully utilised to monitor and understand learning outcomes.
4.1.12 EdTech
With regard to EdTech, or the use in the classroom of technology for learning, the above study did not cover important innovations by the DBE to produce more dynamic and digital learning materials. Building on the successes of the national workbooks and Siyavula textbooks developed within the Action Plan to 2019, the DBE worked with partners such as the Sasol Inzalo Foundation to produce a greater variety of materials that could be freely copied and distributed. Many of the national workbooks have been converted to interactive digital materials and are being piloted. While interactive materials make it easier for different learners to proceed at different paces, assess themselves and repeat certain tasks in line with their learning needs, migration to such materials requires careful planning and testing to ensure that materials work as they should and that teachers are properly trained in their use. Much of the innovation currently occurring involves the production of non-copyrighted materials, which lowers costs and could greatly facilitate the move towards e-Education.
There has been slow progress in the availability of computers in schools. The 2015 TIMSS data confirms that around half of Grade 5 and Grade 9 learners can access computers or tablets in school. This puts South Africa roughly on par with other middle-income countries at the primary level, but well below the average for these countries at the lower secondary level. Moreover, improvements between the 2011 and 2015 waves of the TIMSS were strong in most developing countries but negligible in South Africa.
The 2017 School Monitoring Survey roughly concurs with the TIMSS data. In public schools, 64% of Grade 12 learners are in schools that have computer laboratories. This figure obscures the fact that distribution remains skewed in favour of the historically and economically advantaged, being 93% for Quintile 5 and 40% for Quintile 1. Inter-provincial differences are also large; for instance, 91% in the Free State (a particularly successful province in this regard) against 25% in Limpopo.

35
The percentage of Grade 12 learners who take one of the two computer subjects, Computer Applications Technology and Information Technology, has remained around 6% for many years – 20% in Quintile 5 against 2% in Quintile 1. While there are now many technology and curriculum options to follow beyond the traditional computer subjects and the traditional computer lab, the importance of these formats for bringing technology innovation into historically disadvantaged schools should not be underestimated. They offer proven routes to skills in areas such as computer programming and can serve as a first step towards technology innovation for schools that have experienced very little of it. Moreover, there are clearly ‘low-hanging fruits’ in the form of historically disadvantaged secondary schools which have a computer laboratory, but which do not formally offer any computer subject – around a third of Quintile 1 to 3 secondary schools fall into this category. The intervention required here is mostly to support existing teachers so that they can offer these subjects, or the appointment of suitably qualified teachers.
Figure 8 illustrates statistics emerging from the School Monitoring Survey on computer labs for both the secondary and primary levels.
Figure 8: Access to Computer Labs in Schools, 2017
0
10
20
30
40
50
60
70
80
90
100
EC FS GP KN LP MP NC NW WC SA
% o
f pub
lic sc
hool
lear
ners
with
at l
east
one
co
mpu
ter
lab
in th
eir s
choo
l
Grade 6 Grade 12
4.2 Situational Analysis: Internal Environment
4.2.1 Structure of the DBE
The Department is structured into five programmes to ensure that it achieves its strategic mandates. The programmes are ‘Curriculum Policy, Support and Monitoring’; ‘Teachers, Education Human Resources and Institutional Development’; ‘Planning, Information and Assessments’, ‘Educational Enrichment Services’ and Administration and the Office of the Director-General’.
Despite severe budget cuts over the MTEF period, the DBE has filled key critical posts to ensure service delivery. The Department has a staff establishment of 710. In line with the objectives for the Employment Equity Plan of the Department, the Department has 15 interns and five learners, a total of 20 youths on internship and learnership.
Table 7: DBE Programmes
PROGRAMME 1 Administration
PROGRAMME 2 Curriculum Policy, Support and Monitoring
PROGRAMME 3 Teachers, Education Human Resources and Institutional Development
PROGRAMME 4 Planning, Information and Assessments
PROGRAMME 5 Educational Enrichment Services
The Department has reconfigured itself to ensure there is alignment between the organisational structure and programmes
The Department ensures that there is alignment between its broad strategic objectives and human resource planning within the DBE, such that:

36
• Sufficient posts and human resources are available at all times for the Department to achieve its strategic and operational objectives;
• Personnel are employed at the correct salary levels;• Employment equity targets are met;• Active steps are taken to ensure that suitable persons are recruited and retained as far as possible, and that personnel with
talent are identified and nurtured within the Department;• The required funding for human resources is made available within the Medium Term Expenditure Framework;• A system of performance management ensures optimal utilisation of human resources for effective service delivery,
training, development and recognition of achievements;• Human resources and financial planning are integrated; and• Human resource planning and management are integral parts of the responsibility of all managers.
The DBE is a member of the Government Information Technology Officers Council (GITOC). This engagement model enables the DBE to contribute towards ICT standards, policies, frameworks and procedures, allowing the DBE to align itself with all ICT governmental initiatives. The DBE has strengthened its business relationship with the State Information Technology Agency (SITA) which allows the DBE to conclude Service Level Agreements with SITA focused on technical support to the Department that assist it to deliver its services and mandate.
4.2.2 BBBEE Status
The Department appointed a service provider to conduct the BBBEE compliance assessment for the 2017/18 financial year. The appointed service provider was liquidated and could not complete the process of the assessment. Therefore, the results of the 2017/18 financial year could not be included in the 2018/19 annual report. Another service provider was appointed to do the BBBEE compliance assessment for the 2018/19 financial year. The results of the assessment will be published in the 2019/20 annual report.
Table 8: Status of the Institution regarding Women, Youth And People with Disabilities
Women 59.8% of the total staff
Youth 26.7% of the total staff
People with disabilities 1.2% of the total staff
4.3 SWOT Analysis
As a national department that is mandated to lead the sector in terms of capacity for planning, implementation, monitoring and evaluation, the DBE has to have the internal resources, skills and mechanisms to ensure that its leadership results in quality basic education outcomes. The following presents an overview of the current capacity of the Department, reflected against the organisational strengths, weaknesses and challenges which were identified in the 2015/16–2019/20 Strategic Plan.
Strengths
The Department has well-developed systems and administrative data on its operations in terms of finances, human resources, examinations and textbooks. Consistent leadership has also ensured stability in the portfolio. The DBE benefits from political and administrative leadership with extensive experience at all levels in the issues of curriculum, teacher development and assessment.
Even after three cycles of curriculum reform, stability prevails in the system and attention is turning to the vexing issue of how to coordinate efforts within the sector to improve learning outcomes. The maturity of the organisation means that it is now interrogating the depth and extent of monitoring, which is evolving from mere inspection visits to more in-depth examinations of school-level success indicators, information and strategies for improving instruction. School-level monitoring reflects more on learning and teaching than on asset management and visible compliance with education law and policy. The role of the national department has evolved from actively monitoring schools to determining the parameters for monitoring, although there are still issues related to aligning the logistics and interventions associated with these visits between school, district, province and national levels.

37
Labour peace has characterised recent years. Efforts to improve consultation, dialogue and public narratives include the establishment of various visible partnerships with the United Nations International Children’s Emergency Fund (UNICEF), the NECT, National Reading Coalition and other such structures, to bring together public, private and civil society interests in education development. Interdepartmental collaborations have been particularly useful, including the partnership with the Department of Health on learner well-being, and the Department of Social Development on ECD and provision of support to vulnerable learners.
The education sector has a well-established institutional framework, including schools, and concurrent arrangements determining the responsibilities for service delivery and oversight according to the NEPA. Innovations in provinces are highlighted in these interprovincial and intergovernmental interactions, facilitated by the shift to a focus on learning. The Action Plan developed by the DBE requires an integrated approach to education provisioning, which has been seen in the realignment and re-examination of several departmental structures. The use of data, information and analyses to inform policy making has, in recent years, grown through the work of the Department. The Department has developed several progress reports drawn from administrative, special purpose surveys, and rigorous evaluations of the implementation and the performance of key programmes including programmes on teacher bursaries, nutrition and how to improve and support early grade reading and provision at the classroom level.
Communication with the public has improved with the development of a comprehensive communication profile, with a solid social media presence and interactions intended to communicate policy positions and progress, based on the research and analytical reports produced by the planning, monitoring and research functions in the Department.
Weaknesses
The COVID-19 pandemic has highlighted the importance of more coherent data systems in education. It has also highlighted the administrative processes and protocols that are needed to respond flexibly to teaching and learning disruptions. In addition, the accountability within the schooling system needs to be strengthened in order to ensure learning improves within the context of COVID-19.
Organisations need sufficient time and opportunity to reflect on the attention needed in the systems, resources, capacity and skills and knowledge to effect change. The interventions in weak provincial administrative systems have meant that capacity in the national department has been stretched, especially in the support functions. The skills and capacity of the personnel filling the positions should be aligned to the organisational mandate which is determined by the NEPA. The monitoring and evaluation functions in all programmes require strengthening as does operational planning to meet output, process and outcome expectations in the Department and in the sector.
The limited use of evidence and substantive information to design comprehensive programmes means that programme design, delivery and outcomes are sometimes not optimal and the spirit of public service delivery is lacking. To remedy this, the Department will need to engage in a series of introspective reflections on cultures and values in the organisation, in relation to inclusion, diversity, gender sensitivity and creating an effective working environment.
While recognising the need for consequence management, the role of managers as leaders in guiding the organisation is highlighted in the Department’s work in practice and engagement with the needs of the public and organisational mandates. Root cause analysis of organisational problems will be conducted to improve organisational functioning. Better engagement by managers on departmental mandates will assist in communication and processing to create the context for skills, knowledge and people development.
Opportunities
The strong institutional framework of the sector allows the potential impact on education outcomes to be further leveraged through the migration and transfer of the function for Early Childhood Development from the Department of Social Development. This migration provides an opportunity to contribute even more to the education, skills and social mobility of South Africa’s people, after the introduction of a publicly funded Reception year by the DBE. The ECD migration is not just an administrative phenomenon, involving health, education, social, civil society and municipal players and providers. It presents an opportunity to develop institutional configurations for seamless service delivery that caters to the health, education and social development needs of young children at all stages of development.
Provincial developments show that the schooling system has matured and PEDs have begun to examine their learning outcomes in relation to the quality of support and development of instructional practices throughout schooling and especially in the early
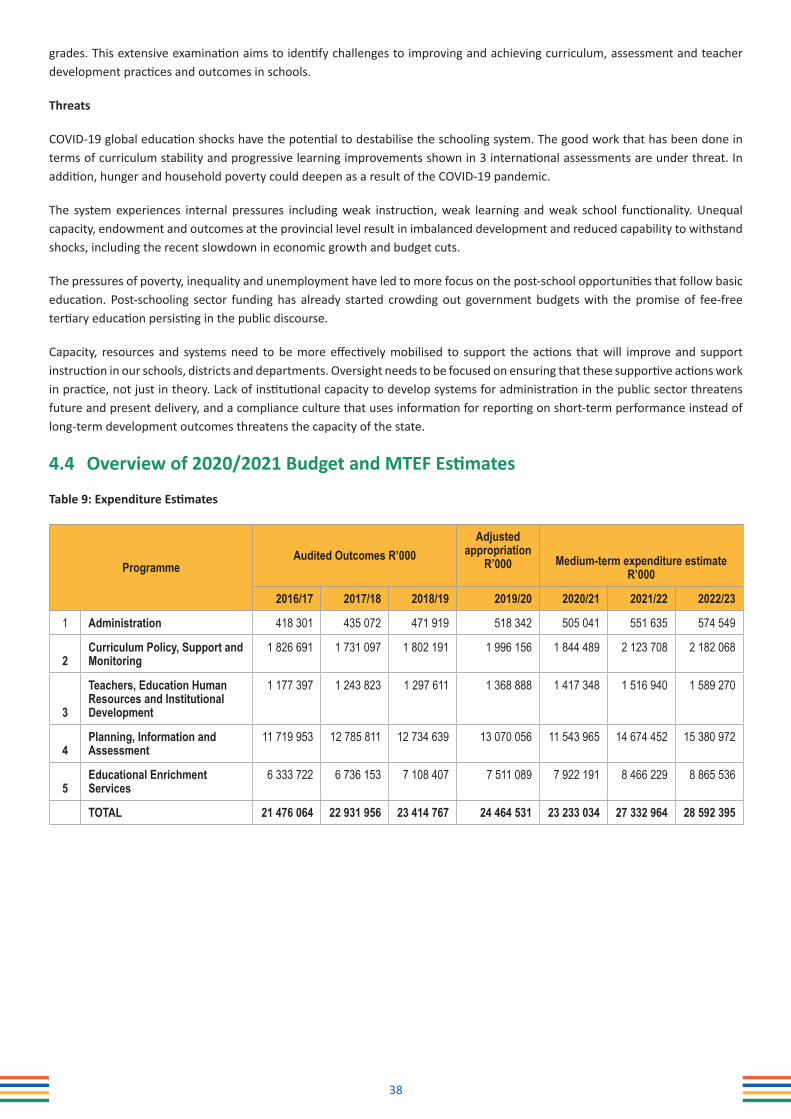
38
grades. This extensive examination aims to identify challenges to improving and achieving curriculum, assessment and teacher development practices and outcomes in schools.
Threats
COVID-19 global education shocks have the potential to destabilise the schooling system. The good work that has been done in terms of curriculum stability and progressive learning improvements shown in 3 international assessments are under threat. In addition, hunger and household poverty could deepen as a result of the COVID-19 pandemic.
The system experiences internal pressures including weak instruction, weak learning and weak school functionality. Unequal capacity, endowment and outcomes at the provincial level result in imbalanced development and reduced capability to withstand shocks, including the recent slowdown in economic growth and budget cuts.
The pressures of poverty, inequality and unemployment have led to more focus on the post-school opportunities that follow basic education. Post-schooling sector funding has already started crowding out government budgets with the promise of fee-free tertiary education persisting in the public discourse.
Capacity, resources and systems need to be more effectively mobilised to support the actions that will improve and support instruction in our schools, districts and departments. Oversight needs to be focused on ensuring that these supportive actions work in practice, not just in theory. Lack of institutional capacity to develop systems for administration in the public sector threatens future and present delivery, and a compliance culture that uses information for reporting on short-term performance instead of long-term development outcomes threatens the capacity of the state.
4.4 Overview of 2020/2021 Budget and MTEF Estimates
Table 9: Expenditure Estimates
ProgrammeAudited Outcomes R’000
Adjusted appropriation
R’000 Medium-term expenditure estimate R’000
2016/17 2017/18 2018/19 2019/20 2020/21 2021/22 2022/23
1 Administration 418 301 435 072 471 919 518 342 505 041 551 635 574 549
2Curriculum Policy, Support and Monitoring
1 826 691 1 731 097 1 802 191 1 996 156 1 844 489 2 123 708 2 182 068
3
Teachers, Education Human Resources and Institutional Development
1 177 397 1 243 823 1 297 611 1 368 888 1 417 348 1 516 940 1 589 270
4Planning, Information and Assessment
11 719 953 12 785 811 12 734 639 13 070 056 11 543 965 14 674 452 15 380 972
5Educational Enrichment Services
6 333 722 6 736 153 7 108 407 7 511 089 7 922 191 8 466 229 8 865 536
TOTAL 21 476 064 22 931 956 23 414 767 24 464 531 23 233 034 27 332 964 28 592 395

39
Part
C: M
easu
ring
Our
Per
form
ance
5.
Insti
tutio
nal P
rogr
amm
e Pe
rfor
man
ce In
form
ation
5.1
Prog
ram
me
1: A
dmin
istr
ation
Prog
ram
me
Purp
ose:
To p
rovi
de st
rate
gic
lead
ersh
ip, m
anag
emen
t and
supp
ort s
ervi
ces t
o th
e De
part
men
t.
Sub-
prog
ram
mes
: Min
istry
; Dep
artm
ent M
anag
emen
t; Co
rpor
ate
Serv
ices
; Offi
ce o
f the
Chi
ef F
inan
cial
Offi
cer;
Inte
rnal
Aud
it an
d Ri
sk M
anag
emen
t; an
d Le
gal a
nd L
egisl
ative
Ser
vice
s.
5.1.
1 O
utco
mes
, Out
puts
, Per
form
ance
Indi
cato
rs a
nd T
arge
ts
Tabl
e 10
: Pro
gram
me
1: O
utco
mes
, Out
puts
, Per
form
ance
Indi
cato
rs a
nd T
arge
ts
Outc
ome
Outp
uts
Outp
utIn
dica
tors
Annu
al Ta
rget
s
Audi
ted
/Act
ual
Perfo
rman
ceEs
timat
edPe
rfor-
man
ceMT
EF P
erio
d
2016
/1720
17/18
2018
/1920
19/20
2020
/2120
21/22
2022
/23
Outco
me 2:
Main
-tai
n and
deve
lop
infor
matio
n and
oth
er sy
stems
wh
ich en
able
trans
forma
tion
and a
n effic
ient
and a
ccou
ntable
se
ctor
Ensu
re th
at ad
minis
tratio
n, pla
nning
and H
R sy
stems
evolv
e to
deal
with
and
supp
ort e
merg
ing
prior
ities o
f the
Natio
nal D
epar
t-me
nt
1.1.1
Perce
ntage
of va
lid in
voice
s pa
id wi
thin 3
0 day
s upo
n rec
eipt b
y the
Dep
artm
ent
99.90
%37
721/
37 75
8
99.91
%36
246/
36 27
799
.05%
1 459
/1 47
310
0%10
0%10
0%10
0%
1.1.2
Numb
er of
repo
rts on
misc
on-
duct
case
s res
olved
with
in 90
days
- 80%
4/5
- No ne
w dis
ciplin
ary c
as-
es w
ere r
eceiv
ed du
ring
this fi
nanc
ial ye
ar
- 100%
2/2
44
44
1.1.3
Numb
er of
capa
city-b
uildin
g pr
ogra
mmes
offer
ed to
the D
BE
officia
ls
--
--
1012
14
1.2.1
Annu
al Pe
rform
ance
Plan
ap
prov
ed by
31 M
arch
each
finan
cial
year
--
--
2021
/22 A
PP
appr
oved
by M
arch
20
21
2022
/23 A
PP
appr
oved
by M
arch
20
22
2023
/24 A
PP
appr
oved
by M
arch
20
231.2
.2 Qu
arter
ly Re
ports
subm
itted
to Na
tiona
l Tre
asur
y (NT
) and
the
Depa
rtmen
t of P
lannin
g, Mo
nitor
ing
and E
valua
tion 3
0 day
s afte
r the
end
of ea
ch qu
arter
--
--
Four
Qua
rterly
Re
ports
subm
itted
to NT
and D
PME
30 da
ys af
ter th
e en
d of e
ach q
uarte
r
Four
Qua
rterly
Re
ports
subm
itted
to NT
and D
PME
30 da
ys af
ter th
e en
d of e
ach q
uarte
r
Four
Qua
rterly
Re
ports
subm
itted
to NT
and D
PME
30 da
ys af
ter th
e en
d of e
ach q
uarte
r

40
5.1.2 Indicators, Annual and Quarterly Targets
Table 11: Programme 1: Indicators, Annual and Quarterly Targets
Output IndicatorsRe-porting Cycle
Annual Target Q1 Q2 Q3 Q4
1.1.1 Percentage of valid invoices paid within 30 days upon receipt by the Department
Quar-terly
100% 100% 100% 100% 100%
1.1.2 Number of reports on misconduct cases resolved within 90 days
Quar-terly
4 1 1 1 1
1.1.3 Number of capacity-building programmes offered to the DBE officials
Annually 10 0 0 0 10
1.2.1 Annual Performance Plan approved by 31 March each financial year
Annually 2021/22 APP approved by March 2021
- - - 2021/22 APP approved by March 2021
1.2.2 Quarterly Reports sub-mitted to National Treasury (NT) and the Department of Planning, Monitoring and Evaluation 30 days after the end of each quarter
Quar-terly
Four Quarterly Reports submit-ted to NT and DPME 30 days after the end of each quarter
Quarterly Report submitted to NT and DPME 30 days after the end of the quarter
Quarterly Report submitted to NT and DPME 30 days after the end of the quarter
Quarterly Report submitted to NT and DPME 30 days after the end of the quarter
Quarterly Report submitted to NT and DPME 30 days after the end of the quarter
5.1.3 Explanation of planned performance over the medium-term period
The Administration Programme is responsible for managing the Department through the provision of strategic leadership, management and support services. The programme contributes to ensuring quality in the basic education system through effective institutional service delivery processes, planning and provisioning.
The Administration Programme will focus on the following deliverables during the 2020/21 financial year:
Labour Relations:
The finalisation of misconduct cases within 90 days
The finalisation of the disciplinary cases on time is important and officials who are found to have transgressed are dealt with promptly. It is therefore crucial for DPSA to receive the reports on a quarterly basis to monitor whether the DBE finalised disciplinary cases on time.
Strategic Planning and Reporting:
Institutional Planning: An Annual Performance Plan (APP) highlights what the Department intends to implement within an upcoming financial year and during the Medium Term Expenditure Framework (MTEF) to implement its Strategic Plan towards achieving its outcomes. The APP reflects outcome indicators and targets for budget programmes and sub-programmes where relevant, to facilitate the achievement of outcomes set out in the Strategic Plan.
The 2020–2024 Strategic Plan and 2020/21 Annual Performance Plan (APP) will be tabled in Parliament in March 2020. The related Operational Plans and Standard Operating Procedures (SOPs) will be analysed and the identified gaps will be addressed at quarterly Branch Reviews.
Institutional and Sector Reporting: The Department will submit the Quarterly Performance Reports timeously to DPME via the electronic Quarterly Performance Reporting System (eQPRS) and to National Treasury. These reports will subsequently be presented at the Portfolio Committee as scheduled. The reports for Quarters 1–3 and bi-annual government priorities reports will be submitted to DPME and serve at Cabinet as per reporting guidelines to be revised by DPME. The other priorities reports which DBE supports will also be submitted to the lead Departments as per reporting obligations.

41
DBE Annual Report: In terms of Chapter 1 of the Public Service Regulations and the prescription by the Minister of Public Service and Administration, all Departments within the Public Service are required to publish their Annual Report. The Annual Report will be tabled in Parliament in September 2020 and will thereafter be presented to the Portfolio Committee.
Public Entities: The Quarterly Performance Reports and APPs for Umalusi and SACE will be analysed and feedback will be submitted through the Chief Financial Officer’s office.
Sector Alignment: The HEDCOM Sub-committee on Planning, Monitoring and Evaluation will convene standard and special meetings with the Auditor-General of South Africa (AGSA) and DPME to improve and strengthen alignment in the sector and address key challenges. Among others, the meetings will provide guidance to the sector in preparation for the financial year on the standardisation of the Medium Term Strategic Framework (MTSF)-aligned indicators.
Estimates of National Expenditure Estimates (ENE): The National Treasury provides the ENE guidelines. The ENE chapter will be compiled and submitted to National Treasury in December 2020.
Service Delivery Improvement Plan (SDIP): The approved SDIP Quarterly report will be submitted. Quarterly review meetings on Service Standards between DBE and DPSA will be held. The Annual Service Delivery Improvement Plan Report will be submitted to the Annual National Service Delivery Improvement Forum, DPSA and Cabinet.
State of the Nation Address (SoNA): The DBE will submit SoNA inputs to the Government Communication and Information System (GCIS) covering four areas:
• Achievements/ Progress on the commitments made by the President on the programmes in the template;• Key plans and upcoming programmes or projects;• The envisaged policy interventions or changes; and• Major planned communication activities.
Research Coordination, Monitoring and Evaluation:
In terms of Research, Coordination Monitoring and Evaluation, the following will be focused on for 2020/21 to coordinate and undertake monitoring of the sector:
• Developing and publishing a General Household Survey (GHS) Focus on Schooling report to monitor progress in the sector. The report provides descriptive statistics on access to education institutions, disability, distance travelled to school, orphan status, literacy and levels of education attainment among other education indicators.
• Updating and publishing Education District Profiles. These profiles provide a consolidated desktop view of district information, including basic information such as school and learner numbers, district characteristics, enrolment trends, school infrastructure, distance as well as learner performance information (NSC).
• The DBE will also conduct a School Monitoring Survey 2020/21 to provide information on the progress that has been made towards the achievement of the goals and indicators that are set out in the sector plan, the Action Plan to 2024: Towards the Realisation of Schooling 2030
Coordination and undertaking of research and evaluation in the sector:
• Publish an approved Departmental Evaluation and Research Plan;• Update and publish the Research Agenda and DBE Research Repository; • Establish and publish Reading Benchmarks for primary schooling.
Internal Audit, Risk Management and Forensic Investigation:
The Department will improve internal audit, risk management and forensic investigation by:
• Presenting the Risk Management Plan before the beginning of every financial year for approval by the Risk Committee;• Working with the Strategic Planning and Reporting Directorate on the risk management process when the Annual
Performance Plan and the five-year Strategic Plan are revised; • Presenting the progress report on a quarterly basis to Senior Management on the risk management progress; • Report on internal audits conducted per quarter as per the internal audit coverage plan; and• Report on a quarterly basis on forensic investigations or awareness campaign conducted.

42
5.1.4 Programme Resource Considerations
Budget allocation for programme and sub-programmes as per the ENE.
Table 12: Programme 1: Reconciling Performance Targets with the Budget and MTEF 2020/21
Sub-ProgrammeAudited Outcomes R’000
Adjusted appropriation
R’000
Medium-term expenditure estimate R’000
2016/17 2017/18 2018/19 2019/20 2020/21 2021/22 2022/23
Ministry 31 439 32 678 34 738 38 059 27 312 35 095 36 457
Departmental Management 79 872 81 708 99 238 95 686 84 155 98 373 101 879
Corporate Services 63 853 64 864 67 206 82 276 74 388 77 616 80 258
Office of the Chief Financial Officer 62 723 63 399 68 326 88 287 90 383 97 650 103 704
Internal Audit and Risk Management 5 775 6 692 6 629 7 847 8 626 9 144 9 490
Office Accommodation 174 639 185 731 195 782 209 187 220 177 233 757 242 761
Total 418 301 435 072 471 919 518 342 505 041 551 635 574 549
Economic Classification
Current payments 404 293 422 076 457 867 501 435 488 521 533 274 555 151
Compensation of employees 151 227 165 092 175 182 192 973 205 928 219 926 230 665
Goods and services 206 745 211 486 238 106 264 905 240 175 272 200 281 813
Computer services 21 577 20 526 26 183 24 854 23 973 25 023 25 678
Operating Lease 613 445 610 1 999 2 056 2 169 2 250
Property payments 119 011 129 775 140 347 151 781 162 624 175 015 181 540
Travel and subsistence 15 137 15 883 21 386 23 639 9 988 22 015 22 685
Other 50 407 44 857 49 580 62 632 41 534 47 978 49 660
Interest and rent on land of which: 46 321 45 498 44 579 43 557 42 418 41 148 42 673
Transfers and subsidies 2 364 2 180 891 2 545 453 478 497
Departmental agencies and accounts 170 405 417 429 453 478 497
Foreign Government and International Organisations - - - - - -
Households 2 194 1 775 474 2 116 - - -
Payments for capital assets 11 583 10 629 12 929 14 360 16 067 17 883 18 901
Buildings and other fixed structures 7 216 8 040 8 958 9 981 11 119 12 390 13 099
Machinery and equipment 4 367 2 589 3 971 4 044 4 599 5 125 5 420
Software and other intangible assets - - - 335 349 368 382
Payments for financial assets 61 187 232 2 - - -
Total 418 301 435 072 471 919 518 342 505 041 551 635 574 549

43
5.2 Programme 2: Curriculum Policy, Support and Monitoring
Programme Purpose: Develop curriculum and assessment policies, and monitor and support their implementation.
Sub-programmes: Programme Management: Curriculum Implementation and Monitoring; Curriculum and Quality Enhancement
Action Plan Goals on Learner Performance
Goal 1 ► Increase the number of learners in Grade 3 who, by the end of the year, have mastered the minimum Language and Numeracy competencies for Grade 3.
Goal 2 ► Increase the number of learners in Grade 6 who, by the end of the year, have mastered the minimum Language and Mathematics competencies for Grade 6.
Goal 3 ► Increase the number of learners in Grade 9 who, by the end of the year, have mastered the minimum Language and Mathematics competencies for Grade 9.
Goal 4 ► Increase the number of Grade 12 learners who become eligible for a Bachelor’s programme at a university.
Goal 5 ► Increase the number of Grade 12 learners who pass Mathematics.
Goal 6 ► Increase the number of Grade 12 learners who pass Physical Science.
Goal 7 ► Improve the average performance of Grade 6 learners in Languages.
Goal 8 ► Improve the average performance of Grade 6 learners in Mathematics.
Goal 9 ► Improve the average performance of Grade 8 learners in Mathematics.
Goal10 ► Ensure that all children remain effectively enrolled in school at least up to the year in which they turn 15.
Goal 11 ► Improve the access of children to quality Early Childhood Development (ECD) below Grade 1.
Goal 12 ► Improve the grade promotion of learners through Grades 1 to 9.
Goal 13 ► Improve the access of the youth to Further Education and Training (FET) beyond Grade 9.
Goal 19 ► Ensure that every learner has access to the minimum set of textbooks and workbooks required according to national policy.
Goal 20 ► Increase access among learners to a wide range of media, including computers, which enrich their education.
Goal 26 ► Increase the number of schools that effectively implement the Inclusive Education policy and have access to centres that offer specialist services.

44
5.2.
1 O
utco
mes
, Out
puts
, Per
form
ance
Indi
cato
rs a
nd T
arge
ts
Tabl
e 13
: Pro
gram
me
2: O
utco
mes
, Out
puts
, Per
form
ance
Indi
cato
rs a
nd T
arge
ts
Outc
ome
Outp
uts
Outp
utIn
dica
tors
Annu
al Ta
rget
s
Audi
ted
/Act
ual
Perfo
rman
ceEs
timat
edPe
rform
ance
MTEF
Per
iod
2016
/1720
17/18
2018
/1920
19/20
2020
/2120
21/22
2022
/23Ou
tcome
1:
Maint
ain
and d
evelo
p the
syste
m of
polic
ies,
includ
ing th
e cu
rricu
lum an
d as
sess
ment,
go
vern
ing
the ba
sic
educ
ation
se
ctor t
o ad
vanc
e a
quali
ty an
d inc
lusive
, sa
fe an
d he
althy
basic
ed
ucati
on
syste
m.
Ensu
re th
at po
licies
and
the cu
rricu
lum
evolv
e to d
eal
with
emer
ging
prior
ities,
includ
ing th
ose
relat
ing to
Ear
ly Ch
ildho
od
Deve
lopme
nt,
inclus
ive
educ
ation
, tw
enty-
first-
centu
ry sk
ills,
the su
ppor
t an
d mon
itorin
g of
learn
ing
outco
mes.
2.1.1
Numb
er of
Tech
nical
scho
ols
monit
ored
for im
pleme
ntatio
n of
Curri
culum
and A
sses
smen
t Poli
cy
State
ments
(CAP
S)
33 Te
chnic
al Sc
hools
vis
ited:
12 in
Q2
9 in Q
36 i
n Q4
27 sc
hools
mo
nitor
ed54
1818
1818
2.1.2
Numb
er of
lear
ners
obtai
ning
subje
ct pa
sses
towa
rds a
Nati
onal
Senio
r Cer
tifica
te (N
SC) o
r exte
nded
Se
nior C
ertifi
cate,
inclu
ding
upgr
aded
NSC
per y
ear
5 635
73 78
064
062
30 00
060
000
60 00
065
000
2.1.3
Numb
er of
Chil
dren
/ Lea
rner
s wi
th Pr
ofoun
d Inte
llectu
al Di
sabil
ity
(C/LP
ID) u
sing t
he Le
arnin
g Pr
ogra
mme f
or C
/LPID
--
6 416
3 327
3 527
3 727
3 927
2.1.4
A Na
tiona
l Rep
ort is
prod
uced
on
mon
itorin
g of th
e imp
lemen
tation
of
the P
olicy
on S
creen
ing,
Identi
ficati
on, A
sses
smen
t and
Su
ppor
t (SI
AS) a
s a m
echa
nism
for
early
iden
tifica
tion a
nd in
terve
ntion
--
--
Appr
oved
Nati
onal
Repo
rt on
mon
itorin
g of
the im
pleme
ntatio
n of
the P
olicy
on
Scre
ening
, Ide
ntific
ation
, As
sess
ment
and
Supp
ort (
SIAS
) as a
me
chan
ism fo
r ear
ly ide
ntific
ation
and
inter
venti
on
Appr
oved
Nati
onal
Repo
rt on
mo
nitor
ing of
the
imple
menta
tion
of the
Poli
cy
on S
creen
ing,
Identi
ficati
on,
Asse
ssme
nt an
d Su
ppor
t (SI
AS) a
s a m
echa
nism
for
early
iden
tifica
tion
and i
nterve
ntion
Appr
oved
Nati
onal
Repo
rt on
mo
nitor
ing of
the
imple
menta
tion
of the
Poli
cy
on S
creen
ing,
Identi
ficati
on,
Asse
ssme
nt an
d Su
ppor
t (SI
AS) a
s a m
echa
nism
for
early
iden
tifica
tion
and i
nterve
ntion
2.1.5
Amen
d leg
islati
on to
regu
late
the ne
w EC
D lan
dsca
pe-
--
-A
joint
subm
ission
for
deter
mina
tion o
n the
ECD
func
tion
shift
is su
bmitte
d to
the M
iniste
r of P
ublic
Se
rvice
Adm
inistr
ation
Amen
dmen
t of
NEPA
, SAS
A an
d Ch
ildre
n’s A
ct co
mplet
ed w
ithin
9 mo
nths o
f Cab
inet
proc
lamati
on on
chan
ge.
Appr
oved
coste
d pla
n
2.1.6
Deve
lop ne
w fun
ding m
odels
for
ECD
deliv
ery
--
--
Repo
rt on
inv
estig
ation
into
ECD
fundin
g mod
els
First
phas
e of
imple
menta
tion
Appr
oved
fund
ing
mode
l

45
Outc
ome
Outp
uts
Outp
utIn
dica
tors
Annu
al Ta
rget
s
Audi
ted
/Act
ual
Perfo
rman
ceEs
timat
edPe
rform
ance
MTEF
Per
iod
2016
/1720
17/18
2018
/1920
19/20
2020
/2120
21/22
2022
/232.1
.7 Co
nduc
t an E
arly
Child
hood
De
velop
ment
cens
us to
infor
m the
int
egra
tion o
f ECD
into
the E
MIS
--
--
Prep
arati
ons f
or E
CD
cens
us is
conc
luded
Appr
oved
repo
rt on
the n
ation
al au
dit co
nduc
ted
on E
arly
Child
hood
De
velop
ment
(ECD
) ce
ntres
DBE
begin
s to
regis
ter E
CD
centr
es an
d pr
ogra
mmes
2.1.8
Deve
lop an
d ope
ratio
nalis
e an
Early
Chil
dhoo
d Dev
elopm
ent (
ECD)
Hu
man R
esou
rce D
evelo
pmen
t (H
RD) P
lan
Repo
rt on
ECD
se
rvice
deliv
ery
mode
l and
its
wor
kforce
im
plica
tions
Onlin
e NQF
Leve
l 4 E
CD qu
alific
ation
pla
tform
oper
ation
al
Prov
incial
Qua
lity
Assu
ranc
e Par
tners
identi
fied
2.1.9
Numb
er of
distr
icts m
onito
red
on im
pleme
ntatio
n of th
e Nati
onal
Curri
culum
Stat
emen
t (NC
S) fo
r Gr
ades
10 -1
2
--
--
88
8
2.1.10
Num
ber o
f pro
vince
s mo
nitor
ed on
extra
-supp
ort c
lasse
s to
incre
ase t
he nu
mber
of le
arne
rs ac
hievin
g Bac
helor
leve
l pas
ses.
--
--
39
9
2.1.11
Num
ber o
f sch
ools
monit
ored
for
imple
menti
ng co
mpuls
ory
entre
pren
eursh
ip ed
ucati
on
--
--
90 (1
0 per
prov
ince)
90 (1
0 per
prov
ince)
90 (1
0 per
prov
ince)
2.1.12
An A
nnua
l Sec
tor R
epor
t is
prod
uced
on th
e imp
lemen
tation
of
the G
ener
al Ed
ucati
on C
ertifi
cate
(GEC
)
---
-Ap
prov
ed A
nnua
l Se
ctor R
epor
t on t
he
imple
menta
tion o
f the
Gene
ral E
duca
tion
Certifi
cate
(GEC
)
Appr
oved
Ann
ual
Secto
r Rep
ort o
n the
imple
menta
tion
of the
Gen
eral
Educ
ation
Ce
rtifica
te (G
EC)
Appr
oved
Ann
ual
Secto
r Rep
ort o
n the
imple
menta
tion
of the
Gen
eral
Educ
ation
Ce
rtifica
te (G
EC)
2.1.13
An A
nnua
l Sec
tor R
epor
t is
prod
uced
on sc
hools
that
are
prep
ared
to re
spec
tively
imple
ment
and p
ilot th
e Tec
hnica
l Occ
upati
onal
Stre
am
--
--
An A
ppro
ved A
nnua
l Se
ctor R
epor
t on
Scho
ols of
Skil
l that
pilot
the Te
chnic
al Oc
cupa
tiona
l Stre
am
in 20
20/21
An A
ppro
ved A
nnua
l Se
ctor R
epor
t on
Ordin
ary S
econ
dary
Scho
ols th
at pil
ot the
Tech
nical
Occu
patio
nal
Stre
am in
2021
/22
An A
ppro
ved
Annu
al Se
ctor
Repo
rt on
scho
ols
that im
pleme
nt the
Tech
nical
Occu
patio
nal
Stre
am in
2022
/23
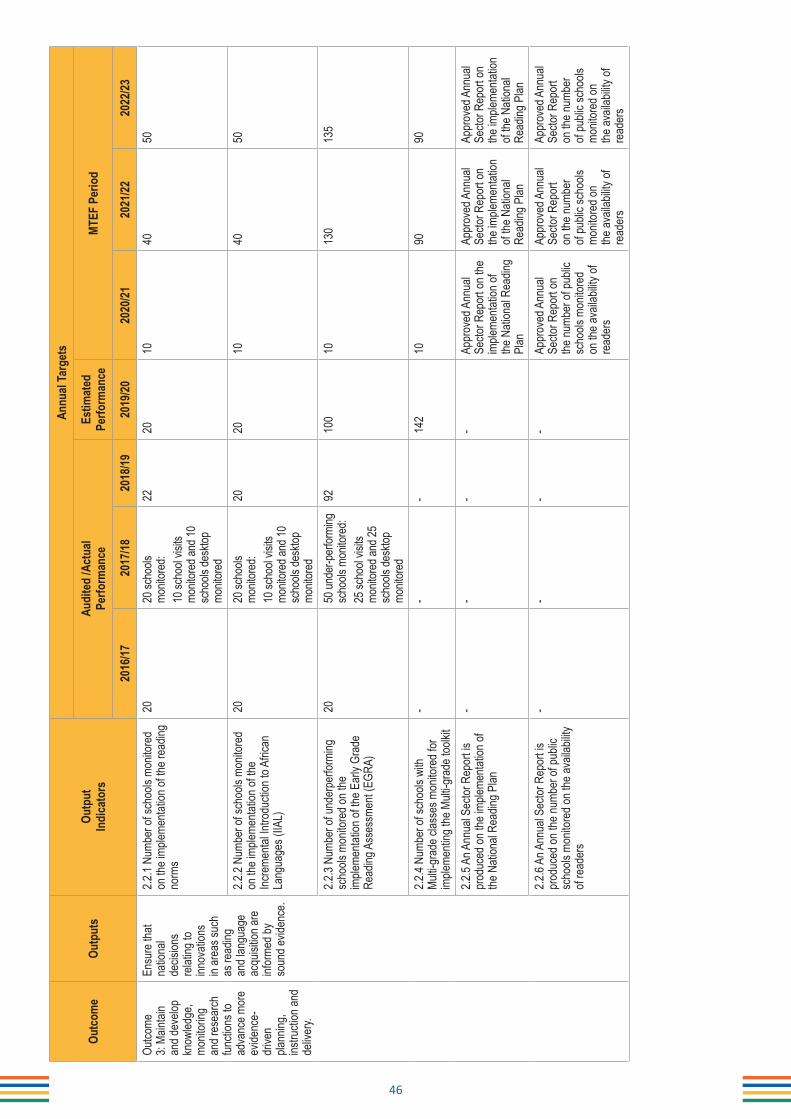
46
Outc
ome
Outp
uts
Outp
utIn
dica
tors
Annu
al Ta
rget
s
Audi
ted
/Act
ual
Perfo
rman
ceEs
timat
edPe
rform
ance
MTEF
Per
iod
2016
/1720
17/18
2018
/1920
19/20
2020
/2120
21/22
2022
/23Ou
tcome
3:
Maint
ain
and d
evelo
p kn
owled
ge,
monit
oring
an
d res
earch
fun
ction
s to
adva
nce m
ore
evide
nce-
drive
n pla
nning
, ins
tructi
on an
d de
liver
y.
Ensu
re th
at na
tiona
l de
cision
s re
lating
to
innov
ation
s in
area
s suc
h as
read
ing
and l
angu
age
acqu
isitio
n are
inf
orme
d by
soun
d evid
ence
.
2.2.1
Numb
er of
scho
ols m
onito
red
on th
e imp
lemen
tation
of th
e rea
ding
norm
s
2020
scho
ols
monit
ored
:10
scho
ol vis
its
monit
ored
and 1
0 sc
hools
desk
top
monit
ored
2220
1040
50
2.2.2
Numb
er of
scho
ols m
onito
red
on th
e imp
lemen
tation
of th
e Inc
reme
ntal In
trodu
ction
to A
frican
La
ngua
ges (
IIAL)
2020
scho
ols
monit
ored
:10
scho
ol vis
its
monit
ored
and 1
0 sc
hools
desk
top
monit
ored
2020
1040
50
2.2.3
Numb
er of
unde
rper
formi
ng
scho
ols m
onito
red o
n the
im
pleme
ntatio
n of th
e Ear
ly Gr
ade
Read
ing A
sses
smen
t (EG
RA)
2050
unde
r-per
formi
ng
scho
ols m
onito
red:
25 sc
hool
visits
mo
nitor
ed an
d 25
scho
ols de
sktop
mo
nitor
ed
9210
010
130
135
2.2.4
Numb
er of
scho
ols w
ith
Multi-
grad
e clas
ses m
onito
red f
or
imple
menti
ng th
e Mult
i-gra
de to
olkit
--
-14
210
9090
2.2.5
An A
nnua
l Sec
tor R
epor
t is
prod
uced
on th
e imp
lemen
tation
of
the N
ation
al Re
ading
Plan
--
--
Appr
oved
Ann
ual
Secto
r Rep
ort o
n the
im
pleme
ntatio
n of
the N
ation
al Re
ading
Pl
an
Appr
oved
Ann
ual
Secto
r Rep
ort o
n the
imple
menta
tion
of the
Nati
onal
Read
ing P
lan
Appr
oved
Ann
ual
Secto
r Rep
ort o
n the
imple
menta
tion
of the
Nati
onal
Read
ing P
lan2.2
.6 An
Ann
ual S
ector
Rep
ort is
pr
oduc
ed on
the n
umbe
r of p
ublic
sc
hools
mon
itore
d on t
he av
ailab
ility
of re
ader
s
--
--
Appr
oved
Ann
ual
Secto
r Rep
ort o
n the
numb
er of
publi
c sc
hools
mon
itore
d on
the a
vaila
bility
of
read
ers
Appr
oved
Ann
ual
Secto
r Rep
ort
on th
e num
ber
of pu
blic s
choo
ls mo
nitor
ed on
the
avail
abilit
y of
read
ers
Appr
oved
Ann
ual
Secto
r Rep
ort
on th
e num
ber
of pu
blic s
choo
ls mo
nitor
ed on
the
avail
abilit
y of
read
ers

47
Outc
ome
Outp
uts
Outp
utIn
dica
tors
Annu
al Ta
rget
s
Audi
ted
/Act
ual
Perfo
rman
ceEs
timat
edPe
rform
ance
MTEF
Per
iod
2016
/1720
17/18
2018
/1920
19/20
2020
/2120
21/22
2022
/23Ou
tcome
4:
Adva
nce t
he
deve
lopme
nt of
innov
ative
an
d high
qu
ality
educ
ation
al ma
terial
s.
Prom
ote th
e us
e of e
viden
ce
in ma
terial
s de
velop
ment
throu
gh a
stron
ger u
se
of em
ergin
g tec
hnolo
gies.
2.3.1
Numb
er of
scho
ols pe
r pr
ovinc
e mon
itore
d for
utilis
ation
of
Infor
matio
n and
Com
munic
ation
s Te
chno
logy (
ICT)
reso
urce
s
3027
scho
ols
monit
ored
2727
(3 pe
r pr
ovinc
e)27
(3 pe
r pro
vince
)27
(3 pe
r pro
vince
)27
(3 pe
r pro
vince
)
2.3.2
Perce
ntage
of pu
blic s
choo
ls pr
ovide
d with
Hom
e Lan
guag
e wo
rkboo
ks fo
r lear
ners
in Gr
ades
1 to
6 per
year
after
havin
g plac
ed an
or
der.
100%
Volu
me 1
deliv
ery:
A tot
al nu
mber
of 17
831
scho
ols re
ceive
d de
liver
ies10
0% V
olume
2 de
liver
y: A
total
numb
er of
1777
8 re
ceive
d deli
verie
s.
100%
Volu
me 1
and
Volum
e 2 G
rade
s1-
6 Hom
e La
ngua
ge
workb
ooks
wer
e de
liver
ed to
100%
sc
hools
Volum
e 1:
100%
(1
7 316
/17
316)
Volum
e 2:
100%
(1
7 341
/17
341)
100%
100%
100%
100%
2.3.3
Perce
ntage
of pu
blic s
choo
ls pr
ovide
d with
Math
emati
cs
workb
ooks
for le
arne
rs in
Grad
es
1 to 9
per y
ear, a
fter h
aving
plac
ed
an or
der.
100%
Volu
me 1
deliv
ery:
A tot
al nu
mber
of 23
613
scho
ols re
ceive
d de
liver
ies10
0% V
olume
2 de
liver
y: A
total
of nu
mber
of 23
543
scho
ols re
ceive
d de
liver
ies
100%
Volu
me
1 and
Volu
me 2
Grad
es 1-
9Ma
thema
tics
workb
ooks
wer
e de
liver
ed to
100%
sc
hools
Volum
e 1:
100%
(2
3 223
/23
223)
Volum
e 2:
100%
(2
3 201
/23
201)
100%
100%
100%
100%
2.3.4
Perce
ntage
of pu
blic s
choo
ls pr
ovide
d with
wor
kboo
ks fo
r lear
ners
in Gr
ades
R pe
r yea
r, afte
r hav
ing
place
d an o
rder.
100%
volum
e 1
deliv
ery:
A tot
al of
16
523 s
choo
ls re
ceive
d de
liver
ies10
0% vo
lume 1
de
liver
y: A
total
of 16
52
3 sch
ools
rece
ived
deliv
eries
100%
Term
s 1-4
Gr
ade R
wor
kboo
ks
were
deliv
ered
to
100%
scho
ols
100%
(1
6 347
/16
347)
100%
100%
100%
100%
2.3.5
An A
nnua
l Sec
tor R
epor
t is
prod
uced
on th
e lea
rner
s pro
vided
wi
th Ma
thema
tics a
nd E
nglis
h Fir
st Ad
dition
al La
ngua
ge (E
FAL)
tex
tbook
s in G
rade
s 3, 6
and 9
--
--
Appr
oved
Ann
ual
Secto
r Rep
ort
Appr
oved
Ann
ual
Secto
r Rep
ort
Appr
oved
Ann
ual
Secto
r Rep
ort

48
Outc
ome
Outp
uts
Outp
utIn
dica
tors
Annu
al Ta
rget
s
Audi
ted
/Act
ual
Perfo
rman
ceEs
timat
edPe
rform
ance
MTEF
Per
iod
2016
/1720
17/18
2018
/1920
19/20
2020
/2120
21/22
2022
/232.3
.6 Th
e num
ber o
f sch
ools
monit
ored
for h
ome l
angu
ages
in
which
Liter
acy G
rade
s 1-3
Less
on
Plan
s hav
e bee
n dev
elope
d for
ter
ms 1-
4
--
--
1010
10
2.3.7
Numb
er of
spec
ial sc
hools
with
ac
cess
to el
ectro
nic de
vices
-
--
-14
030
70
Outco
me
5: Co
nduc
t str
ategic
int
erve
ntion
s to
assis
t an
d dev
elop
prov
incial
ed
ucati
on
syste
ms.
Conti
nue w
ith
the st
rateg
ic us
e an
d mon
itorin
g of
cond
itiona
l gr
ants
and
other
fund
s to
adva
nce
natio
nal
prior
ities,
as w
ell
as ad
dition
al int
erve
ntion
s in
all or
spec
ific
prov
inces
to
adva
nce t
he
attain
ment
of se
ctor-w
ide go
al
2.4.1
An A
nnua
l Sec
tor R
epor
t is
prod
uced
on th
e num
ber o
f teac
hers
traine
d on i
nclus
ion
--
--
Appr
oved
Ann
ual
Secto
r Rep
ort o
n the
nu
mber
of te
ache
rs tra
ined o
n inc
lusion
Appr
oved
Ann
ual
Secto
r Rep
ort o
n the
numb
er of
tea
cher
s tra
ined o
n inc
lusion
Appr
oved
Ann
ual
Secto
r Rep
ort o
n the
numb
er of
tea
cher
s tra
ined o
n inc
lusion
2.4.2
An A
nnua
l Sec
tor R
epor
t is
prod
uced
on th
e num
ber o
f lear
ners
in pu
blic s
pecia
l sch
ools
--
--
Appr
oved
Ann
ual
Secto
r Rep
ort o
n the
nu
mber
of le
arne
rs in
publi
c spe
cial s
choo
ls
Appr
oved
Ann
ual
Secto
r Rep
ort o
n the
numb
er of
lea
rner
s in p
ublic
sp
ecial
scho
ols
Appr
oved
Ann
ual
Secto
r Rep
ort o
n the
numb
er of
lea
rner
s in p
ublic
sp
ecial
scho
ols2.4
.3 An
Ann
ual S
ector
Rep
ort is
pr
oduc
ed on
the p
erce
ntage
of
publi
c spe
cial s
choo
ls se
rving
as
reso
urce
centr
es
--
--
Appr
oved
Ann
ual
Secto
r Rep
ort o
n the
perce
ntage
of
publi
c spe
cial s
choo
ls se
rving
as r
esou
rce
centr
es
Appr
oved
Ann
ual
Secto
r Rep
ort o
n the
perce
ntage
of
publi
c spe
cial
scho
ols se
rving
as
reso
urce
centr
es
Appr
oved
Ann
ual
Secto
r Rep
ort o
n the
perce
ntage
of
publi
c spe
cial
scho
ols se
rving
as
reso
urce
centr
es2.4
.4 An
Ann
ual S
ector
Rep
ort is
pr
oduc
ed on
the e
stabli
shme
nt of
Focu
s Sch
ools
per P
rovin
cial
Educ
ation
Dep
artm
ent
--
--
Appr
oved
Ann
ual
Secto
r Rep
ort o
n the
estab
lishm
ent o
f Fo
cus S
choo
ls pe
r Pr
ovinc
ial E
duca
tion
Depa
rtmen
t
Appr
oved
Ann
ual
Secto
r Rep
ort o
n the
estab
lishm
ent
of Fo
cus S
choo
ls pe
r Pro
vincia
l Ed
ucati
on
Depa
rtmen
t
Appr
oved
Ann
ual
Secto
r Rep
ort o
n the
estab
lishm
ent
of Fo
cus S
choo
ls pe
r Pro
vincia
l Ed
ucati
on
Depa
rtmen
t

49
5.2.
2 In
dica
tors
, Ann
ual a
nd Q
uart
erly
Tar
gets
Tabl
e 14
: Pro
gram
me
2: In
dica
tors
, Ann
ual a
nd Q
uart
erly
Tar
gets
Outp
ut In
dica
tors
Repo
rting
Cy
cleAn
nual
Targ
etQ1
Q2Q3
Q4
2.1.1
Numb
er of
Tech
nical
scho
ols m
onito
red
for im
pleme
ntatio
n of C
urric
ulum
and
Asse
ssme
nt Po
licy S
tatem
ents
(CAP
S)Qu
arter
ly18
66
06
2.1.2
Numb
er of
lear
ners
obtai
ning s
ubjec
t pa
sses
towa
rds a
Nati
onal
Senio
r Cer
tifica
te (N
SC) o
r exte
nded
Sen
ior C
ertifi
cate,
inc
luding
upgr
aded
NSC
per y
ear
Bi-a
nnua
lly60
000
030
000
030
000
2.1.3
Numb
er of
Chil
dren
/ Lea
rner
s with
Pr
ofoun
d Inte
llectu
al Di
sabil
ity (C
/LPID
) us
ing th
e Lea
rning
Pro
gram
me fo
r C/LP
ID
Annu
ally
3 527
00
03 5
27
2.1.4
A Na
tiona
l Rep
ort is
prod
uced
on
mon
itorin
g of th
e imp
lemen
tation
of
the P
olicy
on S
creen
ing, Id
entifi
catio
n, As
sess
ment
and S
uppo
rt (S
IAS)
as a
mech
anism
for e
arly
identi
ficati
on an
d int
erve
ntion
Annu
ally
Appr
oved
Nati
onal
Repo
rt on
mon
itorin
g of th
e im
pleme
ntatio
n of th
e Poli
cy
on S
creen
ing, Id
entifi
catio
n, As
sess
ment
and S
uppo
rt (S
IAS)
as a
mech
anism
for
early
iden
tifica
tion a
nd
inter
venti
on
00
0
Appr
oved
Nati
onal
Repo
rt on
mon
itorin
g of th
e im
pleme
ntatio
n of th
e Poli
cy on
Scre
ening
, Ide
ntific
ation
, Ass
essm
ent a
nd S
uppo
rt (S
IAS)
as
a me
chan
ism fo
r ear
ly ide
ntific
ation
and
inter
venti
on
2.1.5
Amen
d leg
islati
on to
regu
late t
he ne
w EC
D lan
dsca
peAn
nuall
y
A joi
nt su
bmiss
ion fo
r de
termi
natio
n on t
he E
CD
functi
on sh
ift is
subm
itted t
o the
Mini
ster o
f Pub
lic S
ervic
e Ad
minis
tratio
n
Cons
ultati
ons h
eld
betw
een D
BE an
d DS
DDi
agno
stic R
epor
t on
functi
on co
nclud
ed
Read
iness
as
sess
ment
and
draft
deter
mina
tion
conc
luded
Deter
mina
tion s
ubmi
tted t
o DPS
A
2.1.6
Deve
lop ne
w fun
ding m
odels
for E
CD
deliv
ery
Annu
ally
Repo
rt on
inve
stiga
tion i
nto
ECD
fundin
g mod
els
Comp
rehe
nsive
lite
ratur
e rev
iew
Repo
rt on
optio
ns
analy
sis
Repo
rt on
co
nsult
ation
s held
Ap
prov
ed re
port
with
reco
mmen
datio
ns
2.1.7
Cond
uct a
n Ear
ly Ch
ildho
od
Deve
lopme
nt ce
nsus
to in
form
the
integ
ratio
n of E
CD in
to the
EMI
SAn
nuall
yPr
epar
ation
s for
ECD
cens
us
is co
nclud
edPi
loting
and
prep
arati
on fo
r Na
tiona
l Aud
it Fie
ldwor
k tak
es pl
ace
Data
clean
ing an
d an
alysis
Pr
epar
ation
s for
ECD
cens
us is
conc
luded
2.1.8
Deve
lop an
d ope
ratio
nalis
e an E
arly
Child
hood
Dev
elopm
ent (
ECD)
Hum
an
Reso
urce
Dev
elopm
ent (
HRD)
Plan
An
nuall
yRe
port
on E
CD se
rvice
de
liver
y mod
el an
d its
workf
orce
impli
catio
ns
Diag
nosti
c rep
ort o
n HR
capa
city w
ithin
Gove
rnme
nt to
deliv
er
on co
re fu
nctio
ns
Repo
rt on
cons
ultati
ons
with
key G
over
nmen
t de
partm
ents
impli
cated
Repo
rt on
co
nsult
ation
s with
se
ctor s
takeh
older
sAp
prov
ed H
RD pl
an
2.1.9
Numb
er of
distr
icts m
onito
red o
n im
pleme
ntatio
n of th
e Nati
onal
Curri
culum
St
ateme
nt (N
CS) f
or G
rade
s 10 -
12An
nuall
y8
00
08

50
Outp
ut In
dica
tors
Repo
rting
Cy
cleAn
nual
Targ
etQ1
Q2Q3
Q4
2.1.10
Num
ber o
f pro
vince
s mon
itore
d on
extra
-supp
ort c
lasse
s to i
ncre
ase t
he nu
mber
of
learn
ers a
chiev
ing B
ache
lor le
vel p
asse
s.An
nuall
y3
00
03
2.1.11
Num
ber o
f sch
ools
monit
ored
for
imple
menti
ng co
mpuls
ory e
ntrep
rene
ursh
ip ed
ucati
onAn
nuall
y90
(10 p
er pr
ovinc
e)0
00
90 (1
0 per
prov
ince)
2.1.12
An A
nnua
l Sec
tor R
epor
t is pr
oduc
ed
on th
e imp
lemen
tation
of th
e Gen
eral
Educ
ation
Cer
tifica
te (G
EC)
Annu
ally
Appr
oved
Ann
ual S
ector
Re
port
on th
e imp
lemen
tation
of
the G
ener
al Ed
ucati
on
Certifi
cate
(GEC
)0
00
Appr
oved
Ann
ual S
ector
Rep
ort o
n the
im
pleme
ntatio
n of th
e Gen
eral
Educ
ation
Ce
rtifica
te (G
EC)
2.1.13
An A
nnua
l Sec
tor R
epor
t is pr
oduc
ed
on sc
hools
that
are p
repa
red t
o res
pecti
vely
imple
ment
and p
ilot th
e Tec
hnica
l Oc
cupa
tiona
l Stre
amAn
nuall
y
An A
ppro
ved A
nnua
l Sec
tor
Repo
rt on
Sch
ools
of Sk
ill tha
t pilo
t the T
echn
ical
Occu
patio
nal S
tream
in
2020
/21
00
0An
App
rove
d Ann
ual S
ector
Rep
ort o
n Sch
ools
of Sk
ill tha
t pilo
t the T
echn
ical O
ccup
ation
al St
ream
in 20
20/21
2.2.1
Numb
er of
scho
ols m
onito
red o
n the
im
pleme
ntatio
n of th
e rea
ding n
orms
Annu
ally
100
00
10
2.2.2
Numb
er of
scho
ols m
onito
red o
n the
imple
menta
tion o
f the I
ncre
menta
l Int
rodu
ction
to A
frican
Lang
uage
s (IIA
L)An
nuall
y10
00
010
2.2.3
Numb
er of
unde
rper
formi
ng sc
hools
mo
nitor
ed on
the i
mplem
entat
ion of
the E
arly
Grad
e Rea
ding A
sses
smen
t (EG
RA)
Annu
ally
100
00
10
2.2.4
Numb
er of
scho
ols w
ith M
ulti-g
rade
cla
sses
mon
itore
d for
imple
menti
ng th
e Mu
lti-gr
ade t
oolki
tAn
nuall
y10
00
010
2.2.5
An A
nnua
l Sec
tor R
epor
t is pr
oduc
ed
on th
e imp
lemen
tation
of th
e Nati
onal
Read
ing P
lanAn
nuall
yAp
prov
ed A
nnua
l Sec
tor
Repo
rt on
the i
mplem
entat
ion
of the
Nati
onal
Read
ing P
lan0
00
Appr
oved
Ann
ual S
ector
Rep
ort o
n the
im
pleme
ntatio
n of th
e Nati
onal
Read
ing P
lan
2.2.6
An A
nnua
l Sec
tor R
epor
t is pr
oduc
ed
on th
e num
ber o
f pub
lic sc
hools
mon
itore
d on
the a
vaila
bility
of re
ader
sAn
nuall
yAp
prov
ed A
nnua
l Sec
tor
Repo
rt on
the n
umbe
r of
publi
c sch
ools
monit
ored
on
the av
ailab
ility o
f rea
ders
00
0Ap
prov
ed A
nnua
l Sec
tor R
epor
t on t
he nu
mber
of
publi
c sch
ools
monit
ored
on th
e ava
ilabil
ity
of re
ader
s
2.3.1
Numb
er of
scho
ols pe
r pro
vince
mo
nitor
ed fo
r utili
satio
n of In
forma
tion a
nd
Comm
unica
tions
Tech
nolog
y (IC
T) re
sour
ces
Annu
ally
27 (3
per p
rovin
ce)
00
027
(3 pe
r pro
vince
)

51
Outp
ut In
dica
tors
Repo
rting
Cy
cleAn
nual
Targ
etQ1
Q2Q3
Q4
2.3.2
Perce
ntage
of pu
blic s
choo
ls pr
ovide
d wi
th Ho
me La
ngua
ge w
orkb
ooks
for le
arne
rs in
Grad
es 1
to 6 p
er ye
ar af
ter ha
ving p
laced
an
orde
rAn
nuall
y10
0%0
00
100%
2.3.3
Perce
ntage
of pu
blic s
choo
ls pr
ovide
d wi
th Ma
thema
tics w
orkb
ooks
for le
arne
rs in
Grad
es 1
to 9 p
er ye
ar, af
ter ha
ving p
laced
an
orde
rAn
nuall
y10
0%0
00
100%
2.3.4
Perce
ntage
of pu
blic s
choo
ls pr
ovide
d wi
th wo
rkboo
ks fo
r lear
ners
in Gr
ades
R pe
r ye
ar, af
ter ha
ving p
laced
an or
der
Annu
ally
100%
00
010
0%
2.3.5
An A
nnua
l Sec
tor R
epor
t is pr
oduc
ed
on th
e lea
rner
s pro
vided
with
Math
emati
cs
and E
nglis
h Firs
t Add
itiona
l Lan
guag
e (E
FAL)
textb
ooks
in G
rade
s 3, 6
and 9
Annu
ally
Appr
oved
Ann
ual S
ector
Re
port
00
0Ap
prov
ed A
nnua
l Sec
tor R
epor
t
2.3.6
The n
umbe
r of s
choo
ls mo
nitor
ed fo
r ho
me la
ngua
ges i
n whic
h Lite
racy
Gra
des
1-3 L
esso
n Plan
s hav
e bee
n dev
elope
d for
ter
ms 1-
4An
nuall
y10
00
010
2.3.7
Numb
er of
spec
ial sc
hools
with
acce
ss
to ele
ctron
ic de
vices
An
nuall
y14
00
00
140
2.4.1
An A
nnua
l Sec
tor R
epor
t is pr
oduc
ed
on th
e num
ber o
f teac
hers
traine
d on
inclus
ionAn
nuall
yAp
prov
ed A
nnua
l Sec
tor
Repo
rt on
the n
umbe
r of
teach
ers t
raine
d on i
nclus
ion0
00
Appr
oved
Ann
ual S
ector
Rep
ort o
n the
numb
er
of tea
cher
s tra
ined o
n inc
lusion
2.4.2
An A
nnua
l Sec
tor R
epor
t is pr
oduc
ed
on th
e num
ber o
f lear
ners
in pu
blic s
pecia
l sc
hools
Annu
ally
Appr
oved
Ann
ual S
ector
re
port
on th
e num
ber o
f lea
rner
s in p
ublic
spec
ial
scho
ols0
00
Appr
oved
Ann
ual S
ector
repo
rt on
the n
umbe
r of
learn
ers i
n pub
lic sp
ecial
scho
ols
2.4.3
An A
nnua
l Sec
tor R
epor
t is pr
oduc
ed
on th
e per
centa
ge of
publi
c spe
cial s
choo
ls se
rving
as re
sour
ce ce
ntres
Annu
ally
Appr
oved
Ann
ual S
ector
Re
port
on th
e per
centa
ge of
pu
blic s
pecia
l sch
ools
servi
ng
as re
sour
ce ce
ntres
00
0Ap
prov
ed A
nnua
l Sec
tor R
epor
t on t
he
perce
ntage
of pu
blic s
pecia
l sch
ools
servi
ng as
re
sour
ce ce
ntres
2.4.4
An A
nnua
l Sec
tor R
epor
t is pr
oduc
ed
on th
e esta
blish
ment
of Fo
cus S
choo
ls pe
r Pr
ovinc
ial E
duca
tion D
epar
tmen
tAn
nuall
y
Appr
oved
Ann
ual S
ector
Re
port
on th
e esta
blish
ment
of Fo
cus S
choo
ls pe
r Pr
ovinc
ial E
duca
tion
Depa
rtmen
t
00
0Ap
prov
ed A
nnua
l Sec
tor R
epor
t on t
he
estab
lishm
ent o
f Foc
us S
choo
ls pe
r Pro
vincia
l Ed
ucati
on D
epar
tmen
t

52
5.2.3 Explanation of planned performance over the medium-term period
The Programme: Curriculum Policy, Support and Monitoring will focus on the following priority areas during the 2020/21 financial year:
Curriculum Implementation and Quality Improvement:
General Education and Training (GET) Grade R–9
The Department will monitor and support the implementation of the Curriculum and Assessment Policy Statement (CAPS) in addition to monitoring and supporting reading and writing norms in Grades 3, 6 and 9. The GET will engage with Provincial Education Departments (PEDs) through Subject Committee Meetings and inter-provincial forums to monitor and support multi-grade schools by strengthening the implementation of School-Based Assessment towards improving the quality of learner attainment. Furthermore, the Department aims to do oversight monitoring and support the implementation of the Early Grade Reading Assessment (EGRA) in Grades 1–3 at 55 schools. The Department plans to monitor and support the implementation of the national reading sector plan and Incremental Introduction of African Languages (IIAL) Strategy: 10 schools. To strengthen access to learning and to improve learner attainment, English Across the Curriculum in all subjects in the GET band will be implemented while monitoring and supporting the implementation of the National Strategy for Learner Attainment (NSLA). Through conducting oversight monitoring of special intervention programmes, the Department will work towards improving learner performance.
Inclusive Education
The Department will ensure that schools effectively implement the Inclusive Education policy and have access to specialised support through monitoring the implementation of the Screening, Identification, Assessment and Support (SIAS) policy as a mechanism for early identification of barriers to learning. Through institutionalisation of curriculum differentiation to expand access, reduce learner dropout rate and improve retention, the Department aims to implement the NSLA in respect of Inclusive Education and Home Education, policy on Home Education and the Technical Occupational Stream.
The Department, through the Conditional Grant on Learners with Severe to Profound Intellectual Disability, will monitor and support human resource provision specific to Inclusive Education. This entails monitoring the recruitment, retention and utilisation of Provincial Project Managers and Transversal Itinerant Outreach Team members who will provide outreach services to special care centres and schools. Support and Monitoring will be provided for capacity-building of Transversal Itinerant Outreach Team members, caregivers, teachers, therapists and officials on the implementation of the Learning Programme for the Learners with Severe to Profound Intellectual Disability. This is in addition to the provision of LTSMs, outreach services and therapeutic and psychosocial support to the Learners with Severe to Profound Intellectual Disability in targeted special care centres and schools.
Curriculum Implementation and Quality Improvement:
Further Education and Training (FET) Grades 10 to 12
The Department, through the FET programme, aims to monitor and support the implementation of the NSLA, curriculum implementation for FET subjects in Grades 10–12 as well as strengthening and supporting School-Based Assessment in Grades 10–12. Additionally, monitoring will be fulfilled through the implementation of existing policy and development/ amendment of policy related to curriculum in the FET band while supporting the improvement of quality learning outcomes.
Early Childhood Development (ECD)
The Department aims to finalise the migration of ECD functions from the Department of Social Development to the Department of Basic Education whilst monitoring and supporting the implementation of the National Curriculum Framework for Children from Birth to 4 years, and the implementation of the NSLA as it pertains to ECD. In order to strengthen inter-provincial collaboration, ECD practitioners in PEDs will be monitored and supported through the Inter-Provincial ECD Committee, Training and Curriculum Sub-committee, along with the development of a costed plan for the implementation of two additional years before Grade 1.
Rural Education
The Department will coordinate a multi-disciplinary approach in supporting rural schools to provide a quality education through coordinating and facilitating the finalisation of the Rural Education Framework and managing the Rural Education Assistants

53
Project (REAP). REAP implementation will be monitored and supported by conducting research and producing a research report on the REAP and developing a Framework for Education Assistants. The Department aims to strengthen agriculture education matters through the Agriculture Education Project by engaging with PEDs with the help of the National Agricultural Education Committee (NAEC) as well as finalising a concept document on a Self-sufficient Agricultural School Model. There will be engagements with PEDs on rural education matters through the Inter-Provincial Rural Education Committee (IPREC), while at the same time coordination of partnership, interdepartmental and sectoral programmes.
5.2.4 Programme Resource Considerations
Foundation Phase reading and writing are a concern for the sector. Although there has been recent improvement in assessment studies results, South Africa still performs lower than most African countries. Research shows that interventions should target the Foundation Phase to effect significant change in reading and learning outcomes. As such, this area of early grade reading is a policy priority for the next MTEF. The Department will implement the Early Grade Reading Programme in North West during 2020, with wider scale-up planned over five years, to ensure that 10-year-old learners enrolled in publicly funded schools can read for meaning. The DBE will print and disseminate graded readers per learner across at least three provinces in 2020.
A Professional Development Course for Literacy Coaches is under development which will be used to train the first cohort of coaches and subject advisors in 2020. Currently, the implementation of the Early Grade Reading Programme in North West is funded by donors, with the intention that in future, PEDs will identify sources of funding for the various components of the programme through their budgets for LTSM and teacher training. To facilitate this process, a finance study is being commissioned to make recommendations about sources of funding within existing budgets and to estimate the costs of scale-up.
Parallel initiatives such as the Read-to-Lead campaign also seek to encourage a culture of reading from a young age, by ensuring learners can read but also that they have reading material available for reading enjoyment. The sector will also continue pursuing improving learners’ reading proficiency in the Foundation Phase in underperforming schools through the use of the Early Grade Reading Assessment, a diagnostic reading assessment tool aimed at improving reading proficiency levels. Over the MTEF, EGRA toolkits will be developed in all official languages; 75% of schools will receive toolkits and 390 schools will be monitored, focusing on Grade 2 and 3 classes. Monitoring of implementation of EGRA will be done through desktop analysis.
To address the budget cuts by the Cabinet, the order for EGRA toolkits will be reduced from 49 616 to 40 000 during the 2020/21 financial year and further reduced to 35 000 in 2021/22.
Enhancing teaching and learning
Goal 19 of the Action Plan to 2024: Towards the Realisation of Schooling 2030 mandates the Department to ensure that every learner has access to a minimum set of textbooks and workbooks required according to national policy. To respond to this mandate, the Department provides workbooks to Grade R to 9 learners.
The expenditure for workbooks is aligned to the achievement of operational outcomes. The delivery of an improved curriculum and access to LTSMs of high quality are central to providing quality basic education and ensuring that these materials are used effectively. Accordingly, the Department plans to print and deliver an estimated 61 million workbooks for Grades R to 9 each year over the medium term in life skills, languages and Mathematics. These workbooks are expected to be distributed to more than 24 000 public schools across South Africa. To this end, R3,5 billion over the MTEF period is allocated in the Curriculum and Quality Enhancement Programme, a sub-programme in the Curriculum Policy, Support and Monitoring programme. An estimated R3 million of this allocation over the MTEF period will be shifted for the introduction and maintenance of a planning and monitoring system to ensure that the correct number and type of workbooks and learner-teacher support materials are delivered to the correct schools.
In response to the budget cuts of approximately R110 million, the Department proposes a reduction in the number of workbook titles by not printing and distributing Grades 1 to 3 Life Skills workbooks for Quintiles 4 and 5 schools for the 2021 academic year and beyond, until additional funds are allocated to the project. This cut will have a significant impact on the number of workbooks to be printed and delivered and will have to be managed accordingly.
Skills for a changing world
The Department receives funding for the Maths, Science and Technology Grant, in the Curriculum and Quality Enhancement Programmes sub-programme, to enhance the curriculum and prepare learners for the changing world. In this regard, the

54
Department introduced new technical subjects that provide learners with a wider scope for subject choices. Over the MTEF, the Department will continue to provide ICT equipment and Information Technology support to schools. The MST Conditional Grant is supporting 1 000 schools nationally: 500 Dinaledi schools (Mathematics and Physical Science Schools); 200 technical schools; and 300 primary/ feeder schools.
The Department is introducing subjects like coding and data analytics at a primary school level. The sector has been innovative in developing subjects and curriculum content related to Coding and Robotics which will equip learners with skills for a changing world and ensure that South African children do not get left behind with regards to basic skills that are required in the digital age.
The three streams model is another innovation towards matching the skills of the future labour force to the needs of the South African economy and expanding participation in the technical streams. In the new MTEF, several ordinary public schools will be transformed into focus schools and new technology subjects and specialisation will be introduced. Arts, Maths and Science and Aviation will be focus subjects for the MTEF.
Improving matric completion rates
The Second Chance Matric Programme (SCMP) introduced in 2016 responds to the NDP’s injunction that retention rates should be improved and drop-out rates reduced. The Programme provides support to learners who are upgrading or who did not meet the pass requirements of the National Senior Certificate examinations. This is done by providing access to quality resources. The outputs of the programme are registered learners, procurement and delivery of e-Resources and administering of support to registered learners.
The Programme will also cater for learners with disabilities in the 2020 academic year. The Department will use the existing 23 special schools for the blind and 43 schools for the deaf that are allocated nationally. The programme for people with disabilities will adopt the same approach of allowing learners to attend after hours and over weekends. The target for 2020/21 of 60 000 includes learners with disabilities.
The Programme will facilitate the establishment of 80 face-to-face centres and appoint more than 800 teachers and 80 centre managers to teach after school hours and over weekends. The centres are located in all nine provinces in densely populated areas where there are high numbers of learners who could not achieve a matric pass. The electronic systems will be a web-based solution that allows multi-users to upload information about the textbooks and administration documents (e.g. attendance registers), facilitate communication between teachers and track the performance of each learner. The programme will provide support in gateway subjects and 11 home languages.
The Programme procures and delivers LTSM and other e-resources to learners through the PEDs. In addition, the Programme also provides support to learners through various platforms that include television and radio broadcasting, provision of online resources through the SCMP website and installation of Content Access Point devices in selected centres that do not have access to the internet.
The SCMP will conduct roadshows in provinces to raise awareness about the Programme to out-of-school youth and members of the public. The 2018/19 performance shows that more learners register for the NSC and Senior Certificate (amended) exams and achieved subject passes through the support of the Programme. During the roadshows, other entities such as Sector Education and Training Authorities, Khetha Career Awareness, National Youth Development Agency, NSFAS and institutions of higher learning will be invited to provide information on careers and other opportunities available to out-of-school youth.
The SCMP has established partnerships with Vodacom Foundation, UNISA Centres, DHET and public libraries to utilise their centres for out-of-school youth to get the information about registration and to access the freely available resources provided through the Programme.
The budget cut will not have a huge impact over the MTEF. Paying teachers and printing learning materials are priorities. The Programme is partnering with different entities to promote advocacy and public awareness in communities. Through collaboration with partners, advocacy campaigns will be shared.

55
Providing educational opportunities to learners with intellectual disabilities
The Department will ensure that children with profound intellectual disabilities have access to publicly funded education. The programme is aimed at providing the support, resources and equipment to identified care centres and schools for the provision of education to Children with Severe to Profound Intellectual Disabilities (CSPID).
R9,9 million has been allocated for this programme. For 2020/21, the LSPID grant will appoint nine deputy chief education specialists as provincial grant managers and 245 Transversal Itinerant Outreach Team members, to guide and support curriculum delivery and provide therapeutic support in special care centres and targeted schools.
A database of selected schools and special care centres will be developed that provides information on 518 special care centres that support CSPID. Transversal Itinerant Outreach Team members, caregivers, teachers, in-service therapists and officials will be trained on the Learning Programme for CSPID and other programmes that support the delivery of the Learning Programme. This will entail training 245 Transversal Itinerant Outreach Team members, 2 970 caregivers, 1 928 special school teachers, 408 in-service therapists and 510 officials.
Outreach services will be provided to 12 185 children/ learners with severe to profound intellectual disability, facilitating the use of the Learning Programme in 518 special care centres and 115 schools through conducting an assessment of children to determine their intellectual functioning and levels of support needed.
Due to budget cuts, in 2022/23, outreach services will not be provided to all CSPID, especially those who are in special care centres that are not currently targeted by the grant, and at home.

56
Budget allocation for programme and sub-programmes as per the ENE.
Table 15: Programme 2: Reconciling performance targets with the Budget and MTEF Expenditure estimates
Sub-ProgrammeAudited Outcomes R’000
Adjusted appropriation
R’000
Medium-term expenditure estimate
R’000
2016/17 2017/18 2018/19 2019/20 2020/21 2021/22 2022/23
Programme Management: Curriculum Policy, Support and Monitoring
3 447 2 502 3 205 2 835 3 681 2 879 2 997
Curriculum Implementation and Monitoring 440 271 269 397 317 987 381 977 351 568 405 344 421 072
Curriculum and Quality Enhancement Programmes
1 382 973 1 459 198 1 480 999 1 611 344 1 489 240 1 715 485 1 757 999
Total 1 826 691 1 731 097 1 802 191 1 996 156 1 844 489 2 123 708 2 182 068
Economic classification
Current Payments 1 463 445 1 298 011 1 249 127 1 382 828 1 267 809 1 443 511 1 476 710
Compensation of employees 72 019 89 090 81 602 98 947 105 345 109 137 106 361
Goods and services 1 391 426 1 208 921 1 167 525 1 283 881 1 162 464 1 334 374 1 370 349
Agency and support/outsourced services 8 509 11 216 12 863 10 358 8 363 6 811 6 782
Inventory: Learner and teacher support material
981 531 1 018 474 1 056 330 1 156 582 1 098 415 1 227 765 1 261 483
Consumables: stationery, printing and office supplies
52 460 3 155 671 21 201 9 047 18 592 20 103
Travel and subsistence 10 586 30 056 33 247 23 002 16 625 18 726 18 947
Operating payments 296 815 83 046 21 231 5 527 981 1 096 1 137
Other 41 525 62 974 43 183 67 211 29 033 61 384 61 897
Transfers and subsidies 362 818 431 812 552 377 612 348 575 922 679 338 704 449
Provinces and MunicipalitiesDepartmental agencies and accountsForeign governmentNon-profit institutionsHouseholds
362 444 431 168 521 281 612 087 575 726 679 131 704 234
Foreign Government and International Organisations
131 120 136 186 196 207 215
Households 243 524 960 75 - - -
Payments for capital assets 423 1 206 670 980 758 859 909
Machinery and equipment 423 731 670 980 758 859 909
Software - 475 - - - - -
Payments for financial assets 5 68 17 - - - -
TOTALS 1 826 691 1 731 097 1 802 191 1 996 156 2 025 646 2 123 708 2 182 068

57
Sub-ProgrammeAudited Outcomes R’000
Adjusted appropriation
R’000Medium-term expenditure estimate
R’000
2016/17 2017/18 2018/19 2019/20 2020/21 2021/22 2022/23Details of selected transfers and subsidiesCurrent -
Transfers and subsidies 362 818 431 812 552 377 612 348 575 922 679 338 704 449Learners with Profound Intellectual Disability Grant
- 66 023 180 798 220 785 242 864 256 222 265 746
Maths, Science and Technology Grant 362 444 365 145 370 483 391 302 332 862 422 909 438 488
Current 374 644 1 096 261 196 207 215Foreign Government and International Organisations
131 120 136 186 196 207 215
Households 243 524 960 75 - - -
5.3 Programme 3: Teachers, Education Human Resources and Institutional Development
Programme Purpose: Promote quality teaching and institutional performance through the effective supply, development and utilisation of human resources.
Sub-programmes: Programme Management: Teacher Education Human Resources Management; Education Human Resources Development; and Curriculum and Professional Development.
Action Plan Goals on Teacher Supply, Development and Utilisation
Goal 14 ► Attract a new group of young, motivated and appropriately trained teachers to the teaching profession every year.
Goal 15 ► Ensure that the availability and utilisation of teachers are such that excessively large classes are avoided.
Goal 16 ► Improve the professionalism, teaching skills, subject knowledge and computer literacy of teachers throughout their entire careers.
Goal 17 ► Strive for a teacher workforce that is healthy and enjoys a sense of job satisfaction.
Goal 18 ► Ensure that learners cover all the topics and skills areas that they should cover within their current school year.
Goal 21 ► Ensure that the basic annual management process takes place across all schools in the country in a way that contributes towards a functional school environment.
Goal 22 ► Improve parent and community participation in the governance of schools, partly by improving access to important information.

58
5.3.
1 O
utco
mes
, Out
puts
, Per
form
ance
Indi
cato
rs a
nd T
arge
ts
Tabl
e 16
: Pro
gram
me
3: O
utco
mes
, Out
puts
, Per
form
ance
Indi
cato
rs a
nd T
arge
ts
Outc
ome
Outp
uts
Outp
utIn
dica
tors
Annu
al Ta
rget
s
Audi
ted
/Act
ual
Perfo
rman
ceEs
timat
edPe
rform
ance
MTEF
Per
iod
2016
/1720
17/18
2018
/1920
19/20
2020
/2120
21/22
2022
/23Ou
tcome
2:
Maint
ain
and d
evelo
p inf
ormati
on an
d oth
er sy
stems
wh
ich en
able
trans
forma
tion
and a
n effic
ient
and a
ccou
ntable
se
ctor
Ensu
re tha
t go
verna
nce
syste
ms ev
olve
to de
al wi
th an
d su
pport
emerg
ing
priori
ties,
in pa
rticula
r, tho
se
relati
ng to
teac
her
place
ment
and
acco
untab
ility of
sc
hools
3.1.1
Perce
ntage
of Sc
hool
Gove
rning
Bo
dies (
SGBs
) that
meet
the m
inimu
m cri
teria
in ter
ms of
effec
tiven
ess
A tota
l of 2
000
tools
were
receiv
ed,
analy
sed a
nd ca
ptured
. Of
the 2
000 s
ample
d sc
hools
, at le
ast 1
822
(91.9%
) sch
ools
were
fou
nd to
be fu
nctio
nal
96.9%
(1 93
8)
of the
surve
yed
SGBs
were
foun
d to
be fu
nctio
nal
1 793
of
1 846
scho
ols
(97.1%
) met
the m
inimu
m cri
teria
in ter
ms of
eff
ectiv
enes
s
80%
of 2
000
samp
led
scho
ols
90%
of 1
000 s
ample
d sc
hools
90%
of 1
000 s
ample
d sc
hools
95%
of 1
000 s
ample
d sc
hools
3.1.2
Perce
ntage
of sc
hools
prod
ucing
the
mini
mum
set
of ma
nage
ment
docu
ments
at a
requir
ed st
anda
rd
A tota
l of 2
000
tools
were
receiv
ed,
analy
sed a
nd ca
ptured
. Of
the 2
000 s
ample
d sc
hools
, at le
ast 1
810
(90.5%
) sch
ools
were
fou
nd to
be fu
nctio
nal
86%
(1 72
0) of
the
2000
surve
yed
scho
ols w
ere
found
to ha
ve
functi
onal
basic
ma
nage
ment
docu
ments
1 674
of
1 917
(87.3
%)
produ
ced
the m
inimu
m se
t of
mana
geme
nt do
cume
nts
90%
of 2
000
samp
led
scho
ols
100%
of 1
000
samp
led sc
hools
100%
of 1
000
samp
led sc
hools
100%
of 1
000
samp
led sc
hools
3.1.3
Numb
er of
Funz
a Lu
shak
a bu
rsarie
s aw
arded
to
stude
nts
enrol
led fo
r Initia
l Tea
cher
Educ
ation
14 34
315
134
13 07
013
000
12 50
0 12
500
12 50
0
3.1.4
Numb
er of
quart
erly m
onito
ring
report
s tra
cking
the
perc
entag
e of
Funz
a Lu
shak
a gra
duate
s pla
ced
withi
n six
mon
ths, u
pon c
onfirm
ation
tha
t the b
ursar
has c
omple
ted st
udies
--
--
44
4
3.1.5
Numb
er of
quart
erly m
onito
ring
report
s ind
icatin
g the
num
ber
and
perce
ntage
of sc
hools
whe
re all
ocate
d tea
ching
posts
are a
ll fille
d
--
--
44
4
3.1.6
An A
nnua
l Se
ctor
Repo
rt is
produ
ced
on th
e nu
mber
of qu
alifie
d tea
chers
aged
30 an
d belo
w en
tering
the
publi
c serv
ice as
teac
hers
--
--
Appro
ved A
nnua
l Se
ctor R
eport
on th
e nu
mber
of qu
alifie
d tea
chers
aged
30
and b
elow
enter
ing
the pu
blic s
ervice
as
teach
ers
Appro
ved A
nnua
l Se
ctor R
eport
on th
e nu
mber
of qu
alifie
d tea
chers
aged
30
and b
elow
enter
ing
the pu
blic s
ervice
as
teach
ers
Appro
ved A
nnua
l Se
ctor R
eport
on th
e nu
mber
of qu
alifie
d tea
chers
aged
30
and b
elow
enter
ing
the pu
blic s
ervice
as
teach
ers

59
Outc
ome
Outp
uts
Outp
utIn
dica
tors
Annu
al Ta
rget
s
Audi
ted
/Act
ual
Perfo
rman
ceEs
timat
edPe
rform
ance
MTEF
Per
iod
2016
/1720
17/18
2018
/1920
19/20
2020
/2120
21/22
2022
/23Ou
tcome
3:
Maint
ain
and d
evelo
p kn
owled
ge,
monit
oring
and
resea
rch fu
nctio
ns
to ad
vanc
e mo
re ev
idenc
e-dri
ven p
lannin
g, ins
tructi
on an
d de
livery
Ensu
re tha
t na
tiona
l de
cision
s rela
ting
to ed
ucato
r co
nditio
ns of
se
rvice
, and
inn
ovati
ons i
n are
as su
ch as
tea
cher
traini
ng,
deve
lopme
nt an
d as
sess
ments
, are
infor
med b
y so
und e
viden
ce
3.2.1
A Na
tiona
l Rep
ort is
prod
uced
on
mon
itorin
g the
fun
ction
ality
of Pr
ovinc
ial
Teac
her
Deve
lopme
nt Ins
titutes
an
d Di
strict
Te
ache
r De
velop
ment
Centr
es
--
--
Appro
ved N
ation
al Re
port o
n mon
itorin
g the
func
tiona
lity of
Pr
ovinc
ial Te
ache
r De
velop
ment
Institu
tes
and D
istric
t Tea
cher
De
velop
ment
Centr
es
Appro
ved N
ation
al Re
port o
n mon
itorin
g the
func
tiona
lity of
Pr
ovinc
ial Te
ache
r De
velop
ment
Institu
tes
and D
istric
t Tea
cher
De
velop
ment
Centr
es
Appro
ved N
ation
al Re
port o
n mon
itorin
g the
func
tiona
lity of
Pr
ovinc
ial Te
ache
r De
velop
ment
Institu
tes
and D
istric
t Tea
cher
De
velop
ment
Centr
es3.2
.2 A
Natio
nal R
eport
is p
roduc
ed
on m
onito
ring
the im
pleme
ntatio
n of
Teac
her
Deve
lopme
nt Pr
ogram
mes
by P
EDs w
ith sp
ecial
focu
s on E
FAL,
Mathe
matic
s, Ph
ysica
l Scie
nce
and
Acco
untin
g
--
--
Appro
ved N
ation
al Re
port o
n mon
itorin
g the
imple
menta
tion o
f Te
ache
r Dev
elopm
ent
Prog
ramme
s by P
EDs
with
spec
ial fo
cus o
n EF
AL, M
athem
atics
, Ph
ysica
l Scie
nce a
nd
Acco
untin
g
Appro
ved N
ation
al Re
port o
n mon
itorin
g the
imple
menta
tion o
f Te
ache
r Dev
elopm
ent
Prog
ramme
s by P
EDs
with
spec
ial fo
cus o
n EF
AL, M
athem
atics
, Ph
ysica
l Scie
nce a
nd
Acco
untin
g
Appro
ved N
ation
al Re
port o
n mon
itorin
g the
imple
menta
tion o
f Te
ache
r Dev
elopm
ent
Prog
ramme
s by P
EDs
with
spec
ial fo
cus o
n EF
AL, M
athem
atics
, Ph
ysica
l Scie
nce a
nd
Acco
untin
g3.2
.3 Nu
mber
of PE
Ds t
hat
had
their
post
provis
ioning
pro
cess
es
asse
ssed
for c
ompli
ance
with
the p
ost
provis
ioning
norm
s and
stan
dards
Monit
oring
visit
s co
nclud
ed in
all n
ine
PEDs
durin
g Feb
ruary
and M
arch 2
017
Nine
PED
s mo
nitore
dAll
nine
PED
s mo
nitore
d9
99
9
3.2.4
An A
nnua
l Se
ctor
Repo
rt is
produ
ced
on th
e nu
mber
of Gr
ade
R pra
ctitio
ners
with
at lea
st an
NQF
leve
l 6 a
nd ab
ove q
ualifi
catio
n
--
--
Appro
ved A
nnua
l Se
ctor R
eport
on th
e nu
mber
of Gr
ade R
pra
ctitio
ners
with
at lea
st an
NQF
leve
l 6
and a
bove
quali
ficati
on
Appro
ved A
nnua
l Se
ctor R
eport
on th
e nu
mber
of Gr
ade R
pra
ctitio
ners
with
at lea
st an
NQF
leve
l 6
and a
bove
quali
ficati
on
Appro
ved A
nnua
l Se
ctor R
eport
on th
e nu
mber
of Gr
ade R
pra
ctitio
ners
with
at lea
st an
NQF
leve
l 6
and a
bove
quali
ficati
onOu
tcome
5:
Cond
uct s
trateg
ic int
erven
tions
to
assis
t and
de
velop
prov
incial
ed
ucati
on
syste
ms
Strat
egic
use
and m
onito
ring
of pro
vince
s to
adva
nce n
ation
al pri
oritie
s, as
well
as
addit
ional
interv
entio
ns in
all
or sp
ecific
prov
-inc
es to
adva
nce
the at
tainm
ent o
f se
ctor-w
ide go
als
3.3.1
Numb
er of
PEDs
mon
itored
on
the In
tegrat
ed Q
uality
Man
agem
ent
Syste
m (IQ
MS)
Monit
ored 1
8 sch
ools
in 6 P
EDs
6 PED
s mon
itored
6 PED
s mo
nitore
d6
99
9
3.3.2
Numb
er of
PEDs
mon
itored
on
the im
pleme
ntatio
n of
the E
duca
tion
Mana
geme
nt Se
rvice
: Pe
rform
ance
Ma
nage
ment
and
Deve
lopme
nt Sy
stem
(EMS
: PMD
S)
6 PED
s mon
itored
6 PED
s mon
itored
66
99
9

60
5.3.
2 In
dica
tors
, Ann
ual a
nd Q
uart
erly
Tar
gets
Tabl
e 17
: Pro
gram
me
3: In
dica
tors
, Ann
ual a
nd Q
uart
erly
Tar
gets
Outp
ut In
dica
tors
Repo
rting
Cy
cleAn
nual
Targ
etQ1
Q2Q3
Q4
3.1.1
Perce
ntage
of S
choo
l Gov
ernin
g Bod
ies (S
GBs)
that m
eet th
e mini
mum
criter
ia in
terms
of ef
fectiv
enes
sAn
nuall
y90
% of
1 00
0 sam
pled s
choo
ls0
00
90%
of 1
000 s
ample
d sch
ools
3.1.2
Perce
ntage
of s
choo
ls pr
oduc
ing th
e mi
nimum
set
of ma
nage
ment
docu
ments
at a
requ
ired s
tanda
rdAn
nuall
y10
0% of
1 00
0 sam
pled s
choo
ls0
00
100%
of 1
000 s
ample
d sch
ools
3.1.3
Numb
er o
f Fun
za L
usha
ka b
ursa
ries a
ward
ed to
stud
ents
enro
lled
for
Initia
l Tea
cher
Edu
catio
nAn
nuall
y12
500
00
012
500
3.1.4
Numb
er o
f qua
rterly
mon
itorin
g re
ports
trac
king
the p
erce
ntage
of
Funz
a Lu
shak
a gr
adua
tes p
laced
with
in six
mon
ths u
pon
confi
rmati
on th
at the
bursa
r has
comp
leted
stud
ies
Quar
terly
41
11
1
3.1.5
Numb
er o
f qua
rterly
mon
itorin
g re
ports
indic
ating
the
numb
er a
nd
perce
ntage
of sc
hools
whe
re al
locate
d tea
ching
posts
are a
ll fille
dQu
arter
ly4
11
11
3.1.6
An A
nnua
l Sec
tor R
epor
t is
prod
uced
on
the n
umbe
r of
quali
fied
teach
ers a
ged 3
0 and
below
enter
ing th
e pub
lic se
rvice
as te
ache
rsAn
nuall
yAp
prov
ed A
nnua
l Sec
tor R
epor
t on
the n
umbe
r of
quali
fied
teach
ers
aged
30
and
below
ente
ring
the
publi
c ser
vice a
s tea
cher
s
00
0Ap
prov
ed A
nnua
l Sec
tor R
epor
t on
the n
umbe
r of
quali
fied
teach
ers
aged
30
and
below
ente
ring
the
publi
c ser
vice a
s tea
cher
s3.2
.1 A
Natio
nal R
epor
t is
prod
uced
on
monit
oring
the
fun
ction
ality
of Pr
ovinc
ial Te
ache
r Dev
elopm
ent In
stitut
es an
d Dist
rict T
each
er D
evelo
pmen
t Ce
ntres
Annu
ally
Appr
oved
Na
tiona
l Re
port
on
monit
oring
the
fun
ction
ality
of Pr
ovinc
ial
Teac
her
Deve
lopme
nt Ins
titutes
and D
istric
t Tea
cher
Dev
elopm
ent C
entre
s
00
0Ap
prov
ed
Natio
nal
Repo
rt on
mo
nitor
ing
the
functi
onali
ty of
Prov
incial
Te
ache
r De
velop
ment
Institu
tes an
d Dist
rict T
each
er D
evelo
pmen
t Cen
tres
3.2.2
A Na
tiona
l Rep
ort i
s pr
oduc
ed o
n mo
nitor
ing th
e im
pleme
ntatio
n of
Teac
her D
evelo
pmen
t Pro
gram
mes
by P
EDs
with
spec
ial fo
cus
on E
FAL,
Mathe
matic
s, Ph
ysica
l Scie
nce a
nd A
ccou
nting
Annu
ally
Appr
oved
Na
tiona
l Re
port
on
monit
oring
the
im
pleme
ntatio
n of T
each
er D
evelo
pmen
t Pro
gram
mes
by P
EDs
with
spec
ial fo
cus
on E
FAL,
Mathe
matic
s, Ph
ysica
l Scie
nce a
nd A
ccou
nting
00
0Ap
prov
ed
Natio
nal
Repo
rt on
mo
nitor
ing
the
imple
menta
tion o
f Tea
cher
Dev
elopm
ent P
rogr
amme
s by
PED
s wi
th sp
ecial
focu
s on
EFA
L, Ma
thema
tics,
Phys
ical S
cienc
e and
Acc
ounti
ng3.2
.3 Nu
mber
of P
EDs t
hat h
ad th
eir p
ost p
rovis
ioning
pro
cess
es a
sses
sed
for co
mplia
nce w
ith th
e pos
t pro
vision
ing no
rms a
nd st
anda
rds
Annu
ally
90
00
9
3.2.4
An A
nnua
l Sec
tor R
epor
t is
prod
uced
on
the n
umbe
r of
Grad
e R
prac
tition
ers w
ith at
leas
t an N
QF le
vel 6
and a
bove
quali
ficati
onAn
nuall
yAp
prov
ed A
nnua
l Sec
tor R
epor
t on t
he nu
mber
of
Grad
e R pr
actiti
oner
s with
at le
ast a
n NQF
leve
l 6
and a
bove
quali
ficati
on
00
0Ap
prov
ed A
nnua
l Sec
tor R
epor
t on
the n
umbe
r of
Grad
e R pr
actiti
oner
s with
at le
ast a
n NQF
leve
l 6 an
d ab
ove q
ualifi
catio
n3.3
.1 Nu
mber
of P
EDs
monit
ored
on
the In
tegra
ted Q
uality
Man
agem
ent
Syste
m (IQ
MS)
Annu
ally
90
00
9
3.3.2
Numb
er o
f PED
s mo
nitor
ed o
n the
imple
menta
tion
of the
Edu
catio
n Ma
nage
ment
Servi
ce: P
erfor
manc
e Ma
nage
ment
and
Deve
lopme
nt Sy
stem
(EMS
: PMD
S)
Annu
ally
90
00
9

61
5.3.3 Explanation of planned performance over the medium-term period
The Teachers, Education Human Resources and Institutional Development Programme will focus on the following deliverables during the 2020/21 financial year:
• Teacher recruitment, placement, deployment and utilisation.
o Monitor the implementation of the post provisioning norms focusing on compliance with policy;
o Monitor and support the placement of Funza Lushaka bursary graduates in posts at schools;
o Monitor the filling of vacant substantive educator posts at schools and the filling of promotional posts;
o Monitor the rate of placement of young and qualified educators; and
o Strengthening the placement processes of Funza Lushaka graduates in all provinces.
• Monitor functionality of Provincial Teachers Development Institutes (PTDIs) and District Teacher Development Centres (DTDCs).
o Development of monitoring tools;
o Yearly monitoring programme;
o Collection of PTDIs and DTDCs completed monitoring tools;
o PEDs reports; and
o Development of a National Annual Report on the functionality of PTDIs and DTDCs.
• Monitor the implementation of Teacher Development Programmes by PEDs with special focus on EFAL, Mathematics, Physical Sciences and Accounting.
o Development of monitoring tools;
o Yearly monitoring programme;
o Monitor the implementation of programmes;
o Collection of nine PEDs NSLA quarterly reports; and
o Development of a National Annual Report on implementation of Teacher Development Programmes by PEDs.
The implementation of the Post Provisioning Norms has been identified as a critical component of ensuring that posts are equitably distributed to schools. A great deal of work has been done in relation to the review of the Post Provisioning model. Some inconsistencies in the manner the post provisioning policy is being implemented were noticed. The monitoring process in the next financial year is a continuation of a process that has been started to strengthen the implementation of post provisioning norms. Compliance with the policy requires unbiased attention.
The NDP commends the Funza Lushaka Bursary Programme (FLBP) as a strategy to attract learners into the teaching profession. The FLBP contributes to the supply of teachers in the targeted subject areas. Furthermore, the NDP enjoins both the DBE and PEDs to ensure that Funza Lushaka graduates are immediately absorbed into teaching posts once they complete their studies. This will ensure a constant supply of teachers in the areas of need across provinces. There is a need to monitor the process of the graduates’ deployment in provinces and provide support where necessary.
The filling of posts in schools is critical in the sector. Teaching and learning are reliant, in part, on the availability of teachers in the classroom. High levels of vacancy rates compromise the quality of learning and teaching. In order for the sector to achieve set learning outcomes, vacant substantive posts, including promotional posts, should be filled with qualified personnel and low levels of vacancy rates thereby maintained. It is, therefore, necessary to keep the filling of vacancies on the radar. The NDP pronounced a need to improve performance in international comparative studies. Ensuring that substantive vacancies are filled will contribute to addressing this need.
The educator human resources trends point to the indisputable reality of an ageing teacher workforce. In response, a constant supply of qualified young graduates to replenish the educator workforce is required. Continuous monitoring of the placement of young graduates has been identified as a yardstick to gauge the sectors’ efforts to ensure the supply of young teachers. This is intended to give direction to the sector on the necessary initiatives to embark on in relation to the recruitment of young qualified educators. Furthermore, the NDP encourages the sector to produce more and better-qualified teachers in areas such as Foundation Phase and ECD where there are shortages, but also to reduce the large class sizes which impact on learner performance.

62
Although there are gains in the process of placing of Funza Lushaka graduates, the DPME implementation evaluation of the Funza Lushaka Bursary Programme points to a need to improve the placement processes in all provinces to ensure that all graduates funded through the FLBP are immediately absorbed in the sector.
Over the medium term, the Department aims to improve the supply of newly qualified teachers by providing 37 500 Funza Lushaka bursaries to prospective teachers in priority subject areas such as Mathematics, Science and technology. A total of R 3,6 billion has been allocated over the medium term for this.
5.3.4 Programme Resource Considerations
Increasing the supply of quality teachers
There is sufficient evidence to suggest that the sector has done considerably well with regards to improving the professional grounding teachers’ need for effective teaching through Initial Teacher Education (ITE). These gains are a combination of efforts in collaboration with DHET to improve teacher pre-service training, and the Funza Lushaka Bursary has largely contributed to this.
The Department aims to increase the supply of newly qualified teachers in Mathematics, Science, and technology in different phases by providing 37 500 Funza Lushaka bursaries to prospective teachers over the medium term. The Department will approve first, second and fourth-year students, as well as Postgraduate Certificate in Education students, enrolled for Initial Teacher Education. The number of bursary awards is set to be maintained at 12 500 over the MTEF, providing general increases in university costs do not exceed this allocation’s average annual growth of approximately 5% over the MTEF period. While some Funza Lushaka bursary recipients qualify for fee-free funding at universities, the Department expects the demand for Funza Lushaka bursaries to remain unchanged. R4,1 billion over the MTEF period is allocated in the Education Human Resources Development sub-programme in the Teachers, Education Human Resources and Institutional Development programme for the NSFAS to administer as bursaries.

63
Budget allocation for programme and sub-programmes as per the ENE.
Table 18: Programme 3: Performance targets with the Budget and MTEF Expenditure estimates
Sub-ProgrammeAudited Outcomes R’000
Adjusted appropriation
R’000
Medium-term expenditure estimateR’000
2016/17 2017/18 2018/19 2019/20 2020/21 2021/22 2022/23
Programme Management: Teachers, Education Human Resources and Institutional Development
2 428 1 569 2 001 1 973 1 977 2 248 2 336
Education Human Resources Management 75 790 61 116 54 456 62 926 63 495 73 541 75 778
Education Human Resources Development 1 089 931 1 170 153 1 226 237 1 286 747 1 337 702 1 424 342 1 493 161
Curriculum and Professional Development Unit
9 248 10 985 14 917 17 242 14 174 16 809 17 995
Total 1 177 397 1 243 823 1 297 611 1 368 888 1 417 348 1 516 940 1 589 270
Economic classification
Current payments 112 298 121 197 109 676 107 661 95 070 116 776 123 447
Compensation of employees 71 411 65 189 63 760 75 246 79 144 83 463 88 889
Goods and services: 40 887 56 008 45 916 32 415 15 926 33 313 34 558
Communication (G&S) 4 465 245 314 457 600 633 657
Consultants and special services: business and advisory services
- 230 316 - - 1 -
Consumables: stationery, printing and office supplies
575 937 518 1 207 1 001 1 161 1 205
Travel and subsistence 19 756 14 774 17 069 17 862 10 321 19 545 20 369
Other 16 091 39 822 27 699 12 889 4 004 11 973 12 327
Transfers and subsidies 1 064 685 1 122 129 1 187 532 1 260 766 1 321 855 1 399 718 1 465 353
Provinces and Municipalities - - - - - -
Departmental agencies and accounts 5 000 9 743 16 000 20 000 13 000 18 876 19 687
Foreign government 15 717 14 757 11 570 16 445 17 249 18 198 18 875
Non-profit institutions - - - - - - -
Households 1 043 968 1 097 629 1 159 962 1 224 321 1 291 606 1 362 644 1 426 791
Payments for capital assets 223 438 361 401 423 446 470
Machinery and equipment 223 438 361 401 423 446 470
Payments for financial assets 191 59 42 60 - - -
Total 1 177 397 1 243 823 1 297 611 1 368 888 1 417 348 1 516 940 1 589 270

64
Sub-ProgrammeAudited Outcomes
R’000
Adjusted appropriation
R’000
Medium-term expenditure estimate R’000
2016/17 2017/18 2018/19 2019/20 2020/21 2021/22 2022/23
Details of selected transfers and subsidies
Current -
Transfers 1 064 685 1 122 129 1 187 532 1 260 766 1 326 593 1 399 718 1 465 353
Departmental agencies and accounts (SACE) 5 000 9 743 16 000 20 000 17 738 18 876 19 687
Foreign government
United Nations Educational, Scientific and Cultural Organisation
15 587 14 638 11 429 16 295 17 091 18 031 18 702
Association for the Development of Education in Africa
130 119 141 150 158 167 173
Current: Households
National Student Financial Aid Scheme 1 043 611 1 095 792 1 159 348 1 224 271 1 291 606 1 362 644 1 426 791
Households 357 1 837 614 50 - - -
5.4 Programme 4: Planning, Information and Assessment
Programme Purpose: To promote quality and effective service delivery in the basic education system through planning, implementation and assessment.
Sub-programmes: Programme Management: National Assessment and Public Examinations; School Infrastructure; National Education Evaluation and Development Unit; and the Planning and Delivery Oversight Unit.
Action Plan Goals on Physical, Financial Planning and District Support
Goal 23 ► Ensure that all schools are funded at least at the minimum per learner levels determined nationally and that funds are utilised transparently and effectively.
Goal 24 ► Ensure that the physical infrastructure and environment of every school inspire learners to want to come to school and learn, and teachers to come and teach.
Goal 27 ► Improve the frequency and quality of the monitoring and support provided to schools by district offices, partly through better use of e-Education.

65
5.4.
1 O
utco
mes
, Out
puts
, Per
form
ance
Indi
cato
rs a
nd T
arge
ts
Tabl
e 19
: Pro
gram
me
4: O
utco
mes
, Out
puts
, Per
form
ance
Indi
cato
rs a
nd T
arge
ts
Outc
ome
Outp
uts
Outp
utIn
dica
tors
Annu
al Ta
rget
s
Audi
ted
/Act
ual
Perfo
rman
ceEs
timat
edPe
rform
ance
MTEF
Per
iod
2016
/1720
17/18
2018
/1920
19/20
2020
/2120
21/22
2022
/23
Outco
me 1:
Ma
intain
and
deve
lop th
e sy
stem
of po
licies
, inc
luding
the
curric
ulum
and
asse
ssme
nt,
gove
rning
the
basic
educ
ation
se
ctor to
adva
nce
a qua
lity an
d inc
lusive
, safe
an
d hea
lthy b
asic
educ
ation
syste
m
Ensu
re th
at po
licies
and t
he
infra
struc
ture
evolv
e to d
eal
with
emer
ging
prior
ities,
includ
ing
those
relat
ing to
ba
sic se
rvice
s and
the
repla
ceme
nt of
inapp
ropr
iate
struc
tures
4.1.1
Numb
er of
new
scho
ols
built
and c
omple
ted th
roug
h AS
IDI
16 in
2016
/17
179 i
n tota
l12
scho
ols w
ere
reco
rded
as co
mplet
ed
in 20
17/18
2140
2429
30
4.1.2
Numb
er of
scho
ols
prov
ided w
ith sa
nitati
on fa
cilitie
s thr
ough
ASI
DI
9 in 2
016/1
7 42
5 in t
otal
29 pr
actic
al co
mplet
ion
certifi
cates
wer
e re
ceive
d in 2
017/1
8
200
717
600
1 500
1 500
4.1.3
Numb
er of
scho
ols
prov
ided w
ith w
ater fa
cilitie
s thr
ough
ASI
DI
10 in
2016
/17
615 i
n tota
l43
prac
tical
comp
letion
ce
rtifica
tes w
ere
rece
ived i
n 201
7/18
199
225
100
--
4.1.4
Numb
er of
scho
ols se
rved
with
emer
genc
y wate
r sup
ply-
--
-3 0
00-
-
4.1.5
Numb
er of
scho
ols se
rved
with
emer
genc
y san
itatio
n-
--
-1 3
00-
-
Outco
me
2: Ma
intain
an
d dev
elop
infor
matio
n and
oth
er sy
stems
wh
ich en
able
trans
forma
tion
and a
n effic
ient
and a
ccou
ntable
se
ctor
Ensu
re th
at mo
nitor
ing
syste
ms su
ch
as S
A-SA
MS,
asse
ssme
nt an
d ex
amina
tion
syste
ms ev
olve
to de
al wi
th an
d su
ppor
t eme
rging
pr
ioritie
s, in
partic
ular th
ose
relat
ing to
scho
ol co
mplet
ion,
learn
ing
outco
mes a
nd th
e ac
coun
tabilit
y of
scho
ols
4.2.1
Numb
er of
Gen
eral
Educ
ation
and T
raini
ng
(GET
) test
items
deve
loped
in
Lang
uage
and M
athem
atics
for
Grad
es 3,
6 an
d 9
701 i
tems w
ere
deve
loped
for b
oth
Lang
uage
and
Mathe
matic
s for
Gr
ades
3, 6
and 9
3 485
test
items
de
velop
ed32
825
050
050
050
0
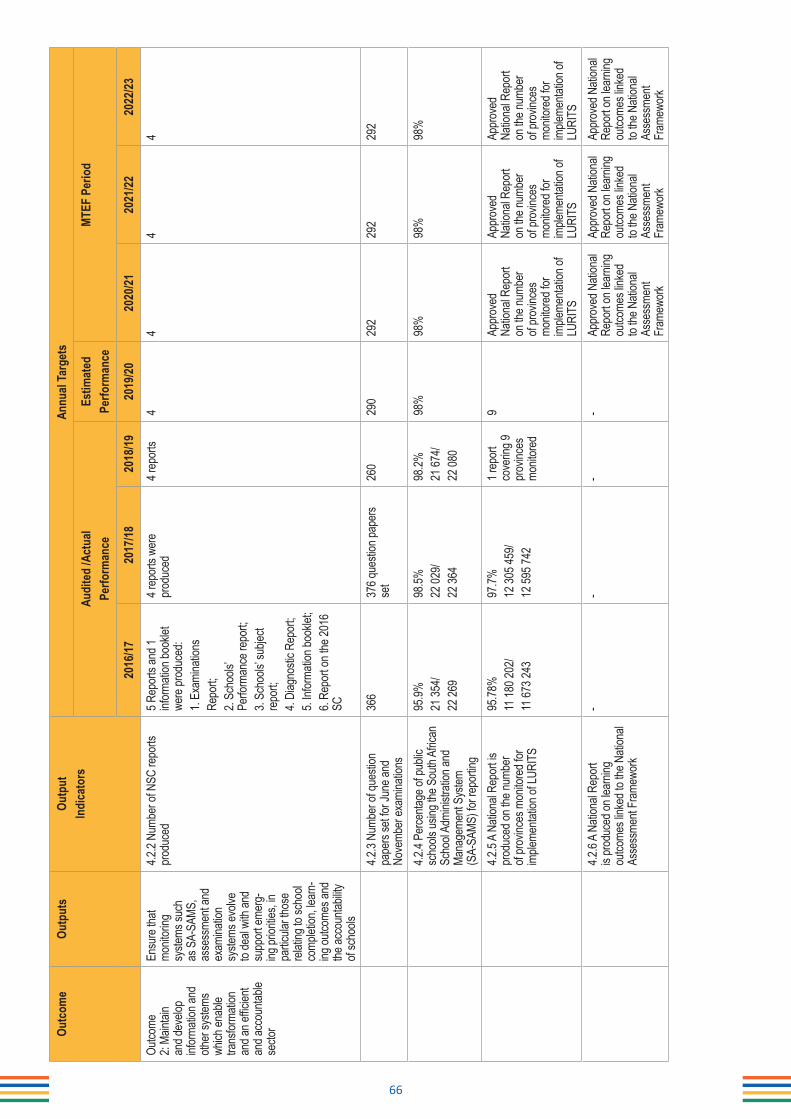
66
Outc
ome
Outp
uts
Outp
utIn
dica
tors
Annu
al Ta
rget
s
Audi
ted
/Act
ual
Perfo
rman
ceEs
timat
edPe
rform
ance
MTEF
Per
iod
2016
/1720
17/18
2018
/1920
19/20
2020
/2120
21/22
2022
/23
Outco
me
2: Ma
intain
an
d dev
elop
infor
matio
n and
oth
er sy
stems
wh
ich en
able
trans
forma
tion
and a
n effic
ient
and a
ccou
ntable
se
ctor
Ensu
re th
at mo
nitor
ing
syste
ms su
ch
as S
A-SA
MS,
asse
ssme
nt an
d ex
amina
tion
syste
ms ev
olve
to de
al wi
th an
d su
ppor
t eme
rg-
ing pr
ioritie
s, in
partic
ular th
ose
relat
ing to
scho
ol co
mplet
ion, le
arn-
ing ou
tcome
s and
the
acco
untab
ility
of sc
hools
4.2.2
Numb
er of
NSC
repo
rts
prod
uced
5 Rep
orts
and 1
inf
orma
tion b
ookle
t we
re pr
oduc
ed:
1. Ex
amina
tions
Repo
rt;2.
Scho
ols’
Perfo
rman
ce re
port;
3. Sc
hools
’ sub
ject
repo
rt;4.
Diag
nosti
c Rep
ort;
5. Inf
orma
tion b
ookle
t;6.
Repo
rt on t
he 20
16
SC
4 rep
orts
were
pr
oduc
ed4 r
epor
ts4
44
4
4.2.3
Numb
er of
ques
tion
pape
rs se
t for J
une a
nd
Nove
mber
exam
inatio
ns
366
376 q
uesti
on pa
pers
set
260
290
292
292
292
4.2.4
Perce
ntage
of pu
blic
scho
ols us
ing th
e Sou
th Af
rican
Sc
hool
Admi
nistra
tion a
nd
Mana
geme
nt Sy
stem
(S
A-SA
MS) fo
r rep
ortin
g
95.9%
21 35
4/22
269
98.5%
22 02
9/22
364
98.2%
21 67
4/22
080
98%
98%
98%
98%
4.2.5
A Na
tiona
l Rep
ort is
pr
oduc
ed on
the n
umbe
r of
prov
inces
mon
itore
d for
im
pleme
ntatio
n of L
URIT
S
95.78
%11
180 2
02/
11 67
3 243
97.7%
12 30
5 459
/12
595 7
42
1 rep
ort
cove
ring 9
pr
ovinc
es
monit
ored
9Ap
prov
ed
Natio
nal R
epor
t on
the n
umbe
r of
prov
inces
mo
nitor
ed fo
r im
pleme
ntatio
n of
LURI
TS
Appr
oved
Na
tiona
l Rep
ort
on th
e num
ber
of pr
ovinc
es
monit
ored
for
imple
menta
tion o
f LU
RITS
Appr
oved
Na
tiona
l Rep
ort
on th
e num
ber
of pr
ovinc
es
monit
ored
for
imple
menta
tion o
f LU
RITS
4.2.6
A Na
tiona
l Rep
ort
is pr
oduc
ed on
lear
ning
outco
mes l
inked
to th
e Nati
onal
Asse
ssme
nt Fr
amew
ork
--
--
Appr
oved
Nati
onal
Repo
rt on l
earn
ing
outco
mes l
inked
to
the N
ation
al As
sess
ment
Fram
ewor
k
Appr
oved
Nati
onal
Repo
rt on l
earn
ing
outco
mes l
inked
to
the N
ation
al As
sess
ment
Fram
ewor
k
Appr
oved
Nati
onal
Repo
rt on l
earn
ing
outco
mes l
inked
to
the N
ation
al As
sess
ment
Fram
ewor
k

67
Outc
ome
Outp
uts
Outp
utIn
dica
tors
Annu
al Ta
rget
s
Audi
ted
/Act
ual
Perfo
rman
ceEs
timat
edPe
rform
ance
MTEF
Per
iod
2016
/1720
17/18
2018
/1920
19/20
2020
/2120
21/22
2022
/23
4.2.7
A Na
tiona
l Rep
ort is
pr
oduc
ed on
deve
loping
and
oper
ation
alisin
g a sc
hool
read
iness
asse
ssme
nt sy
stem
--
--
Appr
oved
Nati
onal
Repo
rt on
deve
loping
and
oper
ation
alisin
g a
scho
ol re
adine
ss
asse
ssme
nt sy
stem
Appr
oved
Nati
onal
Repo
rt on
deve
loping
and
oper
ation
alisin
g a
scho
ol re
adine
ss
asse
ssme
nt sy
stem
Appr
oved
Nati
onal
Repo
rt on
deve
loping
and
oper
ation
alisin
g a
scho
ol re
adine
ss
asse
ssme
nt sy
stem
Outco
me 5:
Co
nduc
t stra
tegic
inter
venti
ons
to as
sist a
nd
deve
lop pr
ovinc
ial
educ
ation
syste
ms
Stra
tegic
use
and m
onito
ring
of dis
tricts
to ad
vanc
e nati
onal
prior
ities,
as w
ell
as ad
dition
al int
erve
ntion
s in a
ll or
spec
ific di
strict
s to
adva
nce t
he
attain
ment
of se
ctor-w
ide
goal
in re
lation
to
mento
rship,
de
velop
ment
and
supp
ort o
f offic
ials
at dis
trict le
vel
4.3.1
Numb
er of
offic
ials f
rom
distric
ts tha
t ach
ieved
below
the
natio
nal b
ench
mark
in the
NSC
pa
rticipa
ting i
n a m
entor
ing
prog
ramm
e
3652
7630
3360
60
4.3.2
Perce
ntage
of sc
hool
princ
ipals
ratin
g the
supp
ort
servi
ces o
f dist
ricts
as be
ing
satis
factor
y
72%
511/7
08An
Impr
ovem
ent p
lan
has b
een d
evelo
ped
75%
56
0/747
075
%0
80%
4.3.3
Perce
ntage
of D
istric
t Di
recto
rs tha
t hav
e und
ergo
ne
comp
etenc
y ass
essm
ent p
rior
to the
ir app
ointm
ent
74%
52/70
80%
4/510
0% 13
/1390
%95
%96
%97
%
4.3.4
Perce
ntage
of
unde
rper
formi
ng sc
hools
mo
nitor
ed at
leas
t twice
a ye
ar
by di
strict
offic
ials f
or su
ppor
t pu
rpos
es
--
-60
%75
%80
%85
%
4.3.5
Numb
er of
Dist
rict D
irecto
r for
ums h
eld-
--
-3
33
4.3.6.
Num
ber o
f dist
ricts
in wh
ich te
ache
r dev
elopm
ent h
as
been
cond
ucted
as pe
r dist
rict
impr
ovem
ent p
lan
--
--
5560
65

68
5.4.
2 In
dica
tors
, Ann
ual a
nd Q
uart
erly
Tar
gets
Tabl
e 20
: Pro
gram
me
4: In
dica
tors
, Ann
ual a
nd Q
uart
erly
Tar
gets
Outp
ut In
dica
tors
Repo
rting
Cy
cleAn
nual
Targ
etQ1
Q2Q3
Q4
4.1.1
Numb
er of
new
scho
ols bu
ilt an
d com
pleted
thro
ugh A
SIDI
Annu
ally
240
00
244.1
.2 Nu
mber
of sc
hools
prov
ided w
ith sa
nitati
on fa
cilitie
s thr
ough
ASI
DIAn
nuall
y60
00
00
600
4.1.3
Numb
er of
scho
ols pr
ovide
d with
wate
r fac
ilities
thro
ugh A
SIDI
Annu
ally
100
00
010
04.1
.4 Nu
mber
of sc
hools
serve
d with
emer
genc
y wate
r sup
plyAn
nuall
y3 0
000
00
3 000
4.1.5
Numb
er of
scho
ols se
rved w
ith em
erge
ncy s
anita
tion
Annu
ally
1 300
00
01 3
004.2
.1 Nu
mber
of G
ener
al Ed
ucati
on an
d Tra
ining
(GET
) tes
t item
s dev
elope
d in L
angu
age a
nd
Mathe
matic
s for
Gra
des 3
, 6 an
d 9An
nuall
y50
00
00
500
4.2.2
Numb
er of
NSC
repo
rts pr
oduc
edAn
nuall
y4
00
04
4.2.3
Numb
er of
ques
tion p
aper
s set
for Ju
ne an
d Nov
embe
r exa
mina
tions
Annu
ally
292
00
029
24.2
.4 Pe
rcenta
ge of
publi
c sch
ools
using
the S
outh
Afric
an S
choo
l Adm
inistr
ation
and
Mana
geme
nt Sy
stem
(SA-
SAMS
) for
repo
rting.
Annu
ally
98%
00
098
%
4.2.5
A Na
tiona
l Rep
ort is
prod
uced
on th
e num
ber o
f pro
vince
s mon
itore
d for
imple
menta
tion o
f LU
RITS
Annu
ally
Appr
oved
Na
tiona
l Re
port
on
the
numb
er o
f pr
ovinc
es m
onito
red
for
imple
menta
tion o
f LUR
ITS
00
0Ap
prov
ed
Natio
nal
Repo
rt on
the
nu
mber
of
prov
inces
mon
itore
d for
im
pleme
ntatio
n of L
URIT
S4.2
.6 A
Natio
nal R
epor
t is pr
oduc
ed on
lear
ning o
utcom
es lin
ked t
o the
Nati
onal
Asse
ssme
nt Fr
amew
ork
Annu
ally
Appr
oved
Nati
onal
Repo
rt on
lear
ning
outco
mes
linke
d to
the
Natio
nal
Asse
ssme
nt Fr
amew
ork
00
0Ap
prov
ed N
ation
al Re
port
on le
arnin
g ou
tcome
s lin
ked
to the
Na
tiona
l As
sess
ment
Fram
ewor
k4.2
.7 A
Natio
nal R
epor
t is pr
oduc
ed on
deve
loping
and o
pera
tiona
lising
a sc
hool
read
iness
as
sess
ment
syste
mAn
nuall
yA
Natio
nal
Repo
rt is
prod
uced
on
deve
loping
an
d op
erati
onali
sing
a sc
hool
read
iness
asse
ssme
nt sy
stem
00
0A
Natio
nal
Repo
rt is
prod
uced
on
deve
loping
an
d op
erati
onali
sing
a sc
hool
read
iness
asse
ssme
nt sy
stem
4.3.1
Numb
er of
offic
ials f
rom
distric
ts tha
t ach
ieved
below
the n
ation
al be
nchm
ark i
n the
NSC
pa
rticipa
ting i
n a m
entor
ing pr
ogra
mme
Annu
ally
330
00
33
4.3.2
Perce
ntage
of sc
hool
princ
ipals
ratin
g the
supp
ort s
ervic
es of
distr
icts a
s bein
g sati
sfacto
ryBi
ennia
lly75
%0
00
75%
4.3.3
Perce
ntage
of D
istric
t Dire
ctors
that h
ave u
nder
gone
comp
etenc
y ass
essm
ent p
rior t
o the
ir ap
point
ment
Annu
ally
95%
00
095
%
4.3.4
Perce
ntage
of un
derp
erfor
ming
scho
ols m
onito
red a
t leas
t twice
a ye
ar by
distr
ict of
ficial
s for
supp
ort p
urpo
ses
Annu
ally
75%
00
075
%
4.3.5
Numb
er of
Dist
rict D
irecto
r for
ums h
eldAn
nuall
y3
00
03
4.3.6
Numb
er of
distr
icts i
n whic
h tea
cher
deve
lopme
nt ha
s bee
n con
ducte
d as p
er di
strict
im
prov
emen
t plan
Annu
ally
550
00
55

69
5.4.3 Explanation of planned performance over the medium-term period
The Planning, Information and Assessment Programme will focus on the following deliverables during the 2020/21 financial year:
Examinations and Assessment
National Assessment
The National Assessment provides the education sector with reliable data on learner performance through high-quality national assessments at key transitional grades at regular intervals in the General Education and Training (GET) band, in selected subjects. The Department achieves its mandate by successfully conducting systemic assessments designed for measuring progress on defined learning outcomes in the South African context and in relation to international trends. The Department utilises data from its national and international systemic assessments to further design diagnostic and summative assessment tools that will enable teachers to improve the quality of their School-Based Assessment. A key indicator for the Department is the number of language and Mathematics test items developed in a year, so that high-quality assessment tools required for systemic, diagnostic and summative purposes may be developed with high quality and precision.
A Systemic Evaluation takes place on a three-year cycle in Grades 3, 6, and 9. The first cycle commenced in 2018 and will end in 2020. Over this three-year period, the evaluation cycle involved test development, questionnaire development, field testing of instruments and processes, refinement, training, administration, analysis, verification and report writing. Cost drivers attached to these processes (e.g. work done by service providers) are scaled according to phases and proportional payments are made almost on a quarterly period. Linked to the roll-out of systemic evaluations is a commitment by the DBE to participate in international assessments (TIMSS, PIRLS, SEACMEQ and TALIS11). These international programmes have an implementation cycle of 4–5 years and within this cycle, payments are made towards annual participation subscriptions and the project work done by research institutions, e.g. Human Sciences Research Council (HSRC).
A diagnostic assessment programme comprises assessment tools, manuals, digital applications, exemplar tests and test items supplied to support and strengthen teachers’ classroom assessments. The cost drivers in this exercise are the costs of the experts who developed these materials and the cost of packaging and distributing these materials to the PEDs.
A summative assessment programme comprising the setting and processing of end-of-year examinations in selected grades and subjects, and providing electronic applications (e.g. Teacher Assessment Resources for Monitoring and Improving Instruction, or TARMII) to support teachers in accessing high-quality test items and generating tests. The cost drivers for this exercise involve the development of examination papers, examination guidelines on conduct and administration and the synchronisation of ICT systems to support and process results.
District Planning and Provincial Monitoring
Outcome 5: Conduct strategic interventions to assist and develop provincial education systems.
The NDP envisions education districts that have the capacity to provide targeted support to improve practices within schools and between schools and authorities. Many of the weaknesses in schools are a reflection of weaknesses at the district level. The NDP further enjoins us to “deploy multi-disciplinary support teams to work with districts in the short to medium term (NDP, p.310)”.
The Action Plan to 2019 Towards the Realisation of Schooling 2030 requires improvement of the frequency and quality of monitoring and support services provided to schools by district offices.
The Education Medium Term Strategic Framework (MTSF) strategic approach aims for policy and implementation stability through strengthening key interventions. The MTSF specifies a focus on “strengthening accountability and improving management at the school, community and district level” along with “tracking of learner performance through reporting and analysis to ensure appropriate feedback to learners and teachers and to benchmark performance over time”.
Education districts present an opportunity to improve the quality of learning outcomes for all learners in the system. They play a central role in ensuring that all learners have access to education of progressively higher quality. This can be achieved through the impact and contribution of the output indicator: Number of officials from districts that achieved below the national benchmark in the NSC participating in a mentoring programme.

70
This indicator seeks to improve learner performance and the quality of NSC passes through a focused mentoring programme for district and circuit managers. The proposed mentoring programme will:
• Provide holistic support to district directors and selected circuit managers and their teams to improve educational outcomes at all levels of the system;
• Complement other management development strategies currently used by the PEDs to support education districts; and
• Serve as a pilot for the mentoring of district directors and circuit managers across the system.
District support to schools is critical because district and circuit offices are often the major, and sometimes the only, source of external assistance and support received by schools. District and circuit offices, therefore, present themselves as a key vehicle for initiating, testing, driving and sustaining systemic reforms.
According to the directive of the Department of Public Service and Administration, it is mandatory that all Senior Management Services (SMS) members appointed from 1 April 2015 undergo competency-based assessment. The district directors, therefore, have to undergo competency assessment to ensure that they possess the requisite skills and knowledge for the job. This also assists with the identification of areas that require development.
Minister’s meetings with district directors provide a strategic forum that affords the Minister and the Department the opportunity to interact closely with district directors. The main purpose of the meetings is to share best practices and improve learner performance in the entire system.
5.4.4 Programme Resource Considerations
Monitoring performance
An important goal of the DBE is to have a robust national assessment system to track learner achievement and system performance against goals set out in the NDP, the Action Plan to 2024: Towards the Realisation of Schooling 2030 and the MTSF. Among these goals is tracking the achievement of learners on key competencies outlined in the Curriculum and Assessment Policy Statement (CAPS), including the percentage of learners who can read for meaning.
The DBE has in its re-conceptualisation of a national assessment system extracted valuable lessons and technical designs from the halted Annual National Assessments (ANA) towards the formulation of the National Assessment Framework (NAF). The NAF, as a re-engineered replacement model of ANA designed to be more inclusive in addressing alternative forms of assessment, places emphasis on a purpose-driven design, without losing the diagnostic and system-wide goals of its predecessor. In this regard, the NAF makes use of both sample assessment designs and universal forms of assessment. Key assessment programmes residing within the NAF are structured into three tiers:
a. Systemic Evaluations, Early Learning National Assessments and international benchmark studies and surveys (including TIMSS, PIRLS, SEACMEQ and TALIS);
b. Diagnostic assessments linked to an Assessment for Learning approach; and
c. Summative assessments and the General Education Certificate (GEC).
The absence of accurate recognition of the learning achievements of South African learners at the end of the compulsory schooling phase (i.e. Grade 9) remains an issue. In response to this, the sector is implementing the policy on GEC which was expressed in Education White Paper 1 of 1995.
The MTSF proposes that the Department introduce the GEC in Grade 9, in part to facilitate movement between schools and TVET colleges. The GEC provides a foundation certificate for learners in the GET band to acknowledge the competencies gained from ten years of formal schooling at the end of Grade 9.
The overarching objective of the GEC is to improve the quality of the education system in the General Education and Training band. It has the following sub-goals:
a. To set standards and desired competencies after 10 years of formal schooling (Grades R–9);
b. To inform learners, parents, and schools on desired pathways to follow linked to a three-stream model;

71
c. To certify learners according to levels of proficiencies linked to academic content, aptitude and the world of work; and
d. To improve learning outcomes.
To achieve the overarching objective and sub-goals, it is proposed that the GEC comprises three major components:
a. Standardised external assessment in selected subjects;
b. Internal school-based performance assessment integrating selected subjects; and
c. Aptitude assessments linked to skills, knowledge, values and attitudes.
Providing school infrastructure
The Department provides a conducive learning environment by ensuring that all schools are funded at least at the minimum per learner levels determined nationally and that funds are utilised transparently and effectively. In line with Goal 24 of the Action Plan to 2024: Towards the Realisation of Schooling 2030, the Department also ensures that the physical infrastructure and environment of every school inspires learners to want to come to school. This is done through state-of-the-art schools built through the School Infrastructure Backlogs Grant.
These activities are mainly carried out in the Planning, Information and Assessment programme through two grants, namely the Education Infrastructure Grant and the School Infrastructure Backlogs Grant. The Education Infrastructure Grant is a supplementary grant transferred to provinces for the provision of school infrastructure. This grant helps to accelerate construction, maintenance, upgrading and rehabilitation of new and existing infrastructure in education, including district and circuit accommodation, to enhance capacity to deliver infrastructure in education and to address damages to infrastructure. The allocation over the 2020 MTEF period amounts to R32,5 billion. The School Infrastructure Backlogs Grant is meant to eradicate the Basic Safety Norms backlog in schools without water, sanitation and electricity and to replace those schools constructed from inappropriate material, including mud schools. The allocation over the 2020 MTEF period amounts to R6,9 billion.
The SAFE Initiative addresses the backlog in the provision of appropriate sanitation in all schools in the country. The DBE conducted an audit that revealed that about 3 898 schools still have inappropriate sanitation. An allocation of R2,8 billion was allocated for the SAFE Initiative over the 2019 MTEF as follows: R700 million in 2019/20, R800 million in 2010/21 and R1,3 billion in 2021/22. The SAFE allocation is classified under the School Infrastructure Backlog Grant. Through SAFE, 188 schools have been provided with adequate sanitation; 880 projects are currently in the planning and design phase, and 127 projects are currently under construction.
Through the ASIDI Programme, the Department will build 24 new schools in 2020 and a total of 83 schools over the MTEF, provide sanitation to 825 schools through ASIDI and SAFE in 2020, 3 600 schools over the MTEF, and provide water to 100 schools in 2020.
The implication of the budget reductions where infrastructure provision is concerned is that it will have a negative impact in terms of meeting the Minimum Uniform Norms and Standards for Public Schools for School Infrastructure published on 29 November 2013. There has always been a deficit in terms of the total budget needed to eradicate the backlogs in the sector and the budget reduction will exacerbate the challenge. This will also negatively affect project planning for the next financial year which is already under way. The budget reductions often leave a small window to introduce new projects into the implementation pipeline. The reduction might also mean that programmes for projects already in implementation will need to be revised, leading to slower progress and thus increasing escalation costs.

72
Budget allocation for programme and sub-programmes as per the ENE.
Table 21: Programme 4: Performance targets with the Budget and MTEF Expenditure estimates
Sub-ProgrammeAudited Outcomes R’000
Adjusted appropriation
R’000
Medium-term expenditure estimate R’000
2016/17 2017/18 2018/19 2019/20 2020/21 2021/22 2022/23
Programme Management: Planning Information and Assessment 2 963 3 490 3 449 3 356 3 797 3 995 4 144
Information Management Systems 47 068 96 173 49 315 50 131 47 039 55 028 56 628
School Infrastructure 11 257 963 12 262 272 12 193 340 12 505 910 11 070 823 14 013 057 14 687 121
National Assessments and Public Examination 289 205 282 403 331 015 349 878 263 968 432 788 457 256
National Education Evaluation and Development Unit 26 185 20 669 20 114 19 300 16 715 18 836 19 524
Planning and Delivery Oversight Unit 96 569 120 804 137 406 141 481 141 623 150 748 156 299
Total 11 719 953 12 785 811 12 734 639 13 070 056 11 543 965 14 674 452 15 380 972
Economic Classification
Current Payments 531 872 410 695 440 059 575 386 466 835 654 054 802 771
Compensation of employees 126 111 116 796 130 690 133 601 141 900 153 252 163 263
Goods and Services of which: 405 761 293 899 308 532 441 785 324 935 500 802 639 508
Computer services 50 675 44 352 59 160 44 902 25 478 59 347 64 496
Consultants: business and advisory services 167 667 162 072 133 234 231 943 189 017 212 162 333 134
Consumables: stationery, printing and office supplies 2 458 2 875 1 052 23 895 6 854 18 847 19 764
Travel and subsistence 64 428 56 422 73 482 78 728 60 252 114 210 120 684
Other 120 533 28 178 41 604 62 317 42 877 96 236 101 430
Interest and rent on land - - 837 - - - -
Transfers and subsidies 10 131 882 10 696 477 10 337 231 10 764 613 9 045 548 11 983 101 12 539 844
Provinces and municipalities 9 933 282 10 467 276 10 093 563 10 514 478 8 786 967 11 710 298 12 255 026
Departmental agencies and accounts 118 678 124 612 128 543 134 634 139 172 146 826 154 158
Foreign government 3 348 3 335 2 668 3 480 3 671 3 873 4 016
Non-profit institutions 76 120 99 959 112 064 111 945 115 738 122 104 126 644
Households 454 1 295 393 76 - - -
Payments for capital assets 1 051 061 1 622 724 1 957 255 1 730 057 2 031 582 2 037 297 2 038 357
Buildings 772 683 1 617 716 1 946 679 1 729 482 2 030 968 2 036 649 2 037 672
Other fixed structures 276 852 - - - - -
Machinery and equipment 1 526 1 063 1 563 575 614 648 685
Software and other intangible assets - 3 945 9 013 - - - -
Payments for financial assets 5 138 55 915 94 - - - -
Total 11 719 953 12 785 811 12 734 639 13 070 056 11 543 965 14 674 452 15 380 972

73
Sub-Programme
Audited Outcomes R’000Adjusted
appropriation R’000
Medium-term expenditure estimate R’000
2016/17 2017/18 2018/19 2019/20 2020/21 2021/22 2022/23
Details of selected transfers and subsidies
Current -
Transfers 10 131 882 10 696 477 10 337 10 764 613 9 045 548 11 983 101 12 539 844
Education Infrastructure Grant 9 933 282 10 467 276 10 093 10 514 478 8 786 967 11 710 298 12 255 026
Umalusi 118 678 124 612 128 543 134 634 139 172 146 826 154 158
Southern and Eastern Africa Consortium for Monitoring Educational Quality 3 348 3 335 2 668 3 480 3 671 3 873 4 016
National Education Collaboration Trust 76 120 99 959 112 064 111 945 115 738 122 104 126 644
Households 454 1 295 393 76 - - -
5.5 Programme 5: Educational Enrichment Services
Programme Purpose: To monitor and support provinces to implement Care and Support programmes for learning and teaching.
Sub-programmes: Programme Management: Care and Support in Schools; and Partnership in Education.
Action Plan Goal on Learner Well-Being
Goal 25 ► Use schools as vehicles for promoting access to a range of public services among learners in areas such as health, poverty alleviation, psychosocial support, sport and culture.

74
5.5.
1 O
utco
mes
, Out
puts
, Per
form
ance
Indi
cato
rs a
nd T
arge
ts
Tabl
e 22
: Pro
gram
me
5: O
utco
mes
, Out
puts
, Per
form
ance
Indi
cato
rs a
nd T
arge
ts
Outc
ome
Outp
uts
Outp
utIn
dica
tors
Annu
al Ta
rget
s
Audi
ted
/Act
ual
Perfo
rman
ceEs
timat
edPe
rform
ance
MTEF
Per
iod
2016
/1720
17/18
2018
/1920
19/20
2020
/2120
21/22
2022
/23
Outco
me 1:
Main
tain
and d
evelo
p the
syste
m of
polic
ies, in
cludin
g the
curri
culum
and
asse
ssme
nt, go
vern
ing
the ba
sic ed
ucati
on
secto
r to a
dvan
ce a
quali
ty an
d inc
lusive
, sa
fe an
d hea
lthy b
asic
educ
ation
syste
m
Ensu
re th
at po
licies
re
lating
to ca
re an
d su
ppor
t ser
vices
evolv
e to
deal
with
emer
ging
prior
ities,
includ
ing
those
relat
ing to
scho
ol nu
trition
, sch
ool s
afety,
so
cial c
ohes
ion, a
nd
learn
er he
alth a
nd
welln
ess
5.1.1
Numb
er of
scho
ols m
onito
red f
or th
e pro
vision
of
nutrit
ious m
eals
151
205
135
110
115
120
125
5.1.2
Numb
er of
PED
s with
appr
oved
annu
al bu
sines
s plan
s for
the H
IV/A
IDS
Life S
kills
Educ
ation
Pr
ogra
mme
--
-9
99
9
5.1.3
Numb
er of
distr
icts m
onito
red a
nd su
ppor
ted
in the
imple
menta
tion o
f the N
ation
al Sc
hool
Safet
y Fr
amew
ork (
NSSF
), so
cial c
ohes
ion, s
port
and
enric
hmen
t pro
gram
mes
--
--
43
75
75
5.1.
4 Nu
mbe
r of le
arne
rs, e
duca
tors
, par
ents,
SGB
s an
d ot
her e
duca
tions
stak
ehold
ers r
each
ed th
roug
h so
cial c
ohes
ion p
rogr
amm
es
--
--
7 500
8 000
8 000

75
5.5.2 Indicators, Annual and Quarterly Targets
Table 23: Programme 5: Indicators, Annual and Quarterly Targets
Output Indicators Reporting Cycle
Annual Target
Q1 Q2 Q3 Q4
5.1.1 Number of schools monitored for the provision of nutritious meals Quarterly 115 30 30 25 30
5.1.2 Number of PEDs with approved annual business plans for the HIV/AIDS Life Skills Education Programme
Annually 9 0 0 0 9
5.1.3 Number of districts monitored and supported in the implementation of the National School Safety Framework (NSSF), social cohesion, sport and enrichment programmes
Quarterly 43 14 9 10 10
5.1.4 Number of learners, educators, parents, SGBs and other educations stakeholders reached through social cohesion programmes
Quarterly 7 500 2 000 2 500 500 2 500
5.5.3 Explanation of planned performance over the medium-term period
The Educational Enrichment Services Programme will focus on the following delivery areas during the 2020/21 financial year:
• Monitor the provision of the National Schools Nutrition Programme in public schools;
• Implement the National School Deworming Programme in NSNP schools;
• Promote and monitor the participation of learners in extramural activities;
• Promote gender equity programmes in schools;
• Promote the implementation of social cohesion programmes in schools;
• Promote safe and violence-free schools;
• Contribute to the reduction of new HIV and TB infections in schools and education departments, as well as learner pregnancy in schools;
• Mitigate the impact of HIV and TB by providing a caring, supportive and enabling environment for learners and educators;
• Promote the psychological, mental and social well-being of learners in schools; and,
• Expand the provision of school health services in schools.
The Department will monitor and support the implementation of safety, social cohesion, sport and enrichment programmes across 75 education districts. The intention is to ensure that the learning environment is characterised not only by good quality education, but that is also safe, rights-based and provides for participation in enrichment programmes.
Guided by the DBE’s framework on Care and Support for Teaching and Learning (CSTL), the Social Inclusion and Partnerships in Education (SIPE) sub-programme aims to ensure that schools are used as vehicles for promoting learners’ access to a range of public services such as health, poverty alleviation, child protection, enrichment and social cohesion, for the holistic development and well-being of learners. The basket of services will be anchored through the INSPIRE package, which provides an evidence-based framework for organising policy, practice and research to address socio-economic challenges in learning environments. The emphasis of programming will focus on multi-sectoral and intergovernmental collaboration and action to achieve positive teaching and learning outcomes.
School Safety
Programmes that strengthen the implementation of the NSSF include addressing bullying in schools, learner road safety, implementing the DBE-SAPS Protocols, addressing violence in schools and implementing the National Strategy for the Management of Drug and Substance Abuse.

76
National School Nutrition Programme (NSNP)
Subsequent to the evaluation, the Improvement Plan was developed to address the recommendations. Seven task teams with thematic focus areas were established in consultation with all provincial departments as implementers. The work of some task teams has yielded results in making major improvements in the programme.
Going forward, the Department will explore the introduction of other protein options and the expansion of breakfast (second meal) in priority districts. In addition, to maximise value for money, the National Treasury will be approached to advise on establishing a transversal procurement process for key NSNP foodstuffs.
HIV and AIDS
Health Promotion programmes seek to create a healthy school environment by addressing key health and social barriers to learning to promote effective teaching and learning. The HIV and AIDS programme supports South Africa’s HIV prevention strategy by mitigating the impact of HIV and TB and providing a caring, supportive and enabling environment for learners and educators to reduce new HIV and TB infections, as well as learner pregnancy in schools.
The focus is to increase HIV, STI and TB knowledge and awareness among learners, educators and officials through teacher training, provision of Comprehensive Sexuality Education (CSE) and access to health and social services, including sexual and reproductive health services (SRH) to learners, educators and officials.
Successful implementation and monitoring of the HIV and AIDS programme will improve the general health and well-being of learners and educators, improve the retention of educators and learners in schools, and contribute to the quality of teaching and learning.
5.5.4 Programme Resource Considerations
Providing meals for learners
The Department contributes to the NDP’s priority of eliminating poverty and supporting food security through the NSNP. As part of the programme, the Department plans to provide meals to more than 9 million learners each year over the medium term in over 19 950 Quintile 1–3 schools as well as identified special schools. To this end, R24,3 billion is allocated over the MTEF period in the Educational Enrichment Services Programme for the National School Nutrition Programme Grant.
The percentage cut for 2020/21 is less than 0.5% and therefore its impact will be minimal. However, the outer years’ cuts are higher and might have a negative impact on implementation in the following areas: roll-out of breakfast to more provinces, improvement of the menu in terms of broadening protein alternatives and provision of meals to Quintile 4–5 learners as well as increasing number of learners in the Eastern Cape and Free State (the latter as a result of reclassification of schools within quintiles).
School Safety
To ensure that safety in schools is addressed, the Department will monitor and support schools in the implementation of the National School Safety Framework, work with police stations to actively support schools and link more schools to police stations.
Given the limited voted funds in the sub-programme, the Department will mobilise donor funding and partnerships to augment the allocated budget towards the achievement of outputs.

77
Table 24: Programme 5: Performance targets with the Budget and MTEF Expenditure estimates
Sub-Programme
Audited Outcomes R’000Adjusted
appropriation R’000
Medium-term expenditure estimate R’000
2016/17 2017/18 2018/19 2019/20 2020/21 2021/22 2022/23
Programme Management: Educational Enrichment Services 3 062 15 290 3 348 3 880 4 764 4 833 5 092
Partnership in Education 22 014 24 107 31 714 33 344 32 773 41 312 43 610
Care and Support in Schools 6 308 646 6 696 756 7 073 345 7 473 865 7 884 654 8 420 084 8 816 834
Total 6 333 722 6 736 153 7 108 407 7 511 089 7 922 191 8 466 229 8 865 536
Economic classification
Current payments 49 499 51 909 62 592 67 908 68 721 81 844 86 338
Compensation of employees 33 607 36 343 39 986 45 984 51 935 56 388 60 041
Goods and services 15 892 15 566 22 606 21 924 16 786 25 456 26 297
Minor Assets 8 19 31 43 45 47 49
Agency and support/ outsourced services 764 1 271 645 211 - - -
Consumables: stationery, printing and office supplies 758 529 586 864 1 261 1 235 1 282
Travel and subsistence 7 727 7 129 9 742 12 013 9 003 13 957 14 424
Other 6 635 6 618 11 602 8 703 6 477 10 217 11 172
Transfers and subsidies 6 284 014 6 677 786 7 045 390 7 442 735 7 853 055 8 383 961 8 778 750
Provinces and municipalities 6 283 842 6 671 621 7 045 314 7 442 666 7 852 982 8 383 883 8 778 668
Non-profit institutions 58 6 061 65 69 73 78 82
Household 114 104 11 - - - -
Payments for capital assets 203 374 381 444 415 424 448
Machinery and Equipment 203 358 381 444 415 424 448
Software and other intangible assets - - - - - - -
Payments for financial assets 6 6 084 44 2 - - -
Total 6 333 722 6 736 153 7 108 407 7 511 089 7 922 191 8 466 229 8 865 536
Sub-Programme
Audited Outcomes R’000Adjusted
appropriation R’000
Medium-term expenditure estimate R’000
2016/17 2017/18 2018/19 2019/20 2020/21 2021/22 2022/23Details of selected transfers and subsidiesCurrent -
Transfers 6 284 014 6 677 786 7 045 390 7 442 735 7 853 055 8 383 961 8 778 750National School Nutrition Programme 6 059 655 6 426 313 6 802 079 7 185 715 7 665 887 8 125 341 8 516 464HIV and AIDS (Life Skills Educators) Grant 224 187 245 308 243 235 256 951 187 095 258 542 262 204
Current 172 6 165 76 69 73 78 82Childline South Africa 58 61 65 69 73 78 82Historic School Restoration PRJ - 6 000 - - - - -Household 114 104 11 - - - -
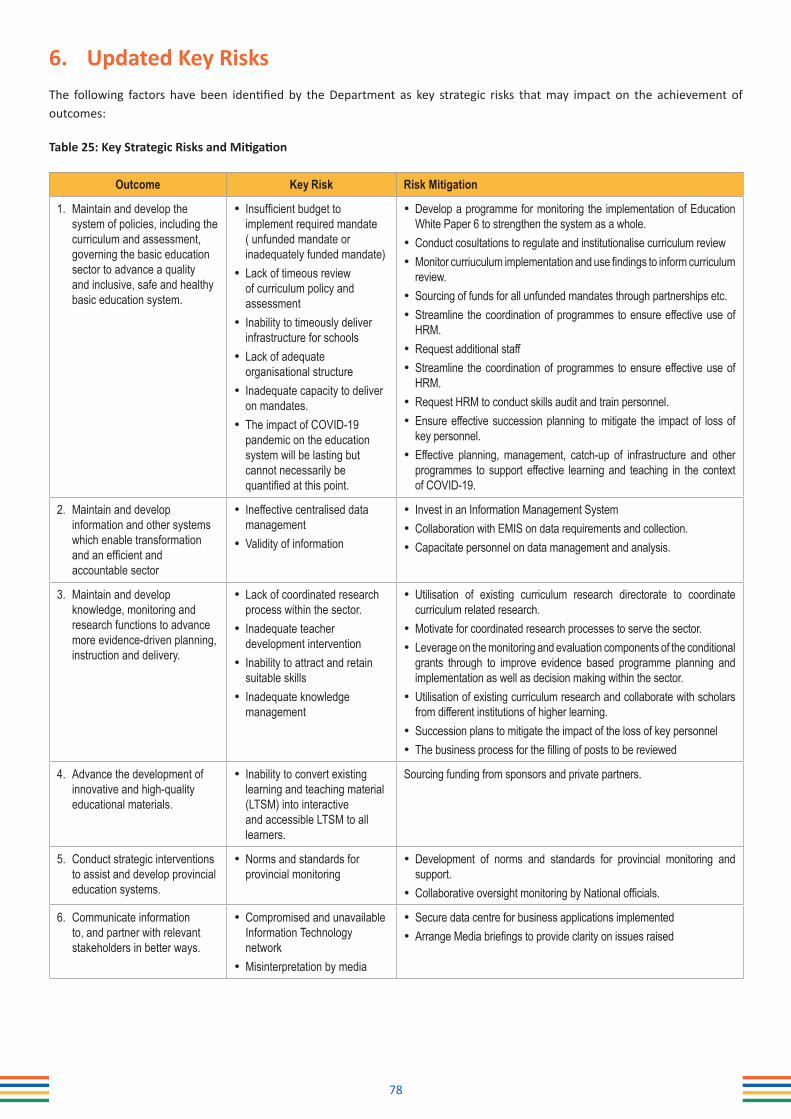
78
6. Updated Key RisksThe following factors have been identified by the Department as key strategic risks that may impact on the achievement of outcomes:
Table 25: Key Strategic Risks and Mitigation
Outcome Key Risk Risk Mitigation
1. Maintain and develop the system of policies, including the curriculum and assessment, governing the basic education sector to advance a quality and inclusive, safe and healthy basic education system.
• Insufficient budget to implement required mandate ( unfunded mandate or inadequately funded mandate)
• Lack of timeous review of curriculum policy and assessment
• Inability to timeously deliver infrastructure for schools
• Lack of adequate organisational structure
• Inadequate capacity to deliver on mandates.
• The impact of COVID-19 pandemic on the education system will be lasting but cannot necessarily be quantified at this point.
• Develop a programme for monitoring the implementation of Education White Paper 6 to strengthen the system as a whole.
• Conduct cosultations to regulate and institutionalise curriculum review• Monitor curriuculum implementation and use findings to inform curriculum
review.• Sourcing of funds for all unfunded mandates through partnerships etc.• Streamline the coordination of programmes to ensure effective use of
HRM.• Request additional staff• Streamline the coordination of programmes to ensure effective use of
HRM.• Request HRM to conduct skills audit and train personnel.• Ensure effective succession planning to mitigate the impact of loss of
key personnel.• Effective planning, management, catch-up of infrastructure and other
programmes to support effective learning and teaching in the context of COVID-19.
2. Maintain and develop information and other systems which enable transformation and an efficient and accountable sector
• Ineffective centralised data management
• Validity of information
• Invest in an Information Management System• Collaboration with EMIS on data requirements and collection.• Capacitate personnel on data management and analysis.
3. Maintain and develop knowledge, monitoring and research functions to advance more evidence-driven planning, instruction and delivery.
• Lack of coordinated research process within the sector.
• Inadequate teacher development intervention
• Inability to attract and retain suitable skills
• Inadequate knowledge management
• Utilisation of existing curriculum research directorate to coordinate curriculum related research.
• Motivate for coordinated research processes to serve the sector.• Leverage on the monitoring and evaluation components of the conditional
grants through to improve evidence based programme planning and implementation as well as decision making within the sector.
• Utilisation of existing curriculum research and collaborate with scholars from different institutions of higher learning.
• Succession plans to mitigate the impact of the loss of key personnel• The business process for the filling of posts to be reviewed
4. Advance the development of innovative and high-quality educational materials.
• Inability to convert existing learning and teaching material (LTSM) into interactive and accessible LTSM to all learners.
Sourcing funding from sponsors and private partners.
5. Conduct strategic interventions to assist and develop provincial education systems.
• Norms and standards for provincial monitoring
• Development of norms and standards for provincial monitoring and support.
• Collaborative oversight monitoring by National officials.
6. Communicate information to, and partner with relevant stakeholders in better ways.
• Compromised and unavailable Information Technology network
• Misinterpretation by media
• Secure data centre for business applications implemented• Arrange Media briefings to provide clarity on issues raised

79
7. Public EntitiesTable 26: Public Entities resorting under DBE
Name of Public Entity Mandate Outcomes
Current Annual Budget(R thousand)
South African Council for Educators
Registration, promotion and professional development of educators, as well as setting, maintaining and protecting the ethical and professional standards of educators
• Enhanced status of teaching;
• Professionalisation of educators through registering educators appropriately, managing professional development and promoting a code of ethics for all educators;
• Professionalising teaching;
• Administration and promotion of the professional teacher development system
R13 000
Umalusi Develop and maintain a framework of qualifications for general and further education and training: NQF Levels 1–4; and for the attendant quality assurance and certification of such qualifications
• Promotes quality and internationally comparative standards in FET;
• Maintains and improves educational standards through development and evaluation of qualifications and curriculum; quality assurance of assessment, and provision of education, training and assessment;
• Continually develops in-depth knowledge and expertise in mandated areas through rigorous research;
• Issues appropriate and credible certificates of learner achievement in terms of specific qualifications and subjects on the FET Framework of Qualifications; and
• provides reliable and credible leadership and guidance in standard-setting and quality assurance
R139 172
8. Infrastructure Projects
No. Project name Programme Project description
Outputs Projected for 2020/21
Project start date
Project completion date
Total Estimated cost
Current Year Expenditure (2020/21)
Inappropriate Structures ASIDI Replacement inappropriate
structures at schools 24 Apr-2020 Mar-2021 560,199,000 89,175,004
Water ASIDI Provision of water to schools 100 Apr-2020 Mar-2021 54,927,000 9,030,380
Sanitation ASIDI Provision of sanitation to schools 98 Apr-2020 Mar-2021 95,489,000 14,674,367
SAFE ASIDI Provision of sanitation to schools 727 Apr-2020 Mar-2021 800,000,000 4,165,473
9. Public-Private PartnershipsThe Department entered in April 2007 into a Public Private Partnership (PPP) with the consortium Sethekgo for a period of 25 years to finance, design, construct and maintain an office accommodation building for the Department of Basic Education (DBE).

80
Part D: Technical Indicator Descriptions (TID)Programme 1: Administration
Indicator Title 1.1.1 Percentage of valid invoices paid within 30 days upon receipt by the Department
Definition To ensure that all valid invoices received by the Department are paid within 30 days of receipt from the suppliers
Source of data Data sourced from the Basic Accounting System (BAS)
Method of Calculation/ Assessment
Numerator: Total number of invoices paid within 30 days of receipt by the institutionDenominator: Total number of invoices received by the institutionMultiply by 100
Means of Verification Accrual report for invoices not paidQuarterly reports for all invoices received and paid by the Department
Data limitations Suppliers not submitting invoices on time
Assumptions There is sufficient Budget to pay service providers
Disaggregation of Beneficiaries (where applicable)
Target for Women: Not ApplicableTarget for Youth: Not ApplicableTarget for People with Disabilities: Not Applicable
Spatial Transformation(where applicable)
Reflect on contribution to spatial transformation priorities: Not ApplicableReflect on the spatial impact area: Not Applicable
Calculation type Cumulative: Year-End
Reporting cycle Quarterly
Desired performance All invoices received are paid within 30 days
Indicator responsibility Lead – Branch A: Finance and AdministrationSupport – Not applicable
Indicator Title 1.1.2 Number of reports on misconduct cases resolved within 90 days
Definition The indicator measures the number of reports on misconduct cases submitted to the Department of Public Service and Administration (DPSA) within the financial year. Misconduct refers to the transgression of the code of conduct by an official in which case a disciplinary action was instituted for such act. This includes both progressive and formal disciplinary actions as outlined in Resolution 1 of 2003- Clause 7.2(a) - and Chapter 7, clause 2.7. (2)(b) of the SMS Handbook
Source of data Signed list of formal cases submitted by line managers to the Directorate: Labour Relations to initiate/institute a disciplinary process.Signed list of those cases resolved by the Directorate: Labour RelationsPERSAL reports
Method of Calculation/ Assessment
Count the number of reports produced
Means of Verification Quarterly misconduct reports submitted to the DPSA
Data limitations Resolution time may be extended beyond 90 days
Assumptions People report misconduct cases
Disaggregation of Beneficiaries (where applicable)
Target for Women: Not ApplicableTarget for Youth: Not ApplicableTarget for People with Disabilities: Not Applicable
Spatial Transformation(where applicable)
Reflect on contribution to spatial transformation priorities: Not ApplicableReflect on the spatial impact area: Not Applicable
Calculation type Cumulative: Year-End
Reporting cycle Quarterly
Desired performance All misconduct cases are resolved within 90 days
Indicator responsibility Lead – Branch A: Finance and AdministrationSupport – Not applicable

81
Indicator Title 1.1.3 Number of capacity-building programmes offered to the DBE officials
Definition The indicator measures the number of capacity-building programmes offered to the DBE officials within the financial year.
Source of data Records of capacity-building Programmes conducted
Method of Calculation/ Assessment
Count the number of capacity-building programmes offered to the DBE officials
Means of Verification Attendance registers
Data limitations No officials attending in a particular quarter
Assumptions That the Department will appoint new officials who will undergo the Compulsory Induction Programme. That DBE officials will request capacity-building programmes for professional development.
Disaggregation of Beneficiaries (where applicable)
Target for Women: Not ApplicableTarget for Youth: Not ApplicableTarget for People with Disabilities: Not Applicable
Spatial Transformation(where applicable)
Reflect on contribution to spatial transformation priorities: Not ApplicableReflect on the spatial impact area: Not Applicable
Calculation type Non-Cumulative
Reporting cycle Annually
Desired performance 10 capacity-building Programmes per year (DBE officials are offered and attend capacity-building programmes that are appropriate for their training needs identified and contribute to their development)
Indicator responsibility Lead – Branch A: Finance and AdministrationSupport – Not applicable
Indicator Title 1.2.1 Annual Performance Plan approved by 31 March each financial year
Definition This indicator measures the APP production process from the first draft until the plan is approved by 31 March of each year.Approval is done by the Minister for the Department of Basic Education.Note that the process of developing the plan for any year is done the year before. For example, the 2020/21 APP is approved around March 2020, however, the process of developing it takes place in the 2019/20 financial year.
Source of data Final APP: DBE’s letter of submission to DPME (March 2021) Draft APP: DBE’s letter of submission to DPME (October 2020)
Method of Calculation/ Assessment
No calculations required – proof of tabling as per Parliamentary Calendar
Means of Verification A copy of the APP that reflects the signature of the Minister of Basic Education
Data limitations Time lag of one year: for any given financial year (x), the APP must be developed and approved in the prioryear (x-1). E.g. the 2020/21 APP is developed in 2019/20 and approved before 31 March 2020
Assumptions None
Disaggregation of Beneficiaries (where applicable)
Target for Women: Not ApplicableTarget for Youth: Not ApplicableTarget for People with Disabilities: Not Applicable
Spatial Transformation(where applicable)
Reflect on contribution to spatial transformation priorities: Not ApplicableReflect on the spatial impact area: Not Applicable
Calculation type Non-Cumulative
Reporting cycle Annually
Desired performance To develop the APP in accordance with the PFMA and the applicable DPME framework and National Trea- sury requirements, and have it approved before implementation
Indicator responsibility Lead – Branch B: Business IntelligenceSupport – Not applicable
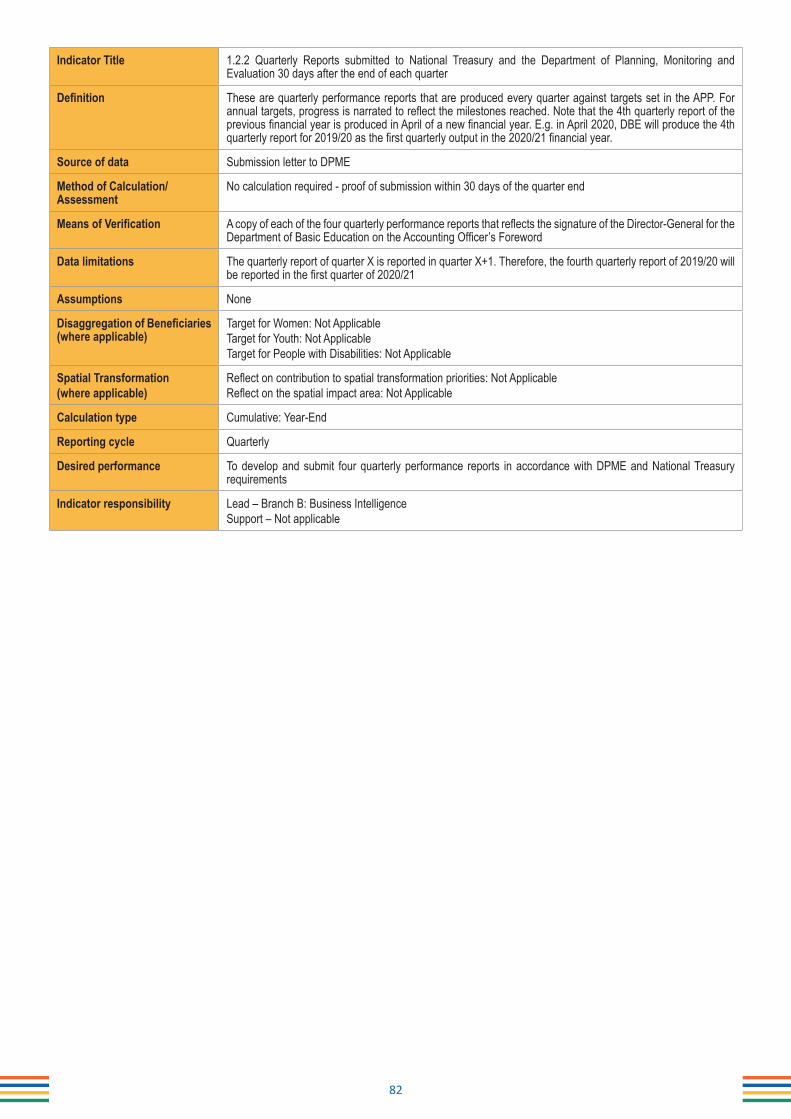
82
Indicator Title 1.2.2 Quarterly Reports submitted to National Treasury and the Department of Planning, Monitoring and Evaluation 30 days after the end of each quarter
Definition These are quarterly performance reports that are produced every quarter against targets set in the APP. For annual targets, progress is narrated to reflect the milestones reached. Note that the 4th quarterly report of the previous financial year is produced in April of a new financial year. E.g. in April 2020, DBE will produce the 4th quarterly report for 2019/20 as the first quarterly output in the 2020/21 financial year.
Source of data Submission letter to DPME
Method of Calculation/ Assessment
No calculation required - proof of submission within 30 days of the quarter end
Means of Verification A copy of each of the four quarterly performance reports that reflects the signature of the Director-General for the Department of Basic Education on the Accounting Officer’s Foreword
Data limitations The quarterly report of quarter X is reported in quarter X+1. Therefore, the fourth quarterly report of 2019/20 will be reported in the first quarter of 2020/21
Assumptions None
Disaggregation of Beneficiaries (where applicable)
Target for Women: Not ApplicableTarget for Youth: Not ApplicableTarget for People with Disabilities: Not Applicable
Spatial Transformation(where applicable)
Reflect on contribution to spatial transformation priorities: Not ApplicableReflect on the spatial impact area: Not Applicable
Calculation type Cumulative: Year-End
Reporting cycle Quarterly
Desired performance To develop and submit four quarterly performance reports in accordance with DPME and National Treasury requirements
Indicator responsibility Lead – Branch B: Business IntelligenceSupport – Not applicable

83
Programme 2: Curriculum Policy, Support and Monitoring
Indicator Title 2.1.1 Number of Technical schools monitored for implementation of Curriculum and Assessment PolicyStatements (CAPS)
Definition The number of technical high schools/ secondary schools offering Grade 10-12 will be desktop monitored on the implementation of the CAPS for Technical Schools. Monitoring is conducted to assess the progress made with regards to the implementation of the CAPS for Technical Schools and to institute improvement plans where applicable.
Source of data Information is obtained through desktop monitoring.
Method of Calculation/ Assessment
Count the number of Technical schools monitored for implementation of CAPS
Means of Verification Completed monitoring toolsSigned list of schools monitored per quarter with dates monitoredConsolidated monitoring status annual report
Data limitations None
Assumptions Implementation of CAPS takes place as planned
Disaggregation of Beneficiaries (where applicable)
Target for Women: Not ApplicableTarget for Youth: Not ApplicableTarget for People with Disabilities: Not Applicable
Spatial Transformation(where applicable)
Reflect on contribution to spatial transformation priorities: Not ApplicableReflect on the spatial impact area: Not Applicable
Calculation type Cumulative: Year-End
Reporting cycle Quarterly
Desired performance Improvement of implementation of the CAPS for Technical Schools.
Indicator responsibility Lead – Branch D: Delivery and SupportSupport – Not Applicable

84
Indicator Title 2.1.2 Number of learners obtaining subject passes towards a National Senior Certificate (NSC) or extendedSenior Certificate, including upgraded NSC per year
Definition Subject passes towards a NSC or extended SC by accessing resources from the Second Chance MatricProgramme which provides the following models of support:• Direct tuition• Radio and television broadcasting• Online Digital Programme (DBE Cloud and Vodacom E School)• Print resourcesThese learners include:• Supplementary learners (including those who did not meet the NSC requirements for Diploma or Degree
pass) who will sit for the March examinations• Progressed learners who modularised and will sit for the June examinations• Candidates writing the extended Senior Certificate in June• Part-time NSC candidates writing the November examinations (including candidates upgrading their pass
status).
Source of data NSC Data sourced from Exams
Method of Calculation/ Assess-ment
Count the number of learners who have subject passes through the Second Chance Support for NSC and amended SC using the examinations database.
Means of Verification Signed list of learners enrolled on the examinations databaseSigned list of results of learners, who have achieved subject passes towards a Bachelor’s, diploma, or certificate verdict towards NSC or an extended Senior Certificate. This includes learners who have upgraded their Grade 12.
Data limitations • DBE is reliant on data from external sources - Examinations Database, registration of learners, Data from DBE Cloud/website and Vodacom E School, District offices, and Data from Broadcasters which is not learner specific.
• Learners accessing support unable to provide examination or ID numbers at venues.• The target achieved in the fourth quarter emanates from the supplementary examinations which are written in
February/ March of the 2020/21 academic year. However, results are only available in May 2021.• Out of school candidates do not take all subjects but a few subjects a year and will therefore not necessary ob-
tain an NSC in one year. However, their subject passes are still an achievement as they are credited towards the qualification.
Assumptions All learners who register sit for the examinations
Disaggregation of Beneficiaries (where applicable)
Target for Women: Not ApplicableTarget for Youth: Not ApplicableTarget for People with Disabilities: Not Applicable
Spatial Transformation(where applicable)
Reflect on contribution to spatial transformation priorities: Not ApplicableReflect on the spatial impact area: Not Applicable
Calculation type Cumulative: Year-End
Reporting cycle Bi-annually
Desired performance High number of learners passing NSC and extended SC or upgraded NSC pass which will improve opportunities at tertiary institutions
Indicator responsibility Lead – Branch C: Curriculum Policy, Support and MonitoringSupport – Not Applicable

85
Indicator title 2.1.3 Number of Children/ Learners with Profound Intellectual Disability (C/LPID) using the LearningProgramme for C/LPID
Definitions A number of children with Profound Intellectual Disability enrolled in special care centres and schools do not always have access to quality education as available Curriculum does not always respond to their learning and developmental needs.
Source of data Data sourced from EMIS
Method of Calculation/ Assessment
Count the number of Children/ Learners with Profound Intellectual Disability (C/LPID) who are learning and developing through the use of the Learning Programme for C/LPID.
Means of Verification Signed list of Children/ Learners using the Learning Programme for C/LPID.
Data limitations Enrolment in Care Centres fluctuates due to socio-economic factors. This has an impact on data collection andreporting.
Assumptions The transversal itinerant outreach team members will support the implementation of the Learning Programme for C/LPID.
Disaggregation of Beneficiaries (where applicable)
Target for Women: Not ApplicableTarget for Youth: Not ApplicableTarget for People with Disabilities: Not Applicable
Spatial Transformation(where applicable)
Reflect on contribution to spatial transformation priorities: Not ApplicableReflect on the spatial impact area: Not Applicable
Calculation type Non-Cumulative
Reporting cycle Annually
Desired performance An increase in the number of Children/ Learners with Profound Intellectual Disability (C/LPID) who are learning and developing through the Learning Programme for C/LPID
Indicator responsibility Lead – Branch C: Curriculum Policy, Support and MonitoringSupport – Branch B: Business Intelligence
Indicator title 2.1.4 A National Report is produced on monitoring of the implementation of the Policy on Screening,Identification, Assessment and Support (SIAS) as a mechanism for early identification and intervention
Short definitions Although a significant number of teachers and officials have been trained on the implementation of the Policy on Screening, Identification, Assessment, and Support (SIAS), implementation has not had the expected impact as a mechanism for early identification and intervention.
Source/Collection of data Information is obtained through desktop monitoring
Method of calculation A National Report is produced on monitoring of the implementation of the Policy on SIAS as a mechanism forearly identification and intervention
Means of verification A National Report is produced on monitoring of the implementation of the Policy on SIAS as a mechanism forearly identification and intervention
Data limitations None
Assumptions All schools implement the Screening, Identification, Assessment and Support (SIAS) Policy
Disaggregation of Beneficiaries (where applicable)
Target for Women: Not ApplicableTarget for Youth: Not ApplicableTarget for People with Disabilities: Not Applicable
Spatial Transformation(where applicable)
Reflect on contribution to spatial transformation priorities: Not ApplicableReflect on the spatial impact area: Not Applicable
Type of indicator Output
Calculation type Non-Cumulative
Reporting cycle Annually
Desired performance Enhanced institutionalisation of the Policy on SIAS as a mechanism for early identification and intervention inschools
Indicator responsibility Lead – Branch C: Curriculum Policy, Support and MonitoringSupport – Branch S: Social Mobilisation and Support Services

86
Indicator Title 2.1.5 Amend legislation to regulate the new ECD landscape
Definition The new functions which the Minister of Basic Education will receive from the Children’s Act necessitate the amendment of the Children’s Act through a Presidential Proclamation.
Source of data Signed Presidential Proclamation
Method ofCalculation / Assessment
No calculation is required – proof of amended legislation
Means of verification Diagnostic report submitted to DGReadiness assessment and draft determination submitted to DGJoint submission submitted to DPSA
Data limitations Turnaround time for the amendment of the legislation
Assumptions Functions are transferred to the Minister of Basic Education through a Presidential Proclamation
Disaggregation of Beneficiaries (where applicable)
Target for Women: Not ApplicableTarget for Youth: Not ApplicableTarget for People with Disabilities: Not Applicable
Spatial Transformation(where applicable)
Reflect on contribution to spatial transformation priorities: Not ApplicableReflect on the spatial impact area: Not Applicable
Calculation Type Non-Cumulative
Reporting Cycle Annually
Desired performance There is clarity on roles and responsibilities in the ECD sector, with the Minister of DBE responsible leading the sector.
IndicatorResponsibility
Lead – Branch D: Delivery and SupportSupport – Branch A: Finance and Administration
Indicator Title 2.1.6 Develop new funding models for ECD delivery
Definition The disbursement of public funds for ECD delivery is done through a range of different modalities. This pro-cess will identify the most appropriate funding model/s for future disbursement by the DBE.
Source of data Signed report on the investigation into ECD funding models
Method ofCalculation / Assessment
Signed report on the investigation into ECD funding models
Means of verification Signed report on the investigation into ECD funding models
Data limitations None
Assumptions There is a budget available to implement the approved model. The budget for ECD services has been trans-ferred to the Department of Basic Education.
Disaggregation of Beneficia-ries (where applicable)
Target for Women: Not ApplicableTarget for Youth: Not ApplicableTarget for People with Disabilities: Not Applicable
Spatial Transformation(where applicable)
Reflect on contribution to spatial transformation priorities: Not ApplicableReflect on the spatial impact area: Not Applicable
Calculation Type Non-Cumulative
Reporting Cycle Annually
Desired performance The model will provide adequate resources as well as effective mechanisms to disburse funds to implement a quality ECD programme.
IndicatorResponsibility
Lead – Branch D: Delivery and SupportSupport – Branch A: Finance and Administration

87
Indicator Title 2.1.7 Conduct an Early Childhood Development census to inform the integration of ECD into the EMIS
Definition Currently no data exists on the number of ECD programmes that are being delivered in the country, and the number of children who are attending these programmes. The ECD census will collect the baseline information on the number of programmes, practitioners and children. This information will be used to integrate ECD into EMIS.
Source of data Database with information collected during the ECD census.
Method ofCalculation / Assessment
Report on the national census conducted
Means of verification Signed Memorandum of UnderstandingApproved request for proposalsAppointed service providerSigned pilot report
Data limitations Currently no data exist.
Assumptions Procurement of a service provider happens without delay. Data collection for the pilot can happen in 2020.
Disaggregation of Beneficiaries (where applicable)
Target for Women: Not ApplicableTarget for Youth: Not ApplicableTarget for People with Disabilities: Not Applicable
Spatial Transformation(where applicable)
If the information is accurate, this will assist in increasing access to quality ECD services, particularly those in the poorest and most vulnerable communities.
Calculation Type Non-Cumulative
Reporting Cycle Annually
Desired performance A database exists with all ECD programmes and the number of children that attend these programmes. A system is in place to update the database annually.
IndicatorResponsibility
Lead – Branch D: Delivery and SupportSupport – Branch B: Business Intelligence
Indicator Title 2.1.8 Develop and operationalise an Early Childhood Development (ECD) Human Resource Development (HRD) Plan
Definition The ECD strategic workforce plan will centre on a particular service delivery model where different stakeholderseach have their specific function to fulfill and clearly defined roles and responsibilities.
Source of data Report on ECD service delivery model and its workforce implications
Method ofCalculation / Assessment
Report on ECD service delivery model and its workforce implications
Means of verification Report on ECD service delivery model and its workforce implications
Data limitations Information is not submitted by PEDs and the Department of Social Development, ECD census was not conducted. ECD Baseline assessment was not conducted.
Assumptions There is an agreed-upon service delivery model.
Disaggregation of Beneficiaries (where applicable)
Target for Women: Not ApplicableTarget for Youth: Not ApplicableTarget for People with Disabilities: Not Applicable
Spatial Transformation(where applicable)
Reflect on contribution to spatial transformation priorities: The execution of the HRD plan will assist in increasing access to quality ECD services, particularly those in the poorest and most vulnerable communities. The services will be delivered by appropriately qualified and competent practitioners.Reflect on the spatial impact area: Not Applicable
Calculation Type Non-Cumulative
Reporting Cycle Annually
Desired performance All ECD practitioners are appropriately qualified to deliver quality service.
IndicatorResponsibility
Lead – Branch D: Delivery and SupportSupport – Branch T: Teachers, Education Human Resources and Institutional Development

88
Indicator Title 2.1.9 Number of districts monitored on implementation of the National Curriculum Statement (NCS) for Grades10 - 12
Definition One of the primary responsibilities of the national department is to monitor and support the implementation of the National Curriculum Statement (NCS) in all subjects for the Further Education and Training (FET) band. Subject specific electronic survey tools to be developed and sent to a sample of schools in identified districts to determine the extent to which the curriculum is implemented, identify gaps in implementation and areas of support required.
Source of data Information is obtained through desktop monitoring
Method ofCalculation / Assessment
Count the number of districts monitored on implementation of the National Curriculum Statement (NCS) forGrades 10 - 12
Means of verification Completed monitoring toolsSigned list of districts monitored per quarter with dates monitoredConsolidated monitoring status annual report
Data limitations Service delivery protests might impact the collection of data on monitoring of the NCS implementation.Teacher Union disengagements with the employer might hinder the collection of data on monitoring of the NCSimplementation.
Assumptions Remote Monitoring of schools in districts will improve learner performance and accountability in the district.
Disaggregation of Beneficiaries (where applicable)
Target for Women: Not ApplicableTarget for Youth: Not ApplicableTarget for People with Disabilities: Not Applicable
Spatial Transformation(where applicable)
The quality of learning and teaching in identified subjects will improve.
Calculation Type Non-Cumulative
Reporting Cycle Annually
Desired performance To improve the quality of teaching to impact on learner performance in identified subjects.
IndicatorResponsibility
Lead – Branch C: Curriculum Policy, Support and Monitoring Support – Not Applicable

89
Indicator Title 2.1.10 Number of provinces monitored on extra-support classes to increase the number of learners achievingBachelor level passes.
Definition One of the primary responsibilities of the national department is to monitor and support the implementation of the National Curriculum Statement (NCS) in all subjects for the Further Education and Training (FET) band. The number of Bachelor level passes per subject obtained is an indicator of the quality of learning and teaching. Extra-support classes provided in provinces is one of the interventions used to increase the number of Bachelor level passes per subject.Each subject specialist monitors a sample of extra-support classes/centres in provinces. The quality of the intervention is assessed against a monitoring instrument to judge the effectiveness of the interventions and identify best practices for sharing amongst the provinces. Electronic survey tools to be sent to a sample of extra-support classes/centres in provinces.
Source of data Information is obtained through desktop monitoring
Method ofCalculation / Assessment
Count the number of provinces monitored on extra-support classes to increase the number of learners achievingBachelor level passes.
Means of verification Completed monitoring toolsSigned list of schools monitored per quarter with dates monitoredConsolidated monitoring status annual report
Data limitations Some of the data is dependent on information from provinces which the DBE cannot confirm the accuracy thereof.Not all subjects are offered during extra-support classes. Data on certain subjects might not be available.
Assumptions Monitoring will increase the number of Bachelor level passes in identified subjects in Grade 12
Disaggregation of Beneficiaries(where applicable)
Target for Women: Not ApplicableTarget for Youth: Not ApplicableTarget for People with Disabilities: Not Applicable
Spatial Transformation(where applicable)
Reflect on contribution to spatial transformation priorities: Learners who are vulnerable are supported to achieveexcellence in passing Grade 12.Reflect on the spatial impact area: Not Applicable
Calculation Type Non-Cumulative
Reporting Cycle Annually
Desired performance To increase the Bachelor level passes in Grade 12.
IndicatorResponsibility
Lead – Branch C: Curriculum Policy, Support and Monitoring Support – Not Applicable

90
Indicator Title 2.1.11 Number of schools monitored for implementing compulsory entrepreneurship education
Definition Entrepreneurship Education is aimed at incrementally infusing project-based learning in the “Project” assessment task in Section 4 of the Curriculum and Assessment Policy Statements from Grades R-12 through Entrepreneurship, Employability and Education Programme.The purpose of the Entrepreneurship, Employability and Education Programme is to develop entrepreneurial skills and competencies of learners and teachers; and to strengthen project-based teaching and learning.
Source of data Information is obtained through desktop monitoring
Method ofCalculation / Assessment
Count the number of schools monitored for implementing compulsory entrepreneurship education
Means of verification Completed monitoring toolsSigned list of schools monitored per quarter with dates monitoredConsolidated monitoring status annual report
Data limitations Some of the data is dependent on information from districts and provinces which the DBE cannot confirm theaccuracy thereof.
Assumptions All schools implement entrepreneurship education
Disaggregation of Beneficiaries(where applicable)
Target for Women: Not ApplicableTarget for Youth: Not ApplicableTarget for People with Disabilities: Not Applicable
Spatial Transformation(where applicable)
Reflect on contribution to spatial transformation priorities: Not ApplicableReflect on the spatial impact area: Not Applicable
Calculation Type Non-Cumulative
Reporting Cycle Annually
Desired performance To improve the implementation of project-based learning.
IndicatorResponsibility
Lead – Branch C: Curriculum Policy, Support and MonitoringSupport – Branch O: Office of the Director-General
Indicator Title 2.1.12 An Annual Sector Report is produced on the implementation of the General Education Certificate (GEC)
Definition The General Education Certificate (GEC) is the qualification at level 1 on the National Qualifications Framework (NQF) that is intended to formally recognise achievements of learners at the end of the compulsory phase of schooling (GET).
Source of data Assessment results of Grade 9 learners
Method of Calculation / Assessment
An Annual Sector Report is produced on the implementation of the General Education Certificate (GEC)
Means of verification • One (1) Annual Sector Report is produced on the implementation of the General Education Certificate (GEC)• Nine (9) PED reports substantiating the Annual Sector Report
Data limitations Data on learner performance from internally assessed subjects at a school level.
Assumptions Successful implementation of the General Education Certificate
Disaggregation of Beneficiaries(where applicable)
Target for Women: Not ApplicableTarget for Youth: Not ApplicableTarget for People with Disabilities: Not Applicable
Spatial Transformation(where applicable)
Reflect on contribution to spatial transformation priorities: Not ApplicableReflect on the spatial impact area: Not Applicable
Calculation Type Non-Cumulative
Reporting Cycle Annually
Desired performance Provision of guidance regarding the articulation of Grade 9 learners into the three learning pathways from Grade 10.
IndicatorResponsibility
Lead – Branch C: Curriculum Policy, Support and MonitoringSupport – Not Applicable

91
Indicator Title 2.1.13 An Annual Sector Report is produced on schools that are prepared to respectively implement and pilot the Technical Occupational Stream
Definition Annual Sector Report will be produced on Schools of Skills piloting and implementing the Technical Occupational Stream
Source of data The information will be collected from individual PED reports
Method ofCalculation / Assessment
Annual Sector Report will be produced by DBE but the data will be collected from individual PED reports
Means of verification • One (1) Annual Sector Report is produced on schools that are prepared to respectively implement and pilot the Technical Occupational Stream
• Nine (9) PED reports substantiating the Annual Sector Report
Data limitations PEDs may not submit data for the consolidation of the national report.
Assumptions There is a set of Schools of Skills and public ordinary schools in which implementation and piloting will take place.
Disaggregation of Beneficia-ries (where applicable)
Target for Women: Not ApplicableTarget for Youth: Not ApplicableTarget for People with Disabilities: Not Applicable
Spatial Transformation(where applicable)
Reflect on contribution to spatial transformation priorities: Not ApplicableReflect on the spatial impact area: Not Applicable
Calculation Type Non-Cumulative
Reporting Cycle Annually
Desired performance Public ordinary schools implementing the Technical Occupational Stream
IndicatorResponsibility
Lead – Branch C: Curriculum Policy, Support and MonitoringSupport – Branch D: Delivery and Support
Indicator Title 2.2.1 Number of schools monitored on the implementation of the reading norms
Definition This refers to the number of public ordinary schools that offer Grade R-9 monitored on Reading Norms. These are standardised benchmarks for reading and writing that are aligned to Curriculum for Home Language and First Additional Language for Grades R-9. Desktop monitoring will be used. 10 schools will be evaluated using desktop monitoring. The desktop monitoring tool will be emailed to the schools.
Source of data Information is obtained through desktop monitoring.The desktop evaluation form will have a school stamp with a date and will be signed off by the school principal. The evaluation form will be verified by the District official by completing the relevant sections on the evaluation tool during their school monitoring and will submit to DBE.
Method of Calculation/ Assessment
Count the number of schools monitored on the implementation of the reading norms
Means of Verification Completed monitoring toolsSigned list of schools monitored per quarter with dates monitoredConsolidated monitoring status annual report
Data limitations Some of the data is dependent on information from provinces which the DBE cannot confirm the accuracy thereof.
Assumptions Every learner can read fluently and with meaning in their Home Language and First Additional Language
Disaggregation of Beneficiaries (where applicable)
Target for Women: Not ApplicableTarget for Youth: Not ApplicableTarget for People with Disabilities: Not Applicable
Spatial Transformation(where applicable)
Reflect on contribution to spatial transformation priorities: Not ApplicableReflect on the spatial impact area: Not Applicable
Calculation type Non-Cumulative
Reporting cycle Annually
Desired performance To improve reading proficiency levels in public schools. To achieve the targets in the Action Plan towards 2024
Indicator responsibility Lead – Branch C: Curriculum Policy, Support and MonitoringSupport – Not Applicable

92
Indicator Title 2.2.2 Number of schools monitored on the implementation of the Incremental Introduction to African Languages(IIAL)
Definition The IIAL strategy is aimed at promoting the utilisation of previously marginalised African Languages in public schools that are not implementing an African Language in Grades 1-9. Desktop monitoring will be used. 10 schools will be evaluated using desktop monitoring. The desktop monitoring tool will be emailed to the schools.
Source of data Information is obtained through desktop monitoring.The desktop evaluation form will have a school stamp with a date and will be signed off by the school principal. The evaluation form will be verified by the District official by completing the relevant sections on the evaluation tool during their school monitoring and will submit to DBE.
Method of Calculation/ Assessment
Count the number of schools monitored on the implementation of the Incremental Introduction to AfricanLanguages (IIAL)
Means of Verification Completed monitoring toolsSigned list of schools monitored per quarter with dates monitoredConsolidated monitoring status annual report
Data limitations Some of the data is dependent on information from provinces which the DBE cannot confirm the accuracy thereof
Assumptions All schools offer a previously marginalised official African Language
Disaggregation of Beneficiaries(where applicable)
Target for Women: Not ApplicableTarget for Youth: Not ApplicableTarget for People with Disabilities: Not Applicable
Spatial Transformation(where applicable)
Reflect on contribution to spatial transformation priorities: Not ApplicableReflect on the spatial impact area: Not Applicable
Calculation type Non-Cumulative
Reporting cycle Annually
Desired performance To achieve the targets in the Action Plan towards 2024
Indicatorresponsibility Lead – Branch C: Curriculum Policy, Support and MonitoringSupport – Not Applicable
Indicator Title 2.2.3 Number of underperforming schools monitored on the implementation of the Early Grade Reading Assessment (EGRA)
Definition EGRA is a diagnostic reading assessment that is aimed at improving reading proficiency levels in the early grades. The monitoring will focus on Grades 2 and 3 classes. Monitoring will be done through desktop analysis.
Source of data Information is obtained through desktop monitoring.The desktop evaluation form will have a school stamp with a date and will be signed off by the school principal. The evaluation form will be verified by the District official by completing the relevant sections on the evaluation tool during their school monitoring and will submit to DBE.
Method of Calculation/ Assessment
Count the number of underperforming schools monitored on the implementation of the Early Grade ReadingAssessment (EGRA)
Means of Verification Completed monitoring toolsSigned list of schools monitored per quarter with dates monitoredConsolidated monitoring status annual report
Data limitations Some of the data is dependent on information from provinces which the DBE cannot confirm the accuracythereof
Assumptions Every learner can read fluently and with meaning in their Home Language and First Additional Language
Disaggregation of Beneficiaries(where applicable)
Target for Women: Not ApplicableTarget for Youth: Not ApplicableTarget for People with Disabilities: Not Applicable
Spatial Transformation(where applicable)
Reflect on contribution to spatial transformation priorities: Not ApplicableReflect on the spatial impact area: Not Applicable
Calculation type Non-Cumulative
Reporting cycle Annually
Desired performance To improve reading proficiency levels in public schools. To achieve the targets in the Action Plan towards 2024
Indicator responsibility Lead – Branch C: Curriculum Policy, Support and MonitoringSupport – Not Applicable

93
Indicator Title 2.2.4 Number of schools with Multi-grade classes monitored for implementing the Multi-grade toolkit
Definition The Multi-grade toolkit is a resource that was developed to support curriculum delivery in schools with Multi- grade classes. The Multi-grade toolkit caters for all subjects in the General Education Band from Grades 1-9.
Source of data Information is obtained through desktop monitoring
Method of Calculation/ Assessment
Count the number of schools with Multi-grade classes monitored for implementing the Multi-grade toolkit
Means of Verification Completed monitoring toolsSigned list of schools monitored per quarter with dates monitoredConsolidated monitoring status annual report
Data limitations Provinces will also provide data on schools monitored
Assumptions All schools with Multi-grade classes have Multi-grade toolkit
Disaggregation of Beneficiaries(where applicable)
Target for Women: Not ApplicableTarget for Youth: Not ApplicableTarget for People with Disabilities: Not Applicable
Spatial Transformation(where applicable)
Reflect on contribution to spatial transformation priorities: Not ApplicableReflect on the spatial impact area: Not Applicable
Calculation type Non-Cumulative
Reporting cycle Annually
Desired performance To achieve improved curriculum coverage in schools with Multi-grade classes
Indicatorresponsibility Lead – Branch C: Curriculum Policy, Support and MonitoringSupport – Not Applicable
Indicator Title 2.2.5 An Annual Sector Report is produced on the implementation of the National Reading Plan
Definition The National Reading Plan for primary schools is aimed at improving performance in Reading for Grades R-6.
Source of data Annual Sector Report will be produced by DBE, but the data will be collected from individual PED reports
Method ofCalculation / Assessment
An Annual Sector Report is produced on the implementation of the National Reading Plan
Means of verification • One (1) Annual Sector Report is produced on the implementation of the National Reading Plan• Nine (9) PED reports substantiating the Annual Sector Report
Data limitations PEDs may not submit data for the consolidation of the national report.
Assumptions All schools implement the National Reading Plan.
Disaggregation of Beneficia-ries(where applicable)
Target for Women: Not ApplicableTarget for Youth: Not ApplicableTarget for People with Disabilities: Not Applicable
Spatial Transformation(where applicable)
Reflect on contribution to spatial transformation priorities: Not ApplicableReflect on the spatial impact area: Not Applicable
Calculation Type Non-Cumulative
Reporting Cycle Annually
Desired performance To improve reading proficiency levels in public schools.
IndicatorResponsibility
Lead – Branch C: Curriculum Policy, Support and MonitoringSupport – Branch S, Branch T and O

94
Indicator Title 2.2.6 An Annual Sector Report is produced on the number of public schools monitored on the availability of readers
Definition Public Schools refer to schools within PEDs. Public schools receive financial allocations, part of which is used toprocure readers for learners themselves, or centrally at the Provincial Level.
Source of data Annual Sector Report will be produced by DBE, but the data will be collected from individual PED reports
Method ofCalculation / Assessment
An Annual Sector Report is produced on the number of public schools monitored on the availability of readers
Means of verification • One (1) Annual Sector Report is produced on the number of public schools monitored on the availability of readers
• Nine (9) PED reports substantiating the Annual Sector Report
Data limitations PEDs may not submit data for the consolidation of the national report.
Assumptions Readers are procured by the school/province; Readers are retrieved from learners each year.
Disaggregation of Beneficiaries(where applicable)
Target for Women: Not ApplicableTarget for Youth: Not ApplicableTarget for People with Disabilities: Not Applicable
Spatial Transformation(where applicable)
Reflect on contribution to spatial transformation priorities: Not ApplicableReflect on the spatial impact area: Not Applicable
Type of indicator Output
Calculation Type Non-Cumulative
Reporting Cycle Annually
Desired performance All (100%) of sampled public schools that are monitored have access to textbooks
IndicatorResponsibility
Lead – Branch D: Delivery and SupportSupport – Not Applicable
Indicator Title 2.3.1 Number of schools per province monitored for utilisation of Information and Communications Technology(ICT) resources
Definition To monitor all nine provinces on the utilisation of ICT resources in schools. The monitoring will include three identified schools in each province. Three schools in each province will be drawn from ongoing ICT projects.
Source of data Information is obtained through desktop monitoring
Method ofCalculation/ Assessment
Count the number of schools monitored for utilisation of Information and Communications Technology(ICT) resources
Means of Verification Completed monitoring toolsSigned list of schools monitored per quarter with dates monitoredConsolidated monitoring status annual report
Data limitations None
Assumptions All schools are provided with ICT resources
Disaggregation of Beneficiaries(where applicable)
Target for Women: Not ApplicableTarget for Youth: Not ApplicableTarget for People with Disabilities: Not Applicable
Spatial Transformation(where applicable)
Reflect on contribution to spatial transformation priorities: Not ApplicableReflect on the spatial impact area: Not Applicable
Calculation type Non-Cumulative
Reporting cycle Annually
Desired performance All schools have access to ICT resources.
Indicator responsibility Lead – Branch D: Delivery and SupportSupport – Not Applicable

95
Indicator Title 2.3.2 Percentage of public schools provided with Home Language workbooks for learners in Grades 1 to 6 per year, after having placed an order
Definition Public Schools refers to schools offering Grades 1-6 and which have placed Home Language workbook orders according to the provincial data submitted to DBE.Grade 1-6 workbooks are produced and delivered as follows:
Item Description Delivery PlanVolume 1 Grades 1-6 Home Languages Oct-Nov 2020Volume 2 Grades 1-6 Home Languages Jan-Feb 2021
Source of data DBE consolidated a list of schools that placed an order for Grades 1-6 Home Languages workbooks.DBE consolidated a list of schools in which Grades 1-6 Home Languages workbooks were delivered with hyperlinks to the delivery note.
Method of Calculation/Assessment
Numerator:Total number of public ordinary schools provided with Home Language workbooks Denominator:Total number public ordinary schools that have ordered Grade 1-6 workbooks Multiply by 100.
Means of Verification Signed copies of workbooksProof of deliveries
Data limitations Late learner admission; Rationalisation/merging of small schools; Schools placing an order on items not provided by DBE; Schools changing Language of Teaching and Learning after placement of workbook order; provinces submitting outdated data on learner numbers per grade; Omission of some grades or schools on the data submitted.
Assumptions • The Language of Learning and Teaching (LoLT) for schools submitted by provinces does not change• The names of schools submitted by provinces do not change.
Disaggregation of Beneficiaries applicable)
Target for Women: Not ApplicableTarget for Youth: Not ApplicableTarget for People with Disabilities: Not Applicable
Spatial Transformation(where applicable)
Reflect on contribution to spatial transformation priorities: Not ApplicableReflect on the spatial impact area: Not Applicable
Calculation type Non-Cumulative
Reporting cycle Annually
Desired performance Public schools with Grades 1-6 which have placed orders have access to Home Language workbooks in the correct language.
Indicatorresponsibility Lead – Branch D: Delivery and SupportSupport – Not Applicable

96
Indicator Title 2.3.3 Percentage of public schools provided with Mathematics workbooks for learners in Grades 1 to 9 per year, after having placed an order
Definition Public Schools refers to schools offering Grades 1-9 and which have placed Mathematics workbook orders according to the provincial data submitted to DBE.Grade 1-9 workbooks are produced and delivered are as follows:
Item Description Delivery PlanVolume 1 Grades 1-9 Mathematics Oct-Nov 2020Volume 2 Grades 1-9 Mathematics Jan-Feb 2021
Source of data DBE consolidated a list of schools that placed an order for Grade 1-9 Mathematics workbooks.DBE consolidated a list of schools in which Grades 1-9 Mathematics workbooks were delivered with hyperlinks to the delivery note.
Method of Calculation/ Assessment
Numerator: Total number of public ordinary schools provided with Mathematics workbooks Denominator: Total number of public ordinary schools that have ordered Grade 1-9 workbooks Multiply by 100.
Means of Verification Signed copies of workbooksProof of deliveries
Data limitations Late learner admission; Rationalisation/merging of small schools; Schools placing an order on items not provid- ed by DBE; Schools changing Language of Teaching and Learning after placement of workbook order; provinces submitting outdated data on learner numbers per grade; Omission of some grades or schools on the data submitted.
Assumptions • The Language of Learning and Teaching (LoLT) for schools submitted by provinces does not change• The names of schools submitted by provinces do not change.
Disaggregation of Beneficiaries (where applicable)
Target for Women: Not ApplicableTarget for Youth: Not ApplicableTarget for People with Disabilities: Not Applicable
Spatial Transformation(where applicable)
Reflect on contribution to spatial transformation priorities: Not ApplicableReflect on the spatial impact area: Not Applicable
Calculation type Non-Cumulative
Reporting cycle Annually
Desired performance Public schools with Grades 1-9 which have placed orders have access to Mathematics workbooks.
Indicator responsibility Lead – Branch D: Delivery and SupportSupport – Not Applicable

97
Indicator Title 2.3.4 Percentage of public schools provided with workbooks for learners in Grades R per year, after having placed an order
Definition Public Schools refer to schools offering Grade R and which have placed workbook orders according to the provincial data submitted to DBE.
Grade R workbooks are produced and delivered as Volume 1-4 as follows:
Item Description Delivery PlanBook 1
Grades ROct-Nov 2020
Book 2Book 3
Jan-Feb 2021Book 4
Source of data DBE consolidated a list of schools that placed an order for Grade R workbooks.
DBE consolidated a list of schools in which Grade R workbooks were delivered with hyperlinks to the delivery note.
Method of Calculation/ Assessment
Numerator:Total number of public ordinary schools provided with Grade R workbooks Denominator:Total number of public ordinary schools that have ordered Grade R workbooks Multiply by 100.
Means of Verification Signed copies of workbooks
Proof of deliveries
Data limitations Late learner admission; Rationalisation/merging of small schools; Schools placing an order on items not provided by DBE; Schools changing Language of Teaching and Learning after place workbook order; provinces submitting outdated data on learner number per grade; Omission of some grades or schools on the data submitted
Assumptions The Language of Learning and Teaching (LoLT) for schools submitted by provinces does not change
The names of schools submitted by provinces do not change.
Disaggregation of Beneficiaries (where applicable)
Target for Women: Not Applicable
Target for Youth: Not Applicable
Target for People with Disabilities: Not Applicable
Spatial Transformation
(where applicable)
Reflect on contribution to spatial transformation priorities: Not Applicable
Reflect on the spatial impact area: Not Applicable
Calculation type Non-Cumulative
Reporting cycle Annually
Desired performance Public schools with Grade R and which placed workbook orders have access to workbooks
Indicator responsibility Lead – Branch D: Delivery and SupportSupport – Not Applicable
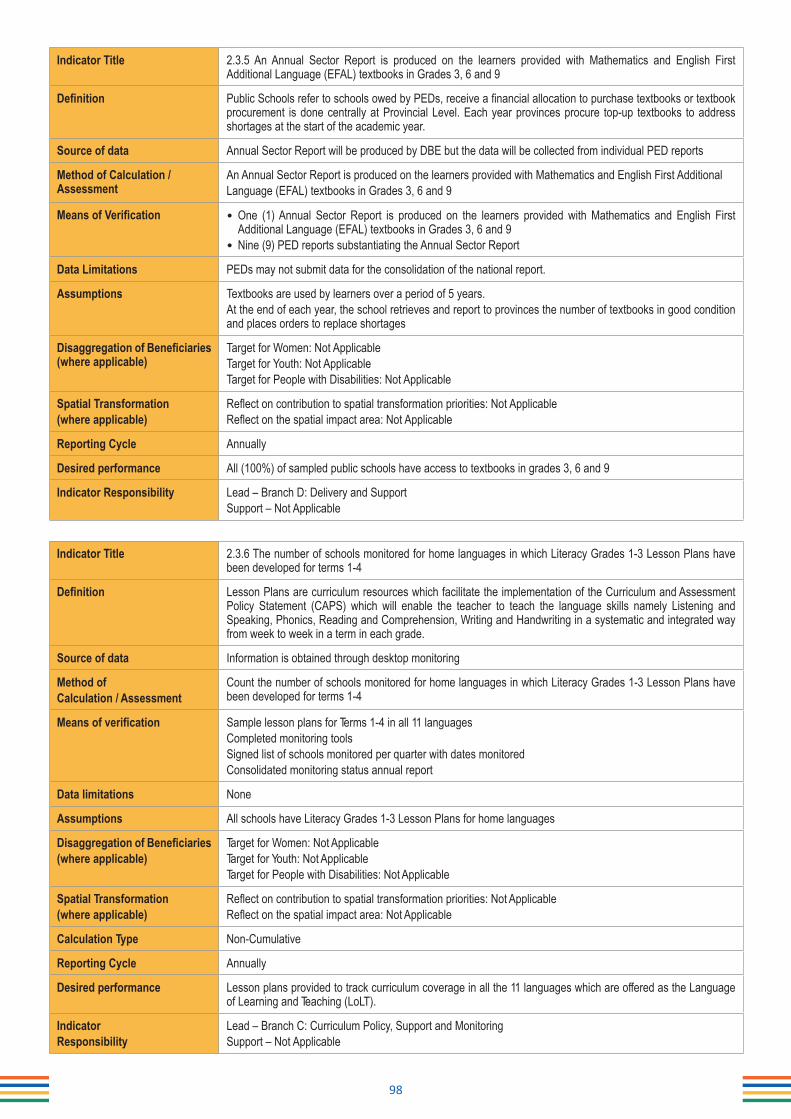
98
Indicator Title 2.3.5 An Annual Sector Report is produced on the learners provided with Mathematics and English First Additional Language (EFAL) textbooks in Grades 3, 6 and 9
Definition Public Schools refer to schools owed by PEDs, receive a financial allocation to purchase textbooks or textbook procurement is done centrally at Provincial Level. Each year provinces procure top-up textbooks to address shortages at the start of the academic year.
Source of data Annual Sector Report will be produced by DBE but the data will be collected from individual PED reports
Method of Calculation / Assessment
An Annual Sector Report is produced on the learners provided with Mathematics and English First AdditionalLanguage (EFAL) textbooks in Grades 3, 6 and 9
Means of Verification • One (1) Annual Sector Report is produced on the learners provided with Mathematics and English First Additional Language (EFAL) textbooks in Grades 3, 6 and 9
• Nine (9) PED reports substantiating the Annual Sector Report
Data Limitations PEDs may not submit data for the consolidation of the national report.
Assumptions Textbooks are used by learners over a period of 5 years.At the end of each year, the school retrieves and report to provinces the number of textbooks in good condition and places orders to replace shortages
Disaggregation of Beneficiaries (where applicable)
Target for Women: Not ApplicableTarget for Youth: Not ApplicableTarget for People with Disabilities: Not Applicable
Spatial Transformation(where applicable)
Reflect on contribution to spatial transformation priorities: Not ApplicableReflect on the spatial impact area: Not Applicable
Reporting Cycle Annually
Desired performance All (100%) of sampled public schools have access to textbooks in grades 3, 6 and 9
Indicator Responsibility Lead – Branch D: Delivery and Support Support – Not Applicable
Indicator Title 2.3.6 The number of schools monitored for home languages in which Literacy Grades 1-3 Lesson Plans have been developed for terms 1-4
Definition Lesson Plans are curriculum resources which facilitate the implementation of the Curriculum and Assessment Policy Statement (CAPS) which will enable the teacher to teach the language skills namely Listening and Speaking, Phonics, Reading and Comprehension, Writing and Handwriting in a systematic and integrated way from week to week in a term in each grade.
Source of data Information is obtained through desktop monitoring
Method ofCalculation / Assessment
Count the number of schools monitored for home languages in which Literacy Grades 1-3 Lesson Plans have been developed for terms 1-4
Means of verification Sample lesson plans for Terms 1-4 in all 11 languagesCompleted monitoring toolsSigned list of schools monitored per quarter with dates monitoredConsolidated monitoring status annual report
Data limitations None
Assumptions All schools have Literacy Grades 1-3 Lesson Plans for home languages
Disaggregation of Beneficiaries(where applicable)
Target for Women: Not ApplicableTarget for Youth: Not ApplicableTarget for People with Disabilities: Not Applicable
Spatial Transformation(where applicable)
Reflect on contribution to spatial transformation priorities: Not ApplicableReflect on the spatial impact area: Not Applicable
Calculation Type Non-Cumulative
Reporting Cycle Annually
Desired performance Lesson plans provided to track curriculum coverage in all the 11 languages which are offered as the Language of Learning and Teaching (LoLT).
IndicatorResponsibility
Lead – Branch C: Curriculum Policy, Support and MonitoringSupport – Not Applicable

99
Indicator Title 2.3.7 Number of special schools with access to electronic devices
Definition The department has developed a comprehensive plan to deliver LTSM on devices to all schools starting with special schools then Multi-grade and farm schools, quintile 1-5 schools
Source of data Information is sourced from schools that received the devices
Method ofCalculation / Assessment
Count the number of special schools with access to electronic devices
Means of verification Signed list of recipient schoolsProof of deliveries
Data limitations None
Assumptions Network Operators will deliver the resources
Disaggregation of Beneficiaries (where applicable)
Target for Women: Not ApplicableTarget for Youth: Not ApplicableTarget for People with Disabilities: Not Applicable
Spatial Transformation (where applicable)
Reflect on contribution to spatial transformation priorities: Not ApplicableReflect on the spatial impact area: Not Applicable
Calculation Type Non-Cumulative
Reporting Cycle Annually
Desired performance Curriculum delivery at all special schools are supported through the use of technology.
IndicatorResponsibility
Lead – Branch D: Delivery and SupportSupport – Branch C: Curriculum Policy, Support and Monitoring
Indicator title 2.4.1 An Annual Sector Report is produced on the number of teachers trained on inclusion
Short definitions Training on inclusion includes training on Braille, Autism, South African Sign Language, psychosocial issues, and others.
Source/Collection of data Annual Sector Report will be produced by DBE but the data will be collected from individual PED reports
Method of calculation An Annual Sector Report is produced on the number of teachers trained on inclusion
Means of verification • One (1) Annual Sector Report is produced on the number of teachers trained on inclusion• Nine (9) PED reports substantiating the Annual Sector Report
Data limitations PEDs may not submit data for the consolidation of the national report.
Assumptions All teachers teaching learners with disabilities are trained in specialised areas of inclusion.
Disaggregation of Beneficiaries (where applicable)
Target for Women: Not ApplicableTarget for Youth: Not ApplicableTarget for People with Disabilities: Not Applicable
Spatial Transformation(where applicable)
Reflect on contribution to spatial transformation priorities: Not ApplicableReflect on the spatial impact area: Not Applicable
Type of indicator Output
Calculation type Non-Cumulative
Reporting cycle Annually
Desired performance All teachers teaching in special schools will receive appropriate training on inclusion
Indicator responsibility Lead – Branch C: Curriculum Policy, Support and MonitoringSupport – Branch T: Teachers, Education Human Resources and Institutional Development
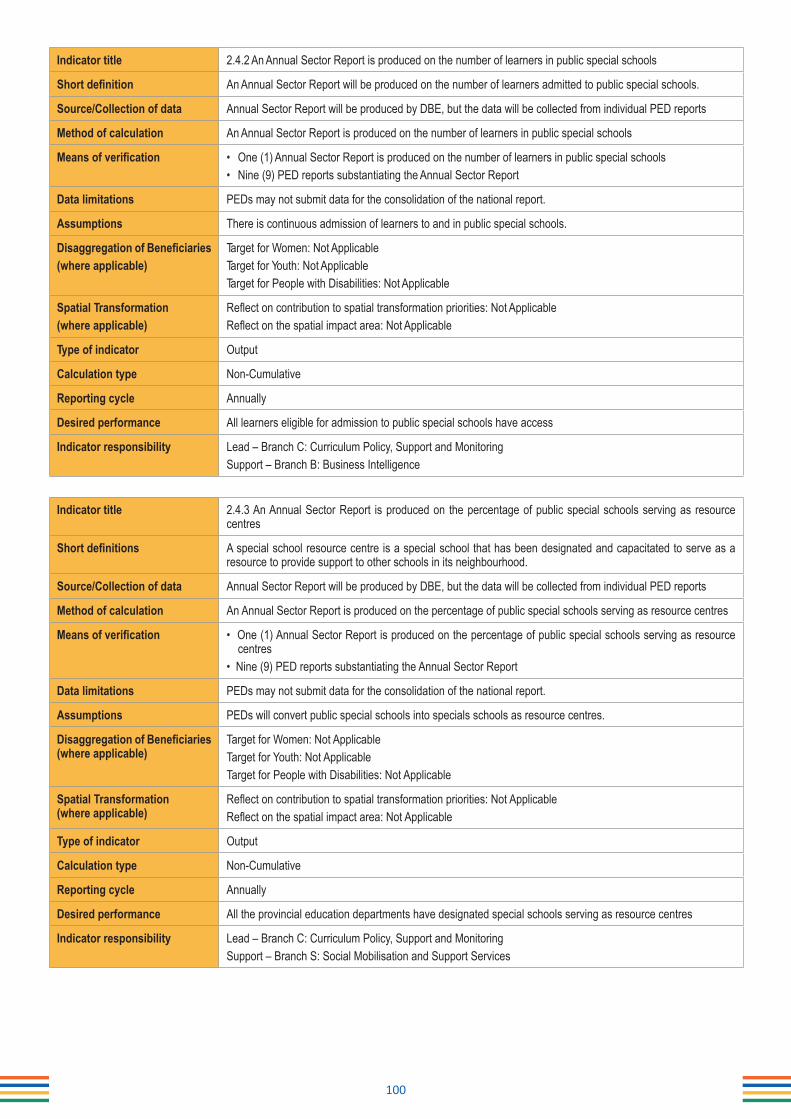
100
Indicator title 2.4.2 An Annual Sector Report is produced on the number of learners in public special schools
Short definition An Annual Sector Report will be produced on the number of learners admitted to public special schools.
Source/Collection of data Annual Sector Report will be produced by DBE, but the data will be collected from individual PED reports
Method of calculation An Annual Sector Report is produced on the number of learners in public special schools
Means of verification • One (1) Annual Sector Report is produced on the number of learners in public special schools• Nine (9) PED reports substantiating the Annual Sector Report
Data limitations PEDs may not submit data for the consolidation of the national report.
Assumptions There is continuous admission of learners to and in public special schools.
Disaggregation of Beneficiaries(where applicable)
Target for Women: Not ApplicableTarget for Youth: Not ApplicableTarget for People with Disabilities: Not Applicable
Spatial Transformation(where applicable)
Reflect on contribution to spatial transformation priorities: Not ApplicableReflect on the spatial impact area: Not Applicable
Type of indicator Output
Calculation type Non-Cumulative
Reporting cycle Annually
Desired performance All learners eligible for admission to public special schools have access
Indicator responsibility Lead – Branch C: Curriculum Policy, Support and MonitoringSupport – Branch B: Business Intelligence
Indicator title 2.4.3 An Annual Sector Report is produced on the percentage of public special schools serving as resource centres
Short definitions A special school resource centre is a special school that has been designated and capacitated to serve as a resource to provide support to other schools in its neighbourhood.
Source/Collection of data Annual Sector Report will be produced by DBE, but the data will be collected from individual PED reports
Method of calculation An Annual Sector Report is produced on the percentage of public special schools serving as resource centres
Means of verification • One (1) Annual Sector Report is produced on the percentage of public special schools serving as resource centres
• Nine (9) PED reports substantiating the Annual Sector Report
Data limitations PEDs may not submit data for the consolidation of the national report.
Assumptions PEDs will convert public special schools into specials schools as resource centres.
Disaggregation of Beneficiaries (where applicable)
Target for Women: Not ApplicableTarget for Youth: Not ApplicableTarget for People with Disabilities: Not Applicable
Spatial Transformation (where applicable)
Reflect on contribution to spatial transformation priorities: Not ApplicableReflect on the spatial impact area: Not Applicable
Type of indicator Output
Calculation type Non-Cumulative
Reporting cycle Annually
Desired performance All the provincial education departments have designated special schools serving as resource centres
Indicator responsibility Lead – Branch C: Curriculum Policy, Support and MonitoringSupport – Branch S: Social Mobilisation and Support Services

101
Indicator Title 2.4.4 An Annual Sector Report is produced on the establishment of Focus Schools per Provincial EducationDepartment
Definition As part of the skills for the changing world the department is promoting the establishment of focused schools/ schools of specialisation across all provinces in line with economic development zones. These schools are intended to respond to the demand for specific skills. 11 types of focus schools/ schools of specialisations have been identified
Source of data Annual Sector Report will be produced by DBE, but the data will be collected from individual PED reports
Method ofCalculation / Assessment
An Annual Sector Report is produced on the establishment of Focus Schools per Provincial EducationDepartment
Means of verification • One (1) Annual Sector Report is produced on the establishment of Focus Schools per Provincial Education Department
• Nine (9) PED reports substantiating the Annual Sector Report
Data limitations PEDs may not submit data for the consolidation of the national report.
Assumptions Provinces will have plans for the establishment of focus schools
Disaggregation of Beneficiaries (where applicable)
Target for Women: Not ApplicableTarget for Youth: Not ApplicableTarget for People with Disabilities: Not Applicable
Spatial Transformation(where applicable)
Reflect on contribution to spatial transformation priorities: Not ApplicableReflect on the spatial impact area: Not Applicable
Type of indicator Output
Calculation Type Non-Cumulative
Reporting Cycle Annually
Desired performance Schools focused on teaching and promoting specific group of subjects are established throughout the country.
IndicatorResponsibility
Lead – Branch D: Delivery and SupportSupport – Not Applicable

102
Programme 3: Teachers, Education Human Resources and Institutional Development
Indicator Title 3.1.1 Percentage of School Governing Bodies (SGBs) that meet the minimum criteria in terms of effectiveness
Definition The South African Schools Act, 84 1996 prescribes roles and responsibilities for School Governing Bodies (SGBs). A School Governing Body is regarded as being functional and effective if it scores an average of 60% of its allocated functions. The following categories are used to determine the effectiveness of SGBs:a) Policies;b) Meetings;c) School assets;d) School’s finances; ande) Curriculum mattersEach category has weighed sub-questions to determine effectiveness.
Source of data Information is obtained through an electronic survey
Method ofCalculation/ Assessment
Numerator: Total number of schools sampled that meet the minimum criteriaDenominator: Total number of schools sampledMultiply by 100
Means of Verification Completed survey toolsSigned list of sampled schoolsSigned list of schools that meet the minimum criteria
Data limitations Reliability of data from schools
Assumptions The survey will be conducted according to the Management Plan
Disaggregation of Beneficiaries(where applicable)
Target for Women: Not ApplicableTarget for Youth: Not ApplicableTarget for People with Disabilities: Not Applicable
Spatial Transformation(where applicable)
Reflect on contribution to spatial transformation priorities: Not ApplicableReflect on the spatial impact area: Not Applicable
Calculation type Non-Cumulative
Reporting cycle Annually
Desired performance All schools should have effective SGBs operating within the legislation to support effective teaching and learning.
Indicator responsibility Lead – Branch D: Delivery and SupportSupport – Not Applicable

103
Indicator Title 3.1.2 Percentage of schools producing the minimum set of management documents at a required standard
Definition The minimum set of management documents are basic documents viewed to be mandatory for the effectiveness of management processes in any school. The main documents comprise 16 items divided into 3 categories namely, management documents, registers and governance documents. The listed compulsory management documents are:a) Annual Academic Performance Report; b) School Improvement Plan (short term); c) School Development Plan (long term); d) School Timetable;e) Classroom Timetables;f) Teacher’s Personal Timetables; and g) Quarterly Learner Achievement Data.Listed compulsory registers that every school must have are:a) Admission Register;b) Educator Daily Attendance Register;c) Learner Attendance Register;d) Educator Leave Register;e) Period Registers;f) School Assets Register; and g) LTSM Assets Register.Documents from the governance section are:a) Audited Financial Statements; and b) Approved School Budget
Source of data Information is obtained through an electronic survey
Method ofCalculation/ Assessment
Numerator: Total number of schools from the sample selected found to be functional by having produced the basic set of documentsDenominator: Total number of schools surveyedMultiply by 100
Means of Verification Completed survey toolsSigned list of sampled schoolsSigned list of schools with a minimum set of management documents
Data limitations Officials conducting the survey may not interpret the findings in a uniform manner
Assumptions The survey will be conducted according to the Management Plan
Disaggregation of Beneficiaries(where applicable)
Target for Women: Not ApplicableTarget for Youth: Not ApplicableTarget for People with Disabilities: Not Applicable
Spatial Transformation(where applicable)
Reflect on contribution to spatial transformation priorities: Not ApplicableReflect on the spatial impact area: Not Applicable
Calculation type Non-Cumulative
Reporting cycle Annually
Desired performance All schools must be able to produce minimum management documents
Indicator responsibility Lead – Branch D: Delivery and SupportSupport – Not Applicable

104
Indicator Title 3.1.3 Number of Funza Lushaka bursaries awarded to students enrolled for Initial Teacher Education
Definition Number of Funza Lushaka bursaries awarded for Initial Teacher Education students in the first, second, third and fourth-year, as well as Postgraduate Certificate in Education (PGCE), and programmes that offer teaching subjects but are not teacher education qualifications in higher education institutions. The following are examples of qualifications awarded: (B.Ed. or a B Com, B Sc., B Tech, B Soc. Sc. followed by a PGCE).The bursaries are awarded to students (identified through ID numbers), meaning that the lists with names ofstudents selected according to the criteria set.
Source of data Application for bursariesProof of registration from the university
Method ofCalculation/ Assessment
Count the number of Funza Lushaka bursaries awarded to Initial Teacher Education students in the first, second, third and fourth-year, as well as PGCE students, and programmes that offer teaching subjects but are not teacher education qualifications in higher education institutions.
Means of Verification A list of awarded beneficiaries of the Funza Lushaka bursary programme from the DBE
Data limitations As a result of fee changes in institutions, bursary that fail to register, cancel the bursary, decline the bursary or become deceased, the number of students awarded the bursary may not be the exact number enrolled.
Assumptions The list of awarded beneficiaries of the Funza Lushaka bursary programme is based on the database of applications received
Disaggregation of Beneficiaries(where applicable)
Target for Women: Not ApplicableTarget for Youth: Not ApplicableTarget for People with Disabilities: Not Applicable
Spatial Transformation(where applicable)
Reflect on contribution to spatial transformation priorities: Not ApplicableReflect on the spatial impact area: Not Applicable
Calculation type Non-Cumulative
Reporting cycle Annually
Desired performance To utilise the bursary to train more graduates for the education profession.
Indicator responsibility Lead – Branch T: Teachers, Education Human Resources and Institutional DevelopmentSupport – Not Applicable

105
Indicator Title 3.1.4 Number of quarterly monitoring reports tracking the percentage of Funza Lushaka graduates placed within six months upon confirmation that the bursar has completed studies
Definition A quarterly monitoring report will track progress on the rate of appointment of Funza Lushaka graduates overall, and the rate of their appointment within six months of completion of their studies. Elements of the Report will, at least, include:• The total number of allocated graduates eligible for placement per province• Total number of graduates placed during the reporting quarter and the year to date.• Total number and percentage of graduates placed within six months within the reporting quarter and the year
to date“Placed” is defined as securing an appointment at a school in a permanent capacity as captured on PERSALReporting will be according to the academic year.
Source of data PERSAL downloads obtained from National Treasury (PERSAL) The Funza Lushaka database of graduates eligible for placement PED Monthly Reports
Method ofCalculation / Assessment
Count the number of signed quarterly monitoring reports tracking the percentage of Funza Lushaka graduatesplaced within six months upon confirmation that the bursar has completed studies
Means of verification Four signed quarterly monitoring reports
Data Limitations Capturing of appointments on PERSAL and changing of the nature of appointment e.g. from temporary to permanent, may delay and thus affecting the accuracy of numbers across quarters. That is, the sum of reported quarterly totals may not reconcile with updated annual totals.
Assumptions Appointments on PERSAL are accurately captured in terms of the critical fields such as the nature of appointment and date of appointment.
Disaggregation of Beneficiaries (where applicable)
Target for Women: Not ApplicableTarget for Youth: Not ApplicableTarget for People with Disabilities: Not Applicable
Spatial Transformation (where applicable)
Not Applicable
Calculation Type Cumulative (Year-End)
Reporting Cycle Quarterly
Desired performance Improvement in Funza Lushaka graduate placement rates
Indicator Responsibility Lead – Branch T: Teachers, Education Human Resources and Institutional DevelopmentSupport – Not Applicable

106
Indicator Title 3.1.5 Number of quarterly monitoring reports indicating the number and percentage of schools where allocatedteaching posts are all filled
Definition A quarterly monitoring report will track the extent of the filling of vacant posts at schools focusing on the extent to which schools fill their allocated posts. The elements of the report will at least include the following:• The total number of schools per province.• The total number and percentage of schools per province where all allocated posts are filled.
Source of data PERSAL downloads obtained from National Treasury (PERSAL).Data of allocated posts to schools as per the post establishment tables. PED aggregated quarterly reports.
Method ofCalculation / Assessment
Count the number of signed quarterly monitoring reports indicating the number and percentage of schoolswhere allocated teaching posts are all filled
Means of verification Four signed quarterly monitoring reports
Data limitations The reporting will rely on PERSAL and there may be a discrepancy between the post establishmentscaptured on PERSAL and that reflected on the actual post establishment distributed to schoolsEducators not allocated to the correct Pay point or Component
Assumptions All PEDs declare final school post establishments and load such on PERSAL
Disaggregation of Beneficiaries(where applicable)
Target for Women: Not ApplicableTarget for Youth: Not ApplicableTarget for People with Disabilities: Not Applicable
Spatial Transformation(where applicable)
Not Applicable
Calculation Type Cumulative (Year-End)
Reporting Cycle Quarterly
Desired performance Timeous filling of vacant posts in schools
IndicatorResponsibility
Lead – Branch T: Teachers, Education Human Resources and Institutional DevelopmentSupport – Not Applicable

107
Indicator Title 3.1.6 An Annual Sector Report is produced on the number of qualified teachers aged 30 and below entering the public service as teachers
Definition The total number of educators aged 30 and below possessing a minimum qualification level of REQV13 who were appointed in posts during the financial year. The type of appointments made includes:Permanent appointmentTemporary appointment: occupying a vacant position usually for a year or twoRelieve appointment occupying a post of a permanent teacher who is temporarily not at school due to conditions such as ill-health, maternity leave, suspension, etc.Part-time: permanently appointed but only work for a limited number of hoursThe report will, at least, include:Main reporting elements: Number of educators, qualification (REQV) level, and ageBasic demographics – Province, Gender, Race
Source of data PERSAL downloads obtained from National Treasury (PERSAL)
Method ofCalculation / Assessment
An Annual Sector Report is produced on the number of qualified teachers aged 30 and below entering the publicservice as teachers
Means of verification • One (1) Annual Sector Report is produced on the number of qualified teachers aged 30 and below entering the public service as teachers
• Nine (9) PED reports substantiating the Annual Sector Report
Data limitations Data is not always readily available at the time of reporting (up to one month lag)
Assumptions Appointments details captured on PERSAL are accurate
Disaggregation of Beneficiaries(where applicable)
Target for Women: Not ApplicableTarget for Youth: Not ApplicableTarget for People with Disabilities: Not Applicable
Spatial Transformation(where applicable)
Reflect on contribution to spatial transformation priorities: Not ApplicableReflect on the spatial impact area: Not Applicable
Calculation Type Non-Cumulative
Reporting Cycle Annually
Desired performance A signed report covering all basic elements
IndicatorResponsibility
Lead – Branch T: Teachers, Education Human Resources and Institutional DevelopmentSupport – Not Applicable
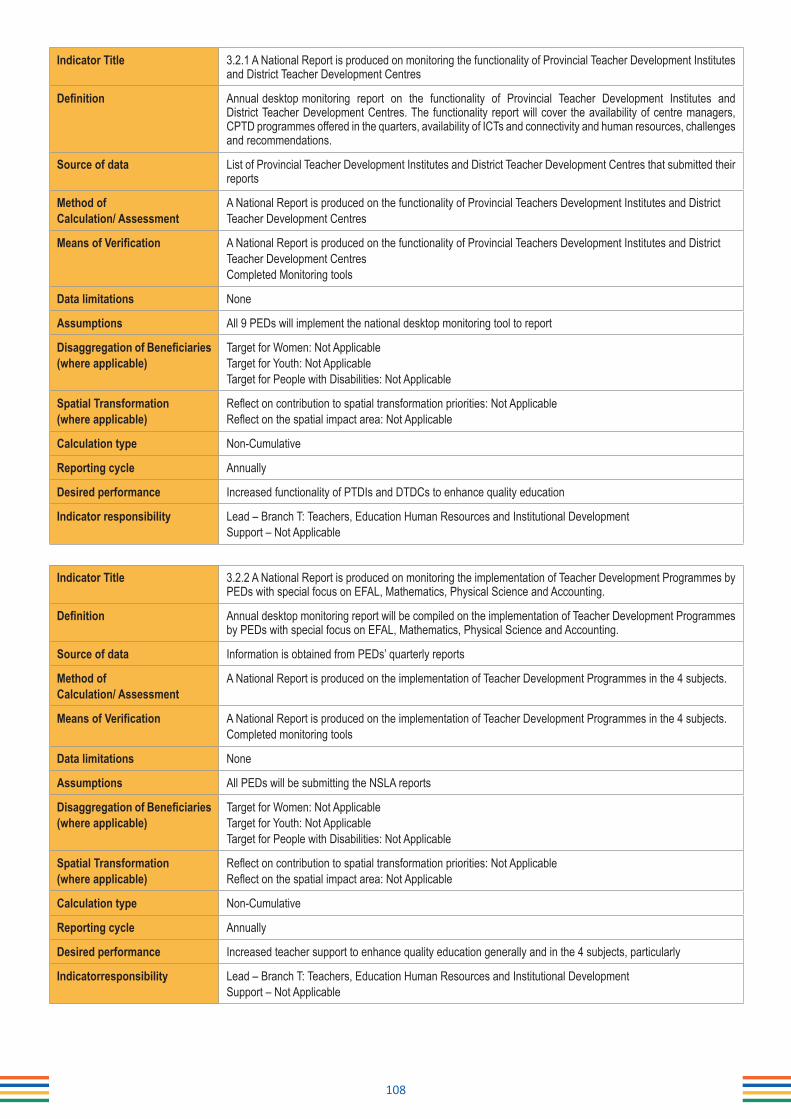
108
Indicator Title 3.2.1 A National Report is produced on monitoring the functionality of Provincial Teacher Development Institutes and District Teacher Development Centres
Definition Annual desktop monitoring report on the functionality of Provincial Teacher Development Institutes and District Teacher Development Centres. The functionality report will cover the availability of centre managers, CPTD programmes offered in the quarters, availability of ICTs and connectivity and human resources, challenges and recommendations.
Source of data List of Provincial Teacher Development Institutes and District Teacher Development Centres that submitted their reports
Method ofCalculation/ Assessment
A National Report is produced on the functionality of Provincial Teachers Development Institutes and DistrictTeacher Development Centres
Means of Verification A National Report is produced on the functionality of Provincial Teachers Development Institutes and DistrictTeacher Development CentresCompleted Monitoring tools
Data limitations None
Assumptions All 9 PEDs will implement the national desktop monitoring tool to report
Disaggregation of Beneficiaries(where applicable)
Target for Women: Not ApplicableTarget for Youth: Not ApplicableTarget for People with Disabilities: Not Applicable
Spatial Transformation(where applicable)
Reflect on contribution to spatial transformation priorities: Not ApplicableReflect on the spatial impact area: Not Applicable
Calculation type Non-Cumulative
Reporting cycle Annually
Desired performance Increased functionality of PTDIs and DTDCs to enhance quality education
Indicator responsibility Lead – Branch T: Teachers, Education Human Resources and Institutional DevelopmentSupport – Not Applicable
Indicator Title 3.2.2 A National Report is produced on monitoring the implementation of Teacher Development Programmes by PEDs with special focus on EFAL, Mathematics, Physical Science and Accounting.
Definition Annual desktop monitoring report will be compiled on the implementation of Teacher Development Programmes by PEDs with special focus on EFAL, Mathematics, Physical Science and Accounting.
Source of data Information is obtained from PEDs’ quarterly reports
Method ofCalculation/ Assessment
A National Report is produced on the implementation of Teacher Development Programmes in the 4 subjects.
Means of Verification A National Report is produced on the implementation of Teacher Development Programmes in the 4 subjects.Completed monitoring tools
Data limitations None
Assumptions All PEDs will be submitting the NSLA reports
Disaggregation of Beneficiaries (where applicable)
Target for Women: Not ApplicableTarget for Youth: Not ApplicableTarget for People with Disabilities: Not Applicable
Spatial Transformation(where applicable)
Reflect on contribution to spatial transformation priorities: Not ApplicableReflect on the spatial impact area: Not Applicable
Calculation type Non-Cumulative
Reporting cycle Annually
Desired performance Increased teacher support to enhance quality education generally and in the 4 subjects, particularly
Indicatorresponsibility Lead – Branch T: Teachers, Education Human Resources and Institutional DevelopmentSupport – Not Applicable

109
Indicator Title 3.2.3 Number of PEDs that had their post provisioning processes assessed for compliance with the post- provisioning norms and standards.
Definition The monitoring of the implementation of the Norms and Standards is done both at the process and technical levels to ensure all the factors and weightings as stipulated in the model are applied.Processes assessed include distribution of posts to schools; declaration of excess posts and vacancies; identification of excess educators; redeployment of excess educators and filling of vacanciesTechnical assessment includes a review of data used; factors and weightings used etc. Provinces avail data used to determine the post establishment and model used with all the original factors and weightings.
Source of data Virtual sessions/meetings held with PED officials responsible for implementation wherein an approved template is administered to collect data.
Method ofCalculation/ Assessment
Count the number of PEDs that had their post provisioning processes assessed for compliance with the post- provisioning norms and standards.
Means of Verification Signed PED post-provisioning plansSigned consolidated monitoring implementation report
Data limitations None
Assumptions PEDs issue staff establishments for the following academic year to schools in the fourth quarter of the preceding academic year
Disaggregation of Beneficiaries(where applicable)
Target for Women: Not ApplicableTarget for Youth: Not ApplicableTarget for People with Disabilities: Not Applicable
Spatial Transformation(where applicable)
Reflect on contribution to spatial transformation priorities: Not ApplicableReflect on the spatial impact area: Not Applicable
Calculation type Non-Cumulative
Reporting cycle Annually
Desired performance All PEDs have their implementation processes assessed.
Indicatorresponsibility Lead – Branch T: Teachers, Education Human Resources and Institutional DevelopmentSupport – Not Applicable
Indicator Title 3.2.4 An Annual Sector Report is produced on the number of Grade R practitioners with at least NQF level 6 and above qualification
Definition A collated Annual Sector Report produced on the number of Grade R practitioners with at least NQF level 6 and above qualification
Source of data Appointments on PERSAL and reports from PEDs for those practitioners either employed by SGBs or not properly reflected on PERSAL
Method ofCalculation / Assessment
An Annual Sector Report is produced on the number of Grade R practitioners with at least NQF level 6 and above qualification
Means of verification • One (1) Annual Sector Report is produced on the number of Grade R practitioners with at least NQF level 6 and above qualification
• Nine (9) PED reports substantiating the Annual Sector Report
Data limitations Data is not always readily available
Assumptions Qualifications should be those that appear on the policy for minimum requirements for teacher qualification for holders to be qualified Grade R teachers
Disaggregation of Beneficiaries(where applicable)
Target for Women: Not ApplicableTarget for Youth: Not ApplicableTarget for People with Disabilities: Not Applicable
Spatial Transformation(where applicable)
Reflect on contribution to spatial transformation priorities: Not ApplicableReflect on the spatial impact area: Not Applicable
Calculation Type Non-Cumulative
Reporting Cycle Annually
Desired performance Increased number of appropriately qualified Grade R teachers to implement compulsory Grade R
IndicatorResponsibility
Lead – Branch T: Teachers, Education Human Resources and Institutional DevelopmentSupport – Not Applicable

110
Indicator Title 3.3.1 Number of PEDs monitored on the Integrated Quality Management System (IQMS)
Definition The Integrated Quality Management System (IQMS) is a performance management system for school-based educators, designed to evaluate the performance levels of educators in order to achieve high levels of school performance. IQMS provides a mechanism for assessing educators, taking into account the context within which they operate. The DBE monitors the training and implementation of the IQMS in all PEDs.
Source of data Information is obtained through desktop monitoring
Method ofCalculation/ Assessment
Count the number of PEDs monitored on the IQMS
Means of Verification Completed monitoring toolsSigned list of provinces, district offices and schools monitored with dates monitoredConsolidated monitoring status annual report
Data limitations Incomplete information and non-availability of summative evaluation reports at schools, district and provincialoffice.
Assumptions PEDs have mechanisms in place to monitor the implementation of the performance management system for school-based educatorsSchool principals ensure that the IQMS is implemented uniformly and effectively.Evidence on the implementation of the IQMS is available at schools, district and head office.
Disaggregation of Beneficiaries(where applicable)
Target for Women: Not ApplicableTarget for Youth: Not ApplicableTarget for People with Disabilities: Not Applicable
Spatial Transformation(where applicable)
Reflect on contribution to spatial transformation priorities: Not ApplicableReflect on the spatial impact area: Not Applicable
Calculation type Non-Cumulative
Reporting cycle Annually
Desired performance Teacher performance and learner achievement improves through the enhanced implementation of IQMS
Indicator responsibility Lead – Branch T: Teachers, Education Human Resources and Institutional DevelopmentSupport – Not Applicable

111
Indicator Title 3.3.2 Number of PEDs monitored on the implementation of the Education Management Service: PerformanceManagement and Development System (EMS: PMDS)
Definition The Education Management Service: Performance Management and Development System (EMS: PMDS) provides a standardised framework for managing the performance of office-based educators. As a performance management system, it is aimed at improving employee performance in terms of quality and quantity. The DBE monitors the implementation of the EMS: PMDS in all PEDs.
Source of data Information is obtained through desktop monitoring
Method ofCalculation/ Assessment
Count the number of PEDs monitored on the implementation of EMS: PMDS
Means of Verification Completed monitoring toolsSigned list of provincial officials evaluatedSigned list of district officials evaluatedConsolidated monitoring status annual report
Data limitations Incomplete information and non-availability of Annual Appraisal Reports in PEDs.
Assumptions PEDs have mechanisms in place to monitor the implementation of EMS: PMDS
Disaggregation of Beneficiaries(where applicable)
Target for Women: Not ApplicableTarget for Youth: Not ApplicableTarget for People with Disabilities: Not Applicable
Spatial Transformation(where applicable)
Reflect on contribution to spatial transformation priorities: Not ApplicableReflect on the spatial impact area: Not Applicable
Calculation type Non-Cumulative
Reporting cycle Annually
Desired performance Educator performance and learner achievement improve through the enhanced implementation of EMS: PMDS.
Indicator responsibility Lead – Branch T: Teachers, Education Human Resources and Institutional DevelopmentSupport – Not Applicable

112
Programme 4: Planning, Information and Assessment
Indicator Title 4.1.1 Number of new schools built and completed through ASIDI
Definition This indicator measures the total number of public schools where a contractor was appointed and the construction work has progressed to achieve practical completion in a given year through ASIDI.This indicator applies to both new and replacement schools.Practical completion means the stage of completion where, in the opinion of the principal agent, completion of the works has substantially been reached and can effectively be used for the purposes intended. The works can be completed as a whole or in sections.
Source of data Practical Completion (PC) Certificates received from Implementing Agents (IAs)
Method ofCalculation/ Assessment
Count the number of schools that have reached practical completion.
Means of Verification Practical Completion CertificatesLists of schools built from inappropriate material
Data limitations Vandalism and natural disasters may lead to more schools that do not meet minimum infrastructure standards
Assumptions All infrastructure provision to be in line with the Norms and Standards for School Infrastructure
Disaggregation of Beneficiaries(where applicable)
Target for Women: Not ApplicableTarget for Youth: Not ApplicableTarget for People with Disabilities: Not Applicable
Spatial Transformation(where applicable)
Reflect on contribution to spatial transformation priorities: Not ApplicableReflect on the spatial impact area: Not Applicable
Calculation type Non-Cumulative
Reporting cycle Annually
Desired performance All children to have access to public schools with basic services and appropriate infrastructure.
Indicator responsibility Lead – Branch I: InfrastructureSupport – Not Applicable
Indicator Title 4.1.2 Number of schools provided with sanitation facilities through ASIDI
Definition This indicator measures the total number of public schools where a contractor was appointed and the construction work has progressed to achieve practical completion in a given year through ASIDI.This measure applies to existing schools and excludes new schools. Sanitation refers to all kinds of toilets including water-borne and dry sanitationPractical completion means the stage of completion where, in the opinion of the principal agent, completion of the works has substantially been reached and can effectively be used for the purposes intended. The works can be completed as a whole or in sections.
Source of data Practical Completion (PC) Certificates received from Implementing Agents (IAs)
Method ofCalculation/ Assessment
Count the number of schools provided with sanitation facilities through ASIDI that have reached practical completion.
Means of Verification Practical Completion CertificatesList of schools that have reached practical completion in provision of sanitation
Data limitations Vandalism and natural disasters may lead to more schools that do not meet minimum sanitation standards.
Assumptions All schools must have access to sanitation in line with the Norms and Standards for School Infrastructure
Disaggregation of Beneficiaries(where applicable)
Target for Women: Not ApplicableTarget for Youth: Not ApplicableTarget for People with Disabilities: Not Applicable
Spatial Transformation(where applicable)
Reflect on contribution to spatial transformation priorities: Not ApplicableReflect on the spatial impact area: Not Applicable
Calculation type Non-Cumulative
Reporting cycle Annually
Desired performance All public schools to have access to sanitation facilities.
Indicator responsibility Lead – Branch I: InfrastructureSupport – Not Applicable

113
Indicator Title 4.1.3 Number of schools provided with water facilities through ASIDI
Definition This indicator measures the total number of public schools where a contractor was appointed and the construction work has progressed to achieve practical completion in a given year through ASIDI.This measure applies to existing schools and excludes new schools. Water supply municipal supply and groundwater supply.Practical completion means the stage of completion where, in the opinion of the principal agent, completion of the works has substantially been reached and can effectively be used for the purposes intended. The works can be completed as a whole or in sections.
Source of data Practical Completion (PC) Certificates received from Implementing Agents (IAs).
Method ofCalculation/ Assessment
Count the number of schools provided with water facilities through ASIDI that have reached practical completion stage.
Means of Verification Practical Completion CertificatesList of schools that have reached practical completion in provision of water facilities
Data limitations Delineating of roles between Education Departments and Municipalities
Assumptions All schools must have access to water in line with the Norms and Standards for School Infrastructure
Disaggregation of Beneficiaries(where applicable)
Target for Women: Not ApplicableTarget for Youth: Not ApplicableTarget for People with Disabilities: Not Applicable
Spatial Transformation(where applicable)
Reflect on contribution to spatial transformation priorities: Not ApplicableReflect on the spatial impact area: Not Applicable
Calculation type Non-Cumulative
Reporting cycle Annually
Desired performance All public schools to have access to water infrastructure.
Indicator responsibility Lead – Branch I: InfrastructureSupport – Not Applicable
Indicator Title 4.1.4 Number of schools served with emergency water supply
Definition This indicator measures the total number of public schools where an implementing agent appointed under the COVID-19 Emergency Water Supply programme :a) Installed on-site storage tank on a temporary foundation and filled it with waterb) Filled an existing on-site storage tank with water.This measure applies to existing schools and excludes new schools.
Source of data “Happy Letter” signed by the implementing agent and a representative from the school
Method ofCalculation/ Assessment
Count the number of schools where signed “Happy Letters” confirm that such schools have been served with water under the COVID-19 Emergency Water Supply programme.
Means of Verification Signed “Happy Letter” per schoolList of schools where signed “Happy Letters” confirm that such schools have been served with water under the COVID-19 Emergency Water Supply programme.
Data limitations Delineating of roles between Education Departments and Municipalities
Assumptions All schools must have access to water in line with the Norms and Standards for School Infrastructure
Disaggregation of Beneficiaries(where applicable)
Target for Women: Not ApplicableTarget for Youth: Not ApplicableTarget for People with Disabilities: Not Applicable
Spatial Transformation(where applicable)
Reflect on contribution to spatial transformation priorities: Not ApplicableReflect on the spatial impact area: Not Applicable
Calculation type Non-Cumulative
Reporting cycle Annually
Desired performance COVID-19 Emergency Water Supply programme deliverables fulfilled
Indicator responsibility Lead – Branch I: Infrastructure Support – Not Applicable

114
Indicator Title 4.1.5 Number of schools served with emergency sanitation
Definition This indicator measures the total number of public schools where an implementing agent appointed under the COVID-19 Emergency Sanitation programme delivered, installed and serviced a mobile chemical toilet.This measure applies to existing schools and excludes new schools.
Source of data “Happy Letter” signed by the implementing agent and a representative from the school
Method ofCalculation/ Assessment
Count the number of schools where signed “Happy Letters” confirm that such schools have been served with mobile chemical toilets under the COVID-19 Emergency Sanitation programme.
Means of Verification Signed “Happy Letter” per schoolList of schools where signed “Happy Letters” confirm that such schools have been served with mobile chemical toilets under the COVID-19 Emergency Sanitation programme.
Data limitations Delineating of roles between Education Departments and Municipalities
Assumptions All schools must have access to water in line with the Norms and Standards for School Infrastructure
Disaggregation of Beneficiaries(where applicable)
Target for Women: Not ApplicableTarget for Youth: Not ApplicableTarget for People with Disabilities: Not Applicable
Spatial Transformation(where applicable)
Reflect on contribution to spatial transformation priorities: Not ApplicableReflect on the spatial impact area: Not Applicable
Calculation type Non-Cumulative
Reporting cycle Annually
Desired performance COVID-19 Emergency Sanitation programme deliverables fulfilled
Indicator responsibility Lead – Branch I: Infrastructure Support – Not Applicable
Indicator Title 4.2.1 Number of General Education and Training (GET) test items developed in Language and Mathematics forGrades 3, 6 and 9
Definition The pool of test items prepared in a year. A total of 250 test items per subject will be produced in Languages and Mathematics for Grades 3, 6 and 9. The test items go through a process of setting and moderation.
Source of data Excel spreadsheet with a database of test items
Method ofCalculation / Assessment
Count the number of General Education and Training (GET) test items developed in Language and Mathematics for Grades 3, 6 and 9
Means of verification A list of test items producedProof of moderation of test items produced
Data limitations The actual tests will not be provided until the final test is written.
Assumptions Schools covered the curriculum as prescribed so that learners may confidently respond to the items
Disaggregation of Beneficiaries(where applicable)
Target for Youth: NATarget for Women: Not ApplicableTarget for People with Disabilities: Not Applicable
Spatial Transformation(where applicable)
Reflect on contribution to spatial transformation priorities: Not ApplicableReflect on the spatial impact area: Not Applicable
Calculation Type Non-Cumulative
Reporting Cycle Annually
Desired performance Maintenance of a valid and credible database of test items
IndicatorResponsibility
Lead – Branch C: Curriculum Policy, Support and MonitoringSupport – Not Applicable

115
Indicator Title 4.2.2 Number of NSC reports produced
Definition The NSC reports will contain data on learner performance obtained through the National Senior Certificate examination. The reports will be in the form of a learner performance that is analysed at the National, Provincial, District and School level and analysed diagnostically in selected subjects.
Source of data National NSC reports on learner performance (database hosted by SITA mainframe).
Method ofCalculation / Assessment
Count the number of NSC reports produced
Means of verification Signed NSC reports
Data limitations None
Assumptions NSC reports will provide the public, districts and schools with relevant data that will inform their classroom practice, and their training needs on content.
Disaggregation of Beneficiaries(where applicable)
Target for Youth: Not ApplicableTarget for Women: Not ApplicableTarget for People with Disabilities: Not Applicable
Spatial Transformation(where applicable)
Reflect on contribution to spatial transformation priorities: Not ApplicableReflect on the spatial impact area: Not Applicable
Calculation Type Non-Cumulative
Reporting Cycle Annually
Desired performance Maintenance of a valid and credible NSC database
IndicatorResponsibility
Lead – Branch C: Curriculum Policy, Support and MonitoringSupport – Not Applicable
Indicator Title 4.2.3 Number of question papers set for June and November examinations
Definition Examiners are appointed to set the examination question papers. Moderation of the question paper is also partof the process of setting of question papers. Question papers are finally approved by Umalusi.
Source of data Umalusi provides a signed list of question papers
Method ofCalculation / Assessment
Count the number of question papers set for June and November examinations
Means of verification Number of question papers setCopies of question papers set for the financial year in question
Data limitations Question papers are highly confidential documents that cannot be provided as evidence to anyone until theresults have been released.
Assumptions Question papers will cover wide topics in the curriculum
Disaggregation of Beneficiaries(where applicable)
Target for Youth: Not ApplicableTarget for Women: Not ApplicableTarget for People with Disabilities: Not Applicable
Spatial Transformation(where applicable)
Reflect on contribution to spatial transformation priorities: Not ApplicableReflect on the spatial impact area: Not Applicable
Calculation Type Non-Cumulative
Reporting Cycle Annually
Desired performance Administration of valid and credible examinations
IndicatorResponsibility
Lead – Branch C: Curriculum Policy, Support and MonitoringSupport – Not Applicable

116
Indicator Title 4.2.4 Percentage of public schools using the South African School Administration and Management System (SA-SAMS) for reporting
Definition The South African School Administration and Management System (SA-SAMS) is a cost-effective, easy to use and fully integrated computer application that assists schools with their administrative, management and governance information needs. The application is provided at no cost to schools in the country. Provinces support schools in using the latest versions of SA-SAMS. The application is policy-driven and is therefore developed and maintained by DBE. As a standardized application, it is designed to capture and record unit school administrative data and is the primary source of information in LURITS. SA-SAMS also assisted schools with quarterly or ad hoc reporting as required by the circuit/district, provincial and DBE. The percentage will be drawn from a population of all the public schools except those schools in Western Cape as the province is currently not using SA-SAMS for reporting.
Source of data List of schools generated by “SA-SAMS indicator tool” showing applicable data that will indicate the quality of data from the school databasesOn request: Databases and signed off deployment forms submitted with database
Method ofCalculation / Assessment
Numerator: Total number of public schools reporting using SA-SAMSDenominator: Total number of public schools (reported by provinces) excluding Western CapeMultiply by 100.This indicator will be measured using the school year, not the financial year. In this case, the 2020 school yearwill be used. The denominator will only include operational public schools from the Provincial Master list.
Means of verification A summary report of all provinces for public schools using SA-SAMS. Consolidated National list of all schools using SA-SAMS (numerator).Consolidated National list of schools provided by provinces (master list) (denominator) An analysis of the quality of information as reported by DQA.
Data limitations Currently, Western Cape does not report through the SA-SAMS. Therefore, no reports will be received from theWestern Cape.
Assumptions Some schools will not be using SA-SAMS for reporting
Disaggregation of Beneficiaries (where applicable)
Target for Youth: Not ApplicableTarget for Women: Not ApplicableTarget for People with Disabilities: Not Applicable
Spatial Transformation(where applicable)
Reflect on contribution to spatial transformation priorities: Not ApplicableReflect on the spatial impact area: Not Applicable
Calculation Type Non-Cumulative: A new school may be reported every year at the end of the academic year (31st December).
Reporting Cycle Annually
Desired performance All public schools to use SA-SAMS to generate performance reports quarterly and to submit these reports with the electronic data to the districts (province) for uploading onto information systems
IndicatorResponsibility
Lead – Branch B: Business Intelligence Support – Not Applicable

117
Indicator Title 4.2.5 A National Report is produced on the number of provinces monitored for implementation of LURITS
Definition Number of provinces monitored by DBE officials for implementation of Education Management InformationSystems (EMIS) priorities and processes as per the provincial approved business plan.
Source of data Information is collected through desktop monitoring
Method ofCalculation / Assessment
A National Report is produced on the number of provinces monitored for implementation of LURITS
Means of verification A National Report is produced on the number of provinces monitored for implementation of LURITS
Data limitations None
Assumptions That all PEDs are correctly implementing the Education Management Information Systems (EMIS) Policy andProtection of Personal Information (POPI) Act when handling the data collected from schools.
Disaggregation of Beneficiaries(where applicable)
Target for Youth: Not ApplicableTarget for Women: Not ApplicableTarget for People with Disabilities: Not Applicable
Spatial Transformation(where applicable)
Reflect on contribution to spatial transformation priorities: Not ApplicableReflect on the spatial impact area: Not Applicable
Calculation Type Non-Cumulative
Reporting Cycle Annually
Desired performance All 9 provincial EMIS’s will be monitored and supported remotely by virtual desktop mediums by DBE officials and Provincial Data Warehouses will be made available to DBE electronically.
IndicatorResponsibility
Lead – Branch B: Business Intelligence Support – Not Applicable
Indicator Title 4.2.6 A National Report is produced on learning outcomes linked to the National Assessment Framework
Definition National Report on learning outcomes linked to the National Assessment Framework will provide the sector with system-wide data based on learner competencies, school functionality, teacher domains and district support.
Source of data National Surveys and Assessments conducted online
Method ofCalculation / Assessment
A National Report is produced on learning outcomes linked to the National Assessment Framework
Means of verification A National Report is produced on learning outcomes linked to the National Assessment Framework
Data Limitations The EMIS master list is updated and correct.
Assumptions Data collected in more than 80% of sampled schools
Disaggregation of Beneficiaries(where applicable)
Target for Youth: Not ApplicableTarget for Women: Not ApplicableTarget for People with Disabilities: Not Applicable
Spatial Transformation(where applicable)
Reflect on contribution to spatial transformation priorities: Not ApplicableReflect on the spatial impact area: Not Applicable
Calculation Type Non-Cumulative
Reporting Cycle Annually
Desired performance A high-quality Annual Report published for public consumption
IndicatorResponsibility
Lead – Branch C: Curriculum Policy, Support and MonitoringSupport – Not Applicable
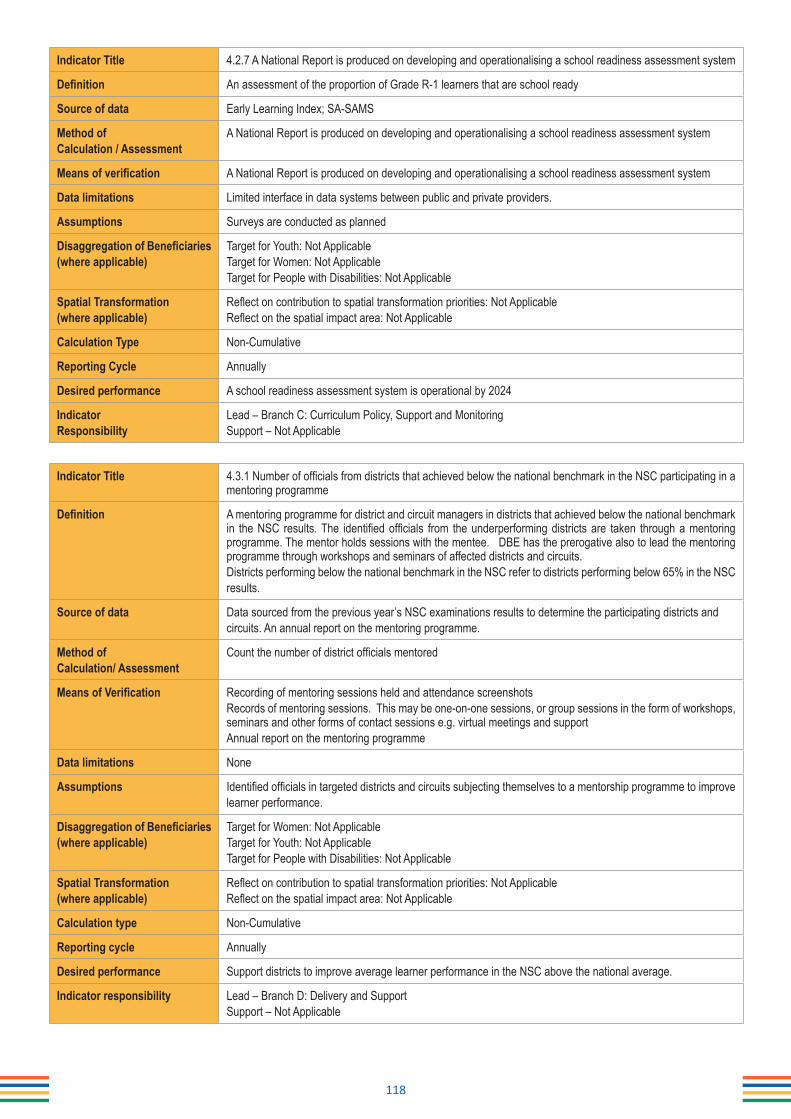
118
Indicator Title 4.2.7 A National Report is produced on developing and operationalising a school readiness assessment system
Definition An assessment of the proportion of Grade R-1 learners that are school ready
Source of data Early Learning Index; SA-SAMS
Method ofCalculation / Assessment
A National Report is produced on developing and operationalising a school readiness assessment system
Means of verification A National Report is produced on developing and operationalising a school readiness assessment system
Data limitations Limited interface in data systems between public and private providers.
Assumptions Surveys are conducted as planned
Disaggregation of Beneficiaries(where applicable)
Target for Youth: Not ApplicableTarget for Women: Not ApplicableTarget for People with Disabilities: Not Applicable
Spatial Transformation(where applicable)
Reflect on contribution to spatial transformation priorities: Not ApplicableReflect on the spatial impact area: Not Applicable
Calculation Type Non-Cumulative
Reporting Cycle Annually
Desired performance A school readiness assessment system is operational by 2024
IndicatorResponsibility
Lead – Branch C: Curriculum Policy, Support and MonitoringSupport – Not Applicable
Indicator Title 4.3.1 Number of officials from districts that achieved below the national benchmark in the NSC participating in a mentoring programme
Definition A mentoring programme for district and circuit managers in districts that achieved below the national benchmark in the NSC results. The identified officials from the underperforming districts are taken through a mentoring programme. The mentor holds sessions with the mentee. DBE has the prerogative also to lead the mentoring programme through workshops and seminars of affected districts and circuits.Districts performing below the national benchmark in the NSC refer to districts performing below 65% in the NSCresults.
Source of data Data sourced from the previous year’s NSC examinations results to determine the participating districts andcircuits. An annual report on the mentoring programme.
Method ofCalculation/ Assessment
Count the number of district officials mentored
Means of Verification Recording of mentoring sessions held and attendance screenshotsRecords of mentoring sessions. This may be one-on-one sessions, or group sessions in the form of workshops, seminars and other forms of contact sessions e.g. virtual meetings and supportAnnual report on the mentoring programme
Data limitations None
Assumptions Identified officials in targeted districts and circuits subjecting themselves to a mentorship programme to improvelearner performance.
Disaggregation of Beneficiaries(where applicable)
Target for Women: Not ApplicableTarget for Youth: Not ApplicableTarget for People with Disabilities: Not Applicable
Spatial Transformation(where applicable)
Reflect on contribution to spatial transformation priorities: Not ApplicableReflect on the spatial impact area: Not Applicable
Calculation type Non-Cumulative
Reporting cycle Annually
Desired performance Support districts to improve average learner performance in the NSC above the national average.
Indicator responsibility Lead – Branch D: Delivery and SupportSupport – Not Applicable

119
Indicator Title 4.3.2 Percentage of school principals rating the support services of districts as being satisfactory
Definition Percentage of school principals rating the support services of districts as being satisfactory. Satisfactory is measured using a 4-point Likert scale (1=Not useful, 2=Somewhat useful, 3=Useful, 4=Very useful )Percentage of school principals rating the support services of districts as being satisfactory.
Source of data Information is obtained through a google survey form
Method ofCalculation/ Assessment
Numerator: Total number of school principals expressing satisfaction Denominator: Total number of principals participating in the survey Multiply by 100
Means of Verification Completed survey toolsList of school principals participating in the surveyCriteria for rating as satisfactory
Data limitations Schools not participating resulting in a low response rate for reporting.
Assumptions Completed survey forms are received electronically from sampled school principals
Disaggregation of Beneficiaries(where applicable)
Target for Women: Not ApplicableTarget for Youth: Not ApplicableTarget for People with Disabilities: Not Applicable
Spatial Transformation(where applicable)
Reflect on contribution to spatial transformation priorities: Not ApplicableReflect on the spatial impact area: Not Applicable
Calculation type Non-Cumulative
Reporting cycle Biennially
Desired performance Schools must get optimum support from education districts, especially in areas of management and governance, curriculum provision as well as learner welfare, to ensure that all schools provide quality basic education across the province. At least 95% of principals should rate the support received as satisfactory.
Indicator responsibility Lead – Branch D: Delivery and SupportSupport – Not Applicable
Indicator Title 4.3.3 Percentage of District Directors that have undergone competency assessment prior to their appointment
Definition Conduct competency-based assessments for District Directors in line with the Public Service Regulations regarding recruitment and appointment of Senior Management Service (SMS) members. The assessments will be targeted at district directors appointed during the Annual Performance Plan year under review. District Directors appointed permanently but have not undergone the competency assessment and those appointed temporarily in acting positions may undergo the competency assessment as part of their professional development. Desktop monitor the provision of support to primary and secondary schools that have been declared as underperforming in terms of Section 58B of the South African Schools Act (SASA), Act No. 84 of 1996.
Source of data Human Resource Management and District Coordination units
Method ofCalculation/ Assessment
Numerator:Total number of District Directors assessedDenominator:Total number of District Directors appointed in 2020/21Multiply by 100.
Means of Verification Appointment letters of competency assessment record
Data limitations Non-appointments/Delay in filling vacant District Director posts or incumbents appointed in acting
Assumptions Individual competency assessment reports of appointed District Directors kept confidential
Disaggregation of Beneficiaries(where applicable)
Target for Women: Not ApplicableTarget for Youth: Not ApplicableTarget for People with Disabilities: Not Applicable
Spatial Transformation(where applicable)
Reflect on contribution to spatial transformation priorities: Not ApplicableReflect on the spatial impact area: Not Applicable
Calculation type Non-cumulative
Reporting cycle Annually
Desired performance All District Directors having undergone competency assessments prior to their appointments
Indicator responsibility Lead – Branch D: Delivery and SupportSupport – Not Applicable
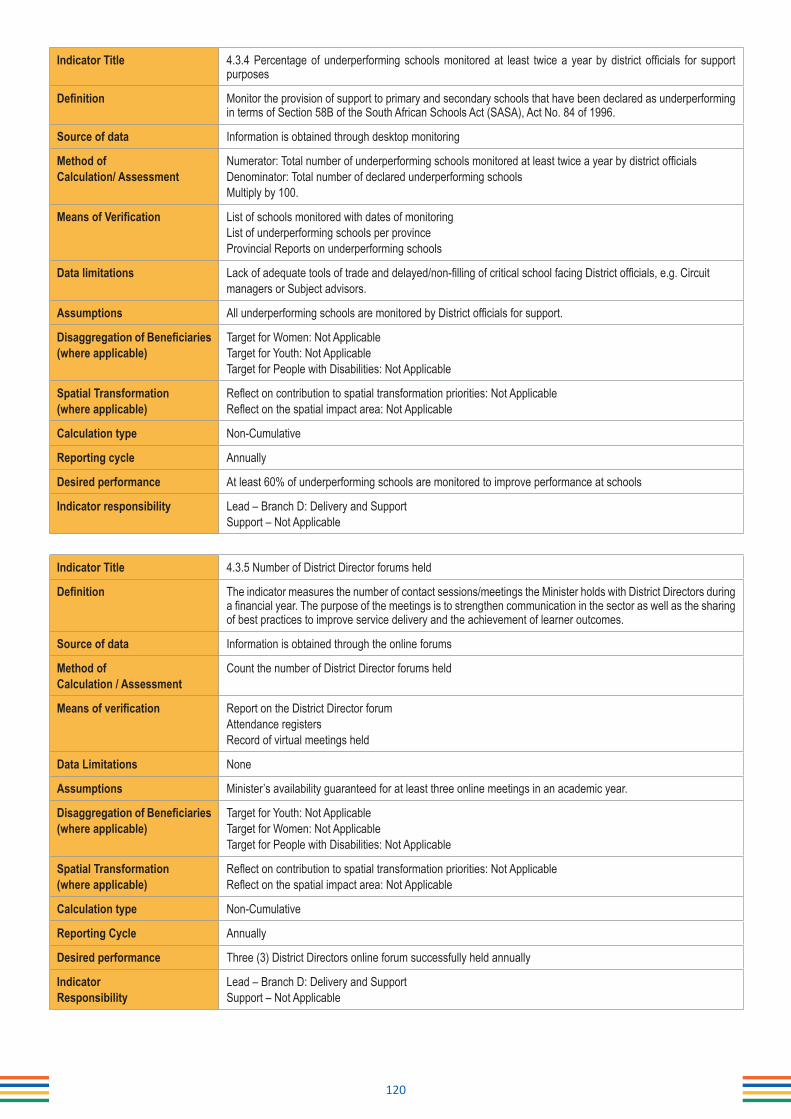
120
Indicator Title 4.3.4 Percentage of underperforming schools monitored at least twice a year by district officials for support purposes
Definition Monitor the provision of support to primary and secondary schools that have been declared as underperforming in terms of Section 58B of the South African Schools Act (SASA), Act No. 84 of 1996.
Source of data Information is obtained through desktop monitoring
Method ofCalculation/ Assessment
Numerator: Total number of underperforming schools monitored at least twice a year by district officialsDenominator: Total number of declared underperforming schoolsMultiply by 100.
Means of Verification List of schools monitored with dates of monitoringList of underperforming schools per provinceProvincial Reports on underperforming schools
Data limitations Lack of adequate tools of trade and delayed/non-filling of critical school facing District officials, e.g. Circuitmanagers or Subject advisors.
Assumptions All underperforming schools are monitored by District officials for support.
Disaggregation of Beneficiaries(where applicable)
Target for Women: Not ApplicableTarget for Youth: Not ApplicableTarget for People with Disabilities: Not Applicable
Spatial Transformation(where applicable)
Reflect on contribution to spatial transformation priorities: Not ApplicableReflect on the spatial impact area: Not Applicable
Calculation type Non-Cumulative
Reporting cycle Annually
Desired performance At least 60% of underperforming schools are monitored to improve performance at schools
Indicator responsibility Lead – Branch D: Delivery and SupportSupport – Not Applicable
Indicator Title 4.3.5 Number of District Director forums held
Definition The indicator measures the number of contact sessions/meetings the Minister holds with District Directors during a financial year. The purpose of the meetings is to strengthen communication in the sector as well as the sharing of best practices to improve service delivery and the achievement of learner outcomes.
Source of data Information is obtained through the online forums
Method ofCalculation / Assessment
Count the number of District Director forums held
Means of verification Report on the District Director forumAttendance registersRecord of virtual meetings held
Data Limitations None
Assumptions Minister’s availability guaranteed for at least three online meetings in an academic year.
Disaggregation of Beneficiaries(where applicable)
Target for Youth: Not ApplicableTarget for Women: Not ApplicableTarget for People with Disabilities: Not Applicable
Spatial Transformation(where applicable)
Reflect on contribution to spatial transformation priorities: Not ApplicableReflect on the spatial impact area: Not Applicable
Calculation type Non-Cumulative
Reporting Cycle Annually
Desired performance Three (3) District Directors online forum successfully held annually
IndicatorResponsibility
Lead – Branch D: Delivery and SupportSupport – Not Applicable
121
Indicator Title 4.3.6. Number of districts in which teacher development has been conducted as per district improvement plan
Definition The indicator measures the actual number of districts with a District Improvement Plan that reflects teacherdevelopment practices. The practices include training and support provided to teachers.
Source of data Information is obtained from the District Improvement Plans
Method ofCalculation / Assessment
Count the number of districts in which teacher development has been conducted as per district improvement plan
Means of verification District Improvement Plans collected by District Directorate
Data Limitations None
Assumptions Each district has a District Improvement Plan
Disaggregation of Beneficiaries(where applicable)
Target for Youth: Not ApplicableTarget for Women: Not ApplicableTarget for People with Disabilities: Not Applicable
Spatial Transformation(where applicable)
Reflect on contribution to spatial transformation priorities: Not ApplicableReflect on the spatial impact area: Not Applicable
Calculation type Non-Cumulative
Reporting Cycle Annually
Desired performance District Improvement Plans flagging the need for teacher development to take place
IndicatorResponsibility
Lead – Branch D: Delivery and SupportSupport – Not Applicable
122
Programme 5: Educational Enrichment Services
Indicator Title 5.1.1 Number of schools monitored for the provision of nutritious meals
Definition The South African Dietary Base Guideline is a national document on health nutrition from the Department of Health. All guidelines, including DBE guidelines, are derived from this national document. According to the guideline, a nutritious meal is made up of a protein, starch and a green/red/orange vegetable or fruit. The schools that will be desktop monitored are public ordinary schools in quintiles 1-3 and identified special schools. It must be noted that there are also public ordinary schools in quintiles 4 and 5 that have been identified as in need of the NSNP.
Source of data Information is obtained through desktop monitoring
Method ofCalculation/ Assessment
Count the number of schools monitored for the provision of nutritious meals
Means of Verification Completed monitoring toolsSigned list of schools monitored per quarter with dates of monitoringConsolidated monitoring status annual report
Data limitations None
Assumptions All schools are monitored for the provision of meals
Disaggregation of Beneficiaries(where applicable)
Target for Women: Not ApplicableTarget for Youth: Not ApplicableTarget for People with Disabilities: Not Applicable
Spatial Transformation(where applicable)
Reflect on contribution to spatial transformation priorities: Not ApplicableReflect on the spatial impact area: Not Applicable
Calculation type Cumulative: Year-End
Reporting cycle Quarterly
Desired performance All schools are serving a nutritious meal made up of a protein, starch, green/yellow/orange vegetable or a fruit
Indicator responsibility Lead – Branch S: Social Mobilisation and Support ServicesSupport – Not Applicable
Indicator Title 5.1.2 Number of PEDs with approved annual business plans for the HIV/AIDS Life Skills Education Programme
Definition This indicator measures the oversight and management function of the DBE towards the development and approval of provincial business plans
Source of data Information is obtained through desktop monitoring
Method ofCalculation/ Assessment
Count the number of business plans approved for the HIV/AIDS Life Skills Education Programme
Means of Verification Signed annual provincial business plansCompleted monitoring reportsConsolidated monitoring status annual reportAgenda and Minutes of the Inter-provincial meetings
Data limitations None
Assumptions All Provinces will submit on time for the assessment of Business Plans
Disaggregation of Beneficiaries(where applicable)
Target for Women: Not ApplicableTarget for Youth: Not ApplicableTarget for People with Disabilities: Not Applicable
Spatial Transformation(where applicable)
Reflect on contribution to spatial transformation priorities: Not ApplicableReflect on the spatial impact area: Not Applicable
Calculation type Non-Cumulative
Reporting cycle Annually
Desired performance Improved implementation of activities in the approved provincial business plans
Indicator responsibility Lead – Branch S: Social Mobilisation and Support ServicesSupport – Not Applicable
123
Indicator Title 5.1.3 Number of districts monitored and supported in the implementation of the National School Safety Framework(NSSF), social cohesion, sport and enrichment programmes
Definition • NSSF seeks to address prevalence of crime and violence in 43 education districts• The District shall refer to the Education District• Safety means school safety in particular• Social Cohesion means social norms, values, constitutional rights, democracy education and gender equity• Sport and Enrichment refers to school sport codes and curriculum support to mass participation in physical
activity, school sport, arts and culture, academic and homework support and life skills activities
Source of data Information is obtained through desktop monitoring
Method ofCalculation / Assessment
Count the number of districts monitored and supported in the implementation of the National School SafetyFramework (NSSF), social cohesion, sport and enrichment programmes
Means of verification Completed monitoring toolsSigned list of districts monitored per quarter with dates of monitoringConsolidated monitoring status annual report
Data limitations The indicator provides information as reported by schools and districts.
Assumptions Districts are monitoring and supporting the implementing school safety at school level.
Disaggregation of Beneficiaries(where applicable)
Target for Women: Not ApplicableTarget for Youth: learners in public ordinary schoolsTarget for People with Disabilities: Learners with Special Educational Needs (LSEN)
Spatial Transformation(where applicable)
Reflect on contribution to spatial transformation priorities: Not ApplicableReflect on the spatial impact area: Not Applicable
Calculation Type Cumulative: Year-End
Reporting Cycle Quarterly
Desired performance NSSF, Social Cohesion, Sport and Enrichment programmes fully implemented
IndicatorResponsibility
Lead – Branch S: Social Mobilisation and Support ServicesSupport – Not Applicable

124
Indicator Title 5.1.4 Number of learners, educators, parents, SGBs and other educations stakeholders reached through social cohesion programmes
Definition Social Cohesion Programme includes activities such as:• Engagements on the Rights and Responsibilities, • National Schools Moot Court, • iNkosi Albert Luthuli Oral Programme, • Youth Citizens Action Programme, • Heritage Education Schools Outreach Programme, • Commemorations of Historic Events and Significant Anniversaries, • Children’s Parliament, • Future Choices Programme, • Girls and Boys Education Movement Programme, • Gender Empowerment Programme
Source of data Information is obtained through the implementation of social cohesion and equity activities.
Method ofCalculation / Assessment
Count the number of learners participating in social cohesion programmes, physically and virtually.
Means of verification • Signed lists of learners from provinces• Signed lists of TRC Bursary Payments• Virtual attendance registers or signed lists and virtual platform-engagements/reactions (likes, comments,
private messages including web-based subscription reports)
Data limitations This indicator only reveals the number of engagements and categories of stakeholders engaged, without the content of engagement.
Assumptions Provinces will facilitate mass participation, arrange facilities and resources for virtual platforms and email or courier pieces of work such as essays and research projects
Disaggregation of Beneficiaries(where applicable)
Target for Women: For in school girl childrenTarget for Youth: In-school YouthTarget for People with Disabilities: Learners with Special Educational Needs (LSEN)
Spatial Transformation(where applicable)
Reflect on contribution to spatial transformation priorities: Not ApplicableReflect on the spatial impact area: Not Applicable
Calculation Type Cumulative: Year-End
Reporting Cycle Quarterly
Desired performance Stakeholder engagements held to promote Constitutions and its values
IndicatorResponsibility
Lead – Branch S: Social Mobilisation and Support ServicesSupport – Not Applicable

125
Anne
xure
s to
the
Annu
al P
erfo
rman
ce P
lan
Anne
xure
A: A
men
dmen
ts to
the
Stra
tegi
c Pl
anN
one.
Anne
xure
B: C
ondi
tiona
l Gra
nts
Tabl
e 27
: Con
ditio
nal G
rant
s
Nam
e of G
rant
Purp
ose
Outp
uts
Curre
nt A
nnua
l Bu
dget
(R’00
0)Pe
riod
of
Gran
t
Educ
atio
n In
frast
ruct
ure
Gran
t
•To
help
acce
lerate
cons
tructi
on,
maint
enan
ce, u
pgra
ding a
nd
reha
bilita
tion o
f new
and e
xistin
g inf
rastr
uctur
e in e
duca
tion,
includ
ing
distric
t and
circu
it acc
ommo
datio
n an
d enh
ance
capa
city t
o deli
ver
infra
struc
ture i
n edu
catio
n.
•Ne
w sc
hools
, add
itiona
l edu
catio
n sp
aces
, edu
catio
n su
ppor
t spa
ces a
nd a
dmini
strati
on fa
cilitie
s con
struc
ted a
s well
as
equip
ment
and f
urnit
ure p
rovid
ed.
•Ex
isting
scho
ols’ in
frastr
uctur
e upg
rade
d and
reha
bilita
ted.
•Ne
w an
d exis
ting s
choo
ls ma
intain
ed.
•W
ork o
ppor
tunitie
s cre
ated.
•Ne
w sp
ecial
scho
ols pr
ovide
d and
exist
ing sp
ecial
and f
ull-se
rvice
scho
ols up
grad
ed an
d main
taine
d.
R8 78
6 967
Annu
ally
HIV
and A
ids
Life
Skil
ls Ed
ucat
ion
Prog
ram
me
•To
supp
ort S
outh
Afric
a’s H
IV
prev
entio
n stra
tegy b
y pro
viding
co
mpre
hens
ive se
xuali
ty ed
ucati
on
and a
cces
s to s
exua
l and
re
prod
uctiv
e hea
lth se
rvice
s to
learn
ers,
and s
uppo
rting t
he pr
ovisi
on
of em
ploye
e hea
lth an
d well
ness
pr
ogra
mmes
for e
duca
tors.
•Ed
ucato
rs tra
ined t
o imp
lemen
t CSE
and T
B pr
even
tion p
rogr
amme
s to e
nable
lear
ners
to pr
otect
thems
elves
from
HIV
an
d TB,
and
the
asso
ciated
key d
river
s of a
lcoho
l and
dru
g us
e, wh
ich le
ad to
uns
afe se
x, lea
rner
pre
gnan
cy a
nd H
IV
infec
tion.
The p
rogr
amme
prior
itises
scho
ols lo
cated
in ar
eas w
ith a
high b
urde
n of H
IV an
d TB
infec
tions
. •
Scho
ol ma
nage
ment
teams
and
gov
ernin
g bo
dies t
raine
d to
deve
lop p
olicy
imple
menta
tion
plans
focu
sing
on ke
eping
ma
inly
youn
g gir
ls in
scho
ol, e
nsur
ing th
at CS
E an
d TB
edu
catio
n is
imple
mente
d for
all
learn
ers
in sc
hools
, and
tha
t the
y can
acc
ess c
ompr
ehen
sive
SRH
and
TB se
rvice
s. A
comp
onen
t of t
raini
ng w
ill als
o ad
dres
s mult
iple
sexu
al pa
rtner
ships
amon
g boy
s and
lear
ner p
regn
ancy
prev
entio
n.•
Co-cu
rricu
lar ac
tivitie
s on p
rovis
ion of
CSE
, acc
ess t
o SRH
and T
B se
rvice
s imp
lemen
ted in
seco
ndar
y sch
ools
includ
e a f
ocus
on pr
even
tion o
f alco
hol a
nd dr
ug us
e and
lear
ner p
regn
ancy
. •
Care
and
supp
ort p
rogr
amme
s imp
lemen
ted to
reac
h lea
rner
s and
edu
cator
s and
incre
ased
app
ointm
ents
of Le
arne
r Su
ppor
t Age
nts to
supp
ort v
ulner
able
learn
ers p
rioriti
sing p
rimar
y sch
ools,
using
the c
are a
nd su
ppor
t for t
each
ing an
d lea
rning
fram
ewor
k. •
Copie
s of C
APS-
comp
liant
mater
ials,
includ
ing m
ateria
l for l
earn
ers w
ith b
arrie
rs to
learn
ing, p
rinted
and
dist
ribute
d to
scho
ols.
•Ad
voca
cy a
nd s
ocial
mob
ilisati
on e
vents
for l
earn
ers,
educ
ators
and
scho
ol co
mmun
ity m
embe
rs on
the
new
DBE
Natio
nal P
olicy
on H
IV, S
TIs a
nd T
B.
R187
095
Annu
ally
Lear
ners
wi
th S
ever
e to
Pro
foun
d In
telle
ctua
l Di
sabi
lity
(LSP
ID)
To pr
ovide
the n
eces
sary
supp
ort,
reso
urce
s and
equip
ment
to ide
ntifie
d ca
re ce
ntres
and s
choo
ls for
the
prov
ision
of ed
ucati
on to
child
ren
with
seve
re to
profo
und i
ntelle
ctual
disab
ilities
.
•Hu
man r
esou
rces s
pecifi
c to i
nclus
ive ed
ucati
on th
roug
h the
prov
ision
of ke
y add
itiona
l staf
f on a
perm
anen
t bas
is, su
ch
as n
ine d
eputy
chief
edu
catio
n sp
ecial
ists a
s pro
vincia
l gra
nt ma
nage
rs; a
nd 2
50 T
rans
versa
l Itine
rant
Outre
ach T
eam
memb
ers,
to pr
ovide
curri
culum
deliv
ery a
nd th
erap
eutic
supp
ort in
spec
ial ca
re ce
ntres
and t
arge
ted sc
hools
.•
Datab
ase o
f sele
cted s
choo
ls an
d spe
cial c
are c
entre
s.•
Tran
sver
sal I
tiner
ant O
utrea
ch T
eam
memb
ers,
care
giver
s, tea
cher
s, in-
servi
ce th
erap
ists
and
officia
ls tra
ined
in the
Le
arnin
g Pro
gram
me fo
r CSP
ID an
d othe
r pro
gram
mes t
hat s
uppo
rt deli
very
of the
Lear
ning P
rogr
amme
. This
will
entai
l:o P
rovid
ing ou
treac
h ser
vices
to ch
ildre
n/lea
rner
s with
seve
re to
profo
und i
ntelle
ctual
disab
ility.
o P
rovid
ing su
ppor
t to le
arne
rs fro
m sp
ecial
care
centr
es en
rolle
d in s
choo
ls.
R220
785
Annu
ally

126
Nam
e of G
rant
Purp
ose
Outp
uts
Curre
nt A
nnua
l Bu
dget
(R’00
0)Pe
riod
of
Gran
t
Math
s, Sc
ience
and
Tech
nolo
gy
(MST
) Gra
nt
To pr
ovide
supp
ort a
nd re
sour
ces t
o sc
hools
, teac
hers
and l
earn
ers i
n line
wi
th the
CAP
S for
the i
mpro
veme
nt of
MST
teach
ing an
d lea
rning
at se
lected
pu
blic s
choo
ls.
•Sc
hools
sup
plied
with
sub
ject-s
pecifi
c co
mpute
r har
dwar
e in
acco
rdan
ce w
ith th
e mi
nimum
spe
cifica
tions
pre
scrib
ed
by C
APS.
•Sc
hools
supp
lied w
ith su
bject-
relat
ed so
ftwar
e in a
ccor
danc
e with
the m
inimu
m sp
ecific
ation
s.•
Tech
nical
scho
ols’ w
orks
hop e
quipm
ent a
nd co
nsum
ables
for te
chno
logy s
ubjec
ts re
paire
d, ma
intain
ed an
d/ or
repla
ced
in ac
cord
ance
with
the m
inimu
m sp
ecific
ation
s.•
Tech
nical
scho
ols’ w
orks
hop
mach
inery
and
tools
for te
chno
logy
subje
cts r
epair
ed, m
aintai
ned
and
repla
ced
in ac
cord
ance
with
the m
inimu
m sp
ecific
ation
s.•
Scho
ols su
pplie
d with
Math
emati
cs an
d Scie
nce k
its.
•La
bora
tories
sup
plied
with
app
aratu
ses
for M
athem
atics
and
Scie
nce
subje
cts in
acc
orda
nce
with
the m
inimu
m sp
ecific
ation
s.•
Labo
rator
ies a
nd w
orks
hops
sup
plied
with
con
suma
bles
for M
athem
atics
, Sc
ience
and
Tec
hnolo
gy s
ubjec
ts in
acco
rdan
ce w
ith th
e mini
mum
spec
ificati
ons.
•Le
arne
rs re
gister
ed fo
r par
ticipa
tion i
n Math
emati
cs, S
cienc
e and
Tech
nolog
y Olym
piads
/ Fair
s/ Ex
pos a
nd ot
her e
vents
ba
sed
on a
stru
cture
d an
nual
calen
dar,
includ
ing su
ppor
t thr
ough
lear
ner c
amps
and
add
itiona
l LTS
Ms su
ch a
s stud
y gu
ides.
•Of
ficial
s atte
nding
spec
ific st
ructu
red
traini
ng a
nd o
rienta
tion
for te
ache
rs an
d su
bject
advis
ors i
n su
bject
conte
nt an
d tea
ching
meth
odolo
gies o
n CAP
S for
elec
trical,
civil
and m
echa
nical
techn
ology
, tech
nical
Mathe
matic
s, an
d Tec
hnica
l Sc
ience
s.•
Teac
hers
and s
ubjec
t adv
isors
atten
ding t
arge
ted an
d stru
cture
d tra
ining
in te
achin
g meth
odolo
gies a
nd su
bject
conte
nt for
Math
emati
cs, P
hysic
al, L
ife, N
atura
l and
Agr
icultu
ral S
cienc
es, T
echn
ology
, Com
puter
App
licati
ons
Tech
nolog
y, Inf
orma
tion T
echn
ology
, and
Agr
icultu
ral M
anag
emen
t and
Tech
nolog
y.
R332
862
Annu
ally
Natio
nal S
choo
l Nu
tritio
n Pr
ogra
mm
e (N
SNP)
To pr
ovide
nutrit
ious m
eals
to tar
geted
sc
hools
.Th
e num
ber o
f sch
ools
that p
repa
re nu
tritiou
s mea
ls for
lear
ners.
R7 18
5 715
Annu
ally
Anne
xure
C: C
onso
lidat
ed In
dica
tors
Inst
itutio
nOu
tput
Indi
cato
rAn
nual
Targ
etDa
ta S
ourc
e
N/A
N/A
N/A
N/A

127

222 Struben StreetPrivate Bag X895, Pretoria, 0001
Telephone: 012 357 3000 Fax: 012 323 0601
ISBN: 978-1-4315-3329-9
Department of Basic Education
Website: Facebook: Twitter:
www.education.gov.za www.facebook.com/BasicEd www.twitter.com/dbe_sa