OUR PERFORMANCE - Annual publications
12
30 Shell Sustainability Report 2012 | reports.shell.com Our performance OUR PERFORMANCE In 2012, we continued to operate in ways that balance economic, environmental and social considerations in a responsible way. We maintained our strong investment in projects that will deliver energy resources for decades to come. We worked to maintain improvements in our safety record. We also continued to work to reduce our impact on the environment, to respond transparently to the views of our neighbours and to generate jobs and business opportunities for local economies.
-
Upload
khangminh22 -
Category
Documents
-
view
2 -
download
0
Transcript of OUR PERFORMANCE - Annual publications
30 Shell Sustainability Report 2012 | reports.shell.comOur performance
OUR PERFORMANCEIn 2012, we continued to operate in ways that balance economic, environmental and social considerations in a responsible way. We maintained our strong investment in projects that will deliver energy resources for decades to come. We worked to maintain improvements in our safety record. We also continued to work to reduce our impact on the environment, to respond transparently to the views of our neighbours and to generate jobs and business opportunities for local economies.

ECONOMIC
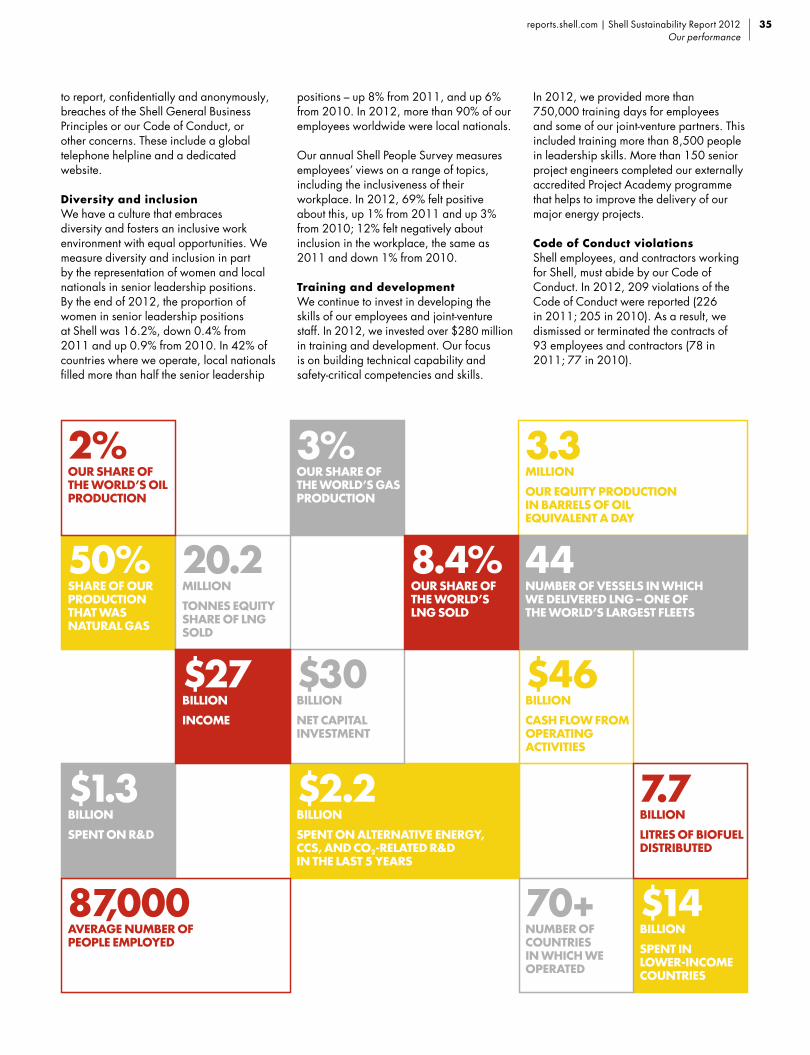
Our income in 2012 was around $27 billion and we announced dividends of more than $11 billion for our shareholders. Our net capital investment of around $30 billion will help to build and sustain our business for the future. We also spent $1.3 billion on our research and development programme.
Shell generated $46 billion of cash fl ow from our operating activities in 2012. This cash is used to fund our capital investment and research and development programme. It also funds our dividend payments to shareholders. Our average reserve replacement ratio, which represents our ability to grow and maintain production, was around 125% over the last fi ve years.
In 2012, the Pearl GTL (gas-to-liquids) plant (Shell interest 100%) in Qatar completed its ramp-up to full production. Pearl can produce 140,000 barrels of oil equivalent (boe) a day of synthetic oil products and 120,000 boe a day of natural gas liquids and ethane for industrial use.
With joint-venture partners we started production at the Caesar Tonga deep-water project in the USA (Shell interest 22.5%) and the Harweel enhanced oil recovery project in Oman (Shell interest 34%). Also with partners, we started producing oil from our deep-water Gumusut-Kakap project (Shell interest 33%) in Malaysia. The Port Arthur refi nery expansion project in Texas, USA, came on-stream and will add a
capacity of around 320,000 barrels a day (Shell interest 50%). The Pluto LNG plant in Australia (Shell indirect interest 21%) also started production.
We took the fi nal investment decision in 2012 on two natural gas projects in Nigeria that will help to reduce fl aring. We also decided to go ahead with the Quest CCS project in Canada that will reduce CO2 emissions from our oil sands operations. Other projects we decided to move forward with were the Tempa Rossa project (Shell interest 25%) in Italy and the Malakai project (Shell interest 35%) in the deep waters off Malaysia, which is expected to produce around 60,000 boe a day at peak production.
Shell’s oil and gas production in 2012 was 3.3 million boe a day, up slightly from 2011. We increased our sales of liquefi ed natural gas (LNG) by 7% to around 20 million tonnes. Exploration and commercial activities continued to add potential resources, underpinning Shell’s long-term growth plan.
Shell scorecardIn 2012, sustainable development continued to account for 20% of the company scorecard, which helps determine the annual bonus levels for all our employees, including members of the Shell Executive Committee (EC). For the EC in 2012, sustainable development measures were split evenly between Shell’s safety performance and targeted measures covering operational spills, energy effi ciency and use of fresh water.
31reports.shell.com | Shell Sustainability Report 2012Our performance
Shell was one of the very fi rst companies to support the
EITI when it began as an idea 10 years ago. Today, Shell is an active participant in the EITI countries where it operates. Iraq is an important case. With one-tenth of the proven oil reserves in the world and a history of confl ict and mismanagement, governance of the extractives sector has been as challenging there as anywhere. It is particularly heartening that in December 2012, Iraq became compliant with the EITI standard. Shell has played an important role as one of three companies serving on the EITI multi-stakeholder council overseeing the process in the country. I hope that Shell will continue to play a role to embed, deepen and widen that process to ensure that Iraq’s complex governance issues in the sector are addressed in a constructive environment.
Jonas Moberg
”
“Head of Secretariat, Extractive Industries Transparency Initiative, Oslo, Norway
REVENUE TRANSPARENCYOur operations generate revenue through taxes and royalties for governments around the world. These funds can help support a country’s economy and contribute to local development.
We believe greater transparency in payments to governments, and how they are used, is important for building trust between businesses such as ours and the communities we work alongside.
We work openly with governments on matters of taxes and royalties. We are a founder and board member of the Extractive Industries Transparency Initiative (EITI). This initiative requires both governments and companies to disclose revenues received from oil and mineral activities.
In 2012, Shell for the fi rst time published details of the payments we make to governments of some of the main countries where we operate. We took this step to reinforce efforts to increase
transparency on revenues to governments ahead of any mandatory requirements taking effect.
To help improve accountability, we support a mandatory global reporting rule for extractive industries, in line with EITI goals to achieve greater transparency (see opinion). We are engaging actively with others to fi nd a workable and common global standard in relation to current US and planned EU regulations.
In 2012, Shell paid globally $21.0 billion in corporate taxes, and $3.6 billion in royalties. We collected $85.1 billion in excise duties and sales taxes on our fuel and other products on behalf of governments.
For a breakdown of payments made to governments by country, see link below:
www.shell.com/payments

ENVIRONMENTAL
Greenhouse gas emissionsThe direct greenhouse gas (GHG) emissions from facilities we operate were 72 million tonnes on a CO2-equivalent basis in 2012, a decrease from 74 million tonnes of CO2 equivalent in 2011. The main reasons for this drop were reduced fl aring in Nigeria and divestments in our Downstream business. These were partly offset by the ramp-up of production at the Pearl GTL plant in Qatar.
Around 55% of our GHG emissions came from the refi neries and chemical plants in our Downstream business. The production of oil and gas in our Upstream business accounted for over 40% of our GHG emissions, and our shipping activities for less than 5%. We continue to work on improving operational performance and energy effi ciency to reduce GHG emissions.
The indirect GHG emissions from the energy we purchased (electricity, heat and steam) were 9 million tonnes on a CO2-equivalent basis in 2012, a decrease from 2011. We estimate that the CO2 emissions from the use of our refi nery and natural gas products were around 580 million tonnes in 2012. Further information on GHG emissions is available on our corporate website.
FlaringThe fl aring of natural gas in our Upstream business decreased in 2012 to 7.7 million tonnes of CO2 equivalent, from 10.0 million tonnes of CO2 equivalent in 2011. We made progress in reducing fl aring in Nigeria in 2012. Flaring emissions were down by around 25% in Nigeria from the previous year, to 4.6 million tonnes of CO2 equivalent. This was mainly because more investments in gas-gathering equipment were brought on-stream and tighter fl aring controls were applied. Flaring also dropped due to reduced production at the Majnoon fi eld in Iraq to allow the upgrade of some facilities, and the completion of start-up of the Pearl GTL plant in Qatar.
Overall, fl aring made up around 10% of the total direct GHG emissions in 2012. Nigeria accounted for around 65% of this fl aring in 2012, with the remainder mainly from the Pearl GTL plant in Qatar, Majnoon in Iraq and operations in Malaysia. In 2012, we further reduced the fl aring intensity – hydrocarbons fl ared per tonne of production – to the lowest level we have recorded for our Upstream business.
Operational fl aring occurs for safety reasons, or during the start-up of Upstream facilities. We aim to minimise this operational fl aring. Continuous fl aring takes place due to a lack of equipment to
capture the gas produced with oil. Most of the continuous fl aring in 2012 took place in Nigeria.
We expect that fl aring from the Majnoon fi eld in Iraq will rise in future years as production increases and before equipment to gather the associated gas can be installed. When we acquire or become the operator of an existing facility that is already fl aring or venting (releasing gas to the atmosphere), it takes time before these activities can be stopped.
Outside Nigeria and Iraq, the few facilities that continuously fl are accounted for less than 1% of our total direct GHG emissions in 2012. Some of these facilities are at ageing oil fi elds where the associated gas pressure is too low to power the compressors used to gather the gas and avoid fl aring. In 2012, the venting of hydrocarbons amounted to less than 1% of our total direct GHG emissions.
Our HSSE & SP Control Framework requires our new facilities to be designed so as not to fl are or vent continuously.
Energy efficiencyOne of the ways we can manage our direct GHG emissions is to work on improving the energy effi ciency of the facilities we operate.
0.5
0.7
0.9
gigajoules/tonne production
ENERGY INTENSITY – UPSTREAM (EXCL. OIL SANDS AND GTL)
12111009080706050403
85
95
105
Chemicals Energy Index
ENERGY INTENSITY – CHEMICAL PLANTS
12111009080706050403
0
30
60
90
120
million tonnes CO2 equivalent
DIRECT GREENHOUSE GAS EMISSIONS
12111009080706050403
0
5
10
gigajoules/tonne production [A]
ENERGY INTENSITY – OIL SANDS
12111009080706050403
[A] Includes mining and upgrading operations
0
15
30
million tonnes CO2 equivalent
FLARING – UPSTREAM
12111009080706050403
90
100
110
ENERGY INTENSITY – REFINERIES
12111009080706050403
[B] Indexed to 2002, based on 2006 Solomon EIITM methodology
32 Shell Sustainability Report 2012 | reports.shell.comOur performance
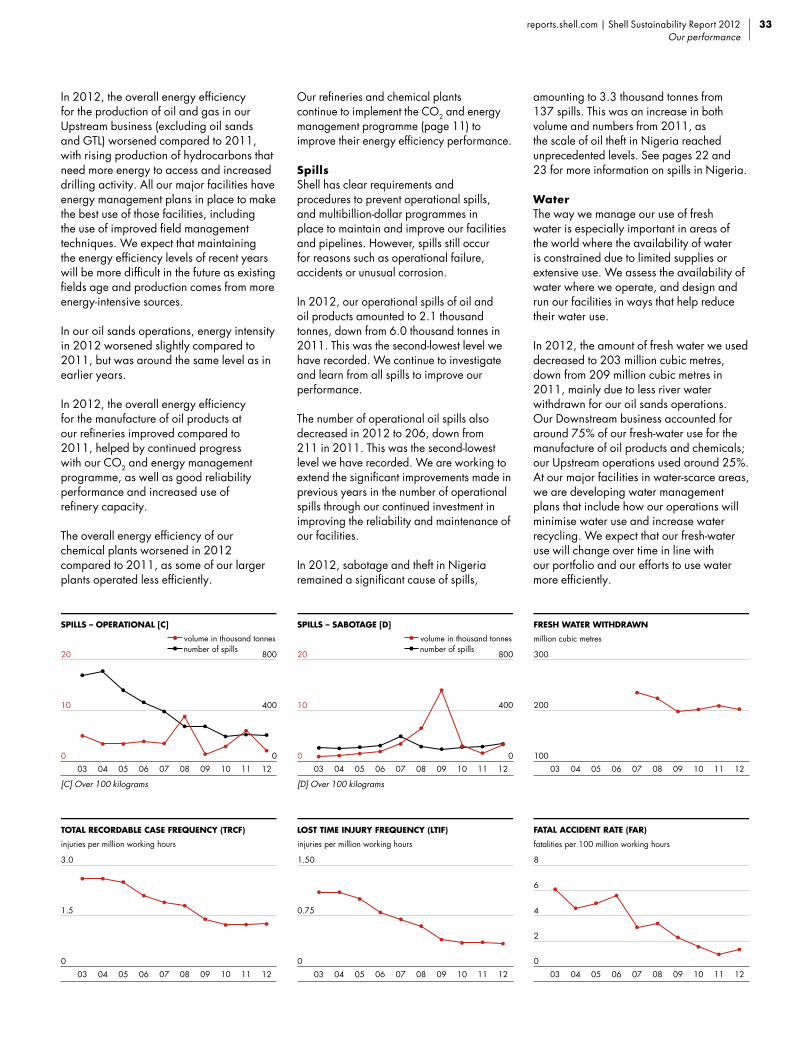
In 2012, the overall energy effi ciency for the production of oil and gas in our Upstream business (excluding oil sands and GTL) worsened compared to 2011, with rising production of hydrocarbons that need more energy to access and increased drilling activity. All our major facilities have energy management plans in place to make the best use of those facilities, including the use of improved fi eld management techniques. We expect that maintaining the energy effi ciency levels of recent years will be more diffi cult in the future as existing fi elds age and production comes from more energy-intensive sources.
In our oil sands operations, energy intensity in 2012 worsened slightly compared to 2011, but was around the same level as in earlier years.
In 2012, the overall energy effi ciency for the manufacture of oil products at our refi neries improved compared to 2011, helped by continued progress with our CO2 and energy management programme, as well as good reliability performance and increased use of refi nery capacity.
The overall energy effi ciency of our chemical plants worsened in 2012 compared to 2011, as some of our larger plants operated less effi ciently.
Our refi neries and chemical plants continue to implement the CO2 and energy management programme (page 11) to improve their energy effi ciency performance.
SpillsShell has clear requirements and procedures to prevent operational spills, and multibillion-dollar programmes in place to maintain and improve our facilities and pipelines. However, spills still occur for reasons such as operational failure, accidents or unusual corrosion.
In 2012, our operational spills of oil and oil products amounted to 2.1 thousand tonnes, down from 6.0 thousand tonnes in 2011. This was the second-lowest level we have recorded. We continue to investigate and learn from all spills to improve our performance.
The number of operational oil spills also decreased in 2012 to 206, down from 211 in 2011. This was the second-lowest level we have recorded. We are working to extend the signifi cant improvements made in previous years in the number of operational spills through our continued investment in improving the reliability and maintenance of our facilities.
In 2012, sabotage and theft in Nigeria remained a signifi cant cause of spills,
amounting to 3.3 thousand tonnes from 137 spills. This was an increase in both volume and numbers from 2011, as the scale of oil theft in Nigeria reached unprecedented levels. See pages 22 and 23 for more information on spills in Nigeria.
WaterThe way we manage our use of fresh water is especially important in areas of the world where the availability of water is constrained due to limited supplies or extensive use. We assess the availability of water where we operate, and design and run our facilities in ways that help reduce their water use.
In 2012, the amount of fresh water we used decreased to 203 million cubic metres, down from 209 million cubic metres in 2011, mainly due to less river water withdrawn for our oil sands operations. Our Downstream business accounted for around 75% of our fresh-water use for the manufacture of oil products and chemicals; our Upstream operations used around 25%. At our major facilities in water-scarce areas, we are developing water management plans that include how our operations will minimise water use and increase water recycling. We expect that our fresh-water use will change over time in line with our portfolio and our efforts to use water more effi ciently.
100
200
300
million cubic metres
FRESH WATER WITHDRAWN
121110090807060504030
10
20
0
400
800
SPILLS – OPERATIONAL [C]volume in thousand tonnesnumber of spills
12111009080706050403
[C] Over 100 kilograms
0
10
20
0
400
800
SPILLS – SABOTAGE [D]volume in thousand tonnesnumber of spills
12111009080706050403
[D] Over 100 kilograms
0
2
4
6
8
fatalities per 100 million working hours
FATAL ACCIDENT RATE (FAR)
121110090807060504030
1.5
3.0
12111009080706050403
injuries per million working hours
TOTAL RECORDABLE CASE FREQUENCY (TRCF)
0
0.75
1.50
injuries per million working hours
LOST TIME INJURY FREQUENCY (LTIF)
12111009080706050403
33reports.shell.com | Shell Sustainability Report 2012Our performance
SOCIAL
Personal safetyFollowing steady improvements in our safety performance in recent years, in 2012 we remained close to our lowest-ever number of injuries per million working hours, the total recordable case frequency (TRCF). We achieved our lowest-ever rate of injuries that led to time off work in 2012, the lost-time injury frequency (LTIF).
Sadly, however, eight people lost their lives while working for Shell in 2012. This was two more than in 2011. Three fatalities were industrial accidents during construction and operations, two were armed attacks in Nigeria, two were road transport incidents, and one was an occupational illness related to air travel. Our fatal accident rate (FAR) – the number of fatalities per 100 million hours worked – worsened in 2012 compared to 2011, when we achieved the lowest FAR that Shell has recorded.
Process safetyAt Shell, we place great emphasis on process safety management. This means making sure our facilities are well designed, well operated and well maintained, so that they can run safely, without harm to people or the environment. We have rigorous controls in place and monitor indicators that focus on the strength of these controls to prevent incidents.
We follow industry standards for measuring process safety performance. In 2012, we recorded 91 Tier 1 process safety incidents (as defi ned in line with oil and gas industry guidelines) related to our operations, an improvement compared to 2011. We investigate and learn from these incidents in order to improve our performance.
Social performanceSocial performance involves working with communities to share the benefi ts of our activities and to reduce the impact of our operations. It includes helping to build local economies through the creation of jobs and business opportunities. In 2012, we created new opportunities for communities and local companies in a number of countries where we operate, including Iraq and Nigeria.
We continued to implement our standards for social performance across the company in 2012. Each year we review the extent to which our operations, as well as our
contractors and suppliers, have processes in place to prevent violations of human rights – for example, the use of child or forced labour. We continued to strengthen our capability in social performance in 2012 by standardising processes and through more training. In 2012, we invested further in building the competency of our staff, training 272 more employees in our social performance requirements. We also worked towards implementing new measures of our social performance.
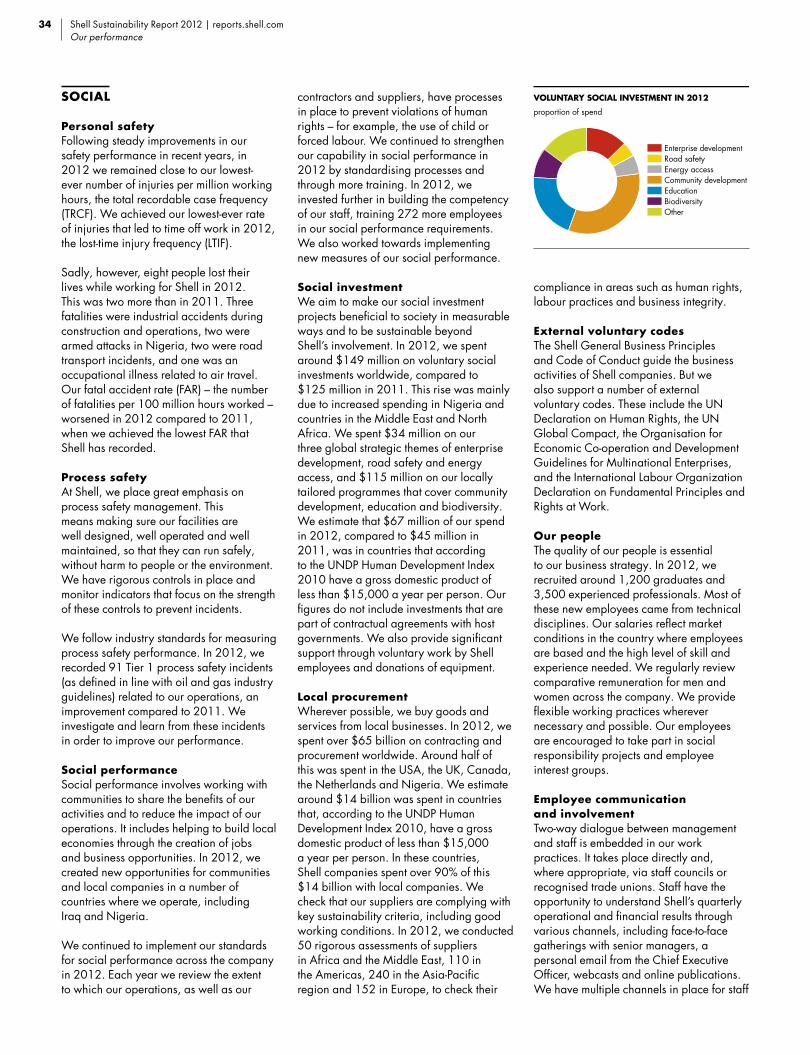
Social investmentWe aim to make our social investment projects benefi cial to society in measurable ways and to be sustainable beyond Shell’s involvement. In 2012, we spent around $149 million on voluntary social investments worldwide, compared to $125 million in 2011. This rise was mainly due to increased spending in Nigeria and countries in the Middle East and North Africa. We spent $34 million on our three global strategic themes of enterprise development, road safety and energy access, and $115 million on our locally tailored programmes that cover community development, education and biodiversity. We estimate that $67 million of our spend in 2012, compared to $45 million in 2011, was in countries that according to the UNDP Human Development Index 2010 have a gross domestic product of less than $15,000 a year per person. Our fi gures do not include investments that are part of contractual agreements with host governments. We also provide signifi cant support through voluntary work by Shell employees and donations of equipment.
Local procurementWherever possible, we buy goods and services from local businesses. In 2012, we spent over $65 billion on contracting and procurement worldwide. Around half of this was spent in the USA, the UK, Canada, the Netherlands and Nigeria. We estimate around $14 billion was spent in countries that, according to the UNDP Human Development Index 2010, have a gross domestic product of less than $15,000 a year per person. In these countries, Shell companies spent over 90% of this $14 billion with local companies. We check that our suppliers are complying with key sustainability criteria, including good working conditions. In 2012, we conducted 50 rigorous assessments of suppliers in Africa and the Middle East, 110 in the Americas, 240 in the Asia-Pacifi c region and 152 in Europe, to check their
compliance in areas such as human rights, labour practices and business integrity.
External voluntary codesThe Shell General Business Principles and Code of Conduct guide the business activities of Shell companies. But we also support a number of external voluntary codes. These include the UN Declaration on Human Rights, the UN Global Compact, the Organisation for Economic Co-operation and Development Guidelines for Multinational Enterprises, and the International Labour Organization Declaration on Fundamental Principles and Rights at Work.
Our peopleThe quality of our people is essential to our business strategy. In 2012, we recruited around 1,200 graduates and 3,500 experienced professionals. Most of these new employees came from technical disciplines. Our salaries refl ect market conditions in the country where employees are based and the high level of skill and experience needed. We regularly review comparative remuneration for men and women across the company. We provide fl exible working practices wherever necessary and possible. Our employees are encouraged to take part in social responsibility projects and employee interest groups.
Employee communication and involvementTwo-way dialogue between management and staff is embedded in our work practices. It takes place directly and, where appropriate, via staff councils or recognised trade unions. Staff have the opportunity to understand Shell’s quarterly operational and fi nancial results through various channels, including face-to-face gatherings with senior managers, a personal email from the Chief Executive Offi cer, webcasts and online publications. We have multiple channels in place for staff
34 Shell Sustainability Report 2012 | reports.shell.comOur performance
VOLUNTARY SOCIAL INVESTMENT IN 2012proportion of spend
Enterprise developmentRoad safetyEnergy access Community developmentEducationBiodiversity Other
to report, confi dentially and anonymously, breaches of the Shell General Business Principles or our Code of Conduct, or other concerns. These include a global telephone helpline and a dedicated website.
Diversity and inclusionWe have a culture that embraces diversity and fosters an inclusive work environment with equal opportunities. We measure diversity and inclusion in part by the representation of women and local nationals in senior leadership positions. By the end of 2012, the proportion of women in senior leadership positions at Shell was 16.2%, down 0.4% from 2011 and up 0.9% from 2010. In 42% of countries where we operate, local nationals fi lled more than half the senior leadership
positions – up 8% from 2011, and up 6% from 2010. In 2012, more than 90% of our employees worldwide were local nationals.
Our annual Shell People Survey measures employees’ views on a range of topics, including the inclusiveness of their workplace. In 2012, 69% felt positive about this, up 1% from 2011 and up 3% from 2010; 12% felt negatively about inclusion in the workplace, the same as 2011 and down 1% from 2010.
Training and developmentWe continue to invest in developing the skills of our employees and joint-venture staff. In 2012, we invested over $280 million in training and development. Our focus is on building technical capability and safety-critical competencies and skills.
In 2012, we provided more than 750,000 training days for employees and some of our joint-venture partners. This included training more than 8,500 people in leadership skills. More than 150 senior project engineers completed our externally accredited Project Academy programme that helps to improve the delivery of our major energy projects.
Code of Conduct violationsShell employees, and contractors working for Shell, must abide by our Code of Conduct. In 2012, 209 violations of the Code of Conduct were reported (226 in 2011; 205 in 2010). As a result, we dismissed or terminated the contracts of 93 employees and contractors (78 in 2011; 77 in 2010).
$14 BILLION SPENT IN LOWER-INCOME COUNTRIES
$2.2BILLION SPENT ON ALTERNATIVE ENERGY, CCS, AND CO2-RELATED R&D
IN THE LAST 5 YEARS
70+NUMBER OF COUNTRIES IN WHICH WE OPERATED
$46BILLION CASH FLOW FROM OPERATING ACTIVITIES
$30 BILLION NET CAPITAL INVESTMENT
3.3MILLION OUR EQUITY PRODUCTION IN BARRELS OF OIL EQUIVALENT A DAY
$1.3BILLION SPENT ON R&D
3%OUR SHARE OF THE WORLD’S GAS PRODUCTION
44NUMBER OF VESSELS IN WHICH WE DELIVERED LNG – ONE OF THE WORLD’S LARGEST FLEETS
50%SHARE OF OUR PRODUCTION THAT WAS NATURAL GAS
20.2MILLION TONNES EQUITY SHARE OF LNG SOLD
2%OUR SHARE OF THE WORLD’S OIL PRODUCTION
8.4%OUR SHARE OF THE WORLD’S LNG SOLD
$27BILLION INCOME
87,000AVERAGE NUMBER OF PEOPLE EMPLOYED
7.7BILLION LITRES OF BIOFUEL DISTRIBUTED
35reports.shell.com | Shell Sustainability Report 2012Our performance
ENVIRONMENTAL AND SOCIAL DATAENVIRONMENTAL DATA
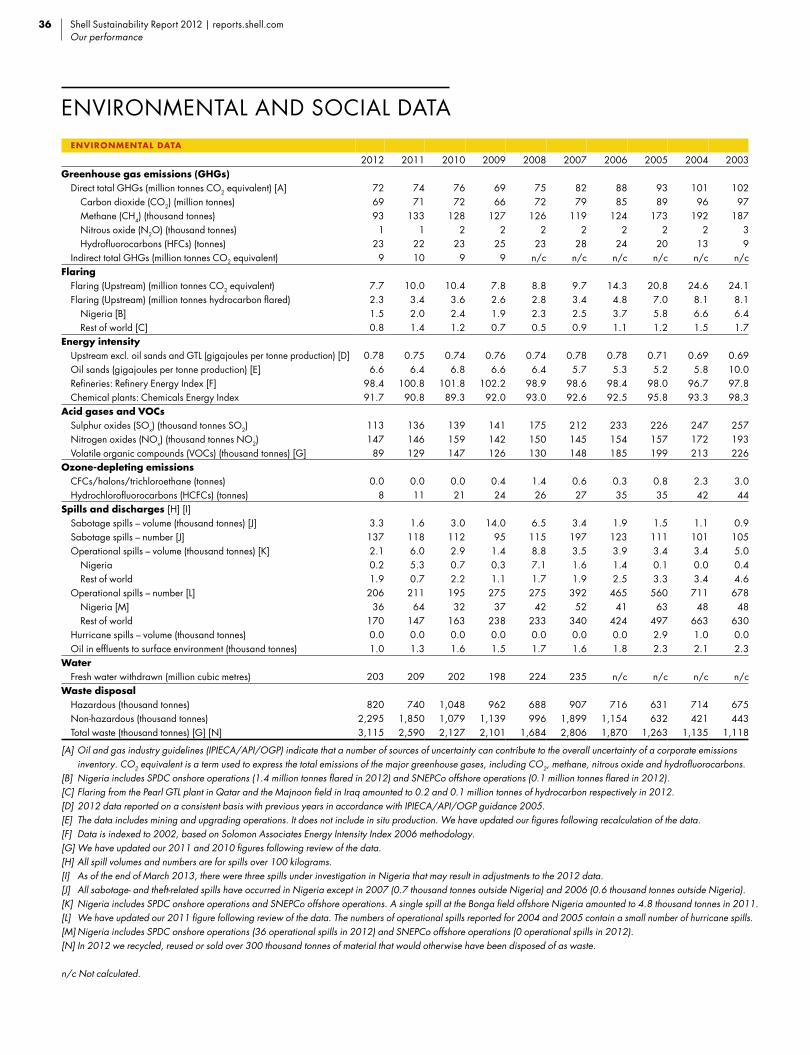
2012 2011 2010 2009 2008 2007 2006 2005 2004 2003Greenhouse gas emissions (GHGs)
Direct total GHGs (million tonnes CO2 equivalent) [A] 72 74 76 69 75 82 88 93 101 102 Carbon dioxide (CO2) (million tonnes) 69 71 72 66 72 79 85 89 96 97 Methane (CH4) (thousand tonnes) 93 133 128 127 126 119 124 173 192 187 Nitrous oxide (N2O) (thousand tonnes) 1 1 2 2 2 2 2 2 2 3 Hydrofl uorocarbons (HFCs) (tonnes) 23 22 23 25 23 28 24 20 13 9Indirect total GHGs (million tonnes CO2 equivalent) 9 10 9 9 n/c n/c n/c n/c n/c n/c
FlaringFlaring (Upstream) (million tonnes CO2 equivalent) 7.7 10.0 10.4 7.8 8.8 9.7 14.3 20.8 24.6 24.1Flaring (Upstream) (million tonnes hydrocarbon fl ared) 2.3 3.4 3.6 2.6 2.8 3.4 4.8 7.0 8.1 8.1 Nigeria [B] 1.5 2.0 2.4 1.9 2.3 2.5 3.7 5.8 6.6 6.4 Rest of world [C] 0.8 1.4 1.2 0.7 0.5 0.9 1.1 1.2 1.5 1.7
Energy intensityUpstream excl. oil sands and GTL (gigajoules per tonne production) [D] 0.78 0.75 0.74 0.76 0.74 0.78 0.78 0.71 0.69 0.69Oil sands (gigajoules per tonne production) [E] 6.6 6.4 6.8 6.6 6.4 5.7 5.3 5.2 5.8 10.0Refi neries: Refi nery Energy Index [F] 98.4 100.8 101.8 102.2 98.9 98.6 98.4 98.0 96.7 97.8Chemical plants: Chemicals Energy Index 91.7 90.8 89.3 92.0 93.0 92.6 92.5 95.8 93.3 98.3
Acid gases and VOCsSulphur oxides (SOx) (thousand tonnes SO2) 113 136 139 141 175 212 233 226 247 257Nitrogen oxides (NOx) (thousand tonnes NO2) 147 146 159 142 150 145 154 157 172 193Volatile organic compounds (VOCs) (thousand tonnes) [G] 89 129 147 126 130 148 185 199 213 226
Ozone-depleting emissionsCFCs/halons/trichloroethane (tonnes) 0.0 0.0 0.0 0.4 1.4 0.6 0.3 0.8 2.3 3.0Hydrochlorofl uorocarbons (HCFCs) (tonnes) 8 11 21 24 26 27 35 35 42 44
Spills and discharges [H] [I]Sabotage spills – volume (thousand tonnes) [J] 3.3 1.6 3.0 14.0 6.5 3.4 1.9 1.5 1.1 0.9Sabotage spills – number [J] 137 118 112 95 115 197 123 111 101 105Operational spills – volume (thousand tonnes) [K] 2.1 6.0 2.9 1.4 8.8 3.5 3.9 3.4 3.4 5.0 Nigeria 0.2 5.3 0.7 0.3 7.1 1.6 1.4 0.1 0.0 0.4 Rest of world 1.9 0.7 2.2 1.1 1.7 1.9 2.5 3.3 3.4 4.6Operational spills – number [L] 206 211 195 275 275 392 465 560 711 678 Nigeria [M] 36 64 32 37 42 52 41 63 48 48 Rest of world 170 147 163 238 233 340 424 497 663 630Hurricane spills – volume (thousand tonnes) 0.0 0.0 0.0 0.0 0.0 0.0 0.0 2.9 1.0 0.0Oil in effl uents to surface environment (thousand tonnes) 1.0 1.3 1.6 1.5 1.7 1.6 1.8 2.3 2.1 2.3
WaterFresh water withdrawn (million cubic metres) 203 209 202 198 224 235 n/c n/c n/c n/c
Waste disposal Hazardous (thousand tonnes) 820 740 1,048 962 688 907 716 631 714 675Non-hazardous (thousand tonnes) 2,295 1,850 1,079 1,139 996 1,899 1,154 632 421 443Total waste (thousand tonnes) [G] [N] 3,115 2,590 2,127 2,101 1,684 2,806 1,870 1,263 1,135 1,118
[A] Oil and gas industry guidelines (IPIECA/API/OGP) indicate that a number of sources of uncertainty can contribute to the overall uncertainty of a corporate emissions inventory. CO2 equivalent is a term used to express the total emissions of the major greenhouse gases, including CO2, methane, nitrous oxide and hydrofl uorocarbons.
[B] Nigeria includes SPDC onshore operations (1.4 million tonnes fl ared in 2012) and SNEPCo offshore operations (0.1 million tonnes fl ared in 2012).[C] Flaring from the Pearl GTL plant in Qatar and the Majnoon fi eld in Iraq amounted to 0.2 and 0.1 million tonnes of hydrocarbon respectively in 2012. [D] 2012 data reported on a consistent basis with previous years in accordance with IPIECA/API/OGP guidance 2005. [E] The data includes mining and upgrading operations. It does not include in situ production. We have updated our fi gures following recalculation of the data. [F] Data is indexed to 2002, based on Solomon Associates Energy Intensity Index 2006 methodology.[G] We have updated our 2011 and 2010 fi gures following review of the data.[H] All spill volumes and numbers are for spills over 100 kilograms.[I] As of the end of March 2013, there were three spills under investigation in Nigeria that may result in adjustments to the 2012 data. [J] All sabotage- and theft-related spills have occurred in Nigeria except in 2007 (0.7 thousand tonnes outside Nigeria) and 2006 (0.6 thousand tonnes outside Nigeria).[K] Nigeria includes SPDC onshore operations and SNEPCo offshore operations. A single spill at the Bonga fi eld offshore Nigeria amounted to 4.8 thousand tonnes in 2011.[L] We have updated our 2011 fi gure following review of the data. The numbers of operational spills reported for 2004 and 2005 contain a small number of hurricane spills.[M] Nigeria includes SPDC onshore operations (36 operational spills in 2012) and SNEPCo offshore operations (0 operational spills in 2012).[N] In 2012 we recycled, reused or sold over 300 thousand tonnes of material that would otherwise have been disposed of as waste.
n/c Not calculated.
36 Shell Sustainability Report 2012 | reports.shell.comOur performance
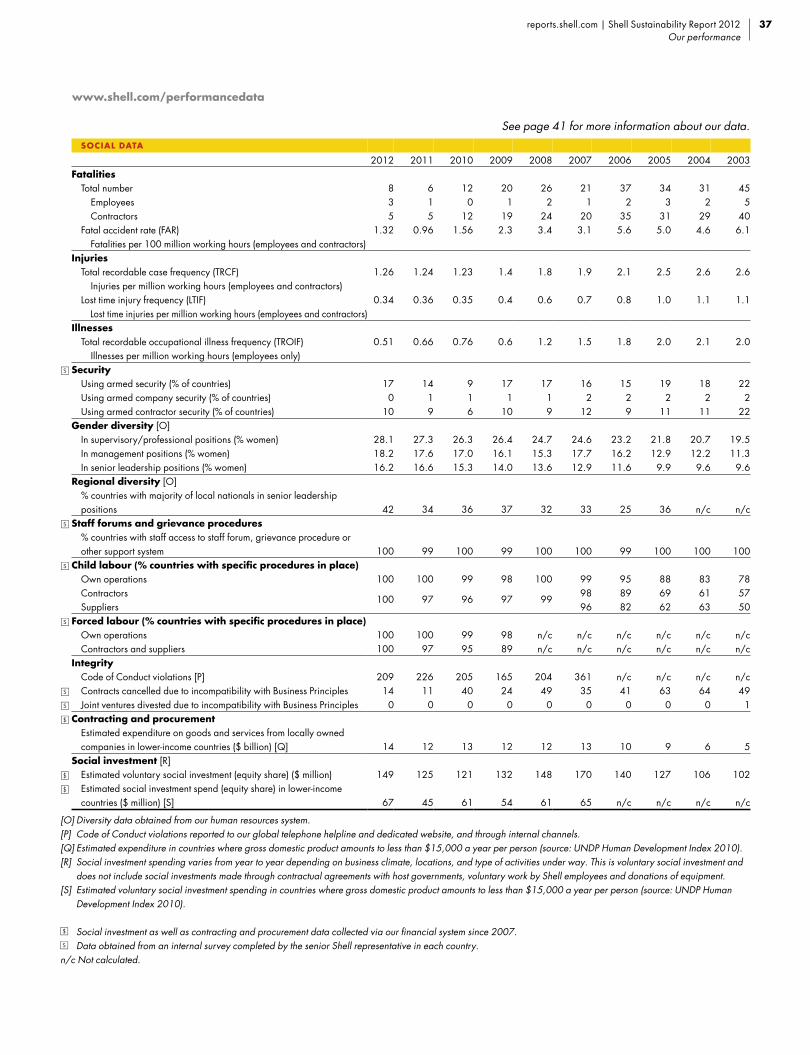
SOCIAL DATA
2012 2011 2010 2009 2008 2007 2006 2005 2004 2003Fatalities
Total number 8 6 12 20 26 21 37 34 31 45 Employees 3 1 0 1 2 1 2 3 2 5 Contractors 5 5 12 19 24 20 35 31 29 40Fatal accident rate (FAR) 1.32 0.96 1.56 2.3 3.4 3.1 5.6 5.0 4.6 6.1 Fatalities per 100 million working hours (employees and contractors)
InjuriesTotal recordable case frequency (TRCF) 1.26 1.24 1.23 1.4 1.8 1.9 2.1 2.5 2.6 2.6 Injuries per million working hours (employees and contractors)Lost time injury frequency (LTIF) 0.34 0.36 0.35 0.4 0.6 0.7 0.8 1.0 1.1 1.1 Lost time injuries per million working hours (employees and contractors)
IllnessesTotal recordable occupational illness frequency (TROIF) 0.51 0.66 0.76 0.6 1.2 1.5 1.8 2.0 2.1 2.0 Illnesses per million working hours (employees only)
SecurityUsing armed security (% of countries) 17 14 9 17 17 16 15 19 18 22Using armed company security (% of countries) 0 1 1 1 1 2 2 2 2 2Using armed contractor security (% of countries) 10 9 6 10 9 12 9 11 11 22
Gender diversity [O]In supervisory/professional positions (% women) 28.1 27.3 26.3 26.4 24.7 24.6 23.2 21.8 20.7 19.5In management positions (% women) 18.2 17.6 17.0 16.1 15.3 17.7 16.2 12.9 12.2 11.3In senior leadership positions (% women) 16.2 16.6 15.3 14.0 13.6 12.9 11.6 9.9 9.6 9.6
Regional diversity [O]% countries with majority of local nationals in senior leadership positions 42 34 36 37 32 33 25 36 n/c n/c
Staff forums and grievance procedures% countries with staff access to staff forum, grievance procedure or other support system 100 99 100 99 100 100 99 100 100 100
Child labour (% countries with specifi c procedures in place)Own operations 100 100 99 98 100 99 95 88 83 78Contractors
100 97 96 97 9998 89 69 61 57
Suppliers 96 82 62 63 50Forced labour (% countries with specifi c procedures in place)
Own operations 100 100 99 98 n/c n/c n/c n/c n/c n/cContractors and suppliers 100 97 95 89 n/c n/c n/c n/c n/c n/c
IntegrityCode of Conduct violations [P] 209 226 205 165 204 361 n/c n/c n/c n/cContracts cancelled due to incompatibility with Business Principles 14 11 40 24 49 35 41 63 64 49Joint ventures divested due to incompatibility with Business Principles 0 0 0 0 0 0 0 0 0 1
Contracting and procurementEstimated expenditure on goods and services from locally owned companies in lower-income countries ($ billion) [Q] 14 12 13 12 12 13 10 9 6 5
Social investment [R]Estimated voluntary social investment (equity share) ($ million) 149 125 121 132 148 170 140 127 106 102Estimated social investment spend (equity share) in lower-income countries ($ million) [S] 67 45 61 54 61 65 n/c n/c n/c n/c
[O] Diversity data obtained from our human resources system.[P] Code of Conduct violations reported to our global telephone helpline and dedicated website, and through internal channels.[Q] Estimated expenditure in countries where gross domestic product amounts to less than $15,000 a year per person (source: UNDP Human Development Index 2010). [R] Social investment spending varies from year to year depending on business climate, locations, and type of activities under way. This is voluntary social investment and
does not include social investments made through contractual agreements with host governments, voluntary work by Shell employees and donations of equipment.[S] Estimated voluntary social investment spending in countries where gross domestic product amounts to less than $15,000 a year per person (source: UNDP Human
Development Index 2010).
Social investment as well as contracting and procurement data collected via our fi nancial system since 2007. Data obtained from an internal survey completed by the senior Shell representative in each country.
n/c Not calculated.
See page 41 for more information about our data.
www.shell.com/performancedata
37reports.shell.com | Shell Sustainability Report 2012Our performance

James HogganPresident, James Hoggan & Associates, Canada
Tom Burke CBEEnvironmental Policy Advisor, Rio Tinto Plc, UK
Motoko Aizawa (Chair)Advisor to the Sustainable Development Network, World Bank, Japan
Charles SecrettFounder Member, The Robertsbridge Group, UK
Ndidi NwuneliFounder, LEAP Africa and Co-Founder, AACE Foods, Nigeria
Dan Sperling PhDDirector, Institute of Transportation Studies, University of California, Davis, USA
Clarissa LinsExecutive Director, Foundation for Sustainable Development, Brazil
EXTERNAL REVIEW COMMITTEE
The External Review Committee (ERC or the Committee) is pleased to comment on Shell’s 2012 Sustainability Report. The ERC’s engagement with Shell in this reporting cycle began in October 2012 with multiple face-to-face meetings with members of Shell’s senior management and the Shell Board of Directors, including Chief Executive Offi cer Peter Voser and Chad Holliday, Chair of the Corporate and Social Responsibility Committee of the Board. The ERC and Shell management next met in January 2013, when the ERC had a chance to provide its reaction to the fi rst draft of the report.
As with previous years, the engagement process was well designed, and Shell managers were open and informative. The ERC thanks the Shell reporting team and senior management for a unique opportunity to understand Shell’s sustainable development activities, challenges and outlook.
The purpose of the ERC’s extensive engagement with Shell management is to enable us to understand Shell’s operational context suffi ciently so that we can provide informed comments on Shell’s Sustainability Report and the company’s sustainability performance. We do not act as verifi ers of information presented in this Report. (See box on page 39 for more detail on the ERC’s role and relationship with Shell.)
This letter contains our opinions on Shell’s 2012 report. We will meet with Shell’s Executive Committee in June 2013 to share our views on the company’s sustainability performance.
Overall report quality The ERC is of the view that the 2012 report presents the material environmental and social challenges that affect Shell’s business performance and are of interest to its key stakeholders. The report provides a thorough account of Shell’s business activities, with focus on safety and responsibility. It presents Shell’s environmental footprint data and some
social performance information in a manner consistent with this responsibility theme, though the Committee would have liked more commentary on performance data throughout the report. The ERC notes that the report uses external opinions effectively to illustrate both progress and challenges. The 2012 report incorporates a number of new features, some in response to feedback from the ERC.
Sustainable development strategy and climate change The ERC understands the core of Shell’s strategy on sustainable development is to use innovation and technology to deliver cleaner energy – through natural gas, carbon capture and storage (CCS), biofuels and energy effi ciency.
The ERC commends the action Shell took in 2012 toward CCS and appreciates the expanded explanation of Shell’s approaches to operational energy effi ciency in this year’s report. Shell’s position on climate change would command greater public confi dence if Shell could more fully explain how it applies its $40 a tonne carbon shadow price. Shell could also clarify how it reconciles the differences between the clear public positions it adopts on climate change, for example by advocating for market mechanisms and a price on carbon, with the positions adopted by some industry organisations to which it belongs. Beyond these observations, the ERC continues to feel that Shell’s activities in these areas should be presented as part of a more coherent long-term strategy to address climate change, believing this would provide necessary context for its stakeholders to understand Shell’s overall sustainable development strategy.
This year, the ERC had an opportunity to better appreciate Shell’s approach to technology and innovation, and how they connect to its long-term view on climate change and future challenges. Given the central role they play in Shell’s approach to sustainable development,
Shell, for the eighth successive year, has invited an External Review Committee to assess its sustainability reporting. This letter provides our assessment of Shell’s 2012 Sustainability Report. We express our views as individuals, not on behalf of our organisations.
38 Shell Sustainability Report 2012 | reports.shell.comOur performance
the Committee looks forward to additional material on technology and innovation in future reports.
Risk and complexity The Committee recognises that Shell’s need to replenish its reserves means that it is seeking them in increasingly challenging areas, such as deep oceans and the Arctic, and from sources such as oil sands. In the 2011 report, the ERC identifi ed some tensions between Shell’s desire to develop reserves in environmentally and socially sensitive locations and its ability to manage risks from these operations. The ERC in turn asked for a more robust treatment of the operational challenges and Shell’s approach to anticipate, identify and manage risks.
The 2012 report describes these tensions, risks and complexities more fully through its use of case studies and “Focus” stories. The report offers a sobering account of the serious challenges that Shell faces in Nigeria. The detailed treatment of the Arctic, the Kulluk incident and Shell’s acknowledgement of operational shortcomings in Alaska in 2012 provide a balanced account of the situation, and the Committee anticipates further analysis and refl ection in next year’s report. Given the concerns about these and other operations in sensitive locations or challenging circumstances, future reports might be more specifi c about lessons learned, and how they are translated into actions and systematically implemented and monitored across the company.
The 2012 report provides detailed coverage on tight/shale gas and oil, which is helpful for stakeholders. Shell has pushed for transparency of information on the chemicals used in fracking, which sets Shell apart from others. Nonetheless, the ERC wonders whether the report suffi ciently acknowledges communities’ concerns about fracking, particularly with regard to potential impacts on air and water. Shell is working to better understand these impacts and has published a set of operating principles designed to raise industry standards. Considering the uncertainties around cumulative impacts and fugitive emissions of methane, however, Shell’s assertions that its technologies are safe are not likely to fully address communities’ concerns without further research, monitoring and reporting.
This year’s report contains a section on how Shell works with its joint venture partners, contractors and suppliers. Due
to the ever-increasing attention on how extractive companies manage governance risks, the explanation of how the Shell Control Framework applies to ventures with Shell’s involvement is very welcome, and the ERC encourages Shell to generate additional materials on this theme in future reporting.
Social performance and investment In the last report cycle, we understood that new social performance metrics were being developed in 2011 and would be implemented in 2012, and that a new social performance strategy would be forthcoming. The Committee also looked forward to learning about the progress in establishing additional grievance mechanisms for new projects. These items were not included in the 2012 report.
Shell acknowledges that its operations are potentially more vulnerable to above-the-ground or non-technical risks than below-the-ground or technical risks, and that social performance is key to managing above-the-ground risks. Considering the materiality of such risks, the ERC hopes that Shell will move forward on social performance and include more information about this in future sustainability reports.
For the fi rst time, this year’s report includes a breakdown of Shell’s social investments, which helps readers understand the types of investments made. It would be important for Shell and its stakeholders to know that the investments are having the desired impacts on communities. Shell could benefi t from completion, publication and proactive application of its social investment strategy, which would not only guide the prioritisation of its social investments at local and global levels, but would also help articulate the impacts, as well as enhance the sustainability, effectiveness and effi ciency of these investments.
Conclusion While acknowledging the high quality of Shell’s sustainability reports, which distinguishes Shell among its peers, there is a growing desire on the part of the ERC to see more strategic context and content in these reports. The Committee would like to see a more comprehensive presentation of Shell’s vision, strategy and metrics for sustainable development in a world facing climate change, growing energy demand, and continuing concern about environmental and social impacts. It is clear from our engagement with Shell that
its management and reporting team can take the company’s sustainability reporting to a new level of excellence.
The ERC now looks forward to engaging with the Executive Committee to continue its dialogue on Shell’s sustainability performance.
39reports.shell.com | Shell Sustainability Report 2012Our performance
ERC OVERVIEWDuring the annual cycle, the Committee met in person three times in The Hague, the Netherlands, and on other occasions by teleconference. We held meetings with key Shell senior management and other personnel to discuss in detail Shell’s approach to sustainable development and its sustainability reporting.
In reviewing Shell’s 2012 Sustainability Report, the Committee concentrated on three main questions: Has Shell selected the most important
topics for the report? How well has the report dealt with
these topics and responded to stakeholder interest? Did Shell provide suffi cient
information and access for us to do our job effectively?
Our review did not include verifi cation of performance data underlying the report, or the information on which the case studies in the report were based.
In addition to our comments on the company’s sustainability reporting, the Committee will meet with Shell’s Executive Committee in mid-2013 (as we did in 2012), to discuss our observations on the company’s strategy and sustainability performance.
In recognition of our time and expertise, an honorarium was offered, payable either to us individually, to our organisation, or to a charity of our choosing. We were also offered reimbursement for the expense of our travel and accommodation.
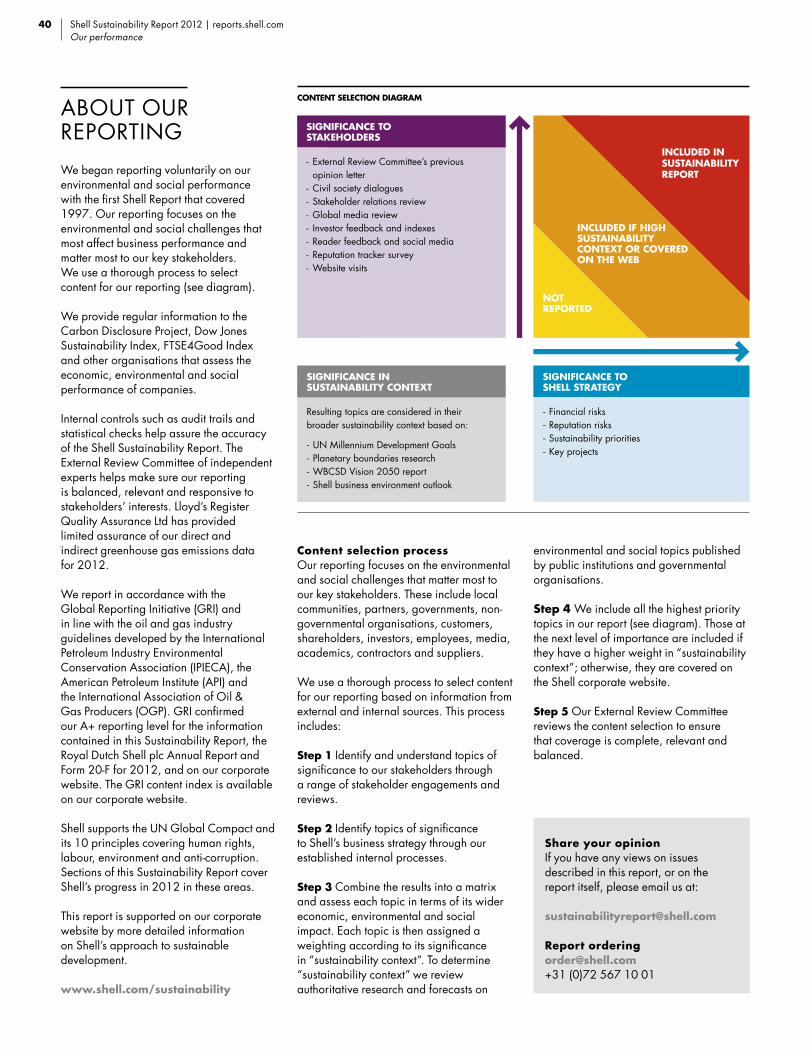
Content selection processOur reporting focuses on the environmental and social challenges that matter most to our key stakeholders. These include local communities, partners, governments, non-governmental organisations, customers, shareholders, investors, employees, media, academics, contractors and suppliers.
We use a thorough process to select content for our reporting based on information from external and internal sources. This process includes:
Step 1 Identify and understand topics of signifi cance to our stakeholders through a range of stakeholder engagements and reviews.
Step 2 Identify topics of signifi cance to Shell’s business strategy through our established internal processes.
Step 3 Combine the results into a matrix and assess each topic in terms of its wider economic, environmental and social impact. Each topic is then assigned a weighting according to its signifi cance in “sustainability context”. To determine “sustainability context” we review authoritative research and forecasts on
environmental and social topics published by public institutions and governmental organisations.
Step 4 We include all the highest priority topics in our report (see diagram). Those at the next level of importance are included if they have a higher weight in “sustainability context”; otherwise, they are covered on the Shell corporate website.
Step 5 Our External Review Committee reviews the content selection to ensure that coverage is complete, relevant and balanced.
INCLUDED IF HIGH SUSTAINABILITY CONTEXT OR COVERED ON THE WEB
NOTREPORTED
INCLUDED IN SUSTAINABILITY REPORT
SIGNIFICANCE TO STAKEHOLDERS - External Review Committee’s previous opinion letter- Civil society dialogues- Stakeholder relations review- Global media review- Investor feedback and indexes- Reader feedback and social media- Reputation tracker survey- Website visits
SIGNIFICANCE TO SHELL STRATEGY - Financial risks- Reputation risks- Sustainability priorities- Key projects
SIGNIFICANCE IN SUSTAINABILITY CONTEXT Resulting topics are considered in their broader sustainability context based on: - UN Millennium Development Goals- Planetary boundaries research- WBCSD Vision 2050 report- Shell business environment outlook
CONTENT SELECTION DIAGRAM
ABOUT OUR REPORTINGWe began reporting voluntarily on our environmental and social performance with the fi rst Shell Report that covered 1997. Our reporting focuses on the environmental and social challenges that most affect business performance and matter most to our key stakeholders. We use a thorough process to select content for our reporting (see diagram).
We provide regular information to the Carbon Disclosure Project, Dow Jones Sustainability Index, FTSE4Good Index and other organisations that assess the economic, environmental and social performance of companies.
Internal controls such as audit trails and statistical checks help assure the accuracy of the Shell Sustainability Report. The External Review Committee of independent experts helps make sure our reporting is balanced, relevant and responsive to stakeholders’ interests. Lloyd’s Register Quality Assurance Ltd has provided limited assurance of our direct and indirect greenhouse gas emissions data for 2012.
We report in accordance with the Global Reporting Initiative (GRI) and in line with the oil and gas industry guidelines developed by the International Petroleum Industry Environmental Conservation Association (IPIECA), the American Petroleum Institute (API) and the International Association of Oil & Gas Producers (OGP). GRI confi rmed our A+ reporting level for the information contained in this Sustainability Report, the Royal Dutch Shell plc Annual Report and Form 20-F for 2012, and on our corporate website. The GRI content index is available on our corporate website.
Shell supports the UN Global Compact and its 10 principles covering human rights, labour, environment and anti-corruption. Sections of this Sustainability Report cover Shell’s progress in 2012 in these areas.
This report is supported on our corporate website by more detailed information on Shell’s approach to sustainable development.
www.shell.com/sustainability
40 Shell Sustainability Report 2012 | reports.shell.comOur performance
Share your opinionIf you have any views on issues described in this report, or on the report itself, please email us at:
Report [email protected]+31 (0)72 567 10 01
carbon neutralnatureOffice.com | NL-001-959223
print production
ABOUT OUR DATAThere are inherent limitations to the accuracy of environmental and social data. We recognise that our environmental and social data will be affected by these limitations and continue to improve the integrity of our data by strengthening our internal controls.
All non-fi nancial data in this report are reported on a 100% basis for companies and joint ventures where we are the operator. Environmental data are for our direct emissions unless otherwise stated. We report in this way, in line with industry practice, because these are the data we can directly manage and affect through operational improvements.
Operations acquired or divested during the year are included only for the period of our ownership. Other data are collected from external sources, staff surveys and other internal sources as indicated.
We only include data in this report that have been confi rmed by the end of March 2013. If incidents are reclassifi ed or confi rmed, or if signifi cant data changes occur after preparation of this report, they will be updated in the following year’s publication. Data marked in the social data table come from an internal survey completed by the senior Shell representative in each country. The accuracy of environmental and social data may be lower than that of data obtained through our fi nancial systems.
Data provided are subject to internal controls. Lloyd’s Register Quality Assurance Ltd has provided limited assurance of our direct and indirect greenhouse gas (GHG) emissions data for 2012. Limited assurance means nothing has come to the auditor’s attention that would indicate that the data are not correct. For GHG emissions we provide more detailed data on our corporate website.
www.shell.com/ghg
Conversions into US dollars are based on the average exchange rates for 2012.
REPORT SPECIFICATIONSThe paper used for this report is Satimat Green, a Forest Stewardship Council (FSC) certifi ed paper, produced from 60% FSC-certifi ed recycled fi bre and 40% FSC-certifi ed virgin fi bre. All virgin fi bres are Elemental Chlorine Free bleached, without using chlorine gas. The inks used are vegetable oil-based. The laminate used for the cover is eco-friendly and allows the report to be fully recycled.
The printing of this document was carbon neutral: certifi ed carbon-offset projects compensated for the CO2 emissions.
Designed by Studio DumbarPrinted by Tuijtel under ISO 14001
Disclaimer:
later changes to such material.
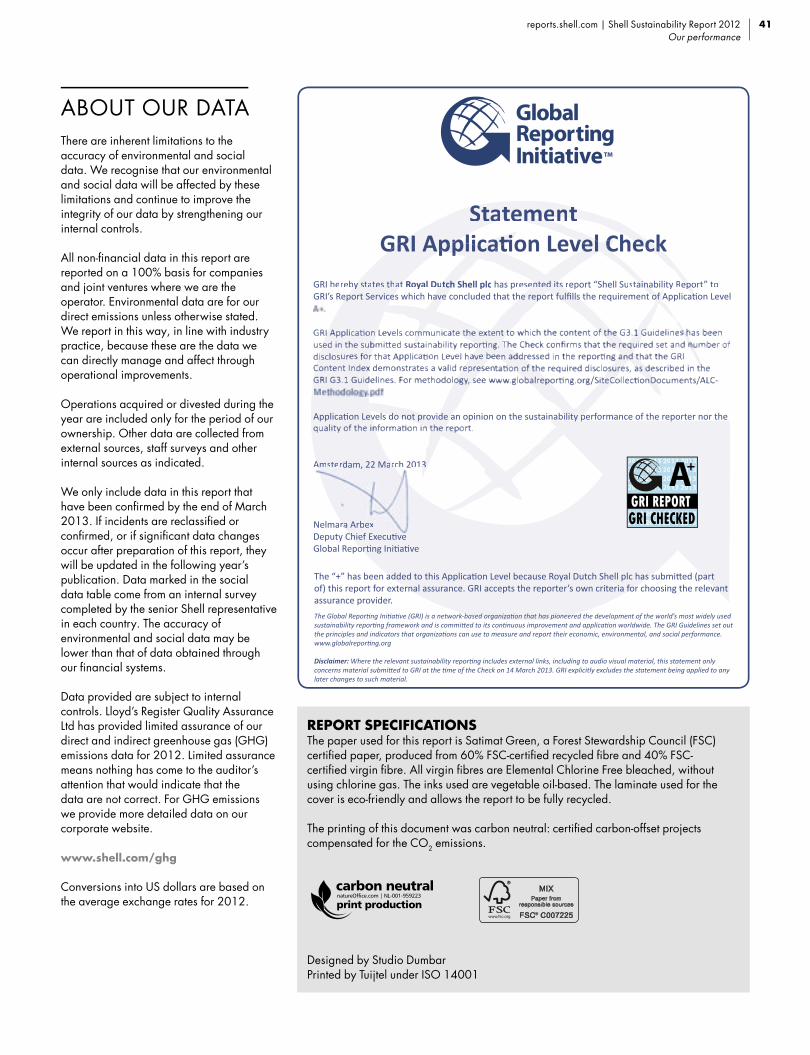
SS atatttemeemeemennntttt
GRI herebyy states thaat t Royal Duutt h Shell plcch has preseennt tsed its report “Shell Sustainability ainabili Reporepo t” to
0133
Royal Dutch Shell plc of) this report for external assurance. GRI accepts the reporter’s own criteria for choosing the relevant assurance provider.
AAmsterrrrrdamddddddddddddd , 22 Marrch 2
Nelmarraa Arbex
2013 2013 2013 20132013 2013 2013 20132013 2013 2013 20132013 2013 2013 20132013 2013 2013 20132013 2013 2013 20132013 2013 2013 20132013 2013 2013 2013
reports.shell.com | Shell Sustainability Report 2012Our performance
41