ANNUAL NOVOLIPETSK REPORT STEEL 2005
144
ANNUAL NOVOLIPETSK REPORT STEEL 2005
-
Upload
khangminh22 -
Category
Documents
-
view
0 -
download
0
Transcript of ANNUAL NOVOLIPETSK REPORT STEEL 2005

ANNUAL NOVOLIPETSKREPORT STEEL
2005

2
Chairman’s statement ............................................................................................................................................3
Objectives and strategy ........................................................................................................................................6
Company profile ..........................................................................................................................................................7
2005 Major developments ..............................................................................................................................10
Main results of 2005 ............................................................................................................................................13
Company’s activities ............................................................................................................................................14
Steel segment..................................................................................................................................................15
Segment’s profile..............................................................................................................................15
Production ............................................................................................................................................15
Overview of steel markets..........................................................................................................21
Sales of steel products ..............................................................................................................25
Raw materials and supplies......................................................................................................29
Financial results ..............................................................................................................................31
Mining segment ............................................................................................................................................35
Segment’s profile..............................................................................................................................35
Production and reserves ............................................................................................................35
Financial results................................................................................................................................39
Other activities ..............................................................................................................................................43
Description ............................................................................................................................................43
Financial results ..............................................................................................................................45
Consolidated financial results ......................................................................................................................46
Financial results ..........................................................................................................................................47
Ratings..................................................................................................................................................................55
Risk management ......................................................................................................................................57
Value-based management ....................................................................................................................61
Technical upgrade and development ......................................................................................................63
Corporate social responsibility ....................................................................................................................67
Corporate governance ........................................................................................................................................74
Principles of corporate governance ............................................................................................75
Management bodies of NLMK..............................................................................................................76
Management structure ............................................................................................................................80
Share capital ..............................................................................................................................................................84
Share capital ....................................................................................................................................................85
Share price information ..........................................................................................................................85
Dividends ............................................................................................................................................................87
Suggested profit allocation ............................................................................................................................89
NLMK’s US GAAP consolidated financial statements ................................................................90
Major results for five years ..........................................................................................................................143
CONTENTS OF THE ANNUAL REPORT

3NLMK • ANNUAL REPORT • 2005
Dear shareholders,
I am delighted to present NLMK’s strong financial results and strategic
developments for the year ended 31 December, 2005. This has been an
outstanding year for our company. Last year, the main objectives were to bring the
company to the international stock market, achieve further vertical integration
through M&A activities to deliver substantial synergy benefits, and successfully
accomplish the first phase of the technical upgrading program. I believe that
NLMK’s outstanding share price performance since the commencement of trading
on the London Stock Exchange on 15 December, 2005, is a strong endorsement of
our corporate strategy.
Our successful listing on the LSE raised NLMK’s international profile and increased
the company’s global liquidity. According to analysts’ reports, NLMK is now the
most liquid steel stock in Russia.
CHAIRMAN’S STATEMENT

4
Despite the fact that the market environment significantly deteriorated in the
second half of the year, the company maintained a high level of revenues. In 2005,
NLMK’s revenues amounted to USD 4,468.7 million, remaining almost at the record
level attained in 2004. The slight decrease in operating income from 2004 is
primarily a result of the reduction of steel output caused by scheduled
maintenance activities. However, it is particularly pleasing to note that in this
challenging pricing and cost environment, we were able to produce a 47% EBITDA
margin. This result enables NLMK to maintain its position as the world’s most
profitable steel company.
NLMK’s continued strong cash generation, with net income at USD 1,385 million for
2005, allows us to fund an ongoing technical upgrading program. We have already
spent USD 1.26 billion on the first phase of the program, covering the period from
2000 to 2005, that allowed NLMK to achieve the current level of technical and
financial efficiency The second phase of the technical upgrading program,
scheduled for the period from 2006 to 2010, will help us to strengthen our position
as a leading steel producer. We are planning to expand rolling capacity to over 6
million tonnes by 2010, focusing on the production of high value-added products.
The strong cash flows from our operations give NLMK the capacity to finance its
production costs, capital expenditures and M&A activities, in full, from existing
cash funds. The company has excess cash and the Board has decided that a large
portion of it will now be returned to shareholders. NLMK’s Board is proposing to
amend the dividend policy so that it now provides for minimum dividend payments
of 20% of US GAAP net income (previously 15% of US GAAP net income) and to
target an average dividend payment during a five-year period of 30% of US GAAP
net income. In addition, starting in 2006, the Board will recommend using the
proceeds from divesting non-core businesses for special dividend payments. The
dividends for 2005 include approximately USD 300 million of net proceeds from
the divestment of a minority stake in Lebedinsky GOK.
In regard to the main components of corporate strategy, we continued to focus on
strengthening vertical integration as the company’s key competitive advantage.
As a result of further consolidation of iron ore assets, NLMK has now achieved
100% self-sufficiency in iron ore, and used strategic acquisition opportunities in
the coal-mining sector to purchase a license for the Zhernovskoe-1 coal deposits
in Western Siberia. Along with the recent acquisitions of coking coal and coke
facilities, Altai-koks and Prokopievskugol, that were completed recently, this will
allow us to achieve 100% self-sufficiency in coking coal by 2009.
The second pillar of the vertical integration strategy is purchasing high-quality
rolling capacities in our strategic markets. In 2005, NLMK participated in the
privatization auction for the stake in Erdemir to extend the company’s access to this
prospective market. However, the auction price escalated to levels beyond adequate
value creation opportunities. I would like to confirm, once again, that we continue to
look selectively at value enhancing M&A opportunities. The acquisition of
DanSteel A/S at the beginning of 2006 demonstrates that NLMK’s fundamental
approach is based on introducing value-added products as opposed to simply
increasing capacity.

5
■ CHAIRMAN’S STATEMENT
NLMK • ANNUAL REPORT • 2005
We continue to ensure constant enhancement of our corporate governance
practices. In 2005 we elected four independent Board members who took active
part in implementing the principles of our new Corporate Governance Code. We
also endeavour to ensure timely and precise disclosure of information and to
provide maximum transparency of our financial and business operations.
The outlook for the global economy is positive. The core markets demonstrate
stable growth and a strong underlying demand for NLMK’s products. We anticipate
that prices and demand will continue at or near current levels throughout 2006,
allowing NLMK to produce strong operating profit and margins.
In conclusion, I want to thank all our employees, Board members and management
team who contributed to NLMK’s success story in 2005. Your dedication,
experience, and industry knowledge are NLMK’s most valuable assets.
Sincerely yours, Vladimir Lisin

6
OBJECTIVES AND STRATEGY
Our vision
Novolipetsk Steel (NLMK) is a leader in the global steel industry, with the highest
profitability margins, supplying a wide range of high quality products to both
domestic and foreign markets.
Our mission
Our mission is to create value for our shareholders by producing high quality
products that meet customers’ requirements.
Our strategic objectives
■ ensure growth of the Company’s value and its attractiveness to investors by
pursuing strategic acquisition opportunities that will help the Company to
achieve further vertical integration;
■ continuously improve technological and management processes and introduce
modern equipment to strengthen our position as a low-cost and highly
profitable steel company;
■ consistently implement the Technical Upgrading Program to further improve
the quality of our products and increase production levels of high value-added
products portfolio;
■ strengthen our competitive advantages on core markets and develop potential
new markets for the Company’s steel products through efficient sales policies
aimed at monitoring the requirements and feedback of the Company’s
customers;
■ further focus on both social responsibility of the Company and efficiency of its
remuneration system to ensure sustainable growth of employees’ living
standards and their social welfare. Attract and retain the most talented
professionals;
■ ensure the Company’s compliance with European environmental standards,
implement innovative technologies and prevent pollution of the environment;
■ maintain firm commitment to the best practices in corporate governance.

7NLMK • ANNUAL REPORT • 2005
Novolipetsk Steel (NLMK) is one of the largest steel-making companies in the
world, and the fourth-largest steel producer in Russia.
Novolipetsk Steel (NLMK) is a vertically integrated group of companies, with
control over many of its raw materials suppliers being, to a considerable extent,
self-sufficient in electricity.
The NLMK Group consists of:
■ Steel Segment including Parent Company OJSC NLMK and service providers
(LLC Trade House NLMK and LLC Independent Transport Company), involved in
supporting metals production and sales of products and services. Also, in
January 2006 NLMK acquired 100% of shares in DanSteel A/S (Danish steel
manufacturer);
■ Mining Segment comprising OJSC Stoilensky GOK, OJSC Dolomite, OJSC
Stagdok (producers of metallurgical raw materials for the Parent Company), as
well as OJSC Combinat KMAruda that joined the Group at the beginning of 2006
(previously, OJSC Combinat KMAruda was a member of the NLMK Group from
2000 through 1st quarter 2005). In addition, in the beginning of 2006 NLMK
reached an agreement to buy an interest in OJSC Altai-koks and
Prokopievskugol group of coal companies;
■ Other Companies including OJSC Tuapse Commercial Sea Port (TMTP), Russia’s
fifth-largest sea port located on the Black Sea; OJSC Bank for Social
Development and Construction Lipetskcombank; LLC Lipetsk Insurance
Company Chance; LLC Lipetsk Municipal Energy Company (LMEC) supplying
electricity to households, and other companies.
The Company produces flat products in a variety of grades and sizes. NLMK
produces about 13% of the overall Russian crude steel output, 20% of flat rolled
steel and 53% of pre-painted rolled products. The Company is the largest producer
of cold-rolled steel in Russia and one of the largest producers of electrical steels
in Europe.
NLMK is Russia’s third-largest producer of iron ore. In 2005, the mining
companies of NLMK Group produced approximately 13% of Russia’s iron ore,
a substantial part of which was consumed within the Group.
The Company’s products are in steady demand on both domestic and foreign
markets. The Company generated 58% of its sales revenue from export markets.
At present, NLMK’s core export markets are Asia and Australasia, the EU and the
Middle East, including Turkey.
NLMK is globally recognized as a producer of high quality products. The
Company’s traditional partners value stability, and so they have confidence in
NLMK. New customers are attracted by the reliability and high quality of NLMK’s
products.
The Company is recognized as Russia’s leader in the implementation of
advanced technologies. As part of its Technical Upgrading Programme and further
COMPANY PROFILE

8
NLMK’s share in steel industry production in 2005
Source: Federal State Statistic Service, Chermet
Source: Federal State Statistic Service, Chermet
* – inc. OJSC КМАruda which is an associate from 2nd quarter 2005 onward
Source: OJSC Rudprom
NLMK’s share in industry production of flat-rolled products in 2005
NLMK’s share in industry production of merchantable iron ore in 2005*

9NLMK • ANNUAL REPORT • 2005
development to raise the quality and competitiveness of our products while
cutting production costs, NLMK has considerably improved both its technological
standards and equipment.
NLMK’s high level of vertical integration enables it to control production costs
throughout its production chain, which guarantees its leadership in terms of
profitability among major global steel producers.
Our strong financial position is confirmed by the highest credit ratings among
Russia’s steel companies. In 2005, Standard & Poor’s and Moody’s assigned to NLMK
BB and Ba2 ratings, respectively.
■ COMPANY PROFILE

10
2005 MAJOR DEVELOPMENTS
January On January 14, ordinary shares of Novolipetsk Steel (NLMK) were included in the
Quotation List B of the List of Securities traded on the RTS Stock Exchange thus
enhancing the Company’s attractiveness to investors.
February Based on the results of their audit, Swedish experts acknowledged NLMK’s Quality
and Environmental Management Systems’ compliance with the stringent
international requirements and standards of the EU. In accordance with the Volvo
valuation methodology applied to suppliers, NLMK ranked category A – the top
category of suppliers.
MarchNLMK embarked on introducing a new incentives system aimed at motivating
highly skilled professionals and attracting young people to the Company.
As regards NLMK’s coke and by-product process, we shut down coke battery
No.2 for renovation. Upgrading is designed to ensure its reliable and accident-free
operation, increase its effective annual output to 460 thousand tonnes and bring
a three-fold reduction of industrial load on the environment.
AprilNLMK was the first Russian company to launch the production of steel products
with new types of polymer coating (polyurethane and polyvinylidene fluoride-
coated rolled products).
MayNLMK’s Annual General Meeting of Shareholders was held. The AGM approved the
2004 Annual Report of the Company, statutory financial (accounting) reports,
profit and loss statements and profit allocation.
Based on the 2004 results, the AGM voted to pay dividends on issued ordinary
shares in the amount of RUR 1.8 per share.
NLMK won a tender for the development of the Zhernovsky-1 site at the
Zhernovsky Black Coal Field (Kemerovo Region, Russia). The deposit will provide
approximately 50% of coking coal requirements of the Company by 2009.
JuneNLMK produced its 1,000,000th tonne of pre-painted rolled products widely used
to manufacture engineering structures, components for buildings’ facades, wall
panels, roof coating as well as faceplates of household appliances.

11NLMK • ANNUAL REPORT • 2005
July NLMK proved its Quality Management System complies with the requirements of
ISO 9001:2000. We passed a re-certification audit of the Quality Management
System applied to hot-rolled production to confirm its compliance with EU
standards and requirements (Directive 97/23/EG).
The Company ran a presentation of its environment protection program to
2010. Implementation of the program scheduled for 2006-2010 will enable the
Company to reduce its total and per unit emissions by 35% and 40%, respectively,
compared with 2000 figures.
The Company successfully passed the first supervisory audit of the Quality
Management System to confirm its compliance with the requirements of
ISO/TS 16949–2002 (Quality Management Systems. Specific Requirements for
Application of ISO 9001:2000 to Automotive Industry and Spare Parts Suppliers).
August NLMK started implementing a set of activities (through 2010) aimed at technical
upgrading of grain-oriented steel production facilities. Introducing additional
capacity will enable the Company to increase the output of rolled products by 20%
and produce up to 12 thousand tonnes of this type of products per month.
After the overhaul and upgrading, NLMK put into operation its second-largest
blast furnace No.5 (with an annual capacity of over 2.7 m tonnes of pig iron ). That
will improve quality of our products and make the blast furnace one of the most
environmentally friendly in Europe.
September NLMK passed a re-certification audit of the Environmental Management System to
confirm its compliance with ISO 14001 (2004 version).
NLMK’s Extraordinary General Meeting of Shareholders was held. It was
approved to pay dividends for the 6 months of 2005 in the amount of RUR 1.0 per
ordinary share.
October NLMK became a member of the International Iron and Steel Institute (IISI). IISI
is the world’s largest non-profit association of steel companies which in aggregate
account for 75% of global steel production.
NLMK’s Board of Directors adopted a Regulation on OJSC NLMK's Information
Policy. This document was developed in accordance with Russian legislation and with
due regard to the listing requirements set out by both Russian and international stock
exchanges, the Corporate Governance Code as well as internal documents of NLMK.
November We ran a presentation of OJSC NLMK’s share placement ahead of the IPO on the LSE
(7% of share capital).

12
NLMK’s continuous hot-dip galvanizing line No.3 produced its first tonnes of
products; the line’s annual production capacity is 340 thousand tonnes of
galvanized rolled products.
NLMK completed the revamping of coke battery No.1 with an annual capacity
of up to 460 thousand tonnes of coke. After the renovation is completed, the
battery’s impact on the environment is to be reduced by three times.
December On December 15, NLMK’s GDSs were listed on the LSE. The offer price was set at
USD 14.5 per one GDS, each GDS represents 10 ordinary shares. The total capital
raised during the listing was USD 609m.
The Company won an All-Russia Competition «Environment Protection Leader»
organized by the Social Development and Environment Protection Department of
the Russian Government.
OJSC Stoilensky GOK put into operation an additional unit for ore
concentration which enables the Company to raise the output of ore concentrate
or, if the need arises, to raise iron content in the commodity output while
maintaining existing levels of production.
NLMK passed a re-certification audit to confirm that slabs produced by the
Company comply with the requirements of Germanischer Lloyd Rules.
On December 29, OJSC NLMK reached an agreement to sell a 12% interest
(2,336,867 ordinary shares) in OJSC Lebedinsky GOK to CJSK OEMK-Invest for
USD 400m. Also, NLMK reached an agreement to buy a 25% interest in OJSC
Combinat KMAruda from certain companies affiliated with shareholders of OJSC
Lebedinsky GOK, which enabled NLMK to consolidate its controlling interest (58%).

13NLMK • ANNUAL REPORT • 2005
MAIN RESULTS OF 2005
2005 2004 Change
+ , - %
(thousand tonnes)
Steel 8,468 9,123 (655) (7.2%)
Finished steel 7,979 8,576 (597) (7.0%)
flat products 4,776 4,813 (37) (0.8%)
slabs 3,203 3,763 (560) (14.9%)
Iron-ore concentrate* 12,782 12,661 121 1.0%
(USD m)
Sales revenue 4,469 4,539 (70) (1.5%)
Gross profit 2,067 2,406 (339) (14.1%)
as a % of sales 46% 53% – –
Income before tax and minority interest 1,906 2,364 (458) (19.4%)
as a % of sales 43% 52% – –
Net income 1,385 1,773 (387) (21.8%)
as a % of sales 31% 39% – –
EBITDA 2,094 2,563 (469) (18.3%)
(USD m)
Total assets 6,051 5,166 885 17.1%
return on assets 25% 43% – –
Equity 5,054 4,220 834 19.8%
return on equity 30% 52% – –
(people)
Total employees 52,461 52,546 (85) (0.2%)
OJSC NLMK employees 38,798 39,433 (635) (1.6%)
Key performance indicators in 2004-2005
Increase of customer’s confidence in the Company’s products
Decrease of negative impact on environment
The Company kept leading positions among its competitors upon profit and financial efficiency
Significant growth of capitalization and investment attractiveness of NLMK
High assessments of credit capacity by largest world credit agencies
External factorsUnstable global steel market conditions
Imbalance of production and consumption in
global steel market
Development of domestic steel market
Growth of prices for raw materials and energy
Significant strengthening of Russian ruble to
US Dollar
Internal factorsSuccessful measures aimed at facilities development
Fulfillment of large major repairs of technological
equipment
Strengthening of operating and geographical
diversification
Improvement of products quality
Improvement of Company’s Management System
Effective control over production cost
*Including performance indicators of OJSC Combinat KMAruda which is an associate from 2nd quarter 2005 onward

COMPANY’S NOVOLIPETSKACTIVITIES STEEL

15NLMK • ANNUAL REPORT • 2005
STEEL SEGMENT
SEGMENT PROFILE
The Group’s steel segment is represented by the Parent Company OJSC NLMK and
service providers (LLC Trade House NLMK and LLC Independent Transport Company)
involved in supporting steel production and sales of products and services.
The steel segment’s products are in steady demand on both domestic and
foreign markets. Accounting for 13% of Russia’s steel production, NLMK is the
fourth-largest steel producer in Russia and one of the largest steel-making
companies in the world.
The Company is the largest producer of cold-rolled steel in Russia and one of
the largest producers of electrical steels in Europe.
PRODUCTION
Description of production capacity
NLMK is an integrated steel company. Our integrated steel making facility occupies
approximately 27 square kilometres. The facility comprises:
■ a sinter plant (annual production capacity at 01.01.2005 was 13.60m tonnes);
■ a coke plant (annual capacity – 4.31m tonnes);
■ a blast-furnace plant (annual capacity – 8.71m tonnes);
■ a steelmaking plant (annual capacity – 9.16m tonnes);
■ a hot rolling plant (annual capacity – 5.30m tonnes);
■ a cold rolling plant (annual capacity – 2.25m tonnes);
■ a grain-oriented steel plant (annual capacity – 140 thousand tonnes);
■ a non-grain-oriented steel plant (annual capacity – 670 thousand tonnes of
both carbon and non-grain-oriented steel).

16
Operations flowchart

17
■ STEEL SEGMENT
NLMK • ANNUAL REPORT • 2005
Production activities’ results
Currently, NLMK steel segment’s product mix includes the following items:
conversion pig iron; semi-finished steel products (slabs); hot-rolled, cold-rolled
and galvanized products; pre-painted steel; electrical non-grain / grain-oriented
rolled products and tubes. Flat products are manufactured from low-carbon, carbon
and low-alloy steel of varying composition, different drawing categories and
strength.
Steel products are manufactured in accordance with basic national and
international standards: ASTM, EN, DIN, JIS, BS, API, and SAE.
OUTPUT OF MAIN PRODUCTS IN 2004-2005
(thousand tonnes) 2005 2004 Change
+ , - %
Sinter 12,931 13,834 (903) (6.5%)
Coke with 6% moisture 3,836 4,403 (567) (12.9%)
Pig iron 7,886 8,994 (1,109) (12.3%)
Steel 8,468 9,123 (655) (7,2%)
Finished steel products 7,979 8,576 (597) (7.0%)
■ slabs for sale 3,203 3,763 (560) (14.9%)
■ rolled steel products, including: 4,776 4,813 (37) (0.8%)
hot-rolled products 2,030 1,972 58 2.9%
cold-rolled products, including: 2,746 2,841 (95) (3.3%)
■ coated steel 532 528 4 0.7%
galvanized steel 267 294 (27) (9.3%)
pre-painted steel 265 235 31 13.1%
■ electrical steel 472 514 (42) (8.2%)
non-grain-oriented rolled products 339 395 (55) (14.0%)
grain-oriented rolled products 133 119 13 11.0%

18
Production of steel and flat products in 2001-2005
Structure of flat products production in 2005
m tonnes

19
■ STEEL SEGMENT
NLMK • ANNUAL REPORT • 2005
The year 2005 was characterized by an unstable environment on the steel mar-
kets. To enhance our production and financial potential in future periods, we
planned to perform a series of major overhauls in 2005, which in certain instances
required suspending the operation of basic production units which had an effect
on the performance indicators of the steel segment.
The sinter and coke production program was followed through in accordance
with the demands of the blast-furnace process.
The greater portion of the reduction in pig iron production was attributable to
commercial pig iron. Steel production fell by 7.2%.
In 2005, the Company’s output of finished steel was 8.0m tonnes, which is
7.0% less than in 2004. Also, certain changes occurred in the steel product port-
folio: the proportion of high value-added products rose from 64% in 2004 to 69%
in 2005. Over the same period, production of slabs for sale went down by 14.9% (to
3.2m tonnes). The year 2005 demonstrated a slight decrease in flat steel products
output – by 0.8% year on year (down to 4.8m tonnes).
Aggregate output of coated steel in 2005 reached 532 thousand tonnes, which
is a 0.7% increase year on year. Also, the production structure underwent some
changes: the output of polymer-coated steel products went up 13.1% compared
with 2004, while the production of galvanized steel products fell by 9.3%.
Overall production of electrical steel products in 2005 fell by 8.2% compared
with 2004. However, as a result of a greater number of orders, the output of grain-
oriented steel exceeded last year’s level by 11.0%.
Management systems and products certification
To be able to function effectively in a market economy, the Company must win
consumer confidence.
NLMK’s high technological and organizational level of production and quality
of products have been certified many times by respected certification bodies, both
Russian and foreign:
■ TÜV CERT (Germany);
■ U.K. Lloyd’s Register of Shipping (United Kingdom);
■ Det Norske Veritas (Norway);
■ Bureau Veritas (France);
■ Germanischer Lloyd;
■ American Bureau of Shipping (ABS);
■ Italian Register of Shipping (RINA);
■ Russian Maritime Register of Shipping;
■ Federal Scientific & Technical Centre of Certification in Construction of the
Russian Federation State Architecture and Construction Committee.
NLMK’s quality management activities comply with ISO 9000 standards.
In May-June 2005, the Company successfully passed the second supervisory
audit of the Quality Management System to confirm its compliance with the
requirements of ISO 9001 (revised in 2000). Areas covered by the certificate:
«production of pig iron for sale, merchant slabs, hot-rolled and cold-rolled
products made of carbon and low-alloy steel in coils, sheets, including galvanized

20
and polymer-coated steels and electrical grain-oriented and non-grain-oriented
steels in coils and sheets».
In 2005, the Company successfully passed its first supervisory audit to confirm
its compliance with the requirements of ISO/TS 16949:2002 Quality Management
System. Specific Requirements for Application of ISO 9001:2000 to Automotive
Industry and Spare Parts Suppliers. Areas covered by the certificate: production of
hot-rolled and cold-rolled products made of carbon and low-alloy steel in coils,
sheets, including galvanized steel for the automotive industry (with product
development).
NLMK is committed to protecting the environment. The Company’s Environ-
mental Management System meets the requirements of ISO 14001:2004.
Between September 5 and 9, TÜV CERT (Germany) performed a full-fledged re-
certification audit of OJSC NLMK Environmental Management System for ISO
14001:2004 compliance.
Based on the results of their audit held in February 2005, Swedish auditors
from Volvo acknowledged the full compliance of NLMK’s quality and Environmental
Management Systems with the relevant international standards and European
market requirements and gave the Company the highest credibility rating for Volvo
suppliers – category A.
In May 2005, the Federal Scientific and Technical Centre for Certification in
Construction of the Russian Federation State Architecture and Construction
Committee confirmed, based on their regular supervisory audit, that the following
products of NLMK are suitable to be applied in construction in Russia:
■ cold-rolled and hot-dip galvanized pre-painted sheets with polymer coatings;
■ steel roll-formed sections with trapezoidal banding shape made of cold
rolled flats.
Between May 30 and June 3, TÜV CERT (Germany) performed a re-certification
audit of NLMK’s Quality Management System for the production of hot-rolled
products made of DIN 17100 and DIN EN 10025 steel grades. Based on the
recertification audit results, the Company obtained a new certificate of conformity
of its hot-rolled steel production with the requirements of the EU Directive
97/23/EG and German technical rules AD 2000 W Merkblat WO/TDR 100.
Based on the results of their supervisory audit in August 2005, the Russian
Maritime Registry of Shipping acknowledged the validity of NLMK’s certificate as a
producer of hot-rolled products for the shipbuilding industry.
In December 2005, based on the results of a re-certification audit, NLMK was
granted a new certificate confirming that its slab production for shipbuilding
complies with Germanischer Lloyd’s Rules.

21
■ STEEL SEGMENT
NLMK • ANNUAL REPORT • 2005
Global steel market
The global steel industry saw high volatility in 2005. The adverse situation in the
global market of flat products in 2005 resulted in a decline of crude steel
production in quite a few regions of the world.
In 2005, China had a significant influence on the global steel market.
Over recent years, China has been a major factor of changes in steel prices.
Based on the 2005 results, the global production of crude steel increased to
1,129m tonnes, while the growth rate of crude steel production fell to 6.8% from
9.0% in 2004.
Major steel producers (м tonnes)
Ranking Country Production
1 China 349.4
2 Japan 112.5
3 USA 93.3
4 Russia 66.2
5 South Korea 47.8
6 Germany 44.5
7 Ukraine 38.6
8 India 38.1
9 Brasil 31.6
10 Italy 29.1
The growth in production was mainly attributable to a greater steel output in
China (+24.6%), which retained its leading position in 2005. China accounted for
31% of global steel production in the reporting year. The 2005 top five also
include Japan, USA, Russia and South Korea.
A considerable decline in production in the reporting year occurred in the
25-member European Union (EU) and North America. The negative trend was also
observed in South America and the CIS.
As mentioned above, 2005 was a year of increased instability: the stable prices
at the beginning of the year gave way to a drastic decline throughout the second
quarter; then the prices rose during the third quarter to be followed by a new fall
at the end of the year.
The stable condition of the global market during the first quarter of 2005 was
attributable to high activity on the Chinese market. Despite a contraction in
business conditions in the European and American markets, prices of rolled
products during that period remained high.
In January through March 2005, supplies to those regions were less attractive
for exporters. Starting from April 2005, the situation changed dramatically: a
downturn in the global market became ubiquitous. In September, due to a higher
OVERVIEW OF STEEL MARKETS
Source: International Iron and Steel Institute

22
Global steel production in 2001-2005
Global steel production in 2005 by region
Source: Metal Bulletin, CSM
Source: International Iron and Steel Institute
Source: International Iron and Steel Institute
Movements in prices of CIS exporters in 2001-2005 (FOB)
m tonnes
USD/tonne

23
■ STEEL SEGMENT
NLMK • ANNUAL REPORT • 2005
demand for and lower supply of steel products, the world market stabilized; by the
end of the year average price levels demonstrated a slight growth compared with
September. In November and December, adverse effects on prices were only caused
by seasonality.
For the whole year 2005, the drop in prices for basic types of flat-rolled
products on the major regional markets of the world was in the range of 8% to 35%
(depending on the region and product type).
Domestic steel market
The unstable environment on the global steel market affected the Russian steel
industry. Production growth rates of Russia’s steel-making companies slowed.
In 2005, Russia’s production indicators were as follows: pig iron – 48m tonnes
(-3.8% year on year); steel – 66m tonnes (+0.9%); finished steel – 55m tonnes
(+1.6%).
In 2005, the proportion of flat products in the finished steel structure
increased from 43% to 44%.
The growth in flat products manufacturing was 4%. Total production of rolled
products was 23.9m tonnes, including:
■ hot-rolled products – 16.2m tonnes (+8.0% year on year);
■ uncoated cold-rolled products – 5.4m tonnes (-6.1%);
■ coated cold-rolled products – 2.3m tonnes (+6.0%).
The fall in global prices resulted in a greater focus on the domestic market. In
2005, the domestic market accounted for over half of Russian-produced flat
products (54.0%); supplies to the domestic market increased by 1m tonnes year on
year to reach 13m tonnes.
In 2005 imports of all types of finished steel rose to over 2m tonnes (26.0%
higher than the 2004 level), including:
■ hot-rolled products – 0.2m tonnes;
■ uncoated cold-rolled products – 0.2m tonnes;
■ coated cold-rolled products – 0.2m tonnes.
In the context of both higher levels of domestic supplies and greater imports,
consumption of flat products rose to 15m tonnes (9.5% year on year).
Consumption of coated cold-rolled products grew to 18.0%.
The adverse conditions on the global market caused a price fall on the domes-
tic market. Negative trends on the secondary market of rolled steel entailed a 3%
decline in prices of hot-rolled and cold-rolled products at the end of the year. But
by the year end the price of galvanized rolled products rose by 3%.
Even though a new trend was in the making (i.e., global prices having a
stronger impact on the domestic prices), the range of domestic price fluctuations
was less than that of the export price.

24
Production of steel and flat-rolled products in Russia in 2001-2005
Price movements on the domestic market in 2002-2005
Source: Federal State Statistic Service
Sales by region
Source: Chermet
RUR/tonne
m tonnes

25
■ STEEL SEGMENT
NLMK • ANNUAL REPORT • 2005
SALES OF STEEL PRODUCTS
In 2005, total sales of NLMK’s steel products went down to 8.2m tonnes, 14% less
than in 2004.
Due to the unstable environment on the global steel market, the proportion of
NLMK’s domestic sales went up. The proportion of exports (70.5%) decreased by
3 percentage points year on year.
Export sales
In 2005, export of steel products decreased by 17.7% against 2004.
The export sales structure showed a significant decrease in the share of pig
iron (by 7%) and an increase in the share of hot-rolled and cold-rolled products
(by 5%).
Export of slabs dropped 14.9% against those in 2004. In 2005, low-alloyed
slabs were shipped primarily to DanSteel A/S (Denmark).
The reorientation of steel sales towards the domestic market caused some
decrease in export sales of hot-rolled, cold-rolled and coated rolled products.
In 2005, the structure of electrical steel sales to foreign consumers changed.
Non-grain-oriented steel sales decreased by 19.4% and grain-oriented steel
shipments increased by 9.2% on 2004. In total, export of electrical steel dropped
by 12.7% against 2004 figures.
NLMK's regional structure of steel sales experienced the following significant
changes in 2005: sales to Asian countries increased by 9 percentage points, while
sales to North America and EU countries decreased by 7% and 2%, respectively.
In 2005, NLMK traded hot-rolled products with the EU under separate quotas.
Based on the 2005 operating results, exports to non-EU European countries
accounted for 17.9% of all NLMK’s exported steel products and 98.9% of this
volume was sold to Turkey, the largest consumer in this region.
In the reporting period, the Company shipped hot-rolled products to the USA
under the quotas imposed in accordance with the Agreement Suspending the
Antidumping Investigation of Certain Cut-to-Length Carbon Steel Plate from the
Russian Federation, while semi-finished goods were sold to the United States free
of any restrictions.

26
Export sales by product in 2005
Export sales of steel products by region in 2005
Note: the structure is based on physical units of measurement
Note: the structure is based on physical units of measurement
Sales of steel products in 2001-2005
m tonnes

27
■ STEEL SEGMENT
NLMK • ANNUAL REPORT • 2005
Domestic sales
In 2005, NLMK’s domestic sales remained at previous years’ levels (2.4m tonnes).
Sales of finished rolled products were on the rise: sales of pre-painted rolled
products increased by 21% and sales of grain-oriented steel rose by 12%. Hot-rolled
products sales increased by 10%. However pig iron sales dropped almost three times.
The change in the domestic steel sales affected the structure of sales by
industry. Sales to machine-building (10%) and automotive producers (12%) made
up a large part of total shipments. However, a major part of products was sold to
trading companies (40%), allowing the Company to minimize shipments to middle-
size and small clients.
In 2005, the Company more than doubled its sales to tube and pipe producers
and increased deliveries to farm-machinery manufacturers by almost 80%.
In terms of regional sales structure, we should note a 20% increase in sales
to the Northern Caucasus region and a 10% rise in deliveries to the Volgo-Vyatka
Region, where NLMK’s interests overlap with its competitors’ – Ukraine’s Ilyich
MMK and OJSC Severstal.
Traditional customers of NLMK remain the Central Region (35%), Mid-Volga
Region (18%), Northern Caucasus (11%) and the Central Black-Earth region (9%).

Domestic sales by product in 2005
Sales by industry in 2005
Sales by region in 2005
Note:
the structure
is based on
physical
units of
measurement
Note:
the structure
is based on
physical
units of
measurement
Note:
the structure
is based on
physical
units of
measurement
28

29
■ STEEL SEGMENT
NLMK • ANNUAL REPORT • 2005
RAW MATERIALS AND SUPPLIES
The steel industry is one of the most resource- and energy-intensive industries.
Based on 2005 results, NLMK used over 2.7 tonnes of raw materials and other
supplies to produce 1 tonne of steel products.
In the steel production process NLMK requires the following raw materials:
iron ore, coking coal, scrap, non-ferrous metals and zinc.
Early in 2005, the growth in prices of basic raw materials continued from
2004. However, after the steel market entered the phase of stagnation and
decline, purchase prices began to fall. As a result, by December 2005, the prices
for basic raw materials either reached the level of 2004 or dropped below the
level seen at the end of 2004.
Given the continuous raw material price growth, the Group’s vertically
integrated structure allows NLMK to minimize potential losses caused by high
prices and shipment failures.
Mining segment enterprises OJSC Stoilensky GOK and OJSC Combinat
KMAruda, which were incorporated in the Group early in 2006, meet NLMK’s iron-
ore concentrate demand completely.
Coal is supplied mostly from the Kuznetsk Coal Field (around 75%).
The Company’s purchase structure also includes coal supplies from Pechora
(around 12%) and Yakutia (around 10%) Coal Fields. In addition, in 2005, a small
part of coal supplies was shipped from Ukraine (around 3%).
Energy (both electricity and natural gas) is supplied by the natural state
monopolies.
A priority area of technological development is ensuring NLMK’s energy
independence from external suppliers. In 2005, subdivisions within NLMK’s
energy sector generated approximately 38% of all electricity consumed.
Freight transportation services are also provided by the natural monopoly,
OJSC Russian Railways. To minimize the risk of OJSC Russian Railways’ failure to
provide rolling-stock, NLMK is successfully implementing a program to buy its
own rolling-stock. In 2005, all steel pellets, dolomite and limestone as well as
nearly 40% of iron-ore concentrate supplies were transported by the Company’s
own rolling-stock.
Overall, Russia’s mineral resource base allows NLMK to meet most of its raw
material requirements domestically. Part of these needs is satisfied by raw
material shipments from neighbouring Ukraine and Kazakhstan and, to a much
lesser extent, from overseas.
To ensure its independence from raw materials producers, in 2005 NLMK
successfully pursued its policy to create its own coal resource base that meets
its production needs. In particular, the Company purchased the license to
explore and mine black coal in Zhernovsky-1 Site of Zhernovsky Black Coal Field
with around 240m tonnes of coal reserves. Based on current estimates, the coal
mining facility will be put into operation in 2008 and will meet roughly 50% of
NLMK's coking coal needs from 2009.
In addition, in 2006, acquisitions of shareholdings in Prokopievskugol Group
and OJSC Altai-koks will be completed, which will enable NLMK to fully provide
its steelmaking facilities with the Company’s own coke and coal by 2009.

Movements in growth rates of prices of major types of raw materials in
Russia
Movements in growth rates of railway tariff and prices of energy and natural
gas in Russia
Movements in growth rates of prices of major types of raw materials in
Russia
30
On December 2000
On December 2000
On December 2000

31
■ STEEL SEGMENT
NLMK • ANNUAL REPORT • 2005
FINANCIAL RESULTS
Note: this Section analyses US GAAP segment reporting for 2005
In 2005, NLMK Group’s steel segment revenue, including intersegment
transactions, was USD 4,179.1m which is 5.1% less than in 2004. Intersegment
sales within the Group accounted for 0.1% (USD 4.4m) of the total segment
revenue.
Revenue fell below 2004 levels due to the following reasons:
■ lower production output and sales;
■ lower prices in the world steel markets.
In 2005, the structure of revenue changed compared with 2004. The share
of revenue from sales of high value-added products increased. Consequently, 23.6%
of the steel segment revenue was derived from sales of cold-rolled products, 21.0%
from hot-rolled products, 12.6% from electrical steel and 10.0% from coated rolled
products. The share of slabs and commercial iron sales fell significantly.
Gross profit earned by NLMK Group’s steel segment in 2005 dropped by 23.6%
on 2004 to USD 1,667.9m.
The main reasons for a decrease in gross profit were:
■ reduction in revenue;
■ higher raw materials and energy prices.
Operating profit for 2005 was USD 1,518.9m, a decrease of 25.4% compared
with 2004. Operating profit margin was 36.3%, a 10.0 pp lower than in 2004.
Summary of financial information of NLMK's steel segment for 2004 and 2005
USD thousands Change
2004 2005 +/- %
Revenue from external sales 4,399,606 4,174,715 (224,891) (5%)Intersegment revenue 3,365 4,402 1,037 31%Depreciation (174,646) (197,110) (22,464) 13%
Gross profit 2,182,293 1,667,880 (514,413) (24%)in percentage of revenue, including intragroup sales 49.6% 39.9% –
Operating profit 2,037,325 1,518,890 (518,435) (25%)in percentage of revenue, including intragroup sales 46.3% 36.3% –
Profit before minority interest 1,639,276 1,165,120 (474,156) (29%)in percentage of revenue, including intragroup sales 37.2% 27.9% –
Segment assets 3,767,196 4,422,873 655,677 17%

32
Revenue and operating profit of the steel segment in 2002-2005
Steel segment revenue by product in 2005
Movement in sales profitability in terms of operating profit of the steel
segment in 2002-2005
Movement in total assets of the steel segment in 2002-2005
Note: revenue includes intersegment transactions
USD m
USD m

33
■ STEEL SEGMENT
NLMK • ANNUAL REPORT • 2005
In 2005, net balance of interest income and expenses was USD 58.7m, 2.1 times
higher than in 2004.
Due to the lower taxable profit, the steel segment’s income tax decreased to
USD 394.3m by 25.7% on 2004.
In 2005, the steel segment’s income before minority interest was USD 1,165.1m,
28.9% lower than in 2004.
There was a stable growth in the total value of assets. They increased to
USD 4,422.9m at the end of 2005, which is 17.4% more than at the end of 2004.

34
Production dynamics at OJSC Stoilensky GOK in 2001-2005
Iron-ore concentrate production dynamics at
OJSC Combinat KMAruda in 2001-2005
Note: Combinat KMAruda has been an assosiate since 2nd quarter 2005
m tonnes
m tonnes

35
MINING SEGMENT
NLMK • ANNUAL REPORT • 2005
SEGMENT’S PROFILE
The second important line of NLMK Group’s business is mining and production of
raw materials for the steel industry, including iron-ore concentrate and flux. The
mining segment in 2005 was comprised of the following companies: OJSC
Stoilensky GOK, OJSC Dolomite and OJSC Stagdok. In addition, OJSC Combinat
KMAruda was a part of this segment in the 1st quarter 2005 (since the 2nd quarter
2005, NLMK can exert significant influence on this company but not control it).
The mining segment gained increased significance after incorporation of
OJSC Stoilensky GOK, the third mining company in Russia in terms of iron-ore
production in NLMK. Also, in February 2006, OJSC NLMK resumed its control over
OJSC Combinat KMAruda, which holds leading positions among Russian companies
which use underground iron ore mining. In March 2006, NLMK acquired another
18% interest in OJSC Combinat KMAruda and in April 2006, after an offer to
repurchase ordinary shares, raised the interest to 84.85% by consolidating yet
another 8.59% shares in the company.
The mining segment is one of the elements, which underpin the financial
sustainability of the whole Group. Mining companies of the Group meet all iron-
ore concentrate and flux steel needs of the steel segment and sell excess products
to third parties.
In 2005, NLMK acquired a license to explore and produce coal at the
Zhernovsky-1 Site of Zhernovsky Black Coal Field (Kemerovo Region, Russia). The
Company also worked on the completion of the agreement to acquire 82% of OJSC
Altai-koks (Altai Region, Russia) and Prokopievskugol Group of coal companies
(Kemerovo Region, Russia). This deal will be completed in 2006. Based on the
current estimates, from 2009, NLMK Group will be well provided with internally
produced coal concentrate.
PRODUCTION AND RESERVES
In terms of merchantable ore production, OJSC Stoilensky GOK is one of Russia’s
leading iron ore raw material manufacturers. It accounts for about 12% of the
domestic merchantable ore output.
The Governmental Mineral Wealth Commission of the Russian Ministry of
Environment and Natural Resources approved sufficient reserves of high-grade
iron ore and magnetite quartzite for open mining to continue extraction for 60
years at current levels of iron-ore production. OJSC Stoilensky GOK has a licence to
mine iron ore and associated non-steellics.
Estimated annual output of the company is 1.2m tonnes for high-grade iron
ore and 25.4m tonnes of magnetite quartzite. In 2005, the company mined 1.06m
tonnes of high-grade ore and 23.3m tonnes of magnetite quartzite.
In 2005, the company produced 10.8m tonnes of iron-ore concentrate and
1.1m tonnes of sintering ore, including 9.4m tonnes of iron-ore concentrate and
0.4m tonnes of sintering ore for OJSC NLMK.

36
Production dynamics at OJSC Dolomite in 2001-2005
Technical limestone production dynamics at OJSC Stagdok in 2001-2005
m tonnes
m tonnes

37
■ MINING SEGMENT
NLMK • ANNUAL REPORT • 2005
Stoilensky iron-ore concentrate with an average iron content of around 66%
and sintering ore with iron content of around 52% are used in the agglomeration
process to manufacture high-quality sinter for further use in blast-furnace
melting.
OJSC Combinat KMAruda, which was brought back under control early in 2006,
has a licence to mine ferruginous quartzite in a field near the town of Gubkin
(Belgorod Region, Russia) for iron-ore concentrate production. As of the end of
2005, remaining reserves of this field were 64.6m tonnes that will allow the
company to mine iron formations for 18 years at the current level of concentrate
production. Currently there are projects underway to implement technology that
will increase the useful life of mines.
In 2005 the company mined 4.02m tonnes of ferruginous quartzite and
produced 1.85m tonnes of iron-ore concentrate, including 0.66m tonnes of
concentrate delivered to OJSC NLMK.
Fields mined by OJSC Stoilensky GOK and OJSC Combinat KMAruda are located
within the Kursk Magnetic Anomaly – the world’s largest iron ore deposit. The
distance between these companies and steel producers is approximately 350 km.
Ore is transported by NLMK’s own rolling stock with the assistance of LLC
Independent Transport Company – a service company incorporated in the
Company. The proximity of major sources of raw materials is a considerable
advantage for NLMK.
OJSC Stagdok and OJSC Dolomite supply technical limestone and dolomite to
the steel segment.
OJSC Stagdok has a licence to use a fluxing limestone field located 3 km from
NLMK’s main steelmaking facilities. At the end of 2005, remaining reserves of this
field were 177m tonnes. Around 28% of these reserves are inaccessible for mining
as they are located under populated areas. Accessible reserves will allow the
company to mine raw limestone over approximately a 24-year period at the current
level of merchantable limestone production.
OJSC Stagdok is one of Russia’s largest producers of fluxing limestone.
Limestone is mined in the opencast method by rock blasting. In 2005, 3.9m tonnes
of raw limestone were mined, 2.9m tonnes of merchantable technical limestone
were produced of which 2.3m tonnes were shipped to the parent company.
OJSC Dolomite has a licence to mine dolomite on the Bigildinsky and
Prikaryerny plots of Dankovsky Field (Lipetsk Region, Russia) for steel,
construction materials and dolomite powder production.
At the end of 2005, the licensed sites had 400m tonnes of dolomite reserves
that will allow the company to mine these resources over 125 years. Overall,
Dankovsky Field has 668m tonnes of dolomite reserves.
OJSC Dolomite is the only producer of furnace dolomites in Russia’s Central
Black-Earth Region. In 2005, 3.2m tonnes of raw dolomite were mined and 1.8m
tonnes of merchantable dolomite were produced, of which 1.0m tonnes were
shipped to the parent company.
Early in 2006, NLMK reached an agreement with a group of investors to acquire
an 82% stake in Altai-koks, a coke-chemical plant, and a 100% interest in the
holding company Kuzbass Asset Holdings Limited, Gibraltar, which owns 100% of
Prokopievskugol Coal Group. In January-April 2006, the parent company entered
into agreement to buy an additional 6.18% of OJSC Altai-koks from various

minority shareholders. As a result, the deal will bring to the Company over 88% of
Altai-koks shares.
OJSC Altai-koks is the leading Russian coke-chemical company. It produces
high-quality coke and chemical products. OJSC Altai-koks has production capacity
of 3.8m tonnes. The construction of a new coke battery is being completed to
increase annual coke production by 1.14m tonnes in late 2006.
The Prokopievskugol Group of companies holds leading positions in
production and processing of high-value coking coal in the Kemerovo Region.
Total annual production of coking coal concentrate is around 3m tonnes, which
meets around 50% of NLMK’s needs.
This acquisition was made as part of NLMK’s vertical integration strategy to
achieve additional competitive advantages by ensuring a stable supply of key raw
materials. The most recent acquisitions will allow the Company to further enhance
sustainability of its business and will create a platform for its long-term growth.
38

39
■ MINING SEGMENT
NLMK • ANNUAL REPORT • 2005
FINANCIAL RESULTS
Note: this Section analyses US GAAP segment reporting for 2005
Despite a certain decrease in the production output of the mining segment
companies in 2005, which was due to the need to repair and upgrade major
facilities, against the background of reducing the steel segment’s demand for
metallurgical raw materials, the segment revenue, including intersegment
transactions, rose by 40.7% on 2004 and reached USD 580.1m.
An increase in revenue comparing with 2004 is explained by a change in the
consolidation period of the largest mining segment company, OJSC Stoilensky GOK,
and by the growing prices for the mining segment’s products. OJSC Stoilensky GOK
was incorporated into NLMK Group in the 2nd quarter 2004.
The mining segment companies are primarily driven by the demand for
metallurgical raw materials from the parent company. As a result, in 2005, 79.4%
of mining segment sales in terms of value represented intragroup transactions.
External sales revenue of the mining segment was USD 119.5m in 2005, 59.4%
higher than in 2004. The segment’s share in the consolidated revenue of the Group
was 2.7% in 2005.
Gross profit earned by NLMK Group’s mining segment in 2005 increased by
53.1% on 2004 to USD 318.2m.
Growing prices for iron-ore raw materials and consolidation of OJSC Stoilensky
GOK contributed to the rise in operating profit of NLMK's mining segment by
56.3%, from USD 186.1m in 2004 to USD 290.9m in 2005. The segment’s share in
consolidated operating profit was 15.6%. Operating profit margin was 50.1%, an
increase of 5 pp comparing with 2004.
Summary financial information of NLMK's mining segment for 2004-2005
USD thousands Change
2004 2005 +/- %
Revenue from external sales 74,965 119,496 44,531 59%
Intersegment revenue 337,344 460,579 123,235 37%
Depreciation (59,972) (69,354) (9,382) 16%
Gross profit 207,805 318,227 110,422 53%
in percentage of revenue, including intragroup sales 50.4% 54.9% – –
Operating profit 186,105 290,904 104,799 56%
in percentage of revenue, including intragroup sales 45.1% 50.1% – –
Profit before minority interest 140,813 224,778 83,965 60%
in percentage of revenue, including intragroup sales 34.2% 38.7% – –
Segment assets 984,495 1,071,717 87,222 9%

Revenue of the mining segment in 2002-2005
Operating profit of the mining segment in 2002-2005
Movement in the total assets of the mining segment in 2002-2005
40
USD m
USD m
USD m

41
■ MINING SEGMENT
NLMK • ANNUAL REPORT • 2005
In 2005, the net balance of interest income and expenses was USD 10.7m,
5.5 times higher than in 2004.
Due to the higher taxable profit, the mining segment’s income tax rose by
66.8% on 2004 and reached USD 68.1m.
In 2005, the mining segment’s income before minority interest was
USD 224.8m, 59.6% higher than in 2004.
At the end of 2005, the total value of assets increased to USD 1,071.7m, 8.9%
higher than at the end of 2004.
In 2005, efficient operation of the mining segment was a positive factor that
partially offset lower profit of the steel segment.

42
Dynamics in transshipment operations at OJSC TMTP in 2001-2005
m tonnes

43
OTHER ACTIVITIES
NLMK • ANNUAL REPORT • 2005
DESCRIPTION
Other segments of NLMK Group include: OJSC Tuapse Commercial Sea Port (TMTP),
LLC LIS Chance insurance company and its subsidiaries, OJSC Lipetskcombank
commercial bank and its subsidiary, and LLC Lipetsk Energy Company (LGEK).
In the mid-2004, OJSC NLMK purchased a controlling interest in OJSC Tuapse
Commercial Sea Port (TMTP)), a major Black Sea port operator in Tuapse, Russia’s
fifth-largest port in terms of transhipments. Tuapse is a deep-water port with year-
round navigation and specializes in transhipment of oil cargo, coal, ore, ferrous
and non-ferrous metals, sugar and other bulk commodities.
In 2005, TMTP transhipped 6.7m tonnes of dry cargo (an increase of 21.6%
compared with 2004) and 15.0m tonnes of oil cargo (an increase of 3.0%).
An increase in transhipment of both dry cargo and oil cargo in 2005 was the main
driving factor behind TMTP’s improved financial results. The export traders who
buy NLMK’s products used TMTP’s port capacities and shipped 1.6m tonnes of steel
products abroad in 2005, which is 29% of NLMK’s export sales.
NLMK’s subsidiaries also include insurance and financial sector companies.
In 2000, NLMK acquired a controlling interest in commercial bank
OJSC Lipetskcombank, located in Lipetsk. The bank provides corporate and retail
banking services under a general license issued by Russia's Central Bank, a foreign
exchange licence and a broker’s licence. In 2005, financial performance of
Lipetskcombank improved on 2004 as a result of an increase in its loan portfolio
and securities market transactions and through an expanded range and scope of
banking services to its clients.
OJSC Lipetskcombank’s growth strategy aims to develop the bank as a
universal commercial bank by expanding its corporate banking segment and
achieving sustainable growth of its retail market share.
To achieve this goal, the bank is expanding its branch network by opening
branches and representative offices in the cities where the Company’s major assets
are located. In addition to the bank branches operating in the towns of Lipetsk
region, in 2005 the bank opened branches in Belgorod and Krasnodar regions,
where the Company’s subsidiaries are located. Early in 2006, the bank’s represen-
tative offices were opened in large industrial centres of Russia: St. Petersburg,
Kursk, Voronezh and Novokuznetsk.
LLC LIS Chance insurance company located in Lipetsk, 100% owned by NLMK,
and its subsidiary LLC SMK Novolipetskaya, provide a wide range of insurance
services, including property insurance, accident insurance, medical insurance, TPL
and others, both to third parties and NLMK. In 2006, these insurance companies
intended to increase their charter capitals to expand their business.

Other segments revenue in 2002-2005
Operating profit of the other segments in 2002-2005
44
Summary financial information of NLMK's other segments for 2004 and 2005
USD thousands Change
2004 2005 +/- %
Revenue from external sales 64,115 174,515 110,400 172%
Intersegment revenue 204 5,154 4,950 25.3 times
Depreciation (9,038) (17,158) (8,120) 90%
Gross profit 20,873 65,939 45,066 3.2 times
in percentage of revenue, including intragroup sales 32.5% 36.7% – –
Operating profit 18,084 39,712 21,628 120%
in percentage of revenue, including intragroup sales 28.1% 22.1% – –
Profit before minority interest 17,322 44,524 27,202 157%
in percentage of revenue, including intragroup sales 26.9% 24.8% – –
Segment assets 654,131 706,761 52,630 8%
USD m
USD m

45
■ OTHER ACTIVITIES
NLMK • ANNUAL REPORT • 2005
FINANCIAL RESULTS
Note: this Section analyses US GAAP segment reporting for 2005
In 2005, other Company’s segments derived revenue of USD 179.7m, 2.8 times
more than in 2004 and 2.9% (USD 5.2m) of this amount relates to intersegment
transactions. Consolidation of assets triggered this significant growth in revenue.
TMTP was consolidated into the Group only in the 3rd quarter 2004, LGEK was
included upon its incorporation in May 2004 and began its active operations in the
second half of the same year.
Gross profit earned by other segments of NLMK Group in 2005 increased
3.2 times on 2004 to USD 65.9m.
Operating profit for 2005 was USD 39.7m. It increased 2.2 times compared with
2004 as a result of TMTP and LGEK consolidation. In addition, the segment’s profit
grew through a wider scope of financial services, including insurance and banking
services provided by NLMK’s insurance companies and OJSC Lipetskcombank.
Operating profit margin was 22.1%, a 6 pp decrease compared with 2004.
In 2005, the net balance of interest income and expenses was USD 14.3m, 78%
higher than in 2004.
Due to the higher taxable profit, the other segment’s income tax increased
3.4 times against 2004 to USD 14.5m.
In 2005, other segment’s income before minority interest was USD 44.5m,
2.6 times higher than in 2004.
It will be observed that the total value of assets has considerably increased:
to USD 706.8m at the end of 2005, 8.0% more than at the end of 2004.

CONSOLIDATEDFINANCIALRESULTS
NOVOLIPETSKSTEEL
This Section analyses US GAAP consolidatedfinancial statements for 2005

47NLMK • ANNUAL REPORT • 2005
FINANCIAL RESULTS In an unstable global market environment and amid a continuing fall in prices for
steel products in 2005, the steel segment companies overhauled their production
equipment to enhance the Company’s future operating capacity. This caused
partial suspension of the production process, which had an impact on the
operational, financial and economic performance of the Company.
In 2005, the rouble gained consistently against the US dollar, which is used as
the basic currency for export steel sales.
A combination of macro- and microeconomic factors resulted in a certain
decrease in the Company’s financial performance in 2005 against the levels seen
in 2004.
In 2005, NLMK’s consolidated revenue was USD 4,468.7m, 1.5% less than in
2004.
The steel segment’s revenue accounts for over 90% of Company’s consolidated
revenue. The mining segment’s small share in the structure of consolidated
revenue is because a significant volume of products manufactured by this segment
is sold to Group companies.
To minimize financial loss against the background of negative price trends in
the world markets, steel sales were re-oriented towards the domestic market where
the fall in prices was less significant. The share of revenue derived from sales in
the Russian market in 2005 was 42.1%, an increase of 6.3 pp.
In addition to the growth of domestic sales within NLMK’s revenue in 2005
compared with 2004 levels, the share of the Asian and Pacific region countries has
increased from 13.8% to 19.0%. The percentage of revenue from sales to North
America decreased from 14.5% to 6.9%. Revenue from sales to EU countries also
dropped (from 17.3% to 14.0%).
The share of revenue from sales to the Middle East countries, including Turkey
(12.8%) and other regions (5.2%), changed insignificantly.
One of NLMK’s priority objectives is to enhance its status as a steel-making
company with low-cost production. To this end, it carries out a range of measures
to ensure strict control over production costs and their optimization.
Despite the significant rise in prices of raw materials and energy in 2005,
the Company's production costs rose by only 12.1%.
Due to increasing cost against reduced revenues, Novolipetsk Steel’s gross
profit for 2005 was USD 2,067.0m, 14.1% less than in 2004.
A 13.4% growth of NLMK's commercial and administrative expenses reaching
USD 170.5m in 2005 and higher tax payments (except for income tax) lowered the
Company’s operating profit by 16.3% to USD 1,860.0m.
In 2005, interest expense rose by 22.7% up to USD 15.1m primarily due to the
growing scale of operations of the Group’s subsidiary bank. Its expanded
operations brought an increase in interest income by 97.5% up to USD 98.9m, in
addition to a rise in deposited cash and cash equivalents.
Due to the lower financial results for 2005, income taxes also decreased to
USD 495.7m from USD 572.2m paid a year earlier. This decrease amounted to 13.4%.
Net profit earned by the Company in 2005 was USD 1,385.3m, 21.8% less than in
2004. Net profit margin was 31.0%. Earnings per share (EPS) were USD 0.23 in 2005.

NLMK Group’s revenue and net profit in 2001-2005
NLMK Group’s revenue structure by segment in 2005
NLMK Group’s movement in profitability of sales in 2001-2005
48
USD m
USD m

49
■ CONSOLIDATED FINANCIAL RESULTS
NLMK • ANNUAL REPORT • 2005
In 2005, EBITDA was USD 2,093.8m, profitability of sales based on EBITDA was
46.9%. For comparison, in 2004 EBITDA was USD 2,562.8m, profitability was
56.5%.
Despite a lower financial result, NLMK remains one of the most efficient steel
companies in Russia and worldwide.
NLMK Group’s financial results for 2004-2005
Steel Mining All Consolidated
segment segment other information
USD m 2005 2004 2005 2004 2005 2004 2005 2004
External sales
revenue 4,175 4,400 119 75 175 64 4,469 4,539
Intersegment
revenue 4 3 461 337 5 0 – –
Depreciation and amortization (197) (175) (69) (60) (17) (9) (284) (244)
Gross profit 1,668 2,182 318 208 66 21 2,067 2,406
Operating profit 1,519 2,037 291 186 40 18 1,860 2,223
Profit before
minority interest 1,165 1,639 225 141 45 17 1,411 1,792
Segment assets,
including goodwill 4,423 3,767 1,072 984 707 654 6,051 5,166
Capital expenditures (493) (220) (67) (45) (13) (5) (573) (269)

50
Evaluation of financial position
In 2005, NLMK’s financial position remained stable.
Positive trends in the Company’s development included:
■ total assets growth;
■ equity increase;
■ liquidity ratio increase.
Over recent years the Company's assets have been continuously growing. At
the end of 2005, the total value of its assets rose comparing with 2004 by 17.1%
to USD 6,051.1m.
The Company’s asset growth was due to an increase in its equity, which rose by
USD 883.7m (19.8%) in 2005 comparing with the previous year.
Profitable business allows NLMK to finance its own activities and development
using primarily its own cash funds. The debt-to-equity ratio of NLMK is
permanently high and was 83.5% at the end of 2005.
Retained earnings drive equity growth and their share in the equity structure
increased from 88.8% in 2004 to 94.0% in 2005.
In 2005, the Company's assets structure changed as follows: the share of
current assets increased to 54.6%, 4.5 pp more than in 2004. Outrunning growth
of current assets (by USD 714.8m) was supported primarily by an increase in cash
and cash equivalents, which rose by 40.6% (USD 548.1m) to USD 1,896.7m.
NLMK’s highly liquid assets substantially exceed its debt. As a consequence,
the Company has negative net debt that amounted to USD (1,902)m as of
31.12.2005.
Total assets and equity growth against NLMK’s deteriorating financial
performance caused a drop in return on equity (ROE) to 29.9% and in return on
assets (ROA) to 24.7%.
Consolidated financial results for 2004-2005
(USD m) 2005 2004 Change
+ , - %
Net sales 4,469 4,539 (70) (1.5%)
Cost of sales (2,402) (2,132) (269) 12.6%
production cost (2,118) (1,889) (229) 12.1%
depreciation and amortization (284) (244) (40) 16.4%
Gross profit 2,067 2,406 (339) (14.1%)
as a % of sales 46% 53% – –
General, administrative and selling expenses 170 150 20 13.4%
Taxes other than income tax 36 33 3 10.2%
Operating income 1,860 2,223 (363) (16.3%)
as a % of sales 42% 49% – –
Income before income tax and minority interest 1,906 2,364 (458) (19.4%)
as a % of sales 43% 52% – –
Net income 1,385 1,773 (387) (21.8%)
as a % of sales 31% 39% – –
Net profit per share (US dollars) 0.2312 0.2958 (0.0646) (21.8%)
EBITDA 2,094 2,563 (469) (18.3%)

51NLMK • ANNUAL REPORT • 2005
NLMK has high liquidity ratios that proves that the Company is able to meet all
its current liabilities. A rise in the current ratio to 6.0 (in 2004 – 4.8) and in the
quick assets ratio to 5.1 (in 2004 – 3.9) shows the stronger financial solvency of
the Company.
In 2005, concurrently with a reduction in revenue by 1.5% and an increase in
the average amount of receivables by 29.2%, receivable days grew by 12 days on
the previous year and reached 51 days.
Since the average inventory value growth rate (25.8% higher than in 2004)
exceeded the rate of cost increase, the stock turnover period increased by 9 days
in 2005 against 2004 and reached 84 days.
Payable days increased by 15 days and reached 83 days since the average
payables growth rate was higher than the cost increase rate.
The increase in both inventory days and payable days during 2005 was
attributable to a rise in prices of raw materials.
In 2005, NLMK did not use any borrowing (except for banking activities)
because cash flows generated by the Company in 2005 allowed ensuring the
required financial resources for carrying out our current and investing activities.
The main source of cash flow generation was the production and sale of steel
products. Efficient cash flow management was achieved through budgeting, which
allowed clearly monitoring and controlling the Company’s cash inflow and outflow.
In 2005, the Company’s net cash from operations amounted to USD 1,514.7m
(USD 1,669.3m in 2004). Net cash used in investing activities was USD (535.6m)
(USD (98.3m) in 2004). That decline was attributable to a significant increase in
cash flows allocated for PP&E acquisition and construction (up to USD (573.2 m)
and to the lack of material transactions in sale and purchase of investments during
2005.
There was a considerable net outflow of cash from financing activities in 2005,
caused by the lack of any acquisition of subsidiaries in the year.
■ CONSOLIDATED FINANCIAL RESULTS

NLMK Group’s structure of revenue by geographical segment in 2005
52
Note:EBITDA is calculated as the sum total of net profit, net interest expense, income tax, loss on dis-
posal of fixed assets, depreciation and amortization and stock-based compensation.Non-monetary transactions include adjustments to reconcile net profit and net cash from opera-
tions less amortization, loss on disposal of fixed assets and stock-based consideration.Other financial resources include net cash used in investing activities less cash spent on acquisi-
tion and construction of fixed assets and net cash used in financing activities less distributions toshareholders.
USD m

53NLMK • ANNUAL REPORT • 2005
Aggregated balance sheet in 2004-2005
2005 2004 Change
Amount Share Amount Share + , - %
(USD m)
Assets
Current assets, incl. 3,302 55% 2,587 50% 715 27.6%
■ cash and short time investments 1,924 32% 1,370 27% 554 40.4%
■ current accounts receivable 660 11% 589 11% 71 12.1%
■ inventory 502 8% 475 9% 26 5.5%
Non-current assets, incl. 2,749 45% 2,578 50% 170 6.6%
■ long-term financial investments 31 1% 51 1% (20) (38.8%)
■ property, plant and equipment 2,394 40% 2,258 44% 136 6.0%
Total assets 6,051 100% 5,166 100% 885 17.1%
Liabilities and shareholders' equity
Current liabilities, incl. 548 9% 534 10% 14 2.7%
■ accounts payable 508 8% 455 9% 53 11.6%
Non-current liabilities 356 6% 326 6% 30 9.3%
Shareholders' equity 5,054 84% 4,220 82% 834 19.8%
Total liabilities and shareholders' equity 6,051 100% 5,166 100% 885 17.1%
Key financial performance in 2004-2005
2005 2004 Change
+ , -
Financial solvency indicators
Share of equity capital in the assets 84% 82% 2 p.p.
Liquidity indicators
Current liquidity ratio 6.0 4.8 1.2
Quick liquidity ratio 5.1 3.9 1.2
Turnover indicators
Length of inventory turnover 84 75 9
Length of receivables turnover 51 39 12
Length of payables turnover 83 68 15
Sales profitability indicators
Operating profit margin 42% 49% (7) p.p.
Net income margin 31% 39% (8) p.p.
EBITDA margin 47% 56% (9) p.p.
Return on assets
Return on equity 30% 52% (22) p.p.
Total return on assets 25% 43% (18) p.p.
■ CONSOLIDATED FINANCIAL RESULTS

NLMK Group’s movement in total assets and equity in 2001-2005
NLMK Group’s movement in return on assets and equity in 2001-2005
NLMK Group’s movement in liquidity ratios in 2001-2005
Free cash flow movement in 2005
54
USD m
USD m

55NLMK • ANNUAL REPORT • 2005
In 2005, NLMK maintained close relations with major global rating agencies with
a view to obtaining their credit ratings.
In May 2005, Standard and Poor’s assigned us BB rating with stable prospects.
In October 2005, Moody’s assigned us Ba2 rating with stable prospects.
At December 31, 2005, OJSC NLMK had the following credit ratings:
Company Rating Description Date of rating
Standard & Poor’s, USA BB Out of danger 26.05.2005
http://www.standardandpoors.ru/ (stable) in the short run, however,
a higher degree of sensitivity
to adverse changes
in the commercial, financial
and economic environment.
Moody’s Investors Service, UK Ba2 No description. 24.10.2005
http://www.moodys.com/ (stable)
National rating scale
Standard & Poor’s, USA ruАА The Issuer’s rating reflects 26.05.2005
http://www.standardandpoors.ru/ (stable) their strong ability to
fully and timely meet
their debt liabilities
as compared with
other Russian issuers.
Moody’s Interfax, Russia Aa2.ru Issuers or debt instruments 24.10.2005
http://rating.interfax.ru/ (stable) holding Aa.ru rating
demonstrate very high
creditworthiness as
compared with other
Russian issuers.
Note: The descriptions of ratings are provided in accordance with information placed on the rating agen-cies’ web sites
RATINGS

56
Company Country Standard&Poor's Moody's Investors Service
Nucor Corp. USA A+/Stable A1/Stable
POSCO South Korea A-/Positive A2/Stable
Mittal Steel Co. N.V. Netherlands BBB+/Negative Baа3/ Stable
Arcelor S.A. Luxembourg BBB/Stable Baa2/Positive
JFE Steel Corp. Japan BBB-/Positive Baa1/Positive
Nippon Steel Corp. Japan BBB-/Positive A3/Positive
ThyssenKrupp AG Germany BBB-/Stable Baa2/Stable
Kobe Steel Ltd. Japan BB/Positive Baa3/Stable
Sumitomo Metal Industries Ltd. Japan BB/Positive Baа3/Positive
OJSC NLMK Russia BB/Stable Ba2/Stable
United States Steel Corp. USA BB/Stable Ba2/Stable
Corus Group PLC UK BB-/Stable Bа2/Positive
OJSC ММК Russia BB-/Stable Ba3/Positive
LLC Evrazholding Russia B+/Positive Bа3/Stable
Usiminas Brasil BB-/Stable B2/Stable
OJSC Severstal Russia B+/Positive B2/Stable
Ratings of major global steel-making companies at 31 December, 2005

57NLMK • ANNUAL REPORT • 2005
RISK MANAGEMENT
Industrial and property risks
Industry risks imply the danger of income being reduced or damages being
inflicted on the company or third parties due to any disruption of the production
process. NLMK annually performs a series of measures to test-run and improve the
existing technology and to enhance reliability of manufacturing equipment. That
enables us to reduce output of products with quality flaws, bring down material
resource consumption and raise production efficiency. We conduct a wide range of
occupational health & safety precautions aimed at heading off any emergency or
dangerous situation. To ensure a continuous production process, we maintain in
each production stage the appropriate reserves of work-in-progress and auxiliary
materials in case of any emergency shutdown in one of the previous stages.
Property risks are the probability of a portion of the Company’s property being
lost or damaged or income short-received in the course of production and financial
activities. To mitigate property risks, NLMK:
■ insures property;
■ installs security systems and devices;
■ protects the Company’s property.
Environmental risks
Environmental risks are the probability of civil liability for any environmental
damage that may arise in the process of constructing and operating production
facilities. To mitigate environmental risks, we continuously monitor the chemical
constitution of emissions and wastewater discharges and seek to reduce the
Company’s impact on the environment through putting into operation new,
environmentally-friendly manufacturing equipment and upgrading existing
machinery.
Industry risks
We use several tools for managing and minimizing risks inherent in the steel industry.
To reduce fallout from the cyclic nature of price behaviour, the Company seeks
to expand its range of products and diversify steel supply both by consumers’
geographical location and industry.
These steps reduce the Company’s dependence on adverse changes in product
prices, minimize possible losses from any negative trends in a certain industry or
geographical segment. Also, these steps can be effective in dealing with market
protection measures such as tariff regulation and quotas.
Continuous monitoring of current conditions and identifying growth potential
in various market segments are means of responding to adverse changes and
compensating for possible losses by timely re-channelling our commodity flows to
other consumers.

In our export activities we are up against multiple competition in each
geographical segment from global steel producers. NLMK constantly improves the
quality of products and responds to all requests from our customers, to ensure both
the required volumes of sales and potential for expanding our presence in
strategically important and financially attractive markets.
NLMK’s development as a vertically integrated holding company enables us to
reduce risks inherent in raw material supplies.
OJSC Stoilensky GOK and OJSC Combinat KMAruda (mining segment)
substantially provide all of our iron ore concentrate requirements.
In 2005, we started the construction of integrated works to produce and
process coking coal at the field Zhernovsky-1. At the beginning of 2006 we
acquired a controlling interest in the Prokopievskugol Group of companies. That
acquisition will enable NLMK to meet a considerable part of the demand for raw
materials for the production of blast-furnace coke.
To minimize the risk of any disruption of supplies, NLMK creates a reserve stock
of raw materials and components that are designed to ensure uninterrupted
production. Raw materials are supplied to the Company and finished products are
delivered to seaports by rail. LLC NTK (steel segment) is in charge of organization,
planning and control of transport flows as well as their optimization, which is an
additional tool of risk management.
NLMK enters into raw materials and components supply contracts only with
qualified and traditional business partners who can guarantee a reliable supply
and quality of resources acquired. We periodically monitor both the domestic and
foreign raw material markets to rule out a risk of financial losses due to any
unforeseen rise in prices of raw materials.
Country risks
The major part of NLMK’s products is exported. In 2005, the Company supplied its
products to more than 60 countries.
The regions where our export sales constitute 10 and higher per cent of
revenues were: Russia, South East Asia, the Middle East and EU countries.
If any negative situation arises in specific regions of the world, NLMK
possesses significant capabilities to re-focus on more attractive markets and to
minimize possible financial losses. Geographical diversification also helps to
minimize losses if the market is closed as a result of tariff regulation and quotas.
Foreign exchange risks
NLMK as an export-oriented company faces foreign exchange risks that may affect
its financial results and increase a risk of asset liquidity deterioration.
In 2005, 58% of revenue was received from export sales. In the context of
foreign exchange movements in 2003-2005, we took a decision to diversify the
structure of our export revenues by currency, which enabled us to minimize the
fallout from EUR/USD rate fluctuations.
The company maintains a proportional allocation of payments under long-term
58

59
■ RISK MANAGEMENT
NLMK • ANNUAL REPORT • 2005
import contracts and uses letters of credit in settlements generating interest
income from the deposit placement of security against these transactions.
Since the majority of NLMK’s cots are incurred in roubles, there is a risk of business
yield reduction if there are significant fluctuations in the rouble exchange rate
against foreign currencies. To minimise these risks the Company takes the
following steps:
■ conclusion of agreements with banks on sales of large amounts of foreign
currency for roubles at a fixed exchange rate with a minimum commission fee;
■ placement of temporarily free cash denominated both in foreign currency and
in roubles to reduce dependence on exchange rate fluctuations while
maintaining the business yields.
In 2005, there was no hedging of foreign exchange risks by means of forward
contracts and options for the following reasons:
■ the lack of legislation governing such transactions;
■ the structure of revenue in terms of foreign currency (US dollar, euro, rouble)
usually covers our expenses denominated in the corresponding foreign currencies.
Interest rate risk
NLMK may act as a borrower to finance ongoing operations and investment
projects. Funds may be raised both on the international and domestic capital
markets.
Over recent years, the Company has demonstrated robust creditworthiness
supported by ratings assigned to NLMK in 2005 by leading global agencies. This is
a key factor that may reduce the cost of borrowings for the Company in the future.
Liquidity deterioration risk
Liquidity risk as regards the Company’s activities is closely connected with the
receipt of cash from settlements for the Company’s products. To reduce this risk
the Company performs a precise planning of the schedule of cash inflows and
outflows to identify a possible deficit of financial resources.
The ratio of NLMK’s liquid assets to liquid liabilities testifies to its high
financial solvency and consequently, a low liquidity risk.
NLMK has adopted and applied an in-house standard governing the
quantification and approval of standard inventory of basic resources required for
creating and maintaining supplies at a reasonable level. Also, NLMK makes
provisions to increase inventory to ensure uninterrupted operation during the
autumn and winter periods.
One of the components underlying NLMK’s strong financial performance in
2005 is consistent abidance by our purchase policies, which enabled us to fully
cover NLMK’s requirements for raw materials, components, energy and equipment
of proper quality.

60

61
VALUE-BASED MANAGEMENT
NLMK • ANNUAL REPORT • 2005
Evaluation and analysis of the Company’s value growth indicators is a key element
of our value-based management system. Based on our review of movements in
these indicators, we make all strategic decisions and control the value-adding
process. Following the criteria of efficient value-based management, we are able
to prevent any decisions that could limit the growth of the Company’s value in the
long run.
An increase in market capitalization is an indicator of a company's value growth.
In 2005, we undertook a series of activities aimed at raising NLMK’s value.
From January 2005, ordinary shares of NLMK are included in the Quotation List B
of the List of Securities traded on the RTS Stock Exchange. That set the stage for
placement of NLMK’s shares on international stock markets and raised NLMK's
attractiveness to investors. In 2005, major global rating agencies assigned high
credit ratings to NLMK. These activities made it possible for us to successfully
place NLMK’s GDSs on the LSE in December 2005, considerably increasing the
Company’s value.
At the end of April 2006, NLMK had the highest capitalization rate among
Russia’s steel companies and was the tenth-largest publicly traded company in
Russia (in terms of capitalization).
As part of its long-term value-adding activities, NLMK focuses on indicators
that reflect the creation of fundamental value that, unlike capitalization rate, is
not susceptible to significant fluctuations.
After a thorough review of methodologies and indicators for assessing the
value-adding process, we selected EVA as the key indicator.
EVA (Economic Value Added) takes capital expenditures into account and does
not ignore investment risks.
EVA assessment based on the 2005 results proves the efficiency of NLMK’s
business activities, its value-adding ability and its attractiveness to investors.
At present, we continue to develop a system of value drivers, which could be
used as value-adding tools. It would be impossible to integrate the value-based
management concept within the existing management system without properly
trained personnel. Therefore, during the initial stage of that process we focused on
developing a «value-based mentality» amongst our employees.
Even though a procedure for evaluating the Company is now built into our
regular analysis of activities, the process of creating a tried and tested system of
value assessment is not yet complete. NLMK meticulously implements the system
of assessment and analysis of changes in the Company's value, based on our
accumulated experience and generally accepted global practices.
In 2005, certain changes in NLMK’s business environment took place. The
Company’s listing on the LSE, its greater attractiveness to investors and higher
capitalization as well as a reduction of Russia’s country risk compared with 2004
were grounds to bring the Company’s WACC (weighted average cost of capital)
down to 12.0% against 14.4% in 2004.
Information about our results in terms of value-based management is regularly
communicated to stakeholders, in particular to our shareholders.

USD m
Indicator 2005 2004
Capital employed 3,598 2,691
ROCE 36.2% 64.5%
WACC 12.0% 14.4%
EVA 870 1,348
Note:EVA estimate is based on NLMK’s US GAAP financial statements. Capital employed was calculated through reducing total assets by the amounts of accounts payable, cash
and current investments.ROCE – return on capital employed is based on net income adjusted for interest income/(expense).In 2005, the methodology of calculating Capital employed and ROCE changed. We used in our calcu-
lations mean values of Capital employed for the period. For an estimate of WACC (which we treat as NLMK's cost of equity) we took into account both the
industry risk (steel industry) and country risk associated with investments in Russian companies’ shares.
62

63NLMK • ANNUAL REPORT • 2005
NLMK’s technical upgrading program is based on a disciplined approach to
investments for the Company’s long-term development. To achieve its major
strategic goals the Company undertakes number of actions to raise product
competitiveness and enhance the Company’s position both in the domestic and
foreign markets.
NLMK makes major investments in all lines of operations. Implementation of
the technical upgrading program started in 2000. The first phase of the program
was completed in 2005. It was developed in cooperation with experts from
scientific and research institutes, design bureaus and leading Russian and foreign
companies. Best practices from European, Asian and American steel producers
were applied in the development process.
The Company’s technical upgrading and development efforts brought:
■ improve technological standards and equipment;
■ increase the efficiency of our production process by reducing unit costs;
■ increase production levels;
■ improve the quality and range of our products;
■ increase the production of high value-added products;
■ lessen the environmental impact of our operations.
From 2000 to 2005 NLMK made capital expenditures of approximately USD 1.56bn
on reconstruction and large-scale overhauls of the existing operating facilities
and construction of new ones, of which we estimate USD 1.26bn was for the first
phase of the technical upgrading program.
Steel Segment
The steel segment accounted for a major portion of investment for further
improvement of production and technical facilities. The following major facilities
were put into operation during the first phase of the technical upgrading program:
■ hot-dip galvanizing section No.2 (2001);
■ continuous casting machine No.4 and two additional secondary metallurgy
units at BOF shop No.1 (2002);
■ unit for preparation and inspection of cold-rolled strips (2003);
■ boiler No.13 (2003);
■ desulphurization station at BOF shop No.2 (2004);
■ hydrogen station No.3 for production of hydrogen by natural gas reforming (2004);
■ hot-dip galvanizing line No.3 (2005).
In addition, reheating furnace No.5 was upgraded at the hot-rolled flats shop
(2001-2003) and renovation of coke battery No.1 was completed (2003-2005).
In 2005 we also completed reconstruction of the aspiration system at the cast-
floor of blast-furnace No.5, began construction of the desulphurization unit at BOF
shop No.1, and upgraded the automated control system for cold-rolling mill
«2030».
TECHNICAL UPGRADEAND DEVELOPMENT

NLMK Group’s Capital Investment in 2000-2005
USD m
64

65
■ TECHNICAL UPGRADE AND DEVELOPMENT
NLMK • ANNUAL REPORT • 2005
As a result, NLMK enhanced the production capacity of these facilities,
improved the quality of products and reduced the negative impact on the
environment.
Other Operations
For the Company to be effective as a vertically integrated group, NLMK tries to
strike a balance in funds invested into the technical upgrading program.
While focusing on the improvement of the steel segment’s technological
standards and equipment, the Company is also aware of the necessity to develop
the Company’s mining assets and transportation infrastructure.
Thus, in 2000-2005 total investment into raw material resources and
transportation base, as well as other assets which are not related to operating
activities, amounted to about USD 160m.
Development Prospects
In 2006-2010 the Company plans to invest USD 2.7bn into construction, upgrading
and expanding production facilities to increase the proportion of high value-added
products and achieving considerable self-sufficiency in raw materials and reduce
production costs. At the same time, the Company’s efforts are aimed at improving
the quality of products and reducing the negative environmental impact of
production. Implementing the technical upgrading program will lead to enhanced
efficiency of NLMK, the most cost-effective company in the steel industry today.
These activities will allow NLMK to retain its leadership of the Russian steel market
in the future and to continue competing strongly with the world’s leading steel
producers.

66
Movement in OJSC NLMK environmental expenditure in 2001-2005
Movement in OJSC NLMK gross air emissions in 2001-2005
Movement in OJSC NLMK waste generation levels in 2001-2005
USD m
thousands of tonnes
thousands of tonnes

67NLMK • ANNUAL REPORT • 2005
CORPORATE SOCIAL RESPONSIBILITY
NLMK adopts a socially responsible position aimed at improving the social infra-
structure in the regions where the Group's companies operate. Specifically, NLMK
pursues its policy designed to protect the environment, create favourable condi-
tions and raise living standards of the Company’s employees.
Environmental protection
The fundamental goal of NLMK in this area is protection of people’s health and the
environment from adverse effects of the Company’s industrial activities, and to
protect and improve the quality of the environment.
In 2005, OJSC NLMK adopted a new environmental policy, which is based on
the principles of corporate social responsibility for environmental conditions and
provides for the use of the best technologies to prevent environmental pollution.
When addressing environmental issues, NLMK not only complies with the
requirements of environmental legislation but also adopts a proactive approach,
shifting priorities from neutralization of pollution (waste water and gas treatment,
disposal of other waste) directly to the sources of negative environmental effects
(use of resources, production processes, organization of production).
NLMK invests significant resources into modernizing production and reducing
emissions. In 2005, the parent company increased its expenditure on
environmental projects by 77.4% comparing with the previous year to USD 46m.
In 2005, OJSC NLMK managed to achieve impressive results in reducing
negative effects on the environment, together with improving the environmental
conditions in Lipetsk. NLMK’s environmental projects at the main production site
in Lipetsk reduced gross emissions by over 14,000 tonnes in 2005 comparing with
2004 levels.
Environmental damage was reduced through the use of resource-saving and
low-waste technologies implemented at the first stage (2000-2005) of the
Technical Upgrading Program. NLMK reduced its waste generation level by
144 thousand tonnes and 99.5% of all waste was utilized or detoxified. New
technologies allowed NLMK to process 288 thousand tonnes of previously
accumulated waste.
In 2005, NLMK’s Environmental Management System again successfully passed
the certification audit for compliance with ISO 14001:2004. In addition, the
Company won Russia’s Environmental Leader National Award established by the
Social Development and Environmental Protection Department of the Russian
Government, and was awarded a diploma by the Metals Enterprises Reconstruction
Workshop for achievements in environmental protection technologies.
For many years, NLMK has been improving its environmental monitoring system
that allows the Company to produce a more accurate forecast of the industrial
effects on the environment and to enhance efficiency of environmental projects.
In 2005, OJSC NLMK obtained a licence from the Russian Federal Service on
Hydrometeorology and Environmental Monitoring (Roshydromet), which allows
the Company to monitor the environmental impact.

68
NLMK Group’s personnel number in 2001-2005
Consumer prices index and average salary of NLMK Group personnel
in 2001-2005*
thousand people
*progressive total to 2001

69
■ NLMK GROUP’S SOCIAL POLICY
NLMK • ANNUAL REPORT • 2005
Other Group companies are also involved in environmental activity in
accordance with the environmental laws and aim to achieve full compliance
with European environmental standards. Operating activities of the mining
segment and other Group companies have a significant effect on the
environment. However, the clear objective of NLMK to ensure environmental
protection allows the Company to minimize adverse effects on the environment
in the regions where the Company's facilities are located. In addition, the steps
taken under the technical upgrading program aimed at modernizing existing
equipment and purchasing new equipment further contribute to improving the
environment and allow the Company to expect a reduction in such adverse
environmental effects in the future.
Human resource policy
Around 52.5 thousand employees work at NLMK’s facilities. Professional personnel
is one of the key factors of the Company’s operational efficiency. In view of the
fact that increasing shareholder value is NLMK’s strategic objective, management
pursues a proactive personnel policy aimed at raising living standards of its
employees through higher salaries and various bonuses.
To motivate the Company’s employees, reward qualified professionals and attract
young employees, OJSC NLMK implemented a new compensation plan in 2005.
Implementation of the new compensation plan in 2005 allowed the Company
to increase the average level of salaries for the parent company’s employees by
21.9% comparing with the previous year.
The new compensation plan focus primarily on attraction, selection and
recruitment of young people, motivation and remuneration of qualified
professionals, professional training, adaptation and counselling, career
management and work with young people.
Highly qualified employees training and high quality education are the key
factors of NLMK’s sustainable operation and competitiveness.
In 2005, over 19.5 thousand of NLMK’s employees were involved in various
training programs: retraining, second professional qualification, specialized
courses for skills improvement. Training is organized at work, in the Labour and
Personnel Department and in conjunction with state educational institutions.
OJSC NLMK actively attracts and supports talented young people and creates a
personnel reserve. Through the work performed in 2005, the Company increased its
share of young employees; over 600 young specialists aged under 30, graduates
from industry-specific third-level institutes, joined OJSC NLMK. To ensure
adaptation and retention of young people, the Company continued to develop its
counselling plan designed to help young specialists to quickly improve their
professional skills.
Getting our young specialists involved in professional competitions is a top
priority of the Company’s Human Resource policy and helps employees to realize their
creative potential and get actively involved in the management of the Company.
Lipetsk State Technical University annually trains engineers and specialists for
OJSC NLMK. In 2005, the Additional Students’ Professional Training Program was
launched. It allocates students for training in OJSC NLMK production departments

70
Movement in revenue and net income per employee at NLMK Group in 2001-2005
Share of OJSC NLMK employees aged 18 – 30 in 2001-2005
70
USD thousands/person
Residential space put into operation by OJSC NLMK in 2002-2005
thousands of sq.m

71NLMK • ANNUAL REPORT • 2005
to prepare highly qualified specialists at the metallurgical enterprise and reduce
the period of professional, social and psychological adaptation of young
employees. Scholarships sponsored by V.S. Lisin (30 scholarships) were set up for
the most talented students. Since 2005, the NLMK Student Program has funded
education of the children of OJSC NLMK employees.
OJSC NLMK focuses on ensuring a high level of industrial safety and favourable
labour conditions for the plant’s employees. Special attention paid by OJSC NLMK
management to this aspect resulted in a significant improvement in this area
compared with the levels seen in the late 1990s.
Health care and housing
In addition to salary and various bonuses, NLMK’s compensation package includes
mandatory and voluntary medical insurance as well as corporate pensions.
A key objective of the Company’s social programs is maintenance and
development of its non-industrial divisions involved in providing medical and
recreational services to the community. The Company’s medical complex located in
Lipetsk is primarily intended to provide a high quality service to NLMK’s employees
and their families and to residents of the town and region.
NLMK takes responsibility for mandatory medical insurance of its employees.
An employer is an insurer under law; insurance contributions are paid as a part of
the unified social tax and amount to 3.1% of the salary fund. Under the mandatory
insurance program employees are eligible for out-patient and in-patient care,
except for complex surgeries and expensive diagnostics and therapy, as provided
in the regional mandatory medical insurance program.
In addition to the above, OJSC NLMK provides voluntary medical insurance to
its employees, which provide for emergency care, medical and orthopaedic
consultations, treatment in specialized clinics for serious diseases and
rehabilitation in health resorts.
An important area of the Company’s social policy is construction of apartments
for its employees.
Pensions
The Company has its own corporate pension plan. NLMK is one of the founders of
the Social Development Corporate Pension Fund.
Currently the Social Development Fund is among the top 40 corporate pension
funds in Russia and is the largest in the Central Black-Earth Region. As at January 1,
2006, 27,488 NLMK employees were contributors and participants in the Fund.
NLMK paid USD 2.7m to the Social Development Fund for its employees in
2005. The Fund invests money received from the participants through Libra Capital
Management Company. Investment income distributed by the Fund among
contributors’ accounts was 12% per annum in the reporting year. The Fund’s
pension reserves are USD 36.5m.
Since July 2001, the Fund has been paying corporate pensions. For the period
from 2001 to 2005, 5,761 employees of NLMK joined the Fund’s pension plan.

Social Development Non-Governmental Fund’s pension reserves in 2001-2005
Movement in income tax charges paid by NLMK Group in 2002-2005
Structure of OJSC NLMK tax charges in 2005
72
USD m
USD m

73
■ SOCIAL RESPONSIBILITY
NLMK • ANNUAL REPORT • 2005
According to the Fund’s rules a corporate pension is payable within the period from
three to thirty years (at a participant’s discretion) until the whole amount is
withdrawn from the account. These payments are made in accordance with
previously defined pension contributions of the participants.
Tax payments
For many years, NLMK has been regularly remitting taxes to the budgets at all levels.
Efficient activities of NLMK Group companies are a the guarantee of the continuing
development of the regions where they operate. In 2005, the total income tax
transferred by NLMK to the budget was USD 434.9m.
The parent company, OJSC NLMK, which operates in Lipetsk region, is the largest
company in the region. OJSC NLMK has been showing positive financial results over
several years that significantly surpass the results of operations of other enterprises
in the region. OJSC NLMK accounts for 62% of the consolidated financial results of
all enterprises in Lipetsk region. As a result, taxes paid by the Company account for
a significant part of the city tax revenue (45%) and of the consolidated budget of
Lipetsk region (54%).
NLMK takes responsibility for maintaining stability in the Lipetsk region. This
is also determined by the fact that thousands of steel-makers and their family
members live in Lipetsk and they should live in a comfortable social environment.
Creating a comfortable environment is one of the Company’s objectives.
The social aspects of NLMK’s activities are not limited to timely and complete
tax payments to the budgets at all levels and non-budgetary funds as required by
Russian law. NLMK seeks to enhance the social welfare of its employees and to
improve their living conditions as the quality of life and social environment of its
employees is a key factor for the Company's success in the future.

CORPORATE NOVOLIPETSKGOVERNANCE STEEL

75NLMK • ANNUAL REPORT • 2005
PRINCIPLES OF CORPORATEGOVERNANCE
Economic Feasibility
The corporate governance model selected by NLMK ensures clear distribution of
strategic and operational management functions between the Company’s Board of
Directors and the management team. The distribution of authorities and
segregation of activities enables the assignment of responsibilities for the
decision-making process at all levels of management. Activities of the
Shareholders’ Meeting, Board of Directors and management are based on principles
of economic feasibility and are aimed at maintaining manageability and ensuring
the Company’s stable development and growth in value.
Protecting the Rights of Shareholders and Investors
Corporate governance of the Company is carried out in accordance with the Law of
the Russian Federation «On Joint Stock Companies», other regulatory acts governing
operations of joint stock companies in the Russian Federation, the Charter, Code of
Corporate Governance and other NLMK internal documents. The Company follows
international practices of good corporate governance to protect the rights of its
shareholders and investors.
Transparency
Confidence in the Company depends on the transparency of its financial and
business operations, and reliable data provided by management on a regular basis.
NLMK complies with the disclosure standards established by Russian legislation,
the requirements of the Federal Service for Financial Markets and of the Listing
rules issued by the UKLA and other UK regulatory acts. The Company endeavours
to ensure timely and precise disclosure of data on all significant issues, including
operating results, financial position, ownership and corporate governance. NLMK
prepares US GAAP financial statements. The Company works with leading
information agencies and uses advanced communications methods to efficiently
distribute information on its operations.

MANAGEMENT BODIES OF NLMKThe General Meeting of Shareholders is the supreme corporate body of Novolipetsk
Steel (NLMK). The Board of Directors performs the general management of the
Company. The General Director and Management Board are executive bodies
carrying out day-to-day operations.
General Meeting of Shareholders
The major issues falling within the competence of the General Meeting of
Shareholders are:
■ introducing amendments and additions to the Company’s Charter or approval
of a new version of the Charter, reorganization or liquidation of the Company;
■ increasing the charter capital of the Company through an increase in the par
value of shares or by issuing additional shares. Decreasing the charter capital
of the Company through a reduction in the par value of shares, cancellation of
shares acquired by the Company but not sold within one year from their
acquisition, cancellation of the Company’s treasury shares and cancellation of
shares whose title has reverted to the Company due to non-payment.
Decreasing the Company’s charter capital through the acquisition by the
Company of shares in order to reduce their total number. Share splits and
consolidations;
■ determining the number of members on the Board of Directors. Election of the
Board of Directors and the Review Commission, the General Director, and early
termination of their authority. Approval of the Company’s Auditor;
■ approving annual reports, annual financial statements, including income
statements (profit and loss accounts) of the Company, and also distribution of
profits, including payment (declaration) of dividends, and losses of the
Company;
■ approval of major transactions, participation in holding companies, financial
and industrial groups, and other associations of commercial organizations.
The Annual General Shareholders’ Meeting is convened not earlier than two
months and not later than six months after the end of the financial year.
Extraordinary General Shareholders’ Meetings may be convened in addition to the
Annual General Shareholders’ Meeting.
The Extraordinary General Shareholders’ Meeting is held in accordance with a
decision of the Board of Directors on its own initiative, requests of the Internal
Audit Commission, the Company’s Auditor or shareholders (a shareholder) who
owns at least 10% of the voting shares.
The Board of Directors determines the agenda of the General Meeting of
Shareholders in the course of preparation for the meeting.
The voting procedure at the General Meeting of Shareholders complies with the
principle «one share – one vote», except for the election of the Board members
that is conducted by cumulative voting.
In 2005, the Company had two Extraordinary and one Annual General
Shareholders’ Meetings.
76

77
■ CORPORATE GOVERNANCE
NLMK • ANNUAL REPORT • 2005
The Annual General Shareholders’ Meeting of OJSC NLMK was held on May 20,
2005. The Meeting considered issues within the competence of the Annual General
Shareholders’ Meeting and the issues of amending the Charter, approving the
revised Regulations on the Board of Directors’ remuneration, and approving the
interested-party transactions and remuneration to members of the Board of
Directors.
Shareholders approved the annual report, balance sheet, profit and loss statement,
and distribution of profits. Based on the Company’s results for 2004, the shareholders
made the decision to declare dividends on OJSC NLMK issued ordinary shares in the
amount of RUR 1.8 per ordinary share and, taking into account the interim dividends
of RUR 1.0 per ordinary share paid out for 9 months 2004, to pay RUR 0.8 per ordinary
share additionally. The total amount of dividends was RUR 10,788m.
The General Shareholders’ Meeting elected the new Board of Directors of NLMK,
General Director and the Review Commission.
The shareholders approved CJSC PricewaterhouseCoopers Audit as the
statutory auditor of OJSC NLMK for 2005 and engaged the same firm to perform an
audit of the Company’s US GAAP financial statements.
The shareholders approved the amendments to the Charter with respect to the
full name of the Company in English and the revised Regulations on the Board of
Directors’ remuneration.
OJSC NLMK Extraordinary General Meeting of Shareholders held on September 26,
2005 considered the issue of dividends payment for 6 months 2005. The
shareholders decided to pay dividends of RUR 1 per ordinary share for 6 months
2005. The total amount of dividends was RUR 5,993m.
OJSC NLMK Extraordinary General Meeting of Shareholders held on
November 16, 2005 considered the issue on approval of interested-party
transactions.
Board of Directors
The OJSC NLMK Board of Directors determines strategic areas for the Company’s
development and exercises the general management of its activities. The Board of
Directors has the right to resolve any issues except for those assigned to the
exclusive competence of the General Meeting of Shareholders.
The Board of Directors guarantees that operations are carried out in
accordance with the Charter, Code of Corporate Governance and decisions of the
General Shareholders’ Meeting. The OJSC NLMK Board of Directors consists of nine
members. Board members are elected by the General Shareholders’ Meeting for a
one-year term. The members of the Board of Directors select the Chairman of the
Board of Directors by a majority vote of all members of the Board. OJSC NLMK Board
members have access to all information needed to perform their duties. The
Company intends to maintain at least three independent directors on the Board of
Directors.
The major issues within the competence of the Board of Directors are:
■ prioritization of the Company’s lines of activity;
■ convening the General Shareholders’ Meeting and approving its agenda;
■ formation of the Company’s Management Board and early termination of its
mandate;

■ recommendation of the size of dividends on shares and procedures for
distribution, and use of the Company’s reserve capital;
■ the Company’s interests in other organizations, establishing the Company’s
branches and opening representative offices;
■ approval of major transactions related to acquisitions and disposals;
■ approval of documents determining the working procedures of the Company’s
management bodies.
OJSC NLMK Board of Directors as of 31.12.2005
Vladimir S. Lisin
Chairman of the Board of Directors
Vladimir N. Skorokhodov
Deputy Chairman of the Board of Directors
Oleg V. Bagrin
Nikolai A. Gagarin
Dmitriy A. Gindin
Oleg V. Kiselev*
Nikolai P. Lyakishev
Randolph Reynolds
Igor P. Fedorov
* Mr. Kiselev applied for withdrawal from the Board of Directors on 23.11.2005.
17 meetings of the Board of Directors were held during 2005. The following
principal decisions were taken at these meetings:
1. On approval of OJSC NLMK budget .
2. On approval of OJSC NLMK internal documents:
■ Regulations on the Committee on personnel, remuneration and social policies;
■ Regulations on the Strategic Planning Committee;
■ Regulations on the Audit Committee;
■ Regulations on OJSC NLMK information policies;
■ Regulations on the authority of the Division of Audit within the system of internal
controls over NLMK’s financial and business operations;
■ Regulations on NLMK-DV – OJSC NLMK Far East Branch.
3. On approval of the interested-party transaction:
■ Approval of Prospectus to access trading in OJSC NLMK Global Depositary
Shares at the London Stock Exchange.
4. On forming Committees under OJSC NLMK Board of Directors.
The following committees were formed at the meetings of the Board of Directors:
■ Audit Committee (Committee Chairman: Randolph Reynolds, member of the
Company’s Board of Directors; Committee members: Oleg Bagrin and Igor
Fedorov, members of NLMK’s Board of Directors);
■ Strategic Planning Committee (Committee Chairman: Vladimir Lisin,
Chairman of NLMK’s Board of Directors; Committee members: Vladimir
Skorokhodov, Deputy Chairman of NLMK’s Board of Directors, Nikolai Gagarin
and Nikolai Lyakishev, members of NLMK’s Board of Directors);
78

79
■ CORPORATE GOVERNANCE
NLMK • ANNUAL REPORT • 2005
■ Committee on personnel, remuneration and social policies (Committee
Chairman: Oleg Kiselev, Dmitriy A. Gindin, member of the Committee, was
authorized to take over the responsibilities of the Committee Chairman at
the Board meeting held on November 23, 2005), Committee members:
Stanislav Tsyrlin, NLMK’s Director for Strategy and Management Systems, and
Sergei Melnik, NLMK’s Director for Human Resources and Administration).
5. On amending NLMK’s Charter.
In accordance with the decision of the General Meeting of NLMK’s
Shareholders, the Charter was amended with respect to the full name of the
Company in English.
6. On convening General Shareholders’ Meetings of the Company and approval of
related issues and events.
7. Approval of the structure of NLMK’s Management Board and its members.
8. Prioritization of the Company’s lines of activity.
Mr V.A. Loskutov, NLMK’s Director for Real Estate and Securities Management,
was approved as the Secretary of NLMK’s Board of Directors.
General Director and Management Board
The General Director and the Management Board, a collective executive body,
oversee NLMK’s day-to-day activities.
The General Director ensures execution of decisions of the General Meeting of
Shareholders and the Board of Directors. The competence of the General Director
includes issues of the management of day-to-day operations, except for issues
assigned to the exclusive competence of the General Shareholders’ Meeting and
the Board of Directors. The General Director submits the list of the Management
Board members for the approval of the Board of Directors, organizes the
Management Board’s work, and acts as its Chairman.
The Management Board operates in accordance with the goals and objectives
set by the General Shareholders’ Meeting. The main goal of the Management Board
is to manage the current operations professionally and in good faith so as to
ensure the stable profitability of the Company.
Members of OJSC NLMK Management Board as of 31.12.2005
Vladimir P. Nastich
General Director of NLMK, Chairman of the Management Board
Sergei A. Rakitin
Technical Director – Chief Engineer
Galina A. Aglyamova
Deputy General Director for Economics and Finance
Igor N. Anisimov
Director for Purchasing
Viacheslav I. Vorotnikov
Director for Production
Pavel V. Gorodilov
Director for Sales

80
Novolipetsk Steel (NLMK) Management Structure
Note: Management structure as of 31.12.2005.

81
■ CORPORATE GOVERNANCE
NLMK • ANNUAL REPORT • 2005
Anatoliy N. Koryshev
Director of Repairs Plant
Alexander I. Kravchenko
Director for Legal Issues
Sergei P. Melnik
Director for Human Resources and General Issues
Sergei V. Perekatov
Director for Construction and Repair Facilities
Vladislav A. Smirnov
Deputy General Director for Power Engineering
Alexander A. Sokolov
Director for Accounting – Chief Accountant
Vladimir A. Tretyakov
IT Director
Victor V. Khripunkov
Security Director
Stanislav E. Tsyrlin
Director for Strategy and Management Systems
Internal Audit Commission
The Internal Audit Commission supervises the financial and business operations of
the Company. The General Meeting of Shareholders elects its members for a one-
year term. Persons involved in the management of the Company may not be
members of the Internal Audit Commission.
The Internal Audit Commission acts on the basis of the Company’s Charter and
Regulations on the Review Commission and coordinates audits of the financial and
business operations of the Company. The objective of the Commission is to obtain
sufficient assurance that the Company’s operations comply with effective
legislation and do not infringe upon shareholders’ rights, and that there are not
any material misstatements in the Company’s accounting and reporting.
The members of OJSC NLMK Review Commisssion as of 31.12.2005:
Valeriy S. Kulikov
Igor A. Matsak
Olga N. Savushkina
Galina I. Shipilova
Natalia V. Kurasevich

OJSC NLMK Subsidiaries and Associates as of 31.12.2005
Company name Location NLMK’s share in the
company’s Charter
capital, %
I. Subsidiaries
LLC Lipetsk Insurance 398059, Lipetsk, Nedelina st., 30 100
Company Chance
LLC Steel 152620, Yaroslavl region, 100
Uglich, Lenina st., 1
LLC Novolipetskoye 398052, Lipetsk region,
village Tyushevka 100
LLC Karamyshevskoye 399077, Lipetsk region, Griazi
district, village Karamyshevo 100
LLC Trade House NLMK 109240, Moscow,
Kotelnicheskaya nab., 1/15, building B 100
Subsidiary 334886, Ukraine, 100
Holiday Hotel Sudak, Chekhova per., 25
Novolipetsky Metallurg
LLC Larmet 121165, Moscow, 99.98
Studencheskaya st., 44/28
LLC Vimet 398005, Lipetsk, 99.97
Mira pr., 35а
OJSC 309530, Belgorod region, 96.98
Stoilensky Stary Oskol
GOK
OJSC Dolomite 399854, Lipetsk region, 92.74
Dankov, Sverdlova st., 1
OJSC 398008, Lipetsk, 88.62
Studenovskaya Gaidara st., 4
Joint Stock
Mining Company
LLC Vtormetsnab NLMK 398040, Lipetsk, 70.00
Metallurgov sq., 2
LLC Independent Transport 119991, Moscow, 70.00
Company Leninsky pr., 32a
OJSC Tuapsinsky Sea 352800, Krasnodar region, 69.41
Commercial Port (TMTP) Tuapse, Gorkogo st., 2
OJSC North Oil and Gas 105082, Moscow, 62.00
Company Spartakovskaya sq., 14, Bld.1
LLC Lipetskaya 398001, Lipetsk, 51.00
Municipal Energy Peter the Great sq., 4а
Company
OJSC Lipetskcombank 398600, Lipetsk, 50.07*
Internationalnaya st., 8
II. Associates
OJSC Lipetsky Gipromez 398600, Lipetsk, Kalinina st., 1 43.44
OJSC Combinat KMAruda 309182, Belgorod region, Gubkin 32.89
LLC Neptun 398005, Lipetsk, 25.00
Admirala Makarova st., 1в, office No.35
* OJSC NLMK holds 50.14% voting shares (ordinary shares).
82

83NLMK • ANNUAL REPORT • 2005
III. Subsidiaries of OJSC NLMK Subsidiaries
LLC AvtoKIM-2001 Moscow
LLC Investment Lipetsk
Company LKB-Finance
LLC Novolipetsk Lipetsk
Insurance Company
LLC Insurance Lipetsk
Medical Company
Novolipetskaya
LLC Karavella Tuapse
LLC Nafta (Т) Tuapse
OJSC Tuapse
Firm Tuapsegrazhdanstroy
OJSC Tuapsinsky Tuapse
Sudoremontny Zavod
LLC TUAPSEVNESHTRANS Tuapse
LLC Private Stary Oskol
Security Company
VV-Zaschita
LLC Uterra Belgorod Region
■ CORPORATE GOVERNANCE

SHARE NOVOLIPETSKCAPITAL STEEL

85NLMK • ANNUAL REPORT • 2005
SHARE CAPITALAs of 31.12.2005, NLMK’s charter capital was RUR 5,993,227,240 (five billion nine
hundred ninety three million two hundred twenty seven thousand two hundred
forty) and consisted of 5,993,227,240 (five billion nine hundred ninety three
million two hundred twenty seven thousand two hundred forty) floated ordinary
shares with a par value of RUR 1.0. The Company’s shares are registered and non-
documentary.
NLMK’s major shareholders as of 31.12.2005
Name % of share capital held
SILENER MANAGEMENT LIMITED 18.98
MEROBEL INVESTMENTS LIMITED 16.19
CASTELLА INVESTMENTS LIMITED 15.94
ULTIMEX TRADING LIMITED 14.91
VEFT ENTERPRISES LIMITED 8.25
CJSC Investment and Finance Company LKB-INVEST 7.52
Registered holder having at least 5% of NLMK’s ordinary shares registered on
its personal account as of 31.12.2005:
LLC Deutsche Bank – 7.69% of NLMK’s share capital (ordinary shares).
SHARE PRICE INFORMATIONFrom January 14, 2005, NLMK’s ordinary shares of (code – NLMK) are included in
the Quotation List B of the List of Securities traded on the Classic Market of Non-
profit Partnership RTS Stock Exchange.
From November 5, 2003 to January 28, 2005, the RTS Board provided
information on indicative quotations of NLMK’s ordinary shares (ticker symbol –
NLMK). This data was not an official quotation of NLMK’s securities, however,
it could be used as a basis for calculation of market capitalization of the Company.
For the period from January 14 through December 31, 2005, there were 1,038
transactions with NLMK’s shares in the Classic Market of RTS Stock Exchange for a
total of USD 66,388,232. The last transaction closing price was USD 1.43.
At December 31, 2005, capitalization of NLMK in the Classic Market of RTS Stock
Exchange was USD 8,570,314,953.
Since November 23, 2004, NLMK’s ordinary shares have been included in the list
of OJSC RTS Exchange system (ticker symbol – NLMKG). For the period from January 1
through December 31, 2005, there were 2,882 transactions with NLMK’s shares in OJSC
RTS Exchange system for a total of RUR 654,639,896. The last transaction closing price
was RUR 41.0. At December 31, 2004, capitalization of NLMK in OJSC RTS Exchange
system was RUR 245,722,316,840 (USD 8,537,212,432 at the Central Bank of Russia’s
exchange rate effective at 31.12.2005). On December 9, 2005 NLMK placed 420m
shares or 42m Global Depositary Shares (GDS) at the London Stock Exchange (LSE)
that represent approximately 7% of the Company’s share capital.

NLMK Shares in RTS (Since the date of inclusion into the Classic Market list
on 14.01.2005)
Capitalization of NLMK in RTS in 2005
NLMK’s GDS at the London Stock Exchange
86
GDS price, USD
USD bn
Share price, USD

87
■ SHARE CAPITAL
NLMK • ANNUAL REPORT • 2005
The placement price was USD 1.45 per share, or USD 14.5 for GDS (each GDS
represents 10 ordinary shares). The Company raised USD 609m. Thus, NLMK’s capi-
talization reached USD 8.7bn.
At March 31, 2006 NLMK’s capitalization in RTS was USD 12,148,271,615.
At March 31, 2006 NLMK’s GDS was priced at USD 20.5 at the London Stock
Exchange (LSE), which corresponds to capitalization of USD 12.3bn.
DIVIDENDSThe Dividend Policy of OJSC NLMK approved on June 2004 was developed to clarify
the Company’s strategy for distribution and use of OJSC NLMK net profits to the
shareholders and all interested parties to the maximum extent possible.
The Dividend Policy is aimed at increasing the fundamental value of the
Company with annual distribution of dividends based on the amount of profits and
funds required for further development of OJSC NLMK. The objective of the
Company’s dividend policy is to ensure sustainable dividend distributions to the
Company’s shareholders.
The Company pays dividends provided that:
■ the Company has a net profit for the reporting period under US GAAP;
■ Russian law does not provide for any limitation on dividend distributions;
■ the Company maintains a stable financial position and ensures prospects for
further development;
■ the Board of Directors gives recommendations on the size of dividend;
■ the General Shareholders’ Meeting takes a corresponding decision.
Dividends are paid to the Company’s shareholders out of the Company’s net
profit reported in the Russian statutory accounting reports.
In 2006 the Board of Directors recommended the following amendments to the
Dividend Policy:
■ increase the minimum percentage of NLMK’s annual net profit allocated for
dividend distribution from 15 to 20%;
■ target an average dividend payment during a five-year period of 30% of US
GAAP annual net income;
■ net profit from divestments from equity securities which fail to ensure
significant influence or control over the issuer can be fully allocated for
dividend payment provided no cash mobilization is required for investment
activity.
The amount of recommended dividends per share is calculated based on the
amount of funds committed to dividend distributions and translated at the closing
exchange rate of the Central Bank of Russia, and the number of the floated and
outstanding shares.
Recommendations of the Company’s Board of Directors on the size of dividends
are submitted to the shareholders for their final approval. The decision on
dividend distribution and the size of dividends is taken by the General
Shareholders’ Meeting. The amount of dividend may not exceed that recommended
by the Board of Directors.

88
Period for which 2002 2003 2004 2005
dividends were paid 6 months
Dividends per 312.5 0.6045 1.8 1.0
share issued, RUR
Number of shares issued 5,987,240 5,993,227,240 5,993,227,240 5,993,227,240
on the dividend declaration
date, pieces
Total amount of 1,871,012,500 3,622,905,867 10,787,809,032 5,993,227,240
dividends accrued, RUR

89
■ SHARE CAPITAL
NLMK • ANNUAL REPORT • 2005
SUGGESTED PROFIT ALLOCATIONBoard of Directors of NLMK recommended that the General Shareholders’ Meeting
declare dividends of RUR 17,979,681,720 based on 2005 results.
Number of OJSC NLMK issued shares, pieces 5,993,227,240
Dividends per ordinary share with a par value of RUR 1.0, RUR 3.0
Total amount of dividends based on 2005 results, RUR 17,979,681,720
With the interim dividends of RUR 1.0 per ordinary share declared by the
General Shareholders’ Meeting in September 2005 taken into account, dividends of
RUR 2.0 per OJSC NLMK ordinary share will be paid additionally based on 2005
results.
The Board of Directors recommended that profit remaining after dividend
distributions is used for NLMK’s technical upgrading and investment programs.

prepared in accordance with accounting principles
generally accepted in the United States of America
as at and for the years ended
December 31, 2005, 2004 and 2003
(with Report of independent auditors thereon)
NOVOLIPETSKSTEEL
NLMK GROUP’SCONSOLIDATEDFINANCIAL STATEMENTS

91NLMK • ANNUAL REPORT • 2005
THE OJSC NLMK MANAGEMENT’SOPINION ON THE GROUP CONSOLIDATEDUS GAAP FINANCIAL STATEMENTSThe Management’s Opinion stated below should be considered as an integral part
of these consolidated financial statements of the Open Joint Stock Company
Novolipetsk Steel (further – NLMK) prepared in accordance with the accounting
principles generally accepted in the United States of America.
The NLMK management confirms its responsibility for the preparation of the
consolidated financial statements of the Group as at and for the years ended
December 31, 2005, 2004 and 2003 consisting of balance sheets, statements of
income, statements of cash flows, statements of shareholders’ equity and
comprehensive income and notes to consolidated financial statements.
The NLMK financial statements, its subsidiaries and affiliated companies
underwent an independent audit which confirms its compliance with the
accounting principles generally accepted in the United States of America.
Independent audit is held by the international company PricewaterhouseCoopers.
While conducting their audits, independent auditors have access to the financial
and other documents and also implement other tests needed to achieve sufficient
confidence for expressing an opinion that the consolidated financial statements
comply with the current legislation requirements and free of material
misstatement.
Companies of the NLMK Group have an operating system of internal financial
control, which major goal is to provide:
■ the most effective organization of accounting;
■ compliance with current legislation requirements;
■ safety of property and other assets.
On the completion of the internal and external control procedures, the
appropriate reports were given to the NLMK management, confirming fair
presentation of the financial position, results of operations and cash flows of the
Parent company and its subsidiaries and affiliated companies in the consolidated
financial statements and its conformity with the accounting principles generally
accepted in the United States of America.
General Director Nastich V.P.
Chief Accountant Sokolov A.A.

92
To the Board of Directors of OJSC Novolipetsk Steel
We have audited the accompanying consolidated balance sheets of OJSC
Novolipetsk Steel and its subsidiaries (the «Group») as at December 31, 2005, 2004
and 2003, and the related consolidated statements of income, cash flows and
stockholders’ equity and comprehensive income for the years then ended. These
consolidated financial statements are the responsibility of the Group’s
management. Our responsibility is to express an opinion on these consolidated
financial statements based on our audits.
We conducted our audits in accordance with auditing standards generally accepted
in the United States of America. Those standards require that we plan and perform
the audits to obtain reasonable assurance about whether the financial statements
are free of material misstatement. An audit includes examining, on a test basis,
evidence supporting the amounts and disclosures in the financial statements. An
audit also includes assessing the accounting principles used and significant
estimates made by management, as well as evaluating the overall financial
statement presentation. We believe that our audits provide a reasonable basis for
our opinion.
As discussed in Note 10 to the consolidated financial statements, the cost of
certain property, plant and equipment was determined with the assistance of an
independent appraiser, who provided US dollar estimates of the fair value of the
Group’s property, plant and equipment.
ZAO PricewaterhouseCoopers Audit
Kosmodamianskaya Nab. 52, Bldg. 5
115054 Moscow Russia
Telephone +7 (495) 967 6000
Facsimile +7 (495) 967 6001
REPORT OF INDEPENDENT AUDITORS

93
■ CONSOLIDATED FINANCIAL STATEMENTS
NLMK • ANNUAL REPORT • 2005
In our opinion, except for the effects of using the appraisal to determine the
carrying value for certain property, plant and equipment as discussed in the
preceding paragraph, the consolidated financial statements referred to above
present fairly, in all material respects, the financial position of the Group as at
December 31, 2005, 2004 and 2003 and the results of its operations and its cash
flows for the years then ended in conformity with accounting principles generally
accepted in the United States of America.
Moscow, Russian Federation
April 17, 2006
* The firm is an authorized licensee of the tradename and logo of PricewaterhouseCoopers.

94
■ CONSOLIDATED BALANCE SHEETSas at December 31, 2005, 2004 and 2003 (All amounts in thousands of US dollars, except for share data)
ASSETS Note
Current assets
Cash and cash equivalents 4
Short-term investments 6
Accounts receivable, net 7
Inventories, net 8
Other current assets, net 9
Restricted cash 5
Non-current assets
Long-term investments 6
Property, plant and equipment, net 10
Intangible assets, net 11
Goodwill 11
Other non-current assets, net 9
Total assets
LIABILITIES AND STOCKHOLDERS’ EQUITY
Current liabilities
Accounts payable and other liabilities 12
Current income tax liability
Short-term capital lease liability
Non-current liabilities
Long-term capital lease liability
Deferred income tax liability 16
Other long-term liabilities 13
Total liabilities
Commitments and contingencies 25
Minority interest 14
Stockholders’ equity
Common stock, 1 Russian ruble par value –
5,993,227,240, 5,993,227,240 and 5,987,240 shares
issued and outstanding at December 31,
2005, 2004 and 2003 15
Statutory reserve 15
Additional paid-in capital
Other comprehensive income
Retained earnings
Total liabilities and stockholders’ equity
The consolidated financial statements as set out on pages 4 to 38 were approved on April 17, 2006.

95NLMK • ANNUAL REPORT • 2005
As at As at As at
December 31, 2005 December 31, 2004 December 31, 2003
1,896,741 1,348,615 729,641
27,040 21,153 180,797
660,054 588,562 377,746
501,556 475,303 301,303
208,920 148,748 63,336
7,979 5,094 23,104
3,302,290 2,587,475 1,675,927
31,470 51,425 39,925
2,393,549 2,257,628 1,332,579
16,655 21,594 –
173,357 179,815 –
133,747 67,984 36,834
2,748,778 2,578,446 1,409,338
6,051,068 5,165,921 3,085,265
507,637 455,042 251,687
40,639 78,638 23,032
– 232 6,114
548,276 533,912 280,833
– 313 11,563
294,337 305,472 159,716
61,675 19,946 6,593
356,012 325,731 177,872
904,288 859,643 458,705
– – –
92,576 85,787 16,652
221,173 221,173 14,440
10,267 10,267 32
1,812 680 680
71,899 242,387 27,672
4,749,053 3,745,984 2,567,084
5,054,204 4,220,491 2,609,908
6,051,068 5,165,921 3,085,265

■ CONSOLIDATED STATEMENTS OF INCOME for the years ended December 31, 2005, 2004 and 2003
96
Note
Sales revenue 22
Cost of sales
Production cost
Depreciation and amortization
Gross profit
General and administrative expenses
Selling expenses
Taxes other than income tax
Operating income
Loss on disposals of property, plant and equipment
Gain / (loss) on investments
Interest income
Interest expense
Foreign currency exchange loss, net
Other income / (expense), net
Income before income tax and minority interest
Income tax 16
Income before minority interest
Equity in net earnings of associate
Minority interest 14
Net income
Income from continuing operations per share (US dollars)
basic and diluted
Net income per share (US dollars)
basic and diluted 17

97
All amounts in thousands of US dollars, except for earnings per share amounts
NLMK • ANNUAL REPORT • 2005
For the year ended For the year ended For the year ended
December 31, 2005 December 31, 2004 December 31, 2003
4,468,726 4,538,686 2,468,022
(2,118,111) (1,888,702) (1,293,330)
(283,622) (243,656) (157,809)
(2,401,733) (2,132,358) (1,451,139)
2,066,993 2,406,328 1,016,883
(107,867) (92,517) (69,524)
(62,614) (57,839) (40,760)
(36,473) (33,108) (24,325)
1,860,039 2,222,864 882,274
(11,812) (12,231) (7,949)
(1,523) 165,174 12,136
98,872 50,069 33,633
(15,091) (12,296) (7,344)
(7,900) (39,101) (42,999)
(16,342) (10,477) 11,983
1,906,243 2,364,002 881,734
(495,683) (572,221) (223,035)
1,410,560 1,791,781 658,699
3,701 – –
(28,925) (19,280) (2,243)
1,385,336 1,772,501 656,456
0.2312 0.2958 0.1095
0.2312 0.2958 0.1095

■ CONSOLIDATED STATEMENTS OF CASH FLOWS for the years ended December 31, 2005, 2004 and 2003
Note
CASH FLOWS FROM OPERATING ACTIVITIES
Net income
Adjustments to reconcile net income to net cash provided by operating activities:
Minority interest 14
Depreciation and amortization
Loss on disposals of property, plant and equipment
(Gain) / loss on investments
Equity in net earnings of associate
Deferred income tax (benefit) / expense 16
Stock-based compensation 24(e)
Other movements
Changes in operating assets and liabilities
Increase in accounts receivable
Increase in inventories
Decrease / (increase) in other current assets
Increase in loans provided by the subsidiary bank
Increase in accounts payable and other liabilities
Increase / (decrease) in current income tax payable
Net cash provided by operating activities
CASH FLOWS FROM INVESTING ACTIVITIES
Acquisitions of subsidiaries, net of cash acquired of $38,109 21
Proceeds from sale of property, plant and equipment
Purchases and construction of property, plant and equipment
Proceeds from sale of investments
Purchase of investments
Movement of restricted cash
Net cash used in investing activities
CASH FLOWS FROM FINANCING ACTIVITIES
Proceeds from borrowings and notes payable
Repayment of borrowings and notes payable
Proceeds from issuance of additional stock in subsidiaries to minority stockholders
Capital lease payments
Payments to controlling shareholders for common control transfer of interests in a new subsidiary, net of cash of $1,070 received in transferred subsidiary 21
Payments to controlling shareholders for common control transfers of interests in existing subsidiaries 24
Repayment of loan by controlling shareholders 24
Proceeds from controlling shareholders for sale of investments 24
Dividends to shareholders
Net cash provided by / (used in) financing activities
98

99
Thousands of US dollars
NLMK • ANNUAL REPORT • 2005
For the year ended For the year ended For the year ended
December 31, 2005 December 31, 2004 December 31, 2003
1,385,336 1,772,501 656,456
28,925 19,280 2,243
283,622 243,656 157,809
11,812 12,231 7,949
1,523 (165,174) (12,136)
(3,701) – –
162 (35,945) (13,498)
1,132 – –
(21,609) 2,096 (19,342)
(96,486) (158,628) (86,853)
(47,077) (132,375) (71,038)
(33,208) 331 328
(69,142) (86,501) (44,357)
107,377 146,731 86,360
(33,990) 51,140 4,390
1,514,676 1,669,343 668,311
– (173,856) –
10,616 8,352 15,677
(573,220) (269,459) (239,279)
72,872 518,866 17,650
(42,722) (185,594) (187,590)
(3,122) 3,378 (15,589)
(535,576) (98,313) (409,131)
20,143 2,545 470
(7,234) (22,161) (930)
– – 388
– (40,818) (6,648)
– (635,383) –
– (2,617) –
– – 71,415
– 5,554 38,104
(384,973) (332,817) (61,675)
(372,064) (1,025,697) 41,124

100
Note
Net increase in cash and cash equivalents
Effect of exchange rate changes on cash and cash equivalents
Cash and cash equivalents at the beginning of the year 4
Cash and cash equivalents at the end of the year 4
Supplemental disclosures of cash flow information:
Cash paid during the year for:
Income tax
Interest
Non cash operating activities:
Offset of income tax payable with VAT receivable
Non cash investing activities:
Capital lease liabilities incurred 18
Reclassification of restricted cash to long-term investments 5
Non cash investing and financing activities as a result of:
Transfers of subsidiary interests from common control parties reflected as capital contribution, net of cash зreceived of $1,070 21
СFair value of net assets acquired from third parties in new subsidiaries, net of cash acquired of $38,109 in OJSC TMTP and its subsidiaries 21
■ CONSOLIDATED STATEMENTS OF CASH FLOWSfor the years ended December 31, 2005, 2004 and 2003

101NLMK • ANNUAL REPORT • 2005
For the year ended For the year ended For the year ended
December 31, 2005 December 31, 2004 December 31, 2003
607,036 545,333 300,304
(58,910) 73,641 46,380
1,348,615 729,641 382,957
1,896,741 1,348,615 729,641
434,885 479,732 190,810
13,623 12,002 7,369
96,427 76,251 41,333
– 19,920 17,059
– 15,000 –
– 597,665 –
– 173,856 –
Thousands of US dollars

102
■ CONSOLIDATED STATEMENTS OF STOCKHOLDERS’EQUITY AND COMPREHENSIVE INCOME
Note
Balance at December 31, 2002
Comprehensive income:
Net income
Other comprehensive income:
Net unrealized loss on a change in valuation of investments
Deferred income tax liability effect 2(b)
Cumulative translation adjustment 2(b)
Comprehensive income
Dividends to shareholders 15
Balance at December 31, 2003
Comprehensive income:
Net income
Other comprehensive income:
Net unrealized gain on a change in valuation of investments
Cumulative translation adjustment 2(b)
Comprehensive income
Stock split 15(а)
Increase in statutory reserve 15(а)
Dividends to shareholders 15(b)
Transfers of subsidiary interests from controlling shareholders 21
Payments to controlling shareholders for common
control transfer of subsidiary 21
Balance at December 31, 2004
Comprehensive income:
Net income
Other comprehensive income:
Net unrealized gain on a change in valuation of investments
Cumulative translation adjustment 2(b)
Comprehensive income
Stock-based compensation 24(e)
Dividends to shareholders 15(b)
Balance at December 31, 2005

103
for the years ended December 31, 2005, 2004 and 2003 (thousands of US dollars)
Common Statutory Additional Other Retained Total
stock reserve paid-in comprehensive earnings stockholders’
capital income equity
14,440 32 680 3,723 1,972,303 1,991,178
– – – – 656,456 656,456
– – – (2,390) – (2,390)
– – – (145,133) – (145,133)
– – – 171,472 – 171,472
680,405
– – – – (61,675) (61,675)
14,440 32 680 27,672 2,567,084 2,609,908
– – – – 1,772,501 1,772,501
– – – 66 – 66
– – – 214,649 – 214,649
1,987,216
206,733 – – – (206,733) –
– 10,235 – – (10,235) –
– – – – (338,915) (338,915)
– – – – 598,735 598,735
– – – – (636,453) (636,453)
221,173 10,267 680 242,387 3,745,984 4,220,491
– – – – 1,385,336 1,385,336
– – – 7 – 7
– – – (170,495) – (170,495)
1,214,848
– – 1,132 – – 1,132
– – – – (382,267) (382,267)
221,173 10,267 1,812 71,899 4,749,053 5,054,204
NLMK • ANNUAL REPORT • 2005

NOTES TO THECONSOLIDATEDFINANCIALSTATEMENTS
NOVOLIPETSKIRON AND STEELCORPORATION
as at and for the yearsended December 31,2005, 2004 and 2003(thousands of US dollars)

105NLMK • ANNUAL REPORT • 2005
1. BACKGROUND
OJSC Novolipetsk Steel (the «Parent Company») and its subsidiaries (together – the «Group»)
is one of the largest iron and steel holdings in the Russian Federation with facilities that allow
the Group to operate an integrated steel production cycle. The Parent Company is a Russian
Federation open joint stock company in accordance with the Civil Code of the Russian
Federation. The Parent Company was originally established as a State owned enterprise in 1934
and was privatized in the form of an open joint stock company on January 28, 1993. On August
12, 1998 the Parent Company’s name was re-registered as an open joint stock company in
accordance with the Law on Joint Stock Companies of the Russian Federation.
The Group’s principal activity is the production and sale of ferrous metals, primarily
consisting of pig iron, steel slabs, hot rolled steel, cold rolled steel, galvanized cold rolled sheet
and cold rolled sheet with polymeric coatings. These products are sold both in the Russian
Federation and abroad. The Group also operates in the mining and has relatively insignificant
interests in the financial and seaport segments (Note 22).
The Group’s main operations are in the Lipetsk region of the Russian Federation and are
subject to the legislative requirements of both the Russian Federation and the Lipetsk regional
authorities.
The Group’s primary subsidiaries, located in Lipetsk and other regions of the Russian
Federation, comprise:
■ Mining companies OJSC Stoilensky GOK (acquired in 2004), OJSC StAGDoK and OJSC
Dolomite. The principal activity of these companies is mining and processing of iron-ore
raw concentrate, fluxing limestone and metallurgical dolomite.
■ Transport company OJSC Tuapse Trade Seaport («OJSC TMTP») and its subsidiaries
(acquired in 2004). The principal business activity of OJSC TMTP is cargo loading and
unloading, transshipment of cargo to sea transport and vice versa.
■ Trading companies LLC Trading House NLMK, LLC Stahl, LLC Vimet and LLC Larmet. The
principal activity of the trading companies is the purchase of raw materials for the Group’s
metallurgical production and the sale of metal products.
■ The commercial bank OJSC Lipetskcombank and its subsidiary. The bank possesses a
general banking license issued by the Central Bank of the Russian Federation, a license for
foreign currency operations and a license for brokerage activity. The bank provides
banking services to commercial and retail customers and other Group companies.
■ The insurance company LLC LIS Chance and its subsidiaries. The principal business
activities of these companies are corporate property insurance, voluntary medical
insurance, vehicle insurance and public liability insurance to commercial and retail
customers and other Group companies.

2. BASIS OF PREPARATION
(а) Statement of complianceThe Group maintains its accounting records in accordance with the legislative requirements of
the Russian Federation. The accompanying consolidated financial statements have been
prepared from those accounting records and adjusted as necessary to comply, in all material
respects, with the requirements of accounting principles generally accepted in the United
States of America («US GAAP»).
(b) Functional and reporting currencyThe accounting records of the Group are maintained in Russian rubles and the Parent Company
prepares its statutory financial statements and reports in that currency to its stockholders in
accordance with the laws of the Russian Federation.
The Group’s functional currency is considered to be the Russian ruble. The accompanying
consolidated financial statements have been prepared using the US dollar as the Group’s
reporting currency. The translation into US dollars has been performed in accordance with the
provisions of SFAS No.52, Foreign Currency Translation.
The Russian economy ceased to be considered hyperinflationary as of January 1, 2003. At
January 1, 2003, the monetary and non-monetary assets and liabilities of the Group as well as
the related stockholders’ equity balance were translated into Russian rubles at the current
exchange rate prevailing at January 1, 2003. This translation established a new functional
currency basis for the Group. For periods subsequent to January 1, 2003, the functional
currency of the consolidated financial statements (Russian rubles) are translated into the
reporting currency (US dollars) utilizing period-end exchange rates for assets and liabilities,
period average exchange rates for consolidated income statement accounts and historic rates
for equity accounts in accordance with the relevant provisions of SFAS No.52. As a result of
these translation procedures, a cumulative translation adjustment of ($170,495), $214,649
and $171,472 as at December 31, 2005, 2004 and 2003, respectively, which accounts for such
translation gains and losses, was recorded directly in stockholders’ equity.
The deferred income tax effect of $145,133 resulting from the change in functional
currency was recorded directly in stockholders’ equity as at January 1, 2003.
The Central Bank of the Russian Federation’s closing rates of exchange at December 31,
2005, 2004 and 2003 were 1 US dollar to 28.7825, 27.7487 and 29.4545 Russian rubles,
respectively. The annual weighted average exchange rates were 28.2864, 28.8150 and 30.6877
Russian rubles to 1 US dollar for the years ended December 31, 2005, 2004 and 2003,
respectively.
(c) Consolidation principlesThese consolidated financial statements include all majority-owned and controlled
subsidiaries of the Group. All significant intercompany accounts and transactions have been
eliminated.
106
■ NOTES

107
thousands of US dollars
NLMK • ANNUAL REPORT • 2005
3. SIGNIFICANT ACCOUNTING POLICIES
The following significant accounting policies have been applied in the preparation of the
consolidated financial statements. These accounting policies have been consistently
applied by the Group from one reporting period to another with the exception of newly
adopted accounting pronouncements.
(а) Use of estimatesThe preparation of financial statements in accordance with US GAAP requires management to
make estimates and assumptions that affect the reported amounts of assets and liabilities,
disclosure of contingent assets and liabilities at the date of the financial statements, and
revenue and expenses during the periods reported. Estimates are used when accounting for
certain items such as allowances for doubtful accounts; employee compensation programs;
depreciation and amortization lives; property, plant, and equipment valuation allowances;
asset retirement obligations; legal and tax contingencies; inventory values; valuations of
investments and determining when investment impairments are other than temporary;
goodwill; assets and liabilities assumed in a purchase business combinations and deferred tax
assets, including valuation allowances. Estimates are based on historical experience, where
applicable, and other assumptions that management believes are reasonable under the
circumstances. Actual results may differ from those estimates under different assumptions or
conditions.
(b) Cash and cash equivalentsCash and cash equivalents comprise cash balances, cash on current accounts with banks, bank
deposits and other highly liquid short-term investments with original maturities of less than
three months.
(c) Restricted cashRestricted cash comprise funds legally or contractually restricted as to withdrawal.
(d) Accounts receivableReceivables are stated at cost less an allowance for doubtful debts. Management quantifies
this allowance based on current information regarding the customers’ ability to repay their
obligations. Amounts previously written off which are subsequently collected are recognized
as income.
(e) Value added taxValue added tax related to sales and services rendered is payable to the tax authorities upon the
collection of receivables from customers. Input VAT is reclaimable against sales VAT upon payment
for purchases. VAT related to sales / purchases and services rendered / used which have not been
settled at the balance sheet date (VAT deferred) is recognised in the balance sheet on a gross basis
and disclosed separately as a current asset and liability. Where allowance has been made for
doubtful debts, loss is recorded for the gross amount of the debtor, including VAT.

(f) InventoriesInventories are stated at the lower of acquisition cost inclusive of completion expenses or
market value. Inventories are released to production or written off otherwise at average cost.
In the case of manufactured inventories and work in progress, cost includes an appropriate
share of production overheads.
The provision for obsolescence is calculated on the basis of slow-moving and obsolete
inventories analysis. Such items are provided for in full.
(g) Investments in marketable debt and equity securitiesMarketable debt and equity securities consist of investments in corporate debt and equity
securities where the Group does not exert control or significant influence over the investee.
The Group classifies marketable debt and equity securities using three categories: trading,
held-to-maturity and available-for-sale. The specific identification method is used for
determining the cost basis of all such securities.
Trading securities
Trading securities are bought and held principally for the purpose of selling them in the near
term. Trading securities are carried in the consolidated balance sheet at their fair value.
Unrealized holding gains and losses on trading securities are included in the consolidated
statement of income.
Held-to-maturity securities
Held-to-maturity securities are those securities which the Group has the ability and intent to
hold until maturity. Such securities are recorded at amortized cost.
Premiums and discounts are amortized and recorded in the consolidated statement of
income over the life of the related security held-to-maturity, as an adjustment to yield using
the effective interest method.
Available-for-sale securities
All marketable securities not included in trading or held-to-maturity are classified as
available-for-sale.
Available-for-sale securities are recorded at their fair value. Unrealized holding gains and
losses, net of the related tax effect, are excluded from earnings and reported as a separate
component of accumulated other comprehensive income in the stockholders’ equity until
realized. Realized gains and losses from the sale of available for sale securities, less tax, are
determined on a specific identification basis. Dividend and interest income are recognized
when earned.
(h) Investments in associates and non-marketable securitiesInvestments in associates
Associates are those enterprises in which the Group has significant influence, but not control,
over the financial and operating policies. Investments in associates are accounted for using
the equity method of accounting. The consolidated financial statements include the Group’s
share of the total recognized gains and losses of associates from the date that significant
influence effectively commences until the date that significant influence effectively ceases.
108
■ NOTES

109NLMK • ANNUAL REPORT • 2005
Investments in non-marketable securities
Investments in non-marketable securities where the Group does not exercise control or
significant influence over the investee are carried at cost less provisions for any other than
temporary diminution in value. Provisions are calculated for the investments in companies
which are experiencing significant financial difficulties for which recovery is not expected
within a reasonable period in the future, or under bankruptcy proceedings.
(i) Property, plant and equipmentOwned assets
Items of property, plant and equipment are stated at acquisition cost less accumulated
depreciation and impairment losses (Note 3(k)). The cost of self-constructed assets includes
the cost of materials, direct labor and an appropriate proportion of production overheads.
Property, plant and equipment also includes assets under construction and plant and
equipment awaiting installation.
Where an item of property, plant and equipment comprises major components having
different useful lives, they are accounted for as separate items of property, plant and
equipment.
Leased assets
Leases that meet the definition of capital leases under the requirements of SFAS No.13,
Accounting for Leases, are classified accordingly. Plant and equipment acquired by way of
capital lease are stated at the lower of its fair value or the present value of the minimum lease
payments at inception of the lease, less accumulated depreciation (refer below) and
impairment losses (Note 3(k)).
Subsequent expenditures
Expenditures incurred to replace a component of an item of property, plant and equipment
that is accounted for separately, are capitalized with the carrying amount of the component
subject to depreciation. Other subsequent expenditures are capitalized only when they
increase the future economic benefits embodied in an item of property, plant and equipment.
All other expenditures are recognized as expenses in the consolidated statement of income as
incurred.
Capitalized interest
Interest is capitalized in connection with the construction of major production facilities. The
capitalized interest is recorded as part of the asset to which it relates, and is depreciated over
the asset’s useful life.
Mineral rights
Mineral rights acquired in business combinations are recorded in accordance with provisions of
SFAS No.141, Business Combinations, («SFAS No.141») at their fair values at the date of
acquisition, based on their appraised fair value. The Group reports mineral rights as a separate
component of property, plant and equipment in accordance with the consensus reached by
Emerging Issues Task Force on Issue No.04-2, Whether Mineral Rights Are Tangible or Intangible
Assets.
thousands of US dollars

Depreciation and amortization
Depreciation is charged on a straight-line basis over the estimated useful lives of the individual
assets. Plant and equipment under capital leases and subsequent capitalized expenses are
depreciated on a straight-line basis over the estimated useful life of the individual assets.
Depreciation commences from the time an asset is put into operation. Depreciation is not
charged on assets to be disposed of or land. The range of estimated useful lives is as follows:
Buildings and land and buildings improvements 20-45 years
Machinery and equipment 2- 40 years
Vehicles 5 - 25 years
Mineral rights are amortized using the straight-line basis over the license term given
approximately even production during the period of license.
(j) Goodwill and intangible assetsGoodwill represents the excess of purchase price over the fair value of net assets acquired. The
Group adopted the provisions of SFAS No.142, Goodwill and Other Intangible Assets, («SFAS
No.142») as of January 1, 2002. Under SFAS No.142 goodwill and intangible assets with
indefinite useful lives are subject to impairment test at least annually and on an interim basis
when an event occurs or circumstances change between annual tests that would more-likely-
than-not result in impairment.
Under SFAS No.142, goodwill is assessed for impairment by using the fair value based
method. The group determines fair value by utilizing discounted cash flows. The impairment
test required by SFAS No.142 includes a two-step approach. Under the first step, companies
must compare fair value of a «reporting unit» to its carrying value. A reporting unit is the level
at which goodwill impairment is measured and it is defined as an operating segment or one
level below it if certain conditions are met. If the fair value of the reporting unit is less than its
carrying value, step two is required to determine if goodwill is impaired.
Under step two, the amount of goodwill impairment is measured by the amount, if any, that
the reporting unit’s goodwill carrying value exceeds its «implied» fair value of goodwill. The
implied fair value of goodwill is determined by deducting the fair value of all tangible and
intangible net assets of the reporting unit (both recognized and unrecognized) from the fair
value of the reporting unit (as determined in the first step).
The Group performs the required annual goodwill impairment test at the end of each
calendar year.
The excess of the fair value of net assets acquired over purchase cost is determined as
negative goodwill, and is allocated to the acquired non-current assets, except for deferred taxes,
if any, until they are reduced to zero.
Intangible assets that have limited useful lives are amortized on a straight-line basis over
the shorter of their useful or legal lives.
(k) Impairment of long-lived assetsLong-lived assets, such as property, plant and equipment, mineral rights and purchased
intangibles, are reviewed for impairment whenever events or changes in circumstances
indicate that the carrying amount of an asset may not be recoverable. Recoverability of assets
110
■ NOTES

111NLMK • ANNUAL REPORT • 2005
to be held and used is measured by a comparison of the carrying amount of an asset to the
estimated undiscounted future cash flows expected to be generated by the asset. If the
carrying amount of an asset exceeds its estimated undiscounted future cash flows, an
impairment charge is recognized for the amount by which the carrying amount of the asset
exceeds the fair value of the asset, generally determined by reference to the discounted future
cash flows. Assets held for sale that meet certain criteria are measured at the lower of their
carrying amount or fair value less cost to sell.
(l) Pension and postretirement benefits other than pensionsThe Group follows the Pension and Social Insurance legislation of the Russian Federation, which
requires contributions to the Russian Federation Pension Fund by the employer calculated as a
percentage of current gross salaries. Such contributions are expensed as incurred.
The Parent Company and some other Group companies have an agreement with a non-
Government pension fund (the «Fund») in accordance with which contributions are made on a
monthly basis. Contributions are calculated as a certain fixed percentage of the employees’
salaries. These pension benefits are accumulated in the Fund during the employment period and
distributed by the Fund subsequently. As such, all these benefits are considered as made under
a defined contribution plan and are charged to expense as incurred. Accordingly, the Group has
no long-term commitments to provide funding, guarantees, or other support to the Fund.
In addition, lump sum benefits are paid to employees of a number of the Group’s
companies on retirement depending on the employment period and the salary level of the
individual employee. The scheme is considered as a defined benefit plan. The expected future
obligations to the employees are assessed by the Group’s management and accrued in the
consolidated financial statements, however these are not material.
(m) Asset retirement obligationsThe Group’s land, buildings and equipment are subject to the provisions of SFAS No.143,
Accounting for Asset Retirement Obligations. Based on the current requirements under the laws
of the Russian Federation and various contractual agreements associated with these assets,
the Group has no material commitments related to the retirement of its long-lived assets.
(n) Long-term borrowingsLong-term borrowings are recognized initially at cost. Subsequent to the initial recognition,
long-term borrowings are stated at amortized cost with any difference between cost and
redemption value being recognized in the consolidated statement of income over the period
of the borrowings.
When borrowings are repurchased or settled before maturity, any difference between the
amount received and the carrying amount is recognized immediately in the consolidated
statement of income.
(o) Commitments and contingenciesContingent liabilities, including environmental remediation costs, arising from claims,
assessments, litigation, fines, penalties and other sources are recorded when it is probable that
a liability can be assessed and the amount of the assessment and / or remediation can be
reasonably estimated.
thousands of US dollars

Estimated losses from environmental remediation obligations are generally recognized no later
than completion of remedial feasibility studies. Group companies accrue expenses associated with
environmental remediation obligations when such expenses are probable and reasonably estimable.
Such accruals are adjusted as further information becomes available or circumstances change.
(p) Income taxIncome taxes are accounted for under the asset and liability method. Deferred tax assets and
liabilities are recognized for the future tax consequences attributable to temporary
differences between the financial statement carrying amounts of existing assets and liabilities
and their respective tax bases and operating loss and tax credit carryforwards. Deferred tax
assets and liabilities are measured using enacted tax rates expected to be applied to taxable
income in the years in which those temporary differences are expected to be recovered or
settled. The effect on deferred tax assets and liabilities of a change in tax rates is recognized
in income in the period when a different tax rate is enacted.
Pursuant to the provisions of SFAS No.109, Accounting For Income Taxes, the Group
provides valuation allowances for deferred tax assets for which it does not consider realization
of such assets to be more likely than not.
The deferred tax effect associated with the temporary differences that arose from the
change in the functional currency of the Group (from the US dollar to the Russian ruble) when
Russia ceased to be considered highly inflationary on January 1, 2003, was reflected as an
adjustment to the cumulative translation adjustment component of accumulated other
comprehensive income on January 1, 2003.
(q) DividendsDividends are recognized as a liability in the period in which they are declared.
(r) Revenue recognitionGoods sold
Revenue from the sale of goods is recognized in the consolidated statement of income when
there is a firm arrangement, the price is fixed and determinable, delivery has occurred, and
collectibility is reasonably assured.
Interest income
Interest income is recognized in the consolidated statement of income as it is earned.
(s) ExpensesOperating lease payments
Operating leases are recognized as an expense in the consolidated statement of income as
incurred.
Interest expense
All interest and other costs incurred in connection with borrowings are expensed as incurred
as part of interest expense, except for interest which is incurred on construction projects and
capitalized (Note 3(i)).
112
■ NOTES

(t) Non-cash transactionsNon-cash settlements represent offset transactions between customers and suppliers, when
exchange equivalent is defined and goods are shipped between the parties without exchange
of cash.
The related sales and purchases are recorded in the same manner as cash transactions. The
fair market value for such transactions is based on the value of similar transactions in which
monetary consideration is exchanged with a third party.
Purchases of property, plant and equipment under capital lease arrangements are also
recognized as non-cash transactions.
(u) Recent accounting pronouncementsIn March 2005, the FASB issued Interpretation No.47, Accounting for Conditional Asset
Retirement Obligations. The interpretation requires entities to record a liability for the fair
value of a conditional asset retirement obligation if the fair value of the liability can be
reasonably estimated. The term «conditional asset retirement obligation»refers to a legal
obligation to perform an asset retirement activity in which the timing and (or) method of
settlement are conditional on a future event that may or may not be within the control of the
entity. The interpretation shall be effective no later than December 31, 2005 and early
adoption is encouraged. The adoption of this interpretation in 2005 did not have a material
impact on its consolidated financial statements.
In May 2005, the FASB issued Statement of Financial Accounting Standards No.154,
Accounting Changes and Error Corrections, («SFAS No.154») which replaces APB Opinion No.20,
Accounting Changes, and FASB Statement No.3, Reporting Accounting Changes in Interim
Financial Statements. This Statement provides guidance on the accounting for and reporting
of accounting changes and error corrections. It establishes, unless impracticable,
retrospective application as the required method for reporting a change in accounting
principle in the absence of explicit transition requirements specific to the newly adopted
accounting principle. The Statement shall be effective for accounting changes made in fiscal
years beginning after December 15, 2005. The impact of SFAS No.154 will depend on the
accounting change, if any, in a future period.
(v) Segment reportingAccording to SFAS No.131, Disclosures about Segments of an Enterprise and Related
Information, segment reporting follows the internal organizational and reporting structure of
the Group. The Group’s organization comprises two reportable segments:
■ Steel segment, comprising production and sales of steel products, primarily pig iron, steel
slabs, hot rolled steel, cold rolled steel, galvanized cold rolled sheet and cold rolled sheet
with polymeric coatings,
■ Mining segment, comprising mining, processing and sales of iron ore, fluxing limestone
and metallurgical dolomite, which supplies raw materials to the steel segment and third
parties,
■ and other segments, not reported separately in the consolidated financial statements.
The accounting policies of the segments are the same as those described in the summary
of significant accounting policies.
113NLMK • ANNUAL REPORT • 2005
thousands of US dollars
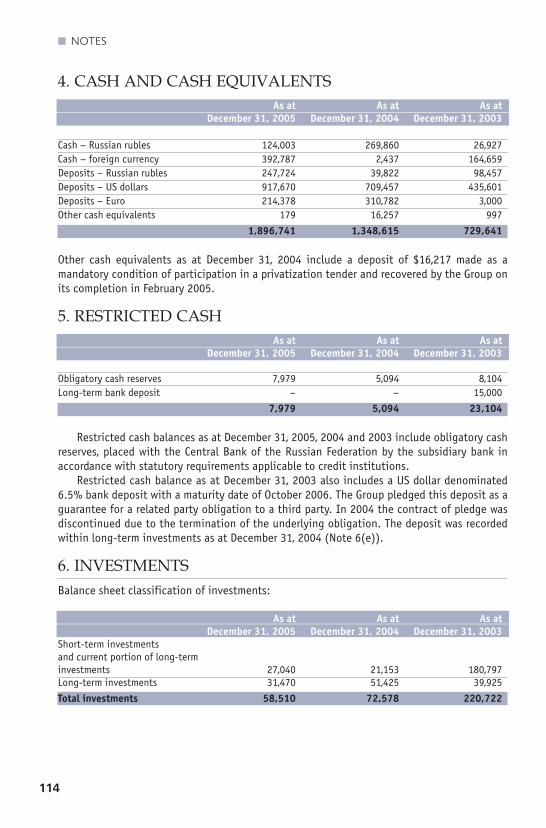
4. CASH AND CASH EQUIVALENTSAs at As at As at
December 31, 2005 December 31, 2004 December 31, 2003
Cash – Russian rubles 124,003 269,860 26,927
Cash – foreign currency 392,787 2,437 164,659
Deposits – Russian rubles 247,724 39,822 98,457
Deposits – US dollars 917,670 709,457 435,601
Deposits – Euro 214,378 310,782 3,000
Other cash equivalents 179 16,257 997
1,896,741 1,348,615 729,641
Other cash equivalents as at December 31, 2004 include a deposit of $16,217 made as a
mandatory condition of participation in a privatization tender and recovered by the Group on
its completion in February 2005.
5. RESTRICTED CASHAs at As at As at
December 31, 2005 December 31, 2004 December 31, 2003
Obligatory cash reserves 7,979 5,094 8,104
Long-term bank deposit – – 15,000
7,979 5,094 23,104
Restricted cash balances as at December 31, 2005, 2004 and 2003 include obligatory cash
reserves, placed with the Central Bank of the Russian Federation by the subsidiary bank in
accordance with statutory requirements applicable to credit institutions.
Restricted cash balance as at December 31, 2003 also includes a US dollar denominated
6.5% bank deposit with a maturity date of October 2006. The Group pledged this deposit as a
guarantee for a related party obligation to a third party. In 2004 the contract of pledge was
discontinued due to the termination of the underlying obligation. The deposit was recorded
within long-term investments as at December 31, 2004 (Note 6(e)).
6. INVESTMENTSBalance sheet classification of investments:
As at As at As at
December 31, 2005 December 31, 2004 December 31, 2003
Short-term investments
and current portion of long-term
investments 27,040 21,153 180,797
Long-term investments 31,470 51,425 39,925
Total investments 58,510 72,578 220,722
114
■ NOTES

115NLMK • ANNUAL REPORT • 2005
(a) Trading securitiesAs at As at As at
December 31, 2005 December 31, 2004 December 31, 2003
Investments in shares 3,990 – 158,280
Corporate bonds 7,971 – 3,378
Eurobonds 7,759 – 9,630
Government bonds 6,401 – –
Other 919 1,469 1,146
27,040 1,469 172,434
Investments in shares are represented by the securities of companies which are listed on
the Russian Trade System. These shares and bonds are held by the Group’s subsidiary bank
The income generated from trading securities for the years ended December 31, 2005, 2004
and 2003 amounts to $439, $162,874 and $8,436, respectively. The Group’s future return on
such investments is affected by the operating environment of the Group (Note 23(a)).
(b) Available-for-sale securitiesAs at As at As at
December 31, 2005 December 31, 2004 December 31, 2003
Russian government and other
bonds with annual coupon rates
ranging from 3% to 9.4%
Acquisition cost 590 2,216 905
Gross unrealized gains / (losses) (31) 1,784 1,718
Deposit certificates
with interest rates ranging
from 5.2% p.a. to 20% p.a. – 35,817 29,304
Fair value 559 39,817 31,927
The maturities of debt securities classified as available-for-sale as at December 31, 2005,
2004 and 2003 are presented below.
As at As at As at
December 31, 2005 December 31, 2004 December 31, 2003
Due within one year – 19,684 8,363
Due in one to five years 559 18,619 20,898
Due after five years – 1,514 2,666
559 39,817 31,927
Russian Government bonds with a face value $2,908 and $2,908 as at December 31, 2004
and 2003, respectively, are pledged to secure the redemption of the Parent Company’s
promissory notes issued in 2000.
thousands of US dollars

116
(c) Investments in associatesAs at December 31, As at December 31,
2005 Ownership 2004 Ownership
CJSC Korpus – –
CJSC Stalconverst – –
OJSC AKB Lipetskcredit – –
OJSC Avron – –
OJSC Lipetsky Gipromez 43.44% 43.44%
OJSC Combinat KMAruda 32.89% –
Provision for other than temporary diminution in value
During the year ended December 31, 2005 the Group sold 18% share in OJSC Combinat KMAruda
(d) Non-marketable securitiesNon-marketable securities, As at December 31, As at December 31,
net of current portion: 2005 Ownership 2004 Ownership
OJSC Lebedinsky GOK 11.96% 11.96%
OJSC Yakovlevsky rudnik – –
OJSC Lipetskenergo 14.11% 14.11%
OJSC Lipetsk power generating company 14.11% –
OJSC Lipetsk energy management company 14.11% –
OJSC Lipetsk energy sales company 14.11% –
OJSC Lipetsk mains systems 14.11% –
OJSC Lipetskoblgaz 19.40% 19.40%
OJSC Almetievsky Pipe Plant – –
OJSC Moscow Pipe Plant Filit – –
Other
Provision for other than temporary diminution in value
■ NOTES

117NLMK • ANNUAL REPORT • 2005
As at December 31, As at December 31, As at December 31, As at December 31,
2003 Ownership 2005 2004 2003
40.00% – – 3,232
36.80% – – 2,130
22.19% – – 1,116
26.70% – – 406
43.44% 8 8 8
– 16,034 – –
16,042 8 6,892
– – (3,652)
16,042 8 3,240
to a third party for $1,966, thereby reducing its stake to 32.89%.
As at December 31, As at December 31, As at December 31, As at December 31,
2003 Ownership 2005 2004 2003
11.96% 9 456 9,808 9,240
9.48% – – 5,797
12.21% 148 3,388 2,268
– 2,719 – –
– 0.2 – –
– 33 – –
– 366 – –
19.40% 712 738 695
14.53% – – 557
12.00% – – 423
788 1,686 708
14,222 15,620 19,688
(353) (336) (6,567)13,869 15,284 13,121
thousands of US dollars
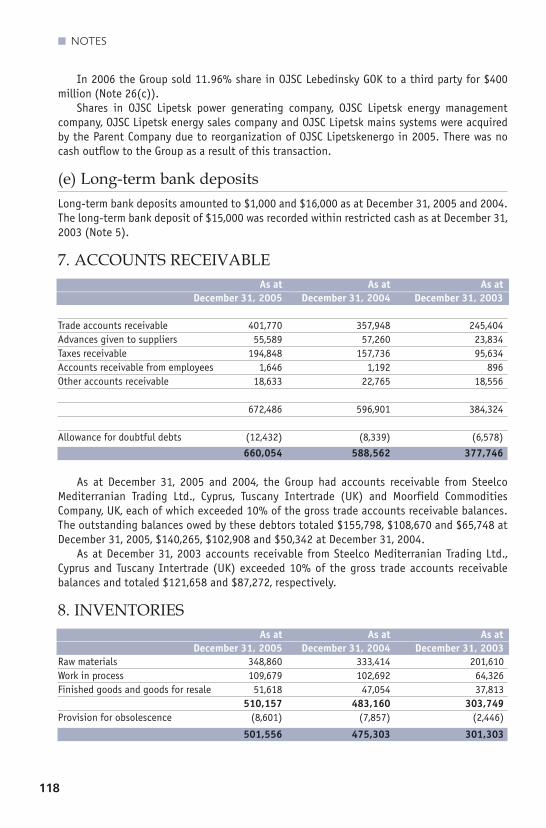
In 2006 the Group sold 11.96% share in OJSC Lebedinsky GOK to a third party for $400
million (Note 26(c)).
Shares in OJSC Lipetsk power generating company, OJSC Lipetsk energy management
company, OJSC Lipetsk energy sales company and OJSC Lipetsk mains systems were acquired
by the Parent Company due to reorganization of OJSC Lipetskenergo in 2005. There was no
cash outflow to the Group as a result of this transaction.
(e) Long-term bank depositsLong-term bank deposits amounted to $1,000 and $16,000 as at December 31, 2005 and 2004.
The long-term bank deposit of $15,000 was recorded within restricted cash as at December 31,
2003 (Note 5).
7. ACCOUNTS RECEIVABLEAs at As at As at
December 31, 2005 December 31, 2004 December 31, 2003
Trade accounts receivable 401,770 357,948 245,404
Advances given to suppliers 55,589 57,260 23,834
Taxes receivable 194,848 157,736 95,634
Accounts receivable from employees 1,646 1,192 896
Other accounts receivable 18,633 22,765 18,556
672,486 596,901 384,324
Allowance for doubtful debts (12,432) (8,339) (6,578)
660,054 588,562 377,746
As at December 31, 2005 and 2004, the Group had accounts receivable from Steelco
Mediterranian Trading Ltd., Cyprus, Tuscany Intertrade (UK) and Moorfield Commodities
Company, UK, each of which exceeded 10% of the gross trade accounts receivable balances.
The outstanding balances owed by these debtors totaled $155,798, $108,670 and $65,748 at
December 31, 2005, $140,265, $102,908 and $50,342 at December 31, 2004.
As at December 31, 2003 accounts receivable from Steelco Mediterranian Trading Ltd.,
Cyprus and Tuscany Intertrade (UK) exceeded 10% of the gross trade accounts receivable
balances and totaled $121,658 and $87,272, respectively.
8. INVENTORIESAs at As at As at
December 31, 2005 December 31, 2004 December 31, 2003
Raw materials 348,860 333,414 201,610
Work in process 109,679 102,692 64,326
Finished goods and goods for resale 51,618 47,054 37,813
510,157 483,160 303,749
Provision for obsolescence (8,601) (7,857) (2,446)
501,556 475,303 301,303
118
■ NOTES

119NLMK • ANNUAL REPORT • 2005
9. OTHER CURRENT AND NON-CURRENT ASSETSAs at As at As at
December 31, 2005 December 31, 2004 December 31, 2003
Other current assets
Short-term loans provided
by the subsidiary bank 163,055 131,267 53,904
Other current assets 51,875 20,047 12,781
214,930 151,314 66,685
Allowance for doubtful loans (6,010) (2,566) (3,349)
Total other current assets 208,920 148,748 63,336
Other non-current assets
Long-term loans provided
by the subsidiary bank 71,138 37,500 21,851
Other non-current assets 62,609 30,484 14,983
Total other non-current assets 133,747 67,984 36,834
Weighted average interest rates on loans, provided to companies (including other banks)
and individuals in 2005 by the subsidiary bank of the Group were 10.7% p.a. for loans
denominated in Russian rubles and 12.7% p.a. for foreign currency loans.
10. PROPERTY, PLANT AND EQUIPMENTAs at As at As at
December 31, 2005 December 31, 2004 December 31, 2003
Land 55,575 46,466 35,442
Mineral rights 522,802 500,996 –
Buildings 708,004 715,759 550,005
Land and buildings improvements 757,066 798,892 686,332
Machinery and equipment 4,234,424 4,320,088 3,831,976
Vehicles 219,431 205,297 105,027
Construction in progress and advances
for construction and acquisition 465,425 254,271 270,574
of property, plant and equipment
Leased assets – 862 21,819
Other 37,229 38,787 7,011
6,999,956 6,881,418 5,508,186
Accumulated depreciation (4,606,407) (4,623,790) (4,175,607)
Net book value 2,393,549 2,257,628 1,332,579
According to US GAAP, the Group’s property, plant and equipment should be reported at
their actual historical depreciated cost. However, due to the absence of reliable US GAAP
accounting records and impairment calculations, the book value of certain property, plant and
equipment was determined with the assistance of an independent appraiser, which
management considers provided the best basis for the recognition and depreciation of such
items. The appraiser provided US dollar estimates of the fair value, determined on the basis of
depreciated replacement cost, which the Group has recorded as its property, plant and
thousands of US dollars

120
equipment balance as of January 1, 2000. As at December 31, 2005, 2004 and 2003, the net
book value of these items amounted to 21%, 28% and 49% of total net book value of property,
plant and equipment, respectively.
In August 2005, the Group acquired a license for exploration and mining of Zhernovsky
coal deposit, expiring in 2025. The carrying value of this license as at December 31, 2005 is
$38,272.
The remaining part of mineral rights was acquired by Group in 2004 through a business
combination (Note 21). They expire January 1, 2016 and management believes that they will
be extended at the initiative of the Group.
11. GOODWILL AND OTHER INTANGIBLE ASSETS
(а) GoodwillGoodwill
Balance as at January 1, 2004 –
Acquired in new subsidiaries (Note 21) 173,677
Cumulative translation adjustment (Note 2(b)) 6,138
Balance as at December 31, 2004 179,815
Cumulative translation adjustment (Note 2(b)) (6,458)
Balance as at December 31, 2005 173,357
Goodwill arising on acquisitions was allocated to the appropriate business segment in which
each acquisition took place. Goodwill arising from the acquisition of a controlling interest in
OJSC Stoilensky GOK amounted to $95,501 was allocated to the mining segment. Goodwill
related to the acquisition of OJSC TMTP and its subsidiaries of $78,176 was allocated to other
non-reportable segments (Note 21).
Negative goodwill of $110,837 generated on acquisitions of minority interest in OJSC
Stoilensky GOK was allocated to the acquired assets other than current assets in accordance
with SFAS No.141.
The Group performed a test for impairment of goodwill at December 31, 2005 and 2004
which indicated no impairments at such dates.
■ NOTES

121NLMK • ANNUAL REPORT • 2005
(b) Other intangible assetsTotal useful life, Gross book Gross book
months value as at value as at
December 31, 2005 December 31, 2004
Customers relationships
OJSC TMTP (oil) 66 10,865 11,270
Customers relationships
OJSC TMTP (dry cargo) 66 12,036 12,484
22,901 23,754
Accumulated amortization (6,246) (2,160)
Total intangible assets 16,655 21,594
The intangible assets were acquired in a business combination (Note 21) and met the
criteria for separate recognition outlined in SFAS No.141. They were recorded under provisions
of SFAS No.141 at fair values at the date of acquisition, based on their appraisal.
Amortization expense
Aggregate amortization expense
For the year ended December 31, 2005 (4,087)
Estimated amortization expense
For the year ended December 31, 2006 (4,164)
For the year ended December 31, 2007 (4,164)
For the year ended December 31, 2008 (4,164)
For the year ended December 31, 2009 (4,164)
12. ACCOUNTS PAYABLEAND OTHER LIABILITIES
As at As at As at
December 31, 2005 December 31, 2004 December 31, 2003
Trade accounts payable 90,637 78,651 65,606
Advances received 130,347 127,776 81,447
Customers’ deposits
and accounts in the subsidiary bank 188,265 156,176 55,704
Taxes payable other than income tax 18,209 19,044 6,166
Accounts payable and
accrued liabilities to employees 55,945 51,628 33,356
Dividends payable 2,572 6,332 –
Notes payable 5,282 5,312 2,803
Other accounts payable 16,380 10,123 6,605
507,637 455,042 251,687
thousands of US dollars

122
13. OTHER LONG-TERM LIABILITIESAs at As at As at
December 31, 2005 December 31, 2004 December 31, 2003
Customers’ deposits in the subsidiary bank 45,377 16,150 4,855
Notes payable 16,298 3,796 1,738
61,675 19,946 6,593
14. MINORITY INTERESTBalance as at December 31, 2002 12,891
Minority’s share in subsidiaries’ income from continuing operations 2,243
Issuance of additional stock by subsidiaries to minority stockholders 388
Cumulative translation adjustment (Note 2(b)) 1,130
Balance as at December 31, 2003 16,652
Minority’s share in subsidiaries’ income from continuing operations 19,280
Acquisitions of new subsidiaries (Note 21) 49,147
Purchase of the minority interest in existing subsidiaries (2,289)
Cumulative translation adjustment (Note 2(b)) 2,997
Balance as at December 31, 2004 85,787
Minority’s share in subsidiaries’ income from continuing operations 28,925
Disposal of a stake in a non-wholly owned subsidiary (Note 6(c)) (19,147)
Cumulative translation adjustment (Note 2(b)) (2,989)
Balance as at December 31, 2005 92,576
15. STOCKHOLDERS’ EQUITY
(a) StockIn May 2004, the Parent Company made a stock split through an additional issue of
5,987,240,000 common stock with a par value of 1 Russian ruble each. These shares were
distributed to all existing shareholders of the Parent Company in proportion to their interest
held at the date of additional shares distribution. Shareholders are eligible for 1,000
additional shares per share held. In accordance with legal requirements the stock split was
followed by a transfer from cumulative retained earnings to capital stock at par value totaling
to $206,733.
As at December 31, 2005, 2004 and 2003, the Parent Company’s share capital consisted of
5,993,227,240, 5,993,227,240 and 5,987,240 issued common shares (5,993,227,240 at all the
dates given the retrospective effect of the stock split), respectively, with a par value of 1
Russian ruble each. For each common share held, the stockholder has the right to one vote at
the annual stockholders’ meeting.
In August 2004 the Group increased the statutory reserve of the Parent Company up to the
amount of $10,267 following the change in common stock value.
(b) DividendsDividends are paid on common stock at the recommendation of the Board of Directors and
approval at the annual Stockholders’ Meeting, subject to certain limitations as determined by
■ NOTES

Russian legislation. Profits available for distribution to stockholders in respect of any
reporting period are determined by reference to the statutory financial statements of the
Parent Company. At December 31, 2005, 2004 and 2003 the retained earnings of the Parent
Company, in accordance with the legislative requirements of the Russian Federation, available
for distribution amounted to $4,137,791, $3,411,114 and $1,855,959, respectively, converted
into US dollars using exchange rates at December 31, 2005, 2004 and 2003, respectively.
The dividend policy, which was approved by a General Shareholders’ Meeting on June 25,
2004, provides for a minimum annual dividend payment of at least 15% of annual net income
and sets an objective of making dividend payments of 25% of annual net income, as
determined in accordance with US GAAP.
In May 2005 the Parent Company declared dividends for the year ended December 31, 2004
of 1.8 Russian ruble per share for the total of $385,556, including interim dividends for the
nine months ended September 30, 2004 of 1 Russian ruble per share ($214,081). In September
2005 the Parent Company declared interim dividends for the six months ended June 30, 2005
of 1 Russian ruble per share for the total of $210,792. Dividends payable amount to $2,572 at
December 31, 2005 (Note 12).
In 2004 and 2003 the Parent Company declared dividends of 0.6 and 312.5 Russian rubles
per share based on the results of 2003 and 2002, respectively, for a total of $124,834 and
$61,675.
At the dates dividends were declared, owners of 5,993,227,240 shares were eligible to
receive dividends for all periods mentioned, except the results of year 2002, where owners of
5,987,240 shares were eligible (Note 15(a)).
16. INCOME TAXFor the year For the year For the year
December 31, December 31, December 31,
2005 2004 2003
Current tax expense 495,521 608,166 236,533
Deferred tax (benefit) / expense:
origination and reversal of temporary differences 162 (35,945) (13,498)
Total income tax expense 495,683 572,221 223,035
The corporate income tax rate in Russia applicable to the Group was 24% in 2005, 2004 and
2003.
123NLMK • ANNUAL REPORT • 2005
thousands of US dollars

124
Income before income tax is reconciled to the income tax expense as follows:
For the year For the year For the year
December 31, December 31, December 31,
2005 2004 2003
Income before tax 1,876,063 2,364,002 881,734
Income tax at applicable tax rate 450,255 567,360 211,616
Increase in income tax resulting from:
non-deductible expenses 45,428 4,861 11,419
Total income tax expense 495,683 572,221 223,035
The tax effects of temporary differences that give rise to the deferred tax assets and
deferred tax liabilities are presented below:
As at As at As at
December 31, 2005 December 31, 2004 December 31, 2003
Deferred tax assets
Accounts payable and other liabilities 8,486 6,948 8,659
Non-current liabilities 88 222 2,455
Accounts receivable 1,066 1,129 1,572
Other 381 – –
Allowance – (28) –
10,021 8,271 12,686
Deferred tax liabilities
Property, plant and equipment (272,202) (302,529) (160,021)
Intangible assets (4,156) (5,183) –
Inventories (12,906) (6,031) (11,145)
Other (15,094) – (1,236)
(304,358) (313,743) (172,402)
Total deferred tax liability (294,337) (305,472) (159,716)
An allowance for deferred tax assets is recognized in respect of the temporary differences,
where it is not probable that future taxable profit will be available and therefore realization of
these tax assets is doubtful.
The deferred tax effect of establishing a new functional currency basis at January 1, 2003
(Note 2(b)) was recorded within the cumulative translation adjustment directly in other
comprehensive income within stockholders’ equity.
At December 31, 2005, $130,253 (December 31, 2004: $155,663) of the deferred tax
liability on property, plant and equipment relate to differences between the US GAAP and tax
carrying values of property, plant and equipment of the acquired subsidiaries. As noted in Note
21(c), the US GAAP carrying value was recorded at fair value on acquisition.
■ NOTES

125NLMK • ANNUAL REPORT • 2005
17. EARNINGS PER SHAREYear ended Year ended Year ended
December 31, December 31, December 31,
2005 2004 2003
Average number of shares
before restatement 5,993,227,240 3,948,404,836 5,987,240
after restatement 5,993,227,240 5,993,227,240 5,993,227,240
Net income (thousands of US dollars) 1,385,336 1,772,501 656,456
Basic and diluted net income per share (US dollars) 0.2312 0.2958 0.1095
Basic net income per share of common stock is calculated by dividing net income by the
weighted average number of shares of common stock outstanding during the reporting period,
after giving retroactive effect to any stock splits.
In May 2004, the Parent Company made a stock split through an additional issue of
5,987,240,000 common stock with a par value of 1 Russian ruble each (Note 15(a)). Earnings
per share data for 2004 and 2003 have been restated to reflect this share distribution.
The average shares outstanding for purposes of basic and diluted earnings per share
information were 5,993,227,240 for the years ended December 31, 2005, 2004 and 2003.
The Parent Company does not have potentially dilutive shares outstanding.
18. NON-CASH TRANSACTIONS
Approximately $7,300, $4,400 and $3,000 of the Group’s 2005, 2004 and 2003 revenues,
respectively, were settled in the form of mutual offset against the liability to pay for raw
materials supplied.
Prices for goods sold and purchased through non-cash settlement arrangements are fixed
in the respective contracts and generally reflect current market prices.
In 2004 and 2003, the Group acquired equipment and vehicles under capital lease
arrangements with the right to buy out leased assets upon completion of the underlying
agreements. The amount of capital lease liabilities incurred during the years ended December
31, 2004 and 2003, was $19,920 and $17,059, respectively. In 2004 the majority of capital lease
liabilities were settled (Note 20).
In 2004 the Group acquired assets and liabilities as a result of acquisitions of new
subsidiaries (Note 21).
thousands of US dollars

126
19. FAIR VALUE OF FINANCIAL INSTRUMENTS
The fair value of a financial instrument is the amount at which the instrument could be
exchanged in a current transaction between willing parties.
Management believes, that the carrying amounts of financial assets and liabilities
approximate to a reasonable estimate of their fair value.
The fair values of available-for-sale securities are based on quoted market prices for these
or similar instruments.
20. CAPITAL AND OPERATIONAL LEASES
At December 31, 2004 and 2003, net book value of the machinery, equipment and vehicles held
under the capital lease arrangements with a related party was:
As at As at As at
December 31, 2005 December 31, 2004 December 31, 2003
Machinery and equipment – 198 4,620
Vehicles – 664 17,199
– 862 21,819
Accumulated depreciation – (87) (1,067)
Net value of property, plant and equipment obtained under capital lease arrangements – 775 20,752
In September 2004, the Group cancelled the majority of its capital lease arrangements and
bought out leased assets. The capital lease liability in the amount of $30,625 at the date of
cancellation was settled. The difference of $6,656 between the carrying amount of the capital
lease liability settled and purchase price was accounted as an adjustment of the carrying value
of the assets.
The discount rates used for the calculation of the present value of net minimum lease
payments was 14%. Capital lease charges of $3,155 and $3,405 were recorded in the
consolidated statements of income for the years ended December 31, 2004 and 2003,
respectively.
The Group incurred expenses in respect of operational leases of $7,347, $6,595 and $5,584
in 2005, 2004 and 2003, respectively.
21. BUSINESS COMBINATIONS
(а) OJSC Stoilensky GOKIn March 2004 the companies under common control of the controlling shareholders of the
Parent Company («the Companies under common control») transferred to the Parent Company
59.8% and in November 2004 – 31.1% of the outstanding common shares of OJSC Stoilensky
GOK. In these consolidated financial statements, the Group accounted for these transfers
retrospectively, in a manner similar to pooling by reflecting the controlling shareholders’ book
value of their acquisition cost in such transfers of $598,735 as capital contributions. The
Group transferred cash consideration to such control parties of $636,453 which is reflected as
■ NOTES

127NLMK • ANNUAL REPORT • 2005
distributions to controlling shareholders.
A part of the primary acquisition cost in the amount of $60,761 represents transaction
related fees paid for by the Companies under common control. The acquisition agreements
contain no material future contingent payments or commitments. The acquisitions resulted in
the Group’s ownership of 91.4% of the voting shares of the company. Prior to March 2004 the
Group’s 0.5% interest in OJSC Stoilensky GOK was accounted for at cost.
This transaction was consummated to acquire one of the largest iron-ore concentrate and
agglomerated ore producers in Russia in order to secure long-term supplies of raw materials
for the Group.
The acquisition of OJSC Stoilensky GOK by the control party was accounted for using the
purchase method of accounting. The entity was consolidated by the Group for the first time as
at the effective date of obtaining control by the control party which management considers to
be March 31, 2004. The results of operations of the acquired entity were included in the
consolidated statement of income starting from April 1, 2004.
In October and November 2004 the Group acquired, at an auction for sale of a state-owned
shareholding and from other minority shareholders, an additional 5.6% of the common stock
of OJSC Stoilensky GOK for a consideration of $22,793 paid in cash.
The Group generated positive goodwill of $95,501 on acquisition of the controlling stock
(59.8%) and negative goodwill $110,837 on subsequent acquisitions. Negative goodwill was
allocated to the acquired assets other than current assets in accordance with SFAS No.141.
(b) OJSC TMTPIn June 2004 the Group acquired 69.4% of the common stock of OJSC TMTP for a consideration
of $189,172 paid in cash to unrelated parties. The Group also obtained control over its
subsidiaries OJSC Tuapse Dockyard, OJSC Tuapsegrazhdanstroi, LLC Nafta-T and LLC Karavella.
The agreement contains no future contingent payments or commitments.
This transaction was consummated to provide smooth transportation of the Group’s
products within the respective area of export sales.
The acquisition of OJSC TMTP and its subsidiaries was accounted for using the purchase
method of accounting. OJSC TMTP and its subsidiaries were consolidated for the first time as
of the effective date of obtaining control which management considers to be June 30, 2004.
The results of operations of the acquired entities were included in the consolidated statement
of income starting from July 1, 2004.
thousands of US dollars

128
(c) Fair values of the assets acquired and liabilities assumed
The following table summarizes the fair values of the assets acquired and liabilities assumed
in the business combinations, determined in accordance with SFAS No.141 provisions. The fair
values of property, plant and equipment, including mineral extraction rights, and intangible
assets were established by independent appraisers:
OJSC OJSC Total
Stoilensky TMTP and acquisitions
GOK its subsidiaries
Current assets 29,197 56,270 85,467
Mineral rights 486,880 – 486,880
Other property, plant and equipment 223,307 95,545 318,852
Intangible assets – 22,712 22,712
Other non-current assets 616 1,000 1,616
Goodwill (Note 11(a)) 95,501 78,176 173,677
Total assets acquired 835,501 253,703 1,089,204
Current liabilities (49,577) (5,969) (55,546)
Non-current liabilities (4,139) (1,208) (5,347)
Deferred income tax liability (154,280) (14,184) (168,464)
Total liabilities assumed (207,996) (21,361) (229,357)
Minority interest (5,977) (43,170) (49,147)
Fair value of net assets acquired 621,528 189,172 810,700
Less: cash acquired (1,070) (38,109) (39,179)
Fair value of net assets acquired,
net of cash acquired 620,458 151,063 771,521
Transfers of subsidiary interests
from common control parties reflected
as capital contribution,
net of cash received of $1,070 597,665 – 597,665
Fair value of net assets
acquired from third parties,
net of cash acquired of $38,109
at OJSC TMTP and its subsidiaries 22,793 151,063 173,856
Fair value of net assets acquired,
net of cash acquired 620,458 151,063 771,521
The transfers of subsidiary interests were recorded in the statement of stockholders’ equity
as capital contributions of $598,735, comprising $597,665 of non-cash contributions and
$1,070 of cash owned by the subsidiary at the dates of contributions. The payments to the
common control parties for the transfer of the shares in OJSC Stoilensky GOK of $636,453 were
recorded as a reduction in stockholders’ equity.
■ NOTES

129NLMK • ANNUAL REPORT • 2005
(d) Other acquisitionsIn 2004 the Group made a number of immaterial acquisitions of stock in other Group’s
subsidiaries and an immaterial acquisition of the controlling stock in LLC Independent
Transport Company from related parties for the total consideration of $2,617 (Note 24).
(e) Pro forma financial statementsThe following unaudited pro forma statements of income are presented relating to the
acquisitions by the Group of OJSC Stoilensky GOK and OJSC TMTP and its subsidiaries (together
– «TMTP Group») in the transactions accounted for as purchases. The unaudited pro forma
statements of income are based on the consolidated statements of income of the Group and
TMTP Group and individual statements of income of OJSC Stoilensky GOK.
The unaudited pro forma statements of income combine the results of operations of the
Group, OJSC Stoilensky GOK (acquired by the Group as of March 31, 2004) and TMTP Group
(acquired by the Group as of June 30, 2004) for the years ended December 31, 2004 and 2003
as if the acquisitions occurred on January 1, 2004 and 2003, respectively. These unaudited pro
forma statements of income should be read in conjunction with the consolidated financial
statements of the Group.
Unaudited proforma income statement data for the year ended December 31, 2004 and
2003 are as follows:
For the year For the year
December 31, December 31,
2004 2003
Sales revenue 4,620,124 2,720,714
Operating income 2,217,107 841,781
Income before income tax and minority interest 2,354,558 815,623
Income before minority interest 1,781,686 605,035
Net income 1,760,792 602,621
Net income per share (US dollars) 0.2938 0.1006
The above statements give effect to the following pro forma adjustments necessary to
reflect the acquisitions:
(a) A depreciation charge and respective deferred tax effect for the periods preceding
business combinations was calculated on the basis of appraised fair value of property and
equipment, including mineral rights, acquired in new subsidiaries.
(b) An amortization charge and respective deferred tax effect for the periods preceding
business combination was calculated on the basis of appraised fair value of intangible assets
identified and separated from goodwill in the process of TMTP Group’s purchase price
allocation.
(c) Minority interest in net income of acquired subsidiaries for the periods preceding
business combinations was calculated on the basis of interest owned by the Group at
December 31, 2004.
The unaudited proforma amounts are provided for informational purposes only and do not
purport to present the results of operations of the Group had the transactions assumed therein
occurred on or as of the date indicated, nor is it necessarily indicative of the results of
operations which may be achieved in the future.
thousands of US dollars

130
22. SEGMENTAL INFORMATION
The Group has two reportable business segments: steel and mining. These segments are
combinations of subsidiaries, have separate management teams and offer different products
and services. The above two segments meet criteria for reportable segments. Subsidiaries are
consolidated by the segment to which they belong based on their products and management.
Revenue from segments that does not exceed the quantitative thresholds is primarily
Steel Mining
Revenue from external customers 4,174,715 119,496
Intersegment revenue 4,402 460,579
Depreciation and amortization (197,110) (69,354)
Gross profit 1,667,880 318,227
Operating income 1,518,890 290,904
Interest income 58,741 10,736
Interest expense (1) (28)
Income tax (394,344) (68,093)
Income before minority interest 1,165,120 224,778
Segment assets, including goodwill 4,422,873 1,071,717
Capital expenditures (492,984) (67,467)
Segmental information for the year ended December 31, 2005 is as follows:
■ NOTES
Steel Mining
Revenue from external customers 4,399,606 74,965
Intersegment revenue 3,365 337,344
Depreciation and amortization (174,646) (59,972)
Gross profit 2,182,293 207,805
Operating income 2,037,325 186,105
Interest income 31,110 2,382
Interest expense (3,326) (443)
Income tax (530,694) (40,818)
Income before minority interest 1,639,276 140,813
Segment assets, including goodwill 3,767,196 984,495
Capital expenditures (219,673) (44,541)
Segmental information for the year ended December 31, 2004 is as follows:

131NLMK • ANNUAL REPORT • 2005
attributable to the two operating segments of the Group. Those segments include the trade
seaport services business, represented by OJSC TMTP and its subsidiaries, and finance business,
comprising banking and insurance services to commercial and retail customers. None of these
segments has met any of the quantitative thresholds for determining reportable segments.
The Group accounts for intersegmental sales and transfers as if the sales or transfers were
to third parties.
The Group’s management evaluates performance of the segments based on segment
revenues, gross profit, operating income and income before minority interest.
All other Totals Intersegmental operations Consolidated
and balances
174,515 4,468,726 – 4,468,726
5,154 470,135 (470,135) –
(17,158) (283,622) – (283,622)
65,939 2,052,046 14,947 2,066,993
39,712 1,849,506 10,533 1,860,039
30,249 99,726 (854) 98,872
(15,916) (15,945) 854 (15,091)
(14,541) (476,978) (18,705) (495,683)
44,524 1,434,422 (23,862) 1,410,560
706,761 6,201,351 (150,283) 6,051,068
(12,769) (573,220) – (573,220)
thousands of US dollars
All other Totals Intersegmental operations Consolidated
and balances
64,115 4,538,686 – 4,538,686
204 340,913 (340,913) –
(9,038) (243,656) – (243,656)
20,873 2,410,971 (4,643) 2,406,328
18,084 2,241,514 (18,650) 2,222,864
17,236 50,728 (659) 50,069
(9,186) (12,955) 659 (12,296)
(4,238) (575,750) 3,529 (572,221)
17,322 1,797,411 (5,630) 1,791,781
654,131 5,405,822 (239,901) 5,165,921
(5,245) (269,459) – (269,459)

132
Geographically, all assets, production and administrative facilities of the Group are located
in Russia.
As disclosed in Note 23(c), the Group sells to three international traders that accounted
for a majority of the Group’s export sales in 2005, 2004 and 2003. LLC Insaur-Stal accounted
for in excess of 10% of the Group’s 2004 and 2003 domestic sales.
The allocation of total revenue by territory is based on the location of end customers who
purchased the Group’s products from international traders (Note 23(c)) and the Group. It does
not reflect the geographical location of the international traders. The Group’s total revenue
from external customers by geographical area for the years ended December 31, 2005, 2004
and 2003, was as follows:
Steel Mining
Revenue from external customers 2,450,193 17,179
Intersegment revenue 1,017 23,099
Depreciation and amortization (155,439) (2,054)
Gross profit / (loss) 1,004,013 4,973
Operating income / (loss) 884,209 2,598
Interest income 23,820 –
Interest expense (3,151) (691)
Income tax (221,372) (435)
Income before minority interest 653,775 2,193
Segment assets 3,022,399 19,431
Capital expenditures (232,955) (2,803)
Segmental information for the year ended December 31, 2003 is as follows:
■ NOTES
For the year For the year For the year
December 31, December 31, December 31,
2005 2004 2003
Russia 1,882,839 1,628,242 1 043,880
Asia and Oceania 847,605 628,238 533,987
European Union 626,332 783,014 384,139
Middle East, including Turkey 571,331 636,044 348,743
North America 306,996 657,427 46,354
Other regions 233,623 205,721 110,919
4,468,726 4,538,686 2,468,022

133NLMK • ANNUAL REPORT • 2005
All other Totals Intersegmental operations Consolidated
and balances
650 2,468,022 – 2,468,022
– 24,116 (24,116) –
(316) (157,809) – (157,809)
(55) 1,008,931 7,952 1,016,883
(289) 886,518 (4,244) 882,274
10,394 34,214 (581) 33,633
(4,083) (7,925) 581 (7,344)
(1,228) (223,035) – (223,035)
3,504 659,472 (773) 658,699
125,427 3,167,257 (81,992) 3,085,265
(3,521) (239,279) – (239,279)
thousands of US dollars

134
23. RISKS AND UNCERTAINTIES
(а) Operating environment of the GroupThe Russian Federation economy continues to display some characteristics of an emerging
market. These characteristics include, but are not limited to, the existence of a currency that
is not freely convertible in most countries outside of the Russian Federation, restrictive
currency controls, and relatively high inflation. The tax, currency and customs legislation
within the Russian Federation is subject to varying interpretations, and changes, which can
occur frequently.
Whilst there have been improvements in the economic trends, the future economic
direction of the Russian Federation is largely dependent upon the effectiveness of economic,
financial and monetary measures undertaken by the Government, together with tax, legal and
political developments.
(b) Convertibility of Russian rubleExchange restrictions and controls exist relating to converting Russian rubles into other
currencies. At present, the Russian ruble is not a convertible currency outside of the Russian
Federation and, further, the Group is required to convert 10% of its foreign currency earnings
into Russian rubles starting 2005 (25% before 2005). Future movements in the exchange rate
between the Russian ruble and the US dollar will affect the reported US dollar amounts related
to the Russian ruble carrying values of the Group’s assets and liabilities. Such movements may
also affect the Group’s ability to realize assets presented in US dollars in these consolidated
financial statements. Accordingly, any translation of ruble amounts to US dollars should not
be construed as a representation that such ruble amounts have been, could be, or will in the
future be converted into US dollars at the exchange rate shown or at any other exchange rate.
(c) Commercial risksThe Group minimizes its sales risks by having a wide range of geographical zones for sales,
which allows the Group to respond quickly to unexpected changes in the situation on one or
more sales markets on the basis of an analysis of the existing and prospective markets.
The Group’s exports in monetary terms in 2005 were 58% (2004: 64%, 2003: 58%) of the
total sales.
The Group relies on export sales to generate foreign currency earnings. As the Group
exports a significant portion of its production, it is exposed to foreign currency risk as well as
global economic and political risks.
Due to its foreign currency denominated assets and liabilities, the Group is subject to the
risk arising from foreign exchange rate fluctuations. The Group’s objective in managing its
exposure to foreign currency fluctuations is to minimize earnings and cash flow volatility
associated with foreign exchange rate changes. The net foreign currency position as at
December 31, 2005 is as follows:
■ NOTES

135NLMK • ANNUAL REPORT • 2005
US Dollar EURO Other currencies
Cash and cash equivalents 960,508 487,582 –
Accounts receivable 286,855 205,741 1,197
Other current assets 14,446 – –
Investments and long-term deposit 1,559 – –
Other non-current assets 27,223 4,465 –
Accounts payable and other liabilities (26,863) (15,215) (389)
Other long-term liabilities (8,500) – –
The Group sells to three international traders that account for the majority of its export
sales. In 2005, Steelco Mediterranean Trading Ltd., Cyprus, Tuscany Intertrade (UK), and
Moorfield Commodities Company, UK, purchased 41%, 26% and 17% of the Group’s export
sales, respectively (2004: 43%, 30% and 17%; 2003: 45%, 33% and 9%). These companies
were indirect shareholders of the Parent Company during 2003. The maximum
shareholdings during 2003 were 7.59%, 9.99% and 7.59%, and at December 31, 2003 were
4.16%, 4.11% and 4.16%, respectively. In 2004 these companies ceased to be indirect
shareholders of the Parent Company. Price fluctuations of sales to these companies are in
line with general trends in global price fluctuations. The Group’s export prices are
comparable to the prices of Russian competitors. In August 2005, 1.199% of the share
capital of the Parent Company was acquired by a company beneficially owned by the
shareholders of these traders.
The Group’s future profitability and overall performance is strongly affected by the prices
of ferrous metal products set in the international metal trading market that are subject to
significant fluctuations.
24. RELATED PARTY TRANSACTIONS
Related parties relationships are determined with reference to SFAS No.57, Related Party
Disclosures. Balances as at December 31, 2005, 2004 and 2003 and transactions for the years
ended December 31, 2005, 2004 and 2003 with related parties of the Group consist of the
following:
(a) Sales to and purchases from related partiesSales
Sales to related parties, either the Companies under common control or companies under
control or significant influence of the Group’s management, were $38,436, $45,715 and $24,502
for the years ended December 31, 2005, 2004 and 2003, respectively, which accounts for 0.9%,
1% and 1% of the total sales revenue. Related accounts receivable equaled $33,178, $6,501 and
$7,397 as at December 31, 2005, 2004 and 2003, respectively.
Purchases and services
Purchases of raw materials, technological equipment and management services from the
Companies under common control, were $22,247, $114,255 and $77,216 for the years ended
December 31, 2005, 2004 and 2003, respectively. Purchases of energy from the companies
under significant influence of the Group’s management (OJSC Lipetsk energy sales company
and other companies, which originated from reorganization of OJSC Lipetskenergo (Note 6(d)),
thousands of US dollars

136
in 2005, and OJSC Lipetskenergo in 2004 and 2003), were $140,005, $106,377 and $85,735 for
the years ended December 31, 2005, 2004 and 2003, respectively.
In 2004 and 2003, the Group made payments to one of the Companies under common
control, acting as an agent between the Group and railroad companies, for the transportation
of raw materials and the Group’s products. The payments include both railroad tariff
(transferred to railroad companies), and agent fee, retained by the agent. The agent fee and
purchases of other materials from this Company under common control amounted to $8,452
and $2,979 for the years ended December 31, 2004 and 2003, respectively.
Accounts payable to the related parties were $4,152, $2,044 and $7,689 as at December 31,
2005, 2004 and 2003, respectively.
(b) Financial transactionsThe subsidiary bank of the Group had loans receivable from related parties, either associates
or companies under control or significant influence of the Group’s management, of $10,633,
$7,538 and $9,221 as at December 31, 2005, 2004 and 2003, respectively.
Deposits and current accounts of related parties, either the Companies under common
control or companies under control or significant influence of the Group’s management, in the
subsidiary bank amounted to $88,090, $28,642 and $8,217 as at December 31, 2005, 2004 and
2003, respectively.
Deposits and current accounts of Group companies in a bank under significant influence
of the Group’s management (OJSC Bank Zenit) amounted to $70,967 as at December 31, 2005
(nil at December 31, 2004 and 2003). Related interest income from these deposits and current
accounts for the year ended December 31, 2005 amounted to $10,235.
The Group leased property, plant and equipment under capital lease arrangements with
one of the Companies under common control. The amount of capital lease liabilities incurred
during the years ended December 31, 2004 and 2003, was $19,920 and $17,059, respectively.
The capital lease liabilities to this related party as at December 31, 2004 and 2003 amounted
to $545 and $17,677, respectively.
The Group granted interest free loans to management in the total amount of $817, $71 and
$40 for the years ended December 31, 2005, 2004 and 2003, respectively. The aggregate
amount of such loans outstanding as at December 31, 2005, 2004 and 2003 was $514, $60 and
$38, respectively.
As at December 31, 2003, the Group had issued guarantees to the Companies under
common control amounting to $38,980 in respect of borrowings from non-group companies
(Note 25(h)). There were no guarantees issued to related parties as at December 31, 2005 and
2004.
In 2003 the Parent Company’s shareholders repaid remaining portion of the long-term
interest free loan in the amount of $71,415. A gain on the early repayment of the loan in the
amount of $20,984 was recognized in the consolidated statement of income for the year ended
December 31, 2003.
(c) Acquisitions and investmentsIn 2004 the Companies under common control transferred to the Parent Company 91.4% of the
outstanding common shares of OJSC Stoilensky GOK. Such transfers of $598,735 were recorded
as capital contributions. The Group transferred cash consideration to such control parties of
$636,453 which is reflected as distributions to controlling shareholders (Note 21(a)).
■ NOTES

137NLMK • ANNUAL REPORT • 2005
In the second half of 2004 the Group made a number of immaterial acquisitions of stock
in the Group’s companies OJSC Dolomit, OJSC StAGDoK, and an immaterial acquisition of the
controlling stock in LLC Independent Transport Company from the Companies under common
control in the total amount of $2,617 (Note 21(d)); acquired non-marketable securities, shares
in OJSC Lipetskenergo, for $944 from one of the Companies under common control, and sold
non-marketable securities, shares in OJSC Moscow Pipe Plant Filit, OJSC Almetyevsky Pipe
Plant and CJSC Engels Pipe Plant, for the total consideration of $2,430 to the Companies under
common control (Note 6(d)). The Group sold an investment in associate CJSC Korpus to one of
the Companies under common control for the consideration of $3,124 (Note 6(c)). In 2003 the
Group sold its share in OJSC Coal Mining Company Kuzbassugol for the consideration of
$38,104 to one of the Companies under common control.
(d) Contributions to non-governmental pension fund andcharity fund
Total contributions to a non-governmental pension fund amounted to $2,729, $2,607 and
$2,216 in 2005, 2004 and 2003, respectively. The Group has the right to appoint and dismiss
top management of the fund as the major contributor to its capital. The Group has no long-
term commitments to provide funding, guarantees, or other support to the fund.
Contributions to the charity fund controlled by the Parent Company’s management were
$6,941 in 2004. There were no such contributions in 2005 and 2003.
(e) Stock-based compensationIn August 2005, the controlling shareholder of the Parent Company effectively sold
200,100,000 of NLMK shares to companies beneficially owned by certain members of its Board
of Directors and management of the Group. The purchase price of these shares was based on
the Russian Trade System («RTS») trading price at the date of the transaction. This purchase
price is payable by December 31, 2006 with no interest charged on the outstanding debt. The
respective shares were pledged to secure the payment. There were no shares under such
arrangements as at and for the years ended December 31, 2004 and 2003. The only movements
which took place in the year ended December 31, 2005 were as described above.
This transaction was achieved through contractual arrangements between companies
owned by the controlling shareholder of the Parent Company and companies beneficially
owned by certain members of NLMK’s Board of Directors and management of the Group, and
therefore there was no cash outflow to the Group as a result of this transaction.
The Group applied SFAS No.123, Accounting for Stock-Based Compensation, («SFAS
No.123») for the purposes of accounting for this transaction, and estimated the fair value of
the options at $31,463. Management of the Group estimated that $1,132 of this value related
to the services provided by the individuals to the Group, and accordingly recorded an expense
in general and administrative expenses in the year ended December 31, 2005, with a
corresponding increase in stockholders’ equity. The arrangement effectively represents the
granting of options, at zero consideration, to buy shares at the RTS trading price of the shares
on the grant date (in August 2005), the option expiring on December 31, 2006.
The following assumptions were made in applying the Black-Scholes model in estimating
the fair values of the options for the purposes of applying SFAS No.123: risk-free interest rate
on Russian dollar-denominated bonds of 4.5%, expected life of 1.33 years, expected volatility
of 25.91%, and expected dividend yield of 4.24%.
thousands of US dollars

138
25. COMMITMENTS AND CONTINGENCIES
(a) Anti-dumping investigationsThe Group’s export trading activities are subject to from time to time compliance reviews of
importers’ regulatory authorities. The Group’s export sales were considered within several anti-
dumping investigation frameworks. The Group takes steps to address negative effects of the
current and potential anti-dumping investigations and participates in the settlement efforts
coordinated through the Russian authorities. No provision arising from any possible
agreements as a result of anti-dumping investigations has been made in the accompanying
consolidated financial statements.
(b) LitigationThe Group, in the ordinary course of business, is the subject of, or party to, various pending or
threatened legal actions. The management of the Group believes that any ultimate liability
resulting from these legal actions will not significantly affect its financial position or results of
operations, and no amount has been accrued in the consolidated financial statements.
(c) Environmental mattersThe enforcement of environmental regulation in Russian Federation is evolving and the
enforcement posture of government authorities is continually being reconsidered. The Group
periodically evaluates its obligations under environmental regulations. As obligations are
determined, they are recognised immediately. Potential liabilities, which might arise as a
result of changes in existing regulations, civil litigation or legislation, cannot be estimated
but could be material. In the current enforcement climate under existing legislation,
management believes that the Group has met the Government’s federal and regional
requirements concerning environmental matters, therefore there are no significant liabilities
for environmental damage or remediation.
(d) InsuranceThe Russian insurance market is in a developing stage and some forms of insurance protection
common in other parts of the world are not yet generally available in the Russian Federation.
The Group has entered into insurance contracts to insure property, plant and equipment,
land transport, an aircraft and purchased accident and health insurance, inter-city motor
vehicle passenger insurance and medical insurance for employees. Furthermore, the Group has
purchased operating entities civil liability coverage for dangerous production units.
(e) Capital commitmentsManagement estimates the outstanding agreements in connection with equipment supply and
construction works amounted to $264,903, $52,230 and $6,000 as at December 31, 2005, 2004
and 2003, respectively.
■ NOTES

139NLMK • ANNUAL REPORT • 2005
(f) Social commitmentsThe Group makes contributions to mandatory and voluntary social programs. The Group’s social
assets, as well as local social programs, benefit the community at large and are not normally
restricted to the Group’s employees. The Group has transferred certain social operations and
assets to local authorities, however, management expects that the Group will continue to fund
certain social programs through the foreseeable future. These costs are recorded in the year
they are incurred.
(g) Tax contingenciesRussian tax, currency and customs legislation is subject to varying interpretations, and
changes, which can occur frequently. Management's interpretation of such legislation as
applied to the transactions and activity of the Group may be challenged by the relevant
regional and federal authorities. Recent events within the Russian Federation suggest that the
tax authorities may be taking a more assertive position in their interpretation of the
legislation and assessments, and it is possible that transactions and activities that have not
been challenged in the past may be challenged. As a result, significant additional taxes,
penalties and interest may be assessed. Fiscal periods remain open to review by the authorities
in respect of taxes for three calendar years preceding the year of review. Under certain
circumstances reviews may cover longer periods.
As at December 31, 2005 management believes that its interpretation of the relevant
legislation is appropriate and the Group’s tax, currency and customs positions will be
sustained. Where management believes it is probable that a position cannot be sustained, an
appropriate amount has been accrued for in these consolidated financial statements.
(h) Financial guarantees issuedAs at December 31, 2005 and 2004, the Group has issued guarantees to third parties amounting
to $540 and $1,365. As at December 31, 2003 the Group had issued guarantees to related
parties amounting to $38,980 in respect of borrowings from non-group companies (Note
24(b)). No amount has been accrued in the consolidated financial statements for the Group’s
obligation under these guarantees as the projected outflows from such guarantees are
immaterial.
26. SUBSEQUENT EVENTS
(a) Acquisition of DanSteel A/S sharesIn January 2006, a company under common control outside of the Group transferred to the
Parent Company 100% of the outstanding common shares of DanSteel A/S, a steel-rolling
company acquired by the common control party in November 2005. The Group transferred cash
consideration of $104,000 to such control party. The transaction value was determined based
on an independent appraisal.
The consideration paid will be reflected as distribution to controlling shareholders in the
consolidated financial statements for the year ending December 31, 2006. Carrying values of
the assets and liabilities contributed will be reflected in the consolidated financial statements
for the year ending December 31, 2006 as capital contribution from controlling shareholders:
thousands of US dollars

140
Current assets 138,257
Property, plant and equipment 14,471
Intangible assets 2,567
Other non-current assets 4,904
Total assets 160,199
Current liabilities (50,300)
Non-current liabilities (35,753)
Deferred income tax liability (10,164)
Total liabilities (96,217)
Carrying value of net assets contributed 63,982
In the consolidated financial statements for the three years ending December 31, 2006,
this business combination will be accounted for retrospectively, as if this transaction had
taken place in November 2005 (the date of purchase by the controlling shareholder).
(b) Acquisition of OJSC Combinat KMAruda sharesIn February-March 2006, the Parent Company purchased from third parties 43.37% of the out-
standing common shares of OJSC Combinat KMAruda, and iron ore producer, for consideration
of $60,597. The acquisition resulted in the Group’s ownership of 76.26%. These transactions
were consummated to improve the upstream integration of the Group.
The following table summarizes the preliminary fair values of the assets acquired and
liabilities assumed in this business combination, determined in accordance with SFAS No.141
provisions. The fair values of property, plant and equipment, including mineral extraction
rights, and intangible assets were based on estimates of independent appraisers (in relation to
the 43.37% stake acquired):
Current assets 7,873
Mineral rights 18,926
Other property, plant and equipment 15,687
Other non-current assets 8,849
Goodwill 16,836
Total assets acquired 68,171
Current liabilities (1,432)
Deferred income tax liability (6,142)
Total liabilities assumed (7,574)
Fair value of net assets acquired 60,597
■ NOTES

141NLMK • ANNUAL REPORT • 2005
(c) Disposal of OJSC Lebedinsky GOK sharesIn January 2006, the Parent Company sold to third parties 11.96% of the outstanding common
shares of OJSC Lebedinsky GOK for consideration of $400 million; carrying value of these
shares at December 31, 2005 was $9,456 (Note 6(d)). This transaction was consummated in
line with Group’s strategy for investment management.
(d) Acquisition of coal mines and coke plantsIn March 2006, the Parent Company signed agreements to acquire from third parties 82% of
the outstanding common shares of OJSC Altai-koks, coke-chemical plant, and 100% of the
outstanding common shares of holding company Kuzbass Asset Holdings Limited, Gibraltar,
which owns 100% of Prokopievskugol Coal Company for a consideration of approximately USD
750 million.
OJSC Altai-koks is among leading coke-chemical plants in Russia. It produces high-quality
coke and chemical products. In January – April 2006, the Parent Company acquired additional
6.18% in OJSC Altai-koks from other minority shareholders. The acquisitions resulted in the
Group’s ownership of more than 88% of the voting shares of the company.
Prokopievskugol Coal Company is the leader in high-grade coking coal production and
processing in the Kemerovo region of Russia. It owns seven mines and three processing plants.
These acquisitions were made in line with Group’s vertical integration strategy, aiming on
additional competitive advantages through the stable supply of key raw materials. The
acquired companies will be consolidated by the Group for the first time as at the effective date
of obtaining control which management considers to be April 2006.
Management considers disclosure of fair values of assets acquired and liabilities assumed
in this business combination to be not practicable, given the effective date of obtaining
control.
thousands of US dollars

142
Indicators 2001 2002 2003 2004 2005
Production results (thousand tonnes)
Pig iron 7,463 8,047 8,623 8,994 7,886
Steel 7,912 8,553 8,854 9,123 8,468
Finished steel 7,334 8,006 8,233 8,576 7,979
Flats 4,634 4,764 4,895 4,813 4,776
Coated steel 371 550 543 528 532
Financial results (USD m)
Sales revenue 1,322 1,712 2,468 4,539 4,469
Gross profit 274 615 1,017 2,406 2,067
Operating income 205 512 882 2,223 1,860
Income before income tax and
minority interest 163 467 882 2,364 1,906
Net income 88 338 656 1,773 1,385
EBITDA1 332 613 1,019 2,563 2,094
Key financial performance
Total assets 1,896 2,199 3,085 5,166 6,051
Equity 1,652 1,991 2,610 4,220 5,054
Equity as a percentage of assets 87% 91% 85% 82% 84%
Current liquidity ratio 2 2.9 5.4 5.9 4.8 6.0
Quick liquidity ratio 3 2.1 4.2 4.8 3.9 5.1
Accounts receivable turnover 4 66 54 48 39 51
Inventory turnover 5 71 75 72 75 84
Profitability
Operating income margin 16% 30% 36% 49% 42%
Net income margin 7% 20% 27% 39% 31%
EBITDA margin 25% 36% 41% 56% 47%
Return on assets 6 5% 17% 25% 43% 25%
Return on equity 7 5% 19% 29% 52% 30%
EBITDA to assets 8 18% 30% 39% 62% 37%
Earnings per share (USD) 14.62 0.0565 0.1095 0.2958 0.2312
MAJOR RESULTS FOR 5 YEARS
1. EBITDA is calculated as the total of net income, net interest expense, income tax, loss on disposal of property,plant and equipment, depreciation and amortization and stock-based compensation.
2. Current liquidity ratio is calculated as current assets, excluding restricted cash, divided by current liabilities.3. Quick liquidity ratio is calculated as current assets, excluding restricted cash and inventory, divided by current lia-
bilities.4. Accounts receivable days are calculated as simple average receivables, divided by sales revenue, multiplied by 365
(number of days in a year).5. Inventory days are calculated as simple average inventory divided by production cost, multiplied by 365 (number of
days in a year).6. Return on assets is calculated as net income divided by simple average assets.7. Return on equity is calculated as net income divided by simple average equity.8. «EBITDA to assets» is calculated as EBITDA divided by simple average assets.
■ NOTES

143NLMK • ANNUAL REPORT • 2005
CONTACTSOJSC NLMK
Address 2, pl. Metallurgov, Lipetsk, 398040 Russia
Telex 101180 NLMK RU, 101264 NLMK RU, 101103 NLMK RU
Fax: +7 (4742) 432-541
E-mail: [email protected]
Internet http://www.nlmk.ru
Telephone numbers
General Director +7 (4742) 445-010
Technical Director – Chief Engineer +7 (4742) 440-806
Economics and Finance Division +7 (4742) 442-640
Production Division +7 (4742) 444-608
Sales Division +7 (4742) 444-688
Purchasing Division +7 (4742) 444-448
Accounting Division +7 (4742) 444-046
Audit Division +7 (4742) 444-930
Legal Division +7 (4742) 444-824
Human Resources and Administration Division +7 (4742) 444-571
Strategy and Management Systems Division +7 (4742) 440-646
IT Division +7 (4742) 445-601
Property and Securities Management Division +7 (4742) 444-989
Invironmental Safety Division +7 (4742) 441-662
Medical Service and Social Issues Division +7 (4742) 440-773
Security Division +7 (4742) 442-396
Press Service +7 (4742) 440-041