Creating a Rock Garden at Kubota Garden Forecourt, Seattle: update

Ibis
(2005),
147
, 563–575
© 2005 British Ornithologists’ Union
Blackwell Publishing, Ltd.
Annual and seasonal trends in the use of garden feeders by birds in winter
DAN E. CHAMBERLAIN,
1
* JULIET A. VICKERY,
2
DAVID E. GLUE,
2
ROBERT A. ROBINSON,
2
GREG J. CONWAY,
2
RICHARD J. W. WOODBURN
2
& ANDREW R. CANNON
2
**
1
British Trust for Ornithology Scotland, School of Biological and Environmental Sciences, Cottrell Building, University of Stirling FK9 4LA, UK
2
British Trust for Ornithology, The Nunnery, Thetford, Norfolk IP24 2 PU, UK
Provision of bird food in gardens is a common activity that may provide an alternativefood source to birds in winter. Long-term survey data recording the weekly presence of allbird species using garden feeders in the winter were analysed to see if there was any evidenceof trends in feeder use between 1970 and 2000 and whether these trends were correlatedwith breeding bird population trends. Of 41 species analysed, 21 showed significant increasesin occurrence at garden feeders between 1970 and 2000. Many of these increases were evidentonly in the last 10 years. Several species showed significant positive correlations betweentrends in winter garden use and trends in relative population size in the previous breedingseason. This was especially the case for species with population change (either increase ordecrease) of the greatest magnitude. There was no evidence that seasonal shifts in gardenfeeder use were associated with population change in any species. Temperature was animportant predictor of garden use but could not explain the year-to-year trends. However,as the number of feeding stations had increased over time the response of birds to the greaterfood availability in gardens may have been responsible for the widespread increases inoccurrence of several species.
Bird monitoring scheme data have been a majorinfluence on UK government conservation policy.Most notably, the government has adopted theWild Bird Indicator (Vickery
et al
. 2004) as one ofits headline ‘Quality of Life’ indicators and has acommitment to reversing declines in the index by 2020(Anon 1999). Monitoring schemes for relativelywidespread breeding species cover a range of habitats(Raven
et al
. 2003), but for longer-term (over 10 years)trends in breeding populations, the available data arebiased towards farmland and woodland habitats. Forpasserines, our knowledge of trends in the winter isrelatively limited compared to spring and summer.For many declining species such as Tree Sparrow
Passer montanus
, Yellowhammer
Emberiza citrinella
and Reed Bunting
E. schoeniclus
this is a key gap inour understanding highlighted by Government Bio-diversity Action Plans (BAPs), although there are
sources of information, particularly for farmlandhabitat, that give us insight into the winter distribu-tion and ecology in a range of species (e.g. Lack 1986,Gillings & Fuller 2001).
Private gardens are likely to hold high proportionsof the national breeding population for many species(Gregory & Baillie 1998) and are also known to beimportant for many species in winter. Bird feeding is avery commonplace activity, and it is estimated that 75%of households provide food for birds at some timeduring the year (Cowie & Hinsley 1988). In Britain,long-term surveys of birds using garden feeders providesources of valuable data for many common and wide-spread bird species in winter, in particular GardenBirdWatch (GBW: Toms 2003) and the Garden BirdFeeding Survey (GBFS: Glue 1982). These provideweekly summaries of species’ presence all year (GBW)and maximum species count in the winter (GBFS) ina large sample of gardens (> 10 000 for GBW and 200–300 for GBFS). However, these data are not incorpo-rated into any national indices of population change.
There is, however, potential to use these data sourcesas additional monitoring tools. In North America
*Corresponding author.Email: [email protected]
**Present address: Department of Animal and Plant Sciences,University of Sheffield S10 2TN, UK.

564
D. E. Chamberlain
et al.
© 2005 British Ornithologists’ Union,
Ibis
,
147
, 563–575
trends in garden birds using feeders are correlatedwith national population trends for many species.Data from Project Feeder Watch, a volunteer-basedsurvey that records bi-weekly counts of birds ongarden feeders in winter in North America, have beenused to assess whether the use of gardens by birdswas correlated with winter and breeding populationindices. There were strong correlations for a largenumber of species indicating that trends in gardenscan reflect population trends in the wider country-side (Wells
et al
. 1998, LePage & Francis 2002).We use survey data from GBFS to investigate
whether there have been long-term trends in the useof garden feeders by birds and whether within-winter patterns of garden use by birds have changedover time. We also use long-term annual monitoringscheme data from the wider countryside to invest-igate the extent to which trends between years reflectnational breeding population trends, seasonal andlong-term change in temperature and/or changes inthe scale (measured as the number of feeding stations)in provision of garden bird food.
METHODS
The Garden Bird Feeding Survey (GBFS) is anannual winter survey, implemented in 1970, thatmonitors the weekly maximum count of birds observedat garden feeders between October and March.GBFS sites are selected to ensure that they arebroadly representative of a range of garden typeswith a consistent geographical distribution. There isa degree of site turnover from year to year, but newsites are selected from the same region and are of asimilar type (e.g. rural or suburban) and size to theone that they have replaced.
Observers are requested to note numbers of allspecies seen at feeding stations within their gardenthroughout the week. The maximum number seenat any one time is recorded. In this paper, the dataare simplified to presence or absence per observationperiod. In total, 1080 sites have been surveyed sincethe implementation of the scheme, although not allof these were included in the analysis (see below).Surveyors were asked to record feeding stations,recorded as the number of separate units per site perweek. These are divided into hanging feeders, feed-ing tables, ground feeding stations and water. Noinformation is recorded on the type of food or thesize of each feeding station (so there is an implicitassumption that the number of feeding stationscorrelates with food abundance).
Data analysis
Analyses were restricted to the 41 most-commonlyoccurring species. One species, Marsh Tit
Paruspalustris
, could be confused with the similar WillowTit
Parus montanus
, which can be difficult to identifyin the field (Cramp 1993), so the composite Marsh/Willow Tit is used to acknowledge this. Bird pres-ence was analysed in relation to year and week usingbinomial logistic regression. Year was expressed asa continuous variable and the quadratic of year wasalso entered to detect non-linear patterns in gardenuse over time. The majority of species show charac-teristic cyclical patterns of occurrence through theseason (Cannon 1998). Modelling this cyclical pat-tern was achieved using periodic logistic regression(Flury & Levri 1999) which expresses week number(1–26 where 1 = early October and 26 = late March/early April) as two separate trigonometric functionsbased on the sine and cosine function (sine week effect =sin[2
×
π
×
(week/26)], cosine effect = cos[2
×
π
×
(week/26)]). Interactions between both week termsand year were included in the model to see if the within-winter pattern of garden use varied over time. Modelswere fitted initially with all terms. Non-significantinteractions and then non-significant individualterms were deleted sequentially until only significant(
P <
0.05) terms were left in the model. The final modelis termed the minimum adequate model (MAM).
Analysing observations from the same garden siteover sequential weeks and years necessitated use ofa repeated-measures model framework, where the‘subject’ was the site and the repeated measureswere both week and year. In formal terms, this meansthat the autoregressive function was fitted to eachsite and year combination. Likelihood ratio testsand parameter estimates were adjusted using generalestimating equations which take into account thetemporal autocorrelation among observations fromthe same site. Detection of interannual trends was amajor goal of the analysis. Sites that were surveyedfor short runs of years (< 5) were not included inthe analysis. This left a total of 458 sites, varyingbetween 51 and 224 per year.
In order to see whether trends in the probability ofspecies’ presence at garden bird feeders over timewere associated with breeding population trends,annual indices of relative breeding population changewere derived from Common Birds Census (CBC)data (Marchant
et al
. 1990) over the period of inter-est. Spearman’s rank correlations were used to see ifuse of gardens by birds was correlated with population

© 2005 British Ornithologists’ Union,
Ibis
,
147
, 563–575
Garden feeders use by birds in winter
565
trend from the preceding breeding season. TheCBC is unable to estimate population change forBlack-headed Gull, Feral Pigeon, Redwing, Fieldfare,Rook, Brambling and Siskin so these species werenot included in the analysis (see Table 1 for scientificnames of all species mentioned in this paper).
The influence of the number of feeding stationsand minimum weekly temperature on the probabilityof bird presence was analysed using the same modelframework. Temperature data were obtained from
the British Atmospheric Data Centre (www.badc.nerc.ac.uk), which provides daily meteorologicaldata for several hundred weather stations through-out Britain. Daily minimum temperature data wereconverted to weekly mean data before analysis.The nearest weather station to each GBFS site ineach week was identified using weather stationand site grid references in a GIS.
Mean minimum temperature and the number offeeders and interactions with week and year were
Table 1. Occurrence per site (number of sites where a species was recorded at least once as a percentage of the total) and per weekwhere a given species was recorded at garden feeding stations between the winters of 1970/71 and 2000/01. The total number of siteswas 458 and the total number of weeks was 118 058.
Species % Site occurrence % Week occurrence
Sparrowhawk Accipiter nisus 61.6 6.2Black-headed Gull Larus ridibundus 55.7 8.9Great Spotted Woodpecker Dendrocopos major 57.2 14.1Feral Pigeon Columba livia 27.9 6.2Wood Pigeon C. palumbus 67.2 15.8Collared Dove Streptopelia decaocto 91.9 57.2Pied Wagtail Motacilla alba 83.0 9.7Wren Troglodytes troglodytes 88.2 13.0Dunnock Prunella modularis 99.6 81.7Robin Erithacus rubecula 100 87.8Blackbird Turdus merula 100 84.9Song Thrush T. philomelos 97.4 32.2Redwing T. iliacus 75.8 1.7Fieldfare T. pilaris 55.0 1.7Mistle Thrush T. viscivorus 62.4 7.5Blackcap Sylvia atricapilla 34.9 3.3Goldcrest Regulus regulus 54.1 1.5Blue Tit Parus caeruleus 100 95.3Great Tit P. major 99.8 81.1Coal Tit P. ater 94.8 49.4Marsh/Willow Tit P. palustris/montanus 46.1 8.6Long-tailed Tit Aegithalos caudatus 63.4 6.6Nuthatch Sitta europaea 37.8 10.1Treecreeper Certhia familiaris 13.3 0.8Jay Garrulus glandarius 39.7 5.4Magpie Pica pica 82.3 30.9Carrion Crow Corvus corone 59.6 8.0Jackdaw C. monedula 45.6 18.9Rook C. frugilegus 65.1 6.0Starling Sturnus vulgaris 98.7 77.7House Sparrow Passer domesticus 99.1 87.0Tree Sparrow P. montanus 28.8 4.5Chaffinch Fringilla coelebs 99.3 75.1Brambling F. montifringilla 54.4 2.3Greenfinch Carduelis chloris 100 68.8Goldfinch C. carduelis 64.4 5.0Linnet C. cannabina 9.8 0.2Siskin C. spinus 69.2 7.6Bullfinch Pyrrhula pyrrhula 54.8 3.0Reed Bunting Emberiza schoeniclus 24.7 3.2Yellowhammer E. citrinella 39.3 2.3

566
D. E. Chamberlain
et al.
© 2005 British Ornithologists’ Union,
Ibis
,
147
, 563–575
added to MAMs. Model reduction was carried out asbefore. Model performance was compared usingAkaike’s information criterion (AIC) to assess whetherinterannual variations could be explained by changesin feeding stations provided and temperature, orwhether year was still significant when feedingstation and temperature data were included. Notall sites provided feeding station data and feedingstation data were available until 1999/2000 only(1 year less than the bird data). Furthermore, gridreferences were not available (or were recordedincorrectly) for a number of sites so temperaturedata could not be obtained. This resulted in sub-samples of 404 sites for the feeding station data and329 sites for the temperature data (of 458).
RESULTS
The proportion of weeks of the total combinedweeks across all years and sites and the proportion ofsites in which a given species was recorded is givenin Table 1. The most commonly occurring species(in terms of the percentage of gardens in whichthey occurred) were Robin, Blackbird, Blue Tit andGreenfinch (100% occurrence) followed by Dun-nock, Song Thrush, Great Tit, Starling, House Sparrowand Chaffinch (> 95%). By far the lowest occurrencewas recorded for Linnet (9.8%). Note that some spe-cies were recorded at a relatively high proportion ofsites but in a low proportion of weeks (e.g. Sparrow-hawk, Pied Wagtail, Wren, Redwing, Long-tailed Tit,Rook, Siskin), indicating that these species werewidespread but infrequent visitors to garden feeders.
Annual trends
Most of the 41 species considered showed significantchanges in probability of occurrence at garden feed-ing stations over the 29 winters of the study. Modelfit was poor in some cases. Typically, these were the lesscommon species that exhibited under-dispersion.Particularly poor model fits (
D
< 0.40) were found forFieldfare, Redwing, Blackcap, Goldcrest, Treecreeper,Tree Sparrow, Brambling, Goldfinch, Linnet, Bull-finch, Reed Bunting and Yellowhammer. For thesespecies, a second model was run in which any siteswhere the species was never recorded were omitted.This reduced the sample size but improved the modelfit (
D
> 0.4) for Blackcap, Goldcrest, Tree Sparrow,Reed Bunting and Yellowhammer. For these species,annual trends were very similar to those observed inthe full model with the exception of Tree Sparrow
which showed a significant increase, although thedata set was much reduced (from 458 to 132 sites).
Examples of annual and seasonal trends in gardenuse of birds with adequate model fit (including thosewhere zero occurrence sites were omitted) are shownin Figure 1, representing increasing, decreasing, fluc-tuating and stable trends. (Figures for all species withadequate model fit are available as Supplementarymaterial, hosred on
Synergy
). Three species showedan initial increase followed by a decline: Black-headedGull (Fig. 1a), Jay and Reed Bunting. There were 21species that were increasing, but in several species theincrease was only in the last ten years. Increasing ‘species’included Collared Dove (Fig. 1b), Sparrowhawk, FeralPigeon, Wood Pigeon, Great Spotted Woodpecker, Cor-vids (except Jay), Wren, Coal Tit, Marsh/Willow Tit,Long-tailed Tit, Nuthatch, Blackcap, Goldcrest andseveral granivorous species (Tree Sparrow, Chaffinch,Greenfinch, Siskin, and Yellowhammer). For four species,the magnitude of change over time was relatively smalland the trend could effectively be regarded as stable:Dunnock (Fig. 1c), Robin, Blue Tit and Great Tit. OnlyBlackbird showed no significant annual variation.There were relatively few species whose probabilityof occurrence showed a significant long-term annualdecline. These species were House Sparrow (Fig. 1d),Pied Wagtail, Song Thrush, Mistle Thrush and Starling.
Percentage changes between 1970/71, 1980/81,1990/91 and 2000/2001 as estimated from bino-mial models are given in Table 2. Some species hadshown huge increases in occurrence at feeders. Speciesthat had increased by more than 20% in estimatedprobability of occurrence over the period of thesurvey were: Collared Dove, Magpie, Greenfinch,Woodpigeon, Jackdaw, Chaffinch and Feral Pigeon.Many other species increased by more than 10% overthe same period. There was, however, no suggestionthat particular groups of species (e.g. taxonomicgroups, groups defined in terms of predominant dietor grouped according to population status) showedgreater or lesser magnitude of change. Relatively fewspecies had shown declines over the period. Gener-ally, rank order was in agreement when consideringchange over different periods. Exceptions occurredwhen the annual patterns were strongly peaked ortroughed, e.g. Jay, Reed Bunting.
Garden trends in relation to national trends
CBC indices were derived at the UK level for allspecies where possible. The CBC index from the

© 2005 British Ornithologists’ Union,
Ibis
,
147
, 563–575
Garden feeders use by birds in winter
567
Figure 1. Mean weekly probability of occurrence of selected species recorded at garden feeders (points) and trend lines fitted frombinomial logistic regression. Note that for presentational purposes trends are presented as continuous but in the model week was notfitted as a continuous trend across years, but within each year. Sample size (n) includes those sites where a given species was recordedon at least one occasion. D indicates the dispersal parameter (deviance/degrees of freedom). Full model details are given in Appendix I.

568
D. E. Chamberlain
et al.
© 2005 British Ornithologists’ Union,
Ibis
,
147
, 563–575
previous breeding season was correlated with annualestimates of the probability of occurrence derivedfrom binomial models for species showing significantannual change. Table 3 shows Spearman’s rankcorrelation coefficients for 29 species. For the period1970/71–1999/2000 (the latest CBC data available),15 species showed significant positive correlationsbetween CBC index and estimated probability ofoccurrence. For the period 1980/81–1999/2000 therewere 21 such species. Five ‘species’ were increasingtheir garden occurrence while the CBC index wasdeclining: Marsh/Willow Tit, Tree Sparrow, Green-
finch, Reed Bunting and Yellowhammer. For Marsh/Willow Tit this correlation was significant for theperiod 1980/81–1999/2000 only. Great Tit, Greenfinchand Reed Bunting showed significant correlations ofopposing direction between 1970/71 onwards and from1980/81 onwards. This is due to the non-linear patternin CBC index (Greenfinch) and garden usage (GreatTit and Reed Bunting) over time in these species.
Seasonal trends
The majority of species also showed variation withinwinter, occurrence peaking typically at some time inmidwinter (e.g. Fig. 1). Several species showedsignificant interactions between week (expressed aseither sine or cosine) and year, indicating that the
Table 2. Change in estimated probability of occurrence derivedfrom binomial logistic models between the given year (columnheading) and 1999/2000, for species showing significant effectsof year (week = 1). Change is expressed as proportional changebetween the column year and 2000 (where 1 = double originalvalue). Species are sorted according to the magnitude of changebetween 1970/71 and 1999/2000. Species with poor model fit(D < 0.40) are not included.
Species 1970 1980 1990
Collared Dove 0.418 0.270 0.125Magpie 0.335 0.207 0.063Greenfinch 0.318 0.326 0.194Wood Pigeon 0.306 0.308 0.241Jackdaw 0.299 0.303 0.220Chaffinch 0.258 0.174 0.085Feral Pigeon 0.251 0.281 0.224Carrion Crow 0.169 0.140 0.087Great Spotted Woodpecker 0.164 0.124 0.070Coal Tit 0.133 0.230 0.191Rook 0.130 0.137 0.104Yellowhammer 0.128 0.110 0.075Siskin 0.108 0.075 0.030Long-tailed Tit 0.107 0.113 0.097Sparrowhawk 0.095 0.075 0.040Robin 0.058 0.087 0.067Wren 0.054 0.037 0.018Tree Sparrow 0.054 0.040 0.023Nuthatch 0.046 0.087 0.075Goldcrest 0.036 0.049 0.042Treecreeper 0.028 0.022 0.014Great Tit 0.021 0.061 0.053Jay 0.021 −0.017 −0.028Blue Tit 0.019 0.034 0.025Black-headed Gull 0.016 0.012 −0.021Reed Bunting 0.009 −0.009 −0.015Blackcap 0.008 0.006 0.004Dunnock −0.006 0.046 0.055Marsh/Willow Tit −0.007 0.089 0.090Mistle Thrush −0.031 −0.018 −0.006Pied Wagtail −0.056 −0.032 −0.015House Sparrow −0.092 −0.115 −0.094Song Thrush −0.310 −0.181 −0.065Starling −0.330 −0.296 −0.191
Table 3. Spearman’s correlation coefficients between CBCindex and estimated probability of bird occurrence derived frombinomial regression. *P < 0.05, **P < 0.01, ***P < 0.001 (otherwisenot significant).Species not included either showed no significanttrend in garden use with year (Blackbird) or do not haveCBC index calculated (Black-headed Gull, Feral Pigeon, Rook,Siskin). Species with poor model fit (D < 0.40) are not included.
Species
Spearman’s r 1970–2000
(n = 31)
Spearman’s r 1980–2000
(n = 21)
Sparrowhawk 0.959*** 0.869***Great Spotted Woodpecker 0.744*** 0.575**Wood Pigeon 0.982*** 1.000***Collared Dove 0.890*** 0.743***Pied Wagtail −0.125 −0.469*Wren 0.253 0.790***Dunnock 0.781*** 0.332Robin 0.799*** 0.868***Song Thrush 0.954*** 0.853***Mistle Thrush 0.965*** 0.964***Goldcrest −0.394* −0.486*Blackcap 0.964*** 1.000***Blue Tit −0.319 0.299Great Tit −0.436* 0.531*Coal Tit 0.337 0.657**Marsh/Willow Tit −0.094 −0.861***Long-tailed Tit 0.310 0.330Nuthatch 0.124 0.871***Jay 0.119 0.751***Magpie 0.898*** 0.670***Carrion Crow 1.000*** 1.000***Jackdaw 0.881*** 0.791***Starling 0.962*** 1.000***House Sparrow 0.967*** 0.927***Tree Sparrow −0.999*** −1.000***Chaffinch 0.896*** 0.668***Greenfinch −0.409* 0.877***Yellowhammer −0.989*** −1.000***Reed Bunting −0.426* 0.484*

© 2005 British Ornithologists’ Union, Ibis, 147, 563–575
Garden feeders use by birds in winter 569
seasonal pattern of occurrence at garden feedingstations varied over time. There were 31 specieswhere a significant interaction was detected. Therewere nine ‘species’ where estimated peak occurr-ence date became increasingly earlier in the winter:Sparrowhawk, Black-headed Gull, Great SpottedWoodpecker, Blue Tit, Great Tit, Coal Tit, Marsh/Willow Tit, Nuthatch and Blackcap. For fourselected example species, the mean weekly occur-rence rates and values fitted from binomial regres-sion parameter estimates have been plotted forthree separate winters, 1970/71, 1985/86 and2000/2001 (Fig. 2). For the remaining species, therewere differences in the shape of the relationshipbetween years but no obvious difference in the dateof peak occurrence. (Trends for all species showingsignificant interactions are available as Supplementarymaterial, hosred on Synergy).
Feeding stations and temperature
There were significant increases in the number ofall feeding stations combined per garden (hanging +ground + table) over time (Fig. 3). There was alsosignificant variation within each winter, with provi-sion of feeding stations showing a peak in midwinter.There were no significant annual or seasonal variationsin the provision of water.
Mean minimum temperature per site was ana-lysed with respect to year and week using a repeated-measures model. There was a significant negativequadratic association between year and temperatureover the study period. This trend, while statisticallysignificant, did not represent a large variation in tem-perature and the trend was driven largely by severalwinters of lower than average temperature in the1980s. There was also a great deal of scatter in thedata and the model was a poor fit (D = 7.99).
The effects of the number of feeding stationsper week and mean daily minimum temperatureper week were incorporated into repeated-measuresmodels. There were significant effects of both numberof feeding stations and minimum temperature in themajority of species. Of the 41 species analysed, allexcept Linnet and Black-headed Gull showed asignificant positive association with the number offeeding stations present (but model fit was poor forLinnet). The probability of bird occurrence was sig-nificantly and negatively associated with minimumtemperature in 36 species. Sparrowhawk was theonly species to show a significant positive effect.Feral Pigeon, Wren, Goldcrest and Linnet showed
no significant effect of temperature. Three speciesvaried significantly in their probability of occurrencewith year in the initial model, but not when year andtemperature were added (Dunnock, Blue Tit andBullfinch). This may indicate that variations in tem-perature or feeding stations could explain the annualpatterns, but it should be remembered that modelsare not directly comparable as sample size wasreduced by almost 30% with the addition of temper-ature and feeding station data. For all species apartfrom Linnet, the addition of temperature and/orfeeding station data improved model performanceaccording to AIC.
Although the probability of bird occurrence wasassociated clearly with fluctuations in temperaturein the majority of species, it was unlikely that vari-ations in temperature could explain relatively largeyear-to-year changes in garden use by birds. The sig-nificant increase in feeding stations over time (Fig. 3)was more likely to have contributed to an increase inprobability of bird occurrence at garden feeders. In afinal analysis, year was replaced by feeding stationnumber in initial models (note that this was notapplicable to Blackbird, for which there was nosignificant year effect). Initial models were re-runon the reduced feeding station data set (n = 404)and model performance was compared between theyear and feeding station models using AIC. Therewere 13 species for which the feeder model had alower AIC indicating that the model was a better fitto the data. These were Sparrowhawk, Feral Pigeon,Great Spotted Woodpecker, Wren, Robin, MistleThrush, Goldcrest, Coal Tit, Nuthatch, Rook, Jay,Greenfinch and Reed Bunting.
DISCUSSION
For many species, annual trends in probability ofoccurrence at garden feeders were associated closelywith trends in the breeding population. For example,Sparrowhawk occurrence has increased in gardens asthe population has recovered from the severe effectsof organochlorine pesticides (Newton 1986). Corvidspecies have increased in population, due possiblyto decreases in persecution and increases in theirexploitation of human habitats (Gregory & Marchant1996); this is reflected in their increase in gardens.Some species that have declined in populationalso showed a decline in garden use; these includedHouse Sparrow and Song Thrush. Seven ‘species’showed a negative association with CBC index:Goldcrest, Great Tit, Pied Wagtail, Marsh/Willow

570 D. E. Chamberlain et al.
© 2005 British Ornithologists’ Union, Ibis, 147, 563–575
Figure 2. Mean probability of bird occurrence in three winters, 1970/71 (triangles), 1985/86 (squares) and 2000/01 (circles) and trendlines fitted from binomial logistic regression (dotted line, thin line and thick line for each year, respectively) for selected species showingsignificant interactions between week and year terms. Week 1 = early October, week 26 = late March (exact dates vary from year to year).

© 2005 British Ornithologists’ Union, Ibis, 147, 563–575
Garden feeders use by birds in winter 571
Tit (the latter two species between 1980 and 2000only), Tree Sparrow, Reed Bunting and Yellow-hammer (but note Reed Bunting showed a positivecorrelation post-1979).
In general, positive associations were detected inspecies that have shown some of the largest changesin population size over the period of GBFS, includingboth increasing (Sparrowhawk, corvids, Woodpigeon,Collared Dove, Blackcap, Chaffinch) and decreasingspecies (Song Thrush, House Sparrow, Starling).One group of species that stands out as having eitherno or negative correlations between garden use andpopulation trend is farmland granivores. Greenfinchshowed significant positive correlations only from 1980onwards when it recovered from earlier declines. Forthis species and for Tree Sparrow, Reed Bunting andYellowhammer there was no positive correlationover the whole period.
Why should granivores as a group show less tem-poral matching between annual population indicesand occurrence at garden feeders? In some speciesthe winter populations are augmented by migrantsfrom northern Europe, notably Goldfinch, but thereis no indication from ringing recovery data of temporalchanges that may explain the patterns observedhere (Wernham et al. 2002). For granivorous species,decreases in food resources outside the breeding sea-son have been strongly implicated in their declines.The switch from spring to autumn-sown cereals has
led to a decrease in stubbles present over the winter.For many species, stubbles are a preferred foraginghabitat in the winter (Evans & Smith 1994, Wilsonet al. 1996, Gillings & Fuller 2001). In addition, theincreasing efficiency of agricultural machinery andincreased cleanliness around the farmyard have alsodecreased the amount of spilt grain available to birds(O’Connor & Shrubb 1986, Shrubb 2003). A decreasein food resources outside the breeding season maybe expected to affect survival rates in granivorousspecies. For several species, there is evidence thatsurvival rates declined during periods of populationdecline (Peach et al. 1999, Siriwardena et al. 1999).
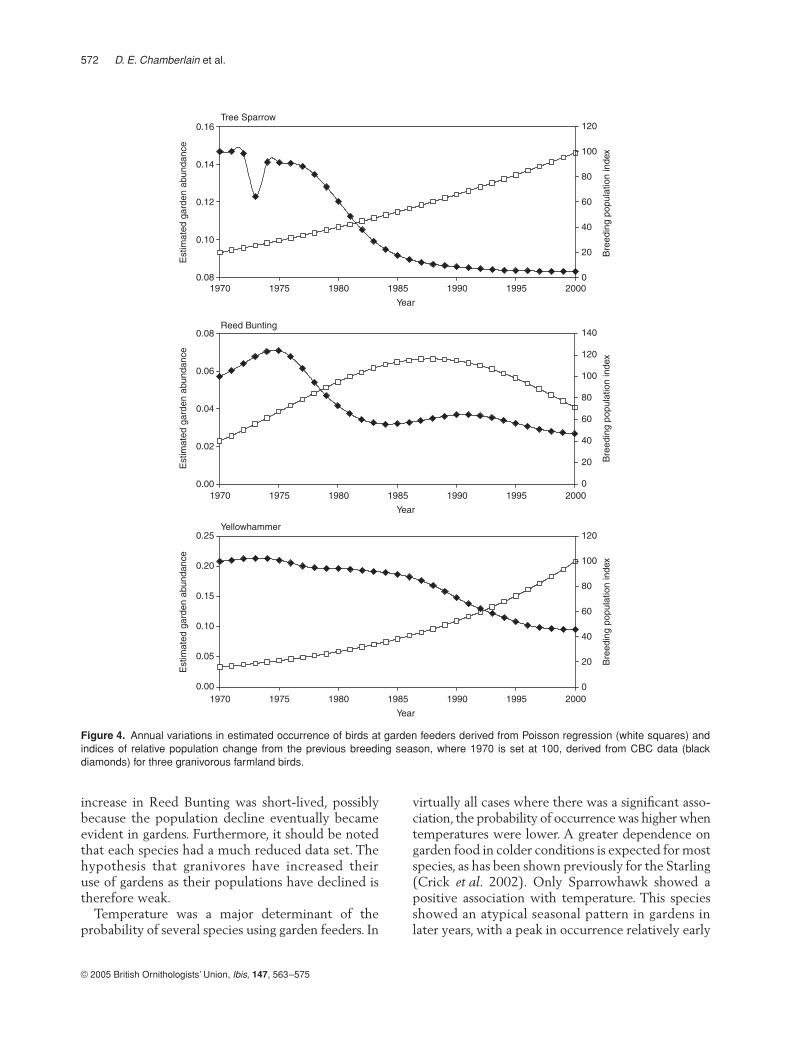
These results imply that the use of garden bird-feeders by certain farmland granivores increases inresponse to lower food supplies in the surroundingcountryside. Simple correlations of garden occurrencerates with CBC index reveal general directional asso-ciations. However, the points of inflexion of bothpopulation index and garden use should also beassociated closely if increasing exploitation of gardenfeeders is caused by declining farmland resources forgranivorous species. Plots of annual trend in gardenuse and CBC index for Tree Sparrow, Reed Buntingand Yellowhammer (species showing significantincreases in garden use that have shown declinesin population over the past 40 years) are shown inFigure 4. Each species showed increases in gardenuse at times of population decline, although the
Figure 3. Mean number of feeding stations per garden per year and predicted feeding stations derived from a repeated-measuresPoisson regression model.
572 D. E. Chamberlain et al.
© 2005 British Ornithologists’ Union, Ibis, 147, 563–575
increase in Reed Bunting was short-lived, possiblybecause the population decline eventually becameevident in gardens. Furthermore, it should be notedthat each species had a much reduced data set. Thehypothesis that granivores have increased theiruse of gardens as their populations have declined istherefore weak.
Temperature was a major determinant of theprobability of several species using garden feeders. In
virtually all cases where there was a significant asso-ciation, the probability of occurrence was higher whentemperatures were lower. A greater dependence ongarden food in colder conditions is expected for mostspecies, as has been shown previously for the Starling(Crick et al. 2002). Only Sparrowhawk showed apositive association with temperature. This speciesshowed an atypical seasonal pattern in gardens inlater years, with a peak in occurrence relatively early
Figure 4. Annual variations in estimated occurrence of birds at garden feeders derived from Poisson regression (white squares) andindices of relative population change from the previous breeding season, where 1970 is set at 100, derived from CBC data (blackdiamonds) for three granivorous farmland birds.

© 2005 British Ornithologists’ Union, Ibis, 147, 563–575
Garden feeders use by birds in winter 573
in the winter in 2000 (Fig. 2). It is unclear why thispeak occurred. Despite widespread associationsbetween garden feeder count and temperature therewas very little evidence that variation in temperatureaccounted for trends between years or within winters.There was no obvious annual trend in temperaturedata over the period of study.
Many species were associated positively with thenumber of feeding stations provided by survey par-ticipants. It is assumed that the number of feedingstations is correlated directly with the amount offood available. Furthermore, for a number of speciesthe increase in feeding stations matched closely theincrease in numbers in gardens. For most species, theeffects of feeding station number were additive tothe effects of year. In 36 species, the increase in feed-ing stations provided a better model fit in place ofyear, showing that for these species increases in num-bers of feeders could provide an adequate explana-tion for increases over time. The increase in feedingstations may be a response to the increasing popular-ity of bird feeding generally (Cannon 1999). This isnot necessarily on the part of the survey participants(who must feed birds as part of the survey), but maybe due to a general increase in bird feeding in the sur-rounding habitats. In addition to the amount of foodprovided, it is also likely that the quality of food hasimproved over time. There is a far greater variety ofcommercially available bird food now than two orthree decades ago. This includes specialist foodstuffssuch as niger seeds and black sunflower hearts, bothof which are aimed specifically at finches. Further-more, it is likely that general garden practice (e.g.wildlife gardening) has recently improved gardensfor birds. Finally, it should be noted that the sampleof GBFS gardens is unlikely to be representative ofgardens nationally.
In addition to marked annual increases in foodprovision, there was also a marked seasonal patternthat matched the pattern seen in many bird species,with a peak in the number of feeding stations in mid-winter. This raises the question of whether birds areshowing a midwinter peak in response to increasedfood supply, whether the surveyors increased theamount of food in response to bird numbers orwhether other cues were involved (e.g. more foodmay be provided when harsher conditions are per-ceived). Such effects are very difficult to isolate,but are extremely important when considering thepotential value of this survey as a monitoring tool.On the evidence of this paper it seems unlikely thatsuch data could be used to monitor the majority of
species as there are many other influences (especiallyfood amount and quality) that will affect garden useby birds. However, GBFS is likely to be useful inmonitoring species that are associated especiallywith human habitation and which show a markedpopulation change (e.g. declining Starling and HouseSparrow).
There is an implicit assumption in this researchthat farmland habitats are homogeneous and thatbirds are able to move freely between farmland andgardens. Neither of these is likely to be true in reality.Resources on farmland are likely to differ geograph-ically. For example, it is unlikely that trends evidentin cereal-dominated areas will be similar to those inpastoral areas where winter food resources haveprobably always been low for granivores, but possiblyhigher for invertebrate feeders (corvids and thrushes).Furthermore, the location of the garden may haveimportant effects. A garden that is adjacent to farm-land may be more sensitive to resource depletion inthe surrounding countryside than a garden in a sub-urban setting. Trends in House Sparrow occurrencein gardens vary according to both landscape and gar-den type (Crick et al. 2002, Robinson et al. 2005).These issues should be addressed for a range ofspecies in future work.
We are extremely grateful to the many dedicated volun-teers who have contributed to GBFS over the past 4 years.Pilot analysis on trends in GBFS data was carried out withthe assistance of Nigel Clark and Steve Freeman. Withouttheir work, this research would not have been possible.Graham Austin, Chas Holt, Nicki Read and Mike Tomshelped with data preparation. Thanks also to MarkEaton for some useful comments on the manuscript. Weare grateful to the British Atmospheric Data Centre whoprovided us with access to the Met Office Land SurfaceObservation Stations Data to obtain temperature data.Finally, we are most grateful to the Leverhulme Trust forfunding this research.
REFERENCES
Anonymous. 1999. A Better Quality of Life − a Strategy forSustainable Development for the United Kingdom. London:Department for Environment, Transport and the Regions.
Cannon, A.R. 1998. Garden Birdwatch Handbook. Thetford:British Trust for Ornithology.
Cannon, A.R. 1999. The significance of private gardens for birdconservation. Bird Conserv. Int. 9: 287–297.
Cowie, R.J. & Hinsley, S.A. 1988. The provision of food and theuse of bird feeders in suburban gardens. Bird Study 35: 163–168.
Cramp, S. 1993. The Birds of the Western Palearctic, Vol. 7.Oxford: Oxford University Press.

574 D. E. Chamberlain et al.
© 2005 British Ornithologists’ Union, Ibis, 147, 563–575
Crick, H.Q.P., Robinson, R.A., Appleton, G.F., Clark, N.A. &Rickard, A.D. (eds). 2002. Investigation Into the Causes ofthe Decline of Starlings and House Sparrows in Great Britain.Thetford: British Trust for Ornithology.
Evans, A.D. & Smith, K.W. 1994. Habitat selection of Cirl BuntingsEmberiza cirlus wintering in Britain. Bird Study 41: 81–87.
Flury, B.D. & Levri, E.P. 1999. Periodic logistic regression.Ecology 80: 2254–2260.
Gillings, S. & Fuller, R.J. 2001. Habitat preferences of SkylarksAlauda arvensis wintering in Britain in 1997/98. Bird Study48: 293–307.
Glue, D.E. 1982. The Garden Bird Book. London: MacMillan.Gregory, R.D. & Baillie, S.R. 1998. Large-scale habitat use of
some declining British birds. J. Appl. Ecol. 35: 785–799.Gregory, R.D. & Marchant, J.H. 1996. Population trends of
Jays, Magpies, Jackdaws and Carrion Crows in the UnitedKingdom. Bird Study 43: 28–37.
Lack, P.C. 1986. The Atlas of Wintering Birds in Britain andIreland. Calton: Poyser.
LePage, D. & Francis, C.M. 2002. Do feeder counts reliably indi-cate bird population changes? 21 years of winter bird countsin Ontario, Canada. Condor 104: 255–270.
Marchant, J.H., Hudson, R., Carter, S.P. & Whittington, P.A.1990. Population Trends in British Breeding Birds. Thetford:British Trust for Ornithology.
Newton, I. 1986. The Sparrowhawk. Calton: Poyser.O’Connor, R.J. & Shrubb, M. 1986. Farming and Birds.
Cambridge: Cambridge University Press.Peach, W.J., Siriwardena, G.M. & Gregory, R.D. 1999. Long-
term changes in overwinter survival rates explain the declineof Reed Buntings in Britain. J. Appl. Ecol. 36: 798–811.
Raven, M.J., Noble, D.G. & Baillie, S.R. 2003. The BreedingBird Survey 2002. British Trust for Ornithology, Thetford.
Robinson, R.A., Siriwardena, G.M. & Crick, H.Q.P. 2005.Size and trends of the House Sparrow Passer domesticuspopulation in Great Britain. Ibis 147 doi: 10.1111/j.1474-919x.2005.00427.x.
Shrubb, M. 2003. Birds, Scythes and Combines. Cambridge:Cambridge University Press.
Siriwardena, G.M., Baillie, S.R. & Wilson, J.D. 1999. Temporalvariation in the annual survival rates of six granivorousbirds with contrasting population trends. Ibis 141: 621–636.
Toms, M. 2003. The BTO/CJ Garden Birdwatch Book. Thetford:British Trust for Ornithology.
Vickery, J.A., Bradbury, R.B., Henderson, I.G., Eaton, M.A. &Grice, P.V. 2004. The role of agri-environment schemes andfarm management practices in reversing the decline of farm-land birds in England. Biol. Cons. 119: 19–39.
Wells, J.V., Rosenberg, K.V., Dunn, E.H., Tessaglia, D.H. &Dhondt, A.A. 1998. Feeder counts as indicators of spatialand temporal variation in winter abundance of resident birds.J. Field Orn. 69: 577–586.
Wernham, C.V., Toms, M.P., Marchant, J.H., Clark, J.A.,Siriwardena, G.M. & Baillie, S.R. (eds) 2002. The MigrationAtlas: Movements of the Birds of Britain and Ireland. London:T. & A.D. Poyser.
Wilson, J.D., Taylor, R. & Muirhead, L.B. 1996. Field use byfarmland birds in winter: an analysis of field type preferencesusing resampling methods. Bird Study 43: 320–332.
Received 7 July 2004; revision accepted 14 January 2005.
Supplementary material
Full data sets are available as part of the fulltext version of this paper online at www.blackwell-synergy.com

© 2005 British Ornithologists’ Union, Ibis, 147, 563–575
Garden feeders use by birds in winter 575
Appendix 1 Full model details. Parameter estimates for significant (P < 0.05) variables, number of sites and model dispersion(deviance/degrees of freedom) for 41 species. Sweek = sin[2 × π × (week/26)], Cweek = cos[2 × π × (week/26)], Int = intercept,D = deviance/degrees of freedom. n = 458 sites in each case with the exception of Blackcap (n = 248), Goldcrest (n = 160), Tree Sparrow(n = 132), Reed Bunting (n = 180) and Yellowhammer (n = 113) where model fit was improved when sites where the species had neverbeen recorded were omitted.
Species Year Year2 Sweek CweekSweek *year
Cweek *year
Cweek *Sweek Int D
Sparrowhawk 0.625 −0.003 −2.171 0.023 −0.237 −34.71 0.43Black-headed Gull 0.661 −0.004 −1.023 −0.488 0.009 −0.216 −31.05 0.59Great Spotted Woodpecker 0.046 −1.210 −0.224 0.013 −0.163 −5.85 0.79Feral Pigeon −0.435 0.003 −0.995 −0.283 0.009 0.003 −0.165 13.96 0.45Wood Pigeon −0.321 0.002 −0.300 0.083 −0.071 8.08 0.79Collared Dove 0.061 −0.135 −0.018 −0.093 −5.01 1.30Pied Wagtail −0.022 −0.003 −0.005 −0.100 −0.38 0.62Wren 0.022 0.468 −0.036 −0.004 0.061 −3.88 0.77Dunnock −0.236 0.001 −0.795 −0.833 0.006 0.006 −0.241 12.03 0.93Robin −0.243 0.002 −0.223 −0.471 −0.128 11.64 0.72Blackbird −0.874 −0.502 −0.454 1.89 0.77Song Thrush −0.0004 −0.763 −0.006 0.005 −0.318 2.31 1.15Mistle Thrush −0.0002 −0.465 −1.086 0.010 −0.163 −0.93 0.52Fieldfare 1.102 −0.007 −1.213 −1.169 −0.600 −50.64 0.16Redwing 0.904 −0.005 −0.864 −0.010 −42.31 0.16Goldcrest 0.0002 −0.006 −4.91 1.49Blackcap 0.0002 1.678 −0.011 −0.020 −0.413 −4.91 0.40Blue Tit −0.327 0.0019 −1.553 −1.637 0.016 0.014 −0.367 17.20 1.37Great Tit −0.219 0.001 −1.215 −0.757 −0.014 0.006 −0.147 10.61 0.96Coal Tit −0.512 0.003 −1.109 −0.573 0.014 0.004 −0.127 20.76 1.36Marsh/Willow Tit −0.645 0.004 −0.818 −0.191 0.009 −0.143 25.58 0.58Long-tailed Tit −0.616 0.004 −0.203 −0.009 −0.282 19.52 0.43Nuthatch −0.278 0.002 −0.468 −0.442 0.005 0.004 −0.097 8.66 0.65Treecreeper −0.331 −0.228 −4.87 0.09Jay 0.585 −0.003 −0.209 −0.198 −29.21 0.41Magpie 0.510 −0.003 −0.486 0.001 0.004 −0.061 −26.20 1.16Carrion Crow 0.065 −0.595 −0.476 0.006 0.005 −0.164 −8.24 0.53Rook −0.314 0.002 −0.793 −0.474 0.007 0.006 −0.160 9.68 0.45Jackdaw −0.369 0.002 −0.370 −0.279 0.003 0.002 −0.112 12.25 0.94Starling 0.228 −0.002 −0.235 −0.322 −0.230 −6.41 1.01House Sparrow 0.374 −0.002 −0.349 −0.839 0.004 0.009 −0.061 −12.00 0.75Tree Sparrow 0.0001 −1.055 −0.043 0.010 −0.089 −2.81 0.80Chaffinch 0.0002 −1.956 −0.296 0.017 −0.462 −0.42 1.05Brambling 0.909 −0.005 −3.375 −0.027 0.001 −0.322 −45.96 0.20Greenfinch −0.457 0.003 −2.336 −1.447 0.023 0.014 −0.350 18.66 1.17Goldfinch −1.204 0.008 2.891 0.115 −0.034 −0.203 42.95 0.33Linnet −2.055 0.030 −6.27 0.03Siskin 0.633 −0.003 1.786 −0.012 −0.014 −0.257 −34.68 0.45Bullfinch −0.468 0.003 −0.479 −0.832 0.007 −0.203 17.15 0.26Yellowhammer 0.0004 −0.683 −0.244 −5.52 0.52Reed Bunting 0.648 −0.0037 −0.857 −0.472 −31.33 0.45
Copyright © 2022 FDOKUMEN