Annales D 905 Remes DISS.pdf - UTUPub
112
TURUN YLIOPISTON JULKAISUJA ANNALES UNIVERSITATIS TURKUENSIS SARJA - SER. D OSA - TOM. 905 MEDICA - ODONTOLOGICA TURUN YLIOPISTO UNIVERSITY OF TURKU Turku 2010 SURVIVAL AND QUALITY OF LIFE AMONG PATIENTS WITH SEVERE LOWER EXTREMITY PERIPHERAL ARTERIAL DISEASE by Leena Remes
-
Upload
khangminh22 -
Category
Documents
-
view
4 -
download
0
Transcript of Annales D 905 Remes DISS.pdf - UTUPub
TURUN YLIOPISTON JULKAISUJAANNALES UNIVERSITATIS TURKUENSIS
SARJA - SER. D OSA - TOM. 905
MEDICA - ODONTOLOGICA
TURUN YLIOPISTOUNIVERSITY OF TURKU
Turku 2010
SURVIVAL AND QUALITY OF LIFE AMONG PATIENTS WITH SEVERE LOWER EXTREMITY PERIPHERAL
ARTERIAL DISEASE
by
Leena Remes
University of Turku, Departments of Public Health, General Practice and Geriatrics, Turku, Finland Turku University Hospital, Unit of General Practice, Turku, Finland Turku City Hospital, Turku, Finland Supervised by
Päivi Rautava Professor University of Turku, Department of Public Health Turku University Hospital, Clinical Research Centre Raimo Isoaho Adj. professor, Docent Nordic School of Public Health, Gothenburg, Sweden University of Turku, Department of General Practice
Reviewed by
Fausto Biancari Docent Oulu University Hospital, Oulu, Finland and Timo Pohjolainen Docent Orton Invalidisäätiö, Helsinki, Finland
Opponent:
Mauri Kallinen Docent Central Finland Central Hospital, Jyväskylä, Finland
ISBN 978-951-29-4304-3 (PRINT) ISBN 978-951-29-4305-0 (PDF) ISSN 0355-9483 Painosalama Oy – Turku, Finland 2010

To Mira, Markus and Linnea
4
ABSTRACT
Leena Remes
Survival and quality of life among patients with severe lower extremity peripheral arterial disease University of Turku, Departments of Public Health, General Practice and Geriatrics
Annales Universitatis Turkuensis, Medica-Odontologica, 2010, Ser D, Turku, Finland
Lower extremity peripheral arterial disease (PAD) is associated with decreased functional status, diminished quality of life (QoL), amputation, myocardial infarction, stroke, and death. Nevertheless, public awareness of PAD as a morbid and mortal disease is low. The aim of this study was to assess the incidence of major lower extremity amputation due to PAD, the extent of reamputations, and survival after major lower extremity amputation (LEA) in a population based PAD patient cohort. Furthermore, the aim was to assess the functional capacity in patients with LEA, and the QoL after lower extremity revascularization and major amputation.
All 210 amputees due to PAD in 1998–2002 and all 519 revascularized patients in 1998–2003 were explored. 59 amputees alive in 2004 were interviewed using a structured questionnaire of QoL. Two of each amputee age-, gender- and domicile-matched controls filled in and returned postal self-administered QoL questionnaire as well as 231 revascularized PAD patients (the amount of these patients who engaged themselves to the study), and one control person for each patient completed postal self-administered QoL questionnaire.
The incidence rate of major LEA was 24.1/100 000 person-years and it was considerably high during the years studied. The one-month mortality rate was 21%, 52% at one-year, and the overall mortality rate was 80%. When comparing the one-year mortality risk of amputees, LEAs were associated with a 7.4-fold annual mortality risk compared with the reference population in Turku. Twenty-two patients (10%) had ipsilateral transversions from BK to AK amputation. Fifty patients (24%) ended up with a contralateral major LEA within two to four amputation operations. Three bilateral amputations were performed at the first major LEA operation. Of the 51 survivors returning home after their first major LEA, 36 (71%) received a prosthesis; (16/36, 44%) and were able to walk both in- and outdoors. Of the 68 patients who were discharged to institutional care, three (4%) had a prosthesis one year after LEA.
Both amputees and revascularized patients had poor physical functioning and significantly more depressive symptoms than their controls. Depressive symptoms were more common in the institutionalized amputees than the home-dwelling amputees. The surviving amputees and their controls had similar life satisfaction. The amputees felt themselves satisfied and contented, whether or not they lived in long-term care or at home. PAD patients who had undergone revascularizations had poorer QoL than their controls.
The revascularized patients’ responses on their perceived physical functioning gave an impression that these patients are in a declining life cycle and that revascularizations, even when successful, may not be sufficient to improve the overall function. It is possible that addressing rehabilitation issues earlier in the care may produce a more positive functional outcome. Depressive symptoms should be recognized and thoroughly considered at the same time the patients are recovering from their revascularization operation. Also primary care should develop proper follow-up, and community organizations should have exercise groups for those who are able to return home, since they very often live alone. In rehabilitation programs we should consider not only physical disability assessment but also QoL.
Keywords: Peripheral arterial disease, quality of life, major lower extremity amputation, incidence rate, survival, prosthetic ambulation, revascularization, case-control study.
5
TIIVISTELMÄ
Leena Remes
Vaikea-asteista alaraajojen valtimokovettumatautia sairastavien potilaiden eloonjääminen, toimintakyky ja elämänlaatu Turun yliopisto, kansanterveystieteen, yleislääketieteen ja geriatrian osastot
Annales Universitatis Turkuensis, Medica-Odontologica, 2010, Ser D, Turku, Suomi. Alaraajojen valtimokovettumatautia (ASO) sairastavien potilaiden fyysinen toimintakyky ja elämänlaatu heikentyvät taudin edetessä. Oireettomatkin ASO-tautia sairastavat kuolevat sydän- ja verisuoniperäisiin tauteihin muita useammin. Tämän tutkimuksen tavoitteena oli analysoida ASO-taudin takia tehtyjen reisi- ja sääriamputaatioiden ilmaantuvuus ja uusinta-amputaatioiden määrä. Lisäksi analysoitiin amputaatio-potilaiden eloonjääminen, fyysinen toimintakyky ja elämänlaatu sekä verisuonitoimenpiteissä olleiden ASO-potilaiden elämänlaatu.
Potilasaineiston muodostivat kaikki 210 vuosina 1998–2002 ASO-taudin takia amputoitua ja 519 verisuonitoimenpiteissä vuosina 1998–2003 ollutta turkulaista. Vuonna 2004 elossa olleet 59 amputoitua haastateltiin käyttäen strukturoitua lomaketta. Heidän elämänlaatuaan verrattiin 118 iän ja sukupuolen suhteen kaltaistetun turkulaisen elämänlaatuun. 519:stä verisuonitoimenpiteissä olleesta 231 täytti elämänlaatua käsittelevän kyselylomakkeen, samoin tekivät heidän 231 iän ja sukupuolen suhteen kaltaistettua verrokkiaan. Kyselylomake oli sama kuin amputoituja haastateltaessa käytetty lomake.
Reisi- ja sääriamputaatioiden ilmaantuvuus 24.1/100 000 henkilövuotta (ensimmäinen reisi- tai sääriamputaatio) oli vuosina 1998–2002 suhteellisen suuri. Amputoiduista 21 % kuoli ensimmäisen postoperatiivisen kuukauden aikana ja 52 % ensimmäisen vuoden aikana. Seuranta-ajan kuluessa, (1.1.1998–31.12.2006) 80 % amputoiduista oli kuollut. Amputoitujen ensimmäisen vuoden kuoleman riski oli 7.4-kertainen verrattuna samanikäisiin turkulaisiin. Ipsilateralinen reamputaatio (sääri-amputaatiosta reisiamputaatioksi) tehtiin 22 potilaalle (10 %), kontralateralisen alaraajan reamputaatio tehtiin 2-4 amputaatio-operaatiokerralla 50 potilaalle (24 %); kolmelle potilaalle tehtiin primaari bilateraalinen sääri- tai reisiamputaatio. Yhteensä 51 palasi ensimmäisen amputaationsa jälkeen kotiin. Heistä 36 (71 %) sai alaraajaproteesin. Näistä 36:sta 16 (44 %) pystyi kävelemään niin sisällä kuin ulkona. Laitoshoitoon joutuneesta 68 henkilöstä kolmella oli vuoden jälkeen käytössään alaraajaproteesi. Sekä amputoidut että alaraajojen valtimoiden leikkaus- tai pallolaajennustoimenpiteissä olleet kokivat fyysisen kuntonsa huonoksi. Heillä oli yleisemmin depressiivisiä oireita kuin verrokeilla. Laitoshoidossa olevilla amputoiduilla oli yleisemmin masennusoireita kuin kotona asuvilla amputoiduilla. Amputoidut olivat kuitenkin yhtä tyytyväisiä elämäänsä kuin heidän verrokkinsa riippumatta siitä, asuivatko he kotonaan vai laitoksessa. Verisuonitoimenpiteissä olleiden elämänlaatu oli kauttaaltaan huonompi kuin heidän verrokkiensa.
Onnistunutkaan verisuonitoimenpide ei parantanut potilaiden koettua toimintakykyä. On mahdollista, että jos ASO-potilaiden kuntouttavat toimenpiteet aloitettaisiin nykyistä aikaisemmin ja tehokkaammin, nämä henkilöt olisivat nykyistä paremmassa fyysisessä kunnossa. Potilaiden toipuessa verisuonitoimenpiteistä pitäisi myös masennusoireet ottaa huomioon ja pyrkiä hoitamaan niitä samanaikaisesti. ASO-potilaille olisi hyvä järjestää systemaattinen seuranta, esimerkiksi perusterveydenhuoltoon, koska perusterveyden-huolto vastaa kotisairaanhoidosta, ja terveyskeskuksen henkilökunta ja kotisairaanhoidon henkilökunta tekevät jo nytkin koordinoidusti yhteistyötä. Potilaille pitäisi järjestää kuntoryhmiä yhteistyössä kunnan liikuntatoimen kanssa, jolloin potilaat saisivat liikunnan lisäksi vertaistukea. Erityisesti yksinäisyydestä kärsivät hyötyisivät toiminnasta. Kuntoutuksessa tulisi fyysisen kunnon kohentamisen lisäksi ottaa huomioon potilaan itsensä kokema elämänlaatu sekä pyrkiä sen parantumiseen.
Avainsanat: Alaraajojen valtimokovettumatauti, elämänlaatu, reisi- ja sääriamputaatio, ilmaantuvuus, eloonjääminen, alaraajaproteesi, verisuonitoimenpide, tapaus-verrokki tutkimus.
6
CONTENTS
Abstract ..................................................................................................................................... 4 TIIVISTELMÄ ......................................................................................................................... 5 ABBREVIATIONS .................................................................................................................. 9 LIST OF ORIGINAL PUBLICATIONS ............................................................................. 11 1. INTRODUCTION ........................................................................................................... 12 2. REVIEW OF THE LITERATURE ............................................................................... 14
2.1. Epidemiology of lower extremity peripheral arterial disease .................................. 14 2.1.1 Peripheral arterial disease prevalence .......................................................... 14 2.1.2 Classification by the severity of peripheral arterial disease ......................... 17 2.1.3 Critical limb ischemia .................................................................................. 19 2.1.4 Acute limb ischemia .................................................................................... 19
2.2. Diagnosing peripheral arterial disease ..................................................................... 20 2.2.1 Ankle-brachial pressure index ..................................................................... 20 2.2.2 Comprehensive assessment of peripheral arterial disease patients .............. 21
2.2.2.1 Measuring cognitive ability ............................................................. 22 2.2.2.2 Measuring physical functional status .............................................. 22 2.2.2.3 Measuring quality of life .................................................................. 23
2.2.3 Examples of grading systems to predict the adverse events or survival after lower extremity revascularization ....................................................... 26
2.3. Treating peripheral arterial disease patients ............................................................ 28 2.3.1 Risk factor management/modification and treating comorbidites ............... 28 2.3.2 Exercise therapy ........................................................................................... 28 2.3.3 Invasive treatments ...................................................................................... 29
2.3.3.1 Lower extremity revascularization .................................................. 29 2.3.3.2 Major lower extremity amputation .................................................. 31
2.4. Mortality .................................................................................................................. 33 2.4.1 Mortality in critical limb ischemia ............................................................... 34 2.4.2 Mortality in acute limb ischemia ................................................................. 34 2.4.3 Mortality and its predictors after lower extremity revascularization ........... 34 2.4.4 Mortality and its predictors after lower extremity amputation .................... 35
2.5. Functional outcome and its predictors after invasive treatments in severe peripheral arterial disease ........................................................................................ 36 2.5.1 Discharge after lower extremity revascularization or major
amputation .................................................................................................... 36 2.5.2 Prosthesis usage predictors .......................................................................... 37
2.6. Quality of life outcome after invasive treatments in severe peripheral arterial disease ...................................................................................................................... 38 2.6.1 Expressed on a generic scale ........................................................................ 38 2.6.2 Expressed as patient’s perceived functional status of health ....................... 38 2.6.3 Expressed as patient’s perceived psychosocial status of health ................... 39
2.7. Summary .................................................................................................................. 40 3. AIMS OF THE STUDY .................................................................................................. 41 4. MATERIALS AND METHODS ................................................................................... 42
4.1. Study designs and settings ....................................................................................... 42 4.2. Study populations .................................................................................................... 42
4.2.1 Patients with major lower extremity amputation in studies I, II and III ...... 42 4.2.1.2 Patients in study II ........................................................................... 42
7
4.2.1.3 Patients and controls in study III ..................................................... 42 4.2.1.4 Patients and controls in study IV ..................................................... 44
4.3. Data collection ......................................................................................................... 45 4.3.1 Amputated patients and review of their medical records for studies I
and II ............................................................................................................ 45 4.3.1.1 Exclusion criteria ............................................................................. 46
4.3.2 Postal questionnaire data collection ............................................................. 46 4.3.3 Ankle-brachial pressure index ..................................................................... 46 4.3.4 Mini-Mental-State Examination .................................................................. 46
4.4. Outcomes ................................................................................................................. 47 4.5. Explanatory variables .............................................................................................. 47
4.5.1 Comorbidity ................................................................................................. 47 4.5.2 Final level of amputation ............................................................................. 48 4.5.3 Reamputation ............................................................................................... 48 4.5.4 Revascularization ......................................................................................... 48 4.5.5 Medication ................................................................................................... 48 4.5.6 Sociodemographics ...................................................................................... 48
4.6. Other, mainly descriptive variables ......................................................................... 49 4.6.1 Indications for amputation ........................................................................... 49 4.6.2 Prosthesis usage ........................................................................................... 49
4.7. Statistical analyses ................................................................................................... 49 4.8. Ethical considerations .............................................................................................. 51
5. RESULTS ......................................................................................................................... 52 5.1. Background medical record data of the patients in studies I-III .............................. 52 5.2. Background of the patients and their controls in study IV ...................................... 53 5.3. Study I ...................................................................................................................... 56
5.3.1 Incidence rates of amputation ...................................................................... 56 5.3.2 Amputation indications ................................................................................ 56 5.3.3 Mortality and its predictors .......................................................................... 56 5.3.4 Reamputations .............................................................................................. 57 5.3.5 Below knee/above knee -ratio ...................................................................... 59 5.3.6 Preventive revascularizations ....................................................................... 59
5.4. Study II .................................................................................................................... 59 5.4.1 Predictors for institutional care discharge .................................................... 59 5.4.2 Prosthesis usage among survivors ............................................................... 59
5.2.1.1 Ambulation capacity according to classification from class I to class V ........................................................................................ 63
5.5. Missing data while using patient records data (studies I and II) ............................. 63 5.6. Study III ................................................................................................................... 64
5.6.1 Health-related quality of life and functional well-being .............................. 65 5.4.1.1. Depressive symptoms ...................................................................... 65 5.4.1.2. Perceived state of health ................................................................. 66 5.4.1.3 Life satisfaction and perceived social support ................................. 69
5.7. Study IV ................................................................................................................... 69 5.7.1 Quality of life ............................................................................................... 69
6. DISCUSSION .................................................................................................................. 72 6.1. External and internal validity of the study ............................................................... 72
6.1.1 Strengths of the study ................................................................................... 72 6.1.2 Study limitations .......................................................................................... 72 6.1.3 Representativeness of the study samples ..................................................... 73
8
6.1.4 Importance of measuring the quality of life and the perceived functional status of patients ......................................................................... 73
6.2. Consideration of the findings ................................................................................... 74 6.2.1 Participants ................................................................................................... 74 6.2.2 The incidence rates of amputations .............................................................. 74 6.2.3 Mortality and its predicting factors .............................................................. 75 6.2.4 Reamputations .............................................................................................. 75 6.2.5 Institutionalization after major lower extremity amputation ....................... 75 6.2.6 Prosthesis usage ........................................................................................... 76
6.2.6.1 Prosthesis versus wheelchair use ..................................................... 76 6.2.7 Quality of life outcome ................................................................................ 77
6.2.7.1 Perceived physical functioning after amputation ............................ 77 6.2.7.2 Social support /importance of social network ................................. 78 6.2.7.3 Cognitive ability ............................................................................... 78 6.2.7.4 Depression and anxiety .................................................................... 78
7. CONCLUSIONS ............................................................................................................. 81 ACKNOWLEDGEMENTS ................................................................................................... 82 REFERENCES ....................................................................................................................... 84 APPENDICES ........................................................................................................................ 97 ORIGINAL PUBLICATIONS ............................................................................................ 113
9
ABBREVIATIONS
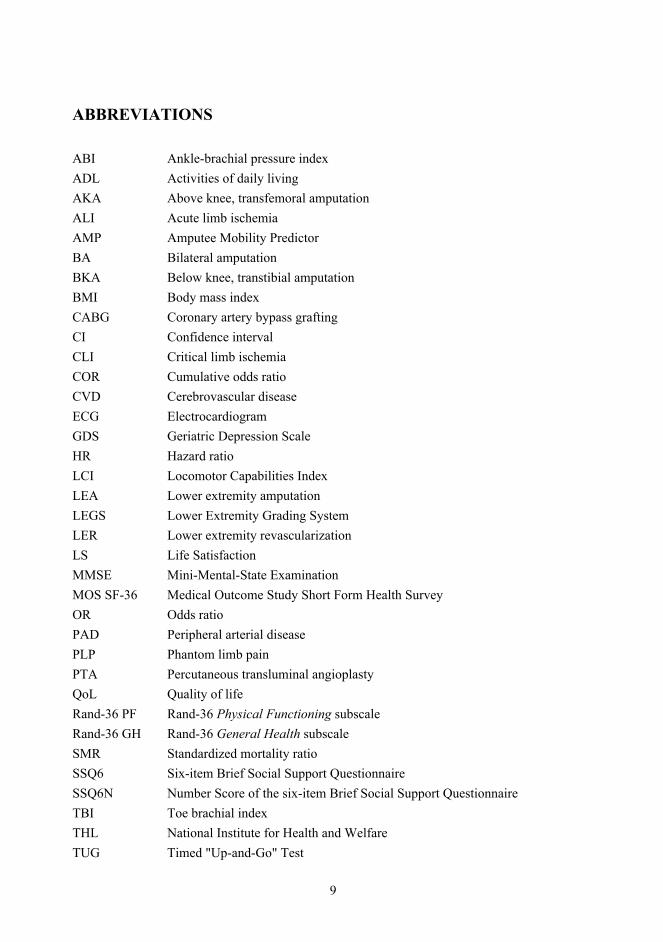
ABI Ankle-brachial pressure index ADL Activities of daily living AKA Above knee, transfemoral amputation ALI Acute limb ischemia AMP Amputee Mobility Predictor BA Bilateral amputation BKA Below knee, transtibial amputation BMI Body mass index CABG Coronary artery bypass grafting CI Confidence interval CLI Critical limb ischemia COR Cumulative odds ratio CVD Cerebrovascular disease ECG Electrocardiogram GDS Geriatric Depression Scale HR Hazard ratio LCI Locomotor Capabilities Index LEA Lower extremity amputation LEGS Lower Extremity Grading System LER Lower extremity revascularization LS Life Satisfaction MMSE Mini-Mental-State Examination MOS SF-36 Medical Outcome Study Short Form Health Survey OR Odds ratio PAD Peripheral arterial disease PLP Phantom limb pain PTA Percutaneous transluminal angioplasty QoL Quality of life Rand-36 PF Rand-36 Physical Functioning subscale Rand-36 GH Rand-36 General Health subscale SMR Standardized mortality ratio SSQ6 Six-item Brief Social Support Questionnaire SSQ6N Number Score of the six-item Brief Social Support Questionnaire TBI Toe brachial index THL National Institute for Health and Welfare TUG Timed "Up-and-Go" Test

10
WIQ Walking Impairment Questionnaire VO2max The maximal rate at which oxygen can be taken up, distributed and used by the
body during physical activity. VO2max is expressed in terms of milliliters of oxygen consumed per kilogram of body weight per minute.
15D HRQoL Fifteen dimension health-related quality of life 6 MW Six-Minute Walk Test
11
LIST OF ORIGINAL PUBLICATIONS
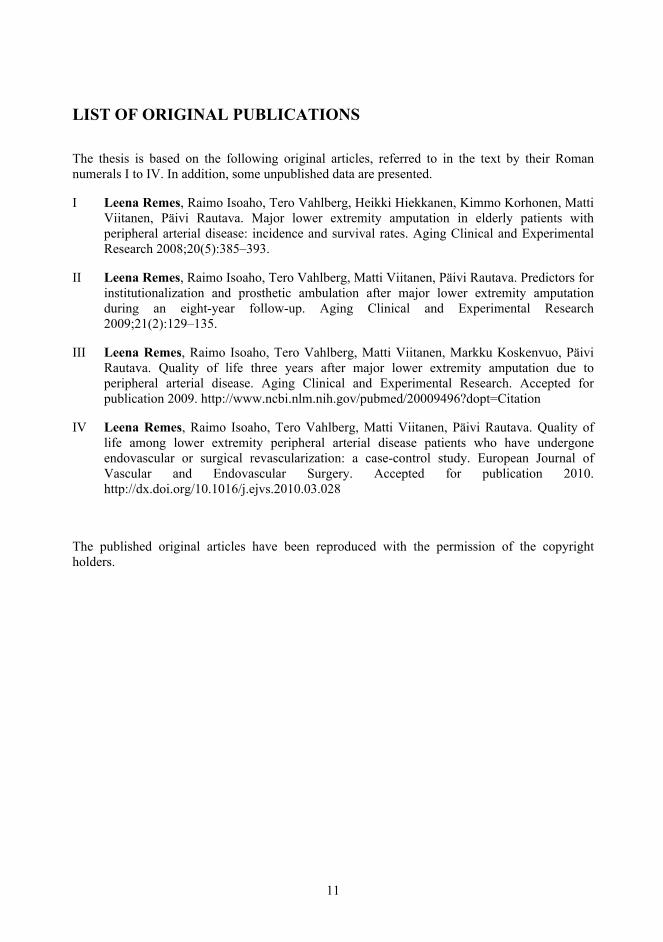
The thesis is based on the following original articles, referred to in the text by their Roman numerals I to IV. In addition, some unpublished data are presented.
I Leena Remes, Raimo Isoaho, Tero Vahlberg, Heikki Hiekkanen, Kimmo Korhonen, Matti Viitanen, Päivi Rautava. Major lower extremity amputation in elderly patients with peripheral arterial disease: incidence and survival rates. Aging Clinical and Experimental Research 2008;20(5):385–393.
II Leena Remes, Raimo Isoaho, Tero Vahlberg, Matti Viitanen, Päivi Rautava. Predictors for institutionalization and prosthetic ambulation after major lower extremity amputation during an eight-year follow-up. Aging Clinical and Experimental Research 2009;21(2):129–135.
III Leena Remes, Raimo Isoaho, Tero Vahlberg, Matti Viitanen, Markku Koskenvuo, Päivi Rautava. Quality of life three years after major lower extremity amputation due to peripheral arterial disease. Aging Clinical and Experimental Research. Accepted for publication 2009. http://www.ncbi.nlm.nih.gov/pubmed/20009496?dopt=Citation
IV Leena Remes, Raimo Isoaho, Tero Vahlberg, Matti Viitanen, Päivi Rautava. Quality of life among lower extremity peripheral arterial disease patients who have undergone endovascular or surgical revascularization: a case-control study. European Journal of Vascular and Endovascular Surgery. Accepted for publication 2010. http://dx.doi.org/10.1016/j.ejvs.2010.03.028
The published original articles have been reproduced with the permission of the copyright holders.
Introduction
12
In order to improve the QoL of patients with a severe or still less severe state of PAD, primary prevention of the disease should be the main target. Detecting asymptomatic arteriopathy, i.e. stage I of the Fontaine classification early enough, and treating PAD in time as well as PAD awareness amongst both health care professionals and the general population is required. PAD awareness is e.g. more monitoring of the ankle-brachial pressure index, particularly among diabetics, smokers, and the over 70s than is presently being done in order to detect PAD patients. ABI-measurements should be organized at health centers in the same way as ECGs.
1. INTRODUCTION
Peripheral arterial disease (PAD) is a manifestation of systemic atherosclerosis that is common and associated with an increased risk of death and ischemic events (Diehm et al., 2004a). The underdiagnosis of PAD among practicing physicians may be a barrier to the effective prevention of ischemic cardiovascular events associated with PAD (Hirsch et al., 2001; Hirsch et al., 2007). Diagnosing and identifying PAD could be improved by using a simple ankle-brachial pressure index (ABI) measurement (Kennedy et al., 2005; McDermott et al., 2004). Atherosclerosis risk factors are very prevalent in PAD patients, but these patients receive less intensive treatment for lipid disorders and hypertension and are prescribed antiplatelet therapy less frequently than patients with cerebrovascular and cardiovascular disease (Norgren et al., 2007).
PAD comprises obstruction of blood flow in arteries other than the coronary and intracranial vessels. Although the definition of PAD technically includes problems within the extracranial carotid, upper limb, visceral, and renal arteries, it is the circulation of the lower limbs that is most frequently involved (Ouriel, 2001). Atherosclerosis most often causes chronic PAD (Diehm et al., 2004a; Dormandy and Murray, 1991). Patients with PAD can be classified into groups according to symptom severity. One half of patients older than 55 years are asymptomatic (Diehm et al., 2004a). Of the symptomatic patients, approximately 40% experience intermittent claudication, and 10% have critical limb ischemia (CLI). Intermittent claudication results from poor oxygenation of the muscles of the lower extremities and is experienced typically as an aching pain, cramping, or numbness in the calf, buttock, hip, thigh, or arch of the foot. Symptoms are induced by walking or exercise, and are relieved by rest (Norgren et al., 2007). CLI is again the term used to designate the condition in which PAD has resulted in resting leg or foot pain, or in a breakdown of the skin of the leg or foot, causing ulcers or tissue loss (Lumsden et al., 2009).
Risk factors for PAD are similar to those for atherosclerosis in coronary and cerebrovascular beds. The two most important risk factors for PAD are cigarette smoking and diabetes (Hiatt et al., 1995). In addition, hypertension, dyslipidemia, elevated C-reactive protein, hyperviscosity and hypercoagulable states, hyperhomocysteinemia, and chronic renal insufficiency have been identified as risk factors (Kennedy et al., 2005). Until now there has been a constant lack of preventive strategies in decreasing vascular risk factors among patients with symptomatic PAD who are at an increased risk of recurrent vascular events (Aronow, 2005; Hirsch et al., 1997).
Asymptomatic PAD is a significant predictor of cardiovascular morbidity and mortality. In high-risk subjects, measurement of the ABI provides valuable information on future cardiovascular events. (Hooi et al., 2004) The ABI should become routine screening among patients with diabetes/and/or those who smoke (Eason et al., 2005).
Introduction
13
The survival of persons with symptomatic PAD is poor (Dormandy et al., 1999b; Hirsch et al., 2001). The annual cardiovascular mortality rate derived from epidemiological studies of patients with stable symptomatic PAD is 4–6% and is higher in those with a more severe disease (Criqui et al., 1992). For patients with CLI, the annual cardiovascular mortality rate is 25%, and may be as high as 45% in those who have undergone amputation (Criqui et al., 1992; Luther, 1994).
The outcome for patients undergoing intervention for CLI is determined by the measures of reconstruction patency and limb salvage. However, chronically ill patients with several comorbidities have easily defined functional, ambulatory impairments, which predict the survival (Taylor et al., 2006). The Six-Minute Walk Test provides prognostic information regarding mortality in persons with PAD also beyond that provided by the ABI (McDermott et al., 2008). Such functional health-related quality of life (HRQoL) measures as the Walking Impairment Questionnaire (WIQ) or the Rand-36 Physical Functioning subscale have discriminative ability to find the functional disabilities typical of PAD patients (Regensteiner et al., 2008).
Assessment of psychosocial status together with functional capacity in PAD patients is important. Depression is common in PAD (Smolderen et al., 2008; Thomas et al., 2004). Hence, depressive symptoms, may also be interpreted to explain the poor adherence to the recommended behavior and lifestyle changes (Kronish et al., 2006), which may in turn contribute to adverse physical outcomes in depressed patients with PAD (Smolderen et al., 2008). Cognitive impairment (Rafnsson et al., 2009) cannot be overlooked. It may e.g. hinder a prosthesis donning, and naturally community living, especially if the person lives alone. Assessing the important spectrum of quality of life (QoL), including the perceived social support, then becomes valuable.
Review of the Literature
14
2. REVIEW OF THE LITERATURE
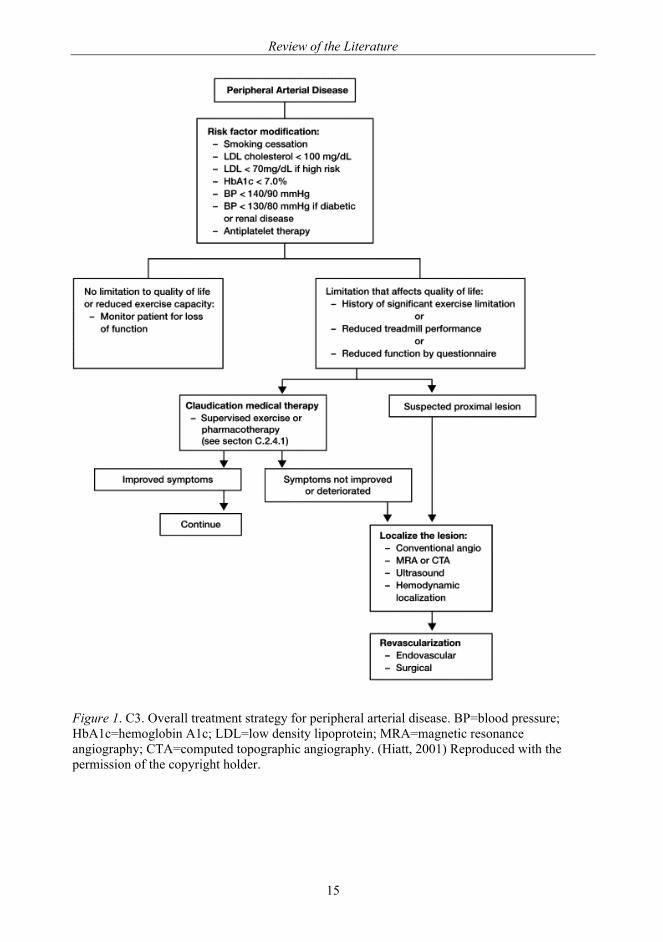
This review discusses the comprehensive way of assessing the QoL of patients with severe PAD. Existing recommendations for treating PAD are available for all, e.g. renewed TransAtlantic Inter-Society Consensus (TASC) (Dormandy and Rutherford, 2000; Norgren et al., 2007; Rutherford et al., 1997). The review describes a decision-making process based on the algorithm (Figure 1), which ends on a revascularization treatment. This thesis goes beyond the algorithm, to the prognosis after a lower extremity revascularization (LER) or amputation (LEA). The rehabilitation process after these interventions should proceed under the proper guidance of primary health care professionals and community according to the limits and visions planned multidisciplinarily, to assure the patient achieves the best possible quality of life, no matter how short his or her life would be.
2.1. Epidemiology of lower extremity peripheral arterial disease
2.1.1 Peripheral arterial disease prevalence
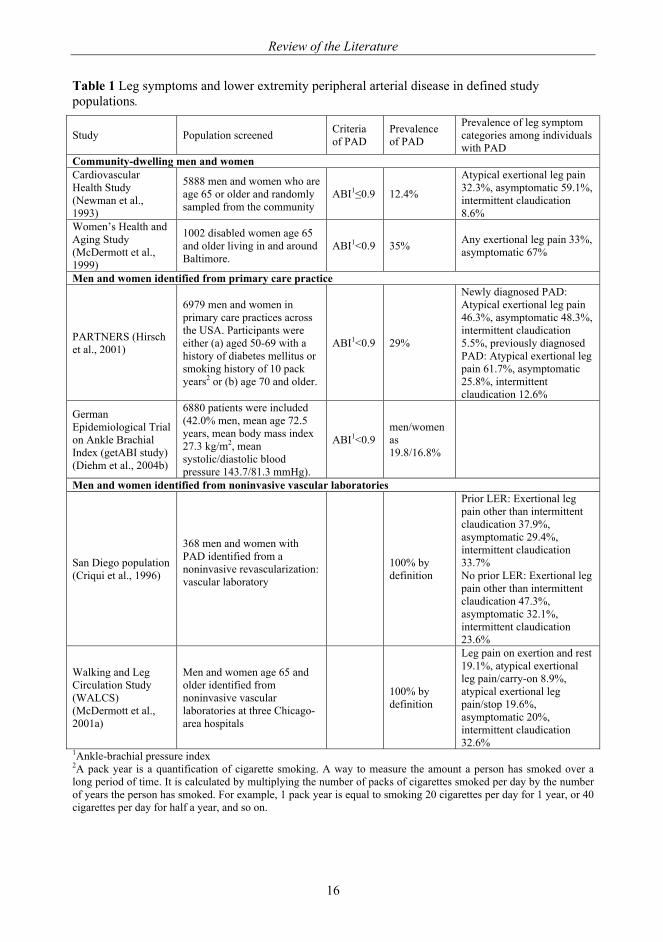
PAD prevalence is 2.5% at ages 40 to 59 years, 8.3% at ages 60 to 69 years, and 18.8% at ages 70 to 79 years. Prevalence is higher in men than in women. (Criqui et al., 1997). In the German Epidemiological Trial on Ankle Brachial Index Study (2002) a total of prevalence of PAD for men/women as indicated by AB1<0.9 was 19.8/16.8%, respectively. Patients with PAD were slightly older than patients without PAD and suffered more frequently from diabetes, hypertension, lipid disorders, and other coexisting atherothrombotic diseases, (any cerebrovascular event; any cardiovascular event) (Diehm et al., 2004b). Examples of PAD prevalence studies are presented in Table 1.
Review of the Literature
15
Figure 1. C3. Overall treatment strategy for peripheral arterial disease. BP=blood pressure; HbA1c=hemoglobin A1c; LDL=low density lipoprotein; MRA=magnetic resonance angiography; CTA=computed topographic angiography. (Hiatt, 2001) Reproduced with the permission of the copyright holder.
Review of the Literature
16
Table 1 Leg symptoms and lower extremity peripheral arterial disease in defined study populations.
Study Population screened Criteria of PAD
Prevalence of PAD
Prevalence of leg symptom categories among individuals with PAD
Community-dwelling men and women Cardiovascular Health Study (Newman et al., 1993)
5888 men and women who are age 65 or older and randomly sampled from the community
ABI1≤0.9 12.4%
Atypical exertional leg pain 32.3%, asymptomatic 59.1%, intermittent claudication 8.6%
Women’s Health and Aging Study (McDermott et al., 1999)
1002 disabled women age 65 and older living in and around Baltimore.
ABI1<0.9 35% Any exertional leg pain 33%, asymptomatic 67%
Men and women identified from primary care practice
PARTNERS (Hirsch et al., 2001)
6979 men and women in primary care practices across the USA. Participants were either (a) aged 50-69 with a history of diabetes mellitus or smoking history of 10 pack years2 or (b) age 70 and older.
ABI1<0.9 29%
Newly diagnosed PAD: Atypical exertional leg pain 46.3%, asymptomatic 48.3%, intermittent claudication 5.5%, previously diagnosed PAD: Atypical exertional leg pain 61.7%, asymptomatic 25.8%, intermittent claudication 12.6%
German Epidemiological Trial on Ankle Brachial Index (getABI study) (Diehm et al., 2004b)
6880 patients were included (42.0% men, mean age 72.5 years, mean body mass index 27.3 kg/m2, mean systolic/diastolic blood pressure 143.7/81.3 mmHg).
ABI1<0.9 men/women as 19.8/16.8%
Men and women identified from noninvasive vascular laboratories
San Diego population (Criqui et al., 1996)
368 men and women with PAD identified from a noninvasive revascularization: vascular laboratory
100% by definition
Prior LER: Exertional leg pain other than intermittent claudication 37.9%, asymptomatic 29.4%, intermittent claudication 33.7% No prior LER: Exertional leg pain other than intermittent claudication 47.3%, asymptomatic 32.1%, intermittent claudication 23.6%
Walking and Leg Circulation Study (WALCS) (McDermott et al., 2001a)
Men and women age 65 and older identified from noninvasive vascular laboratories at three Chicago-area hospitals
100% by definition
Leg pain on exertion and rest 19.1%, atypical exertional leg pain/carry-on 8.9%, atypical exertional leg pain/stop 19.6%, asymptomatic 20%, intermittent claudication 32.6%
1Ankle-brachial pressure index 2A pack year is a quantification of cigarette smoking. A way to measure the amount a person has smoked over a long period of time. It is calculated by multiplying the number of packs of cigarettes smoked per day by the number of years the person has smoked. For example, 1 pack year is equal to smoking 20 cigarettes per day for 1 year, or 40 cigarettes per day for half a year, and so on.
Review of the Literature
17
The prevalence of PAD increases with age, thus it is expected to increase in community as the population gets older (Diehm et al., 2004a).
2.1.2 Classification by the severity of peripheral arterial disease
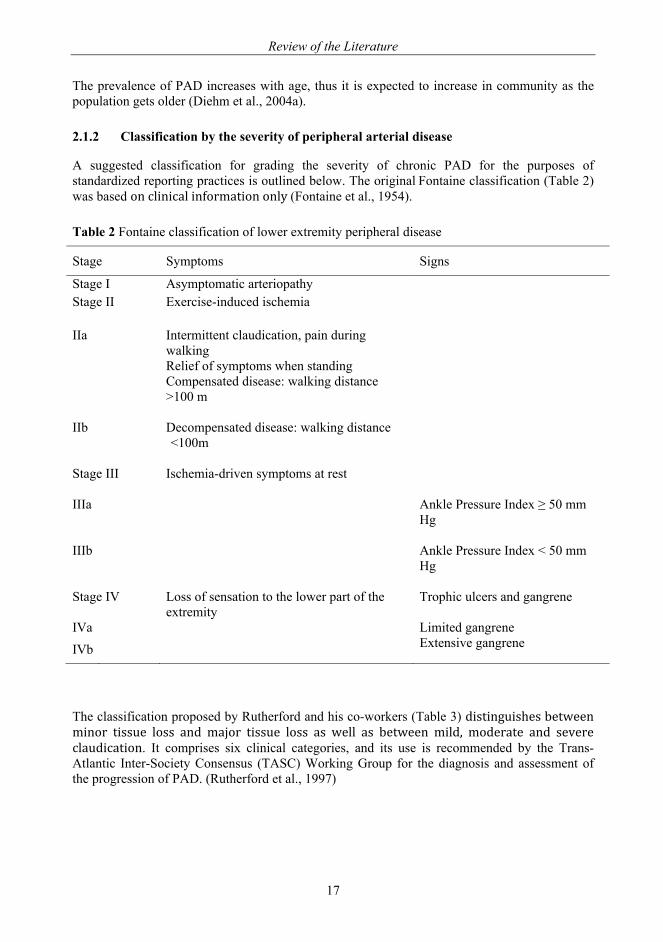
A suggested classification for grading the severity of chronic PAD for the purposes of standardized reporting practices is outlined below. The original Fontaine classification (Table 2) was based on clinical information only (Fontaine et al., 1954).
Table 2 Fontaine classification of lower extremity peripheral disease
Stage Symptoms Signs
Stage I Asymptomatic arteriopathy Stage II Exercise-induced ischemia
IIa Intermittent claudication, pain during walking
Relief of symptoms when standing
Compensated disease: walking distance >100 m
IIb Decompensated disease: walking distance <100m
Stage III
Ischemia-driven symptoms at rest
IIIa Ankle Pressure Index ≥ 50 mm Hg
IIIb Ankle Pressure Index < 50 mm Hg
Stage IV Loss of sensation to the lower part of the extremity
Trophic ulcers and gangrene
IVa Limited gangrene
IVb Extensive gangrene
The classification proposed by Rutherford and his co-workers (Table 3) distinguishes between minor tissue loss and major tissue loss as well as between mild, moderate and severe claudication. It comprises six clinical categories, and its use is recommended by the Trans-Atlantic Inter-Society Consensus (TASC) Working Group for the diagnosis and assessment of the progression of PAD. (Rutherford et al., 1997)
Review of the Literature
18
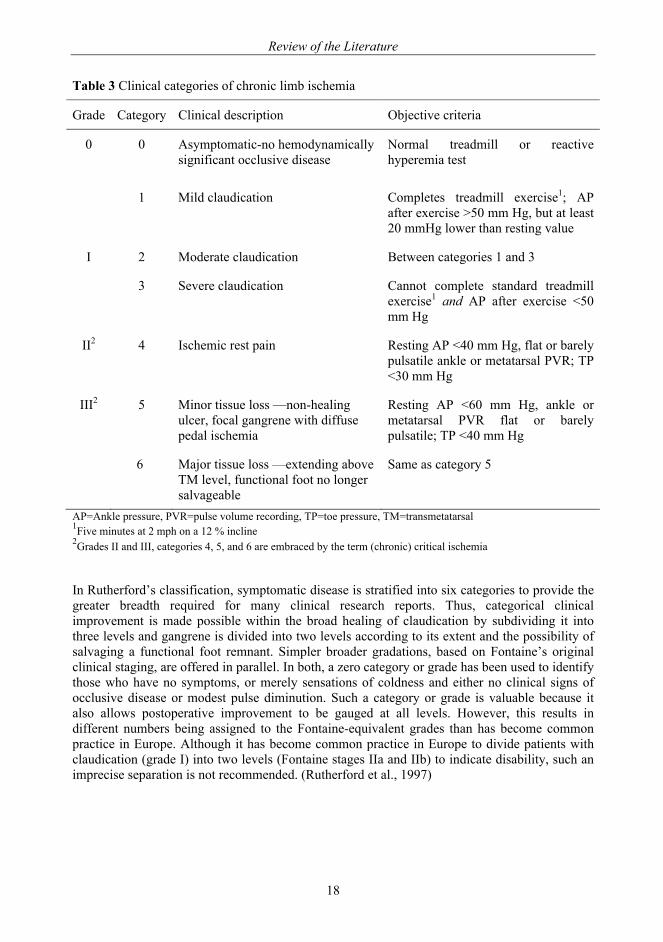
Table 3 Clinical categories of chronic limb ischemia
Grade Category Clinical description Objective criteria
0
0 Asymptomatic-no hemodynamically significant occlusive disease
Normal treadmill or reactive hyperemia test
1 Mild claudication Completes treadmill exercise1; AP after exercise >50 mm Hg, but at least 20 mmHg lower than resting value
I 2 Moderate claudication Between categories 1 and 3
3 Severe claudication Cannot complete standard treadmill exercise1 and AP after exercise <50 mm Hg
II2 4 Ischemic rest pain Resting AP <40 mm Hg, flat or barely pulsatile ankle or metatarsal PVR; TP <30 mm Hg
III2 5 Minor tissue loss —non-healing ulcer, focal gangrene with diffuse pedal ischemia
Resting AP <60 mm Hg, ankle or metatarsal PVR flat or barely pulsatile; TP <40 mm Hg
6 Major tissue loss —extending above TM level, functional foot no longer salvageable
Same as category 5
AP=Ankle pressure, PVR=pulse volume recording, TP=toe pressure, TM=transmetatarsal 1Five minutes at 2 mph on a 12 % incline 2Grades II and III, categories 4, 5, and 6 are embraced by the term (chronic) critical ischemia
In Rutherford’s classification, symptomatic disease is stratified into six categories to provide the greater breadth required for many clinical research reports. Thus, categorical clinical improvement is made possible within the broad healing of claudication by subdividing it into three levels and gangrene is divided into two levels according to its extent and the possibility of salvaging a functional foot remnant. Simpler broader gradations, based on Fontaine’s original clinical staging, are offered in parallel. In both, a zero category or grade has been used to identify those who have no symptoms, or merely sensations of coldness and either no clinical signs of occlusive disease or modest pulse diminution. Such a category or grade is valuable because it also allows postoperative improvement to be gauged at all levels. However, this results in different numbers being assigned to the Fontaine-equivalent grades than has become common practice in Europe. Although it has become common practice in Europe to divide patients with claudication (grade I) into two levels (Fontaine stages IIa and IIb) to indicate disability, such an imprecise separation is not recommended. (Rutherford et al., 1997)
Review of the Literature
19
2.1.3 Critical limb ischemia
Critical limb ischemia (CLI), i.e. Fontaine stages III and IV and Rutherford, category 4 and category 5 and 6, is associated with great loss of both limb and life. The majority of CLI patients (58-85%) have tissue loss or gangrene in their leg (Biancari et al., 2000). Reports on incidence of CLI have ranged from 500 to 1000 per million inhabitants per year, and the prevalence has been estimated to be 1 per 2500 inhabitants (Dormandy and Rutherford, 2000). In Finland, about 2600-5300 people have each year CLI (Albäck, 2009). Thirty per cent of the CLI patients have DM (Criqui et al., 1997).
2.1.4 Acute limb ischemia
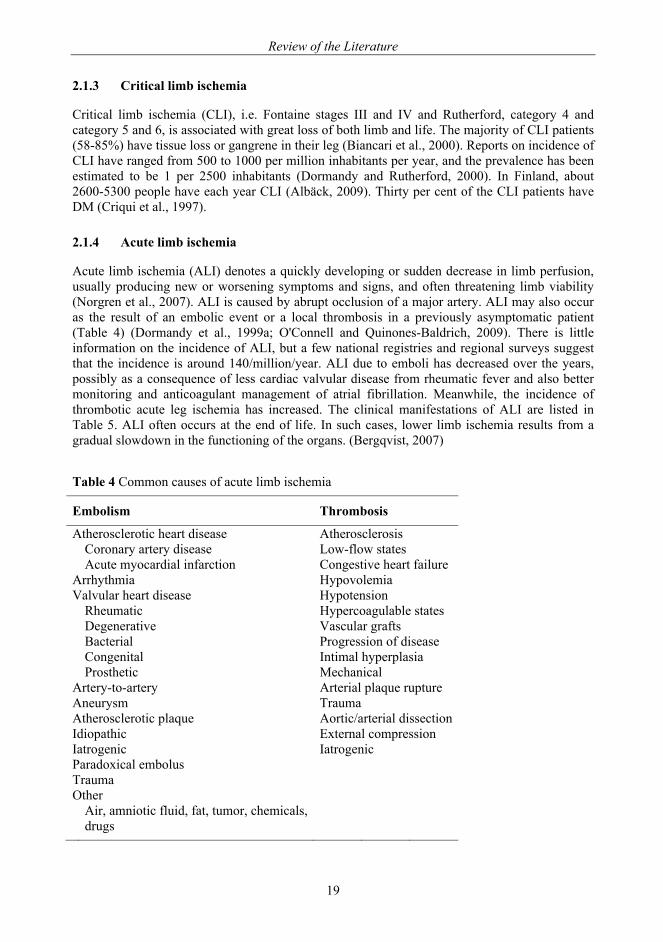
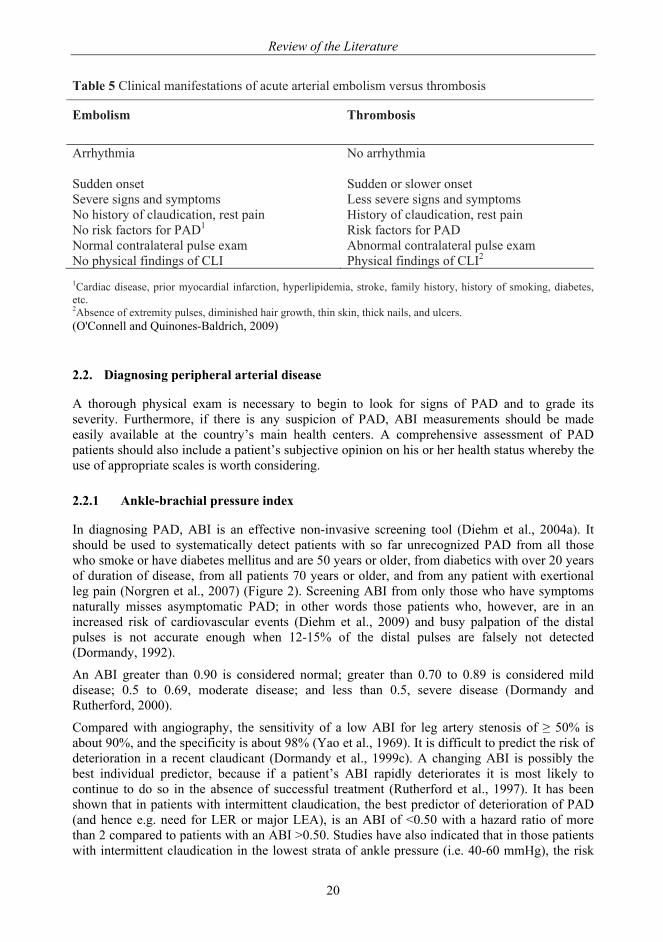
Acute limb ischemia (ALI) denotes a quickly developing or sudden decrease in limb perfusion, usually producing new or worsening symptoms and signs, and often threatening limb viability (Norgren et al., 2007). ALI is caused by abrupt occlusion of a major artery. ALI may also occur as the result of an embolic event or a local thrombosis in a previously asymptomatic patient (Table 4) (Dormandy et al., 1999a; O'Connell and Quinones-Baldrich, 2009). There is little information on the incidence of ALI, but a few national registries and regional surveys suggest that the incidence is around 140/million/year. ALI due to emboli has decreased over the years, possibly as a consequence of less cardiac valvular disease from rheumatic fever and also better monitoring and anticoagulant management of atrial fibrillation. Meanwhile, the incidence of thrombotic acute leg ischemia has increased. The clinical manifestations of ALI are listed in Table 5. ALI often occurs at the end of life. In such cases, lower limb ischemia results from a gradual slowdown in the functioning of the organs. (Bergqvist, 2007)
Table 4 Common causes of acute limb ischemia
Embolism Thrombosis
Atherosclerotic heart disease Atherosclerosis Coronary artery disease Low-flow states Acute myocardial infarction Congestive heart failure Arrhythmia Hypovolemia Valvular heart disease Hypotension Rheumatic Hypercoagulable states Degenerative Vascular grafts Bacterial Progression of disease Congenital Intimal hyperplasia Prosthetic Mechanical Artery-to-artery Arterial plaque rupture Aneurysm Trauma Atherosclerotic plaque Aortic/arterial dissectionIdiopathic External compression Iatrogenic Iatrogenic Paradoxical embolus Trauma Other Air, amniotic fluid, fat, tumor, chemicals,
drugs
Review of the Literature
20
Table 5 Clinical manifestations of acute arterial embolism versus thrombosis
Embolism
Thrombosis
Arrhythmia
No arrhythmia
Sudden onset Sudden or slower onset Severe signs and symptoms Less severe signs and symptoms No history of claudication, rest pain History of claudication, rest pain No risk factors for PAD1 Risk factors for PAD Normal contralateral pulse exam Abnormal contralateral pulse exam No physical findings of CLI Physical findings of CLI2
1Cardiac disease, prior myocardial infarction, hyperlipidemia, stroke, family history, history of smoking, diabetes, etc. 2Absence of extremity pulses, diminished hair growth, thin skin, thick nails, and ulcers. (O'Connell and Quinones-Baldrich, 2009)
2.2. Diagnosing peripheral arterial disease
A thorough physical exam is necessary to begin to look for signs of PAD and to grade its severity. Furthermore, if there is any suspicion of PAD, ABI measurements should be made easily available at the country’s main health centers. A comprehensive assessment of PAD patients should also include a patient’s subjective opinion on his or her health status whereby the use of appropriate scales is worth considering.
2.2.1 Ankle-brachial pressure index
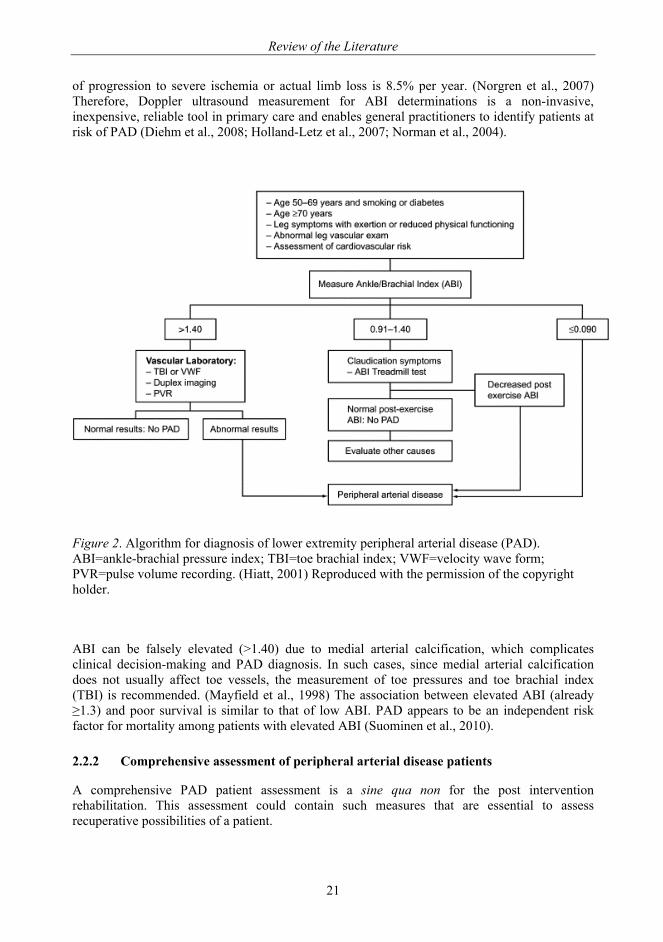
In diagnosing PAD, ABI is an effective non-invasive screening tool (Diehm et al., 2004a). It should be used to systematically detect patients with so far unrecognized PAD from all those who smoke or have diabetes mellitus and are 50 years or older, from diabetics with over 20 years of duration of disease, from all patients 70 years or older, and from any patient with exertional leg pain (Norgren et al., 2007) (Figure 2). Screening ABI from only those who have symptoms naturally misses asymptomatic PAD; in other words those patients who, however, are in an increased risk of cardiovascular events (Diehm et al., 2009) and busy palpation of the distal pulses is not accurate enough when 12-15% of the distal pulses are falsely not detected (Dormandy, 1992).
An ABI greater than 0.90 is considered normal; greater than 0.70 to 0.89 is considered mild disease; 0.5 to 0.69, moderate disease; and less than 0.5, severe disease (Dormandy and Rutherford, 2000).
Compared with angiography, the sensitivity of a low ABI for leg artery stenosis of ≥ 50% is about 90%, and the specificity is about 98% (Yao et al., 1969). It is difficult to predict the risk of deterioration in a recent claudicant (Dormandy et al., 1999c). A changing ABI is possibly the best individual predictor, because if a patient’s ABI rapidly deteriorates it is most likely to continue to do so in the absence of successful treatment (Rutherford et al., 1997). It has been shown that in patients with intermittent claudication, the best predictor of deterioration of PAD (and hence e.g. need for LER or major LEA), is an ABI of <0.50 with a hazard ratio of more than 2 compared to patients with an ABI >0.50. Studies have also indicated that in those patients with intermittent claudication in the lowest strata of ankle pressure (i.e. 40-60 mmHg), the risk
Review of the Literature
21
of progression to severe ischemia or actual limb loss is 8.5% per year. (Norgren et al., 2007) Therefore, Doppler ultrasound measurement for ABI determinations is a non-invasive, inexpensive, reliable tool in primary care and enables general practitioners to identify patients at risk of PAD (Diehm et al., 2008; Holland-Letz et al., 2007; Norman et al., 2004).
Figure 2. Algorithm for diagnosis of lower extremity peripheral arterial disease (PAD). ABI=ankle-brachial pressure index; TBI=toe brachial index; VWF=velocity wave form; PVR=pulse volume recording. (Hiatt, 2001) Reproduced with the permission of the copyright holder.
ABI can be falsely elevated (>1.40) due to medial arterial calcification, which complicates clinical decision-making and PAD diagnosis. In such cases, since medial arterial calcification does not usually affect toe vessels, the measurement of toe pressures and toe brachial index (TBI) is recommended. (Mayfield et al., 1998) The association between elevated ABI (already ≥1.3) and poor survival is similar to that of low ABI. PAD appears to be an independent risk factor for mortality among patients with elevated ABI (Suominen et al., 2010).
2.2.2 Comprehensive assessment of peripheral arterial disease patients
A comprehensive PAD patient assessment is a sine qua non for the post intervention rehabilitation. This assessment could contain such measures that are essential to assess recuperative possibilities of a patient.
Review of the Literature
22
2.2.2.1 Measuring cognitive ability
The Mini-Mental-State Examination (MMSE) (Folstein et al., 1975) is a very important scale for screening cognitive impairment of the elderly people. Sum scores of 24-30 are considered indicative of no cognitive impairment and 18-23 of mild and 0-17 of severe cognitive impairment (Tombaugh and McIntyre, 1992). Patient-based studies have shown that individuals with severe PAD tend to perform poorly on cognitive tests compared to controls (Tilvis et al., 2004). In population studies, PAD is associated with an increased cognitive decline independently of previous cerebrovascular disease and cardiovascular risk factors. A low ABI may be an early predictor of cognitive decline and of potential value in identifying individuals at increased risk of cognitive impairment. In patients with PAD, secondary preventive measures directed at decreasing the long-term systemic vascular complications may also be important to the preservation of cognitive health (Rafnsson et al., 2009).
2.2.2.2 Measuring physical functional status
If the assessment is performed multidisciplinarily, it should include all important measures to evaluate a possible PAD in the elderly patient. Most of the measures may also be found from the internet, e.g. as the Geriatric Examination Tool Kit (http://web.missouri.edu/~proste/tool/). The two tests below have been also used in validating the Locomotor Capabilities Index (LCI) and the Amputee Mobility Predictor (AMP). They are functional tests excellent for evaluating PAD (McDermott et al., 2008; Montgomery and Gardner, 1998).
Timed "Up-and-Go" Test
In the Timed "Up-and-Go" (TUG) Test the participant is asked to, as fast as possible, rise from a chair, walk three meters with his/her ordinary walking aid, turn around, walk back and sit down again in the chair and the result is measured in seconds. The TUG Test is easy to use in clinical settings and it has been shown to be valid and reliable in testing of function in an elderly population. (Podsiadlo and Richardson, 1991) The TUG Test is a reliable instrument with adequate concurrent validity to measure the physical mobility of patients with an amputation of the lower extremity (Schoppen et al., 1999).
Six-Minute Walk Test
The Six-Minute Walk Test (6 MW) gives a good impression of the remaining exercise capacity of an elderly patient with chronic heart failure, while a treadmill exercise test with VO2max measurement is difficult to accomplish. The 6 MW is on the other hand well correlated with the treadmill test. The 6 MW is also well tolerated by elderly patients (Peeters and Mets, 1996). The 6 MW yields highly reliable measurements, which are related to the functional and hemodynamic severity of PAD, in patients with intermittent claudication (Montgomery and Gardner, 1998). Walking performance in PAD patients who complete 6 minutes of walking is largely determined by a decline in walking velocity rather than slower initial walking velocity. ABI is more closely associated with cadence than step length (McDermott et al., 2001b). By studying 6 MW, in 2004, McDermott and her co-workers have found that the baseline ABI and the nature of leg symptoms predict the degree of functional decline, so that the lack of worsening in claudication symptoms over time in patients with PAD may be more related to declining functional performance than to the lack of disease progression (McDermott et al., 2004). In 2008, McDermott et al. have demonstrated that the supervised 6 MW among persons with PAD also predicts mortality independently of the ABI (McDermott et al., 2008).
Review of the Literature
23
Treadmill testing
Serial treadmill testing is an objective means of assessing changes in performance in patients with claudication. The two measures most commonly used to evaluate exercise performance on the treadmill are claudication-free walking time or distance and maximal, claudication-limited walking time or distance (absolute claudication distance). The latter measure is used most frequently in clinical trials as the primary end point. (Nehler et al., 2003b)
Evaluating prosthesis use capability
Several indices have been created in order to evaluate patients’ physical capability to use a prosthesis. These include, e.g.:
Locomotor Capabilities Index
The Locomotor Capabilities Index (LCI) consists of 14 items that measure one general construct, the locomotor capabilities with the prosthesis. Two subscales emerge from this general construct; basic abilities (7 items) and advanced abilities (7 items). The items inquire about the ability to perform activities and the level of independence while performing these activities. Each of the 14 items is graded on a 4-point ordinal scale; 0 (not able to), 1 (yes, with help from other person), 2 (yes, with supervision) and 3 (yes, independently). The total LCI score is the sum of the item scores and can range from 0 (worst) to 42 (best). Similarly, subscale scores for basic and advanced capabilities with the prosthesis can range from 0 to 21. The LCI is intended for self-administration but can also be administered in a face-to-face or telephone interview. The time needed to complete the LCI is approximately five minutes (Grise et al., 1993; Gauthier-Gagnon and Grise, 1994).
The Locomotor Capabilities Index is routinely used, e.g., in Orton, Helsinki, Finland (Määttänen, 2006).
Amputee Mobility Predictor
The Amputee Mobility Predictor (AMP) instrument is designed to measure ambulatory potential of lower-limb amputees with and without the use of a prosthesis. The AMP instrument is easy to administer in 15 minutes or less, with a simple scoring system, requiring very little equipment or space. It has a high inter- and intrarater reliability and appears to be a very practical clinical tool. Its high reliability suggests that, with proper training, multiple disciplines could administer the test with results that are consistent over time. (Gailey et al., 2002)
Prosthesis usage classification
In this classification, class I means ambulating with prosthesis and without any other walking aids outdoors and indoors, class II means ambulating with prosthesis indoors, but requiring one walking stick or crutch for outdoor activities, class III means independent indoors, ambulating with prosthesis and one crutch indoors, but requiring two crutches outdoors and occasionally a wheelchair, class IV means walking indoors with a prosthesis and two crutches or a walker, but requiring a wheelchair for outdoor activities, class V means walking indoors only short distances, but mostly a wheelchair user. Class VI means walking with aids, but without prosthesis, and a class VII patient ambulates with a wheelchair only. (Narang et al., 1984; Pohjolainen et al., 1990)
2.2.2.3 Measuring quality of life
QoL and health-related QoL (HRQoL) instruments abound in health care literature, but many appear to measure nothing more than what in previous decades was called health status (Dijkers,
Review of the Literature
24
2003). HRQoL assessments aim to provide a multidimensional measure of patient health with regards to illness and response to treatment, and include physical, emotional, and social domains (Criqui et al., 1992; Regensteiner and Steiner, 1990). Patient self-reported health-status questionnaires, whether filled out by patients or administered in by person or by phone, fall into two categories: (a) generic questionnaires designed to scale any burden of disease or disability and (b) disease specific questionnaires designed to measure health states related to a given medical condition. Generic questionnaires allow comparisons across many patient populations, whereas disease specific questionnaires are more sensitive to particular changes in the health burden of a particular condition. (Gallagher and Desmond, 2007)
Usually, PAD patients have multiple morbidities, and the assessment of QoL may give a more representative picture of the patient's perception of health than the exclusive measurement of walking performance. However, a number of unresolved questions prevent the use of QoL as a primary end point after intervention. Problem areas include choosing the most appropriate instrument, proper validation of scales, potential compositing of end points, and the definition of what magnitude of change with a specific QoL scale may be considered clinically relevant. At present, QoL should be assessed as a secondary end point (O'Neill, 1997).
Examples of generic quality of life instruments
Generic measures of QoL typically assess multiple health domains and can be used in the general population and across different patient populations (Garratt et al., 2002)
Medical Outcome Study Short Form 36 or Rand-36
The most widely used, validated, and reliable generic questionnaire is the Medical Outcome Study Short Form Health Survey (MOS SF-36) described and analyzed by Ware and Sherbourne (Ware and Sherbourne, 1992). The Rand-36 is identical to the MOS SF-36 (Aalto, 1999). This 36-item questionnaire, which refers to patients’ health over the previous four weeks, was originally designed to measure general health perceptions and eight particular dimensions of health: physical functioning, mental health, role-emotional functioning, role physical functioning, bodily pain, vitality/fatigue, and social functioning. The Physical Functioning subscale (PF) is based on a standardized, 10-item scale that asks respondents to rate their degree of difficulty in performing vigorous and moderate activities, lifting or carrying, climbing stairs, bending, kneeling or stooping, walking three distances (ranging from one block to one mile), and bathing or dressing. The 10 responses are scored from 0 (very limited in all 10 items) to 100 (not limited at all for all 10 items). It also correlates well (r=0.68) with 6 MW results in medically managed claudication patients (Bauman and Arthur, 1997).
15D health-related quality of life instrument
The 15D HRQoL instrument is widely used in Finland. It is a Finnish scale which reliability, validity, discriminatory power and responsiveness to change of its health state descriptive system and valuation system is described by Sintonen (Sintonen, 2001). The 15D is a non-disease specific, 15-dimensional, standardized and self-administered measure of HRQoL that can be used both as a profile and single index score measure.
HRQoL among elective coronary artery bypass grafting (CABG) patients has been evaluated by using the 15D instrument. CABG patients experience a significant improvement in their HRQoL within 6 months after the operation, and the effect remained through the observation period between 6 to 18 months, but in patients 75 years or over, the initial improvement of HRQoL returned to the preoperative level 18 months after the surgery. (Loponen et al., 2007).
Furthermore, the psychometric properties of the 15D HRQoL instrument are analyzed, and 15D is also found to be appropriate for measuring among patients with PAD. By using the 15D
Review of the Literature
25
instrument and the Nottingham Health Profile (NHP) instrument, Koivunen et al found that the HRQoL of middle-aged men with PAD was significantly poorer than that of their controls, and that male sex, retirement, asymptomatic walking distance, other atherosclerotic disease, lack of exercise, and feeling incapable of performing daily activities were also important causes of impaired HRQoL. (Koivunen and Lukkarinen, 2006)
Trinity Amputation and Prosthesis Experience Scales
The Trinity Amputation and Prosthesis Experience Scales (TAPES) is a multidimensional assessment of adaptation to amputation and prosthesis use developed specifically for use with individuals with lower limb amputations. The TAPES comprises three Psychosocial Adjustment subscales, three Activity Restriction subscales and three Prosthesis Satisfaction subscales. The final section of the TAPES includes an assessment of other medical problems and phantom and residual limb pain experience. Details of the psychometric characteristics and validity and reliability data can be found on the internet (The TAPES is freely available and can be downloaded at www.tcd.ie/psychoprosthetics). (Gallagher and Maclachlan, 2004)
An example of instruments for the perceived functional status
There are a number of subjective, patient self-reported methods being used to evaluate functional endpoints. These measures address functional endpoints that are crucial for patients who cope with difficulties such as crossing a busy street before a traffic light changes or putting on pants while standing. (Feinglass et al., 2000b)
Walking Impairment Questionnaire
Because PAD is associated with limited physical capacity and impaired functional status (Holtzman et al., 1999), the Walking Impairment Questionnaire (WIQ) is optimal in evaluating walking limitations in patients with PAD (Regensteiner and Steiner, 1990). It assesses the ability of individuals to walk defined distances (ranging from inside the home to five blocks, walking slowly to running or jogging) and speeds, and a 3-item scale of difficulty in climbing one to three flights of stairs.
In addition, the questionnaire evaluates symptoms (e.g. calf pain, shortness of breath, chest pain, joint pain) that could limit ambulation. The WIQ has been validated against treadmill walking as well as the 6 MW, 4-meter walking velocity test, and ABI. It is used to evaluate baseline functional status and efficacy of treatments for claudication.
Patients with particular comorbid conditions may provide characteristic responses to WIQ items (Feinglass et al., 1999). The WIQ therefore also assesses whether claudication, as opposed to other comorbidities, is indeed the most limiting symptom for patients’ walking ability. The WIQ walking distance and speed scores and PAD patients’ distance on supervised 6 MW and 4-meter walking velocity tests have reasonably high correlations (McDermott et al., 1998).
Examples of instruments for the perceived mental status
There are several depression screening tools, e.g., Center for Epidemiologic Study Depression Scale (Darnall et al., 2005), Beck Depression Inventory (Beck et al., 1961), and Zung Self-Rating Depression Scale (Zung, 1967). The screening tools and PAD’s association with depression is found in more detail in Pratt and her co-workers’ article (Pratt et al., 2005).
A screening of depression as e.g. by using Geriatric Depression Scale (GDS) (Yesavage et al., 1982) is essential in order to treat and support the PAD patient most properly. The relationship between depression and vascular disease should be understood as bidirectional (Vaccarino et al., 2001). Depression predisposes to later vascular disease and vascular disease may lead to or aggravate depressive symptoms (Thomas et al., 2004). A checklist assessing the amount of
Review of the Literature
26
depressive symptoms may be more useful than a dichotomous diagnosis. From a practical standpoint, the GDS test is easier to administer than a structured interview for clinical diagnosis of depression, and it does not require a mental health specialist. Therefore, it may provide a feasible means of identifying depressed patients with PAD who are in need of special attention. (Thomas et al., 2004) Among men and women with PAD, the prevalence of a clinically significant number of depressive symptoms measures by GDS is high, 12% - 24%. Greater numbers of depressive symptoms are associated with greater impairment in lower extremity functioning. (McDermott et al., 2003) PAD patients with depression are also at a significantly increased risk for coronary heart disease events and progression of contralateral PAD after their LER (Cherr et al., 2008).
Self-reported Life Satisfaction Score
A summary score for life satisfaction (LS) is defined as interest in life, happiness, loneliness, and general ease of living (scale range 4-20). The summary score may be divided in three categories: the satisfied (LS 4-6), the intermediate group (LS 7-11), and the dissatisfied (LS 12-20). (Koivumaa-Honkanen, 1998)
The role of self-reported life satisfaction in mortality with a prospective cohort study (1976-1995) has been investigated. A nationwide sample of healthy adults (18-64 years, n=22 461) from the Finnish Twin Cohort responded to a questionnaire about life satisfaction and known predictors of mortality in 1975. Dissatisfaction was found to associate with increased disease mortality, particularly in men with heavy alcohol use (hazard ratio=3.76, 95% CI: 1.61, 8.80). Women were not found to show similar associations between life satisfaction and mortality. Life dissatisfaction may predict mortality and serve as a general health risk indicator. The effect seems to be partially mediated through adverse health behavior. (Koivumaa-Honkanen et al., 2000)
Examples of instruments for the perceived social support
A variety of measures have been used to assess the effects of social support on physical and psychological well-being (Unden and Orth-Gomer, 1989). They include the Multidimensional Scale of Perceived Social Support (MSPSS) (Asano et al., 2008; Zimet et al., 1990) and Sarason’s social support questionnaire with 27 items or the short form of 6 items (SSQ6), which have number and satisfaction parts (Sarason, 1987).
The 6-item Brief Social Support Questionnaire (SSQ6) is an example of many perceived social support scales. Sarason’s Social Support Questionnaire has high internal validity (Sarason, 1987). The use of only the number part of the score has been utilized in previous studies in Finland. They represent large populations (Elovainio et al., 2003; Väänänen et al., 2008; Väänänen et al., 2005; Vahtera et al., 2002). The predictive value of the lack of social support, measured by using the SSQ6, has been shown on psychiatric morbidity (Morano et al., 1993; Pierce et al., 1992).
2.2.3 Examples of grading systems to predict the adverse events or survival after lower extremity revascularization
When decision-making is to be done with a severe PAD, some grading systems relying on long experience and scientific evidence are worthwhile.
1) A risk score has been collected from the Finnvasc registry. Diabetes, coronary artery disease, foot gangrene, and urgent operation, which are the most important predictors of 30-day postoperative mortality and/or a major LEA after infrainguinal surgical revascularization for CLI, comprise the score. The risk score has been developed by assigning one point to each of the
Review of the Literature
27
predictors. The score is validated, and the method is found to be useful in stratifying immediate postoperative outcome after infrainguinal surgical revascularization. (Biancari et al., 2007)
2) Prevent III (PIII) CLI is a risk score in infrainguinal bypass for amputation free survival after LER. There four points is given for dialysis, three points for tissue loss, and one point for both age ≥75 years and advanced coronary artery disease. A patient has got a low risk with ≤ 3 points, a medium risk at 4-7 points, high risk at ≥8 points for LEA (Schanzer et al., 2009; Schanzer et al., 2008)
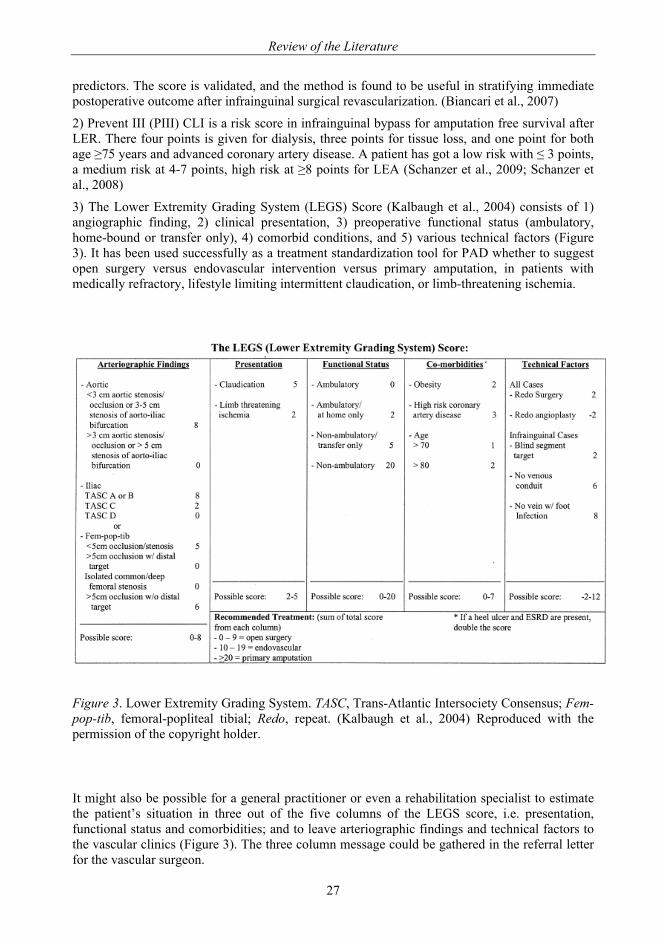
3) The Lower Extremity Grading System (LEGS) Score (Kalbaugh et al., 2004) consists of 1) angiographic finding, 2) clinical presentation, 3) preoperative functional status (ambulatory, home-bound or transfer only), 4) comorbid conditions, and 5) various technical factors (Figure 3). It has been used successfully as a treatment standardization tool for PAD whether to suggest open surgery versus endovascular intervention versus primary amputation, in patients with medically refractory, lifestyle limiting intermittent claudication, or limb-threatening ischemia.
Figure 3. Lower Extremity Grading System. TASC, Trans-Atlantic Intersociety Consensus; Fem-pop-tib, femoral-popliteal tibial; Redo, repeat. (Kalbaugh et al., 2004) Reproduced with the permission of the copyright holder.
It might also be possible for a general practitioner or even a rehabilitation specialist to estimate the patient’s situation in three out of the five columns of the LEGS score, i.e. presentation, functional status and comorbidities; and to leave arteriographic findings and technical factors to the vascular clinics (Figure 3). The three column message could be gathered in the referral letter for the vascular surgeon.
Review of the Literature
28
In all Fontaine classification’s stages, all PAD risk factors should be carefully recorded and evaluated during appointments. When we treat PAD patients, we do not only care about their medication, but also ask the patients about their smoking habits. If they do smoke, guidance to help them quit smoking should also be given. Ascertaining whether patients move daily, and instructing them to join exercise groups organized in the community is also vital.
2.3. Treating peripheral arterial disease patients
Comprehensive treatment of risk factors for cardiovascular disease in patients with atherosclerosis is fundamental. Smoking cessation is the most important measure for treating all types of vascular disease and cannot be overemphasized. Regular physical exercise and walking alleviates the symptoms of an existing PAD. Weight loss and physical activity also improve risk factors such as hypertension, high lipids, and high blood sugar.
All lifestyle changes should be regarded as a long-term investment, not as temporary restrictions or attitudes.
2.3.1 Risk factor management/modification and treating comorbidites
Modifiable risk factors that predispose individuals to PAD include active cigarette smoking, passive smoking, diabetes mellitus, hypertension, dyslipidemia, increased plasma homocysteine levels and hypothyroidism. Comorbidities such as hypertension, diabetes mellitus, dyslipidemia, and hypothyroidism require treatment. Statins reduce the incidence of intermittent claudication and improve exercise duration until the onset of intermittent claudication in people with PAD and hypercholesterolemia. Anti-platelet drugs such aspirin or especially clopidogrel, angiotensin-converting enzyme inhibitors and statins should be given to all patients with PAD. Beta blockers are recommended if a coronary artery disease is present. (Aronow, 2009) Patients with PAD do not achieve risk factor control as frequently as individuals with coronary heart disease or cerebrovascular disease. Improved risk factor control associates with a positive impact on 1-year cardiovascular event rates (Cacoub et al., 2009).
The medical management of patients with severe PAD is essential, even when their disease has led to an amputation. E.g. statins and antiplatelet agents are also then needed. (Bradley and Kirker, 2006)
2.3.2 Exercise therapy
Treatment options for intermittent claudication include bypass surgery, angioplasty and drug therapy, but the mainstay of treatment for many patients with mild-to-moderate claudication remains as advice "Stop smoking and keep walking" (Housley, 1988). Exercise therapy is a relatively inexpensive, low risk treatment, compared with interventional procedures (Oakley et al., 2008). Regular supervised exercise can improve walking distance (Gardner and Poehlman, 1995), and it should be made available as part of the initial treatment for all patients with PAD. The most effective programs employ treadmill or track walking that is of sufficient intensity to bring on claudication followed by rest over the course of a 30-60 minute session. Exercise sessions are typically conducted three times a week for 3 months. (Norgren et al., 2007) Exercise therapy should play an important part in the care of selected patients with intermittent claudication to improve walking times and distances. Effects are demonstrated following three months of supervised exercise although some programmes have lasted over one year. There are limited data to suggest that an effect is sustained for up to two years. (Watson et al., 2008)
Review of the Literature
29
2.3.3 Invasive treatments
Invasive treatments are presented here as LERs and LEAs. The increasing safety of vascular interventions should be considered when deciding which patients to treat, but with the caveat that endovascular interventions are not always safer than open repair (Nowygrod et al., 2006).
2.3.3.1 Lower extremity revascularization
LER is indicated to prevent limb loss in patients with CLI caused by arterial occlusive disease, including patients with chronic distal leg wounds (a non-healing amputation site or ulcers that fail to heal over time), wet or dry gangrene of the toes and forefoot, or ischemic rest pain (Feinglass et al., 2000b). Revascularization to improve blood flow can be either open or endovascular. Open revascularization is surgical reconstruction of the artery by means of bypass, endarterectomy or thromboembolectomy. Bypass involves rerouting the stenosis or occlusion using a vein or synthetic vascular prosthesis, whereas endarterectomy involves surgical removal of stenotic or occlusive atherosclerotic lesion from inside the artery. Thromboembolectomy is the removal of clots from the artery either surgically (with Fogarty’s catheters) or endovascularily (by aspiration catheters).
Patients with thrombotic or macroembolic events should also be considered candidates for urgent reconstructive surgery. Arterial reconstructive surgery is often undertaken in selected patients with severe, disabling intermittent claudication. Patients with non-healing wounds, gangrene, or ischemic rest pain are likely to harbor occlusive disease at multiple levels. These patients may require staged arterial reconstruction. Patients with extensive tissue loss invariably require pulsatile blood flow to heal their wounds. Catheter-based interventional procedures, such as percutaneous transluminal angioplasty (PTA) of the aortoiliac segment, femoropopliteal segment as well as infrapopliteal arteries with or without stenting; have become established alternatives to surgical revascularization in recent years. (Feinglass et al., 2000b)
SBU Board of Directions and Scientific Advisory Committee, Sweden, / The Swedish Council on Technology Assessment in Health Care has made a systematic review ‘Peripheral Arterial Disease– Diagnosis and Treatment’, in 2007 (Bergqvist, 2007). In the summary the grade of evidence of revascularization interventions has been set as follows:
Proper exercise rehabilitation should be used for Fontaine class IIa and IIb and possibly rest pain/ class IIIa patients also together with social interventions and personal support.
Review of the Literature
30
C
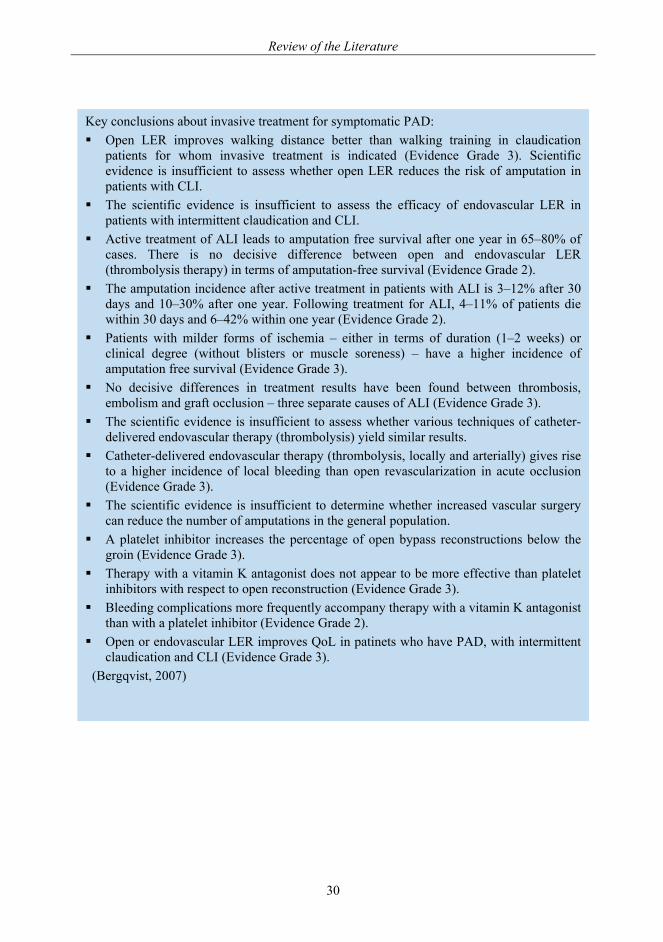
Key conclusions about invasive treatment for symptomatic PAD: Open LER improves walking distance better than walking training in claudication
patients for whom invasive treatment is indicated (Evidence Grade 3). Scientific evidence is insufficient to assess whether open LER reduces the risk of amputation in patients with CLI.
The scientific evidence is insufficient to assess the efficacy of endovascular LER in patients with intermittent claudication and CLI.
Active treatment of ALI leads to amputation free survival after one year in 65–80% of cases. There is no decisive difference between open and endovascular LER (thrombolysis therapy) in terms of amputation-free survival (Evidence Grade 2).
The amputation incidence after active treatment in patients with ALI is 3–12% after 30 days and 10–30% after one year. Following treatment for ALI, 4–11% of patients die within 30 days and 6–42% within one year (Evidence Grade 2).
Patients with milder forms of ischemia – either in terms of duration (1–2 weeks) or clinical degree (without blisters or muscle soreness) – have a higher incidence of amputation free survival (Evidence Grade 3).
No decisive differences in treatment results have been found between thrombosis, embolism and graft occlusion – three separate causes of ALI (Evidence Grade 3).
The scientific evidence is insufficient to assess whether various techniques of catheter-delivered endovascular therapy (thrombolysis) yield similar results.
Catheter-delivered endovascular therapy (thrombolysis, locally and arterially) gives rise to a higher incidence of local bleeding than open revascularization in acute occlusion (Evidence Grade 3).
The scientific evidence is insufficient to determine whether increased vascular surgery can reduce the number of amputations in the general population.
A platelet inhibitor increases the percentage of open bypass reconstructions below the groin (Evidence Grade 3).
Therapy with a vitamin K antagonist does not appear to be more effective than platelet inhibitors with respect to open reconstruction (Evidence Grade 3).
Bleeding complications more frequently accompany therapy with a vitamin K antagonist than with a platelet inhibitor (Evidence Grade 2).
Open or endovascular LER improves QoL in patinets who have PAD, with intermittent claudication and CLI (Evidence Grade 3).
(Bergqvist, 2007)
Review of the Literature
31
2.3.3.2 Major lower extremity amputation
According to the internet medical dictionary major lower extremity amputation is defined as “amputation, removal of an appending part (appendage), above the ankle joint”. Many reports, however, also consider amputation at the ankle joint to be considered as a major amputation. This level is mainly used in amputation due to trauma or congenital deformities (Pohjolainen, 1993).
Despite developments in balloon angioplasty and peripheral vascular bypass grafting, PAD accounts for 90% of the causes of the amputations in the elderly population (Fletcher et al., 2002). With the changes in population demographics, the number of individuals older than 65 continues to increase and the absolute number of geriatric patients with amputation might remain large (Feinglass et al., 1999; Fletcher et al., 2002). Individuals with diabetes have a 15- to 46-fold risk of all LEAs than those without (Armstrong et al., 1997). As to ABI recordings, patients with an ABI < 0.5 are more likely to require amputation (Marston et al., 2006).
Unfortunately, patients who present with CLI and physiologic impairments that preclude open surgery commonly also seem to have such comorbidities that blunt any functional advantage achieved after percutaneous transluminal angioplasty (PTA) for limb salvage. A PTA in that kind of a setting affords very little benefit compared with amputation alone. (Taylor et al., 2007b) Major tissue loss, end-state renal disease, diabetes mellitus, and non-ambulatory status are all such factors where treatment with primary amputation might be the choice rather than revascularization (Abou-Zamzam et al., 2007).
The goal of modern management of patients who have had an amputation is to restore the form and function of the limb in a way that optimizes QoL (Matsen et al., 2000). Therefore, amputation surgery should be the first step in the rehabilitation of a patient with a non-functional limb, rather than the final step in treatment (Pinzur et al., 2003). When faced with a difficult decision regarding LEA compared with attempted limb reconstruction, expectations for a reasonable outcome must be determined. After reasonable goals have been set, the surgery should be directed toward interfacing with a prosthetic limb. Current surgical techniques of LEA, paying special attention to transosseous versus disarticulation amputation, help to optimize prosthetic limb fitting and functional rehabilitation. (Pinzur et al., 2003)
Incidence of major lower extremity amputation In 2005, there were 1.6 million persons in the USA living with the loss of a limb. Of those subjects, 38% had an amputation secondary to PAD with a comorbid diagnosis of diabetes mellitus, (i.e. 608 000 persons). It is projected that the number of people living with the loss of a limb will more than double by the year 2050 to 3.6 million. If incidence rates secondary to PAD can be reduced by 10%, this number would be lowered by 225 000 (i.e. 3 375 000 US citizens with limb loss in 2050.) (Ziegler-Graham et al., 2008)
The reported incidence of LEA varies considerably between different Western countries, both between and within countries (Table 6). Variations in the clinical decisions made by vascular surgeons given to the same patient are likely to explain at least a part of the observed geographical variation in LEA rates. (Connelly et al., 2001)
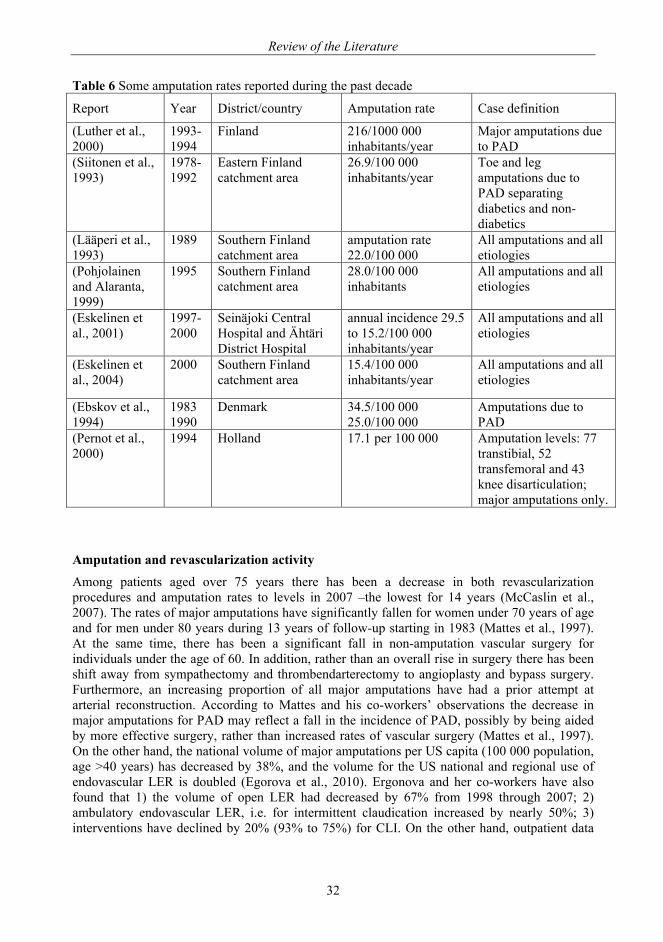
Review of the Literature
32
Table 6 Some amputation rates reported during the past decade
Report Year District/country Amputation rate Case definition
(Luther et al., 2000)
1993-1994
Finland 216/1000 000 inhabitants/year
Major amputations due to PAD
(Siitonen et al., 1993)
1978-1992
Eastern Finland catchment area
26.9/100 000 inhabitants/year
Toe and leg amputations due to PAD separating diabetics and non-diabetics
(Lääperi et al., 1993)
1989 Southern Finland catchment area
amputation rate 22.0/100 000
All amputations and all etiologies
(Pohjolainen and Alaranta, 1999)
1995 Southern Finland catchment area
28.0/100 000 inhabitants
All amputations and all etiologies
(Eskelinen et al., 2001)
1997- 2000
Seinäjoki Central Hospital and Ähtäri District Hospital
annual incidence 29.5 to 15.2/100 000 inhabitants/year
All amputations and all etiologies
(Eskelinen et al., 2004)
2000 Southern Finland catchment area
15.4/100 000 inhabitants/year
All amputations and all etiologies
(Ebskov et al., 1994)
1983 1990
Denmark 34.5/100 000 25.0/100 000
Amputations due to PAD
(Pernot et al., 2000)
1994 Holland 17.1 per 100 000 Amputation levels: 77 transtibial, 52 transfemoral and 43 knee disarticulation; major amputations only.
Amputation and revascularization activity
Among patients aged over 75 years there has been a decrease in both revascularization procedures and amputation rates to levels in 2007 –the lowest for 14 years (McCaslin et al., 2007). The rates of major amputations have significantly fallen for women under 70 years of age and for men under 80 years during 13 years of follow-up starting in 1983 (Mattes et al., 1997). At the same time, there has been a significant fall in non-amputation vascular surgery for individuals under the age of 60. In addition, rather than an overall rise in surgery there has been shift away from sympathectomy and thrombendarterectomy to angioplasty and bypass surgery. Furthermore, an increasing proportion of all major amputations have had a prior attempt at arterial reconstruction. According to Mattes and his co-workers’ observations the decrease in major amputations for PAD may reflect a fall in the incidence of PAD, possibly by being aided by more effective surgery, rather than increased rates of vascular surgery (Mattes et al., 1997). On the other hand, the national volume of major amputations per US capita (100 000 population, age >40 years) has decreased by 38%, and the volume for the US national and regional use of endovascular LER is doubled (Egorova et al., 2010). Ergonova and her co-workers have also found that 1) the volume of open LER had decreased by 67% from 1998 through 2007; 2) ambulatory endovascular LER, i.e. for intermittent claudication increased by nearly 50%; 3) interventions have declined by 20% (93% to 75%) for CLI. On the other hand, outpatient data
Review of the Literature
33
analysis has revealed a fivefold increase in vascular interventions for CLI and intermittent claudication, in the US, endovascular LER interventions have quadrupled (8% to 32%) for CLI and doubled (26% to 61%) for intermittent claudication. A parallel reduction has occurred in major amputations for patients with CLI (42% to 30%), for other PAD diagnoses (18% to 14%), and for intermittent claudication (0.9% to 0.3%). Surgical interventions for CLI have declined significantly for octogenarians from 317 to 240 per 100 000, but outpatient interventions have increased for CLI, intermittent claudication, and other diagnoses in all age groups. Comorbidities for patients treated have substantially increased, but for most procedures, cardiac and bleeding complications have significantly decreased during the last decade. It includes changes in medical management and wound care. In-hospital length of stay has declined there from 9.5 to 7.6 days and the percentage of short (1-2 day) hospitalizations has increased from 16% to 35%. The authors confess that the change appears to be largely due to the widespread and successful use of endovascular LER or to earlier intervention, or both, driven by the safety of these techniques. (Egorova et al., 2010)
Reamputations
Several studies have reported reamputation rates (Dillingham et al., 2005; Thomas et al., 2001). However, the results of these studies are too general to apply to individual patients; some studies combine reamputation episodes of both ipsilateral and contralateral limbs (Larsson et al., 1998) and others addressed reamputation of only one extremity (Bodily and Burgess, 1983). Izumi and his co-workers in the USA, in 2006 have defined a reamputation episode as the removal of bones to advance on amputation a level higher. Any soft tissue surgeries such as debridement, incision and drainage, or secondary closure are excluded, as well as revision surgeries performed at the same level. The last level of amputation is not counted as a reamputation if the amputation was performed on the same limb within a 2-week period. All minor and major amputations are included into their study protocol. They report on reamputation episodes for the ipsilateral and contralateral limbs performed on 277 diabetic patients after their first LEA between 1993 and 1997. The cumulative rates of reamputation per person were 26.7% at 1 year, 48.3% at 3 years, and 60.7% at 5 years, and hence of ipsilateral major LEA reamputation: 4.7, 11.8, and 13.3%, respectively, and for contralateral major LEA reamputation: 11.6, 44.1, and 53.3%. Their study showed that a patient is at the greatest risk for further same-limb amputation in the six months after the initial amputation. Their opinion was that although the risk to the contralateral limb rises steadily, it never meets the level of that of the ipsilateral limb. Therefore, the focus should be on preventive efforts and medical resources during individualized at-risk periods for patients undergoing first-time amputations. (Izumi et al., 2006)
In 1980, in Denmark, the incidence of ipsilateral reamputation was high in the immediate postoperative period with 10.4% after one month, 16.5% after three months and 18.8% after six months. Later ─after the amputation─ the incidence decreased and reached a total of 23.1% after four years. The risk of contralateral amputation was then 11.9% within one year, 17.8% after two years, 27.2% after three years, and finally 44.3% after four years. (Ebskov and Josephsen, 1980)
In some cases the selection of the original amputation level may leave patients with non-healing stumps, thereby necessitating reamputation. For an amputation to be successful patients must comply with wound care and off-loading, and careful discharge planning and patient education may be necessary for a better outcome in this period. (Izumi et al., 2006)
2.4. Mortality
PAD is associated with increased mortality. The severity of PAD by e.g. Fontaine classification and the comorbidities affect the mortality.
Review of the Literature
34
2.4.1 Mortality in critical limb ischemia
CLI is a serious condition if left untreated. If there is no chance for revascularization, the survival of the patient is poor, and the 1-year survival plus limb salvage is only 28% (Mätzke et al., 1996). Nevertheless, mortality is expected to be 20% within the first year of presentation, and 40–75% are likely to die within five years (Luther et al., 2000). Diabetes, smoking, and one or more cardiovascular risk factor [angina, myocardial infarction, arrhythmia and congestive heart disease (Eagle and Froehlich, 1996)] are all predictors of mortality in CLI. Patients with CLI have an elevated risk of future myocardial infarction, stroke, and vascular death, 3-fold higher than patients with intermittent claudication. (Novo et al., 2004)
2.4.2 Mortality in acute limb ischemia
Patients presenting with ALI continue to have a particularly severe short-term outlook both in terms of loss of the leg and mortality, with 30-day amputation rates of between 10% and 30% and a mortality rate of around 15%. A patient with an embolic cause for an ischemic leg is at a higher risk of death because of the associated underlying cardiac disease, whereas patients with a thrombotic cause are more likely to lose a limb. The fact that overall mortality rates after intervention for acute ischemia have not improved dramatically over the past 20 years no doubt reflects the severity of the underlying diseases in these high-risk patients (Dormandy et al., 1999a; O'Connell and Quinones-Baldrich, 2009)
2.4.3 Mortality and its predictors after lower extremity revascularization
Survival after LERs is poor, only a 60–70% five-year survival is reported in most surgical series (Duggan et al., 1994; Farkouh et al., 1994). This fact particularly complicates clinical decision-making for the oldest patients, who have the worst long-term prognosis but may require LERs to achieve a level of walking ability and exercise capacity consistent with maintaining general cardiovascular health (Taylor et al., 2005b).
At primary presentation, severe comorbidities, tissue loss, or the presence of gangrene, as well severe coronary heart disease (Schanzer et al., 2009), are bound to lead to poor outcome (Taylor et al., 2007a). Perioperative cardiac factors (age, preoperative risk level, early cardiac complications) are the primary determinants of patient longevity (Back et al., 2004). Thus, cardiovascular risk factor management in patients with CLI is important before revascularization (Bismuth et al., 2001; Schouten et al., 2010).
Diabetes plus poor perioperative glycaemic control associates with an unfavorable outcome after infrainguinal bypass surgery in diabetic patients (Malmstedt et al., 2006). Diabetes is associated with lower amputation-free survival after leg bypass for CLI. That is why patients with diabetes and limb ischemia need intensified treatment of diabetes-related risk factors to improve outcome (Malmstedt et al., 2008).
Renal insufficiency is a risk factor for poor outcome after infrainguinal bypass in patients with CLI (Arvela et al., 2008; Taylor et al., 2007a). Also patients with extracardiac arteriopathy, diabetes and decreased glomerular filtration rate at the time of coronary artery bypass grafting (CABG) are at risk for late lower limb ischemia. These patients would most benefit from closer follow-up for prevention of PAD and its related complications. (Biancari et al., 2008)
However, when taking into account the ambulatory ability at the time of presentation only impaired ambulatory ability associates with death in 70% of the patients in 5 years, and presence of dementia with late mortality in 73% (Taylor et al., 2006).
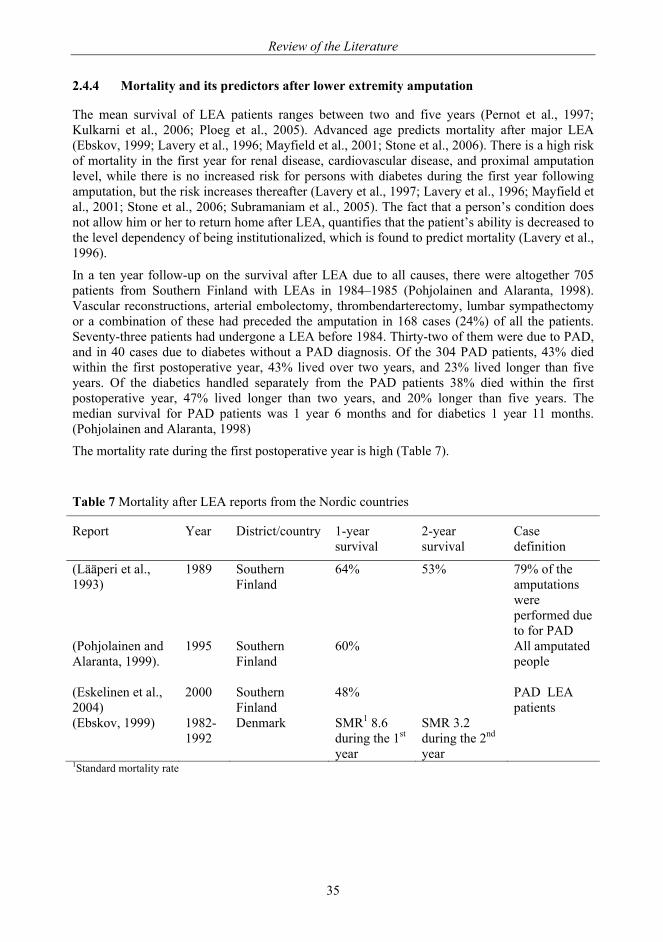
Review of the Literature
35
2.4.4 Mortality and its predictors after lower extremity amputation
The mean survival of LEA patients ranges between two and five years (Pernot et al., 1997; Kulkarni et al., 2006; Ploeg et al., 2005). Advanced age predicts mortality after major LEA (Ebskov, 1999; Lavery et al., 1996; Mayfield et al., 2001; Stone et al., 2006). There is a high risk of mortality in the first year for renal disease, cardiovascular disease, and proximal amputation level, while there is no increased risk for persons with diabetes during the first year following amputation, but the risk increases thereafter (Lavery et al., 1997; Lavery et al., 1996; Mayfield et al., 2001; Stone et al., 2006; Subramaniam et al., 2005). The fact that a person’s condition does not allow him or her to return home after LEA, quantifies that the patient’s ability is decreased to the level dependency of being institutionalized, which is found to predict mortality (Lavery et al., 1996).
In a ten year follow-up on the survival after LEA due to all causes, there were altogether 705 patients from Southern Finland with LEAs in 1984–1985 (Pohjolainen and Alaranta, 1998). Vascular reconstructions, arterial embolectomy, thrombendarterectomy, lumbar sympathectomy or a combination of these had preceded the amputation in 168 cases (24%) of all the patients. Seventy-three patients had undergone a LEA before 1984. Thirty-two of them were due to PAD, and in 40 cases due to diabetes without a PAD diagnosis. Of the 304 PAD patients, 43% died within the first postoperative year, 43% lived over two years, and 23% lived longer than five years. Of the diabetics handled separately from the PAD patients 38% died within the first postoperative year, 47% lived longer than two years, and 20% longer than five years. The median survival for PAD patients was 1 year 6 months and for diabetics 1 year 11 months. (Pohjolainen and Alaranta, 1998)
The mortality rate during the first postoperative year is high (Table 7).
Table 7 Mortality after LEA reports from the Nordic countries
Report Year District/country 1-year survival
2-year survival
Case definition
(Lääperi et al., 1993)
1989 Southern Finland
64% 53% 79% of the amputations were performed due to for PAD
(Pohjolainen and Alaranta, 1999).
1995 Southern Finland
60% All amputated people
(Eskelinen et al., 2004)
2000 Southern Finland
48% PAD LEA patients
(Ebskov, 1999) 1982-1992
Denmark SMR1 8.6 during the 1st year
SMR 3.2 during the 2nd year
1Standard mortality rate
Review of the Literature
36
2.5. Functional outcome and its predictors after invasive treatments in severe peripheral arterial disease
Functional outcome for patients undergoing LER for CLI is not solely determined by the traditional measures of reconstruction patency and limb salvage, but also by certain intrinsic patient comorbidities at the time of presentation (Taylor et al., 2006). Preoperative functional status (especially ambulatory status at presentation; ambulatory, home-bound, ‘transfer-only’/ non-ambulatory) is the most important predicting factor of the functional outcome after LER or LEA (Taylor et al., 2005b). If the ambulatory ability is poor at the time of presentation, the patient coming for the intervention impaired ambulatory ability leads in 39.5% failure to eventually ambulate (hazard ratio, HR 2.83). In the presence of dementia 41.2% eventually fail to ambulate (HR 2.20) (Taylor et al., 2006) Taylor and his co-workers have reported on outcomes after 1000 treated limbs with rest pain (35.5% with endovascular, 61.7% with open surgical revascularization, and 2.8% with both): At 5 years, the survival was only 41,9% and limb salvage 72.1%; 70.6% of those alive had maintained ambulation, and 81.3% their independent living status (Taylor et al., 2006).
Holtzman and his co-workers (1999) have assessed functional status and QoL outcomes after LER by a telephone survey and chart review in Minnesota, USA. There were 329 subjects who had undergone either their first LER procedure or a primary LEA for PAD between 1998 and 1995 and who had granted consent or had died. 166 patients (50%) were alive and were surveyed by telephone in 1996 (the follow-up examination was done 1 to 7.5 years after the qualifying procedure).
Seventy-three per cent of the 166 patients (121/166) still had the qualifying limb, 65% of them (108/166) were able to walk independently and 43% (71/166) had little or no limitation in walking several blocks. Patients with diabetes and patients who were older were less likely to be able to walk at follow-up examination and had a worse functional status. The number of years since the procedure was not a predictor in any of the analyses. Holtzman and his co-workers conclude that the survivors are likely to retain their limb over time and have good functional status; and that number of years since the procedure is not a predictor of the functional outcome. (Holtzman et al., 1999)
Even the most updated literature involves a small number of patients and does not operate with uniformly defined outcomes rendering a direct comparison among studies difficult and causing low external validity. Also the assessment of functional outcome of patients after LEA has been carried out differently. That is why studies are not always comparable with each other. (Cao and De Rango, 2009; Pernot et al., 1997)
2.5.1 Discharge after lower extremity revascularization or major amputation
The functional outcome after LER or LEA may be adversely estimated by patients’ capability to return home or being forced to move into an institution, thus losing their independent living status. After LER there is a 30% possibility with a hazard ratio of 7.97, of losing independent living status if the ambulation is preoperatively impaired. But the presence of dementia increases the risk of losing independent living status by 46%, with a hazard ratio of 5.44 (Taylor et al., 2006). In 1998, Pomposelli and his co-workers reported on results of patients 80 years or older in the USA who had undergone LER. Residential status and level of ambulatory function were graded by a simple scoring system in which 1 indicates living independently, walking without assistance; 2 indicates living at home with family, walking with an ambulatory assistance device; 3 indicates an extended stay in a rehabilitation facility, using a wheelchair; and 4 indicates permanent nursing home, bedridden. Preoperative and postoperative scores for both residential
Review of the Literature
37
status and ambulatory function were compared. The patient survival rate at 5 years was 44%. The postoperative residential status and ambulatory function scores were 1.95+/-0.80 and 1.70+/-0.66, respectively. The overall scores remained the same or improved in 88% and 78% of patients, respectively. The authors mean that LER in octogenarians is safe, with graft patency, and limb salvage is comparable to those reported for younger patients. LER preserves the ability to ambulate and reside at home for most patients (Pomposelli et al., 1998).
Discharge to a nursing home after major LEA again is common with females, advanced age (>65 years), single marital status, high level amputation, and advanced cerebrovascular disease and locomotor impairment, while male gender, and absence of advanced locomotor impairment are associated with discharge to a rehabilitation facility (Lavery et al., 1997).
According to Taylor and his co-workers predicting factors for a failure to maintain independent living status after LEA are in the order of importance 1) age ≥70 yrs, 2) age 60-69, 3) the level of amputation, 4) being ‘homebound, but ambulatory status’, and 5) presence of dementia (Taylor et al., 2005a).
2.5.2 Prosthesis usage predictors
The functional outcome after LEA is most often described as a capability to be able to ambulate with a prosthesis. However, for those who are non-ambulatory already before LEA and also homebound, the ambulatory status predicts not wearing a prosthesis. E.g., in Helsinki a rehabilitation model was formed to improve prosthetic use in 2005. Of the 79 amputees, only 40% were ambulatory, i.e. possible prosthetic use candidates. (Määttänen, 2006) Serious comorbidities, such as severe coronary heart disease and end-state-renal disease predict the non-wearing (Taylor et al., 2005a). All cerebrovascular diseases associate with the inability to be fitted with a prosthesis (Steinberg et al., 1985). Instead, a working capacity of 50% VO2max or greater, a lesser number of comorbidity, good ability to stand on the remaining leg, and a strong will to walk are positive predictors for prosthesis use (Chin et al., 2002). Whilst a larger amount of physical disability, cognitive impairment/ presence of dementia, poorer self-perceived health and the amputee's dissatisfaction predict the non-wearing of a prosthesis (Bilodeau et al., 2000; Schoppen et al., 2003; Taylor et al., 2005a).
The level of amputation predicts the mobility after LEA; BK gaining better mobility than AK (Taylor et al., 2005a; Turney et al., 2001). Following contralateral amputation barely more than half are able to walk. (Inderbitzi et al., 1992; Taylor et al., 2005a). As far as the stump is concerned, no residual contracture of the knee or hip joint are predicting factors for successful prosthetic ambulation (Munin et al., 2001). Even though there are different opinions about the mobility outcome following BK or AK amputations, it has also been found there are no significant perceived rehabilitation benefits in preserving stump length; i.e. by performing a BK amputation may not be as significant as previously reported (Basu et al., 2008). One-leg balance on the unaffected limb is an excellent predictor of the future prosthesis use (Schoppen et al., 2003). Failing to ambulate correlates with poor wound healing, and in that case not necessarily with etiology or surgical level (Munin et al., 2001). Also possession of a wheelchair is found to predict the non-wearing of a prosthesis (Bilodeau et al., 2000). However, when amputation is inevitable, more consideration should be given to surgery that optimizes wheelchair rehabilitation (Houghton et al., 1992).
In 1991, in a 1-year follow-up after LEA, Pohjolainen and Alaranta found that on 125 survivors increasing age associates with decreased physical function: i.e. walking distance, walking time, amount of walking outdoors, and use of a prosthesis. The need for walking aids increases with older people. The time lag between surgery and prosthetic fitting, and the occurrence of cerebrovascular disease associate with lesser prosthetic usage. In the group of BK amputees the
Review of the Literature
38
length of the stump had a significant favorable relationship with walking distance. Male smokers with BKAs had a shorter walking distance and they were not able walk outdoors as much as the BK amputated non-smokers. None of the variables showed any significant relationship with the postoperative accommodation situation. (Pohjolainen and Alaranta, 1991)
A physiologic limit to successful prosthetic fitting may exist in the geriatric patient due to advanced age and comorbidity (Frieden, 2005). Research should be directed toward improving outcomes of postamputation rehabilitation in elderly patients and in devising alternatives to long-term care as the number of these patients increases (Fletcher et al., 2002). It is important to take the patient’s comorbidity factors and expected mobility outcome into consideration when deciding on the primary amputation level (Basu et al., 2008).
2.6. Quality of life outcome after invasive treatments in severe peripheral arterial disease
Long-term follow up studies seem to be scares on QoL after LER or LEA.
2.6.1 Expressed on a generic scale
In a prospective study, Koivunen and Lukkarinen followed 64 conservatively, 85 endovascularily and 31 surgically treated patients for one year with a generic QoL measure, the Nottingham Health Profile (NHP) questionnaire and an ABI measurement before treatment and 12 months after. The ABI and asymptomatic walking distance scores of the patients treated with endovascular and surgical procedures improved statistically significantly. Conservatively treated patients reported improvement of sleep and emotional reactions. The patients with endovascular treatment reported improved emotional reactions, energy and less social isolation. The surgically treated patients reported improvement of pain, mobility, sleep and emotional reactions. Deterioration of any clinical characteristics or HRQoL was not observed after any of the treatment modalities. They conclude that surgery gives PAD patients a good clinical outcome and HRQoL for at least a year, whereas patients who were treated with endovascular and especially conservative treatment gained limited benefits. (Koivunen and Lukkarinen, 2008)
2.6.2 Expressed as patient’s perceived functional status of health
Feinglass and his co-workers have reported on a prospective 18-month study of 526 patients with intermittent claudication, with an 18 months follow-up. There were 44 who had undergone
In a follow-up [19 months (range 3-30)] study by Duggan and her co-workers from 1994, there were 38 patients with CLI and age 65 years or older who had undergone surgical revascularization. (The perioperative mortality rate was 5.2% and 2-year survival was 61%, and the rate of limb loss over that period was 27%, 5.5% early limb loss.) There was no statistically significant difference in health perceptions (the Rand scores) between patients with successful limb salvage and patients with failed bypass grafts requiring amputation. There was no difference between patients with successful bypasses and patients with failed bypasses in the amount of pain reported- amputation being an effective pain control measure. That might have been explained by comorbid conditions that continue to deteriorate in spite of limb salvage interventions. The authors suggest that it is possible that addressing rehabilitation issues earlier in the care of these patients may produce a more positive outcome. Patients who have had strokes or debilitating arthritis may lose substantial functional ability during convalescence from peripheral bypass surgery, which may take weeks to heal, especially when associated with gangrene or ulceration and that is why the functional outcome goals need to be better defined for patients who need limb salvage vascular operations to enhance the quality of care given these patients and to be in concert with emerging health policy. (Duggan et al., 1994)
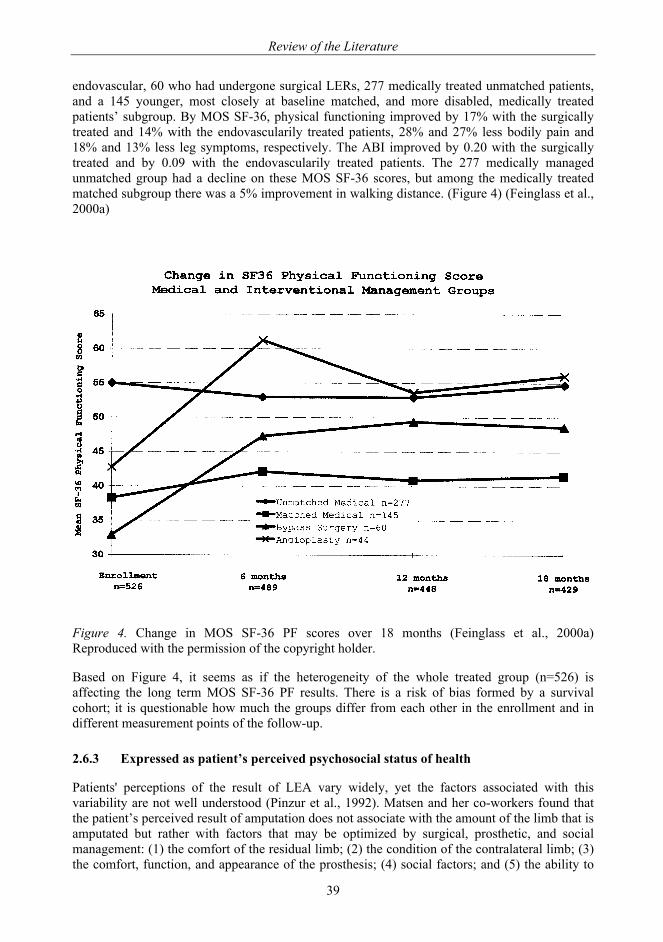
Review of the Literature
39
endovascular, 60 who had undergone surgical LERs, 277 medically treated unmatched patients, and a 145 younger, most closely at baseline matched, and more disabled, medically treated patients’ subgroup. By MOS SF-36, physical functioning improved by 17% with the surgically treated and 14% with the endovascularily treated patients, 28% and 27% less bodily pain and 18% and 13% less leg symptoms, respectively. The ABI improved by 0.20 with the surgically treated and by 0.09 with the endovascularily treated patients. The 277 medically managed unmatched group had a decline on these MOS SF-36 scores, but among the medically treated matched subgroup there was a 5% improvement in walking distance. (Figure 4) (Feinglass et al., 2000a)
Figure 4. Change in MOS SF-36 PF scores over 18 months (Feinglass et al., 2000a) Reproduced with the permission of the copyright holder.
Based on Figure 4, it seems as if the heterogeneity of the whole treated group (n=526) is affecting the long term MOS SF-36 PF results. There is a risk of bias formed by a survival cohort; it is questionable how much the groups differ from each other in the enrollment and in different measurement points of the follow-up.
2.6.3 Expressed as patient’s perceived psychosocial status of health
Patients' perceptions of the result of LEA vary widely, yet the factors associated with this variability are not well understood (Pinzur et al., 1992). Matsen and her co-workers found that the patient’s perceived result of amputation does not associate with the amount of the limb that is amputated but rather with factors that may be optimized by surgical, prosthetic, and social management: (1) the comfort of the residual limb; (2) the condition of the contralateral limb; (3) the comfort, function, and appearance of the prosthesis; (4) social factors; and (5) the ability to
Review of the Literature
40
exercise recreationally, but the level and laterality of the amputation do not correlate with the patients' perceptions. (Matsen et al., 2000)
Hanley and her co-workers’ findings from 2004 support a biopsychosocial model of long-term adjustment to amputation and phantom limb pain (PLP). In addition, results suggest that some psychosocial variables are more important than others for predicting adjustment, providing important implications for early interventions after amputation. They followed 70 amputees’ PLP intensity, cognitions (catastrophizing, perceived control over pain), coping (pain-contingent rest), social environment (social support, solicitous responding), and functioning (pain interference, depressive symptoms) for two years. Depressive symptoms and pain interference changed significantly in one year and in two year post amputation measurements. Catastrophizing and social support were associated with improvement in both criterion measures, while solicitous responding was associated with worsening in both measures. (Hanley et al., 2004)
By using the Center for Epidemiologic Study Depression Scale the prevalence of depressive symptoms among persons with limb loss, in general, is 29%. Risk factors for depressive symptoms include being divorced, being somewhat bothered with back pain or phantom limb pain, and having residual limb pain among persons aged 18 to 54. Having higher education is a buffer against depressive symptoms. (Darnall et al., 2005)
Social discomfort is a predictor of depression among amputees (Rybarczyk et al., 1992) Individual coping styles are important predictors of psychosocial adaption to e.g. amputation. Avoidance is strongly associated with psychosocial distress and poor adjustment. In contrast, problem solving type of coping is negatively associated with depressive and anxious symptomatology whereas seeking social support is negatively associated with depressive symptoms and positively associated with social adaption. (Desmond and MacLachlan, 2006)
2.7. Summary
Despite marked advances in the technical ability to perform LER, the decision whether to perform primary amputation or attempt revascularization in high risk patients is a major part of modern vascular care. With an aging population and improved medical care that has increased life expectancy, more patients with severe systemic disease are presenting with CLI. In addition, it is well recognized that CLI patients suffer diagnostic delays and poor risk factor modification (Bradley and Kirker, 2006), which in part contributes to limb loss and poor patient survival (Nehler and Peyton, 2004). Diabetic and uremic patients are at high risk for both leg and life loss after LER (Biancari et al., 2000; Subramaniam et al., 2005).
Patient’s status of health is worth evaluating properly in order to plan the postintervention rehabilitation. A functional performance measure 6 MW, which can be administered in an office setting, predicts mortality in persons with PAD beyond that provided by the ABI (McDermott et al., 2008). The patient’s own perception of his or her physical functioning and possible depressive symptoms are important factors that well predict also the outcome after LER or LEA (Cherr et al., 2007). Depressed mood may either precede mobility limitation or follow from mobility limitation (Hirvensalo et al., 2007). Pain, commonly seen in LER or major LEA patients, may be an underlying factor in both depressed mood and mobility limitation.
Aims of the Study
41
3. AIMS OF THE STUDY
The study aims were to evaluate the survival, the functional capacity and the quality of life of patients with severe peripheral arterial disease, and the special aims were:
1. To assess the incidence of major lower extremity amputations, the reamputations, and the survival of major lower extremity amputees (I).
2. To assess functional capacity in patients after major lower extremity amputation (II).
3. To assess quality of life after lower extremity revascularization (IV) and major amputation (III).
4. To evaluate how the health care organization is able to fulfill the needs of patients with severe PAD (I-IV).
Materials and Methods
42
4. MATERIALS AND METHODS
4.1. Study designs and settings
Studies I and II were retrospective from 1998 to 2002 and the patients were followed until the end of 2006. The studies were based on hospital records. The setting was Turku, Finland; the amputations were performed at Turku City Hospital and at Turku University Hospital. The population of Turku was 174 868 on December 31, 2005, and the total population of Finland at that time was 5.3 million.
In studies III and IV the study design was observationally retrospective and cross sectional. They were questionnaire studies, where a case-control methodology in comparisons between major LEA patients and age-, gender- and domicile-matched controls in study III, and between LER patients and similarly matched controls, in study IV, was applied. These studies were also conducted in Turku, Finland. All major LEAs were performed in 1998-2002. The amputees were interviewed using a set of questionnaires in 2004-2006. Their controls postal questionnaire intervention was performed in 2005-2006. The LER interventions for the study IV patient population were performed between 1998 and 2003; and LER patient population’s postal questionnaire intervention was made in 2004 and their controls postal inquiry in 2005-2006. The questionnaire is seen in Appendix 1.
4.2. Study populations
The study patient population consisted of two groups: 1) All patients who had undergone their first major LEA due to PAD, in 1998-2002 (studies I, II and III) and 2) all those who had undergone either one or several endovascular only and/or surgical LERs, but not major LEA in 1998-2003 (study IV).
4.2.1 Patients with major lower extremity amputation in studies I, II and III
From 1998 to 2002, 210 patients (mean age 76.6, SD 10.7 years, 45% men) underwent index major LEA because of PAD. The operations were performed at Turku City Hospital on 184 patients and at Turku University Hospital on 26 patients. A hundred and thirty-eight of them had had a primary LEA, 34 had had prior endovascular LERs only, 32 prior surgical LERs only, and 15 had both endovascular and surgical LERs before their first major LEA.
4.2.1.2 Patients in study II
In study II, 149 of the 210 amputees were admitted from home for the intervention. Thirty (20%) of them died within the first 31 days after the first major LEA, and were excluded.
The remaining 119 amputees formed the material for that part of the 2nd study where predictors for the institutionalization were analyzed.
4.2.1.3 Patients and controls in study III
Of the 210 amputees, 61 (29%) were alive during spring 2004. Fifty nine of them were available for interview for the study. Each of them had two age-, gender- and domicile matched controls. (Figure 5)
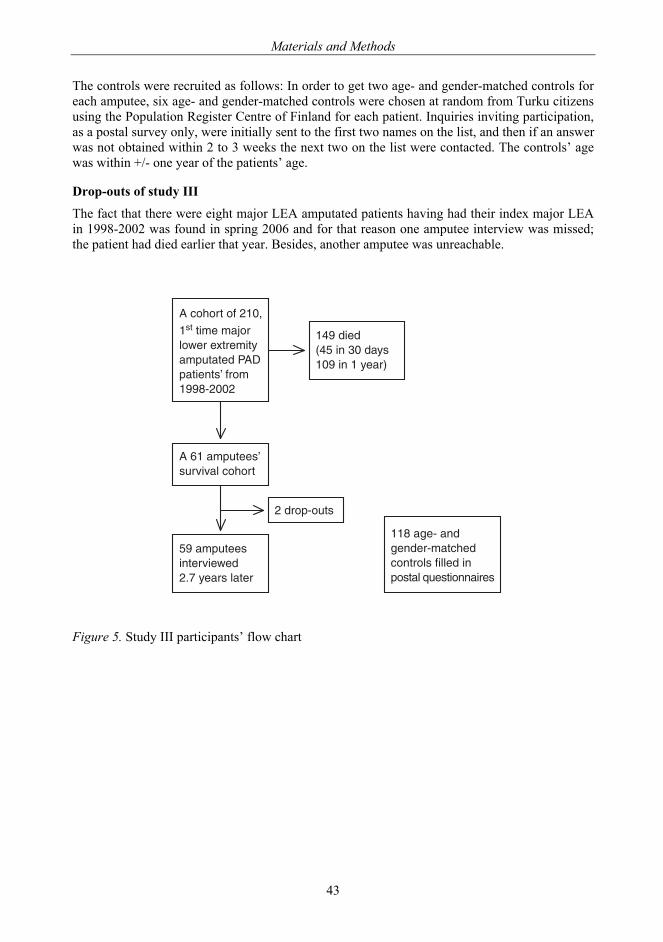
Materials and Methods
43
The controls were recruited as follows: In order to get two age- and gender-matched controls for each amputee, six age- and gender-matched controls were chosen at random from Turku citizens using the Population Register Centre of Finland for each patient. Inquiries inviting participation, as a postal survey only, were initially sent to the first two names on the list, and then if an answer was not obtained within 2 to 3 weeks the next two on the list were contacted. The controls’ age was within +/- one year of the patients’ age.
Drop-outs of study III
The fact that there were eight major LEA amputated patients having had their index major LEA in 1998-2002 was found in spring 2006 and for that reason one amputee interview was missed; the patient had died earlier that year. Besides, another amputee was unreachable.
Figure 5. Study III participants’ flow chart
������������� ���������������������������������������������������������� !��
��"��������������#�#���������
����� ����
$���������������#�����%&������������
�'������('$����)�������������������*
�� ��+�!����+�����!�������������������������������,�������������
!
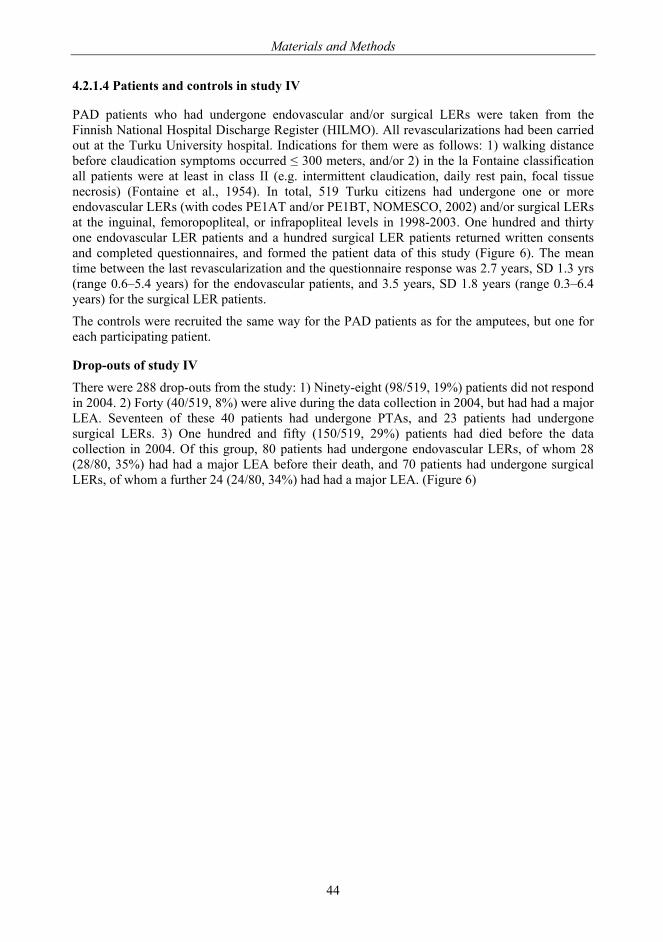
Materials and Methods
44
4.2.1.4 Patients and controls in study IV
PAD patients who had undergone endovascular and/or surgical LERs were taken from the Finnish National Hospital Discharge Register (HILMO). All revascularizations had been carried out at the Turku University hospital. Indications for them were as follows: 1) walking distance before claudication symptoms occurred ≤ 300 meters, and/or 2) in the la Fontaine classification all patients were at least in class II (e.g. intermittent claudication, daily rest pain, focal tissue necrosis) (Fontaine et al., 1954). In total, 519 Turku citizens had undergone one or more endovascular LERs (with codes PE1AT and/or PE1BT, NOMESCO, 2002) and/or surgical LERs at the inguinal, femoropopliteal, or infrapopliteal levels in 1998-2003. One hundred and thirty one endovascular LER patients and a hundred surgical LER patients returned written consents and completed questionnaires, and formed the patient data of this study (Figure 6). The mean time between the last revascularization and the questionnaire response was 2.7 years, SD 1.3 yrs (range 0.6–5.4 years) for the endovascular patients, and 3.5 years, SD 1.8 years (range 0.3–6.4 years) for the surgical LER patients.
The controls were recruited the same way for the PAD patients as for the amputees, but one for each participating patient.
Drop-outs of study IV
There were 288 drop-outs from the study: 1) Ninety-eight (98/519, 19%) patients did not respond in 2004. 2) Forty (40/519, 8%) were alive during the data collection in 2004, but had had a major LEA. Seventeen of these 40 patients had undergone PTAs, and 23 patients had undergone surgical LERs. 3) One hundred and fifty (150/519, 29%) patients had died before the data collection in 2004. Of this group, 80 patients had undergone endovascular LERs, of whom 28 (28/80, 35%) had had a major LEA before their death, and 70 patients had undergone surgical LERs, of whom a further 24 (24/80, 34%) had had a major LEA. (Figure 6)
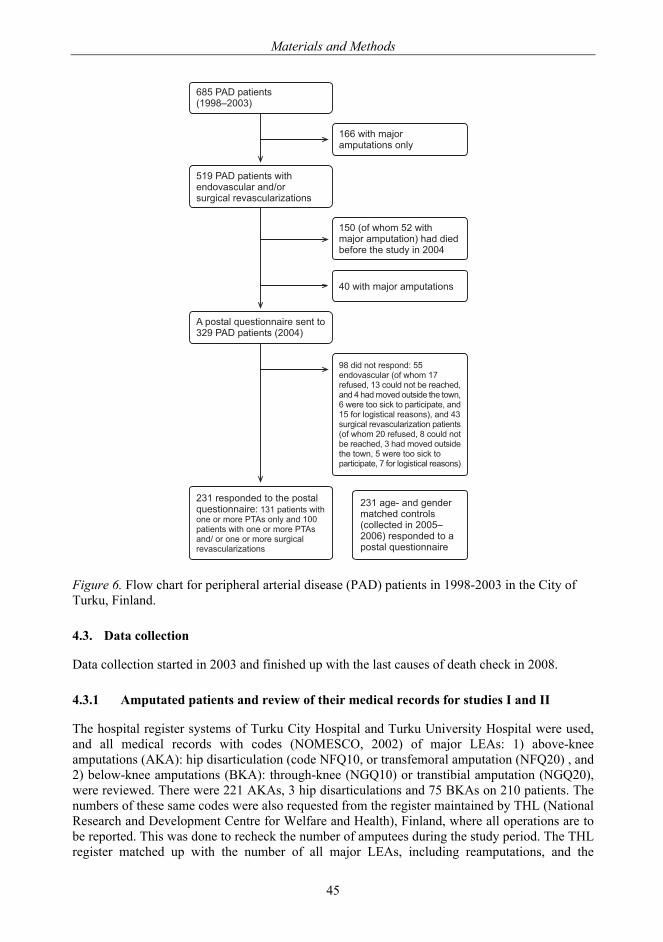
Materials and Methods
45
Figure 6. Flow chart for peripheral arterial disease (PAD) patients in 1998-2003 in the City of Turku, Finland.
4.3. Data collection
Data collection started in 2003 and finished up with the last causes of death check in 2008.
4.3.1 Amputated patients and review of their medical records for studies I and II
The hospital register systems of Turku City Hospital and Turku University Hospital were used, and all medical records with codes (NOMESCO, 2002) of major LEAs: 1) above-knee amputations (AKA): hip disarticulation (code NFQ10, or transfemoral amputation (NFQ20) , and 2) below-knee amputations (BKA): through-knee (NGQ10) or transtibial amputation (NGQ20), were reviewed. There were 221 AKAs, 3 hip disarticulations and 75 BKAs on 210 patients. The numbers of these same codes were also requested from the register maintained by THL (National Research and Development Centre for Welfare and Health), Finland, where all operations are to be reported. This was done to recheck the number of amputees during the study period. The THL register matched up with the number of all major LEAs, including reamputations, and the
���������� ��������������
�������������������������
���������� �������� �!�"�#�����!$�����%�#��� "�#����&�����
������'����������������������������!�!� !( '�� ��� ����! �������)
)��������������������
�������*� �������� �� ��������������� ��������)�
����% +��!�% �! ���#� !�#��������#��� #� !���������������� ���! !���������*� ��������
���!�!������ ���!,��� �!�"�#������'�������-� '�� !.����#���!�����( �� #� !.�!�)��!���" !������! ��� �����.��� � �������#/�������#�� .��!���'�����%����#��� �����.��!�)����%�#��� "�#����&������� �����'���������� '�� !.���#���!����( �� #� !.����!���" !������! �� �����.���� � �������#/������#�� .�-�'�����%����#��� �����
����� ���! !������ �����*� �������� ,������� ���������� ������� ��0������ ��!������ ����������� ������� ��0���!$������ ������� ����%�#�� "�#����&�����
Materials and Methods
46
number of amputations done for reasons other than PAD. The medical records of the patients who had only minor LEAs, i.e. below-ankle joint amputations or at the talocrural level of LEA (NHQ10) were not requested. The dates and immediate and basic causes of death were obtained from Statistics Finland (http://www.stat.fi/index.html).
4.3.1.1 Exclusion criteria
Patients with vasculitis (n=3) and Buerger’s disease (n=1) were excluded from the series. In addition, there were 20 persons with PAD who had had their first major LEA, and three of them even had their second major LEA, done in 1977-1997, and they were therefore excluded. Nine patients who underwent a major LEA due to reasons other than vascular pathology were excluded. One major LEA was due to metastases of kidney cancer, five were due to trauma, and one alcoholic lost his legs due to hypothermic injury, while two patients had rheumatoid arthritis and lost their legs due to infectious knee endoprosthesis.
4.3.2 Postal questionnaire data collection
The data for studies III and IV were collected by means of postal questionnaires.
In order to check how the questionnaire worked in practice, the author pilot-tested it by means of four interviews. Prior to the start up of the project, as well as during collection of the material, the author gave detailed directions to the nurses, pertaining to how the nurses and the author were to conduct the interviews.
For the institutionalized patients (n=30), the author did 27 (90%) of the interviews and the public health nurses 3 (10%), and for the home-dwelling patients (n=29), the author undertook 23 (80%) of the interviews, and the public health nurses 6 (20%).
All 118 controls for the amputees and 231 for the revascularized PAD patients returned, by mail, written consent and self-administered questionnaire. The same questionnaire was used for interviewing the amputees. The responses of those 165 revascularized PAD patients who took part in the ABI measurement and MMSE test were rechecked by the author together with the patients. Those patients’ medication was rechecked at the same time from their electronic medical records.
Close relatives of some elderly revascularized patients and controls contacted the author and explained that they would help their parent to complete the questionnaire. This was permitted.
4.3.3 Ankle-brachial pressure index
In order to evaluate the severity of PAD a trained research nurse measured the resting ABI by Doppler of the 165 PAD patients willing to be tested.
4.3.4 Mini-Mental-State Examination
A trained research assistant, a medical student performed MMSEs on 172/231 (74%) patients, (7 of whom had had their MMSE monitored during an interview made for diabetic home-care patients). MMSE sum scores of 24-30 were considered indicative of no cognitive impairment, 18-23 of mild and 0-17 of severe cognitive impairment (Tombaugh and McIntyre, 1992). According to MMSEs, most had no cognitive impairment.
Materials and Methods
47
4.4. Outcomes
In study I: Population-based incidence rates of index amputations, mortality and standardized mortality ratio (SMR).
In study II: The main outcome measure was institutionalization in a sample of older persons with recent major LEA, and the secondary outcome measures were prosthesis use and ambulation recovery.
In studies III and IV: Quality of life assessed with the 15D health-related QoL instrument, the Rand-36 Physical Functioning- and General Health subscales, the Geriatric Depression Scale, the 6-item Brief Social Support Questionnaire, the Self-reported Life Satisfaction score, and one ‘Perceived State of Health’ question.
Quality of life and status of health measures
The 15D health-related QoL instrument (15D HRQoL) (Sintonen, 2001), which is a Finnish generic HRQoL scale, the number score of the 6-item Brief Social Support Questionnaire (SSQ6N) (Sarason, 1987) to assess perceived social support, Rand-36 Physical Functioning subscale (Rand-36 PF) (Aalto, 1999; Hays et al., 1993) as a physical/mobility screening scale, Geriatric Depression Scale GDS) (Yesavage et al., 1982) to find out depressive symptoms, and the Life Satisfaction score (LS) (Allardt, 1973; Koivumaa-Honkanen et al., 2000) were used to triangulate the health-related quality of life as a whole. The ‘perceived state of health’ was obtained by asking whether participants felt their state of health to be ‘good’, ‘quite good’, ‘fair’, ‘rather poor’ and ‘poor’. QoL and status of health measures used are presented in more detail in the Appendix 2.
In study III, the respondents’ compliance in completing the questionnaire was good; a high number of patients’ responses allowed a good number of case-control pairs or stratums (98% in 15D HRQoL, 93% in SSQ6N, 98% in the 10 items of Rand-36 PF, 97% in the 4 items of Rand-36 GH, 95% in GDS, 97% in LS, and 100% in the question of ‘perceived state of health’) into the analyses. In study IV, the respondents exhibited excellent compliance in completing the questionnaire; a high number of patients’ responses allowed a large number of case-control pairs or stratums (99% in 15D HRQoL, 97% in SSQ6N, 95-99% in the 10 items of Rand-36 PF, 99% in GDS, 100% in LS, and 99% in the ‘perceived state of health’ question of) into the analyses.
4.5. Explanatory variables
In analysis and statistical models, comorbidity, final level of amputation, reamputation, revascularization, medication, and sociodemographics were used as explanatory variables to explain the outcomes.
4.5.1 Comorbidity
The diseases shown in the medical records were coded according to the Finnish version of International Statistical Classification of Diseases and Related Health Problems (ICD10). Those who had ICD-10 diagnoses of dementia, i.e. F00, F01, F03 or G30, and those who were found to score 0-17 points in the MMSE (Folstein et al., 1975; Tombaugh and McIntyre, 1992) were categorized as having cognitive impairment comorbidity. Diabetes was coded for those who had ICD-10 diagnostic codes of E10-E11 or had diabetes medication in their records.
Materials and Methods
48
4.5.2 Final level of amputation
The dates and the levels of all amputations were collected to determine the final level of amputation.
4.5.3 Reamputation
All major LEAs performed after index major LEA were defined as major, i.e. above the ankle, reamputations. Therefore, the dates and the levels of all subsequent amputations were collected to determine the reamputations: ipsilateral as to the index major amputation at the same level, from below to above knee, and as well contralateral major amputations. This also included revisions, providing the procedures were recorded in the medical records as transfemoral amputations (NFQ20), hip disarticulations (NFQ10), or transtibial amputations (NGQ20). Minor amputations, which were toe and transmetatarsal amputations, were also collected.
4.5.4 Revascularization
Previous revascularizations were collected as follows: percutaneous transluminal angioplasty: codes (NOMESCO, 2002) PE1AT and PE1BT, and vascular reconstructions: Y-prosthesis, bypass from the infrarenal abdominal aorta and iliac arteries: codes (NOMESCO, 2002) PDH50, PDH51, PDH52, and PDH54, bypass from a femoral artery and branches: PEH56 and PEH57, bypass from axillary to bilateral femoral arteries: PGH44, bypass from a femoral to the contralateral femoral artery: PGH47, bypass from a femoral artery to infrapopliteal arteries and from a popliteal artery to arteries of the lower leg and foot: PFH58, PFH59, PFH62, PFH63, PFH64, PFH66, and PFH67.
4.5.5 Medication
The preamputation medication, medication at the time of the interviews and postal inquiry was coded according to the Guidelines for the Anatomical Therapeutic Chemical classification system (2003).
4.5.6 Sociodemographics
Socio-demographic variables, health behavior, and health status information were gathered from the patient records. Smoking habits and MMSE, if available, were obtained from medical records for studies I and II.
Background data in the questionnaire studies III and IV consisted of basic demographics, including smoking habits, alcohol consumption, present medical diagnoses, cardiac symptoms and current medication. Body mass index (BMI) calculated as self-reported current weight in kilograms divided by self-reported square of height in meters. Both the Weighted Index of Comorbidity (Charlson Index) and the age-related risk were calculated according to the model described by Charlson (Charlson et al., 1987; Sundararajan et al., 2004).
Materials and Methods
49
4.6. Other, mainly descriptive variables
4.6.1 Indications for amputation
Indications for amputation, including chronic critical ischemia, gangrene (arterial ulcer and rest pain), osteitis, or acute limb ischemia, and the sides of amputations were also collected.
4.6.2 Prosthesis usage
In 1998-2002, routine care for an amputated patient was as follows: The patient was moved from the surgical ward into the geriatric rehabilitation unit of Turku City Hospital in the days following the amputation. There each amputee was assessed by a multidisciplinary team consisting of a specialist in geriatric medicine, physiotherapist, occupational therapist, and specialist in prosthetics. This team selected those whose recovery seemed to proceed well enough for further prosthesis use. During the patients’ convalescence pressure trials for the stump were given, and a rehabilitation prosthesis was used as soon as the healing stump allowed. After the patient had been discharged either home or to institutional care he or she continued to come to the prosthesis users’ training group twice a week. The training group of amputees was collected from their residences by taxi and also returned home by taxi supported by the city medical care.
The mobility and rehabilitation capabilities of the training group amputees were reviewed from the rehabilitation unit’s records. Furthermore, the physiotherapist of the training group was interviewed. The manner the patients were able to use their prostheses was classified by a physiotherapist according to the classification system devised by Narang and his co-workers (Narang et al., 1984; Pohjolainen et al., 1990). In this classification, class I means ambulating with prosthesis and without any other walking aids outdoors and indoors, class II means ambulating with prosthesis indoors, but requiring one walking stick or crutch for outdoor activities, class III means independent indoors, ambulating with prosthesis and one crutch indoors, but requiring two crutches outdoors and occasionally a wheelchair , class IV means walking indoors with a prosthesis and two crutches or a walker, but requiring a wheelchair for outdoor activities, class V means walking indoors only short distances, but primarily a wheelchair user. The classification also includes classes VI and VII (class VI walking with aids, but without prosthesis, and class VII ambulates by a wheelchair). However, codes VI and VII were not found in the medical records.
4.7. Statistical analyses
All statistical analyses were carried out using SAS/STAT® software, Version 9.1.3 SP3 of the SAS System for Windows (SAS Institute Inc., Cary, NC, USA). P-values less than 0.05 were considered to be significant.
In Study I: The follow-up (measured in days and expressed as years and person-years) started on the date of the index major amputation and continued until death or the end of the study period, December 31, 2006. Population-based incidence rates of index LEAs were calculated separately for each year of 1998-2002. The incidence rates of index amputations were calculated separately and combined, for both genders and the age groups of younger than 65 years, 65-74, 75-84, and 85 years and older. All incidence rates were standardized for age and gender with the direct method, using the December 31, 2005 population of Finland as reference. Therefore, these standardized incidence rates can be compared to the overall amputation rates in Finland or some
Materials and Methods
50
other district or city with a population composition similar to that in Finland. Incidence rates are reported per 100 000 person-years.
Comparisons between men and women were made with the Chi-Square Test and Fisher's Exact Test when analyzing categorical variables. Wilcoxon’s rank sum test was used to compare differences in age (continuous variable) between men and women, due to the skewness of the age distribution. The follow-up time for survival analysis was calculated from the date of the first major amputation to death or the end of the study period. Survival curves were calculated with the Kaplan-Meier method. The potential predictors for survival were first analyzed with age- and gender-adjusted Cox proportional hazards models. The significant predictors obtained from these analyses were included in the multivariate Cox models. The results were quantified by HR and their 95% confidence intervals (CI).
The standardized mortality ratio (SMR) was calculated as the ratio of the number of deaths in the study group to the mortality that would be expected in the Turku population (Last, 2001).
In Study II: The sociodemographic factors, comorbidities, and preamputation medications of the 119 amputees were cross-tabulated by discharge destination; home or institutional care, and tested using the Chi-Square Test or Fisher’s Exact Test. Sociodemographic and comorbidity variables having p-values of less than 0.05 and the preamputation medication variables having p-values less than 0.10 were selected (Fletcher, 2005) for the logistic regression analysis.
Discharge destination was a dependent variable in the logistic regression models. Predictors for discharge destination were first analyzed by univariate analysis. In the second phase, age- and gender-adjusted analyses were carried out. Lastly, significant predictors in the age- and gender-adjusted analyses were included in the final multivariate logistic model. Associations were quantified by odds ratios (OR) and their 95% CIs.
In Study III: The differences in categorical variables between amputees and their age and gender matched controls were analyzed with logistic regression using generalized estimating equations to account for matching. Binary logistic models were revealed for dichotomic dependent variables and cumulative logistic models for ordinal dependent variables. The results of logistic regression were quantified by calculating OR and cumulative odds ratios (COR) with their 95% CI. The continuous variables measuring quality of life (15D HRQoL-, Rand-36 PF-, GDS-, Rand-36 GH-, SSQ6N-, LS scores), the number of self-reported diagnoses, the Weighted Index of Comorbidity and the Charlson Combined Comorbidity Index were compared between amputees and their age- and gender-matched controls using a linear mixed model where stratum (one amputee and his/her two controls) was used as a random effect. GDS-, LS score and mean number of self-reported diagnoses were logarithmically transformed, and the SSQ6N score was square root transformed for statistical analyses due to skewed distributions. 15D dimensions of health were compared between amputees and their controls using a stratified Mann-Whitney U-test. The Chi-Square Test or Fisher’s Exact Test was used to compare categorical background data between amputees living at home or in institutional care.
The differences in QoL scores between amputees with and without prosthesis, and those who lived at home and those who lived in institutional care were analyzed using analysis of covariance with adjustment for age.
In Study IV: The differences in categorical variables between PAD patients and their age- and gender-matched controls were analyzed with logistic regression using generalized estimating equations to account for matching. Binary logistic models were revealed for dichotomic dependent variables and cumulative logistic models for ordinal dependent variables. The results of logistic regression were quantified by calculating OR and COR with their 95% CI. Continuous background variables between PAD patients and their controls were compared using paired t-test. The 15 dimensions HRQoL were compared between PAD patients and their controls using
Materials and Methods
51
Wilcoxon Signed Rank test. Chi-Square Test or Fisher’s Exact Test was used to compare categorical background data between endovascular and surgical revascularization patients. Continuous background variables between these patients were compared using two-sample t-test.
Explanatory variables (both background variables and the QoL scale values) for ‘perceived state of health’ were separately analyzed for the PAD patients and the control group by the cumulative logistic regression model.
4.8. Ethical considerations
Written consent was obtained from the interviewed amputees, participating revascularized PAD patients, and all controls. The Joint Ethics Committee of Turku University and the Hospital District of Southwest Finland approved the research plan. Finland's Ministry of Social Affairs and Health approved the study plan and granted the access to registers.
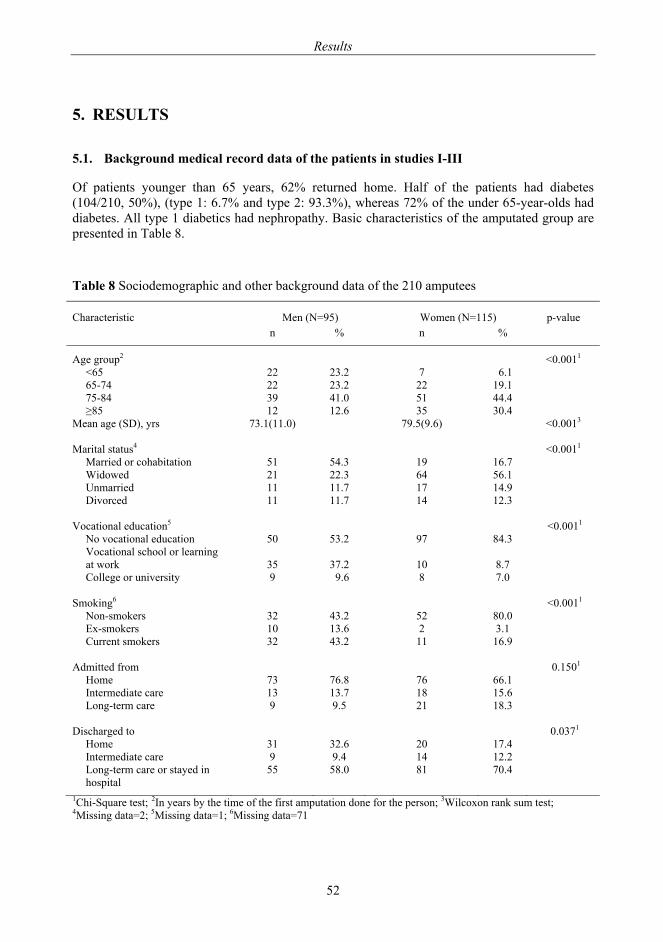
Results
52
5. RESULTS
5.1. Background medical record data of the patients in studies I-III
Of patients younger than 65 years, 62% returned home. Half of the patients had diabetes (104/210, 50%), (type 1: 6.7% and type 2: 93.3%), whereas 72% of the under 65-year-olds had diabetes. All type 1 diabetics had nephropathy. Basic characteristics of the amputated group are presented in Table 8.
Table 8 Sociodemographic and other background data of the 210 amputees
Characteristic Men (N=95) Women (N=115) p-value
n % n %
Age group2 <0.0011 <65 22 23.2 7 6.1 65-74 22 23.2 22 19.1 75-84 39 41.0 51 44.4 ≥85 12 12.6 35 30.4
Mean age (SD), yrs 73.1(11.0) 79.5(9.6) <0.0013 Marital status4 <0.0011
Married or cohabitation 51 54.3 19 16.7 Widowed 21 22.3 64 56.1 Unmarried 11 11.7 17 14.9 Divorced 11 11.7 14 12.3
Vocational education5 <0.0011
No vocational education 50 53.2 97 84.3 Vocational school or learning at work
35
37.2
10
8.7
College or university 9 9.6 8 7.0
Smoking6 <0.0011 Non-smokers 32 43.2 52 80.0 Ex-smokers 10 13.6 2 3.1 Current smokers 32 43.2 11 16.9
Admitted from 0.1501
Home 73 76.8 76 66.1 Intermediate care 13 13.7 18 15.6 Long-term care 9 9.5 21 18.3
Discharged to 0.0371
Home 31 32.6 20 17.4 Intermediate care 9 9.4 14 12.2 Long-term care or stayed in hospital
55 58.0 81 70.4
1Chi-Square test; 2In years by the time of the first amputation done for the person; 3Wilcoxon rank sum test; 4Missing data=2; 5Missing data=1; 6Missing data=71
Results
53
5.2. Background of the patients and their controls in study IV
Males were over represented in the patients. Age- and gender-matched controls were more commonly non-smokers and/or married or living with a companion than the patients. Patients had less vocational education, lower BMI, more commonly cardiac symptoms, more self-reported diseases and both their Weighted Index of Comorbidity/ Charlson Index and the Charlson Combined Comorbidity Index were higher, when compared with their controls (Table 9). Patients, who had undergone surgical revascularization were younger than PTA patients, more commonly had vocational education, and used sedatives more frequently.
Both endovascular and surgical LER patients had low ABIs (0.5–0.89 in 96/165, 58%). According to MMSEs, most had no cognitive impairment.
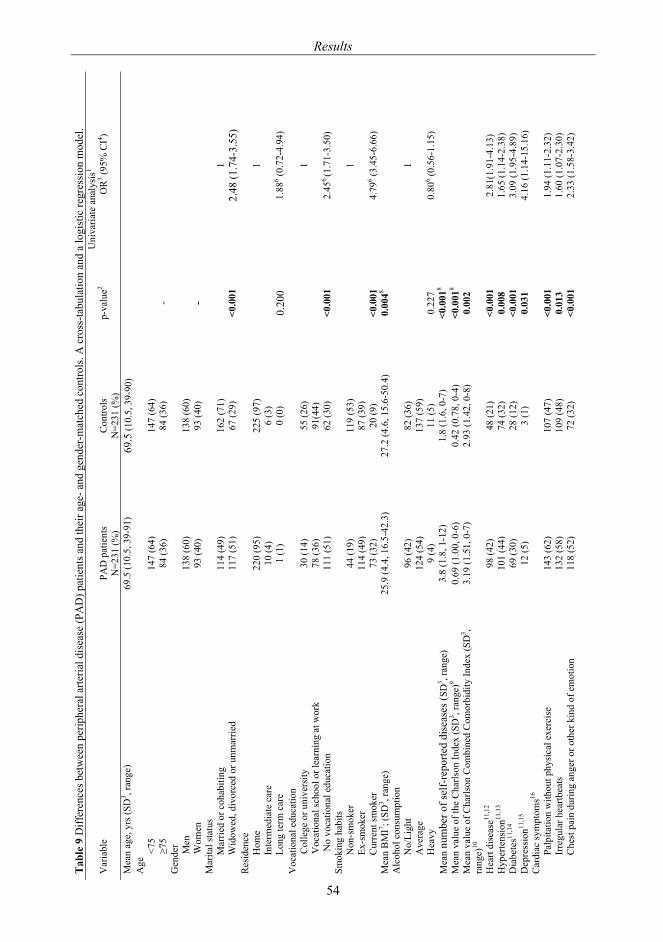
Tab
le 9
Diff
eren
ces b
etw
een
perip
hera
l arte
rial d
isea
se (P
AD
) pat
ient
s and
thei
r age
- and
gen
der-
mat
ched
con
trols
. A c
ross
-tabu
latio
n an
d a
logi
stic
regr
essi
on m
odel
.
Uni
varia
te a
naly
sis1
Var
iabl
e PA
D p
atie
nts
N=2
31 (%
) C
ontro
ls
N=2
31 (%
) p-
valu
e2 O
R3 (9
5% C
I4 )
Mea
n ag
e, y
rs (S
D3 , r
ange
) 69
.5 (1
0.5,
39-
91)
69.5
(10.
5, 3
9-90
)
A
ge
<7
5 14
7 (6
4)
147
(64)
≥75
84 (3
6)
84 (3
6)
-
Gen
der
M
en
138
(60)
13
8 (6
0)
W
omen
93
(40)
93
(40)
-
M
arita
l sta
tus
M
arrie
d or
coh
abiti
ng
114
(49)
16
2 (7
1)
1
W
idow
ed, d
ivor
ced
or u
nmar
ried
117
(51)
67
(29)
<0
.001
2.
48 (1
.74-
3.55
) R
esid
ence
Hom
e 22
0 (9
5)
225
(97)
1
Inte
rmed
iate
car
e 10
(4)
6 (3
)
Long
term
car
e 1
(1)
0 (0
) 0.
200
1.88
6 (0.7
2-4.
94)
Voc
atio
nal e
duca
tion
C
olle
ge o
r uni
vers
ity
30 (1
4)
55 (2
6)
1
V
ocat
iona
l sch
ool o
r lea
rnin
g at
wor
k
78 (3
6)
91(4
4)
N
o vo
catio
nal e
duca
tion
111
(51)
62
(30)
<0
.001
2.
456(1
.71-
3.50
) Sm
okin
g ha
bits
Non
-sm
oker
44
(19)
11
9 (5
3)
1
Ex
-sm
oker
11
4 (4
9)
87 (3
9)
C
urre
nt sm
oker
73
(32)
20
(9)
<0.0
01
4.79
6 (3.4
5-6.
66)
Mea
n B
MI7 ; (
SD3 , r
ange
) 25
.9 (4
.4, 1
6.5-
42.3
) 27
.2 (4
.6, 1
5.6-
50.4
) 0.
0048
A
lcoh
ol c
onsu
mpt
ion
N
o/Li
ght
96 (4
2)
82 (3
6)
1
A
vera
ge
124
(54)
13
7 (5
9)
H
eavy
9
(4)
11 (5
) 0.
227
0.80
6 (0.5
6-1.
15)
Mea
n nu
mbe
r of s
elf-
repo
rted
dise
ases
(SD
3 , ran
ge)
3.8
(1.8
, 1-1
2)
1.8
(1.6
, 0-7
) <0
.001
8
Mea
n va
lue
of th
e C
harls
on In
dex
(SD
3 , ran
ge)9
0.69
(1.0
0, 0
-6)
0.42
(0.7
8, 0
-4)
<0.0
018
M
ean
valu
e of
Cha
rlson
Com
bine
d C
omor
bidi
ty In
dex
(SD
3 , ra
nge)
10
3.19
(1.5
1, 0
-7)
2.93
(1.4
2, 0
-8)
0.00
2
Hea
rt di
seas
e11,1
2 98
(42)
48
(21)
<0
.001
2.
81(1
.91-
4.13
) H
yper
tens
ion11
,13
101
(44)
74
(32)
0.
008
1.65
(1.1
4-2.
38)
Dia
bete
s11,1
4 69
(30)
28
(12)
<0
.001
3.
09 (1
.95-
4.89
) D
epre
ssio
n11,1
5 12
(5)
3 (1
) 0.
031
4.16
(1.1
4-15
.16)
C
ardi
ac sy
mpt
oms16
Palp
itatio
n w
ithou
t phy
sica
l exe
rcis
e 14
3 (6
2)
107
(47)
<0
.001
1.
94 (1
.11-
2.32
)
Irre
gula
r hea
rtbea
ts
132
(58)
10
9 (4
8)
0.01
3 1.
60 (1
.07-
2.30
)
Che
st p
ain
durin
g an
ger o
r oth
er k
ind
of e
mot
ion
118
(52)
72
(32)
<0
.001
2.
33 (1
.58-
3.42
)
Results
54
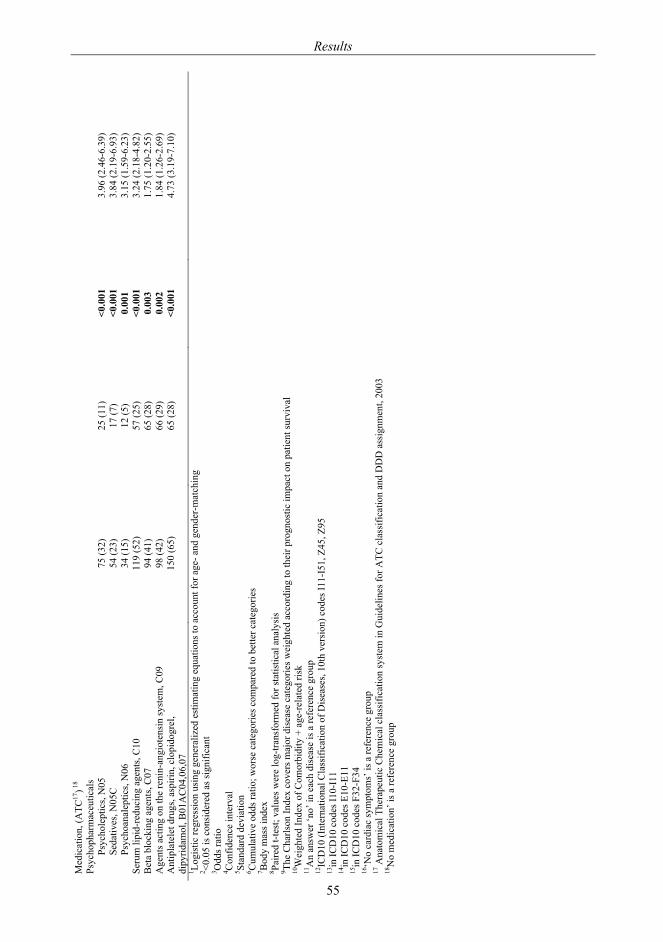
Med
icat
ion,
(ATC
17)18
Ps
ycho
phar
mac
eutic
als
Ps
ycho
lept
ics,
N05
75
(32)
25
(11)
<0
.001
3.
96 (2
.46-
6.39
)
Seda
tives
, N05
C
54 (2
3)
17 (7
) <0
.001
3.
84 (2
.19-
6.93
)
Psyc
hoan
alep
tics,
N06
34
(15)
12
(5)
0.00
1 3.
15 (1
.59-
6.23
) Se
rum
lipi
d-re
duci
ng a
gent
s, C
10
119
(52)
57
(25)
<0
.001
3.
24 (2
.18-
4.82
) B
eta
bloc
king
age
nts,
C07
94
(41)
65
(28)
0.
003
1.75
(1.2
0-2.
55)
Age
nts a
ctin
g on
the
reni
n-an
giot
ensi
n sy
stem
, C09
98
(42)
66
(29)
0.
002
1.84
(1.2
6-2.
69)
Ant
ipla
tele
t dru
gs, a
spiri
n, c
lopi
dogr
el,
dipy
ridam
ol, B
01A
C04
,06,
07
150
(65)
65
(28)
<0
.001
4.
73 (3
.19-
7.10
)
1 Logi
stic
regr
essi
on u
sing
gen
eral
ized
est
imat
ing
equa
tions
to a
ccou
nt fo
r age
- and
gen
der-
mat
chin
g 2 <0
.05
is c
onsi
dere
d as
sign
ifica
nt
3 Odd
s rat
io
4 Con
fiden
ce in
terv
al
5 Stan
dard
dev
iatio
n
6 Cum
ulat
ive
odds
ratio
; wor
se c
ateg
orie
s com
pare
d to
bet
ter c
ateg
orie
s 7 B
ody
mas
s ind
ex
8 Paire
d t-t
est;
valu
es w
ere
log-
trans
form
ed fo
r sta
tistic
al a
naly
sis
9 The
Cha
rlson
Inde
x co
vers
maj
or d
isea
se c
ateg
orie
s wei
ghte
d ac
cord
ing
to th
eir p
rogn
ostic
impa
ct o
n pa
tient
surv
ival
10
Wei
ghte
d In
dex
of C
omor
bidi
ty +
age
-rel
ated
risk
11
An
answ
er ‘n
o’ in
eac
h di
seas
e is
a re
fere
nce
grou
p
12IC
D10
(Int
erna
tiona
l Cla
ssifi
catio
n of
Dis
ease
s, 10
th v
ersi
on) c
odes
I11-
I51,
Z45
, Z95
13in
ICD
10 c
odes
I10-
I11
14in
ICD
10 c
odes
E10
-E11
15
in IC
D10
cod
es F
32-F
34
16‘N
o ca
rdia
c sy
mpt
oms’
is a
refe
renc
e gr
oup
17 A
nato
mic
al T
hera
peut
ic C
hem
ical
cla
ssifi
catio
n sy
stem
in G
uide
lines
for A
TC c
lass
ifica
tion
and
DD
D a
ssig
nmen
t, 20
03
18N
o m
edic
atio
n’ is
a re
fere
nce
grou
p
Results
55
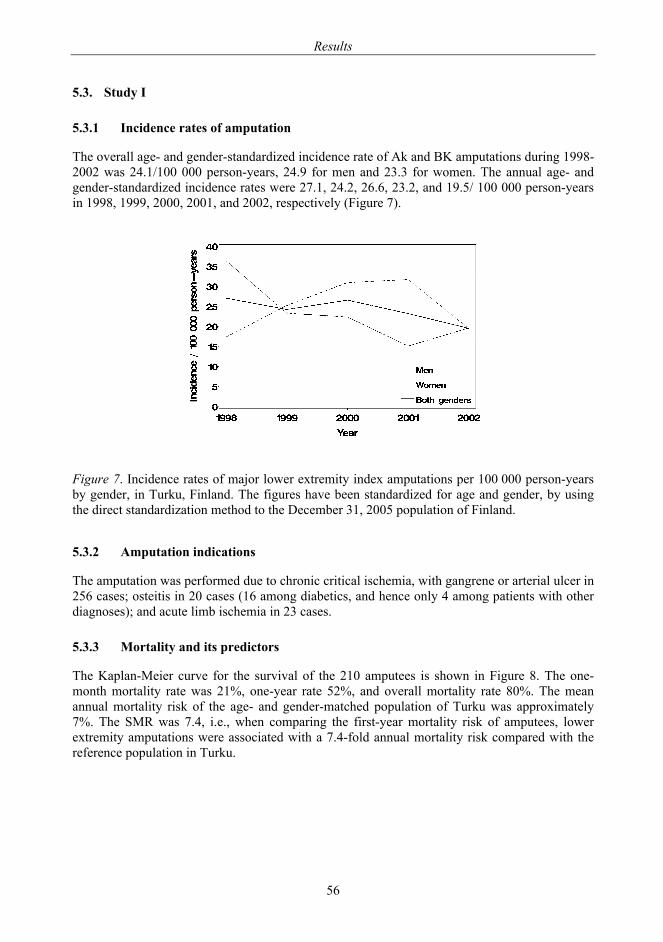
Results
56
5.3. Study I
5.3.1 Incidence rates of amputation
The overall age- and gender-standardized incidence rate of Ak and BK amputations during 1998-2002 was 24.1/100 000 person-years, 24.9 for men and 23.3 for women. The annual age- and gender-standardized incidence rates were 27.1, 24.2, 26.6, 23.2, and 19.5/ 100 000 person-years in 1998, 1999, 2000, 2001, and 2002, respectively (Figure 7).
Figure 7. Incidence rates of major lower extremity index amputations per 100 000 person-years by gender, in Turku, Finland. The figures have been standardized for age and gender, by using the direct standardization method to the December 31, 2005 population of Finland.
5.3.2 Amputation indications
The amputation was performed due to chronic critical ischemia, with gangrene or arterial ulcer in 256 cases; osteitis in 20 cases (16 among diabetics, and hence only 4 among patients with other diagnoses); and acute limb ischemia in 23 cases.
5.3.3 Mortality and its predictors
The Kaplan-Meier curve for the survival of the 210 amputees is shown in Figure 8. The one-month mortality rate was 21%, one-year rate 52%, and overall mortality rate 80%. The mean annual mortality risk of the age- and gender-matched population of Turku was approximately 7%. The SMR was 7.4, i.e., when comparing the first-year mortality risk of amputees, lower extremity amputations were associated with a 7.4-fold annual mortality risk compared with the reference population in Turku.
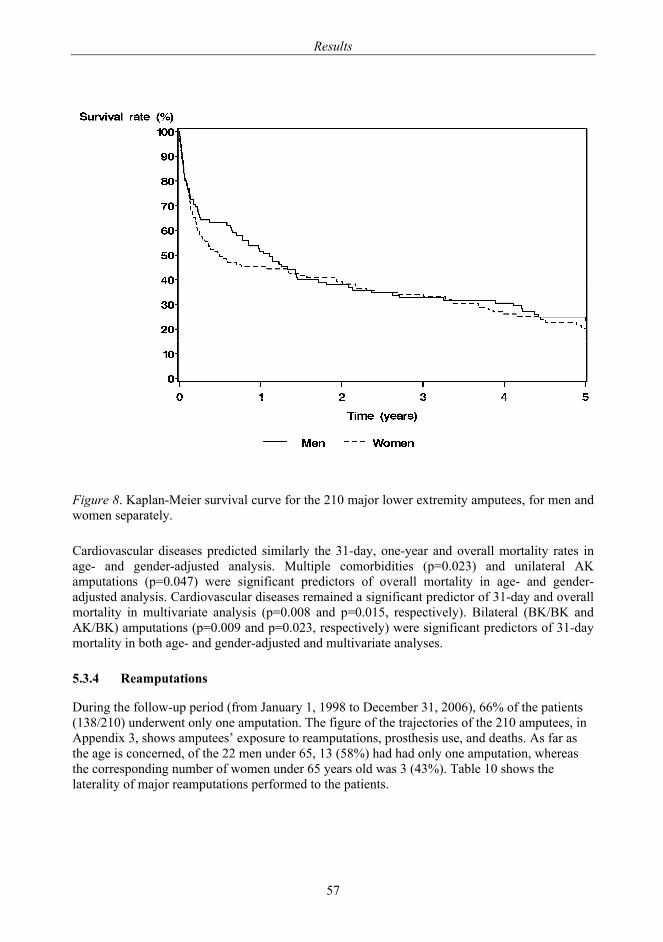
Results
57
Figure 8. Kaplan-Meier survival curve for the 210 major lower extremity amputees, for men and women separately.
Cardiovascular diseases predicted similarly the 31-day, one-year and overall mortality rates in age- and gender-adjusted analysis. Multiple comorbidities (p=0.023) and unilateral AK amputations (p=0.047) were significant predictors of overall mortality in age- and gender-adjusted analysis. Cardiovascular diseases remained a significant predictor of 31-day and overall mortality in multivariate analysis (p=0.008 and p=0.015, respectively). Bilateral (BK/BK and AK/BK) amputations (p=0.009 and p=0.023, respectively) were significant predictors of 31-day mortality in both age- and gender-adjusted and multivariate analyses.
5.3.4 Reamputations
During the follow-up period (from January 1, 1998 to December 31, 2006), 66% of the patients (138/210) underwent only one amputation. The figure of the trajectories of the 210 amputees, in Appendix 3, shows amputees’ exposure to reamputations, prosthesis use, and deaths. As far as the age is concerned, of the 22 men under 65, 13 (58%) had had only one amputation, whereas the corresponding number of women under 65 years old was 3 (43%). Table 10 shows the laterality of major reamputations performed to the patients.
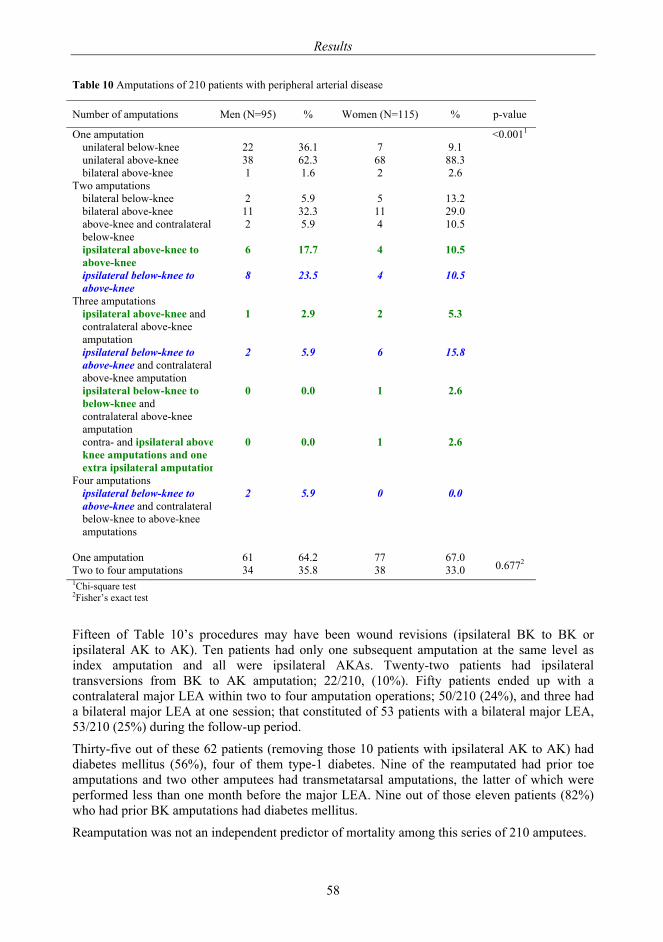
Results
58
Table 10 Amputations of 210 patients with peripheral arterial disease
Number of amputations Men (N=95) % Women (N=115) % p-value
One amputation <0.0011 unilateral below-knee 22 36.1 7 9.1 unilateral above-knee 38 62.3 68 88.3 bilateral above-knee 1 1.6 2 2.6
Two amputations bilateral below-knee 2 5.9 5 13.2 bilateral above-knee 11 32.3 11 29.0 above-knee and contralateral below-knee
2 5.9 4 10.5
ipsilateral above-knee to above-knee
6 17.7 4 10.5
ipsilateral below-knee to above-knee
8 23.5 4 10.5
Three amputations ipsilateral above-knee and contralateral above-knee amputation
1 2.9 2 5.3
ipsilateral below-knee to above-knee and contralateral above-knee amputation
2 5.9 6 15.8
ipsilateral below-knee to below-knee and contralateral above-knee amputation
0 0.0 1 2.6
contra- and ipsilateral aboveknee amputations and one extra ipsilateral amputation
0 0.0 1 2.6
Four amputations ipsilateral below-knee to above-knee and contralateral below-knee to above-knee amputations
2 5.9 0 0.0
One amputation 61 64.2 77 67.0
0.6772 Two to four amputations 34 35.8 38 33.0 1Chi-square test 2Fisher’s exact test Fifteen of Table 10’s procedures may have been wound revisions (ipsilateral BK to BK or ipsilateral AK to AK). Ten patients had only one subsequent amputation at the same level as index amputation and all were ipsilateral AKAs. Twenty-two patients had ipsilateral transversions from BK to AK amputation; 22/210, (10%). Fifty patients ended up with a contralateral major LEA within two to four amputation operations; 50/210 (24%), and three had a bilateral major LEA at one session; that constituted of 53 patients with a bilateral major LEA, 53/210 (25%) during the follow-up period.
Thirty-five out of these 62 patients (removing those 10 patients with ipsilateral AK to AK) had diabetes mellitus (56%), four of them type-1 diabetes. Nine of the reamputated had prior toe amputations and two other amputees had transmetatarsal amputations, the latter of which were performed less than one month before the major LEA. Nine out of those eleven patients (82%) who had prior BK amputations had diabetes mellitus.
Reamputation was not an independent predictor of mortality among this series of 210 amputees.
Results
59
5.3.5 Below knee/above knee -ratio
In 1998-2002, the below-knee vs. above-knee, i.e. BK/AK, ratio was 74/219=0.34. (The annual BK/AK ratios for the years 1998 to 2002 were 18/49=0.37, 13/46=0.28, 17/46=0.37, 15/39=0.38, and 11/39=0.28, respectively.)
5.3.6 Preventive revascularizations
PTA was performed on the same extremity as the index major LEA on a total of 49/210 (23%) cases and on 39/49 (80%) of cases less than six months before the major LEA. Respectively, the following surgical LERs were performed on 47/210 (22%) cases: Y prosthesis on 8/210 (4%) and 1/8 (13%) less than six months before the major LEA, bypass at the inguinal level on 29/210 (14%) and 14/29 (48%) less than six months before the major LEA, bypass at the suprapopliteal level on 18/210 (9%) and 13/18 (72%) less than six months before major LEA, and bypass at the infrapopliteal level on 4/210 (2%) and 4/4 (100%) less than six months before the major LEA. (Tables in Appendices 4 and 5)
Patients who had to stay at hospital for a prolonged time or who were discharged into long-term care or intermediate care had a significantly lower 1-year and an overall survival rate in both age- and gender-adjusted and multivariate analyses.
5.4. Study II
The mean age of the 119 amputees admitted from home for their index major LEA was 73.6 years (SD 11.5 years, 48% men). Fifty-one were able to return home and 68 were discharged into institutional care. Their background characteristics are shown in Table 7, divided by patients’ discharge destination and prosthetic ambulation ability: discharged home with prosthesis, home without prosthesis, or into institutional care.
5.4.1 Predictors for institutional care discharge
Institutional discharge associated with sociodemographic variables were female gender, older age, and living alone in the univariate logistic regression model. Institutionalization was also associated with heart disease, unilateral AK or bilateral amputation, and not having diabetes combined with renal disease, or not having had a LER performed. The use of psycholeptics predicted discharge into institutional care, whereas use of serum lipid-reducing agents predicted discharge to home.
In the models adjusted for age and gender, those having unilateral AK or bilateral amputation, living alone, and using psycholeptics, had a higher risk of being discharged into institutional care.
Lastly, in the multivariate model, older age, living alone in preamputation, and unilateral AK or bilateral amputation at 31 days after the first major LEA were significantly associated with discharge destination into institutional care (Table 11).
5.4.2 Prosthesis usage among survivors
Of the 51 survivors returning home after their first major LEA, 36 (71%) received a prosthesis. The remaining 15 survivors had either: 1) a combination of age of 75 years or older and unilateral AK or bilateral amputation, or 2) a combination of unilateral AK or bilateral amputation and hemiplegia, paraplegia, uremia, or alcohol misuse.
Results
60
Of the 68 patients who were discharged into institutional care, three (4%) had a prosthesis by one year, and 36 (53%) without prosthesis were 75 years or older and had a primary amputation level higher than below-knee. The remaining 29 patients were either younger than 75 years old (n=18) and/ or had below-knee as their primary amputation level (n=11). They did not receive a prosthesis, because 15 (52%) of them died within the first two to four months after primary major LEA and the remainder had comorbidities such as alcohol misuse, depression, dementia, hemiplegia, or cancer metastases.
In cross-tabulation, those amputees who received a prosthesis (n=39) were significantly younger (p<0.001), were more frequently men (p=0.014), lived with a companion (p=0.006), had unilateral BK rather than unilateral AK or bilateral amputation (p<0.001), and had diabetes (p=0.013) more frequently than those who remained non-ambulatory. Twenty-seven (51%) of the 53 patients younger than 75 and 12 (18%) out of the 66 of the 75-year-olds or older received a prosthesis.
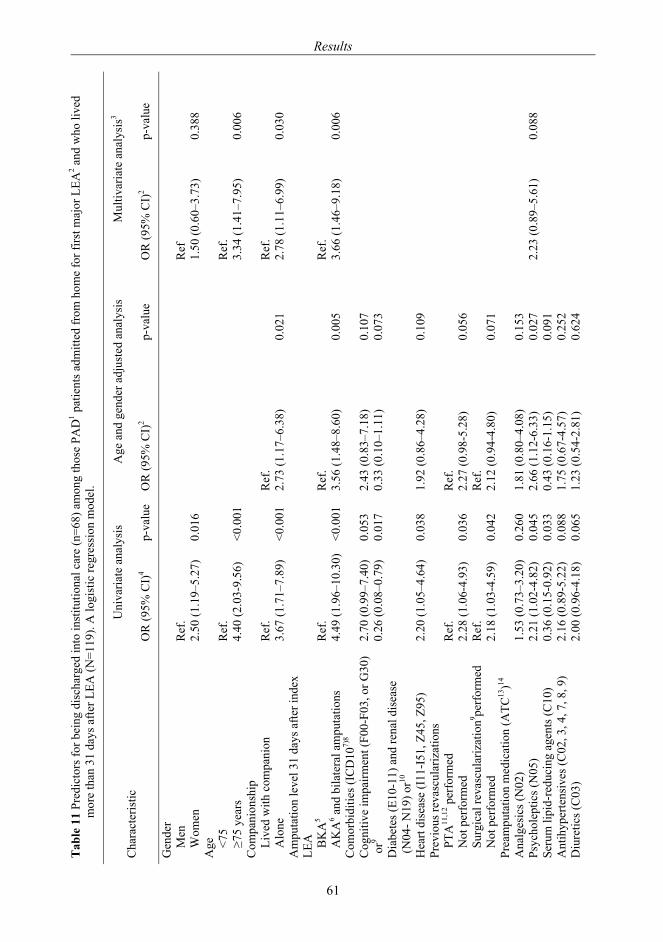
Tab
le 1
1 Pr
edic
tors
for b
eing
dis
char
ged
into
inst
itutio
nal c
are
(n=6
8) a
mon
g th
ose
PAD
1 pat
ient
s adm
itted
from
hom
e fo
r firs
t maj
or L
EA2 a
nd w
ho li
ved
m
ore
than
31
days
afte
r LEA
(N=1
19).
A lo
gist
ic re
gres
sion
mod
el.
Cha
ract
eris
tic
Uni
varia
te a
naly
sis
Age
and
gen
der a
djus
ted
anal
ysis
M
ultiv
aria
te a
naly
sis3
OR
(95%
CI)
4
p-va
lue
OR
(95%
CI)
2 p-
valu
e O
R (9
5% C
I)2
p-va
lue
Gen
der
Men
R
ef.
R
ef
W
omen
2.
50 (1
.19–
5.27
) 0.
016
1.50
(0.6
0–3.
73)
0.38
8 A
ge
<75
Ref
.
Ref
.
≥75
year
s 4.
40 (2
.03-
9.56
) <0
.001
3.
34 (1
.41–
7.95
) 0.
006
Com
pani
onsh
ip
Live
d w
ith c
ompa
nion
R
ef.
R
ef.
R
ef.
A
lone
3.
67 (1
.71–
7.89
) <0
.001
2.
73 (1
.17–
6.38
) 0.
021
2.78
(1.1
1–6.
99)
0.03
0 A
mpu
tatio
n le
vel 3
1 da
ys a
fter i
ndex
LE
A
BK
A5
Ref
.
Ref
.
Ref
.
AK
A6 a
nd b
ilate
ral a
mpu
tatio
ns
4.49
(1.9
6–10
.30)
<0
.001
3.
56 (1
.48–
8.60
) 0.
005
3.66
(1.4
6–9.
18)
0.00
6 C
omor
bidi
ties (
ICD
107)
8
C
ogni
tive
impa
irmen
t (F0
0-F0
3, o
r G30
) or
9 D
iabe
tes (
E10-
11) a
nd re
nal d
isea
se
(N04
- N19
) or10
2.70
(0.9
9–7.
40)
0.26
(0.0
8–0.
79)
0.05
3 0.
017
2.43
(0.8
3–7.
18)
0.33
(0.1
0–1.
11)
0.10
7 0.
073
Hea
rt di
seas
e (I
11-I
51, Z
45, Z
95)
2.20
(1.0
5–4.
64)
0.03
8 1.
92 (0
.86–
4.28
) 0.
109
Prev
ious
reva
scul
ariz
atio
ns
PTA
11,1
2 per
form
ed
Ref
.
Ref
.
Not
per
form
ed
2.28
(1.0
6-4.
93)
0.03
6 2.
27 (0
.98-
5.28
) 0.
056
Surg
ical
reva
scul
ariz
atio
n9 perf
orm
ed
Ref
.
Ref
.
Not
per
form
ed
2.18
(1.0
3-4.
59)
0.04
2 2.
12 (0
.94-
4.80
) 0.
071
Prea
mpu
tatio
n m
edic
atio
n (A
TC13
)14
Ana
lges
ics (
N02
) 1.
53 (0
.73–
3.20
) 0.
260
1.81
(0.8
0–4.
08)
0.15
3
Ps
ycho
lept
ics (
N05
) 2.
21 (1
.02-
4.82
) 0.
045
2.66
(1.1
2-6.
33)
0.02
7 2.
23 (0
.89–
5.61
) 0.
088
Seru
m li
pid-
redu
cing
age
nts (
C10
) 0.
36 (0
.15-
0.92
) 0.
033
0.43
(0.1
6-1.
15)
0.09
1
A
ntih
yper
tens
ives
(C02
, 3, 4
, 7, 8
, 9)
2.16
(0.8
9-5.
22)
0.08
8 1.
75 (0
.67-
4.57
) 0.
252
Diu
retic
s (C
03)
2.00
(0.9
6-4.
18)
0.06
5 1.
23 (0
.54-
2.81
) 0.
624
Results
61
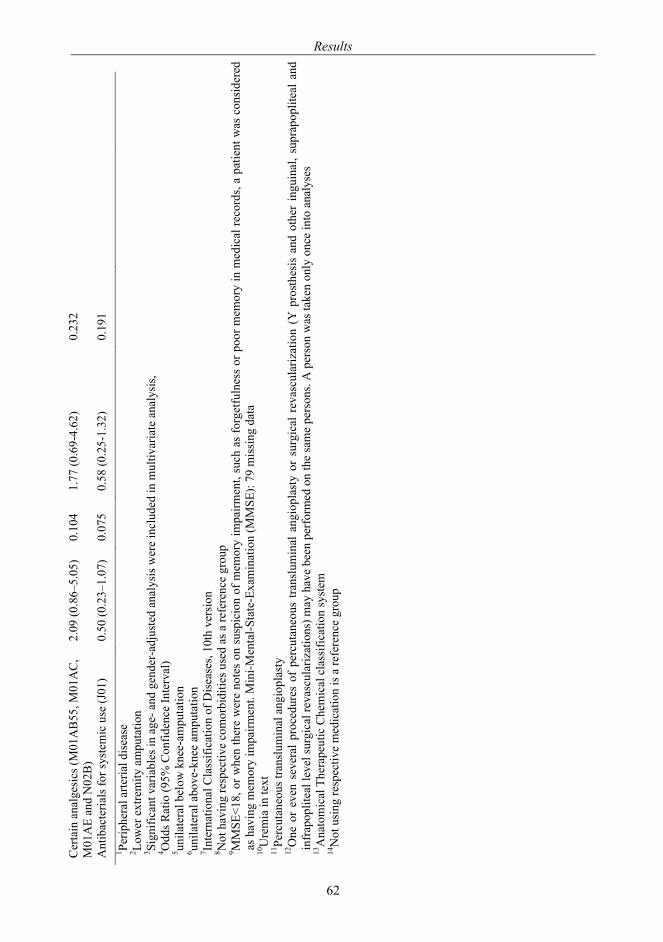
Cer
tain
ana
lges
ics (
M01
AB
55, M
01A
C,
M01
AE
and
N02
B)
2.09
(0.8
6–5.
05)
0.10
4 1.
77 (0
.69-
4.62
) 0.
232
Ant
ibac
teria
ls fo
r sys
tem
ic u
se (J
01)
0.50
(0.2
3–1.
07)
0.07
5 0.
58 (0
.25-
1.32
) 0.
191
1 Perip
hera
l arte
rial d
isea
se
2 Low
er e
xtre
mity
am
puta
tion
3 Si
gnifi
cant
var
iabl
es in
age
- and
gen
der-
adju
sted
ana
lysi
s wer
e in
clud
ed in
mul
tivar
iate
ana
lysi
s,
4 Odd
s Rat
io (9
5% C
onfid
ence
Inte
rval
) 5 un
ilate
ral b
elow
kne
e-am
puta
tion
6 un
ilate
ral a
bove
-kne
e am
puta
tion
7 In
tern
atio
nal C
lass
ifica
tion
of D
isea
ses,
10th
ver
sion
8 Not
hav
ing
resp
ectiv
e co
mor
bidi
ties u
sed
as a
refe
renc
e gr
oup
9 M
MSE
<18,
or w
hen
ther
e w
ere
note
s on
sus
pici
on o
f mem
ory
impa
irmen
t, su
ch a
s fo
rget
fuln
ess
or p
oor m
emor
y in
med
ical
reco
rds,
a pa
tient
was
con
side
red
as h
avin
g m
emor
y im
pairm
ent.
Min
i-Men
tal-S
tate
-Exa
min
atio
n (M
MSE
): 79
mis
sing
dat
a
10U
rem
ia in
text
11
Perc
utan
eous
tran
slum
inal
ang
iopl
asty
12
One
or
even
sev
eral
pro
cedu
res
of p
ercu
tane
ous
trans
lum
inal
ang
iopl
asty
or
surg
ical
rev
ascu
lariz
atio
n (Y
pro
sthe
sis
and
othe
r in
guin
al, s
upra
popl
iteal
and
in
frap
oplit
eal l
evel
surg
ical
reva
scul
ariz
atio
ns) m
ay h
ave
been
per
form
ed o
n th
e sa
me
pers
ons.
A p
erso
n w
as ta
ken
only
onc
e in
to a
naly
ses
13A
nato
mic
al T
hera
peut
ic C
hem
ical
cla
ssifi
catio
n sy
stem
14
Not
usi
ng re
spec
tive
med
icat
ion
is a
refe
renc
e gr
oup
Results
62
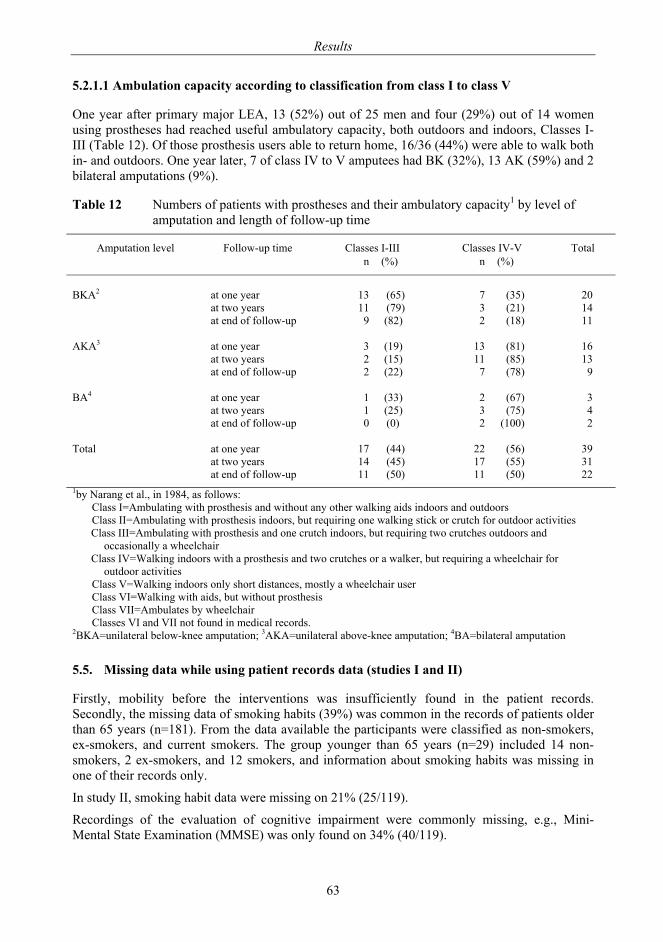
Results
63
5.2.1.1 Ambulation capacity according to classification from class I to class V
One year after primary major LEA, 13 (52%) out of 25 men and four (29%) out of 14 women using prostheses had reached useful ambulatory capacity, both outdoors and indoors, Classes I-III (Table 12). Of those prosthesis users able to return home, 16/36 (44%) were able to walk both in- and outdoors. One year later, 7 of class IV to V amputees had BK (32%), 13 AK (59%) and 2 bilateral amputations (9%).
Table 12 Numbers of patients with prostheses and their ambulatory capacity1 by level of amputation and length of follow-up time
Amputation level Follow-up time Classes I-III Classes IV-V Total n (%) n (%)
BKA2 at one year 13 (65) 7 (35) 20
at two years 11 (79) 3 (21) 14 at end of follow-up
9 (82) 2 (18) 11
AKA3 at one year 3 (19) 13 (81) 16 at two years 2 (15) 11 (85) 13 at end of follow-up
2 (22) 7 (78) 9
BA4 at one year 1 (33) 2 (67) 3 at two years 1 (25) 3 (75) 4 at end of follow-up
0 (0) 2 (100) 2
Total at one year 17 (44) 22 (56) 39 at two years 14 (45) 17 (55) 31 at end of follow-up 11 (50) 11 (50) 22
1by Narang et al., in 1984, as follows: Class I=Ambulating with prosthesis and without any other walking aids indoors and outdoors Class II=Ambulating with prosthesis indoors, but requiring one walking stick or crutch for outdoor activities Class III=Ambulating with prosthesis and one crutch indoors, but requiring two crutches outdoors and
occasionally a wheelchair Class IV=Walking indoors with a prosthesis and two crutches or a walker, but requiring a wheelchair for
outdoor activities Class V=Walking indoors only short distances, mostly a wheelchair user Class VI=Walking with aids, but without prosthesis Class VII=Ambulates by wheelchair Classes VI and VII not found in medical records.
2BKA=unilateral below-knee amputation; 3AKA=unilateral above-knee amputation; 4BA=bilateral amputation
5.5. Missing data while using patient records data (studies I and II)
Firstly, mobility before the interventions was insufficiently found in the patient records. Secondly, the missing data of smoking habits (39%) was common in the records of patients older than 65 years (n=181). From the data available the participants were classified as non-smokers, ex-smokers, and current smokers. The group younger than 65 years (n=29) included 14 non-smokers, 2 ex-smokers, and 12 smokers, and information about smoking habits was missing in one of their records only.
In study II, smoking habit data were missing on 21% (25/119).
Recordings of the evaluation of cognitive impairment were commonly missing, e.g., Mini-Mental State Examination (MMSE) was only found on 34% (40/119).
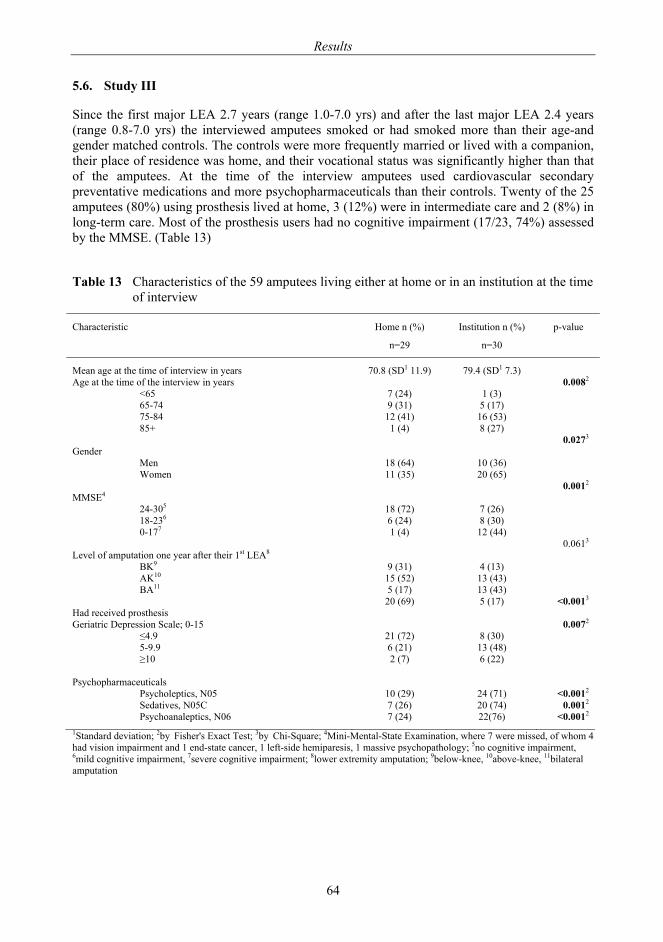
Results
64
5.6. Study III
Since the first major LEA 2.7 years (range 1.0-7.0 yrs) and after the last major LEA 2.4 years (range 0.8-7.0 yrs) the interviewed amputees smoked or had smoked more than their age-and gender matched controls. The controls were more frequently married or lived with a companion, their place of residence was home, and their vocational status was significantly higher than that of the amputees. At the time of the interview amputees used cardiovascular secondary preventative medications and more psychopharmaceuticals than their controls. Twenty of the 25 amputees (80%) using prosthesis lived at home, 3 (12%) were in intermediate care and 2 (8%) in long-term care. Most of the prosthesis users had no cognitive impairment (17/23, 74%) assessed by the MMSE. (Table 13)
Table 13 Characteristics of the 59 amputees living either at home or in an institution at the time of interview
Characteristic Home n (%)
n=29
Institution n (%)
n=30
p-value
Mean age at the time of interview in years 70.8 (SD1 11.9) 79.4 (SD1 7.3) Age at the time of the interview in years 0.0082 <65 7 (24) 1 (3) 65-74 9 (31) 5 (17) 75-84 12 (41) 16 (53) 85+ 1 (4) 8 (27) Gender
0.0273
Men 18 (64) 10 (36) Women 11 (35) 20 (65) MMSE4
0.0012
24-305 18 (72) 7 (26) 18-236 6 (24) 8 (30) 0-177 1 (4) 12 (44) Level of amputation one year after their 1st LEA8
0.0613
BK9 9 (31) 4 (13) AK10 15 (52) 13 (43) BA11 5 (17) 13 (43) Had received prosthesis
20 (69) 5 (17) <0.0013
Geriatric Depression Scale; 0-15 0.0072 ≤4.9 21 (72) 8 (30) 5-9.9 6 (21) 13 (48) ≥10 2 (7) 6 (22) Psychopharmaceuticals
Psycholeptics, N05 10 (29) 24 (71) <0.0012 Sedatives, N05C 7 (26) 20 (74) 0.0012 Psychoanaleptics, N06 7 (24) 22(76) <0.0012 1Standard deviation; 2by Fisher's Exact Test; 3by Chi-Square; 4Mini-Mental-State Examination, where 7 were missed, of whom 4 had vision impairment and 1 end-state cancer, 1 left-side hemiparesis, 1 massive psychopathology; 5no cognitive impairment, 6mild cognitive impairment, 7severe cognitive impairment; 8lower extremity amputation; 9below-knee, 10above-knee, 11bilateral amputation
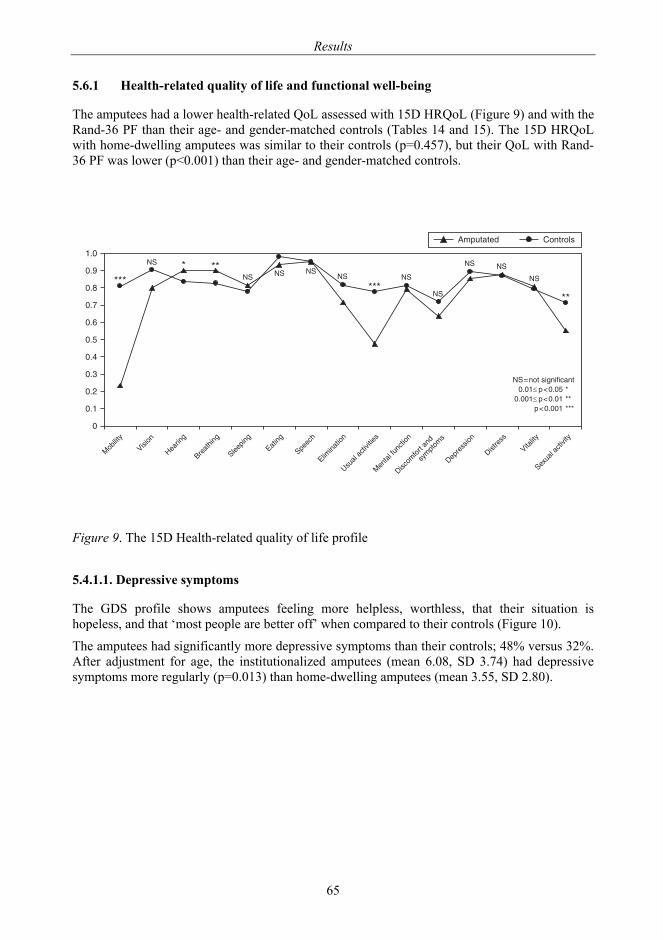
Results
65
5.6.1 Health-related quality of life and functional well-being
The amputees had a lower health-related QoL assessed with 15D HRQoL (Figure 9) and with the Rand-36 PF than their age- and gender-matched controls (Tables 14 and 15). The 15D HRQoL with home-dwelling amputees was similar to their controls (p=0.457), but their QoL with Rand-36 PF was lower (p<0.001) than their age- and gender-matched controls.
Figure 9. The 15D Health-related quality of life profile
5.4.1.1. Depressive symptoms
The GDS profile shows amputees feeling more helpless, worthless, that their situation is hopeless, and that ‘most people are better off’ when compared to their controls (Figure 10).
The amputees had significantly more depressive symptoms than their controls; 48% versus 32%. After adjustment for age, the institutionalized amputees (mean 6.08, SD 3.74) had depressive symptoms more regularly (p=0.013) than home-dwelling amputees (mean 3.55, SD 2.80).
�
���
���
���
���
���
��
��
���
���
���
�������� ��������
��������
������
�����!
"����#��!
$������!
%����!
$���&#
%����������
'����(�&��)�����
������(*��&����
+��&��*���(���
��������
+���������
+�������
��������
$�,���(�&��)���
---
--
.$ - --.$ .$ .$
.$
---.$
.$
.$ .$
.$
.$/���(��!��*�&�������� �0���� -������ �0���� --
�0����� ---
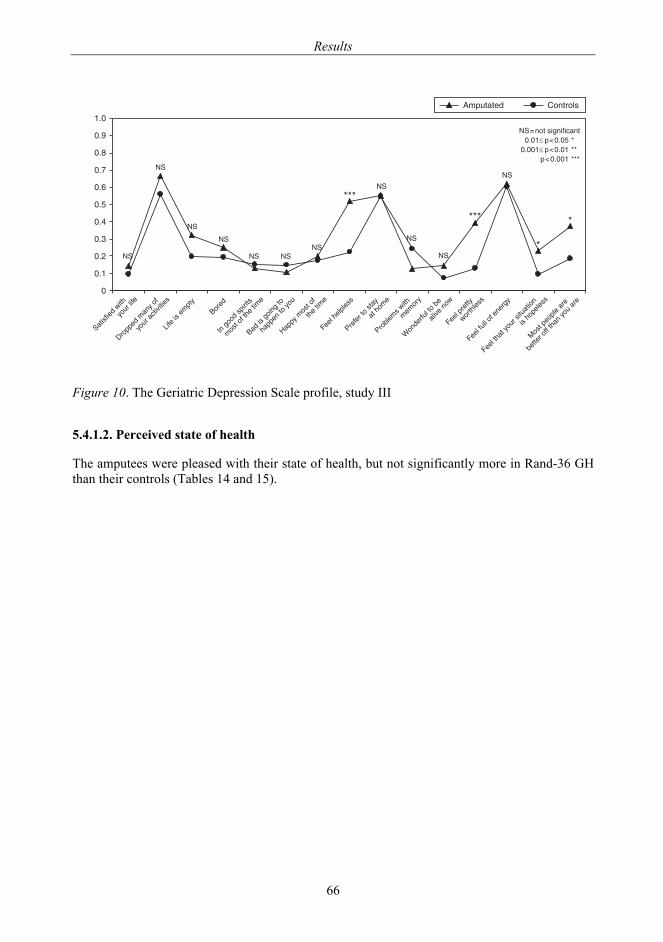
Results
66
Figure 10. The Geriatric Depression Scale profile, study III
5.4.1.2. Perceived state of health
The amputees were pleased with their state of health, but not significantly more in Rand-36 GH than their controls (Tables 14 and 15).
�
���
���
���
���
���
��
��
���
���
���
��������������
���������������
�������������
����
!��"�����������
���������#������
������"���"���
#������������
$������������
�#������
%��&�#�&�&���
'�������������
���#���
'��(&����)��#
������
*�������&����(�
�&������)
%��&�������
)���#&���
%��&���&&��������"�
%��&��#�����������������
���#���&���
+���������)��#
�����&���
,+-������"������������� �.���� /������ �.���� //
�.����� ///
,+
,+
,+
,+
,+ ,+,+
///,+
,+
,+
///
,+
/
/
0�������� 1�����&�
2��������&�����
�(�����������#����������
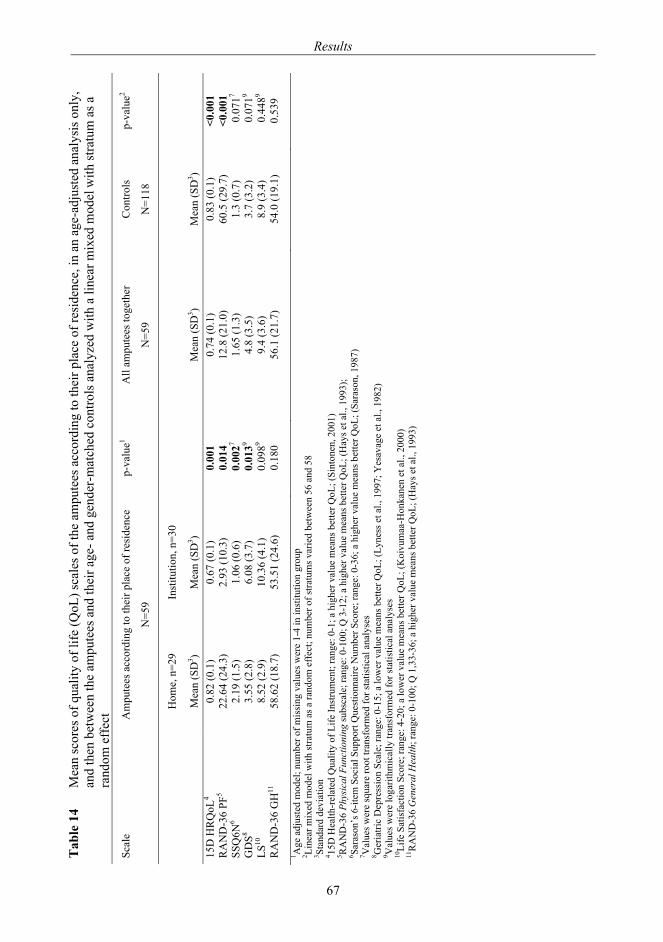
Tab
le 1
4 M
ean
scor
es o
f qua
lity
of li
fe (Q
oL) s
cale
s of t
he a
mpu
tees
acc
ordi
ng to
thei
r pla
ce o
f res
iden
ce, i
n an
age
-adj
uste
d an
alys
is o
nly,
an
d th
en b
etw
een
the
ampu
tees
and
thei
r age
- and
gen
der-
mat
ched
con
trols
ana
lyze
d w
ith a
line
ar m
ixed
mod
el w
ith st
ratu
m a
s a
ra
ndom
eff
ect
Scal
e A
mpu
tees
acc
ordi
ng to
thei
r pla
ce o
f res
iden
ce
N=5
9
p-va
lue1
All
ampu
tees
toge
ther
N=5
9 C
ontro
ls
N=1
18
p-va
lue2
H
ome,
n=2
9 In
stitu
tion,
n=3
0
M
ean
(SD
3 ) M
ean
(SD
3 )
Mea
n (S
D3 )
Mea
n (S
D3 )
15
D H
RQ
oL4
0.82
(0.1
) 0.
67 (0
.1)
0.00
1 0.
74 (0
.1)
0.83
(0.1
) <0
.001
R
AN
D-3
6 PF
5 22
.64
(24.
3)
2.93
(10.
3)
0.01
4 12
.8 (2
1.0)
60
.5 (2
9.7)
<0
.001
SS
Q6N
6 2.
19 (1
.5)
1.06
(0.6
) 0
.002
7 1.
65 (1
.3)
1.3
(0.7
) 0
.071
7 G
DS8
3.55
(2.8
) 6.
08 (3
.7)
0.0
139
4.8
(3.5
) 3.
7 (3
.2)
0.0
719
LS10
8.
52 (2
.9)
10.3
6 (4
.1)
0.0
989
9.4
(3.6
) 8.
9 (3
.4)
0.4
489
RA
ND
-36
GH
11
58.6
2 (1
8.7)
53
.51
(24.
6)
0.18
0
56.1
(21.
7)
54.0
(19.
1)
0.53
9 1 A
ge a
djus
ted
mod
el; n
umbe
r of m
issi
ng v
alue
s wer
e 1-
4 in
inst
itutio
n gr
oup
2 Line
ar m
ixed
mod
el w
ith st
ratu
m a
s a ra
ndom
eff
ect;
num
ber o
f stra
tum
s var
ied
betw
een
56 a
nd 5
8 3 St
anda
rd d
evia
tion
4 15D
Hea
lth-r
elat
ed Q
ualit
y of
Life
Inst
rum
ent;
rang
e: 0
-1; a
hig
her v
alue
mea
ns b
ette
r QoL
; (Si
nton
en, 2
001)
5 R
AN
D-3
6 Ph
ysic
al F
unct
ioni
ng su
bsca
le; r
ange
: 0-1
00; Q
3-1
2; a
hig
her v
alue
mea
ns b
ette
r QoL
; (H
ays e
t al.,
199
3);
6 Sara
son’
s 6-it
em S
ocia
l Sup
port
Que
stio
nnai
re N
umbe
r Sco
re; r
ange
: 0-3
6; a
hig
her v
alue
mea
ns b
ette
r QoL
; (Sa
raso
n, 1
987)
7 V
alue
s wer
e sq
uare
root
tran
sfor
med
for s
tatis
tical
ana
lyse
s 8 G
eria
tric
Dep
ress
ion
Scal
e; ra
nge:
0-1
5; a
low
er v
alue
mea
ns b
ette
r QoL
; (Ly
ness
et a
l., 1
997;
Yes
avag
e et
al.,
198
2)
9 Val
ues w
ere
loga
rithm
ical
ly tr
ansf
orm
ed fo
r sta
tistic
al a
naly
ses
10Li
fe S
atis
fact
ion
Scor
e; ra
nge:
4-2
0; a
low
er v
alue
mea
ns b
ette
r QoL
; (K
oivu
maa
-Hon
kane
n et
al.,
200
0)
11R
AN
D-3
6 G
ener
al H
ealth
; ran
ge: 0
-100
; Q 1
,33-
36; a
hig
her v
alue
mea
ns b
ette
r QoL
; (H
ays e
t al.,
199
3)
Results
67
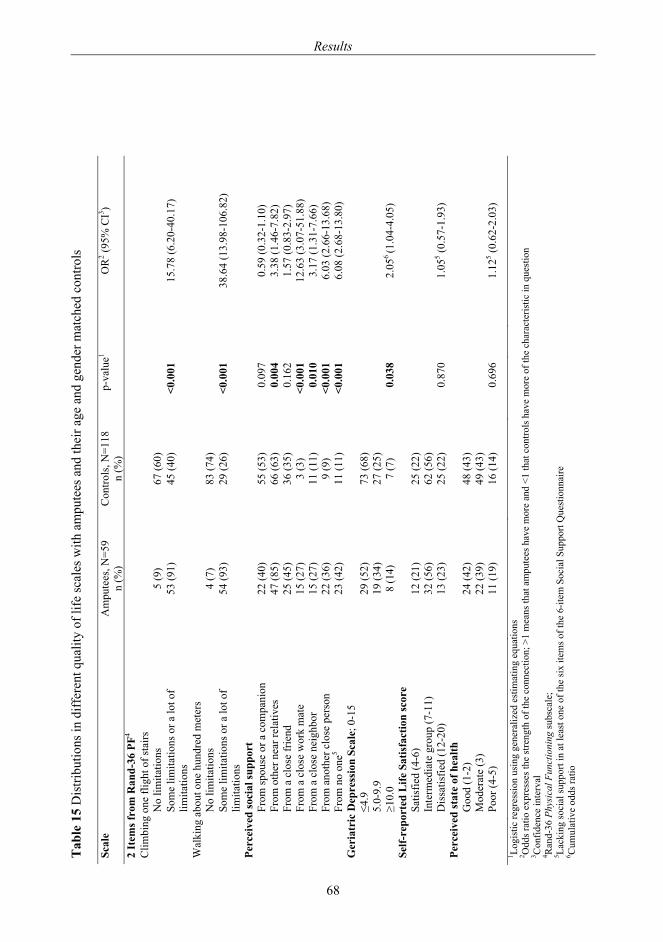
Tab
le 1
5 D
istri
butio
ns in
diff
eren
t qua
lity
of li
fe sc
ales
with
am
pute
es a
nd th
eir a
ge a
nd g
ende
r mat
ched
con
trols
Scal
e A
mpu
tees
, N=5
9 C
ontro
ls, N
=118
p-
valu
e1 O
R2 (9
5% C
I3 )
n (%
) n
(%)
2 It
ems f
rom
Ran
d-36
PF4
Clim
bing
one
flig
ht o
f sta
irs
N
o lim
itatio
ns
5 (9
) 67
(60)
So
me
limita
tions
or a
lot o
f lim
itatio
ns
53 (9
1)
45 (4
0)
<0.0
01
15
.78
(6.2
0-40
.17)
Wal
king
abo
ut o
ne h
undr
ed m
eter
s
N
o lim
itatio
ns
4 (7
) 83
(74)
So
me
limita
tions
or a
lot o
f lim
itatio
ns
54 (9
3)
29 (2
6)
<0.0
01
38
.64
(13.
98-1
06.8
2)
Perc
eive
d so
cial
supp
ort
From
spou
se o
r a c
ompa
nion
22
(40)
55
(53)
0.
097
0.
59 (0
.32-
1.10
)
From
oth
er n
ear r
elat
ives
47
(85)
66
(63)
0.
004
3.
38 (1
.46-
7.82
)
From
a c
lose
frie
nd
25 (4
5)
36 (3
5)
0.16
2
1.57
(0.8
3-2.
97)
Fr
om a
clo
se w
ork
mat
e 15
(27)
3
(3)
<0.0
01
12
.63
(3.0
7-51
.88)
From
a c
lose
nei
ghbo
r 15
(27)
11
(11)
0.
010
3.
17 (1
.31-
7.66
)
From
ano
ther
clo
se p
erso
n 22
(36)
9
(9)
<0.0
01
6.
03 (2
.66-
13.6
8)
Fr
om n
o on
e5 23
(42)
11
(11)
<0
.001
6.08
(2.6
8-13
.80)
G
eria
tric
Dep
ress
ion
Scal
e; 0
-15
≤4.9
29
(52)
73
(68)
5.
0-9.
9 19
(34)
27
(25)
≥1
0.0
8 (1
4)
7 (7
) 0.
038
2.
056 (1
.04-
4.05
) Se
lf-re
port
ed L
ife S
atis
fact
ion
scor
e
Sa
tisfie
d (4
-6)
12 (2
1)
25 (2
2)
Inte
rmed
iate
gro
up (7
-11)
32
(56)
62
(56)
D
issa
tisfie
d (1
2-20
) 13
(23)
25
(22)
0.
870
1.
055 (0
.57-
1.93
) Pe
rcei
ved
stat
e of
hea
lth
Goo
d (1
-2)
24 (4
2)
48 (4
3)
Mod
erat
e (3
) 22
(39)
49
(43)
Po
or (4
-5)
11 (1
9)
16 (1
4)
0.69
6
1.12
5 (0.6
2-2.
03)
1 Logi
stic
regr
essi
on u
sing
gen
eral
ized
est
imat
ing
equa
tions
2 O
dds r
atio
exp
ress
es th
e st
reng
th o
f the
con
nect
ion;
>1
mea
ns th
at a
mpu
tees
hav
e m
ore
and
<1 th
at c
ontro
ls h
ave
mor
e of
the
char
acte
ristic
in q
uest
ion
3 Con
fiden
ce in
terv
al
4 Ran
d-36
Phy
sica
l Fun
ctio
ning
subs
cale
; 5 La
ckin
g so
cial
supp
ort i
n at
leas
t one
of t
he si
x ite
ms o
f the
6-it
em S
ocia
l Sup
port
Que
stio
nnai
re
6 Cum
ulat
ive
odds
ratio
Results
68
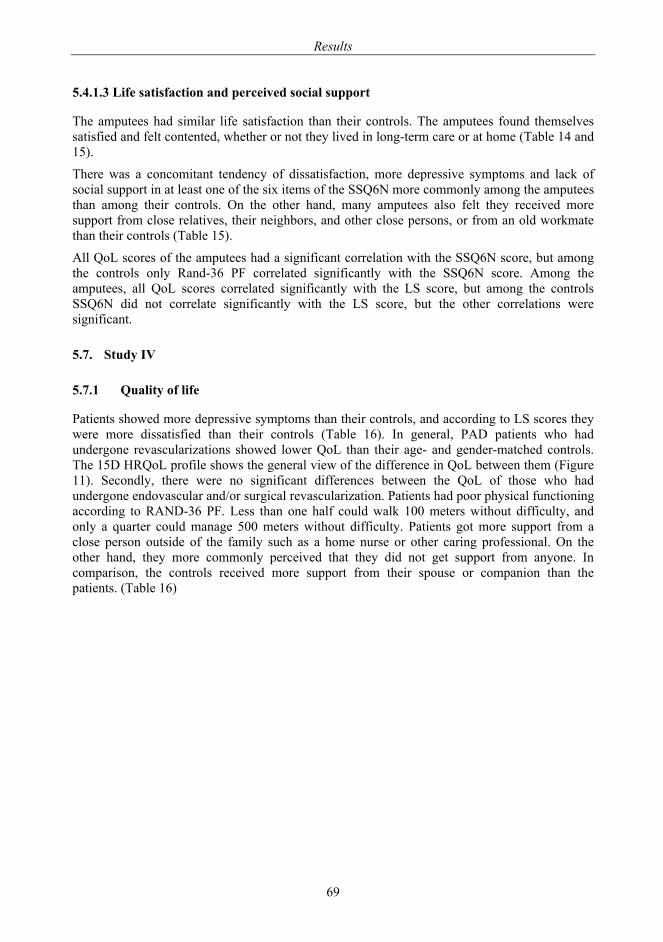
Results
69
5.4.1.3 Life satisfaction and perceived social support
The amputees had similar life satisfaction than their controls. The amputees found themselves satisfied and felt contented, whether or not they lived in long-term care or at home (Table 14 and 15).
There was a concomitant tendency of dissatisfaction, more depressive symptoms and lack of social support in at least one of the six items of the SSQ6N more commonly among the amputees than among their controls. On the other hand, many amputees also felt they received more support from close relatives, their neighbors, and other close persons, or from an old workmate than their controls (Table 15).
All QoL scores of the amputees had a significant correlation with the SSQ6N score, but among the controls only Rand-36 PF correlated significantly with the SSQ6N score. Among the amputees, all QoL scores correlated significantly with the LS score, but among the controls SSQ6N did not correlate significantly with the LS score, but the other correlations were significant.
5.7. Study IV
5.7.1 Quality of life
Patients showed more depressive symptoms than their controls, and according to LS scores they were more dissatisfied than their controls (Table 16). In general, PAD patients who had undergone revascularizations showed lower QoL than their age- and gender-matched controls. The 15D HRQoL profile shows the general view of the difference in QoL between them (Figure 11). Secondly, there were no significant differences between the QoL of those who had undergone endovascular and/or surgical revascularization. Patients had poor physical functioning according to RAND-36 PF. Less than one half could walk 100 meters without difficulty, and only a quarter could manage 500 meters without difficulty. Patients got more support from a close person outside of the family such as a home nurse or other caring professional. On the other hand, they more commonly perceived that they did not get support from anyone. In comparison, the controls received more support from their spouse or companion than the patients. (Table 16)
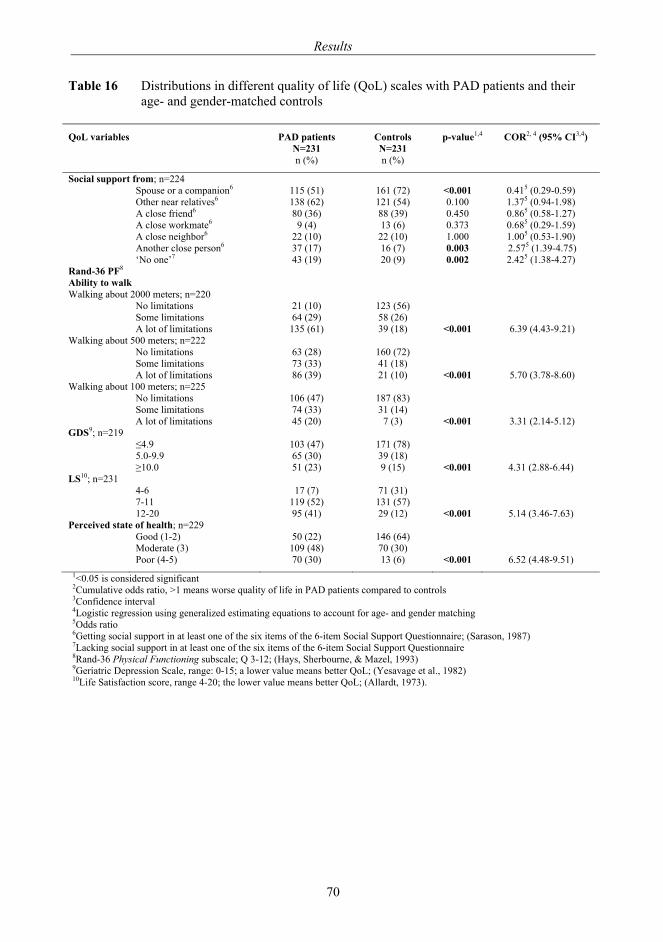
Results
70
Table 16 Distributions in different quality of life (QoL) scales with PAD patients and their age- and gender-matched controls
QoL variables PAD patients
N=231 Controls N=231
p-value1,4 COR2, 4 (95% CI3,4)
n (%) n (%)
Social support from; n=224 Spouse or a companion6 115 (51) 161 (72) <0.001 0.415 (0.29-0.59) Other near relatives6 138 (62) 121 (54) 0.100 1.375 (0.94-1.98) A close friend6 80 (36) 88 (39) 0.450 0.865 (0.58-1.27) A close workmate6 9 (4) 13 (6) 0.373 0.685 (0.29-1.59) A close neighbor6 22 (10) 22 (10) 1.000 1.005 (0.53-1.90) Another close person6 37 (17) 16 (7) 0.003 2.575 (1.39-4.75) ‘No one’7 43 (19) 20 (9) 0.002 2.425 (1.38-4.27) Rand-36 PF8 Ability to walk Walking about 2000 meters; n=220 No limitations 21 (10) 123 (56) Some limitations 64 (29) 58 (26) A lot of limitations 135 (61) 39 (18) <0.001 6.39 (4.43-9.21) Walking about 500 meters; n=222 No limitations 63 (28) 160 (72) Some limitations 73 (33) 41 (18) A lot of limitations 86 (39) 21 (10) <0.001 5.70 (3.78-8.60) Walking about 100 meters; n=225 No limitations 106 (47) 187 (83) Some limitations 74 (33) 31 (14) A lot of limitations 45 (20) 7 (3) <0.001 3.31 (2.14-5.12) GDS9; n=219 ≤4.9 103 (47) 171 (78) 5.0-9.9 65 (30) 39 (18) ≥10.0 51 (23) 9 (15) <0.001 4.31 (2.88-6.44) LS10; n=231 4-6 17 (7) 71 (31) 7-11 119 (52) 131 (57) 12-20 95 (41) 29 (12) <0.001 5.14 (3.46-7.63) Perceived state of health; n=229 Good (1-2) 50 (22) 146 (64) Moderate (3) 109 (48) 70 (30) Poor (4-5) 70 (30) 13 (6) <0.001 6.52 (4.48-9.51)
1<0.05 is considered significant 2Cumulative odds ratio, >1 means worse quality of life in PAD patients compared to controls 3Confidence interval 4Logistic regression using generalized estimating equations to account for age- and gender matching 5Odds ratio 6Getting social support in at least one of the six items of the 6-item Social Support Questionnaire; (Sarason, 1987) 7Lacking social support in at least one of the six items of the 6-item Social Support Questionnaire 8Rand-36 Physical Functioning subscale; Q 3-12; (Hays, Sherbourne, & Mazel, 1993) 9Geriatric Depression Scale, range: 0-15; a lower value means better QoL; (Yesavage et al., 1982) 10Life Satisfaction score, range 4-20; the lower value means better QoL; (Allardt, 1973).
Results
71
Figure 11. 15D HRQoL profile for the PAD patients and their age- and gender-matched controls. -▲-PAD patients after endovascular procedures -●- controls NS=not significant, 0.01≤p<0.05 *, 0.001≤p<0.01 **, p<0.001 ***.
There was clear co-linearity between all QoL measures. Low 15D HRQoL, Rand-36 PF, and high GDS, and LS predicted a low ‘perceived state of health’ in both the patient and the control groups (p<0.001). Similarly the inability to walk was associated with a poor ‘perceived state of health’ amongst patients (p<0.001). The same association tended to be similar among the controls (p=0.047). Those patients who felt they were given more social support were associated with having a better ‘perceived state of health’ compared to those individuals who did not feel they were given support. The latter association did not exist among the controls.
�
���
���
���
���
���
��
��
���
���
���
�������
������
�������
���������
��������
�����
����!�
��"�������
#�$��%�!��&�����
�����%'$�!����
(��!�"'���%��)
��"���"�
(���������
(�������
��������
��*$��%�!��&���
+++
+++ +++
+++ ++++++
+++
+++
+++
+++ ++++++
+++
+ +
Discussion
72
6. DISCUSSION
The aim of the study originated from a sad thought, which occurred several years ago: why are the people attending the prosthetic rehabilitation group in such poor shape? In this study incidence, mortality, and subjective health status together with QoL measurements of people who have undergone a major LEA due to PAD –the most common reason for LEAs– have been evaluated. In addition, the subjective health status of patients with severe PAD and achievement of limb salvage through LERs has been analyzed, and is now discussed.
6.1. External and internal validity of the study
6.1.1 Strengths of the study
The data in studies I, II and III included all amputees of the study period and area.
As well, the strength of the Study IV was that original patient populations covered all PAD patients with revascularizations during the given period and from the specified district. One and the same researcher carefully examined all medical records twice.
The case-control study design in Studies III and IV ensured the QoL outcome was comparable between cases and their controls sharing the same age, community and historical period of life.
A high number of responses were reached in both of these studies, so that almost all QoL assessments case-control pairs could be analyzed making the results reliable. All measures of perceived status of health and QoL used were reliable and widely used in research purposes. Furthermore, all of them had Finnish versions.
6.1.2 Study limitations
The series of the amputees was small, comprising only 210 patients. Studies I and II being retrospective medical record reviews, some important information concerning the prognostic factors among the amputees was often lacking. Data, especially from the rehabilitation point of view, such as preamputation ambulatory capacity, global physical functional capacity or evaluation of cognitive function (including also an up-to-date MMSE) were often missing.
From the research point of view, it is unfortunate that psychological and cognitive functional tests were not found to be carried out. But since decisions are mainly made according to knowledge recorded in medical notes, this means that, in clinical practice, the value of psychological and cognitive capacity is not fully understood for maintaining mobility after amputation.
One very important predisposing factor, smoking (Wattanakit et al., 2005), was also found to be poorly recorded in the medical records. For some reason, doctors had not regularly recorded these old patients’ smoking habits. Therefore, it was not possible to include the important PAD risk factor of smoking habits in the statistical modeling.
The degree of renal insufficiency was difficult to assess from the records. Variables indicative of the severity of diabetes should also be recorded in detail. Perhaps there was more concern over diabetic neuropathic changes than purely vascular changes in peripheral arteries.
Discussion
73
For practical reasons, age and gender, and not the place of residence were used for matching criteria in the Study III. That led to a situation where most controls lived in their own homes, while half of the amputees lived in institutions. Most individuals in long-term care move less than they would move at home. They also have more comorbidities and medication.
The fact that the amputees were personally interviewed and the controls completed postal questionnaires only, may have influenced our results, e.g. in the amount of social support reported by the controls. Comparison of the morbidity data may suffer from self-administered answers of the controls in the postal questionnaires. For the comorbidity data it would have therefore been better, had it been possible to carry out a medical data review. However, the same structured questionnaire was used for both cases and controls, although the MMSE was performed for the amputees only during the interview.
Different interviewers, e.g., nurses or lay persons and respondents in postal inquiries may give varying information on diagnoses and medication (Brogger et al., 2002). Neither inter-rater reliability nor test-retest reliability was tested for the questionnaire. The patients were only expected to give answers to the clear-cut questions of the QoL scales, and thus the responses of the scale items were relied on.
6.1.3 Representativeness of the study samples
In Study I, the amputation incidence rates were standardized for age and gender, using the December 31, 2005 population of Finland as reference. Therefore, the standardized incidence rates in this study may be compared to the overall amputation rates in Finland or some other district or city with a population composition similar to that in Finland.
Study II was a pure medical record review describing the predictors for institutionalization, which type of accommodation is a burden to both community and individual, and also the ambulatory capacity of the patients and ambulatory capacity predictors.
Study III particularly in relation with rehabilitation sphere of patients’ post major amputation period: The practical issue this study brings out is to become aware of how ill people who are bound to lose their leg due to PAD are. In fact, many of them die soon after their amputation due to reasons other than their leg; quite often their heart cannot bear the stress [very high post-operative (within 30 days) mortality and high at 12 month mortality rate]. If they survive, these patients might be so exhausted that they cannot stand the amount of rehabilitation and training that would otherwise be necessary to avoid extra muscle weakening due to along period of being bed-bound.
Study III had about 30 % of the original amputated patient population, and Study IV patients covered 80% of the survivors after revascularization. The results of the studies may only be generalized to survival cohorts among PAD patients after LER (IV) or LEA (III) (Fletcher, 2005) Since the follow-up time varied 0.3-6.4 years from the time of intervention, in Study IV, the fact that recurrence of symptoms may occur at different time points, might have also affected the QoL.
6.1.4 Importance of measuring the quality of life and the perceived functional status of patients
QoL measurements give all members of the treatment chain a better understanding of the patient’s subjective state of health: even a generic instrument gives it if several scales measuring different domains of QoL are used together. These may offer a good way to follow the rehabilitation process. If the QoL was measured at the beginning of the training period for
Discussion
74
prosthesis use, and then subsequently checked throughout the follow-up period, the improvement of QoL by Rand-36 would also be very promising for the amputee.
Participants’ perceived status of health and QoL was measured multidimensionally, by triangulating to understand the aspects of their health-related quality of life. Triangulation is expected to strengthen the basis for conclusions to be drawn from the study and add its reliability (Cohen, 2002; Last, 2001). The QoL was approached by viewing it through the domains of physical functioning, mental state and socio-psychological attitudes or behavioral attitudes towards life in general. Positive correlations between all other QoL scores used and the social support score and separately between the life satisfaction score of the amputees, indicate that the scales used focused on the same issue. As well the fact that there was clear co-linearity between all QoL measures as to the ‘perceived state of health’ of the PAD patients and their controls were concerned refers to the same thing.
6.2. Consideration of the findings
6.2.1 Participants
Amputated as well revascularized patients seemed to constitute samples of severely ill patients. The mean age of the amputated patients was high, as elsewhere in Finland (Eskelinen et al., 2001; Pohjolainen and Alaranta, 1999) and in industrialized countries in general (Wong, 2006). The revascularized patients were somewhat younger than the amputees, and the surgically revascularized were younger than endovascularized, which is in line with expectations (Eskelinen et al., 2001).
6.2.2 The incidence rates of amputations
The incidence rates of amputations in the city of Turku were considerably high compared to some other reports from elsewhere (Melillo et al., 2004; Pohjolainen and Alaranta, 1999; Sandnes et al., 2004). However, comparison of incidence rates is difficult even in Finland, because some Finnish studies rely exclusively on the national registers maintained by THL, Finland. They register all operations and their codes, and index amputations cannot be differentiated from the overall records. Some studies, such as ours, have overviewed all medical records of the amputees in their study area. Some have not used a reference population in their calculations.
Sandnes and co-workers reported their standardized amputation rates from the State of Washington. They had also included toe and metatarsal amputations. The incidence rates were 22.3-30.6/100 000 person-years. However, minor amputations accounted for approximately one third of all LEAs (Sandnes et al., 2004). The incidence rates of AK and BK amputations in Turku ranged from 27.1 to 19.5/100 000 person-years, showing a slight decrease over time. Furthermore, our rates did not include traumatic or reamputations, as do many other reports (Carmona et al., 2005). LEA incidence rates are decreasing (Winell et al., 2006). However, the number of the amputees will stay relatively large. Ziegler-Graham et al (2008) have predicted that due to the fact that in the year 2005 there were 1.6 million persons living with the loss of a limb in the USA (38% of them had an amputation secondary to dysvascular disease with a comorbid diagnosis of diabetes mellitus), the number of US citizens living with the loss of a limb will more than double by the year 2050 to 3.6 million. If incidence rates secondary to dysvascular disease can be reduced by 10%, this number would be lowered by 225 000. (Ziegler-Graham et al., 2008)
Discussion
75
6.2.3 Mortality and its predicting factors
The standardized mortality ratio after the first year following the index amputation in the study group is comparable to the earlier studies. Ebskov and co-workers reported SMR figures from 8.4 to 8.9 (Ebskov, 1999).
The presence of cardiovascular disease predicted both early and late postoperative mortality. The patients who died within one month most likely had a severe cardiovascular disease, and their gangrenous leg was amputated as mere pain relief for their final days.
Therefore, individual perioperative assessment should be carried out according to defined criteria. For example, the Eagle criteria include age >70 years, angina, diabetes, Q wave on ECG, and history of congestive heart failure (Back et al., 2003; de Virgilio et al., 1996; Matsuura et al., 1997). The cardiac medication should be adjusted perioperatively (Schouten et al.).
The survival of AK amputated patients is known to be shorter than that of patients with BK amputations (Aulivola et al., 2004; Pohjolainen and Alaranta, 1998). Among patients in this study, unilateral AK amputations predicted the overall mortality in univariate analysis only. On the other hand, 79% of the BK amputated patients were younger than 65 years.
LERs had probably been done electively to the patients who were expected to have a higher survival rate. In fact, their early survival was better than that of the ones who had not had surgical reconstruction, but the later mortality figures were similar to those of the other patients. (Zeller et al., 2009; Rowe et al., 2009)
6.2.4 Reamputations
During the four to eight year follow-up, the ipsilateral, from BK to AK reamputation rate was 10%, which is in accordance with Izumi and his co-workers who report on true reamputation of first-time amputation with a seven to ten year follow-up of diabetic patients, being 13.3% at five years. Their contralateral major LEA reamputation rate was 53.3% at five years, while in this study it was 24% during our follow-up. (Izumi et al., 2006)
A reamputation is a serious and stressful procedure for the patient. Even a wound revision is a sign of prolongation of the convalescence after LEA which delays the possible prosthetic rehabilitation. The condition of the contralateral lower extremity is essential to determine during the perioperative time.
6.2.5 Institutionalization after major lower extremity amputation
In Finland, there is a general opinion or belief that elderly Finns have been in institutional care more frequently than other elderly Europeans. There is an active policy to change this situation. The present patients, however, were so frail that many of the ones who were admitted from home died during the early follow-up, and survival was even shorter if their condition did not allow them to return home any more.
Positively inspiring social activities and physical training groups for the elderly should be organized already before any amputation. However, physical rehabilitation and psychological help following amputation are fundamental.
Discussion
76
In this study, the main predictors for institutionalization were older age, living alone, and more invasive amputation (AK or BA). Depression and dementia are one of the most common causes of dependency and being forced to move into institutional care in old age (Anstey et al., 2007). However, loss in mobility also causes dependency. Disability usually occurs first in mobility, and mobility difficulty predicts the onset of disability in tasks essential to living independently in the community (e.g. shopping, meal preparation) and caring for oneself (e.g. bathing, dressing). (Harris et al., 1989) At least half of end-stage disability in self-care tasks results from such a progressive decline in function, whereas the remaining half may occur catastrophically due to a medical event, e.g. stroke (Ferrucci et al., 1996) or CLI and amputation.
Most of the patients who received a prosthesis were able to return home. Those who had a distinct comorbid condition, e.g. hemiplegia, dementia, or an extra burden of alcohol misuse became non-ambulatory.
6.2.6 Prosthesis usage
Although the mortality of the series was very high, the prosthesis use of the surviving patients’ was in accordance with other reports (Nehler et al., 2003a). Of those who returned home and survived more than one year after primary amputation, two-thirds of the patients had received a prosthesis, and just under half of the prosthesis users were able to walk both in- and outdoors. Prosthesis use was related to younger age, type of amputation, and better health. Compared to an earlier Finnish follow-up from Southern Finland (Pohjolainen et al., 1989), where 27% of 267 PAD patients and 25% of the 245 diabetics 25% died within two months, and evidently after that 55 PAD patients and 74 diabetics were fitted with a prosthesis, our results might resemble those figures from this earlier decade. In 2005, Geertzen and his co-workers observed that the chances of walking 500 m or more decrease with an increase in age and a more proximal amputation (Geertzen et al., 2005). They estimate the ability to walk 500 m or more enabled adequate activities of daily living (ADL) independence and is a positive determinant with respect to quality of life in amputees. In the grading system of Narang and his co-workers (Narang et al., 1984), walking distance is not evaluated together with ambulatory capacity. In 2005, Taylor and his co-workers stated that younger healthy patients with BK amputations achieved functional outcomes similar to what might be expected after successful lower extremity revascularization (Taylor et al., 2005a). They suggest that amputation in these instances should probably not be considered failed therapy, but another treatment option that is capable of extending functionality and independent living. The knee joint enables good bipedal gait with contemporary prostheses (Nehler et al., 2003a).
6.2.6.1 Prosthesis versus wheelchair use
Only 33% gained prosthetic ambulation capacity and most of the amputees were either institutionalized or lived as non-ambulatory in their homes. In our medical records, class VII expressing wheelchair use was not found, although it would be beneficial and important to be able to independently use a wheelchair.
Both prostheses and wheelchairs have become lighter during the past few decades.
Amputation should not be considered as an end-of-life event, but rather as a realistic form of care if performed at the proper moment, so that long bed rest with long-healing ulcers does not diminish the functional capacity of a patient with already weakened musculature and balance.
Discussion
77
According to Chin and his co-workers, a lower amount of comorbidity, good ability to stand on the remaining leg, and a strong will to walk were found to be important factors contributing to successful prosthetic rehabilitation. Age alone is not an important factor. (Chin et al., 2002) However, training walking after a long interval of decreased mobility with chronic critical ischemia is a remarkable stress for the cardiovascular system of an amputee. Oxygen uptake with a proximal prosthesis is higher than with a distal one, and so walking with an AK prosthesis is more demanding for the heart than a BK prosthesis. Coronary artery disease or cardiac insufficiency, naturally reduce the oxygen uptake necessary for strenuous exercise such as walking with a prosthesis for, e.g., a transfemoral stump. (Chin et al., 2002)
Cardiorespiratory capacity determines postamputation capability to move, and to maintain one’s preamputation independency in the community. Cerebrovascular diseases, e.g. hemiparesis diminish prosthetic ambulation possibilities. Moreover, cognitive impairment and dementia may hinder prosthesis use. Therefore, it would be desirable not only to have physical fitness evaluated early enough at the preamputation stage and after amputation, but also MMSE for evaluating cognitive capacity. If a patient is not using prosthesis, learning wheelchair use and transfer activities may also be an important rehabilitation target for e.g. those who are partially dependent but living in a home like-dwelling. Nevertheless, proper regard for wheelchair ambulation might be good to take into consideration when inevitable amputation is planned and the possibility to use a wheelchair cannot be understated (Houghton et al., 1992), for a person who is of high age and might not be able to go through the heavy rehabilitation process needed for good prosthesis ambulation.
On the other hand, mobility in institutional care is not always supported by active physiotherapy as the general health status of an amputee does not always allow much active wheelchair use practice. In this way, loss of independency might further increase (Gillis and MacDonald, 2005; Hoenig and Rubenstein, 1991).
6.2.7 Quality of life outcome
6.2.7.1 Perceived physical functioning after amputation
PAD amputees, who had survived approximately for three years after their first major lower extremity amputation, reported to have similar life satisfaction, social support network and general state of health as their age- and gender-matched controls. The physical functioning of the amputees was notably worse than their age- and gender-matched controls, as also Pell and his co-workers reported, in 1993. They note that amputees had more problems with mobility, social isolation, lethargy, pain, sleep and emotional disturbance than controls; the ‘mobility’ variable remained as an independent factor in their multivariate logistic regression analyses. The ‘social isolation’ and ‘emotional distress’ variables lost their significance after adjustment for mobility, so they suggest that much of the poor quality of life is secondary to restricted mobility. Therefore, rehabilitation following amputation should focus on attempts to improve mobility. Most individuals in long-term care move less than they would move at home; they have poor mobility. The great majority of the patients had either AK or bilateral amputation. Hence, greater instruction in the use of wheelchairs should be included into our rehabilitation programs in order to improve mobility and social integration. (Pell et al., 1993)
Discussion
78
6.2.7.2 Social support /importance of social network
Amputees who lived at home had a larger social support network and more available social support than their controls, whereas social isolation was found in those who lived in institutional care. Those individuals who have no-one to support them should be identified.
The ability to feel that one was getting support was also important for the revascularized patients. When under stressful situations, however, many of them did not feel that this support was given.
It would be valuable to evaluate perceived social support and the size of social network already during the perioperative period, in order to focus on this aspect during rehabilitation and for the hospital discharge plan (Deans et al., 2008). Likewise, a social support survey would help the staff organize peer and support persons to visit long-term care patients and home-dwelling amputees.
Steinbach has reported that social networks diminish the likelihood of institutionalization and mortality (Steinbach, 1992). Old people who participated in some form of social activity were also found to have a risk of institutionalization of almost one-half, whereas living alone increased the likelihood of institutionalization. Participating in social activities and visiting or talking with friends or relatives were negatively related to the likelihood of mortality (Steinbach, 1992). In the medical record studies I and II social networks were not found to be reported, even though the existence of social networks may be essential for the on-going rehabilitation process. It is easier to cope with changed circumstances in mobility and health if there are informal caregivers, a partner or other friendship relationships (Gooberman-Hill and Ebrahim, 2006). Patients who live alone after hospitalization are less likely to improve in ADL function, and are more likely to be admitted to a nursing home in the subsequent month. Such patients may benefit from increased social and medical support to maintain independent living and improve function (Mahoney et al., 2000). In an optimal situation, social factors should be assessed at the time revascularizations are planned for PAD patients.
6.2.7.3 Cognitive ability
Cognitive ability also crucially affects amputated patients QoL, e.g. putting on the prosthesis becomes almost impossible without help from another person (Rafnsson et al., 2009). In this study, the helplessness of the amputees, seen in the GDS profile, was obvious; e.g. not being able to put on a prosthesis or difficulties in using a wheelchair may cause frustration and anger.
6.2.7.4 Depression and anxiety
Depression and anxiety are common up to two years post-amputation, and appear to decline thereafter to general population norms (Horgan and MacLachlan, 2004). In this study, the difference was still found three years after the amputation, but emphasized that those who lived in institutional care had the worst QoL and the highest level of depressive symptoms. The
Rehabilitation planning necessitates that a proper comprehensive assessment is carried out for the patient. In doing so, depression must be taken into account, not only by medicating for it, but also by introducing fresh, innovative, and active sports programs to give both mental and social peer support.
Discussion
79
institutionalized amputees were commonly medicated with psycho-pharmaceuticals, but e.g. a depression diagnosis was seldom reported by the participants, nor was it found in the medical records. On one hand, dementia and depression are common diagnoses of old people in long-term care today (O'Hara et al., 2002), as well as being common with the institutionalized amputees in our study. On the other hand, GDS and other verbal depression scales do not give reliable results as far as patients with low cognitive abilities are concerned (Debruyne et al., 2009).
The relationship between life dissatisfaction, increased mortality and adverse health behaviour might support the use of LS scales as a cumulative health risk indicator (Koivumaa-Honkanen et al., 2000). An optimistic personality disposition and active attempts at coping return when enough time has passed since amputation (Horgan and MacLachlan, 2004).
GDS indicated depressive symptoms among patients. Unlike their controls both amputees and revascularized patients also used more psychopharmaceuticals. There might have been clinical signs of depression, but proper evaluation of this disease has evidently not been carried out for all who needed it. Clinical depression, as it is, should be diagnosed in two stages: an effective approach could be that doctors would routinely use screening scales, such as those with well-defined cut-off points, which GPs or psychiatrists could use to make a proper clinical evaluation of the depression of patients. Depressed PAD patients have been found to have a worse outcome in their revascularized leg (Cherr et al., 2007). Moreover, many patients continued smoking irrespective of their life threatening disease, and by smoking they might have masked depressive symptoms from themselves (Breslau et al., 1998; Khaled et al., 2009).
’Type-D personality’ is defined as having a tendency to experience negative emotions and being socially inhibited. Aquarius and her co-workers have found it predicting PAD patients’ poor physical health and decreased level of independence as well as depressive symptoms in patients with PAD above and beyond ABI. Additionally, they found it predicting poor overall QoL, controlled for age, gender, PAD severity, and cardiovascular risk factors. In the current study, both among amputees and revascularized patients, there were some individuals who had abundant depressive symptoms, were dissatisfied and had no perceived social support in some of the six items of the SSQ6N. This might indicate a type-D personality. Because of this, it is important to account for personality when evaluating patient-based outcomes in the context of PAD. (Aquarius et al., 2007)
Feelings of ‘perceived control’ are crucial for maintaining functional ability in later life (Kempen et al., 1999b). It is reasonable to assume that effective care of depressive symptoms enhances the perceived physical functioning and vice versa. Preventing an increase in depressive symptoms may further help prevent deterioration in physical functioning in poorly functioning older persons (Kempen et al., 1999a). Hence, an assessment of depression in elderly adults is crucial, because depression diminishes QoL, increases mortality, and causes extra health care costs (Loughlin, 2004).
Proper management of pain and medical comorbidity may mitigate depressive symptoms anyway, as well as discussion about depressive symptoms and their treatment options (Darnall et al., 2005). However, it is possible that some of the amputees, both older and younger individuals who had many difficulties in daily living, are such personality types whose ability to be satisfied with life has kept them alive. They may have a problem-solving, salutogenic capability (Lindstrom and Eriksson, 2006). Whatever the case, it is reasonable to assume that good LS and salutogenic capability create a prerequisite for a health promoting trajectory. Personal coping mechanisms might be worth exploring among these seriously ill arteriosclerotic patients (Desmond and MacLachlan, 2006).
Discussion
80
Major LEA incidence rate is most likely decreasing (Egorova et al.; Eskelinen et al., 2004; Winell et al., 2006), but the long-term perceived functional capacity of patients after LER remains poor. The incidence rate of major LEAs might be decreasing because of 1) LERs: endovascular, surgical, or hybrid operations, where endovascular and surgical revascularizations are performed during the same session, or 2) endovascular procedures are performed using better devices, or 3) the general level of education and health awareness has been raised and thus people a) seek care earlier, b) make life-style modifications and c) have better medication, e.g. statins. However, a major LEA should not be considered an end-of-life event. The technical quality of prostheses has improved remarkably compared to the techniques that were available a few decades ago, broadening the possibilities of successful prosthesis ambulation.
In order to make invasive endovascular or surgical LERs more effective, it is necessary to concentrate on these patients’ rehabilitation and exercise programs. The poor results in mobility and overall physical functioning call for exercise rehabilitation planned specifically for PAD patients.
Conclusions
81
7. CONCLUSIONS
The following major findings and conclusions were made:
1. The incidence rates of major low extremity amputations (LEA) in the City of Turku were considerably high in 1998-2002, however the annual incidence rates decreased from 1998 to 2002. Reamputations were common during the 4 to 8 years of follow-up. Mortality during the first year after major LEA was high then levelled out to almost the same as their coevals. Cardiovascular diseases predicted high mortality after LEA. (Study I)
2. The majority of amputated patients could not return home after their first major LEA. Older age, living alone before the amputation, and unilateral above-knee or bilateral amputation at 31 days after the first major LEA were significantly associated with discharge destination into institutional care. Most elderly amputees remained non-ambulatory. (Study II)
3. Home-dwelling amputees had a relatively good life satisfaction and perceived state of health even when compared to their age- and gender match controls whereas amputees living in long-term care had a lot of depressive symptoms (Study III).
4. By using triangulation to measure the perceived status of health, a good point of view of patients’ perspective is reached. In this study, the long-term physical functioning was poor among the amputees, but also among patients after both endovascular and surgical revascularization. Depressive symptoms might hinder these patients from effective reconditioning. (Studies III and IV)
5. During the data collection and the writing of the studies a clear lack of distinctly gathered information was noticed (Studies I and II).
6. Comprehensive assessment and regular use of QoL measures might help with the effectiveness of focusing on issues that have hindered a patient from reaching a better state of health and functional capacity otherwise aimed by skilful invasive procedures. A comprehensive assessment should be done before and perioperatively with major LEA in order to save a patient from too many LEAs, and for postoperative rehabilitation in order to offer a patient as good as possible quality of the rest of his or her life. The responsibility lies on the whole care chain. (Studies III and IV)

Acknowledgements
82
ACKNOWLEDGEMENTS
This work was carried out in the Departments of Public Health and General Practice at the University of Turku during the years 2003-2010. These studies were financially supported by grants from the Uulo Arhio Foundation, the Yrjö Jahnsson Foundation, Turunmaan Duodecim-seura r.y., and the EVO Research Funds of City Hospital of Turku and Turku University Hospital.
First of all, I would like to express my warm gratitude to all the patients who have participated in these studies by giving their time for interviews and/or filling in the questionnaires.
I am sincerely grateful to my supervisors Professor Päivi Rautava and Professor Raimo Isoaho. They have both given me endless support, guidance and encouragement at various stages of this work.
Professor Matti Viitanen deserves my deepest gratitude; without his comments and expertise in geriatrics I would not have gone forward in many tricky points in the sub-articles.
I want to thank Tero Vahlberg, MSc, for guiding me patiently into the world of statistical analyses. Jukka Saukkoriipi’s quality work as a system analyst was of the utmost importance. It was a joy to solve many data management problems with him during the otherwise lonely days of research.
I am deeply grateful for the reviewers of this study, Docent Fausto Biancari and Docent Timo Pohjolainen. Their intelligent and accurate remarks on my work were most helpful. Our co-operation greatly improved the quality of this thesis.
My special thanks go to the Head of the General Practice Department, Professor Sirkka-Liisa Kivelä who offered me the opportunity to use the facilities and staff, and to Professor Markku Koskenvuo, the former Head of the Public Health Department, who constructed the set of quality of life questionnaires with me, and who was a co-author in the third sub-article. I also extend my deep thanks to the Head of the Public Health Department, Professor Jussi Vahtera, for offering me a post as a Ph.D. student.
Special thanks to co-authors: Kimmo Korhonen, MD. Ph.D. and Heikki Hiekkanen, MSc.
I warmly thank Mr. Mike Nelson, Mrs. Lorna Koskela for careful revision of the language of original publications, and Mr. Patrick Gallenger for the revision of the manuscript of the thesis. I also want to thank Mrs. Selena Nitecki, who expertly edited the thesis and the tables in this work. There are many other people whose assistance in this research has been invaluable. I thank you all.
years has been a long period of life for me, and a lot of it has passed by my computer.
During that time, I have been forced to say goodbye to very important individuals who have meant a lot to me. I cannot thank my late father Professor Kauko Aho without tears. If ever anyone encouraged me to find out the truth in life, it was he. And I think I found my own truth. He gave me his thesis on The Load on Tractor Transmission Systems in Finnish Farm Use, from 1968. This thesis has been hanging on my study wall during my Ph.D. study years, and has inspired me to persevere.
When my master in Physiatry Professor Hannu Alaranta was talking with me for the last time on the telephone, we decided that I am only to thank him here and not to dedicate the thesis to him
Seven

Acknowledgements
83
even though I would have wanted to. Hannu guided me through the first steps in my specialization in rehabilitation medicine, and introduced me to the world of disabled sports. When I was having a hard time, he promised to help me wherever he could; and did so, always with a very warn attitude. He listened and guided me in this Ph.D. process. The gratitude I feel for these two men –already deceased– is something that moves me a lot.
I have been blessed with friends who have held me up when needed; to mention some: Päivi Ovaskainen, Thea Mantsinen, Lorna Koskela, Sisko Raitis, Leena Kauppila, Eira Pekola, Pia Pennala, Harri Pietilä, Arja Miettinen and my neighbors: Anne and Heikki Lehto, Outi and Arto Ruohola, and all their kids Ruut Ruohola at the head. Not to mention a pitch-black, one year old Labrador named Saga who is able to jump three meters and make a turn while flying. I wish to thank you all.
I would not be me without my dearest mother Hilkka Aho and my older sister Marja Aho. I am deeply grateful for both of them.
The closest support and delight rests on family, and for that I am grateful and fortunate. All my three kids Mira, Markus and Linnea and even my fourth, my exchange daughter, Elisa, have been assisting me in collecting the data for this work. It is fun to realize that we did it. We all did it, and I thank you all!
References
84
REFERENCES
Geriatric Depression Scale. Available at: http://www.stanford.edu/~yesavage/GDS.html. Accessed April 3 2009. In
Internet dictionary http://www.mondofacto.com/facts/dictionary?major+amputation. 2002. getABI: German epidemiological trial on ankle brachial index for elderly patients in
family practice to detect peripheral arterial disease, significant marker for high mortality. Vasa 31:241-248.
2003. Guidelines for ATC classification and DDD assignment, 6th ed. Oslo: Norwegian Institute of Public Health.
Aalto A-M, Aro, AR., and Teperi J. 1999. RAND-36 terveyteen liittyvän elämänlaadun mittarina. Mittarin luotettavuus ja väestöarvot suomalaisessa aikuisväestössä. (RAND-36 as a measure of health related quality of life. Reliability and adult population values in Finland). . In: Stakes, editor. Tutkimuksia: The National Research and Development Centre for Welfare and Health, STAKES. p 101.
Abou-Zamzam AM, Jr., Gomez NR, Molkara A, Banta JE, Teruya TH, Killeen JD, Bianchi C. 2007. A prospective analysis of critical limb ischemia: factors leading to major primary amputation versus revascularization. Ann Vasc Surg 21:458-463.
Albäck A. 2009. Kriittinen alaraajaiskemia tulevaisuuden haasteena. Duocecim 125:432–438. Allardt E. 1973. About dimension of welfare: an explanatory analysis of the comparative
Scandinavian survey. In: Sociology RGoC, editor. Research reports Helsinki, Finland: University of Helsinki.
Anstey KJ, von Sanden C, Sargent-Cox K, Luszcz MA. 2007. Prevalence and risk factors for depression in a longitudinal, population-based study including individuals in the community and residential care. Am J Geriatr Psychiatry 15:497-505.
Aquarius AE, Denollet J, Hamming JF, Van Berge Henegouwen DP, De Vries J. 2007. Type-D personality and ankle brachial index as predictors of impaired quality of life and depressive symptoms in peripheral arterial disease. Arch Surg 142:662-667.
Armstrong DG, Lavery LA, Quebedeaux TL, Walker SC. 1997. Surgical morbidity and the risk of amputation due to infected puncture wounds in diabetic versus nondiabetic adults. J Am Podiatr Med Assoc 87:321-326.
Aronow WS. 2005. Management of peripheral arterial disease. Cardiol Rev 13:61-68. Aronow WS. 2009. Peripheral arterial disease in women. Maturitas. Arvela E, Söderström M, Albäck A, Aho PS, Tikkanen I, Lepäntalo M. 2008. Estimated
glomerular filtration rate (eGFR) as a predictor of outcome after infrainguinal bypass in patients with critical limb ischemia. Eur J Vasc Endovasc Surg 36:77-83.
Asano M, Rushton P, Miller WC, Deathe BA. 2008. Predictors of quality of life among individuals who have a lower limb amputation. Prosthet Orthot Int 32:231-243.
Aulivola B, Hile CN, Hamdan AD, Sheahan MG, Veraldi JR, Skillman JJ, Campbell DR, Scovell SD, LoGerfo FW, Pomposelli FB, Jr. 2004. Major lower extremity amputation: outcome of a modern series. Arch Surg 139:395-399; discussion 399.
Back MR, Leo F, Cuthbertson D, Johnson BL, Shamesmd ML, Bandyk DF. 2004. Long-term survival after vascular surgery: specific influence of cardiac factors and implications for preoperative evaluation. J Vasc Surg 40:752-760.
Back MR, Schmacht DC, Bowser AN, Stordahl N, Cuthbertson D, Johnson BL, Bandyk DF. 2003. Critical appraisal of cardiac risk stratification before elective vascular surgery. Vasc Endovascular Surg 37:387-397.
References
85
Basu NN, Fassiadis N, McIrvine A. 2008. Mobility one year after unilateral lower limb amputation: a modern, UK institutional report. Interact Cardiovasc Thorac Surg 7:1024-1026.
Bauman HC, Arthur HM. 1997. Relationship between functional exercise capacity and general quality of life in nonsurgical patients with lower-extremity peripheral arterial disease. J Vasc Nurs 15:21-28.
Beck AT, Ward CH, Mendelson M, Mock J, Erbaugh J. 1961. An inventory for measuring depression. Arch Gen Psychiatry 4:561-571.
Bergqvist D, Delle, M, Eckerlund, I, Holst, J, Jogestrand, T, Jörneskog, G et al. 2007. Benartärsjukdom –diagnostik och behandling En systematisk litteraturöversikt. In: SBU • Statens beredning för medicinsk utvärdering The Swedish Council on Technology Assessment in Health Care.
Biancari F, Kangasniemi OP, Mahar MA, Ylönen K. 2008. Need for late lower limb revascularization and major amputation after coronary artery bypass surgery. Eur J Vasc Endovasc Surg 35:596-602.
Biancari F, Kantonen I, Albäck A, Ihlberg L, Lehtola A, Lepäntalo M. 2000. Popliteal-to-distal bypass grafts for critical leg ischaemia. J Cardiovasc Surg (Torino) 41:281-286.
Biancari F, Salenius JP, Heikkinen M, Luther M, Ylönen K, Lepäntalo M. 2007. Risk-scoring method for prediction of 30-day postoperative outcome after infrainguinal surgical revascularization for critical lower-limb ischemia: a Finnvasc registry study. World J Surg 31:217-225; discussion 226-217.
Bilodeau S, Hebert R, Desrosiers J. 2000. Lower limb prosthesis utilisation by elderly amputees. Prosthet Orthot Int 24:126-132.
Bismuth J, Klitfod L, Sillesen H. 2001. The lack of cardiovascular risk factor management in patients with critical limb ischaemia. Eur J Vasc Endovasc Surg 21:143-146.
Bodily KC, Burgess EM. 1983. Contralateral limb and patient survival after leg amputation. Am J Surg 146:280-282.
Bradley L, Kirker SG. 2006. Secondary prevention of arteriosclerosis in lower limb vascular amputees: a missed opportunity. Eur J Vasc Endovasc Surg 32:491-493.
Breslau N, Peterson EL, Schultz LR, Chilcoat HD, Andreski P. 1998. Major depression and stages of smoking. A longitudinal investigation. Arch Gen Psychiatry 55:161-166.
Brogger J, Bakke P, Eide GE, Gulsvik A. 2002. Comparison of telephone and postal survey modes on respiratory symptoms and risk factors. Am J Epidemiol 155:572-576.
Cacoub PP, Abola MT, Baumgartner I, Bhatt DL, Creager MA, Liau CS, Goto S, Rother J, Steg PG, Hirsch AT. 2009. Cardiovascular risk factor control and outcomes in peripheral artery disease patients in the Reduction of Atherothrombosis for Continued Health (REACH) Registry. Atherosclerosis 204:e86-92.
Cao P, De Rango P. 2009. Endovascular treatment of peripheral artery disease (PAD): so old yet so far from evidence! Eur J Vasc Endovasc Surg 37:501-503.
Carmona GA, Hoffmeyer P, Herrmann FR, Vaucher J, Tschopp O, Lacraz A, Vischer UM. 2005. Major lower limb amputations in the elderly observed over ten years: the role of diabetes and peripheral arterial disease. Diabetes Metab 31:449-454.
Charlson ME, Pompei P, Ales KL, MacKenzie CR. 1987. A new method of classifying prognostic comorbidity in longitudinal studies: development and validation. J Chronic Dis 40:373-383.
Cherr GS, Wang J, Zimmerman PM, Dosluoglu HH. 2007. Depression is associated with worse patency and recurrent leg symptoms after lower extremity revascularization. J Vasc Surg 45:744-750.
References
86
Cherr GS, Zimmerman PM, Wang J, Dosluoglu HH. 2008. Patients with depression are at increased risk for secondary cardiovascular events after lower extremity revascularization. J Gen Intern Med 23:629-634.
Chin T, Sawamura S, Fujita H, Ojima I, Oyabu H, Nagakura Y, Otsuka H, Nakagawa A. 2002. %VO2max as an indicator of prosthetic rehabilitation outcome after dysvascular amputation. Prosthet Orthot Int 26:44-49.
Cohen L, Manion, L. et Morrison, K. 2002. Research Methods in Education. London: Routledge Falmer.
Connelly J, Airey M, Chell S. 2001. Variation in clinical decision making is a partial explanation for geographical variation in lower extremity amputation rates. Br J Surg 88:529-535.
Criqui MH, Denenberg JO, Bird CE, Fronek A, Klauber MR, Langer RD. 1996. The correlation between symptoms and non-invasive test results in patients referred for peripheral arterial disease testing. Vasc Med 1:65-71.
Criqui MH, Denenberg JO, Langer RD, Fronek A. 1997. The epidemiology of peripheral arterial disease: importance of identifying the population at risk. Vasc Med 2:221-226.
Criqui MH, Langer RD, Fronek A, Feigelson HS, Klauber MR, McCann TJ, Browner D. 1992. Mortality over a period of 10 years in patients with peripheral arterial disease. N Engl J Med 326:381-386.
Darnall BD, Ephraim P, Wegener ST, Dillingham T, Pezzin L, Rossbach P, MacKenzie EJ. 2005. Depressive symptoms and mental health service utilization among persons with limb loss: results of a national survey. Arch Phys Med Rehabil 86:650-658.
de Virgilio C, Pak S, Arnell T, Donayre C, Lewis RJ, Stabile BE, White R. 1996. Cardiac assessment prior to vascular surgery: is dipyridamole-sestamibi necessary? Ann Vasc Surg 10:325-329.
Deans SA, McFadyen AK, Rowe PJ. 2008. Physical activity and quality of life: A study of a lower-limb amputee population. Prosthet Orthot Int 32:186-200.
Debruyne H, Van Buggenhout M, Le Bastard N, Aries M, Audenaert K, De Deyn PP, Engelborghs S. 2009. Is the geriatric depression scale a reliable screening tool for depressive symptoms in elderly patients with cognitive impairment? Int J Geriatr Psychiatry 24:556-562.
Desmond DM, MacLachlan M. 2006. Coping strategies as predictors of psychosocial adaptation in a sample of elderly veterans with acquired lower limb amputations. Soc Sci Med 62:208-216.
Diehm C, Allenberg JR, Pittrow D, Mahn M, Tepohl G, Haberl RL, Darius H, Burghaus I, Trampisch HJ. 2009. Mortality and vascular morbidity in older adults with asymptomatic versus symptomatic peripheral artery disease. Circulation 120:2053-2061.
Diehm C, Darius H, Burghaus I, Mahn M, Pittrow D. 2008. Ankle brachial index vs metabolic syndrome for risk prediction. Lancet 372:1221; author reply 1221-1222.
Diehm C, Kareem S, Lawall H. 2004a. Epidemiology of peripheral arterial disease. Vasa 33:183-189.
Diehm C, Schuster A, Allenberg JR, Darius H, Haberl R, Lange S, Pittrow D, von Stritzky B, Tepohl G, Trampisch HJ. 2004b. High prevalence of peripheral arterial disease and co-morbidity in 6880 primary care patients: cross-sectional study. Atherosclerosis 172:95-105.
Dijkers MP. 2003. Individualization in quality of life measurement: instruments and approaches. Arch Phys Med Rehabil 84:S3-14.
Dillingham TR, Pezzin LE, Shore AD. 2005. Reamputation, mortality, and health care costs among persons with dysvascular lower-limb amputations. Arch Phys Med Rehabil 86:480-486.
Dormandy J. 1992. Palpation of peripheral pulses: a difficult art. Ann R Coll Surg Engl 74:155.
References
87
Dormandy J, Heeck L, Vig S. 1999a. Acute limb ischemia. Semin Vasc Surg 12:148-153. Dormandy J, Heeck L, Vig S. 1999b. The fate of patients with critical leg ischemia. Semin Vasc
Surg 12:142-147. Dormandy J, Heeck L, Vig S. 1999c. Intermittent claudication: a condition with underrated risks.
Semin Vasc Surg 12:96-108. Dormandy J, Murray GD. 1991. The fate of the claudicant--a prospective study of 1969
claudicants. Eur J Vasc Surg 5:131-133. Dormandy J, Rutherford RB. 2000. Management of peripheral arterial disease (PAD). TASC
Working Group. TransAtlantic Inter-Society Consensus (TASC). J Vasc Surg 31:S1-S296.
Duggan MM, Woodson J, Scott TE, Ortega AN, Menzoian JO. 1994. Functional outcomes in limb salvage vascular surgery. Am J Surg 168:188-191.
Eagle KA, Froehlich JB. 1996. Reducing cardiovascular risk in patients undergoing noncardiac surgery. N Engl J Med 335:1761-1763.
Eason SL, Petersen NJ, Suarez-Almazor M, Davis B, Collins TC. 2005. Diabetes mellitus, smoking, and the risk for asymptomatic peripheral arterial disease: whom should we screen? J Am Board Fam Pract 18:355-361.
Ebskov B. 1999. Relative mortality and long term survival for the non-diabetic lower limb amputee with vascular insufficiency. Prosthet Orthot Int 23:209-216.
Ebskov B, Josephsen P. 1980. Incidence of reamputation and death after gangrene of the lower extremity. Prosthet Orthot Int 4:77-80.
Ebskov LB, Schroeder TV, Holstein PE. 1994. Epidemiology of leg amputation: the influence of vascular surgery. Br J Surg 81:1600-1603.
Egorova NN, Guillerme S, Gelijns A, Morrissey N, Dayal R, McKinsey JF, Nowygrod R. 2010. An analysis of the outcomes of a decade of experience with lower extremity revascularization including limb salvage, lengths of stay, and safety. J Vasc Surg 51:878-885, 885 e871.
Elovainio M, Kivimäki M, Vahtera J, Ojanlatva A, Korkeila K, Suominen S, Helenius H, Koskenvuo M. 2003. Social support, early retirement, and a retirement preference: a study of 10,489 Finnish adults. J Occup Environ Med 45:433-439.
Eskelinen E, Eskelinen A, Hyytinen T, Jaakkola A. 2001. Changing pattern of major lower limb amputations in Seinäjoki Central Hospital 1997-2000. Ann Chir Gynaecol 90:290-293.
Eskelinen E, Lepäntalo M, Hietala EM, Sell H, Kauppila L, Mäenpaa I, Pitkänen J, Salminen-Peltola P, Leutola S, Eskelinen A, Kivioja A, Tukiainen E, Lukinmaa A, Brasken P, Railo M. 2004. Lower limb amputations in Southern Finland in 2000 and trends up to 2001. Eur J Vasc Endovasc Surg 27:193-200.
Farkouh ME, Rihal CS, Gersh BJ, Rooke TW, Hallett JW, Jr., O'Fallon WM, Ballard DJ. 1994. Influence of coronary heart disease on morbidity and mortality after lower extremity revascularization surgery: a population-based study in Olmsted County, Minnesota (1970-1987). J Am Coll Cardiol 24:1290-1296.
Feinglass J, Brown JL, LoSasso A, Sohn MW, Manheim LM, Shah SJ, Pearce WH. 1999. Rates of lower-extremity amputation and arterial reconstruction in the United States, 1979 to 1996. Am J Public Health 89:1222-1227.
Feinglass J, McCarthy WJ, Slavensky R, Manheim LM, Martin GJ. 2000a. Functional status and walking ability after lower extremity bypass grafting or angioplasty for intermittent claudication: results from a prospective outcomes study. J Vasc Surg 31:93-103.
Feinglass J, Morasch M, McCarthy WJ. 2000b. Measures of success and health-related quality of life in lower-extremity vascular surgery. Annu Rev Med 51:101-113.
References
88
Ferrucci L, Guralnik JM, Simonsick E, Salive ME, Corti C, Langlois J. 1996. Progressive versus catastrophic disability: a longitudinal view of the disablement process. J Gerontol A Biol Sci Med Sci 51:M123-130.
Fletcher DD, Andrews KL, Hallett JW, Jr., Butters MA, Rowland CM, Jacobsen SJ. 2002. Trends in rehabilitation after amputation for geriatric patients with vascular disease: implications for future health resource allocation. Arch Phys Med Rehabil 83:1389-1393.
Fletcher R, Fletcher, SW. 2005. Clinical Epidemiology the Essentials, 4th ed: Lippincott Williams & Wilkins.
Folstein MF, Folstein SE, McHugh PR. 1975. "Mini-mental state". A practical method for grading the cognitive state of patients for the clinician. J Psychiatr Res 12:189-198.
Fontaine R, Kim M, Kieny R. 1954. [Surgical treatment of peripheral circulation disorders.]. Helv Chir Acta 21:499-533.
Frieden RA. 2005. The geriatric amputee. Phys Med Rehabil Clin N Am 16:179-195. Gailey RS, Roach KE, Applegate EB, Cho B, Cunniffe B, Licht S, Maguire M, Nash MS. 2002.
The amputee mobility predictor: an instrument to assess determinants of the lower-limb amputee's ability to ambulate. Arch Phys Med Rehabil 83:613-627.
Gallagher P, Desmond D. 2007. Measuring quality of life in prosthetic practice: benefits and challenges. Prosthet Orthot Int 31:167-176.
Gallagher P, Maclachlan M. 2004. The Trinity Amputation and Prosthesis Experience Scales and quality of life in people with lower-limb amputation. Arch Phys Med Rehabil 85:730-736.
Gardner AW, Poehlman ET. 1995. Exercise rehabilitation programs for the treatment of claudication pain. A meta-analysis. Jama 274:975-980.
Garratt A, Schmidt L, Mackintosh A, Fitzpatrick R. 2002. Quality of life measurement: bibliographic study of patient assessed health outcome measures. Bmj 324:1417.
Gauthier-Gagnon C, Grise MC. 1994. Prosthetic profile of the amputee questionnaire: validity and reliability. Arch Phys Med Rehabil 75:1309-1314.
Geertzen JH, Bosmans JC, van der Schans CP, Dijkstra PU. 2005. Claimed walking distance of lower limb amputees. Disabil Rehabil 27:101-104.
Gillis A, MacDonald B. 2005. Deconditioning in the hospitalized elderly. Can Nurse 101:16-20. Gooberman-Hill R, Ebrahim S. 2006. Informal care at times of change in health and mobility: a
qualitative study. Age Ageing 35:261-266. Grise MC, Gauthier-Gagnon C, Martineau GG. 1993. Prosthetic profile of people with lower
extremity amputation: conception and design of a follow-up questionnaire. Arch Phys Med Rehabil 74:862-870.
Hanley MA, Jensen MP, Ehde DM, Hoffman AJ, Patterson DR, Robinson LR. 2004. Psychosocial predictors of long-term adjustment to lower-limb amputation and phantom limb pain. Disabil Rehabil 26:882-893.
Harris T, Kovar MG, Suzman R, Kleinman JC, Feldman JJ. 1989. Longitudinal study of physical ability in the oldest-old. Am J Public Health 79:698-702.
Hays RD, Sherbourne CD, Mazel RM. 1993. The RAND 36-Item Health Survey 1.0. Health Econ 2:217-227.
Hiatt WR. 2001. Medical treatment of peripheral arterial disease and claudication. N Engl J Med 344:1608-1621.
Hiatt WR, Hoag S, Hamman RF. 1995. Effect of diagnostic criteria on the prevalence of peripheral arterial disease. The San Luis Valley Diabetes Study. Circulation 91:1472-1479.
Hirsch AT, Criqui MH, Treat-Jacobson D, Regensteiner JG, Creager MA, Olin JW, Krook SH, Hunninghake DB, Comerota AJ, Walsh ME, McDermott MM, Hiatt WR. 2001.
References
89
Peripheral arterial disease detection, awareness, and treatment in primary care. Jama 286:1317-1324.
Hirsch AT, Murphy TP, Lovell MB, Twillman G, Treat-Jacobson D, Harwood EM, Mohler ER, 3rd, Creager MA, Hobson RW, 2nd, Robertson RM, Howard WJ, Schroeder P, Criqui MH. 2007. Gaps in public knowledge of peripheral arterial disease: the first national PAD public awareness survey. Circulation 116:2086-2094.
Hirsch AT, Treat-Jacobson D, Lando HA, Hatsukami DK. 1997. The role of tobacco cessation, antiplatelet and lipid-lowering therapies in the treatment of peripheral arterial disease. Vasc Med 2:243-251.
Hirvensalo M, Sakari-Rantala R, Kallinen M, Leinonen R, Lintunen T, Rantanen T. 2007. Underlying factors in the association between depressed mood and mobility limitation in older people. Gerontology 53:173-178.
Hoenig HM, Rubenstein LZ. 1991. Hospital-associated deconditioning and dysfunction. J Am Geriatr Soc 39:220-222.
Holland-Letz T, Endres HG, Biedermann S, Mahn M, Kunert J, Groh S, Pittrow D, von Bilderling P, Sternitzky R, Diehm C. 2007. Reproducibility and reliability of the ankle-brachial index as assessed by vascular experts, family physicians and nurses. Vasc Med 12:105-112.
Holtzman J, Caldwell M, Walvatne C, Kane R. 1999. Long-term functional status and quality of life after lower extremity revascularization. J Vasc Surg 29:395-402.
Hooi JD, Kester AD, Stoffers HE, Rinkens PE, Knottnerus JA, van Ree JW. 2004. Asymptomatic peripheral arterial occlusive disease predicted cardiovascular morbidity and mortality in a 7-year follow-up study. J Clin Epidemiol 57:294-300.
Horgan O, MacLachlan M. 2004. Psychosocial adjustment to lower-limb amputation: a review. Disabil Rehabil 26:837-850.
Houghton AD, Taylor PR, Thurlow S, Rootes E, McColl I. 1992. Success rates for rehabilitation of vascular amputees: implications for preoperative assessment and amputation level. Br J Surg 79:753-755.
Housley E. 1988. Treating claudication in five words. Br Med J (Clin Res Ed) 296:1483-1484. Inderbitzi R, Buttiker M, Pfluger D, Nachbur B. 1992. The fate of bilateral lower limb amputees
in end-stage vascular disease. Eur J Vasc Surg 6:321-326. Izumi Y, Satterfield K, Lee S, Harkless LB. 2006. Risk of reamputation in diabetic patients
stratified by limb and level of amputation: a 10-year observation. Diabetes Care 29:566-570.
Kalbaugh CA, Taylor SM, Cull DL, Blackhurst DW, Gray BH, Langan EM, 3rd, Dellinger MB, McClary GE, Jr., Jackson MR, Carsten CG, 3rd, Snyder BA, York JW, Youkey JR. 2004. Invasive treatment of chronic limb ischemia according to the Lower Extremity Grading System (LEGS) score: a 6-month report. J Vasc Surg 39:1268-1276.
Kempen GI, Sullivan M, van Sonderen E, Ormel J. 1999a. Performance-based and self-reported physical functioning in low-functioning older persons: congruence of change and the impact of depressive symptoms. J Gerontol B Psychol Sci Soc Sci 54:P380-386.
Kempen GI, van Sonderen E, Ormel J. 1999b. The impact of psychological attributes on changes in disability among low-functioning older persons. J Gerontol B Psychol Sci Soc Sci 54:P23-29.
Kennedy M, Solomon C, Manolio TA, Criqui MH, Newman AB, Polak JF, Burke GL, Enright P, Cushman M. 2005. Risk factors for declining ankle-brachial index in men and women 65 years or older: the Cardiovascular Health Study. Arch Intern Med 165:1896-1902.
Khaled SM, Bulloch A, Exner DV, Patten SB. 2009. Cigarette smoking, stages of change, and major depression in the Canadian population. Can J Psychiatry 54:204-208.
References
90
Koivumaa-Honkanen H. 1998. Life Satisfaction as a Health Predictor. Doctoral dissertation. In: Medical Sciences 143. . Kuopio: Kuopio University. p 129
Koivumaa-Honkanen H, Honkanen R, Viinamäki H, Heikkilä K, Kaprio J, Koskenvuo M. 2000. Self-reported life satisfaction and 20-year mortality in healthy Finnish adults. Am J Epidemiol 152:983-991.
Koivunen K, Lukkarinen H. 2006. Lower limb atherosclerotic disease causes various deteriorations of patients' health-related quality of life. J Vasc Nurs 24:102-115.
Koivunen K, Lukkarinen H. 2008. One-year prospective health-related quality-of-life outcomes in patients treated with conservative method, endovascular treatment or open surgery for symptomatic lower limb atherosclerotic disease. Eur J Cardiovasc Nurs 7:247-256.
Kronish IM, Rieckmann N, Halm EA, Shimbo D, Vorchheimer D, Haas DC, Davidson KW. 2006. Persistent depression affects adherence to secondary prevention behaviors after acute coronary syndromes. J Gen Intern Med 21:1178-1183.
Kulkarni J, Pande S, Morris J. 2006. Survival rates in dysvascular lower limb amputees. Int J Surg 4:217-221.
Lääperi T, Pohjolainen T, Alaranta H, Kärkkäinen M. 1993. Lower-limb amputations. Ann Chir Gynaecol 82:183-187.
Larsson J, Agardh CD, Apelqvist J, Stenstrom A. 1998. Long-term prognosis after healed amputation in patients with diabetes. Clin Orthop Relat Res:149-158.
Last JM, editor. 2001. A dictionary of epidemiology, 4th ed. Oxford: Oxford University Press. Lavery LA, Van Houtum WH, Armstrong DG. 1997. Institutionalization following diabetes-
related lower extremity amputation. Am J Med 103:383-388. Lavery LA, van Houtum WH, Harkless LB. 1996. In-hospital mortality and disposition of
diabetic amputees in The Netherlands. Diabet Med 13:192-197. Lindstrom B, Eriksson M. 2006. Contextualizing salutogenesis and Antonovsky in public health
development. Health Promot Int 21:238-244. Loponen P, Luther M, Wistbacka JO, Korpilahti K, Laurikka J, Sintonen H, Huhtala H, Tarkka
MR. 2007. Quality of life during 18 months after coronary artery bypass grafting. Eur J Cardiothorac Surg 32:77-82.
Loughlin A. 2004. Depression and social support: effective treatments for homebound elderly adults. J Gerontol Nurs 30:11-15.
Lumsden AB, Davies MG, Peden EK. 2009. Medical and endovascular management of critical limb ischemia. J Endovasc Ther 16:II31-62.
Luther M. 1994. The influence of arterial reconstructive surgery on the outcome of critical leg ischaemia. Eur J Vasc Surg 8:682-689.
Luther M, Kantonen I, Lepäntalo M, Salenius J. 2000. Arterial intervention and reduction in amputation for chronic critical leg ischaemia. Br J Surg 87:454-458.
Lyness JM, Noel TK, Cox C, King DA, Conwell Y, Caine ED. 1997. Screening for depression in elderly primary care patients. A comparison of the Center for Epidemiologic Studies-Depression Scale and the Geriatric Depression Scale. Arch Intern Med 157:449-454.
Mahoney JE, Eisner J, Havighurst T, Gray S, Palta M. 2000. Problems of older adults living alone after hospitalization. J Gen Intern Med 15:611-619.
Malmstedt J, Leander K, Wahlberg E, Karlstrom L, Alfredsson L, Swedenborg J. 2008. Outcome after leg bypass surgery for critical limb ischemia is poor in patients with diabetes: a population-based cohort study. Diabetes Care 31:887-892.
Malmstedt J, Wahlberg E, Jorneskog G, Swedenborg J. 2006. Influence of perioperative blood glucose levels on outcome after infrainguinal bypass surgery in patients with diabetes. Br J Surg 93:1360-1367.
References
91
Marston WA, Davies SW, Armstrong B, Farber MA, Mendes RC, Fulton JJ, Keagy BA. 2006. Natural history of limbs with arterial insufficiency and chronic ulceration treated without revascularization. J Vasc Surg 44:108-114.
Matsen SL, Malchow D, Matsen FA, 3rd. 2000. Correlations with patients' perspectives of the result of lower-extremity amputation. J Bone Joint Surg Am 82-A:1089-1095.
Matsuura JH, Sobel M, Wong J, Dattilo JB, Poletti LF, Makhoul RG, Posner MP, Lee HM. 1997. The limits of generalized cardiac screening tests for predicting cardiac complications after infrainguinal arterial reconstruction. Ann Vasc Surg 11:620-625.
Mattes E, Norman PE, Jamrozik K. 1997. Falling incidence of amputations for peripheral occlusive arterial disease in Western Australia between 1980 and 1992. Eur J Vasc Endovasc Surg 13:14-22.
Mätzke S, Ollgren J, Lepäntalo M. 1996. Predictive value of distal pressure measurements in critical leg ischaemia. Ann Chir Gynaecol 85:316-321.
Mayfield JA, Reiber GE, Maynard C, Czerniecki JM, Caps MT, Sangeorzan BJ. 2001. Survival following lower-limb amputation in a veteran population. J Rehabil Res Dev 38:341-345.
Mayfield JA, Reiber GE, Sanders LJ, Janisse D, Pogach LM. 1998. Preventive foot care in people with diabetes. Diabetes Care 21:2161-2177.
McCaslin JE, Hafez HM, Stansby G. 2007. Lower-limb revascularization and major amputation rates in England. Br J Surg 94:835-839.
McDermott MM, Greenland P, Guralnik JM, Liu K, Criqui MH, Pearce WH, Chan C, Schneider J, Sharma L, Taylor LM, Arseven A, Quann M, Celic L. 2003. Depressive symptoms and lower extremity functioning in men and women with peripheral arterial disease. J Gen Intern Med 18:461-467.
McDermott MM, Greenland P, Liu K, Guralnik JM, Criqui MH, Dolan NC, Chan C, Celic L, Pearce WH, Schneider JR, Sharma L, Clark E, Gibson D, Martin GJ. 2001a. Leg symptoms in peripheral arterial disease: associated clinical characteristics and functional impairment. Jama 286:1599-1606.
McDermott MM, Liu K, Greenland P, Guralnik JM, Criqui MH, Chan C, Pearce WH, Schneider JR, Ferrucci L, Celic L, Taylor LM, Vonesh E, Martin GJ, Clark E. 2004. Functional decline in peripheral arterial disease: associations with the ankle brachial index and leg symptoms. Jama 292:453-461.
McDermott MM, Liu K, Guralnik JM, Martin GJ, Criqui MH, Greenland P. 1998. Measurement of walking endurance and walking velocity with questionnaire: validation of the walking impairment questionnaire in men and women with peripheral arterial disease. J Vasc Surg 28:1072-1081.
McDermott MM, Mehta S, Greenland P. 1999. Exertional leg symptoms other than intermittent claudication are common in peripheral arterial disease. Arch Intern Med 159:387-392.
McDermott MM, Ohlmiller SM, Liu K, Guralnik JM, Martin GJ, Pearce WH, Greenland P. 2001b. Gait alterations associated with walking impairment in people with peripheral arterial disease with and without intermittent claudication. J Am Geriatr Soc 49:747-754.
McDermott MM, Tian L, Liu K, Guralnik JM, Ferrucci L, Tan J, Pearce WH, Schneider JR, Criqui MH. 2008. Prognostic value of functional performance for mortality in patients with peripheral artery disease. J Am Coll Cardiol 51:1482-1489.
Melillo E, Nuti M, Bongiorni L, Golgini E, Balbarini A. 2004. [Major and minor amputation rates and lower critical limb ischemia: the epidemiological data of western Tuscany]. Ital Heart J Suppl 5:794-805.
Montgomery PS, Gardner AW. 1998. The clinical utility of a six-minute walk test in peripheral arterial occlusive disease patients. J Am Geriatr Soc 46:706-711.
Morano CD, Cisler RA, Lemerond J. 1993. Risk factors for adolescent suicidal behavior: loss, insufficient familial support, and hopelessness. Adolescence 28:851-865.
References
92
Munin MC, Espejo-De Guzman MC, Boninger ML, Fitzgerald SG, Penrod LE, Singh J. 2001. Predictive factors for successful early prosthetic ambulation among lower-limb amputees. J Rehabil Res Dev 38:379-384.
Määttänen M, Lepäntalo, M, Hurri, H, Soininen, J, Pohjolainen, T. 2006. Alaraaja-amputaatiopotilaiden kuntoutuksen kehittämishanke Helsingissä. Suomen Ortopedia ja Traumatologia 29:281-286.
Narang IC, Mathur BP, Singh P, Jape VS. 1984. Functional capabilities of lower limb amputees. Prosthet Orthot Int 8:43-51.
Nehler MR, Coll JR, Hiatt WR, Regensteiner JG, Schnickel GT, Klenke WA, Strecker PK, Anderson MW, Jones DN, Whitehill TA, Moskowitz S, Krupski WC. 2003a. Functional outcome in a contemporary series of major lower extremity amputations. J Vasc Surg 38:7-14.
Nehler MR, McDermott MM, Treat-Jacobson D, Chetter I, Regensteiner JG. 2003b. Functional outcomes and quality of life in peripheral arterial disease: current status. Vasc Med 8:115-126.
Nehler MR, Peyton BD. 2004. Is revascularization and limb salvage always the treatment for critical limb ischemia? J Cardiovasc Surg (Torino) 45:177-184.
Newman AB, Sutton-Tyrrell K, Vogt MT, Kuller LH. 1993. Morbidity and mortality in hypertensive adults with a low ankle/arm blood pressure index. Jama 270:487-489.
NOMESCO. 2002. Classification of surgical procedures. Nordic Medico-Statistical Committee (NOMESCO)http://www.helsedirektoratet.no/vp/multimedia/archive/00269/Ncsp_1_14_269099a.pdf
Norgren L, Hiatt WR, Dormandy J, Nehler MR, Harris KA, Fowkes FG, Bell K, Caporusso J, Durand-Zaleski I, Komori K, Lammer J, Liapis C, Novo S, Razavi M, Robbs J, Schaper N, Shigematsu H, Sapoval M, White C, White J, Clement D, Creager M, Jaff M, Mohler E, 3rd, Rutherford RB, Sheehan P, Sillesen H, Rosenfield K. 2007. Inter-Society Consensus for the Management of Peripheral Arterial Disease (TASC II). Eur J Vasc Endovasc Surg 33 Suppl 1:S1-75.
Norman PE, Eikelboom JW, Hankey GJ. 2004. Peripheral arterial disease: prognostic significance and prevention of atherothrombotic complications. Med J Aust 181:150-154.
Novo S, Coppola G, Milio G. 2004. Critical limb ischemia: definition and natural history. Curr Drug Targets Cardiovasc Haematol Disord 4:219-225.
Nowygrod R, Egorova N, Greco G, Anderson P, Gelijns A, Moskowitz A, McKinsey J, Morrissey N, Kent KC. 2006. Trends, complications, and mortality in peripheral vascular surgery. J Vasc Surg 43:205-216.
O'Connell JB, Quinones-Baldrich WJ. 2009. Proper evaluation and management of acute embolic versus thrombotic limb ischemia. Semin Vasc Surg 22:10-16.
O'Hara R, Mumenthaler MS, Davies H, Cassidy EL, Buffum M, Namburi S, Shakoori R, Danielsen CE, Tsui P, Noda A, Kraemer HC, Sheikh JI. 2002. Cognitive status and behavioral problems in older hospitalized patients. Ann Gen Hosp Psychiatry 1:1.
O'Neill RT. 1997. Secondary endpoints cannot be validly analyzed if the primary endpoint does not demonstrate clear statistical significance. Control Clin Trials 18:550-556; discussion 561-557.
Oakley C, Zwierska I, Tew G, Beard JD, Saxton JM. 2008. Nordic poles immediately improve walking distance in patients with intermittent claudication. Eur J Vasc Endovasc Surg 36:689-694; discussion 695-686.
Ouriel K. 2001. Peripheral arterial disease. Lancet 358:1257-1264. Peeters P, Mets T. 1996. The 6-minute walk as an appropriate exercise test in elderly patients
with chronic heart failure. J Gerontol A Biol Sci Med Sci 51:M147-151.
References
93
Pell JP, Donnan PT, Fowkes FG, Ruckley CV. 1993. Quality of life following lower limb amputation for peripheral arterial disease. Eur J Vasc Surg 7:448-451.
Pernot HF, de Witte LP, Lindeman E, Cluitmans J. 1997. Daily functioning of the lower extremity amputee: an overview of the literature. Clin Rehabil 11:93-106.
Pernot HF, Winnubst GM, Cluitmans JJ, De Witte LP. 2000. Amputees in Limburg: incidence, morbidity and mortality, prosthetic supply, care utilisation and functional level after one year. Prosthet Orthot Int 24:90-96.
Pierce GR, Sarason BR, Sarason IG. 1992. General and specific support expectations and stress as predictors of perceived supportiveness: an experimental study. J Pers Soc Psychol 63:297-307.
Pinzur MS, Littooy F, Daniels J, Arney C, Reddy NK, Graham G, Osterman H. 1992. Multidisciplinary preoperative assessment and late function in dysvascular amputees. Clin Orthop Relat Res:239-243.
Pinzur MS, Pinto MA, Schon LC, Smith DG. 2003. Controversies in amputation surgery. Instr Course Lect 52:445-451.
Ploeg AJ, Lardenoye JW, Vrancken Peeters MP, Breslau PJ. 2005. Contemporary series of morbidity and mortality after lower limb amputation. Eur J Vasc Endovasc Surg 29:633-637.
Podsiadlo D, Richardson S. 1991. The timed "Up & Go": a test of basic functional mobility for frail elderly persons. J Am Geriatr Soc 39:142-148.
Pohjolainen T. 1993. [Lower limb amputation and prosthesis]. Duodecim 109:329-335. Pohjolainen T, Alaranta H. 1991. Predictive factors of functional ability after lower-limb
amputation. Ann Chir Gynaecol 80:36-39. Pohjolainen T, Alaranta H. 1998. Ten-year survival of Finnish lower limb amputees. Prosthet
Orthot Int 22:10-16. Pohjolainen T, Alaranta H. 1999. Epidemiology of lower limb amputees in Southern Finland in
1995 and trends since 1984. Prosthet Orthot Int 23:88-92. Pohjolainen T, Alaranta H, Kärkkäinen M. 1990. Prosthetic use and functional and social
outcome following major lower limb amputation. Prosthet Orthot Int 14:75-79. Pohjolainen T, Alaranta H, Wikstrom J. 1989. Primary survival and prosthetic fitting of lower
limb amputees. Prosthet Orthot Int 13:63-69. Pomposelli FB, Jr., Arora S, Gibbons GW, Frykberg R, Smakowski P, Campbell DR, Freeman
DV, LoGerfo FW. 1998. Lower extremity arterial reconstruction in the very elderly: successful outcome preserves not only the limb but also residential status and ambulatory function. J Vasc Surg 28:215-225.
Pratt AG, Norris ER, Kaufmann M. 2005. Peripheral vascular disease and depression. J Vasc Nurs 23:123-127; quiz 128-129.
Rafnsson SB, Deary IJ, Fowkes FG. 2009. Peripheral arterial disease and cognitive function. Vasc Med 14:51-61.
Regensteiner JG, Hiatt WR, Coll JR, Criqui MH, Treat-Jacobson D, McDermott MM, Hirsch AT. 2008. The impact of peripheral arterial disease on health-related quality of life in the Peripheral Arterial Disease Awareness, Risk, and Treatment: New Resources for Survival (PARTNERS) Program. Vasc Med 13:15-24.
Regensteiner JG, Steiner JF. 1990. Evaluation of walking impairment by questionnaire in patients with peripheral arterial disease. J Vascular Medicine Biology 2:142-152.
Rowe VL, Lee W, Weaver FA, Etzioni D. 2009. Patterns of treatment for peripheral arterial disease in the United States: 1996-2005. J Vasc Surg 49:910-917.
Rutherford RB, Baker JD, Ernst C, Johnston KW, Porter JM, Ahn S, Jones DN. 1997. Recommended standards for reports dealing with lower extremity ischemia: revised version. J Vasc Surg 26:517-538.
References
94
Rybarczyk BD, Nyenhuis DL, Nicholas JJ, Schulz R, Alioto RJ, Blair C. 1992. Social discomfort and depression in a sample of adults with leg amputations. Arch Phys Med Rehabil 73:1169-1173.
Sandnes DK, Sobel M, Flum DR. 2004. Survival after lower-extremity amputation. J Am Coll Surg 199:394-402.
Sarason I, Sarason, B.R., Shearin, E.N, Pierce, G.R. 1987. A brief measure of social support: Practical and theoretical implications. J. Soc. Pers. Relat. 4:497–510.
Schanzer A, Goodney PP, Li Y, Eslami M, Cronenwett J, Messina L, Conte MS. 2009. Validation of the PIII CLI risk score for the prediction of amputation-free survival in patients undergoing infrainguinal autogenous vein bypass for critical limb ischemia. J Vasc Surg 50:769-775; discussion 775.
Schanzer A, Mega J, Meadows J, Samson RH, Bandyk DF, Conte MS. 2008. Risk stratification in critical limb ischemia: derivation and validation of a model to predict amputation-free survival using multicenter surgical outcomes data. J Vasc Surg 48:1464-1471.
Schoppen T, Boonstra A, Groothoff JW, de Vries J, Goeken LN, Eisma WH. 1999. The Timed "up and go" test: reliability and validity in persons with unilateral lower limb amputation. Arch Phys Med Rehabil 80:825-828.
Schoppen T, Boonstra A, Groothoff JW, de Vries J, Goeken LN, Eisma WH. 2003. Physical, mental, and social predictors of functional outcome in unilateral lower-limb amputees. Arch Phys Med Rehabil 84:803-811.
Schouten O, Sillesen H, Poldermans D. 2010. New guidelines from the European Society of Cardiology for perioperative cardiac care: a summary of implications for elective vascular surgery patients. Eur J Vasc Endovasc Surg 39:1-4.
Siitonen OI, Niskanen LK, Laakso M, Siitonen JT, Pyörälä K. 1993. Lower-extremity amputations in diabetic and nondiabetic patients. A population-based study in eastern Finland. Diabetes Care 16:16-20.
Sintonen H. 2001. The 15D instrument of health-related quality of life: properties and applications. Ann Med 33:328-336.
Smolderen KG, Aquarius AE, de Vries J, Smith OR, Hamming JF, Denollet J. 2008. Depressive symptoms in peripheral arterial disease: a follow-up study on prevalence, stability, and risk factors. J Affect Disord 110:27-35.
Steinbach U. 1992. Social networks, institutionalization, and mortality among elderly people in the United States. J Gerontol 47:S183-190.
Steinberg FU, Sunwoo I, Roettger RF. 1985. Prosthetic rehabilitation of geriatric amputee patients: a follow-up study. Arch Phys Med Rehabil 66:742-745.
Stone PA, Flaherty SK, Aburahma AF, Hass SM, Jackson JM, Hayes JD, Hofeldt MJ, Hager CS, Elmore MS. 2006. Factors affecting perioperative mortality and wound-related complications following major lower extremity amputations. Ann Vasc Surg 20:209-216.
Subramaniam B, Pomposelli F, Talmor D, Park KW. 2005. Perioperative and long-term morbidity and mortality after above-knee and below-knee amputations in diabetics and nondiabetics. Anesth Analg 100:1241-1247, table of contents.
Sundararajan V, Henderson T, Perry C, Muggivan A, Quan H, Ghali WA. 2004. New ICD-10 version of the Charlson comorbidity index predicted in-hospital mortality. J Clin Epidemiol 57:1288-1294.
Suominen V, Uurto I, Saarinen J, Venermo M, Salenius J. 2010. PAD as a Risk Factor for Mortality Among Patients with Elevated ABI - A Clinical Study. Eur J Vasc Endovasc Surg 39:316-322.
Taylor SM, Cull DL, Kalbaugh CA, Cass AL, Harmon SA, Langan EM, 3rd, Youkey JR. 2007a. Critical analysis of clinical success after surgical bypass for lower-extremity ischemic
References
95
tissue loss using a standardized definition combining multiple parameters: a new paradigm of outcomes assessment. J Am Coll Surg 204:831-838; discussion 838-839.
Taylor SM, Kalbaugh CA, Blackhurst DW, Cass AL, Trent EA, Langan EM, 3rd, Youkey JR. 2006. Determinants of functional outcome after revascularization for critical limb ischemia: an analysis of 1000 consecutive vascular interventions. J Vasc Surg 44:747-755; discussion 755-746.
Taylor SM, Kalbaugh CA, Blackhurst DW, Hamontree SE, Cull DL, Messich HS, Robertson RT, Langan EM, 3rd, York JW, Carsten CG, 3rd, Snyder BA, Jackson MR, Youkey JR. 2005a. Preoperative clinical factors predict postoperative functional outcomes after major lower limb amputation: an analysis of 553 consecutive patients. J Vasc Surg 42:227-235.
Taylor SM, Kalbaugh CA, Blackhurst DW, Kellicut DC, Langan EM, 3rd, Youkey JR. 2007b. A comparison of percutaneous transluminal angioplasty versus amputation for critical limb ischemia in patients unsuitable for open surgery. J Vasc Surg 45:304-310; discussion 310-301.
Taylor SM, Kalbaugh CA, Blackhurst DW, Langan EM, 3rd, Cull DL, Snyder BA, Carsten CG, 3rd, Jackson MR, York JW, Youkey JR. 2005b. Postoperative outcomes according to preoperative medical and functional status after infrainguinal revascularization for critical limb ischemia in patients 80 years and older. Am Surg 71:640-645; discussion 645-646.
Thomas AJ, Kalaria RN, O'Brien JT. 2004. Depression and vascular disease: what is the relationship? J Affect Disord 79:81-95.
Thomas SR, Perkins JM, Magee TR, Galland RB. 2001. Transmetatarsal amputation: an 8-year experience. Ann R Coll Surg Engl 83:164-166.
Tilvis RS, Kähonen-Vare MH, Jolkkonen J, Valvanne J, Pitkälä KH, Strandberg TE. 2004. Predictors of cognitive decline and mortality of aged people over a 10-year period. J Gerontol A Biol Sci Med Sci 59:268-274.
Tombaugh TN, McIntyre NJ. 1992. The mini-mental state examination: a comprehensive review. J Am Geriatr Soc 40:922-935.
Turney BW, Kent SJ, Walker RT, Loftus IM. 2001. Amputations: no longer the end of the road. J R Coll Surg Edinb 46:271-273.
Unden AL, Orth-Gomer K. 1989. Development of a social support instrument for use in population surveys. Soc Sci Med 29:1387-1392.
Väänänen A, Kouvonen A, Kivimäki M, Pentti J, Vahtera J. 2008. Social support, network heterogeneity, and smoking behavior in women: the 10-town study. Am J Health Promot 22:246-255.
Väänänen A, Vahtera J, Pentti J, Kivimäki M. 2005. Sources of social support as determinants of psychiatric morbidity after severe life events: prospective cohort study of female employees. J Psychosom Res 58:459-467.
Vaccarino V, Kasl SV, Abramson J, Krumholz HM. 2001. Depressive symptoms and risk of functional decline and death in patients with heart failure. J Am Coll Cardiol 38:199-205.
Vahtera J, Poikolainen K, Kivimäki M, Ala-Mursula L, Pentti J. 2002. Alcohol intake and sickness absence: a curvilinear relation. Am J Epidemiol 156:969-976.
Ware JE, Jr., Sherbourne CD. 1992. The MOS 36-item short-form health survey (SF-36). I. Conceptual framework and item selection. Med Care 30:473-483.
Watson L, Ellis B, Leng GC. 2008. Exercise for intermittent claudication. Cochrane Database Syst Rev:CD000990.
Wattanakit K, Folsom AR, Selvin E, Weatherley BD, Pankow JS, Brancati FL, Hirsch AT. 2005. Risk factors for peripheral arterial disease incidence in persons with diabetes: the Atherosclerosis Risk in Communities (ARIC) Study. Atherosclerosis 180:389-397.
Winell K, Niemi M, Lepäntalo M. 2006. The national hospital discharge register data on lower limb amputations. Eur J Vasc Endovasc Surg 32:66-70.
References
96
Wong MW. 2006. Predictors for mortality after lower-extremity amputations in geriatric patients. Am J Surg 191:443-447.
Yao ST, Hobbs JT, Irvine WT. 1969. Ankle systolic pressure measurements in arterial disease affecting the lower extremities. Br J Surg 56:676-679.
Yesavage JA, Brink TL, Rose TL, Lum O, Huang V, Adey M, Leirer VO. 1982. Development and validation of a geriatric depression screening scale: a preliminary report. J Psychiatr Res 17:37-49.
Zeller T, Sixt S, Rastan A. 2009. New techniques for endovascular treatment of peripheral artery disease with focus on chronic critical limb ischemia. Vasa 38:3-12.
Ziegler-Graham K, MacKenzie EJ, Ephraim PL, Travison TG, Brookmeyer R. 2008. Estimating the prevalence of limb loss in the United States: 2005 to 2050. Arch Phys Med Rehabil 89:422-429.
Zimet GD, Powell SS, Farley GK, Werkman S, Berkoff KA. 1990. Psychometric characteristics of the Multidimensional Scale of Perceived Social Support. J Pers Assess 55:610-617.
Zung WW. 1967. Factors influencing the self-rating depression scale. Arch Gen Psychiatry 16:543-547.

Appendices
97
Appendices
97
Appendices
97
APPENDICES
1
Appendix 1 PATIENT’S QUALITY OF LIFE A lower leg peripheral arterial disease patient on target Person to contact Leena Remes Specialist in Physiatry The date of filling in the questionnaire: Name: Address: Phone number: Age: Male: Female Marital status: Married Cohabiting Widowed Divorced How many people live in the same household with you? Your former profession/ occupation Your height …… cm Your weight ………..kg List all your diseases you have here……………. List all your daily medications you presently have ………………… Questions dealing with your health related quality of life Instruction: Please, first read each items all response possibilities carefully. Then mark a cross (x) at the choice that describes your present health the most. Do so in all items 1 through 19, and items 26-29 in this manner. From each item pick only one alternative.
1
Appendix 1 PATIENT’S QUALITY OF LIFE A lower leg peripheral arterial disease patient on target Person to contact Leena Remes Specialist in Physiatry The date of filling in the questionnaire: Name: Address: Phone number: Age: Male: Female Marital status: Married Cohabiting Widowed Divorced How many people live in the same household with you? Your former profession/ occupation Your height …… cm Your weight ………..kg List all your diseases you have here……………. List all your daily medications you presently have …………………
Please, first read each items all response possibilities carefully. Then mark a cross (x) at the choice that describes your present health the most. Do so in all items 1 through 19, and items 26-29 in this manner. From each item pick only one alternative.
Here are questions dealing with your health related quality of life.
1
Appendix 1 PATIENT’S QUALITY OF LIFE A lower leg peripheral arterial disease patient on target Person to contact Leena Remes Specialist in Physiatry The date of filling in the questionnaire: Name: Address: Phone number: Age: Male: Female Marital status: Married Cohabiting Widowed Divorced How many people live in the same household with you? Your former profession/ occupation Your height …… cm Your weight ………..kg List all your diseases you have here……………. List all your daily medications you presently have ………………… Questions dealing with your health related quality of life Instruction: Please, first read each items all response possibilities carefully. Then mark a cross (x) at the choice that describes your present health the most. Do so in all items 1 through 19, and items 26-29 in this manner. From each item pick only one alternative.

Appendices
98
2
1) QUALITY OF LIFE QUESTIONNAIRE (15D©) QUESTION 1. MOBILITY 1 ( ) I am able to walk normally (without difficulty) indoors, outdoors and on stairs. 2 ( ) I am able to walk without difficulty indoors, but outdoors and/or on stairs I have slight difficulties. 3 ( ) I am able to walk without help indoors (with or without an appliance), but outdoors and/or on stairs only with considerable difficulty or with help from others. 4 ( ) I am able to walk indoors only with help from others. 5 ( ) I am completely bed-ridden and unable to move about.
QUESTION 2. VISION 1 ( ) I see normally, i.e. I can read newspapers and TV text without difficulty (with or without glasses). 2 ( ) I can read papers and/or TV text with slight difficulty (with or without glasses). 3 ( ) I can read papers and/or TV text with considerable difficulty (with or without glasses). 4 ( ) I cannot read papers or TV text either with glasses or without, but I can see enough to walk about without guidance. 5 ( ) I cannot see enough to walk about without a guide, i.e. I am almost or completely blind.
QUESTION 3. HEARING 1 ( ) I can hear normally, i.e. normal speech (with or without a hearing aid). 2 ( ) I hear normal speech with a little difficulty. 3 ( ) I hear normal speech with considerable difficulty; in conversation I need voices to be louder than normal. 4 ( ) I hear even loud voices poorly; I am almost deaf. 5 ( ) I am completely deaf.
QUESTION 4. BREATHING 1 ( ) I am able to breathe normally, i.e. with no shortness of breath or other breathing difficulty. 2 ( ) I have shortness of breath during heavy work or sports, or when walking briskly on flat ground or slightly uphill. 3 ( ) I have shortness of breath when walking on flat ground at the same speed as others my age. 4 ( ) I get shortness of breath even after light activity, e.g. washing or dressing myself. 5 ( ) I have breathing difficulties almost all the time, even when resting.
QUESTION 5. SLEEPING 1 ( ) I am able to sleep normally, i.e. I have no problems sleeping. 2 ( ) I have slight problems sleeping, e.g. difficulty in falling asleep, or sometimes waking at night. 3 ( ) I have moderate problems sleeping, e.g. disturbed sleep, or feeling I have not slept enough. 4 ( ) I have great problems sleeping, e.g. having to use sleeping pills often or routinely, or usually waking at night and/or too early in the morning. 5 ( ) I suffer severe sleeplessness, e.g. sleep is almost impossible even with full use of sleeping pills, or
staying awake most of the night.
QUESTION 6. EATING 1 ( ) I am able to eat normally, i.e. with no help from others. 2 ( ) I am able to eat by myself with minor difficulty (e.g. slowly, clumsily, shakily, or with special appliances). 3 ( ) I need some help from another person with eating. 4 ( ) I am unable to eat by myself at all, so I must be fed by another person. 5 ( ) I am unable to eat at all, so I am fed either by tube or intravenously.

Appendices
99
2
1) QUALITY OF LIFE QUESTIONNAIRE (15D©) QUESTION 1. MOBILITY 1 ( ) I am able to walk normally (without difficulty) indoors, outdoors and on stairs. 2 ( ) I am able to walk without difficulty indoors, but outdoors and/or on stairs I have slight difficulties. 3 ( ) I am able to walk without help indoors (with or without an appliance), but outdoors and/or on stairs only with considerable difficulty or with help from others. 4 ( ) I am able to walk indoors only with help from others. 5 ( ) I am completely bed-ridden and unable to move about.
QUESTION 2. VISION 1 ( ) I see normally, i.e. I can read newspapers and TV text without difficulty (with or without glasses). 2 ( ) I can read papers and/or TV text with slight difficulty (with or without glasses). 3 ( ) I can read papers and/or TV text with considerable difficulty (with or without glasses). 4 ( ) I cannot read papers or TV text either with glasses or without, but I can see enough to walk about without guidance. 5 ( ) I cannot see enough to walk about without a guide, i.e. I am almost or completely blind.
QUESTION 3. HEARING 1 ( ) I can hear normally, i.e. normal speech (with or without a hearing aid). 2 ( ) I hear normal speech with a little difficulty. 3 ( ) I hear normal speech with considerable difficulty; in conversation I need voices to be louder than normal. 4 ( ) I hear even loud voices poorly; I am almost deaf. 5 ( ) I am completely deaf.
QUESTION 4. BREATHING 1 ( ) I am able to breathe normally, i.e. with no shortness of breath or other breathing difficulty. 2 ( ) I have shortness of breath during heavy work or sports, or when walking briskly on flat ground or slightly uphill. 3 ( ) I have shortness of breath when walking on flat ground at the same speed as others my age. 4 ( ) I get shortness of breath even after light activity, e.g. washing or dressing myself. 5 ( ) I have breathing difficulties almost all the time, even when resting.
QUESTION 5. SLEEPING 1 ( ) I am able to sleep normally, i.e. I have no problems sleeping. 2 ( ) I have slight problems sleeping, e.g. difficulty in falling asleep, or sometimes waking at night. 3 ( ) I have moderate problems sleeping, e.g. disturbed sleep, or feeling I have not slept enough. 4 ( ) I have great problems sleeping, e.g. having to use sleeping pills often or routinely, or usually waking at night and/or too early in the morning. 5 ( ) I suffer severe sleeplessness, e.g. sleep is almost impossible even with full use of sleeping pills, or
staying awake most of the night.
QUESTION 6. EATING 1 ( ) I am able to eat normally, i.e. with no help from others. 2 ( ) I am able to eat by myself with minor difficulty (e.g. slowly, clumsily, shakily, or with special appliances). 3 ( ) I need some help from another person with eating. 4 ( ) I am unable to eat by myself at all, so I must be fed by another person. 5 ( ) I am unable to eat at all, so I am fed either by tube or intravenously.
3
QUESTION 7. SPEECH 1 ( ) I am able to speak normally, i.e. clearly, audibly and fluently. 2 ( ) I have slight speech difficulties, e.g. occasional fumbling for words, mumbling, or changes of pitch. 3 ( ) I can make myself understood, but my speech is e.g. disjointed, faltering, stuttering or stammering. 4 ( ) Most people have great difficulty understanding my speech. 5 ( ) I can only make myself understood by gestures.
QUESTION 8. ELIMINATION 1 ( ) My bladder and bowel work normally and without problems. 2 ( ) I have slight problems with my bladder and/or bowel function, e.g. difficulties with urination, or loose or hard bowels. 3 ( ) I have marked problems with my bladder and/or bowel function, e.g. occasional 'accidents', or severe constipation or diarrhea. 4 ( ) I have serious problems with my bladder and/or bowel function, e.g. routine 'accidents', or need of catheterization or enemas. 5 ( ) I have no control over my bladder and/or bowel function.
QUESTION 9. USUAL ACTIVITIES 1 ( ) I am able to perform my usual activities (e.g. employment, studying, housework, free-time activities)
without difficulty. 2 ( ) I am able to perform my usual activities slightly less effectively or with minor difficulty. 3 ( ) I am able to perform my usual activities much less effectively, with considerable difficulty, or not completely. 4 ( ) I can only manage a small proportion of my previously usual activities. 5 ( ) I am unable to manage any of my previously usual activities.
QUESTION 10. MENTAL FUNCTION 1 ( ) I am able to think clearly and logically, and my memory functions well 2 ( ) I have slight difficulties in thinking clearly and logically, or my memory sometimes fails me. 3 ( ) I have marked difficulties in thinking clearly and logically, or my memory is somewhat impaired. 4 ( ) I have great difficulties in thinking clearly and logically, or my memory is seriously impaired. 5 ( ) I am permanently confused and disoriented in place and time.
QUESTION 11. DISCOMFORT AND SYMPTOMS 1 ( ) I have no physical discomfort or symptoms, e.g. pain, ache, nausea, itching etc. 2 ( ) I have mild physical discomfort or symptoms, e.g. pain, ache, nausea, itching etc. 3 ( ) I have marked physical discomfort or symptoms, e.g. pain, ache, nausea, itching etc. 4 ( ) I have severe physical discomfort or symptoms, e.g. pain, ache, nausea, itching etc. 5 ( ) I have unbearable physical discomfort or symptoms, e.g. pain, ache, nausea, itching etc.
QUESTION 12. DEPRESSION 1 ( ) I do not feel at all sad, melancholic or depressed. 2 ( ) I feel slightly sad, melancholic or depressed. 3 ( ) I feel moderately sad, melancholic or depressed. 4 ( ) I feel very sad, melancholic or depressed. 5 ( ) I feel extremely sad, melancholic or depressed.
QUESTION 13. DISTRESS 1 ( ) I do not feel at all anxious, stressed or nervous. 2 ( ) I feel slightly anxious, stressed or nervous. 3 ( ) I feel moderately anxious, stressed or nervous. 4 ( ) I feel very anxious, stressed or nervous. 5 ( ) I feel extremely anxious, stressed or nervous.

Appendices
100
4
QUESTION 14. VITALITY 1 ( ) I feel healthy and energetic. 2 ( ) I feel slightly weary, tired or feeble. 3 ( ) I feel moderately weary, tired or feeble. 4 ( ) I feel very weary, tired or feeble, almost exhausted. 5 ( ) I feel extremely weary, tired or feeble, totally exhausted.
QUESTION 15. SEXUAL ACTIVITY 1 ( ) My state of health has no adverse effect on my sexual activity. 2 ( ) My state of health has a slight effect on my sexual activity. 3 ( ) My state of health has a considerable effect on my sexual activity. 4 ( ) My state of health makes sexual activity almost impossible. 5 ( ) My state of health makes sexual activity impossible. 15D©/Harri Sintonen
QUESTION 16. DO YOU FEEL THAT YOUR LIFE AT PRESENT IS 1. very interesting, 2. fairly interesting, 3. fairly boring, 4. very boring?
QUESTION 17. DO YOU FEEL THAT YOUR LIFE AT PRESENT IS 1. very happy, 2. fairly happy, 3. fairly sad, 4. very sad?
QUESTION 18. DO YOU FEEL THAT YOUR LIFE AT PRESENT IS 1 very easy 2 fairly easy 3 fairly hard 4 very hard?
QUESTION 19. DO YOU FEEL THAT AT THE PRESENT MOMENT YOU ARE: 1. very lonely, 2. fairly lonely, 3. not at all lonely?
Weigh up your changes/possibilities to get help from your near ones, when you need help or support. You may mark one or several alternatives for each item if you feel like that.
QUESTION 20. WHO CAN YOU REALLY COUNT ON TO BE DEPENDABLE WHEN YOU NEED HELP?
1. Spouse or a companion 2. Other near relatives 3. A close friend 4. A close work mate 5. A close neighbor 6. Another close person 7. No one

Appendices
101
4
QUESTION 14. VITALITY 1 ( ) I feel healthy and energetic. 2 ( ) I feel slightly weary, tired or feeble. 3 ( ) I feel moderately weary, tired or feeble. 4 ( ) I feel very weary, tired or feeble, almost exhausted. 5 ( ) I feel extremely weary, tired or feeble, totally exhausted.
QUESTION 15. SEXUAL ACTIVITY 1 ( ) My state of health has no adverse effect on my sexual activity. 2 ( ) My state of health has a slight effect on my sexual activity. 3 ( ) My state of health has a considerable effect on my sexual activity. 4 ( ) My state of health makes sexual activity almost impossible. 5 ( ) My state of health makes sexual activity impossible. 15D©/Harri Sintonen
QUESTION 16. DO YOU FEEL THAT YOUR LIFE AT PRESENT IS 1. very interesting, 2. fairly interesting, 3. fairly boring, 4. very boring?
QUESTION 17. DO YOU FEEL THAT YOUR LIFE AT PRESENT IS 1. very happy, 2. fairly happy, 3. fairly sad, 4. very sad?
QUESTION 18. DO YOU FEEL THAT YOUR LIFE AT PRESENT IS 1 very easy 2 fairly easy 3 fairly hard 4 very hard?
QUESTION 19. DO YOU FEEL THAT AT THE PRESENT MOMENT YOU ARE: 1. very lonely, 2. fairly lonely, 3. not at all lonely?
Weigh up your changes/possibilities to get help from your near ones, when you need help or support. You may mark one or several alternatives for each item if you feel like that.
QUESTION 20. WHO CAN YOU REALLY COUNT ON TO BE DEPENDABLE WHEN YOU NEED HELP?
1. Spouse or a companion 2. Other near relatives 3. A close friend 4. A close work mate 5. A close neighbor 6. Another close person 7. No one
5
QUESTION 21. WHO CAN YOU REALLY COUNT ON TO HELP YOU FEEL MORE RELAXED WHEN YOU ARE UNDER PRESSURE OR TENSE?
1. Spouse or a companion 2. Other near relatives 3. A close friend 4. A close work mate 5. A close neighbor 6. Another close person 7. No one
QUESTION 22. WHO ACCEPTS YOU TOTALLY, INCLUDING BOTH YOUR WORST AND YOUR BEST POINTS?
1. Spouse or a companion 2. Other near relatives 3. A close friend 4. A close work mate 5. A close neighbor 6. Another close person 7. No one
QUESTION 23. WHO CAN YOU REALLY COUNT ON TO CARE ABOUT YOU, REGARDLESS OF WHAT IS HAPPENING TO YOU?
1. Spouse or a companion 2. Other near relatives 3. A close friend 4. A close work mate 5. A close neighbor 6. Another close person 7. No one
QUESTION 24. WHO CAN YOU REALLY COUNT ON TO HELP YOU FEEL BETTER WHEN YOU ARE FEELING GENERALLY DOWN-IN-THE-DUMPS?
1. Spouse or a companion 2. Other near relatives 3. A close friend 4. A close work mate 5. A close neighbor 6. Another close person 7. No one
QUESTION 25. WHO CAN YOU COUNT ON TO CONSOLE YOU WHEN YOU ARE VERY UPSET?
1. Spouse or a companion 2. Other near relatives 3. A close friend 4. A close work mate 5. A close neighbor 6. Another close person 7. No one

Appendices
102
6
QUESTION 26. IN GENERAL, WOULD YOU SAY YOUR HEALTH IS 1. Excellent 2. Very good 3. Good 4. Fair 5. Poor 6. How often have you experienced the following symptoms during the last passed
month? Please, answer even though you haven’t experienced any symptoms.
QUESTION 27. PALPITATION WITHOUT PHYSICAL EXERCISE 1. Daily or nearly daily 2. About weekly 3. More seldom 4. Not at all
QUESTION 28. IRREGULAR HEARTBEATS 1. Daily or nearly daily 2. About weekly 3. More seldom 4. Not at all
QUESTION 29. CHEST PAIN DURING ANGER OR OTHER KIND OF EMOTION 1. Daily or nearly daily 2. About weekly 3. More seldom 4. Not at all
QUESTIONS 30–39: Yes, limited a lot Yes, limited a little No, not limited at all
30. Vigorous activities, such as running, lifting heavy objects, participating in strenuous sports
[1] [2] [3]
31. Moderate activities, such as moving a table, pushing a vacuum cleaner, bowling, or playing golf
[1] [2] [3]
32. Lifting or carrying groceries [1] [2] [3] 33. Climbing several flights of stairs
[1] [2] [3]
34. Climbing one flight of stairs [1] [2] [3] 35. Bending, kneeling, or stooping
[1] [2] [3]
36. Walking more than a mile
[1] [2] [3]
37. Walking several blocks [1] [2] [3]
38. Walking one block [1] [2] [3]
39. Bathing or dressing myself
[1] [2] [3]
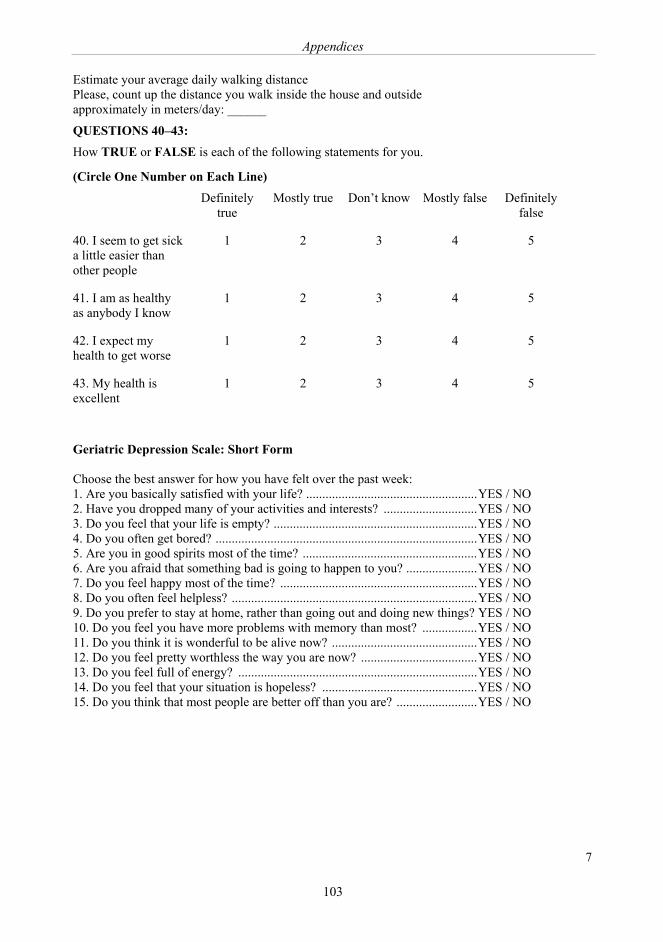
Appendices
103
7
Estimate your average daily walking distance Please, count up the distance you walk inside the house and outside approximately in meters/day: ______
QUESTIONS 40–43: How TRUE or FALSE is each of the following statements for you.
(Circle One Number on Each Line) Definitely
true Mostly true Don’t know Mostly false Definitely
false
40. I seem to get sick a little easier than other people
1 2 3 4 5
41. I am as healthy as anybody I know
1 2 3 4 5
42. I expect my health to get worse
1 2 3 4 5
43. My health is excellent
1 2 3 4 5
Geriatric Depression Scale: Short Form Choose the best answer for how you have felt over the past week: 1. Are you basically satisfied with your life? .....................................................YES / NO 2. Have you dropped many of your activities and interests? .............................YES / NO 3. Do you feel that your life is empty? ...............................................................YES / NO 4. Do you often get bored? .................................................................................YES / NO 5. Are you in good spirits most of the time? ......................................................YES / NO 6. Are you afraid that something bad is going to happen to you? ......................YES / NO 7. Do you feel happy most of the time? .............................................................YES / NO 8. Do you often feel helpless? ............................................................................YES / NO 9. Do you prefer to stay at home, rather than going out and doing new things? YES / NO 10. Do you feel you have more problems with memory than most? .................YES / NO 11. Do you think it is wonderful to be alive now? .............................................YES / NO 12. Do you feel pretty worthless the way you are now? ....................................YES / NO 13. Do you feel full of energy? ..........................................................................YES / NO 14. Do you feel that your situation is hopeless? ................................................YES / NO 15. Do you think that most people are better off than you are? .........................YES / NO

Appendices
104
8
Have you ever smoked daily? Yes No If you have quit smoking, so for how many years ago have you stopped? ____________ If you do smoke presently, how much do you smoke daily cigarettes? _________ pipefuls? __________ cigars? ____________
QUESTIONS 44. HOW OFTEN HAVE YOU BEEN DRUNK DURING THE PAST 12 MONTHS? 1. Not a single time 2. Once 3. 2-3 times 4. 4-5 times 5. About once every two months 6. About once a month 7. 2-3 times a month 8. About once a week 9. Twice a week or more often 10. Approximately how much/many of the following alcoholic drinks/beverage you have?
QUESTIONS 45. BEER PER WEEK? 1. Not at all 2. Less than a bottle (a´ 0,33 liters) 3. 1-4 bottles 4. 5-12 bottles 5. 13-24 bottles 6. 25-47 bottles 7. More than 48 bottles
QUESTIONS 46. WINE OR OTHER MILD ALCOHOLIC DRINKS PER WEEK? 1. Not at all 2. Less than a glass 3. 1-4 glasses 4. 1-2,5 bottles 5. 3-4,5 bottles 6. 5-9 bottles 7. More than 10 bottles
QUESTIONS 47. STRONG ALCOHOLIC DRINKS PER MONTH? 1. Not at all 2. Less than a half a bottle (a´ 0,5 liter) 3. A half – 1,5 bottles 4. 2-3,5 bottles 5. 4-9 bottles 6. 10-19 bottles 7. More than 20 bottles
QUESTIONS 48. HAVE YOU PASSED OUT WHILE USING ALCOHOL DURING THE LAST YEAR?
1. Not once 2. Once 3. 2-3 times 4. 4-6 times 5. 7 times, or more
Appendices
105
8
Have you ever smoked daily? Yes No If you have quit smoking, so for how many years ago have you stopped? ____________ If you do smoke presently, how much do you smoke daily cigarettes? _________ pipefuls? __________ cigars? ____________
QUESTIONS 44. HOW OFTEN HAVE YOU BEEN DRUNK DURING THE PAST 12 MONTHS? 1. Not a single time 2. Once 3. 2-3 times 4. 4-5 times 5. About once every two months 6. About once a month 7. 2-3 times a month 8. About once a week 9. Twice a week or more often 10. Approximately how much/many of the following alcoholic drinks/beverage you have?
QUESTIONS 45. BEER PER WEEK? 1. Not at all 2. Less than a bottle (a´ 0,33 liters) 3. 1-4 bottles 4. 5-12 bottles 5. 13-24 bottles 6. 25-47 bottles 7. More than 48 bottles
QUESTIONS 46. WINE OR OTHER MILD ALCOHOLIC DRINKS PER WEEK? 1. Not at all 2. Less than a glass 3. 1-4 glasses 4. 1-2,5 bottles 5. 3-4,5 bottles 6. 5-9 bottles 7. More than 10 bottles
QUESTIONS 47. STRONG ALCOHOLIC DRINKS PER MONTH? 1. Not at all 2. Less than a half a bottle (a´ 0,5 liter) 3. A half – 1,5 bottles 4. 2-3,5 bottles 5. 4-9 bottles 6. 10-19 bottles 7. More than 20 bottles
QUESTIONS 48. HAVE YOU PASSED OUT WHILE USING ALCOHOL DURING THE LAST YEAR?
1. Not once 2. Once 3. 2-3 times 4. 4-6 times 5. 7 times, or more
1
Appendix 2
Quality of life, status of health and symptom screening scales used in the comparison between PAD
patients and their age- and gender-matched controls:
Cardiac symptoms
There were three questions relating to cardiac symptoms: whether subjects had experienced daily or
weekly a) chest pain during anger or another kind of emotion, b) palpitation without physical
exercise, or c) irregular heartbeats, or not (Sumanen et al., 2004).
The 15D health-related QoL scale (15D HRQoL)
The 15D health-related quality of life instrument is a Finnish scale which reliability, validity,
discriminatory power and responsiveness to change of its health state descriptive system and
valuation system is described by Sintonen at the beginning of this century (Sintonen, 2001). It is
generally accepted to also suit our kind of patient population and its comparison to age- and gender-
matched controls (Koivunen et al., 2007).
In the 15D HRQoL12 out of 15 items had to be answered. Failure to do so resulted in the patient-
control-pair being deleted from the HRQoL profile material.
The 6-item Brief Social Support Questionnaire (SSQ6)
The short form of the Sarason’s social support score, SSQ6 has high internal validity (Sarason,
1987). The use of only the number part of score has been utilized in previous studies in Finland.
They represent large populations (Elovainio et al., 2003; Vahtera et al., 2002; Väänänen et al.,
2005; Väänänen et al., 2008).
Perceived social support was assessed using two measures: 1) the size of social network and 2)
social network heterogeneity as set out in the 6-item Brief Social Support Questionnaire (SSQ6)
Appendices
106
2
(Sarason, 1987). In this study, SSQ6 differentiated 0 to 6 sources of social support (options: spouse
or companion /other close relative/friend/ close workmate /neighbour/another close person/’no
one’) in six different situations (for example, “Who can you count on to console you when you are
very upset?”) (Elovainio et al., 2003). ‘The Satisfaction part’ of SSQ6 was not used, only ‘the
Number part’; thus 36 was the maximum amount for social support. This value was divided by the
number of items, 6, which gave the SSQ6 Number score (SSQ6N). The social network
heterogeneity was analyzed by checking whether there was at least one time support from the
spouse, or companion, other near relatives, a close friend, a close workmate, a close neighbour,
another close person, or ‘no one’. At least four items had to be answered in order to obtain the
SSQ6 responses to the analysis, otherwise the respondent’s answers were omitted.
The Physical Functioning and General Health subscales of the Rand-36 Item Health Survey 1.0
(Rand-36 PF and Rand-36 GH)
The Rand-36 HRQoL instrument has also been validated for the Finnish population and is also in
Finnish (Aalto, 1999). All correlations between items and their hypothesized scales (corrected for
overlap) are at least 0.50. Rand-36 PF and Rand-36 GH subscales of the Rand-36 Item Health
Survey 1.0 scorings were run according to the instructions at
http://www.rand.org/health/surveys_tools/mos/mos_core_36item_scoring.html
In order for the respondent’s sum score to be included, a minimum of 5/10 questions had to be
answered in Rand-36 PF and 3/5 in Rand-36 GH subscale.
The Geriatric Depression Scale (GDS)
In the Geriatric Depression Scale (GDS) the use of the cut-off point 4/5 for the GDS-15 has
produced sensitivity and specificity rates of 92.7% and 65.2% respectively, and positive and
Appendices
107
3
negative predictive values of 82.6% and 83.3% respectively when ICD-10 diagnostic criteria for
major depressive episode have been used as the 'gold standard'. Reliability coefficients have been
0.81 for GDS-15. The optimum cut-off point for the GDS has been 10, yielding a sensitivity of
100% and a specificity of 84%. A shorter version of the GDS has had a sensitivity of 92% and a
specificity of 81% using a cut-off point of 5. All scales lose accuracy when used to detect minor
depression or the presence of any depressive diagnosis. (Almeida and Almeida, 1999)
In the 15 item Geriatric Depression Scale (Yesavage et al., 1982; Almeida and Almeida, 1999) from
0 to 15, a score of 5 points or more is suggestive of depression and ought to warrant a
comprehensive follow-up assessment. A score of 10 points or more was considered indicative of
depression. If respondents set their answer in between ‘yes’ or ‘no’, 0.5 points were allocated for
the item in question. A minimum of 12/15 questions had to be answered. Failure to do so resulted in
the respondent’s summary score being deleted.
The Life Satisfaction score (LS)
Life Satisfaction Score’s correlation coefficients between each item and the life satisfaction score
range from 0.63 to 0.80 (p < 0.001). Cronbach’s alpha was 0.74. Distribution of the life satisfaction
score is skewed, with lower scores representing greater life satisfaction predominating irrespective
of gender, health status, or age group. (Koivumaa-Honkanen, 1998)
Life Satisfaction was assessed using a series of four questions from a life-quality study conducted at
the University of Michigan and adapted in the Finnish cohort study of twins (Allardt, 1973)
(Koivumaa-Honkanen et al., 2000). Self-reported life satisfaction (LS) was measured using a four-
question scale with sum score (LS, range 4–20) categorized as satisfied (LS: 4–6), intermediate (LS:
7–11) or dissatisfied (LS: 12–20). Participants were asked to rate four aspects of LS: interest in life,
happiness, ease of living and loneliness (very interesting/happy/easy/not at all lonely=1, fairly
interesting/happy/easy=2, missing data and `cannot say' = 3, fairly boring/unhappy/hard/lonely=4,
Appendices
108
4
very boring/unhappy/hard/lonely=5) (Koivumaa-Honkanen et al., 2000). At least two out four items
had to be answered in order to get the sum score for the analysis otherwise the respondent’s sum
score was omitted.
‘Perceived state of health’
‘Perceived state of health’ was taken separately from the Rand-36 General Health subscale (having
been included in the study protocol as a whole) and studied according to Likert's five-step scale
(good, quite good, fair, rather poor and poor). Due to small frequencies extreme categories were
combined, and a three-step scale (good, fair, and poor) was used in the analyses.
Mini-Mental-State Examination
The cognition was measured by using Mini-Mental-State Examination (MMSE). One trained
research assistant performed most of the MMSE tests on the participants. MMSE is an easy to use
and commonly used test to evaluate cognitive capacity. It may not be used as a single test to detect
dementia (Tombaugh and McIntyre, 1992). MMSE is not sensitive enough to detect mild cognitive
impairment. The repeatability of the test is good (Juva et al., 1994)
References: 15D Health-related Quality of Life instrument scoring instructions. Available at :http://www.15d-
instrument.net/rmd. Accessed April 3 2009. In. Geriatric Depression Scale. Available at: http://www.stanford.edu/~yesavage/GDS.html. Accessed
April 3 2009. In. Rand-36 Quality of Life Scale scoring instructions. Available at:
http://www.rand.org/health/surveys_tools/mos/mos_core_36item_scoring.html. Accessed April 2 2009. In.
Almeida OP, Almeida SA. 1999. Short versions of the geriatric depression scale: a study of their validity for the diagnosis of a major depressive episode according to ICD-10 and DSM-IV. Int J Geriatr Psychiatry 14:858-865.

Appendices
109
5
Hyttinen L, Kekälainen P, Vuorio AF, Sintonen H, Strandberg TE. 2008. Health-related quality of life in elderly patients with familial hypercholesterolemia. Int J Technol Assess Health Care 24:228-234.
Juva K, Sulkava R, Erkinjuntti T, Ylikoski R, Valvanne J, Tilvis R. 1994. Staging the severity of dementia: comparison of clinical (CDR, DSM-III-R), functional (ADL, IADL) and cognitive (MMSE) scales. Acta Neurol Scand 90:293-298.
Koivunen K, Sintonen H, Lukkarinen H. 2007. Properties of the 15D and the Nottingham Health Profile questionnaires in patients with lower limb atherosclerotic disease. Int J Technol Assess Health Care 23:385-391.
Sumanen MP, Suominen SB, Koskenvuo MJ, Sillanmaki LH, Mattila KJ. 2004. Occurrence of symptoms and depressive mood among working-aged coronary heart disease patients. Health Qual Life Outcomes 2:60.
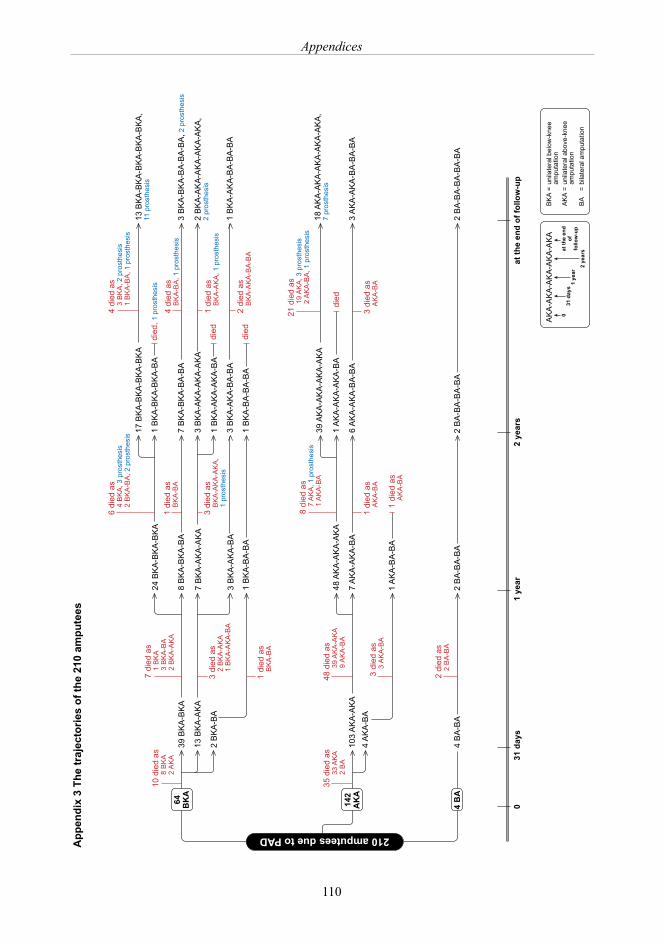
Appendices
110
�����������������������
���
����
���
����
����
���
�������
�����
����
����
���
�� ��
�
���
��
�
���
���
��
���
���
���
���
���
��
���
���
���
���
���
���
���
���
�
����
����
���
��
���
����
��
���
��
���
��
���
����
����
����
���
���
��
���
��
���
���
����
����
���
��
���
�
����
����
����
����
���
���
��
���
��
���
����
��
���
���
��
���
��
���
���
�
����
����
���
��
����
����
����
���
���
��
���
���
��
���
���
��
���
���
��
���
���
���
�
����
��
���
���
��
���
�
����
����
��
��
���
����
����
��
��
���
����
����
����
���
����
����
����
���
���
��
���
�����
����
����
�
����
��
���
���
��
���
���
��
���
����
����
��
���
��
���
���
���
���
�
����
����
����
��
���
��
�
����
��
���
�
����
��
���
�
���
��
���
����
����
��
��
���
����
����
���
��
���
��
���
��
���
���
�
����
����
���
��
���
��
���
���
��
���
��
����
����
��
��
���
���
��
���
���
���
��
���
���
�
���
��
���
���
��
���
��
���
���
�
����
��
���
���
��
���
��
���
���
���
����
����
����
����
��
��
���
���
��
���
����
����
����
��
���
��
���
���
���
��
���
���
��
���
���
��
���
���
��
���
�
����
����
��
��
���
���
��
���
���
���
�
���
��
���
���
��
���
����
��
���
���
��
���
�
����
����
���
��
����
����
����
���
���
��
���
�����
����
����
�
����
�����
����
����
�
����
����
��
��
���
���
���
�
����
����
��
��
���
����
����
����
���
����
����
��
��
���
�����
����
����
�
����
����
���
��
����
����
����
���
���
��
���
�����
����
����
�
����
��
���
���
��
���
���
��
���
����
����
���
���
��
���
���
���
���
����
����
����
���
���
��
���
���
��
���
���
��
���
����
����
��
���
��
���
���
���
���
�
��
���
��
���
���
��
���
�
���
����
���
����
����
�����
�����
���
��
�����
���
�
��
��
�����
����
�����
����
���
����
�����
��
��
���
�����
�����
����
����
���
����
����
��
���
����
�����
���
�����
�
�����
���
����
���
����
����
����
������
����
����
����
��
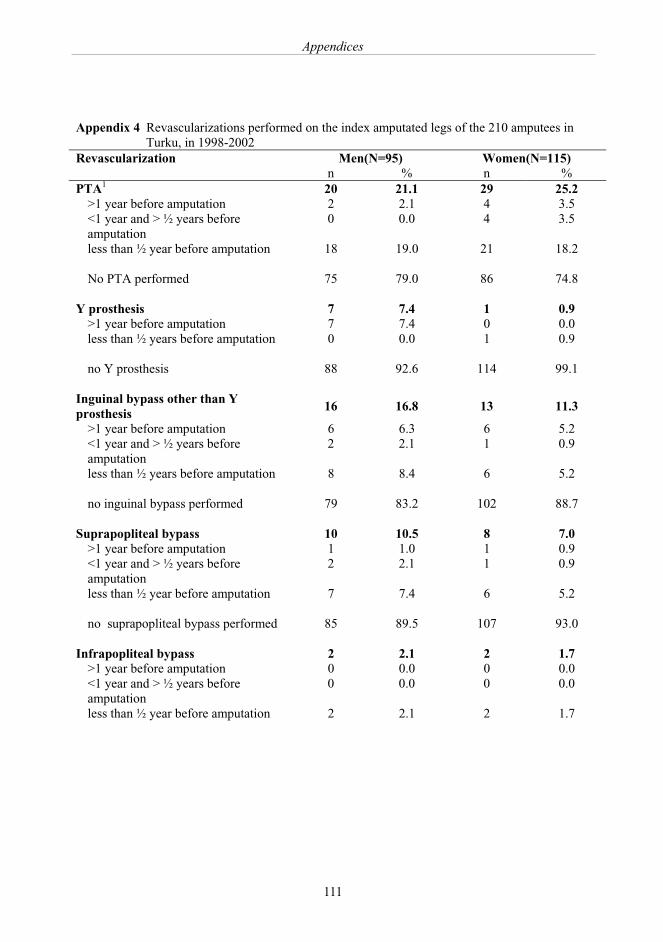
Appendices
111
Appendix 4 Revascularizations performed on the index amputated legs of the 210 amputees in Turku, in 1998-2002
Revascularization Men(N=95) Women(N=115) n % n % PTA1 20 21.1 29 25.2
>1 year before amputation 2 2.1 4 3.5 <1 year and > ½ years before amputation
0 0.0 4 3.5
less than ½ year before amputation 18 19.0 21 18.2 No PTA performed 75 79.0 86 74.8
Y prosthesis 7 7.4 1 0.9 >1 year before amputation 7 7.4 0 0.0 less than ½ years before amputation 0 0.0 1 0.9 no Y prosthesis 88 92.6 114 99.1
Inguinal bypass other than Y prosthesis
16 16.8 13 11.3
>1 year before amputation 6 6.3 6 5.2 <1 year and > ½ years before amputation
2 2.1 1 0.9
less than ½ years before amputation 8 8.4 6 5.2 no inguinal bypass performed 79 83.2 102 88.7
Suprapopliteal bypass 10 10.5 8 7.0 >1 year before amputation 1 1.0 1 0.9 <1 year and > ½ years before amputation
2 2.1 1 0.9
less than ½ year before amputation 7 7.4 6 5.2 no suprapopliteal bypass performed 85 89.5 107 93.0
Infrapopliteal bypass 2 2.1 2 1.7 >1 year before amputation 0 0.0 0 0.0 <1 year and > ½ years before amputation
0 0.0 0 0.0
less than ½ year before amputation 2 2.1 2 1.7 no infrapopliteal bypass performed 93 97.9 113 98.3
1Percutaneous transluminal angioplasty
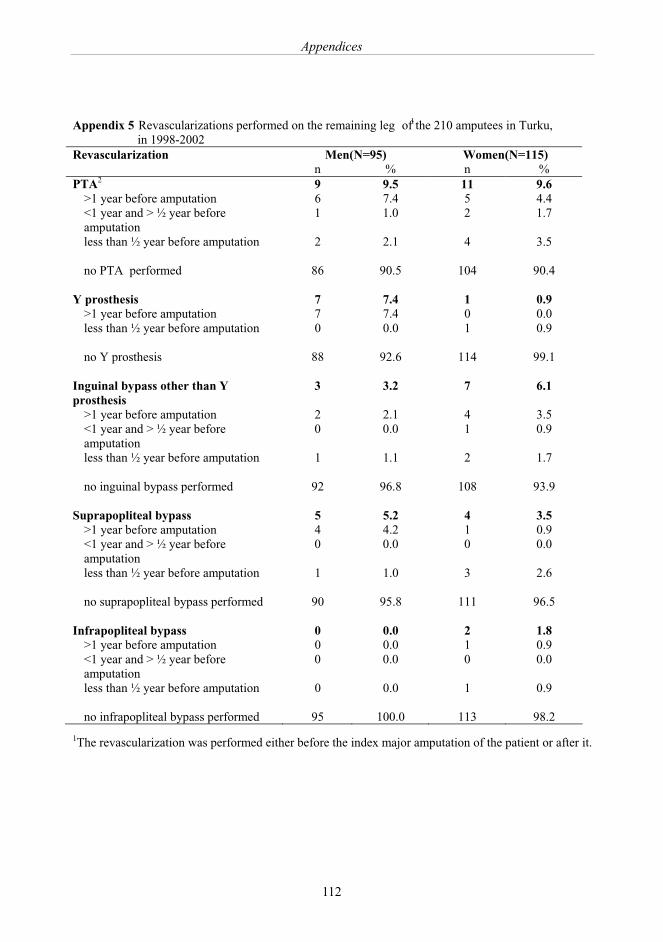
Appendices
112
Appendix 5 Revascularizations performed on the remaining leg 1 of the 210 amputees in Turku, in 1998-2002
Revascularization Men(N=95) Women(N=115) n % n % PTA2 9 9.5 11 9.6
>1 year before amputation 6 7.4 5 4.4 <1 year and > ½ year before amputation
1 1.0 2 1.7
less than ½ year before amputation 2 2.1 4 3.5 no PTA performed 86 90.5 104 90.4
Y prosthesis 7 7.4 1 0.9 >1 year before amputation 7 7.4 0 0.0 less than ½ year before amputation 0 0.0 1 0.9 no Y prosthesis 88 92.6 114 99.1
Inguinal bypass other than Y prosthesis
3 3.2 7 6.1
>1 year before amputation 2 2.1 4 3.5 <1 year and > ½ year before amputation
0 0.0 1 0.9
less than ½ year before amputation 1 1.1 2 1.7 no inguinal bypass performed 92 96.8 108 93.9
Suprapopliteal bypass 5 5.2 4 3.5 >1 year before amputation 4 4.2 1 0.9 <1 year and > ½ year before amputation
0 0.0 0 0.0
less than ½ year before amputation 1 1.0 3 2.6 no suprapopliteal bypass performed 90 95.8 111 96.5
Infrapopliteal bypass 0 0.0 2 1.8 >1 year before amputation 0 0.0 1 0.9 <1 year and > ½ year before amputation
0 0.0 0 0.0
less than ½ year before amputation 0 0.0 1 0.9 no infrapopliteal bypass performed 95 100.0 113 98.2
1The revascularization was performed either before the index major amputation of the patient or after it. The time interval was calculated either to the major amputation of the remaining leg or death after the revascularization of the leg in question. 2Percutaneous transluminal angioplasty