Genetic and functional characterization of clonally derived adult human brown adipocytes
Upload
independentCategory
view
1download
0
ORIGINAL RESEARCH ARTICLEpublished: 11 March 2013
doi: 10.3389/fendo.2013.00010
Angiotensinogen gene silencing reduces markers of lipidaccumulation and inflammation in cultured adipocytesWenting X. Carroll 1,2, Nishan S. Kalupahana3, Suzanne L. Booker 1,2, Nalin Siriwardhana4,Monique LeMieux 4, Arnold M. Saxton1,2 and Naima Moustaid-Moussa4*1 Department of Animal Science, University of Tennessee, Knoxville, TN, USA2 Obesity Research Center, University of Tennessee, Knoxville, TN, USA3 Department of Physiology, Faculty of Medicine, University of Peradeniya, Peradeniya, Sri Lanka4 Nutritional Sciences Program, College of Human Sciences, Texas Tech University, Lubbock, TX, USA
Edited by:Tsuguhito Ota, Kanazawa University,Japan
Reviewed by:Subrata Chakrabarti, The University ofWestern Ontario, CanadaPo Sing Leung, The ChineseUniversity of Hong Kong, China
*Correspondence:Naima Moustaid-Moussa, NutritionalSciences Program, College of HumanSciences, Texas Tech University, 1301Akron Street, Lubbock, TX 79409,USA.e-mail: [email protected]
Inflammatory adipokines secreted from adipose tissue are major contributors to obesity-associated inflammation and other metabolic dysfunctions. We and others have recentlydocumented the contribution of adipose tissue renin-angiotensin system to the pathogene-sis of obesity, inflammation, and insulin resistance.We hypothesized that adipocyte-derivedangiotensinogen (Agt) plays a critical role in adipogenesis and/or lipogenesis as well asinflammation.This was tested using 3T3-L1 adipocytes, stably transfected with Agt-shRNAor scrambled Sc-shRNA as a control. Transfected preadipocytes were differentiated andused to investigate the role of adipose Agt through microarray and PCR analyses andadipokine profiling. As expected, Agt gene silencing significantly reduced the expressionof Agt and its hormone product angiotensin II (Ang II), as well as lipid accumulation in 3T3-L1 adipocytes. Microarray studies identified several genes involved in lipid metabolismand inflammatory pathways which were down-regulated by Agt gene inactivation, suchas glycerol-3-phosphate dehydrogenase 1 (Gpd1), serum amyloid A 3 (Saa3), nucleotide-binding oligomerization domain containing 1 (Nod1), and signal transducer and activator oftranscription 1 (Stat1). Mouse adipogenesis PCR arrays revealed lower expression levelsof adipogenic/lipogenic genes such as peroxisome proliferator activated receptor gamma(PPARγ), sterol regulatory element binding transcription factor 1 (Srebf1), adipogenin (Adig),and fatty acid binding protein 4 (Fabp4). Further, silencing of Agt gene significantly loweredexpression of pro-inflammatory adipokines including interleukin-6 (IL-6), tumor necrosisfactor-alpha (TNF-α), and monocyte chemotactic protein-1 (MCP-1). In conclusion, this studydirectly demonstrates critical effects of Agt in adipocyte metabolism and inflammation andfurther support a potential role for adipose Agt in the pathogenesis of obesity-associatedmetabolic alterations.
Keywords: angiotensinogen, gene silencing, inflammation, adipocytes, adipokines, adipogenesis
INTRODUCTIONObesity is a major risk factor for life-threatening diseases in theUnited States and worldwide. Its comorbidities include hyper-tension, cardiovascular disease, stroke, type-2 diabetes mellitus(T2DM), and some types of cancer (Ouchi et al., 2011). In obeseindividuals, imbalanced secretion of pro- vs. anti-inflammatoryadipokines from abnormally expanded adipose tissue and ashift in immune cell populations leads to the development ofmetabolic complications (Ouchi et al., 2011; Kalupahana andMoustaid-Moussa, 2012a). In the past decades, multiple stud-ies (in vitro, in vivo, and clinical) indicated the critical roleof the renin-angiotensin system (RAS) in the pathogenesis ofobesity-associated health disorders. RAS is conventionally knownas a group of hormones and enzymes (renin and angiotensin-converting enzyme: ACE) which regulate blood pressure and fluidbalance. Angiotensinogen (Agt) is the only known precursor fromwhich the hypertensive hormone angiotensin (Ang) II and other
bioactive Ang peptides are generated. Ang II mainly functionsthrough two G-protein coupled receptors, type 1 (AT1) and type2 (AT2) receptors. In lean individuals, the liver is the major sitefor Agt production but RAS components are also expressed inwhite and brown adipose tissue, making them relevant to thiswork (Karlsson et al., 1998; Engeli et al., 2000; Galvez-Prietoet al., 2008). Angiotensinogen expression in general has beenshown to be hormonally and nutritionally regulated as well asdifferentiation-dependent (Jones et al., 1997a; Siriwardhana et al.,2012). Specifically Agt is thought to be a late marker for adipocytedifferentiation (Ailhaud et al., 2002), making it relevant to thecurrent study.
Clinical studies showed that RAS blockade using ACE inhibitorsor AT1 blockers improved the insulin sensitivity and low-ered the incidence of T2DM in patients with hypertensionor other cardiovascular diseases (Pollare et al., 1989). RASblockade also increased the insulin sensitivity and improved
www.frontiersin.org March 2013 | Volume 4 | Article 10 | 1

Carroll et al. Angiotensiongen gene silencing in adipocytes
adiposity in obese and diabetic rodent models (reviewed inKalupahana and Moustaid-Moussa, 2012a). The metabolic effectsof RAS were further confirmed in genetic animal models with sys-temic deletion of certain RAS components (Agt, renin, ACE, AT1a,or AT2 receptor) (reviewed in Kalupahana and Moustaid-Moussa,2012a). In vitro studies showed that Ang II stimulated lipogene-sis and secretion of pro-inflammatory adipokines in adipocytes(Jones et al., 1997b; Kalupahana et al., 2012).
In obese humans and rodents, adipose tissue is the majorsite for Agt production, which significantly increases Agt levelin circulation (Van Harmelen et al., 2000; Boustany et al., 2004;Engeli et al., 2005). Our lab and others demonstrated that micewith Agt over-expression in adipose tissue developed obesity withadipocyte hypertrophy, concurrent with insulin resistance andincreased expression of lipogenic and pro-inflammatory makers(Massiera et al., 2001a; Kalupahana et al., 2012). Most of theseeffects were rescued by deletion of AT2 receptor (Yvan-Charvetet al., 2009). The genetic mouse model with adipose-specificAgt gene knock-out exhibited lower systolic blood pressure asthey age, however no change was observed in body weight orfat mass when fed a low-fat diet (Yiannikouris et al., 2012).Systemic AGT knock-out mouse models have also been gener-ated in which body weight, adiposity, leptin, and insulin levelswere significantly lowered on a high-fat diet compared to wild-type mice. These effects were then reversed when AGT was re-expressed in adipose tissue (Massiera et al., 2001b; Kim et al.,2002).
Studies reviewed above link the elevated secretion of Agt fromadipose tissue to obesity-associated local and systemic inflam-mation as well as insulin resistance, and possibly exacerbatedadiposity. Therefore, we hypothesized that inactivation of Agtin adipocytes will limit lipid accumulation, and improve theinflammatory profile.
In the present study, we silenced Agt gene in 3T3-L1 adipocytesusing shRNA, and demonstrated that lower Agt expression leadsto decreased triglyceride accumulation, which is accompaniedby improved expression patterns of adipogenic/lipogenic andinflammatory genes and proteins in adipocytes.
MATERIALS AND METHODSCELL CULTURE, shRNA TRANSFECTION, AND PREADIPOCYTEDIFFERENTIATIONInitially, cell lines were generated as described below using two dif-ferent shRNA sequences and prepared as both isolated or pooledclones of stably transfected cells. They were then compared tocells stably transfected with scrambled sequences. Both shRNAsequences reduced inflammatory markers and led to significantinactivation of AGT (>70%). Due to the similarities between thetwo sequences, only one was chosen and used for further detailedexperiments as discussed below.
3T3-L1 preadipocytes (American Type Culture Collection;ATCC, Manassas, VA, USA) were seeded in two 6-well cell cul-ture plates. Each well had 2 ml Dulbecco’s modified eagle medium(DMEM) supplemented with 10% fetal bovine serum (FBS).Cells were incubated at 37˚C in a humidified CO2 incubator.The vector-based shRNA targeting Agt gene (Agt-shRNA, GGATCCCGTTTCTACCTTGGATCCTAGATTGATATCCGTCTAAGGA
TCCAAGGTAGAAATTTTTTCCAAAAGCTT) was ordered fromGenScript (Piscataway, NJ, USA). A scrambled sequence(Sc-shRNA,GGATCCCGTCGCTTACCGATTCAGAATGGTTGATATCCGCCATTCTGAATCGGTAAGCGACGAAGCTTAAGTTTAAACCGCTGATCAGCCTCGACTGTGCCTTCTAGT) with nohomology to any mouse or rat mRNA sequence in NCBI data-base was used as experimental control. These vectors carried aneomycin resistance gene.
Cells were stably transfected at ∼50–60% confluence. Thetransfection was performed using Lipofectamine™ 2000 Transfec-tion Reagent (Life Technologies, Grand Island, NY, USA) method.3T3-L1 preadipocytes transfected by Agt-shRNA or Sc-shRNAwere maintained in regular growth medium (DMEM contain-ing 10% FBS, 1% penicillin/streptomycin) till 90% confluence.To differentiate the preadipocytes to mature adipocytes, cells weremaintained in regular growth medium supplemented by isobutyl-methylxanthine (0.5 mM), dexamethasone (0.25 µM), and insulin(1 µg/ml) for 3 days, followed by regular growth media for another3 days. Several cell lines were generated from these stable trans-fections and referred to as Agt-ShRNA1, 2, etc. Overall, Agt wassilenced by more than 70% in these cell lines.
AGT AND ANG II MEASUREMENTTotal protein was extracted using tissue lysis buffer (Life Tech-nologies, Grand Island, NY, USA) containing protease inhibitors(Roche, USA). The concentration of extracted protein sampleswas determined by Bradford assay (Thermo Scientific/Pierce,Rockford, IL, USA).
The expression level of Agt protein was measured by west-ern blotting. Each sample of 25 µg total protein from 3T3-L1adipocytes transfected by Agt-shRNA or Sc-shRNA (3 vs. 3) wasfirst separated by electrophoresis using 12% Mini-PROTEAN TGXPrecast Gel (Bio-Rad, Hercules, CA, USA), and then transferred toa PVDF membrane. After overnight blocking (3% bovine serumalbumin in tris-buffered-saline supplemented by 0.1% Tween 20),the membrane was incubated with polyclonal antibodies targetingAgt protein (Santa Cruz Biotechnology, Santa Cruz, CA, USA).After a wash (tris-buffered-saline with 0.1% Tween 20), the mem-brane was incubated with the secondary antibodies containinghorseradish peroxidase. The expression of Agt was detected withthe ECL Plus substrate (Thermo Scientific/Pierce, Rockford, IL,USA), and quantified using the NIH ImageJ software. The expres-sion level of Agt protein was normalized by the expression ofglyceraldehyde 3-phosphate dehydrogenase (GAPDH).
The intracellular level of Ang II was measured by Angiotensin IIEIA Kit (Cayman Chemical, Ann Arbor, MI, USA). To perform theassay, 10 µL of each total protein sample from 3T3-L1 adipocytestransfected by Agt-shRNA or Sc-shRNA (n= 5 each) was used.The analyte value was normalized by total protein concentration.
LIPID ACCUMULATION ASSAY3T3-L1 adipocytes transfected by Agt-shRNA or Sc-shRNA (n= 5each) were washed with PBS, and then harvested in PBS sup-plemented by 10% IGEPAL CA-630 (detergent, Sigma-Aldrich,St. Louis, MO, USA). Cells were then transferred to a 2 ml auto-claved centrifuge tube and homogenized for 15 s. The triglyceridecontent in cell lysate was measured using Serum Triglyceride
Frontiers in Endocrinology | Diabetes March 2013 | Volume 4 | Article 10 | 2

Carroll et al. Angiotensiongen gene silencing in adipocytes
Determination Kit (Sigma-Aldrich, St. Louis, MO, USA). Theanalyte value was normalized by total protein concentration.
PRO-INFLAMMATORY ADIPOKINE PROFILINGThe intracellular level of pro-inflammatory adipokines (IL-1,TNF-α, MCP-1, PAI-1, and resistin) was measured by the MouseSerum Adipokine Milliplex Kit (Millipore, Billerica, MA, USA). Toperform the assay, total protein sample from 3T3-L1 adipocytestransfected by Agt-shRNA or Sc-shRNA (n= 5 each) was used.The analyte value was normalized by protein concentration.
MICROARRAYTotal RNA was extracted from 3T3-L1 adipocytes transfectedwith Agt-shRNA or Sc-shRNA using RNeasy lipid tissue kit (Qia-gen, Valencia, CA, USA). Four sets of RNA samples each wereused for microarray analyses. The concentration of these RNAsamples was measured using NanoDrop 2000 (Thermo Scien-tific, USA), and the quality was determined by the ExperionRNA StdSens Chips (Bio-Rad, Hercules, CA, USA). Sampleswere sent to the McGill University’s Génome Québec Innova-tion Center (Montréal, Canada) and Illumina MouseRef-8 V2.0Expression Beadchips (Illumina, San Diego, CA, USA) wereused to measure 25,697 RefSeq transcripts, over 19,100 genes.David Bioinformatics Database 6.71 (NIAID/NIH) was used forthe ontology and pathway analysis on genes with differentialexpression.
QUANTITATIVE REAL-TIME PCRThe expression pattern of selected genes with differential expres-sion in the microarray analyses was verified by quantitative Real-Time PCR (qRT-PCR). Total RNA samples extracted from 3T3-L1adipocytes transfected with Agt-shRNA or Sc-shRNA (n= 4 each)were used for cDNA synthesis using the High Capacity cDNA RTkit (Applied Biosystems, Carlsbad, CA, USA). All primers usedin this study were purchased from Qiagen (QuantiTect PrimerAssay). The real-time PCR was performed on Applied Biosys-tems 7900HT Fast Real-Time PCR System using the Fast SYBRMaster Mix (Applied Biosystems, Carlsbad, CA, USA). The expres-sion level of housekeeping gene β-actin (Actb) was measuredas reference to normalize the expression level of genes underinvestigation.
PCR ARRAYThe expression of genes associated with adipocyte metabolismwas profiled by Mouse Adipogenesis RT2 Profiler™ PCR Array(SABiosciences, Qiagen, Valencia, CA, USA), which targets 84 coregenes in mouse adipogenesis pathway. The array kit also con-tains five housekeeping genes, which include Actb. Total RNAsamples extracted from 3T3-L1 adipocytes transfected with Agt-shRNA or Sc-shRNA (n= 4 each) were used for the synthesis ofcDNA using RT2 First Strand Kit (SABiosciences, Qiagen, Valen-cia, CA, USA). RT-PCR was performed on the same equipment asdescribed previously using the RT2 SYBR Green qPCR Mastermix(SABiosciences, Qiagen, Valencia, CA, USA). David Bioinformat-ics Database 6.7 (see text footnote 1, NIAID/NIH) was used forthe gene ontology analysis.
1http://david.abcc.ncifcrf.gov/tools.jsp
STATISTICAL ANALYSESIn this study, microarray data were analyzed by R software(version 2.9.0) using “lumi” package in bioconductor2. Signifi-cant differential expression in 3T3-L1 adipocytes with Agt genesilencing compared to the adipocytes transfected by Sc-shRNAwas defined as an FDR adjusted P value < 0.05.
Data from qRT-PCR and PCR array studies were analyzed bythe web-based software3 (SABiosciences) using 2−∆∆CT method.The expression level for genes of interest was normalized by theexpression of Actb housekeeping gene.
All other analyses were performed using SAS software (version9.2, Cary, NC, USA). Results were reported as means± SE. Oneway ANOVA followed by Tukey post hoc test was used to comparethe group means at P < 0.05.
RESULTSANGIOTENSINOGEN GENE SILENCING REDUCED AGT PROTEINEXPRESSION AND INTRACELLULAR LEVEL OF ANG II IN 3T3-L1ADIPOCYTESSuccessful transfection of Agt-shRNA into 3T3-L1 preadipocyteswas demonstrated by the significantly lower expression of Agt pro-tein in 3T3-L1 adipocytes expressing Agt-shRNA vs. Sc-shRNA(Figures 1A,B; P < 0.005). As Agt is the precursor for the hyper-tensive hormone Ang II, we further measured the intracellularlevel of Ang II, which was also decreased in 3T3-L1 adipocytesexpressing Agt-shRNA vs. Sc-shRNA (Figure 1C; P < 0.0001).
AGT GENE SILENCING DECREASED LIPID ACCUMULATION ANDINTRACELLULAR LEVEL OF PRO-INFLAMMATORY ADIPOKINES IN3T3-L1 ADIPOCYTESPrevious studies have reported that Ang II increases the triglyc-eride content in 3T3-L1 adipocytes (Jones et al., 1997b). Here,we determined the role of RAS in mediating lipogenesis bydirectly knocking down the expression of Ang II precursor –Agt gene. Agt gene silencing significantly reduced the triglyc-eride content in 3T3-L1 adipocytes expressing Agt-shRNA vs.Sc-shRNA (Figure 2A; P < 0.005). Studies have also shown thatAng II stimulates the secretion of pro-inflammatory adipokinesfrom both human and 3T3-L1 adipocytes. In this study, wemeasured the intracellular level of major pro-inflammatoryadipokines (IL-6, TNF-α, MCP-1, resistin, and PAI-1). Theresults showed lower IL-6, TNF-α, and MCP-1 protein levels in3T3-L1 adipocytes transfected with Agt-shRNA vs. Sc-shRNA(Figure 2B). This indicated Agt as an important mediator inadipose inflammation.
AGT GENE SILENCING INDUCED CHANGES IN THE EXPRESSION OFGENES INVOLVED IN LIPID METABOLISM AND IMMUNE RESPONSEPATHWAYSTo dissect the underlying mechanism which mediates the meta-bolic effects of Agt in adipocytes, a microarray study was per-formed on 3T3-L1 adipocytes transfected by Agt-shRNA or Sc-shRNA. After filtering out 16,561 transcripts with insignificantexpression, we conducted statistical analysis on the remaining
2http://www.bioconductor.org/3http://pcrdataanalysis.sabiosciences.com/pcr/arrayanalysis.php
www.frontiersin.org March 2013 | Volume 4 | Article 10 | 3

Carroll et al. Angiotensiongen gene silencing in adipocytes
FIGURE 1 | Agt gene silencing induces lower Agt protein expressionand intracellular level of Ang II. 3T3-L1 preadipocytes were transfectedby shRNA targeting Agt gene (Agt-shRNA) or scrambled shRNA(Sc-shRNA), and then differentiated to mature adipocytes. (A,B) Agt proteinexpression, and (C) intracellular level of Ang II are shown. Data arepresented as mean±SE [n=3 for each group in (A), n=5 for each group in(C)]. The expression of Agt is normalized by the expression of GAPDH. Theintracellular level of Ang II is normalized by total protein concentration.*P < 0.005 vs. adipocytes transfected by Sc-shRNA.
9,136 transcripts. Compared to cells transfected with Sc-shRNA,the expression of 89 genes was significantly down-regulated andthe expression of 23 genes was up-regulated in 3T3-L1 adipocyteswith Agt gene silencing (Figure 3A). A heat map was plot-ted by cluster analysis on genes with differential expression in3T3-L1 adipocytes transfected with Agt-shRNA vs. Sc-shRNA. Theexpression patterns of these genes were highly consistent withineach adipocyte cell line, as shown in Figure 3B.
Gene ontology and pathway analysis showed that the expressionof several critical genes involved in lipid metabolism and inflam-matory response was down-regulated in 3T3-L1 adipocytes withAgt gene silencing; selected genes are listed in Tables 1 and 2. Other
FIGURE 2 | Agt gene silencing leads to lower triglyceride accumulationand intracellular level of pro-inflammatory adipokines in 3T3-L1adipocytes. 3T3-L1 preadipocytes were transfected by shRNA targetingAgt gene (Agt-shRNA) or scrambled shRNA (Sc-shRNA), and thendifferentiated to mature adipocytes. Triglyceride content (A) and adipokineconcentration (B) is normalized by total protein concentration. Data arepresented as mean±SE (n=5 for each group). *P < 0.05 vs. adipocytestransfected by Sc-shRNA.
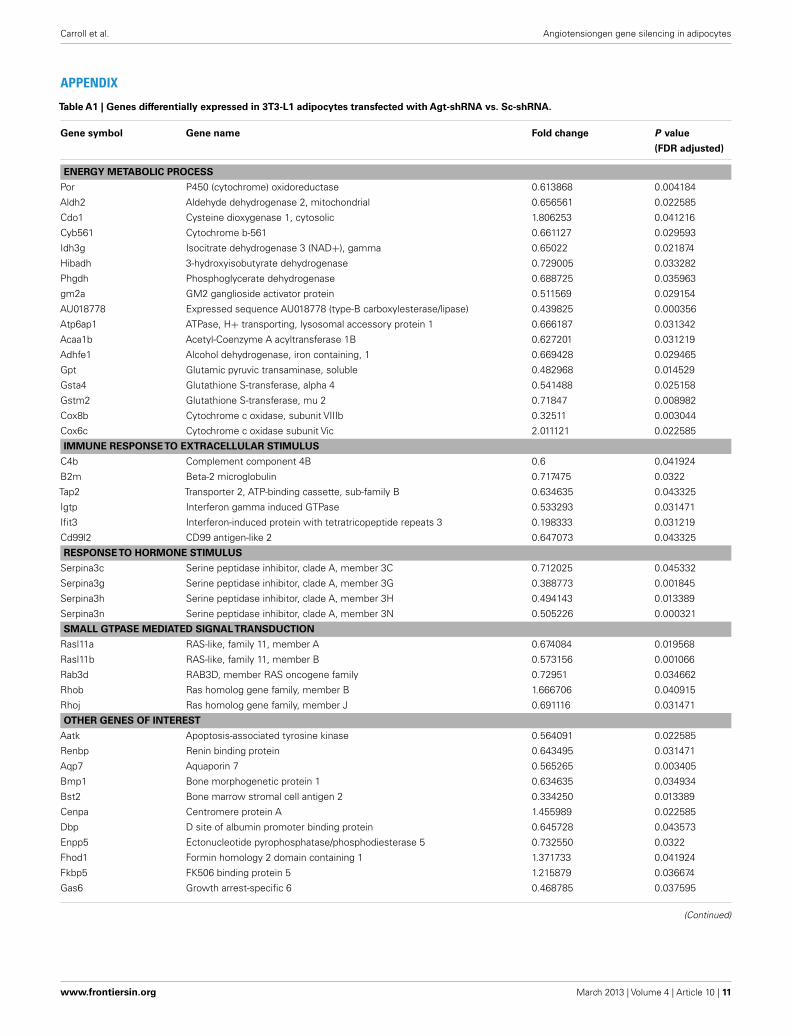
genes with decreased expression in 3T3-L1 adipocytes with Agtgene silencing were genes involved in energy metabolism, immuneresponse, oxidative stress, cell differentiation, and apoptosis. Geneswith up-regulated expression in 3T3-L1 adipocytes with Agt genesilencing were ones involved in DNA replication, transcription,translation, repair, chromosomal structure, intracellular proteintrafficking, protein phosphorylation, and proteolysis. These genesare listed in Table A1 in Appendix.
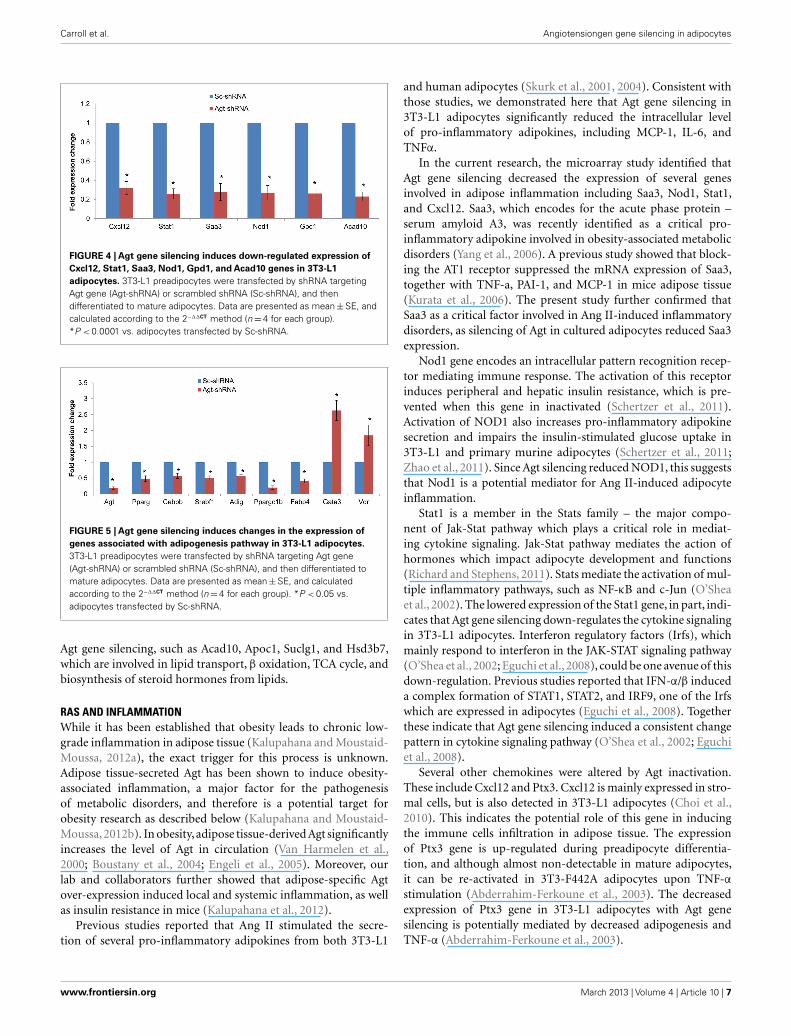
To determine whether the profile of global gene expression fromthe microarray study were consistent with the relative amounts ofmRNA present in parallel samples, qRT-PCR was performed onselected genes (Cxcl12, Stat1, Saa3, Nod1, Gpd1, and Acad10).Consistent with microarray results, the expression level of allthese genes were down-regulated in 3T3-L1 adipocytes with Agtgene silencing compared to those transfected with Sc-shRNA(Figure 4).
Since knock-down of Agt gene decreased lipid accumulationand the expression of genes associated with lipid metabolism in3T3-L1 adipocytes, we further profiled the expression pattern of
Frontiers in Endocrinology | Diabetes March 2013 | Volume 4 | Article 10 | 4

Carroll et al. Angiotensiongen gene silencing in adipocytes
FIGURE 3 | Agt gene silencing induces changes in global geneexpression patterns in 3T3-L1 adipocytes. 3T3-L1 preadipocytes weretransfected by shRNA targeting Agt gene (Agt-shRNA) or scrambled shRNA(Sc-shRNA), and then differentiated into mature adipocytes. Changes inglobal gene expression patterns were profiled by microarray study. Geneswith significant differential expression in 3T3-L1 adipocytes transfectedwith Agt-shRNA vs. Sc-shRNA were determined by the false discovery rate(FDR) adjusted P value < 0.05 (A). Heat map with genes of differentialexpression is shown in (B). The rows represent the patterns of geneexpression, and columns represent samples. Red region corresponds togenes with down-regulated expression, and yellow region corresponds togenes with up-regulated expression, in 3T3-L1 adipocytes transfected withAgt-shRNA vs. Sc-shRNA (n= 4 for each cell line).
genes in the adipogenesis pathways using a PCR array. The resultsconfirmed the lower expression of Agt gene at transcription level,and showed decreased expression of several adipogenic genes,including PPAR-γ, Cebpb, Srebf1 and Adig, and lipid metabolicmarkers Ppargc1b and Fabp4 in 3T3-L1 adipocytes with Agt genesilencing. Conversely, the expression of genes with anti-adipogeniceffects, Gata3, and Vdr, were up-regulated. The expression pattern
of these genes is shown in Figure 5, and the functions of thesegenes are described in Table 3.
DISCUSSIONRecent studies indicated the potential role of adipose tissue-derived Agt in the pathogenesis of metabolic disorders. However,the underlying mechanisms mediating these effects are not wellclarified. In the present study, we successfully established Agt genesilencing in 3T3-L1 adipocytes using shRNA, which effectivelydecreased the intracellular level of Agt and Ang II,and enabled us todirectly investigate the metabolic effects of adipose Agt. Using thisin vitro model, we confirmed the direct contribution of adipocyte-derived Agt and Ang II to preadipocyte differentiation, lipogenesis,and adipocyte inflammation, as evidenced by decreased triglyc-eride accumulation, and pro-inflammatory adipokine production,as well as down-regulated expression of several adipogenic andinflammatory genes.
RAS AND ADIPOSITYThe present study confirmed the effects of Agt/Ang II in promot-ing lipogenesis. Our lab previously reported that Ang II increaseslipogenesis in 3T3-L1 and human adipocytes (Jones et al., 1997b).In line with these findings, we demonstrated in this study thatinactivation of Agt gene significantly reduced the lipid accumu-lation during 3T3-L1 preadipocyte differentiation. This is alsoin agreement with a recent study where shRNA-mediated Agtgene silencing inhibited triglyceride storage during human vis-ceral preadipocyte differentiation (Ye et al., 2010). Indeed, in thesestudies, the expression of Gpd1 gene which encodes glycerol-3-phosphate dehydrogenase 1 was increased in Ang II treated3T3-L1 adipocytes (Jones et al., 1997b) but decreased by knock-down of the Agt gene in human preadipocytes. Consistently, weidentified here that the expression of Gpd1 gene was decreasedin 3T3-L1 adipocytes with Agt gene silencing. In this study, nochange was detected in the gene expression of acetyl-coenzymeA carboxylase or fatty acid synthase, the major enzymes mediat-ing de novo lipogenesis. Therefore, the lower lipid accumulationin 3T3-L1 adipocytes with Agt gene silencing is potentially dueto the decreased synthesis of glycerol by Gpd1 in the processof lipogenesis. It is also possible that Agt gene silencing down-regulates the activity of lipogenic enzymes, and inhibits the denovo lipogenesis in 3T3-L1 adipocytes. Ang II was previouslyshown to inhibit preadipocyte differentiation, which was poten-tially mediated by the AT1 receptor. Similarly, certain AT1 blockersenhanced preadipocyte differentiation in both 3T3-L1 and humanpreadipocytes, and mice with systemic knock-out of AT1a recep-tor showed adipocyte hypotrophy (Janke et al., 2002, 2006; Schuppet al., 2004). However, in this study, we identified that Agt genesilencing inhibited 3T3-L1 preadipocyte differentiation throughdown-regulating the expression of core adipogenic genes (C/EBP-β and PPAR-γ) and other adipogenic markers (Srebf1 and Adig)which mediate the initiation of adipogenesis. Agt gene silencingalso decreased the expression of several lipid metabolic genes(Fabp4 and Ppargc1b). Genes with anti-adipogenic effects (Gata3and Vdr) were also up-regulated in Agt-shRNA transfected cells.These indicated Agt as a critical factor with stimulatory effectson preadipocyte differentiation. We propose that the effect of
www.frontiersin.org March 2013 | Volume 4 | Article 10 | 5

Carroll et al. Angiotensiongen gene silencing in adipocytes
Table 1 | Lipid metabolic genes differentially expressed in 3T3-L1 adipocytes transfected by Agt-shRNA vs. Sc-shRNA.
Gene
symbol
Gene name Fold
change
P value
(FDR adjusted)
Function
Gpd1 Glycerol-3-phosphate dehydrogenase 1 0.34 0.003919 A lipogenic marker, catalyzes the reversible conversion of
dihydroxyacetone phosphate to sn-glycerol-3-phosphate
Ces3 Carboxylesterase 3 0.24 0.000087 Adipocyte lipase, mediates lipolysis
Retsat Retinol saturase 0.63 0.025349 Saturates13-14 double bond of all-trans-retinol to produce
all-trans-13, 14-dihydroretinol
Acad10 Acyl-Coenzyme A dehydrogenase family,
member 10
0.78 0.050300 Catalyzes the initial step of mitochondria fatty acid
β-oxidation
Apoc1 Apolipoprotein C-I 0.48 0.001845 Modulates the interaction of APOE with beta-migrating
VLDL, inhibits the binding of beta-VLDL to LDL
receptor-related protein
Hsd3b7 Hydroxy-delta-5-steroid dehydrogenase, 3
beta-, and steroid delta-isomerase 7
0.80 0.048719 Plays a crucial role in the biosynthesis of hormonal steroids
Suclg1 Succinate-CoA ligase, GDP-forming, alpha
subunit, mitochondrial
0.72 0.037140 An enzyme in tricarboxylic acid cycle, catalyzes ATP- or GTP-
dependent ligation of succinate and CoA to form
succinyl-CoA in mitochondrial matrix
FDR, false discovery rate.
Table 2 | Inflammatory genes differentially expressed in 3T3-L1 adipocytes transfected by Agt-shRNA vs. Sc-shRNA.
Gene
symbol
Gene name Fold
change
P value
(FDR adjusted)
Function
Saa3 Serum amyloid A 3 0.57 0.025314 Major acute phase protein, in response to cytokine
stimulation
Nod1 Nucleotide-binding oligomerization
domain containing 1
0.75 0.029593 Induces NF-κ B activation via RIPK2 and IKK-gamma,
enhances caspase-9-mediated apoptosis
Cxcl12 Chemokine (C-X-C motif) ligand 12 0.38 0.046402 Chemoattractant for T-lymphocytes and monocytes
Ptx3 Pentraxin related gene 0.71 0.033282 Activates classical complement pathway, facilitates
pathogen recognition by immune cells
Stat1 Signal transducer and activator of
transcription 1
0.66 0.029154 A member of signal transducers and activators of
transcription (STATs) family, mediates cytokine signaling
Irf9 Interferon regulatory factor 9 0.64 0.029593 Plays a critical role in stimulating IFN-alpha responsive genes
FDR, false discovery rate.
Ang II on adipogenesis is receptor specific, and dose dependent.Possibly, low to regular levels of Ang II stimulate adipogenesisthrough the AT2 receptor, which overcomes the anti-adipogeniceffect mediated by the AT1 receptor. However, high levels ofAng II could activate the AT1 receptor and inhibit preadipocytedifferentiation.
Our microarray study detected multiple genes associated withadipocyte metabolism which were down-regulated by Agt genesilencing. Retsat (encodes retinol saturase) is induced during3T3-L1 preadipocyte differentiation and promotes adipogenesisthrough increased PPAR-γ transcriptional activity (Schupp et al.,2009).
Ang II is an active mediator of lipolysis in a time-dependentmanner. Short term treatment of Ang II inhibits lipolysis inhuman adipose tissue and adipocytes through the AT1 receptor(Boschmann et al., 2001; Goossens et al., 2004, 2007). However,long term infusion of Ang II markedly increased lipolysis in rats(Cabassi et al., 2005). One explanation for this could be the Ces3gene which encodes for carboxylesterase 3 (triacylglycerol hydro-lase, TGH) – an adipocyte lipase – whose expression was decreasedin 3T3-L1 adipocytes with Agt gene silencing.
Lastly, our microarray and RT-PCR data indicated that Agt genewidely affects the whole process of lipid metabolism in adipocytes.This was seen in the expression of other genes down-regulated by
Frontiers in Endocrinology | Diabetes March 2013 | Volume 4 | Article 10 | 6
Carroll et al. Angiotensiongen gene silencing in adipocytes
FIGURE 4 | Agt gene silencing induces down-regulated expression ofCxcl12, Stat1, Saa3, Nod1, Gpd1, and Acad10 genes in 3T3-L1adipocytes. 3T3-L1 preadipocytes were transfected by shRNA targetingAgt gene (Agt-shRNA) or scrambled shRNA (Sc-shRNA), and thendifferentiated to mature adipocytes. Data are presented as mean±SE, andcalculated according to the 2−∆∆CT method (n=4 for each group).*P < 0.0001 vs. adipocytes transfected by Sc-shRNA.
FIGURE 5 | Agt gene silencing induces changes in the expression ofgenes associated with adipogenesis pathway in 3T3-L1 adipocytes.3T3-L1 preadipocytes were transfected by shRNA targeting Agt gene(Agt-shRNA) or scrambled shRNA (Sc-shRNA), and then differentiated tomature adipocytes. Data are presented as mean±SE, and calculatedaccording to the 2−∆∆CT method (n=4 for each group). *P < 0.05 vs.adipocytes transfected by Sc-shRNA.
Agt gene silencing, such as Acad10, Apoc1, Suclg1, and Hsd3b7,which are involved in lipid transport, β oxidation, TCA cycle, andbiosynthesis of steroid hormones from lipids.
RAS AND INFLAMMATIONWhile it has been established that obesity leads to chronic low-grade inflammation in adipose tissue (Kalupahana and Moustaid-Moussa, 2012a), the exact trigger for this process is unknown.Adipose tissue-secreted Agt has been shown to induce obesity-associated inflammation, a major factor for the pathogenesisof metabolic disorders, and therefore is a potential target forobesity research as described below (Kalupahana and Moustaid-Moussa,2012b). In obesity, adipose tissue-derived Agt significantlyincreases the level of Agt in circulation (Van Harmelen et al.,2000; Boustany et al., 2004; Engeli et al., 2005). Moreover, ourlab and collaborators further showed that adipose-specific Agtover-expression induced local and systemic inflammation, as wellas insulin resistance in mice (Kalupahana et al., 2012).
Previous studies reported that Ang II stimulated the secre-tion of several pro-inflammatory adipokines from both 3T3-L1
and human adipocytes (Skurk et al., 2001, 2004). Consistent withthose studies, we demonstrated here that Agt gene silencing in3T3-L1 adipocytes significantly reduced the intracellular levelof pro-inflammatory adipokines, including MCP-1, IL-6, andTNFα.
In the current research, the microarray study identified thatAgt gene silencing decreased the expression of several genesinvolved in adipose inflammation including Saa3, Nod1, Stat1,and Cxcl12. Saa3, which encodes for the acute phase protein –serum amyloid A3, was recently identified as a critical pro-inflammatory adipokine involved in obesity-associated metabolicdisorders (Yang et al., 2006). A previous study showed that block-ing the AT1 receptor suppressed the mRNA expression of Saa3,together with TNF-a, PAI-1, and MCP-1 in mice adipose tissue(Kurata et al., 2006). The present study further confirmed thatSaa3 as a critical factor involved in Ang II-induced inflammatorydisorders, as silencing of Agt in cultured adipocytes reduced Saa3expression.
Nod1 gene encodes an intracellular pattern recognition recep-tor mediating immune response. The activation of this receptorinduces peripheral and hepatic insulin resistance, which is pre-vented when this gene in inactivated (Schertzer et al., 2011).Activation of NOD1 also increases pro-inflammatory adipokinesecretion and impairs the insulin-stimulated glucose uptake in3T3-L1 and primary murine adipocytes (Schertzer et al., 2011;Zhao et al., 2011). Since Agt silencing reduced NOD1, this suggeststhat Nod1 is a potential mediator for Ang II-induced adipocyteinflammation.
Stat1 is a member in the Stats family – the major compo-nent of Jak-Stat pathway which plays a critical role in mediat-ing cytokine signaling. Jak-Stat pathway mediates the action ofhormones which impact adipocyte development and functions(Richard and Stephens, 2011). Stats mediate the activation of mul-tiple inflammatory pathways, such as NF-κB and c-Jun (O’Sheaet al., 2002). The lowered expression of the Stat1 gene, in part, indi-cates that Agt gene silencing down-regulates the cytokine signalingin 3T3-L1 adipocytes. Interferon regulatory factors (Irfs), whichmainly respond to interferon in the JAK-STAT signaling pathway(O’Shea et al., 2002; Eguchi et al., 2008), could be one avenue of thisdown-regulation. Previous studies reported that IFN-α/β induceda complex formation of STAT1, STAT2, and IRF9, one of the Irfswhich are expressed in adipocytes (Eguchi et al., 2008). Togetherthese indicate that Agt gene silencing induced a consistent changepattern in cytokine signaling pathway (O’Shea et al., 2002; Eguchiet al., 2008).
Several other chemokines were altered by Agt inactivation.These include Cxcl12 and Ptx3. Cxcl12 is mainly expressed in stro-mal cells, but is also detected in 3T3-L1 adipocytes (Choi et al.,2010). This indicates the potential role of this gene in inducingthe immune cells infiltration in adipose tissue. The expressionof Ptx3 gene is up-regulated during preadipocyte differentia-tion, and although almost non-detectable in mature adipocytes,it can be re-activated in 3T3-F442A adipocytes upon TNF-αstimulation (Abderrahim-Ferkoune et al., 2003). The decreasedexpression of Ptx3 gene in 3T3-L1 adipocytes with Agt genesilencing is potentially mediated by decreased adipogenesis andTNF-α (Abderrahim-Ferkoune et al., 2003).
www.frontiersin.org March 2013 | Volume 4 | Article 10 | 7

Carroll et al. Angiotensiongen gene silencing in adipocytes
Table 3 | Genes with differential expression associated with adipogenesis pathway in 3T3-L1 adipocytes transfected by Agt-shRNA vs.
Sc-shRNA.
Gene
symbol
Gene name Fold
change
P value Function
Pparg Peroxisome proliferator activated
receptor gamma
0.4808 0.030656 Key regulator of glucose homeostasis and preadipocyte
differentiation
Cebpb CCAAT/enhancer binding protein
(C/EBP), beta
0.5718 0.038756 Plays a catalytic role in preadipocyte differentiation
Srebf1 Sterol regulatory element binding
transcription factor 1
0.5070 0.008977 Regulates glucose metabolism, fatty acid, and lipid (mainly
cholesterol) synthesis
Adig Adipogenin 0.5619 0.005956 An adipocyte-specific protein, promotes adipocyte
differentiation
Ppargc1b Peroxisome proliferative activated
receptor, gamma, coactivator 1 beta
0.2017 0.045250 Stimulates the activation of transcription factors. Involved in
fat oxidation, and non-oxidative glucose metabolism
Fabp4 Fatty acid binding protein 4 0.4094 0.002358 Adipocytes specific lipid transport protein
Gata3 GATA binding protein 3 2.6291 0.003210 Suppresses preadipocytes differentiation through PPAR-γ
Vdr Vitamin D receptor 1.8460 0.003185 Suppresses preadipocytes differentiation through C/EBP
and PPAR-γ
FIGURE 6 | Proposed mechanisms for Ang II-induced metabolicdisorders. Adipocyte-derived Agt is converted to Ang II which affectsadipocytes in autocrine or paracrine manner through angiotensin receptors.Ang II activates inflammatory pathways, and increases the secretion of
pro-inflammatory adipokines, which inhibit insulin signaling and induce insulinresistance. Ang II also stimulates lipogenesis in adipocytes, leading toadipocyte hypertrophy which potentially activates inflammatory pathways andexacerbates these inflammatory conditions.
Elevated level of RAS components was detected in adipose tis-sue and circulation in obese human subjects and animals (VanHarmelen et al., 2000; Boustany et al., 2004; Engeli et al., 2005).Animal models with systemic deletion of RAS components (Agt,renin,ACE,AT1a, and AT2) were protected from diet-induced obe-sity and metabolic disorders (Massiera et al., 2001b). Transgenicmice with Agt over-expression in adipose tissue exhibit adiposity,adipocyte hypertrophy, adipose and systemic inflammation, and
insulin resistance (Kalupahana et al., 2012). However, mice withAgt gene specifically knock-out from adipose tissue had no changein fat mass or body weight (Yiannikouris et al., 2012). These indi-cate that elevated secretion of Agt from adipose tissue may in partmediate obesity-associated metabolic disorders.
In summary, this study showed that gene silencing inducedlower adipocyte-derived-Agt, which led to decreased lipidaccumulation and pro-inflammatory adipokines production, as
Frontiers in Endocrinology | Diabetes March 2013 | Volume 4 | Article 10 | 8

Carroll et al. Angiotensiongen gene silencing in adipocytes
well as down-regulated expression of adipogenic and lipid meta-bolic markers and genes in inflammatory pathways. The underly-ing mechanism for the metabolic effect of Ang II is summarizedin Figure 6.
ACKNOWLEDGMENTSThis work was supported by the Physician Medical Education andResearch Foundation, The University of Tennessee AgResearch,and The College of Human Sciences/Texas Tech University.
REFERENCESAbderrahim-Ferkoune, A., Bezy, O.,
Chiellini, C., Maffei, M., Grimaldi,P., Bonino, F., et al. (2003). Char-acterization of the long pentraxinPTX3 as a TNFα-induced secretedprotein of adipose cells. J. Lipid Res.44, 994–1000.
Ailhaud, G., Teboul, M., and Massiera,F. (2002). Angiotensinogen,adipocyte differentiation andfat mass enlargement. Curr.Opin. Clin. Nutr. Metab. Care 5,385–389.
Boschmann, M., Ringel, J., Klaus, S., andSharma, A. M. (2001). Metabolicand hemodynamic response of adi-pose tissue to angiotensin II. Obes.Res. 9, 486–491.
Boustany, C. M., Bharadwaj, K., Daugh-erty, A., Brown, D. R., Randall,D. C., and Cassis, L. A. (2004).Activation of the systemic andadipose renin-angiotensin systemin rats with diet-induced obesityand hypertension. Am. J. Physiol.Regul. Integr. Comp. Physiol. 287,R943–R949.
Cabassi, A., Coghi, P., Govoni, P.,Barouhiel, E., Speroni, E., Cavazz-ini, S., et al. (2005). Sympatheticmodulation by carvedilol and losar-tan reduces angiotensin II-mediatedlipolysis in subcutaneous and vis-ceral fat. J. Clin. Endocrinol. Metab.90, 2888–2897.
Choi, S., Kim, J., Yea, K., Suh, P.G., Kim, J., and Ryu, S. H.(2010). Targeted label-free quan-titative analysis of secretory pro-teins from adipocytes in response tooxidative stress. Anal. Biochem. 401,196–202.
Eguchi, J., Yan, Q. W., Schones, D. E.,Kamal, M., Hsu, C. H., Zhang, M.Q., et al. (2008). Interferon regula-tory factors are transcriptional regu-lators of adipogenesis. Cell Metab. 7,86–94.
Engeli, S., Bohnke, J., Gorzelniak,K., Janke, J., Schling, P., Bader,M., et al. (2005). Weight lossand the renin-angiotensin-aldosterone system. Hypertension 45,356–362.
Engeli, S., Negrel, R., and Sharma, A.M. (2000). Physiology and patho-physiology of the adipose tissuerenin-angiotensin system. Hyperten-sion 35, 1270–1277.
Galvez-Prieto, B., Bolbrinker, J., Stuc-chi, P., de Las Heras, A. I.,
Merino, B., Arribas, S., et al. (2008).Comparative expression analysisof the renin-angiotensin systemcomponents between white andbrown perivascular adipose tissue. J.Endocrinol. 197, 55–64.
Goossens, G. H., Blaak, E. E., Arner, P.,Saris, W. H., and van Baak, M. A.(2007). Angiotensin II: a hormonethat affects lipid metabolism in adi-pose tissue. Int. J. Obes. (Lond.) 31,382–384.
Goossens, G. H., Blaak, E. E., Saris,W. H. M., and van Baak, M.A. (2004). Angiotensin II-inducedeffects on adipose and skeletal mus-cle tissue blood flow and lipolysisin normal-weight and obese sub-jects. J. Clin. Endocrinol. Metab. 89,2690–2696.
Janke, J., Engeli, S., Gorzelniak, K.,Luft, F. C., and Sharma, A. M.(2002). Mature adipocytes inhibitin vitro differentiation of humanpreadipocytes via angiotensintype 1 receptors. Diabetes 51,1699–1707.
Janke, J., Schupp, M., Engeli, S.,Gorzelniak, K., Boschmann,M., Sauma, L., et al. (2006).Angiotensin type 1 receptor antag-onists induce human in-vitroadipogenesis through peroxisomeproliferator-activated receptor-gamma activation. J. Hypertens. 24,1809–1816.
Jones, B. H., Standridge, M. K., Tay-lor, J. W., Moustaïd, N. (1997a).Angiotensinogen gene expression inadipose tissue: analysis of obesemodels and hormonal and nutri-tional control. Am. J. Physiol. 273(1Pt 2): R236–R242.
Jones, B. H., Standridge, M. K.,and Moustaid, N. (1997b).Angiotensin II increases lipo-genesis in 3T3-L1 and humanadipose cells. Endocrinology 138,1512–1519.
Kalupahana, N. S., Massiera, F.,Quignard-Boulange, A., Ailhaud,G., Voy, B. H., Wasserman, D. H.,et al. (2012). Overproduction ofangiotensinogen from adipose tis-sue induces adipose inflammation,glucose intolerance, and insulinresistance. Obesity (Silver Spring)20, 48–56.
Kalupahana, N. S., and Moustaid-Moussa, N. (2012a). Therenin-angiotensin system: a linkbetween obesity, inflammation and
insulin resistance. Obes. Rev. 13,136–149.
Kalupahana, N. S., and Moustaid-Moussa, N. (2012b). The adiposetissue renin-angiotensin sys-tem and metabolic disorders: areview of molecular mechanisms.Crit. Rev. Biochem. Mol. Biol. 47,379–390.
Karlsson, C., Lindell, K., Ottosson, M.,Sjostrom, L., Carlsson, B., and Carls-son, L. M. (1998). Human adi-pose tissue expresses angiotensino-gen and enzymes required for itsconversion to angiotensin II. J. Clin.Endocrinol. Metab. 83, 3925–3929.
Kim, S., Urs, S., Massiera, F., Wort-man, P., Joshi, R., Heo, Y. R.,et al. (2002). Effects of high-fatdiet, angiotensinogen (agt) geneinactivation, and targeted expressionto adipose tissue on lipid metab-olism and renal gene expression.Horm. Metab. Res. 34, 721–725.
Kurata, A., Nishizawa, H., Kihara, S.,Maeda, N., Sonoda, M., Okada, T., etal. (2006). Blockade of AngiotensinII type-1 receptor reduces oxidativestress in adipose tissue and amelio-rates adipocytokine dysregulation.Kidney Int. 70, 1717–1724.
Massiera, F., Bloch-Faure, M., Ceiler,D., Murakami, K., Fukamizu, A.,Gasc, J. M., et al. (2001a). Adi-pose angiotensinogen is involved inadipose tissue growth and bloodpressure regulation. FASEB J. 15,2727–2729.
Massiera, F., Seydoux, J., Geloen,A., Quignard-Boulange, A., Tur-ban, S., Saint-Marc, P., et al.(2001b). Angiotensinogen-deficientmice exhibit impairment of diet-induced weight gain with alter-ation in adipose tissue developmentand increased locomotor activity.Endocrinology 142, 5220–5225.
O’Shea, J. J., Gadina, M., and Schreiber,R. D. (2002). Cytokine signaling in2002: new surprises in the jak/statpathway. Cell 109 (Suppl. 1), S121–S131.
Ouchi, N., Parker, J. L., Lugus, J. J.,and Walsh, K. (2011). Adipokinesin inflammation and metabolic dis-ease. Nat. Rev. Immunol. 11, 85–97.
Pollare, T., Lithell, H., and Berne, C.(1989). A comparison of the effectsof hydrochlorothiazide and capto-pril on glucose and lipid metabo-lism in patients with hypertension.N. Engl. J. Med. 321, 868–873.
Richard, A. J., and Stephens, J.M. (2011). Emerging roles ofJAK–STAT signaling pathwaysin adipocytes. Trends Endocrinol.Metab. 22, 325–332.
Schertzer, J. D., Tamrakar, A. K., Mag-alhaes, J. G., Pereira, S., Bilan, P.J., Fullerton, M. D., et al. (2011).NOD1 activators link innate immu-nity to insulin resistance. Diabetes60, 2206–2215.
Schupp, M., Janke, J., Clasen, R.,Unger, T., and Kintscher, U.(2004). Angiotensin type 1 recep-tor blockers induce peroxisomeproliferator-activated receptor-gamma activity. Circulation 109,2054–2057.
Schupp, M., Lefterova, M. I., Janke,J., Leitner, K., Cristancho, A. G.,Mullican, S. E., et al. (2009). Retinolsaturase promotes adipogenesisand is downregulated in obesity.Proc. Natl. Acad. Sci. U.S.A. 106,1105–1110.
Siriwardhana, N., Kalupahana, N. S.,Fletcher, S., Xin, W., Claycombe,K. J., Quignard-Boulange, A., et al.(2012). n-3 and n-6 polyunsatu-rated fatty acids differentially reg-ulate adipose angiotensinogen andother inflammatory adipokines inpart via NF-κB-dependent mech-anisms. J. Nutr. Biochem. 23,1661–1667.
Skurk, T., Lee, Y. M., and Hauner,H. (2001). Angiotensin II and itsmetabolites stimulate PAI-1 proteinrelease from human adipocytes inprimary culture. Hypertension 37,1336–1340.
Skurk, T., van Harmelen, V., andHauner, H. (2004). Angiotensin IIstimulates the release of interleukin-6 and interleukin-8 from culturedhuman adipocytes by activationof NF-kappaB. Arterioscler. Thromb.Vasc. Biol. 24, 1199–1203.
Van Harmelen, V., Ariapart, P., Hoffst-edt, J., Lundkvist, I., Bringman, S.,and Arner, P. (2000). Increased adi-pose angiotensinogen gene expres-sion in human obesity. Obes. Res. 8,337–341.
Yang, R. Z., Lee, M. J., Hu, H.,Pollin, T. I., Ryan, A. S., Nick-las, B. J., et al. (2006). Acute-phaseserum amyloid a: an inflamma-tory adipokine and potential linkbetween obesity and its metaboliccomplications. PLoS Med. 3:e287.doi:10.1371/journal.pmed.0030287
www.frontiersin.org March 2013 | Volume 4 | Article 10 | 9

Carroll et al. Angiotensiongen gene silencing in adipocytes
Ye, Z. W., Wu, X. M., and Jiang,J. G. (2010). Knockdown ofangiotensinogen by shRNA-mediated RNA interference inhibitshuman visceral preadipocytes dif-ferentiation. Int. J. Obes. (Lond.) 34,157–164.
Yiannikouris, F., Karounos, M.,Charnigo, R., English, V. L., Rateri,D. L., Daugherty, A., et al. (2012).Adipocyte-specific deficiency ofangiotensinogen decreases plasmaangiotensinogen concentration andsystolic blood pressure in mice.Am. J. Physiol. Regul. Integr. Comp.Physiol. 302, R244–R251.
Yvan-Charvet, L., Massiera, F.,Lamande, N., Ailhaud, G., Teboul,M., Moustaid-Moussa, N., et al.(2009). Deficiency of angiotensintype 2 receptor rescues obesitybut not hypertension induced byoverexpression of angiotensinogenin adipose tissue. Endocrinology 150,1421–1428.
Zhao, L., Hu, P., Zhou, Y., Purohit, J.S., and Hwang, D. H. (2011). NOD1activation induces proinflammatorygene expression and insulin resis-tance in 3T3-L1 adipocytes. Am.J. Physiol. Endocrinol. Metab. 301,E587–E598.
Conflict of Interest Statement: Theauthors declare that the research wasconducted in the absence of anycommercial or financial relationshipsthat could be construed as a potentialconflict of interest.
Received: 17 November 2012; accepted:28 January 2013; published online: 11March 2013.Citation: Carroll WX, Kalupahana NS,Booker SL, Siriwardhana N, LeMieuxM, Saxton AM and Moustaid-MoussaN (2013) Angiotensinogen gene silencingreduces markers of lipid accumula-tion and inflammation in cultured
adipocytes. Front. Endocrinol. 4:10.doi:10.3389/fendo.2013.00010This article was submitted to Frontiersin Diabetes, a specialty of Frontiers inEndocrinology.Copyright © 2013 Carroll, Kalupahana,Booker, Siriwardhana, LeMieux, Saxtonand Moustaid-Moussa. This is an open-access article distributed under the termsof the Creative Commons AttributionLicense, which permits use, distributionand reproduction in other forums, pro-vided the original authors and sourceare credited and subject to any copy-right notices concerning any third-partygraphics etc.
Frontiers in Endocrinology | Diabetes March 2013 | Volume 4 | Article 10 | 10
Carroll et al. Angiotensiongen gene silencing in adipocytes
APPENDIX
Table A1 | Genes differentially expressed in 3T3-L1 adipocytes transfected with Agt-shRNA vs. Sc-shRNA.
Gene symbol Gene name Fold change P value
(FDR adjusted)
ENERGY METABOLIC PROCESS
Por P450 (cytochrome) oxidoreductase 0.613868 0.004184
Aldh2 Aldehyde dehydrogenase 2, mitochondrial 0.656561 0.022585
Cdo1 Cysteine dioxygenase 1, cytosolic 1.806253 0.041216
Cyb561 Cytochrome b-561 0.661127 0.029593
Idh3g Isocitrate dehydrogenase 3 (NAD+), gamma 0.65022 0.021874
Hibadh 3-hydroxyisobutyrate dehydrogenase 0.729005 0.033282
Phgdh Phosphoglycerate dehydrogenase 0.688725 0.035963
gm2a GM2 ganglioside activator protein 0.511569 0.029154
AU018778 Expressed sequence AU018778 (type-B carboxylesterase/lipase) 0.439825 0.000356
Atp6ap1 ATPase, H+ transporting, lysosomal accessory protein 1 0.666187 0.031342
Acaa1b Acetyl-Coenzyme A acyltransferase 1B 0.627201 0.031219
Adhfe1 Alcohol dehydrogenase, iron containing, 1 0.669428 0.029465
Gpt Glutamic pyruvic transaminase, soluble 0.482968 0.014529
Gsta4 Glutathione S-transferase, alpha 4 0.541488 0.025158
Gstm2 Glutathione S-transferase, mu 2 0.71847 0.008982
Cox8b Cytochrome c oxidase, subunit VIIIb 0.32511 0.003044
Cox6c Cytochrome c oxidase subunit Vic 2.011121 0.022585
IMMUNE RESPONSETO EXTRACELLULAR STIMULUS
C4b Complement component 4B 0.6 0.041924
B2m Beta-2 microglobulin 0.717475 0.0322
Tap2 Transporter 2, ATP-binding cassette, sub-family B 0.634635 0.043325
Igtp Interferon gamma induced GTPase 0.533293 0.031471
Ifit3 Interferon-induced protein with tetratricopeptide repeats 3 0.198333 0.031219
Cd99l2 CD99 antigen-like 2 0.647073 0.043325
RESPONSETO HORMONE STIMULUS
Serpina3c Serine peptidase inhibitor, clade A, member 3C 0.712025 0.045332
Serpina3g Serine peptidase inhibitor, clade A, member 3G 0.388773 0.001845
Serpina3h Serine peptidase inhibitor, clade A, member 3H 0.494143 0.013389
Serpina3n Serine peptidase inhibitor, clade A, member 3N 0.505226 0.000321
SMALL GTPASE MEDIATED SIGNALTRANSDUCTION
Rasl11a RAS-like, family 11, member A 0.674084 0.019568
Rasl11b RAS-like, family 11, member B 0.573156 0.001066
Rab3d RAB3D, member RAS oncogene family 0.72951 0.034662
Rhob Ras homolog gene family, member B 1.666706 0.040915
Rhoj Ras homolog gene family, member J 0.691116 0.031471
OTHER GENES OF INTEREST
Aatk Apoptosis-associated tyrosine kinase 0.564091 0.022585
Renbp Renin binding protein 0.643495 0.031471
Aqp7 Aquaporin 7 0.565265 0.003405
Bmp1 Bone morphogenetic protein 1 0.634635 0.034934
Bst2 Bone marrow stromal cell antigen 2 0.334250 0.013389
Cenpa Centromere protein A 1.455989 0.022585
Dbp D site of albumin promoter binding protein 0.645728 0.043573
Enpp5 Ectonucleotide pyrophosphatase/phosphodiesterase 5 0.732550 0.0322
Fhod1 Formin homology 2 domain containing 1 1.371733 0.041924
Fkbp5 FK506 binding protein 5 1.215879 0.036674
Gas6 Growth arrest-specific 6 0.468785 0.037595
(Continued)
www.frontiersin.org March 2013 | Volume 4 | Article 10 | 11

Carroll et al. Angiotensiongen gene silencing in adipocytes
Table A1 | Continued
Gene symbol Gene name Fold change P value
(FDR adjusted)
Gatad1 GATA zinc finger domain containing 1 1.747145 0.003405
Gtf3c5 General transcription factor IIIC, polypeptide 5 1.264003 0.0322
Hist1h2ah Histone cluster 1, H2ah 1.634670 0.040326
Hp Haptoglobin 0.657015 0.030981
Hspb8 Heat shock 22kDa protein 8 0.668963 0.022585
Ifi27 Interferon, alpha-inducible protein 27 0.309497 0.03069
Ift20 Intraflagellar transport 20 homolog 1.485552 0.031471
Itih4 Inter-alpha (globulin) inhibitor H4 0.243332 0.000025
Klc1 Kinesin light chain 1 1.278985 0.035963
Matn4 Matrilin 4 0.641712 0.031471
Mettl7B Methyltransferase like 7B 0.704660 0.048333
Mid1ip1 MID1 interacting protein 1 0.720464 0.045125
Mpp1 Membrane protein, palmitoylated 1, 55kDa 0.744322 0.041924
Nasp Nuclear autoantigenic sperm protein (histone-binding) 1.336074 0.048719
Nup107 Nucleoporin 107kDa 0.657927 0.029465
Pde1b Phosphodiesterase 1B, calmodulin-dependent 1.522033 0.013389
Pde4dip Phosphodiesterase 4D interacting protein 0.654289 0.038052
Prelp Proline/arginine-rich end leucine-rich repeat protein 0.677362 0.034934
Psmc5 Proteasome (prosome, macropain) 26S subunit, ATPase, 5 1.387030 0.029465
Pxmp2 Peroxisomal membrane protein 2, 22 kDa 0.660669 0.033282
Rdbp RD RNA binding protein 1.263127 0.045125
Rps24 Ribosomal protein S24 1.791291 0.022585
S100A13 S100 calcium binding protein A13 1.580082 0.022585
Aimp1 AminoacyltRNAsynthetase complex-interacting multifunctional protein 1 1.354724 0.025849
Slc5a6 Solute carrier family 5 (sodium-dependent vitamin transporter), member 6 0.756283 0.048936
Thrsp Thyroid hormone responsive 0.264621 0.001714
Tk1 Thymidine kinase 1, soluble 1.629015 0.022786
Tmed4 Transmembrane emp24 protein transport domain containing 4 0.777007 0.045125
Tmem43 Transmembrane protein 43 0.637722 0.022585
Tmem45B Transmembrane protein 45B 0.718470 0.041924
Tpm2 Tropomyosin 2 (beta) 1.418140 0.041924
Trafd1 Traf-type zinc finger domain containing 1 0.692074 0.004184
Uba7 Ubiquitin-like modifier activating enzyme 7 0.668037 0.048719
Uck2 Uridine-cytidine kinase 2 1.286097 0.019568
Uhrf1 Ubiquitin-like with PHD and ring finger domains 1 1.420107 0.043072
Usp18 Ubiquitin specific peptidase 18 0.238489 0.029154
Yeats4 YEATS domain containing 4 0.503128 0.019128
Frontiers in Endocrinology | Diabetes March 2013 | Volume 4 | Article 10 | 12
Copyright © 2022 FDOKUMEN