Analyzing the Factors Influencing the Demand and Supply of ...
23
ADBI Working Paper Series ANALYZING THE FACTORS INFLUENCING THE DEMAND AND SUPPLY OF SOLAR MODULES IN JAPAN Farhad Taghizadeh-Hesary, Naoyuki Yoshino, Yugo Inagaki, and Peter J. Morgan No. 1084 March 2020 Asian Development Bank Institute
-
Upload
khangminh22 -
Category
Documents
-
view
0 -
download
0
Transcript of Analyzing the Factors Influencing the Demand and Supply of ...
ADBI Working Paper Series
ANALYZING THE FACTORS INFLUENCING THE DEMAND AND SUPPLY OF SOLAR MODULES IN JAPAN
Farhad Taghizadeh-Hesary, Naoyuki Yoshino, Yugo Inagaki, and Peter J. Morgan
No. 1084 March 2020
Asian Development Bank Institute
The Working Paper series is a continuation of the formerly named Discussion Paper series; the numbering of the papers continued without interruption or change. ADBI’s working papers reflect initial ideas on a topic and are posted online for discussion. Some working papers may develop into other forms of publication.
Suggested citation:
Taghizadeh-Hesary, F., N. Yoshino, Y. Inagaki, and P. J. Morgan. 2020. Analyzing the Factors Influencing the Demand and Supply of Solar Modules in Japan. ADBI Working Paper 1084. Tokyo: Asian Development Bank Institute. Available: https://www.adb.org/publications/analyzing-factors-influencing-demand-supply-solar-modules-japan Please contact the authors for information about this paper.
Email: [email protected]; [email protected]
Farhad Taghizadeh-Hesary is an associate professor of economics at Tokai University, Japan. Naoyuki Yoshino is dean and chief executive officer of the Asian Development Bank Institute and professor emeritus of Keio University, Japan. Yugo Inagaki is a graduate of Keio University, Japan. Peter J. Morgan is senior consulting economist and vice chair for research at the Asian Development Bank Institute, Japan. The views expressed in this paper are the views of the author and do not necessarily reflect the views or policies of ADBI, ADB, its Board of Directors, or the governments they represent. ADBI does not guarantee the accuracy of the data included in this paper and accepts no responsibility for any consequences of their use. Terminology used may not necessarily be consistent with ADB official terms. Working papers are subject to formal revision and correction before they are finalized and considered published.
Asian Development Bank Institute Kasumigaseki Building, 8th Floor 3-2-5 Kasumigaseki, Chiyoda-ku Tokyo 100-6008, Japan Tel: +81-3-3593-5500 Fax: +81-3-3593-5571 URL: www.adbi.org E-mail: [email protected] © 2020 Asian Development Bank Institute
ADBI Working Paper 1084 F. Taghizadeh-Hesary et al.
Abstract Ever since the occurrence of the first oil shock, which struck the Japanese economy in 1973, Japan has made efforts to increase its energy efficiency, reduce its energy intensity, decrease its dependence on fossil fuels, and diversify its energy basket by introducing alternative energy sources, such as renewable energy, to raise the energy security level. One key technology that has partially supported this change is solar photovoltaic technology. Japan was one of the leading countries in the solar photovoltaic market, with the third-highest number of solar modules installed in the world. However, its development in the solar module sector in recent years, since the tremendous increase in solar module installation after the feed-in tariff policy, has become sluggish. For Japan to put itself back on track, it must find a new strategy to increase its solar module installation and raise its self-sufficiency ratio in the primary energy supply. This paper analyzes the influence of certain factors on the demand and supply of solar modules by employing the fully modified ordinary least squares method using Japanese data. The paper concludes that finance is a key issue in solar module development and that the country needs to put effort into green financing to maintain its progress in solar photovoltaic technology. Keywords: solar module, photovoltaic, renewable energy, green finance JEL Classification: Q21, Q41, O3

ADBI Working Paper 1084 F. Taghizadeh-Hesary et al.
Contents 1. INTRODUCTION ......................................................................................................... 1
2. LITERATURE SURVEY .............................................................................................. 2
2.1 Price Competitiveness of Solar Electricity ....................................................... 3 2.2 GDP and Renewable Energy .......................................................................... 4 2.3 Oil Prices and Renewable Technology............................................................ 4 2.4 Effects of the FIT Policy on Solar Modules ...................................................... 4 2.5 Financing and Solar PV Technology ............................................................... 5 2.6 Influence of Silicon Prices on Solar Modules’ Prices ....................................... 5 2.7 Influence of R&D on Solar Modules’ Prices..................................................... 5
3. THEORETICAL MODEL ............................................................................................. 6
3.1 Demand Side ................................................................................................... 6 3.2 Supply Side ..................................................................................................... 7
4. EMPIRICAL ANALYSIS ............................................................................................ 10
4.1 Test Procedures ............................................................................................ 10 4.2 Test Results .................................................................................................. 11 4.3 Regression Results ....................................................................................... 12
5. CONCLUDING REMARKS AND POLICY RECOMMENDATION ............................. 14
5.1 Policy Recommendation ................................................................................ 14
REFERENCES ..................................................................................................................... 16

ADBI Working Paper 1084 F. Taghizadeh-Hesary et al.
1
1. INTRODUCTION Due to a scarcity of resources, Japan has been dependent on fossil fuels. For this reason, the Japanese economy took a direct hit from the 1970s’ oil shocks. Since crude oil has been a vital energy commodity, fueling the world economy, several studies (see, inter alia, Hamilton 1983; Barsky and Kilian 2004; Taghizadeh-Hesary et al. 2013, 2016) have evaluated the impacts of oil price fluctuations on various macroeconomic indicators. In addition, in March 2011, a devastating earthquake and tsunami struck eastern Japan and damaged the nuclear power plant at Fukushima, resulting in a nuclear shutdown throughout the whole country. Due to the lack of safety and people’s opposition to nuclear power, the government kept the nuclear power plants off and substituted the nuclear power lost with more imported fossil fuels, which reduced the self-sufficiency of energy in the country. Taghizadeh-Hesary, Rasoulinezhad, and Kobayashi (2016), in an empirical analysis, found that, after the Fukushima disaster, because of the greater reliance on oil imports, the sensitivity of most sectors to oil price volatility declined, endangering the energy security in the country.
Figure 1: Cumulative Capacity of Solar Photovoltaics in Japan from 1992 to 2017 (MW)
Note: Created by the authors using data collected from the Global Market Outlook for Solar Power 2016–2020, 2015–2019, and 2014–2018 and the Snapshot of Global PV 1992–2014.
After the Fukushima disaster, Japan’s energy self-sufficiency fell from a high of 20.2% in 2010 to 6.4% in 2014 (METI2016). At the same time, this incident engendered an opportunity for the renewable energy (RE) sector. The share of renewable energy in the generation mix rose from 9% in 2010 to 12% in 2014. Japan’s Ministry of Economy, Trade and Industry (METI) set several objectives for its energy generation mix by 2030. It set targets for fossil fuels’ share to decrease to 56% and nuclear energy to restart and to account for 20% to 22%. The RE source objectives are ambitious, set to reach 22%–24% by 2030, with hydropower accounting for 8.8%–9.2%, solar 7%, wind 1.6%, biomass 3.7%–4.6%, and geothermal 1.0%–1.1% (JOGMEC 2018). Japan has experienced significant growth in the renewable energy sector, specifically in the solar photovoltaic area. The changes in the total amount of solar photovoltaics installed in Japan are shown in Figure 1. In the past 5 years, the amount of solar photovoltaics installed has grown tenfold. Driving this growth is the change in the global price of solar modules. In the past 5 years, the unit price of solar modules has fallen by half its original price.

ADBI Working Paper 1084 F. Taghizadeh-Hesary et al.
2
In addition, Japan has witnessed tremendous growth in its installations since 2012, the year when it implemented the feed-in tariff (FIT) policy. The FIT policy is a policy that allows electricity generators to sell renewable energy at a fixed price to the grid. The government’s aim was to encourage renewable electricity generation. Its expectation was for the learning curve to help cut the production cost of solar modules through increased production. The FIT policy was successful in terms of introducing the use of solar modules. However, the growth in the production of solar modules in recent years has started to diminish. To be able to increase the self-sufficiency of energy and raise the share of renewable and clean energy in the energy basket, Japan needs to implement new plans to keep the installed solar projects perdurable even without the existence of the FIT. The aim of this paper is to understand further the structure of the solar module market in Japan by assessing the factors that determine the demand and supply sides of the solar module market. The goal is to offer an effective policy recommendation to make the renewable energy sector of the country sustainable. Section 2 provides the results of a literature review in an effort to understand the past research on the drivers influencing the solar module market. We reconfirm the importance of providing a structural demand and supply model for solar modules using economic variables. In section 3, we construct an original model of the solar module supply and demand. Our solar module model takes into account the impact of solar module prices, the price of oil (substitute energy), the GDP (economic activity), the exchange rate, and the FIT as explanatory variables on the demand side. On the supply side, our model has solar module prices, the price of silicon, the GDP, the real interest rate, and the exchange rate as explanatory variables. Section 4 presents the results of the econometric analysis that we conduct on our structural model. Section 5 provides the concluding remarks and the policy recommendations.
2. LITERATURE SURVEY The market structure of the solar module plays an important role in finding a solution to accelerate the development in the solar power infrastructure. One main market factor that has been the key in this field of study is the price of solar modules. Originally, the high price of solar modules acted as a barrier, preventing countries from investing in solar photovoltaic technology. The high price of solar modules reduces the rate of return on investment in solar power projects; therefore, the private sector shows reluctance to invest in these projects (Yoshino, Taghizadeh-Hesary, and Nakahigashi 2019). Therefore, the drivers influencing solar module prices have become a hot topic in the field of renewable energy studies. One of the most common methods of evaluating the tendency of solar module price change is to analyze the learning curve effect of solar modules. The learning curve effect refers to the tendency in the manufacturing industry to optimize the manufacturing process over time by considering the decrease in the price of products as cumulative production rises. The solar energy policies in Japan are based on the estimated future price of solar modules by taking into account the learning curve. Researchers have created several learning curve models to explain better the cost reduction process in solar modules. Numerous learning curve models have emerged in the field of renewable energy. The research by Neij (1997) indicated that learning curves are applicable to solar PV technology. Messener (1997) later created one of the first learning curve models applicable to renewable energy. This model became the basis for many renewable energy cost studies, such as the study by Barreto et al. (2000), which created the commonly known renewable learning curve model called the ERIS (Energy Research and Investment Strategy). However, the learning curve effect is only a tendency in the manufacturing price, which is the sum of numerous factors, such as the
ADBI Working Paper 1084 F. Taghizadeh-Hesary et al.
3
wage rate and the material price. Nemet (2006) concluded that the actual effect of the learning curve is less than 10% of the overall cost reduction. In another group of studies that considered various determining factors for the price of solar modules, Pillai (2014) created a model explaining the cost reduction of solar modules using independent variables such as the time, polysilicon price, plant size, and firm investment. De la Tour, Glachant, and Ménière (2013) used a similar model to predict the solar module price from 2011 to 2020. They identified an experience curve model using cumulative production, R&D expenditure, the silicon price, and the silver price as independent variables. These studies concentrated on the change in the solar module price from the engineer’s perspective. Several researchers have expanded their scope to include the influence of certain factors on the demand side of the solar module market. Gan and Li (2015) conducted a quantitative study on the long-term global solar photovoltaic market using the learning curve model. They took into account the influence of the silicon price, the influx of lower-cost Chinese modules, and the supply–demand gap in the PV market to explain the recent cost reduction and to forecast the future decline in solar module prices. Taghizadeh-Hesary, Yoshino, and Inagaki (2019) used an oligopolistic model and econometric method to determine the economic factors that have an influence on solar module prices by employing a reduced-form model for the top solar module suppliers, namely the People’s Republic of China (PRC), Germany, Japan, the Republic of Korea, and the United States (US). Their empirical results showed that the interest rate (cost of capital) has a positive correlation with solar module prices, while the exchange rate, knowledge stock, and oil price have a negative association with solar module prices on average. Although a large number of studies have deconstructed the dynamics of the solar module price, no research has analyzed the influence of certain factors on the solar module supply and demand separately using a structural model. Earlier research on the solar module market has provided insights into the impact of different factors on solar module prices. To understand better the influence that various economic and non-economic factors have on solar module prices, it is also necessary to examine the changes in the solar module demand and supply. This is the contribution of this paper to the literature: to develop a structural model to identify the determining factors of the demand and supply of solar modules.
2.1 Price Competitiveness of Solar Electricity
The price reduction surrounding the installation of solar photovoltaic systems has been tremendous. According to Lazard (2017), the unsubsidized leveled cost of electricity (LCOE) of utility-scale solar photovoltaic systems in November 2017 was $43/Mwh, whereas conventional energy sources, such as coal, IGCC, gas peaking, and nuclear, had an LCOE of $60/Mwh, $96/Mwh, $156/Mwh, and $112/Mwh, respectively. Figures show that solar PV technology has become cheaper than conventional electricity sources in recent years. A report by IRENA (2017), which calculated the global-averaged LCOE in the years 2010 and 2017, showed that the reduction in solar PV module and system costs drove the decline in utility-scale solar PV projects.
ADBI Working Paper 1084 F. Taghizadeh-Hesary et al.
4
2.2 GDP and Renewable Energy
The GDP influences the demand side of the solar module industry. It affects solar modules by promoting an increase in renewable energy consumption. Studies have shown that countries with a higher GDP tend to consume more electricity. Kantar and Keskin (2013) found that there is a strong relationship between electricity consumption and economic growth regardless of a country’s income level. As a country progresses economically, the amount of electricity grows. This is because it is possible to understand the GDP as a scale for the volume of economic activity within a country. Therefore, countries with a higher GDP are more likely to consume a larger amount of electricity due to corporate activity. Especially for countries such as Japan, which has scarce energy resources, the demand specifically for renewable electricity skyrockets to meet the increasing domestic demand for electricity without importing exhaustible resources from foreign countries.
2.3 Oil Prices and Renewable Technology
There are two ways in which oil prices influence renewable energy. First, oil, a fossil fuel with a high level of greenhouse gas (GHG) emissions, acts as a substitute for renewable energy. Therefore, with a rise in the oil price, a country’s demand for renewable technology will increase to substitute oil with renewable energy. For countries such as Japan, which has scarce energy resources and imports most of its energy in the form of fossil fuels from abroad, the influence of an oil price increase on the demand for renewable energy technology is significant. Another way in which oil prices influence renewable energy is through its influence on renewable R&D. Cheon and Urpelainen (2012) conducted an empirical analysis on how oil prices influence renewable energy development. Their analysis showed that an increase in oil prices increases countries’ incentives to invest more in renewable energy technology. Similarly, Wong, Chia, and Chang (2013 found that oil prices and renewable R&D show a positive correlation. Therefore, oil prices influence both the supply and the demand side of the solar module market as a substitute good for solar modules and as a key driver of renewable R&D.
2.4 Effects of the FIT Policy on Solar Modules
The FIT allows electricity generators to sell their renewable electricity to consumers at a fixed price. The purpose of this policy is to reduce the risk of investment in renewable energy technology to promote the incentive to invest in them. The implementation of the FIT in the early stage of renewable energy installation allows for a cost reduction in renewable energy equipment through the learning curve effect, eventually leading to competitiveness of renewable energy technology in the energy market. Japan first implemented this policy in 2012. Following the implementation of the FIT, the generation cost of solar PV dropped by 38% by the fifth year of implementation and the solar module installation grew to double the original amount, which suggests that the FIT has a correlation with solar module infrastructure in the short term (REI 2017). Moreover, the number of corporations involved in solar PV, seeking a profit, has risen since the implementation of the FIT (REI 2017). The impact of the FIT on solar module production mainly occurs through the stimulation of the demand side. The FIT policy raises the demand for solar modules.
ADBI Working Paper 1084 F. Taghizadeh-Hesary et al.
5
2.5 Financing and Solar PV Technology
Solar electricity-related industries, like other renewable sources, tend to be capital intensive. One of the key characteristics of the solar electricity system is that the capital expenditure (CAPEX) tends to be high, involving a tremendous amount of funding. Solar PV installation usually takes place on a large scale to maximize efficiency through economies of scale. Therefore, past research has discussed the influence of the interest rate on renewable energy development (Taghizadeh-Hesary and Yoshino, 2019). Brunnschweiler (2009) investigated the influence of renewable energy finance on renewable energy electricity generation. The analysis results showed that countries with financial development tend to generate a larger quantity of green electricity. Brunnschweiler (2009) continued by stating that enhancing the renewable financing channel is essential for the renewable industry to develop. The econometric analysis by Taghizadeh-Hesary, Yoshino, and Inagaki (2019) supported this statement. Their analysis results showed that the interest rate has a significant impact on the solar module price. The Council on Economic Policies (CEP) analyzed the influence of a low interest rate on renewable energy technology (Monnin 2015). The research results indicated that the interest rate has a significant impact on green energy technology costs. According to Sachs et al. (2019), for the development of renewable energy projects and the achievement of the Sustainable Development Goals, which are related to the environment and clean energy, it is necessary to scale financing through new financial instruments known as “green finance.”
2.6 Influence of Silicon Prices on Solar Modules’ Prices
One of the main components of solar modules is polysilicon. The manufacturing process of solar modules involves first processing polysilicon into silicon ingots, then slicing the ingots into silicon wafers and putting them together to form a solar cell for integration into solar modules. Pillai (2014) concluded that the price of silicon partly drove the price changes in solar panels from 2005 to 2012, which suggests that the influence of the silicon price on the solar module price is vital. Pillai’s analysis results suggested that a 1% drop in the silicon price results in approximately a 0.9% drop in the solar module price. Japan does not have a domestic source of silicon; therefore, it must rely on its neighboring country, the PRC. Thus, the exchange rate of Chinese yuan and Japanese yen will have an influence on the production cost as well. Moreover, there are exportations between every manufacturing process, because the production plants tend to disperse to minimize the cost through the use of cheap labor in Southeast Asia. Therefore, exchange rate fluctuations influence the solar module price not only for importing the main raw material but also for importing and exporting the parts and equipment in the solar module supply chain.
2.7 Influence of R&D on Solar Modules’ Prices
Nemet (2006) emphasized that, for the solar module industry to prosper, a vast amount of knowledge accumulation must occur through factors such as investment and R&D expenditure. These investments not only increase energy conversion efficiency but also act as one of the most important drivers of cost reduction for solar modules. Many researchers have conducted empirical analyses of the influence of R&D expenditure on the solar module price (Barreto and Kypreos 2004; De la Tour, Glachant, and Ménière 2013; Miketa and Schrattenholzer 2004). In an empirical analysis, Taghizadeh-Hesary, Yoshino, and Inagaki (2019) found that, while R&D expenditure had a statistically significant impact on the solar module price in countries such as the PRC, the Republic
ADBI Working Paper 1084 F. Taghizadeh-Hesary et al.
6
of Korea, and the United States, it did not have a significant impact on the solar module price in Japan. This is because the objective of R&D projects is not always to reduce costs. In the case of Japan, R&D mainly aims to cope with the strict domestic environmental regulation rather than accelerating the cost efficiency. Similarly, the research by Hayamizu, Furubayashi, and Nakata (2014) indicated that public R&D projects do not have as much influence on solar module prices as private R&D expenditures, because public R&D projects usually aim to develop a certain function of solar modules rather than to optimize the manufacturing process.
3. THEORETICAL MODEL 3.1 Demand Side
From 1 April 2016, full liberalization of the electricity retail business happened in Japan. Although now the market is open to power generators and retailers, they still rely on the public sector for transmission, as the establishment of another power grid is not feasible for the private sector. In developing the theoretical model of this paper, we assume that the private sector is generating electricity and selling it to a public electric power company (EPCO) for transmission. Here we consider the case of Japan, where the demand for electricity to purchase comes from an EPCO, which purchases the electricity from private generators and sells it to households, the industrial sector, and the commercial sector, which are the end users. It is possible to analyze the demand for solar electricity through its relative superiority in terms of electricity generation to alternative sources of electricity. For simplicity, we assume that the only alternative source of electricity to solar electricity is thermal power. We compute the demand for solar electricity as a portion of the total electricity demand in Eq. 1, which determines the portion based on the difference between the price of solar electricity generation and the price of thermal electricity generation, as in Eq. 2. delectricity, t is the total electricity demand in year(t), (solar electricity ratio)t is the share of solar electricity in the total electricity demand in year(t), pthermal, t is the price of thermal electricity in year(t), and psolar, t is the price of solar electricity in year(t).
𝑑𝑑𝑠𝑠𝑠𝑠𝑠𝑠𝑠𝑠𝑠𝑠 𝑒𝑒𝑠𝑠𝑒𝑒𝑒𝑒𝑒𝑒𝑠𝑠𝑒𝑒𝑒𝑒𝑒𝑒𝑒𝑒,𝑒𝑒 = (𝑠𝑠𝑠𝑠𝑠𝑠𝑠𝑠𝑠𝑠 𝑒𝑒𝑠𝑠𝑒𝑒𝑒𝑒𝑒𝑒𝑠𝑠𝑒𝑒𝑒𝑒𝑒𝑒𝑒𝑒𝑒𝑒 𝑠𝑠𝑠𝑠𝑒𝑒𝑒𝑒𝑠𝑠)𝑒𝑒 .𝑑𝑑𝑒𝑒𝑠𝑠𝑒𝑒𝑒𝑒𝑒𝑒𝑠𝑠𝑒𝑒𝑒𝑒𝑒𝑒𝑒𝑒𝑒𝑒,𝑒𝑒 (1)
(𝑠𝑠𝑠𝑠𝑠𝑠𝑠𝑠𝑠𝑠 𝑒𝑒𝑠𝑠𝑒𝑒𝑒𝑒𝑒𝑒𝑠𝑠𝑒𝑒𝑒𝑒𝑒𝑒𝑒𝑒𝑒𝑒 𝑠𝑠𝑠𝑠𝑒𝑒𝑒𝑒𝑠𝑠)𝑒𝑒 = 𝑠𝑠0 + 𝑠𝑠1(𝑝𝑝𝑒𝑒ℎ𝑒𝑒𝑠𝑠𝑒𝑒𝑠𝑠𝑠𝑠,𝑒𝑒 − 𝑝𝑝𝑠𝑠𝑠𝑠𝑠𝑠𝑠𝑠𝑠𝑠,𝑒𝑒) (2)
We assume that the demand function for electricity takes the form of the Cobb–Douglas production function with two inputs, the price of electricity and the gross domestic product. We can write the demand function of total electricity as in Eq. 3.
𝑑𝑑𝑒𝑒𝑠𝑠𝑒𝑒𝑒𝑒𝑒𝑒𝑠𝑠𝑒𝑒𝑒𝑒𝑒𝑒𝑒𝑒𝑒𝑒,𝑒𝑒 = 𝑠𝑠2𝐺𝐺𝐺𝐺𝐺𝐺𝑒𝑒𝜏𝜏 ∗ 𝑝𝑝𝑒𝑒𝑠𝑠𝑒𝑒𝑒𝑒𝑒𝑒𝑠𝑠𝑒𝑒𝑒𝑒𝑒𝑒𝑒𝑒𝑒𝑒,𝑒𝑒𝜙𝜙 (3)
GDPt is the gross domestic product in year(t), pelectricity, t is the average price of electricity, 𝜏𝜏 is the GDP elasticity, and 𝜙𝜙 is the electricity price elasticity.
ADBI Working Paper 1084 F. Taghizadeh-Hesary et al.
7
Using Eq. 2 and Eq. 3, we represent the demand for solar electricity as a combination of the price of thermal electricity, the price of solar electricity, and the demand for electricity (Eq. 4).
𝑑𝑑𝑠𝑠𝑠𝑠𝑠𝑠𝑠𝑠𝑠𝑠 𝑒𝑒𝑠𝑠𝑒𝑒𝑒𝑒𝑒𝑒𝑠𝑠𝑒𝑒𝑒𝑒𝑒𝑒𝑒𝑒,𝑒𝑒 = 𝑓𝑓�𝑑𝑑𝑒𝑒𝑠𝑠𝑒𝑒𝑒𝑒𝑒𝑒𝑠𝑠𝑒𝑒𝑒𝑒𝑒𝑒𝑒𝑒𝑒𝑒,𝑒𝑒 ,𝑝𝑝𝑒𝑒ℎ𝑒𝑒𝑠𝑠𝑒𝑒𝑠𝑠𝑠𝑠,𝑒𝑒 ,𝑝𝑝𝑠𝑠𝑠𝑠𝑠𝑠𝑠𝑠𝑠𝑠,𝑒𝑒� (4)
As the GDP is one of the determinants of the demand for electricity in Eq. 4, the determinants for the demand for solar electricity are the GDP, the price of thermal electricity, and the price of solar electricity.
𝑑𝑑𝑠𝑠𝑠𝑠𝑠𝑠𝑠𝑠𝑠𝑠 𝑒𝑒𝑠𝑠𝑒𝑒𝑒𝑒𝑒𝑒𝑠𝑠𝑒𝑒𝑒𝑒𝑒𝑒𝑒𝑒,𝑒𝑒 = 𝑓𝑓�𝐺𝐺𝐺𝐺𝐺𝐺 𝑒𝑒 ,𝑝𝑝𝑒𝑒ℎ𝑒𝑒𝑠𝑠𝑒𝑒𝑠𝑠𝑠𝑠,𝑒𝑒 ,𝑝𝑝𝑠𝑠𝑠𝑠𝑠𝑠𝑠𝑠𝑠𝑠,𝑒𝑒� (5)
The purpose of this paper is to analyze the demand not for solar electricity but for solar modules. As the demand for solar electricity and the demand for solar modules have a strong positive correlation, we can assume that the same factors influence the demand for solar modules and the demand for solar electricity. In addition, in the supply chain of solar modules, each country is not the sole producer of all the components and equipment and needs to import components from different countries; hence, the importing of components and material and, thus, the exchange rate matter (Taghizadeh-Hesary, Yoshino, and Inagaki, 2019). Therefore, we include the exchange rate as a control variable to identify its explanatory role in the demand for solar modules.
𝑑𝑑𝑠𝑠𝑠𝑠𝑠𝑠𝑠𝑠𝑠𝑠 𝑒𝑒𝑠𝑠𝑚𝑚𝑚𝑚𝑠𝑠𝑒𝑒,𝑒𝑒 = 𝑓𝑓�𝐺𝐺𝐺𝐺𝐺𝐺 𝑒𝑒 , 𝑒𝑒𝑒𝑒 ,𝑝𝑝𝑒𝑒ℎ𝑒𝑒𝑠𝑠𝑒𝑒𝑠𝑠𝑠𝑠,𝑒𝑒 ,𝑝𝑝𝑠𝑠𝑠𝑠𝑠𝑠𝑠𝑠𝑠𝑠,𝑒𝑒� (6)
In Eq. 5, e t is the exchange rate in year(t). We will use Eq. 5 to conduct the empirical analysis of the solar module demand in section 4.
3.2 Supply Side
To develop the supply equation for solar modules, we assume that the production function for solar module producer countries takes the form of the Cobb–Douglas production function with five production inputs, as in Eq. 7:
𝑒𝑒𝑒𝑒 = 𝐴𝐴𝑒𝑒𝑁𝑁𝑒𝑒𝛼𝛼𝐾𝐾𝑒𝑒𝛽𝛽𝑀𝑀𝑒𝑒
𝛾𝛾 = 𝑓𝑓(𝐴𝐴,𝑁𝑁,𝐾𝐾,𝑀𝑀) (7)
where (yt) is the total production of solar modules in year(t), (A𝒕𝒕) is the productivity parameter in year(t), (N𝑒𝑒) is the labor input in year(t), (K𝑒𝑒) is the capital stock in year(t), and (M𝑒𝑒) is the material input in year(t). (α), (β),𝑠𝑠𝑎𝑎𝑑𝑑 (𝛾𝛾) are the output elasticities of labor inputs, capital stock, and material inputs. Eq. 8 shows the cost function that we assume for solar modules:
𝐶𝐶𝑒𝑒 = 𝑤𝑤𝑒𝑒𝑁𝑁𝑒𝑒 + 𝑒𝑒𝑒𝑒𝐾𝐾𝑒𝑒 + 𝑝𝑝𝑠𝑠𝑒𝑒𝑠𝑠𝑒𝑒𝑒𝑒𝑠𝑠𝑎𝑎,𝑒𝑒. 𝑒𝑒𝑒𝑒.𝑀𝑀𝑒𝑒 (8)
ADBI Working Paper 1084 F. Taghizadeh-Hesary et al.
8
where (C𝑒𝑒) is the cost of solar module production in year(t), (w𝑒𝑒) is the labor cost in year(t), (r𝑒𝑒) is the interest rate in year(t), (p𝑠𝑠𝑒𝑒𝑠𝑠𝑒𝑒𝑒𝑒𝑠𝑠𝑠𝑠,𝑒𝑒) is the price of silicon in year(t), e t is the exchange rate in year(t), and M𝑒𝑒 is the amount of silicon used for the production of solar modules in year(t). Here, the cost is the sum of the labor cost, capital cost, and silicon cost. We assume that the country imports all the materials that it uses to produce solar modules from abroad and is thus under the influence of the exchange rate. We minimize the cost through the Lagrange multiplier. The cost equation for a solar module producer appears in Eq. 9, with the production function as the constraint equation in Eq. 10.
𝑀𝑀𝑒𝑒𝑎𝑎𝐶𝐶𝑒𝑒 = 𝑤𝑤𝑒𝑒𝑁𝑁𝑒𝑒 + 𝑠𝑠𝑒𝑒𝐾𝐾𝑒𝑒 + 𝑝𝑝𝑠𝑠𝑒𝑒𝑠𝑠𝑒𝑒𝑒𝑒𝑠𝑠𝑠𝑠,𝑒𝑒 . 𝑒𝑒𝑒𝑒 .𝑀𝑀𝑒𝑒 (9)
𝑠𝑠𝑠𝑠𝑠𝑠𝑠𝑠𝑒𝑒𝑒𝑒𝑒𝑒 𝑒𝑒𝑠𝑠 𝑒𝑒 = 𝐴𝐴𝑒𝑒𝑁𝑁𝑒𝑒𝛼𝛼𝐾𝐾𝑒𝑒𝛽𝛽𝑀𝑀𝑒𝑒
𝛾𝛾 = 𝑓𝑓(𝐴𝐴,𝑁𝑁,𝐾𝐾,𝑀𝑀) (10)
Eq. 11 defines the Lagrange function. Eqs. 12 to 14 are the first-order conditions for the cost minimization problem.
𝐿𝐿𝑒𝑒 = 𝑤𝑤𝑒𝑒𝑁𝑁𝑒𝑒 + 𝑠𝑠𝑒𝑒𝐾𝐾𝑒𝑒 + 𝑝𝑝𝑠𝑠𝑒𝑒𝑠𝑠𝑒𝑒𝑒𝑒𝑠𝑠𝑠𝑠,𝑒𝑒 . 𝑒𝑒𝑒𝑒 .𝑀𝑀𝑒𝑒 + 𝜆𝜆(𝑒𝑒 − 𝑓𝑓(𝐴𝐴,𝑁𝑁,𝐾𝐾,𝑀𝑀)) (11)
𝜕𝜕𝐿𝐿𝜕𝜕𝑁𝑁
= 𝑤𝑤 − 𝜆𝜆𝜕𝜕𝑓𝑓𝜕𝜕𝑁𝑁
= 0 (12)
𝜕𝜕𝐿𝐿𝜕𝜕𝐾𝐾
= 𝑠𝑠 − 𝜆𝜆𝜕𝜕𝑓𝑓𝜕𝜕𝐾𝐾
= 0 (13)
𝜕𝜕𝐿𝐿𝜕𝜕𝑀𝑀
= 𝑝𝑝𝑠𝑠𝑒𝑒𝑠𝑠𝑒𝑒𝑒𝑒𝑠𝑠𝑠𝑠,𝑒𝑒 . 𝑒𝑒𝑒𝑒 − 𝜆𝜆𝜕𝜕𝑓𝑓𝜕𝜕𝑀𝑀
= 0 (14)
𝑒𝑒 − 𝑓𝑓(𝐴𝐴,𝑁𝑁,𝐾𝐾,𝑀𝑀) = 0 (15)
By differentiating 𝑓𝑓 with respect to N, K, and M using Eq. 7, we gain the following equations, Eq. 16 to Eq. 18.
𝜕𝜕𝑓𝑓𝜕𝜕𝑁𝑁
= 𝛼𝛼𝑒𝑒𝑁𝑁
(16)
𝜕𝜕𝑓𝑓𝜕𝜕𝐾𝐾
= 𝛽𝛽𝑒𝑒𝐾𝐾
(17)
𝜕𝜕𝑓𝑓𝜕𝜕𝑀𝑀
= 𝛾𝛾𝑒𝑒𝑀𝑀
(18)
ADBI Working Paper 1084 F. Taghizadeh-Hesary et al.
9
Using Eq. 12 to Eq. 14 and Eq. 16 to Eq. 18, we can express N, K, and M as below in Eq. 19 to Eq. 21.
𝜕𝜕𝐿𝐿𝜕𝜕𝑁𝑁
= 𝑤𝑤 − 𝛼𝛼𝜆𝜆𝑒𝑒𝑁𝑁
= 0
↔ N = α𝜆𝜆𝑒𝑒𝑤𝑤
(19)
𝜕𝜕𝐿𝐿𝜕𝜕𝐾𝐾
= 𝑠𝑠 − 𝛽𝛽𝜆𝜆𝑒𝑒𝐾𝐾
= 0
↔ K = β𝜆𝜆𝑒𝑒𝑠𝑠 (20)
𝜕𝜕𝐿𝐿𝜕𝜕𝑀𝑀
= 𝑝𝑝𝑠𝑠𝑒𝑒𝑠𝑠𝑒𝑒𝑒𝑒𝑠𝑠𝑠𝑠,𝑒𝑒 ∗ 𝑒𝑒𝑒𝑒 − 𝛾𝛾𝜆𝜆𝑒𝑒𝑀𝑀
= 0
↔ M = γ𝜆𝜆𝑒𝑒
𝑝𝑝𝑠𝑠𝑒𝑒𝑠𝑠𝑒𝑒𝑒𝑒𝑠𝑠𝑠𝑠,𝑒𝑒 ∗ 𝑒𝑒𝑒𝑒 (21)
Using Eqs 16 to 18 and the cost function (Eq. 8), we can write the marginal cost as below. The marginal cost is a function of the wage, interest rate, module production, price of silicon, exchange rate, and material cost.
C = 𝑤𝑤 �α𝜆𝜆𝑒𝑒𝑤𝑤� + 𝑠𝑠 �β𝜆𝜆
𝑒𝑒𝑠𝑠� + 𝑝𝑝𝑠𝑠𝑒𝑒𝑠𝑠𝑒𝑒𝑒𝑒𝑠𝑠𝑠𝑠,𝑒𝑒 . 𝑒𝑒𝑒𝑒 . (γ𝜆𝜆
𝑒𝑒𝑝𝑝𝑠𝑠𝑒𝑒𝑠𝑠𝑒𝑒𝑒𝑒𝑠𝑠𝑠𝑠,𝑒𝑒 ∗ 𝑒𝑒𝑒𝑒
)
𝑀𝑀𝑠𝑠𝑠𝑠𝑀𝑀𝑒𝑒𝑎𝑎𝑠𝑠𝑠𝑠 𝐶𝐶𝑠𝑠𝑠𝑠𝑒𝑒: 𝜕𝜕𝐶𝐶𝜕𝜕𝑒𝑒
= 𝜆𝜆 (𝑤𝑤, 𝑠𝑠,𝑒𝑒,𝑝𝑝𝑠𝑠𝑒𝑒𝑠𝑠𝑒𝑒𝑒𝑒𝑠𝑠𝑠𝑠 , 𝑒𝑒) (22)
We can express the profit of a solar module producer company as Eq. 20. By taking a partial derivative of the profit with respect to solar module production ( yt) , we can compute the optimal output that maximizes the profit. As Eq. 21 shows, in an oligopolistic market, the maximum profit occurs when the marginal revenue equals the marginal cost.
𝜋𝜋 = 𝑝𝑝𝑠𝑠𝑠𝑠𝑠𝑠𝑠𝑠𝑠𝑠 𝑒𝑒𝑠𝑠𝑚𝑚𝑚𝑚𝑠𝑠𝑒𝑒 𝑒𝑒 − 𝐶𝐶(𝑤𝑤, 𝑠𝑠,𝑒𝑒, 𝑝𝑝𝑠𝑠𝑒𝑒𝑠𝑠𝑒𝑒𝑒𝑒𝑠𝑠𝑠𝑠, 𝑒𝑒, ) (23)
𝜕𝜕𝜋𝜋𝜕𝜕𝑒𝑒
= (𝑀𝑀𝑠𝑠𝑠𝑠𝑀𝑀𝑒𝑒𝑎𝑎𝑠𝑠𝑠𝑠 𝑅𝑅𝑒𝑒𝑅𝑅𝑒𝑒𝑎𝑎𝑠𝑠𝑒𝑒) − (𝑀𝑀𝑠𝑠𝑠𝑠𝑀𝑀𝑒𝑒𝑎𝑎𝑠𝑠𝑠𝑠 𝐶𝐶𝑠𝑠𝑠𝑠𝑒𝑒) = 0 (24)
ADBI Working Paper 1084 F. Taghizadeh-Hesary et al.
10
𝑝𝑝𝑠𝑠𝑠𝑠𝑠𝑠𝑠𝑠𝑠𝑠 𝑒𝑒𝑠𝑠𝑚𝑚𝑚𝑚𝑠𝑠𝑒𝑒 − 𝜆𝜆 (𝑤𝑤, 𝑠𝑠,𝑒𝑒,𝑝𝑝𝑠𝑠𝑒𝑒𝑠𝑠𝑒𝑒𝑒𝑒𝑠𝑠𝑠𝑠 , 𝑒𝑒 ) = 0
𝑝𝑝𝑠𝑠𝑠𝑠𝑠𝑠𝑠𝑠𝑠𝑠 𝑒𝑒𝑠𝑠𝑚𝑚𝑚𝑚𝑠𝑠𝑒𝑒 = 𝜆𝜆 (𝑤𝑤, 𝑠𝑠,𝑒𝑒,𝑝𝑝𝑠𝑠𝑒𝑒𝑠𝑠𝑒𝑒𝑒𝑒𝑠𝑠𝑠𝑠, 𝑒𝑒) (25)
The price of solar modules is a function of the wage, interest rate, solar module production, price of silicon, exchange rate, and material cost. Thus, using Eq. 23 and Eq. 24, we can rewrite the production of solar modules (yt) as Eq. 26:
𝑒𝑒𝑒𝑒 = 𝛽𝛽0 + 𝛽𝛽1(𝑠𝑠𝑒𝑒) + 𝛽𝛽2 log�𝑝𝑝𝑠𝑠𝑠𝑠𝑠𝑠𝑠𝑠𝑠𝑠,𝑒𝑒� + 𝛽𝛽3 log�𝑝𝑝𝑠𝑠𝑒𝑒𝑠𝑠𝑒𝑒𝑒𝑒𝑠𝑠𝑠𝑠,𝑒𝑒� + 𝛽𝛽4 log(𝑒𝑒𝑒𝑒) + 𝜀𝜀𝑒𝑒 (26)
As Eq. 26 shows, the production (supply) of solar modules (𝑒𝑒𝑒𝑒) is a function of the interest (r𝑒𝑒), price of solar modules (p𝑠𝑠𝑠𝑠𝑠𝑠𝑠𝑠𝑠𝑠,𝑒𝑒), price of silicon (p𝑠𝑠𝑒𝑒𝑠𝑠𝑒𝑒𝑒𝑒𝑠𝑠𝑠𝑠,𝑒𝑒), exchange rate (e𝑒𝑒), and GDP (𝐺𝐺𝐺𝐺𝐺𝐺𝑒𝑒).
In the empirical analysis, for the supply side model, in addition to the aforementioned variables, we include the money supply. As the interest rate in Japan was very low or almost zero throughout the period of our analysis, we include another monetary variable (M2).
4. EMPIRICAL ANALYSIS 4.1 Test Procedures
We conducted the empirical analysis on Japan using quarterly data from 1997 to 2015. For production, we used the national PV module production data, which we collected from the IEA-PVPS. For the demand, we used the PV module production and import data from the JPEA. For the solar module price, we used data that we collected from the IEA-PVPS and Bloomberg databases. The unit of price is JPY per watt. For the interest rate, we used the 10-year government bond yield rate, which we collected from the OECD database. For the exchange rate, we used the real effective exchange rate of JPY (2010=100), which Bruegel (2017) and the World Bank database provided. For the price of oil, we used the simple average of three major crude oil price sources, Brent crude oil prices, Dubai crude oil prices, and West Texas Intermediate (WTI) crude oil prices, which are available from the World Bank database. For the price of silicon, we used the average silicon wafer price, which we collected from the METI (2019). For the GDP, we used the nominal GDP (in JPY), which the World Bank released. The data that we used for the GDP, the price of solar modules, and the oil prices are in nominal US dollars. We converted the three series into JPY using the exchange rate and deflated them all using the JPY GDP deflator (2010=100). We deflated the long-term interest rate using the national GDP deflator (2010=100). We collected the GDP deflators from the World Bank database. For the FIT, we used a dummy variable that takes the value 1 when the FIT is in effect and 0 when it is not in effect. For the regression analysis, we used the solar module price, GDP, exchange rate, silicon price, and oil price in their logarithm form. In the time series analysis before running the regression, we needed to perform a data analysis on all the series. Section 4.2 shows the results of our data analysis.
ADBI Working Paper 1084 F. Taghizadeh-Hesary et al.
11
4.2 Test Results
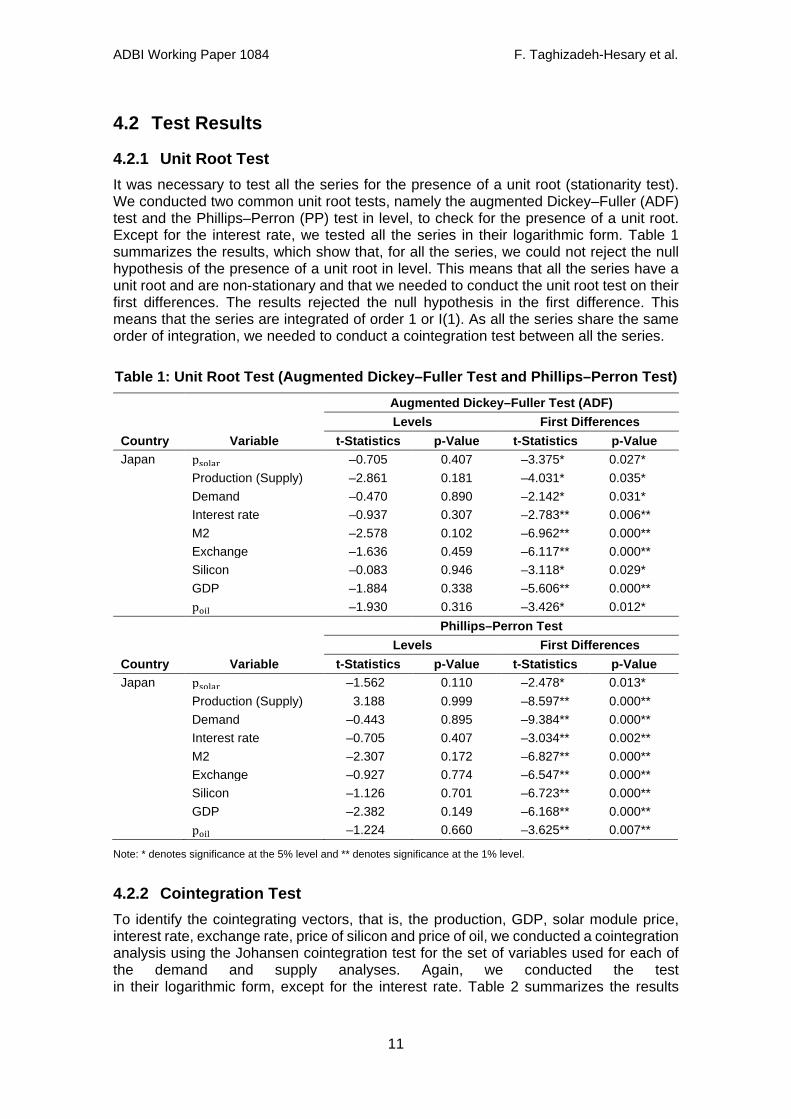
4.2.1 Unit Root Test It was necessary to test all the series for the presence of a unit root (stationarity test). We conducted two common unit root tests, namely the augmented Dickey–Fuller (ADF) test and the Phillips–Perron (PP) test in level, to check for the presence of a unit root. Except for the interest rate, we tested all the series in their logarithmic form. Table 1 summarizes the results, which show that, for all the series, we could not reject the null hypothesis of the presence of a unit root in level. This means that all the series have a unit root and are non-stationary and that we needed to conduct the unit root test on their first differences. The results rejected the null hypothesis in the first difference. This means that the series are integrated of order 1 or I(1). As all the series share the same order of integration, we needed to conduct a cointegration test between all the series.
Table 1: Unit Root Test (Augmented Dickey–Fuller Test and Phillips–Perron Test) Augmented Dickey–Fuller Test (ADF) Levels First Differences
Country Variable t-Statistics p-Value t-Statistics p-Value Japan psolar –0.705 0.407 –3.375* 0.027* Production (Supply) –2.861 0.181 –4.031* 0.035* Demand –0.470 0.890 –2.142* 0.031* Interest rate –0.937 0.307 –2.783** 0.006** M2 –2.578 0.102 –6.962** 0.000** Exchange –1.636 0.459 –6.117** 0.000** Silicon –0.083 0.946 –3.118* 0.029* GDP –1.884 0.338 –5.606** 0.000**
poil –1.930 0.316 –3.426* 0.012* Phillips–Perron Test Levels First Differences
Country Variable t-Statistics p-Value t-Statistics p-Value Japan psolar –1.562 0.110 –2.478* 0.013* Production (Supply) 3.188 0.999 –8.597** 0.000** Demand –0.443 0.895 –9.384** 0.000** Interest rate –0.705 0.407 –3.034** 0.002** M2 –2.307 0.172 –6.827** 0.000** Exchange –0.927 0.774 –6.547** 0.000** Silicon –1.126 0.701 –6.723** 0.000** GDP –2.382 0.149 –6.168** 0.000**
poil –1.224 0.660 –3.625** 0.007**
Note: * denotes significance at the 5% level and ** denotes significance at the 1% level.
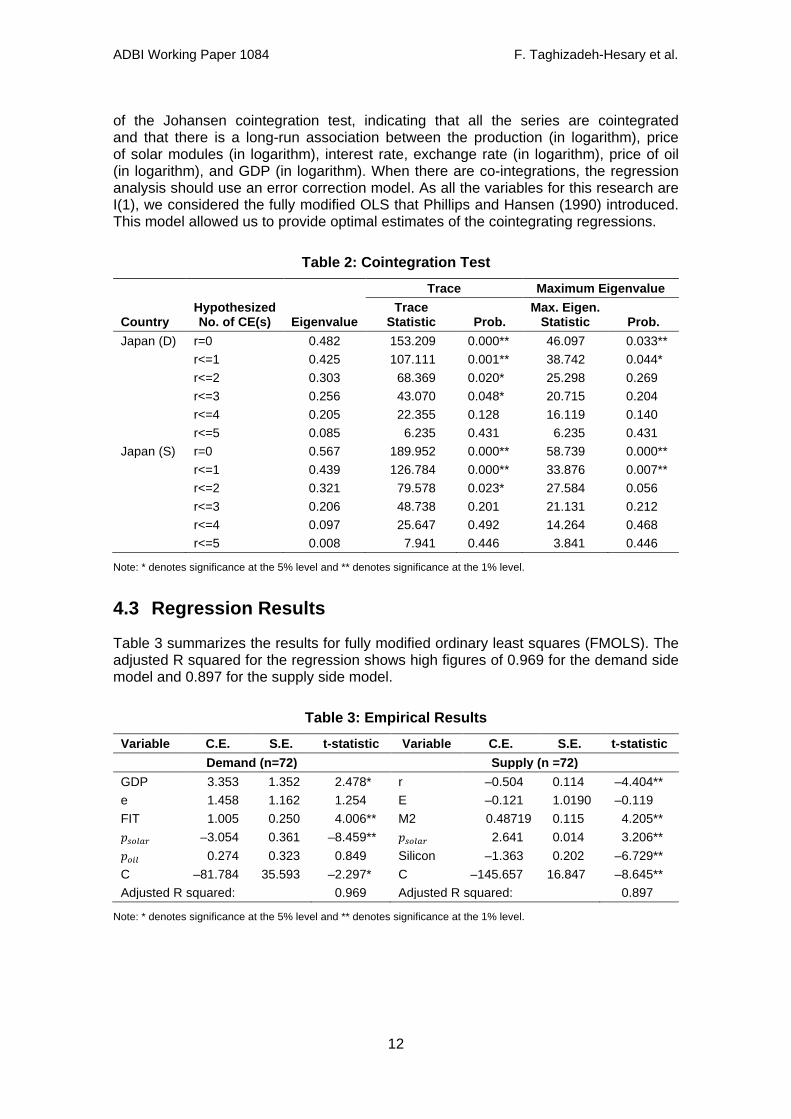
4.2.2 Cointegration Test To identify the cointegrating vectors, that is, the production, GDP, solar module price, interest rate, exchange rate, price of silicon and price of oil, we conducted a cointegration analysis using the Johansen cointegration test for the set of variables used for each of the demand and supply analyses. Again, we conducted the test in their logarithmic form, except for the interest rate. Table 2 summarizes the results
ADBI Working Paper 1084 F. Taghizadeh-Hesary et al.
12
of the Johansen cointegration test, indicating that all the series are cointegrated and that there is a long-run association between the production (in logarithm), price of solar modules (in logarithm), interest rate, exchange rate (in logarithm), price of oil (in logarithm), and GDP (in logarithm). When there are co-integrations, the regression analysis should use an error correction model. As all the variables for this research are I(1), we considered the fully modified OLS that Phillips and Hansen (1990) introduced. This model allowed us to provide optimal estimates of the cointegrating regressions.
Table 2: Cointegration Test Trace Maximum Eigenvalue
Country Hypothesized No. of CE(s) Eigenvalue
Trace Statistic Prob.
Max. Eigen. Statistic Prob.
Japan (D) r=0 0.482 153.209 0.000** 46.097 0.033** r<=1 0.425 107.111 0.001** 38.742 0.044* r<=2 0.303 68.369 0.020* 25.298 0.269 r<=3 0.256 43.070 0.048* 20.715 0.204 r<=4 0.205 22.355 0.128 16.119 0.140 r<=5 0.085 6.235 0.431 6.235 0.431 Japan (S) r=0 0.567 189.952 0.000** 58.739 0.000** r<=1 0.439 126.784 0.000** 33.876 0.007** r<=2 0.321 79.578 0.023* 27.584 0.056 r<=3 0.206 48.738 0.201 21.131 0.212 r<=4 0.097 25.647 0.492 14.264 0.468 r<=5 0.008 7.941 0.446 3.841 0.446
Note: * denotes significance at the 5% level and ** denotes significance at the 1% level.
4.3 Regression Results
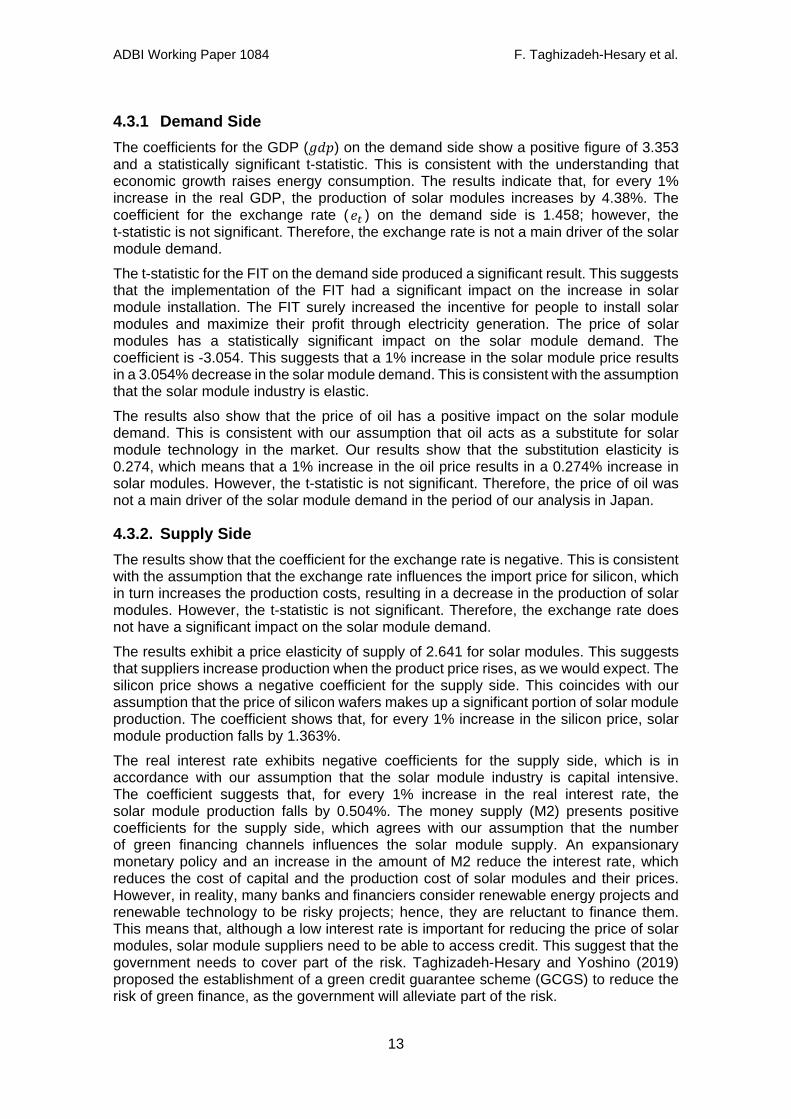
Table 3 summarizes the results for fully modified ordinary least squares (FMOLS). The adjusted R squared for the regression shows high figures of 0.969 for the demand side model and 0.897 for the supply side model.
Table 3: Empirical Results Variable C.E. S.E. t-statistic Variable C.E. S.E. t-statistic
Demand (n=72) Supply (n =72) GDP 3.353 1.352 2.478* r –0.504 0.114 –4.404** e 1.458 1.162 1.254 E –0.121 1.0190 –0.119 FIT 1.005 0.250 4.006** M2 0.48719 0.115 4.205** 𝑝𝑝𝑠𝑠𝑠𝑠𝑠𝑠𝑠𝑠𝑠𝑠 –3.054 0.361 –8.459** 𝑝𝑝𝑠𝑠𝑠𝑠𝑠𝑠𝑠𝑠𝑠𝑠 2.641 0.014 3.206** 𝑝𝑝𝑠𝑠𝑒𝑒𝑠𝑠 0.274 0.323 0.849 Silicon –1.363 0.202 –6.729** C –81.784 35.593 –2.297* C –145.657 16.847 –8.645** Adjusted R squared: 0.969 Adjusted R squared: 0.897
Note: * denotes significance at the 5% level and ** denotes significance at the 1% level.
ADBI Working Paper 1084 F. Taghizadeh-Hesary et al.
13
4.3.1 Demand Side The coefficients for the GDP (𝑀𝑀𝑑𝑑𝑝𝑝) on the demand side show a positive figure of 3.353 and a statistically significant t-statistic. This is consistent with the understanding that economic growth raises energy consumption. The results indicate that, for every 1% increase in the real GDP, the production of solar modules increases by 4.38%. The coefficient for the exchange rate (𝑒𝑒𝑒𝑒 ) on the demand side is 1.458; however, the t-statistic is not significant. Therefore, the exchange rate is not a main driver of the solar module demand. The t-statistic for the FIT on the demand side produced a significant result. This suggests that the implementation of the FIT had a significant impact on the increase in solar module installation. The FIT surely increased the incentive for people to install solar modules and maximize their profit through electricity generation. The price of solar modules has a statistically significant impact on the solar module demand. The coefficient is -3.054. This suggests that a 1% increase in the solar module price results in a 3.054% decrease in the solar module demand. This is consistent with the assumption that the solar module industry is elastic. The results also show that the price of oil has a positive impact on the solar module demand. This is consistent with our assumption that oil acts as a substitute for solar module technology in the market. Our results show that the substitution elasticity is 0.274, which means that a 1% increase in the oil price results in a 0.274% increase in solar modules. However, the t-statistic is not significant. Therefore, the price of oil was not a main driver of the solar module demand in the period of our analysis in Japan.
4.3.2. Supply Side The results show that the coefficient for the exchange rate is negative. This is consistent with the assumption that the exchange rate influences the import price for silicon, which in turn increases the production costs, resulting in a decrease in the production of solar modules. However, the t-statistic is not significant. Therefore, the exchange rate does not have a significant impact on the solar module demand. The results exhibit a price elasticity of supply of 2.641 for solar modules. This suggests that suppliers increase production when the product price rises, as we would expect. The silicon price shows a negative coefficient for the supply side. This coincides with our assumption that the price of silicon wafers makes up a significant portion of solar module production. The coefficient shows that, for every 1% increase in the silicon price, solar module production falls by 1.363%. The real interest rate exhibits negative coefficients for the supply side, which is in accordance with our assumption that the solar module industry is capital intensive. The coefficient suggests that, for every 1% increase in the real interest rate, the solar module production falls by 0.504%. The money supply (M2) presents positive coefficients for the supply side, which agrees with our assumption that the number of green financing channels influences the solar module supply. An expansionary monetary policy and an increase in the amount of M2 reduce the interest rate, which reduces the cost of capital and the production cost of solar modules and their prices. However, in reality, many banks and financiers consider renewable energy projects and renewable technology to be risky projects; hence, they are reluctant to finance them. This means that, although a low interest rate is important for reducing the price of solar modules, solar module suppliers need to be able to access credit. This suggest that the government needs to cover part of the risk. Taghizadeh-Hesary and Yoshino (2019) proposed the establishment of a green credit guarantee scheme (GCGS) to reduce the risk of green finance, as the government will alleviate part of the risk.
ADBI Working Paper 1084 F. Taghizadeh-Hesary et al.
14
5. CONCLUDING REMARKS AND POLICY RECOMMENDATION
In this paper, we investigated the factors influencing the demand and supply of solar modules in Japan. On the supply side, we examined the influence of the real GDP, price of solar modules, FIT, real interest rate, price of silicon, and exchange rate. On the demand side, we studied the influence of the real GDP, price of solar modules, FIT, price of oil, money supply, and exchange rate. We constructed two models, a solar module supply model and a solar module demand model. Based on the two models, we conducted fully modified OLS (FMOLS) to estimate the influence of each factor using quarterly data from 1997 to 2015. Our empirical analysis results produced several findings concerning the solar module supply and demand. On the demand side, the results show that the price of solar modules and the GDP have a significant impact. On the supply side, the results indicate that all the variables, the GDP, exchange rate, FIT, price of solar modules, price of silicon, and interest rate, have a significant impact. All the coefficients are consistent with our understanding of each factor.
5.1 Policy Recommendation
We confirmed through the analysis results that international and external factors, such as the price of silicon, have a strong influence on the solar module market, and the Japanese Government does not have control over these external factors. For Japan to expand its solar module market, it must shift from the reliance on the FIT policy to enhancing the financing channels for solar module production, which are an important internal factor. The feed-in tariff policy (FIT) manipulates and forces a fixed price on solar electricity to enhance the market demand for solar electricity. As the empirical results in Table 3 show, it has a significant impact on the demand side of the solar module market. We can still consider the FIT policy to be an effective tool for enhancing solar module installation. However, the manipulation of the solar electricity price through the FIT is not the most efficient target in terms of accelerating solar PV development. First, the FIT policy involves careful price setting to maintain company incentives to invest in solar PV and minimize the cost imposed on electricity consumers. A report by REI (2017) emphasized the difficulty of setting an efficient price for the FIT and the insufficiency of the discussions focusing on FIT price setting. Therefore, the continuous use of the FIT policy has the risk of misconfiguration. Moreover, the FIT policy might increase the incentives for green technology investment, but the absence of channels for initial finance might act as a bottleneck, limiting the potential increase in solar PV market entries. Therefore, the more efficient target for the further development of solar PV technology is access to finance. Easing the access to finance and reducing the capital costs will lower the initial financing hurdle, allowing an increase in the number of new entries into the solar PV market. At the same time, it will not impose the cost of capital directly on the consumers. As Taghizadeh-Hesary, Yoshino, and Inagaki (2019) noted, for the solar module industry to accelerate its development, the government must implement new renewable energy funding tactics to reduce the capital cost as well as to enhance the financing opportunities in the industry. We reconfirmed in this research that the interest rate as a capital cost as well as M2 as the money stock have significant impacts on the supply side of the solar module market. As renewable industries are high-tech, the influence that the capital cost has on the technology price is significant. The government’s efforts to provide industries with low-interest finance will accelerate renewable business. Countries are implementing many different policies regarding green finance globally, such as green bonds and green banks. However, Taghizadeh-Hesary and Yoshino (2019) stated that the current variety of green financing
ADBI Working Paper 1084 F. Taghizadeh-Hesary et al.
15
channels and the amount of money invested in green projects are inadequate. They proposed the establishment of a green credit guarantee scheme (GCGS) to reduce the risk of green finance, as the government will alleviate part of the risk. The recent movement in Japan may become a gateway to realize this type of green financing. The Japanese Government has recently started putting effort into the green financing sector, leading to the creation of the Green Finance Network Japan (GFNJ) in November 2018. The Green Finance Network Japan is a taskforce consisting of financial institutions, institutional investors, development banks, think tanks, academics, NGOs, and international organizations to provide a platform to connect Japanese and international stakeholders and encourage the development of the green financing market. Although this network is still in its experimental phase, its broad network, which is not exclusive to financial institutions, may encourage all types of organizations to find their green project investment opportunity. This organization has the potential to become a pathway to the diversification of green financing channels and the expansion of the green financing market. The government should make an effort to create the infrastructure for a global green financing network that is not exclusive to financial institutions, which will consequently reduce the cost of finding a lender, and implement a well-structured policy to create more opportunities for green financing. The construction of this green financing platform altogether will lead to an increase in solar PV installation.

ADBI Working Paper 1084 F. Taghizadeh-Hesary et al.
16
REFERENCES Barreto, L., and S. Kypreos. 2004. “Endogenizing R&D and Market Experience in the
‘Bottom-Up’ Energy-Systems ERIS Model.” Technovation 24 (18): 615–629. Barreto, L., S. Kepreos, S. Capros, and S. Messener. 2000. “ERIS: A Model Prototype
with Endogenized Technological Change.” International Journal of Global Energy Issues14 (1/2/3/4).
Barsky, R., and L. Kilian. 2004. “Oil and Macroeconomy since the 1970s.” Journal of Economics Perspectives 18: 115–34. DOI: 10.1257/0895330042632708.
Bruegel. 2017. “Real Effective Exchange Rates for 178 Countries: A New Database.” http://bruegel.org/publications/datasets/real-effective-exchange-rates-for-178-countries-a-new-database/.
Brunnschweiler, C.N. 2009. “Finance for Renewable Energy: An Empirical Analysis of Developing and Transition Economies. Environment and Development Economics, 15 (3): 241–274. http://doc.rero.ch/record/303054/files/S1355770X1000001X.pdf.
Cheon, A., and J. Urpelainen. 2012. “Oil Prices and Energy Technology Innovation: An Empirical Analysis.” Global Environmental Change22 (2): 407–417.
De La Tour, Arnaud, Matthieu Glachant, and Yann Ménière. 2013. “Predicting the Costs of Photovoltaic Solar Modules in 2020 Using Experience Curve Models.” Energy 62: 341–348.
Gan, Peck Yean, and Zhi Dong Li. 2015. “Quantitative Study on Long Term Global Solar Photovoltaic Market.” Renewable and Sustainable Energy Reviews 46: 88–99.
Hamilton, J. 1983. “Oil and the Macroeconomy since World War II.” Journal of Political Economy 91 (2): 228–48. DOI: 10.1086/261140.
Hayamizu, S., T. Furubayashi, and T. Nakata. 2014. “Quantification of Technological Learning by R&D and its Application for Renewable Energy Technologies.” Transactions of the JSME80 (811): 巻.
IEA-PVPS. 1999. “Trends in Photovoltaic Applications in Selected IEA Countries between 1992 and 1998.”: 2018,1,19. http://www.iea-pvps.org/fileadmin/dam/ public/report/statistics/tr_1998.pdf.
———. 2000. “Trends in Photovoltaic Applications in Selected IEA Countries between 1992 and 1999.”: 2018,1,19. http://www.iea-pvps.org/fileadmin/dam/public/ report/statistics/tr_1999.pdf.
———. 2001. “Trends in Photovoltaic Applications in Selected IEA Countries between 1992 and 2000.”: 2018,1,19. http://www.iea-pvps.org/fileadmin/dam/public/ report/statistics/tr_2000.pdf.
———. 2002. “Trends in Photovoltaic Applications in Selected IEA Countries between 1992 and 2001.”: 2018,1,19. http://www.iea-pvps.org/fileadmin/dam/public/ report/statistics/tr_2001.pdf.
———. 2003. “Trends in Photovoltaic Applications Survey Report of Selected IEA Countries between 1992 and 2002.”: 2018,1,19. http://www.iea-pvps.org/ fileadmin/dam/public/report/statistics/tr_2002.pdf.
ADBI Working Paper 1084 F. Taghizadeh-Hesary et al.
17
———. 2004. “Trends in Photovoltaic Applications Survey Report of Selected IEA Countries between 1992 and 2003.”: 2018,1,19. http://www.iea-pvps.org/ fileadmin/dam/public/report/statistics/tr_2003.pdf.
———. 2005. “Trends in Photovoltaic Applications Survey Report of Selected IEA Countries between 1992 and 2004.”: 2018,1,19. http://www.iea-pvps.org/ fileadmin/dam/public/report/statistics/tr_2004.pdf.
———. 2006. “Trends in Photovoltaic Applications Survey Report of Selected IEA Countries between 1992 and 2005.日: 2018,1,19. http://www.iea-pvps.org/ fileadmin/dam/public/report/statistics/tr_2005.pdf.
———. 2007. “Trends in Photovoltaic Applications Survey Report of Selected IEA Countries between 1992 and 2006.: 2018,1,19. http://www.iea-pvps.org/ fileadmin/dam/public/report/statistics/tr_2006.pdf.
———. 2008. “Trends in Photovoltaic Applications Survey Report of Selected IEA Countries between 1992 and 2007.: 2018,1,19. http://www.iea-pvps.org/ fileadmin/dam/public/report/statistics/tr_2007.pdf.
———. 2009. “Trends in Photovoltaic Applications Survey Report of Selected IEA Countries between 1992 and 2008.: 2018,1, 19. http://www.iea-pvps.org/ fileadmin/dam/public/report/statistics/tr_2008.pdf.
———. 2010. “Trends in Photovoltaic Applications Survey Report of Selected IEA Countries between 1992 and 2009.”: 2018, 1,19. http://www.iea-pvps.org/ fileadmin/dam/public/report/statistics/tr_2009_neu.pdf.
———. 2011. “Trends in Photovoltaic Applications Survey Report of Selected IEA Countries between 1992 and 2010.”: 2018,1,19. http://www.iea-pvps.org/ fileadmin/dam/public/report/statistics/tr_2010_low.pdf.
———. 2012. “Trends in Photovoltaic Applications Survey Report of Selected IEA Countries between 1992 and 2011.”: 2018,1,19. http://www.iea-pvps.org/ fileadmin/dam/public/report/statistics/tr_2011.pdf.
———. 2013. “Trends in Photovoltaic Applications 2013.”: 2018,1,19. http://www.iea-pvps.org/fileadmin/dam/public/report/statistics/FINAL_TRENDS_v1.02.pdf.
———. 2014. “PVPS Report—Snapshot of Global PV 1992–2013.”: 2018, 1, 19. http://www.iea-pvps.org/fileadmin/dam/public/report/statistics/PVPS_report_-_A_Snapshot_of_Global_PV_-_1992-2013_-_final_3.pdf.
———. 2015. “Trends in Photovoltaic Applications 2015.”: 2018,1,19. http://www.iea-pvps.org/fileadmin/dam/public/report/national/IEA-PVPS_-_Trends_2015_-_MedRes.pdf.
———. 2016. “Trends in Photovoltaic Applications 2016.”: 2018, 1,19. http://www.iea-pvps.org/fileadmin/dam/public/report/national/Trends_2016_-_mr.pdf.
IRENA. 2017. “Renewable Power Generation Costs in 2017.”: 2018,1,19. https://www.irena.org/-/media/Files/IRENA/Agency/Publication/2018/Jan/ IRENA_2017_Power_Costs_2018.pdf.
JOGMEC. 2018. Activities of JOGMEC—Geothermal Resources Development Department. Japan Oil, Gas and Metals National Corporation (JOGMEC): Tokyo, October 2018.
ADBI Working Paper 1084 F. Taghizadeh-Hesary et al.
18
Kantar, Keskin. 2013. “The Relationships between Electricity Consumption and GDP in Asian Countries, Using Hierarchical Structure Methods.” Physics A: Statistical Mechanics and its Applications, 392 (22): 5678–5684.
Kilian, L. 2009. “Not All Oil Price Shocks Are Alike: Disentangling Demand and Supply Shocks in the Crude Oil Market.” American Economic Review 99: 1053–63. DOI: 10.1257/aer.99.3.1053.
Lazard (2017). Lazard's Levelized Cost of Storage Analysis". https://www.lazard.com/ media/450337/lazard-levelized-cost-of-energy-version-110.pdf (retrieved 15 Nov 2019).
Messener, S. 1997. “Endogenized Technological Learning In an Energy Systems Model.” Journal of Evolutionary Economics, 7 (3): 291–313.
Miketa, A., and L. Schrattenholzer. 2004. “Experiments with a Methodology to Model the Role of R&D Expenditures in Energy Technology Learning Processes: First Results.” Energy Policy, 32(15): 1679–1692.
Ministry of Economy, Trade and Industry (METI). 2016. Japan’s Energy—Twenty Questions to Understand the Current Energy Situation. Ministry of Economy, Trade and Industry of Japan: Tokyo.
Monnin, P. 2015. “The Impact of Interest Rates on Electricity Production Costs.” 2018, 1, 31. https://www.cepweb.org/wp-content/uploads/CEP_DN_Interest_Rates _Energy_Prices.pdf. (retrieved: 5 Nov 2019).
Neij, L., 1997. “Use of experience curves to analyse the prospects for diffusion and adoption of renewable energy technology.” Energy Policy, 25 (13): 1099–1107.
Nemet, G.F. 2005. “Beyond the Learning Curve: Factors Influencing Cost Reductions in Photovoltaics.” Energy Policy 34 (17): 3218–3232.
Phillips, P.C., and B.E. Hansen. 1990. “Statistical Inference in Instrumental Variables Regression with I(1) Processes.” Review of Economic Studies, 57 (1): 99–125.
Pillai, U. 2014. “Cost Reduction in Crystalline Silicon Solar Modules.” https://www.aaai.org/ocs/index.php/FSS/FSS14/paper/viewFile/9131/9122 (accessed 18 Feb 2020).
Sachs, J., W.T. Woo, N. Yoshino, and F. Taghizadeh-Hesary. 2019. “Importance of Green Finance for Achieving Sustainable Development Goals and Energy Security.” In Handbook of Green Finance: Energy Security and Sustainable Development, edited by J. Sachs, W.T. Woo, N. Yoshino, and F. Taghizadeh-Hesary. Tokyo: Springer.
Solar Power Europe. 2015. “Global Market Outlook for Solar Power 2015–2019.”: 2018,1,19. http://www.solarpowereurope.org/fileadmin/user_upload/ documents/Publications/Global_Market_Outlook_2015_-2019_lr_v23.pdf.
———. 2016. “Global Market Outlook for Solar Power 2016–2020.”: 2018,1,19. http://www.solareb2b.it/wp-content/uploads/2016/06/SPE_GMO2016 _full_version.pdf.
Taghizadeh-Hesary, F., E. Rasoulinezhad, and Y. Kobayashi. 2016. “Oil Price Fluctuations and Oil Consuming Sectors: An Empirical Analysis of Japan.” Economics and Policy of Energy and the Environment 2 (19): 33–5. DOI: 10.3280/EFE2016-002003.
ADBI Working Paper 1084 F. Taghizadeh-Hesary et al.
19
Taghizadeh-Hesary, F., and N. Yoshino. 2019. “The Way to Induce Private Participation in Green Finance and Investment.” Finance Research Letter. 31: 98–103. DOI: 10.1016/j.frl.2019.04.016.
Taghizadeh-Hesary, F., N. Yoshino, M.M.H. Abadi, and R. Farboudmanesh. 2016. “The Response of Macro Variables of Emerging and Developed Oil Importers to Oil Price Movements.” Journal of the Asia Pacific Economy 21 (1): 91–102. DOI: 10.1080/13547860.2015.1057955.
Taghizadeh-Hesary, F., N. Yoshino, G. Abdoli, and A. Farzinvash. 2013. “An Estimation of the Impact of Oil Shocks on Crude Oil Exporting Economies and their Trade Partners.” Frontiers of Economics in China 8: 571–91. DOI: 10.3868/s060-002-013-0029-3.
Taghizadeh-Hesary, F., N. Yoshino, and Y. Inagaki. 2019. “Empirical Analysis of Factors Influencing the Price of Solar Modules.” International Journal of Energy Sector Management 13 (1): 77–97. DOI:10.1108/IJESM-05-2018-0005.
Wong, S.L., W.M. Chia, and Y. Chang. 2013. “Energy Consumption and Energy R&D in OECD: Perspectives from Oil Prices and Economic Growth.” Energy Policy 第 62: 巻.
Yoshino, N., F. Taghizadeh-Hesary, and M. Nakahigashi. 2019. “Modelling the Social Funding and Spill-over Tax for Addressing the Green Energy Financing Gap.” Economic Modelling 77: 34–41. DOI: 10.1016/j.econmod.2018.11.018.