Analyzing Survey Questions According to Departments and Checking the Reliability of Them for an...
17
www.ccsenet.org/ijbm International Journal of Business and Management Vol. 7, No. 6; March 2012 Published by Canadian Center of Science and Education 185 Analyzing Survey Questions According to Departments and Checking the Reliability of Them for an Organization İmran Aslan (Corresponding author) Faculty of Engineering, Boğaziçi University İstanbul, Turkey Tel: 90-531-515-1428 E-mail: [email protected] Orhan Çınar Faculty of Economics and Administrative Sciences, Atatürk University Erzurum, Turkey E-mail: [email protected] Selahattin Yavuz Faculty of Economics and Administrative Sciences, Erzincan University Erzincan, Turkey E-mail: [email protected] Received: November 22, 2011 Accepted: December 21, 2011 Published: March 16, 2012 doi:10.5539/ijbm.v7n6p185 URL: http://dx.doi.org/10.5539/ijbm.v7n6p185 Abstract Kipaş Group decided to change its management structure due to internal problems and changing environmental conditions. Thus, we have carried out some surveys to gather information about the organization. In this article, the results of surveys conducted at the reorganization project of Kipaş Group are presented with some important findings. 40 questions about the group were asked to 38 persons from the top management. Moreover, interviews were carried out after they filled the survey. The questions are grouped according to their related field. The attributes of survey were analyzed to compare the departments and check the validity of the survey. Reliability analysis is used to see the internal consistency of survey. To improve the internal consistency, some items were deleted from groups. Keywords: Reliability, Statistical analysis, Satisfaction analysis 1. Introduction Firms are like living organism. They have the steps of born-improve-disappear. Changes are unavoidable and firms need to adapt themselves to changes coming from intern and outside and requirements. There was a strong competition between two owner families’ members of the group. Each family has wanted to get more control over the group. Moreover, removal of quotas and globalization forced the firm to make internal and external changes. Kipaş which was founded 26 years ago when the Turkish textile and apparel sector initiated continuing progress by joint-venture of two families employs more than 4000 workers in textile sector. Kipaş Group decided to change its management structure considering recent developments in textile sector and raising conflicts among stakeholders due to the management system of the company. In order to collect data, internal and external analyses of the firm were carried out. Surveys, interviews and observations methods were used for internal analysis. The survey results are analyzed in this study. To reorganize the group, survey and interview methods were selected to collect data. The questions are categorized according to departments and the mean and standard deviation of each question were analyzed. To check the validity of groups, the Cronbach Alpha (α) Coefficient is used.
Transcript of Analyzing Survey Questions According to Departments and Checking the Reliability of Them for an...

www.ccsenet.org/ijbm International Journal of Business and Management Vol. 7, No. 6; March 2012
Published by Canadian Center of Science and Education 185
Analyzing Survey Questions According to Departments and Checking the Reliability of Them for an Organization
İmran Aslan (Corresponding author)
Faculty of Engineering, Boğaziçi University
İstanbul, Turkey
Tel: 90-531-515-1428 E-mail: [email protected]
Orhan Çınar
Faculty of Economics and Administrative Sciences, Atatürk University
Erzurum, Turkey
E-mail: [email protected]
Selahattin Yavuz
Faculty of Economics and Administrative Sciences, Erzincan University
Erzincan, Turkey
E-mail: [email protected]
Received: November 22, 2011 Accepted: December 21, 2011 Published: March 16, 2012
doi:10.5539/ijbm.v7n6p185 URL: http://dx.doi.org/10.5539/ijbm.v7n6p185
Abstract
Kipaş Group decided to change its management structure due to internal problems and changing environmental conditions. Thus, we have carried out some surveys to gather information about the organization. In this article, the results of surveys conducted at the reorganization project of Kipaş Group are presented with some important findings. 40 questions about the group were asked to 38 persons from the top management. Moreover, interviews were carried out after they filled the survey. The questions are grouped according to their related field. The attributes of survey were analyzed to compare the departments and check the validity of the survey. Reliability analysis is used to see the internal consistency of survey. To improve the internal consistency, some items were deleted from groups.
Keywords: Reliability, Statistical analysis, Satisfaction analysis
1. Introduction
Firms are like living organism. They have the steps of born-improve-disappear. Changes are unavoidable and firms need to adapt themselves to changes coming from intern and outside and requirements. There was a strong competition between two owner families’ members of the group. Each family has wanted to get more control over the group. Moreover, removal of quotas and globalization forced the firm to make internal and external changes.
Kipaş which was founded 26 years ago when the Turkish textile and apparel sector initiated continuing progress by joint-venture of two families employs more than 4000 workers in textile sector. Kipaş Group decided to change its management structure considering recent developments in textile sector and raising conflicts among stakeholders due to the management system of the company. In order to collect data, internal and external analyses of the firm were carried out. Surveys, interviews and observations methods were used for internal analysis. The survey results are analyzed in this study.
To reorganize the group, survey and interview methods were selected to collect data. The questions are categorized according to departments and the mean and standard deviation of each question were analyzed. To check the validity of groups, the Cronbach Alpha (α) Coefficient is used.
www.ccsenet.org/ijbm International Journal of Business and Management Vol. 7, No. 6; March 2012
ISSN 1833-3850 E-ISSN 1833-8119 186
In Kipaş, it was noticed that the family members who are relatives or family employed friends get more gain than other workers. This was indicated by some workers with same status. The organization seemed to be divided by family members and non-family members. The results of survey were combined with related interviews’ questions in the article.
Organization image is an important indicator of the organization for employees to send their applications. More institutionalized firms have fewer problems while employing new workers than firms in which workers are mainly family members. Firms try to create a good image in job seekers pool in order to be applied. The firms should have a clear recruitment policy for that purpose. Families owned firms are in competition to get more control over the firm if there is more than one family of ownership. Firms are not alone in the market and they are whether in competition or corporation with others. The external factors help the firms to design their internal structure and strategies or force them for new adjustments. The firm’s image, culture, market value, policies et cetera create a perceived value or an evaluation score for customers and job seekers towards buying its product and for applications (Walker et al, 2011; Aslan and Çınar, 2010). On the other hand, finding the right person for the organization and the job is always a challenged situation. Person-Organization and Person-Job fits are weighted when a person is hired. Firms searches for candidate that fits their organizational culture and goals. So, there should be a compatibility of the candidate for the organization and job. The weight of each of them depends on strategies of the organization. The person with Person-Organization weight will share more similar characteristics and personality with other organizational managers, which result in more trust and easy management but some knowledge intense works needed skills less influenced from norms and culture. Strategic Human Resource Management will bring added value to firms operations to find the right person for the right position in the long run (Sekiguchi et al, 2011; Ayanda and Danlami, 2011). In this point of view, the organizational justice should be fair against all workers while making decisions. It is favorable for different organizational and work oriented outputs. It is also difficult to make a fair one in family owned firms. The absence of fair can be the source of problems (İnce and Gül, 2011).
2. Theoretical Background
2.1 Organizational Change
If one consider about the need for organizational change it can be said that nothing remains stable in the world of business. The rate of change that organizations face has increased recently because of advances in technology and the globalization of supply chains. All organizations must take right action not to be left behind by the competition because of improvements and of changes in environment or customer demands. However, as much as 50% of all change efforts fail, often as a result of poor change leadership. It is suggested that these failures are commonly related to human issues, not technical issues (Self et al, 2007).
The general aim of organizational change is an adaptation to the environment or an improvement in performance (Del Val and Fuentes, 2003). Each organization has its own dynamics to change. The formation of change differs with the effects of the environment that determine the durations and the speed of the process of change (Hoogendoorn et al, 2006).
Burtonshaw-Gunn (2008) suggests a model that shows a range of changes which an organization may wish to adopt. According to this, the easier changes at the bottom of the pyramid offer the least level of discomfort for employees and that these lower level changes also require the least amount of time and cost. Similarly, the higher levels necessitate substantial time and investment and as such are much harder to implement.
Insert Figure 1- here
Di Virgilio and Ludema (2009) argue that the goal of organizational change is to make a shift in the distribution of actions, behaviors, and practices within the organization by changing the network of conversations, and the role of the change leader is to enable change by engaging organizational members in language interventions such as redefining the meaning of words, proposing alternative schema, crafting new visions, or creating conditions for transformative dialogue.
There are a number of factors that should be considered by management to implement the necessary changes. It is obvious that inconsistent strategies with the demands of the situation –the people, the cultural setting and the environment- will cause problems and fail to help the long-term required changes. It is recommended that the management should take into account the following factors (Burtonshaw-Gunn, 2008):
The degree of the opposition expected.
The power base of the change initiator.
www.ccsenet.org/ijbm International Journal of Business and Management Vol. 7, No. 6; March 2012
Published by Canadian Center of Science and Education 187
The need for information, communication and commitment when planning and carrying out the change.
The nature of the current organization’s culture and its likely response to change.
2.2 Consistency Coefficient
The most widely used consistency coefficient is Crobach Alfa Coefficient. Alfa Coefficient is the sum of all questions variance over whole variance of the survey as seen in Equation 1. It is used to measure the freedom degree of questionnaire from random errors (Hora et al, 2009). Surveys distributed randomly are expected to have a high alpha coefficient. Surveys with a high score are more internally consistent (Brown, 2002). Low alpha results in wrong assessment for making decisions. In this case, the survey results should not be used to make scientific conclusions (Spiliotopoulou, 2010). Moreover, alpha coefficient measures the relationship among questions to find how well they are homogeny. Ideally, the measurements that are taken with a scale would always replicate perfectly. However, in the real world there are a number of external random factors that can affect the way that respondents provide answers to a scale. Cronbach Alpha measures squared correlation between observed scores and true scores (Yu, 2010). A particular measurement taken with the scale is therefore composed of two factors: the theoretical "truescore" of the scale and the variation caused by random factors. Reliability is a measure of how much of the variability in the observed scores actually represents variability in the underlying true score. The higher the reliability of the scale, the easier it is to obtain significant findings. Low reliability only hurts chances of finding significant results. In this way, using a scale with low reliability is analogous to conducting an experiment with a small number of participants (DeCoster and Claypool, 2004; Zumbo, 1999). To get reliable results, the sample size of survey is important. Low sample size can result in unstable coefficients. There are some methods to learn sample size in order to get reliable coefficients by using some simulation programs. Reliability power analysis can be used by researchers to determine the appropriate sample size (Yurdugül, 2008; Spiliotopoulou, 2010).
(1)
Si2 is the variance of i question and Sp2 is the variance of whole survey.
If Alpha:
0.00 =< α < 0.40 not consistent
0.40 =< α < 0.60 low consistent
0.60 =< α < 0.80 consistent
0.80 =< α < 1.00 highly consistent (Esensoy et al, 2000)
There are some criticisms excluding some items from the groups or survey to increase the reliability of survey since deleting items may lead to a decrease the content (Tan, 2009). An estimate of error variance is needed to have an estimate of alpha (Vehkalahti et al, 2006). If you estimate 55% of you storages and the real value is 50%, there is 5% error. It is expected that the error of measurement is to be minimized (Yu, 2010).
The output from this analysis includes reliability analysis. We use this to determine whether there are any bad items in our scale. The column labeled corrected item-total correlation tells us the correlation between each item and the average of the other items in the scale. The column labeled Alpha if item deleted tells us what the reliability of scale would be if we would delete the given item. We want to keep out any items where the reliability of the scale would drop if it were deleted. Initially, all questions are included for each group. Then, each question for each group is excluded from group to see the effect of this question on the group. If the question decreases the reliability of the group under 0.7, it will be excluded from the group and analysis will be done without this question. From the output of analysis, the number of cases (surveys), number of items (questions) and reliability coefficient α can be seen. Also, interclass coefficient can be seen for each case. At the end of each group, there is a graph summarizing each group results.
3. Statistical Analysis
Statistical analysis is carried out to compare the groups of questions. With this analysis, the weakest group is determined and other groups are compared according to their mean. Moreover, questions of the groups are compared with each other. Reliability analysis is used to check whether decisions made are consistent or not. Groups with low reliability are excluded from analysis. Moreover, bad items and questions of survey were
www.ccsenet.org/ijbm International Journal of Business and Management Vol. 7, No. 6; March 2012
ISSN 1833-3850 E-ISSN 1833-8119 188
determined.
3.1 Group Analysis
Survey questions are divided into 7 main groups to see the picture of company more clearly. Each group is analyzed subsequently. The mean and standard deviation are 3.91 and 0.75 respectively for the whole Holding. The mean of whole question is good. It is expected to be the group mean as low as possible. The questions having high average take attention, which means the workers are not happy about it.
Satisfaction analysis is a simple way to analyze each question. With this analysis, all questions can be compared with each other. Strong and weak parts of the firm can be found. Questions with low score will take the attention of analyzers.
(2)
The number of each people select a scale is multiplied with its score and divided the sum of people to find a satisfaction score as shown in the equation 2. At scaling table, there are scales for each value, see Table 1. As result, the higher score means that they are more satisfied with the situation. By looking this score, each question can be analyzed more easily. The mean of seven scales should be 50.
Insert Table 1- here
In pie charts, scale is divided into three main sections and the percent of people entering is found in each group to find whether workers are happy, little happy or unhappy, which is parallel with frequency graphs to see more clearly the results. When we look at seven scales, it is more difficult to analyze. Thus, with three sections, it is easier to see the picture of each question as shown in Table 2.
Insert Table 2- here
3.1.1 Finance Group
There are 5 questions at this group. Mean of these questions is 3.15 and so it is good according to general mean which is about 3.91. Q24 has best result and Q33 has worst result for this group. As it can be seen from the result of Q24, company’s investment is excellent. However, accounting and financial systems is not good for company.
Mean of whole group 3.15
Standard Deviation 1.45
Q1-How do you see your company among your competitors?
Q2-How do you see the financial position of your company?
Q33-What do you think about accounting and financial systems of your company?
Q38-What do you think about way of the payments of your company?
Q24-What do you think about your company’s investment?
Insert Figure 2- here
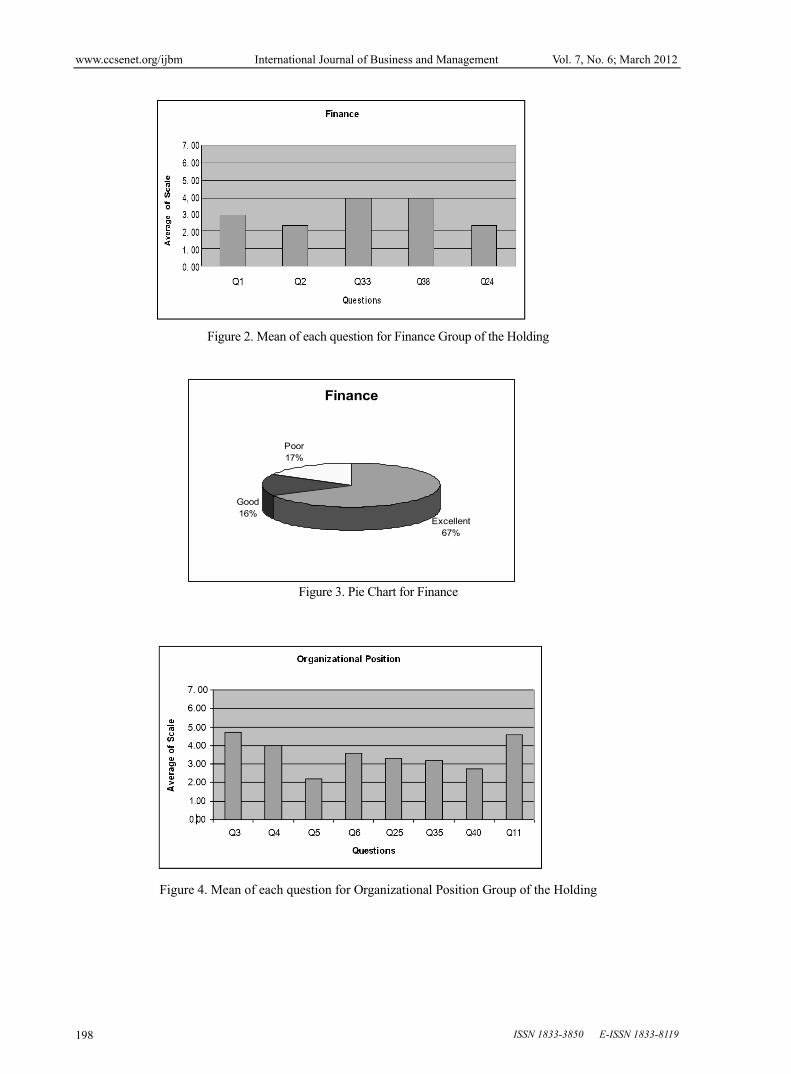
According to frequency pie chart, 67 percent of workers select excellent section, 16 percent of workers select good section, and 17 percent of workers select poor section. Its satisfaction level is 62.18 and Q24 has the highest satisfaction level. So, it can be said that the financial position of the firm is very good. In reality, their financial position is very strong.
Insert Figure 3- here
Insert Table 3- here
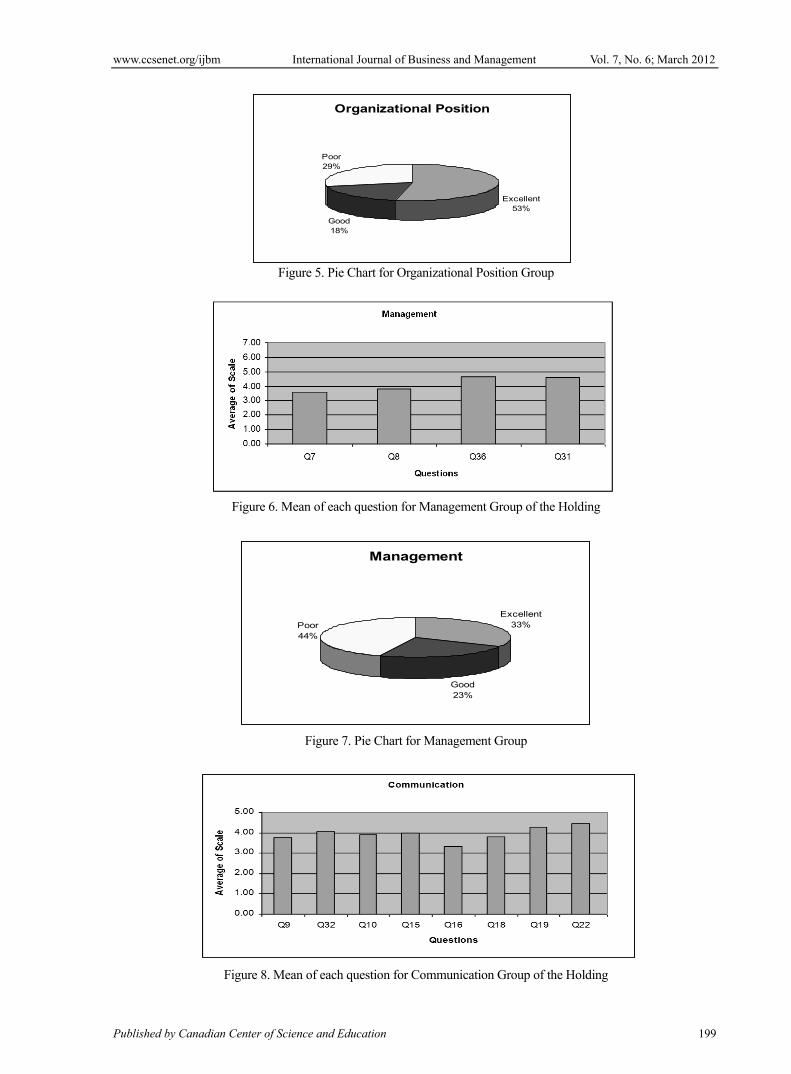
3.1.2 Organizational Position
There are eight questions for Organizational Group. This group’s mean is 3.54 and it is smaller than general mean. So it can be said that, Organizational Position of firm is good. Q5 has the best result for this group, which shows that local ethics of company is perfect. Q3 has the worst result showing that organization of company is not good. The main problem of organization was old organizational structure without clear definition of hierarchy and responsibilities.
Mean 3.54
Standard Deviation 1.56
www.ccsenet.org/ijbm International Journal of Business and Management Vol. 7, No. 6; March 2012
Published by Canadian Center of Science and Education 189
Q3-What do you think about the organization of your company?
Q4-What do you think about the customers’ potential?
Q5-What do you think about local ethics of your company?
Q6-What do you think about your top managers’ opening and activities for your company?
Q25-What do you think about international fame of your company?
Q35-What do you think about your company power against the new competitors?
Q40-Where do you want to see your company after 5 years?
Q11-What do you think about the structure of your organization?
Insert Figure 4- here
As it can be seen from the pie chart, 53 percent of the workers select excellent section, 18 percent of the workers select good section, and 29 percent of the workers select poor section. Moreover, Satisfaction Level for this group is 55.94 and Q5 has the highest Satisfaction Level.
Insert Figure 5- here
Insert Table 4- here
3.1.3 Management Group
The mean of the whole group is 4.16, which is greater than the general mean of Kipaş. So, the management is not good and workers are not happy about the management according to mean. Q31 has the worst mean and Q7 has the lowest mean. Moreover, the standard deviation of the group is very high.
Mean 4.16
Standard Deviation 1.44
Q7-What do you think about your managers’ education and knowledge?
Q8-What do you think about your managers’ approach when there is a problem?
Q36-What do you think about the efficiency of the processes?
Q31-What do you think about creativity activities of your company?
Insert Figure 6 here
Insert Figure 7 here
Insert Table 5 here
33 percent of the workers select excellent section whereas 44 percent of workers select poor section. The satisfaction level is 45.44 which is not good. 56 percent of people select good and excellent section. As result management is not good by looking both at satisfaction level and pie chart.
3.1.4 Communication
The mean of communication group is a bit greater than general mean of Kipaş and its standard deviation is high again. Q22 has a very big mean and Q9 has the lowest mean.
Mean 3.96
Standard Deviation 1.37
Q9 - What do you think about the relationships between customers and your managers?
Q32 - What do you think about company approach to the complaints of customers?
Q10 - What do you think about the relationships between workers and your managers?
Q15 - What do you think about relationships between your company and suppliers?
Q16 - What do you think about politics relationships of your company?
Q18 - What do you think about relationships between competitors and your company?
Q19 - What do you think about relationships among the workers?
Q22 - What do you think about communication among the workers?
Insert Figure 8- here

www.ccsenet.org/ijbm International Journal of Business and Management Vol. 7, No. 6; March 2012
ISSN 1833-3850 E-ISSN 1833-8119 190
Insert Figure 9- here
Insert Table 6- here
37 percent of workers select excellent section and 36 percent of workers select poor section. The satisfaction level is good and Q16 has the highest satisfaction level in this group. It can be said that the communication level of the firm is low. There was not any good communication channel among firms. Each firm worker blamed other when there was a problem related supply chain. One could not see the whole operation of firms when they were processed.
3.1.5 Sales and Marketing
The mean of sales and marketing is greater than the general mean of the firm. Planning and logistics question (Q30) has a large mean in this group. Moreover, its standard deviation is high.
Mean 4.20
Standard Deviation 1.44
Q14-What do you think about sales activity of your company?
Q27-What do you think about your company’s approach for new markets and products?
Q28-What do you think about marketing activities of your company?
Q30-What do you think about planning and logistic activities of your company?
Q37-What do you think about expansion of your company to the other countries?
Insert Figure 10- here
Insert Figure 11- here
Insert Table 7- here
The satisfaction level of sales and marketing is not so good.46 percent of workers select poor section in pie chart. This section was reorganized. Especially to increase the sale potential of firm abroad, new functions were opened in the organizational chart.
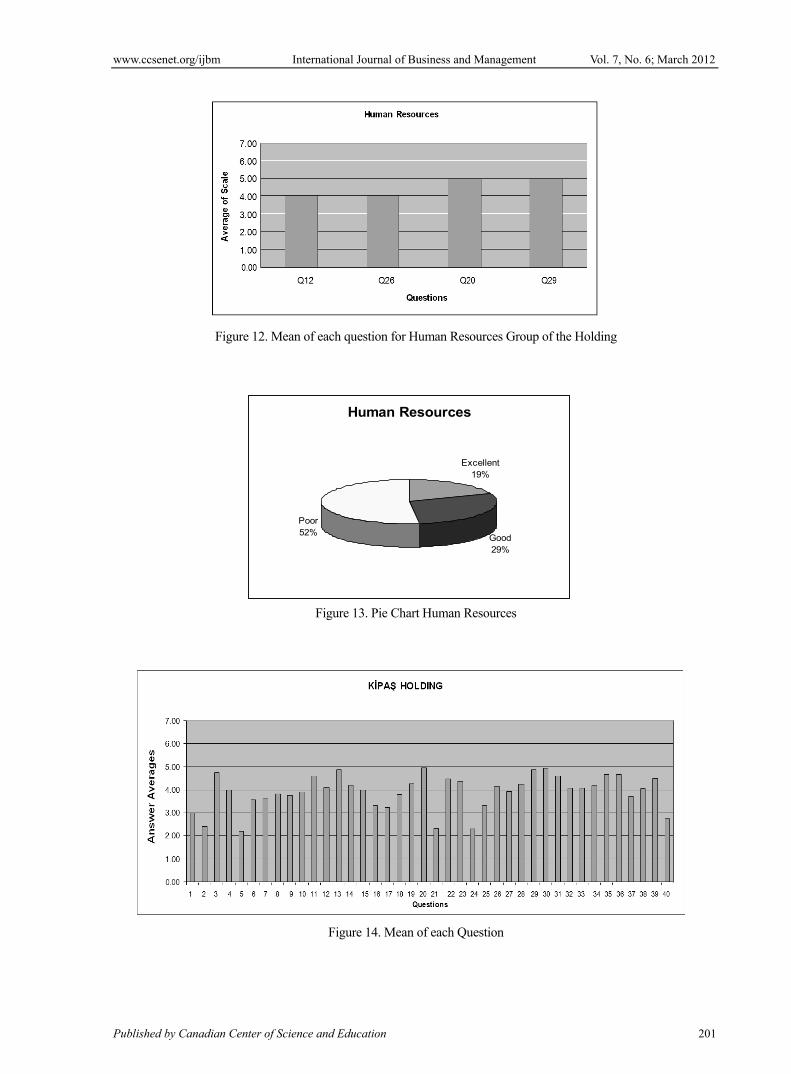
3.1.6 Human Resources
The mean of human resources is very high and the firm has some problems in that section. In fact, they did not have human resources department. So it is normal that the mean of human resources is high. They did not apply performance measurement and also they did not have any carrier planning system. Workers were employed according to the wishes of owners. Each family wanted to get more employ from their side to get more control in the group.
Mean 4.51
Standard Deviation 1.37
Q12 -What do you think that your company gives enough attention for the education?
Q26 -What do you think about workers’ education and knowledge?
Q20 -What do you think about performance measurement system of your company?
Q29 -What do you think about authority and responsibility balance in the company?
Insert Figure 12- here
Insert Figure 13- here
Insert Table 8- here
The Satisfaction Level of the human resources is very low. Half of the workers say that human resources are poor for firm. A new human resource and development section was opened in new organization chart. In interviews, there was strong conflicts and discussion among workers.
3.1.7 Technology
The reliability coefficient for this group is 0.4390 which is low and so none comments can be drawn from about this group since the questions are not inter-correlated. They are consistent in each other but they are not consistent in a group.
Q21-What do you think about production technologies of your company?
www.ccsenet.org/ijbm International Journal of Business and Management Vol. 7, No. 6; March 2012
Published by Canadian Center of Science and Education 191
Q23-What do you think about information technologies of your company?
Q34-What do you think about engineering approach of your company?
Insert Figure 14- here
The questions having high average take attention, which means the workers are not happy about it. Each group is compared with mean of whole holding. The best and worst departments are determined based on this analysis. 20thand 30thquestions have the worst mean. There was not any performance measurement system in the group. Even hard worker of the group was not got enough attention and payment than other. They could not show themselves while others did not allow them to go further. They have mainly concentrated to employ cheap workers than well qualified ones. Another problem was that if they employed good qualified workers with good payments, other workers would not accept it and so they could not change the whole team. Distance among firms and the quick requirement of logistics activities of the group prevented for a single company to make effective planning. Thus, new functions for this section were opened for domestic and foreign markets.
3.2 Reliability Analysis
Survey consisting forty questions divided into seven groups. Initially, all questions are included for each group. Then, each question for each group is excluded from group to see the effect of this question on the group. If the question decreases the reliability of the group under 0.7, it will be excluded from the group and analysis will be done without this question. From the output of analysis, the number of cases (surveys), number of items (questions) and reliability coefficient α can be seen. Also, interclass coefficient can be seen for each case. At the end of each group, there is a graph summarizing each group results.
3.2.1 Finance
Initially, we include all other questions and find a reliability coefficient for whole group. Then; each question is excluded from the group to see the effect of it. Finance group is reliable when all questions are included. But; two questions decrease the reliability of the group from 0.7591 to 0.6878 and 0.6884 respectively shown on the table. Other questions do not affect the reliability of the group very much. You can see the reliability and correlation coefficient interval for each case.
Insert Table 9- here
3.2.2 Communication
By looking at the reliability coefficients, they are almost the same and highly reliable. Excluding each question does not change the situation. The whole is more reliable than other cases.
Insert Table 10- here
3.2.3 Human Resource
Group is reliable without excluding any questions but when the third and the fourth question of the group excluded, its reliability decreases as low reliable.
Insert Table 11- here
3.2.4. Management
This group is consistent when each question is excluded. Moreover, it is reliable wholly.
Insert Table 12- here
3.2.5 Organizational Position
This group has a high reliability coefficient and it is highly reliable when each question excluded too.
Insert Table 13- here
3.2.6 Technology
Technology group takes special attention when compared with other groups since it has the least reliability and is not reliable. But, when we take out two questions respectively, its reliability decreases more from 0.4390 to 0.2304 and 0.1432 respectively whereas its reliability increases from 0.4390 to 0.5491. When, the number of scales decreases, and the reliability coefficient changes more. It isn’t possible to find significant results in technology. Therefore, this section is not used to make scientific conclusions.
Insert Table 14- here
3.2.7 Sales and Marketing
In this group, reliability decreases from highly reliable to reliable for four questions whereas it increases for one
www.ccsenet.org/ijbm International Journal of Business and Management Vol. 7, No. 6; March 2012
ISSN 1833-3850 E-ISSN 1833-8119 192
question from 0.8071 to 0.8638. Its reliability is over 0.7, which is a desired score. So, it is beneficial to use the results of this group according to reliability analysis.
Insert Table 15- here
4. Conclusion
Mean and satisfaction analysis are helpful to persuade the owners of firm to make critical decisions. In face to face interviews, they may have not been so brave to tell everything. Especially, in table meetings, everybody was in position to back up his/her department. But after surveys, they have been able to learn the option of other workers about their departments. Survey results support our observations and interviews. From survey results, it is seen that they have a strong financial position with a high satisfaction score and workers are aware of it, but they were not happy about payments. They found their salary low. From survey results, it is seen that the weakest part of the firm is its human resource. From satisfaction analysis, it can be seen clearly. Moreover, workers had many complaints about HR in interviews. In reality, they did not have any effective human resource and people in critical positions were tried to be filled by incapable family members or relatives. Furthermore, they did not have any strategic HR planning activity. To prepare the firm for future, a well establish human development plan is a requirement for the firms. The firm has made deep revisions its HR. They have opened new braches abroad and tried to get here capable persons.
Reliability analysis is helpful to see validity of groups. From this analysis, technology has a low alpha score. Thus, none decisions are given based on this group. The number of surveys could be increased to raise the alpha value. In this kind of surveys, homogeneity increases as the number of surveys increases. Other groups have acceptable alpha values. This study is limited to Kipaş Group and can be used for the same kind of firms for the same purposes.
References
Aslan, I., & Çınar, O. (2010). The institutionalization of a family business: restructuring and the process of preparation successors for the management. Organizasyon ve Yönetim Bilimleri Dergisi, 2(1), 89-97.
Ayanda, O. J., & Danlami, A. S. (2011). Strategic Human Resource Management and Organizational Performance in the Nigerian Manufacturing Sector: An Empirical Investigation. International Journal of Business and Management, 6(9), 46-56. http://dx.doi.org/10.5539/ijbm.v6n9p46
Brown J. D. (2002). The Cronbach alpha reliability estimate. JALT Testing & Evaluation SIG Newsletter. 6(1), 17-18.
Burtonshaw- Gunn, S. (2008). The Essential Management Toolbox: Tools, Models and Notes for Managers and Consultants.
DeCoster J., & Claypool H. (2004). Data Analysis in SPSS. [Online] Available: http://decoster.socialpsychology.org/#research (January 1, 2005)
Del Val, M. P., & Fuentes, C. M. (2003). Resistance to change: a literature review and empirical study. Management Decision, 41(2), 148-155. http://dx.doi.org/10.1108/00251740310457597
Di Virgilio, M. E., & Ludema, J. (2009). Let’s Talk: Creating Energy for Action through Strategic Conversations. Journal of Change Management, 9(1), 67-85. http://dx.doi.org/10.1080/14697010902727211
Esensoy Ö., Sertkaya, D., & ve Büyükyazıcı, M. (2000). Hizmet endüstrisinde anket uygulaması, değerlendirmesi ve anket güvenirliği, İstanbul.
Hoogendoorn, M., Jonker, C.M., & Treur, J. (2006). Simulating Organizational Change Triggered by a Changing Environment. In Proceedings of the 20th European Conference on Modeling and Simulation, 28-31. Bonn, Germany, European Council for Modeling and Simulation, pp. 532-539.
Hora H. R. M., Arica J., & Freitas J. D. C. (2009). Questionnaires reliability and scale purification: an experiment with the Cronbach alpha. 3rd International Conference on Integrity, Reliability and Failure, Porto, Portugal.
İnce, M., & Gül, H. (2011). The Effect of Employees' Perceptions of Organizational Justice on Organizational Citizenship Behavior: An Application in Turkish Public Institutions. International Journal of Business and Management, 6(6), 134-149.
Sekiguchi, T., & Huber, V. L. (2011). The use of person–organization fit and person–job fit information in making selection decisions. Organizational Behavior and Human Decision Processes, 116, 203-216. http://dx.doi.org/10.1016/j.obhdp.2011.04.001
www.ccsenet.org/ijbm International Journal of Business and Management Vol. 7, No. 6; March 2012
Published by Canadian Center of Science and Education 193
Self, D. R., Armenakis, A. A., & Schraeder, M. (2007). Organizational Change Content, Process, and Context: A Simultaneous Analysis of Employee Reactions. Journal of Change Management, 7(2), 211-229. http://dx.doi.org/10.1080/14697010701461129
Spiliotopoulou, G. (2010). Reliability reconsidered: Cronbach's alpha and paediatric assessment in occupational therapy. Australian Occupational Therapy Journal, 1-17. [Online] Available: http://bura.brunel.ac.uk/bitstream/2438/3260/1/Reliability%20reconsidered%20BURA.pdf (January 1, 2005)
Tan Ş. (2009). Misuses of KR-20 and Cronbach’s Alpha Reliability Coefficients. Education and Science, 34(152).
Vehkalahti K., Puntanen S., & Tarkkonen L. (2006). Estimation of reliability: a better alternative for Cronbach’s alpha. [Online] Available: http://mathstat.helsinki.fi/reports/Preprint430.pdf (January 1, 2005)
Walker, H. J., Field, H. S., Giles, W. F., Bernerth, J. B., & Short, J. C. (2011). So what do you think of the organization? A contextual priming explanation for recruitment Web site characteristics as antecedents of job seekers’ organizational image perceptions. Organizational Behavior and Human Decision Processes, 114, 165-178.
Yu C. H. (2010). An introduction to computing and interpreting Cronbach Coefficient Alpha in SAS. Arizona State University, Tempe, AZ.
Yurdugül H. (2008). C ronbach alfa katsayısı için minimum örneklem genişliği: Monte-Carlo Çalışması. Hacettepe Üniversitesi Eğitim Fakültesi Dergisi (H. U. Journal of Education), 35, 397-405.
Zumbo, B. D. (1999). A glance at coefficient alpha with an eye towards robustness studies: Some mathematical notes and a simulation model (Paper No. ESQBS-99-1). Prince George, B.C.: University of Northern British Columbia. Edgeworth Laboratory for Quantitative Behavioural Science. [Online] Available: http://www.consumerstar.org/pubs/Culturalcompselfassess.pdf
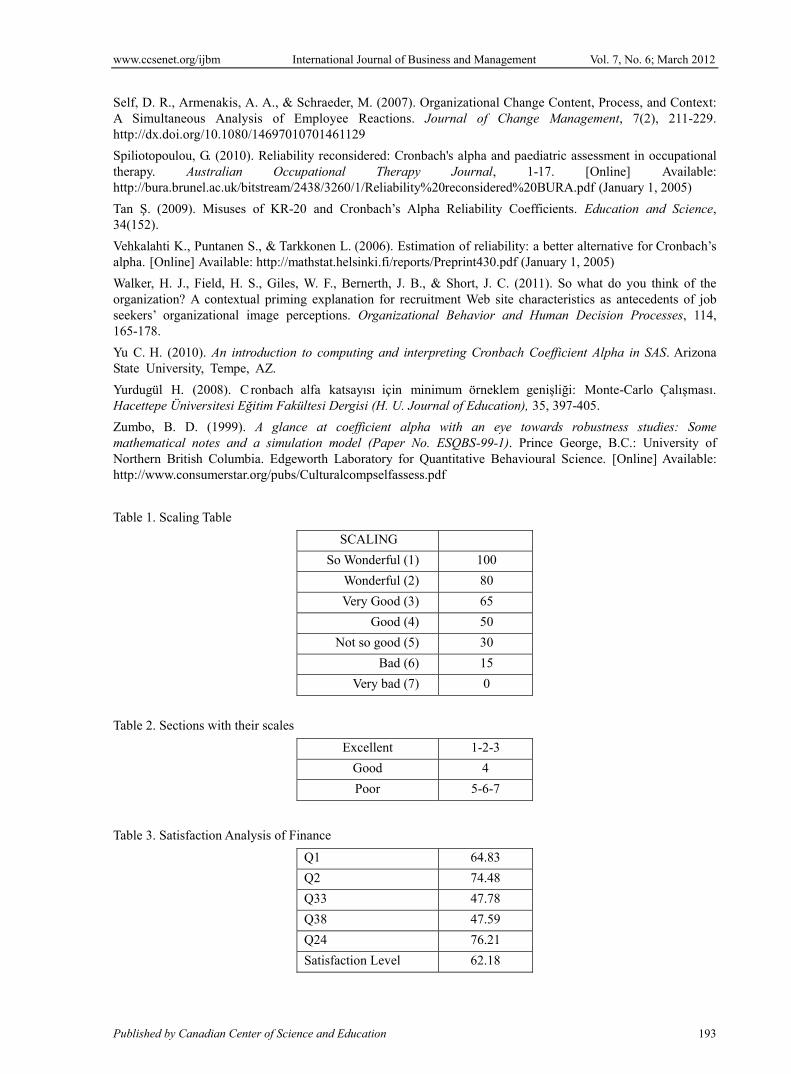
Table 1. Scaling Table
SCALING
So Wonderful (1) 100
Wonderful (2) 80
Very Good (3) 65
Good (4) 50
Not so good (5) 30
Bad (6) 15
Very bad (7) 0
Table 2. Sections with their scales
Excellent 1-2-3
Good 4
Poor 5-6-7
Table 3. Satisfaction Analysis of Finance
Q1 64.83
Q2 74.48
Q33 47.78
Q38 47.59
Q24 76.21
Satisfaction Level 62.18
www.ccsenet.org/ijbm International Journal of Business and Management Vol. 7, No. 6; March 2012
ISSN 1833-3850 E-ISSN 1833-8119 194
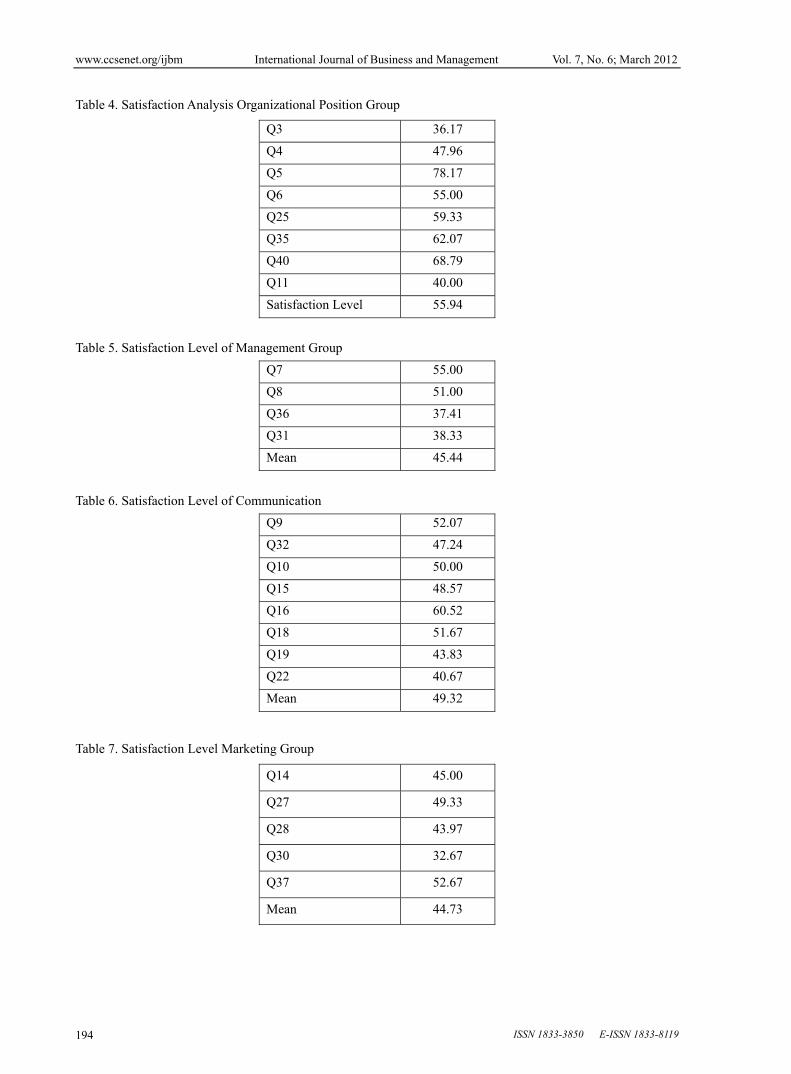
Table 4. Satisfaction Analysis Organizational Position Group
Q3 36.17
Q4 47.96
Q5 78.17
Q6 55.00
Q25 59.33
Q35 62.07
Q40 68.79
Q11 40.00
Satisfaction Level 55.94
Table 5. Satisfaction Level of Management Group
Q7 55.00
Q8 51.00
Q36 37.41
Q31 38.33
Mean 45.44
Table 6. Satisfaction Level of Communication
Q9 52.07
Q32 47.24
Q10 50.00
Q15 48.57
Q16 60.52
Q18 51.67
Q19 43.83
Q22 40.67
Mean 49.32
Table 7. Satisfaction Level Marketing Group
Q14 45.00
Q27 49.33
Q28 43.97
Q30 32.67
Q37 52.67
Mean 44.73
www.ccsenet.org/ijbm International Journal of Business and Management Vol. 7, No. 6; March 2012
Published by Canadian Center of Science and Education 195
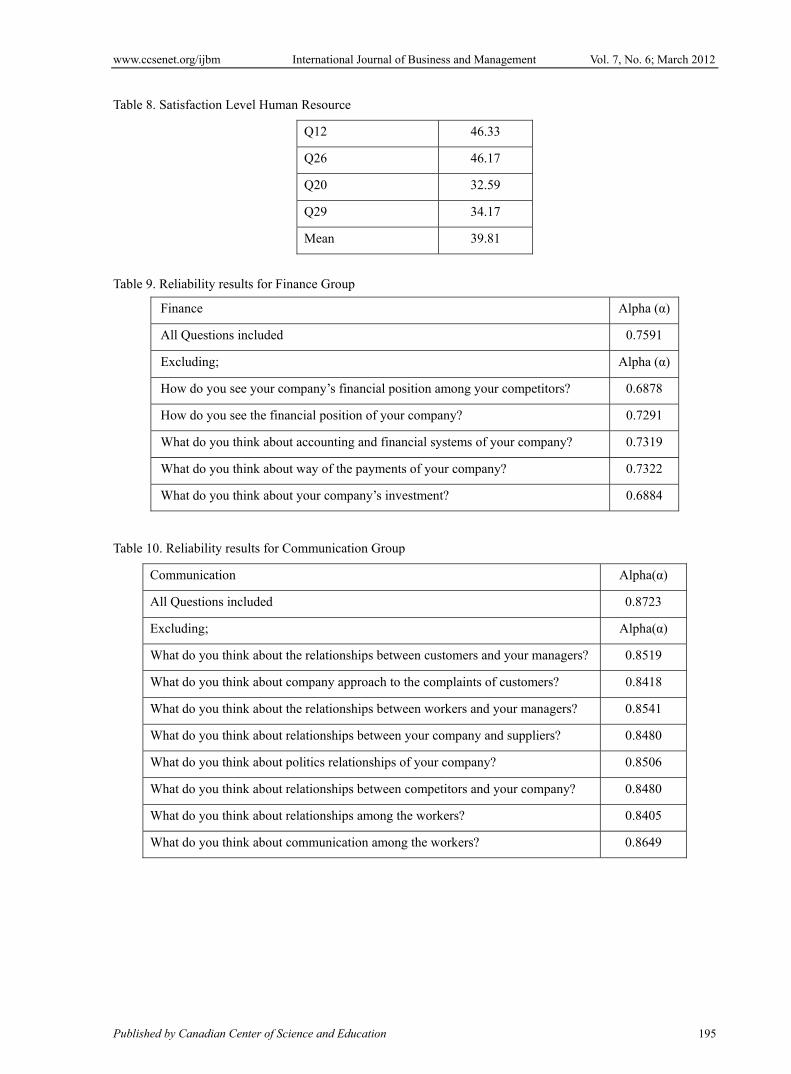
Table 8. Satisfaction Level Human Resource
Q12 46.33
Q26 46.17
Q20 32.59
Q29 34.17
Mean 39.81
Table 9. Reliability results for Finance Group
Finance Alpha (α)
All Questions included 0.7591
Excluding; Alpha (α)
How do you see your company’s financial position among your competitors? 0.6878
How do you see the financial position of your company? 0.7291
What do you think about accounting and financial systems of your company? 0.7319
What do you think about way of the payments of your company? 0.7322
What do you think about your company’s investment? 0.6884
Table 10. Reliability results for Communication Group
Communication Alpha(α)
All Questions included 0.8723
Excluding; Alpha(α)
What do you think about the relationships between customers and your managers? 0.8519
What do you think about company approach to the complaints of customers? 0.8418
What do you think about the relationships between workers and your managers? 0.8541
What do you think about relationships between your company and suppliers? 0.8480
What do you think about politics relationships of your company? 0.8506
What do you think about relationships between competitors and your company? 0.8480
What do you think about relationships among the workers? 0.8405
What do you think about communication among the workers? 0.8649

www.ccsenet.org/ijbm International Journal of Business and Management Vol. 7, No. 6; March 2012
ISSN 1833-3850 E-ISSN 1833-8119 196
Table 11. Reliability results for Human Resource Group
Human Resource Alpha(α )
All Questions included 0.7612
Excluding; Alpha(α)
What do you think that your company gives enough attention for the education? 0.7539
What do you think about workers’ education and knowledge? 0.6741
What do you think about performance measurement system of your company? 0.6386
What do you think about authority and responsibility balance in the company? 0.7337
Table 12. Reliability results for Management Group
Management Alpha (α)
All Questions included 0.8306
Excluding; Alpha(α)
What do you think about your managers’ education and knowledge? 0.8699
What do you think about your managers’ approach when there is a problem? 0.7618
What do you think about the efficiency of the processes? 0.7193
What do you think about creativity activities of your company? 0.7370
Table 13. Reliability results for Organizational Position
Organizational Position Alpha(α)
All Questions included 0.8291
Excluding Alpha(α)
What do you think about the organization of your company? 0.8008
What do you think about the customers’ potential? 0.8188
What do you think about local ethics of your company? 0.8402
What do you think about your top managers’ opening and activities for your company? 0.8020
What do you think about international fame of your company? 0.8206
What do you think about your company power against the new competitors? 0.7764
Where do you want to see your company after 5years? 0.7934
What do you think about the structure of your organization? 0.8081

www.ccsenet.org/ijbm International Journal of Business and Management Vol. 7, No. 6; March 2012
Published by Canadian Center of Science and Education 197
Table 14. Reliability results for Technology
Technology Alpha(α)
All Questions included 0.4390
Excluding; Alpha(α)
What do you think about production technologies of your company? 0.5491
What do you think about information technologies of your company? 0.2304
What do you think about engineering approach of your company? 0.1432
Table 15. Reliability results for Sales and Marketing
Sales and Marketing Alpha(α)
All Questions included 0.8071
Excluding; Alpha(α)
What do you think about sales activity of your company? 0.7378
What do you think about your company’s approach for new markets and products? 0.7239
What do you think about marketing activities of your company? 0.7535
What do you think about planning and logistic activities of your company? 0.8638
What do you think about expansion of your company to the other countries? 0.7461
Figure 1. Change Pyramid
www.ccsenet.org/ijbm International Journal of Business and Management Vol. 7, No. 6; March 2012
ISSN 1833-3850 E-ISSN 1833-8119 198
Finance
Good16%
Poor17%
Excellent67%
Figure 2. Mean of each question for Finance Group of the Holding
Figure 3. Pie Chart for Finance
Figure 4. Mean of each question for Organizational Position Group of the Holding
www.ccsenet.org/ijbm International Journal of Business and Management Vol. 7, No. 6; March 2012
Published by Canadian Center of Science and Education 199
Management
Good23%
Poor44%
Excellent33%
Organizational Position
Good18%
Poor29%
Excellent53%
Figure 5. Pie Chart for Organizational Position Group
Figure 6. Mean of each question for Management Group of the Holding
Figure 7. Pie Chart for Management Group
Figure 8. Mean of each question for Communication Group of the Holding

www.ccsenet.org/ijbm International Journal of Business and Management Vol. 7, No. 6; March 2012
ISSN 1833-3850 E-ISSN 1833-8119 200
Communication
Good27%
Poor36%
Excellent37%
Sales & Marketing
Good23%
Poor46%
Excellent31%
Figure 9. Pie Chart for Communication Group
Figure 10. Mean of each question for Sales and Marketing Group of the Holding
Figure 11. Pie Chart for Sales and Marketing Group
www.ccsenet.org/ijbm International Journal of Business and Management Vol. 7, No. 6; March 2012
Published by Canadian Center of Science and Education 201
Human Resources
Good29%
Poor52%
Excellent19%
Figure 12. Mean of each question for Human Resources Group of the Holding
Figure 13. Pie Chart Human Resources
Figure 14. Mean of each Question