Analyzing rockfall activity (1600–2002) in a protection forest—a case study using...
18
Analyzing rockfall activity (1600–2002) in a protection forest—a case study using dendrogeomorphology Markus Stoffel a, * , Dominique Schneuwly a , Michelle Bollschweiler a , Igor Lie `vre a , Reynald Delaloye a , Moe Myint b , Michel Monbaron a a Groupe de Recherches en Ge ´omorphologie (GReG), Department of Geosciences, Geography, chemin du Muse ´e 4, University of Fribourg, 1700 Fribourg, Switzerland b Remote Sensing and GIS Unit, Department of Geosciences, Geography, University of Fribourg, 1700 Fribourg, Switzerland Received 28 October 2003; received in revised form 19 November 2004; accepted 20 November 2004 Available online 6 January 2005 Abstract For the first time, dendrogeomorphology has been used to investigate spatial and temporal variations of rockfall activity in a protection forest. We report results of 564 cores from 135 severely injured Larix decidua Mill. trees on the west-facing Ta ¨schgufer slope, Swiss Alps. While trees sampled reached an age of 297 years on average, the oldest one attained breast height in AD 1318. For reasons of sample depth, the analysis was limited to the period 1600–2002. In total, we reconstructed 741 growth disturbances (GD) during the last four centuries. Impacts were most commonly found in trees located in the southern part of the slope, where GD recurred more than once per decade. In contrast, trees in the northern part were less frequently disturbed by rockfall and define recurrence intervals of more than 150 years. Throughout the last four centuries, rockfall has caused GD to the trees sampled on the Ta ¨schgufer slope, most frequently in the form of low magnitude–high frequency events. In addition, we identified one high magnitude–low frequency event in 1720, which displaced the forest fringe of the northern sector a considerable distance downslope and eliminated an entire forest stand. To analyze past rockfall activity, we introduce a brateQ defined as the number of impacts per meter width of all tree surfaces sampled per decade. Results clearly demonstrate that this rockfall brateQ continually decreased in both sectors after the large 1720 rockfall event. Significantly low rockfall bratesQ can be observed during the 1850s, 1960s and 1970s in the northern and during the 1820s in the southern sector. In contrast, high rockfall bratesQ were identified during the 1870s and 1990s in the northern, and during the 1770s in the southern sector. Reconstructed data further show that the forest recolonizing the southern sector after the 1720 event gradually improved its protective function, reducing bratesQ by a factor of 13 between the 1740s and the 1990s. In the recent past, bratesQ oscillated around 0.7 GD 1 meter width 1 (10 years) 1 . In the well-established forest of the northern sector, the efficacy of the protective forest was temporarily reduced by the rockfalls in 1720, resulting in increased rockfall bratesQ. Since then, the protective 0169-555X/$ - see front matter D 2004 Elsevier B.V. All rights reserved. doi:10.1016/j.geomorph.2004.11.017 * Corresponding author. Tel.: +41 26 300 90 10; fax: +41 26 300 97 46. E-mail address: [email protected] (M. Stoffel). Geomorphology 68 (2005) 224 – 241 www.elsevier.com/locate/geomorph
-
Upload
independent -
Category
Documents
-
view
0 -
download
0
Transcript of Analyzing rockfall activity (1600–2002) in a protection forest—a case study using...

www.elsevier.com/locate/geomorph
Geomorphology 68 (
Analyzing rockfall activity (1600–2002) in a protection
forest—a case study using dendrogeomorphology
Markus Stoffela,*, Dominique Schneuwlya, Michelle Bollschweilera, Igor Lievrea,
Reynald Delaloyea, Moe Myintb, Michel Monbarona
aGroupe de Recherches en Geomorphologie (GReG), Department of Geosciences, Geography, chemin du Musee 4,
University of Fribourg, 1700 Fribourg, SwitzerlandbRemote Sensing and GIS Unit, Department of Geosciences, Geography, University of Fribourg, 1700 Fribourg, Switzerland
Received 28 October 2003; received in revised form 19 November 2004; accepted 20 November 2004
Available online 6 January 2005
Abstract
For the first time, dendrogeomorphology has been used to investigate spatial and temporal variations of rockfall
activity in a protection forest. We report results of 564 cores from 135 severely injured Larix decidua Mill. trees on the
west-facing Taschgufer slope, Swiss Alps. While trees sampled reached an age of 297 years on average, the oldest one
attained breast height in AD 1318. For reasons of sample depth, the analysis was limited to the period 1600–2002. In
total, we reconstructed 741 growth disturbances (GD) during the last four centuries. Impacts were most commonly
found in trees located in the southern part of the slope, where GD recurred more than once per decade. In contrast,
trees in the northern part were less frequently disturbed by rockfall and define recurrence intervals of more than 150
years.
Throughout the last four centuries, rockfall has caused GD to the trees sampled on the Taschgufer slope, most frequently in
the form of low magnitude–high frequency events. In addition, we identified one high magnitude–low frequency event in 1720,
which displaced the forest fringe of the northern sector a considerable distance downslope and eliminated an entire forest stand.
To analyze past rockfall activity, we introduce a brateQ defined as the number of impacts per meter width of all tree surfaces
sampled per decade. Results clearly demonstrate that this rockfall brateQ continually decreased in both sectors after the large
1720 rockfall event. Significantly low rockfall bratesQ can be observed during the 1850s, 1960s and 1970s in the northern and
during the 1820s in the southern sector. In contrast, high rockfall bratesQ were identified during the 1870s and 1990s in the
northern, and during the 1770s in the southern sector.
Reconstructed data further show that the forest recolonizing the southern sector after the 1720 event gradually improved its
protective function, reducing bratesQ by a factor of 13 between the 1740s and the 1990s. In the recent past, bratesQ oscillatedaround 0.7 GD 1 meter width�1 (10 years)�1. In the well-established forest of the northern sector, the efficacy of the protective
forest was temporarily reduced by the rockfalls in 1720, resulting in increased rockfall bratesQ. Since then, the protective
0169-555X/$ - s
doi:10.1016/j.ge
* Correspondi
E-mail addre
2005) 224–241
ee front matter D 2004 Elsevier B.V. All rights reserved.
omorph.2004.11.017
ng author. Tel.: +41 26 300 90 10; fax: +41 26 300 97 46.
ss: [email protected] (M. Stoffel).

M. Stoffel et al. / Geomorphology 68 (2005) 224–241 225
function of the forest stand has increased again, resulting in a rate of 0.4 GD 1 m width�1 (10 years)�1 during the late 20th
century.
D 2004 Elsevier B.V. All rights reserved.
Keywords: Dendrogeomorphology; Rockfall; Growth disturbances; Frequency; Magnitude; Protection forest; Swiss Alps
1. Introduction
Rockfall represents the most intensely studied
geomorphic process of the cliff zone in mountainous
areas (Luckman and Fiske, 1995). Nevertheless, little
information exists on how rockfall frequencies and
magnitudes vary over time. So far, studies have mainly
been based on short-term observations of contempo-
rary rockfall activity in the field (e.g., Luckman, 1976;
Douglas, 1980; Gardner, 1980, 1983), rendering it
difficult to estimate long-term accretion rates. Long-
term estimates of rockfall accumulation rates have, in
contrast, been derived from accumulated talus vol-
umes (e.g., Rapp, 1960). But such rates may, as
Luckman and Fiske (1995) pertinently object, neither
be representative of the present-day rockfall activities
nor of those that prevailed in the past. Hetu and Gray
(2000) managed to avoid this problem by combining
present-day processes and stratigraphic data to study
the dynamics of scree slopes throughout the post-
glacial period. On slopes composed of siliceous
lithologies, lichenometry has repeatedly been used to
evaluate the mean age or activity of talus surfaces
(Andre, 1986, 1997) or to estimate 50-year and long-
term rates of rockfall accretion (Luckman and Fiske,
1995). Finally, McCarroll et al. (1998) combined a
lichen-based analysis of spatial and temporal patterns
of past rockfall activity with a modeling approach.
Simultaneously, investigations of forest–rockfall
interactions have tended to evolve towards the
analysis of mountain forests as a means of protection
against rockfall (e.g., Bebi et al., 2001; Berger et al.,
2002). Hetu and Gray (2000) indicated that forest
cover would provide effective protection in the case of
low magnitude–high frequency rockfall events, but
could not prevent the devastating effects of high-
magnitude events.
However, quantitative information on the effect of
forest stands on the downslope movement of rockfall
boulders remains insufficient. The previously men-
tioned studies on rockfall activity or the distribution of
scree give a reasonable overview of long-term
fluctuations, but they lack more detailed data on
decadal or even yearly variations in rockfall activity
on a slope. In contrast to their use in other mass
movement processes (e.g., Shroder, 1980; Wiles et al.,
1996; Fantucci and Sorriso-Valvo, 1999; Solomina,
2002, Stoffel et al., in press), tree-ring analyses have
been used only rarely in rockfall research, where the
focus in these few cases has been on sedimentation
rates, the dynamics of forest fringes on scree slopes
(Lafortune et al., 1997) or the seasonal timing of past
rockfall activity (Stoffel et al., in press).
It is therefore the purpose of the present paper to
use tree-ring analysis in order to: (1) analyze the
magnitude and frequency; (2) determine spatial
variations; (3) derive decadal and yearly variations
in rockfall activity on a forested slope. In it, we use a
rockfall brateQ to reconstruct and evaluate fluctuations
in rockfall activity. Results were obtained from two
neighboring sectors differing in both their age
structure and recurrence intervals. In total, 564
increment cores of 135 European larch trees (Larix
decidua Mill.) were analyzed, documenting decadal
and yearly variations in rockfall activity on a forested
slope at Taschgufer (Valais, Swiss Alps) over more
than 400 years.
2. Study area
The area investigated was the west-facing Tasch-
gufer slope. As can be seen from Fig. 1, the
Taschgufer slope descends from the Leiterspitzen
summit (3214 m a.s.l.) in the Siviez–Mischabel nappe,
southern Swiss Alps. Rockfall frequently occurs on
the slope, originating from the heavily disintegrated
gneissic rockwalls below the Leiterspitzen summit.
Layers of this weak bedrock generally strike SSW and
dip WNW with angles of 40–808 (Lauber, 1995), thuscontaining joints dipping out of the slope. The main
rockfall source areas on the slope are located between

Fig. 1. Location of the study site. (A) The Taschgufer slope is located in the southern Swiss Alps, northeast of the village of Tasch. (B) The
detailed sketch illustrates the rockfall slope with the main rockfall source areas and trajectories, the rockslide deposits and the dams built after
1988 (Dams 1–7).
M. Stoffel et al. / Geomorphology 68 (2005) 224–241226
2300 and 2600 m a.s.l. (Rockfall Source Area 2) and
above 2700 m a.s.l. (Rockfall Source Area 1), where
bedrock is highly fractured with many joints. As
suggested by a locally calibrated permafrost distribu-
tion model (Gruber and Hoelzle, 2001), Rockfall
Source Area 2 would be located on the borderline
between seasonal frost and permafrost environments.
The presence of contemporary permafrost is con-
firmed on the southern edge of the slope between
2400 and 2500 m a.s.l., where ground ice was
encountered during construction work (Haeberli,
1992; see Fig. 2).
On the upper slope, mean slope gradients locally
rise up to 488 and gradually decrease to 208 near thevalley floor. The volume of single rockfall fragments
normally does not exceed 2 m3. Besides frequent
rockfall activity, one rockslide is noted in chronicles
(Zurbriggen, 1952). Its age was estimated with
lichenometry to be at least 600 years BP (Joris,
1995). The spatial extent of the rockslide deposits
can be seen in Fig. 1B. Furthermore, small debris
flows may occur at Taschgufer. Single events
generally amount to a few cubic meters and move
downslope in well-defined channels. In contrast,
snow avalanches have never been witnessed on the
slope.
The forest at Taschgufer predominantly consists of
L. decidua Mill. trees, accompanied by single Picea
abies (L.) Karst. and Pinus cembra ssp. sibirica trees.
Although the regional timberline is located at approx-
imately 2300 m a.s.l. in the immediate neighborhood,
continuous forest cover reaches only 1780 m a.s.l. in
the most heavily affected areas of the active rockfall
slope. As shown in Fig. 1B, surfaces are sparsely
wooded in this part of the slope and large areas remain
free of vegetation.

Dam 7
Dam 6
1
2
Leiterspitzen
Fig. 2. View of the upper Taschgufer slope and the Leiterspitzen summit (3214 m a.s.l.): Note the main Rockfall Source Areas (1, 2), the main
rockfall trajectories (arrows) and the zone where ground ice has been encountered (star) during construction works (Photo: D. Schneuwly).
M. Stoffel et al. / Geomorphology 68 (2005) 224–241 227
In the recent past, rockfall regularly caused damage
to roads and hiking trails. For example, on October 6,
1985, single blocks reached the valley floor, damag-
ing agricultural buildings in the village of Tasch
(Valais). According to Lauber (1995), rockfall activity
at Taschgufer apparently increased in the 1980s and
again after 1993. These observations have recently
been confirmed with dendrochronological analysis
(Stoffel et al., in press), which further indicated that
almost 90% of the intra-annual rockfall activity at
Taschgufer occurs in April and May. As a response to
the increased rockfall activity, five deflection dams
were erected in 1988 (Dam 1) and 1989 (Dams 2–5;
see Fig. 1B). In the late 1990s, two large protection
dams completed the construction works on the slope
(Dams 6–7, see Fig. 2).
3. Material and methods
3.1. Sampling strategy
As shown in Fig. 3, dendrogeomorphological
investigations were conducted in the protection forest1
1 Protection forest: forest stand which directly protects people,
buildings and infrastructure against the impacts of mass wasting
events such as landslides, rockfall or snow avalanches (see Brang,
2001).
north of Tasch (1440 to 1760 m a.s.l.). Within the
study area covering approximately 39 ha, virtually all
trees (L. decidua Mill.) show visible damage related
to rockfall activity (i.e., broken crowns or branches,
scars, tilted stems). We sampled severely affected
trees with obvious signs of growth disturbances (GD)
from both the rockslide deposits (northern sector) and
the southern sector of the slope. The separation of the
two parts of the slope (Fig. 3) is based on the different
origins of rockfall material. As indicated in Fig. 1B,
trees located in the northern sector are normally
subject to rockfall fragments from the Rockfall Source
Area 1, while the samples growing in the southern
sector are predominantly influenced by boulders
originating at Rockfall Source Area 2. We therefore
analyze the two parts of the slope separately and refer
to them as bnorthern sectorQ and bsouthern sectorQ. Inaddition, we excluded a well-defined area in the
southern sector, which is influenced by both rockfall
and debris flow activity (Fig. 3).
In this investigation, at least 4 cores were extracted
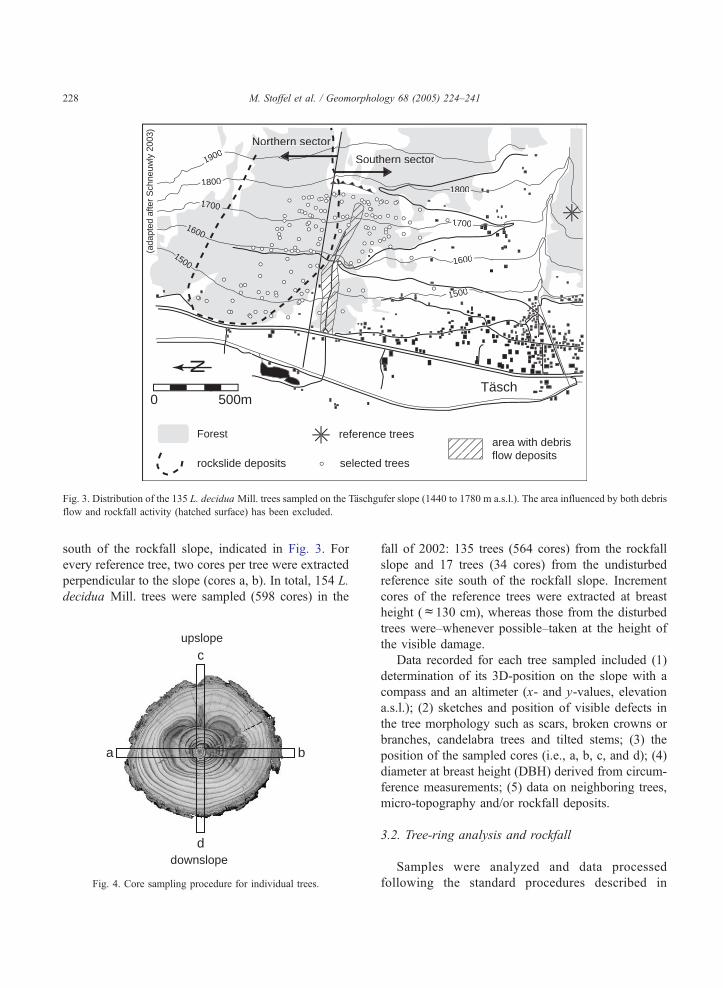
per tree using increment borers. Fig. 4 illustrates that
one core was taken upslope (core c), one downslope
(core d) and two cores perpendicular to the slope
(cores a, b). In the case of visible scars, further
increment cores were extracted from the wound and
the overgrowing callous tissue. In addition to the
disturbed trees sampled at Taschgufer, we sampled
undisturbed reference trees from a forest stand located
Täsch
1500
15005
1600
1700
01800
1600
11700
1800
1900
N
0 500m
rockslide deposits selected trees
reference treesarea with debrisflow deposits
Souuthern sectorS
NorNorthern sector(a
dapt
ed a
fter
Sch
neuw
ly 2
003)
Forest
Fig. 3. Distribution of the 135 L. decidua Mill. trees sampled on the Taschgufer slope (1440 to 1780 m a.s.l.). The area influenced by both debris
flow and rockfall activity (hatched surface) has been excluded.
M. Stoffel et al. / Geomorphology 68 (2005) 224–241228
south of the rockfall slope, indicated in Fig. 3. For
every reference tree, two cores per tree were extracted
perpendicular to the slope (cores a, b). In total, 154 L.
decidua Mill. trees were sampled (598 cores) in the
c
ba
d
upslope
downslope
Fig. 4. Core sampling procedure for individual trees.
fall of 2002: 135 trees (564 cores) from the rockfall
slope and 17 trees (34 cores) from the undisturbed
reference site south of the rockfall slope. Increment
cores of the reference trees were extracted at breast
height (c130 cm), whereas those from the disturbed
trees were–whenever possible–taken at the height of
the visible damage.
Data recorded for each tree sampled included (1)
determination of its 3D-position on the slope with a
compass and an altimeter (x- and y-values, elevation
a.s.l.); (2) sketches and position of visible defects in
the tree morphology such as scars, broken crowns or
branches, candelabra trees and tilted stems; (3) the
position of the sampled cores (i.e., a, b, c, and d); (4)
diameter at breast height (DBH) derived from circum-
ference measurements; (5) data on neighboring trees,
micro-topography and/or rockfall deposits.
3.2. Tree-ring analysis and rockfall
Samples were analyzed and data processed
following the standard procedures described in

2 The term drockfall brateQT used in this paper is only a proxy fo
the true rate. We therefore keep the quotation marks whenever using
this term.
M. Stoffel et al. / Geomorphology 68 (2005) 224–241 229
Braker (2002). Single steps of sample analysis
included surface preparation, skeleton plots as well
as ring-width measurements using digital LINTAB
positioning tables connected to a Leica stereomicro-
scope and TSAP 3.0 (Time Series Analysis and
Presentation) software (Rinntech, 2003). Growth
curves of the disturbed samples were then crossdated
with the reference chronology (1596–2002) con-
structed from 17 undisturbed L. decidua Mill. trees.
This procedure allowed differentiation of climatically
driven fluctuations in tree growth within the study
area from GD caused by rockfall activity (Cook and
Kairiukstis, 1990).
Growth curves were then used to determine the
initiation of abrupt growth reductions or recovery
(Schweingruber, 1996). In the case of tilted stems,
both the appearance of the cells (i.e., structure and
color of the reaction wood cells) and the growth curve
data were analyzed (e.g., Shroder, 1980; Braam et al.,
1987; Fantucci and Sorriso-Valvo, 1999). Further
focus was placed on the visual analysis of callous
tissue overgrowing rockfall scars and traumatic rows
of resin ducts (Larson, 1994; Schweingruber, 2001).
As resin ducts may result from causes other than
rockfall (e.g., climate, wind, insects, fraying or
browsing by ungulates), thresholds were needed to
determine bresin duct eventsQ caused by rockfall
activity. Criteria were defined using 270 stem discs
sampled on the same slope (Stoffel et al., in press) that
showed both tree damage (scars, decapitation) and
resin ducts. As a result, resin ducts were only
considered the product of rockfall activity if they
formed (a) traumatic, (b) extremely compact and (c)
continuous rows. Both the presence of resin ducts on
multiple radii in a single year and the occurrence of
multiple consecutive years with traumatic rows of
resin ducts were used as further indicators but not a
compulsory criterion. In contrast, neither dispersed
resin ducts within a single tree ring nor the presence of
traumatic rows of resin ducts occurring in the years
following an event represents bresin duct eventsQ.Characteristic examples of disturbed stem discs and
respective growth curves are illustrated in Fig. 5.
Reconstructed GD of individual trees were then
compiled in a database (Schneuwly, 2003). For every
individual tree, we determined recurrence intervals by
dividing its age at breast height by the number of
dated GD.
Judging the frequency or magnitude of single event
years or decadal fluctuations in the number of GD
proved to pose a considerable problem: So far,
dendrogeomorphology has mainly involved the anal-
ysis of impacts by geomorphic processes that have a
relatively large volume or surface area, such as debris
flows, snow avalanches or floods. In contrast, rockfall
consists of single falling, bouncing or rolling stones
which may only disturb trees along their trajectories
and within a range defined by the size of the clast.
Further, only the effects of a single boulder are
recorded, whereas the fall itself may be composite.
Finally, important differences emerged as to the age of
the individual trees, their DBH and their decadal DBH
increment which rendered absolute comparisons of
past rockfall activity difficult.
We therefore use a rockfall brateQ2 expressed as
number of rockfalls (GD) per meter width of all tree
surfaces sampled per decade instead of analyzing
absolute values. The brateQ is based on the idea that
thick stems expose a larger target (DBH) to falling
rocks than thin ones and so large trunks are more
likely to be subject to GD. We then determined the
yearly DBH increment of every individual tree by
dividing its DBH by the number of rings between pith
and sample year (2002) at breast height. In a further
step, values were multiplied by the number of years a
tree had existed at the beginning of a particular
decade. The DBH values of all trees existing at the
beginning of a particular decade were then summar-
ized to comprise what we refer to as exposed diameter
(ED; in m). To obtain the rockfall brateQ, the decadal
sum of GD was finally divided by the ED, indicating
the number of GD recorded per meter ED and per
decade. Within this study, increment rates in trees
were considered to remain constant, disregarding
juvenile growth or ageing trends.
In addition to the decadal rockfall bratesQ, the treessampled in the two sectors were classed according to
their age at breast height (oldest to youngest) and split
into two samples each. In both cases, Sample 1 was
formed with the uneven samples (i.e., oldest, 3rd
oldest, 5th oldest, . . .), while Sample 2 contained the
even ones (i.e., 2nd oldest, 4th oldest, 6th oldest, . . .).
r

Rin
g w
idth
Years
Rin
g w
idth
Years
A
B
C
decapitation
injury(scar)
tilting
Stem discs Ring width measurements
abrupt growth decrease
eccentric growth
21
2
1
21
2
1
callous growth + resin ducts
Rin
g w
idth
Years
abrupt growth release
21
2
1
elimination of neighboring tree(s)
D
Fig. 5. Evidence used to infer rockfall events.
M. Stoffel et al. / Geomorphology 68 (2005) 224–241230
We then calculated rockfall bratesQ for these samples
as well.
In a further step, the rockfall bratesQ of the entire
populations as well as those of Samples 1 and 2 were
converted from real into logarithmic values, a power
regression trend line calculated and residuals from the
regression model determined.
Due to the difficulties of dendrogeomorphological
analysis in rockfall research and in order to analyze
variations in decadal rockfall bratesQ, we arbitrarily
chose a range of F1.15 standard errors on the
regression fit, assuming a normal distribution of the
residuals from the regression model, as a criterion for
identifying exceptional rockfall bratesQ. Indeed, dec-adal rockfall bratesQ located within these F1.15
standard errors (called Var75%) were considered to
be noise and therefore insignificant. In contrast, the
25% of rockfall bratesQ lying beyond these limits were
subject to analysis in greater detail.
Finally, we used yearly rockfall bratesQ (real
values) to analyze short-term fluctuations in rockfall
activity for the period 1950–2002. This use of yearly
resolved data on GD also allowed estimation of the
influence of anthropogenic rockfall triggering during
the periods of dam construction work in 1988/89
(Dams 1–5; see Figs. 1B, 2) and 1996–1998 (Dams 6
and 7) as well as the distribution of GD thereafter.
3.3. Spatial visualization of single-tree data
Data on single trees included their position, their
age at breast height, and the number as well as the
years of GD. Tree coordinates were transformed into
geo-objects and information from the database linked
as attributes to the single trees, allowing spatial
visualization of the data in a Geographical Informa-
tion System (GIS). Data were investigated with the
ArcGIS Geostatistical Analyst software (ESRI,

M. Stoffel et al. / Geomorphology 68 (2005) 224–241 231
2003a) in order to examine spatial relationships
between all sample points. Following the procedure
described in Johnston et al. (2001), skewed data were
first transformed to make them normal. Trend
analyses were then used to identify directional
influences (global trends), and data detrended using
second-order polynomials. In a next step, spatial
autocorrelations were analyzed using spherical semi-
variogram models and covariance clouds. As a result,
the numbers of lags and bin sizes have been adapted.
Finally, cross-validation of measured with predicted
points allowed determination of mean prediction
errors of the interpolations. After the exploration of
the data, the Ordinary Kriging model (Johnston et al.,
2001) was chosen for the visualization of continuous
surfaces. Interpolations were performed including
data from five neighboring trees. In angular sections,
at least two trees were taken into consideration.
Results were edited using ArcView 8.3 software
(ESRI, 2003b). Within this study, interpolations were
performed to visualize the age structure of the forest
stand and the spatial distribution of recurrence
intervals.
4. Results
4.1. Age structure of the forest stand
Data on the pith age at breast height indicate that
the 135 sampled L. decidua Mill. trees are, on
average, 297 years old.3 Over the centuries, sampled
trees gradually (re-)colonized the slope to build up the
current forest at Taschgufer. However, we observe that
25% of the sampled trees–mostly those located in the
southern sector–reached breast height between 1725
and 1759.
Fig. 6 illustrates the spatial distribution of the age
structure at Taschgufer, indicating that old trees are
largely concentrated on the northern part of the study
area. In this sector, 78 trees were considered. The
boundaries of age classes broadly correspond with the
outer limits of the rockslide deposits mentioned in
Section 2. The 57 trees sampled in the southern sector
3 All of the numbers given below refer to age at breast height and
do not indicate germination or inception dates.
are, on the other hand, considerably younger and
generally started to (re-)colonize the slope in the early
18th century. The youngest trees are concentrated
alongside the rockfall couloirs underneath Dam 7 and
at the southeastern edge of the study area. Even so,
younger trees are repeatedly located close to the forest
fringes on the valley floor, where anthropogenic
activity markedly influenced tree growth and succes-
sion rates (i.e., farming activities, extraction of fire-
and construction wood).
The major differences in the age structure between
the two sectors also appear in Table 1. While the trees
sampled in this study averaged 362 years in the
northern sector, they have an average age of only 212
years in the southern sector. Similarly, the oldest
sample in the northern sector attained breast height in
AD 1318 and the youngest tree here reached breast
height in 1941. In contrast, the oldest tree from the
southern sector dates to 1596 and the youngest to
1957.
4.2. Visible defects and growth reactions to rockfall
impacts
Investigations permitted identification of 236
visible defects on the 135 L. decidua Mill. stems
chosen for analysis. As illustrated in Table 2,
candelabra trees (=broken crown) largely predomi-
nated among the visible defects. This growth feature
occurs after the decapitation of the crown or part of
the stem and could be identified in 151 cases (64%).
Based on observations in the field, we believe that
candelabra trees at Taschgufer were largely due to
the propagation of impact energies from the lower-
most part of the trunk to the apex of the stem,
resulting in crown breakage between 2 and 13 m
above the ground. In contrast, the decapitation of
tree crowns was only rarely caused by high bounces
of rockfall fragments. Recent or (partly) overgrown
injuries (scars) were observed in 58 cases (25%).
Finally, 27 trees (11%) were obviously tilted by
rockfall impacts.
The analysis of the 564 cores allowed identifica-
tion of 786 GD attributed to rockfall activity on the
slope. In some cases, impacts caused GD in more
than one core of the same tree, reducing the number
of different rockfall events to 761. Table 2 shows
the predominant occurrence of traumatic rows of

Table 2
Different types of damage observed in the field (left) and growth
Täsch
Dam 7
1500
1500
1616001600
1700
01800
1600
11700
018001800
1900
N
0 m500mTäsch
Dam 7
1500
1500
1616001600
1700
01800
1600
11700
018001800
1900
N
0 m500m
251 - 325
45 - 100
101 - 175
176 - 250
326 - 400
401 - 475
476 - 550
Age of trees at breastheight (in years)
Fig. 6. Mean age of L. decidua Mill. trees sampled on the Taschgufer slope. The patterns have been generalized based on interpolations. Ages
are for tree at breast height.
M. Stoffel et al. / Geomorphology 68 (2005) 224–241232
resin ducts. This feature was used in 675 cases
(86%) to determine GD. Abrupt growth suppression
occurred in 50 samples (6.5%), whereas abrupt
growth release and reaction wood could only be
found in 24 cores each (3%). Finally, callous tissue
in cores proved to be rather scarce, occurring in only
13 cases (1.5%).
Characteristic increment curves of cores showing
compression wood, growth suppression and missing
rings after scarring are illustrated in Fig. 7: Tree A
displays an abrupt growth reduction in 1908. As the
indexed reference chronology–marked as REF in Fig.
7–does not show this sudden change in yearly
increment, the growth suppression in Tree A was not
driven by climatic variations but by stem breakage
due to rockfall. The increment curves of Tree B
illustrate that this tree was tilted in 1982 and started to
produce reaction wood on the downhill side (core d)
Table 1
Pith age at breast height of the trees sampled for analysis (in years)
Pith age at breast height Northern sector Southern sector
Mean 362 212
Standard deviation 141.4 75.6
Maximum 684 406
Minimum 61 45
thereafter, while tree-ring formation remained unaf-
fected on the uphill side (core c). In this case,
eccentric growth lasted until the core was extracted
in 2002. Finally, Tree C was apparently scarred in
1970: While the callous tissue had not yet recovered
the injury on the uphill side (core c), it overgrew the
wound at core b–c by 1981.
4.3. Spatial distribution of growth disturbances
In the investigated forest stand at Taschgufer,
reconstructed rockfall activity varied greatly across
the slope. The spatial distribution of interpolated
recurrence intervals are given in Fig. 8, and show that
reactions reconstructed from increment cores (right) at Taschgufer
(adapted after Schneuwly, 2003)
Visible defects Growth reactions
Broken crown 151 (64%) Growth release 24 (3%)
Tilted stem 27 (11%) Growth suppression 50 (6.5%)
Injuries (scars) 58 (25%) Reaction wood 24 (3%)
Callous tissue 13 (1.5%)
Traumatic resin ducts 675 (86%)
Total 236 (100%) Total 786 (100%)

1890 1900 1910 1920 1930 1940 1950 1960 1970 1980 1990 2000
1890 1900 1910 1920 1930 1940 1950 1960 1970 1980 1990 2000
+50
-50
0
Rin
g w
idth
(1/
100m
m)
REF
inde
xed
ref.
Tree A200
100
0
Tree B
600
500
400
300
200
100
0
Tree C
200
100
0
core c
core d
d
b-c
d
c
d
c
core d
core c
core b-c
core d
(Data source: Schneuwly 2003)
c
core c
Fig. 7. Examples of growth disturbances produced by rockfall events. Tree A shows an abrupt growth reduction as a result of stem breakage in
1908. Tree Bwas tilted in 1982 and initiated reactionwood on the downhill side (core d) thereafter. Tree Cwas scarred in 1970:While the scar is not
yet overgrown at core c, callous tissue overgrew the wound at core b–c by 1981. Part of the reference ring width chronology (REF) is also shown.
Täsch
Dam 7
1500
1500
1616001600
17001
01800
1600
11700
018001800
N
0
19001900
500m
> 150 years
100 - 149 years
80 - 99 years
60 - 79 years
40 - 59 years
20 - 39 years
< 20 years
Recurrence intervalsbetween two GD
Fig. 8. Recurrence intervals of GD for the forest stand investigated. Intervals designate the number of years passing between two reconstructed
growth disturbances on a single tree.
M. Stoffel et al. / Geomorphology 68 (2005) 224–241 233

M. Stoffel et al. / Geomorphology 68 (2005) 224–241234
GD abundantly occurred in the trees located above
1700 m a.s.l., where surfaces gradually become more
sparsely forested. Similarly, GD have repeatedly been
reconstructed in trees growing in the rockfall couloirs
of the southern sector below the recently built Dam 7.
Here, trees were regularly disturbed by rockfall
fragments and recurrence intervals were locally b10
years. In a few century-old trees growing close to the
northern sector, dendrogeomorphological analysis
indicates that tree growth has been disturbed almost
twice a decade since the mid-19th century. In contrast,
low numbers of GD can be found in trees growing in
the northern sector. In this part of the slope, recurrence
intervals proved to be particularly high. Here,
intervals between two GD regularly exceeded 150
years and individual century-old trees even showed no
GD at all. Not surprisingly, the spatial pattern of
recurrence intervals largely coincides with the distri-
bution of the age structure seen in Fig. 6 and oldest
trees are commonly found in areas with relatively low
numbers of GD. In contrast, youngest trees are largely
concentrated in areas where rockfall repeatedly caused
GD, leading to increased mortality and subsequently
to higher recruitment rates by opening up sites for
germination.
1600
1700
1800D
N
0 500m
Trees
Trees
Trees
(mod
ified
afte
r S
chne
uwly
200
3)
Fig. 9. Damage resulting from the 1720 rockfall. Thirteen trees have been
1721 (o). The (re-)colonization of the rockfall slope (.) in the succeedingrockfall event.
4.4. Rockfall magnitudes and frequencies
Throughout the last four centuries, rockfall frag-
ments have continuously caused GD to the trees
sampled for analysis. There seems to have been no
period since AD 1600 without rockfall, and activity
most commonly consisted of low magnitude–high
frequency events. In addition, tree-ring and age
structure analyses also allowed identification of one
high magnitude–low frequency event, which (almost)
completely destroyed the forest stand in the southern
sector of the slope in 1720. In the northern sector,
trees sampled were disturbed considerably during the
rockfalls but largely survived. Fig. 9 shows that
according to the reconstructed data, 13 trees were
obviously injured by abundant rockfall. Simultane-
ously, 11 trees reacted to the event with an abrupt
growth release starting in 1721. These trees presum-
ably benefited from the sudden elimination of
neighboring trees, which improved their own growth
conditions (e.g., light, nutrients, humidity). Within the
northern sector, GD mainly occurred in trees located
in the upper part of the slope (above 1590 m a.s.l.).
Here, 16 of the existing 33 trees (48%) showed GD in
1720. In contrast, trees sampled in the lower part of
1500
1600
1700
1800
am 7
showing growth release in 1721
showing injuries in 1720
reaching breast height 1725-1759
injured (+) and 11 trees show an abrupt growth release starting in
decades (1725–1759) most probably represents a reaction to the 1720

M. Stoffel et al. / Geomorphology 68 (2005) 224–241 235
the slope mostly remained unaffected by the 1720
event and scars were only present in 3 of the 21
existing trees (14%). Even so, abrupt growth releases
following the event are missing here. Fig. 9 also shows
that, as an indirect consequence of the high-magnitude
event in 1720, trees abundantly (re-)colonized the
slope. Between 1725 and 1759, 25% of all sampled
trees reached breast height (i.e., 34 trees). Most of the
successor trees were located in the southern sector of
the slope.
4.5. Decadal variations in rockfall activity
4.5.1. Northern sector (1600–1999)
Investigations of rockfall activity in the northern
sector start in the year 1600, when 29 of the trees
sampled were taller than breast height. We hence
disregarded 12 rockfall events occurring between
1394 and 1599, since the sample depth appeared to
be too low for reliable analysis and the individual
trees were unevenly distributed within the sector. The
number of GD was reduced to 400 events derived
from 78 trees. Among all trees sampled in the sector,
the DBH averaged 47.97 cm in 2002. As indicated in
Table 3, the largest and smallest trees were 76.4 and
17.51 cm DBH in 2002. As a result, the decadal DBH
increments varied between 0.6 and 6.29 cm, with an
average increment of 1.56 cm (10 years)�1 tree�1.
While the exposed diameter (ED) of the trees sampled
within the northern sector only totaled 3.9 m at the
beginning of the investigated period in 1600, it
gradually rose to 37.8 m by 1990. Table 3 further
illustrates that the decadal rockfall bratesQ averaged
0.65 GD 1 m ED�1 (10 years)�1.
The reconstructed rockfall bratesQ of the entire
population as well as the bratesQ from Samples 1 and 2
are illustrated in Fig. 10A. For the period before the
Table 3
Size statistics of the trees sampled in the northern sector; DBH:
diameter at breast height as measured in 2002 (in cm), 10-yr DBH:
10-year increment of the DBH (in cm), and rockfall bratesQ [GD 1 m
ED�1 (10 years)�1]
Northern sector DBH 10-yr DBH Rockfall bratesQ
Mean 47.97 1.56 0.65
Standard deviation 12.62 0.97 0.34
Maximum 76.40 6.29 1.53
Minimum 17.51 0.61 0.20
important rockfalls in 1720, rockfall bratesQ indicateconsiderable fluctuations in reconstructed numbers of
GD. As a result of the high-magnitude rockfalls in
1720 and the considerable damage caused to the forest
fringe, the highest decadal rockfall brateQ in the last
four centuries was noted in the 1720s, causing 1 GD
per 0.65 m ED (i.e., a brateQ of 1.53). Since, data
indicate that rockfall activity continually decreased
after the 1720 event (see Fig. 10A), interrupted by
decades with significantly low (1850s, 1960s, 1970s)
and significantly high rockfall bratesQ (1870s, 1990s).During the 19th century, rockfall bratesQ indicate
rather low values during the 1850s (0.24) and, to a
minor extent, the 1810s (0.36). Thereafter, rockfall
caused higher bratesQ during the late 19th and the early20th century (i.e., 1870s, 1890s, 1920s, 1940s).
Within the second half of the 20th century, rockfall
bratesQ indicate a period with low activity lasting from
the 1950s until the 1970s. For the 1970s, a decadal
value of 0.2 was identified, meaning that only one
growth disturbance (GD) occurred every 5 m of
exposed diameter (ED). This period of low activity
was followed by an increase in the rockfall brateQduring the 1980s (0.54) and, even more, the 1990s
(0.57). The importance of this increase as well as the
influence of dam construction works on the decadal
ratios of the 1980s and 1990s will be analyzed below
in Section 4.6.
4.5.2. Southern sector (1740–1999)
Due to the different age structure and the large
number of trees sampled that had grown after the
high-magnitude rockfalls in 1720 in the southern
sector, the analysis of rockfall bratesQ only starts in the
1740s, when 20 of the trees sampled were greater than
breast height. We disregarded 8 reconstructed GD
occurring between 1657 and 1734, since the sample
depth appeared to be too low for reliable analysis. In
total, 341 GD were dated in the 57 trees sampled.
Among the trees sampled, the DBH averaged 48.3 cm
in 2002. As illustrated in Table 4, the largest tree had
79.5 cm and the smallest only 25.4 cm DBH in 2002.
As a result, the decadal DBH increment greatly varied
between 0.78 and 8.59 cm, with an average DBH
increment of 2.70 cm (10 years)�1 tree�1. At the
beginning of the investigation in 1740, the ED of all
trees sampled totaled 0.9 m and gradually rose to 27.7
m by 1990.

100
10
1
0.1
Num
ber
of G
D 1
m E
D -1
(10
yea
rs)
-1
1740
s
1760
s
1780
s
1800
s
1820
s
1840
s
1860
s
1880
s
1900
s
1920
s
1940
s
1960
s
1980
s
1600
s
1620
s
1640
s
1660
s
1680
s
1700
s
1720
s
100
10
1
0.1Num
ber
of G
D 1
m E
D -1
(10
yea
rs)
-1A
B
R2 = 0.6331
R2 = 0.8599
Northern sector (1600-1999)
Southern sector (1740-1999)
Rockfall "rate"
"Rate" Sample 1
"Rate" Sample 2
Power Regression (Rockfall rate)
Var 75% (± 1.15 standard deviation)
1720 rockfalls
1720 rockfalls
?
Fig. 10. Reconstructed rockfall activity. Rockfall activity is measured by the rockfall brateQ (for explanation see text). (A) In the northern sector,
analyses cover the last four centuries (1600–1999), indicating that the large 1720 rockfalls temporarily reduced the protection afforded by the
forest. (B) After the elimination of the forest in the southern sector by the 1720 event, the recolonizing trees permanently improved their
protective function, reducing the number of rockfall impacts on the trees sampled by almost 13 times since the 1740s.
M. Stoffel et al. / Geomorphology 68 (2005) 224–241236
Results on decadal rockfall bratesQ in the southern
sector averaged 2.36 GD 1 m ED�1 (10 years)�1,
which represents a value almost four times higher than
Table 4
Size statistics of the trees sampled in the southern sector; DBH:
diameter at breast height as measured in 2002 (in cm), 10-yr DBH:
10-year increment of the DBH (in cm), and rockfall bratesQ [GD 1 m
ED�1 (10 years)�1]
Southern sector DBH 10-yr DBH Rockfall bratesQ
Mean 48.39 2.70 2.36
Standard deviation 13.89 1.58 2.70
Maximum 79.58 8.59 10.99
Minimum 25.47 0.78 0.63
that of the northern sector. Reconstructed rockfall
bratesQ of the entire population as well as the bratesQ ofSamples 1 and 2 are shown in Fig. 10B. During the
early decades following the high-magnitude rockfalls
of 1720, the successor trees sampled for analysis were
repeatedly subject to GD. As a consequence, the
highest rockfall brateQ was reconstructed for the
1740s, when almost 11 disturbances were identified
per 1 m ED (i.e., a brateQ of 10.99). Similarly to the
northern sector, reconstructed rockfall bratesQ contin-ually decreased in the southern sector after the high
magnitude rockfalls of 1720.
Unlike the results from the northern sector with
six decadal values located beyond the Var75%

M. Stoffel et al. / Geomorphology 68 (2005) 224–241 237
boundaries, only two rockfall bratesQ lie beyond the
Var75% limits here, namely, those of the 1770s and
the 1820s (Fig. 10B). We note that, after a slight
decrease in the 1750s and 1760s, the brateQ indicatesa considerable increase in rockfall activity in the
1770s. For this period, the rockfall brateQ gives a
value of 8.86 GD 1 m ED�1 (10 years)�1,
approaching that for the 1740s. This period of
increased rockfall activity lasted until the 1780s or
even 1790s. In contrast to the high magnitude
rockfalls of 1720s, reconstructed data indicate that
the considerable number of GD identified for the last
three decades of the 18th century were not caused by
one high-magnitude event, but rather by a series of
years with high rockfall activity (i.e., 1772, 1774,
1779, 1783, 1792). Even though the number of GD
also increased in the northern sector (see Fig. 10A),
significant effects remained mostly restricted to the
bratesQ of the southern sector. Between the 1870s and
the 1940s, comparably low numbers of GD were
found in the trees sampled, resulting in a consid-
erable decrease in rockfall bratesQ. During this
period, the lowest rockfall brateQ of the last 260
years was derived, totaling 0.63 during the 1910s. In
contrast to the northern sector, the rockfall brateQstarted to increase again in the 1940s, oscillating
around the calculated power regression trend line
ever since. However, the changes in the rockfall
bratesQ seem to be less marked here. Again, the
influence of the dam construction works on the
decadal ratios of the 1980s and 1990s will be
analyzed further down in Section 4.6.
0
0.1
0.2
0.3
0
0.1
1950
1960
1970
1955
1965
Num
ber
of G
D 1
m E
D -1
yea
r -1
A
B
Northern sector (1950-
Southern sector (1950-
Fig. 11. Annual estimates of rockfall 1950–2002. Note the important variab
sectors.
4.6. Yearly fluctuations in rockfall activity
(1950–2002)
In complement to the decadal rockfall bratesQ,yearly fluctuations were analyzed for the period
1950–2002. In total, we identified 172 GD, 105 in
the southern (61%) and 67 in the northern sector
(39%). On average, more than 3 GD year�1 could be
identified in the 135 trees sampled.
As illustrated in Fig. 11A, the number of recon-
structed GD remained on a comparably low level in the
northern sector during the first three decades of
investigation, when years without GD occur almost
as frequently as years with GD. After 1980, rockfall
repeatedly caused more GD to the trees sampled.
Reconstructed data neatly reflect the period of
increased rockfall activity in the 1980s and the early
1990s, as described for the Taschgufer slope by Lauber
(1995). Between 1950 and 2002, yearly rockfall
bratesQ averaged 0.037 GD 1 m ED�1 year�1,
indicating that approximately 1 GD was recorded for
every 27 m of ED.
In the southern sector, decadal rockfall bratesQslightly increased in the 1940s and thereafter. Yearly
resolved bratesQ indicate that during the first three
decades, (short) periods with increased numbers of
GD (e.g., 1959–1964) were followed by several years
with (almost) no GD (Fig. 11B). Similar to the
northern sector, considerably increased rockfall
bratesQ can be discerned in 1980 and 1992. In contrast,the high rockfall brateQ reconstructed for 1986 (0.28)
was probably restricted to the southern sector. On
2000
1980
1990
1975
1985
1995
2002)
2002) Mean: 0.085
Mean: 0.037
ility in reconstructed growth disturbances and different activity in the

M. Stoffel et al. / Geomorphology 68 (2005) 224–241238
average, yearly bratesQ totaled 0.085 GD 1 m ED�1
year�1, indicating that more than 1 GD has been
recorded per 12 m of ED.
In contrast to the results from trees located in the
heavily disturbed forest stand above 1780 m a.s.l.
(Stoffel et al., in press), the construction of Dams 1 to
5 (1988/89; see Fig. 1B) only slightly influenced the
rockfall bratesQ of the present study. In the northern
sector, the two GD recorded in 1989 caused an
increase in the decadal brateQ from 0.46 to 0.52.
Similarly, the only GD recorded in the southern sector
in 1989 influenced the brateQ, resulting in a value of
0.96 instead of 0.92. In contrast, reconstructed
rockfall bratesQ prove to be influenced by the
construction works (e.g., excavation, blastings) of
the two protection dams in the late 1990s. As can be
seen from Fig. 12, rockfall triggered during the
200119991996 1998
Distribution of trees with GD (1996 - 2001)
N
0 500m
1500
1600
170070
180000
190019
(ada
pted
afte
r S
chne
uwly
200
3)
Dam 6Dam 7
Fig. 12. Rockfall events during and after dam construction, 1996–
2002. Growth disturbances have been recorded during construction
works at Dam 6 in 1996 (+), Dam 7 in 1998 (E) and in the
succeeding years (.=1999; *=2001). No growth disturbances were
recorded in the years 1997, 2000 and 2002.
construction of Dam 6 in 1996 (c2000 m a.s.l.)
caused six GD. Growth reactions were even more
frequent during the construction of Dam 7 in 1998
(1780 m a.s.l.). As a result of anthropogenic
intervention on the slope, six GD were caused in
the northern and nine GD in the southern sector. For
this reason, the rockfall bratesQ of the 1990s given in
Section 4.5 were clearly influenced by anthropogenic
intervention on the slope, making it difficult to
estimate the undisturbed rockfall frequency over this
period.
As a further consequence, anthropogenic interven-
tion on the slope hindered rockfall fragments to cause
GD to the trees sampled after 1998. While no GD
have been recorded since 1999 in the southern sector
(Fig. 11), GD could still be identified in the northern
sector. As illustrated in Fig. 12, rockfall fragments
apparently passed north of the recently built dams in
1999 and 2001, causing GD to five trees in the
northern sector. In the sparsely wooded areas between
Dam 6 and 7, reconstructed data clearly indicate that
abundant rockfall still occurs on the slope (Stoffel et
al., in press). We therefore have to believe that the
recently built dams efficiently stopped rockfall in the
recent past and so further influenced the rockfall
bratesQ of the 1990s.
5. Discussion
In the study we report here, cores extracted from
135 living L. decidua Mill. trees allowed reconstruc-
tion of yearly and decadal rockfall activities on the
Taschgufer slope. Similar to analysis used in debris
flow, snow avalanche or flooding research (e.g.,
Schweingruber, 1996), we investigated growth dis-
turbances (GD) in increment cores to analyze past
rockfall activity. In the trees sampled, rows of
traumatic resin ducts proved to be by far the most
common reaction to rockfall impacts. Reaction wood,
growth suppression or growth release could be
identified less frequently.
We identified 741 GD covering the period 1600–
2002. Impacts could be found more commonly in
trees located in the southern sector of the slope, where
GD rockfall recurred locally more than once per
decade. According to the results, we believe that
rockfall activity at Taschgufer mainly consisted of low

Table 5
Growth disturbance data by decades for the two sites; GD=growth
disturbances; ED=exposed diameter, i.e., DBH of all trees sampled
at a particular decade (in m); Tr=decadal number of existing trees
rockfall bratesQ=number of GD per 1 m ED and decade; GD–T
ratio=number of GD per tree (Tr) and decade
Decade GD ED (m) Tr Rockfall
bratesQGD–Tr
ratio
N S N S N S N S N S
1600s 2 – 3.9 – 29 – 0.51 – 0.07 –
1610s 4 – 4.2 – 29 – 0.95 – 0.14 –
1620s 1 – 4.6 – 30 – 0.22 – 0.03 –
1630s 4 – 5.0 – 35 – 0.79 – 0.11 –
1640s 3 – 5.5 – 38 – 0.55 – 0.08 –
1650s 6 – 5.9 – 39 – 1.01 – 0.15 –
1660s 6 – 6.4 – 40 – 0.94 – 0.15 –
1670s 2 – 6.9 – 43 – 0.29 – 0.05 –
1680s 4 – 7.5 – 45 – 0.53 – 0.09 –
1690s 10 – 8.1 – 48 – 1.24 – 0.21 –
1700s 5 – 8.6 – 49 – 0.58 – 0.10 –
1710s 4 – 9.2 – 49 – 0.43 – 0.08 –
1720s 15 – 9.8 – 50 – 1.53 – 0.30 –
1730s 10 – 10.5 – 51 – 0.95 – 0.20 –
1740s 13 10 11.3 0.9 58 19 1.15 10.99 0.22 0.53
1750s 13 8 12.1 1.4 62 22 1.07 5.93 0.21 0.36
1760s 10 11 13.0 1.8 66 25 0.77 6.01 0.15 0.44
1770s 11 21 13.9 2.4 68 28 0.79 8.86 0.16 0.75
1780s 11 13 14.8 2.9 69 30 0.74 4.42 0.16 0.43
1790s 14 10 15.7 3.6 69 33 0.89 2.75 0.20 0.30
1800s 9 12 16.6 4.4 70 35 0.54 2.75 0.13 0.34
1810s 6 7 17.6 5.1 70 37 0.33 1.36 0.09 0.19
1820s 8 6 18.5 5.9 71 38 0.43 1.02 0.11 0.16
1830s 12 11 19.5 6.7 71 40 0.62 1.64 0.17 0.28
1840s 10 13 20.5 7.6 71 43 0.49 1.70 0.14 0.30
1850s 5 9 21.5 8.7 74 46 0.23 1.04 0.07 0.20
1860s 9 14 22.6 9.7 74 48 0.40 1.44 0.12 0.29
1870s 16 11 23.7 10.9 75 49 0.68 1.01 0.21 0.22
1880s 11 11 24.8 12.1 76 51 0.44 0.91 0.14 0.22
1890s 13 9 25.9 13.3 76 52 0.50 0.68 0.17 0.17
1900s 9 15 27.0 14.6 76 53 0.33 1.03 0.12 0.28
1910s 9 10 28.1 15.9 76 54 0.32 0.63 0.12 0.18
1920s 14 22 29.3 17.3 77 55 0.48 1.28 0.18 0.40
1930s 10 13 30.5 18.6 77 55 0.33 0.70 0.13 0.24
1940s 15 21 31.7 20.0 77 55 0.47 1.05 0.19 0.38
1950s 10 18 32.9 21.5 78 57 0.30 0.84 0.13 0.32
1960s 7 22 34.1 23.1 78 57 0.21 0.95 0.09 0.39
1970s 7 17 35.4 24.6 78 57 0.20 0.69 0.09 0.30
1980s 19 25 36.6 26.2 78 57 0.52 0.96 0.24 0.44
1990s 21 23 37.8 27.7 78 57 0.56 0.83 0.27 0.40
Bold numbers indicate maximum, bold italic numbers minimum
values.
M. Stoffel et al. / Geomorphology 68 (2005) 224–241 239
magnitude–high frequency events, considered to be
typical for rockfall in alpine areas (e.g., Matsuoka and
Sakai, 1999; Jomelli and Francou, 2000). The only
high magnitude–low frequency event occurred in
1720, causing considerable damage to the forest in
the northern sector. As a result, the forest fringe was
displaced downslope. The forest stand in the southern
sector was almost completely destroyed by the
devastating rockfalls in 1720. Data also show that
the high rockfall frequency both inhibited recoloniza-
tion and caused considerable damage in the juvenile
trees of the southern sector thereafter. As a result,
considerable differences emerge in the reconstructed
numbers of GD between the northern and the southern
sector.
In contrast to the analysis of geomorphic processes
involving larger volumes, such as debris flows, snow
avalanches or flooding, results from dendrogeomor-
phological investigations of rockfalls cannot immedi-
ately be used to illustrate yearly or decadal
fluctuations in rockfall activity. As rockfall consists
of single falling, bouncing or rolling stones, a single
event may only disturb trees along its trajectory.
Furthermore, trees at Taschgufer were of uneven age
and displayed abundant differences in their DBH as
well as the decadal DBH increment. As a result, the
number of reconstructed GD steadily increased with
time, reaching maximum values for the recent past.
Even so, a ratio dividing the decadal number of GD
by the number of trees (Tr) existing at the beginning
of a particular decade cannot concisely represent the
importance of decadal rockfall activity. As illustrated
in Table 5, GD–Tr ratios regularly increased in
periods following major modifications in the sample
depth (e.g., 1690s and after 1720 in the northern and
after the 1770s in the southern sector), leading to an
overestimation of past rockfall activity. Even so, it
appears that the GD–Tr ratio may not correctly
represent the rockfall activity during the late 20th
century, when the lack of succeeding trees and an
almost constant sample depth again influence the
ratios.
The rockfall brateQ, considering the exposed
diameter (ED=DBH of all sampled trees within a
sector at the beginning of a particular decade),
proved, instead, to be a more reliable indicator of
past rockfall activity, as it takes account of the
diameter exposed to rockfall fragments as well as the
,
r
gradual changes of the ED with time. As a further
result, the rockfall bratesQ nicely illustrate the
protective function of the two selected forest stands:

M. Stoffel et al. / Geomorphology 68 (2005) 224–241240
After the devastating rockfalls of 1720, the recolo-
nizing trees could not efficiently stop rockfall frag-
ments in the southern sector, resulting in
considerably high decadal ratios in the early decades
of the analysis [e.g., 10.99 GD 1 m ED�1 (10
years)�1 in the 1740s]. Compared to the 1740s,
almost 13 times fewer GD are dated per 1 m of ED
today. In the forest stand of the northern sector,
rockfall bratesQ persisted on a relatively low level
throughout the last four centuries. Nonetheless, the
high-magnitude event of 1720 also emerged from the
GD–ED data, resulting in the highest decadal rock-
fall brateQ [1.53 GD 1 m ED�1 (10 years)�1]
recorded since AD 1600. As a further consequence,
the efficacy of the protective forest was temporarily
reduced, resulting in higher bratesQ until the late 18th
century. Since then, the protective function has
further increased, resulting in a rockfall brateQ basedon the linear regression trend of approximately 0.4.
This study represents the first attempt to analyze
yearly and decadal fluctuations in rockfall activity
on a forested slope. It has furthermore analyzed the
age structure of the forest stands. Nevertheless,
some issues remain to be resolved. In this study,
we tried to select severely injured trees. However,
comparisons between visible defects with recon-
structed events indicate that scars and bcandelabraformQ trees may only reflect 28% of the GD (i.e.,
resin ducts, callous tissue, growth suppression) dated
on the cores. We therefore stress the key role played
by the sampling strategy by pleading for more
random strategies when choosing trees in heavily
disturbed rockfall forests. Even so, as the results
presented above are from two sectors of one single
slope, replicate studies are needed from a variety of
similar sites to place our reconstructions as well as
the general applicability of the rockfall brateQ in a
wider context.
6. Conclusion
The approach outlined in this study proved to be
a useful tool for analyzing fluctuations in inter-
annual and inter-decadal rockfall activity on a
forested slope. In contrast to former studies, this
analysis was no longer limited by the restricted
temporal sample available for the assessment of
long-term variations in rockfall activity or by the
temporal resolution of the approach (e.g., lichen-
ometry). Although the techniques used in this
investigation need further refinement and minor
modifications in the sampling strategy, the results
presented above clearly show that dendrogeomor-
phic investigations have the potential to produce
results on yearly fluctuations and decadal ratios of
rockfall activity over several centuries. Moreover,
we have been able to determine spatial variations in
rockfall activity, considerable differences in recur-
rence intervals and the changes in the efficacy of the
protective function of the two forest stands at
Taschgufer.
Acknowledgements
The authors gratefully acknowledge Sascha Negro
for assistance in the field. Simone Perret is warmly
acknowledged for providing helpful comments and
Heather Murray for improving the English of this
paper. The authors also want to thank the local
community president Kilian Imboden and the local
forester Leo Jfrger for coring permission and support.
Finally, the authors gratefully acknowledge the
suggestions made by the reviewers Nel Caine and
Brian H. Luckman.
References
Andre, M.-F., 1986. Dating slope deposits and estimating rates of
rockfall wall retreat in Northwest Spitsbergen by lichenometry.
Geogr. Ann. 68, 65–75.
Andre, M.-F., 1997. Holocene rockwall retreat in Svalbard: a triple-
rate evolution. Earth Surf. Processes Landf. 22, 423–440.
Bebi, P., Kienast, F., Schfnenberger, W., 2001. Assessing structures
in mountain forests as a basis for investigating the forestsTdynamics and protective function. For. Ecol. Manag. 145, 3–14.
Berger, F., Quetel, C., Dorren, L.K.A., 2002. Forest: a natural
protection mean against rockfall, but with which efficiency? The
objectives and methodology of the ROCKFOR project. Proc.
Int. Congress Interpraevent 2002 in the Pacific Rim, Matsu-
moto, Japan, pp. 815–826.
Braam, R.R., Weiss, E.E.J, Burrough, P.A., 1987. Spatial and
temporal analysis of mass movement using dendrochronology.
Catena 14, 573–584.
Braker, O.U., 2002. Measuring and data processing in tree-ring
research—a methodological introduction. Dendrochronologia
20, 203–216.

M. Stoffel et al. / Geomorphology 68 (2005) 224–241 241
Brang, P., 2001. Resistance and elasticity: promising concepts for
the management of protection forests in the European Alps. For.
Ecol. Manag. 145, 107–117.
Cook, E.R., Kairiukstis, L.A., 1990. Methods of dendrochronol-
ogy—applications in the environmental sciences. Kluwer,
London.
Douglas, G.R., 1980. Magnitude frequency study of rockfall in
Co. Antrim. Northern Ireland. Earth Surf. Processes Landf. 5,
123–129.
ESRI, 2003a. Geostatistical Analyst. http://www.esri.com/software/
arcgis/arcgisextensions/geostatistical/.
ESRI, 2003b. ArcView. http://www.esri.com/software/arcgis/
arcview.
Fantucci, R., Sorriso-Valvo, M., 1999. Dendrogeomorphological
analysis of a slope near Lago Calabria (Italy). Geomorphology
30, 165–174.
Gardner, J.S., 1980. Frequency, magnitude, and spatial distribution
of mountain rockfalls and rockslides in the Highwood Pass
Area, Alberta, Canada. In: Coates, R., Vitek, J.D. (Eds.),
Thresholds in Geomorphology. Allen and Unwin, New York,
pp. 267–295.
Gardner, J.S., 1983. Rockfall frequency and distribution. Z. Geo-
morphol. N.F. 27, 311–324.
Gruber, S., Hoelzle, M., 2001. Statistical modelling of mountain
permafrost distribution: local calibration and incorporation of
remotely sensed data. Permafr. Periglac. Process. 12, 69–77.
Haeberli, W., 1992. Construction, environmental problems and
natural hazards in periglacial mountain belts. Permafr. Periglac.
Process. 3, 111–124.
Hetu, B., Gray, J.T., 2000. Effects of environmental change on scree
slope development throughout the postglacial period in the
Chic-Choc Mountains in the northern Gaspe Peninsula, Quebec.
Geomorphology 32, 335–355.
Johnston, K., Ver Hoef, J.M., Krivoruchko, K., Lucas, N., 2001.
Using ArcGIS geostatistical analyst. ESRI, Redlands.
Jomelli, V., Francou, B., 2000. Comparing the characteristics of
rockfall talus and snow avalanche landforms in an Alpine
environment using a new methodological approach: Massif des
Ecrins, French Alps. Geomorphology 35, 181–192.
Joris, C.-L., 1995. Der Bergsturz, ein Zufallsereignis unter
vielen. In: Naturforschende Gesellschaft Oberwallis (Ed.), Der
Bergsturz von Randa 1991. Neue Buchdruckerei Visp AG, Visp,
pp. 43–49 (in German).
Lafortune, M., Filion, L., Hetu, B., 1997. Dynamique d’un front
forestier sur un talus d’eboulis actif en climat tempere froid
(Gaspesie, Quebec). Geogr. Phys. Quat. 51 (1), 1–15 (in
French, with English Abstr.).
Larson, P.R., 1994. The vascular cambium. Development and
structure. Springer, Berlin.
Lauber, T., 1995. Bergsturz und Steinschlag im Taschgufer, Tasch.
Geological advisory opinion 95-525.1, Naters, Switzerland (in
German).
Luckman, B.H., 1976. Rockfalls and rockfall inventory data: some
observations from Surprise Valley, Jasper National Park. Earth
Surf. Processes 1, 287–298.
Luckman, B.H., Fiske, C.J., 1995. Estimating long-term rockfall
accretion rates by lichenometry. In: Slaymaker, O. (Ed.),
Steepland Geomorphology. Wiley, Chichester, pp. 233–255.
Matsuoka, N., Sakai, H., 1999. Rockfall activity from an alpine cliff
during thawing periods. Geomorphology 28, 309–328.
McCarroll, D., Shakesby, R.A., Matthews, J.S., 1998. Spatial and
temporal patterns of Late Holocene rockfall activity on a
Norwegian talus slope: lichenometry and simulation-modelling
approach. Arct. Alp. Res. 30, 51–60.
Rapp, A., 1960. Recent development of mountain slopes in
Karkevagge and surroundings, Northern Scandinavia. Geogr.
Ann. 42, 65–200.
Rinntech, 2003. LINTAB—Precision ring by ring. http://www.
rinntech.com/Products/Lintab.htm.
Schneuwly D. 2003. 500-jahrige Rekonstruktion der Steinschlag-
frequenz im Taschgufer anhand dendrogeomorphologischer
Methoden. Diploma thesis, University of Fribourg, Fribourg,
Switzerland (in German).
Schweingruber, F.H., 1996. Tree rings and environment, dendroe-
cology. Paul Haupt, Bern Stuttgart, Wien.
Schweingruber, F.H., 2001. Dendrofkologische Holzanatomie. Paul
Haupt, Bern Stuttgart, Wien (in German).
Shroder, J.F., 1980. Dendrogeomorphology: review and new
techniques of tree-ring dating. Prog. Phys. Geogr. 4, 161–188.
Solomina, O., 2002. Dendrogeomorphology: research requirements.
Dendrochronologia 20, 233–245.
Stoffel, M., Lievre, I., Conus, D., Grichting, M., Raetzo, H.,
Gartner, H., Monbaron, M., 2005a. 400 years of debris flow
activity and triggering weather conditions: Ritigraben VS,
Switzerland. Arct. Antarct. Alp. Res. 37 (1) in press.
Stoffel, M., Lievre, I., Monbaron, M., Perret, S., 2005b. Seasonal
timing of rockfall activity on a forested slope at Taschgufer
(Swiss Alps)—a dendrochronological approach. Z. Geomorphol.
49, in press.
Wiles, G.C., Calkin, P.E., Jacoby, G.C., 1996. Tree-ring analysis
and quaternary geology: principles and recent applications.
Geomorphology 16, 259–272.
Zurbriggen, J., 1952. Tasch. Familienstatistik, Chronik und Kirche.
Buchdruckerei Tscherrig-Trfndle, Brig-Glis (in German).