Analyzing psychotherapy process as intersubjective sensemaking: An approach based on discourse...
19
PLEASE SCROLL DOWN FOR ARTICLE This article was downloaded by: [Nitti, Mariangela] On: 27 July 2010 Access details: Access Details: [subscription number 924820690] Publisher Routledge Informa Ltd Registered in England and Wales Registered Number: 1072954 Registered office: Mortimer House, 37- 41 Mortimer Street, London W1T 3JH, UK Psychotherapy Research Publication details, including instructions for authors and subscription information: http://www.informaworld.com/smpp/title~content=t713663589 Analyzing psychotherapy process as intersubjective sensemaking: An approach based on discourse analysis and neural networks Mariangela Nitti a ; Enrico Ciavolino b ; Sergio Salvatore a ; Alessandro Gennaro a a Department of Pedogogy, Psychology, and Teaching, b Department of Philosophy and Social Sciences, University of Salento, Lecce, Italy First published on: 27 July 2010 To cite this Article Nitti, Mariangela , Ciavolino, Enrico , Salvatore, Sergio and Gennaro, Alessandro(2010) 'Analyzing psychotherapy process as intersubjective sensemaking: An approach based on discourse analysis and neural networks', Psychotherapy Research,, First published on: 27 July 2010 (iFirst) To link to this Article: DOI: 10.1080/10503301003641886 URL: http://dx.doi.org/10.1080/10503301003641886 Full terms and conditions of use: http://www.informaworld.com/terms-and-conditions-of-access.pdf This article may be used for research, teaching and private study purposes. Any substantial or systematic reproduction, re-distribution, re-selling, loan or sub-licensing, systematic supply or distribution in any form to anyone is expressly forbidden. The publisher does not give any warranty express or implied or make any representation that the contents will be complete or accurate or up to date. The accuracy of any instructions, formulae and drug doses should be independently verified with primary sources. The publisher shall not be liable for any loss, actions, claims, proceedings, demand or costs or damages whatsoever or howsoever caused arising directly or indirectly in connection with or arising out of the use of this material.
Transcript of Analyzing psychotherapy process as intersubjective sensemaking: An approach based on discourse...

PLEASE SCROLL DOWN FOR ARTICLE
This article was downloaded by: [Nitti, Mariangela]On: 27 July 2010Access details: Access Details: [subscription number 924820690]Publisher RoutledgeInforma Ltd Registered in England and Wales Registered Number: 1072954 Registered office: Mortimer House, 37-41 Mortimer Street, London W1T 3JH, UK
Psychotherapy ResearchPublication details, including instructions for authors and subscription information:http://www.informaworld.com/smpp/title~content=t713663589
Analyzing psychotherapy process as intersubjective sensemaking: Anapproach based on discourse analysis and neural networksMariangela Nittia; Enrico Ciavolinob; Sergio Salvatorea; Alessandro Gennaroa
a Department of Pedogogy, Psychology, and Teaching, b Department of Philosophy and Social Sciences,University of Salento, Lecce, Italy
First published on: 27 July 2010
To cite this Article Nitti, Mariangela , Ciavolino, Enrico , Salvatore, Sergio and Gennaro, Alessandro(2010) 'Analyzingpsychotherapy process as intersubjective sensemaking: An approach based on discourse analysis and neural networks',Psychotherapy Research,, First published on: 27 July 2010 (iFirst)To link to this Article: DOI: 10.1080/10503301003641886URL: http://dx.doi.org/10.1080/10503301003641886
Full terms and conditions of use: http://www.informaworld.com/terms-and-conditions-of-access.pdf
This article may be used for research, teaching and private study purposes. Any substantial orsystematic reproduction, re-distribution, re-selling, loan or sub-licensing, systematic supply ordistribution in any form to anyone is expressly forbidden.
The publisher does not give any warranty express or implied or make any representation that the contentswill be complete or accurate or up to date. The accuracy of any instructions, formulae and drug dosesshould be independently verified with primary sources. The publisher shall not be liable for any loss,actions, claims, proceedings, demand or costs or damages whatsoever or howsoever caused arising directlyor indirectly in connection with or arising out of the use of this material.
Analyzing psychotherapy process as intersubjective sensemaking: Anapproach based on discourse analysis and neural networks
MARIANGELA NITTI1, ENRICO CIAVOLINO2, SERGIO SALVATORE1, &
ALESSANDRO GENNARO1
1Department of Pedogogy, Psychology, and Teaching & 2Department of Philosophy and Social Sciences, University of Salento,
Lecce, Italy
(Received 30 August 2009; revised 13 January 2010; accepted 19 January 2010)
AbstractThe authors propose a method for analyzing the psychotherapy process: discourse flow analysis (DFA). DFA is a techniquerepresenting the verbal interaction between therapist and patient as a discourse network, aimed at measuring the therapist�patient discourse ability to generate new meanings through time. DFA assumes that the main function of psychotherapy is toproduce semiotic novelty. DFA is applied to the verbatim transcript of the psychotherapy. It defines the main meaningsactive within the therapeutic discourse by means of the combined use of text analysis and statistical techniques.Subsequently, it represents the dynamic interconnections among these meanings in terms of a ‘‘discursive network.’’ Thedynamic and structural indexes of the discursive network have been shown to provide a valid representation of the patient�therapist communicative flow as well as an estimation of its clinical quality. Finally, a neural network is designed specificallyto identify patterns of functioning of the discursive network and to verify the clinical validity of these patterns in terms oftheir association with specific phases of the psychotherapy process. An application of the DFA to a case of psychotherapy isprovided to illustrate the method and the kinds of results it produces.
Keywords: process research; discourse flow analysis; competitive neural networks; health services quality
The present work is an attempt to improve quality
research into the therapeutic process by means of the
combination of statistical methodologies, enabling
clinical interaction to be analyzed.
Among several approaches to psychotherapeutic
research, a common way of considering the clinical
process is to look at it as an intersubjective dynamic
of co-construction of new meanings between thera-
pist and patient. Discourse flow analysis (DFA) was
designed by a group of researchers (Salvatore et al.,
2007, in press) to develop an empirical model of
the psychotherapeutic process as intersubjective
sensemaking. According to this model, meaning is
not statically held in signs (e.g., words, gestures).
Rather, it is the product of the way people use signs
in order to regulate their communication and activity
(Harre & Gillett, 1994). People do not choose a
ready-to-use meaning; rather, they co-construct it in
the sense that the interpretation of the signs is a
matter of situated agreement among the participants
of the conversation, performed through the dialogue
and grounded on socially shared generalized mean-
ings (Valsiner, 2007) working as taken-for-granted
assumptions (Rommetveit, 1992). In sum, sense-
making is intrinsically dialogical (Linell, 2009).1
The vision of the psychotherapy process as
intersubjective sensemaking is a meta-theoretical
framework crossing several clinical approaches: psy-
chodynamic (Storolow, Atwood, & Brandchaft,
1994; Hoffman, 1998) and cognitive (Dimaggio &
Semerari, 2004) as well as humanistic (Hermans &
Hermans-Jansen, 1995) and narrative (Santos,
Goncalves, Matos, & Salvatore, 2009). Although
very different in many respects, these approaches
share the basic idea of the clinical exchange as a co-
construction of meanings (i.e., intersubjective sense-
making) aimed at changing the patients’ symbolic
(affective and/or cognitive) modality of interpreting
their experience (Gennaro et al., 2010). Psychother-
apy can, therefore, be seen as a ‘‘transformative
dialog’’ (Gergen, 1999, p. 250), where new mean-
ings are elaborated, new categories are developed,
Correspondence concerning this article should be addressed to Mariangela Nitti, Universita del Salento, Dipartimento di Scienze
Pedagogiche, Psicologiche e Didattiche, Via Stampacchia, Lecce, 73100 Italy. E-mail: [email protected]
Psychotherapy Research
2010, 1�18, iFirst article
ISSN 1050-3307 print/ISSN 1468-4381 online # 2010 Society for Psychotherapy Research
DOI: 10.1080/10503301003641886
Downloaded By: [Nitti, Mariangela] At: 14:29 27 July 2010

and one’s presuppositions (Chambers & Bickhard,
2007) are transformed within an intersubjective
context.
To achieve this aim, DFA analyzes patient�therapist
dialogue in formal terms*that is, by depicting the
structural global qualities of their communicational
exchange*rather than merely in terms of the seman-
tic contents exchanged within their dialogue. In fact,
even though most analysis methods used in psy-
chotherapy process research focus on the semantic
content of the clinical exchange, semantic content
analysis is important, but not sufficient, for a real
understanding of the clinical exchange.
One of the limitations of the semantic content
analysis is the so-called indexicality of linguistic
signs: The semantic content of a sign needs the
context to be understood (Nightingale & Cromby,
1999), so a high level of inference is required.
Furthermore, the indexicality of a sign concerns
not only the discourse semantic dimension but also
the pragmatic sphere: Because producing a sign is
not a mere linguistic operation but rather a speech
act (Austin, 1962), the psychological meaning of a
sign is related to its communicative function as
performed in discourse activity. This communicative
function is not immanent to the sign, but depends on
the way it is used in relation with the other signs
within the intersubjective circumstances of the
discourse (Harre & Gillett, 1994; Wittgenstein,
1953). The temporal dimension of the discourse is,
therefore, an outstanding factor in the process of
constructing the sense.
Consider the following sequences of thematic
contents as characterizing the dialogue of two
patients:
Patient 1 sequence: experience of frustration0anger0pain0desire to be helped by therapist
Patient 2 sequence: pain0desire to be helped by
therapist0experience of frustration0anger
The content of the talk is the same in the two cases;
yet the sequences are different. In addition, it is
evident that the two sequences differ as concerns
their global meaning. The first sequence seems to
concern the patient’s request to be supported by the
therapist in dealing with the negative emotive reac-
tion to a frustrated desire. The second sequence
seems to concern a patient expressing a negative
feelings aroused by his or her desire to be helped by
the therapist.
Among the contributions present in literature, the
matter of the indexicality and the temporal dynamics
of sensemaking has been ignored (researchers have
focused only on the semantic dimension of sense-
making) or dealt with by adopting a qualitative
discourse analysis in order to properly consider the
context and the communicative function of the signs
and analyze the discourse dynamic over time.
Our contribution seeks to construct a robust,
flexible, and automatic, although not uncritical,
procedure for seriously taking into account the
temporal dynamics of the discourse, which is a basic
(although not exhaustive) aspect of sensemaking.
As the procedure leads to the synthetic description
of the discourse network through some indexes,
such indexes are processed by a competitive neural
network that classifies them based on their common
properties. Each discourse network will be then
interpreted with reference to the average character-
istics of the category to which it belongs.
This work is organized in two parts. The first is
devoted to the description of the DFA method. The
latter concerns the exemplificative application of
DFA to a case: Pietro’s psychotherapy.
Discourse Flow Analysis
DFA was designed to develop an empirical model of
the psychotherapy process as intersubjective sense-
making. In order to go beyond the limits of semantic
content analysis described previously, DFA allows a
dynamic analysis of sensemaking, focusing on the
temporal patterns of meanings rather than on the
survey of discrete contents, by adopting an auto-
mated low-inferential procedure of content analysis,
yet at the same time is able to take the contextuality
of meaning into account. Let us now consider how
DFA operates in order to reach such results.
The main assumption of this model is the idea that,
because the relationships among contents basically
arise from associations for temporal adjacency,
sensemaking strongly depends on the way contents
are combined throughout the discourse flow.
Coherently, sensemaking is a matter not of con-
tents but of sequential combination of contents.
Starting from this assumption, DFA maps the
psychotherapeutic dialogue in terms of associations
for adjacency between semantic contents occurring
within the clinical exchange. In order to operate in
this way, DFA refers to the concept of discourse
network. A discourse network is made of nodes, each
of which represents one of the units of semantic
contents, those that are active in the communi-
cational exchange between patient and therapist.
Reducing the communicational exchange in terms of
network allows us to analyze the systemic and
dynamic structure of sensemaking.
To construct and analyze the clinical process as a
discourse network, the DFA method works in three
steps and is applied to the verbatim transcript of
therapist�patient dialogue. First, a content analysis
2 M. Nitti et al.
Downloaded By: [Nitti, Mariangela] At: 14:29 27 July 2010

identifies and categorizes the semantic contents
active in the text. Second, a sequence analysis is
applied to the results of the first step in order to
calculate the probability of pairs of contents being
adjacent; this procedure is designed to construct the
discourse network. Third, through quantitative
analysis, it is possible to obtain a synthetic descrip-
tion of the way the discourse network functions by
means of structural-dynamic indexes. Finally, the
quantitative indexes describing the discourse net-
work are processed, in the fourth step, into a
competitive neural network that can classify the
psychotherapy sessions on the basis of the index
patterns characterizing them. The steps of the
analysis are shown in Figure I.
Step 1: Content Analysis
Content analysis is applied to the integral verbatim
transcription (henceforth corpus) of the patient�therapist talk. Using text analysis software (T-Lab
5.3 Beta; Lancia, 2005), the lexical corpus is
transformed into a digital matrix (co-occurrence
matrix) and subjected to a multidimensional proce-
dure of analysis.
Preliminary Operations
First, T-Lab performs the segmentation of the text.
It divides the whole text into elementary context
units (ECUs), each of which represents a meaningful
sentence or group of sentences. To this end, T-Lab
adopts the following criterion: An ECU ends
with the first punctuation mark (‘‘.’’ or ‘‘!’’ or ‘‘?’’)
after the 250th character and it does not exceed
500 characters in length.
At the same time, T-Lab operates the lemmatization
of the lexical corpus. This substep is carried out in
terms of the several subprocedures, discussed next.
Listing. All the textual forms present in the text
are listed just as they appear in the corpus. T-Lab
considers a form to be any string of characters (even
if made up of one character) between two blank
spaces (or a blank space and a punctuation mark).
Filtering. Punctuation is eliminated from the
analysis. At the end of this procedure, the original
list of textual forms is filtered into a list of lexical
forms.
Disambiguation. This procedure is designed to
change the lexical forms that can have more than one
semantic content (e.g., ‘‘subject’’). It is performed by
modifying the lexical form in the various contexts
where it occurs. In this way, the original form is
differentiated into two or more forms with a single
semantic content. For instance, the original form
‘‘subject’’ could be differentiated into two new
forms: ‘‘subject_p’’ when its meaning is ‘‘person’’
and ‘‘subject_k’’ when, according to the context, it
means ‘‘branch of knowledge.’’ Once the disambi-
guation has been performed, listing and filtering
need to be repeated. Finally, it is worth noting that
the disambiguation may be performed only on the
most frequent words and/or on the lexical forms that
are relevant for the aim of the analysis (e.g., in the
case of an analysis of the psychotherapy process, it
could be relevant to differentiate between ‘‘sense’’ as
concerning perception and ‘‘sense’’ as synonymous
of meaning).2
Lemmatization. The lexical forms are grouped
according to their common lexical root. In other
words, the various forms of the same word are
turned into their corresponding lemma. This sub-
procedure entails the application of a dictionary to
the list of lexical forms. A dictionary is a list of the
main lemmas of a given language (e.g., English,
Italian), each of them put in correspondence with
Figure I. Steps of the analysis.
Analysis of psychotherapy through statistics 3
Downloaded By: [Nitti, Mariangela] At: 14:29 27 July 2010

the set of forms constituting its lexical variant (i.e., in
the dictionary, the lemma ‘‘do’’ is in correspondence
with the lexical forms ‘‘does,’’ ‘‘done,’’ ‘‘did,’’ and so
forth). To empower the coverage of the lemmatiza-
tion (i.e., the percentage of textual forms recognized
by the dictionary and, therefore, lemmatized), we
integrated the T-Lab dictionary with another one
elaborated by us. The DFA dictionary was produced
by listing the textual forms of a large number of texts
retrieved from a variety of discursive fields and
sources (sport, politics, novels, verbatim transcripts
of psychotherapy sessions). Eventually, the auto-
matic lemmatization is checked and, if necessary,
completed by the researcher.
Not all the lemmas are kept in the analysis.
Because of T-Lab’s computational constraints, only
the 500 more frequent lemmas are used for the
analysis.
Identification of the Co-Occurrence of ECUs for the Sake
of the Definition of the Thematic Nuclei
As these preliminary text operations are done, it is
possible to proceed with the content analysis. Con-
tent analysis is realized by using criteria of categor-
ization of the text intrinsic to the text itself rather
than external parameters of classification. The
method operates the text classification by means
of a composite multidimensional procedure of ana-
lysis combining multiple correspondence analysis
(MCA; Benzecri, 1973) and cluster analysis (CA;
Anderberg, 1973).
To perform these analyses, T-Lab produces a co-
occurrence matrix with ECU as rows and lemmas as
columns.3 In the generic cell xij we will find the value
‘‘1’’, if the jth lemma is present in the ith ECU, ‘‘0’’
otherwise, as shown in Table I.
This matrix undergoes MCA. Each factorial
dimension extracted by MCA maps the joint behavior
of groups of lemmas. Generally speaking, MCA
breaks down the lexical variability into patterns of
co-occurrence of lemmas (i.e., joint presence of
lemmas within the same ECU). Each factorial
dimension represents a pattern of this kind: a rather
stable combination of words present through the
text (or parts of the text). Accordingly, a factorial
dimension can be interpreted as a semantic micro-
dimension active in the text.
The factorial dimensions are then used as criteria
of classification in the subsequent CA (in T-Lab
language, the thematic analysis of elementary con-
text). Thus, CA groups the ECUs (and the lemmas)
according to their similarity on the semantic micro-
dimensions. In other words, a cluster represents a
subset of utterances (i.e., ECUs) that share similar
patterns of co-occurrence of lemmas; or, in a
complementary way, each cluster represents a subset
of words tending to occur in the same sentences.
Therefore, each cluster can be understood as a
thematic nucleus (or semantic content or node),
made up of a set of words whose aggregation reflects
the ‘‘isotopy’’ of semantic traits (Lancia, 2005).
To clarify this concept, let us take an example
from a previous application of DFA (Lisa’s case;
Salvatore et al., in press). Table II shows the three
Table I. Co-occurrence Matrix
ECU/Lemma Be Your Name Pen Red
What is your name? 1 1 1 0 0
The pens are red. 1 0 0 1 1
Note. ECU, elementary context unit.
Table II. Selected Part of One Cluster: Thematic Nucleus
Resulting from the Application of the DFA Method to a
Transcript of Psychotherapy (Lisa’s Case)
ECU 1 (in Session 9; score: 185.32)
T: How would you do that?
L: Uh, just I either stay in the house or do housecleaning or
whatever needs to be done um.
T: How would you do that right now if you were to just sort of like
put her aside, put her, what do you do, put her in a box almost?
L: Um.
T: Trap her. Try to do that now, to trap her and put her away.
L: Okay, um, just, just stay home.
ECU 2 (in Session 12; score: 172.70)
T: Tell her she scares you and you feel small, tell her about what
it’s like, speak from, it’s almost like saying ‘‘I’m small and
I feel . . .’’ Finish it off.
L: I’m ah. I’m small and I feel ah, ah, just helpless um.
T: Mm-hm.
L: Just giving out myself.
T: Mm-hm, a little lost?
L: Yeah, I feel um lost.
T: Tell her.
L: InsECUre.
ECU 3 (in Session 9; score 160.59)
T: So you, you sort of keep her, shield her from the people, from
the world in a sense.
L: Yeah.
T: Okay, be the shield, be the shield and speak from that and tell
her what you feel.
L: Um, I don’t want you to desert me, or just, just stay with me
and and we’ll make it through together.
T: Mm-hm. Tell her how you protect her.
Note. The score is a chi-square parameter depicting the associa-
tion between the ECU (token) and the cluster (type). The higher
the index, the higher the representativeness of the ECU with
respect to the cluster. Underlined words are word forms belonging
to the characteristic lemmas of the identified cluster (adjusted
from Salvatore et al., in press). ECU, elementary context unit; T,
therapist; L, Lisa.
4 M. Nitti et al.
Downloaded By: [Nitti, Mariangela] At: 14:29 27 July 2010

most representative ECUs of one of the clusters
defined by the analysis (the cluster in question
globally encompasses 94 ECUs, corresponding to
5.25% of the classified ECUs in the text; cf.
Salvatore et al., in press). The underlined words
are the ones whose co-occurrence made the ECU
cluster together. The thematic interpretation of the
cluster entails identifying a thematic area overlap-
ping/passing through the clustered ECUs. In the
case of the three ECUs reported in Table II, it seems
that they share a common thematic area concerning
the recognition of needs/desires in relations with
others.4
Text Indexing
The thematic nuclei identified as active in the corpus
by the combination of MCA-CA are then used for
the subsequent text indexing carried out as follows.
Each ECU is assigned to the cluster (therefore to a
thematic nucleus) with which the ECU has the
highest index of association. In this way, each ECU
is marked with the most representative thematic
nuclei identified through content analysis. Thus,
the output of this step is the transformation of
the text into a sequence of thematic nuclei, each of
which represents the semantic content of a nucleus.
Table III shows an example of the output of a
content analysis applied on a hypothetical text
segmented into a sequence of 20 ECUs and assigned
to a set of four clusters.
Evidence Supporting the Procedure of Content Analysis
In the last 20 years, there has been a dramatic
development of automatic procedure of textual
analysis and textual mining. Nowadays, we have
major evidence of the validity of this kind of
approach. Here we briefly recall two kinds of
findings, converging to highlight the power of the
automatic process of content analysis.
One source of evidence is represented by studies
dealing with the modeling of the cognitive processes
entailed in the mapping and understanding of mean-
ing, especially in the case of the reading of written
texts. Some authors within this stream of studies
have developed specific procedural models that
have proved able to simulate the competence of a
human being in mapping meanings (Andersen,
2001; Landauer & Dumais, 1997).
The other source of evidence is given by the
studies more specifically aimed at testing the validity
and reliability of automatic procedures of content
analysis. A strong tradition in this sense is provided
by the many studies concerning the validity of the
procedure of data mining for the classification of
documents. In a study aimed at comparing models
of cluster analysis applied to the classification of
documents, Steinbach, Karypis, and Kumar (2000)
provided estimates of the efficacy of various algo-
rithms of cluster analysis related to a previously
established classification. Based on their analysis,
according to the type of documents, all the proce-
dures range between .58 to .85, with most of the
performance greater than .70 (1�perfect capacity
of classification; that is the clustering capacity of
fully reproducing the normative classification).
Rosenberg, Schnurr, and Oxman (1990) have com-
pared two automatic procedures of content analysis,
based on the calculation of the frequencies of
occurrences of words (one not context sensitive,
the other context sensitive), and a clinically informed
method of content analysis based on human coding.
The three methods were applied to the transcripts
of interviews with 71 patients from four clinical
groups (cancer, depression, somatization, paranoid)
and compared regarding their capacity of rightly
classifying the subjects in accordance to the diag-
nosis. At this end, the authors performed three
separate stepwise discriminant analyses, one for
each method. The classification performances of
the three methods were then compared in a mixed
analysis of variance design, with clinical group as a
between-subjects factor and method as a within-
subject factor. The two computerized methods
showed significantly better performance than the
method based on human coding.
Table III. Cluster and ECU Sequences
ECU sequence Cluster sequence
ECU 1 CL3
ECU 2 CL1
ECU 3 CL2
ECU 4 CL1
ECU 5 CL4
ECU 6 CL1
ECU 7 CL3
ECU 8 CL2
ECU 9 CL3
ECU 10 CL1
ECU 11 CL2
ECU 12 CL4
ECU 13 CL1
ECU 14 CL3
ECU 15 CL2
ECU 16 CL3
ECU 17 CL1
ECU 18 CL2
ECU 19 CL4
ECU 20 CL1
Note. ECU, elementary context unit.
Analysis of psychotherapy through statistics 5
Downloaded By: [Nitti, Mariangela] At: 14:29 27 July 2010

With regard to DFA, the reliability of the proce-
dure of content analysis adopted by the method was
studied within the framework defined by the line of
study we just mentioned (Salvatore et al., 2010).
Two complementary approaches were adopted. On
the one hand, trained judges were asked to evaluate
the output of the content analysis provided by the
DFA procedure. On the other hand, we compared
the content analysis produced by the DFA with the
series of content analysis provided by judges. Both
kinds of tests were performed on a sample of
transcripts randomly and blindly extracted from an
Italian language psychotherapy (Katia; see Nicolo &
Salvatore, 2007). The main findings are as follows:
1. The judges were asked to rate the semantic
similarity of a set of 70 ECUs (i.e., utterances;
see prior discussion), five for each of the
14 clusters produced by the DFA procedure
of content analysis. The intracluster similarity
(i.e., the mean of the rates of similarity of each
couple of the five ECUs grouped in the same
cluster) was significantly higher than the inter-
cluster similarity (i.e., the mean of the rates of
similarity of each couple of ECUs belonging to
different clusters). This means that the DFA
procedure seems to be able to differentiate the
utterances and group them in classes that
are semantically meaningful. In other words,
DFA puts together what a human coder con-
siders more semantically homogeneous and
separates what the human coder considers
more dissimilar.
2. DFA procedures calculate an index of the
similarity between each couple of the clusters
defined: the Euclidian distance between the
centroids of the clusters. The higher this index,
the more dissimilar the cluster. We then com-
pared the judgments of similarity between each
couple of clusters with this DFA index. We
found a significant negative correlation. This
means that the DFA’s way of representing the
relationship of (dis)similarity among the ECUs,
and therefore among the clusters, tends to over-
lap the one produced by the human coders. If
one considers that the human coders in this case
were engaged in a task of semantic coding, one
can conclude that the DFA procedure yields a
classification of ECUs reflecting a network of
relationships of similarity�dissimilarity consis-
tent with the one provided by the human coders.
3. Three judges were asked to group the 70 ECUs
on the basis of their semantic similarity in terms
of the same partition produced by DFA (14
clusters, each of five ECUs). Then we com-
pared the interrater agreement between each
couple of judges and between the judges and
the DFA procedure. The comparison between
the judge�judge agreement and DFA�judge
agreement could not be differentiated; in all
cases, we recorded a fair level of agreement
(Cohen’s k between .30 and .40). Note that in
order to appreciate the level of such agreement
one has to take into account the large amount
of degrees of freedom associated with the
classification at stake. As a matter of fact, the
probability that the classifier orders 70 ECUs
(n) in 14 groups (g) of five items (k) is equal
to 6,19�100, as resulting from the formula:
P(n,g,k)�(k! (n�k)!n!)g�(5! (70�5)!70!)14.
In sum, different sources of results support the
conclusion that automatic procedures of information
retrieval are able to perform content analysis with
at least a sufficient level of reliability. Within this
scenario, the procedure of content analysis adopted
by DFA seems to be able to discriminate the
utterances in accordance with their semantic simi-
larity and to classify the semantic content of the text
in a way that does not differ from a trained human
coder (as measured by the interrater agreement).
Step 2: Creation of the Discourse Network
The clusters of ECU are used for the definition
of the discourse network. In its most elementary
version, a network is a collection of elements (nodes)
linked to each other: In our case, the nodes are
represented by the cluster of ECUs, and the con-
nections between them represent the strength of
their association. The strength of a cluster’s associa-
tion is calculated using a sequence analysis.
To explain simply how the sequence analysis
works, we give an example in Table III, which
considers 20 ECUs grouped into four clusters. The
four clusters represent, as we said, the nodes of the
discourse network. Given the sequence of clusters in
Table III, it is possible to calculate the transition
matrix deriving from the matrix of the successors.
Table IV shows the matrix of the successors. This
matrix has the ECU clusters both in rows (prede-
cessors) and columns (successors) and shows, in its
generic cell, the number of times the jth cluster
follows the ith cluster. For instance, the number of
Table IV. Frequencies of Successors
Cluster CL1 CL2 CL3 CL4
CL1 0 3 2 1
CL2 1 0 2 2
CL3 3 2 0 0
CL4 3 0 0 0
6 M. Nitti et al.
Downloaded By: [Nitti, Mariangela] At: 14:29 27 July 2010

times Cluster 1 (CL1) follows Cluster 3 (CL3) is
equal to 3, as is shown in the tables. The total
transition number is equal to the number of ECUs
minus 1 (score of 19 in Table IV), because the first
item of the sequence has no predecessors.
The resulting transition matrix, similarly to the
matrix of successors, has the clusters both in rows and
columns and shows in its generic cell the strength of
the association between two clusters. The strength
of that association is the probability, calculated by
a Markovian algorithm, that a cluster i follows j
immediately afterward: This probability is nothing
but the relative frequency of the successor, that is, the
ratio between the absolute frequency of a cluster’s
successor (the frequency in the successor matrix cell)
and the total number of the cluster’s successors (the
marginal row of the matrix). In our example, the
resulting transition matrix is shown in Table V.
The values contained in the transition matrix are
the strength of the associations among the discourse
network nodes. The direction of the connections
goes from the predecessor (i) to the successor (j).
The intensity of the association is represented by the
thickness of the arrow connecting two clusters: In
Figure II, CL4 and CL1 have the maximum
association (equal to 1; that is, every time CL4
appears throughout the discourse, it will be certainly
be followed by CL1), represented by the thickest
arrow; CL4 has less probability of following CL1
(0.167) and so the arrow is very thin.
Moreover, Markovian sequence analysis produces
as output, for each node, a set of essential informa-
tion, such as:
. Frequency of occurrence (how many times a
node is present through the discourse). In the
example, CL3 appears five times during the
interaction.
. Incoming and outgoing nodes (including the
node considered, because a node can be asso-
ciated with itself) and the corresponding fre-
quencies. In the example, CL3 has two
predecessors (CL1 and CL2), with a frequency
equal to four, and two successors (CL1 and
CL2), with a frequency of five.
This descriptive information is useful for carrying
out the quantitative analysis of the discourse network.
The aim of this step is to measure the structural and
dynamic properties of the network and to interpret
them as relevant aspects of the sensemaking dynamic.
It is worth emphasizing that sequence analysis is
applied to a single time ‘‘window,’’ consisting of a
specific temporal period of the psychotherapy under
analysis. The sequence analysis can, therefore, be
applied to single sessions of psychotherapy as well
as to part of a session (i.e., the first half hour) or to
a group of sessions. According to the aim and the
conditions of the analysis, the windows can be
defined in order to cover all the sessions or to
sample parts of them. In sum, both discursive
networks and windows of analysis will be defined
by the segmentation and/or the sampling of the
transcript the research produces.
Step 3: Quantitative Analysis of the Discourse
Network
The quantitative analysis of the discourse network is
mainly carried out by means of the following
indexes: connectivity, activity, and super-order
nodes.
Connectivity (C) is the density of the association
among nodes, that is, the relative amount of con-
nections among the nodes. It is calculated as the
percentage of connections that are active in the text
compared with the theoretical number of connec-
tions. It results from:
C�c=K2 (1)
where c is the number of connections active in the
text and K2 is the square of the number of nodes
(every node can be theoretically associated with
every other node, including itself). In our example,
the number of active connections is nine (the
number of cells of Table IV with a non-zero value)
and the theoretical number of connections is 42�16,
so the connectivity is equal to (9/16)�0.5625.
Activity (A) is the global network ability to extend
the spectrum of associations among nodes thro-
ugh time. High levels of activity depict discourse
Table V. Transition Matrix
Cluster CL1 CL2 CL3 CL4
CL1 0 0.5 0.333 0.167
CL2 0.2 0 0.400 0.400
CL3 0.6 0.4 0 0
CL4 1 0 0 0
CL1
CL3 CL4
CL2
Figure II. Example of discourse network.
Analysis of psychotherapy through statistics 7
Downloaded By: [Nitti, Mariangela] At: 14:29 27 July 2010

dynamics capable of expanding the paths of sense-
making by enriching the possible combinations
among meanings. It is calculated as the ratio
between network generative and absorbing power:
A�GEN=ABS (2)
These two parameters express the capability of the
discourse flow to, respectively, increase and decrease
the meaning variability over time. It is based on
the measure of the single node’s contribution to
the discourse meaning variability.
To calculate the contribution of a node, S(CNTj),
the sum and the difference of the frequencies of
outgoing and incoming connections (respectively, ouj
and inj) are multiplied and weighted by the number
of theoretically possible connections (two times the
number of nodes, or 2K) and the frequency of the
node (freqj):
S(CNTj)�(ou j � in j)
2K�
(ou j � in j)
freq j
(3)
According to the measure of the contribution,
nodes can be classified as ‘‘generative,’’ ‘‘relay,’’ or
‘‘absorbing.’’ The distinction is based on the differ-
ence between outgoing and incoming connections.
In a generative node, the difference is positive; in an
absorbing node, negative; and in a relay node, null.
The network’s generative power (GEN) and absorb-
ing power (ABS) are calculated as the average
contribution of the generative nodes and of the
absorbing nodes, respectively.
Super-order nodes (SN) are particular nodes
carrying out the function of super-ordered meaning
working as taken-for-granted assumptions (e.g.,
concepts of self and others, affective schemata,
metacognitive modalities, relational and attachment
strategies, unconscious plans) regulating patients’
interpretation of the experience (see Teasdale
& Barnard, 1993) and, more in general, sense-
making*in psychotherapy dialogue too.
The super-order meanings’ regulative function
results from the high frequency of occurrence and
the strong connectivity they have with other nodes.
The index is calculated as the percentage of highly
frequent nodes with high (generative or absorb-
ing) contribution as well. DFA defines the high-
frequency node as a node with a frequency higher
than 1.5 times the average ratio between token and
type. The contribution is considered high if a node
has outgoing or incoming connections with more
than 33% of the nodes in the network.
All these indexes, taken singly, give no information
on the quality of the psychotherapy process. They,
therefore, have to be taken into account together, in
their interactions, with the function of describing the
internal dynamic of the discourse network, without
any specific reference to the clinical significance of
this dynamic.
Step 4: Neural Network for the Sessions’
Classification
Neural networks can be a useful instrument for the
analysis of the psychotherapy process. As discussed
in the previous steps, the implementation of DFA
leads to the representation of the whole commu-
nicative exchange between therapist and patient in
terms of discourse networks and provides a descrip-
tion of such networks by means of structural and
dynamic indexes. The aim of this fourth step is to
provide an interpretation of these indexes based on
their classification into homogeneous classes.
Therefore, the neural network we are about to
construct has to be able to:
1. Discriminate patterns of indexes according to
regularities and differences between them;
2. Classify the sessions in classes in accordance to
these patterns of indexes; and
3. Compare the classification provided by the
network with a theoretical based classification
in order to test the convergence between the
two classifications.
The building block of an artificial neural network
is a processing unit called neuron (or neurode, node,
or unit), which captures many essential features of
biological neurons. It receives input from other
neurons or from an external source. Each input has
an associated weight (w), which can be modified so
as to model synaptic learning. The outcome of each
unit (a) is merely the result of a function like this:
ai �f (XR
j�1
wij pj )
where p is the incoming input signal and the function
argument is called net input (n) to unit i. A neural
network is composed of such units and the weighted
unidirectional connections between them; in some
neural nets, the number of units may be in the
thousands. For a correct functioning of the network,
a further element is introduced in the network, the
so-called bias. The bias is much like a weight, except
that it has a constant input of 1; like weights, biases
are scalar parameters of the neuron, adjustable by
the learning rule used. This element is nothing but a
threshold term, regulating the ‘‘activation’’ or the
‘‘inhibition’’ of the neuron (for more details, see
Floreano, 1996); for a linear output unit, the bias
term is equivalent to an intercept in a regression
model.
8 M. Nitti et al.
Downloaded By: [Nitti, Mariangela] At: 14:29 27 July 2010
The output of one unit typically becomes an input
for another; they may also be units with external
inputs/outputs.
To simplify the notation, we can consider all the
items of the network in terms of vectors and
matrixes.
a�f (wp)�f (n)
Function f is called activation function or transfer
function; in the simplest case, f is the identity
function, and the unit output is just its net input
(this is called ‘‘linear unit’’). According to the goals
of the network, it is possible to choose among many
activation functions; one of the most used is the
threshold function: If the net input is greater than a
given constant, the activation value is 1 and is 0
otherwise.
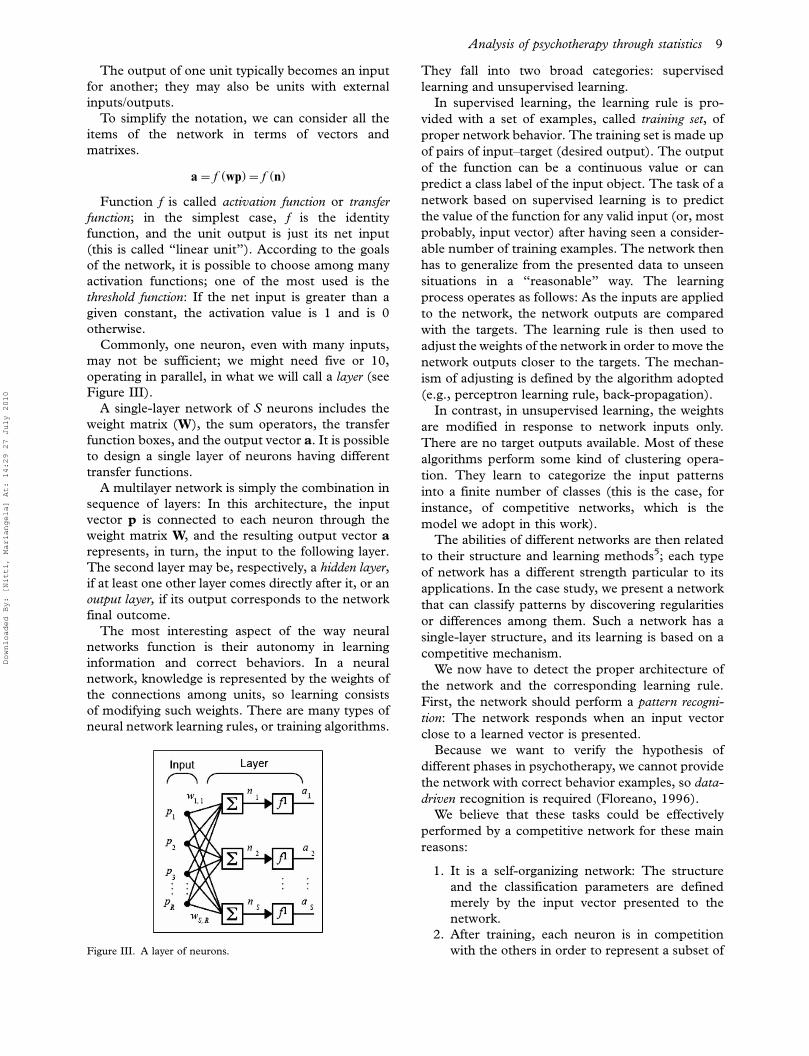
Commonly, one neuron, even with many inputs,
may not be sufficient; we might need five or 10,
operating in parallel, in what we will call a layer (see
Figure III).
A single-layer network of S neurons includes the
weight matrix (W), the sum operators, the transfer
function boxes, and the output vector a. It is possible
to design a single layer of neurons having different
transfer functions.
A multilayer network is simply the combination in
sequence of layers: In this architecture, the input
vector p is connected to each neuron through the
weight matrix W, and the resulting output vector a
represents, in turn, the input to the following layer.
The second layer may be, respectively, a hidden layer,
if at least one other layer comes directly after it, or an
output layer, if its output corresponds to the network
final outcome.
The most interesting aspect of the way neural
networks function is their autonomy in learning
information and correct behaviors. In a neural
network, knowledge is represented by the weights of
the connections among units, so learning consists
of modifying such weights. There are many types of
neural network learning rules, or training algorithms.
They fall into two broad categories: supervised
learning and unsupervised learning.
In supervised learning, the learning rule is pro-
vided with a set of examples, called training set, of
proper network behavior. The training set is made up
of pairs of input�target (desired output). The output
of the function can be a continuous value or can
predict a class label of the input object. The task of a
network based on supervised learning is to predict
the value of the function for any valid input (or, most
probably, input vector) after having seen a consider-
able number of training examples. The network then
has to generalize from the presented data to unseen
situations in a ‘‘reasonable’’ way. The learning
process operates as follows: As the inputs are applied
to the network, the network outputs are compared
with the targets. The learning rule is then used to
adjust the weights of the network in order to move the
network outputs closer to the targets. The mechan-
ism of adjusting is defined by the algorithm adopted
(e.g., perceptron learning rule, back-propagation).
In contrast, in unsupervised learning, the weights
are modified in response to network inputs only.
There are no target outputs available. Most of these
algorithms perform some kind of clustering opera-
tion. They learn to categorize the input patterns
into a finite number of classes (this is the case, for
instance, of competitive networks, which is the
model we adopt in this work).
The abilities of different networks are then related
to their structure and learning methods5; each type
of network has a different strength particular to its
applications. In the case study, we present a network
that can classify patterns by discovering regularities
or differences among them. Such a network has a
single-layer structure, and its learning is based on a
competitive mechanism.
We now have to detect the proper architecture of
the network and the corresponding learning rule.
First, the network should perform a pattern recogni-
tion: The network responds when an input vector
close to a learned vector is presented.
Because we want to verify the hypothesis of
different phases in psychotherapy, we cannot provide
the network with correct behavior examples, so data-
driven recognition is required (Floreano, 1996).
We believe that these tasks could be effectively
performed by a competitive network for these main
reasons:
1. It is a self-organizing network: The structure
and the classification parameters are defined
merely by the input vector presented to the
network.
2. After training, each neuron is in competition
with the others in order to represent a subset ofFigure III. A layer of neurons.
Analysis of psychotherapy through statistics 9
Downloaded By: [Nitti, Mariangela] At: 14:29 27 July 2010

input patterns; this competition is won by the
most representative neuron.
The mechanism of competition (Hagan, Demuth,
& Beale, 1996) between neurons is very simple
and effective. The network is supplied with a great
number of example patterns of inputs; such exam-
ples are called characteristics and occur in the space of
characteristics. A suitable distance function, applied on
each pair of items, calculates the degree of likeness
between them.
At the end of the training, the network will
respond to the input by activating only one neuron,
the one closest to the input presented. This neuron is
called the winning neuron (i*), and its output, ai is the
average of the characteristics of the cluster (subset of
inputs) represented by the neuron.
The network, therefore, groups the examples
together into subsets with the highest inner homo-
geneity and the highest outer unlikeness. To do so,
the following transfer function is defined:
a�compet (n) (4)
where the network outcome (a) results from the
application of the transfer function compet to the
net input (n), that is, the inner product between
the input vector and the weights matrix.
The compet function operates by assigning ‘‘1’’ to
the neuron with the highest net input and ‘‘0’’ to the
others. The reason for this choice is that the higher
the inner product between input vector and weights,
the lower the distance between them and the
characteristics space. The winner is, therefore, the
neuron whose weights are most similar to the inputs
presented to the network.
In a competitive network, each neuron corresponds
to a subset of inputs: For example, if the network
consists of three neurons, it will classify inputs into
three classes; if there are seven neurons, the network
will fit a seven-class classification. The researcher,
therefore, has to set the structure of the network on
the basis of the number of classes expected. Gen-
erally, this is a limitation for those who want to
discover relations between data in an explorative way.
However, in our case, we need to adopt a confirmative
approach: We want to verify the existence of regular
trends within different phases of the therapy.
Theoretical Based Classification
We adopt as the criterion of comparison the two-
stage semiotic model (TSSM; Gennaro et al., 2010;
Salvatore et al., in press). This model considers the
psychotherapy process to be composed of two phases,
with different patterns of functioning. The TSSM
sees psychotherapy as a dialogical process involving
the deconstruction of old meanings and the creation
of new ones. The patient arrives at psychotherapy
with a predefined, more or less rigid system of*explicit, implicit, and latent*assumptions (e.g.,
concepts of self and others, affective schemata,
metacognitive modalities, relational and attachment
strategies, unconscious plans), which are taken for
granted and work as super-ordered meanings regulat-
ing the interpretation of experience (see Teasdale &
Barnard, 1993). This system of assumptions can be
conceived of as the source of the patient’s psycholo-
gical problems: symptoms, at the intrapsychic as well
as at the relational level. One of the main therapeutic
activities consists, therefore, of triggering the reorga-
nization of the patient’s super-ordered meanings.
TSSM claims that the change process in the
communicational system made up of patient�therapist interaction follows two stages. In the first
stage, the patient�therapist exchange works funda-
mentally as an external source of limitation on the
patient’s system of assumptions. The first stage is,
therefore, fundamentally a deconstructive process,
with therapeutic dialogue aimed at placing con-
straints on the regulative activity of the patient’s
problematic assumptions. The weakening of the
patient’s critical super-ordered meaning opens the
way for the emergence of new super-ordered ones.
This is what happens in the second, constructive,
stage, when the patient�therapist dialogue imple-
ments new super-ordered meanings, replacing the
previous ones in regulating the meaning-making
experience.6
Following the TSSM, we expect that the incidence
of the regulative assumption (i.e., of the super-
ordered meaning depicted by the DFA’s index:
super-ordered nodes) will decrease in the first stage
(deconstructive stage) and then increase in the
second (constructive stage).
Following TSSM, we differentiate the psychother-
apy process into two macrophases, a deconstructive
and a constructive phase, adopting as a cutoff point
the session with the first negative peak of the SN
index.7
Finally, we compare the TSSM-based classifica-
tion and the one provided by the operation of pattern
recognition performed by the neural network (we use
a nonparametric test* Fisher’s exact test*for this
purpose). Insofar as these two classifications prove to
be consistent (i.e., their association is statistically
significant), then it could be concluded that the
sessions of each of the two phases defined on the
basis of the TSSM criterion are characterized by a
specific pattern of functioning of the psychotherapy
process. On the other hand, such a result would
mean that the neural network is able to discriminate
the sessions in a clinically meaningful way.
10 M. Nitti et al.
Downloaded By: [Nitti, Mariangela] At: 14:29 27 July 2010

A Case Study: Pietro’s Psychotherapy
To explain better the way the DFA method works,
we proceed with the examination of an empirical
case. The analysis is based on the verbatim tran-
scriptions of 43 sessions of a single case of supportive
psychodynamic psychotherapy.
At the time of the therapy, Pietro was a 22-year-
old undergraduate student at the University of
Padua who sought psychological counseling at the
university’s psychological support service because of
his difficulties with human relationships, resulting,
in his opinion, from insecurity and self-confidence
problems. Pietro received therapy approximately
once a week for 2 years, for a total of 79 sessions.
Results of several outcome measures indicate that
Pietro’s therapy was successful.
We now show how the DFA method operates in
practice by transforming therapy�patient conversa-
tions in discourse networks and evaluating them
in terms of dynamic systems able to generate new
intersubjective meanings. To achieve this aim, the
steps described in the previous section are followed
and some considerations about the outcomes pro-
vided.
Step 1: Content Analysis
The corpus consists of the verbatim transcriptions of
43 psychotherapy audiotaped sessions (randomly
sampled from the total of 79 sessions). Table VI
shows the output of the preliminary treatment of the
corpus (see section above).
A distinction must be made between word token
and word type: The former is the total amount of
words present in the text; the latter is the number of
words that are different from each other, subjected
to lemmatization.
The co-occurrence matrix derived by this pre-
liminary treatment of the corpus is made up of 5,367
rows (ECU) and 4,337 columns (lemmas). The
subsequent application of the MCA and CA to this
matrix led to the identification of 20 clusters/
thematic nuclei (inertia between clusters, in our
case equal to 49.1% on the total inertia). A sample
of the most representative ECUs of one of the
20 clusters is given in the Appendix. The following
text indexing was performed in accordance with
them, each ECU being attributed to the cluster with
which it was mainly associated.
Step 2: Creation of the Discourse Networks
The indexing of the ECU represents a transforma-
tion of the text into a sequence of thematic nuclei.
This sequence is the input of sequence analysis. In
this study, we have adopted the single session as a
window. That is, we performed a sequence analysis
separately for each sequence of clusters correspond-
ing to a session. This means that we created 43
discourse networks.
Step 3: Quantitative Analysis of the Discourse
Network
Indexes of the discourse network for each of the
43 sessions were calculated. Here we focus on the
main ones: connectivity, activity, and frequencies of
super-order nodes (SN) (it is worth remembering
that a proper interpretation of the results needs a
joint evaluation of all index trends).
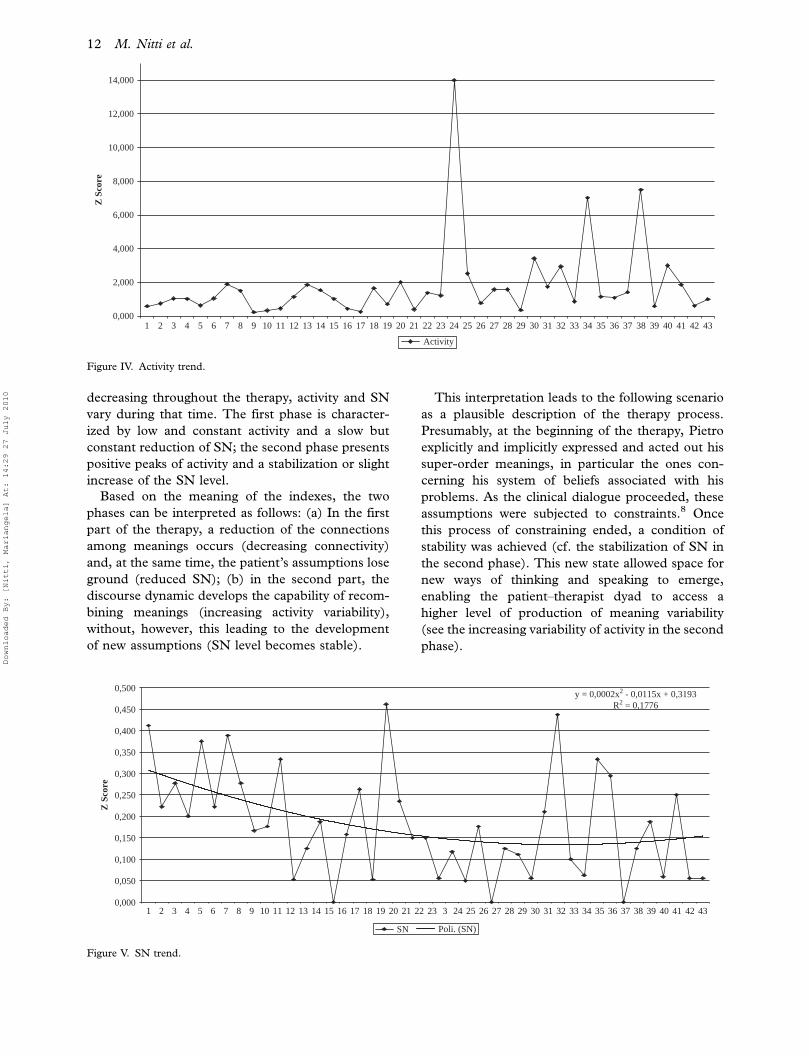
Activity: As shown in Figure IV, the activity can be
depicted as having two phases. While in the first
part of the therapy (Sessions 1�23) we find a
continuous basic line of low activity, from the
middle of the therapy there are precise, discrete
bursts of variability (see Sessions 24, 34, and 38).
SN: The SN globally follows a U-shape trend
(Figure V). In particular, one can distinguish a
first period (roughly from Session 1 to 18, with
Session 15 being the first negative peak) with a
downward trend, followed by a middle period
(roughly Sessions 19�30) characterized by a flat
trend (with the exception of some deviant ses-
sions, in particular Session 19). In the last third of
the sessions, the trend shows a slight inversion: a
weak rise associated with a considerable increment
of the variability between the sessions.
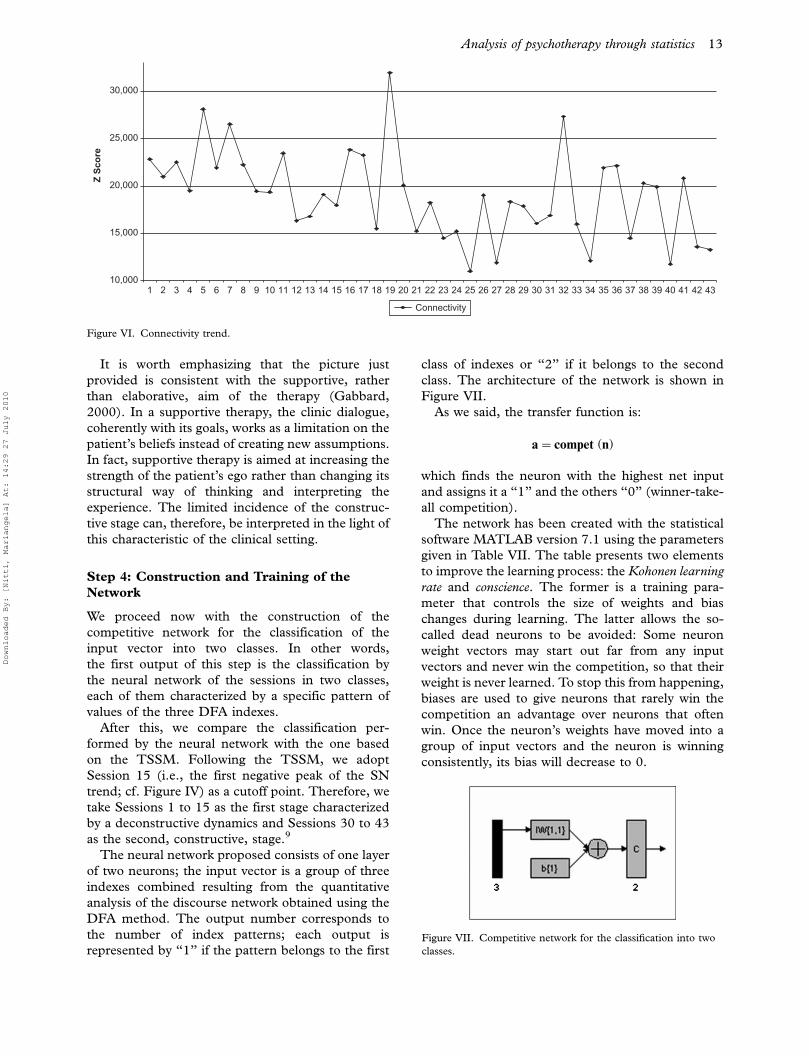
Connectivity: The shape of the connectivity index
curve (with exception of the peaks in Sessions
19 and 32) is slowly decreasing (Figure VI).
Taken together, these trends depict a double-
phase course. Whereas connectivity is constantly
Table VI. Output of Preliminary Treatment of the Corpus of
Pietro’s Therapy
Descriptive parameter Amount
Number of sessions 43
Number of ECUs 5,367
Mean number of ECUs per session 124.81
Number of occurrences in the text
(token)
140,869
Number of lemmas the text (type) 8,053
Token-type ratio 17.49
Number of lemmas in analysis 4,616
Frequency threshold for selecting the
lemma for analysis
5
Note. ECU, elementary context unit.
Analysis of psychotherapy through statistics 11
Downloaded By: [Nitti, Mariangela] At: 14:29 27 July 2010
decreasing throughout the therapy, activity and SN
vary during that time. The first phase is character-
ized by low and constant activity and a slow but
constant reduction of SN; the second phase presents
positive peaks of activity and a stabilization or slight
increase of the SN level.
Based on the meaning of the indexes, the two
phases can be interpreted as follows: (a) In the first
part of the therapy, a reduction of the connections
among meanings occurs (decreasing connectivity)
and, at the same time, the patient’s assumptions lose
ground (reduced SN); (b) in the second part, the
discourse dynamic develops the capability of recom-
bining meanings (increasing activity variability),
without, however, this leading to the development
of new assumptions (SN level becomes stable).
This interpretation leads to the following scenario
as a plausible description of the therapy process.
Presumably, at the beginning of the therapy, Pietro
explicitly and implicitly expressed and acted out his
super-order meanings, in particular the ones con-
cerning his system of beliefs associated with his
problems. As the clinical dialogue proceeded, these
assumptions were subjected to constraints.8 Once
this process of constraining ended, a condition of
stability was achieved (cf. the stabilization of SN in
the second phase). This new state allowed space for
new ways of thinking and speaking to emerge,
enabling the patient�therapist dyad to access a
higher level of production of meaning variability
(see the increasing variability of activity in the second
phase).
0,000
2,000
4,000
6,000
8,000
10,000
12,000
14,000
1 2 3 4 5 6 7 8 9 10 11 12 13 14 15 16 17 18 19 20 21 22 23 24 25 26 27 28 29 30 31 32 33 34 35 36 37 38 39 40 41 42 43
Z S
core
Activity
Figure IV. Activity trend.
y = 0,0002x2 - 0,0115x + 0,3193R2 = 0,1776
0,000
0,050
0,100
0,150
0,200
0,250
0,300
0,350
0,400
0,450
0,500
1 2 3 4 5 6 7 8 9 10 11 12 13 14 15 16 17 18 19 20 21 22 323 24 25 26 27 28 29 30 31 32 33 34 35 36 37 38 39 40 41 42 43
Z S
core
SN Poli. (SN)
Figure V. SN trend.
12 M. Nitti et al.
Downloaded By: [Nitti, Mariangela] At: 14:29 27 July 2010
It is worth emphasizing that the picture just
provided is consistent with the supportive, rather
than elaborative, aim of the therapy (Gabbard,
2000). In a supportive therapy, the clinic dialogue,
coherently with its goals, works as a limitation on the
patient’s beliefs instead of creating new assumptions.
In fact, supportive therapy is aimed at increasing the
strength of the patient’s ego rather than changing its
structural way of thinking and interpreting the
experience. The limited incidence of the construc-
tive stage can, therefore, be interpreted in the light of
this characteristic of the clinical setting.
Step 4: Construction and Training of the
Network
We proceed now with the construction of the
competitive network for the classification of the
input vector into two classes. In other words,
the first output of this step is the classification by
the neural network of the sessions in two classes,
each of them characterized by a specific pattern of
values of the three DFA indexes.
After this, we compare the classification per-
formed by the neural network with the one based
on the TSSM. Following the TSSM, we adopt
Session 15 (i.e., the first negative peak of the SN
trend; cf. Figure IV) as a cutoff point. Therefore, we
take Sessions 1 to 15 as the first stage characterized
by a deconstructive dynamics and Sessions 30 to 43
as the second, constructive, stage.9
The neural network proposed consists of one layer
of two neurons; the input vector is a group of three
indexes combined resulting from the quantitative
analysis of the discourse network obtained using the
DFA method. The output number corresponds to
the number of index patterns; each output is
represented by ‘‘1’’ if the pattern belongs to the first
class of indexes or ‘‘2’’ if it belongs to the second
class. The architecture of the network is shown in
Figure VII.
As we said, the transfer function is:
a�compet (n)
which finds the neuron with the highest net input
and assigns it a ‘‘1’’ and the others ‘‘0’’ (winner-take-
all competition).
The network has been created with the statistical
software MATLAB version 7.1 using the parameters
given in Table VII. The table presents two elements
to improve the learning process: the Kohonen learning
rate and conscience. The former is a training para-
meter that controls the size of weights and bias
changes during learning. The latter allows the so-
called dead neurons to be avoided: Some neuron
weight vectors may start out far from any input
vectors and never win the competition, so that their
weight is never learned. To stop this from happening,
biases are used to give neurons that rarely win the
competition an advantage over neurons that often
win. Once the neuron’s weights have moved into a
group of input vectors and the neuron is winning
consistently, its bias will decrease to 0.
Figure VII. Competitive network for the classification into two
classes.
10,000
15,000
20,000
25,000
30,000
1 2 3 4 5 6 7 8 9 10 11 12 13 14 15 16 17 18 19 20 21 22 23 24 25 26 27 28 29 30 31 32 33 34 35 36 37 38 39 40 41 42 43
Z Sc
ore
Connectivity
Figure VI. Connectivity trend.
Analysis of psychotherapy through statistics 13
Downloaded By: [Nitti, Mariangela] At: 14:29 27 July 2010
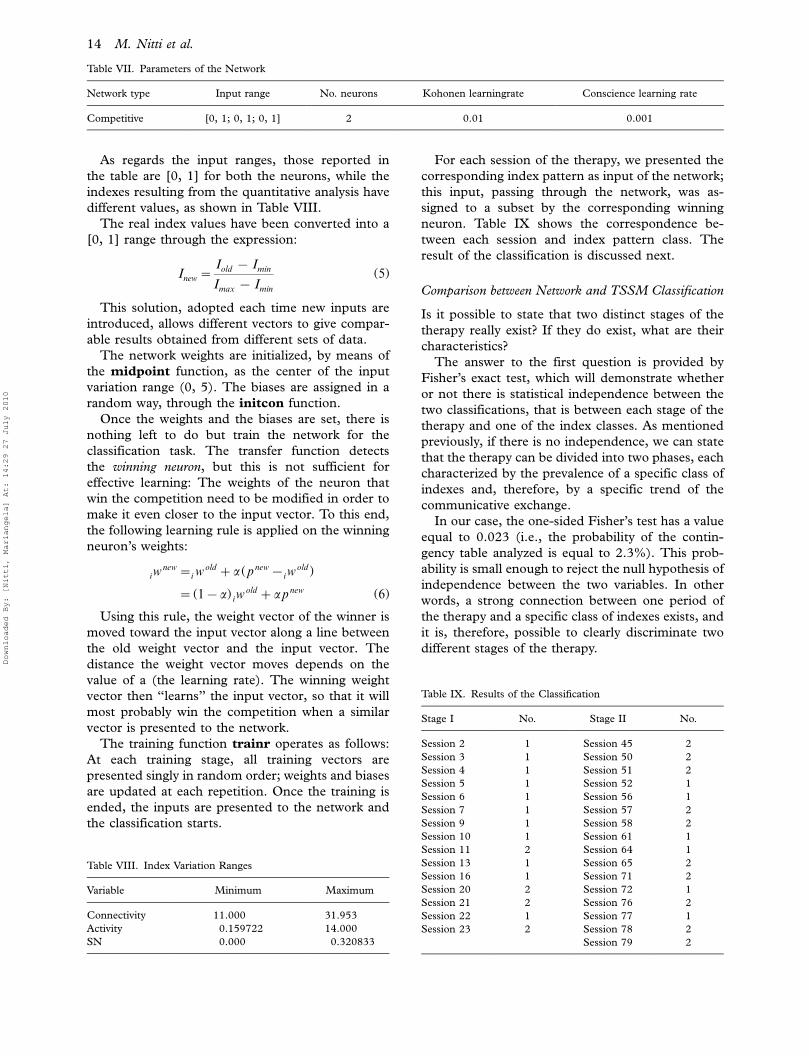
As regards the input ranges, those reported in
the table are [0, 1] for both the neurons, while the
indexes resulting from the quantitative analysis have
different values, as shown in Table VIII.
The real index values have been converted into a
[0, 1] range through the expression:
Inew�Iold � Imin
Imax � Imin
(5)
This solution, adopted each time new inputs are
introduced, allows different vectors to give compar-
able results obtained from different sets of data.
The network weights are initialized, by means of
the midpoint function, as the center of the input
variation range (0, 5). The biases are assigned in a
random way, through the initcon function.
Once the weights and the biases are set, there is
nothing left to do but train the network for the
classification task. The transfer function detects
the winning neuron, but this is not sufficient for
effective learning: The weights of the neuron that
win the competition need to be modified in order to
make it even closer to the input vector. To this end,
the following learning rule is applied on the winning
neuron’s weights:
iwnew�i w
old �a (pnew�iwold )
�(1�a) iwold �apnew (6)
Using this rule, the weight vector of the winner is
moved toward the input vector along a line between
the old weight vector and the input vector. The
distance the weight vector moves depends on the
value of a (the learning rate). The winning weight
vector then ‘‘learns’’ the input vector, so that it will
most probably win the competition when a similar
vector is presented to the network.
The training function trainr operates as follows:
At each training stage, all training vectors are
presented singly in random order; weights and biases
are updated at each repetition. Once the training is
ended, the inputs are presented to the network and
the classification starts.
For each session of the therapy, we presented the
corresponding index pattern as input of the network;
this input, passing through the network, was as-
signed to a subset by the corresponding winning
neuron. Table IX shows the correspondence be-
tween each session and index pattern class. The
result of the classification is discussed next.
Comparison between Network and TSSM Classification
Is it possible to state that two distinct stages of the
therapy really exist? If they do exist, what are their
characteristics?
The answer to the first question is provided by
Fisher’s exact test, which will demonstrate whether
or not there is statistical independence between the
two classifications, that is between each stage of the
therapy and one of the index classes. As mentioned
previously, if there is no independence, we can state
that the therapy can be divided into two phases, each
characterized by the prevalence of a specific class of
indexes and, therefore, by a specific trend of the
communicative exchange.
In our case, the one-sided Fisher’s test has a value
equal to 0.023 (i.e., the probability of the contin-
gency table analyzed is equal to 2.3%). This prob-
ability is small enough to reject the null hypothesis of
independence between the two variables. In other
words, a strong connection between one period of
the therapy and a specific class of indexes exists, and
it is, therefore, possible to clearly discriminate two
different stages of the therapy.
Table VIII. Index Variation Ranges
Variable Minimum Maximum
Connectivity 11.000 31.953
Activity 0.159722 14.000
SN 0.000 0.320833
Table IX. Results of the Classification
Stage I No. Stage II No.
Session 2 1 Session 45 2
Session 3 1 Session 50 2
Session 4 1 Session 51 2
Session 5 1 Session 52 1
Session 6 1 Session 56 1
Session 7 1 Session 57 2
Session 9 1 Session 58 2
Session 10 1 Session 61 1
Session 11 2 Session 64 1
Session 13 1 Session 65 2
Session 16 1 Session 71 2
Session 20 2 Session 72 1
Session 21 2 Session 76 2
Session 22 1 Session 77 1
Session 23 2 Session 78 2
Session 79 2
Table VII. Parameters of the Network
Network type Input range No. neurons Kohonen learningrate Conscience learning rate
Competitive [0, 1; 0, 1; 0, 1] 2 0.01 0.001
14 M. Nitti et al.
Downloaded By: [Nitti, Mariangela] At: 14:29 27 July 2010

We now have to answer the second question: How
is each stage of the psychotherapeutic process
characterized? As described previously, at the end
of the training, each neuron represents the average
characteristics of the input patterns it classifies. In a
neural network, memory and knowledge are stored
in weights and biases of the neurons. Thus, in a
competitive network, the weights and the biases are
simply the prototypical index configurations found
in the patterns presented.
The final network parameters leading to our index
classification are presented in Table X. As regards
weights, each row corresponds to a neuron (a class)
and each column to a quantitative index: respec-
tively, connectivity, activity, and frequencies of SN.
The first neuron classifies the patterns of indexes
that are prevalent in the first stage of the therapy,
whereas the second neuron classifies those dominant
in the second stage.
We can summarize the main characteristics of
each stage as follows: The first stage sessions present
a high level of connectivity (0.555 on a 0�1 scale)
and SN (0.6) and a very low activity level (0.061); in
a mirror image, connectivity and SN drastically
decrease while the activity increases, even if it does
not reach a very high level. Therefore, in the second
stage of the therapy, a constraint on the discourse
network structure intervenes: The connections
among nodes become loose, with an important effect
on the regulative function of meanings (SN). The
reduction of super-order nodes does not involve a
reduction of the discursive dynamic, which, in fact,
is strengthened (as shown by the increasing activity).
It is finally possible to interpret the outputs of the
network in terms of clinical effects that the therapy is
able to produce on the patient. In the first phase of
the therapy, the interaction between therapist and
patient operates toward a limitation of the patient’s
beliefs and ways of perceiving experiences. The
therapy starts with a consistent wealth of meanings
regulating the patient’s interpretation of experience;
this is confirmed by the high level of super-order
nodes at the beginning of the therapy. During the
first stage, this level slowly decreases: The initial
assumptions are renegotiated through the discourse.
The reduction of super-order meanings is an effect
of the high connectivity among meanings and, only
marginally, of the activity.
The second one is the stage of re-elaboration of
sense. In this phase, the discourse dynamic enriches
the variability of the connections among meanings.
As a matter of fact, the second neuron, correspond-
ing to the second stage of the therapy, classifies
pattern combination with higher levels of activity.
Then, in the second stage, the communicative
exchange between patient and therapist becomes
capable of enlarging the paths of sensemaking by
enriching the combination among meanings that
these paths are made of. The activity then leads to
the recombination of the super-order meanings.
In summary, the competitive neural network
constructed here detects, among the index patterns
presented, such regularities that allow two classes to
be distinguished, corresponding with the two stages
(limitation and recombination) of the psychotherapy
process.
Conclusions and Potential Developments
The work presented here is an attempt to contribute
to the development of a technique, conceived and
tested in recent years, for analyzing the psychother-
apeutic process: discourse flow analysis.
The main strength and originality of such an
approach is the attempt to depict a model representing
the psychotherapeutic process with its temporal-
dynamic dimensions, by means of integrated statis-
tical methods allowing the creation of an automatic
procedure of analysis. Such methods are here
used in an innovative way: The cluster analysis,
usually adopted for the aims of classification, be-
comes a precious instrument for the content analysis;
the sequence analysis is implemented to discover
the sensemaking dynamics and represents the dis-
course network; the neural networks allow us to
identify the patterns characterizing the psychotherapy
process.
It is worth highlighting that because of its auto-
matic procedures of analysis the method consumes
relatively little time. Depending on the specific
operation involved, the function of researchers is to
define the parameters of the analysis and control or
complete the intermediate output (e.g., the case of
the lemmatization).
The introduction of these devices, and in parti-
cular of the neural network, represents an innovative
contribution to psychotherapy research. Researchers
are aware of the necessity of developing dynamic
approaches to the study of the psychotherapy
process so that it can be analyzed in terms of pattern
modification through time. Nevertheless, this theo-
retical awareness has not yet been translated into
consistent strategies and procedures of empirical
Table X. Parameters of the Network
Weights
Variable Connectivity Activity SN Biases
1st neuron 0.555 0.061 0.60 5.442
2nd neuron 0.214 0.173 0.18 5.430
Analysis of psychotherapy through statistics 15
Downloaded By: [Nitti, Mariangela] At: 14:29 27 July 2010

analysis. The DFA has been elaborated in order to
favor the overcoming of this methodological gap.
Needless to say, the encouraging results reported
in this study must not let its limits be under-
estimated. Our study is based on just one case. We
need more analyses to validate the DFA in terms of
both construct and convergent validity. We have
already obtained some positive results in this direc-
tion (Gennaro et al., 2010; Salvatore et al., 2007, in
press). Other case analyses have been planned to test
with a larger variety of types of psychotherapies,
clinical problems, and outcome.
Moreover, we are aware of several criticisms that
can be prompted by DFA. First, the method is quite
abstract and highly demanding of computational
competence. One could be led to ask: Where is the
clinical side in all this? How could it be useful for
clinicians?
We recognize the relevance of this issue. However,
the fact that a given technical competence is thought
of as sector-based or part of the common ground is a
matter of historical evolution of the field; for
instance, the statistical competence shared among
clinical researchers nowadays are very different in
quantity and quality compared with 20 years ago.
Above all, we believe that the development of a
clinical understanding of the psychotherapy process
can be enhanced by contributions coming from more
abstract and formal models. A method has to be
evaluated not on its complexity but on the mean-
ingfulness of its results in terms of implications for
clinical thought. So the right question is: Could DFA
be useful for the clinical side?
This study allows us to think that the answer to this
question could be positive. The DFA can contribute
to elaborate and validate a general model of the
psychotherapy process (TSSM), a goal that has
theoretical as well as methodological implications.
From a theoretical point of view, DFA proposes an
intersubjective and semiotic view of the psychother-
apy process. According to this view, the clinical
quality of psychotherapy as well as the mechanisms
of change need to be sought at the level of the
functional, structural, and dynamic characteristics
of the communication between therapist and patient
rather than in isolated aspects concerning the
patient’s and/or therapist’s state of mind (feeling,
attitude, thoughts, and the like) or behaviors. From a
methodological point of view, the DFA highlights
the need to move psychotherapy process research
toward a more dynamic and pattern-focused
approach (Greenberg, 1991, 1994; Russell, 1994)
to make it closer and more consistent to the actual
clinical experience and psychotherapists’ professional
culture.
A second critical issue concerns the DFA’s way of
interpreting the indexes. Focusing on the most
important example, we have to say that the inter-
pretation of the SN index as super-ordered meaning,
and thus in terms of the patient’s assumptions,
cannot be considered more than a plausible hypoth-
esis that requires further testing. This means devel-
oping the qualitative side of the DFA. In other words,
it means retrieving the content of the super-order
nodes and analyzing their discursive characteristics
and functions. For the present, what we can only say
is that our preliminary results are consistent with the
hypothesis grounding the TSSM model and the DFA
method.
Finally, we have to come back to the claim made at
the beginning of the study concerning the capability
of DFA to take the contextuality of meanings into
account. Needless to say, DFA has a limited rather
than absolute sensibility to the context. Many con-
textual dimensions and sources (e.g., paralinguistic
cues, nonverbal behavior, and syntactic, lexical, and
pragmatic markers) are not considered, because the
method focuses on just one aspect of contextuality:
the temporal dynamics of the discursive flow. Ob-
viously, no method can fully grasp the contextuality
of communication; suffice to say that this complete-
ness is already lost in the translation from the clinical
exchange to the transcript. On the other hand, the
levels of contextuality are not fully orthogonal among
themselves. Rather, because of the redundant char-
acter of the language, there is systematically a certain
extent of vicariousness through the dimensions of
the context. For instance, a patient striving to keep
himself emotively distant from the content of his
utterances could perform this communicative feat by
using redundantly a variable set of elements (e.g., an
impersonal syntactic expression, a distancing tone,
an abstract lexicon, and a controlled paralinguistic
and nonverbal behavior).
However, it is not possible to say to what extent
the redundancy of the language is a comfortable and
stable ground for the validity of the DFA with the
findings produced as far. The next fundamental step
in the development of the DFA will address this
point, it being the focal issue of any effort toward a
low inferential and time-efficient procedure of tex-
tual analysis aiming to deal with the complexity,
contingency, and dynamism of communication, in
particular the communication in a clinical setting.
Notes1 More precisely, the dialogical nature of sensemaking concerns
three complementary aspects (authors disagree in terms of the
relevance given to each of them). First, any sign (i.e., a word, an
utterance) takes place in the flow of other signs mobilized by the
participants in the dialogue. Every time people use signs, for
16 M. Nitti et al.
Downloaded By: [Nitti, Mariangela] At: 14:29 27 July 2010

speaking as well as for thinking or whatever use (e.g., as an
answer to the earlier signs of the flow, as an anticipation of the
future signs), those utterances are made by a present inter-
locutor, or by an imagined or imaginary other (Linell, 2009). In
that sense, sensemaking*also when it is a product of an
individual thinker*is itself always and already a dialogical
activity, inherently social. Second, signs specify their meanings
according to the position in that flow. The same utterance can
produce different meanings depending on which other utter-
ances come before and after. In that sense, sensemaking is
carried out through dialogue. Third, sensemaking is not merely
a matter of description of the reality. Rather, it has an inherent
social purpose: It is shaped by the intersubjective circumstances
motivating its activation. To use Wittgenstein’s terminology, the
meaning of a sign is its function of regulating the forms of life
carried on by linguistic games. Of course, broader contextual
dimensions (cultural models, ideologies, or structures of power)
are as much constitutive of the dialogical nature of thinking and
communicating as the situated circumstances of these activities
(Ratner, 2008). However, these dimensions have to be activated
within the contingence of the life of people influenced by them,
and it is at this level that we examine them here.2 However, one can observe that the method of content analysis
that DFA adopts makes the disambiguation not strictly
required. Indeed, the method is based on the co-occurrences
of the word within the utterances (see later discussion).
Consequently, the words are interpreted in accordance with
the context of their occurrence (i.e., the other words they tend
to occur with in the same utterance). Therefore, the disambi-
guation can be performed downhill, at the moment of the
interpretation of the cluster of co-occurring words. For instance,
imagine that the word ‘‘subject’’ has not been undertaken to
disambiguation. Moreover, imagine that the output of the
analysis shows that it is associated with words such as ‘‘under-
stand,’’ ‘‘to study,’’ ‘‘book,’’ and ‘‘examination.’’ One can then
conclude that in this context of co-occurrence the semantic
content that is pertinent is probably the one concerning ‘‘branch
of knowledge’’ rather than ‘‘person.’’3 Each lemma is considered a category of the ‘‘discourse’’ variable
and each ECU*that is, the context where a specific lemma is
used*is the statistical unit of analysis.4 Needless to say, this interpretation needs to be deepened and
perhaps articulated through a comparison of the other ECUs of
the cluster as well as of the whole distribution of the ECU of the
other clusters, a task that goes beyond the illustrative aim of our
discussion here (for details, see Salvatore et al., 2010).5 Another important aspect is the dynamic of the network, that is,
the direction of the information flow between and/or within
layers.6 Needless to say, the two stages are not totally distinct and
mutually exclusive. Both of them are present throughout the
whole psychotherapy, within every session, although to different
extents. However, the two-stage assumption asserts that, at the
macroanalytical level, in a clinically efficacious psychotherapy
process, it is possible to discriminate between a first stage
where deconstructive sensemaking is dominant and a second
one where the dynamics of sensemaking take on a constructive
function.7 Obviously, this criterion is valid insofar as the SN trend is
consistent with the U-shape model expected by the TSSM.8 The clinical literature provides various conceptualizations of the
clinical exchange in terms of a dialectical source of constraints
on a patient’s beliefs (inter alia; Salvatore, Tebaldi, & Potı,
2009).9 We have excluded from the analysis the sessions of the middle
period (Sessions 16�30). This is because the variability of
the SN trend in this period leads us to think that, at least in
the case of Pietro, the middle period may have worked as a
phase of transition, with no clear and discriminative pattern
emerging.
References
Anderberg, M. R. (1973). Cluster analysis for applications. New
York: Academic Press.
Andersen, S. (2001). The emergence of meaning: Generating
symbols from random sounds*A factor analytic model. Journal
of Quantitative Linguistics, 8(2), 101�136.
Austin, J. (1962). How to do things with words. Oxford, UK: Oxford
University Press.
Benzecri, J. P. (1973). L’Analyse des donnees. Tome I: La taxinomie.
Tome II: Correspondances [Data analysis. Volume I: The taxonomy.
Volume II: Correspondences]. Paris: Dunod.
Chambers, J., & Bickhard, M. (2007). Culture, self and identity.
Interactivist contributions to a metatheory for cultural psychol-
ogy. Culture and Psychology, 13(3), 259�295.
Dimaggio, G., & Semerari, A. (2004). Disorganized narratives:
The psychological condition and its treatment. In L. Angus &
J. McLeod (Eds.), The handbook of narrative and psychotherapy.
practice, theory and research (pp. 263�282). Thousand Oaks,
CA: Sage.
Floreano, D. (1996). Manuale sulle reti neurali [Handbook on neural
networks]. Bologna: Il Mulino.
Gabbard, F. (2000). Psychodynamic psychiatry in clinical practice
(3rd ed). Washington, DC: American Psychiatric Publishing Inc.
Gennaro, A., Al-Radaideh, A., Gelo, O., Manzo, S., Nitti, M.,
Auletta, A., et al. (2010). Modelling the psychotherapy process
as a meaning-making dynamics. The two stage semiotic model
(TSSM) and the discourse flow analyzer (DFA). In S.
Salvatore, J. Valsiner, A. Gennaro, & J. B. Traves Simon
(Eds.), YIS: Yearbook of idiographic science 2009, Volume 2.
Rome: Firera.
Gergen, K. J. (1999). An invitation to social construction. London:
Sage.
Greenberg, L. E. (1991). Research on the process of change.
Psychotherapy Research, 1(1), 3�16.
Greenberg, L. E. (1994). The investigation of change: Its
measurement and explanation. In R. L. Russell (Ed.), Reasses-
sing psychotherapy research (pp. 114�143). New York: Guilford
Press.
Hagan, M. T., Demuth, H. B., & Beale, M. (1996). Neural network
design. Boston: PWS Publishing.
Harre, R., & Gillett, G. (1994). The discursive mind. London: Sage.
Hermans, H. J. M., & Hermans-Jansen, E. (1995). Self-narratives.
The construction of meaning in psychotherapy. New York: Guilford
Press.
Hoffman, I. Z. (1998). Ritual and spontaneity in the psychoanalytic
process. Hillsdale, NJ: Analytic Press.
Lancia, F. (2005). Word co-occurrence and similarity in meaning.
Retrieved July 2, 2006 from http://www.mytlab.com/wctheory.
pdf.
Landauer, T. K., & Dumais, S. (1997). A solution to Plato’s
problem: The latent semantic analysis theory of acquisition,
induction and representation of knowledge. Psychological Re-
view, 104, 211�240.
Linell, P. (2009). Rethinking language, mind, and world dialogically.
Charlotte, NC: Information Age.
Nicolo, G., & Salvatore, S. (Eds.). (2007). La ricerca sui risultati e
sul processo in psicoterapia [Research in psychotherapy outcome
and process]. Rome: Edizioni Carlo Amore.
Nightingale, D. J., & Cromby, J. (Eds.). (1999). Social construc-
tionist psychology. A critical analysis of theory and practice.
Buckingham, UK: Open University Press.
Analysis of psychotherapy through statistics 17
Downloaded By: [Nitti, Mariangela] At: 14:29 27 July 2010
Ratner, C. (2008). Cultural psychology and qualitative methodol-
ogy: Scientific and political considerations. Culture and Psychol-
ogy, 14(3), 259�288.
Rommetveit, R. (1992). Outlines of a dialogically based social�cognitive approach to human cognition and communication. In
A. H. Wold (Ed.), The dialogical alternative towards a theory of
language and mind (pp. 19�44). Oslo: Scandinavian University
Press.
Rosenberg, S. D., Schnurr, P. P., & Oxman, T. E. (1990). Content
analysis: A comparison of manual and computerized systems.
Journal of Personality Assessment, 5(1�2), 298�310.
Russell, R. L. (Ed.). (1994). Reassessing psychotherapy research.
New York: Guilford Press.
Salvatore, S., Gelo, O., Gennaro, A., Manzo, S., & Al-Radaideh,
A. A. M. (in press). Looking at the psychotherapy process as an
intersubjective dynamic of meaning making. A case study with
discourse flow analysis. Journal of Constructivist Psychology.
Salvatore, S., Gennaro, A., Auletta, A., Al-Radaideh, A. A. M.,
Aloia, N., Masiello, F., et al. (2010, June). Perspectives for the
textual data analysis: A contextual approach. Paper presented at
the 41st International Meeting of the Society for Psychotherapy
Research, Pacific Grove, CA.
Salvatore, S., Gennaro, A., Grassi, R., Manzo, S., Melgiovanni,
S., Mossi, P., et al. (2007). Lo studio del processo terapeutico
in termini di analisi della dinamica discorsiva. Applicazione del
DFA (discourse flow analyzer) al caso K [The study of the
therapeutic process in terms of the discourse dynamic. The
application of DFA (discourse flow analyzer) to case K]. In G.
Nicolo & S. Salvatore (Eds.). La ricerca sui risultati e sul processo
della psicoterapia [Psychotherapy outcome and process research] (pp.
355�397). Rome: Firera & Liuzzo Group.
Salvatore, S., Tebaldi, C., & Potı, S. (2009). The discursive
dynamic of sensemaking. In S. Salvatore, J. Valsiner, S. Strout,
& J. Clegg (Eds.), YIS: Yearbook of idiographic science 2008,
Volume 1 (pp. 39�72). Rome: Firera. Retrieved September 20,
2008, from http://www.valsiner.com/articles/salvatore.htm.
Santos, A., Goncalves, M., Matos, M., & Salvatore, S. (2009).
Innovative moments and change pathways: A good outcome
case of narrative therapy. Psychology and Psychotherapy: Theory,
Research and Practice, 82, 449�466.
Steinbach, M., Karypis, G., & Kumar, V. (2000). A comparison of
document clustering techniques (University of Minnesota Techni-
cal Report No. 00-34). Retrieved December 4, 2006 from
http://www.cs.umn.edu/tech_reports_upload/tr2000/00-034.pdf
Storolow, R. D., Atwood, G. E., & Brandchaft, B. (1994). The
intersubjective perspective. Northvale, NJ: Jason Aronson.
Teasdale, J. D., & Barnard, P. J. (1993). Affect, cognition, and
change: Re-modeling depressive thought. Hillsdale, NJ: Erlbaum.
Valsiner, J. (2007). Culture in minds and societies. Foundations of
cultural psychology. New Delhi: Sage.
Wittgenstein, L. (1953). Philosophische Untersuchungen [Philosophi-
cal investigations] (2nd ed.). Oxford, UK: Basil Blackwell.
18 M. Nitti et al.
Downloaded By: [Nitti, Mariangela] At: 14:29 27 July 2010