ANALYSIS OF VARIATION IN CONCENTRATION OF ESSENTIAL AND NON ESSENTIAL ELEMENTS IN CANNED AND FRESH...
18
ANALYSIS OFVARIATION IN CONCENTRATION OF ESSENTIAL AND NON ESSENTIAL ELEMENTS IN CANNED AND FRESH FOOD UZAIRA RAFIQUE 1 , SUMREEN IQBAL, SAADIA FAIZ and AASIA HASHMI Environmental Sciences Program Fatima Jinnah Women University, The Mall, Rawalpindi, 46000 Accepted for Publication March 27, 2008 ABSTRACT Essential (copper, nickel and zinc) and nonessential (cadmium, lead and tin) elements were determined in canned and fresh food samples employing the technique of Flame Atomic Absorption Spectrophotometry. Food samples were purchased from the shelves of local markets of Rawalpindi, Islamabad and Wah Cantt, Pakistan. Canned food samples were analyzed to study the effect of temperature, time and pH on concentration of elements. To determine the magnitude of variation in concentration of elements in canned food, elemental analysis was performed on samples (food and medium) upon initial opening, and samples upon 4 weeks after opening. The physical observation of the canned food samples was also made to determine the internal coating (lacquer), headspace level and pH of the medium upon opening the can. The result showed that concentration of elements in canned food samples was greater than fresh food, and it increases with increasing time and temperature but decreases with increasing pH. A low concentration of elements was found related to fully lacquered cans, high pH of medium, low nitrate concentration and small headspace. The concentration of elements in each sample was compared statistically. PRACTICAL APPLICATIONS Food quality surveillance is a very important tool to develop a perspective of human health risks. The study is significant in evaluating the concentration of different elements in the food and the effect of their toxicities. This research has a very significant application at the end user level as to give information about the benefits of the fresh food over the canned food. The food industry 1 Corresponding author. TEL: 92-51-9270050; FAX: 92-51-9271168; EMAIL: [email protected] Journal of Food Processing and Preservation 33 (2009) 186–203. © 2009, The Author(s) Journal compilation © 2009 Wiley Periodicals, Inc. 186
Transcript of ANALYSIS OF VARIATION IN CONCENTRATION OF ESSENTIAL AND NON ESSENTIAL ELEMENTS IN CANNED AND FRESH...

ANALYSIS OF VARIATION IN CONCENTRATION OF ESSENTIALAND NON ESSENTIAL ELEMENTS IN CANNED
AND FRESH FOOD
UZAIRA RAFIQUE1, SUMREEN IQBAL, SAADIA FAIZ and AASIA HASHMI
Environmental Sciences ProgramFatima Jinnah Women University,
The Mall, Rawalpindi, 46000
Accepted for Publication March 27, 2008
ABSTRACT
Essential (copper, nickel and zinc) and nonessential (cadmium, lead andtin) elements were determined in canned and fresh food samples employing thetechnique of Flame Atomic Absorption Spectrophotometry. Food samples werepurchased from the shelves of local markets of Rawalpindi, Islamabad andWah Cantt, Pakistan. Canned food samples were analyzed to study the effect oftemperature, time and pH on concentration of elements. To determine themagnitude of variation in concentration of elements in canned food, elementalanalysis was performed on samples (food and medium) upon initial opening,and samples upon 4 weeks after opening. The physical observation of thecanned food samples was also made to determine the internal coating(lacquer), headspace level and pH of the medium upon opening the can. Theresult showed that concentration of elements in canned food samples wasgreater than fresh food, and it increases with increasing time and temperaturebut decreases with increasing pH. A low concentration of elements was foundrelated to fully lacquered cans, high pH of medium, low nitrate concentrationand small headspace. The concentration of elements in each sample wascompared statistically.
PRACTICAL APPLICATIONS
Food quality surveillance is a very important tool to develop a perspectiveof human health risks. The study is significant in evaluating the concentrationof different elements in the food and the effect of their toxicities. This researchhas a very significant application at the end user level as to give informationabout the benefits of the fresh food over the canned food. The food industry
1 Corresponding author. TEL: 92-51-9270050; FAX: 92-51-9271168; EMAIL: [email protected]
Journal of Food Processing and Preservation 33 (2009) 186–203.© 2009, The Author(s)Journal compilation © 2009 Wiley Periodicals, Inc.
186

can benefit from the study as it provides the details over the canned food aboutthe usage and storage. It also provides background knowledge about thedeadlines of storage with respect to different essential metal levels. Taking it asa precautionary measure, many of the digestive diseases and abdominal prob-lems can be avoided in masses. Industry can benefit by it to reduce theseelements to the minimum possible levels, and can search techniques todecrease the concentration of these elements. It will assist the industries todevelop procedures to conserve the food in good optimal manner for bestpossible, healthier levels. It will stress the desirability of the establishment oftolerances for metal in all foods as a public health measure. It will createawareness in Pakistan of food science and technology. It will also aid thehealth and food inspectors in improving food quality and developing strategiesto reduce the level of metal contamination in the food and to make it accordingto the WHO guidelines for food quality. This work has opened the doors toinvestigate the food quality in details with special reference to public health.
INTRODUCTION
Food consumed is a mixture of carbohydrates, fats, proteins, minerals andvitamins called nutrients that provide not only energy but also essential mol-ecules that cannot be synthesized by tissues for body maintenance and growth.Minerals (elements) occurring in the body constitute less than 0.01% of thebody mass and are termed as trace elements (Tanvir and Rakhshanda 2001).Certain trace elements (e.g., copper, zinc, nickel) are considered essential forlife, and their deficiency leads to related disorders in an otherwise well-fedindividual (Javaid et al. 1991). A micro nutrient deficiency is also termed ashidden hunger (Ayesha and Rakhshanda 2001). However, some trace metalsmay be toxic (e.g., lead, tin, cadmium) and eventually lethal. With increasingindustrialization and urbanization, more and more metals are entering into theenvironment. Metals are primarily distributed in the atmosphere, water, soiland sediments. Metals and other elements may enter the food chain at anypoint from growth and harvesting through storage and processing. However,certain food groups naturally contain and accumulate high concentrations ofthese elements (FSA 2004). The toxic effects of metals, particularly arsenic,mercury, cadmium and lead, have been broadly studied (Uchida et al. 1961;Schoerder 1965; Venugopal and Luckey 1975; Inskip and Piotrowsiki 1985;Nishihara et al. 1985; Kurieshy and D’siliva 1993; Narvaes 2002). Fresh foodsare preserved with different techniques such as canning, refrigeration, freez-ing, dehydration, freeze-drying, salting, pickling, pasteurization, fermenting,carbonating, chemical preservation, irradiation, etc., to avoid spoilage (Ahmad1993).
187ANALYSIS OF ELEMENTS IN CANNED AND FRESH FOOD

Canned foods are valuable commodities worldwide. Canning is a simpleand feasible technology for preservation of fruits and vegetables, and is asource of different metals into the food at the same time. The natural concen-tration of different elements in plant and animal tissues is low, and the maindietary source of these minerals are foods that have been in contact withmetallic cans (Greger and Baier 1981; Sherlock and Smart 1984; Rader 1991;Sumitani et al. 1993; Biego et al. 1999).
Food may be canned in glass jars or metal containers and require specialsealing equipments for canning; therefore, there is a need for regular moni-toring of toxic and essential trace elements in canned food products. Concen-tration of elements may exceed in canned foods due to the corrosion andleaching from un-lacquered or poorly lacquered cans (Fricke et al. 1979;Greger 1988). Different factors affecting the concentration of elements incanned foods are the lacquer of the can, the pH of the food, headspace,presence of nitrates, etc. In addition, it is essential to identify the interactionbetween the foodstuff and its package, particularly when it is being purchasedand consumed (Koçak et al. 2005).
The premium objective of the study is to ascertain the levels of differentelements in fresh and canned foodstuffs. For this purpose, the variation inconcentration was analyzed for essential (nickel, copper, zinc) and nonessen-tial elements (lead, cadmium, tin) in 10 canned foods and fresh food samples,each from local markets, and were determined by flame atomic absorptionspectrometry. The factors that are considered important, which enhance theleaching of elements into the canned medium, like presence or absence oflacquer, pH of food, storage conditions (time and temperature), storage ofopened cans, plant pigments and headspace level, were also studied.
EXPERIMENTAL
A food group of canned and fresh fruits, vegetables and cereals, includinglychee (L), pineapple, strawberry, corns, beans, peas, chickpeas, mushrooms,sweet potato and tomato, was purchased at random from the shelves of localmarkets of Rawalpindi, Islamabad and Wah Cantt. The canned food samplestaken were of different manufacturers (imported) except for corn and peas(local). Description of canned samples is presented in Table 1.
All glassware was soaked overnight in 10% (v/v) nitric acid, followed bywashing with 10% (v/v) hydrochloric acid, rinsed with double-distilled waterand dried before using. All reagents used were of analytical reagent grade(Merck, Germany). Standard stock solutions (1,000 mL) of nickel, copper,zinc, lead, cadmium and tin were prepared from nickel chloride (4.05 g),copper sulfate (3.93 g), zinc nitrate (4.54 g), lead nitrate (1.59 g), cadmium
188 U. RAFIQUE ET AL.

nitrate (2.74 g) and tin chloride (1.90 g), respectively. The working solutionswere freshly prepared by diluting an appropriate aliquot of the stock solutions.
To quantify the concentration of elements, each sample was preparedusing standard acid digestion procedure. Fresh and canned food samples weredried in an oven at 60–70C and were grounded to fine powder in pestle andmortar. A half gram each of dried samples was weighed into a 200-mL beakerand 10 mL of concentrated 65% nitric acid was added (Maas and Dressing1983). The beaker was covered with a watch glass and – after most of thesample had dissolved by standing overnight – heated on a hot plate to boil untilany vigorous reaction had subsided. The solution was allowed to cool, trans-ferred into a 50-mL volumetric flask and diluted to the mark with distilledwater. Five milliliters of medium of the canned samples were taken in a beakerand 10 mL concentrated 65% nitric acid was added to prepare the mediumsamples. Elements were determined by direct aspiration of the sample solutioninto the air/acetylene and NO2/acetylene flame. The blanks and calibrationstandard solutions were also analyzed in the same way as the sample solutions.
Headspace, thickness of can and pH of the medium was measured imme-diately after opening the cans. Nitrate concentration of the medium was alsodetermined by UV-Visible Spectrophotometer (UV-1601 Shimadzu, Japan) at220 nm. Each sample was analyzed separately for 4 weeks (80 samples) and attemperatures of 4, 30, 35, 40 and 45C (100 samples), to study the effect of timeand temperature. Can medium was also analyzed at pH of 3,4,5,6 and 7 (50samples) to observe the effect of pH. A Varian Model 220 atomic absorptionspectrophotometer (Varian, Australia) equipped with a deuterium backgroundcorrector was used for the quantification of essential (copper, zinc, nickel) andnonessential (lead, tin, cadmium) elements of 240 prepared samples includingfresh food, canned food and medium.
TABLE 1.ESTIMATION OF pH, HEADSPACE, INTERNAL COATING AND NITRATES
IN CANNED FOOD
Canned food Sample code Headspace (cm) Internal coating pH Nitrates (ppm)
Corns C 0.5 Lacquered 6.11 35.75Peas P 0.5 Lacquered 5.73 28.92Beans B 0.5 Partially lacquered 4.94 30.43Lychee L 0.4 Un-lacquered 3.94 22.91Chickpeas CP 0 Partially lacquered 6.24 38.24Strawberry S 0.3 Lacquered 3.5 35.10Pineapple PA 0.4 Un-lacquered 3.78 26.79Mushroom M 0.4 Un-lacquered 5.31 29.57Sweet potato SP 0.2 Lacquered 4.9 35.25Tomato T 0.3 Partially lacquered 4.52 29.05
189ANALYSIS OF ELEMENTS IN CANNED AND FRESH FOOD

RESULTS AND DISCUSSIONS
Results of pH, headspace, internal coating and nitrate concentration aretabulated in Table 1. It was noted that internal coating ranges from fullylacquered, partially lacquered to un-lacquered. No headspace was noted forchickpeas, whereas maximum headspace (0.5 cm) was found for corns, peasand beans. It was also observed that pH ranges from 3.5–6.24 (see Table 1). pHof the medium of all food samples was found in the acidic range with theobservation that strongly acidic pH (3.5–4.52) is of the fruits (strawberry,pineapple, lychee and tomato). The range of nitrate concentration in cannedfood samples was found between 22.19–38.24 ppm (see Table 1). A relationwas noted between concentration of nitrates, pH and internal coating. Theinternal coating is directly related to nitrate concentration but indirectly relatedto pH. The higher the nitrate contents and lower the pH, the higher theelemental concentration. This is also depicted by the presence of high amountsof elements (such as tin in sweet potato). Ability of acidic foods such astomatoes to leach elements from cans when they contain high concentration ofnitrate is well recognized (Vannoort et al. 2000).
Canned and fresh food samples were analyzed separately for thecomparative determination of elemental concentration. The result for themetal analysis in fresh food showed that the highest concentration of lead(0.2743 ppm) is present in tomato. The concentration of cadmium(0.0491 ppm), copper (0.4952 ppm) and zinc (0.9569 ppm) is found most inmushroom, whereas maximum tin (17.3895 ppm) and nickel (0.1859 ppm) isfound in strawberry (see Fig. 1). The result showed that the amounts ofcadmium, lead and tin are found to be exceeding the recommended tolerablelimits for food intake.
Canned food samples were analyzed immediately after opening the cans.The results are graphically presented in Fig. 1, showing that in the case of allthe food samples, the concentration of essential and nonessential elements isgreater in the case of canned samples than the fresh food samples.
The higher concentration of elements in the case of canned samples thanthe fresh food is perhaps due to the reason that canned food is subjected toheavy metal contamination during the canning process (Fong et al. 2006). Thehigher amount of elements in the canned samples are attributed to the canningor machining process (Nasir et al. 1990), and may be due to the corrosion ofcontainers caused by long storage of canned foods under improper conditions.
An exception was seen in the case of some food samples where theconcentration of elements (lead and cadmium) was insignificantly higher infresh samples than the canned ones (see Fig. 1b,d,f). The greater level of leadand cadmium may account from the natural levels of these elements in the soil;the accumulation of lead in the topsoil is of great ecological significance
190 U. RAFIQUE ET AL.

because of its great effect on the biological activity of soil (Alloway 1995),whereas additional cadmium is added to the environment through differentprocesses. Further cadmium has been added to agricultural soils through theuse of phosphate fertilizers (WHO 1989) and certain organic fertilizers basedon manures.
a Nickel
0
0.05
0.1
0.15
0.2
0.25
0.3
0.35
C P B L CP S PA M SP T
Sample Code
Con
cent
rati
on (
ppm
)
Fresh Canned
b Zinc
0
0.2
0.4
0.6
0.8
1
1.2
1.4
C P B L CP S PA M SP TSample Code
Con
cent
rati
on (
ppm
)
Fresh Canned
c Copper
0
0.2
0.4
0.6
0.8
1
1.2
1.4
C P B L CP S PA M SP T
Sample Code
Con
cent
rati
on (
ppm
)
Fresh Canned
d Lead
0
0.05
0.1
0.15
0.2
0.25
0.3
0.35
C P B L CP S P M SP TSample Code
Con
cent
rati
on (
ppm
)
Fresh Canned
e Tin
0
5
10
15
20
25
C P B L CP S PA M SP T
Sample Code
Con
cent
rati
on (
ppm
Fresh Canned
f Cadmium
0
0.01
0.02
0.03
0.04
0.05
0.06
0.07
C P B L CP S PA M SP T
Sample Code
Con
cent
rati
on (
ppm
)
Fresh Canned
FIG. 1. VARIATION IN THE CONCENTRATION OF ESSENTIAL AND NONESSENTIALELEMENTS IN FRESH AND CANNED FOOD SAMPLES (a–f)
(C) corns. (P) peas. (B) beans. (L) lychee. (CP) chickpeas. (S) strawberry. (PA) pineapple.(M) mushrooms. (SP) sweet potato. (T) tomato.
191ANALYSIS OF ELEMENTS IN CANNED AND FRESH FOOD

The statistical analysis of the results of the canned food samples and itsmedium to study the effect of time, temperature and pH on the concentrationof essential and nonessential elements, are tabulated through Tables 2–4, andFig 2.
For essential elements, the highest mean concentration of nickel(0.340 � 0.021) and copper (1.570 � 0.338) is found in tomato, whereas zinc(1.465 � 0.310) is found in mushroom canned food samples. The same case isobserved in medium samples with concentrations of nickel (0.750 � 0.050)and copper (2.275 � 0.310) in tomato, whereas zinc has the concentrationof 1.643 � 0.088 but the amounts are a little higher than the food samples.For nonessential elements in food samples, lead (0.400 � 0.079 and0.525 � 0.079) is found to be maximum in tomato, both in medium and foodsamples, respectively. The maximum concentration of tin, 26.258 � 4.383 and33.575 � 4.216, is found in food and medium samples of lychee, respectively.The cadmium concentration is present in tomato (0.059 � 0.000) and mush-room (0.098 � 0.001) in food and medium samples, respectively. The resultsrevealed that tomato has the maximum levels of most of the elements analyzed.
It was noted that with increase in time there is an increase in the concen-tration of elements, with a highest concentration in week four or the final weekof sampling. This is perhaps because when foods are stored in cans afteropening, even when refrigerated (Greger and Baier 1981), with each removalof a portion of food from the can, a new tin-food–air interface is formed,which results in the dissolution of greater quantities of elements in the food(Capar and Boyer 1980). Medium showed relatively higher concentration ofelements as compared with food samples. The results demonstrated a betterindication on the relationship of storage time with the metal contents alsoobserved by Arwanitoyannis (1990). Among all the elements studied, tin was
TABLE 2.CONCENTRATION (IN ppm) OF ESSENTIAL AND NON ESSENTIAL ELEMENTS
IN FRESH FOOD SAMPLES
Fresh food Cadmium Lead Tin Nickel Copper Zinc
Corns 0.0193 0.1119 10.4192 0.0478 0.3257 0.4729Peas 0.0247 0.0872 11.6062 0.0567 0.366 0.2049Beans 0.0348 0.1538 9.2999 0.0414 0.4511 0.3701Lychee 0.0132 0.1631 18.0416 0.0951 0.4536 0.7809Chickpeas 0.0142 0.1165 13.8713 0.0567 0.2483 0.4172Strawberry 0.0137 0.2353 17.3895 0.1859 0.2576 0.2095Pineapple 0.0171 0.1449 16.9837 0.0933 0.276 0.4647Mushroom 0.0491 0.2219 14.6951 0.0844 0.4952 0.9569Sweet potato 0.0358 0.2504 14.9342 0.0862 0.1394 0.6992Tomato 0.0414 0.2743 13.3464 0.0966 0.4025 0.6056
192 U. RAFIQUE ET AL.

TAB
LE
3.(a
)ST
AT
IST
ICA
LA
NA
LYSI
SO
FW
EE
KLY
VA
RIA
TIO
NIN
CO
NC
EN
TR
AT
ION
(ppm
)O
FE
SSE
NT
IAL
EL
EM
EN
TS
INC
AN
NE
DFO
OD
AN
DM
ED
IUM
SAM
PLE
S(b
)ST
AT
IST
ICA
LA
NA
LYSI
SO
FW
EE
KLY
VA
RIA
TIO
NIN
CO
NC
EN
TR
AT
ION
(ppm
)O
FN
ON
ESS
EN
TIA
LE
LE
ME
NT
SIN
CA
NN
ED
FOO
DA
ND
ME
DIU
MSA
MPL
ES
Nic
kel
Food
Med
ium
Sam
ples
Mea
n�
SESD
tw
hen
n=
4,df
=3
Sign
ifica
nce
(2-t
aile
d)M
ean
�SE
SDt
whe
nn
=4,
df=
3Si
gnifi
canc
e(2
-tai
led)
(a)
C0.
138�
0.00
90.
017
16.1
020.
001
0.51
5�
0.04
80.
024
21.4
770.
000
P0.
155
�0.
022
0.04
407
.112
0.00
60.
475
�0.
039
0.01
924
.529
0.00
0B
0.19
8�
0.02
30.
046
08.6
370.
003
0.56
5�
0.04
40.
022
25.4
810.
000
L0.
183
�0.
008
0.01
524
.333
0.00
00.
700
�0.
065
0.03
221
.602
0.00
0C
P0.
163
�0.
011
0.02
214
.657
0.00
10.
545
�0.
037
0.01
829
.485
0.00
0S
0.24
3�
0.01
30.
025
19.4
000.
000
0.76
8�
0.04
30.
021
35.9
320.
000
PA0.
198
�0.
015
0.03
013
.228
0.00
10.
498
�0.
046
0.02
321
.417
0.00
0M
0.18
0�
0.01
40.
028
12.7
280.
001
0.51
0�
0.05
00.
025
20.2
650.
000
SP0.
260
�0.
023
0.04
511
.438
0.00
10.
688
�0.
030
0.01
546
.047
0.00
0T
0.34
0�
0.02
10.
042
16.0
280.
001
0.75
0�
0.05
00.
025
30.2
020.
000
Zin
cC
0.89
3�
0.11
20.
056
15.9
710.
001
0.91
0�
0.07
10.
035
25.7
390.
000
P0.
495
�0.
121
0.06
08.
2030
0.00
40.
628
�0.
035
0.01
835
.857
0.00
0B
0.54
5�
0.09
30.
046
11.7
310.
001
0.61
5�
0.03
90.
019
31.7
580.
000
L1.
350
�0.
300
0.15
08.
9900
0.00
31.
615
�0.
072
0.03
644
.649
0.00
0C
P0.
608
�0.
036
0.01
833
.807
0.00
00.
790
�0.
056
0.02
828
.226
0.00
0S
0.32
5�
0.10
10.
050
6.44
700.
008
0.52
0�
0.04
30.
022
24.0
710.
000
PA0.
575
�0.
045
0.02
325
.503
0.00
00.
763
�0.
036
0.01
842
.432
0.00
0M
1.46
5�
0.31
00.
155
9.43
900.
003
1.64
3�
0.08
80.
044
37.4
560.
000
SP0.
870
�0.
045
0.02
338
.275
0.00
01.
028
�0.
157
0.07
813
.131
0.00
1T
0.84
5�
0.08
70.
043
19.5
140.
000
0.91
0�
0.07
10.
035
25.7
390.
000
Cop
per
C0.
770
�0.
199
0.10
07.
732
0.00
41.
118
�0.
260
0.13
08.
590
0.00
3P
0.71
0�
0.18
50.
092
7.69
30.
005
1.07
5�
0.26
20.
131
8.20
30.
004
B0.
933
�0.
281
0.14
16.
629
0.00
71.
160
�0.
250
0.12
59.
282
0.00
3L
0.90
5�
0.23
30.
116
7.77
70.
004
1.30
0�
0.29
80.
149
8.72
20.
003
CP
1.00
3�
0.34
30.
172
5.83
90.
010
1.23
3�
0.20
20.
101
12.2
300.
001
S1.
095
�0.
249
0.12
58.
783
0.00
31.
433
�0.
265
0.13
210
.816
0.00
2PA
1.18
8�
0.18
80.
094
12.6
660.
001
1.53
3�
0.24
90.
125
12.3
000.
001
M0.
880
�0.
181
0.09
09.
738
0.00
21.
238
�0.
244
0.12
210
.136
0.00
2SP
0.31
8�
0.05
60.
028
11.2
990.
001
0.57
8�
0.14
10.
071
8.18
90.
004
T1.
570
�0.
338
0.16
99.
281
0.00
32.
275
�0.
310
0.15
514
.683
0.00
1
193ANALYSIS OF ELEMENTS IN CANNED AND FRESH FOOD

TAB
LE
3.C
ON
TIN
UE
D
Nic
kel
Food
Med
ium
Sam
ples
Mea
n�
SESD
tw
hen
n=
4,df
=3
Sign
ifica
nce
(2-t
aile
d)M
ean
�SE
SDt
whe
nn
=4,
df=
3Si
gnifi
canc
e(2
-tai
led)
(b)
C0.
148
�0.
035
0.01
808
.429
0.00
40.
173
�0.
043
0.02
27.
932
0.00
4P
0.16
5�
0.03
50.
018
09.3
970.
003
0.19
3�
0.01
30.
006
30.5
970.
000
B0.
265
�0.
042
0.02
112
.610
0.00
10.
353
�0.
059
0.02
912
.046
0.00
1L
0.31
5�
0.05
80.
029
10.8
580.
002
0.33
5�
0.07
80.
039
8.62
60.
003
CP
0.14
0�
0.01
40.
007
19.7
990.
000
0.19
8�
0.01
30.
006
31.3
910.
000
S0.
350
�0.
076
0.03
809
.191
0.00
30.
365
�0.
081
0.04
19.
008
0.00
3PA
0.35
8�
0.09
70.
049
07.3
650.
005
0.44
3�
0.16
60.
083
5.33
80.
013
M0.
318
�0.
062
0.03
110
.267
0.00
20.
360
�0.
062
0.03
111
.579
0.00
1SP
0.25
8�
0.02
80.
014
18.7
020.
000
0.42
0�
0.06
10.
030
13.8
720.
001
T0.
400
�0.
079
0.03
910
.160
0.00
20.
525
�0.
079
0.04
013
.229
0.00
1T
inC
14.8
65�
1.31
40.
657
22.6
300.
000
19.7
70�
2.39
21.
196
16.5
300.
000
P14
.938
�1.
160
0.58
025
.755
0.00
018
.495
�1.
414
0.70
726
.167
0.00
0B
15.7
55�
0.88
80.
444
35.4
700.
000
21.0
58�
1.30
30.
652
32.3
120.
000
L26
.258
�4.
383
2.19
111
.982
0.00
133
.575
�4.
216
2.10
815
.929
0.00
1C
P17
.840
�1.
427
0.71
424
.997
0.00
023
.998
�3.
005
1.50
315
.970
0.00
1S
23.6
50�
4.73
92.
370
9.98
100.
002
28.1
15�
3.14
61.
573
17.8
740.
000
PA21
.528
�2.
295
1.14
818
.759
0.00
029
.555
�4.
165
2.08
214
.193
0.00
1M
17.9
95�
1.28
70.
643
27.9
660.
000
26.4
70�
4.94
82.
474
10.6
990.
002
SP20
.195
�1.
989
0.99
420
.311
0.00
027
.303
�3.
720
1.86
014
.678
0.00
1T
23.2
93�
3.43
91.
719
13.5
480.
001
30.4
50�
4.02
72.
014
15.1
210.
001
Cad
miu
mC
0.01
7�
0.00
00.
000
181.
844
0.00
00.
017
�0.
000
0.00
025
9.49
00.
000
P0.
026
�0.
004
0.00
214
.531
0.00
10.
027
�0.
003
0.00
119
.763
0.00
0B
0.05
6�
0.00
30.
001
41.9
350.
000
0.05
9�
0.00
00.
000
260.
445
0.00
0L
0.01
9�
0.00
10.
000
61.2
280.
000
0.01
9�
0.00
00.
000
216.
943
0.00
0C
P0.
020
�0.
000
0.00
012
5.75
90.
000
0.02
3�
0.00
10.
001
31.4
510.
000
S0.
015
�0.
000
0.00
011
8.01
60.
000
0.05
9�
0.00
10.
001
116.
829
0.00
0PA
0.02
0�
0.00
00.
000
204.
193
0.00
00.
022
�0.
001
0.00
134
.834
0.00
0M
0.05
2�
0.00
00.
000
417.
000
0.00
00.
098
�0.
001
0.00
114
3.61
70.
000
SP0.
049
�0.
002
0.00
154
.345
0.00
00.
097
�0.
002
0.00
198
.024
0.00
0T
0.05
9�
0.00
00.
000
293.
590
0.00
00.
187
�0.
007
0.00
356
.262
0.00
0
C,c
orns
;P,p
eas;
B,b
eans
;L,l
yche
e;C
P,ch
ickp
eas;
S,st
raw
berr
y;PA
,pin
eapp
le;M
,mus
hroo
ms;
SP,s
wee
tpot
ato;
T,to
mat
o;SD
,sta
ndar
dde
viat
ion;
SE,s
tand
ard
erro
r;df
,deg
rees
offr
eedo
m.
194 U. RAFIQUE ET AL.

TAB
LE
4.(a
)E
FFE
CT
OF
TE
MPE
RA
TU
RE
VA
RIA
TIO
NO
NC
ON
CE
NT
RA
TIO
N.(
INpp
m)
OF
ESS
EN
TIA
LE
LE
ME
NT
SIN
CA
NN
ED
FOO
DA
ND
ITS
ME
DIU
M(b
)E
FFE
CT
OF
TE
MPE
RA
TU
RE
VA
RIA
TIO
NO
NC
ON
CE
NT
RA
TIO
N(I
Npp
m)
OF
NO
NE
SSE
NT
IAL
EL
EM
EN
TS
INC
AN
NE
DFO
OD
AN
DIT
SM
ED
IUM
(a)
Nic
kel
Food
Med
ium
Sam
ple
Mea
n�
SESD
Var
ianc
eSk
ewne
ssK
urto
sis
Mea
n�
SESD
Var
ianc
eSk
ewne
ssK
urto
sis
C0.
266
�0.
010
0.02
00.
009
0.84
61.
745
0.61
60�
0.01
810.
036
0.04
9-0
.579
-1.2
21P
0.30
6�
0.00
90.
017
0.01
2-0
.081
-0.8
170.
5480
�0.
0185
0.03
70.
038
0.23
6-1
.963
B0.
270
�0.
015
0.03
00.
009
0.57
70.
488
0.65
00�
0.01
640.
033
0.05
5-0
.353
-1.2
92L
0.33
0�
0.01
20.
025
0.01
40.
609
-0.1
330.
7440
�0.
0181
0.03
60.
073
0.12
30.
676
CP
0.30
4�
0.01
40.
027
0.01
2-0
.543
-0.0
030.
4780
�0.
0166
0.03
30.
029
0.60
7-1
.174
S0.
372
�0.
022
0.04
40.
017
1.16
31.
922
0.84
40�
0.01
440.
029
0.09
60.
608
-0.6
81PA
0.29
4�
0.01
50.
030
0.01
10.
147
0.15
40.
5940
�0.
0191
0.03
80.
045
0.11
6-0
.861
M0.
362
�0.
024
0.04
90.
016
-0.5
36-1
.973
0.59
40�
0.02
180.
044
0.04
5-0
.770
0.89
7SP
0.37
2�
0.01
70.
034
0.01
70.
863
1.09
20.
7600
�0.
0110
0.02
20.
078
1.36
12.
000
T0.
426
�0.
021
0.04
30.
023
-0.4
14-0
.961
0.77
80�
0.01
930.
0387
0.07
93-1
.258
0.51
4Z
inc
C1.
236
�0.
140
0.28
050.
1960
-0.2
06-2
.314
1.52
20�
0.14
160.
2832
0.28
610.
065
-1.4
50P
0.74
8�
0.02
30.
0453
0.07
220.
098
-2.6
950.
9280
�0.
1229
0.24
580.
1168
1.26
31.
644
B0.
622
�0.
022
0.04
400.
0493
1.27
00.
861
0.78
20�
0.06
300.
1261
0.07
470.
106
-1.9
47L
1.49
8�
0.05
80.
1151
0.28
42-0
.918
-1.0
351.
8560
�0.
1204
0.24
090.
4210
1.00
5-0
.449
CP
0.75
2�
0.04
30.
0866
0.06
950.
947
0.52
11.
1460
�0.
0596
0.11
930.
1625
-0.2
82-1
.457
S0.
494
�0.
051
0.10
210.
0306
1.04
20.
492
0.53
40�
0.01
860.
0372
0.03
640.
397
-1.5
78PA
0.64
6�
0.04
30.
0850
0.05
100.
600
-1.1
130.
8540
�0.
0273
0.05
460.
0938
0.21
3-2
.329
M1.
658
�0.
069
0.13
820.
3459
-0.4
86-0
.935
1.77
40�
0.05
180.
1037
0.40
75-0
.162
1.13
9SP
1.43
6�
0.11
50.
2291
0.25
18-0
.248
-2.2
841.
5380
�0.
1490
0.29
810.
2937
-0.2
91-2
.078
T1.
226
�0.
129
0.25
830.
1894
0.13
2-2
.871
1.26
60�
0.07
850.
1570
0.19
62-1
.205
0.66
8C
oppe
rC
0.85
8�
0.08
50.
1693
0.09
160.
762
0.03
81.
320
�0.
120
0.24
020.
2146
-0.7
210.
186
P0.
978
�0.
143
0.28
560.
1365
0.59
8-0
.858
1.28
2�
0.11
60.
2325
0.20
240.
374
-0.6
64B
1.00
8�
0.09
20.
1845
0.12
520.
173
-2.3
301.
408
�0.
126
0.25
280.
2439
-0.6
08-0
.492
L1.
020
�0.
108
0.21
580.
1312
0.61
9-1
.650
1.34
6�
0.08
990.
1797
0.22
120.
604
0.01
3C
P1.
218
�0.
170
0.33
980.
2064
0.11
2-2
.015
1.35
8�
0.15
00.
3002
0.23
500.
263
-0.5
10S
1.39
2�
0.16
80.
3371
0.25
37-0
.077
-1.6
311.
446
�0.
121
0.24
200.
2559
0.27
90.
500
PA1.
376
�0.
092
0.18
340.
2312
0.74
9-0
.059
1.56
0�
0.08
80.
1758
0.29
950.
567
0.75
1M
0.97
2�
0.09
50.
1898
0.11
74-0
.139
-1.4
171.
226
�0.
087
0.17
420.
1833
0.02
7-1
.301
SP0.
342
�0.
020
0.03
970.
0144
0.20
8-1
.464
0.74
0�
0.05
70.
1137
0.06
680.
267
-1.8
26T
1.66
0�
0.15
50.
3093
0.34
040.
298
-0.9
081.
738
�0.
085
0.16
920.
3755
0.03
6-0
.205
195ANALYSIS OF ELEMENTS IN CANNED AND FRESH FOOD

TAB
LE
4.C
ON
TIN
UE
D
(b)
Lea
d
Food
Med
ium
Sam
ple
Mea
n�
SESD
Var
ianc
eSk
ewne
ssK
urto
sis
Mea
n�
SESD
Var
ianc
eSk
ewne
ssK
urto
sis
C0.
270
�0.
034
0.06
80.
010
1.08
71.
334
0.33
0�
0.02
70.
053
0.01
30.
390
-1.2
06P
0.26
6�
0.05
90.
117
0.01
50.
473
-2.5
310.
348
�0.
033
0.06
70.
015
0.34
4-0
.883
B0.
272
�0.
031
0.06
10.
010
0.05
9-1
.433
0.30
2�
0.02
50.
050
0.01
10.
792
-1.5
66L
0.37
8�
0.03
00.
060
0.01
7-0
.058
-2.0
850.
384
�0.
026
0.05
10.
018
0.30
7-1
.544
CP
0.20
2�
0.02
80.
055
0.00
61.
111
1.43
40.
302
�0.
015
0.02
90.
011
0.84
9-0
.666
S0.
354
�0.
025
0.05
00.
015
-0.2
69-1
.151
0.38
2�
0.02
40.
048
0.01
80.
150
-1.9
37PA
0.35
4�
0.02
30.
047
0.01
50.
095
-1.4
980.
382
�0.
031
0.06
20.
018
1.09
40.
379
M0.
384
�0.
047
0.09
40.
019
-0.0
47-1
.864
0.36
2�
0.02
50.
049
0.01
60.
242
0.80
3SP
0.35
6�
0.02
40.
048
0.01
6-0
.407
-0.4
380.
410
�0.
025
0.05
10.
021
0.00
0-1
.711
T0.
422
�0.
024
0.04
90.
022
0.57
6-0
.422
0.46
4�
0.02
60.
052
0.02
7-0
.330
-1.8
62T
inC
15.8
78�
0.82
21.
6437
31.1
970.
970
-0.0
4222
.130
�1.
506
3.01
259
.785
0.29
4-2
.560
P15
.028
�0.
444
0.88
8429
.219
0.20
1-2
.764
19.7
30�
0.91
91.
838
48.5
470.
672
0.15
0B
15.4
50�
0.36
80.
7356
31.3
81-0
.407
-0.8
4321
.234
�1.
123
2.24
655
.710
0.69
8-1
.607
L25
.188
�1.
569
3.13
6977
.665
0.33
2-0
.977
34.5
28�
2.18
84.
376
145.
836
0.74
60.
245
CP
19.0
28�
1.07
12.
1427
44.5
570.
450
-0.6
4126
.018
�1.
537
3.07
583
.077
-0.0
85-2
.040
S24
.092
�1.
564
3.12
7070
.939
0.30
5-1
.278
26.8
96�
1.20
02.
401
90.5
20-0
.315
-0.9
39PA
24.3
80�
1.25
32.
5069
73.5
85-0
.226
-1.8
0629
.488
�1.
744
3.48
910
6.70
90.
079
-2.2
28M
18.9
98�
0.81
71.
6346
45.2
960.
459
-0.7
8126
.752
�1.
590
3.18
087
.804
0.41
8-0
.553
SP21
.846
�1.
215
2.43
0058
.775
0.43
4-0
.995
26.8
08�
1.67
53.
351
87.9
620.
622
-0.3
40T
25.4
54�
2.23
34.
4662
79.5
490.
291
-1.3
0030
.450
�1.
535
3.07
011
4.95
00.
445
-0.8
94C
adm
ium
C0.
0289
�0.
0002
0.00
040.
0001
-1.7
933.
447
0.02
94�
0.00
030.
0006
0.00
010.
600
-1.2
72P
0.03
67�
0.00
160.
0031
0.00
02-1
.534
2.67
10.
0382
�0.
0008
0.00
170.
0002
-0.4
94-3
.126
B0.
0671
�0.
0008
0.00
160.
0006
-0.9
270.
968
0.06
73�
0.00
070.
0014
0.00
060.
653
-0.2
35L
0.02
67�
0.00
040.
0008
0.00
01-0
.861
-1.7
060.
0271
�0.
0009
0.00
180.
0001
0.05
7-1
.194
CP
0.02
82�
0.00
060.
0012
0.00
01-0
.538
-3.1
670.
0284
�0.
0007
0.00
140.
0001
-1.6
733.
417
S0.
0275
�0.
0013
0.00
250.
0001
-0.5
14-2
.363
0.02
63�
0.00
140.
0028
0.00
01-1
.414
2.11
5PA
0.02
59�
0.00
080.
0016
0.00
010.
584
1.24
30.
0265
�0.
0006
0.00
110.
0001
0.41
0-2
.583
M0.
0654
�0.
0012
0.00
240.
0006
0.26
9-1
.818
0.06
66�
0.00
100.
0019
0.00
06-0
.475
-0.7
50SP
0.05
52�
0.00
130.
0026
0.00
040.
499
-1.1
200.
0570
�0.
0008
0.00
160.
0004
0.06
60.
077
T0.
0666
�0.
0013
0.00
260.
0006
-0.0
21-2
.542
0.06
77�
0.00
080.
0016
0.00
060.
109
-2.3
61
C,c
orns
;P,
peas
;B
,bea
ns;
L,l
yche
e;C
P,ch
ickp
eas;
S,st
raw
berr
y;PA
,pin
eapp
le;
M,m
ushr
oom
s;SP
,sw
eet
pota
to;
T,to
mat
o;SD
,sta
ndar
dde
viat
ion;
SE,s
tand
ard
erro
r.
196 U. RAFIQUE ET AL.
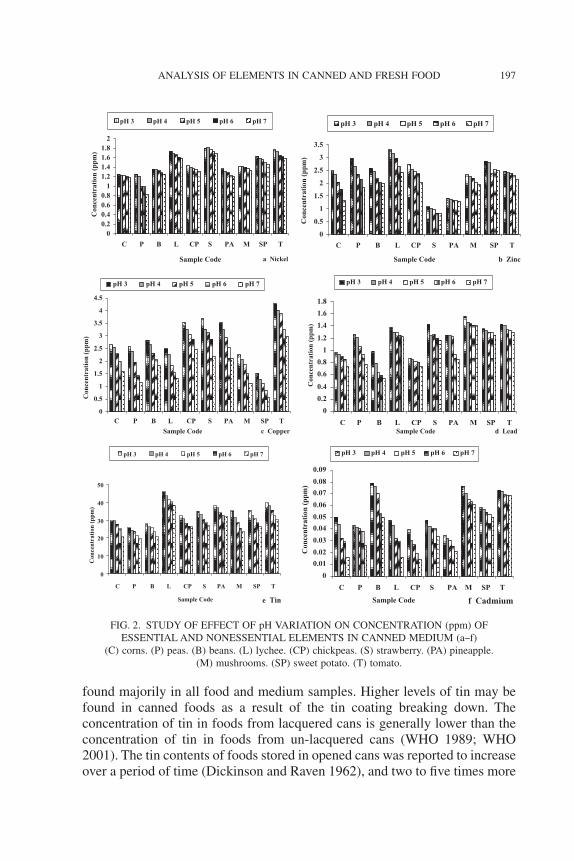
found majorily in all food and medium samples. Higher levels of tin may befound in canned foods as a result of the tin coating breaking down. Theconcentration of tin in foods from lacquered cans is generally lower than theconcentration of tin in foods from un-lacquered cans (WHO 1989; WHO2001). The tin contents of foods stored in opened cans was reported to increaseover a period of time (Dickinson and Raven 1962), and two to five times more
e Tin
0
10
20
30
40
50
C P B L CP S PA M SP T
Sample Code
Con
cent
rati
on (
ppm
)
pH 3 pH 4 pH 5 pH 6 pH 7
a Nickel
00.20.40.60.8
11.21.41.61.8
2
C P B L CP S PA M SP T
Sample Code
Con
cent
rati
on (
ppm
)
pH 3 pH 4 pH 5 pH 6 pH 7
b Zinc
0
0.5
1
1.5
2
2.5
3
3.5
C P B L CP S PA M SP T
Sample Code
Con
cent
rati
on (
ppm
)
pH 3 pH 4 pH 5 pH 6 pH 7
c Copper
0
0.5
1
1.5
2
2.5
3
3.5
4
4.5
C P B L CP S PA M SP T
Sample Code
Con
cent
rati
on (
ppm
)
pH 3 pH 4 pH 5 pH 6 pH 7
d Lead
0
0.2
0.4
0.6
0.8
1
1.2
1.4
1.6
1.8
C P B L CP S PA M SP TSample Code
Con
cent
rati
on (
ppm
)
pH 3 pH 4 pH 5 pH 6 pH 7
f Cadmium
0
0.01
0.02
0.03
0.04
0.05
0.06
0.07
0.08
0.09
C P B L CP S PA M SP T
Sample Code
Con
cent
rati
on (
ppm
)
pH 3 pH 4 pH 5 pH 6 pH 7
FIG. 2. STUDY OF EFFECT OF pH VARIATION ON CONCENTRATION (ppm) OFESSENTIAL AND NONESSENTIAL ELEMENTS IN CANNED MEDIUM (a–f)
(C) corns. (P) peas. (B) beans. (L) lychee. (CP) chickpeas. (S) strawberry. (PA) pineapple.(M) mushrooms. (SP) sweet potato. (T) tomato.
197ANALYSIS OF ELEMENTS IN CANNED AND FRESH FOOD

tin was found in canned food that had been open for 48 h (Iwamoto et al.1970). Thus, the elemental content of canned foods was affected by the lengthof storage. The tin in canned food is likely to be in the form of inorganic tinsalts (Sherlock and Smart 1984; Marro 1996; Vannoort et al. 2000). Bigelow,and Adam and Horner showed that tin concentration in canned food increasedover periods of a few months to 2 years (Bigelow 1916; Adam and Horner1937). This was subsequently supported by other investigators that cannedfood accumulated more tin and other metals when stored for longer periods(Arwanitoyannis 1990; Cichon 1995). Capar and Boyer (1980) also found thatthe tin content of foods in opened un-lacquered cans increased by an averageof about fourfold when stored for 5 days.
A maximum of fivefold increase was noted for tin in week three and fourin lychee, strawberry food samples, respectively, whereas in medium, fourthweek showed a fivefold increase in sweet potato and mushroom. The resultshowed that there is a considerable effect of storage time after opening of canon the concentration of tin in canned food samples. There is a consensus thatthe natural concentration of tin in plant and animal tissues is low and that themain dietary source of this mineral are foods that have been in contact withmetallic tin from the tinplate of cans used to preserve them (Monier-Williams1949; Schroeder et al. 1964; Greger and Baier 1981; Sherlock and Smart1984; Rader 1991; Sumitani et al. 1993; Biego et al. 1996).
An increase in concentration is related to a number of physicochemicalcharacteristics investigated in the present study. The observed increased con-centration of tin in lychee (food and medium) may be attributed to theun-lacquered coating, which is observed during the physical examination ofthe can of the lychee showing a good agreement with the earlier studies whichsuggests that most high concentrations of tin are found in canned foods due tothe corrosion and leaching of tin from un-lacquered or poorly lacquered cans(Monier-Williams 1949; Schroeder et al. 1964; Fricke et al. 1979; Greger1988) and acidic medium.
A relation is observed between low pH and high nitrate concentration onmetals amount. Low pH speeds up the dissolution of elements through oxida-tion of uncoated sides and seals of cans (Vannoort et al. 2000). High concen-tration of tin in strawberry is perhaps related not only to high acidity ofmedium, but also to high nitrates (Sherlock and Smart 1984) and high pig-mentation (Smart and Sherlock 1989).
Other factors that may increase the concentration of tin in canned foodsare the presence of oxygen in the can, headspace and of nitrate. The presenceof oxygen and other compounds can increase the rate of dissolution of tin intocanned foods to result in unacceptably high tin concentrations within a fewmonths (Sherlock and Smart 1984), and nitrates (Davis et al. 1979, 1980)favor corrosion of the internal surface of tin cans. These factors can also
198 U. RAFIQUE ET AL.

increase the rate of pitting and increase the migration of tin from un-lacqueredcans into foods (Davis et al. 1980; Sherlock and Smart 1984). The ability ofacidic foods such as tomatoes, apricots and peaches to leach tin from canswhen they contain high concentrations of nitrate is well recognized (Vannoortet al. 2000). Tomatoes sometimes have high concentrations of nitrate (Sher-lock and Smart 1984; Meah et al. 1991), thus, are susceptible to leaching ofelements into the food from the can. Presence of other elements such as nickeland lead may also come from the canning process. Contamination of lead incanned food may be attributed to two sources: the solder used in fabrication ofcan seams and the lead contained in the tin coating on tinplate (Cichon 1995).Food processing and storage methods apparently add to the nickel levelsalready present in foodstuffs through leaching from nickel-containing alloys infood-processing equipment (NAS 1975).
In order to study the effect of temperature, variation in concentration ofelements was measured at below room (4C), room (30C) and above room(45C) temperatures. The range of concentration of elements in food samplesfrom minimum to maximum increases 21, 22 and 32-fold at 4C, 30C and 45C,respectively. Maximum variation was found in the case of tin. The highestincrease is found in tomato. Medium samples also showed similar behavior ascanned food samples. The variation in the concentration of elements on heattreatment can be a result of the migration of elements from can into medium,which is accelerated when the ambient temperature exceeds 40C (Nagy et al.1980). Calloway and McMullen (1966) and Biego et al. (1999), also found asignificant effect of temperature on the amount of tin in canned food.
The effect of pH on chemical extraction of elements into the medium arestudied at variable pH, from strongly acidic to neutral (pH 3–pH 7) areselected. The concentration range of pH 3, pH 5 and pH 7 is found to be0.0354–45.6982 ppm, 0.0274–41.2694 ppm and 0.0142–38.2514 ppm, re-spectively, showing an evident effect of increase of elemental concentrationwhile moving from basic to acidic pH, evident from Fig. 2a–f. The highestelemental concentration found is of tin at acidic pH. It is found with theresearch that foods with a low pH are more aggressive to tin coating thanneutral or less acid foods. Acidic foods oxidize the uncoated sides or seals ofcans (Fricke et al. 1979), and the dissolution of tin can be rapid in an acidenvironment (Davis et al. 1979). In a study, the highest concentrations ofelements were found in canned acidic foods (Vannoort et al. 2000).
The tolerable limit for cadmium, tin, lead, copper are 0.007 mg/kg,14 mg/kg, 0.025 mg/kg, 0.2 mg/kg of body weight (bw)/week and zinc as45 mg/day, respectively, which was set at the different meetings of the FAO/WHO Joint Expert Committee on Food Additives (WHO 1989; WHO 1996;WHO 2000; WHO 2001). The study showed that the canned food in many ofthe cases exceeded the tolerable limits.
199ANALYSIS OF ELEMENTS IN CANNED AND FRESH FOOD

The concentration of each sample was compared statistically to othersamples taken at different stages of the process. Analysis of the data wasperformed on the results using Student’s t-test with a significance level set at0.05. Statistical analysis revealed a significant (P value is less than 0.05)difference at 95% confidence level for metal contents in cans with respect totime. Most of the sample analyzed to study the effect of temperature showeda positive skewness, which is an indication of a distribution with a symmetrictail extending towards more positive values characterizing the degree of sym-metry of the distribution towards right tail which is also verified by the resultsof kurtosis.
CONCLUSION
The study of the variation in concentration of essential (nickel, copperand zinc) and nonessential (lead, tin and cadmium) elements along with theinfluencing factors in canned and fresh food samples comes to the followingconclusions: that the concentration of elements increases with increasingstorage time of opened cans and increasing temperature but decreases withincreasing pH. It was noticed in almost all food samples that the concentrationof elements was higher in the case of canned food samples as compared withthe fresh one. The result showed that the elemental contents of productspacked in completely un-lacquered and end-lacquered cans were not signifi-cantly different from each other, but were higher than the content of productspacked in fully lacquered cans.
REFERENCES
ADAM, W.B. and HORNER, G. 1937. The tin content of English cannedfruits and vegetables. J. Soc. Chem Ind 56, 329t–334t.
AHMAD, A. 1993. Introduction to Food Science and Technology, Ferozsons(Pvt) Ltd, Pakistan.
ALLOWAY, B.J. 1995. Soil processes and the behaviour of metals. In HeavyMetals in Soils, (B.J. Alloway) pp. 122–151, Blackie, Londres.
ARWANITOYANNIS, I. 1990. The effect of storage of canned juices oncontent of the metals Fe, Cu, Zn, Pb, Sn, Al, Cd, Sb and Ni. Nahrung 34,141–145.
AYESHA, Y. and RAKHSHANDA, B. 2001. Role of zinc in human body andapproaches for improvement with reference to status in Pakistan. TheNucleus 38(3–4), 293–301.
200 U. RAFIQUE ET AL.

BIEGO, G.H., JOYEUX, M. and HARTEMANN, P. 1999. Determination ofdietary tin intake in an adult French citizen. Arch. Environ. Contam.Toxicol. 36, 227–232.
BIGELOW, W.D. 1916. Tin in canned foods. J. Ind. Eng. Chem. 8, 813–815.CALLOWAY, D.H. and MCMULLEN, J.J. 1966. Fecal excretion of iron and
tin by men fed stored canned foods. Am. J. Clin. Nutr. 18, 1–6.CAPAR, S.G. and BOYER, K.W. 1980. J. Food Safety 2, 105–118.CICHON, Z. 1995. Study on the migration phenomena of selected metals in
canned fruits during long storage. Nahrung 39, 219–227.DAVIS, D.R., COCKRELL, C.W. and WIESE, K.F. 1979. Pitting in canned
green beans: Effect of cultural practices, tin coating, vacuum, corrosionaccelerators, and storage conditions. J. Food Sci. 44, 241–245.
DAVIS, D.R., COCKRELL, C.W. and WIESE, K.F. 1980. Can pitting in greenbeans: Relation to vacuum, pH, nitrate, phosphate, copper, and ironcontent. J. Food Sci. 45, 1411–1415.
DICKINSON, D. and RAVEN, T.W. 1962. Tin content of canned fruits andvegetables. Food Manuf. 480–484.
FONG, S.S., KANAKARAJU, D., and LING S.C. 2006. Evaluation of theacid digestion method with different solvent combination determinationof iron, zinc and lead in canned sardines. Malays. J. Chem. 8(1), 10–15.
FOOD STANDARDS AGENCY. 2004. 2000 Total Diet Study of 12 Elements– Aluminum, Arsenic, Cadmium, Chromium, Copper, Lead, Manganese,Mercury, Nickel, Selenium, Tin and Zinc. Food Surveillance InformationSheet 48/04. http://www.food.gov.uk/multimedia/pdfs/fsismetals.pdf(accessed November 27, 2007).
FRICKE, F.L., ROBBINS, W.B. and CARUSO, J.A. 1979. Trace elementanalysis of food and beverages by atomic absorption spectrometry. Prog.Anal. At. Spectrosc 2, 185–286.
GREGER, J.L. 1988. Tin and aluminum. In Trace Minerals in Foods, (K.T.Smith, ed). Marcel Dekker, New York.
GREGER, J.L. and BAIER, M. 1981. Tin and iron content of canned andbottled food. J. Food Sci. 46, 1751–1754.
JAVAID, N., HASCHKE, F., PIETSCHNIG, B., SCHUSTER, E., HUEMER,C., SHEBAZ, A., GANESH, P., STEFFAN, I., HURREL, R. andSECRETIN, M.C. 1991. Interactions between infections, malnutritionand iron nutritional status in Pakistani infants. Acta. Paediatr. Scand. 374,141–150.
INSKIP, M.J. and PIOTROWSIKI, J.K. 1985. Review of the health effects ofmethyl mercury. J. Appl. Toxicol. 5, 113–133.
IWAMOTO, Y., MAEDA, Y., and HORIO T. 1970. Internal corrosion of cans.V. Dissolving of tin in cans after opening. Shokuhin Eiseigaku Zasshi 11,183–187.
201ANALYSIS OF ELEMENTS IN CANNED AND FRESH FOOD

KOÇAK, S. and TOKUÇOÇLU Ö., AYCAN S. 2005. Some heavy metal andtrace essential element detection in canned vegetable foodstuffs by Dif-ferential Pulse Polarography (Dpp) Electron. J. Environ. Agric. FoodChem. 4(2), 871–878.
KURIESHY, T.W. and D’SILIVA, C. 1993. Uptake and loss of mercury,cadmium and lead in marine organisms. Indian J. Exp. Biol. 31, 373–379.
MARRO, N. 1996. The 1994 Australian Market Basket Survey, Australia NewZealand Food Authority, Canberra, Australia.
MAAS, R.P. and DRESSING, S.A. 1983. Purification of nitric acid at tracemetal levels. Anal. Chem. 55(4), 808–809.
MEAH, M.N., SMART, G.A., HARRISON, A.J. and SHERLOCK, J.C. 1991.Lead and tin in canned foods: Results of the UK survey 1983–1987. FoodAddit. Contam. 8, 485–496.
MONIER-WILLIAMS, G.W. 1949. Tin. In Trace Elements in Food, pp. 138–161, John Wiley & Sons, New York.
NAGY, S., ROUSEFF, R. and TING S.V. 1980. Effects of temperature andstorage on the iron and tin contents of commercially canned single-strength orange juice. J. Agric. Food Chem. 28, 1166–1169.
NARVAES, D.M. 2002. Human exposure to mercury in fish in mining areasin the Philippines. FAO/WHO Global forum of food safety regulation,Marrakec, Morocco.
NAS. 1975. Nickel, p. 277, National Academy of Sciences, Washington, DC.NASIR, K., SUHELA, R. and SHAMIM A.C. 1990. Modern Trends in Con-
temporary Part 2: Elements, Ministry of Health, Wellington.NISHIHARA, T., SHIMAMATO, T., WEN, K.C. and KONDO, M. 1985.
Accumulation of lead, cadmium and chromium in several organs andtissues of carp. J. Hygienic Chemistry. 31, 119–123.
RADER, J.I. 1991. Anti-Nutritive Effects of Tin in Friedman, Nutritional andToxicological Consequences of Food Processing, Plenum Press, NewYork.
SCHOERDER, H.A. 1965. Cadmium as a factor in hypertension. J. Chron.Dis. 18, 647.
SCHROEDER, H.A., BALASSA, J.J. and TIPTON, I.H. 1964. Abnormaltrace metals in man: Tin. J. Chron. Dis. 17, 483–502.
SHERLOCK, J.C. and SMART, G.A. 1984. Tin in foods and the diet. FoodAddit. Contam. 1, 277–282.
SMART, G.A. and SHERLOCK, J.C. 1989. Survey of canned food storage inthe home. Food Addit. Contam. 6, 125–132.
SUMITANI, H., SHEKANE, S. and NAKATANI, A. 1993. Inductivelycoupled plasma atomic emission spectrometric determination of tin incanned food. J. Assoc. Off. Ana. Chem. 76, 1374–1377.
202 U. RAFIQUE ET AL.

TANVIR, A. and RAKHSHANDA, B. 2001. A review of method for assess-ment of trace element bioavailability in humans. The Nucleus 38(3–4),289–292.
UCHIDA, M., HIRAKAWA, Y. and INOUE, T. 1961. Biochemical studies onMinamata disease IV. Isolation and chemical identification of themercury compound in the toxic shellfish with special references to thecausal agent of the disease. Kumamoto Medical J. 14, 182–218.
VANNOORT, R., CRESSEY, P. and SILVERS K. 2000. 1997/98New Zealand Total Diet Survey, Part 2: Elements, Ministry of Health,Wellington.
VENUGOPAL, B. and LUCKEY, T. 1975. Toxicity of non radioactive heavymetals and their salts. In Heavy Metal Toxicity, Safety and Hormology, (F.Coulston, ed.). Academic Press, George Thieme Stuttagart, New York.
WHO. 1989. Evaluation of certain food additives and contaminants (Thirty-third Report of the Joint FAO/WHO Expert Committee on Food Addi-tives). Technical Report Series No. 776. World Health Organization,Geneva, Switzerland.
WHO. 1996. Trace elements in human nutrition. World Health Organization,Geneva, Switzerland.
WHO. 2000. Evaluation of certain food additives and contaminants (Fifty-third report of the Joint FAO/Expert Committee on Food Additives. Tech-nical Report Series No. 896. World Health Organization, Geneva,Switzerland.
WHO. 2001. Evaluation of certain food additives and contaminants (Fifty-sixth report of the Joint FAO/WHO Expert Committee on Food Additives(Summary). Technical Report Series in press. World Health Organization,Geneva, Switzerland.
203ANALYSIS OF ELEMENTS IN CANNED AND FRESH FOOD