Analysis of the reduction yield of synthetic iron oxide sinter reduced by H2 at 900-1100°C using...
7
Transcript of Analysis of the reduction yield of synthetic iron oxide sinter reduced by H2 at 900-1100°C using...
white paper
steel-grips.com 2014 11
Saeed Ghali, Elsayed A. Mousa
Analysis of the reduction yield of synthetic iron oxide sinter reduced
by H2 at 900-1100°C using factorial design approachThe factorial design approach can be used to precisely estimate the effect of different parameters on the reduction
process of iron oxide. In the current study, a 24 factorial design was used to significantly calculate the magnitude
impact of manganese oxide and silica on the reduction yield of iron oxide which was reduced with H2 at 900-
1100°C. A regression model was built on the experimental reduction results of pure iron oxide and iron oxide doped
with either MnO2 (mass content of 6%) and/or SiO2 (mass content of 7.5%) at 900°C and 1100°C. The developed
mathematical model was used to predict the reduction yield as a function of four parameters including MnO2 (mass
content of 0-6%), SiO2 (mass content of 0-7.5%), reduction time (1 .0-10 min) and temperature (900-1100°C). In
addition, the effect of the interaction combination of different parameters (MnO2, SiO2, time, and temperature) on
the reduction yield was estimated. The results showed that the reduction time has the highest positive effect on the
reduction yield of iron oxide sinter followed by the applied temperature and then SiO2 addition. On the other hand,
MnO2 exhibited the highest negative effect on the reduction yield of iron oxide followed by the combination effect
of SiO2 with time and temperature. The interaction combination effect of MnO2 with temperature or MnO2-SiO2
with time and temperature on the reduction yield was very small. The regression model was applied to theoretically
estimate the reduction yield of pure and doped iron oxide at 900-1100°C. The obtained values of the derived model
are in a good agreement with the experimental results under different conditions.
1. Introduction
The depletion of high-grade iron ore reserves allover
the world has enforced the iron and steel workers to
utilize the intermediate- and low-grade iron ore in order
to meet the growing demand on the international iron
ore market [1 ] . The Egyptian iron ores are often
contaminated with various impurities which affect
negatively the production yield and energy
consumption in the blast furnace [2,3] . The influence of
manganese oxide and silica on the reduction behaviour
of iron oxide compacts with either CO or H2 was
intensively studied [3-6] . A catastrophic swelling (up to
405%) was accompanied the reduction of MnO2-doped
iron oxide compacts with CO due to the formation of
metallic iron whiskers and plates while the presence of
SiO2 hindered such phenomenon through increasing the
compact strength [3] . In addition, both of SiO2 and
MnO2 exhibited unsteady influence on the reduction
rate and mechanism of iron oxide due to the formation
of hard reducible phases such as manganese ferrite
(MnFe2O4), iron manganese oxide (FeMnO), fayalite
(FeSiO4) and fayalite manganoan ((Fe,Mn)2SiO4). The
reduction behaviour of high manganese iron ore (mass
content of 9.9% MnO2) by H2 at 800-1000°C was
investigated [7] . The reduction rate was increased with
temperature and decreased as the time proceeded. The
investigation carried out on the effect of barite (BaSiO4)
on the mineralogical composition of iron ore sinter
indicated that the optimum BaO content in the ore
blend is 2.5% mass content which is able to form
eutectic and needle structures of barium ferrite solid
solution [8] . The effect of Al2O3 on the reduction of
iron ore sinter was studied [9] . The rate of reduction
was increased with Al2O3 content up to 2.5% mass
content which was attributed to the formation of high
reducible silico-ferrite of calcium and aluminium phase
in the applied sinter. The effect of CaO/SiO2 on the
reduction rate of wüstite sinter reducibility using low
and high potential reducing gas is examined [10] . The
highest reduction rate was exhibited by basic sinter
(CaO/SiO2 = 2.0) which was attributed to the formation
of high reducible calcium ferrite while acidic sinter
(CaO/SiO2 = 0.5) was exhibited the lowest reducibility
due to the formation of fayalite and ferrobustamite. The
effect of SiO2 and/or Al2O3 on the reduction of wüstite
was studied [11 ] . The Al2O3 was found to decrease the
reduction rate in the all range of applied temperature;
670-930°C. On the other hand the simultaneous
dissolution of SiO2 and Al2O3 in FeO was accelerated
the reduction process of FeO.
The previous survey summarized some studies which
were experimentally carried out to estimate the effect of
some impurities on the reduction rate of iron oxides
however the effective magnitude of these impurities
individually or collectively on the reduction yield is still
not clear. It was demonstrated that the factorial design
approach has several advantages in the prediction of
process yield, process performance and estimation of
key parameters that controlling the overall process [12-
14] . In the current study, a 24 factorial design is used to
precisely estimate the individual and collective impacts
of MnO2, SiO2, temperature and time on the reduction
yield of iron oxide. The factorial design is built up on
synthetic iron oxide sinter doped with MnO2 (mass
content of 6%) and SiO2 (mass content of 7.5%) which
was reduced with H2 gas at 900°C and 1100°C at 1 .0
and 10 min [4] . The derived model is verified with
different percentage of MnO2 (mass content of 2, 4 and
6%) and / or SiO2 (mass content of 2.5, 5.0 and 7.5%)
at 900°C, 1000°C and 1100°C in the range of 1 .0-10
min. The doping amounts of either MnO2 or SiO2 were
selected to simulate the average content of these
impurities in the Egyptian iron ores.
2. Experimental Procedure
A 24 factorial design is derived based on the
experimental data of pure Fe2O3, MnO2 (mass content
of 6%)-doped Fe2O3, SiO2 (mass content of 7.5%)-
doped Fe2O3 and [MnO2 (mass content of
6%)+SiO2(mass content of 7.5%)]-doped Fe2O3

white paper
steel-grips.com 201412
compacts that were reduced with H2 gas at 900°C and
1100°C [4] . Chemically high grades (mass content of
around 99.5%) Fe2O3, MnO2 and SiO2 powders (< 50
µm) were used to prepare a synthetic sinter in order to
eliminate the influence of the other impurities that are
usually associated with iron ores. The powders were
mixed well in a ball mill for 8.0 hours to guarantee the
full homogeneity of the mixtures. Pure Fe2O3 and Fe2O3
doped with either MnO2 and/or SiO2 moistened with
naphtha (mass content of around 6%) were pressed in a
cylindrical mould at 10 kN. The dry compacts (9.0 mm
diameter, 1 4 mm height) were gradually heated in a
muffle furnace (10 K/min) up to 1200°C and kept at
this temperature for 6.0 hours. After firing, the
compacts were gradually cooled down to room
temperature in the furnace to avoid the thermal shock
and kept dry in a desiccator. Pure and doped compacts
were isothermally reduced with pure H2 gas (1 .0 L/min)
at 900-1100°C. The reduction process was took place in
vertical tube furnace and the oxygen weight loss from
the reduction process was continuously recorded as a
function of time. The reduction system was described
elsewhere [10] .The reduction yield of pure Fe2O3 and
doped iron oxide compacts after 1 .0 and 10 min at
900°C and 1100°C is given in Table 1 . Each trail was
repeated two times under the same conditions in order
to confirm the results reproducibility. A 24 factorial
design is used to estimate the individual and
combination effect of MnO2, SiO2 additions, time and
temperature on reduction yield. Mathematical analysis
clarifies the effect of MnO2, SiO2, time and
temperatures and their interactions on the reduction
yield were deduced. The formulated regression model is
applied on iron oxide compacts that doped with MnO2
(mass content of 2, 4 and 6%), SiO2 (mass content of
2.5, 5 and 7.5%) and MnO2 (mass content of 2 and 4%)
with SiO2 (mass content of 7.5%) to precisely estimate
the reduction yield.
3. Results and Discussion
3.1. Definition of the controlling parameters
The controlling parameters which are considered in the
current applied 24 factorial design are including the
effect of MnO2, SiO2, reduction time and applied
temperature. By convention, the effect of each factor
was donated by a Latin letter. Thus “A” refers to the
effect of MnO2; “B” refers to the effect of SiO2; “C”
refers to the effect of time; “D” refers to the effect of
applied temperature; “AB” refers to the interaction
effect of MnO2 with SiO2; “AC” and “BC” refer to the
interaction effect of MnO2 and SiO2 with reduction time
respectively; “AD” and “BD” refer to the interaction
effect of MnO2 and SiO2 with temperature respectively;
“CD” refers to the interaction effect of time with
temperature; “ABC” refers to the interaction effect of
MnO2, SiO2 with time; “ABD” refers to the interaction
effect of MnO2, SiO2 with temperature; “ACD” refers
to the interaction effect of MnO2, time with
temperature; “BCD” refers to the interaction effect of
SiO2, time, with temperature; “ABCD” refers to the
interaction effect of the all parameters including MnO2,
SiO2, time with temperature. The low and high levels of
A, B, C and D are denoted by “– “and “+” respectively.
The sixteen treatment combinations in the design are
usually represented by lowercase letters. The high level
of any factor in the treatment combination is denoted by
the corresponding lowercase letter (a, b, c, and d) and
the low level of each factor in the treatment
combination is denoted by the absence of the
corresponding letter. Thus, “a” represents the treatment
combination of A at high level with B, C and D at low
levels, “b” represents B at high level with A, C and D at
low levels, “ab” represents A and B factors at the high
levels with C and D at low level, “abc” represents A, B
and C factors at the high levels with D at low level,
“abcd” represents A, B, C, and D at high levels, finally
(1 ) is used to
denote all factors
at low level.
The average
effect of each
factor can be
defined as the
change in
response
produced by a
change in the
level of that
factor averaged
over the levels of
the other factors.
The symbols (1 ),
a, b, ab, c, ac, bc,
abc, d, ad, bd,
abd, cd, acd, bcd,
and abcd
represent the
total of all 2
replicates (n=2)Table 1 : Conditions of experiments and reduction yield of iron oxide

white paper
steel-grips.com 2014 13
taken at the treatment combination.
3.2 Development of mathematical
formulations
Mathematical formulations are used to estimate the
effect of different
parameters on the
reduction yield. The effect
of A at low levels of B, C
and D is [a-(1 )]/n, the
effect ofA at high levels of
B, C and D is [abcd-
bcd]/n, the effect of A at
low level of B and high
levels of C and D is [acd-
cd]/n, the effect of A at
low level of C and high
levels of B and D is [abd-
bd]/n, the effect of A at
high level of C and low
levels of B and D is [ac-
c]/n, the effect of A at low
level of D and high levels
of B and C is [abc-bc]/n,
the effect of A at high level
of B and low levels of C and D is [ab-b]/n, and the
effect ofA at high level of D and low levels of B and C
is [ad-d]/n. The main effect of A is the average
quantities of its effect at low and high levels of B and
C. In similar way, the average main effect of one, two,
three or the four factors and their interactions can be
calculated (dividing its contrast by 16 i.e. number of
experiments) according to factorial design of 24. The
effect of all parameters on the reduction yield and its
interaction are given in Eqs. 1 - 1 5 (see appendix 1 ).
3.3 Application and validation of regression
model
The plus and minus signs which can be developed from
the contrasts of the effective factors are given in Table
2. The high level is referred by (+) sign and low level is
referred by (-) sign.
Sum of squares for the effects in the 24 design with n
replicates is SS=(Contrast)2/16n. The total sum of
squares (SST) has (abcdn-1 ) degrees of freedom and the
error sum of squares (SSE) has abcd(n-1 ) degrees of
freedom. Table 3 summarizes the main effects of
variables, sum of squares and the mean square.
Based on this data, the magnitude and direction of the
factors can be examined to determine which variable is
relatively more effective compared to the others. The
reaction time (C) exhibited the highest positive effect
on the reduction yield followed by the applied
temperature (D) followed by the interaction effect of
time with temperature (CD) and finally the effect of
SiO2 (B). On the other hand, the highest negative effect
on the reduction yield was revealed by MnO2 (A)
followed by the interaction effect of SiO2-time-
temperature (BCD), MnO2-time (AC) and then SiO2-
tempearture (BD). The remaining interaction
parameters have a slightly negative effect on the
reduction yield of iron oxide sinter. Based on the
previous values, the parameters with relatively high and
positive magnitude
will enhance the
reduction process
of iron oxide at the
applied time
interval while the
parameters with
negative
magnitude will
retard the reduction
process and
consequently affect
negatively the
reduction yield.
The contrast
coefficients which
are used in the
calculations are
summerized inTable 2: Algebraic signs represent the contrast constants for the 24 factorial design
Table 3: Analysis of variances
white paper
steel-grips.com 201414
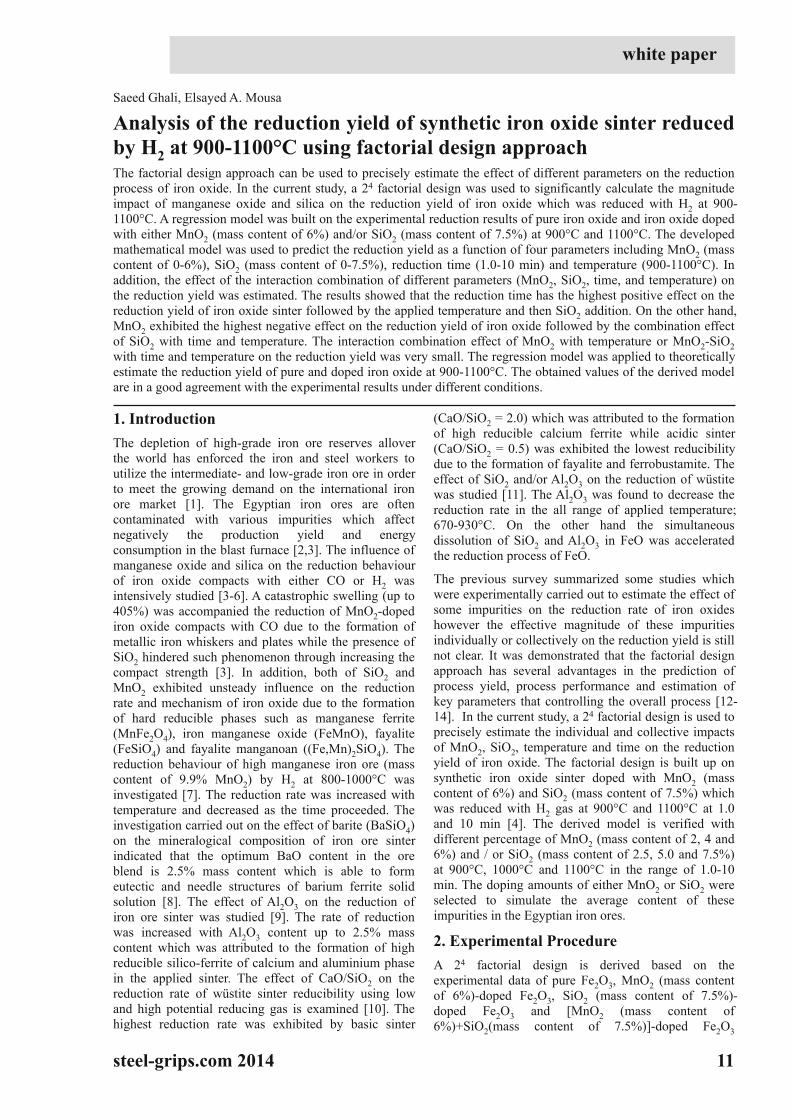
Table 4. The contrast coefficient is always either (+1 ) or
(-1 ) referring to the maximum and minimum level for
the affecting factor.
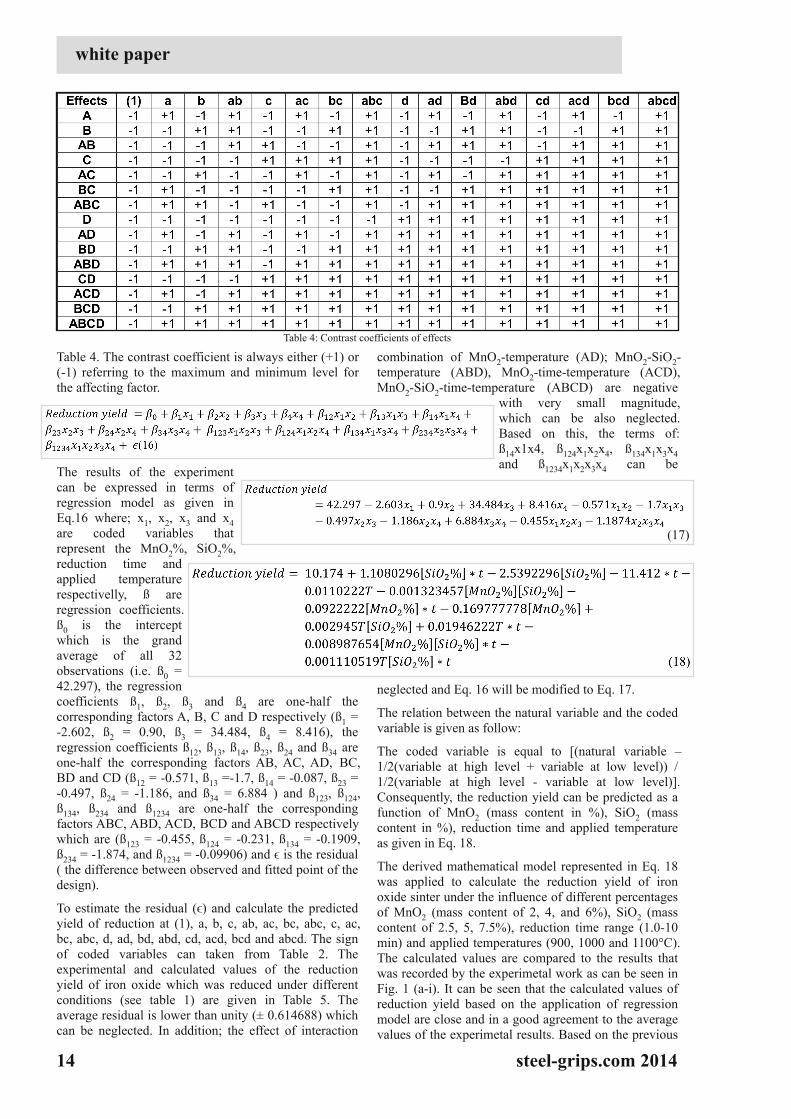
The results of the experiment
can be expressed in terms of
regression model as given in
Eq.16 where; x1 , x2, x3 and x4
are coded variables that
represent the MnO2%, SiO2%,
reduction time and
applied temperature
respectivelly, ß are
regression coefficients.
ß0 is the intercept
which is the grand
average of all 32
observations (i.e. ß0 =
42.297), the regression
coefficients ß1 , ß2, ß3 and ß4 are one-half the
corresponding factors A, B, C and D respectively (ß1 =
-2.602, ß2 = 0.90, ß3 = 34.484, ß4 = 8.416), the
regression coefficients ß12, ß13, ß14, ß23, ß24 and ß34 are
one-half the corresponding factors AB, AC, AD, BC,
BD and CD (ß12 = -0.571 , ß13 =-1 .7, ß14 = -0.087, ß23 =
-0.497, ß24 = -1 .1 86, and ß34 = 6.884 ) and ß123, ß124,
ß134, ß234 and ß1234 are one-half the corresponding
factors ABC, ABD, ACD, BCD and ABCD respectively
which are (ß123 = -0.455, ß124 = -0.231 , ß134 = -0.1 909,
ß234 = -1 .874, and ß1234 = -0.09906) and ϵ is the residual
( the difference between observed and fitted point of the
design).
To estimate the residual (ϵ) and calculate the predicted
yield of reduction at (1 ), a, b, c, ab, ac, bc, abc, c, ac,
bc, abc, d, ad, bd, abd, cd, acd, bcd and abcd. The sign
of coded variables can taken from Table 2. The
experimental and calculated values of the reduction
yield of iron oxide which was reduced under different
conditions (see table 1 ) are given in Table 5. The
average residual is lower than unity (± 0.614688) which
can be neglected. In addition; the effect of interaction
combination of MnO2-temperature (AD); MnO2-SiO2-
temperature (ABD), MnO2-time-temperature (ACD),
MnO2-SiO2-time-temperature (ABCD) are negative
with very small magnitude,
which can be also neglected.
Based on this, the terms of:
ß14x1x4, ß124x1x2x4, ß134x1x3x4
and ß1234x1x2x3x4 can be
neglected and Eq. 16 will be modified to Eq. 17.
The relation between the natural variable and the coded
variable is given as follow:
The coded variable is equal to [(natural variable –
1 /2(variable at high level + variable at low level)) /
1 /2(variable at high level - variable at low level)] .
Consequently, the reduction yield can be predicted as a
function of MnO2 (mass content in %), SiO2 (mass
content in %), reduction time and applied temperature
as given in Eq. 1 8.
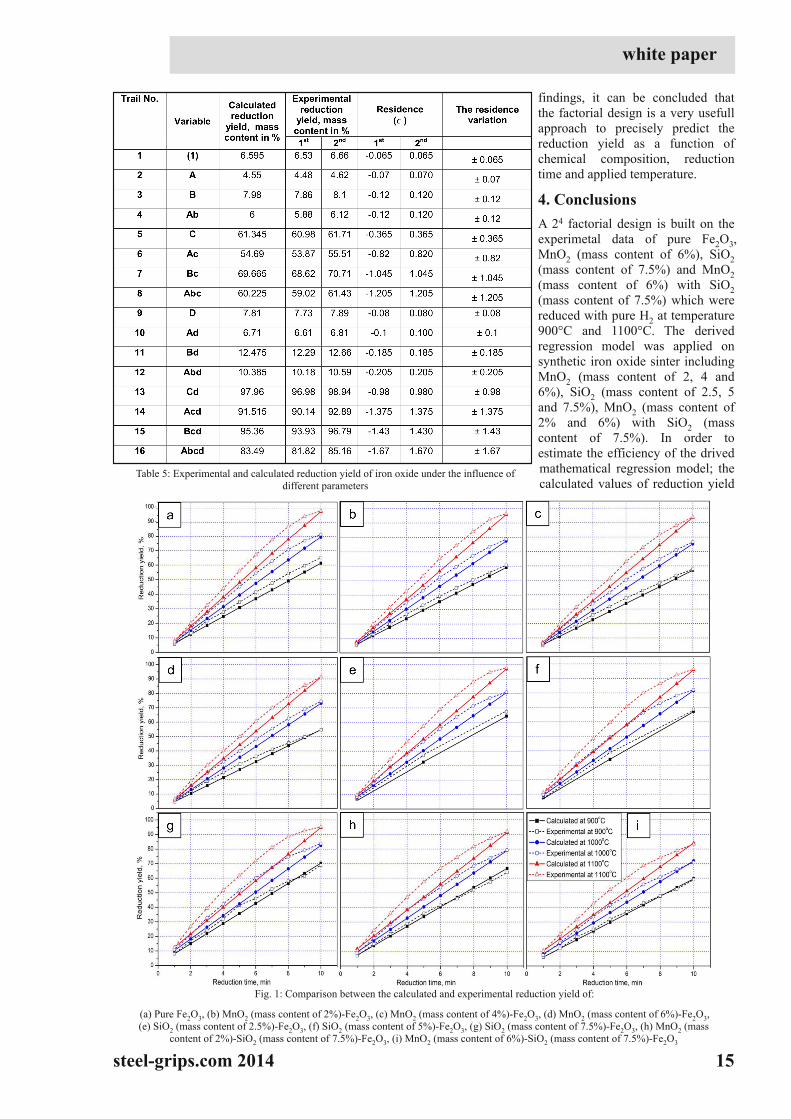
The derived mathematical model represented in Eq. 1 8
was applied to calculate the reduction yield of iron
oxide sinter under the influence of different percentages
of MnO2 (mass content of 2, 4, and 6%), SiO2 (mass
content of 2.5, 5, 7.5%), reduction time range (1 .0-10
min) and applied temperatures (900, 1000 and 1100°C).
The calculated values are compared to the results that
was recorded by the experimetal work as can be seen in
Fig. 1 (a-i). It can be seen that the calculated values of
reduction yield based on the application of regression
model are close and in a good agreement to the average
values of the experimetal results. Based on the previous
Table 4: Contrast coefficients of effects
(1 7)
white paper
steel-grips.com 2014 15
findings, it can be concluded that
the factorial design is a very usefull
approach to precisely predict the
reduction yield as a function of
chemical composition, reduction
time and applied temperature.
4. Conclusions
A 24 factorial design is built on the
experimetal data of pure Fe2O3,
MnO2 (mass content of 6%), SiO2
(mass content of 7.5%) and MnO2
(mass content of 6%) with SiO2
(mass content of 7.5%) which were
reduced with pure H2 at temperature
900°C and 1100°C. The derived
regression model was applied on
synthetic iron oxide sinter including
MnO2 (mass content of 2, 4 and
6%), SiO2 (mass content of 2.5, 5
and 7.5%), MnO2 (mass content of
2% and 6%) with SiO2 (mass
content of 7.5%). In order to
estimate the efficiency of the drived
mathematical regression model; the
calculated values of reduction yieldTable 5: Experimental and calculated reduction yield of iron oxide under the influence of
different parameters
Fig. 1 : Comparison between the calculated and experimental reduction yield of:
(a) Pure Fe2O3, (b) MnO2 (mass content of 2%)-Fe2O3, (c) MnO2 (mass content of 4%)-Fe2O3, (d) MnO2 (mass content of 6%)-Fe2O3,
(e) SiO2 (mass content of 2.5%)-Fe2O3, (f) SiO2 (mass content of 5%)-Fe2O3, (g) SiO2 (mass content of 7.5%)-Fe2O3, (h) MnO2 (mass
content of 2%)-SiO2 (mass content of 7.5%)-Fe2O3, (i) MnO2 (mass content of 6%)-SiO2 (mass content of 7.5%)-Fe2O3

white paper
steel-grips.com 201416
are compared to that obtained experimetally under
different conditions.The reduction yield can be
calculated based on the regression Eq. 19.
The formulated factorial design demonstrated very
successfully the effect of individual and combined
parameters on the reduction yield of iron oxide sinter.
The reduction time showed the highest positive effect
on the reduction yield followed by the applied
temperature then the interaction effect of time with
temperature and finally the effect of SiO2 addition. On
the other hand, MnO2 exhibited the highest negative
effect on the reduction yield followed by the interaction
effect of SiO2 with time and temperature. The
interaction effect of MnO2 with time or SiO2 with
temperature was resulted in a relatively small negative
effect on the reduction yield while the remaining
interaction parameters revealed very small negative
effect on the reduction yield and it can be neglected.
The predicted reduction yield using the developed
regression model is found to be in a good agreement
with the experimental data under different conditions
which reflected the efficiency of the factorial design in
the deduction of the influence of various variables on
the reduction process of iron oxides.
5. References
[1 ] Ma, M.: International Journal ofMining Engineering and Material
Processing, 1 (2010) No. 2, pp. 56/61 .
[2] Baioumy, H.M.; Khedr, M.Z.; Ahmed,A.H.: Ore Geology
Reviews, 53 (2013) No. 12, p.63/76.
[3] El-Geassy, A.A.; Nasr, M.I.; Mousa, E.A.: Steel Research Int. , 81
(2010) No. 3, p. 1 78/1 85.
[4] El-Geassy, A.A.; et.al. : ISIJ International, 48 (2008) No. 10,
p.1 359/1 367.
[5] El-Geassy, A.A.; et.al. : ISIJ International, 47(2007) No. 3, p.
377/385.
[6] El-Geassy, A.A.; et.al. : Ironmaking and Steelmaking, 35 (2008)
No. 7, p.531 /538.
[7] Ahmed, A.M.; El-Geassy, A.A.; Mishreky, M.L.: Ironmaking and
Steelmaking, forthcoming.DOI:
http://dx.doi.org/10.1179/1743281214Y.0000000207
[8] Hessien, M. M. et al. :
Ironmaking and
Steelmaking, 35 (2008),
No. 3, p. 1 69/178.
[9] Hessien, M. M. et al. :
Ironmaking and
Steelmaking, 35 (2008)
No. 3, p. 1 91 /204.
[1 0] Mousa, E.A.:
Ironmaking and
Steelmaking, 41 (2014)
No. 6, p. 418/429.
[11 ] Shigematsu, N.; Iwai, H.: Transactions ISIJ, 28 (1988), p.
206/21 3.
[1 2] Gao, Y.; et al. : ISIJ International, 52 (2012) No. 5, p. 759/763.
[1 3] Mesquita,T.J.; Nogueira, R.P.; Bastos, I.N.: Latin America
Applied Research, 41 (2011 ), p. 311 /31 5.
[1 4] Robinson, R.: Studies in low temperature self-reduction of by-
products from integrated iron and steelmaking, PhD thesis, Luleå
University ofTechnology, 2008. ISSN: 1402-1 544.
Author` s note
(1 9)
Assoc. Prof. Saeed Ghali
Steel Technology Department
Central Metallurgical Research and Development
Institute (CMRDI)
Cairo, Egypt
E-Mail: [email protected]
Dr.-Ing. Elsayed Mousa
Pyrometallurgy Department
Central Metallurgical Research and Development
Institute (CMRDI)
Cairo, Egypt
* Corresponding author; E-Mail: [email protected]

white paper
steel-grips.com 2014 17
Appendix 1