Christian Churches and Nigeria's Political Economy of Oil and ...
Upload
khangminh22Category
view
4download
0
Analysis of the Impact of Central Bank of
Nigeria's Agricultural Intervention Funds on the
Economy *
Adamgbe, E. T., Belonwu M. C., Ochu, E. R. and Okafor I. I.
AbstractThis paper set out to investigate the impact of Central Bank of Nigeria's interventions on the agricultural sector within an economy-wide framework of general equilibrium modelling. The paper adopted a dynamic (recursive), two-sector general equilibrium model of the Nigerian economy with some modications on the standard model developed by the Centre for Econometric and Applied Research (CEAR) and incorporated the contributions of the CBN's agricultural based interventions as increases in the stock of agricultural capital so as to have a more robust size of interventions into the agricultural sector. The SAM used for the CGE model analysis was derived from the updated Input and Output Table for 2011. Results indicated that interventions contributed positively (although marginally) to GDP during the periods of intervention; contributed to a marginal decline in government subsidy expenditures and improvement in government revenues; led to an increase in exports of agricultural commodities and marginal reduction in the volume of imports of intermediate goods used in the agricultural value chain; prices of agricultural commodity exports increased marginally in the fth period as a result of the interventions; interventions impacted positively on the incomes and utility of rich farm owners. However, poor farmers were worse off with interventions, as their income and utility increased steadily at a faster pace without intervention than it did with interventions. It is recommended that targeted extensive support must be provided to poor farmers to improve their competitiveness and ensure they are not crowded out by the rich farm holders and access to markets for fair and competitive prices needs to be encouraged.
Keywords: Impact, Evaluation. Computable General Equilibrium, Interventions, SAM,
Agriculture
JEL Classication: D1, D5, D57, C68
I.� Introduction
ustained public sector interventions in agriculture are critical to the growth
Sand transformation of the sector in Nigeria. This is due to the low level of
investment in the sector compared to its huge potentials to create
employment, generate wealth and reduce poverty (Olomola et al., 2014). The
agricultural sector in Nigeria is endowed with fertile soil, complimented by
streams, lakes, forests, lush grassland, as well as huge demand driven by a large
active population, estimated at 182 million as at 2016 (representing 2.35 per cent
of global population). The abundant resources, if properly harnessed can
Central Bank of Nigeria Economic and Financial Review Volume 58/1 March 2020 57
*The authors are staff of the Research Department, Central Bank of Nigeria. The usual disclaimer
applies.

support self-sufciency in food, supply of raw materials to the industrial sector
and provide gainful employment to the teeming population, of which about 50
per cent of them are employed in the sector (World Bank, 2017).
To ensure improved investments and output within the sector, various
governments embarked on different growth enhancement programmes. The
focus of these programmes comprised providing improved access to nance
and other farming inputs such as fertilisers and seedlings to agriculturalists, price
support mechanisms through implementation of protectionist policies on tariffs
and taxes, among others. These interventions were done at all levels by
government agencies and international development partners. An agency of
the government, the Central Bank of Nigeria (CBN), has been actively involved
in intervening within the agricultural sector with the aim of improving access to
nance (mostly at single digit rates) to agriculturalists. The impact of these
interventions within the agricultural sector by the Bank has not been captured
within an economy-wide framework of general equilibrium modelling in the
past, hence obscuring the impact of its sectoral contribution to growth in the
economy.
The aim of this paper is to provide an insight into the estimated impact of various
agricultural interventions by the CBN on the economy. To this end, we adopt a
dynamic (recursive), two-sector general equilibrium model of the Nigerian
economy and incorporate the contributions of the CBN's agricultural based
interventions as increases in the stock of agricultural capital so as to have a more
robust size of interventions into the agricultural sector. Following the introductory
section, section 2 presents an overview of Nigeria's agricultural sector, while
section 3 presents the nature of government interventions in agriculture. Section th4 reviews the empirical literature while the 5 section presents the methodology
adopted in the paper. Intervention scenarios and simulation results are
presented in sections 6 and 7, respectively while recommendations and thconclusions of the paper are presented in the 8 and nal sections, respectively.
II.� Overview of Nigeria's Agricultural Sector
Agricultural activities are dominated by peasant small holder farmers who
constitute about 90 per cent of farm holding in the country. These farmers
practice mostly traditional methods and produce mostly for subsistence
purposes. Interventions by government have been inuenced by the need to
provide access to inputs and other support to peasant farmers so as to boost
their productivity and enable them transit to mechanised agricultural practices,
while commercial farm holders were supported through the provision of credit
facilities, input subsidies, capacity building initiatives and export incentives.
58 Central Bank of Nigeria Economic and Financial Review March 2020

Although its rate of growth has declined consistently over time, agriculture has
remained a growth driver in Nigeria. Between 2000 and 2005, the sector grew by
15.9 per cent (although this high gure could be attributed to the huge growth
recorded in 2002 (55.9 per cent ), without which it would have grown at 6.0 per
cent). Its growth however declined to 6.5 and 4.1 per cent within the period
2006-2010 and 2011 -2016 respectively. Similarly, the sector has remained
dominant in the economy of Nigeria due, partly, to its contribution in value
added to GDP and the share of the population employed within the sector
which is put at about 50 per cent of Nigerians. During the period 2000-2005, the
sector contributed 36.3 per cent of total value added to GDP. Its average
contribution however declined consistently over time to 31.7 per cent in the
period 2006-2010 and further down to 21.3 per cent during the period 2011-2016.
One of the objectives contained in most agricultural policies or programmes of
the government has been to improve self-sufciency of the nation, reduce share
of imported food and encourage the export of agricultural commodities. Table
1 below indicates that the period 2000-2016 witnessed a sustained improvement
in the share of agricultural raw material exports as a percentage of total
merchandise exports. Its share grew from a paltry 0.1 per cent during the period
2000-2005 to 1.0 and 4.3 per cent during the period 2006-2010 and 2011-2016
respectively. However, signicant gains that were achieved in reducing the
share of import of agricultural raw materials to total merchandise imports at the
beginning of the period under consideration was reversed towards the end of
the period. Its share in total merchandise imports reduced from 1.3 per cent
recorded in 2000-2005 to 0.9 per cent during the period 2006-2010. This later
jumped to 2.1 per cent during the period 2011-2016.
Table 1: Selected Agricultural Based Indicators (2000-2016)
S/No.
Agricultural Indicators
2000-2005
2006-2010
2011-2016
1 Agricultural GDP Growth (per cent)1
15.92
6.5
4.1
2 Agriculture, value added (per cent
of GDP)
36.3
31.7
21.3
3 Agricultural raw materials exports (per cent of
merchandise exports) 0.1 1.0 4.3
4 Agricultural raw materials imports (per cent of
merchandise imports) 1.3 0.9 2.1
5 Employment in agriculture (per cent of total
employment) 44.6 48.6 -
6 Cereal yield (kg per hectare) 1293.9 1513.0 1392.3
Source: World Bank Open Data
1GDP gures for constant basic prices was used and sourced from the CBN Statistical database.2The gure is high due to the inuence of an outlier of for 2002 which was included; without which the average growth would have been at 6.0 per cent.
Adamgbe et. al,: Analysis of the Impact of Central Bank of Nigeria's Agricultural Intervention Funds on the Economy 59
II.1� Nature of Government Intervention in Agriculture
Post-independence, with the discovery of crude oil and the boom that marked
that era, agriculture lost its position as the main export earner to crude oil. To
enhance the importance of the sector and ensure food security, several
agricultural policies were initiated to improve the performance of the sector.
Most of these initiatives are embedded in the various National Development
Plans (1960-1985), the Structural Adjustment Programme (1986-1988), National
Economic Empowerment and Development Strategy (2004-2007), Agricultural
Transformation Action Plan (ATAP) (2011-2015) as well as in various
transformation initiatives adopted by governments. These initiatives focused on
four broad areas within the agricultural value chain. These include to; improve
access to land, boost the production of selected crops, provide input support
mechanisms through import waivers and export incentives as contained in scal
policies of the government as well as the provision of credit to agriculturalists at
single digit rates.
In the area of improving access to land as a critical factor in agricultural
production, more notable efforts were made by some state governments to
encourage private sector participation in commercial agriculture in their states.
For instance, Kwara and Cross River states embarked on public-private sector
partnership programmes in the establishment of commercial farms. In Kwara
State, the initiative, which began in 2004, led to the arrival of Zimbabwean
farmers who went into the production of cereals, rice, cassava, vegetables,
dairy, poultry products, and tobacco. In order to support these farmers, the state
government provided facilities such as feeder roads, security, and
telecommunication equipment and irrigation facilities. The marketing strategy
put in place was for the farmers to sell to potential bulk buyers such as our and
feed mills, etc.
Similarly, the Cross River state government improved access to land for
commercial agricultural purposes with the leasing of 22 farms constituting about
71,809 hectares to private farmers and ensured timely delivery of legal title
documents to them. In addition, it provided enabling environment through
provision of seedlings, fertilisers, technical and nancial assistance to a number
of privately owned farm estates. Also, many hitherto moribund state-owned oil
palm, rubber and cocoa estates were revitalised, privatised and in most cases
leased in smaller blocs to private farmers.
To support the local production of selected staple and cash crops, recent
government administrations rolled out various presidential initiatives
60 Central Bank of Nigeria Economic and Financial Review March 2020

(Iwuchukwu & Igbokwe, 2012). In 2001, the Federal Government adopted
different strategies which involved massive production and supply of improved
seedlings, procurement and distribution of critical inputs, facilitation of scal
incentives required for protable production and effective coordination of
institutional support, as well as capacity building for farmers and processors.
Consequently, the Presidential Initiative on Increased Rice Production was
designed to reverse the rising rice import bill which stood at N96.012 billion in
2002, meet domestic demand by 2006 and produce for export by end of 2007.
By 2007, it was targeted that 3.0 million hectares of land would be put under
cultivation to produce 15 million tons of paddy or 9.0 million tons of milled rice. It
was planned that the importation of rice would be banned in January 2007 to
give stimulus for local production.
The initiative on cassava production and export was intended to raise the
production level of cassava to 150 million MT per annum by the end of year 2010.
The programme was also expected to realise an income of US$5.0 billion per
annum from the export of 37.6 million tons of cassava products, such as starch,
cassava chips, pharmaceuticals, adhesives and other value added products.
The Agricultural Transformation Agenda (ATA) of the Government set up the
Growth Enhancement Scheme to register small holder farmers and provide
targeted input subsidies such as access to fertilisers and seeds. Between 2011
and 2014 subsidies were provided to about 14 million farmers (Federal Ministry of
Agriculture and Rural Development, 2016).
Similarly, government sought to attain self-sufciency in vegetable oil
production over a period not exceeding 3 years through the implementation of
the Presidential Initiative on vegetable oil and tree crops development. Under
this programme, attention was focused on the promotion of eleven scheduled
oil seed crops, among which were: oil palm, groundnut, soya beans, Beni seed,
cotton, sunower, cashew, coconut and cocoa. Production target was set for
each crop under the programme, thus; oil palm: 1 million hectares capable of
producing 15 million fresh fruit bunches, groundnut: 15 million tons annually, soya
bean: 670,000 to 1 million tons annually and seed cotton: 1 million tons over the
plan period.
Fiscal incentives were also used to support agricultural output through various
import waivers, export incentives, tax holidays and exemptions in the sector. For
instance, from January 31, 2012, duty on agricultural machinery and equipment
was waived. Export incentives were administered by the Nigerian Export and
Import Bank (NEXIM)'s Export Credit Insurance Facility, which was designed to
Adamgbe et. al,: Analysis of the Impact of Central Bank of Nigeria's Agricultural Intervention Funds on the Economy 61

protect exporters in Nigeria against the risks of non-payment for goods and
services exported on credit terms and the Nigerian Export Promotion Council
(NEPC) who initiated the Export Expansion Grant Scheme for the stimulation of
export oriented activities that leads to signicant growth of the non-oil export
sector, especially agriculture.
Tax incentives were also given to boost agricultural production comprising: a
ve–year tax holiday for agricultural products' processing companies granted
pioneer status; tax exemptions on Interests earned by nancial Institutions on
loans granted for agricultural trade or businesses; enhanced capital allowance
of up to 50 per cent for agro-allied plant and equipment and; exemptions from
Value Added Tax (VAT) on machinery and equipment purchased for
agricultural purposes.
Various agencies such as NEXIM, CBN, Bank of Industry (BoI), Bank of Agriculture
(BoA), etc. have been involved in providing credit to agriculturalists at single
digit rates. These interventions (especially those of the CBN) are done through
various programmes as summarised below:
· Interest Drawback (IDP). Under the IDP of the CBN, farmers could borrow
from lending banks at market–determined rates, while the programme
pays an interest rebate of 40.0 per cent to farmers who repay their loans
on schedule;
· Agricultural Credit Guarantee Scheme Fund (ACGSF). Administered by
the Central Bank of Nigeria, the fund was introduced in 1978 to assist
banks to support agricultural activities. It provides up to 75.0 per cent
guarantee for loans granted by the commercial banks for approved
agricultural activities. A total of 1,020,299 loans valued N98.860 billion
had been guaranteed from inception in 1978 to May, 2016;
· Commercial Agricultural Credit Scheme (CACS) was established in
March 2009 by the CBN in partnership with the Federal Ministry of
Agriculture and Rural Development (FMARD) to fast track the
development of commercial agriculture in the country. The applicable
interest rate under the fund was retained at 9.0 per cent. From inception
in 2009 to May 2016, the sum of N364.477 billion had been released to the
economy for 452 projects;
· Agricultural Credit Support Scheme (ACSS). The ACSS is granted at 14.0
per cent interest rate, while beneciaries who fully repay their loans on
schedule are entitled for a refund of 6.0 per cent of interest paid.
62 Central Bank of Nigeria Economic and Financial Review March 2020

· Anchor Borrowers' Programme: Under the programme, the CBN set aside
N40 billion, out of the N220 billion Micro, Small and Medium Enterprises
Development Fund (MSMEDF) to be given to farmers at single digit
interest rate of maximum 9 per cent per annum.
· The Nigerian Incentive-Based Risk Sharing system for Agricultural
Lending (NIRSAL). The programme was launched in 2011 and
incorporated in 2013 by the CBN as a dynamic, holistic USD500 Million
public-private initiative. Its aim is to dene, measure, price and share
agribusiness related credit risk. Its approach involves xing the
agricultural value chain, so that banks can lend to the sector with
condence; and encouraging banks to lend to the agricultural value
chain by offering strong incentives and technical assistance. It has ve
pillars which include:
o Risk-sharing Facility (USD300 Million). NIRSAL uses this facility to
address banks' perception of high-risks in the sector by sharing
losses on agricultural loans.
o Insurance Facility (USD30 Million). The facility's primary goal is to
expand insurance products for agricultural lending from the
current coverage to new products, such as weather index
insurance, new variants of pest and disease insurance etc.
o Technical Assistance Facility (USD60 Million). NIRSAL uses this
facility to equip banks to lend sustainably to agriculture,
producers to borrow and use loans more effectively and increase
output of better quality agricultural products.
o Holistic Bank Rating Mechanism (USD10 Million). This mechanism is
used by NIRSAL to rate banks based on two factors, the
effectiveness of their agricultural lending and the social impact.
o Bank Incentives Mechanism (USD100 Million). This mechanism
offers winning banks in Pillar four, additional incentives to build
their long-term capabilities to lend to agriculture. It will be in terms
of cash awards.
· Cassava Bread Development Fund. Established by the Government in
2008 to fund the cassava value chain (from processors to bakers),
including providing equipment to master bakers. N3.44 billion was
disbursed to farmers at 5 per cent interest per annum in the funding
structure of 50 per cent term loan and 50 per cent grant.
· National Programme for Food Security Fund. It was established in 2009 to
benet registered members of Apex Farmers' Associations (AFA),
Adamgbe et. al,: Analysis of the Impact of Central Bank of Nigeria's Agricultural Intervention Funds on the Economy 63

registered co-operative groups and SMEs, in the structure of 40 per cent
grant and the balance divided into 80 per cent loan and 20 per cent
equity contribution by the beneciaries.
III.� Review of Empirical Literature
Computable General Equilibrium (CGE) models have been used widely by
researchers in analysing impact of various policies. Borojo (2015) applied a
recursive dynamic computable general equilibrium model to examine the
economic impact of investment on infrastructure for electricity in Ethiopia using
an updated 2009/10 social accounting matrix. The ndings of the study showed
improvement of the real gross domestic product (GDP), output of industrial and
service sectors in all simulations. Nonetheless, mixed effects were found on
household consumption and trade balance. The highest growth of real GDP is
registered when the investment on electricity is fully nanced by domestic
household and enterprise saving.
Mband (2011) analysed the impact of public infrastructure investment in South
Africa using dynamic Computable General Equilibrium (CGE) analysis under
different nancing options to nance public infrastructure investment. The results
showed that nancing public infrastructure investment by direct taxation gives
better results in terms of impact on aggregate output production, private
investment, job creation, and household income. On the other hand, decit
nancing seems to result the worst impacts on the economy in terms of above
variables.
Dissou and Didic (2011) assessed the growth, sectoral and welfare implications
of increased spending on infrastructure in Benin, using a multi-sector inter
temporal general equilibrium model with public capital and heterogeneous
agents using domestic nancing through discretionary taxes and foreign
nancing through increased foreign aid. The results show that increased public
investment on infrastructure has positive impacts on private investment for all
agents in the long-run irrespective of nancing method.
Estache et al. (2008) constructed a standard CGE model to explore the impact
of scaling up infrastructure in six African countries. The study compared various
infrastructure investments funded with different scal tools. These investments
scenarios are compared to nonproductive investment that can be interpreted
as a business as usual scenario. Their results show that foreign aid does produce
Dutch disease effects, but the negative impacts are strongly dependent on the
type of investments performed. Moreover, growth effects contribute to
attenuate the negative effects.
64 Central Bank of Nigeria Economic and Financial Review March 2020

Aydin (2010) analysed the potential long term impacts of the hydro power
expanding shock on some macroeconomic variables of interest such as GDP,
real consumption, real investment, exports, imports, trade balance, and carbon
emissions using a dynamic multi sectoral general equilibrium model of the Turkish
economy. They analysed the impact of hydro power shock under policy
scenario doubling hydro power generation. The simulation results show that
doubling hydro power have slightly positive effects on macro indicators and
carbon emissions for Turkish economy.
Strzepek et al. (2006) analysed the economic impact of high Aswan dam in
Egypt. In their study, they used a CGE model of the Egyptian economy to
estimate the impact of the High Aswan Dam. The results of simulations show how
Egypt's economy would have performed in 1996/97 without the dam. The shock
is applied to agriculture, transport, tourism, and power generation. According to
their result, if the High Aswan Dam were not there, agriculture gains (especially
summer crops with high value) and the burden of the shocks falls on the non-
agriculture sectors, with declines in power, transportation, and tourism.
Galinis and Leeuwen (2000) used a CGE model to analyse the future of nuclear
energy in Lithuania using increases and keeping limited nuclear capacity. In the
rst case export sector, agriculture and bulk goods industry is stimulated. In the
second case economic growth is relatively low, especially in the trade
(commercial and public) sectors, services, and transport.
In Nigeria, Opeyemi et al. (2017), investigated the extent to which the removal of
fuel subsidy inuences the level of carbon emissions in Nigeria over a 5 year
period. The study adopted the recursive dynamic version of the partnership for
economic policy computable general equilibrium model based on the 2006
Nigerian social accounting matrix. Simulating a partial, gradual and complete
removal of import tariff on imported petrol indicated reduction of emissions only
when subsidy removal was partial. Findings from the results showed carbon
emissions marginally increasing under the gradual and one shot removal.
Odior (2011) investigated the dynamic (direct and indirect) effects of
government policy on education and its relation to the cyclical economic
growth in the long-run using an integrated sequential dynamic computable
general equilibrium (CGE) model of the Nigerian economy. The paper found
out that the re-allocation of government expenditure to education sector is
signicant in explaining economic growth in Nigeria.
This paper contributes to the body of existing literature through conducting a
Adamgbe et. al,: Analysis of the Impact of Central Bank of Nigeria's Agricultural Intervention Funds on the Economy 65
detailed assessment of the impact of CBN's agricultural based interventions on
the economy. It also uses a dynamic recursive CGE model and an updated
20111 SAM to analyse the impact of the interventions.
IV.� Methods
IV.1� Description of the Dynamic CGE Model
Computable General Equilibrium (CGE) models are models that adapt
Walrasian General Equilibrium concepts into economy-wide applications. They
provide a valuable framework for modelling the interaction between the agents
and their interdependences within the economy. This is done by making a vivid
representation of the behaviour of economic agents within the economy.
Market equilibrium and model assumptions (which lead to breakeven
conditions) must be established through the expression of market clearing
equations. These blocks of the CGE model are presented in this section.
With some modications, the dynamic CGE model described below adopts the
standard model developed by the Centre for Econometric and Allied Research
(CEAR), University of Ibadan. In addition to the standard blocks of CGE models,
recursive dynamic general equilibrium equations which incorporate annual
interventions in the agricultural sector by the CBN have been added. The
recursive dynamic behaviour of the model implies that its agents' behaviour is
based on adaptive projections rather than on the forward-looking projections
that underlie alternative inter-temporal optimisation models (Cabral, Cisse,
Diagne, & Siwa, 2017). Since a recursive model simulates one period at a time, it
is possible to separate the static (within-period) component from the dynamic
(between-period) component, where the latter dictates the model's dynamics.
IV.2� Description of the Static Model
This describes a one-period static CGE model which is presented according to
the standard block of Production Structure, Household behaviour, Government
behaviour and the Rest of the World. Equilibrium is maintained through a series of
system constraints which are discussed at the end of this section.
IV.2.1� Production Structure and Technology
In the model, we adopt two productive sectors or activities that combine
primary inputs with intermediate commodities to determine aggregate output
levels. Two inputs, labour and capital, are identied in the model. Economic
decisions of producers are guided by the motive for prot maximisation subject
to constant returns to sale. Choice of production factors are guided by a
66 Central Bank of Nigeria Economic and Financial Review March 2020

constant elasticity of substitution (CES) function. This allows for relatively easy
substitution of factors by producers so as to derive a nal value added. In the
different production activities, we assume that factors of production are
remunerated by the representative rm who also gives returns to the
government in the form of taxes and dividends to households.
The value added is formed by the combination of labour (L ) and capital (KD) i
based on the CES production function (equation 1) through which the demand
functions of labour and capital-land are derived.
Where: is the efciency coefcient and and (1- ) are the distribution
parameters of the production function. Parameter between the production
factors and L The production structure further incorporates the depreciation i
of capital, which is modeled as a xed proportion from the current level of the
capital stock in the dynamic analysis.
IV.2.2� Household Behaviour
The behaviour of households in the economy is simulated by introducing two
representative households – rich and poor. Households are assumed to
generate income from factor returns derived as an outcome of the production
process. Production inputs such as capital is assumed xed within a given time-
period and across sectors, while labor supply is assumed to be perfectly elastic
at a given real wage.
Households generate factor incomes proportional to the implied share of each
factor stock that they control. In addition to factor returns, households also
receive transfers in the form of returns from other households, government, other
institutions, and the external sector. Household disposable income is net of
personal income tax (based on xed rates), savings (based on xed marginal
propensities), and remittances. Stone-Geary Linear Expenditure System (LES)
(Equation 2) which explains consumer preferences subject to budget constraint
is used to explain this behaviour.
Where: U is the consumer's utility, C is the amount of consumption of the j-th j
commodity, represents the subsistence level of consumption of each u-th
commodity and is a preferential parameter of the respective j-th
commodity in the consumer basket.
In line with survey ndings from the NBS, households are classied according to
Adamgbe et. al,: Analysis of the Impact of Central Bank of Nigeria's Agricultural Intervention Funds on the Economy 67

income levels (rich and poor) across both sectors in the analysis. While rich
households earn 90 per cent of income from capital in agriculture, they earn
only 10 per cent of labour income from agricultural sector and vice versa.
IV.2.3� Government Behaviour
The government performs the function of collecting taxes, paying subsidies (if
necessary) and purchasing goods and services in the model. It maximises the
utility modeled by the Cobb-Douglas utility function subject to budget
constraint and dependent on volume of tax receipts:
Where: CG is the government consumption of a commodity j and represents j
the preferential incomes in the government consumption basket.
The closure of the government account is achieved by xing a ratio of the
governmental consumption to GDP. Government savings are thus adjusted to
the difference between the government incomes and expenditures.
IV.2.4� Foreign Sector (Rest of the World)
The model adopts the Armingtonian composite goods system function in which
locally produced goods and imported ones are regarded as imperfect
substitutes in aggregate demand, given an elasticity of substitution. The nal
ratio of imports to domestic goods is determined by the cost of minimising
decision-making of domestic consumers based on the relative prices of imports
and domestic goods (both of which include relevant taxes). Foreign prices are
regarded as given due to the small open nature of the economy.
The functional form of the Armington CES function is provided in equation 4.
Where: X is the amount of the total supply of the j-th commodity in the domestic j
thmarket, M is the amount of imports of j commodity from the Rest of the World, j
XDD is the amount of domestic production of j-th commodity supplied to domestic j
market. Analogically to the CES function, and are the parameters of
the CES function.
Substitutions between domestic and foreign market production are also
possible. The producer's decision is guided by a constant elasticity of
transformation (CET) function, which distinguishes between exported and
domestic goods, thereby taking note of any differences in time or quality
68 Central Bank of Nigeria Economic and Financial Review March 2020

between the two products. The motive for prot maximisation drives producers
to sell in those markets where net returns are highest based on relative
differences between domestic and export prices.
IV.2.5� Macroeconomic Closures and Equilibrium in the Model
In line with earlier works by (Annabi, Cockborn, & Decaluwe, 2004) and more
recently, (Cabral, Cisse, Diagne, & Siwa, 2017), equilibrium within the model is
achieved by the equality between supply and demand of goods and factors
and the investment-savings identity within each period. In the goods market,
equilibrium requires that demand for commodities equals supply. Aggregate
demand for each commodity comprises consumption expenditures by
household and government, transaction demand, investment spending, and
export. Supply comprises both goods produced locally and commodity imports.
Equilibrium is attained through the endogenous interaction of domestic and
foreign prices, and the effect that shifts in relative prices have on sectoral
production and employment, and hence institutional income and demand.
To balance factor demand and supply, it is assumed that capital is sector-
specic and fully utilised while there is competition in the labor market thereby
making the supply of labour to be responsive to changes in actual wages, so as
to adjust to ensure the same level of equilibrium for demand and supply. To
ensure equilibrium in macro accounts, 'macro closure' rules are specied for the
current account, the government balance, and the savings and investments
account. These rules provide a mechanism through which adjustment is
assumed to take place.
Various macro variables were assumed xed in the model. The world prices of
exports, intermediate and nal imports; value of labour and capital
endowments and stock of capital in the agricultural sector were xed to initial
levels in the static model. However, the value of capital, labour and foreign
savings are assumed to grow at same rate as population growth in the dynamic
models.
The model adopts a neoclassical savings-driven closure, in which the domestic
investments are passively driven by aggregate savings to ensure equilibrium
between savings and investment spending. However, the inclusion of dynamics
into the model allows past investments to inuence economic growth, and
thereby the level of savings available for investments in the current period.
Finally, the price index is chosen as the numeraire. The model is also
homogenous of degree zero in prices, implying that doubling all prices does not
Adamgbe et. al,: Analysis of the Impact of Central Bank of Nigeria's Agricultural Intervention Funds on the Economy 69

alter the actual allocation of resources.
IV.3� Incorporating CBN Interventions into the CGE Model
As stated earlier, interventions by the CBN in the agricultural sector are
principally the Agricultural Credit Guarantee Scheme (ACGS) and the
Commercial Agricultural Credit Scheme (CACS). Modelling the impact of the
interventions into the agricultural sector is based on the assumption that such
interventions impact the production decisions of agriculturalists leading to
increased output/ yield. Given that the interventions by the Bank are provided
to both small and large scale agriculturalists, it is plausible to assume that those
interventions act as increases in the stock of agricultural capital and thus have
direct effects on the production decisions of the farmers.
Due to the fact that interventions are given to going concerns, modelling their
impact is seen as additions to existing stock of capital in the agricultural sector.
This is introduced in the model through incorporating the share of additional CBN
interventions to the total sock of agricultural sector capital in the recursive
dynamic CGE equations on an annual basis as displayed in equation 5:
Where: AC is total stock of agricultural sector capital while nc is the share of CBN
interventions to total stock of agricultural capital.
3IV.4� Description of the SAM
The SAM used for the CGE model analysis was derived from the updated Input
and Output Table for 2011 whose data was generated principally from the
National Bureau of Statistics (NBS), the Central Bank of Nigeria (CBN), the Federal
Ministry of Agriculture and rural Development (FMARD) and national household
surveys; and was balanced using the cross entropy estimation method.
While the updated 2011 Input-Output (I-O) table comprehensively covered
selected sectors, the Social Accounting Matrix (SAM) is aggregated to be a 2-
sector square matrix comprising agricultural and non-agricultural sectors of the
economy. The agricultural sector aggregates 4 activity sectors of crop
production, livestock, forestry and shing; while the non-agricultural sector
aggregates 9 activity sectors including; mining and quarrying, manufacturing,
utilities, building and construction, transportation, communication, wholesale
and retail, nance and insurance, as well as, other services.
3Special appreciation goes to the painstaking efforts of Dr Aminu Alarudeen of CEAR, University of Ibadan, for his tutelage and support throughout the work.
70 Central Bank of Nigeria Economic and Financial Review March 2020

It provides an economy-wide data framework, which represents the
aggregated structure of the Nigerian economy; the links among production
activities, income distribution, consumption of goods/services, savings and
investment, and foreign trade of the economic agents in year 2011. It begins
with activities account, followed by commodities account and thereafter
accounts for the economic agents in the Nigerian economy.
Each cell in the matrix represents the ow of economic activities in monetary
terms from a column account (expenditure or outow) to a row account
(income or inow).
IV.5� Intervention Scenarios
In addition to ve intervention scenarios modelled in this paper, corresponding
baseline scenarios were simulated to forecast economic outcomes in the
absence of any intervention. Since all scenario results signicantly depend on
the baseline forecast, the results of the baseline forecast is important in
evaluating the long term welfare impact of the interventions.
In the baseline/ static scenario, growth of labour supply and foreign savings are
assumed to grow at 2.8 per cent being the assumed growth rate of population
per year.
The ve policy simulations are designed to reect additions to agricultural
capital stock net of depreciation. An analysis of Table 2 indicates that the share
of CBN interventions to total agricultural capital for the years under review are
innitesimal as they are less than 1 per cent of total agricultural capital stock. This
has implications for the anticipated impact of the magnitude of the
interventions on the economy.
A simple comparison of the growth trends between the baseline and policy
scenarios for each of the simulation periods is the policy impact of the
interventions on the economy.
Year
Total Agricultural Interventions (Nbn)*
Ratio of Agricultural Interventions to Total Agriculture Capital (Per cent )**
2011 73.88 0.20
2012 58.54 0.16
2013 27.33 0.07 2014 38.37 0.10 2015 67.50 0.18 2016 65.17 0.18
Table 2: Ratio of Agricultural Interventions by CBN to Total Agriculture Capital
Source: **Author's computations; *CBN
Adamgbe et. al,: Analysis of the Impact of Central Bank of Nigeria's Agricultural Intervention Funds on the Economy 71

V.� Simulation Results
This section presents the outcome of baseline and intervention simulations.
V.1 Impact of CBN Interventions on the Dynamics of Economic Growth
Results of both models presented in table 3 indicate that interventions
contributed positively (although marginally) to GDP during the years (periods) of
intervention. Similar to simulation results of the model without interventions, in
which contributions to growth in GDP were at rates above 0.8 per cent annually,
impact of interventions on growth became visible from the fourth period of
interventions.
V.2� Impact of CBN Interventions on Fiscal Variables
The impact of CBN's agricultural interventions on selected scal variables such
as expenditures on government subsidies and government revenue were
assessed. Results from both models presented in table 4 indicated that CBN's
interventions in the agricultural sector contributed to a marginal decline in
government subsidy expenditures and improvement in government revenues.
This is in line with a priori expectations since increase in the stock of agricultural
capital should lead to increases in productivity and sustainability of agricultural
operations thereby leading to reduced need for subsidies and increased scal
revenues through improved taxes.
VARIABLES BASE PERIOD
YEAR 2
YEAR 3
YEAR 4
YEAR 5
YEAR 6
Gross Domestic Product Without Interventions
36636.80087
0.82106 0.89627 0.97609 1.06061 0.68150
Gross Domestic Product with Interventions
- 0.82106 0.89627 0.97610 1.06063 0.73575
Table 3: Impact of CBN Interventions on the Dynamics of Economic Growth
(per cent growth rates)
Source: Author's computations
VARIABLES
BASE PERIOD
YEAR 2
YEAR 3
YEAR 4 YEAR 5
YEAR 6
Government Subsidy Expenditure Without Intervention
15.8596
0.54284
0.64511
0.75716 0.87909
4.18793
Government Subsidy Expenditure with Intervention
- 0.54278 0.64498 0.75703 0.87897 3.87206
Government Revenue WithoutIntervention
161.43849 0.48136 0.50220 0.52257 0.54241 -2.21156
Government Revenue withIntervention
- 0.48142 0.50225 0.52262 0.54250 -1.92265
Table 4: Impact of CBN Interventions on Fiscal Variables
(growth rates in per cent)
Source: Author's computations
72 Central Bank of Nigeria Economic and Financial Review March 2020

From Table 4, while the counterfactual periods without interventions indicated
that government subsidies increased consistently from 0.54284 per cent in
period 2 to 0.87904 per cent in period 5, interventions by the Bank in the
agricultural sector contributed to a marginal reduction in the amount of
subsidies expended by the government in all periods of the simulation as
government subsidies grew at a slower pace from 0.54278 in period 2 to 0.57897
in the fth period.
Likewise, government revenues increased during all periods, in both models. In
the simulations without interventions (counterfactual), government revenues
increased by 0.48136 per cent in period 2 and rose consistently through the
simulation periods to 0.54241 in period 5. However, government revenues
showed a marginally better growth in the periods when the CBN interventions
were simulated in the model as revenues grew by 0.48142 per cent in period 2 to
0.54250 in period 5.
V.3� Impact of CBN Interventions on Supply of Agricultural Commodities
The supply of agricultural commodities at various stages of the production
process was also assessed in the model. This way, the impact of the agricultural
interventions on export of goods produced locally and import of nal goods
were ascertained.
Simulation results indicated that CBN's interventions on the agricultural sector
led to an increase in exports of agricultural commodities and marginal reduction
in the volume of imports of intermediate goods used in the agricultural value
chain. While model results presented in table 5 indicated that in the simulations
without intervention, exports of agricultural commodities would have increased
by 2.89207 per cent in the second period and rise consistently through the
periods to 3.27203 per cent in the fth period; the simulations with interventions
showed more increases in export of agricultural commodities by a slightly higher
magnitude as export of goods produced locally from the agricultural sector
increased by 2.89221 per cent in period 2 of intervention through to 3.27219 per
cent in period 5. The marginal increase in export of goods produced locally
could be attributed to increased output arising from increased agricultural
interventions from the CBN.
Adamgbe et. al,: Analysis of the Impact of Central Bank of Nigeria's Agricultural Intervention Funds on the Economy 73

Similarly, imports of intermediate goods declined marginally as a result of the
interventions compared to the counterfactual periods apart from the third
period when it showed no impact. Reduction in imports of intermediate
agricultural commodities could be due to improved capacity of the sector to
produce commodities to be used for further production within the value chain.
In line with this, simulation results of the counterfactual periods indicated that
imports of intermediate goods increased by 0.80750 per cent in the second
period and continued a steady increase to 1.07338 per cent in the fth period.
Results from the model with interventions indicated a lower magnitude of
increase from the second to the fth period except in the third period when it
showed no impact as stated earlier. In line with this, the intervention contributed
to a decrease of imported intermediate commodities by 0.80750 per cent in the
second period and increased at a lower magnitude compared to the
counterfactual to 1.07338 per cent in the fth period.
V.4� Impact of CBN Interventions on Prices of Agricultural Exports
Simulation results from both models presented in table 6 indicated that prices of
agricultural commodity exports increased marginally in the fth period as a result
of the interventions. This could be due to improvements recorded in the quality
of products through improved processing and transformation of the otherwise
primary commodities.
VARIABLES SECTOR BASE PERIOD YEAR 2 YEAR 3 YEAR 4 YEAR 5 YEAR 6
Export of Goods Produced Locally Without Intervention
Agric Sector
6791.97759
2.89207
3.01951
3.14629
3.27203
12.69557
Non-Agric Sector
15182.1939
0.64321
0.62583
0.60655
0.58526
-4.08416
Export of Goods Produced Locally with Intervention
Agric Sector
-
2.89221
3.01962
3.14641
3.27219
11.74402
Non-Agric Sector -
0.64318
0.62580
0.60651
0.58521
-3.61064
Imported Intermediate goods without Intervention
Agric Sector 100.1891
0.80752
0.89235
0.98100
1.07339
8.19010
Non-Agric Sector
582.27494
-0.31692
-0.33474
-0.35281
-0.37103
-3.50518
Imported Intermediate goods with Intervention
Agric Sector
- 0.80750 0.89235 0.98098 1.07338 7.47096
Non-Agric Sector
- -0.31691 -0.33474 -0.35280 -0.37101 -3.18784
Table 5: Impact of CBN Interventions on Supply of Agricultural Commodities
(Growth rates in per cent)
Source: Author's computations
74 Central Bank of Nigeria Economic and Financial Review March 2020

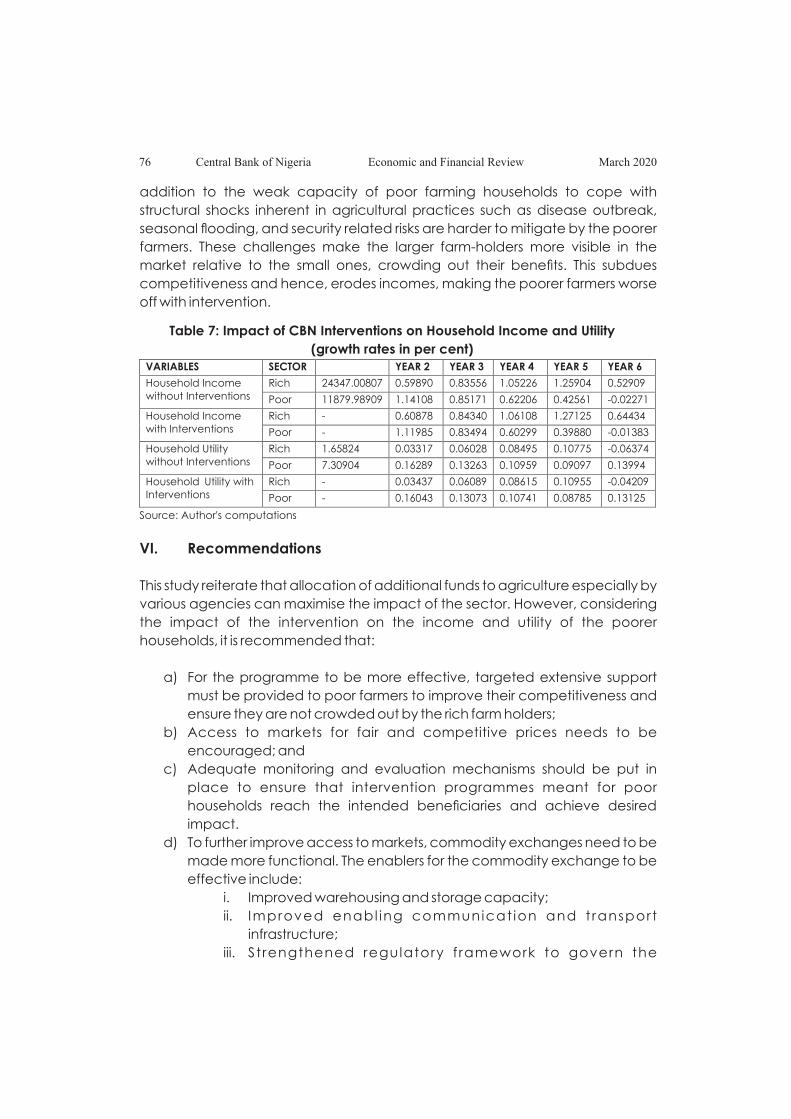
V.5� Impact of CBN Interventions on Household Income and Utility
The impact of CBN interventions on household incomes and utility was also
assessed and presented in table 7. In this regard, households were classied
based on rich and poor agricultural households. Simulation results indicated that
CBN interventions impacted positively on the incomes and utility of rich farm
owners. Interestingly, poor farmers were worse off with interventions, as their
income and utility increased steadily at a faster pace without intervention than it
did with interventions.
More specically, results from the model without interventions show that the
income of rich households increased by 0.59890 per cent in the second period to
a rate of 1.25904 per cent in the fth period, and increased by a larger
magnitude during the simulations of the intervention periods as it increased from
0.60878 in second period to 1.27125 per cent in the fth period.
On the other hand, incomes of poor households without interventions increased
at declining rates from 1.14108 per cent in period 2 to 0.42561 per cent in the fth
period. It recorded declines with higher magnitudes during the intervention
period as incomes of poor farming households increased by 1.11985 per cent in
period 2 to an increase of 0.398880 per cent in the fth period of intervention.
Household utility behaved in a similar pattern with incomes. This seemingly
surprising outcome could be due to the capital intensive nature of investment in
agriculture.
Agriculture is expensive, and CBN agriculture intervention is more easily
accessed by the rich farm holders and would cost the small farmers more to
engage in. This is helped by their access to big markets for their products at fair
and competitive prices, ability to take advantage of scale efciencies and
warehousing or storage capacity, and to readily meet the intervention
conditions. Further, most of the interventions seem to support mechanised
agriculture, doubling their advantages in scale and scope efciencies. This is in
VARIABLES SECTOR
BASE PERIOD
YEAR 2
YEAR 3
YEAR 4
YEAR 5
YEAR 6
Price of Export without interventions
Agric Sector
1.00000
1.76746 1.80438
1.84166
1.87451
0.93007
Non-Agric Sector
1.00000
1.76746 1.80438
1.84166
1.87451
0.93007
Price of Export with interventions
Agric Sector
-
1.76746 1.80438
1.84166
1.87544
1.03980
Non-Agric Sector - 1.76746 1.80438 1.84166 1.87544 1.03980
Table 6: Impact of CBN Interventions on Prices of Agricultural Exports
(growth rates in per cent)
Source: Author's computations
Adamgbe et. al,: Analysis of the Impact of Central Bank of Nigeria's Agricultural Intervention Funds on the Economy 75
addition to the weak capacity of poor farming households to cope with
structural shocks inherent in agricultural practices such as disease outbreak,
seasonal ooding, and security related risks are harder to mitigate by the poorer
farmers. These challenges make the larger farm-holders more visible in the
market relative to the small ones, crowding out their benets. This subdues
competitiveness and hence, erodes incomes, making the poorer farmers worse
off with intervention.
VI.� Recommendations
This study reiterate that allocation of additional funds to agriculture especially by
various agencies can maximise the impact of the sector. However, considering
the impact of the intervention on the income and utility of the poorer
households, it is recommended that:
a) For the programme to be more effective, targeted extensive support
must be provided to poor farmers to improve their competitiveness and
ensure they are not crowded out by the rich farm holders;
b) Access to markets for fair and competitive prices needs to be
encouraged; and
c) Adequate monitoring and evaluation mechanisms should be put in
place to ensure that intervention programmes meant for poor
households reach the intended beneciaries and achieve desired
impact.
d) To further improve access to markets, commodity exchanges need to be
made more functional. The enablers for the commodity exchange to be
effective include:
i. Improved warehousing and storage capacity;
ii. Improved enabl ing communicat ion and t ransport
infrastructure;
iii. St rengthened regulatory f ramework to govern the
Table 7: Impact of CBN Interventions on Household Income and Utility
(growth rates in per cent)VARIABLES
SECTOR
YEAR 2
YEAR 3
YEAR 4
YEAR 5
YEAR 6
Household Income without Interventions
Rich
24347.00807
0.59890
0.83556
1.05226
1.25904
0.52909
Poor
11879.98909
1.14108
0.85171
0.62206
0.42561
-0.02271
Household Income with Interventions
Rich
-
0.60878
0.84340
1.06108
1.27125
0.64434
Poor - 1.11985 0.83494 0.60299 0.39880 -0.01383
Household Utility without Interventions
Rich 1.65824 0.03317 0.06028 0.08495 0.10775 -0.06374
Poor 7.30904 0.16289 0.13263 0.10959 0.09097 0.13994
Household Utility with Interventions
Rich
-
0.03437
0.06089
0.08615
0.10955
-0.04209
Poor - 0.16043 0.13073 0.10741 0.08785 0.13125
Source: Author's computations
76 Central Bank of Nigeria Economic and Financial Review March 2020
enforcement of contracts in spot markets to guarantee
property rights; and
iv. Strong and effective policies and legal framework.
VII.� Conclusion
With the aid of a recursive dynamic CGE model, the paper presented the
impact of CBN agricultural intervention schemes on the economy. However, it
was noted that the impact across various indicators were mostly positive,
though marginal. This could be attributed to the conservative nature of the
model parameters and the relative amount of interventions. Also, an update in
the Social Accounting Matrix (SAM) for Nigeria beyond 2011 should be
conducted so as to have more precise impact of interventions.
Disaggregated sectoral effects of the interventions are proposed as areas for
further study. Other intervention schemes of the government for the agricultural
sector can be incorporated to reect a more holistic picture of the impact as
well. It is therefore recommended that more funds should be allocated to
agriculture especially by various agencies so as to maximise the impact of the
sector.
Adamgbe et. al,: Analysis of the Impact of Central Bank of Nigeria's Agricultural Intervention Funds on the Economy 77

References
Annabi, N., Cockborn, J., & Decaluwe, B. (2004). A Sequential Dynamic Model
for Poverty Analysis. Retrieved from Partnership for Economic Policy:
https://www.pep-net.org
Aydin, L. (2010). The Economic and Environment Impacts of Constructing Hydro
Power Plants in Turkey: A Dynamic CGE Analysis . Natural Resources, 1,
69-79.
Borojo, D. G. (2015). The Economy Wide Impact of Investment on Infrastructure
for Electricity in Ethiopia: A Recursive Dynamic Computable General
Equilibrium Approach. International Journal of Energy Economics and
Policy, 986-997.
Cabral, F. J., Cisse, F., Diagne, A., & Siwa, M. (2017). Global Biofuel Production
and Poverty in Senegal. Economics Bulletin.
Dissou, Y. D. (2011). Public Infrastructure and Economic Growth: A Dynamic
Computable General Equilibrium Analysis with Heterogeneous Agents.
Working Paper, University of Ottawa.
Estache, A., Perrault, J., & Savard, L. (2008). Impact of Infrastructure Spending in
Sub-Saharan Africa. A CGE Modeling Approach. Working Paper,
Universite de Sherbrooke.
Federal Ministry of Agriculture and Rural Development. (2016). Agricultural
Transformation Agenda. Retrieved from Federal Ministry of Agriculture
and Rural Development.
Galinis, A. V. (2000). A CGE Model for Lithuania: The Future of Nuclear Energy.
Journal of Policy Modeling, 22, 691-718.
Iwuchukwu, J., & Igbokwe, E. M. (2012). Lessons from Agricultural Policies and
Programmes in Nigeria. Journal of Law, Policy and Globalisation.
Mband, V., Chumi, S., & Kanda, P. & Mabugu, M. R. (2010). Impact of Public
Infrastructure Investment in South Africa: A Dynamic CGE Analysis.
Poverty and Economic Policy Research Network, 8th General Meeting,
Senegal, Dakar
Odior, E. S. (2011). Government Spending on Education, Economic Growth and
Long Waves in a CGE Micro-Simulation Analysis: The Case of Nigeria,
British Journal of Economics, Finance and Management Sciences
74,September, Vol. 1 (2).
Olomola, A., Mogues, T., Olonbiyi, T., Nwoko, C., Udoh, E., Alabi, R., &
Woldeyohannes, S. (2014). Analysis of Agricultural Expecditures in
Nigeria: Examination at the Federal, State and Local Government Levels.
International Food Policy Research Institute.
Opeyemi A. O., Alege, O. P., Ajayi, O., & Okodua, H. (2017). Energy Pricing Policy
and Environmental Quality in Nigeria: A Dynamic Computable General
78 Central Bank of Nigeria Economic and Financial Review March 2020

Equilibrium Approach. International Journal of Energy Economics and
Policy, 7(1), 268-276.
Strzepek, K. M., Yohe, G. W., & Tol, R. S. (2006). The Value of the High Aswan Dam
to the Egyptian Economy. Ecological Economics, 66(1), 117-126.
World Bank. (2017). Agriculture Data. Retrieved from World Bank Open Data.
Adamgbe et. al,: Analysis of the Impact of Central Bank of Nigeria's Agricultural Intervention Funds on the Economy 79

Ac
tiv
itie
s(A
CT)
Co
mm
od
itie
s(C
OO
M)
Fac
tors
Inst
itu
tio
ns
Tax
es
Ca
pita
l
Ac
co
un
t
AG
RN
AG
RA
GR
NA
GR
LAB
OU
RC
AP
ITA
LH
HO
LDS
GO
VT
IND
.TA
XSU
BSI
DY
(CA
P)
RO
WTO
TAL
ACT
AG
R9050.5
85833
6791.9
7759
15842.5
6342
NA
GR
27774.0
6368
15182.1
939
42956.2
5759
COMM
AG
R2715.9
12683
1536.5
30567
3670.0
07269
54.6
7779891
1378.8
75462
9356.0
0378
NA
GR
1997.7
10456
15245.2
62
11343.6
1552
2603.6
74207
2200.1
41269
33390.4
0346
Factors
LAB
OU
R3472.0
79818
8988.6
88599
12460.7
6842
CA
PIT
AL
7517.0
98834
16249.1
2991
23766.2
2874
Institutions
HH
OLD
S
12460.7
6842
23766.2
2874
36226.9
9716
GO
VT
177.2
980939
-15.8
5960466
161.4
384892
Taxes
IND
.TA
X9.5
64732057
167.7
333618
177.2
980939
SUB
SID
Y-1
3.4
663079
-2.3
93296765
-15.8
5960466
CAP
CA
PIT
AL
AC
CT
43.4
7411414
189.0
314959
21213.3
7437
-2496.9
13517
-15369.9
4974
3579.0
1673
RO
W100.1
890998
582.2
749413
305.4
179471
5616.3
39771
6604.2
2176
TOTA
L15842.5
6343
42956.2
5758
9356.0
0378
33390.4
0346
12460.7
6842
23766.2
2874
36226.9
9716
161.4
384892
177.2
980939
-15.8
5960466
3579.0
16731
6604.2
2176
184505.3
38
APPEN
DIX
: TW
O-S
EC
TOR
SO
CIA
L A
CC
OU
NTI
NG
MA
TRIX
FO
R 2
011
80 Central Bank of Nigeria Economic and Financial Review March 2020
Copyright © 2022 FDOKUMEN